International Journal of Science and Research (IJSR) ISSN (Online): 2319-7064 Index Copernicus Value (2013): 6.14 | Impact Factor (2013): 4.438 Volume 4 Issue 3, March 2015 www.ijsr.net Licensed Under Creative Commons Attribution CC BY Assessment of Chlorination Efficiency and Quality of Municipal Drinking Water in Gwalior City, Madhya Pradesh, India Harendra K. Sharma 1 , Makhmoor Ahmad Rather 2 School of Studies in Environmental Science (IGAEERE), Jiwaji University Gwalior, (M.P.) India-474011 Abstract: The quality of drinking water at the point of delivery to the consumer is crucial in safeguarding people’s health. This study was carried out to study effectiveness of chlorination throughout drinking water distribution system and quality of water supplied to households in Gwalior city. Water samples were collected from 10 sampling points within the city. The collected water samples were subjected to physicochemical and microbiological analysis by using standard methods and values recorded were compared with World Health Organization (WHO) guidelines for drinking water. The results of the study demonstrated that physicochemical and bacteriological quality of water just leaving water treatment plant was satisfactory. In the distribution system, physicochemical quality of water was satisfactory while most of the samples contained bacteriological contamination and residual chlorine concentration in distribution system was decreasing considerably with increase in distance from water treatment plant. Average concentration of residual chlorine from all sampling location was between 0.08 to 0.98 mg/l. Total coliform was found at most of the sampling locations in the range of 0.82 to 7.15 MPN/100ml. Diarrhoea was most the prevalent health problem in the study area as reported by 33% of households followed by Typhoid (21.5%). Among the methods of treatment, 32% of households were using boiling, 18% aqua guard and 16.5% alum for treatment of tap water before drinking it. Possible causes of contamination were leaking of water mains and cross connections between water mains and sewers due to close proximity. It is recommended to carry out compulsory chlorination at water sources while maintaining reasonable chlorine residuals at the consumer end to eliminate the bacteriological contamination. Keywords: Drinking water, Residual chlorine, Water treatment plant, Quality analysis, Questionnaire survey 1. Introduction Water is one of the most vital components of all natural resources known on earth. It is important to all living organisms, most ecological systems, human health, food production and economic development (Postel et al., 1996). World Health Organization (WHO) states that domestic water consumption of 30-35 liters per capita per day is the minimum requirement for maintaining good health (Cleave, 1998). The safety of drinking water is prime concern within the global village. Drinking water should have high quality so that it can be consumed without threat of immediate or long term adverse impacts to health. Such water is commonly called as “potable water”. Water availability is equally important as water quality. Good and adequate water supply services are essential for public health and well being. Many water resources in developing countries are unhealthy because they contain harmful physical, chemical and biological agents (Cheesbrough, 2000). To maintain good health, however water should be safe to drink and meet the local standards. The safe drinking water is defined by WHO as that water having acceptable quality in terms of its physical, chemical and bacteriological parameters. The safe water is that which is free from pathogenic microbes, hazardous chemicals/substance and aesthetically acceptable (i.e. pleasing to sight, odourless and good taste). It is important that this type of water should not only be available, but also be available in enough quantity all the time (Park, 2005). The decline in availability of water supplies is one of the most important environmental issues faced by various countries at the present time. It has been estimated that nearly two-third of nation’s world-wide will experience water stress by year 2025 (UNEP, 2002). In India, chlorination is practiced at most of the filtration plant as means of water disinfection, and it is supplied to the public via distribution network. Chlorine due to its low cost and effectiveness is a chemical of choice in many countries including India. It is added to drinking water to disinfect pathogenic microorganisms. Chlorine residuals of drinking water have long been recognized as an excellent indicator for studying water quality in the distribution network (Lienyao et al., 2004). The presence of any disinfectant residual reduces the microorganism level and frequency of occurrence at the consumer’s tap (Olivieri et al., 1986). Addition of chlorine in different water treatment plant is a common practice, but it is not sufficient to ensure the safety of water. The maintenance of chlorine residue is needed at all points in the distribution system supplied with chlorine as disinfectant (Kitazawa 2006). India in 1981 launched the decade programme to supply safe drinking water through 100% coverage of urban and rural areas by piped water supply. To achieve the goals, conservation of water and preservation of water quality in water supply systems assume prime significance. The elements of surveillance include water quality surveillance, study of institutional setup and examination of water for physicochemical and bacteriological parameters. This include assessment of availability of water resources, appropriate treatment, safe storage and equitable safe distribution of water, the examination of water quality at the beneficiary points periodically and study of institutional and financial set-up. Systematic periodic monitoring of microbiological quality of drinking water supplies helps to Paper ID: SUB152227 1699

Welcome message from author
This document is posted to help you gain knowledge. Please leave a comment to let me know what you think about it! Share it to your friends and learn new things together.
Transcript

International Journal of Science and Research (IJSR) ISSN (Online): 2319-7064
Index Copernicus Value (2013): 6.14 | Impact Factor (2013): 4.438
Volume 4 Issue 3, March 2015
www.ijsr.net Licensed Under Creative Commons Attribution CC BY
Assessment of Chlorination Efficiency and Quality
of Municipal Drinking Water in Gwalior City,
Madhya Pradesh, India
Harendra K. Sharma1,
Makhmoor Ahmad Rather
2
School of Studies in Environmental Science (IGAEERE), Jiwaji University Gwalior, (M.P.) India-474011
Abstract: The quality of drinking water at the point of delivery to the consumer is crucial in safeguarding people’s health. This study
was carried out to study effectiveness of chlorination throughout drinking water distribution system and quality of water supplied to
households in Gwalior city. Water samples were collected from 10 sampling points within the city. The collected water samples were
subjected to physicochemical and microbiological analysis by using standard methods and values recorded were compared with World
Health Organization (WHO) guidelines for drinking water. The results of the study demonstrated that physicochemical and
bacteriological quality of water just leaving water treatment plant was satisfactory. In the distribution system, physicochemical quality of
water was satisfactory while most of the samples contained bacteriological contamination and residual chlorine concentration in
distribution system was decreasing considerably with increase in distance from water treatment plant. Average concentration of residual
chlorine from all sampling location was between 0.08 to 0.98 mg/l. Total coliform was found at most of the sampling locations in the
range of 0.82 to 7.15 MPN/100ml. Diarrhoea was most the prevalent health problem in the study area as reported by 33% of households
followed by Typhoid (21.5%). Among the methods of treatment, 32% of households were using boiling, 18% aqua guard and 16.5%
alum for treatment of tap water before drinking it. Possible causes of contamination were leaking of water mains and cross connections
between water mains and sewers due to close proximity. It is recommended to carry out compulsory chlorination at water sources while
maintaining reasonable chlorine residuals at the consumer end to eliminate the bacteriological contamination.
Keywords: Drinking water, Residual chlorine, Water treatment plant, Quality analysis, Questionnaire survey
1. Introduction
Water is one of the most vital components of all natural
resources known on earth. It is important to all living
organisms, most ecological systems, human health, food
production and economic development (Postel et al., 1996).
World Health Organization (WHO) states that domestic
water consumption of 30-35 liters per capita per day is the
minimum requirement for maintaining good health (Cleave,
1998). The safety of drinking water is prime concern within
the global village. Drinking water should have high quality
so that it can be consumed without threat of immediate or
long term adverse impacts to health. Such water is
commonly called as “potable water”. Water availability is
equally important as water quality. Good and adequate water
supply services are essential for public health and well
being. Many water resources in developing countries are
unhealthy because they contain harmful physical, chemical
and biological agents (Cheesbrough, 2000). To maintain
good health, however water should be safe to drink and meet
the local standards.
The safe drinking water is defined by WHO as that water
having acceptable quality in terms of its physical, chemical
and bacteriological parameters. The safe water is that which
is free from pathogenic microbes, hazardous
chemicals/substance and aesthetically acceptable (i.e.
pleasing to sight, odourless and good taste). It is important
that this type of water should not only be available, but also
be available in enough quantity all the time (Park, 2005).
The decline in availability of water supplies is one of the
most important environmental issues faced by various
countries at the present time. It has been estimated that
nearly two-third of nation’s world-wide will experience
water stress by year 2025 (UNEP, 2002).
In India, chlorination is practiced at most of the filtration
plant as means of water disinfection, and it is supplied to the
public via distribution network. Chlorine due to its low cost
and effectiveness is a chemical of choice in many countries
including India. It is added to drinking water to disinfect
pathogenic microorganisms. Chlorine residuals of drinking
water have long been recognized as an excellent indicator
for studying water quality in the distribution network
(Lienyao et al., 2004). The presence of any disinfectant
residual reduces the microorganism level and frequency of
occurrence at the consumer’s tap (Olivieri et al., 1986).
Addition of chlorine in different water treatment plant is a
common practice, but it is not sufficient to ensure the safety
of water. The maintenance of chlorine residue is needed at
all points in the distribution system supplied with chlorine as
disinfectant (Kitazawa 2006).
India in 1981 launched the decade programme to supply safe
drinking water through 100% coverage of urban and rural
areas by piped water supply. To achieve the goals,
conservation of water and preservation of water quality in
water supply systems assume prime significance. The
elements of surveillance include water quality surveillance,
study of institutional setup and examination of water for
physicochemical and bacteriological parameters. This
include assessment of availability of water resources,
appropriate treatment, safe storage and equitable safe
distribution of water, the examination of water quality at the
beneficiary points periodically and study of institutional and
financial set-up. Systematic periodic monitoring of
microbiological quality of drinking water supplies helps to
Paper ID: SUB152227 1699

International Journal of Science and Research (IJSR) ISSN (Online): 2319-7064
Index Copernicus Value (2013): 6.14 | Impact Factor (2013): 4.438
Volume 4 Issue 3, March 2015
www.ijsr.net Licensed Under Creative Commons Attribution CC BY
identify failures and initiate actions. Keeping in view of
health, physicochemical and microbial analysis of packaged
water brand of Gwalior city has carried out (Rather and
Sharma et al, 2013). Some of these parameters constitute a
risk to human health, others affect the aesthetic quality of
the water supplied and others relate to treatment issues
(Ratnayaka et al., 2009).
Considering the deteriorating quality of drinking water in
Gwalior city, present study was carried out. In the present
investigation, water quality of treatment plants and
consumer ends was monitored to assess the drinking water
quality status. This study was an attempt to judge the water
quality changes from the source to consumer, which may be
useful in deciding appropriate remedial measures for
preventing drinking water from contamination and help in
safe drinking water supply to consumers.
2. Materials and Methods
2.1. Study Area
Gwalior is situated in the north of the state of Madhya
Pradesh, in the Indo- Gangetic plains. The city has
municipal area of approx. 173.65 Sq. km. and is
administered by dividing the city into 60 municipal wards. It
is also known as one of the eminent tourist destination in
India. The city of Gwalior is located at 26° 12′ 12.50" N 78°
18′ 58.76" E and has an average elevation of 212 meters.
The city consists of three distinct urban areas; Old Gwalior
in the north, Lashkar about 3 km to the southwest, and
Morar towards the east.
The water supply system in Gwalior is mainly dependent on
the Tighra-Kaketo system and ground water augments this
supply. The supplies from Tighra dam located on the Sank
River are supplemented by supply from another reservoir of
the Kaketo dam on Narver River. In all, 190 MLD of water
is reserved for drinking water supplies to Gwalior. Water is
supplied from the dam to the two WTPs (old and new) at
Motijheel, through two pipelines (17 Km long and diameter
1200 mm).
2.2. Sampling
In present study, the methods of sampling used were
combination of random and purposive sampling. Water
samples were collected from the households located at
different distance from water treatment plant after the
sterilization of house taps. Water samples were also
collected from Motijheel WTP (before and after treatment).
These samples were collected in sterilized glass bottles (500
ml), labeled properly with date and name of the location. All
these bottles were closed carefully and transported to the
laboratory in an ice box kept at 4oC, and processed within 6
hours for and microbiological and physicochemical analysis.
2.3. Physico-chemical analysis
Physical parameters analyzed were temperature, turbidity,
pH, TDS etc. and chemical parameters comprised of
electrical conductivity, total hardness, total alkalinity,
chloride, fluoride and residual chlorine. Residual chlorine
was determined by DPD ferrous titrimetric method. Methods
employed for analysis of physico-chemical parameters were
in accordance with APHA (1992) and Gupta (2001).
2.4. Microbiological analysis
Microbiological parameters analyzed were total coliform
and faecal coliform. The total coliform and faecal coliform
counts were determined by multiple tube fermentation
technique. For enumeration of total coliforms lauryle
tryptose broth (LTB) was used for the presumptive test and
brilliant green lactose broth for confirmation and for
enumeration of faecal coliforms EC medium was used.
Results were expressed in terms of most probable number
(MPN). Standard methods were followed in collecting,
handling, preserving, and analyzing samples for the above
mentioned parameters (APHA, 1992).
2.5. Questionnaire survey for evaluation of drinking
water quality and associated health problems
The field survey approach was also used to carry out present
study. The selection of households in the study area was
based on random sampling. At least 20 households were
interviewed from each sampling locations (Total 200
households from 10 sampling locations). The respondents
were interviewed during early morning and evening hours
and observations were recorded on the spot. The respondents
were given a brief orientation on the nature and purpose of
the study. Questionnaire survey was carried out to analyze
the present situations of school drinking water quality,
equipment, and health problems related with it.
3. Results and Discussion
The measured value of different physical and chemical water
quality parameters of the collected water samples is
summarized in Table 1. Findings of the study have been
assessed according to WHO drinking water quality
guidelines and BIS as well.
Table 1: Physico-chemical and microbiological parameters of water samples collected from different sites.
Name of
the Site
Temperature
(oC) pH
Turbidity
(NTU) TDS (mg/l)
Total
hardness
(mg/l)
BOD
(mg/l)
Nitrate
(mg/l)
Fluoride
(mg/l)
Residual
chlorine
(mg/l)
Total
coliforms
(MPN/10
0ml)
Faecal
coliforms
(MPN/100
ml)
Motijheel
WTP
(After
treatment)
26.50±0.58 7.25±0
.30 2.16±0.87 330.50±24.69 85.61±3.57 2.09±1.18 2.85±0.88 0.28±0.07 1.30±0.25 0.0 0.0
Paper ID: SUB152227 1700

International Journal of Science and Research (IJSR) ISSN (Online): 2319-7064
Index Copernicus Value (2013): 6.14 | Impact Factor (2013): 4.438
Volume 4 Issue 3, March 2015
www.ijsr.net Licensed Under Creative Commons Attribution CC BY
Anand
Nagar 28.00±0.82
7.42±0
.30 2.28±0.66 472.50±17.18 53.73±6.72 2.50±0.55 3.45±0.69 0.31±0.08 0.98±0.13 0.82±0.54 0.0
Kishan
Bagh 27.25±2.06
7.28±0
.15 2.39±0.69 482.00±68.23 74.25±1.76 2.87±0.80 3.68±0.85 0.42±0.06 0.72±0.10 1.1±0.0 0.0
Vinay
Nagar 27.50±1.29
7.05±0
.24 2.78±0.45 459.75±17.17 66.33±1.43 2.41±0.53 4.97±0.80 0.39±0.10 0.65±0.13 2.22±0.75 0.0
Lashkar 27.75±0.50 7.00±0
.18 2.96±0.35 561.50±22.66 129.00±2.57 2.61±0.54 5.55±0.66 0.50±0.08 0.47±0.10 4.10±1.00 1.20±1.07
Kampoo 31.00±1.41 8.20±0
.14 3.68±0.69 479.00±38.04 134.08±4.55 2.64±0.38 3.49±0.73 0.47±0.04 0.36±0.10 3.60±1.15 1.48±0.75
Bada 27.50±0.58 7.55±0
.52 3.22±0.33 462.26±33.64 143.16±4.41 2.70±0.40 3.87±1.06 0.35±0.11 0.27±0.09 4.6±0.0 2.22±0.75
Sikandar
Kampoo 30.50±2.38
7.95±0
.44 3.78±0.64 466.50±36.00 118.70±2.48 2.82±0.51 3.43±0.71 0.37±0.06 0.21±0.10 4.6±0.0 2.72±1.44
Govindpuri 29.00±0.82 7.30±0
.64 4.14±0.83 421.75±9.43 107.74±2.11 4.00±1.22 3.14±0.38 0.36±0.06 0.15±0.06 5.45±1.70 3.10±1.00
Thatipur 28.25±2.63 7.32±0
.7 4.20±0.80 391.50±54.36 94.30±2.08 3.06±0.91 4.57±1.30 0.30±0.08 0.12±0.05 7.15±1.70 3.60±1.15
Morar 29.00±2.83 7.33±0
.17 4.38±0.65 482.25±38.91 88.52±2.22 4.11±1.46 4.00±0.92 0.44±0.07 0.08±0.01 7.15±1.70 4.10±1.00
Motijheel
WTP
(Before
treatment)
32.50±0.58 6.60±0
.14 8.21±1.82
946.95±106.6
3 166.79±3.77 7.18±0.59 9.09±1.53 0.72±0.12 0.0 8.0±0.0 7.15±1.70
WHO
permissible
limits
-- 6.5-8.5 5.0 500.0 500.0 6.0 50.0 1.5 0.6-1.0 0.0 0.0
3.1. Water quality characteristics
Temperature
Temperature of water samples from all sampling locations
ranged from 27.25±2.06 to 31.00±1.41oC. Highest value of
temperature was observed in water samples of Kampoo
(31.00oC) and lowest value was observed in water samples
of Kishan Bagh (27.25oC). The value of temperature
recorded in the water samples before treatment at Motijheel
WTP was 32.50±0.58oC and after treatment the value of the
temperature recorded was 26.50±0.58oC. Whereas WHO has
not recommended any definite temperature value for
drinking water. A temperature of about 40oC is permissible
limit for drinking water (BIS, 1991). Knowledge of water
temperature is important because temperature is a critical
factor in determining the growth of the microorganisms
(Ramteke et al., 1992). Temperature also affects the
solubility of oxygen in water.
pH
The average pH values of water samples taken from
different sampling locations ranged from 7.00±0.18 to
8.20±0.14. A maximum pH of 8.20 was observed at
Kampoo and a minimum pH of 7.00 was recorded at
Lashkar. Value of pH was 6.60±0.14 at Motijheel WTP
before treatment and 7.25±0.30 after treatment. pH of water
samples from all sampling locations ranges from neutral to
slightly alkaline and was found well within WHO limits of
6.5 to 8.5. Similar results were obtained by Roohul-Amin et
al., (2012) in urban parts Peshawar Pakistan. However
higher values of pH hasten the scale formation in water
heater and reduce the germicidal potential of Chlorine (Gard
et al., 2007). pH of the water samples analyzed before
treatment process at Motijheel treatment plant was found
slightly acidic. The pH of treated water is an important
factor for chlorination efficiency (Boyacioglu, 2007). It is
one of the important parameter in determining the
corrosivity of water because generally the lower pH results
in higher level of corrosion (WHO, 1996).
Turbidity
Turbidity of most of the water samples was below 5 NTU.
But few samples possess higher values. Levels of Turbidity
in all water samples collected from different locations
ranged from 2.28±0.66 to 4.38±0.65 NTU. Similar results
were also reported earlier in a study conducted by the
National Water Quality Program, PCRWR, (2005) which
revealed that the turbidity ranges from 1.10 to 4.40 NTU.
Turbidity was recorded maximum at Morar with a value of
8.21 NTU and minimum value of 2.16 NTU at Anand
Nagar. Turbidity was recorded 8.21±1.82 mg/l at Motijheel
WTP before treatment and 2.16±0.87 mg/l after treatment.
Turbidity of water samples collected from various sampling
locations was well within WHO limit of 5 NTU. It is
suggested that turbidity more than 1 NTU will influence the
disinfection efficiency; turbidity more than 5 NTU can be
identified by the naked eye and is often complained by the
users. Maximum levels of Turbidity can provide shelter for
opportunistic microorganisms and pathogens (Aulicino and
Pastoni, 2004). Turbidity shows increase from Motijheel
WTP towards end users with respect to distance from
treatment plant. This can be attributed to accumulation of
more suspended particles in water towards end users through
faulty joints in pipelines.
TDS
Evaluation of TDS of water samples collected from different
locations ranged from 391.50±54.36 to 482.25±38.91 mg/l.
Maximum value of 482.25 mg/l was found at Thatipur and
minimum value of 391.50 mg/l was recorded at Morar.
Paper ID: SUB152227 1701

International Journal of Science and Research (IJSR) ISSN (Online): 2319-7064
Index Copernicus Value (2013): 6.14 | Impact Factor (2013): 4.438
Volume 4 Issue 3, March 2015
www.ijsr.net Licensed Under Creative Commons Attribution CC BY
Concentration of TDS was 946.95±106.63 mg/l at Motijheel
WTP before treatment and 330.50±24.69 mg/l after
treatment. This showed that coagulation method employed at
Motijheel WTP was effective in coagulating the dissolved
materials in water. Water which has TDS level less than 500
mg/l is regarded as good, while water having TDS more than
1000 mg/l is unacceptable for human consumption (WHO,
2006). High TDS may result in offensive odors, tastes,
colors, and health problems depending on the specific
contaminant(s) present (Jenson et al., 2007). TDS of all
water samples from all locations were within WHO and BIS
standards. US-EPA (1978) recommends treatment when
TDS concentrations exceed 500 mg/l or 500 ppm.
Total hardness
The range of total hardness of water samples collected from
different sampling locations was 53.73±6.72 to 143.16±4.41
mg/l. Maximum value of total hardness level was found at
Badha (143.16 mg/l) and minimum level was recorded at
Anand Nagar (53.73 mg/l). Level of total hardness before
and after treatment at Motijheel WTP was 166.79±3.77 mg/l
and 85.61±3.57 mg/l respectively. Total hardness of
drinking water at all sampling locations was within WHO
guideline value of 500 mg/l. As a matter of fact, this
guideline value is not proposed on the basis of health.
Consumers can tolerate water hardness in excess of 500
mg/l. Hardness above 500 mg/l needs excess use of soap to
achieve cleaning and results in scaling of pipelines and
water boilers. A thorough look at the results revealed that
water was soft to moderately hard at all sampling location.
The total hardness of water is mainly caused by dissolved
calcium and magnesium salts from the surrounding ores (Lin
et al., 1996). The hardness will influence the taste of water,
but the taste threshold differs from person to person. If the
total hardness is too low, the water may accelerate the pipe
erosion; when the total hardness is too high (higher than 200
mg/l), boiler scale and water scale are formed in the heating
process (Yisa and Jimoh, 2010).
Biological oxygen demand (BOD)
BOD values examined in water samples collected from
different sampling locations ranged from 2.41±0.53 to
4.11±1.46 mg/l. Maximum concentration of BOD was
recorded from Morar (4.11 mg/l) and minimum
concentration was found at Vinay Nagar (2.41 mg/l). Levels
of BOD before and after treatment at Motijheel WTP were
7.18±0.59 mg/l and 2.09±1.18 mg/l respectively. BOD at all
sampling locations was well within permissible limit of 6
mg/l of WHO. The findings are similar with those of Kataria
et al., (2008). Water samples collected just from the outlet of
Motijheel WTP possess less BOD. Therefore, high BOD
concentration in the distribution system towards end users
might be due to cross-contamination through leaking pipes,
unauthorized connection and improper domestic storage
facilities.
Nitrate
Nitrate values observed in water samples collected from
various sampling locations ranged from 3.14±0.38 to
5.55±0.66 mg/l. Maximum level of nitrate was recorded
from Lashkar (5.55 mg/l) and minimum concentration was
found at Govindpuri (3.14mg/l). Levels of nitrate before and
after treatment at Motijheel WTP were found to be
9.09±1.53 mg/l and 2.85±0.88 mg/l respectively. Nitrate
levels of samples collected from different sites were well
with WHO permissible limit of 50mg/l. Nitrate
concentrations may be encountered in water impacted by
intensive fertilizer application, or septic effluents. This can
lead to serious water contamination. Nitrate has been
implicated in methaemoglobinaemia and also a number of
currently inconclusive health outcomes. These include
proposed effects such as cancer (via the bacterial production
of N-nitroso compounds), hypertension, increased infant
mortality, birth defects, diabetes, spontaneous abortions,
respiratory tract infections and alterations to the immune
system (Gupta et al., 2000).
Fluoride
Evaluation of fluoride of water samples from different
sampling locations ranged 0.30±0.08 to 0.47±0.04 mg/l.
Maximum value of 0.47 mg/l was found at Kampoo and
minimum value of 0.30 mg/l was recorded at Thatipur.
Concentration of fluoride was 0.72±0.12 mg/l at Motijheel
WTP before treatment and 0.28±0.07 after treatment.
fluoride concentrations at all sampling location were well
below WHO standard (1.5 mg/l). F- has a significant
mitigating effect against dental cares if the concentration is
approximately 1 mg/l (Soticha et al., 2014). However,
continuing consumption of higher concentrations of 4mg/l or
more can cause dental fluorosis and in extreme cases even
skeletal fluorosis (Dissanayake, 1991).
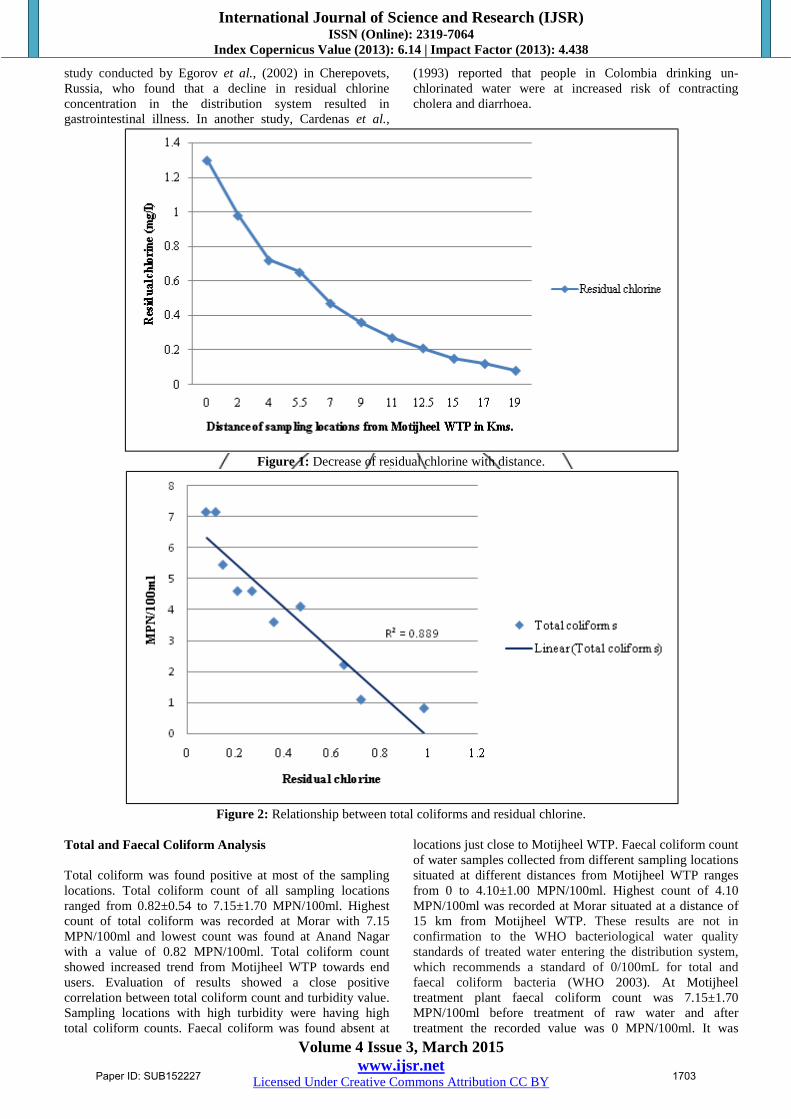
Residual chlorine
Concentration of residual chlorine of most of the water
samples from all sampling locations was below 0.6 mg/l.
But few samples possess higher values. Levels of residual
chlorine in all water samples collected from different
locations ranged from 0.08±0.01 to 0.98±0.13 mg/l. findings
have also been reported by Olivieri et al., (1986) & Hashmi
et al., 2009) who found residual chlorine in the range of 0.1
to 1.0 mg/l in drinking water distribution system. The
maximum residual chlorine was recorded at Anand Nagar
with a value of 0.98 mg/l and minimum value of 0.08 mg/l
was observed at Morar. Level of residual chlorine was
absent at Motijheel WTP before treatment and 1.30±0.25
mg/l after treatment. Residual chlorine shows sharp decrease
with the increase in distance of sampling locations from
Motijheel WTP (Fig 1). WHO (2006) had recommend that
the residual chlorine of 0.6–1.0 mg/l as standard. When
compared with WHO standards residual chlorine
concentration of most of the sampling locations was found
below 0.6 mg/l. Concentration below 0.6 mg/l is inadequate
for disinfection and this might result in pathogenic bacterial
growth in the distribution system (Olivieri et al., 1986).
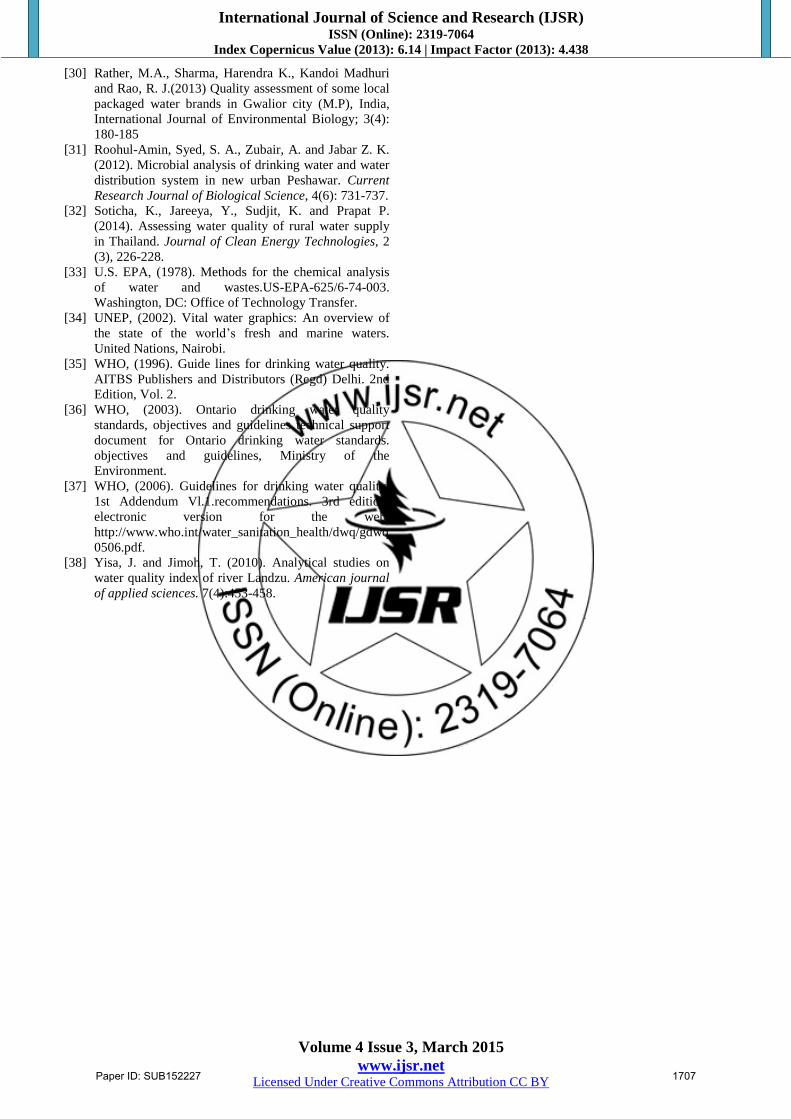
Total coliform count in drinking water was found varying
considerably with residual chlorine concentration present in
water (Fig. 2). Due to low concentration of residual chlorine
in many sampling locations, coliform bacteria counts were
recorded to be very high. And at these sampling locations
health problems were prevalent as indicated by
questionnaire survey. These findings are in line with the
Paper ID: SUB152227 1702
International Journal of Science and Research (IJSR) ISSN (Online): 2319-7064
Index Copernicus Value (2013): 6.14 | Impact Factor (2013): 4.438
Volume 4 Issue 3, March 2015
www.ijsr.net Licensed Under Creative Commons Attribution CC BY
study conducted by Egorov et al., (2002) in Cherepovets,
Russia, who found that a decline in residual chlorine
concentration in the distribution system resulted in
gastrointestinal illness. In another study, Cardenas et al.,
(1993) reported that people in Colombia drinking un-
chlorinated water were at increased risk of contracting
cholera and diarrhoea.
Figure 1: Decrease of residual chlorine with distance.
Figure 2: Relationship between total coliforms and residual chlorine.
Total and Faecal Coliform Analysis
Total coliform was found positive at most of the sampling
locations. Total coliform count of all sampling locations
ranged from 0.82±0.54 to 7.15±1.70 MPN/100ml. Highest
count of total coliform was recorded at Morar with 7.15
MPN/100ml and lowest count was found at Anand Nagar
with a value of 0.82 MPN/100ml. Total coliform count
showed increased trend from Motijheel WTP towards end
users. Evaluation of results showed a close positive
correlation between total coliform count and turbidity value.
Sampling locations with high turbidity were having high
total coliform counts. Faecal coliform was found absent at
locations just close to Motijheel WTP. Faecal coliform count
of water samples collected from different sampling locations
situated at different distances from Motijheel WTP ranges
from 0 to 4.10±1.00 MPN/100ml. Highest count of 4.10
MPN/100ml was recorded at Morar situated at a distance of
15 km from Motijheel WTP. These results are not in
confirmation to the WHO bacteriological water quality
standards of treated water entering the distribution system,
which recommends a standard of 0/100mL for total and
faecal coliform bacteria (WHO 2003). At Motijheel
treatment plant faecal coliform count was 7.15±1.70
MPN/100ml before treatment of raw water and after
treatment the recorded value was 0 MPN/100ml. It was
Paper ID: SUB152227 1703

International Journal of Science and Research (IJSR) ISSN (Online): 2319-7064
Index Copernicus Value (2013): 6.14 | Impact Factor (2013): 4.438
Volume 4 Issue 3, March 2015
www.ijsr.net Licensed Under Creative Commons Attribution CC BY
found that sampling locations situated close to Motijheel
WTP were having less coliform count. This might be
attributed to presence of sufficient residual chlorine at
location which results in effective disinfection of microbes
present there. Both total coliform as well as faecal coliform
counts showed an increasing trend with decrease in residual
chlorine in the water samples at sampling locations (Figure
3).
The presence of coliform organisms indicates the biological
contamination of drinking water (LeChevallier et al., 1991
& Khan et al., 2012). Total and faecal coliform counts were
very high at Govindpuri, Thatipur and Morar where residual
chlorine was very low or almost absent. These findings are
in compliance with the study conducted by Jiwa et al.,
(1991) who assessed the bacteriological quality of potable
water supply of the Morogoro municipality and determined
fecal coliform by the MPN method. Hence, the water
distribution systems were not capable of maintaining high
water quality from the water treatment facilities to the end-
user. Similarly studies were conducted by Hamida et al.,
(2006) in Peshawar Pakistan. Water quality decay in the
distribution network can be caused by properties of pipeline
materials, hydraulic conditions, biofilm thickness, excessive
network leakages, corrosion of parts, and intermittent
service (Lee and Schwab 2005). Sampling locations with
high turbidity were having high total coliform counts (Fig.
4). Correlation between various physico-chemical and
microbial parameters analyzed during present study is
shown in (Table 2).
Figure 3: Relation of total coliform, faecal coliform count with residual chlorine recorded at different sampling locations.
Figure 4: Relationship between total coliform and turbidity
Paper ID: SUB152227 1704

International Journal of Science and Research (IJSR) ISSN (Online): 2319-7064
Index Copernicus Value (2013): 6.14 | Impact Factor (2013): 4.438
Volume 4 Issue 3, March 2015
www.ijsr.net Licensed Under Creative Commons Attribution CC BY
.
Subjective response of respondents to the questionnaire
survey for water quality analysis
Questionnaire survey in the study area was carried out to
know people’s perception towards quality of water in
distribution network. A total 200 households (20 households
at each sampling location) were interviewed using
questionnaires. 61.5% of households complained about the
bad taste problem of tap water and for 38.5% households,
the bad taste does not present any problem. 35.5% of
households complained of bad odor issues and 27%
households complained of water color issues from all study
sites. 96% households reported that they were adversely
affected by the use of tap water and 4% households reported
that they were not affected by any health problem by using
tap water. 78.5% households reported that they were treating
the tap water before using it.
Diarrhoea was most the prevalent health problem in the
study area as reported by 33% of households followed by
Typhoid (21.5%), Jaundice (12.5%) and Dysentery (11%)
(Fig.5). Among the methods of treatment, 32% of
households were using boiling, 18% aqua guard and 16.5%
alum as the methods of treatment for tap water before
drinking it and 21.5% households were not treating water
before using it for drinking or for cooking purposes (Fig. 6).
Figure 5: Occurrence of various water borne diseases in
%age at in the study area
Figure 6: Various methods of water treatment used by the
households (in %age) in the study area.
Table 2: Correlation matrix for different various physico-chemical and microbiological parameters analyzed during present
study.
Temp. pH Turbidity EC TH BOD NO3- Iron F- RC TC TDS
Temp. 1 pH 0.8044 1 Turbidity 0.6587 0.3103 1 EC 0.3806 0.1837 0.1024 1 TH 0.4316 0.4649 0.4283 0.3434 1 BOD 0.3525 -0.0365 0.7753 -0.0086 0.0744 1 NO3
- -0.1891 -0.4889 0.0657 0.5434 0.0776 -0.0824 1 Iron 0.1112 -0.3285 0.4107 0.5986 0.1942 0.2980 0.7797 1 F- 0.3682 0.0908 0.1923 0.7201 0.3839 0.2000 0.4705 0.4641 1 RC -0.6010 -0.2715 -0.9216 -0.3541 -0.5328 -0.7140 -0.2569 -0.5049 -0.3491 1 TC 0.4488 0.1089 0.9464 0.1437 0.4535 0.7285 0.2681 -0.5812 0.1764 0.9199 1 TDS 0.2601 0.0213 0.0405 0.9300 0.2529 0.1014 0.5586 0.5752 0.8222 -0.4453 -0.3110 1
4. Conclusion
Results of water samples collected from the outlet of
Motijheel WTP revealed that the water entering the
distribution system was of desired physico-chemical quality
and free from micro-organisms. However, good quality
drinking water can suffer serious contamination in
distribution system because of breaches in the integrity of
the pipe work and storage reservoirs. All of the water
samples collected from different sampling locations were
found positive for total coliforms. Most of the water samples
were positive for faecal coliforms except the water samples
collected from Anand Nagar and Kishan Bagh. Residual
chlorine was found very low at most of sampling locations
as compared to WHO limits of (0.6-1.0 ml). The lowest
value of 0.08 mg/l of residual chlorine was found at Morar.
Paper ID: SUB152227 1705

International Journal of Science and Research (IJSR) ISSN (Online): 2319-7064
Index Copernicus Value (2013): 6.14 | Impact Factor (2013): 4.438
Volume 4 Issue 3, March 2015
www.ijsr.net Licensed Under Creative Commons Attribution CC BY
This study revealed that monitoring of water quality is
essential to ensure adequate free chlorine residual at the
consumer end. Public response was quite interesting as
revealed by questionnaire survey. People were very much
concerned about the quality of drinking water they were
consuming, as most of them gave suggestions with the stress
on periodical monitoring by the government agencies. The
result of this study may help government and allied agencies
to take appropriate action with regard to appropriate
chlorination practices in the area.
5. Acknowledgements
Authors are thankful to School of Studies in Environmental
science (IGAEERE), Jiwaji University, Gwalior for
providing laboratory facility for the investigation.
References
[1] APHA, (1992). Standard methods for the examination
of water and wastewater. 18th
Ed., Washington USA.
[2] Aulicino, F. A. and Pastoni, F. (2004). Microorganisms
surviving in drinking water systems and related
problems. Annalid’ igiene, 16: 265–272.
[3] Boyacioglu, H. (2007). Development of water quality
index based on European classification scheme. Water
Supply, 1: 101-114.
[4] Cardenas, V., Saad, C., Varona, M. and Linero, M.
(1993). Waterborne cholera in Riohacha, Colombia.
Bulletin of the Public American Health Organization,
27(4): 313–330.
[5] Cheesbrough, M. (2000). District laboratory practice
for tropical countries, part 2. Cambridge University
Press, Cambridge, 143-154.
[6] Cleave, F. (1998). There is a way to do it. Waterlines,
169 (4): 12-14.
[7] Dissanayake, C. B. (1991). The fluoride problem in the
groundwater of Sri Lanka- environmental management
and health. International Journal of Environmental
Studies, 19: 195-203.
[8] Egorov, A., Ford, T., Tereschenko, A., Drizhd, N.,
Segedevich, I. and Fourman, V. (2002). Deterioration
of drinking water quality in the distribution system and
gastrointestinal morbidity in a Russian city.
International Journal of Environmental Health
Research, 12(3): 221–233.
[9] Garg. D., Goyal. S., Chaturvedi. S. and Singh, R. V.
(2007). Positional Survey of the ground water quality
of the Bharatpur area during the monsoon season.
Journal of Current Sciences, 10: 131-136.
[10] Gupta, P. K. (2001). Methods in environmental
analysis; water, soil and air. Updesh Purohit Agrobios
(India), Jodhpur.
[11] Gupta, V., Agarwal, J. and Sharma, S. (2008).
Adsorption analysis of Mn(vii) from aqueous medium
by natural polymer chitin and chitosan, Asian Journal
of Chemistry, 20(8): 6195-98.
[12] Hashmi, I., Farooq, S., and Qaiser, S. (2009).
Chlorinationand water quality monitoring within a
public drinking water supply in Rawalpindi Cantt.
(Westridge and Tench) area, Pakistan. Environmental
Monitoring and Assessment, 158, 393–403.
[13] Hamida, A., Javed, A., Mohammad N. A. and
Musaddiq, I. (2006). Bacteriological analysis of
[14] drinking water of hand pumps in different schools of
District Peshawar Pakistan. Pakistan Journal of Food
Science 16(1-4): 34-38.
[15] Jiwa, S. F., Mugula, J. K. and Msangi, M. J. (1991).
Bacteriological quality of potable water sources
supplyingMorogoro municipality and its outskirts: A
case study in Tanzania. Epidemiology and Infection,
107(3): 479–484.
[16] Jensen, P. K., Jayasinghe, G., Van der Hoek, W.,
Cairncross, S., & Dalsgaard, A. (2004). Is there an
association between bacteriological drinking water
quality and childhood diarrhoea in developing
countries? TropicalMedicine&InternationalHealth,
9(11), 1210–1215.
[17] Kataria, Gupta, R. and Verma, P. (2008). Analysis of
Fluoride Concentration in Groundwater in and around
Bhopal city, M.P. India. Bioscience Biotechnology
Research Asia, 5(2): 699-700.
[18] Khan, S., Shahnaz, M., Jehan, N., Rehman, S., Shah,
M. T. and Din, I. (2012). Drinking Water Quality and
Human Health Risk in Charsadda District, Pakistan.
Journal of Cleaner Production. 1-9.
[19] Kitazawa, H. (2006). Keeping residual chlorine and
decreasing unpleasant odor caused by disinfection of
tap water. Water Supply, 6(2): 193–199.
[20] LeChevallier, M. W., Norton, W. D., and Lee, R. G.
(1991). Giardia and Cryptosporidium spp. in filtered
drinking water supplies. Applied and Environmental
Microbiology, 57(9): 2617–2621.
[21] Lee, Y. and Nam, S. (2005). Comparative study of
chemical disinfection in drinking water supplies. Water
Conditioning & Purification. 1-6.
[22] Lienyao, L., Chungsying, L. and Shyang-Lai, K.
(2004). Spatial diversity of chlorine residual in a
drinking water distribution system. Journal of
Environmental Engineering, 130: 1263–1268.
[23] Lin, T. F., Little, J. C. and Nazaroff, W. W. (1996).
Transport and sorption of organic gases in
activatedcarbon. Journal of Environmental
Engineering, 122(3): 169–175.
[24] Olivieri, V. P., Snead, M. C., Kruse, C. W. and
Kawata, K. M. (1986). Stability and effectiveness of
chlorine disinfectants in water distribution systems.
Environmental Health Perspectives, 69: 15–29.
[25] Park, (2005). Textbook of preventive and social
medicine, 18th Edition. M/s Banarsidas Bhanot
publishers, Prem Nagar, Jabalpur, India.
[26] PCRWR, (2005). Pakistan Council of Research and
Water Resources. National Water Quality Monitoring
Programme, Report 2004, Islamabad.
[27] Postel, S. L., Gretchen C. D. and Paul, R. E. (1996).
Human appropriation of renewable freshwater.
Science, 271: 785-788.
[28] Ramteke, P. W., Bhattacharjee, J. W., Pathak, S. P., &
Kaira, N. (1992). Evaluation of coliforms as indicators
of water quality in India. Journal of Applied
Bacteriology,72(4), 352–356.
[29] Ratnayaka, D. D., Brandt, M. J. and Johnson, K. M.
(2009). Chemistry, microbiology and biology of water
chapter 6. 6th edition. Butterworth, Burlington, 195–
266.
Paper ID: SUB152227 1706
International Journal of Science and Research (IJSR) ISSN (Online): 2319-7064
Index Copernicus Value (2013): 6.14 | Impact Factor (2013): 4.438
Volume 4 Issue 3, March 2015
www.ijsr.net Licensed Under Creative Commons Attribution CC BY
[30] Rather, M.A., Sharma, Harendra K., Kandoi Madhuri
and Rao, R. J.(2013) Quality assessment of some local
packaged water brands in Gwalior city (M.P), India,
International Journal of Environmental Biology; 3(4):
180-185
[31] Roohul-Amin, Syed, S. A., Zubair, A. and Jabar Z. K.
(2012). Microbial analysis of drinking water and water
distribution system in new urban Peshawar. Current
Research Journal of Biological Science, 4(6): 731-737.
[32] Soticha, K., Jareeya, Y., Sudjit, K. and Prapat P.
(2014). Assessing water quality of rural water supply
in Thailand. Journal of Clean Energy Technologies, 2
(3), 226-228.
[33] U.S. EPA, (1978). Methods for the chemical analysis
of water and wastes.US-EPA-625/6-74-003.
Washington, DC: Office of Technology Transfer.
[34] UNEP, (2002). Vital water graphics: An overview of
the state of the world’s fresh and marine waters.
United Nations, Nairobi.
[35] WHO, (1996). Guide lines for drinking water quality.
AITBS Publishers and Distributors (Regd) Delhi. 2nd
Edition, Vol. 2.
[36] WHO, (2003). Ontario drinking water quality
standards, objectives and guidelines technical support
document for Ontario drinking water standards.
objectives and guidelines, Ministry of the
Environment.
[37] WHO, (2006). Guidelines for drinking water quality,
1st Addendum Vl.1.recommendations. 3rd edition,
electronic version for the web.
http://www.who.int/water_sanitation_health/dwq/gdwq
0506.pdf.
[38] Yisa, J. and Jimoh, T. (2010). Analytical studies on
water quality index of river Landzu. American journal
of applied sciences. 7(4):453-458.
Paper ID: SUB152227 1707
Related Documents


