Nuclear Safety NEA/CSNI/R(2014)12 January 2015 www.oecd-nea.org Assessment of CFD Codes for Nuclear Reactor Safety Problems – Revision 2

Welcome message from author
This document is posted to help you gain knowledge. Please leave a comment to let me know what you think about it! Share it to your friends and learn new things together.
Transcript

Nuclear SafetyNEA/CSNI/R(2014)12 January 2015www.oecd-nea.org
Assessment of CFD Codesfor Nuclear Reactor Safety Problems – Revision 2


Unclassified NEA/CSNI/R(2014)12
Organisation de Coopération et de Développement Économiques
Organisation for Economic Co-operation and Development 16-Jan-2015
___________________________________________________________________________________________
_____________ English text only NUCLEAR ENERGY AGENCY
COMMITTEE ON THE SAFETY OF NUCLEAR INSTALLATIONS
Assessment of CFD Codes for Nuclear Reactor Safety Problems - Revision 2
JT03369378
Complete document available on OLIS in its original format
This document and any map included herein are without prejudice to the status of or sovereignty over any territory, to the delimitation of
international frontiers and boundaries and to the name of any territory, city or area.
NE
A/C
SN
I/R(2
01
4)1
2
Un
classified
En
glish
text o
nly

NEA/CSNI/R(2014)12
2
ORGANISATION FOR ECONOMIC CO-OPERATION AND DEVELOPMENT
The OECD is a unique forum where the governments of 34 democracies work together to address the economic, social
and environmental challenges of globalisation. The OECD is also at the forefront of efforts to understand and to help
governments respond to new developments and concerns, such as corporate governance, the information economy and the
challenges of an ageing population. The Organisation provides a setting where governments can compare policy
experiences, seek answers to common problems, identify good practice and work to co-ordinate domestic and international
policies.
The OECD member countries are: Australia, Austria, Belgium, Canada, Chile, the Czech Republic, Denmark, Estonia,
Finland, France, Germany, Greece, Hungary, Iceland, Ireland, Israel, Italy, Japan, Luxembourg, Mexico, the Netherlands,
New Zealand, Norway, Poland, Portugal, the Republic of Korea, the Slovak Republic, Slovenia, Spain, Sweden,
Switzerland, Turkey, the United Kingdom and the United States. The European Commission takes part in the work of the
OECD.
OECD Publishing disseminates widely the results of the Organisation’s statistics gathering and research on economic,
social and environmental issues, as well as the conventions, guidelines and standards agreed by its members.
NUCLEAR ENERGY AGENCY
The OECD Nuclear Energy Agency (NEA) was established on 1 February 1958. Current NEA membership consists of
31 countries: Australia, Austria, Belgium, Canada, the Czech Republic, Denmark, Finland, France, Germany, Greece,
Hungary, Iceland, Ireland, Italy, Japan, Luxembourg, Mexico, the Netherlands, Norway, Poland, Portugal, the Republic of
Korea, the Russian Federation, the Slovak Republic, Slovenia, Spain, Sweden, Switzerland, Turkey, the United Kingdom
and the United States. The European Commission also takes part in the work of the Agency.
The mission of the NEA is:
– to assist its member countries in maintaining and further developing, through international co-operation, the
scientific, technological and legal bases required for a safe, environmentally friendly and economical use of
nuclear energy for peaceful purposes, as well as
– to provide authoritative assessments and to forge common understandings on key issues, as input to government
decisions on nuclear energy policy and to broader OECD policy analyses in areas such as energy and sustainable
development.
Specific areas of competence of the NEA include the safety and regulation of nuclear activities, radioactive waste
management, radiological protection, nuclear science, economic and technical analyses of the nuclear fuel cycle, nuclear law
and liability, and public information.
The NEA Data Bank provides nuclear data and computer program services for participating countries. In these and
related tasks, the NEA works in close collaboration with the International Atomic Energy Agency in Vienna, with which it
has a Co-operation Agreement, as well as with other international organisations in the nuclear field.
This document and any map included herein are without prejudice to the status of or sovereignty over any territory, to the delimitation of
international frontiers and boundaries and to the name of any territory, city or area.
Corrigenda to OECD publications may be found online at: www.oecd.org/publishing/corrigenda.
© OECD 2014
You can copy, download or print OECD content for your own use, and you can include excerpts from OECD publications, databases and multimedia products in your own documents, presentations, blogs, websites and teaching materials, provided that suitable acknowledgment of the OECD as source
and copyright owner is given. All requests for public or commercial use and translation rights should be submitted to [email protected]. Requests for
permission to photocopy portions of this material for public or commercial use shall be addressed directly to the Copyright Clearance Center (CCC) at
[email protected] or the Centre français d'exploitation du droit de copie (CFC) [email protected].

NEA/CSNI/R(2014)12
3
COMMITTEE ON THE SAFETY OF NUCLEAR INSTALLATIONS
Within the OECD framework, the NEA Committee on the Safety of Nuclear Installations (CSNI) is
an international committee made of senior scientists and engineers, with broad responsibilities for safety
technology and research programmes, as well as representatives from regulatory authorities. It was set up
in 1973 to develop and co-ordinate the activities of the NEA concerning the technical aspects of the design,
construction and operation of nuclear installations insofar as they affect the safety of such installations.
The committee’s purpose is to foster international co-operation in nuclear safety amongst the NEA
member countries. The CSNI’s main tasks are to exchange technical information and to promote
collaboration between research, development, engineering and regulatory organisations; to review
operating experience and the state of knowledge on selected topics of nuclear safety technology and safety
assessment; to initiate and conduct programmes to overcome discrepancies, develop improvements and
research consensus on technical issues; and to promote the co-ordination of work that serves to maintain
competence in nuclear safety matters, including the establishment of joint undertakings.
The clear priority of the committee is on the safety of nuclear installations and the design and
construction of new reactors and installations. For advanced reactor designs the committee provides a
forum for improving safety related knowledge and a vehicle for joint research.
In implementing its programme, the CSNI establishes co-operative mechanisms with the NEA’s
Committee on Nuclear Regulatory Activities (CNRA) which is responsible for the programme of the
Agency concerning the regulation, licensing and inspection of nuclear installations with regard to safety. It
also co-operates with the other NEA’s Standing Committees as well as with key international organizations
(e.g., the IAEA) on matters of common interest.

NEA/CSNI/R(2014)12
4
ASSESSMENT OF CFD FOR NUCLEAR REACTOR SAFETY PROBLEMS
B. L. Smith (PSI), M. Andreani (PSI), U. Bieder (CEA), F. Ducros (CEA), E. Graffard (IRSN),
M. Heitsch (GRS), M. Henriksson (Vattenfall), T. Höhne (FZD), M. Houkema (NRG),
E. Komen (NRG), J. Mahaffy (PSU), F. Menter (ANSYS), F. Moretti (UPisa),
T. Morii (JNES), P. Mühlbauer (NRI), U. Rohde (HZDR), M. Scheuerer (GRS),
C.-H. Song (KAERI), T. Watanabe (JAEA), G. Zigh (US NRC)
With additional input from
F. Archambeau (EDF), S. Bellet (EDF), D. Bestion (CEA), C. F. Boyd (US NRC), E. Krepper (HZDR),
J.M. Muñoz-Cobo (UPV), J.-P. Simoneau (AREVA)

NEA/CSNI/R(2014)12
5
EXECUTIVE SUMMARY
Original Initiative
Following recommendations made at an “Exploratory Meeting of Experts to Define an Action Plan on
the Application of Computational Fluid Dynamics (CFD) Codes to Nuclear Reactor Safety (NRS)
Problems”, held in Aix-en-Provence, France, 15-16 May, 2002, and a follow-up meeting “Use of
Computational Fluid Dynamics (CFD) Codes for Safety Analysis of Reactor Systems including
Containment”, which took place in Pisa on 11-14 Nov., 2002, a CSNI action plan was drawn up which
resulted in the creation of three Writing Groups, with mandates to perform the following tasks:
(1) Provide a set of guidelines for the application of CFD to NRS problems;
(2) Evaluate the existing CFD assessment bases, and identify gaps that need to be filled;
(3) Summarise the extensions needed to CFD codes for application to two-phase NRS problems.
Work began early in 2003. In the case of Writing Group 2 (WG2), a preliminary report was submitted
to WGAMA in September 2004 that scoped the work needed to be carried out to fulfil its mandate, and
made recommendations on how to achieve the objective. A similar procedure was followed by the other
two groups, and in January 2005 all three groups were reformed to carry out their respective tasks. In the
case of WG2, this resulted in the issue of a CSNI report (NEA/CSNI/R(2007)13), issued in January 2008,
describing the work undertaken.
Background
Computational methods have been used in the safety analysis of reactor systems for nearly 40 years.
During this time, very reliable numerical programs have been developed for analysing the primary system,
and similar programs have also been written for modelling containments and severe accident scenarios.
Such codes model the reactor components as networks of 1-D or even 0-D cells. It is evident, however, that
the flows in many reactor primary components are essentially 3-D in character, as is natural circulation,
mixing and stratification in containments. CFD has the potential to numerically simulate flows of this type,
and to handle geometries of almost arbitrary complexity. Consequently, CFD is expected to feature more
prominently in reactor thermal-hydraulics analyses in the future.
Traditional approaches to NRS analysis, using system codes for example, have been successful
because of the very large database of mass, momentum and energy exchange correlations that have been
built into them. The correlations have been formulated from essentially 1-D special-effects tests, and their
specific ranges of validity have been very well scrutinised. Analogous data relating to 3-D flow situations
is very sparse by comparison. Consequently, the issue of the validity range of CFD codes for 3-D NRS
applications has first to be addressed before the use of CFD may be considered as routine and trustworthy,
as it is, for example, in the turbo-machinery, automobile and aerospace industries. Assessment of the
reliability of CFD methodology in NRS applications represented the primary focus of the WG2 group.
Working Group on the Analysis and Management of Accidents

NEA/CSNI/R(2014)12
6
Objectives and Scope
The main tasks of WG2 were originally defined as follows:
Extend and consolidate the existing provisional WG2 document to the level of a CSNI report, to act
as a platform for launching a web-based assessment database;
Monitor and assess the current status of CFD validation exercises relevant to NRS issues;
Identify gaps in the technology base and assess the prospect of them being closed in the near future;
Identify experiments the data from which could be used as a basis for CFD benchmarking activities;
Organise, as a spin-off activity, a series of international workshops to promote availability and
distribution of experimental data suitable for NRS validation.
The group concentrated on single-phase phenomena, considering that two-phase CFD is not yet of
sufficient maturity for a useful assessment basis to be constructed, and that identification of the areas
which need to be developed (the task of WG3) should be undertaken first. Nonetheless, for completeness,
those phenomena requiring multi-phase CFD have been identified in this document, but not elaborated
upon. Where appropriate, reference is given to the WG3 document (NEA/CSNI/R(2010)2), where such
issues are taken up and discussed in detail.
It was recognised that the nuclear community was not the primary driving force for the emergence of
commercial CFD software during the early years of its development (1980s and 1990s), but could benefit
nonetheless from the validation procedures undertaken in those industrial areas for which the basic
thermal-hydraulic phenomena were similar. Consequently, it was necessary for the group to take full
account of CFD assessment activities taking place outside the nuclear industry, and the present document
reflects this wider perspective.
Organisation of the Document
The writing group met on average twice per year during the period March 2005 to May 2007, and
coordinated activities strongly with the sister groups WG1 (Best Practice Guidelines) and WG3
(Multiphase Extensions). The resulting document prepared at the end of this time still represents the core
of the present revised version, though updates have been made as new material has become available. After
some introductory remarks, Chapter 3 lists twenty-three (23) NRS issues for which it is considered that the
application of CFD would bring real benefits in terms of better predictive capability, and ultimately
enhanced safety awareness in quantitative terms. This classification is followed by a short description of
each specific safety issue, a highly condensed state-of-the-art summary of what has been attempted to date,
what is still needed to be done to improve reliability, and a list of topical references.
Chapter 4 details the general assessment bases that have already been established, and discusses the
usefulness and relevance of the work to NRS applications, where appropriate. This information is
augmented in Chapter 5 by descriptions of the existing CFD assessment bases that have been established
around specific NRS issues. Typical examples are experiments devoted to boron dilution, pressurised
thermal shock, and thermal fatigue in pipes. The technology gaps which need to be closed to make CFD a
more trustworthy analytical tool are listed in Chapter 6. Some deficiencies originally identified, such as
limitations in the range of application of turbulence modelling, coupling of CFD with neutronics and
system codes, and computer power limitations, have subsequently been filled, or partially filled. Most CFD
codes currently being used in NRS applications have their own, custom-built assessment bases, the data
being provided from both within and outside the nuclear community. These efforts are also documented.
Chapter 7 has been completely revised, since the CFD4NRS Workshop in Garching, Germany in
2006 has been followed by three more workshops in the series: XCFD4NRS (Grenoble, France, 2008),
NEA/CSNI/R(2014)12
7
CFD4NRS-3 (Washington DC, USA, 2010) and CFD4NRS-4 (Daejeon, S. Korea, 2012). In addition, two
OECD-sponsored CFD benchmark exercises have been organised by the CFD group within WGAMA,
featuring topical issues of nuclear safety: thermal fatigue in T-junctions and turbulence generated
downstream of a spacer grid in a rod bundle. Summary details are given.
Major Revisions
Several important additions to the original document have been made as a consequence of the later
initiative within WGAMA to create a CFD Task Group to oversee the updating of the three Writing Group
documents, and transfer the information to a Wiki environment on the NEA website. The updates and
additions to the original WG2 document have been incorporated into this revised version. For easy
reference, the modified sections are listed here.
Section 3.15 (Induced Break) has been re-written in the light of more recent developments.
Section 3.16 (Thermal Fatigue) has also been reworked, and extra references added.
Section 3.25 (Sump Strainer Clogging) is a completely new addition to the document, making good
an obvious earlier omission. Available validation data from the tests in Germany appear under
Section 5.5.
Section 5.3, which details the available assessment bases in the area of thermal fatigue, has been
expanded to include the recent release of information on the issue deriving from operation of the
sodium-cooled Phénix reactor, the tests from the WATLON series in Japan, and the recent OECD-
Vattenfall CFD International Benchmark. The reference list has also been extended.
Section 5.5 (Sump Strainer Clogging) is a new addition to the document, detailing the tests made at
HZDR in Germany on the issue. A comprehensive reference list has also been added.
Section 6.12 (Scaling and Uncertainty) represents a major overhaul of the material contained in the
original document (which was compiled principally from documentation written in the context of the
EC 5th FWP ECORA). The new material is very extensive, and includes sub-sections on the basis
scaling issue, the various scaling methodologies in current use, an illustrative example relevant to
CFD, the existing methods of uncertainty analysis in CFD, recommendations on new paths to
follow, and a comprehensive reference list.
Section 7 has been extended to include included information on the creation of a web portal to
provide online access to the material contained in the Writing Group reports
Annex 1 has been updated substantially to include details of the four CFD4NRS Workshops held to
date, including the list of technical sessions and the conclusions and recommendations coming from
the panel session debates.
Follow-Up Activities
During the time the Writing Groups were still meeting regularly, there was already discussion among
the groups of how better to make use of the material collected. These thoughts manifested themselves in a
proposal to WGAMA to extend and broaden the work beyond just the production of the three archival
documents. The following ideas were put forward:
Organise a new series of international workshops to provide a forum for experimenters and
numerical analysts to exchange information;
Establish a Wiki-type web portal to give online access to the information collected and
documented by the Writing Groups, and provide a means for updating and extending the
information by inviting reader participation; and
NEA/CSNI/R(2014)12
8
Encourage nuclear departments at universities and research organisations to release previously
restricted test data by initiating a series of international benchmarking exercises.
The CFD4NRS Workshops
The first of the workshops, which are all specifically focused on the application of CFD to nuclear
reactor safety (NRS) issues, took place in 2006 under the acronym CFD4NRS, sponsored jointly by the
OECD/NEA and the IAEA. There were 79 attendees. Papers describing CFD simulations were accepted
only if there was a strong validation component. In total, 39 technical and 5 invited papers were presented.
Most related to the NRS issues highlighted in this document, such as pressurised thermal shock, boron
dilution, hydrogen distribution, induced breaks and thermal striping. Selected papers appeared in a special
issue of Nuclear Engineering and Design (NED). The second workshop in the series, XCFD4NRS, took
place in Grenoble, France in September 2008. Here, the emphasis was more on new experimental
techniques and two-phase CFD. The workshop attracted 147 participants. There were 5 invited speakers, 3
keynote talks, 44 technical papers and 15 posters. Again, selected papers were collected in a special issue
of NED. The third workshop, CFD4NRS-3, was held in Washington DC in September 2010 and its
proceedings appeared during 2011 with selected papers in a topical issue of Nuclear Engineering and
Design in 2012. The fourth workshop, hosted by KAERI, took place in Daejeon, Rep. of Korea in
September 2012 with the proceedings published in early 2014 (http://www.oecd-
nea.org/nsd/docs/2014/csni-r2014-4.pdf). The fifth workshop, CFD4NRS-5, was hosted by ETH Zurich in
September 2014; at the time of writing, proceedings are being prepared and some papers have been
selected for a special issue of Nuclear Engineering and Design. More details are given in Appendix 1.
Moving the Writing Group Documents to the Web
The activities of the three OECD/NEA Writing Groups on CFD were concluded at the end of 2007
with the completion, or near completion, of their respective CSNI reports. It was recognised, like any state-
of-the-art report, these documents would only be up-to-date at the time of writing, and, given the rapidly
expanding use of CFD in the nuclear technology field, the information they contained would soon become
outdated, though perhaps less so for the WG1 document dealing with BPGs. To preserve their topicality,
improvements and extensions to the documents were already foreseen. It was decided that the most
efficient vehicle for regular updating would be to create a Wiki-type web portal. Consequently, in a pilot
study, a dedicated webpage has been created on the NEA website using Wikimedia software. In a first step,
the WG2 document in the form in which it appears as an archival document was uploaded to provide on-
line access. The WG1 document has also since been uploaded, and the webpages for the WG3 document
are under construction. Some details are given in Annex 2.
CFD Blind Benchmark Exercises
At a meeting of the chairmen of the NEA CFD Writing Groups in 2008, it was decided to utilize the
organization within the Special CFD Group of WGAMA to launch the first of a series of international
benchmark exercises. Both single-phase and two-phase flow options were considered. It was generally
agreed that it would be desirable to have the opportunity of setting up a blind benchmarking activity, in
which participants would not have access to measured data, apart from what was necessary to define initial
and boundary conditions for the numerical simulation, until they had submitted their numerical predictions
for evaluation. This would entail finding a completed, or nearly completed, experiment for which the data
had not yet been released, or encouraging a new experiment (most likely in an existing facility) to be
undertaken especially for this exercise. The group took on the responsibility of finding a suitable
experiment, for providing the organisational basis for launching the benchmark exercise, and for the
subsequent synthesis of the results.
Two such benchmarking exercises have since been conducted, and a third is at the planning stage. The
first examined the issue of high-cycle thermal fatigue in a T-junction geometry, and was based on

NEA/CSNI/R(2014)12
9
previously unreleased test data from a very careful experiment carried out at the Älvkarleby Laboratory of
Vattenfall Research and Development in Sweden in November 2008. The benchmark activity ran from
May 2009 (Kick-Off Meeting) to December 2010 (CSNI approval of the final report). In total, 29
participants submitted blind numerical predictions for synthesis. The second benchmark exercise focused
on the ability of CFD codes to predict turbulence characteristics downstream of a spacer grid in a rod-
bundle geometry. Special tests were carried out in the MATiS-H cold-flow facility at the Korea Atomic
Energy Research Institute (KAERI) in early Spring 2012. Two spacer grids (of generic design), of the split
type and swirl-type, were featured in the study. Computer Aided Design (CAD) files of the spacer grids
were made available by KAERI to aid CFD mesh generation. The benchmark was launched in April 2011,
and 25 blind numerical predictions collected one year later. The final benchmark report was approved by
the CSNI in December 2012. Annex 3 gives more details of both the benchmark activities.
Results and recommendations
The use of CFD in many branches of engineering is widespread and growing, due largely to the
considerable advancements made in software and hardware technology. With the advent of multi-processor
machines, application areas are expected to broaden, and expectations on the potential benefits in
employing CFD methodologies to increase. Accompanying this drive forwards is a need to establish
quality and trust in the predictive capabilities of CFD codes, and, as a consequence of open public
awareness, this message is particularly relevant to the application of CFD to nuclear reactor safety. There
is a need therefore to quantify the trustworthiness of the CFD results obtained from NRS applications. The
mandate of the CFD Writing Group on assessment, WG2, was to specifically address this issue. The earlier
document (issued in January 2008) represented, at the time of writing, a compendium of the then current
application areas. It provided a catalogue of experimental validation data relevant to these applications,
identified where the gaps in information lie, and made recommendations on what should be done to fill
them. Primary focus was given to single-phase flow situations.
A list of NRS problems for which CFD analysis is required, or is expected to result in positive
benefits, has been compiled, and reviewed critically. The list includes safety issues of relevance to core,
primary-circuit and containment behaviour, under both normal and abnormal operating conditions, and
during accident sequences, as comprehensively as could be assembled with the resources available. The list
may be taken to represent the current application areas for single-phase CFD in NRS, and to serve as a
basis for assembling the relevant assessment matrices. Since CFD is already an established technology
outside the nuclear technology area, suitable validation data from all available sources has been included in
the document. It was found that the databases were principally of two types: those concerned with general
aspects of trustworthiness of code predictions (e.g., ERCOFTAC, QNET-CFD, FLOWNET), and those
focused on particular application areas (e.g., MARNET, NPARC, AIAA). It was concluded that
application of CFD to NRS problems can benefit indirectly from these databases, and the continuing
efforts to extend them, but that a comprehensive NRS-specific database would always be needed to
complement them. Consequently, the established assessment databases relating to specific NRS issues has
been catalogued separately, and more comprehensively discussed in the document. Areas here include
boron dilution, flow in complex geometries, pressurised thermal shock and thermal fatigue, all of which
have already been the subject of CFD benchmarking activities.
Also identified, from a modelling viewpoint, are the gaps in the existing assessment databases. For
single-phase CFD applications, these devolve around the traditional limitations of computing power,
controlling numerical diffusion, the appropriateness of the established turbulence models, and coupling to
system, neutronics and (to a lesser extent) structure mechanics codes. There is also the issue of isolating
the CFD problem. An example is the specification of initial conditions if only an intermediate part of a
given reactor transient is to be simulated, a part in which 3-D flow phenomena are expected to be
important.
NEA/CSNI/R(2014)12
10
Important new information is provided by the material presented at the series of CFD4NRS
Workshops, four of which have taken place between 2006 and 2012. Here, numerical simulations with a
strong emphasis on validation were particularly encouraged, together with the reporting of experiments
which have provided high-quality data suitable for CFD validation. In addition, an important new
contribution to the assessment database is the organisation of CFD benchmarking activities, also promoted
by WGAMA. Two benchmarking exercises have so far been completed (in the area of thermal fatigue in a
T-junction and turbulence generation downstream of a spacer grid in a rod bundle), and a third benchmark
is being planned, based on a new experiment to be performed in the PANDA facility at PSI.
The present document thus represents an important milestone in establishing a comprehensive
assessment database for the application of CFD to NRS problems. A second stage will involve updating the
new information to the Wiki website to enable ready access to the information, and give encouragement for
users to supply new information. CFD remains a very dynamic technology, and with its increasing use
within nuclear safety there will be ever greater demands to document current capabilities, and prove
trustworthiness by means of validation exercises. It is therefore anticipated that any existing assessment
database will soon need to be extended. To prevent important information assembled from becoming
obsolete, the following recommendations were made in the original WG2 document, and subsequently
acted upon.
Set up and maintain a web-based centre to consolidate, update and extend the information
contained in the document. The webpages are now active on the NEA website, and the new
information contained in this document will be uploaded to it in due course.
Provide a forum for numerical analysts and experimentalists to exchange information in the field of
NRS-related activities relevant to CFD validation by holding further workshops in the CFD4NRS
series, to provide information for building into the web-based assessment matrix. Four such
workshops have now taken place, and a fifth is planned for 2014.
Form a small task unit comprising one representative from each of the three Writing Groups,
together with the NEA webmaster and secretariat, to act as the central organising body for the tasks
here stated. The task unit was formed, and became the central organising body for the CFD4NRS
workshops and related benchmarking exercises.
In the longer term, new benchmarking exercises will need to be considered, based on suitable data
already identified within this document, or on new data being presented at future workshops in the
CFD4NRS series. It is not anticipated that these would be on the scale of an ISP, but would be of
maximum two years duration from initial announcement to summary document. The reduced overhead will
enable the benchmark organisers to respond quickly to changing directions in the application of CFD to
nuclear reactor safety issues, and keep pace with the CFD4NRS workshop format, enabling the close links
between them to be maintained.

NEA/CSNI/R(2014)12
11
TABLE OF CONTENTS
EXECUTIVE SUMMARY ............................................................................................................................. 5 1. INTRODUCTION/BACKGROUND ....................................................................................................... 13 2. OBJECTIVES OF THE WORK .............................................................................................................. 17 3. NRS PROBLEMS WHERE (SINGLE-PHASE) CFD ANALYSIS BRINGS REAL BENEFITS ........ 19
Introduction ................................................................................................................................................ 19 3.1 Erosion, Corrosion and Deposition ................................................................................................. 20 3.2 Core Instability in BWRs ................................................................................................................ 22 3.3 Transition boiling in BWRs – determination of MCPR .................................................................. 23 3.4 Recriticality in BWRs ..................................................................................................................... 23 3.5 Reflooding ....................................................................................................................................... 23 3.6 Lower Plenum Debris Coolability and Melt Distribution ............................................................... 24 3.7 Boron Dilution ................................................................................................................................ 25 3.8 Mixing, Stratification, Hot-Leg Heterogeneities............................................................................. 27 3.9 Hot Leg Heterogeneities ................................................................................................................. 28 3.10 Heterogeneous Flow Distributions ............................................................................................ 30 3.11 BWR/ABWR Lower Plenum Flow ........................................................................................... 31 3.12 Water-Hammer Condensation ................................................................................................... 32 3.13 Pressurised Thermal Shock (PTS) ............................................................................................. 34 3.14 Pipe Break ................................................................................................................................. 35 3.15 Induced Break ............................................................................................................................ 36 3.16 Thermal Fatigue in Stratified Flows .......................................................................................... 39 3.17 Hydrogen Distribution ............................................................................................................... 40 3.18 Chemical Reactions/Combustion/Detonation ............................................................................ 42 3.19 Aerosol Deposition/Atmospheric Transport (Source Term) ..................................................... 43 3.20 Atmospheric Transport (Source Term) ...................................................................................... 44 3.21 Direct-Contact Condensation .................................................................................................... 45 3.22 Bubble Dynamics in Suppression Pools .................................................................................... 45 3.23 Behaviour of Gas/Liquid Interfaces .......................................................................................... 46 3.24 Special Considerations for Advanced Reactors ......................................................................... 46 3.25 Flow induced vibration of APWR radial reflector .................................................................... 48 3.26 Natural circulation in LMFBRs ................................................................................................. 50 3.27 Natural Circulation in PAHR (Post Accident Heat Removal) ................................................... 51 3.28 Gas Flow in the Containment following a Sodium Leak .......................................................... 52 3.29 AP600, AP1000 and APR1400 ................................................................................................. 53 3.30 SBWR, ESBWR and SWR-1000 .............................................................................................. 54 3.31 High Temperature Gas-Cooled Reactor .................................................................................... 57 3.32 Sump Strainer Clogging ............................................................................................................ 59
4. DESCRIPTION OF EXISTING ASSESSMENT BASES ....................................................................... 61 4.1 Validation Tests Performed by Major CFD Code Vendors ............................................................ 63 4.2 ERCOFTAC .................................................................................................................................... 72 4.3 QNET-CFD Knowledge Base ......................................................................................................... 74 4.4 MARNET ........................................................................................................................................ 75 4.5 FLOWNET...................................................................................................................................... 76

NEA/CSNI/R(2014)12
12
4.6 NPARC Alliance Data Base ........................................................................................................... 76 4.7 AIAA ............................................................................................................................................... 77 4.8 Vattenfall Database ......................................................................................................................... 77 4.9 Existing CFD Databases from NEA/CSNI and Other Sources ....................................................... 78 4.10 Euratom Framework Programmes ............................................................................................. 78
5. ESTABLISHED ASSESSMENT BASES FOR NRS APPLICATIONS ................................................ 87 5.1 Boron Dilution ................................................................................................................................ 87 5.2 Pressurised Thermal Shock ............................................................................................................. 96 5.4 Aerosol Transport in Containments .............................................................................................. 115 5.5 Sump Clogging ............................................................................................................................. 116
6. IDENTIFICATION OF GAPS IN TECHNOLOGY AND ASSESSMENT BASES ............................ 123 6.1 Isolating the CFD Problem ........................................................................................................... 126 6.2 Range of Application of Turbulence Models ................................................................................ 127 6.3 Two-Phase Turbulence Models..................................................................................................... 129 6.4 Two-Phase Closure Laws in 3-D .................................................................................................. 130 6.5 Experimental Database for Two-Phase 3-D Closure Laws ........................................................... 130 6.6 Stratification and Buoyancy Effects .............................................................................................. 130 6.7 Coupling of CFD code with Neutronics Codes ............................................................................. 131 6.8 Coupling of CFD code with Structure Codes ............................................................................... 133 6.9 Coupling CFD with System Codes: Porous Medium Approach ................................................... 135 6.10 Computing Power Limitations ................................................................................................. 139 6.11 Special Considerations for Liquid Metals ............................................................................... 142 6.12 Scaling and Uncertainty........................................................................................................... 143
6.12.1 The scaling issue ................................................................................................................. 143 6.12.2 The scaling methodologies .................................................................................................. 144 6.12.3 System code uncertainty methodologies ............................................................................ 154 6.12.4 Particularities of single-phase CFD applications ................................................................ 155 6.12.5 Existing CFD methods for uncertainty quantification ........................................................ 157 6.12.6 Some recommendations with regard to scaling associated to CFD applications................ 158
7. NEW INITIATIVES: THE CFD4NRS SERIES OF WORKSHOPS, BENCHMARKING ACTIVITIES
AND WEB PORTAL .................................................................................................................................. 163 7.1 The CFD4NRS Series of Workshops ............................................................................................ 163 7.2 Moving the Writing Group Documents to the Web ...................................................................... 164 7.3 CFD Benchmarking Exercises ...................................................................................................... 165 7.3.1 Possible Benchmarks for Primary Circuits .............................................................................. 165
7.3.2 Possible Containment Benchmarks ......................................................................................... 172 7.3.3 Possible Core-Flow Benchmarks ............................................................................................. 180
7.4 OECD/NEA-Sponsored CFD Benchmarking Exercises ............................................................... 183 8. CONCLUSIONS AND RECOMMENDATIONS ................................................................................. 185 APPENDIX 1: OECD-IAEA WORKSHOPS IN THE CFD4NRS SERIES .............................................. 189 APPENDIX 2: GLOSSARY ....................................................................................................................... 221

NEA/CSNI/R(2014)12
13
1. INTRODUCTION/BACKGROUND
Computational methods have supplemented scaled model experiments, and even prototypic tests, in
the safety analysis of reactor systems for more than 35 years. During this time, very reliable system codes,
such as RELAP-5, TRACE, CATHARE and ATHLET, have been formulated for analysis of primary
circuit transients. Similar programs (such as SCDAP, MELCOR, GOTHIC, TONUS, ASTEC, MAAP,
ICARE, COCOSYS/CPA) have also been written for containment and severe accident analyses.
The application of Computational Fluid Dynamics (CFD) methods to problems relating to Nuclear
Reactor Safety (NRS) is less well developed, but is accelerating. The need arises, for example, because
many traditional reactor system and containment codes are modelled as networks of 1-D or 0-D volumes. It
is evident, however, that the flow in components such as the upper and lower plena, downcomer and core
of a reactor vessel is 3-D. Natural circulation, mixing and stratification in containments is also essentially
3-D in nature, and representing such complex flows by pseudo 1-D approximations may not just be
oversimplified, but misleading, producing erroneous conclusions.
One of the reasons why the application of CFD methods in Nuclear Reactor Safety (NRS) has been
slow to establish itself is that transient, two-phase events associated with accident analyses are extremely
complex. Traditional approaches using system codes have been successful because a very large database of
phasic exchange and wall heat transfer correlations has been built into them. The correlations have been
formulated from essentially 1-D special-effects experiments, and their range of validity well scrutinised.
Data on the exchange of mass, momentum and energy between phases for 3-D flows is very sparse in
comparison. Thus, although 1-D formulations may restrict the use of system codes in simulations in which
there is complex geometry, the physical models are well-established and reliable, provided they are used
within their specified ranges of validity. The trend has therefore been to continue with such approaches,
and live within their geometrical limitations.
For containment issues, lumped-parameter codes, such as COCOSYS or TONUS-0D, include models
for system components, such as recombiners, sprays, sumps, etc., which enable realistic simulations of
accident scenarios to be undertaken without excessive computational costs. To take into account such
systems in a multi-dimensional (CFD) simulation remains a challenging task, and attempts to do this have
only recently begun, and these in dedicated ‘CFD-type’ codes such as GOTHIC, GASFLOW or TONUS-
3D rather than with general-purpose CFD software.
The issue of the validity range of CFD codes for NRS applications has also to be addressed, and may
explain why the application of CFD methods is not straightforward. In many cases, even for single-phase
problems, nuclear thermal-hydraulic flows may lie outside the range of standard models and methods,
especially in the case of long, evolving transient flows with strong heat transfer, and feed-back effects on
system behaviour and neutronics.
It appears then that there exists a duality between system codes, with limited geometric capabilities
and non-guaranteed control of numerical errors, but with sophisticated and highly trustworthy physical
models, and which often run in real time for real reactor transients, and CFD, for which geometric
complexity is no real issue, with modern numerical schemes, but for which, at least for two-phase and

NEA/CSNI/R(2014)12
14
containment applications, the physical models require considerable further development, and for which
massive parallel machine architecture is often required for real reactor applications.
The present activity arises from the need to critically assess where CFD methods may be used
effectively in problems relating to Nuclear Reactor Safety (NRS), and to demonstrate that utilisation of
such advanced numerical methods, with large computer overheads, is justified, because the use of simpler
engineering tools or 1-D codes have proven to be limited, or even inadequate.
From a regulatory perspective, a common approach to dealing with practical licensing issues is to use
such simplified modelling, coupled with conservatism to cover the unknown factors. In this way, sufficient
safety margins can be ensured. The advantage of the simplified modelling approach is that a large number
of sensitivity studies can be carried out to determine how plant parameters have to be modified in order for
the predictions to remain conservative. Sophisticated statistical methods, such as Latin Hypercube
Sampling (LHS), have placed this practise on a firm mathematical basis. However, a key issue is then to
determine the degree of conservatism needed to cover the lack of physics embodied in the simplified
models. Information can be obtained from mock-up experiments, but considerable care is necessary in
extrapolating results to full scale. Moreover, the experiments themselves contain simplifications, and
judging the conservatism involved in introducing the simplifications is itself quite difficult. The only way
to ultimately ensure conservatism is to increase the margins, but this often places unwelcome constraints
on plant effectiveness.
The trend is to gradually replace conservatism by a best-estimate methodology, coupled with an
uncertainty evaluation. This process has already taken place in the context of system analysis codes with
the development of second-generation codes in the 1970s based on the two-fluid approach as a means of
replacing the conservatism of simplified two-phase flow models. The use of CFD codes in NRS may be
viewed similarly in regard to the multi-dimensionality of some of the safety analyses which need to be
performed, always with the aim of reducing the conservatism associated with using simplified or
inappropriate analysis tools. To gain acceptance in the licensing world, however, such investigations need
to be underpinned by a comprehensive validation programme to demonstrate the capability of the
technology to produce reliable results. Many examples are given in this document of how such reliability
in the use of CFD can be achieved, where the limitations are, and what needs to be done to improve the
situation. For single-phase applications, CFD is mature enough to complement existing analysis tools
currently employed by regulatory authorities, and has the potential to reduce conservatism without
compromising safety margins. However, one issue that needs to be resolved is that generally the major
commercial CFD vendors do not allow unrestricted access to their source code, a situation which appears
unacceptable from a regulatory standpoint. No doubt, a solution will be found in due course.
The document is organised as follows. The objectives of the activity, which have been updated
slightly from those originally set out in the CAPS (GAMA 2002 7, Revision 0, October 2002), are
summarised in Chapter 2. The main body of the document begins with Chapter 3, which provides a list of
NRS problems for which the need for CFD analysis has been recognised, and in most cases also actively
pursued. A few references to each topic are provided for orientation purposes, but are not intended to be
comprehensive. Two-phase problems requiring CFD are also listed for completeness, but all details are
deferred to the companion WG3 document. Brief summaries of existing assessment databases (both from
the nuclear and non-nuclear areas) are given in Chapter 4, and extended in Chapter 5 to include those
databases centred around specific NRS issues. Here, the reference list is more comprehensive. From this
information, the gaps in the assessment bases, with particular emphasis on NRS applications, are
summarised in Chapter 6.
The word assess, as used here, is a synonym for appraise, evaluate or judge.

NEA/CSNI/R(2014)12
15
A synthesis of the information gained from the papers presented at the series of CFD4NRS
International Workshops is introduced in the first part of Chapter 7, with more complete details of the
background material, scope and objectives, the presentations and poster sessions, and conclusions and
recommendatons given in Annex 1. The Chapter also contains some suggestions for possible future CFD
benchmarks for the primary circuit, core and containment, as compiled for the original release of this
document. However, the subsequent sections of Chapter 7 describe the actual benchmark exercises actually
carried out within the OECD/NEA initiative. Overall conclusions, recommendations and perspectives are
provided in Chapter 8. Finally, Annex 1 gives details of the workshop programmes of the four CFD4NRS
conferences held to date, including the summaries and recommendations made by participants on each
occasion. Annex 2 contains a brief description of the web-based WG2 document, Annex 3 describes the
two blind CFD benchmarks carried out to date, and Annex 4 contains a glossary of the acronyms used in
the document.

NEA/CSNI/R(2014)12
16

NEA/CSNI/R(2014)12
17
2. OBJECTIVES OF THE WORK
The basic objective of the present activity is to provide documented evidence of the need to perform
CFD simulations in NRS (concentrating on single-phase applications), and to assess the competence of the
present generation of CFD codes to perform these simulations reliably. The fulfilling of this objective will
involve multiple tasks, as evidenced by the titles of the succeeding chapters, but, in summary, the
following items list the specifics:
To provide a classification of NRS problems requiring CFD analysis
To identify and catalogue existing CFD assessment bases
To identify shortcomings in CFD approaches
To put into place a means for extending the CFD assessment database, with an emphasis on
NRS applications.

NEA/CSNI/R(2014)12
18

NEA/CSNI/R(2014)12
19
3. NRS PROBLEMS WHERE (SINGLE-PHASE) CFD ANALYSIS
BRINGS REAL BENEFITS
Introduction
The focus here will be on the use of CFD techniques for single-phase problems relating to NRS. This
is the traditional environment for most non-NRS CFD applications, and the one which has a firm basis in
the commercial CFD area. NRS applications involving two-phase phenomena will be listed in this
document for completeness, but full details are reserved for the WG3 document (Extension of CFD Codes
to Two-Phase Flow Nuclear Reactor Safety Problems, NEA/CSNI/R(2007)15, in preparation), which
addresses the extensions necessary for CFD to handle such problems.
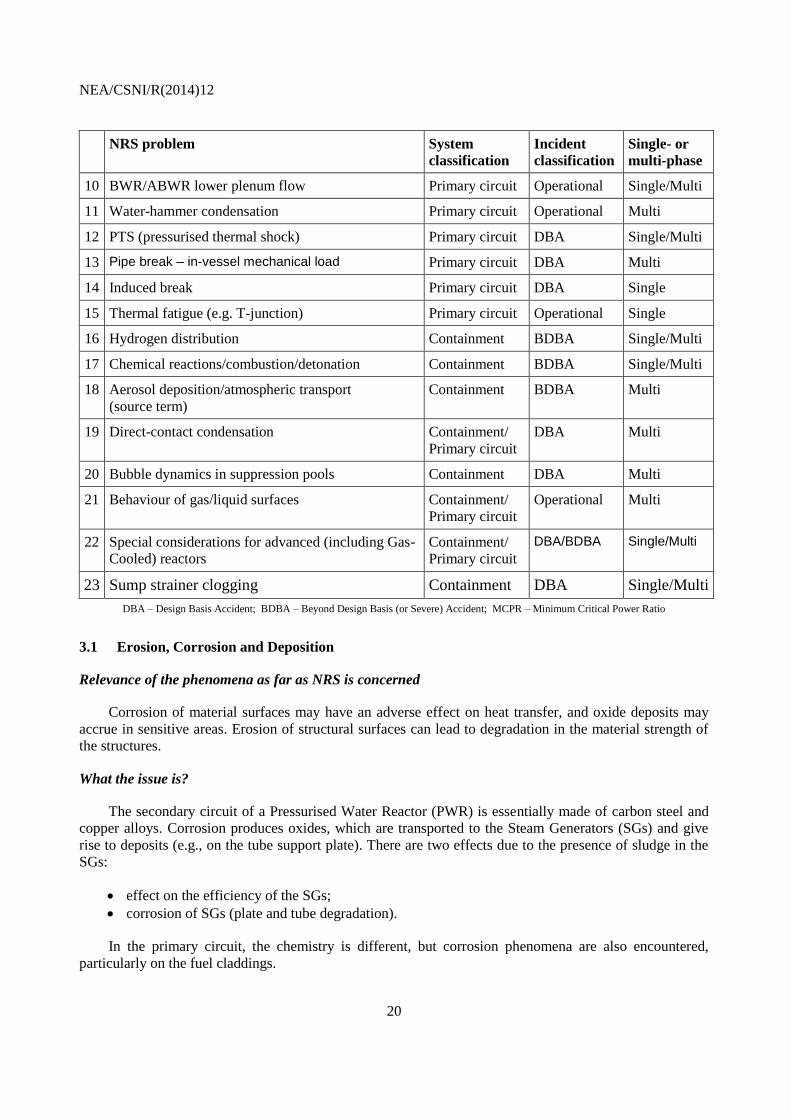
The classification of problems identified by the Group is summarised in Table 1, and then, under
appropriate sub-headings, a short description of each issue is given, why CFD especially is needed to
address it, what has been achieved, and what further progress needs to be made. There are also moves
within the nuclear community to interface CFD codes with traditional system codes. Identification of the
needs of this combined approach is also contained in Table 1, and then addressed more fully in the
subsequent sub-sections.
With some overlaps, the entries are roughly grouped into problems concerning the reactor core,
primary circuit and containment, consecutively.
Table 1: NRS problems requiring CFD with/without coupling to system codes
NRS problem System
classification
Incident
classification
Single- or
multi-phase
1 Erosion, corrosion and deposition Core, primary
and secondary
circuits
Operational Single/Multi
2 Core instability in BWRs Core Operational Multi
3 Transition boiling in BWR/determination of MCPR Core Operational Multi
4 Recriticality in BWRs Core BDBA Multi
5 Reflooding Core DBA Multi
6 Lower plenum debris coolability/melt distribution Core BDBA Multi
7 Boron dilution Primary circuit DBA Single
8 Mixing: stratification/hot-leg heterogeneities Primary circuit Operational Single/Multi
9 Heterogeneous flow distribution (e.g. in SG inlet
plenum causing vibrations, HDR experiments, etc.)
Primary circuit Operational Single
NEA/CSNI/R(2014)12
20
NRS problem System
classification
Incident
classification
Single- or
multi-phase
10 BWR/ABWR lower plenum flow Primary circuit Operational Single/Multi
11 Water-hammer condensation Primary circuit Operational Multi
12 PTS (pressurised thermal shock) Primary circuit DBA Single/Multi
13 Pipe break – in-vessel mechanical load Primary circuit DBA Multi
14 Induced break Primary circuit DBA Single
15 Thermal fatigue (e.g. T-junction) Primary circuit Operational Single
16 Hydrogen distribution Containment BDBA Single/Multi
17 Chemical reactions/combustion/detonation Containment BDBA Single/Multi
18 Aerosol deposition/atmospheric transport
(source term)
Containment BDBA Multi
19 Direct-contact condensation Containment/
Primary circuit
DBA Multi
20 Bubble dynamics in suppression pools Containment DBA Multi
21 Behaviour of gas/liquid surfaces Containment/
Primary circuit
Operational Multi
22 Special considerations for advanced (including Gas-
Cooled) reactors
Containment/
Primary circuit
DBA/BDBA Single/Multi
23 Sump strainer clogging Containment DBA Single/Multi
DBA – Design Basis Accident; BDBA – Beyond Design Basis (or Severe) Accident; MCPR – Minimum Critical Power Ratio
3.1 Erosion, Corrosion and Deposition
Relevance of the phenomena as far as NRS is concerned
Corrosion of material surfaces may have an adverse effect on heat transfer, and oxide deposits may
accrue in sensitive areas. Erosion of structural surfaces can lead to degradation in the material strength of
the structures.
What the issue is?
The secondary circuit of a Pressurised Water Reactor (PWR) is essentially made of carbon steel and
copper alloys. Corrosion produces oxides, which are transported to the Steam Generators (SGs) and give
rise to deposits (e.g., on the tube support plate). There are two effects due to the presence of sludge in the
SGs:
effect on the efficiency of the SGs;
corrosion of SGs (plate and tube degradation).
In the primary circuit, the chemistry is different, but corrosion phenomena are also encountered,
particularly on the fuel claddings.

NEA/CSNI/R(2014)12
21
The oxide layers resulting from corrosion have altered properties compared to the initial construction
material. If the layers are thin enough, the effect on the overall structural integrity is negligible. Such a thin
oxide layer is in fact protecting the structural material from further degradation. However, in certain
circumstances, the oxide layer may be eroded, due to a local increase of wall shear stress. This is typically
occurring at places where there is a sudden change of flow direction, for example at a channel entrance or
sudden area change. In such circumstances, the protective oxide layer may be continuously eroded, leading
to substantial changes in structure integrity.
What the difficulty is and why CFD is needed?
The prediction of the occurrence of such phenomena requires simulation at very small scales. It is
important to understand and predict primary and secondary circuit corrosion occurrence as well as sludge
deposition in order to control and limit their occurrence. System codes and component codes, which use
either homogenisation or sub-channel analysis, cannot predict the highly localised phenomena associated
with corrosion and deposition, and there is a need for a detailed flow field analysis, with focus on the wall
shear stress prediction. (In the case of two-phase flow, it may require CFD extension to properly treat the
two-phase boundary layer.) The rate of the erosion primarily depends on water chemistry (pH level, fluid
oxygen content) and material properties, but it is also influenced by the following fluid-mechanics
parameters:
fluid local velocity;
fluid local temperature;
flow local quality.
These local parameters are geometry-dependent, and can only be predicted with a proper CFD model.
What has been attempted and achieved/what needs to be done (recommendations)?
Some successful applications of CFD in predicting erosion/corrosion already exist; e.g. Ref, 2.
However, more work is needed to resolve near-wall mass and momentum transfer.
Proper modelling of erosion/corrosion requires investigation of both mass transfer and fluid flow in
wall boundary layers. For that purpose, it is necessary to fully resolve the mass transfer boundary layer,
which is typically an order of magnitude smaller than the viscous sub-layer. As a result, extremely fine
grids in near-wall regions are required.
Further development of single-phase CFD models is required in the following areas:
Investigation of the turbulent Schmidt number in near wall regions using: e.g. DNS approach
Development of turbulence models in near wall regions, tailored for mass transfer predictions
Development of erosion models
Modelling of complex 3D geometries.
In Ferng et al. (2006), a methodology is presented to predict the wall thinning locations on the shell
wall of feed water heaters. The commercial CFD code ANSYS-CFX 4.2 with an impingement erosion
model implemented into an Eulerian/Lagrangian model of flow of steam continuum and water droplets
enabled prediction of wear sites on the shell wall. These corresponded well with the measured ones
obtained from a PWR located in the southern region of Taiwan. Droplet kinetic energy was used as an
appropriate indicator of possible locations of severe wall thinning.
NEA/CSNI/R(2014)12
22
Ref. 1: Burstein G.T., Sasaki K., “Effect of impact angle on the erosion-corrosion of 304L stainless
steel,” WEAR, 186-187, 80-94 (1995)
Ref. 2: A. Keaton, S. Nesic, “Prediction of two-phase erosion-corrosion in bends”, 2nd Int. Conf. CFD
in the Minerals and Process Industries, CSIRO, Melbourne, Australia, 6-8 Dec. 1999.
Ref. 3: G. Cragnolino, C. Czaijkowski, W. J. Shack, NUREG/CR-5156, Review of Erosion-Corrosion in
Single-Phase Flows, April 1988.
Ref. 4: McLaury, B.S., Shirazi S.A., Shadley I.R., Rybicki E.F., “Parameters affecting the accelerated
erosion and erosion-corrosion”, Paper 120, CORROSION99, NACE International, Houston, TX
(1999).
Ref. 5: Ferng, Y.M., Hsieh J.H., Horng, C. D. “Computational fluid dynamics predicting the distribution
of thinning locations on the shell wall of feedwater heaters”, Nuclear Technology, 153, 197-207
(2006).
3.2 Core Instability in BWRs
This is a two-phase phenomenon, which is covered fully in the WG3 document.
Orientation
Flow instabilities in BWRs can induce power surges, because of the strong coupling between void
fraction and neutronics. The coupling results in a feedback system that under particular conditions can be
unstable. In these conditions, the core experiences neutron power surges, with a frequency of the order of
0.5 Hz, eventually leading to a reactor scram.
The prediction of local or out-of-phase oscillations requires detailed 3D calculations, both for the
kinetics and thermohydraulic parts. A very detailed representation of the core and of its surroundings is
desirable in order to obtain more reliable predictions. This includes a detailed nodalisation of the lower and
upper plena and recirculation flow path.
Many computer codes have been used to predict stability behaviour in a BWR, but most of the
available codes are based on drift-flux formulations. It is desirable to assess the benefits that could be
achieved using two-fluid models for the prediction of channel stability. Moreover, a greater effort should
be spent on benchmarking available codes against experimental data of real plant behaviour.
Ref. 1: Lahey and Moody, ISBN 0-89448-037-5, “The thermal-hydraulics of a boiling water nuclear
reactor” ch.7.
Ref. 2: F. d’Auria et al., OCDE/GD(97)13, “State of the art report on BWR stability”.
Ref. 3: C.Demazière, I.Pázsit: “On the possibility of the space-dependence of the stability indicator
(decay ratio) of a BWR”, Ann.Nucl. Energy, 32, 1305-1322 (2005).
Ref. 4: J.Karlsson, I.Pászit: “Noise decomposition in Boiling Water Reactors with application to
stability monitoring”, Int J.of Nucl. Sci. and Eng., 128, 225-242 (1998).
Ref. 5: D. Hennig: “A study on boiling water reactor stability behaviour”, Nucl Technology, 126(1), 10-
31 (1999).
Ref. 6: D. Ginestar et al., “Singular system analysis of the LPRM readings of a BWR in an unstable
event”, Int J of Nucl Energy Science and Technology 2(3), 253-265 (2006).
NEA/CSNI/R(2014)12
23
3.3 Transition boiling in BWRs – determination of MCPR
This is a two-phase phenomenon, which is covered fully in the WG3 document.
Orientation
BWRs TechSpec requires that during steady-state operation the MCPR (Minimum Critical Power
Ratio) thermal limit is kept above the licensed safety value. The MCPR tends to be a limiting factor at high
burnup conditions. The current trend to extend plant lifetime and increase the fuel cycle duration requires
improvements to be made in the methods used in the licensing analysis to estimate this limit. The use of
CFD codes could lead to a significant decrease in the present, conservative assumptions employed.
Ref. 1: Lahey and Moody, ISBN 0-89448-037-5, “The thermal-hydraulics of a boiling water nuclear
reactor”, ch. 4.
Ref. 2: General Electric Co., NEDO-10958, “GETAB – General Electric BWR Thermal Analysis
Basis”.
Ref. 3: Y.-Y. Hsu and R. W. Graham, Transport Processes in Boiling and Two-Phase Systems:
Including Near-Critical Fluids, ANS, 1968, ISBN: 0-89448-030-8.
3.4 Recriticality in BWRs
This is a two-phase phenomenon, which is covered fully in the WG3 document.
Orientation
In a BWR severe accident, the first materials to melt are the control rods. This is due to the low
melting temperature for the mixture of boron carbide and stainless steel. The situation can lead to core
recriticality and runaway overheating transients. The resultant molten material accumulates on top of the
lower support plate of the core. Some of it re-solidifies, supporting an accumulating melt pool. The
supporting layer eventually breaks, and melt pours into the lower plenum.
Coolant penetration into the core during reflooding is assumed to occur due to a melt-coolant
interaction in the lower plenum. No integral code is capable of describing all the necessary phenomena.
Ref. 1: NUREG/CR-5653, "Recriticality in a BWR Following a Core Damage Event," U.S. Nuclear
Regulatory Commission, November 1990.
Ref. 2: W. Frid et al. “Severe accident recriticality analyses (SARA)”, Nucl. Engrng. and Design, 209,
97–106 (2001).
3.5 Reflooding
This is a two-phase phenomenon, which is covered fully in the WG3 document.
Orientation
A large-break, loss-of-coolant-accident (LBLOCA) remains the classical design-basis-accident
(DBA), in the sense that the emergency core-cooling (ECC) system has to be designed to be able to reflood
the core and prevent overheating of the fuel cladding. During reflooding, multi-dimensional flow patterns
occur. Though the physical phenomena are complex, CFD has the potential of following the details of the
flow, with the aim of reducing uncertainties in current predictions made on the basis of 1-D system codes
and 0-D lumped-parameter codes.

NEA/CSNI/R(2014)12
24
Ref. 1: R.T. Lahey, Jr. & F.J. Moody The Thermal-Hydraulics of a Boiling Water Nuclear Reactor,
Second Edition, American Nuclear Society, La Grange Park, Il, 1993, ISBN 0-89448-037-5.
Ref. 2: F. D’Auria, F. De Pasquale, J. C. Micaelli, Advancement in the study of reflood phenomenology
in typical situations of PWR plants, Proceedings of UIT (Unione Italiana di
Termofuidodinamica) VII National Conference on Heat Transfer, 15-17 June 1989.
Ref. 3: A. Yamanouchi, Effect of core spray cooling in transient state after loss of coolant accident,
Journal of Nuclear Science and Technology, 5,547–558 (1968).
Ref. 4: G. Yadigaroglu, R. Greif, K.P. Yu and L. Arrieta, Heat Transfer During the Reflooding Phase of
the LOCA-State of the Art, EPRI 248-1, (1975).
3.6 Lower Plenum Debris Coolability and Melt Distribution
Relevance of the phenomenon as far as NRS is concerned
During a severe accident in a nuclear power plant, the integrity of the nuclear reactor core is lost, and
it can relocate to the lower plenum and form a debris bed. If cooling of the debris bed is not sufficient to
remove the generated decay heat, a melt-through of the reactor pressure vessel will occur.
What the issue is?
Estimates of debris coolability and melt relocation are highly empirical, and dependant on the
particular design solutions used in the nuclear power plants. However, what is common to all the scenarios
is the necessity to halt accident progression, remove the decay heat from the debris bed, and prevent melt-
through of the vessel.
What the difficulty is and why CFD is needed?
The following key parameters have to be taken into account in proper modelling of cooling of a debris
bed:
flow driving force (gravitation, capillary forces);
flow resistance for both laminar flow (small particle areas) and turbulent flow (large particle areas);
dryout criteria;
counter-current flow limitation (CCFL);
multi-dimensional effects;
transient behaviour.
What has been attempted and achieved/what needs to be done (recommendations)?
Current approaches remain empirical, and correlations are used to predict the heat transfer rate
between particles and the cooling water. The water penetration through the bed is highly dependent on the
bed structure (non-uniform particle distributions) and simplified approaches can be applied. CFD can be
used to improve the accuracy of predictions in non-uniform beds. In particular, three-dimensional models
of flow in a porous material will give better estimates of the water penetration rates, and relaminarisation
due to different grain sizes.

NEA/CSNI/R(2014)12
25
Ref. 1: T.N. Dinh, V.A. Bui, R.R. Nourgaliev, J.A. Green, B.R. Sehgal, “Experimental and Analytical
Study of Molten Jet Coolant Interactions: The Synthesis”, Int. J. Nuclear Engineering and
Design, 189, 299-327 (1999).
Ref. 2: T. G. Theofanous et al. “In-vessel coolability and retention of a core melt”, Nucl. Eng. Des., 169,
1-48 (1997).
Ref. 3: Y. Maruyama, et al. “Experimental study on in-vessel debris coolability in ALPHA program”,
Nucl. Eng. Des., 187, 241-254 (1999).
Ref. 4: D. L. Knudson et al. “Late-phase melt conditions affecting the potential for in-vessel retention in
high power reactors”, Nucl. Eng. Des., 230, 133-150 (2004).
3.7 Boron Dilution
Relevance of the phenomenon as far as NRS is concerned
Boron concentration aims at controlling the power and subcriticality for shutdown conditions.
Mechanisms C:\Program Files\Real\RealPlayer\DataCache\Login\index.html supposed to lead to boron
diluted water are known (consequence of small break, SG leakage etc. (ee Ref. 1 for a review).
What the issue is?
The safety problem concerns the possible transport to the core of a diluted slug of water, and the
related power excursion.
What the difficulty is and why CFD is needed?
The whole phenomenon modelling requires two steps: (i) knowledge of the concentration of boron at
the core entrance, and (ii) thermal-hydraulics/neutronics calculations for the core region. The first step
(covered by CFD) thus provides the initial and boundary conditions for the second. Main CFD inputs to
this problem concern the description of the transportation mechanisms to the core: (i) pump start-up, or (ii)
natural circulation after water inventory restoration. Relevant part of the reactor for flow modelling
concern at least the downcomer, the lower plenum, and possibly the pipework related to the transportation
of the slug. CFD features of the simulation are the transient behaviour of the flow, the geometrical
complexity of the computational domain, and the requirement of the precise mixing properties of the flow.
What has been attempted and achieved/what needs to be done (recommendations)?
Boron dilution has been considered within an International Standard Problem (ISP-43, based on a
University of Maryland Thermalhydraulic Facility allowing the mixing of flows of different temperature
within a reduced scale vessel model, see Ref. 2).
Another scaled (1/5th) model (ROCOM, Forschungszentrum Rossendorf) of the German PWR
KONVOI has been considered for several test scenarios related to boron dilution transients (steady state,
transient and cavity-driven flows may be considered). Some related results have been published (Ref. 1).
A third test facility is the Vattenfall model, built at Vattenfall Utveckling, Älvkarleby in 1992. It is a
1:5 scale model of the 3-loop Westinghouse PWR at Ringhals. The model has been used for several
studies, including CFD simulations. International cooperation has been within the EUBORA project, and
now the on-going FLOWMIX-R project, both of them EU 5th Framework programmes.
For these databases, successful CFD results have been claimed, and applications to existing reactors
have also been reported.
NEA/CSNI/R(2014)12
26
A concerted action on Boron Dilution Experiments (EUBORA, 1998, 4th EC program) gathered
several European countries involved in CFD applications for such problems. Many facilities provided
relevant data: the EDF Bora Bora facility; the Rosendorf ROCOM facility; the UPTF facility; and the PSI
Panda facility (see Ref. 5). The conclusion from the EUBORA project was that 3-D CFD does provide an
effective tool for mixing calculations, though the code calculations, and the applied turbulent mixing
models, have to be validated by experiments. The current status on assessment is deemed not to be
complete, it was concluded. A large-scale test (scale 1:2 tentatively) was also suggested to provide
confirmation data.
The ongoing EU-project FLOWMIX-R aims at describing relevant mixing phenomena in the PWR
primary circuit. It includes a well-defined set of mixing experiments in several scaled facilities
(Rossendorf, Vattenfall, Gidropress and Fortum) to provide data for CFD code validation. Calculations are
performed for selected experiments using two commercial CFD codes (ANSYS-CFX, FLUENT). The
applicability of various turbulence modelling techniques is being studied for both transient and steady-state
flows. Best Practise Guidelines (BPGs) are being applied in these computations. Homepage for
FLOWMIX-R is www.fz-rossendorf.de/FWS/FLOMIX.
Also, an OECD action has recently started concerning a coolant transient for the VVER-1000 (Ref.
3).
Questions regarding the relevance of a test facility, when compared to reactor functioning conditions,
may concern: (i) Re numbers (lower for the test facility, see discussion in Ref. 4), and (ii) complexity of
the lower plenum, which may be different and lead to different mixing properties. The first point is
considered as non-crucial, the second one may depend on the reactor considered.
Ref. 1: T. Hoehne, H.-M. Prasser, U. Rohde, “Numerical coolant mixing in comparison with
experiments at the ROCOM test facility”, in proceedings of the ANS Conference, USA, 2001.
Ref. 2: T. Hoehne, “Numerical simulation of ISP-43 test using CFX-4”, in proceedings of the ANS-
ASME conference, Penn State University, 2002.
Ref. 3: NEA/NSC/DOC(2003) document on OECD/DOE/CEA VVER-1000 Coolant Transient
Benchmark – 1st Workshop.
Ref. 4: T. Hoehne, “Coolant mixing in pressurized Power Reactor”, 1999, in Proceedings of ICONE 7.
Ref. 5: H. Tuomisto, et al., “EUBORA - Concerted Action on Boron Dilution Experiments”, FISA-99
Symposium on EU Research on Severe Accidents, Luxembourg, 29 November - 1 December,
1999.
Ref. 6: ISP-43: Rapid Boron Dilution Transient Experiment, Comparison Report,
NEA/CSNI/R(2000)22.
Ref. 7: B. Hemström, R. Karlsson, M. Henriksson. “Experiments and Numerical Modelling of Rapid
Boron Dilution Transients in a Westinghouse PWR”. Annual Meeting on Nuclear Technology,
Berlin, May 2003.
Ref. 8: T.S. Kwon, C.R. Choi, C.H. Song and W.P. Baek, “A three-dimensional CFD calculation for
boron mixing behaviors at the core inlet”, Proc. NURETH-10, Seoul (2003)
Ref. 9: C.R. Choi, T.S. Kwon and C.H. Song, “Numerical analysis and visulaization experimenet on
behavior of borated water during MSLB aith RCP running mode in an advanced reactor”,
Nuclear engineering and design, (2007)
Ref. 10: H. Tinoco et al., “Physical modelling of a rapid boron dilution transient”, Vattenfall Utveckling
AB, Report VU-S93:B21, 1993.

NEA/CSNI/R(2014)12
27
3.8 Mixing, Stratification, Hot-Leg Heterogeneities
In-vessel mixing phenomena
Relevance of the phenomenon as far as NRS is concerned
PWRs have two to four coolant loops, depending on the design. It is important for reactor control that
cold water fed from these loops is thoroughly mixed before entering the core otherwise the safe operation
of the reactor could be compromised.
What the issue is?
The issue is the study of the mixing phenomena occurring in the downcomer and lower plenum of the
reactor in the case of an accidental transient leading to asymmetric loop-flow conditions in terms of
temperature or boron concentration. Transients such as Main Steam Line Break, accidental or inherent
dilution transients are relevant to this issue. In these scenarios, flow in one or more of the hot legs is colder
or non-borated with respect to the other loops. In the case of poor mixing, cold or low borated water can be
injected into the core leading to recriticality returns, with a risk of cladding failure and fuel dispersion.
In general, the simulation of these transients requires the coupling of systems codes, to represent the
whole primary circuit, and a part of the secondary circuit except the core. Core inlet conditions (flow rates,
temperature or enthalpy) are deduced from vessel inlet conditions by the application of a mixing matrix.
Up to now, the coupling is weak and mainly external (close-ups, boundary conditions, etc.), but attempts
are being made to have a stronger coupling (see, for example, the OCDE/CSNI PWR Main Steam Line
Break Benchmark).
Description of the difficulties and why CFD is needed to solve it
Mixing in the downcomer and lower plenum, up to now, as far as we know, have been modelled using
mixing matrices obtained by extrapolation of steady-state test results, and not always with the actual lower
plenum geometry (i.e. including downcomer and lower plenum internal structures), and not always under
real operating conditions (in general, a constant mixing matrix is used). These matrices are then
introduced as input to system codes, or used as an interface between a system code and a 3D core thermal-
hydraulic code.
The use of CFD codes for the real reactor case, validated against data from the tests which have been
used in defining the validation matrix, would represent a big step forward, since CFD offers the possibility
to deal with the detailed geometry of the reactor and, in the “near” future, with transient flow conditions.
In the short term, CFD calculations would help identify the mixing laws used in the actual schemes
(systems codes, coupled system, 3D core thermal-hydraulic and neutronics codes) in use, and in the
medium term, one could imagine integration of a CFD code into the coupled chain: i.e. system, CFD, core
3D thermal-hydraulic and neutronics codes operating together. Finally, in the long term, if the capability of
CFD codes is assessed for core thermal-hydraulic simulation, one could imagine the use of CFD for lower
plenum and the core, coupled to 3D neutronics codes.
State of the art - recommendations
In a first step, one could focus on the application of CFD independent of any coupling with other
types of codes. Up to now, CFD has been applied with some encouraging results for steady-state
calculations of mixing phenomena in plena with internal structures (see, e.g., Hot Leg Heterogeneities,
Section 3.8).
NEA/CSNI/R(2014)12
28
The mixing process of feedwater and reactor water in the downcomer of an internal-pump BWR
(Forsmark 1 & 2) has been numerically modelled using the CFD code FLUENT/UNS. Earlier studies, with
a very coarse model had shown that a new sparger design is necessary to achieve an effective HWC
through improved mixing in the downcomer. This requires detailed and accurate modelling of the flow, not
only for determining the mixing quality, but also for avoiding undesirable effects, such as increased
thermal loading of internal parts.
A 90-degree sector model, as well as smaller sector models, was used. The 90-degree model covered
one (of four) spargers, two main coolant pumps (of eight), and flow from the steam separators. Some
results are presented in Ref. 2 below. No verification tests have so far been performed, but hydraulic model
tests of 1:5 scale or larger have been suggested.
The main difficulty in the application of CFD codes to such problems are due to:
the complexity and expanse of the geometry to be modelled: at least the four hot legs and junctions
with the core vessel, the downcomer and the lower plenum, together with all their internal
structures, resulting in a large number of meshes;
the difficulty in building the mesh due to the quite different scales in the domain (from a few cms
to several metres);
the need to perform transient calculations, with or without coupling to system codes and 3D core
physics codes.
Consequently, application of CFD codes in such a field requires, mainly:
validated models, especially models of turbulence, to estimate the mixing in the lower plenum,
good capacity to treat complex geometries of very different sized scales.
A second step will be to treat all the difficulties related to the coupling of CFD codes with system
codes, other 3D component codes, and with 3D neutronics (see Section 5.2).
Ref. 1: OCDE/NEA – US/NRC PWR Main Steam-Line Break Benchmark,
http://www.nea.fr/html/science/egrsltb/pwrmslbb/index.html
Ref. 2: Tinoco, H. and Einarsson, T., “Numerical Analysis of the Mixing and Recombination in the
Downcomer of an Internal Pump BWR”, Modelling and Design in Fluid-Flow Machinery, 1997.
3.9 Hot Leg Heterogeneities
Relevance of the phenomenon as far as NRS is concerned
For the safe running and control of a PWR, it is essential to have, as precisely as possible, knowledge
of the real primary flow rates, to ensure that they do not exceed the limiting design basis values.
Description of the issue
The issue refers to the estimation of the flow-rates in a PWR plant. Indeed, for safe running, the real
primary flow rates in the loops and the core have to be checked to ensure they do not exceed the limiting
design-basis values. The upper value is deduced from mechanical considerations regarding the assembly
NEA/CSNI/R(2014)12
29
holding forces, and on the control rod falling time, the lower value is associated to the DNB risk protection
signal.
The real primary flow rates are deduced from on-site periodic measurements.
For each loop, the flow-rate is determined from the following formula:
CLHL
RCPSGloop
HH
WWQ
CL
106.36
/1/
with:
WSG : thermal power extracted from the SG, deduced from a heat balance on the SG secondary
side,
WRCP : thermal power given by the Reactor Coolant Pump, obtained via the RCP power
measurement,
ρCL : water density, given by the water property determination,
HHL : Hot Leg enthalpy,
HCL : Cold Leg enthalpy.
These two enthalpies are deduced from temperature measurements of the Hot and Cold legs of the
loop under consideration.
In order to check if the estimated value does not exceed the criterion, the uncertainty on the final
value has to be estimated. This uncertainty is a combination of all the basic uncertainties resulting from the
measurement devices, and to the methodology used to determine the different elements in Equation /1/.
By far the main source of uncertainty (about 10 times greater than the other sources) is related to the
estimation of the hot-leg temperature. Two kinds of uncertainties are involved in this estimation:
the first (easy to estimate) is generated by the measurement-chain precision;
the second is due to a lack of representation of the three temperature measurement locations used to
estimate the average temperature in regard to the real average temperature.
Concerning the second uncertainty, despite the mixing processes in the upper plenum, important
temperature and flow heterogeneities are still present at the hot-leg instrumentation location, leading to
uncertainties in the estimation of the real average temperature. Consequently, in order to quantify this
error, the real average temperature of the hot-leg has to be estimated from specific experimental tests, from
specific plant tests, and finally by calculation.
Description of the difficulties and why CFD is needed to solve them
Direct extrapolation of experimental results to the real plant is very difficult, and often leads to an
overestimation of the uncertainty. The use of this overestimated value in the case of plant modifications
(e.g., core loading, etc.) can give results which do not satisfy the safety criteria. Advanced methodologies
based on CFD calculations are then required in order to reduce this overestimation.

NEA/CSNI/R(2014)12
30
State of the art - recommendations
The situation at present is that CFD calculations have shown encouraging results. They are able to
reproduce qualitatively all the phenomena observed during the experiments: the upper-plenum flow, the
temperature contours from the core to the hot legs, and the flow pattern in the hot legs, composed of two
rotating counter-current vortices. Nevertheless, some discrepancies remain, such as the location of the
centre of these vortices along the hot-leg pipe.
The main difficulties in the application of CFD codes for such a physical issue are listed below.
The complexity and the expanse of the geometry to be modelled the upper part of the core, the
upper plenum and the dome, with all their internal structures, and the hot leg and the very different
scales (from 1 cm to a metre) of all the structures, lead to very difficult meshing problems, and to very
expensive computations (involving several millions of computational cells).
There are complexities involved in specifying the boundary conditions (core outlets, inner flow-rates
in the lead tubes,…), and difficulties in initialising the turbulence levels.
Very fine representation of the turbulent phenomena is required to localise the vortices in the hot leg.
Consequently, application of CFD codes in such a field requires validated models, especially models
of turbulence, to estimate mixing in the upper plenum and vortex development in the hot leg.
A good capacity to treat complex geometries, of very different scales, is also required.
Ref. 1: Rohde, U.; Höhne, T.; Kliem, S.; Hemström, B.; Scheuerer, M.; Toppila, T.; Aszodi, A.; Boros, I.;
Farkas, I.; Muehlbauer, P.; Vyskocil, V.; Klepac, J.; Remis, J.; Dury, T., Fluid mixing and flow
distribution in the reactor circuit – Part 2: Computational fluid dynamics code validation, Nuclear
Engineering and Design (2007)
Ref. 2: Kliem, S.; Kozmenkov, Y.; Höhne, T.; Rohde, U., Analyses of the V1000CT-1 benchmark with
the DYN3D/ATHLET and DYN3D/RELAP coupled code systems including a coolant mixing
model validated against CFD calculations, Progress in Nuclear Energy 48(2006), 830-848
Ref. 3: Höhne, T.; Kliem, S.; Bieder, U., Modeling of a buoyancy-driven flow experiment at the ROCOM
test facility using the CFD-codes CFX-5 and TRIO_U, Nuclear Engineering and Design Volume
236(2006)Issue 12, 1309-1325
3.10 Heterogeneous Flow Distributions
Steam generator tube vibration (fluid/structure interaction)
Relevance of the phenomenon as far as NRS is concerned
Vibrations of the steam generator tubes are due to hydraulic forces arising from the flow around the
tube bends; this is a fluid/structure interaction problem. The vibrations mainly concern the part of the
generator where either cross-flows develop (as, for example, for the single-phase flow at the generator
inlet) or two-phase flows take place (in the evaporation region). Excessive vibrations of the tubes can lead
to tube rupture. If this occurs, there will be mixing of primary and secondary circuits, and a (nominal at
least) breach of the primary containment barrier. Improved understanding of the phenomena can lead to
improvements in geometry, and better inspection procedures.

NEA/CSNI/R(2014)12
31
What the issue is?
Flow-induced vibration is significant at the U-bend section of the tubes, and anti-vibration bars are
installed in some designs to restrict the amplitude of the vibration. A global understanding of the vibration
excitation mechanism is proposed in Ref. 1, as well as a collection of reference data. Actual vibration
modelling relies on estimation of excitation sources, hydrodynamic mass, damping phenomena, mean
velocity, void fraction, etc., without the support of CFD. However, a better (assessed) prediction of such
quantities may come from a finer flow description, and knowledge of local, small-scale quantities.
What the difficulty is and why CFD is needed to solve it?
System codes, such as RELAP5, cannot model the flow-induced vibration, or the mechanical
interaction between the fluid and the structure. The coupling of the fluid and structure calculations is
generally difficult, since (at least for Lagrangian modelling approaches) the mesh structure for the fluid
calculation may change due to the motion of the structure. The relevant description should provide realistic
mean values for future vibration models, and local values for coupled fluid/structure modelling in regions
of complex flow. Both single-phase and two-phase flows are involved. For the first, existing models may
provide some details, even if suitable assessment is required. Two-phase flow solvers may not yet be
considered mature enough to provide relevant information for such phenomena.
What has been attempted and achieved / What needs to be done (recommendations)?
Some new experiments are proposed in Ref. 1, to complement those being conducted by CEA: for
example, the Panachet experiment, which considers single-phase cross-flow over a matrix of tube bundles.
Also noteworthy are the first attempts at simulation using a CFD tool. Fluid-structure interaction is not
taken into account in many commercial CFD codes, though developments are now underway (see Section
6.9). Coupling of a reliable two-phase CFD code, if one exists, and a computational structural dynamics
code is necessary to calculate the U-tube vibration, since the structural motion has a feed-back on the flow
dynamics.
Ref. 1: “Flow induced vibration: recent findings and open questions”, Pettigrew, Taylor, Fisher, Yetisir,
Smith, Nuclear Engineering and Design, 185, 249-276 (1998).
Ref. 2: I-C. Chu and H.J. Chung, “Fluid-Elastic Instability of Straight Tube Bundles in Air-Water Two-
Phase Cross-Flow,” Proceedings of ICAPP `05, Paper 5668, Seoul, Korea, May 15-19, 2005.
Ref. 3: H.J. Chung and I.-C. Chu, “Fluid-Elastic Instability of Rotated Square Tube Array in Air-Water
Two-Phase Cross-Flow,” Nuclear Engineering and Technology, Vol. 38, pp. 69-80, 2006.
Ref. 4: I.-C. Chu, H.J. Chung, C.H. Lee, H.H. Byun, and M.Y. Kim, “Flow-Induced Vibration Responses
of U-Tube Bundle in Air-Water Flow,” Proceedings of PVP2007, PVP2007-26777, July 22-26,
2007, San Antonio, Texas, USA.
Ref. 5: K. W. Ryu, B. H. CHo, C. Y. Park, S. K. Park, “Analysis of fluid-elastic instability for KSNP
steam generator tube and its plugging effect at central region”, Proceedings of PVP2003, July 20-
24, 2003, Cleveland, Ohio, USA.
3.11 BWR/ABWR Lower Plenum Flow
Relevance of the phenomenon as far as NRS is concerned
There are many pipes in the lower plenum of a BWR or ABWR reactor. Two phenomena are relevant
to NRS. One is the stress induced by flow vibration, which may cause these pipes to break, and the other is

NEA/CSNI/R(2014)12
32
a lack of uniformity of flow between the pipes, which may lead to a non-uniform temperature distribution
in the reactor core.
What the issue is?
In an ABWR, the reactor internal pumps are newly installed at the side, near the base of the reactor
pressure vessel. (Fig. 1, Section 3.22) The following two problems are to be solved.
(1) Many internal structures, such as guidance pipes of control rods and instrumentation pipes for
neutron flux detection, are situated close together in the lower plenum. It is necessary to check the
integrity of these structures against flow induced-vibration stresses (Fig.2, Section 3.22).
(2) In an ABWR, partial operation of the reactor internal pumps is accepted. However, it is necessary to
check that the coolant is uniformly distributed to the reactor core during such operation.
What the difficulty is and why CFD is needed to solve it?
Many internal structures are located close together in the lower plenum. At a time of partial pump
operation, inverse flow can occur in the leg attached to the pump which has stopped. CFD codes are
effective in evaluating the flow field in such complicated situations.
What has been attempted/achieved so far and what needs to be done?
The three-dimensional flow field in the reactor vessel has been evaluated successfully using the CFD
code STAR-CD, with the standard k-epsilon turbulent model.
Ref. 1: S. Takahashi, et al., "Evaluation of Flow Characteristics in the Lower Plenum of the ABWR by
using CFD Analysis", ICONE-11, Tokyo, JAPAN, April 20-23, 2003.
Ref. 2: J.H. Jeong, B.S. Han, “A CFD analysis of coolant flow in a PWR lower plenum without
geometrical simplification”, ICONE-13, Beijing, China, 2005.
Ref. 3: J.H. Jeong, J.P. Park, and B.S. Han, "Head Loss Coefficient Evaluation Based on CFD Analysis
for PWR Downcomer and Lower Plenum", NTHAS5, Jeju, Korea, November 26- 29, 2006
3.12 Water-Hammer Condensation
Relevance of the phenomenon as far as NRS is concerned
Fast closing (or even opening) of valves induces strong pressure waves, which propagate through the
circuit, both in the primary and secondary loops. The dynamic effects on the pipework could induce
damage, and are therefore a safety concern.
What the issues are?
Water-hammer is most often investigated with respect to the mechanical loads applied to the pipe
structure, resulting from pressure waves. This is connected to the study of ageing phenomena of nuclear
pressure vessel materials.

NEA/CSNI/R(2014)12
33
What the difficulty is and why CFD is needed?
The main issue concerns the loads applied to the structure. This implies knowledge of additional
quantities, such as condensation speed, velocity and pressure distributions, from which depends the
mechanical loading to the pipes. All these phenomena are characterised by very fast transients. The
simulation typically requires very small time steps, and may be conducted using a one-dimensional code.
Three-dimensional codes are required when volume effects are involved, for example in the hot leg.
The water-hammer phenomenon can develop along with stratification (thermal or phase induced), and
this also has three-dimensional features: occurrence of radial pressure distributions [1] and three-
dimensional turbulence effects. Code assessment needs to take care of the different possible geometries:
straight pipes, elbows, change of pipe diameter, etc. The accurate evaluation of these quantities may
require CFD.
What has been attempted and achieved/What needs to be done (recommendations)
Basic considerations for code assessment may be required for waves developing in liquids and gases:
examples are air and water [2], and subcooled water and steam for vertical and/or horizontal pipes [3].
Available measurements would concern pressure at different positions in the pipes, and, in particular, in
sensitive areas, such as the measurement of the condensed phase at the end of the pipe.
Results of the WAHALoads (Two-Phase Flow Water Hammer Transients and Loads Induced on
Materials and Structures of Nuclear Power Plants) EC programme may be of interest in the near future.
The WAHALoads group may select and open for public use a set of relevant experiments undertaken
during the program. This should be done in the spirit of a benchmarking activity and related code
assessment.
Ref. 1: Gaddis and Harling, “Estimation of peak pressure-rise in a piping system due to the condensation
induced waterhammer phenomenon”, Proceedings of ASME/JSME Fluid Engineering Division
Summer Meeting, 1999.
Ref. 2: K. W. Brinckman, M. A. Chaiko, “Assessment of TRAC-BF1 for waterhammer calculations with
entrapped air”, J. of Nuclear Technology, 133(1), 133-139 (2001).
Ref. 3: Giot, M., Prasser, H.M., Dudlik, A., Ezsol, G., Habip, M., Lemonnier, H., Tisej, I., Castrillo, F.,
Van Hove, W., Perezagua, R. & Potapov, S., “Twophase flow water hammer transients and
induced loads on materials and structures of nuclear power plants (WAHALoads)” FISA-2001 EU
Research in Reactor Safety, Luxembourg 12-15 November 2001, EUR 20281, 176-187, G. Van
Goethem, A. Zurita, J. Martin Bermejo, P. Manolatos and H. Bischoff, Eds., EURATOM, 752p.,
2002.
Ref. 4: Prasser, H.-M., Böttger, A., Zschau, J., Baranyai, G., and Ezsöl, Gy., "Thermal Effects During
Condensation Induced Water Hammer Behind Fast Acting Valves In Pipelines", International
Conference On Nuclear Engineering ICONE-11, 20-23 April, 2003, Shinjuku, Tokyo, Japan,
Paper no. ICONE11-36310.
Ref. 5: Bogoi, A., Seynhaeve, J.M., Giot, M., “A two-component two-phase bubbly flow model -
Simulations of choked flows and water hammer” 41th European Two-Phase Flow Group Meeting
in Norway and 2nd European Multiphase Systems Institute Meeting, May 2003.
Ref. 6: Altstadt, E., Carl, H., Weiss, R., “Fluid-Structure Interaction Experiments at the Cold Water
Hammer Test Facility (CWHTF) of Forschungszentrum Rossendorf”, Annual Meeting on Nuclear
Technology, 2002, 14–16 May, 2002, Stuttgart, Germany.

NEA/CSNI/R(2014)12
34
3.13 Pressurised Thermal Shock (PTS)
Relevance of the phenomenon as far as NRS is concerned
PTS is related to the ageing of the vessel (because the mechanical resistance of the structure decreases
with age). The events of concern are cold-water injections which would, for example, accompanying a
Loss of Coolant Accident followed by Emergency Core Cooling System (ECCS) injection; a Main Steam
Line Break; a steam generator tube rupture; a small break loss of coolant; etc. (see Refs. 1 and 2) that
may lead to a thermal shock. Both single-phase and two-phase flow situations may occur.
What the issue is?
The issue is to predict the temperature (and the related thermal stresses) for the part of the vessel
subjected to thermal shock, in order to investigate thermal fatigue, and the mechanical stresses to the
vessel. Limited to the CFD concerns, the temperature of the vessel is determined through the temperature
of the water in contact with the walls, and is influenced by turbulence, stratification (for both single- and
two-phase situations), and, in the case of two-phase flows, by the condensation rate (the issue is connected
with the direct-contact-condensation issue). The CFD issues are to take into account these features for the
whole transient (which may last for several hundreds of seconds), for complex geometries (downcomer,
upper plenum, and connected pipes), and for complex flow patterns (stratified flows, jets, plume
development in the downcomer, etc.).
What the difficulty is and why CFD is needed?
The temperature of the vessel is determined through the temperature of the fluid in contact with it, and
is influenced by turbulence (which enhances mixing), stratification (for both single- and two-phase
situations), and by the condensation rate (for two-phase flow).
The whole phenomenon is unsteady, 3-D, and the precise determination of all the parameters is
complex. The existing reported simulations concern single-phase flow, whereas simulations of two-phase
flows in such situations are just beginning. Concerning single-phase flows, however, the precise
description of the problem is reported to require turbulence models where both low Reynolds effects,
laminar to turbulence transition and buoyancy effects need to be taken into account (Ref. 3).
What has been attempted and achieved/what needs to be done (recommendations)?
No systematic assessment has yet been reported, and only the system codes may be considered as
validated against this problem. Although the single-phase CFD applications seem mature enough to be
used, reported attempts were not all successful (see Ref. 3), and the further use of relevant experimental
data and turbulence modelling improvement has been suggested (see Ref. 5).
For CFD, two assessment methods may be considered. Firstly, an assessment has to be made of the
ability of a method to reproduce a particular phenomenon within the whole transient: one may consider the
capability of the method to solve unsteady, coupled problems between the structure and the flow (thermal
fatigue issue), the ability to describe stratification, to estimate condensation for different flow patterns
(reported uncertainties concern for example the Heat Transfer Coefficient (HTC) inside the plumes).
Secondly, the assessment should take into account an entire thermal shock sequence with the complete
geometry. Reported relevant experiments are:
COSI: the COSI experiment is scaled 1/100 for volume and power from a 900 MW PWR and allows
various flow configurations. Simulations representing small break LOCA thermal-hydraulic conditions,

NEA/CSNI/R(2014)12
35
and including temperature profiles at various axial positions in the pipe and condensation rates, are
reported in Ref. 1, and validation of models on Separate-Effect tests are reported in Ref 7.
An international study concerning PTS (International Case RPV PTS ICAS) has been completed, and
proposed comparative assessment studies for which CFD codes could be used (Ref. 4). Reported data used
for thermal-hydraulic tests concern the Upper Plenum Test Facility (UPTF) in Manheim. Particular
attention was paid to thermal-hydraulic mixing. A first description of UPTF facility is available at the
following web-site: http://asa2.jrc.it/stresa_framatome_anp/specific/uptf/uptffac.htm, or at
http://www.nea.fr/abs/html/csni1004.html.
For both single- and two-phase flows, model improvement seems to be required. (See also the
requirements for two-phase flows models in the work of the writing group on two-phase flow CFD.)
Ref. 1: P. Coste, “An approach of multidimensional condensation modelling for ECC injection”, in the
Proceedings of the European Two Phase Flow Group Meeting, 2003.
Ref. 2: H.K. Joum, T.E. Jin, “Plant specific pressurized thermal shock evaluation for reactor pressure
vessel of a Korean nuclear power plant”, in the Proceedings of the International Conference on
Nuclear Energy in Central Europe, 2000.
Ref. 3: J. Sievers, HG Sonnenburg, “Modelling of Thermal Hydraulic Loads and Mechanical Stresses on
Reactor Pressure Vessel”, presented at Eurosafe 1999.
Ref. 4: “Comparison report of RPV pressurized thermal shock international comparative assessment
study (PTS ICAS)”, 1999, NEA/CSNI/R(99)3 report.
Ref. 5: “Advanced Thermohydraulic and neutronics codes: current and future applications”, 2001,
NEA/CSNI/R(2001)1/VOL1 report.
Ref. 6: D. Lucas et al., “On the simulation of two-phase flow Pressurized Thermal Shock”, Proc. 12th Int.
Topical Meeting on Nuclear Reactor Thermal Hydraulics (NURETH-12) Pittsburgh,
Pennsylvania, U.S.A., September 30-October 4, 2007.
Ref. 7: W. Yao, P. Coste, D. Bestion, M. Boucker, “Two-phase pressurized thermal shock investing-
ations using a 3D two-fluid modelling of stratified flow with condensation”, Proceedings of the
NURETH-10, Seoul, Korea, 2003.
3.14 Pipe Break
Relevance of the phenomenon as far as NRS is concerned
Transient pressure forces occur on the structures following a large pipe break, and are of importance
for various reactors. Inside the reactor vessel, the decompression waves will produce dynamic loadings on
the surfaces of the vessel internals, such as the core shroud and core grids of a BWR.
What the issue is?
This issue is an important example of the need to predict accurately three-dimensional, transient
pressure fields, in order to estimate dynamic loadings on the internals. Structural analysis nowadays has to
include dynamic loads, even for loss-of-coolant accidents.
What the difficulty is and why CFD is needed?
The decompression process is a highly three-dimensional and transient phenomenon, so it is well
suited for a 3D CFD simulation. During the first phase, before flashing of the reactor water begins, a

NEA/CSNI/R(2014)12
36
single-phase CFD model could be used. After flashing has started, a two-phase model is necessary to
describe the decompression process, since then two-phase effects are dominant.
What has been attempted and achieved/what needs to be done (recommendations)?
CFD analysis of a steam line break in a BWR plant was part of a qualifying programme before the
replacement of core grids at Units 1 and 2 at Forsmark NPP, Sweden, [Ref. 1]. The study was based on the
assumption that the time scale of the transient analysis is smaller than the relaxation time of the water-
steam system.
The results displayed a rather complex behaviour of the decompression, and the instantaneous forces
computed were approximately twice those estimated in the past using simpler methods. It was pointed out
that, at longer times, a two-phase model is necessary to describe the decompression. The results have not
been validated against experiments, however.
During the last few years, several other simulations of rapid pipe breaks have been performed for
Swedish reactors, also with no possibilities to compare with experimental results. Validation against HDR
Experiments was therefore foreseen. In the early 1980s, the HDR (Heissdampfreaktor) blow-down
experiments had been performed in Karlsruhe, Germany [Refs. 2 and 3]. The HDR rig consists of a blow-
down nozzle, and a large pressure vessel, including internals (core barrel). The blow-down experiment
V31.1 has been used for validation of numerical simulations, first using system codes, such as RELAP
[e.g. Ref. 4], and later also with CFD (or CFD-like) codes. Lars Andersson et al. [Ref. 5] has presented
simulation results using Adina-FSI (a coupling between the codes Adina-F (CFD) and the Adina structure
solver) at the ASME PVP 2002 conference. The conclusions were that the results based on a single-phase
fluid model, with no possibility of phase change, and with fluid-structure-interaction (FSI), compare well
with experimental data for the first 100 ms after the break. Without FSI, the simulations show a factor 2
higher frequency for the pressure oscillations, and the amplitudes were generally higher. The conclusion
was that the effects of FSI have to be included to obtain reliable results.
Ref. 1: Tinoco, H., “Three-Dimensional Modelling of a Steam-Line Break in a Boiling Water Reactor”,
Nuclear and Engineering, 140, 152-164 (2002).
Ref. 2: Wolf, L., “Experimental results of coupled fluid-structure interaction during blow down of the
HDR-vessel and comparison with pre- and post-test prediction”, Nuclear Engineering and Design,
70, pp. 269-308 (1982).
Ref. 3: HDR Sicherheitsprogramm. Auswertung von Dehnungsmessungen am HDR-Kernmantel und
vergleich mit Spannungsberechnungen bei Bruch einer Reaktorkühlmittelleitung. Auswertebericht
Versuchsgruppe RDB-E II. Versuche: V31.2, V32, V33, V34.
Ref. 4: Müller, F. Romas, A., “Validation of RELAP-5 against HDR-experiments”, DNV-Kärnteknik,
2002.
Ref. 5: Andersson, L., Andersson, P., Lundwall, J., Sundqvist, J., Veber, P., “Numerical Simulation of the
HDR Blowdown Experiment V31.1 at Karlsruhe”, PVP-Vol. 435, Thermal-Hydraulic Problems,
Sloshing Phenomena and Extreme Loads on Structures, ASME 2002.
3.15 Induced Break
Relevance of the phenomenon as far as NRS is concerned
This scenario is of direct safety relevance because it involves the potential for a steam generator tube
rupture during a severe accident scenario, which could lead to the release of fission products bypassing the
containment.

NEA/CSNI/R(2014)12
37
Description of the issue
This subject is devoted to PWR induced break during a high pressure severe accident (e.g., due to
total station blackout with a loss of secondary feed water). In this kind of scenario, the core is uncovered,
heat is carried away from the fuel by steam in a process of natural circulation to structures in the reactor
coolant system, including the upper vessel, hot leg, and steam generator tubes. The loop seals remain filled
with water, and full primary loop circulation is blocked. A counter-current, natural circulation pattern in
the hot leg and steam generator (with direct and reverse circulation in different SG tubes) ensues, as
has been experimentally observed.
The temperatures during the severe accident ultimately lead to a thermally induced failure in the
primary coolant loop. The flow field and heat transfer details determine whether the failure occurs within
the vessel, in the reactor coolant piping system, or in the steam generator tubes, this providing a leak path
that bypasses the containment. Details of the three-dimensional flow fields and heat transfer mechanisms
are needed in order to predict the likely failure location.
The key parameters addressed in these evaluations are the magnitude of the natural circulation flows
in the reactor coolant system piping and steam generator tube bundle, as well as the mixing and
entrainment that occurs within the hot leg and steam generator inlet plenum.
Description of the difficulties and why CFD is needed to resolve them?
The thermal-hydraulic and core-degradation modelling of this severe accident scenario is
generally performed using lumped- parameter codes such as SCDAP/RELAP5, CATHARE/ICARE,
etc. The efficiency of the lumped-parameter approach makes it feasible to predict the transient behaviour
of the entire reactor coolant system over extended periods of time. These codes, however, do not
implicitly model the three-dimensional mixing and entrainment behaviour important for determining the
magnitude of the natural circulation flows in the system. The system codes must rely on pre-determined
flow paths and mixing ratios that are used to adjust the system code predictions to ensure consistency
with experimental observations, or predictions from multi-dimensional tools such as CFD. CFD
predictions have been used to extend the limited small-scale experimental database to a variety of full-scale
conditions. Some of the key issues that have been studied using CFD predictions include the following:
hot leg flow rate;
steam generator tube bundle flow rate;
tube bundle flow and temperature distributions;
mixing and entrainment in the hot leg and steam generator inlet plenum;

NEA/CSNI/R(2014)12
38
impact of the pressurizer surge line;
impact of steam generator tube leakage on the natural circulation flows;
impact of inlet plenum and loop geometry variations.
State of the art - recommendations
To date, CFD has been applied with some encouraging results for steady-state calculations of the
reactor case [1-4], and for one experimental validation case [5]. The main difficulties in the
application of CFD codes to such accident scenarios are listed here.
The complexity and expanse of the geometry to be modelled: at least one hot leg with the
pressuriser surge line, the primary side of the steam generator, including both plena (inlet and
outlet), the SG tubes, and possibly the vessel upper plenum.
The extent of this domain, especially the large number of steam generator tubes, presents a challenge
to the CFD modeller. In addition to the large domain, the modeller is faced with complex,
buoyancy-driven turbulent flows of steam and hydrogen, and the potential for radiative heat
exchange between the structure and the optically-thick, high-pressure steam mixture.
Consequently, application of CFD codes in such a field requires:
validated models, especially models of turbulence, to estimate mixing and stratification;
a validated model of radiative heat exchange (with steam and hydrogen at high temperatures);
simplified, but accurate, nodalisation of the tube bundle – the solutions one can imagine are to
couple 1D and 3D models, or to define some equivalent (Ref. 4) to reduce the size of the mesh;
validated models of the depressurisation induced by the opening of the safety valves (i.e.
compressible or quasi-compressible model).
Ref. 1: H. Mutelle, U. Bieder “Study with the CFD Code TRIO_U of Natural Gas Convection for PWR
Severe Accidents”, NEA and IAEA Workshop: Use of computational fluid dynamics (CFD) codes for
safety analysis of reactor systems including containment - PISA ,Italy, November 11-15, 2002.
Ref. 2: U. Bieder, C. Calvi, H. Mutelle “Detailed thermal hydraulic analysis of induced break severe
accidents using the massively parallel CFD code TRIO_U/PRICELES”, SNA 2003 International
conference on super computing in nuclear applications, Paris, France, 22-24 Sept. 2003.
Ref. 3: C.F. Boyd, D.M. Helton, K. Hardesty, “CFD Analysis of Full-Scale Steam Generator Inlet
Plenum Mixing During a PWR Severe Accident”, NUREG-1788, May 2004.
Ref. 4: C.F. Boyd, K . W . A r m s t r o n g “Computational Fluid Dynamics Analysis of Natural
Circulation Flows in a Pressurized-Water Reactor under Severe Accident Conditions,” NUREG-1922,
March 2010.
Ref. 5: C.F. Boyd, K. Hardesty “CFD Analysis of 1/7th Scale Steam Generator Inlet Plenum Mixing
during a PWR Severe Accident”, NUREG-1781, September 2003.
NEA/CSNI/R(2014)12
39
3.16 Thermal Fatigue in Stratified Flows
Relevance of the phenomenon as far as NRS is concerned
Thermal stratification, cycling and striping phenomena may occur in different piping systems of
nuclear plants. They can occur in safety-related lines such as the pressuriser surge line, the emergency core
cooling injection lines, and other lines where hot and cold fluids come into contact and mix together.
What the issue is?
Often the phenomena are caused by defective valves through which hot (or cold) coolant leaks into
cold (or hot) coolant. Damage due to thermal loadings has been reported in mixing tees of both the primary
and secondary loops, for both sodium-cooled and water-cooled reactors. Static mixers have sometimes
been inserted once first inspections have indicated cracks. Thus, in general, the more common thermal
fatigue issues are understood, and can be controlled. However, some incidents indicate that certain
information on the loading in the mixing zone, and its impact on the structure, is still missing.
In accident conditions, plume and stripe cooling in the downcomers of LWRs may occur. Different
flow patterns are present, depending on the flow rates in the ECC injection nozzles, and the downcomer
water levels. Two-phase flow may occur when cold water is heated through an isolation device by hot
water, causing the cold water on the other side to rise above the saturation temperature. One may encounter
stratified flows, low velocities, and sometimes the presence of air due to degassing. There might also be
low-frequency flow fluctuations associated with temperature fluctuations, which may lead to thermal
fatigue.
What the difficulty is and why CFD is needed to solve it?
CFD is able to predict the thermal loadings on the metallic structures. Single-phase CFD may need to
include LES (Large Eddy Simulation) turbulence modelling to be able to predict the frequency and
amplitude of the large-scale fluctuations, both of which are important parameters for the associated
structural and failure analyses.
What has been attempted and achieved/what needs to be done (recommendations)?
Current studies are focussed on single-phase situations. Development of a two-phase CFD code able
to handle stratified flows with temperature and density stratification, and with turbulent mixing effects, and
possibly using LES for the liquid, flow would be useful for some two-phase situations.
Ref. 1: T. Muramatsu, “Numerical analysis of non-stationary thermal response characteristics for a fluid-
structure interaction system”, Journal of Pressure Vessel Technology, 121, 276, 1999.
Ref. 2: K.-J. Metzner, U. Wilke, “European THERFAT project thermal fatigue evaluation of piping
system Tee-connections”, Nucl. Engng. Des., 235, 473-484 (2004).
Ref. 3: J. Westin et al., “Experiments and Unsteady CFD Calculations of Thermal Mixing in a T-
Junction”, Proc. Int. Workshop on Benchmarking of CFD Codes for Application to Nuclear
Reactor Safety (CFD4NRS), Garching, Munich, Germany, 5-7 September 2006 (CD-ROM).
Ref. 4: K.C. Kim, M.H. Park, H.K. Youm, J.H. Kim, “Thermal Stratification Phenomeon in a Branch
Pipping with In-Leakage”, Proceedings of Nureth-10, 2003 (CD-ROM).
Ref. 5: K.C. Kim, M.H. Park, H.K. Youm, S.K. Lee, T.R. Kim and J.K. Yoon, “An Unsteady Analysis on
Thermal Stratification in the SCS Piping Branched Off the RCS Piping”, Proceedings of ASME
PVP, 2003.

NEA/CSNI/R(2014)12
40
Ref. 6: H.K. Youm, K.C. Kim, M.H. Park, T.E. Jin, S.K. Lee, T.R. Kim and J.H. Kim, “Fatigue Effect of
RCS Branch Line by Thermal Stratification”, Proceedings of ASME PVP, 2003.
Ref. 7: Jo, J.C., Choi, Y.H. and Choi, S. K., November 2003, "Numerical Analysis of Unsteady
Conjugate Heat Transfer and Thermal Stress for a PWR Pressurizer Surge Line Pipe Subjected to
Thermal Stratification,"ASME Transaction J. of Pressure Vessel Technology. Vol. 125, pp. 467-
474.
Ref. 8: O. Gélineau, M. Spérandio, J.-P. Simoneau, J.-M. Hamy, P. Roubin, 2002, “Validation of fast
reactor thermomechanical and thermohydraulic codes : thermomechanical and thermal hydraulic
analyses of a tee junction using experimental data”, Final report of a co-ordinated research project,
International Atomic Energy Agency, AIEA TECDOC-1318, Nov. 2002.
Ref. 9: O. Gélineau, C. Escaravage, J.-P. Simoneau, C. Faidy “High Cycle Thermal Fatigue: Experience
and State of the Art in French LMFR, Proc. SMIRT16, 2001.
Ref. 10: J.-P. Simoneau H. Noé, B. Menant, “Large eddy simulation of sodium flow in a tee junction,
comparison of temperature fluctuations with experiments”, Proc. 8th Topical Mtg. Nuclear Reactor
Thermal Hydraulics (NURETH-8), Kyoto, Japan, 1997.
3.17 Hydrogen Distribution
Relevance of the phenomenon as far as NRS is concerned
During the course of a severe accident in a water-cooled reactor, large quantities of hydrogen could
accumulate in the containment.
What the issue is?
Detailed knowledge of containment thermal hydraulics is necessary to ensure the effectiveness of
hydrogen mitigation methods. Condensation and evaporation on walls, pool surfaces and condensers needs
to be adequately modelled, because the related mass and heat transfer strongly influence the pressure and
mixture composition in the containment. For the Siemens containment design, the transient pressure rise
causes certain explosion hatches to open (which defines the scenario). In addition, there is pressure loading
to the structures. The mixture composition is very important, because it strongly determines the burning
mode of hydrogen and the operation of the PARs (Passive Autocatalytic Recombiners).
What the difficulty is and why CFD is needed?
Containments have very large volumes and multi-compartments. The situation occurring in the
context of a severe accident is also physically complex. A too coarse nodalisation will not only lose
resolution, but will smear the temperature and velocity gradients through numerical diffusion. Temporal
discretisation is also an important issue, as accident transients must be simulated over several hours, or
even days, of physical time. From a physical point of view, the flow model must also take into account
condensation (in the bulk or at the wall), together with heat transfer to the structures. Condensation models
are not standard in CFD codes.
An additional, and significant, difficulty in the application of CFD to hydrogen distribution problems
relates to the way in which reactor systems, such as recombiners, spray systems, sumps, etc., are taken into
account. CFD simulations without such system/component models will not be representative of realistic
accident scenarios in nuclear reactor containments.
NEA/CSNI/R(2014)12
41
What has been attempted and achieved/what needs to be done (recommendations)?
A State-of-the-Art report on this issue was proposed to the CSNI in 1995, and a group of experts
convened to produce the document, which appeared finally in 1999. The twin objectives of the SOAR were
to assess current capabilities to predict hydrogen distributions in containments under severe accident
conditions, and to draw conclusions on the relative merits of the various predictive methods (lumped-
parameter approaches, field codes, CFD). The report concentrates on the traditional containment codes
(e.g. CONTAIN and GOTHIC), but acknowledges the future role of CFD-type approaches (e.g.
GASFLOW, TONUS and ANSYS-CFX) to reduce numerical diffusion.
It was concluded that current lumped-parameter models are able to make relevant predictions of the
pressure history of the containment and its average steam content, and that predictions of hydrogen
distributions are adequate provided safety margins are kept high enough to preclude significant
accumulations of sensitive mixtures, but that gas distribution predictions needed to serve as a basis for
combustion analyses required higher resolution. The limits of the lumped-parameter approach have been
demonstrated in a number of ISP exercises (notably ISP-23, ISP-29, ISP-35, and ISP-37). CFD-type
approaches may be the better option for the future, but considerable validation and accumulation of
experience were considered necessary before such tools could be reliably used for plant analyses. An on-
going benchmark exercise, ISP-47, aims precisely at validating CFD codes for containment thermal-
hydraulics, including hydrogen risk.
Hydrogen distribution occurring during a hypothetical station blackout (SBO) accident in the Korean
next generation reactor APR1400 containment has been analysed using the 3-D CFD code GASFLOW
(Ref. 6). Because the hydrogen was released into the in-containment refuelling water storage tank
(IRWST) of the containment during the accident, the main concern was the hydrogen concentration and the
possibility flame acceleration in the IRWST. In this study, design modifications were proposed and
evaluated with GASFLOW in view of the hydrogen mitigation strategy.
Ref. 1: SOAR on Containment Thermalhydraulics and Hydrogen Distribution, NEA/CSNI/R(1999)16.
Ref. 2: A. Beccantini et al., “H2 release and combustion in large-scale geometries: models and methods”,
Proc. Supercomputing for Nuclear Applications, SNA 2003, Paris, France, 22-24 September 2003.
Ref. 3: L. Blumenfeld et al., “CFD simulation of mixed convection and condensation in a reactor
containment: the MICOCO benchmark”, Proc. 10th Int. Topical Meeting on Nuclear Thermal-
Hydraulics, NURETH-10, Seoul, Korea, 5-9 October 2003.
Ref. 4: N.B. Siccama, M. Houkema, E.M.J. Komen “CFD analyses of steam and hydrogen distribution in
a nuclear power plant”, IAEA-TECDOC-1379, 2003.
Ref. 5: International Standard Problem ISP-47 on Containment Thermal Hydraulics, Final Report,
NEA/CSNI/R(2007)10.
Ref. 6: Jongtae Kim, Seong-Wan Hong, Sang-Baik Kim, Hee-Dong Kim, “Hydrogen Mitigation Strategy
of the APR1400 NPP for a Hypothetical Station Blackout Accident”, Nuclear Technology, 150,
263-282 (2005).
Ref. 7: Jongtae Kim, Unjang, Lee, Seong-Wan Hong, Sang-Baik Kim, Hee-Dong Kim, “Spray effect on
the behavior of hydrogen during severe accidents by a loss-of-coolant in the APR1400
containment”, International Communications in Heat and Mass Transfer, 33, 1207–1216 (2006).
NEA/CSNI/R(2014)12
42
3.18 Chemical Reactions/Combustion/Detonation
Relevance of the phenomenon as far as NRS is concerned
Detonation and combustion in containments may lead to pressure rises which exceed the design
specifications. There is also risk of localised overheating of structures in the case of standing flames.
What the issue is?
Although BWR containments are normally nitrogen inerted, which prevents hydrogen combustion
and detonation, special attention has been addressed in recent years to possible leakage of hydrogen from
the small overpressurised BWR containment to the reactor building, resulting in possible combustion and
detonation, and providing a challenge for the containment integrity from outside.
For PWR containments that are not inerted, but which have some mitigation systems (recombiners,
for example), local hydrogen concentrations can exceed the flammability limits, at least during some stages
of the accident scenarios. Deflagrations, accelerated flames or even detonations are to be envisaged for
some accident scenarios.
What the difficulty is and why CFD is needed to solve it?
Deflagrations are very complex phenomena, involving chemistry and turbulence. No adequate models
exist to accurately describe deflagrations at large-scale and in complex geometries – but still, CFD
combined with flame-speed-based deflagration models can provide significant insight into the dynamic
loadings on the structures.
Detonation processes are relatively simple to model, because the very fast front propagation means
there is little feed-back from other, slower processes, such as chemistry, fluid flow and structural
deformation. The interaction with the flow is limited to shock wave propagation – no turbulence models
are necessary; in fact, it is generally sufficient to use the inviscid Euler equations. However, a fully
compressible method must be used, typically a Riemann-type solver. Shock-wave simulations should
account also for multiple reflections and superposition of the shock waves.
What has been attempted/achieved so far and what needs to be done?
A project has been carried out under NKS/SOS-2.3 for the calculation of containment loads (BWR) in
the above postulated scenario. The CFD code FLUENT was used to calculate hydrogen distribution in the
reactor building, DET3D (Karlsruhe) for the 3D detonation simulation, and ABAQUS for the structural
analysis and evaluation of the loads. The conclusion of this study was that a more detailed analysis would
be required to take into account the pressure decrease after the detonation.
There have been many applications of compressible CFD solvers to model detonations in large-scale
geometries (e.g. the RUT experiments from the Kurchatov Institute), and also some calculations of fast
deflagrations in a simplified reactor containment (EPR) were performed in the framework of the 5th FP
Project HYCOM. H2 deflagration models and CFD codes were also evaluated in the 4th FP project HDC
(Hydrogen Distribution and Combustion).
Ref. 1: NKS-61 Advances in Operational Safety and Severe Accident Research, VTT Automation,
Finland, 2002.
Ref. 2: A. Beccantini, H. Paillère, “Modeling of hydrogen detonation for application to reactor safety”,
Proc. ICONE-6, San Diego, USA, 1998.

NEA/CSNI/R(2014)12
43
Ref. 3: U. Bielert et al., “Multi-dimensional simulation of hydrogen distribution and turbulent combustion
in severe accidents”, Nuclear Engineering and Design, 209, 165-172 (2001).
Ref. 4: W. Scholtyssek et al., “Integral Large Scale Experiments on Hydrogen Combustion for Severe
Accident Code Validation”, Final Report of HYCOM Project, Project FIKS-CT-1999-00004, to
appear 2004.
Ref. 5: P. Pailhories, A. Beccantini, “Use of a Finite Volume scheme for the simulation of hydrogen
explosions”, Technical meeting on use of CFD for safety analysis of reactor systems, including
containment, Pisa, Italy, November 11-15, 2002.
3.19 Aerosol Deposition/Atmospheric Transport (Source Term)
Aerosol Deposition
Relevance of the phenomenon as far as NRS is concerned
Following a severe reactor accident, fission products would be released into the containment in the
form of aerosols. If there were a subsequent leak in the containment barrier, aerosols would be released
into the environment and pose a health hazard.
What the issue is?
The most conservative assumption is that all the fission-product aerosols eventually reach the
environment. A more realistic assessment can be made by studying the detailed processes which govern
the initial core degradation, fission product release, aerosol-borne transport and retention in the coolant
circuitry, and the aerosol dynamics and chemical behaviour in the containment.
What the difficulty is and why CFD is needed?
The global thermal-hydraulic response is primarily determined by the balance of flow of steam from
the circuit and condensation. The overall behaviour is therefore governed by the thermodynamic state, and
is well reproduced using simple lumped-parameter models with coarse nodalisation (one or two volumes),
provided the boundary conditions are correctly imposed. Nonetheless, it should be realised that the
adequacy of simple representations perhaps depends on simple geometry and well-defined conditions. Care
should be taken when extrapolating such conclusions to the much more complex situations encountered in
a real plant.
Consequently, the controlling phenomena for aerosol removal need to be assessed using a more
rigorous treatment of the forces acting on the particles. To simulate particle motion, it is necessary to know
the 3-D velocity field, and CFD is needed for this purpose. The goal is to determine the accuracy with
which CFD tools are able to predict the lifetimes of aerosols circulating in a large volume, such as a real
reactor containment. By tracking a number of such particles, statistical information on the actual deposition
can be obtained, and from that a realistic estimate of release in the event of a containment breach.
What has been attempted and achieved/what needs to be done (recommendations)?
The PHEBEN-2 EU 5th Framework Programme aimed at improving the current analytical capability
of realistically estimating power plant safety in the event of a hypothetical accident, based on the
experimental information coming from PHEBUS-FP project. The PHEBUS-FP facility is operated at CEA
Cadarache, and aims to investigate the key phenomena occurring in an LWR severe accident. The facility
provides prototypic reactor conditions from which integral data on core degradation, fission product
release, aerosol-borne transport and retention in the coolant circuit, and the aerosol dynamics and chemical

NEA/CSNI/R(2014)12
44
behaviour in the containment may be obtained. A series of five experiments was carried out during the
period 1993-2004, which simulated release and fission product behaviour for various plant states and
accident situations. The definitive final document is currently in review, and expected to be released in
2008.
The experimental measurements from the PHEBUS tests, which must be remembered are of integral
form, confirm the appropriateness of lumped-parameter, coarse-node models for calculating the global
response of the containment, at least for the simple geometry and conditions considered in the tests. There
is no indication that detailed models or CFD methods are needed to calculate the global behaviour, though
such methods are being applied to scope the potential. In any event, such approaches would be necessary to
calculate the hydrogen distribution, and may be needed for aerosol deposition in more realistic geometries.
There is a definite lack of useful validation data of the type needed to validate the CFD models in open
geometries.
Ref. 1: P. von der Hardt, A.V. Jones, C. Lecomte, A. Tattegrain, “The PHEBUS FP Severe Accident
Experimental Programme”, Nuclear Safety, 35(2), 187-205 (1994).
Ref. 2: A. V. Jones et al., “Validation of severe accident codes against PHEBUS-FP for plant applications
(PHEBEN-2)”. FISA-2001 EU Research in Reactor Safety, Luxembourg, 12-14 November 2001.
Ref. 3: A. Dehbi, “Tracking of aerosol particles in large volumes with the help of CFD”, Proceedings of
12th International Conference on Nuclear Engineering (ICONE 12), Paper ICONE12-49552,
Arlington, VA, April 25-29, 2004.
Ref. 4: “State of the Art Report on Nuclear Aerosols”, NEA/CSNI/R(2009)5.
3.20 Atmospheric Transport (Source Term)
Relevance of the phenomenon as far as NRS is concerned
During a severe reactor accident, radioactive release to the atmosphere could occur, which may
represent a health hazard for the installation workers and the surrounding population.
What the issue is?
Atmospheric release of nuclear materials (aerosols and gases) implies air contamination: on-site at
first, and off-site with time. The atmospheric dispersion of such material in complex situations, such as the
case of buildings in close proximity, is a difficult problem, but important for the safety of the people living
and working in such areas. Dispersion models need meteorological fields as input; typical examples of
such fields are velocity fields and characterisation of atmospheric thermal stability.
What the difficulty is and why CFD is needed to solve it?
CFD provides a method to build and run models that can simulate atmospheric dispersion in
geometrically complex situations; however, the accuracy of the results needs to be assessed. Emergency
situations, which lead to atmospheric release generally, involve two basic scales: on-site scale, where the
influence of nearby buildings and source modelling are important phenomenon, and off-site scale (from a
few kilometres to tens of kilometres), where specific atmospheric motions are predominant.
On-site atmospheric flows and dispersion are highly 3D, turbulent and unsteady, and CFD is a
traditional approach to investigate such situations. Numerical modelling of building effects on the wind
and dispersion pose several challenges. Firstly, computation of the flows around buildings requires
knowledge of the characteristics of atmospheric boundary layers. In addition, knowledge of the mean wind
speed and degree of atmospheric turbulence are also needed to accurately represent atmospheric winds, and

NEA/CSNI/R(2014)12
45
the effects of the site, on dispersion. Secondly, topography of the configuration to be modelled is usually
complex, especially in a Nuclear Power Plant, where closely spaced groups of buildings are commonplace,
with different individual topologies, heights and orientations. Consequently, great challenges are
encountered when discretising the computational domain. Thirdly, the flows are highly complex, having all
the elements that modern fluid mechanics has not yet successfully resolved. The major challenge lies in
turbulence modelling. The difficulty is associated with the fact that the flows are highly three-dimensional,
being accompanied, almost without exception, by strong streamline curvature, separation, and vortices of
various origin and unsteadiness.
What has been attempted/achieved so far and what needs to be done?
While most of the CFD applications to date have been focussed on the generation of wind fields, as
input to dispersion models for the purposes of assessment or emergency preparedness, the utilisation of
prognostic models in weather-related emergencies is beginning to be explored. Prognostic model
forecasting on regional scales will play an important role in advising local agencies regarding emergency
planning in cases of severe accidents. In addition, model output information, such as precipitation,
moisture and temperature, are often necessary for predicting the movement of pollutants under complex
meteorological conditions. For example, wet scavenging during precipitation is an important sink of
airborne pollutants leading to the deposition of contaminants.
Workstation-based meso-scale models have recently been used to provide real-time forecasts at
regional scales, for emergency response to locally-induced severe accidents. In regional response
forecasting, meteorological forecasts of 3-48h are generated continuously, with nested grid resolutions of
1-20 km, centred at the specific site of interest. These locally-generated forecasts are available for
dispersion calculations.
Ref. 1: Fast J.D., O’Steen B.L., Addis R.P. “Advanced atmospheric modelling for emergency response”,
J. Applied Meteor., 94, 626-649 (1995).
Ref. 2: Byrne C.E.I., Holdo A.E. “Effects of increased geometric complexity on the comparison between
computational and experimental simulations”, J. of Wind Eng. and Indus. Aerodyn., 73, 159-179
(1997).
Ref. 3: Ding F., Arya S.P., Lin Y.L. “Large eddy simulations of the atmospheric boundary layer using a
new subgrid-scale model”, Environmental Fluid Mechanics, 1, 29-47 (2001).
3.21 Direct-Contact Condensation
This is a two-phase phenomenon, which is covered fully in the WG3 document.
Orientation
Some reactor designs feature steam discharge to cold-water pools. It is important to avoid steam by-
pass in which vented steam may enter the vapour space above the pool and over-pressurise the
confinement. The efficiency of the condensation process, and thermal mixing in the pool, may require
detailed 3-D modelling using CFD.
3.22 Bubble Dynamics in Suppression Pools
This is a two-phase phenomenon, which is covered fully in the WG3 document.

NEA/CSNI/R(2014)12
46
Orientation
Again, and related to direct contact condensation, it is important to avoid steam by-pass into the
vapour space to avoid over-pressurisation. For some advanced passive cooling system designs,
containment gases are vented to suppression pools. Even with complete steam condensation, bubbles
containing non-condensable gases remain, and to assess their ability to mix the water in the pool, and avoid
stratification, requires detailed CFD modelling.
3.23 Behaviour of Gas/Liquid Interfaces
This is a two-phase phenomenon, which is covered fully in the WG3 document.
Orientation
In the two-fluid approach to two-phase flow modelling, as commonly employed in 1-D system codes
and 3-D CFD codes, the two phases are treated as interpenetrating media. There are many instances of
relevance to NRS in which the phases are physically separated and the phase boundary between them
requires detailed resolution. Some examples are pressurised thermal shock (leading to thermal striping and
cyclic-fatigue in structures), level detection in pressurisers, accumulators and the cores of BWRs (used for
triggering ECC devices), and level swell in suppression pools. Given the 3-D nature of the flow regime,
CFD methods, with direct interface-tracking capability, may be needed to accurately describe events. Some
references regarding modelling approaches are given here.
Ref. 1: C. W. Hirt, B. D. Nichols, “Volume of Fluid method (VOF) for the dynamics of free boundaries”,
J. Comput. Phys., 39, 201-225 (1981).
Ref. 2: M. Meier, G. Yadigaroglu, B. L. Smith, “A novel technique for including surface tension in PLIC-
VOF methods, Eur. J. Mech. B/Fluids, 21, 61-73 (2002).
Ref. 3: S. Osher, J. A. Sethian, “Fronts propagating with curvature-dependent speed: algorithms based on
Hamilton-Jacobi formulations”, J. Comput. Phys., 79, 12 (1988).
Ref. 4: J. A. Sethian, Level Set Methods, Cambridge University Press, Cambridge, UK, 1998.
3.24 Special Considerations for Advanced Reactors
Coolability of radial reflector of APWR
Relevance of the phenomenon as far as NRS is concerned
Insufficient cooling of the radial reflector causes thermal deformation of the reflector blocks, which
results in formation of a gap between blocks. A leak flow through the gap decreases the core flow rate, and
may raise the temperature of the reactor core.
What the issue is?
The radial reflector consists of a stack of eight SUS304 blocks, in which many holes are installed to
cool the reflector blocks, which become hot due to the heat generation of gamma rays. A large amount of
the coolant which enters in the reactor vessel from the inlet nozzles flows up into the core region, and a
small part of that flows into the radial reflector (Figs. 1,2) If the coolant flow rate into the radial reflector
falls short, or becomes uneven circumferentially, the temperature of the coolant rises and the coolant may
possibly boil (Fig.3).

NEA/CSNI/R(2014)12
47
Since the reflector block is not symmetrical and the heat generation of gamma rays is not spatially
uniform, the temperature distribution of the reflector block becomes uneven, and a deformation of the
block due to the differences of the thermal expansion, produces a gap between the adjacent blocks.
Consequently, the gaps cause bypass flow from the reactor core side into the neutron reflector.
What the difficulty is and why CFD is needed to solve it?
Evaluation of the temperature distribution in the reflector blocks with sufficient accuracy needs a
detailed description of the coolant flow rate into the reflector. The details of this flow depend on the
coolant flow field in the reactor vessel, and the flow field in lower plenum is complicated because of the
asymmetrical arrangement of the structures. CFD is therefore the only effective tool for evaluating the
coolant flow field in the reactor vessel.
What has been attempted/achieved so far and what needs to be done?
The three-dimensional flow field in the reactor vessel, and the distribution of the coolant flow rate
into the radial reflector, have been evaluated using the CFD code uFLOW/INS with the standard k-epsilon
turbulent model. The uFLOW/INS code has been validated against experimental data from a 1/5-scale
APWR experiment. Evaluation of the coolability of the radial reflector needs the correct calculation of the
flow rates through the very small cooling holes installed in the reflector blocks. A technique is required for
modelling these small holes without substantially increasing the total number of grid points used for the
calculational domain.
Ref. 1: T. Morii “Hydraulic flow tests of APWR reactor internals for safety analysis”, Benchmarking of
CFD Codes for Application to Nuclear Reactor Safety, Garching, Munich, Germany 5-7
September 2006.
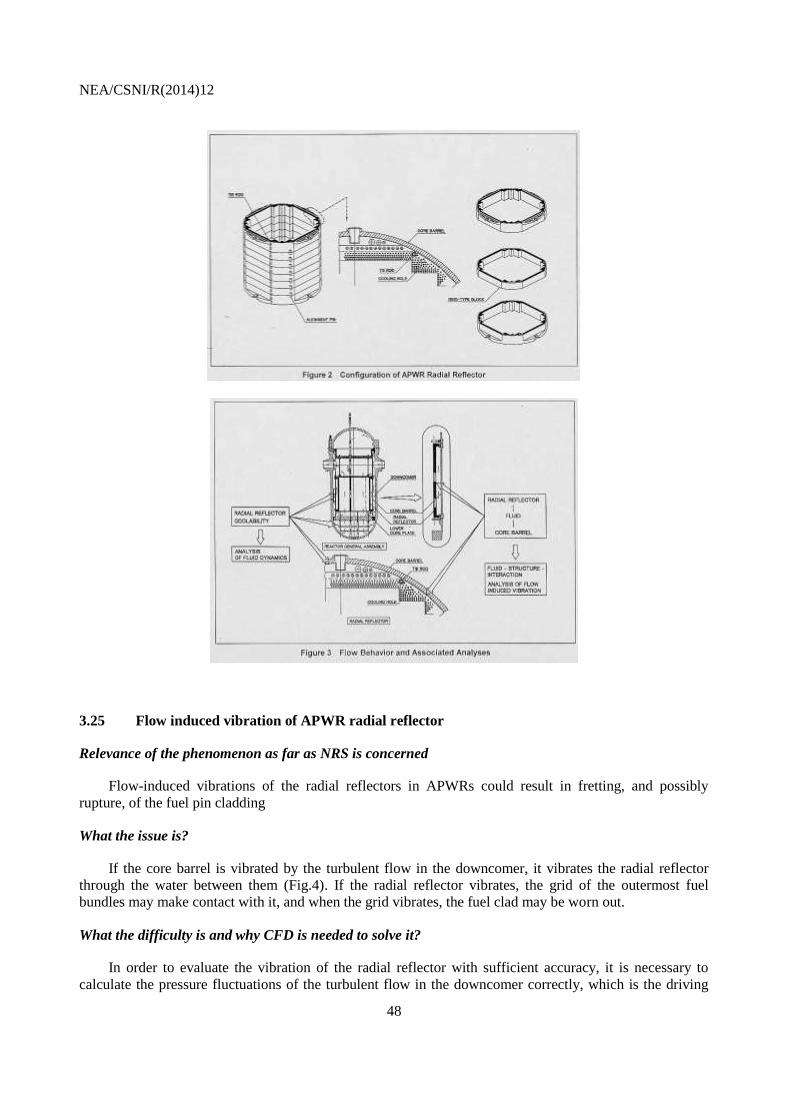
NEA/CSNI/R(2014)12
48
3.25 Flow induced vibration of APWR radial reflector
Relevance of the phenomenon as far as NRS is concerned
Flow-induced vibrations of the radial reflectors in APWRs could result in fretting, and possibly
rupture, of the fuel pin cladding
What the issue is?
If the core barrel is vibrated by the turbulent flow in the downcomer, it vibrates the radial reflector
through the water between them (Fig.4). If the radial reflector vibrates, the grid of the outermost fuel
bundles may make contact with it, and when the grid vibrates, the fuel clad may be worn out.
What the difficulty is and why CFD is needed to solve it?
In order to evaluate the vibration of the radial reflector with sufficient accuracy, it is necessary to
calculate the pressure fluctuations of the turbulent flow in the downcomer correctly, which is the driving
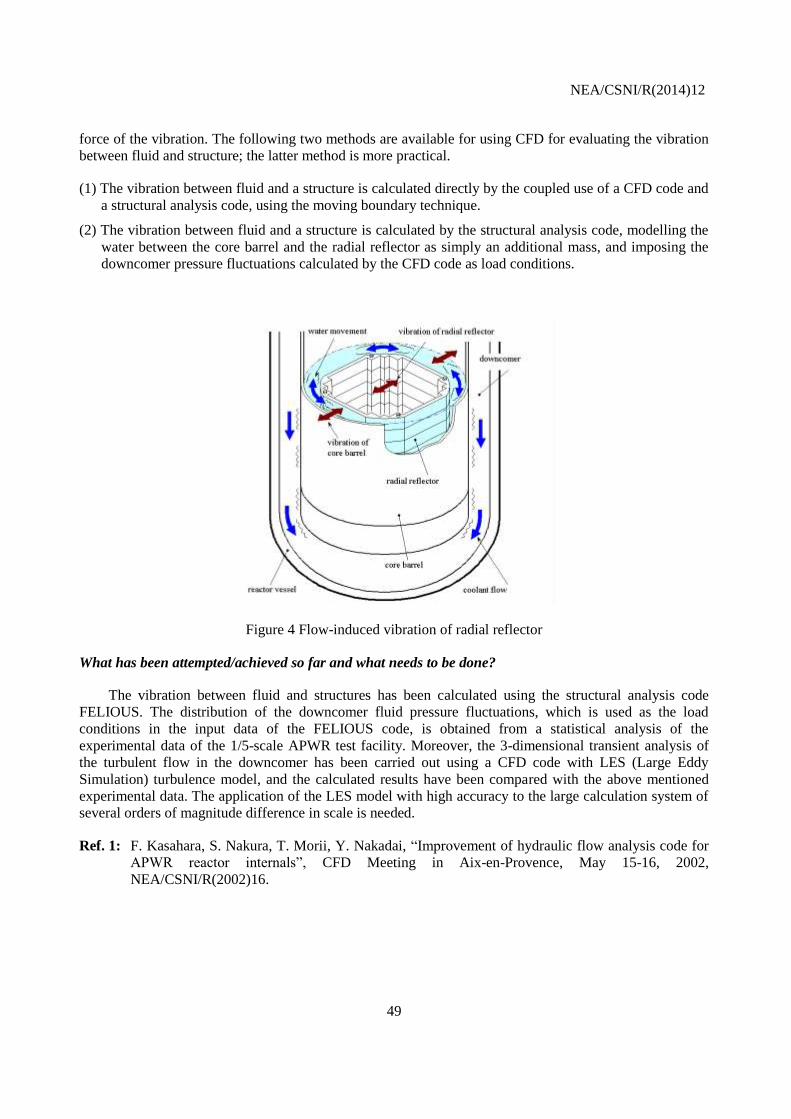
NEA/CSNI/R(2014)12
49
force of the vibration. The following two methods are available for using CFD for evaluating the vibration
between fluid and structure; the latter method is more practical.
(1) The vibration between fluid and a structure is calculated directly by the coupled use of a CFD code and
a structural analysis code, using the moving boundary technique.
(2) The vibration between fluid and a structure is calculated by the structural analysis code, modelling the
water between the core barrel and the radial reflector as simply an additional mass, and imposing the
downcomer pressure fluctuations calculated by the CFD code as load conditions.
Figure 4 Flow-induced vibration of radial reflector
What has been attempted/achieved so far and what needs to be done?
The vibration between fluid and structures has been calculated using the structural analysis code
FELIOUS. The distribution of the downcomer fluid pressure fluctuations, which is used as the load
conditions in the input data of the FELIOUS code, is obtained from a statistical analysis of the
experimental data of the 1/5-scale APWR test facility. Moreover, the 3-dimensional transient analysis of
the turbulent flow in the downcomer has been carried out using a CFD code with LES (Large Eddy
Simulation) turbulence model, and the calculated results have been compared with the above mentioned
experimental data. The application of the LES model with high accuracy to the large calculation system of
several orders of magnitude difference in scale is needed.
Ref. 1: F. Kasahara, S. Nakura, T. Morii, Y. Nakadai, “Improvement of hydraulic flow analysis code for
APWR reactor internals”, CFD Meeting in Aix-en-Provence, May 15-16, 2002,
NEA/CSNI/R(2002)16.

NEA/CSNI/R(2014)12
50
3.26 Natural circulation in LMFBRs
Relevance of the phenomenon as far as NRS is concerned
Current LMFBR designs often feature passive devices for decay-heat removal. It is necessary to
demonstrate that the system operates correctly under postulated accident conditions.
What the issue is?
Decay heat removal using natural circulation is one of the important functions for the safety of current
LMFBRs. For example, DRACS (Direct Reactor Auxiliary Cooling System) has been selected for current
designs of the Japanese Demonstration Fast Breeder Reactor. DRACS has Dumped Heat Exchangers
(DHXs) in the upper plenum of the reactor vessel. Cold sodium provided by the DHX covers the reactor
core outlet, and also produces thermal stratification in the upper plenum (Fig.1). In particular, the decay
heat removal capability has to be assured for the total blackout accident in order to achieve high reliability.
What the difficulty is and why CFD is needed to solve it?
The cold sodium in the upper plenum can penetrate into the gap region between the subassemblies
due to negative buoyancy, and enhances the natural convection in these gap regions. Analyses of natural
circulation tests in the Japanese experimental reactor JOYO revealed that heat transfer between
subassemblies, i.e. inter-subassembly heat transfer, reduced subassembly outlet temperatures for the inner
rows of the core. CFD is effective in evaluating the complex flow field caused by natural convection in the
LMFBR reactor vessel.
What has been attempted/achieved so far and what needs to be done?
The three-dimensional flow field and temperature distribution of sodium in the reactor vessel have
been evaluated by JNC (Japan Nuclear Cycle Development Institute) using the CFD code AQUA.
The three-dimensional natural convection in the reactor vessel, coupled with the one-dimensional
natural circulation in the loops, have been evaluated simultaneously by JAPC (Japan Atomic Power
Company) using a CFD code combined with a system code.
Ref. 1: H. Kamide, K. Hayashi, T. Isozaki, M. Nishimura, “Investigation of Core Thermohydraulics in
Fast Reactors - Interwrapper Flow during Natural Circulation”, Nuclear Technology, 133, 77-91
(2001).
Ref. 2: H. Kamide, K. Nagasawa, N. Kimura, H. Miyakoshi, “Evaluation Method for Core
Thermohydraulics during Natural Circulation in Fast Reactors (Numerical Predictions of Inter-
Wrapper Flow)”, JSME International Journal, Series B, Vol.45, No.3, 577-585, 2002.
Ref. 3: Watanabe et al., “Study on Natural Circulation Evaluation Method for a large FBR”, Proc.
NURETH-8 Conference, Kyoto September 30 - October 4, 1997.
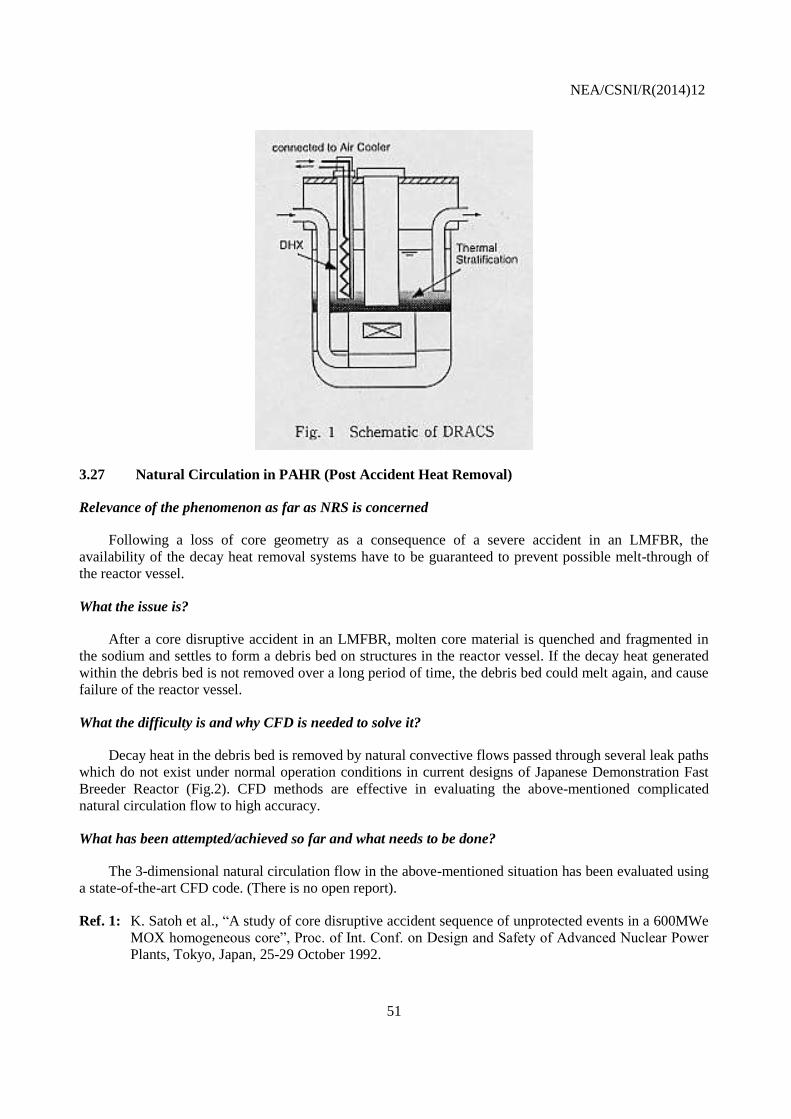
NEA/CSNI/R(2014)12
51
3.27 Natural Circulation in PAHR (Post Accident Heat Removal)
Relevance of the phenomenon as far as NRS is concerned
Following a loss of core geometry as a consequence of a severe accident in an LMFBR, the
availability of the decay heat removal systems have to be guaranteed to prevent possible melt-through of
the reactor vessel.
What the issue is?
After a core disruptive accident in an LMFBR, molten core material is quenched and fragmented in
the sodium and settles to form a debris bed on structures in the reactor vessel. If the decay heat generated
within the debris bed is not removed over a long period of time, the debris bed could melt again, and cause
failure of the reactor vessel.
What the difficulty is and why CFD is needed to solve it?
Decay heat in the debris bed is removed by natural convective flows passed through several leak paths
which do not exist under normal operation conditions in current designs of Japanese Demonstration Fast
Breeder Reactor (Fig.2). CFD methods are effective in evaluating the above-mentioned complicated
natural circulation flow to high accuracy.
What has been attempted/achieved so far and what needs to be done?
The 3-dimensional natural circulation flow in the above-mentioned situation has been evaluated using
a state-of-the-art CFD code. (There is no open report).
Ref. 1: K. Satoh et al., “A study of core disruptive accident sequence of unprotected events in a 600MWe
MOX homogeneous core”, Proc. of Int. Conf. on Design and Safety of Advanced Nuclear Power
Plants, Tokyo, Japan, 25-29 October 1992.

NEA/CSNI/R(2014)12
52
Ref. 2: K. Koyama et al., “A study of CDA sequences of an unprotected loss-of flow event for a 600MWe
FBR with a homogeneous MOX core”, IWGFR/89 IAEA Technical Committee Meeting on
Material-Coolant Interactions and Material Movement and Relocation in Liquid Metal Fast
Reactors, O-arai, Ibaraki, Japan, 6-9 June 1994.
Figure 2: Schematic of the Demonstration Fast Reactor
3.28 Gas Flow in the Containment following a Sodium Leak
Relevance of the phenomenon as far as NRS is concerned
The sodium coolant used in LMFBRs is a hazardous material, and adequate precautions have to be
made if a spill occurs.
What the issue is?
Liquid sodium has preferable characteristics as a coolant in LMFBRs from both the neutronics and
thermal-hydraulics viewpoints. On the other hand, liquid sodium will chemically react with oxygen or
water if it leaks out of heat transport system. For the safety of the LMFBR plants, it is important to
evaluate the consequence of possible sodium combustion.
What the difficulty is and why CFD is needed to solve it?
Leaked sodium may break up into small droplets of various diameters. In an air atmosphere, the
droplets burn as they fall. This is designated as spray combustion. The unburned sodium collects on the
floor of the reactor building, and pool combustion may ensue (Fig.3).
In order to evaluate the spray combustion rate with sufficient accuracy, it is necessary to evaluate the
amount of oxygen which flows around the sodium droplets. The amount of oxygen depends on the gas
flow in the room caused by the motion of sodium droplets, and the temperature/concentration stratification.
On the other hand, in order to estimate the pool combustion rate with sufficient accuracy, it is
necessary to evaluate the amount of oxygen which flows to the sodium pool surface. This depends on the

NEA/CSNI/R(2014)12
53
natural convection flow generated on the hot pool surface. A CFD code is effective in evaluating this gas
flow.
What has been attempted/achieved so far and what needs to be done?
The CFD code AQUA-SF has been developed by JNC (Japan Nuclear Cycle Development Institute)
to evaluate spatial distributions of gas temperature and chemical species. The code includes the spray
combustion model and a flame-sheet pool combustion model.
Ref. 1: A. Yamaguchi, T. Takata, Y. Okano, “Numerical Methodology to Evaluate Fast Reactor Sodium
Combustion”, Nuclear Technology, 136, 315-330, (2001).
Ref. 2: T. Takata, A. Yamaguchi, I. Maekawa, "Numerical Investigation of Multi-dimensional
characteristics in sodium combustion", Nuclear Engineering and Design, 220, 37-50 (2003).
Figure 3: Computational Models for the SPHINCS Program
3.29 AP600, AP1000 and APR1400
Relevance of the phenomenon as far as NRS is concerned
The AP600 is a 2 loop PWR, designed by Westinghouse, with passive safeguard systems. The passive
safety systems, such as core make-up tanks and the passive, residual-heat-removal heat exchanger, depend
on gravity. The availability and functionality of these components has been confirmed as part of the
licensing procedures. However, certain aspects of the operation involve 3-D flow behaviour, and there is
scope for CFD to be employed to improve efficiency and reduce the degree of conservatism in the design.
What the issue is?
The AP600 has several passive system components, and thermal-hydraulic phenomena relating to
these components will occur during accidents or transients: thermal stratification in the core makeup tank
(CMT), downcomer and cold legs, condensation and convection in the in-containment refuelling water
storage tank (IRWST), and so on.
NEA/CSNI/R(2014)12
54
In the IRWST, three-dimensional thermal convection due to the heat transfer from the passive residual
heat removal (PRHR) heat exchanger, and the condensation of steam from the automatic depressurisation
system (ADS), are both important for cooling of the primary system.
Thermal stratification in cold legs is one of the significant phenomena under some small-break LOCA
conditions after the termination of the natural circulation through the steam generators. In the loop where
the PRHR system is connected, the fluid in the cold leg is a mixture of the draining flow from the steam
generator U-tubes and the discharge from the PRHR heat exchanger in low-temperature IRWST, and
becomes significantly colder than the downcomer liquid. The relatively warmer downcomer liquid intrudes
along the top of the cold leg. In contrast, in the loop with the CMT, the cold-leg liquid is kept at a higher
temperature than the downcomer liquid temperature, since the CMT water is injected into the downcomer
through the direct vessel injection (DVI) line, and the downcomer liquid intrudes along the bottom of the
cold leg. In both cases, a counter-current flow is established as well as the thermal stratification. In case of
cold-leg break LOCAs, the thermal stratification in the cold legs has an effect upon the discharge flow rate
from the break point, and thus the system response.
What the difficulty is and why CFD is needed to solve it?
Three-dimensional convection in a tank and counter-current thermal stratification in legs are difficult
phenomena to model using system analysis codes based on one-dimensional components. The difference
of discharge from a break point due to the difference of orientation is not generally accounted for. The
system behaviour, however, is associated with these local phenomena, and a CFD approach is necessary
for safety evaluation of new types of components and reactors.
What has been attempted/achieved so far and what needs to be done?
Three-dimensional calculations for single-phase flows are possible using commercial CFD codes. The
cold-leg flow, however, becomes a two-phase mixture under some conditions, and is much influenced by
the system response. The flow in the IRWST is also related strongly to the system response. Detailed three-
dimensional calculations of single- and two-phase flows are necessary at the same time with, or in the
framework of, the system analyses.
Ref. 1: http://www.iaea.or.at/programmes/ne/nenp/nptds/newweb2001/simulators/cti_pwr/pwr_ap600_ov
erview.pdf
Ref. 2: I.S. Kim and D.S. Kim, “APR1400: Evolutionary Korean Next Generation Reactor”, Proc.
ICONE-10, Arlington, USA, April 14-18, 2002.
Ref. 3: C.-H. Song, W.P. Baek, J.K. Park, “Thermal-Hydraulic Tests and Analyses for the APR1400’s
Development and Licensing”, J. Nuclear Eng. & Technology 39(4), Aug. 2007.
3.30 SBWR, ESBWR and SWR-1000
Relevance of the phenomenon as far as NRS is concerned
Evolutionary-design reactor systems often feature passive decay-heat removal systems, including
passive decay heat removal from the containment in the event of a LOCA. The coupling of the primary
circuit and containment response is a new concept, and needs to be thoroughly understood in order to
ensure safe operation of the reactor under such conditions.

NEA/CSNI/R(2014)12
55
What the issue is?
The phenomena to be investigated involve mixing and transport of the containment gases ― steam
and incondensables (nitrogen and, in the case of severe accidents involving core degradation, possibly also
hydrogen) ― and condensation of the steam on cold surfaces and/or water pools.
What the difficulty is and why CFD is needed?
Generally, in all the above cases, decay heat removal involves complex mixing and transport of two-
component/two-phase flows in complex geometries. The numerical simulation of such behaviour requires
the use of sophisticated modelling tools (i.e.? CFD) because of the geometric complexities and the inherent
3-D behaviour, together with the development of reliable and appropriate physical models.
The principles, which reflect the need for advanced tools, may be illustrated with reference to the
schematic of the ESBWR shown in Fig. 4a. The Drywell is directly connected to Passive Containment
Cooler (PCC) units, which sit on the containment roof. The steam condensed in these units is fed back to
the Reactor Pressure Vessel (RPV), while any uncondensed steam, together with the nitrogen which
originally filled the Drywell atmosphere, is vented to the Suppression Pool. Clearly, partial condensation of
steam and stratified conditions in the pool are both unfavourable, leading to excess pressure in the
chamber. It is therefore important to understand the condensation and mixing phenomena which occur in
the pool. To accurately represent the dynamics of the bubble expansion and break-up, CFD, in combination
with an interface tracking procedure (e.g.? VOF or LS) is required.
Following break-up of the primary discharge bubble into smaller bubbles, it is no longer convenient to
explicitly describe the liquid/gas interface, because of its disjointedness and complexity. Consequently, an
Euler/Euler, two-fluid approach has been followed, with the water acting as the continuous medium and
the bubbles representing the dispersed phase. A full description of the bubble dynamics, and the stirring of
the water in the pool to break up stratified layers, will encompass CFD with two-phase flow and turbulence
models.
In the SWR-1000 (Fig. 4b), containment condensers are employed. One condenser under
consideration is a cross-flow, finned-tube heat exchanger with steam condensation outside the tubes and
water evaporation within. The tubes are slightly inclined and staggered (Fig. 5). The performance of such
finned tube containment condensers can be investigated at small and medium scale, but the scaling factors
remain uncertain for a full-sized unit. CFD offers an opportunity to analyse the full-scale situation cheaply
and efficiently, using data from smaller tests to validate the models.
What has been attempted and achieved/what needs to be done (recommendations)?
Aspects of the issues alluded to above have been tackled using CFD methods in the context of the EU
shared-cost actions TEMPEST, IPSS, INCON and ECORA. In addition, CFD has been used to model the
mock-up experiments carried out in the PANDA facility. Considerable modelling effort has been expended
on condensation in the presence of incondensables, interface tracking of gas-discharge bubbles and bubble
plumes in suppression pools. Requiring more attention is the extension of the two-phase CFD models for
condensation and turbulence.
Ref. 1: S. Rao, A. Gonzalez, 1998, “ESBWR: Using Passive Features for Improved Performance and
Economics”, Proc. Nucl. Conf., Nice, France, 26-28 Oct. 1998.
Ref. 2: G. Yadigaroglu, 1999, “Passive Core and Containment Cooling Systems: Characteristics and
State-of-the-Art”, Keynote Lecture, NURETH-9, 3-8 Oct., 1999.

NEA/CSNI/R(2014)12
56
Ref. 3: N. S. Aksan, and D. Lubbesmeyer, “General Description of International Standard Problem 42
(ISP-42) on PANDA Tests”, Proc. Int. Conf. ICONE9, Nice, France, April 8-12,
ASME/JSME/SFEN, 2001.
Ref. 4: Wickers, V. A., et al., 2003. Testing and Enhanced Modelling of Passive Evolutionary Systems
Technology for Containment Cooling (TEMPEST), FISA 2003 Conference, EU Research in
Reactor Safety, Luxembourg, 2003.
Ref 5: Andreani, M., Putz, F., Dury, T. V., Gjerloev, C. and Smith, B. L., 2003. On the application of
field codes to the analysis of gas mixing in large volumes: case studies using CFX and GOTHIC.
Annals of Nuclear Energy, 30, 685-714.
Ref. 6: Yadigaroglu, G, Andreani, M., Dreier, J. and Coddington, P., 2003. Trends and needs in
experimentation and numerical simulation for LWR safety, Nucl. Eng. Des., 221, 205-223.
Figure 4: Two Evolutionary Reactor Designs: (a) ESBWR, (b) SWR-1000
ø 32.0 m
28.7 m
4 Cont ainmentcooling condenser s
4 Emer gencycondensers
Dryer-separatorstorage pool
Corefloodingpool
Core
Pressuresuppression pool
16 Vent pipes
Residual heat r emoval system
Control rod drives
4 Cor eflooding lines
3 Main steam
lines
2 Feedwater
lines
Reactor water
clean-up system
4 H v ent pipes
6 Safety
relief
valves
Drywellflooding line
2
2 Overf low pipes
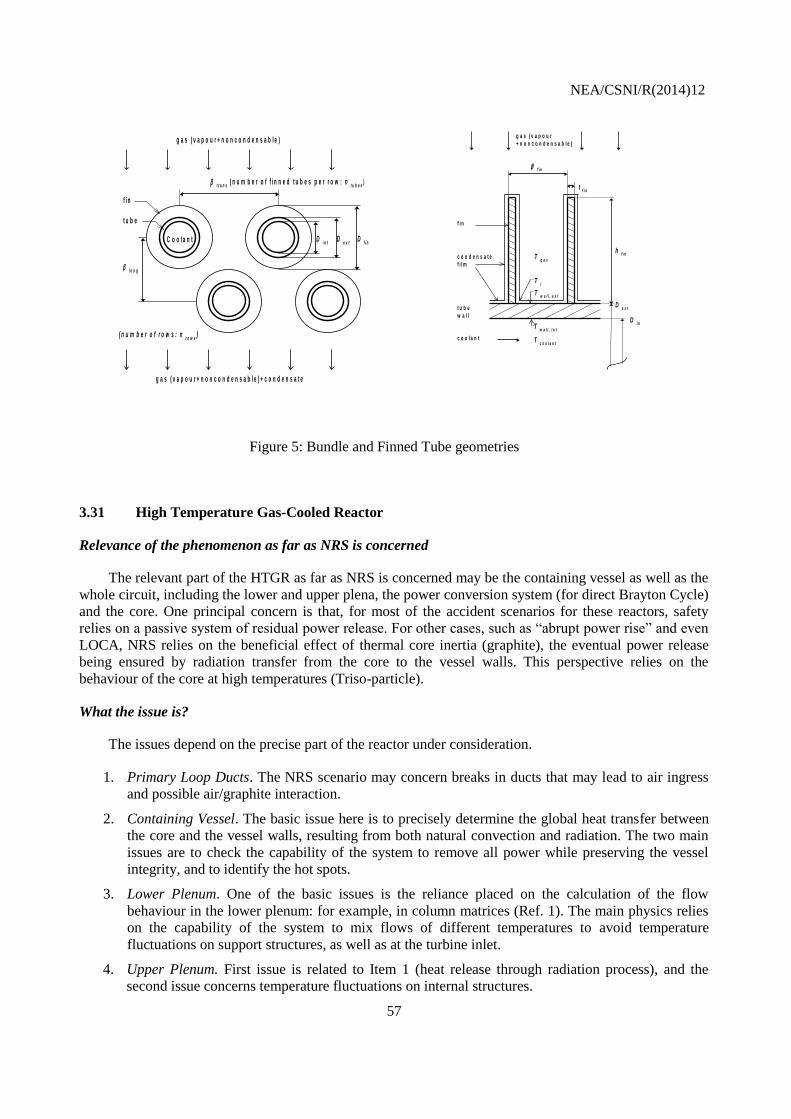
NEA/CSNI/R(2014)12
57
Figure 5: Bundle and Finned Tube geometries
3.31 High Temperature Gas-Cooled Reactor
Relevance of the phenomenon as far as NRS is concerned
The relevant part of the HTGR as far as NRS is concerned may be the containing vessel as well as the
whole circuit, including the lower and upper plena, the power conversion system (for direct Brayton Cycle)
and the core. One principal concern is that, for most of the accident scenarios for these reactors, safety
relies on a passive system of residual power release. For other cases, such as “abrupt power rise” and even
LOCA, NRS relies on the beneficial effect of thermal core inertia (graphite), the eventual power release
being ensured by radiation transfer from the core to the vessel walls. This perspective relies on the
behaviour of the core at high temperatures (Triso-particle).
What the issue is?
The issues depend on the precise part of the reactor under consideration.
1. Primary Loop Ducts. The NRS scenario may concern breaks in ducts that may lead to air ingress
and possible air/graphite interaction.
2. Containing Vessel. The basic issue here is to precisely determine the global heat transfer between
the core and the vessel walls, resulting from both natural convection and radiation. The two main
issues are to check the capability of the system to remove all power while preserving the vessel
integrity, and to identify the hot spots.
3. Lower Plenum. One of the basic issues is the reliance placed on the calculation of the flow
behaviour in the lower plenum: for example, in column matrices (Ref. 1). The main physics relies
on the capability of the system to mix flows of different temperatures to avoid temperature
fluctuations on support structures, as well as at the turbine inlet.
4. Upper Plenum. First issue is related to Item 1 (heat release through radiation process), and the
second issue concerns temperature fluctuations on internal structures.
C o o l a n t
l o n g
g a s ( v a p o u r + n o n c o n d e n s a b l e )
t r a n s ( n u m b e r o f f i n n e d t u b e s p e r r o w : n
t u b e s)
g a s ( v a p o u r + n o n c o n d e n s a b l e ) + c o n d e n s a t e
D i n t
D e x t
D f i n
( n u m b e r o f r o w s : n r o w s
)
f i n
t u b e
t u b e
g a s ( v a p o u r
+ n o n c o n d e n s a b l e )
c o o l a n t
f i n
t f i n
h f i n
D e x t
D i n t
t u b e
w a l l
f i n
c o n d e n s a t e
f i l mT
g a s
T i
T w a l l , e x t
T c o o l a n t
T w a l l , i n t

NEA/CSNI/R(2014)12
58
5. Turbine. First issue is connected with Item 2 (temperature heterogeneity at the inlet for nominal
and accident scenarios). Second issue concerns the temperature of the blades and disks. Indeed,
these structures may not be cooled in some designs. For all the transients where these structures are
not cooled, the question of thermal constraints arises. Other issues concern the dynamical
behaviour: pressure variation, rotating speed variation, etc.
6. Compressor. Particular regimes such as stall or surge in the case of depressurisation may be of
concern.
7. Heat exchanger. Firstly, the water exchangers are the only cold source of the primary loop. They
should be checked for many transient situations: e.g. loss of load, pre-cooler failure, etc. NRS
scenarios may also concern secondary loop water ingress. Secondly, the heat recuperator is
submitted to temperature and pressure fluctuations at inlet.
8. Core. The core is subject to the usual problems, such as power rise, LOCA, etc.
What the difficulty is and why CFD is needed?
Geometries are complex, and it is difficult to make simplifications to ease modelling. Transients
(which may be short or very long) involve multi-physics phenomena: CFD has to be employed in
combination with conjugate heat transfer, radiation and neutronics coupling, for example, and the flow
regimes are varied and complex (from incompressible to compressible, from laminar to turbulent – and
sometimes with relaminarisation – and from forced to mixed and natural convection).
CFD is required, or is at least preferable, in the following circumstances.
Where real three dimensional flows occur, which is typically the case for:
the core in accident situations (tube plugging or power rise);
the lower plenum, since asymmetrical flow develops due to the position of the outlet;
the heat exchanger, though here the case for CFD is questionable, since such a component
can be taken into account only at the system level; however, a precise description of the
phenomena may require CFD.
Where complex flows develop in situations in which details of local quantities or local phenomena
are needed. This is the case for:
the turbine, where local information about hot spots is required;
the compressor, where stall prediction is an issue;
generally, where local values are needed for the determination of hot spots.
Even if the global behaviour in the upper plenum may be described as a component through a 0-D
system approach, CFD may produce a more accurate description of the mixing processes occurring
as a result of turbulence action.
The precise description of local effects may be of relevance in the case of air ingress prediction,
thermal fatigue (the GCR counterpart of the PWR tee-junction or thermal shock problem).
What has been attempted and achieved/what needs to be done (recommendations)?
Pioneering simulations concerning flows around lower plenum columns, and flows in some regions of
the core, have been conducted at CEA (Ref. 1 to 5).

NEA/CSNI/R(2014)12
59
Ref. 1: Tauveron, N. “Thermal fluctuations in the lower plenum of a high temperature reactor”, Nuclear
Engineering and Design, 222, 125-137 (2003).
Ref. 2: M. Elmo, O. Cioni, Low Mach number model for compressible flows and application to HTR,
Nuclear Engineering and Design 222, 2003
Ref. 3: E. Studer et al., “Gas Cooled Reactor Thermal-Hydraulics using CAST3M and CRONOS2
codes”, Proc. 10th Int. Topical Meeting on Nuclear Thermal-Hydraulics, NURETH-10, Seoul,
Korea, 5-11 October 2003.
Ref. 4: O. Cioni, M. Marchand, G. Geffraye, F. Ducros, “3D thermal hydraulic calculations of a modular
block type HTR core”, Nuclear Engineering and Design 236, 2006
Ref. 5: O. Cioni, F. Perdu, F. Ducros, G. Geffraye, N .Tauveron, D. Tenchine, A. Ruby, M. Saez Multi-
scale analysis of gas Cooled Reactors through CFD and system codes, ENC'2005, Versailles,
France.
3.32 Sump Strainer Clogging
Relevance of the phenomenon as far as NRS is concerned
In a loss-of-coolant accident (LOCA) in a Pressurised Water Reactor (PWR), the two-phase jet flow
from the break could strip off thermal insulation from the piping system and wash down the broken and
fragmented debris to the sump screens. A total, or even partial, blockage of the screens could seriously
inhibit the effectiveness of the decay-heat removal system.
What the issue is?
The particle load on the strainers results in an increased pressure drop, and hence decreased mass flow
rate through the strainers. Sedimentation of the insulation debris on the screens, and its possible re-
suspension and transport in the sump water flow, need to be accurately quantified to ensure continuous
heat removal capability. This involves estimating the mass of fibre material deposited on the screens for a
specified geometry of the reactor sump, and of the mass dragged on by the water flow. Ultimately, the
mass transport of coolant determines the efficiency of the core cooling process.
What the difficulty is and why CFD is needed to solve it?
During the long-term core cooling operation following the LOCA, the water falls from the break from
a height of several meters onto the sump water surface. During its transit, the water stream will mix with
the air around. Air bubbles and released materials will be transported to the sump. The jet-induced flow
into the sump will influence the transport of fibrous insulation material to the sump strainer, and
consequently the head-loss across the strainer. CFD is able to calculate the main flow characteristics during
the plunging jet situation. The establishment of a large swirling flow in the sump water caused by the
entrained air can be reproduced using CFD, as can the transport of the fibrous material. The swirling flow
patterns, which directly affect the fibre deposition properties, are three-dimensional phenomena, and
cannot be captured using a traditional system-code approach.
What has been attempted/achieved so far and what needs to be done?
A joint research project has been set up between the University of Applied Science Zittau/Görlitz
(HZGR) and the Helmholtz-Zentrum Dresden-Rossendorf (HZDR), involving an experimental
investigation of particle transport phenomena (HZGR), and the development of appropriate CFD models
for its simulation (HZDR). In the project, the fragmentation at prototypic thermal-hydraulic conditions, the
transport behaviour of the fibres in a turbulent water flow, and the deposition and possible re-suspension of
fibres have all been investigated. In addition, a numerical “strainer model” has been developed, the fibre
NEA/CSNI/R(2014)12
60
behaviour being investigated for conditions of a plunging jet in a large pool. In a later part of the project,
the scope was extended to include the effects of the presence of fibres in the core region, and consideration
was also given to the chemical phenomena associated with them.
Ref. 1: Grahn, A.; Krepper, E.; Alt, S.; Kästner, W. “Modelling of differential pressure buildup during
flow through beds of fibrous materials”, Chemical Engineering & Technology, 29(8), 997-1000
(2006).
Ref. 2: Grahn, A.; Krepper, E.; Alt, S.; Kästner, W. “Implementation of a strainer model for calculating
the pressure drop across beds of compressible, fibrous materials”, Nuclear Engineering and
Design, 238, 2546-2553 (2008).
Ref. 3: Grahn, A.; Krepper, E.; Weiß, F.-P.; Alt, S.; Kästner, W.; Kratzsch, A.; Hampel, R.
“Implementation of a pressure drop model for the CFD simulation of clogged containment sump
strainers”, Journal of Engineering for Gas Turbines and Power - Transactions of the ASME, 132,
082902 (2010).
Ref. 4: Höhne, T.; Grahn, A.; Kliem, S.; Weiss, F.-P, “CFD simulation of fibre material transport in a
PWR under loss of coolant conditions”, Kerntechnik, 76, 39-45 (2011).
Ref. 5: Krepper, E.; Cartland-Glover, G.; Grahn, A.; Weiss, F.-P.; Alt, S.; Hampel, R.; Kästner, W.;
Seeliger, A., “Numerical and experimental investigations for insulation particle transport
phenomena in water flow”, Annals of Nuclear Energy, 35, 1564-1579 (2008).
Ref. 6: Krepper, E.; Weiß, F.-P.; Alt, S.; Kratzsch, A.; Renger, S.; Kästner, W. “Influence of air
entrainment on the liquid flow field caused by a plunging jet and consequences for fibre
deposition”, Nuclear Engineering and Design, 241, 1047–1054 (2011).

NEA/CSNI/R(2014)12
61
4. DESCRIPTION OF EXISTING ASSESSMENT BASES
Major sources of information identified by the Group are elaborated below under appropriate section
headings. In addition, in summary form, references to documents available from the NEA/CSNI and
elsewhere are collected at the end of the section.
Some of the web sites referenced below allow free access to data for code validation, they sometimes
propose CFD reference calculations, and they ask people to participate to the enhancement of the database
by submitting their own cases. In this way, the CFD community has ready access to an ever-increasing
body of information to act as an assessment base for their activities. At present, the activities are orientated
primarily towards the aerospace and aerodynamics communities, but at least demonstrate the seriousness
of the commitment to “quality and trust” in CFD, and the concept could be expanded to serve the nuclear
community also.
To be precise with the definition, assessment is defined here as an application-specific process based
on three principal steps:
1. Verification (solving the equations correctly);
2. Validation (solving the correct equations); and
3. Demonstration (i.e., demonstrating the capability to solve a given class of problems).
This process is seen schematically in the Figure below.
Experiments Code
Verification
Validation
Assessment
Demonstration, including solution verification
Intended application, planning, requirements gathering, PIRT

NEA/CSNI/R(2014)12
62
An assessment matrix for a given application should therefore be composed of three groups of items
(particular matrices):
4. “Exact” solutions and corresponding CFD calculations;
5. Validation experiments and corresponding CFD simulations; and
6. Demonstration CFD simulations, and possibly prototype experiments.
The following general statement can therefore be made:
“Any assessment matrix should be strictly problem-dependent: that is, any particular matrix must
contain at least part of a computational path (numerical algorithm and/or physical model) considered for
the intended application of the code”.
As a consequence, a separate assessment matrix should be prepared for every selected nuclear safety
issue where CFD simulation can be beneficial (see Chapter 3). This is a very demanding task. Fortunately
though, many items (particular matrices) will be the same in the majority of such groups of matrices
associated with different applications, since the same numerical algorithm and physical models will often
be used.
Whereas verification should be performed mainly by code developers, validation and demonstration
are strictly application-dependent and must therefore be performed, or at least overseen, by users.
Validation and demonstration are the principal themes of this document. A review of several available
general-purpose databases comprising experimental data is presented below under appropriate sub-
headings. Then, specific application areas, namely boron dilution, pressurized thermal shocks, thermal
fatigue and aerosol transport in containments, are dealt with in more detail. Some corresponding
experiments are presented, together with available calculations. On the basis of analysis of experimental
data and results of CFD simulations, a statement on the appropriateness of a given CFD code to the
intended class of problems can be stated. This step completes the description of the existing assessment
bases.
Ref. 1: “Verification and Validation of CFD Simulations”, 1999, Stern, Wilson, Coleman, Paterson
(Iowa Institute of Hydraulic Research and Propulsion Research Center), report of the IIHR,
(www.iihr.uiowa.edu/gothenburg2000/PDF/iihr_407.pdf).
Ref. 2: “Verification and Validation in Computational Fluid Dynamics”, 2002, Oberkampf, Trucano,
Sandia National Laboratories report.
Ref. 3: “Tutorial on CFD V&V of the NPARC Alliance”,
(http://www.grc.nasa.gov/WWW/wind/valid/validation.html).
Ref. 4: Shaw, R.A., Larson, T.K. & Dimenna, R.K. “Development of a phenomena identification and
ranking table (PIRT) for thermal-hydraulic phenomena during a PWR LBLOCA”, NUREG/ CR-
5074, EG&G Idaho, Inc., 1988.
Ref. 5: Wilson, G.E. & Boyack, B.E. “The Role of the PIRT Process in Experiments, Code Development
and Code Applications Associated with Reactor Safety Analysis”, Nuclear Engineering and
Design, 186, 23-37 (1998).
Ref. 6: Chung, B.D. et al. “Phenomenological Identification and Ranking Tabulation for APR 1400
Direct Vessel Injection Line Break”, Proc. NURETH-10, Seoul, Korea, Oct. 5-9, 2003.
Ref. 7: C.-H. Song, et al. (2006), “Development of the PIRT for the Thermal Mixing Phenomena in the
IRWST of the APR1400”, Proc. 5th Korea-Japan Symposium on Nuclear Thermal Hydraulics
and Safety (NTHAS5), Jeju, Korea, Nov. 26-29, 2006
NEA/CSNI/R(2014)12
63
4.1 Validation Tests Performed by Major CFD Code Vendors
The code vendors identified here are those who promote general-purpose CFD: namely, ANSYS-
CFX, STAR-CD, FLUENT and PHOENICS, all of whom have customers in the nuclear industry area.
Other organisations with specialisations in certain areas, such as the aerospace industry, are excluded from
the list, though those codes written specifically for nuclear applications, though not always available for
general use, are included.
Each of the vendors operates in a commercial environment, and is keenly aware of their major
competitors. Consequently, such a sensitive item as validation, which might lead them into an unwelcome
code-code comparison exercise, may not receive all the attention it deserves. In addition, a validation
activity may have been performed at the request of a particular customer, and the results restricted, or may
not be published unless successful. Nonetheless, the companies are becoming more open, and have actively
participated in international projects: the active involvement of ANSYS-CFX in the EU 5th Framework
Programme ECORA is such an example.
The best source of information on specific validation databases is through the respective websites:
ANSYS-CFX www.ansys.com
STAR-CD www.cd-adapco.com
FLUENT www.FLUENT.com
PHOENIX www.cham.co.uk
Here one finds documentation, access to the workshops organised by each company, and to
conferences and journal articles where customers and/or staff have published validation material. The most
comprehensive documentation list appears to have been put together for PHOENICS, where a list of over
950 published papers can be found (some are validation cases), a special section devoted to validation
issues is included on the website, and the code has its own journal containing peer-reviewed articles.
Clearly, the list of validation documents is too long to be written here, but evidence of its existence
does confirm that commercial CFD has a well-founded technology base. It should be noted, however, that
even for codes explicitly written for the nuclear community normally include basic (often academic)
validation cases, just like those codes from the commercial area. A survey of validation tests has been put
together by Freitas (Ref. 1).
Ref. 1: C.J. Freitas “Perspective - Selected benchmarks from commercial CFD codes” J. Fluids Engg.
117, 208.
GASFLOW
The GASFLOW code, which has been developed as a cooperation between Los Alamos National
Laboratory (LANL) and Forschungszentrum Karlsruhe (FZK), is a 3D fluid dynamics field code used to
analyse flow phenomena such as circulation patterns, stratification, hydrogen distribution, combustion and
flame propagation, local condensation and evaporation phenomena, and aerosol entrainment, transport and
deposition in reactor containments. GASFLOW is a finite-volume code, and based on robust numerical
techniques for solving the compressible Navier-Stokes equations in Cartesian or cylindrical geometries. A
semi-implicit solver is employed to allow large time steps. The code can model geometrically complex
facilities with multiple compartments and internal structures, and has transport equations for multiple gas
species, liquid water droplets, and total fluid internal energy. A built-in library contains the properties of 23
gas species and liquid water. GASFLOW can simulate the effects of two-phase dynamics with the
NEA/CSNI/R(2014)12
64
homogeneous equilibrium model, two-phase heat transfer to and from walls and internal structures,
catalytic hydrogen recombination and combustion processes, and fluid turbulence.
Ref. 1: J.R. Travis, J.W. Spore, P. Royl, K.L. Lam, T.L. Wilson, C. Müller, G.A. Necker, B.D. Nichols,
R. Redlinger, “GASFLOW: A Computational Fluid Dynamics Code for Gases, Aerosols, and
Combustion", Vol. I, Theory and Computational Model, Reports FZKA- 5994, LA-13357-M
(1998).
Ref 2: J.W. Spore, J.R. Travis, P. Royl, K.L. Lam, T.L. Wilson, C. Müller, G.A. Necker, B.D. Nichols,
"GASFLOW: A Computational Fluid Dynamics Code for Gases, Aerosols, and Combustion",
Vol. II, User's Manual, Reports FZKA-5994, LA-13357-M (1998).
STAR-CD
Some elements relevant of the STAR-CD validation process are listed here: they derive from
Workshop or University researches and are not nuclear oriented. CD Adapco, the company who market
STAR-CD in Europe, is compiling a much more comprehensive validation list (including testing of
turbulence models, heat transfer, multiphase flows, combustion, etc.), but the information is mainly derived
from industrial cases, which are confidential. Consequently, it will not be readily available.
Lid-Driven Cavity Flow
The problem is characterised by its elliptic and non-linear nature: numerical diffusion is tested. This
study is concentrated on using the test case to compare the performance of the code with different types of
mesh. Three types of mesh are used in this calculation, namely hexahedral cells, tetrahedral cells and
polyhedral (trimmed) cells.
Two-Dimensional Single Hill Flow
This is one of the two test cases prepared for the ERCOFTAC Workshop on Databases and Testing of
Calculation Methods for Turbulent Flows (organised as part of the 4th ERCOFTAC/IAHR Workshop on
Refined Flow Modelling. Experimental data have been provided, and the main objective of the exercise
was to demonstrate the accuracy of prediction attainable. This study is concerned with the turbulent flow
past a surface mounted obstacle in a channel.
Supersonic Flow Over a Flat Plate
This example concerns the development of the turbulent boundary layer on a two-dimensional wedge.
The cross-sectional geometry of the wedge is an elongated trapezium with the top and bottom surfaces
parallel. The leading edge is the intersection between the wedge’s front and top surfaces, and the inclined
angle between them is 6.7o. The rear end of the wedge is vertical. Measuring from the tip of the leading
edge to the trailing edge, the length of the wedge is 0.914 m. In the parallel part of the wedge, the thickness
is 0.033 m.
During wind-tunnel tests, the flat surface of the wedge was kept parallel to the flow direction and
hence at zero pressure gradient. The model was placed in the centre of the working section and the flow
was considered to be two-dimensional. The wedge was not actively cooled, but was allowed to reach
equilibrium temperature. Based on free-stream flow conditions of air, the Reynolds number was
15 350 000.

NEA/CSNI/R(2014)12
65
Turbulent Flow Over a Surface-Mounted Rib
This study is concerned with turbulent flow past a surface-mounted obstacle in a channel. The
obstacle, representing a fence or rib, spans the whole width of the channel. Tests were performed in air at
20oC and over a range of flow velocities. Based on the mean inlet velocity and obstacle height, the
Reynolds numbers ranged between 1500 to 3000.
Turbulent Vortex-Shedding around a Square Cross-Section Cylinder
This study is concerned with turbulent flow past a square-section cylinder, which exhibits natural
periodic shedding of vortices. The experimental measurements were made by Durao et al. and the
experimental configuration comprised a square cross-section cylinder spanning the whole width of a
rectangular cross-section channel. According to their findings, the width of the test section was sufficiently
large for the flow to be assumed two-dimensional at the central plane. Based on the mean flow velocity of
water at inlet and on the height of the square, the Reynolds number was 14 000.
One-Dimension SOD’s Shock Tube
A shock tube is simply a tube that is divided by a membrane or diaphragm into two chambers at
different pressures. When the membrane is suddenly removed (broken), a wave motion is set up. This
problem is characterised by the interface between the low and high-pressure chambers. The contact face, as
it is known, marks the boundary between the fluids that were initially on either side of the diaphragm.
The main purpose of this validation case is to demonstrate the use of the gradient-based second order
accurate differencing scheme (MARS) and the second-order temporal discretisation scheme in capturing
the wave structures and motions.
Friction Factor of Fully Developed Turbulent Pipe Flow
The case of turbulent flow through pipes has been investigated thoroughly in the past, and a large
amount of experimental data is available in the open literature. Because of its wide range of applications, it
is also important for any CFD code to predict friction values that are comparable to those obtained from
experiments.
TRIO-U (Version V1.4.4)
Non-nuclear specific test cases used as a validation database are listed here.
Laminar flow (for incompressible, Boussinesq and low Mach number regimes)
Basic tests for convection, diffusion and coupled problems:
2D Poiseuille flow; 2D axi-Poiseuille; 3D Poiseuille; 2D and 3D Taylor-Green vortices; 2D axi-
symmetric pipe flow, with and without conjugate heat transfer; boundary layer on a vertical plate; flow
past a 2D circular cylinder (Re=100); oscillating flow in non-symmetrically heated cavity; square box
with a moving wall.

NEA/CSNI/R(2014)12
66
Turbulent flow (incompressible, Boussinesq and low Mach number regimes)
a) Mixing length model:
flow in a turbulent periodic channel; flow in a turbulent periodic pipe.
b) k-epsilon model:
2D axisymmetric pipe flow, with and without varying sections; 2D Hill flow; heated square box with
unsteady thermal stratification with air inlet and outlet; differentially heated square box; S-shaped
channel; flow around a single cube and around buildings (from the EEC TRAPPOS project).
c) LES modelling / RANS-LES hybrid model:
freely decaying homogeneous isotropic turbulence; isothermal turbulent periodic channel/pipe flow
with and without wall functions; differentially heated channel flow with and without wall functions,
and with and without solid wall coupling; vertical impinging jet; flow around circular or square
cylinders (from ERCOFTAC database); LES on specific nuclear applications.
Porous medium
a) Air flow through a particle bed; air flow in a storage room with axial arrays of heating tubes; Blasius
flow with regular loss of pressure; Blasius flow with mixed open medium and porous medium.
Radiation module
a) 2D and 3D square cavity with 2 facing walls at imposed temperature and 2 facing perfectly
reflecting walls; 2D and 3D axisymmetric cylinders; 2D and 3D square cavity filled with steam (for
radiation in absorbing media).
Nuclear specific test cases
Some comparisons between experiments and CFD results have been performed. These include data
from the ROCOM 1/5th scale reactor of FZR (Forschungszentrum Rossendorf), from the ISP-43, from tee-
junction configurations, from experiments involving temperature transport, and from dilution in complex
geometries.
SATURNE (Version 1.1)/NEPTUNE_CFD
Listed below are elements of the validation matrices of the EDF in-house code SATURNE, with both
nuclear and non-nuclear items included. Much of the single-phase part of the coding was later incorporated
in the NEPTUNE_CFD code.
1. Flow around an isolated cylinder: laminar, unsteady, isothermal regime
2. Flow in a 2D square cavity with moving wall: laminar, steady, isothermal regime
3. Taylor vortices: laminar, unsteady, isothermal regime
4. Plane channel flow: laminar and turbulent, steady, isothermal regimes
5. 2D Flow over a hill: turbulent steady, isothermal regime
6. 2D flow in a 2D arrays of tubes: turbulent, steady and unsteady, isothermal regime
7. Flow in a 2D channel with inclined pressure drop: laminar, steady, isothermal regime
8. Freely decaying homogeneous isotropic turbulence: turbulent, unsteady, isothermal regime
NEA/CSNI/R(2014)12
67
9. 3D flow in a cylindrical 180° curved pipe: steady, turbulent, isothermal regime
10. 3D flow around a car shape: steady, turbulent, isothermal regime
11. Natural convection in a 2D closed box with vertical heated walls: steady, turbulent, natural-
convection regime
12. Mixed convection in a 2D cavity with air inflow and heating: steady, turbulent, mixed-convection
regime.
13. Mixed convection in a 2D cavity with heated floor and air circulation heating: steady, turbulent,
mixed-convection regime.
14. 2D axisymmetric jet impingement on a heated wall: steady, turbulent, forced-convection regime.
15. 2D axisymmetric jet of sodium: steady, turbulent regime with thermal transfer
16. Thermal stratification in a hot duct with cold water injection: steady, turbulent, stratified regime
17. Injection (at 45°) of a mixture of gases in a pure gas: steady, turbulent, multi-species flow
18. 2D channel with thick heated walls: steady, turbulent flow with thermal coupling
19. Premixed combustion: steady reactive turbulent flow
20. Diffusion flame: steady, reactive, turbulent flow
21. Pulverised coal furnace: steady, turbulent, reactive flow with radiation heat transfer
22. Two-phase gas/particle flow along a vertical plate: steady, turbulent flow with Lagrangian
transport
23. Two-phase gas/particle flow in a vertical cylindrical duct: steady, turbulent flow with Lagrangian
transport
24. Industrial tee-junction: steady, turbulent flow
25. Industrial cold water injection in hot water duct: unsteady, turbulent flow with heat transfer
26. Simple tests of functionalities of practical interest (parallelism, periodicity, restart…)
27. Analytical case of radiative transfer in a closed cavity: steady, radiation heat transfer
Cast3M (including TONUS)
Listed below are elements of the validation matrices of two CEA in-house codes; both nuclear and
non-nuclear items are included.
Test of scalar equation transport (academic test cases)
a. Convection: 2D rotational transport flow
b. Convection-diffusion: 2D Smith-Hutton flow
c. Non-linear conservation law: 2D Burgers equation
d. Diffusive transport: 2D and 3D heat equation
Radiation heat transfer
a. Transparent media: square cavity, wedge, co-axial cylinders, co-centric spheres, cube
b. Radiation and conduction: air-filled cylinder
NEA/CSNI/R(2014)12
68
c. Absorbing media: absorbing gas in a sphere
d. Radiation and natural convection in absorbing media: 2D square cavity
Single-Component Flow
a. Incompressible
i. Lid-driven cavity
ii. Blasius flat plate
iii. Backward-facing step
b. Boussinesq
iv. Natural convection in zero Prandtl fluid
v. Rayleigh-Marangoni convection
vi. Vahl Davis differentially heated cavity
c. Low Mach Number
vii. Differentially heated cavity with large temperature differences
viii. Pressurisation
d. Compressible Flows
ix. 2D Laval-type nozzles or channel flow; 1D SOD shock tube; 1D double rarefaction wave;
shock collisions; moving or steady contact waves; moving or steady shock waves; 1D blast
wave; 2D shock reflection; 2D inviscid shear layer; 2D jet interaction; odd-even decoupling;
“Carbuncle Test Case”; double Mach reflection; forward-facing step; shock diffraction over
90° corner.
e. Multi-Component Flows
x. Low Mach and compressible approaches; shear layer; non-reactive shock tube; reactive
shock tube.
f. Turbulence Modelling
xi. Incompressible k-eps: grid turbulence; fully-developed channel flow; turbulent natural
convection in a square cavity
xii. LES on specific experiments
xiii. k-eps and Mixing-Length model for low Mach number NS Equations with condensation
xiv. k-eps for low Mach number reactive flows (EBU modelling)
g. Containment
xv. MISTRA tests
xvi. Wall condensation experiment
xvii. Condensation + convection + conduction in axisymmetric and 3D geometries, with and
without He
xviii. Flow in 3D compartmented geometries
xix. Spray dynamics, with convective heat transfer
xx. Droplet heat and mass transfer
NEA/CSNI/R(2014)12
69
xxi. Spray experiments
xxii. H2 detonation in 1D, 2D and 3D geometries
xxiii. Fast and slow H2 deflagrations
xxiv. LP models with H2 recombiner, with stratification and distribution, with wall condensation
xxv. Air/steam leaks in idealised and concrete cracks
h. “GCR” Specific Models
xxvi. Conduction, radiation, convection in complex geometries
xxvii. Turbine blade deblading
ANSYS (ANSYS-CFX)
Heat transfer predictions from the two codes ANSYS-TASCflow and ANSYS-CFX are
comprehensively covered in the document cited below. All situations analysed were for turbulent flow
conditions. Three two-equation, eddy-viscosity turbulence models were analysed in the context of 9 test
cases, illustrated in the accompanying table The test cases are idealised, academic standards, but
nonetheless of relevance to NRS issues, since many such situations (though not idealised) will occur in
NRS applications. It is estimated that less than 1% of all industrial applications of CFD target the
prediction of heat transfer to and from solid walls.
It was found that the often reported poor performance of eddy viscosity models could be attributed to
the application of low-Re near wall treatments, and not so much on the underlying turbulence model. It is
generally known that k- approaches overpredict heat transfer rates in regions of adverse pressure gradient,
and at flow-attachment points. The k-ω model has better heat transfer characteristics in near-wall regions,
but is sensitive to the free-stream values of ω outside the wall boundary layer. The sensitivity often extends
to the specification of inlet values. The SST (Shear-Stress Transport) model is an attempt to take advantage
of the favourable characteristics of both models by combining a k-ω treatment near the wall and a k-
description in the far field. This model performed the best in all 9 test cases, and results compared well
with more complex four-equation model v2f, developed at Stanford. On the basis of this benchmark
exercise, it was demonstrated that the ANSYS-CFX software is capable of performing heat transfer
simulations for industrial flows. The experience gained from this exercise endorses the statement that CFD
is a “tried-and-tested” technology, and this has immediate benefits for NRS applications.
Overall, validation is a key component of the ANSYS-CFX software strategy, which is reflected in
the vendor’s participation in international benchmarking activities, such as those organised within EU
Framework Programmes (ASTAR, ECORA) and ERCOFTAC.
Ref. 1: W. Vieser, T. Esch, F. Menter “Heat Transfer Predictions using Advanced Two-Equation
Turbulence Models”, ANSYS-CFX Technical Memorandum, ANSYS-CFX-VAL10/0602, AEA
Technology, June 2002, [email protected].

NEA/CSNI/R(2014)12
70
Experiment Mach N° &
Fluid Properties
Flow
Type
Items of Interest
Backward
Facing Step
Ideal Gas Plane, 2D
Flow separation,
reattachment and re-
developing flow
(Vogel & Eaton,
1985)
Pipe
Expansion
Rotation axis
Ideal Gas Axi-
symmetric
Flow separation,
reattachment and re-
developing flow
(Baughn et al., 1984)
2D-Rib
Ideal Gas Plane, 2D
Periodic flow over a
surface mounted rib
(Nicklin, 1998)
Driven Cavity
Ideal gas Plane, 2D
Driven cavity flow,
(Metzger et al., 1989)
Natural
Convection
Ideal gas Plane, 2D
Buoyancy, heat
transfer (Betts &
Bokhari, 2000)
Impinging Jet
Ideal gas Axi-
symmetric
Stagnation flow,
(Craft et al., 1983;
Yan et al., 1992)
Impinging Jet
on a Pedestal
Ideal Gas Axi-
symmetric
Stagnation flow,
(Baughn et al., 1993;
Mesbah, 1996)
Subsonic and
Supersonic
Nozzle Flow
0.2 – 2.5,
air-methane
mixture, ideal
gas
Axi-
symmetric
Cooled turbulent
boundary layer under
the influence of large
pressure gradients
(Back et al., 1964)

NEA/CSNI/R(2014)12
71
Ref. 1: Back, L.H., Massier, P.F. and Gier, H.L., 1964, “Convective Heat Transfer in a Convergent-
Divergent Nozzle”, Int. J. Heat Mass Transfer, Vol. 7, pp. 549 – 568
Ref. 2: Baughn, J.W., Hoffmann, M.A., Takahashi, R.K. and Launder, B.E., 1984, “Local Heat Transfer
Downstream of an Abrupt Expansion in a Circular Channel With Constant Wall Heat Flux”, Vol.
106, Journal of Heat Transfer, pp. 789 – 796.
Ref. 3: Baughn, J. W., Mesbah, M., and Yan, X., 1993, “Measurements of local heat transfer for an
impinging jet on a cylindrical pedestal”, ASME HTD-Vol 239, pp. 57-62
Ref. 4: Betts, P. L., and Bokhari, I. H., 2000, “Experiments on turbulent natural convection in an
enclosed tall cavity”, Int. J. Heat & Fluid Flow, 21, pp. 675-683
Ref. 5: Craft, T. J., Graham, L. J. W., and Launder, B. E., 1993, “Impinging jet studies for turbulence
model assessment – II. An examination of the performance of four turbulence models”, Int. J.
Heat Mass Transfer. 36(10), pp. 2685-2697
Ref. 6: Mesbah, M., 1996, “An experimental study of local heat transfer to an impinging jet on non-flat
surfaces: a cylindrical pedestal and a hemispherically concave surface”, PhD Thesis, University
of California, Davis.
Ref. 7: Metzger, D. E., Bunker, R. S., and Chyu, R. K., 1989, “Cavity Heat Transfer on a Transverse
Grooved Wall in a Narrow Channel”, J. Heat Transfer, 111, pp. 73-79
Ref. 8: Nicklin, G. J. E., 1998, “Augmented heat transfer in a square channel with asymmetrical
turbulence production”, Final year project report, Dept. of Mech. Eng., UMIST, Manchester
Ref. 9: Vogel, J.C. and Eaton, J.K., 1985, “Combined Heat Transfer and Fluid Dynamic Measurements
Downstream of a Backward-Facing Step”, Vol. 107, Journal of Heat Transfer, pp. 922 – 929.
Ref. 10: Yan, X., Baughn, J. W., and Mesbah, M., 1992, “The effect of Reynolds number on the heat
transfer distribution from a flat plate to an impinging jet”, ASME HTD-Vol 226, pp. 1-7.
FLUENT
A generally available validation database for FLUENT does not currently exists. There are instead
three levels of validation reports. The most public are journal publications of validation exercises. Since
1990, more than 100 references have accrued citing validation activities; of these 6 were related to NRS
applications. At a second, and more restrictive level, FLUENT provides licensed code users (for
Universities only the primary holder of the site license) with online access to nineteen validation reports.
Titles of the reports are:
Flow in a Rotating Cavity
Natural Convection in an Annulus
Laminar Flow Around a Circular Cylinder
Flow in a 90 Planar Tee-Junction
Flows in Driven Cavities
Periodic Flow in a Wavy Channel
Heat Transfer in a Pipe Expansion
Propane Jet in a Coaxial Air Flow
Non-Premixed Hydrogen/Air Flame
300 kW BERL Combustor

NEA/CSNI/R(2014)12
72
Flow through an Engine Inlet Valve
Turbulent Flow in a Transition Duct
Solid Body Rotation with Central Air Injection
Transonic Flow Over a RAE 2822 Airfoil
Mid-Span Flow Over a Goldman Stator Blade
Compressible Turbulent Mixing Layer
Scramjet Outflow
Turbulent Bubbly Flows
Adiabatic Compression and Expansion Inside an Idealised 2D In-Cylinder Engine.
The third, and more detailed, set of validation reports exists internal to FLUENT. The tests are applied
during development of new code versions, but most are proprietary, and details of this validation set are
not available externally.
Ref. 1: F. Lin, B. T. Smith, G. E. Hecker, P. N. Hopping, “Innovative 3-D numerical simulation of
thermal discharge from Browns Ferry multiport diffusers”, Proc. 2003 International Joint Power
Generation Conference, Atlanta, GA, June 16-19 2003, p 101-110.
Ref. 2: R. M. Underhill, S. J. Rees, H. Fowler, “A novel approach to coupling the fluid and structural
analysis of a boiler nozzle”, Nuclear Energy, 42(2), 95-103 (2003).
Ref. 3: T.-S. Kwon, C.-R. Choi, C.-H. Song, “Three-dimensional analysis of flow characteristics on the
reactor vessel downcomer during the late reflood phase of a postulated LBLOCA”, Nucl. Eng.
Des., 226(3), 255-265 (2003).
4.2 ERCOFTAC
The European Research Community on Flow, Turbulence And Combustion (ERCOFTAC) is an
association of research, educational and industrial groups with main objectives to promote joint efforts,
centres and industrial application of research, and the creation of Special Interest Groups (SIGs).
A large number of SIGs have been formed, and one is the ERCOFTAC Database Interest Group
(DBig), with the objective to coordinate, maintain and promote the creation of suitable databases derived
from experimental, DNS, LES, CFD, PIV and flow visualisation specialists.
This data base, started in 1995, and administrated by UMIST Mechanical Engineering CFD group,
contains experimental as well as existing numerical data (collected through Workshops) relative to both
academic and more applied applications. The database is actively maintained by UMIST staff, and is
currently undergoing a restructuring and expansion to include, amongst other things, more details of the
test cases, computational results, and results and conclusions drawn from the ERCOFTAC Workshops on
Refined Turbulence Modelling. Each case contains at least a brief description, some data to download, and
references to published work. Some cases contain significantly more information than this.
ERCOFTAC databases can be found for four basic sources:
Classic Data Base, which is open to the public (but registration is needed when downloading data).
Documented are 83 cases, either containing experimental data, or with DNS/LES data available. Some

NEA/CSNI/R(2014)12
73
of the cases could be used also in NRS applications, such as flow in curved channels, mixing layers, and
flows through tube bundles.
Experimental Distributed Data Base is under development and aims to collect web-accessible
experimental datasets that are of potential interest to the wider community of flow, turbulence and
combustion researchers, engineers and designers. Currently of special interest from the point of view of
nuclear reactor safety are the Barton Smith (Utah State University) experimental data, since they
contain pressure drop and velocity field measurements for flow through an array of cylinders. These
mimic a Next Generation Nuclear Plant lower plenum, with measurements of velocity and turbulence
for flow along fuel rods separated by grid spacers, performed within the project “Advanced
computational thermal fluid physics (CTFP) and its assessment for light water reactors and supercritical
reactors’. Experimental data may be downloaded in the form of ASCII files. Animations are available,
together with reports describing the experimental arrangements.
DNS/LES Distributed Data Base is also under development and contains links to several papers
describing applications of DNS and LES, with detailed experimental and computational data. There is
also a link to the DNS data base of the Turbulence and Heat Transfer Laboratory, University of Tokyo.
The DNS data base is openly available, but some other links within this page require user ID and
password. The data are related to basic problems of turbulence and do not have direct application to
engineering analyses.
Distributed Flow Visualisation Library is currently available in French only; a version in English is
under construction. The library contains at present almost 300 items, including authors, title, keywords
and abstracts, but loading them requires postal delivery of a CD ROM. Visualisations from both
experiments and numerical analyses are included, some of them (e.g. visualisation of liquid-gas bubbly
flow, No. 40) could be interesting to developers of two-phase flow models. Information on flow
patterns in various geometries and flow regimes can also help in assessment of CFD simulations.
Current and past test cases of three Special Interest Groups (SIG’s), namely Turbulence Modelling
SIG, Transition Modelling in Turbomachinery SIG, and Large Eddy Simulation SIG can be found via the
referenced links, as well as links to worldwide fluid dynamics data bases. Unfortunately, for several links,
the web sites probably do not now exist.
www.ercoftac.org
Classic Data Base:
http://cfd.me.umist.ac.uk/ercoftac/
Experimental Distributed Data Base:
http://ercoftac.mech.surrey.ac.uk/exp/homepage.html, http://www.mae.usu.edu/faculty/bsmith/data.html,
http://www.mae.usu.edu/faculty/bsmith/EFDL/array/Array.html,
http://www.mae.usu.edu/faculty/bsmith/EFDL/KNERI/KNERI.html
DNS/LES Distributed Data Base:
http://ercoftac.mech.surrey.ac.uk/dns/homepage.html,
http://www.thtlab.t.u-tokyo.ac.jp/,
Distributed Flow Visualisation Library:
http://ercoftac.mech.surrey.ac.uk/flovis/homepage.html
Special Interest Groups:
http://tmdb.ws.tn.tudelft.nl/,
http://ercoftac.mech.surrey.ac.uk/transition/homepage.html,
http://ercoftac.mech.surrey.ac.uk/LESig/homepage.html

NEA/CSNI/R(2014)12
74
Worldwide Data Base:
http://ercoftac.mech.surrey.ac.uk/links/data.html
4.3 QNET-CFD Knowledge Base
QNET-CFD is “A Thematic Network for Quality and Trust in the Industrial Application of
Computational Fluid Dynamics”, partly funded by the EU. Four years were spent in assembling and
collating knowledge and know-how across a range of CFD applications. The resulting knowledge base will
be launched shortly into the public domain under the stewardship of ERCOFTAC, but limited access is
possible now.
The knowledge base is hierarchically structured around the notions of Application Areas, Application
Challenges (realistic test cases which can be used in assessment of CFD for a given Application Area), and
Underlying Flow Regimes (generic, well studied test cases capturing important elements of the key flow
physics encountered in one or more Application Challenges). Each Application Challenge and Underlying
Flow Regime features best practice advice providing guidance on model set-up decisions and the
interpretation of results.
At present, the following Application Areas are included:
External Aerodynamics
Combustion and Heat Transfer
Chemical and Process, Thermal Hydraulics and Nuclear Safety
Civil Construction and HVAC
Environmental Flow
Turbomachinery Internal Flow.
In the Chemical and Process, Thermal Hydraulics and Nuclear Safety Application Area, the following
Application Challenges are included:
Buoyancy-opposed wall jet (contributed by Magnox Electric, UK); a two-dimensional buoyancy-
opposed plane wall jet penetrating into a slowly moving, counter-current uniform flow. Experimental
study of this flow has been performed at the University of Manchester (UMIST) using a water rig.
Particle Image Velocimetry (PIV) and Laser Doppler Anemometry (LDA) systems were used to study
the mean flow and turbulent fields. Laser light sheet flow visualisation and PIV were used to obtain
pictures of the instantaneous flow structure. Detailed measurements of local mean velocity, turbulence
and temperature were then made using an LDA system incorporating a fibre optic probe and
transversable rake of thermocouples. Computations have been performed at UMIST using the two-
dimensional finite-volume TEAM code. Four models of turbulence based on RANS and a LES model
have been considered. The jet-spreading rate (distance from the wall where the mean velocity becomes
half the local maximum velocity), and the jet penetration depth were chosen to assess the quality of the
numerical simulations.
Induced flow in a T-junction (contributed by the EDF R&D Division, Chatou, F); a high-Reynolds
number flow is maintained in the main pipe while very small incoming mass flow rates are imposed in
the auxiliary pipe. Description of the swirl flow in the auxiliary leg should be well predicted.
Experiments have been performed at Chatou, and two RANS turbulence models (k-epsilon, and RSM)
have been used in the calculations. The height of the swirl is the main parameter to assess the quality of
calculations.
Cyclone separator (contributed by FLUENT Europe Ltd) No details yet available.
NEA/CSNI/R(2014)12
75
Buoyant gas air-mixing (contributed by British Nuclear Fuels, BNFL, UK); the mixing of buoyant gas
(helium or hydrogen) with air in a vessel. The mole fraction of hydrogen or helium measured at various
points in the geometry is the assessment parameter.
Mixed convection in a reactor (contributed by CEA/DMT Saclay, F); distribution of steam and /or
hydrogen in containment during an accident with break in the reactor coolant system. Experiment D30
of the MISTRA experimental series, which focused on validation of turbulence and condensation
models, was selected. CFD simulation with the CEA code TONUS is presented. The objective is to
predict correctly condensation rates and gas distribution in the cylindrical containment. The effect of
turbulence on the mixing of scalars (temperature, concentrations), and on pressure and condensation
rates are the key parameters.
Spray evaporation in turbulent flow (contributed by Martin-Luther-Universität, Halle-Wittenberg,
D); spray evaporation in a heated turbulent air stream was studied experimentally with isopropyl-
alcohol used as liquid. Different flow conditions (flow rate, air temperature, liquid flow rate) were
studied in a pipe expansion (with expansion ratio of three). Heated air entered through an annulus, and
there was a hollow cone-spray nozzle mounted at the centre. Phase-Doppler anemometry (PDA) was
applied to obtain the spatial change of the droplet size spectrum in the flow field and to measure droplet
size-velocity correlations. Profiles of droplet mean velocities, velocity fluctuations, and droplet mean
diameters were then obtained by averaging over all droplet size classes, and profiles of droplet mass
flux, enabling determination of global evaporation rates, were also determined. Velocity profiles of both
phases along the test section, including mean velocities for the axial and radial components as well as
the associated rms-values, are the assessment parameters. Additionally, profiles of droplet mean
diameters and droplet mass flux can be used, together with the liquid mass flow along the test section,
enabling the global evaporation rate to be determined.
Combining/dividing flow in Y junction (contributed by Rolls-Royce Marine Power, Engineering &
Technology Division) No details yet available.
Downward flow in a heated annulus (contributed by British Energy, UK); turbulent downward flow
in an annulus with a uniformly heated core and an adiabatic outer casing was tested with the aim of
evaluating the influence of buoyancy on mixed-convection flow, heat transfer and turbulence. The
Reynolds number of the flows ranges from 1000 to 6000, and the Grashof number (based on heat flux)
ranges from 1.1x10⁸ to 1.4x10
9. The experimental data collected on the experimental rig in the Nuclear
Engineering Department, School of Engineering, University of Manchester are temperatures, velocity
and turbulence. A representative set of CFD calculations have been undertaken at UMIST using the k-
epsilon turbulence model, but with three approaches to the modelling of near-wall turbulence. The
variation of Nusselt number on the heated core is the assessment parameter.
For each Application Challenge, its description, test data, CFD simulations, evaluation, best practice
advice, and related underlying flow regimes should all be available. At present, user ID and password are
required.
Ref. 1: http://eddie.mech.surrey.ac.uk/homepage.htm
4.4 MARNET
These are Best Practices Guidelines for Marine Applications of CFD, and were prepared by WS
Atkins Consultants. The general ERCOFTAC document is taken as a starting point, and specific advice on
the application of CFD methods within the marine industry are provided.
Ref. 1: WS Atkins Consultants, “Best Practices Guidelines for Marine Applications of CFD,”
MARNET-CFD Report, 2002.
Ref. 2: https://pronet.wsatkins.co.uk/marnet/

NEA/CSNI/R(2014)12
76
4.5 FLOWNET
The FLOWNET initiative is intended to provide the scientific and industrial communities with a code
validation tool for flow modelling and computational/experimental methods. By means of network
databases, multi-disciplinary knowledge is cross-fertilised and archived. Providing a share of technical
complements to scientists and engineers, the network enhances quality and trust in pre-industrial processes.
The ultimate goal of the network is to bring together academic and industrial node partners in a
dynamically open forum to evaluate continuously the quality and performance of CFD software for
improving complex design in industry from the viewpoint of accuracy and efficiency. The FLOWNET
project provides data once specific authorisation has been provided; the main orientation is the
aerodynamics community (http://dataserv.inria.fr/sinus/flownet/links/index.php3).
4.6 NPARC Alliance Data Base
The NPARC Alliance for CFD Verification & Validation provides a tutorial, as well as available
measurements and data for CFD cases, chiefly orientated towards the aerodynamics community. The data
archive of NASA also provides suitable data for CFD applications, while there is also a link to an archive
of the high-quality validation data listed below.
Incompressible, turbulent flat plate;
RAE 2822 transonic airfoil;
S-Duct;
Subsonic conical diffuser;
2D diffuser;
Supersonic axisymmetric jet flow;
Incompressible backward-facing step;
Ejector nozzle;
Transonic diffuser;
ONERA M6 wing;
2D axisymmetric boat tail nozzle;
3D boat tail nozzle
Hydrogen-air combustion in a channel;
Dual-stream mixing;
Laminar flow over a circular cylinder.
All validation cases include a full flow description, comparison data and references.
Measurements and Data:
http://www.grc.nasa.gov/WWW/wind/valid/tutorial/tutorial.html
NASA Archive:
http://www.nas.nasa.gov/Software/DataSets
Validation Data:
http://www.grc.nasa.gov/WWW/wind/valid/
NEA/CSNI/R(2014)12
77
4.7 AIAA
The American Institute of Aeronautics and Astronautics, or AIAA, is a 65-year-old “professional
society for aerospace professionals in the United States”. Its purpose it to “advance the arts, sciences, and
technology of aeronautics and astronautics, and to promote the professionalism of those engaged in these
pursuits”. For example, there is a link up with the QNET-CFD activity. The society participates to the
definition of standards for CFD in its “Verification and Validation Guide”.
Web sites related to AIAA activities propose lists of references (papers, books, author coordinates)
related to CFD verification and validation and various links with other web sites gathering information of
aeronautical interest. Some of these links may provide valuable information for CFD validation, though
this would have to be sifted for information of interest to the NRS community.
Base address:
http://www.aiaa.org
CFD V&V:
http://www.aiaa.org/publications/database.html
http://www.icase.edu/docs/library/itrs.html
4.8 Vattenfall Database
The Plane Wall Jet (UFR3-10)
Detailed three-component turbulence measurements in a wall jet down to y+<2 are reported. The
experimental technique was a combination of light collection in 90° side-scatter, and the use of optics with
probe volumes of small diameters. A complete k-profile was obtained, and turbulence statistics up to fourth
order are presented for all three velocity components. Comparing the wall jet to the flat plate boundary
layer, one finds that the turbulence structure in the near-wall region is qualitatively very similar, but that
the actual values of the quantities (in conventional inner scaling) are higher for the wall jet.
Draft Tube (TA6-07) for a Kaplan Turbine
Data have been made available from measurements taken using LDV in a model turbine (scale 1:11)
at Vattenfall Utveckling, Älvkarleby, Sweden for an ERCOFTAC/IAHR sponsored Workshop: Turbine 99
- Workshop on Draft Tube Flow, held at Porjus, Sweden on 20-23 June, 1999. The basic challenge for
calculations submitted to the Workshop was to predict technically relevant quantities from measured data
at the inlet and outlet of the draft tube. This involved head loss coefficients, pressure distributions and the
positions of separated flow regions. A substantial amount of additional experimental data was made
available to the participants at the meeting, involving velocity fields at several internal points, boundary
layer profiles at selected points, and visual observations (with laser-induced fluorescence) of swirl and
recirculation zones. Proceedings of the Workshop are available on the web at
http://www.sirius.luth.se/strl/Turbine-99/index.htm, and the benchmark is also referenced in QNET-CFD.
Ref. 1: Eriksson J; Karlsson R; Persson J “An Experimental Study of a Two-Dimensional Plane
Turbulent Wall Jet”, Exp. Fluids, 25, 50-60 (1998).
Ref. 2: Andersson, U., Karlsson, R., "Quality aspects of the Turbine-99 experiments", in Proceedings of
Turbine-99 – Workshop on draft tube flow in Porjus, Sweden, 20-23 June 1999.
Ref. 3: The QNET-CFD Network Newsletter, A Thematic Network For Quality and Trust, Volume 2,
No. 3 – December 2003.

NEA/CSNI/R(2014)12
78
4.9 Existing CFD Databases from NEA/CSNI and Other Sources
Source Reference
1 State-of-the Art Report (SOAR) on Containment Thermal-
Hydraulics and Hydrogen Distribution
NEA/CSNI/R(1999)16
2 SOAR on Flame Acceleration and Deflagration-to-Detonation
Transition in Nuclear Safety
NEA/CSNI/R(2000)7
3 Summary and Conclusions of the May 1996 (Winnipeg)
Workshop on the Implementation of Hydrogen Mitigation
Techniques
NEA/CSNI/R(1996)8
4 Proceedings of the 1996 (Annapolis) Workshop on Transient
Thermal-Hydraulic and Neutronic Code Requirements
NEA/CSNI/R(1997)4
5 Proceedings of the April 2000 (Barcelona) Workshop on
Advanced Thermal-Hydraulic and Neutronic Codes - Current
and Future Applications (Volumes 1 and 2)
NEA/CSNI/R(2001)2
6 Summary and Conclusions of the April 2000 (Barcelona)
Workshop on Advanced Thermal-Hydraulic and Neutronic
Codes - Current and Future Applications
NEA/CSNI/R(2001)9
7 Proceedings of the May 2002 (Aix-en-Provence) Exploratory
Meeting of Experts to Define an Action Plan on the Application
of CFD to NRS Problems
NEA/CSNI/R(2002)16
8 Proceedings of the November 2002 (Pisa) IAEA/NEA Technical
Meeting on the Use of Computational Fluid Dynamics Codes for
Safety Analysis of Reactor Systems, Including Containment
NEA/CSNI/R(2003)
9 Severe Accident Research and Management in Nordic Countries
-- A Status Report, May 2000
NKS-71 (2002)
10 NKS Recriticality Calculation with GENFLO Code for the BWR
Core After Steal Explosion in the Lower Head, December 2002
NKS-83
ISBN 87-7893-140-1
11 The Marviken Full-Scale Experiments CSNI Report No. 103
12 Analysis of Primary Loop Flows (ECORA WP2 Report) http://domino.grs.de/ecora/ecora.nsf
4.10 Euratom Framework Programmes
ASTAR
ASTAR (Advanced Three-Dimensional Two-Phase Flow Simulation Tool) was a 5th Framework EU
shared-cost action dedicated to the further development of high-resolution numerical methods, and their
application to transient two-phase flow. The project explored the capabilities of using hyperbolic numerical
methods – which are traditionally the province of single-phase fluid dynamics, especially in the aerospace
industry – for two-phase flow simulations of relevance to nuclear reactor modelling. Several benchmark
exercises were adopted as verification and assessment procedures for comparing the different modelling
and numerical approaches.
It was recognised that the simulation tools currently used by the nuclear reactor community are based
on elliptic solvers, and suffer from high numerical diffusion. However, many of the accident sequences
being modelled with these methods involve propagation of strong parameter gradients: e.g. quench fronts,
stratification, phase separation, thermal shocks, critical flow conditions, etc., and such “fronts” become

NEA/CSNI/R(2014)12
79
smeared, unless very fine nodalisation is employed. Hyperbolic methods, on the other hand, are well suited
to such propagation phenomena, and one the principal goals of the ASTAR project was to demonstrate the
flow modelling capabilities and robustness of such techniques in idealised, nuclear accident situations.
ASTAR provide a forum in which separate organisations, developing in-house hyperbolic solvers,
could assess their progress within a common framework. To this purpose, a set of benchmark exercises
were defined to which the various participants were invited to submit sample solutions. The benchmarks
were taken from the nuclear research community, and for which reliable analytical, numerical or
experimental data were available. These included: phase separation in a vertical pipe, dispersed two-phase
flow in a nozzle, oscillating manometer, the Ransom faucet problem, the CANON (fast depressurisation)
test, boiling in a vertical channel, and LINX bubble-plume tests.
Although not all the different numerical approaches (though all hyperbolic) had reached the same
level of development and testing, there was evidence coming out of the project that high-resolution,
characteristic-based numerical schemes have reached a satisfactory level of maturity, and might therefore
be considered as alternatives to the present elliptic-based methods for a new generation of nuclear reactor
thermal-hydraulic simulation tool.
Ref. 1: H. Städtke et al. “The ASTAR Project – Status and Perspective”, 10th Int. Topical Mtg. on
Nuclear Reactor Thermal Hydraulics (NURETH-10), Seoul, Korea, Oct. 5-9, 2003.
Ref. 2: H. Paillere et al. “Advanced Three-Dimensional Two-Phase Flow Simulation Tools for
Application to Reactor Safety (ASTAR)”, FISA-2003 / EU Research in Reactor Safety, 10-13
November 2003, EC Luxembourg, http://www.cordis.lu/fp5-euratom/src/ev-fisa2003.htm.
ECORA
The overall objective of the European 5th Framework Programme ECORA wass to evaluate the
capabilities of CFD software packages in relation to simulating flows in the primary system and
containment of nuclear reactors. The interest in the application of CFD methods arises from the importance
of three-dimensional effects, which cannot be represented by traditional one-dimensional system codes.
Perspective areas of the application of detailed three-dimensional CFD calculations was identified, and
recommendations for code improvements necessary for a comprehensive simulations of safety-relevant
accident scenarios for future research were provided. Within the ECORA project, the experience of the
twelve partners from European industry and research organisations in the field of nuclear safety was
combined, applying the CFD codes ANSYS-CFX, FLUENT, SATURNE, STAR-CD and TRIO_U.
The assessment included the establishment of Best Practice Guidelines and standards regarding the
use of CFD software, and evaluation of results for safety analysis. CFD quality criteria is being
standardised prior to the application of different CFD software packages, and results are only accepted if
the set quality criteria are satisfied. Thus, a general basis is being formed for assessing merits and
weaknesses of particular models and codes on a European-wide basis. CFD simulations achieving the
accepted quality level will increase confidence in the application of CFD-tools to nuclear issues.
Furthermore, a comprehensive and systematic software engineering approach for extending and
customising CFD codes for nuclear safety analyses has been formulated and applied. The adaptation of
CFD software for nuclear reactor flow simulations is being demonstrated by implementing enhanced two-
phase flow, turbulence and energy transfer models relevant for pressurised thermal shock (PTS) studies
into ANSYS-CFX, Saturne and Trio_U. An analysis of selected experiments from the UPTF and PANDA
test series is being performed to validate CFD software in relation to PTS phenomena in the primary
system, and severe accident management in the containment.

NEA/CSNI/R(2014)12
80
The selected tests with PTS relevant flow phenomena include free surfaces, stratification, turbulent
mixing and jet flows. The test matrix starts with single-effect tests of increasing complexity, and ends with
industrially (reactor safety) relevant demonstration cases.
Verification test cases
VER01: Gravitational oscillation of water in U-shaped tube (Ransom, 1992)
VER02: Centralised liquid sloshing in a cylindrical pool (Maschek et al., 1992)
Validation test cases
VAL01: Axisymmetric single-phase air jet in air environment, impinging on a heated flat plate (Baughn
and Shimizu, 1989)
VAL02: Water jet in air environment impinging on an inclined flat plate, (Kvicinsky et al., 2002)
VAL03: Jet impingement on a free surface (Bonetto and Lahey, 1993)
VAL04: Contact condensation on stratified steam/water flow (Goldbrunner et al., 1998)
Demonstration test cases
DEM01: UPTF Test 1
DEM02: UPTF TRAM C1
The ECORA web address is http://domino.grs.de/ecora/ecora.nsf, where all project documents may be
found.
Ref. 1: M. Scheuerer et al., “Evaluation of computational fluid dynamic methods for reactor safety
analysis (ECORA)”, Nucl. Eng. Des., 235, 359–368 (2005).
TEMPEST
The shared-cost EU FP5 project TEMPEST focussed on resolving outstanding issues concerning the
effect of light gases on the long-term LOCA response of the passive containment cooling systems for the
SWR1000 and ESBWR advanced reactors. Validation of multi-dimensional codes for containment analysis
was a further objective. A series of five tests in the PANDA facility at PSI, with detailed local
measurements of gas species, temperature and pressure, were performed within the project. The
experimental data were used for the validation of CFD containment models, and provided improved
confidence in the performance of passive heat-removal systems in the presence of hydrogen. CFD codes
were successfully employed for predicting stratification behaviour in the containment volumes. This
included finding the cause of the tendency of system codes to overpredict containment end-pressure in the
presence of light gases. Improved passive containment models for the lumped parameter codes WAVCO
and SPECTRA were also validated.
The TEMPEST project was begun to settle the following issues:
1) How does mixing or stratification affect long-term containment pressure response?
2) What are the effects of hydrogen on the performance of passive containment cooling systems?
3) How to apply CFD (and CFD-like) codes for improved passive containment analysis?
A threefold approach was followed. Firstly, PANDA (PSI) and KALI (CEA, Cadarache) experiments
were performed in order to provide an experimental database for the above issues. Secondly, CFD models
for quantitative assessment of Building Condenser (BC) and Passive Containment Cooling (PCC) system
performance were developed and validated. Thirdly, both lumped-parameter and CFD (or CFD-like) codes

NEA/CSNI/R(2014)12
81
were then applied to assist in interpreting experimental results, with the objective of better understanding
passive containment behaviour.
From the analyses performed within the TEMPEST project, it was found that stratification affects the
system end-pressure in these reactors through its effect on the distribution of light gases between the
Drywell and the Suppression Chamber. Lumped-parameter codes demonstrated overall satisfactory
performance in passive containment analyses, but showed a tendency to overpredict system end-pressure,
due to their inability to properly account for stratification. In contrast, CFD codes were shown to be able to
accurately predict stratification in gas spaces and water pools, and therefore produce better end-pressure
predictions. A combined system-code/CFD-code approach, in which stratification is predicted using CFD,
could be considered for future analyses.
Ref. 1: V.A. Wichers et al. “Testing and Enhanced Modelling of Passive Evolutionary Systems
Technology for Containment Cooling (TEMPEST)”, FISA-2003/EU Research in Reactor Safety,
10-13 Nov. 2003, EC Luxembourg, http://www.cordis.lu/fp5-euratom/src/ev-fisa2003.htm.
IPSS
IPSS is an acronym for European BWR R&D Cluster for Innovative Passive Safety Systems, which
was an EU FP4 project concentrating on important innovations of BWRs, such as natural convection in the
reactor coolant system and passive decay-heat removal. Experiments were performed at the NOKO (FZJ,
separate-effects tests) and PANDA (PSI, integral tests) facilities, and post-test analyses performed with the
lumped-parameter/system codes ATHLET, APROS, COCOSYS, MELCOR, RELAP5, TRAC, the
containment code GOTHIC, and the CFD codes ANSYS-CFX-4 and PHOENICS.
Though it was demonstrated that traditional lumped-parameter and system codes were capable of
reproducing the experimental results, it became evident that CFD codes have to be used to a greater extent
than was envisaged at the start of the project. However, it was noted that the validation of these codes for
commercial reactor applications was not yet satisfactory, due to the limited amount of relevant
experimental data. Nonetheless, the continuing development of CFD codes, and the increasing capacity
and speed of computers, the project recognised the usefulness of applying the codes to the analysis of
thermal-hydraulic phenomena in real reactors in the future. It was also recommended to continue the study
of flow and temperature fields in large water pools and in the containment, and perform further
experiments with improved instrumentation (increase in number and sometimes also in quality) in order to
accurately resolve regions of stratification, and provide quality data for CFD validation.
Ref. 1: E. F. Hicken, K. Verfondern (eds.) “Investigation of the Effectiveness of Innovative Passive
Safety Systems for Boiling Water Reactors, Vol. 11, Energy Technology series of the Research
Center Jülich, May 2000.
EUBORA
The EU Concerted Action on Boron Dilution Experiments (EUBORA) had 15 partners, with Fortum,
Finland as the coordinator. Most of the partners from the FLOMIX-R project (see below) participated also
in EUBORA. The project started in late 1998, and finished within about 15 months.
The primary objective was to discuss and evaluate the needs for a common European experimental
and analytical programme to validate the calculation methods for assessing transport and mixing of diluted
and boron-free slugs in the primary circuit during relevant reactor transients. The second objective was to
discuss how the inhomogeneous boron dilution issues should be addressed within the EU.

NEA/CSNI/R(2014)12
82
The partners concluded that there was a clear need to understand the role of mixing in mitigating the
consequences of inhomogeneous boron dilution. In particular, the mixing of a boron-reduced slug on its
way from the location of formation to the reactor core inlet is important. In order to take full benefit of this
mechanism, one should be able to predict the degree of mixing for the reactor case in the most reliable
way. Though 3-D CFD methods do provide an effective tool for mixing calculations, it is important to
study the slug transportation in sufficient detail, and to perform the calculations under transient conditions.
The code calculations, and the applied turbulent mixing models, have to be validated by experiments.
Although a number of small-scale and large-scale tests have been performed in existing facilities, the
current status of assessment is deemed to be incomplete. In particular, the large-scale experimental
database does not cover all the slug motion and mixing cases.
It was also proposed that cooperation among the existing 1/5-scale experiments would provide useful
information by focussing on several phenomenological aspects not yet fully covered by the experimental
programmes. It was also concluded that other fluid mixing and flow distribution phenomena should be
regarded in the same context, since the final aim is to justify and assess the application of CFD codes for
general reactor calculations.
Large-scale experiments (scale 1/2) would provide confirmatory data for the existing 1/5-scale
experiments, and the partners supported the proposal to modify the existing PANDA facility at PSI for
large-scale mixing experiments, though this has yet to be carried out.
Ref. 1. Tuomisto H., Final Report: EUBORA Concerted Action on Boron Dilution Experiments, EU
Framework Programme on Nuclear Fission Safety, AMM-EUBORA(99)-P002, Dec. 1999.
FLOWMIX-R
Fluid mixing and flow distribution in the reactor circuit (FLOWMIX-R) is an EU 5th
Framework
shared cost action programme with 11 participants, with the Forschnungszentrum Rossendorf, Dresden
responsible for project coordination.
1. Forschungszentrum Rossendorf, Dresden (DE)
2. Vattenfall Utveckling AB, Älvkarleby (SE)
3. Serco Assurance, Dorchester, Dorset (GB)
4. GRS, Garching (DE)
5. Fortum Nuclear Services, Vantaa (Fin)
6. PSL, Villingen (SL)
7. VUJE, Trnava (SK)
8. NRI, Rez (CZ)
9. AEKI, Budapest (HU)
10. NPP Paks, Paks (HU)
11. EDO Gidropress, Podolsk (RU)
The project started in October 2001. The first objective of the project is to obtain complementary data
on slug mixing, and to understand in sufficient detail how the slug mixes before it enters the reactor core.
(Slug mixing is the most mitigative mechanism against serious reactivity accidents in local boron dilution
transients.) The second objective is to utilise data from steady-state mixing experiments and plant
commissioning test data, to determine the primary circuit flow distribution, and the effect of thermal
mixing phenomena in the context of the improvement of normal operation conditions and structural
integrity assessment. The third objective is to use the experimental data to contribute to the validation of

NEA/CSNI/R(2014)12
83
CFD codes for the analysis of turbulent mixing problems. Benchmark calculations for selected experiments
are used to justify the application of turbulent mixing models, to reduce the influence of numerical
diffusion, and to decrease grid, time step and user effects in CFD analyses.
Due to the large interest of research organisations and utilities from newly associated states (NASs), a
NAS extension of the project, incorporating the research institutions VUJE Trnava, NRI Rez (Czech
Republic), AEKI Budapest (Hungary) and the nuclear power plant NPP Paks (Hungary), as well as the
research and design organisation EDO Gidropress (Russia), as an external expert organisation, has been
undertaken.
The work on the project is performed within five work packages.
In WP 1, the key mixing and flow distribution phenomena relevant for both safety analysis,
particularly in steam-line-break and boron-dilution scenarios, and for economical operation and structural
integrity, have been identified. Based on this analysis, test matrices for the experiments have been defined,
and guidelines have been provided for the documentation of the measurement data, and for performing
validation calculations with CFD codes.
In WP 2 on slug mixing tests, experiments on slug mixing at the ROCOM and Vattenfall test facilities
have been performed, and the measurement data have been made available to the project partners for CFD
code validation purposes. Additional slug-mixing tests at the VVER-1000 facility of EDO Gidropress are
also being made available. Two experiments on density-driven mixing (one from ROCOM, one from the
Fortum PTS facility) have been selected for benchmarking.
In WP 3 on flow distribution in the cold legs and pressure vessel of the primary circuit,
commissioning test measurements performed at the Paks VVER-440 NPP have been used for the
estimation of thermal mixing of cooling loop flows in the downcomer and lower plenum of the pressure
vessel. A series of quasi-steady-state mixing experiments has been performed at the ROCOM test facility.
CFD methods are used for the simulation of the flow field in the primary circuit of an operating full-scale
reactor, and computed results compared against available measurement data. Conclusions are being drawn
concerning the usability and modelling requirements of CFD methods for these kinds of application.
Concerning WP 4 on validation of CFD codes, the strategy of code validation based on the BPGs, and
a matrix of CFD code-validation calculations, has been elaborated. CFD validation calculations on selected
benchmark tests are being performed. The CFD validation work is shared among the partners
systematically on the basis of a CFD validation matrix.
In WP 5, conclusions on flow distribution and turbulent mixing in NPPs will be drawn, and
recommendations on CFD applications will be given.
Quality assurance practice for CFD is being applied, based on the ERCOFTAC BPGs, as specified in
the ECORA project for reactor safety analysis applications. Serco Assurance and Vattenfall experts are
active in the ERCOFTAC organisation. Most of the FLOMIX-R partners are participating also in ECORA,
aimed at an assessment of CFD methods for reactor safety analyses. FLOMIX-R is contributing to the
extension of the experimental database on mixing, and the application of CFD methods to mixing
problems. Recommendations on the use of CFD codes for turbulent mixing problems defined within
FLOMIX-R will be fed back to the ECORA and ERCOFTAC BPGs.
First conclusions from the project are that a new quality of research in flow distribution and turbulent
mixing inside the RPV has been achieved in the FLOMIX-R project. Experimental data on slug mixing,
with enhanced resolution is space and time, has been gained from various test facilities, and covers
different geometrical and flow conditions. The basic understanding of momentum-controlled mixing in
NEA/CSNI/R(2014)12
84
highly turbulent flows, and buoyancy-driven mixing in the case of density differences between the mixing
fluids, has been improved significantly. A higher level of quality assurance in CFD code validation has
been achieved by consistently applying BPGs to the solution procedure.
The web address for FLOWMIX-R is http://www.fzd.de/FWS/FLOMIX/
Ref. 1: F.-P. Weiss et al., “Fluid Mixing and Flow Distribution in the Reactor Circuit (FLOWMIX-R)”,
Proc. FISA-2003/EU Research in Reactor Safety, 10-13 Nov. 2003, Luxembourg.
ASCHLIM
In the Accelerator Driven System (ADS) concept, thermal neutrons produced by bombarding a high-
density target with a proton beam, are utilised to produce energy and for the transmutation of radioactive
waste. In some designs, the target material is a Heavy-Liquid-Metal (HLM), which also serves as the
primary coolant, taking away the heat associated with the spallation reactions that produce the neutrons.
Power densities can easily reach 1000 W/cm3, not only in the liquid metal, but also in critical structures
surrounding the spallation region. Structural materials work at very high temperatures, and have to
themselves dissipate large quantities of heat. It is essential to have CFD tools capable of reliably simulating
the critical phenomena that occur, since it is not possible to experimentally simulate the acquired power
densities without actually using a beam.
The ASCHLIM project (Assessment of Computational Fluid Dynamics Codes for Heavy Liquid
Metals) is an Accompanying Measure of the Euratom 5th Framework Programme), and aims at joining
different experiences in the field of HLMs, both, in the experimental and numerical fields, and creating an
international collaboration to (1) make an assessment of the main technological problems in the fields of
turbulence, free surface and bubbly flow, and (2) coordinate future research activities.
Where possible, the assessments have been made on the basis of existing experiments, whose basic
physical phenomena are analysed through the execution of calculational benchmarks. Selected commercial
codes are used, because of their widespread availability, robustness and flexibility. In some particular
cases, research codes belonging to particular research institutes have also been considered, given the fact
that they often contain state-of-the-art numerical schemes and models. Particular attention is paid in the
project to problems associated with turbulence modelling for HLMs, especially those associated with
turbulent heat transfer (i.e. uncertainties in specifying the turbulent Prandtl number), free-surface
modelling (in the windowless ADS concept, the beam impinges on the liquid surface) and bubbly flows
(one ADS design incorporates gas injection to enhance natural circulation).
Some important indications about the use of CFD turbulence models have come from the ASCHLIM
benchmarking activity, although in some cases only partial conclusions could be drawn, principally due to
the lack of experimental measurements of turbulence quantities. The most important point to be clarified is
the exact range of applicability of the turbulent Prandtl number approach to HLM flows, and possibly to
extend it through the formulation, if it exists, of a relationship between it and the local fluid and flow
characteristics (e.g. molecular Prandtl number and turbulent Reynolds number), valid at least in the range
of Peclet numbers of interest for ADS applications.
Further benchmarking exercises in relation to free-surface configurations, and in particular new
experiments with water, are recommended. (The use of water as stimulant fluid arises because the
measurement possibilities with water are much broader, and less expensive, than with HLMs.) However,
the final assessment clearly must involve experiments with the real or very similar fluids (PbBi, Hg).
The need for full 3-D simulations was stressed by most of the participants. However, it must be
pointed out here that such simulations could lead to very large, if not prohibitively excessive, CPU times,

NEA/CSNI/R(2014)12
85
at least with the present generation of computers. New developments with research codes might also
improve the basic knowledge and understanding of free-surface behaviour.
Ref. 1: B. Arien (Ed.) “Assessment of Computational Fluid Dynamics codes for Heavy Liquid Metals”, Final
Technical Report, October 2003.
EXTRA MATERIAL
Aix-en-Provence, May 2002 Exploratory Meeting
The meeting was in two parts: first, several presentations were given describing CFD applications to
relevant NRS issues, and then a working group, under the joint chairmanship of J. C. Micaelli (IRSN) and
J. Mahaffy (PSU), was convened, with the purpose of defining an action plan on the “application of CFD
to nuclear reactor safety problems”. This initiative was followed up at the subsequent IAEA/NEA
Technical Meeting in Pisa (see below), where further discussions took place, and became the starting point
of the present activity.
The technical presentations covered the areas listed here.
Recent IRSN work on the application of CFD to primary-system-related phenomena (induced
breaks, hot-leg temperature heterogeneity and PTS) and containment-related (development and
use of the TONUS code) phenomena.
The ECORA (Evaluation of Computational Methods for Reactor Safety Analysis) 5th Framework
Programme.
The application of in-house codes at NUPEC to provide the Japanese Regulatory Authority with
an independent means of assessment of safety analysis of APWR internals. The issues addressed
included flow distribution into the neutron reflector (an innovative design improvement), turbulent
flow in the downcomer, γ-heating of the neutron reflector, and flow-induced vibrations.
Mixing of containment gases (relating to ECORA, ISP-42 activities), aerosol deposition
(PHEBEN-2 project), wall condensation, liquid-gas interface tracking, and bubble dynamics in
suppression pools.
Application of CFD techniques associated with various EU projects, including PHEBEN-2,
TEMPEST, ECORA and NACUSP.
The need for two-phase CFD in NRS, including details and preliminary conclusions from the
EUROFASTNET project, and the latest R&D developments embodied within the joint CEA/EDF
code NEPTUNE.
Some NRS applications requiring CFD: boron dilution, thermal fatigue, induced pipe rupture,
PTS, long-term waste storage, together with latest developments of the CEA code TRIO-U.
All the items covered at this meeting have been identified as topics relevant to the activities of this
group, and information concerning them is itemised elsewhere in this report. Consequently, no further
explanation is given here. A CD-ROM was prepared of the presentations, but no written papers were
required.
Ref. 1: “Exploratory Meeting of Experts to Define an Action Plan on the Application of Computational
Fluid Dynamics (CFD) Codes to Nuclear Reactor Safety Problems, Working Group on the
Analysis and Management of Accidents”, Aix-en-Provence, France, 15-16 May, 2002,
NEA/SEN/SIN/AMA(2002)16.

NEA/CSNI/R(2014)12
86
IAEA/NEA Technical Meeting, Pisa, November 2002
The meeting was convened to provide an international forum for the presentation and discussion of
selected topics related to various applications of CFD to NRS problems, with the intention to use the
material presented to identify further needs for investigation. There were 31 oral and 16 poster session
presentations, the principal areas covered being PTS, boron dilution, in-vessel mixing, in-vessel severe
accidents, containment studies, combustion and two-phase modelling. Presentations and papers are
available on CD-ROM.
Ref. 1: “Technical Meeting on the Use of Computational Fluid Dynamics (CFD) Codes for Safety
Analysis of Reactor Systems, including Containment”, IAEA-OECD/NEA Joint Meeting, Pisa,
Italy, 11-14 November, 2002.
OECD/CSNI Workshop in Barcelona 2000
This was the follow-up meeting to that held at Annapolis in 1996, and was intended to review the
developments in the areas which had been identified at that time for special focus, to analyse the present
status of current thermal-hydraulic and neutronics codes, and to evaluate the role of such tools in the
evolving regulatory environment. Though the focus of the meeting, as at Anaheim, remained on system
codes, some time was spent on the emerging role of CFD in NRS issues. In the findings and
recommendations, it was recognised that CFD involvement was required in areas where the details of local
flow behaviour was of importance, and identified thermal stratification and boron dilution as two such
areas.
It was recognised (GRS) that though CFD had its roots outside of the nuclear industry, it was
attractive to apply a product with proven capability and a large user community in reactor applications. Of
particular advantage is the fact that CFD can be readily applied in regions of geometric complexity, and
have the capability of modelling turbulence in those situations where it is the dominant flow mechanism,
such as for PTS or containment mixing. Everywhere it was emphasised that the major achievements of
CFD are for single-phase flows, and that considerable research effort needs to be expended on the physical
modelling side if this success is going to be extended to the two-phase flow situations relevant to NRS
problems. Some early advances are cited for dispersed flow and the simulation of nucleate boiling using
mechanistic models, and a “concerted action” within Germany was announced, involving research centres,
university institutes, GRS, a major code vendor and parts of industry, whereby the code ANSYS-CFX-5
would be further developed for the specific needs of the nuclear industry.
Also emphasised at the Workshop was the need to couple CFD modules with system codes, since it
was hardly feasible to model all reactor components using a CFD-type discretisation. Generally, it was
recognised that for some important transients (boron dilution and PTS) system codes introduced excessive
numerical diffusion, due to the use of first-order difference schemes and coarse meshes, that front-tracking
methods in these codes did not improve matters, and that CFD was needed to obtain reliable estimates of
the degree of flow mixing taking place.
Otherwise, the capabilities of CFD, and its proven worth in non-nuclear applications, was
acknowledged, but that considerably more work on two-phase modelling – meaning closure laws and
turbulence – was needed.
Ref. 1: Advanced Thermal-Hydraulic and Neutronic Codes: Current and Future Applications,
OECD/CSNI Workshop, Barcelona, Spain, 10-13 April, 2000, NEA/CSNI/R(2001)

NEA/CSNI/R(2014)12
87
5. ESTABLISHED ASSESSMENT BASES FOR NRS APPLICATIONS
5.1 Boron Dilution
Introduction
During boron-dilution events, a volume (slug) of boron-deficient water enters the reactor core after
start-up of the main circulation pump, or after recovery of natural circulation. In contrast to the PTS events
(see 5.2), the slug fills all the cold leg cross section, and flow rates are usually higher. Experiments
generally try to reproduce the mixing in the reactor downcomer and lower plenum, upstream of the reactor
core inlets. The main experimental facilities are ROCOM (FZD Rossendorf, Germany), modelling the
Konvoi reactor, OKB Gidropress (Russia), modelling the VVER-1000 reactor, and Vattenfall (Sweden),
modelling the Westinghouse three-loop reactor. Very detailed results are also available from a series of
tests carried out on the University of Maryland four-leg loop, which formed the basis of the OECD/NEA
International Standard Problem ISP-43. All these works are referenced at the end of the section, which also
cites associated CFD simulations.
University of Maryland experiments and corresponding simulations (ISP-43)
Under the terms of ISP-43, two sets of experiments performed on the University of Maryland facility
UM2x4 Loop were made available for numerical analysis. Originally, these for “blind” analyses, but
several post-test simulations have been published since then.
The UM2x4 Loop is a scaled down model of the Three Mile Island Unit 2, Babcock & Wilcox PWR.
Sixteen redundant Test A (front mixing test, with an infinite slug of cold water entering the RPV) and six
redundant Test B (slug mixing test, with a finite-volume slug of cold water entering the RPV) experiments
were performed. Quite detailed boundary conditions were provided for the analysts, and time histories of
temperatures at nearly 300 positions at eleven levels within the downcomer and lower plenum were
available. The problem with wall heat flux was resolved by application of an isolating paint on the wall
inner surfaces. The model of the RPV with positions of thermocouples marked is shown in Fig. 5-1.
In Fig. 5-2, a transparent replica of the metallic vessel, the Boron-Mixing Optical Vessel (B-MOV), is
also shown. This was used for velocity measurements and flow visualisations utilising Laser Induced
Fluorescence (LIF) techniques. Both “front injection” and “slug injection” classes of tests were conducted.
From the visualisation, the time development of flow patterns in both cases can be seen.

NEA/CSNI/R(2014)12
88
Fig. 5-1: UM 2x4 Loop RPV (integral vessel) and positions of thermocouples.
Figure 5-2: (a) B-MOV and (b) integral vessels
One aspect of the results analysed is the possible dependency of the flow pattern in the downcomer on
buoyancy. For Fr<6, the incoming flow penetrates downwards in a single jet, whereas for Fr>10 the flow
splits into two jets, forming a stagnation region under the point of injection. The two flow patterns were
even found for repeated “identical” runs in the critical Froude number range 6<Fr<10. The tests provided
very interesting results from visualisation of the flow, which can help in deciding the importance of
buoyancy in a given case.
Coolant
Flow Path
Coolant
Flow Path Cold Leg
Cold Leg Fake
Hot Leg
Hot Leg
Downcomer
(a) (b)
NEA/CSNI/R(2014)12
89
Ten participants from eight countries participated in the blind-calculation phase of the benchmark.
The CFD codes featured were ANSYS-CFX-4, ANSYS-CFX-TASCflow, FLUENT and TRIO-U. The
time history of the average temperature at the downcomer outlet was selected as the target variable for
code comparison. Major factors influencing results from the simulations include: choice made for the
solution domain (e.g., whether or not to include the core region), position of the outlet and selection of the
outlet boundary condition, buoyancy effects, temperature dependency of water properties, modelling of the
perforated bottom and core support plate, the distribution, size and type of mesh cells used, inlet boundary
condition (uniform velocity, velocity profile, turbulent intensity), turbulence model adopted, order of
discretisation schemes for the numerics, time step size, limits of convergence, etc. Comparison of the
results of computations with the measured data revealed considerable discrepancy, even among the users of
the same code. Some post-test analyses were also carried out, focusing on selected modelling issues such
as characteristics of porous-body modelling of the core barrel bottom and core support plates, importance
of buoyancy, mesh dependency, etc. It is to be hoped that such analyses will continue, and the results will
be made available to the public.
Ref. 1: Gavrilas, M., Hoehne, T.: OECD/CSNI ISP Nr. 43 Rapid Boron Dilution transient tests for code
verification post-test calculation with ANSYS-CFX-4. Wissenschaftlich-Technische Berichte.
Forschungszentrum Rossendorf FZR-325, Juli 2001.
Ref. 2: Gavrilas, M., Kiger, K.: OECD/CSNI ISP Nr. 43 Rapid Boron-Dilution Transient Tests for Code
Verification, September 2000.
Ref. 3: Gavrilas M., Scheuerer M., Tietsch W.: Boron mixing experiments at the 2x4 UMCP test facility.
Wechselwirkungen Neutronenphysik und Thermofluiddynamik. Fachtagung der KTG-
Fachgruppen “Thermo- und Fluiddynamik” und “Reaktorphysik und Berechnungsmethoden”.
Forschungszentrum Rossendorf, January 31 to February 1, 2000, Germany.
Ref. 4: Gavrilas, M., Kiger, K.: ISP-43: Rapid Boron Dilution Transient Experiment. Comparison Report.
NEA/CSNI/R(2000)22, February 2001.
Ref. 5: Gavrilas, M., Woods, B. G.: Fr number effects on downcomer flowpattern development in cold
leg injection scenarios. Proc. of ICONE10, Arlington 2002, ICONE10-22728.
ROCOM experiments (FLOMIX-R)
In 1998, the Rossendorf test facility ROCOM was constructed for the investigation of coolant mixing
phenomena in primary circuits of PWRs. ROCOM is a 1:5 scaled Plexiglas model of the German PWR
Konvoi, consisting of four loops, and with fully controllable coolant pumps. The facility is operated with
demineralised water at normal conditions. The coolant mixing is investigated by the injection of slugs of a
tracer solution (diluted salt) into the main flow of one loop. The salt concentration is measured by means of
wire mesh conductivity sensors with high resolution in time and space. Sensors are installed in the cold leg
inlet nozzle of the disturbed loop (256 measuring points), two in the downcomer, just below the inlet
nozzles and before the entrance into the lower plenum (2256 measuring points). The fourth sensor is
integrated into the lower core support plate and has one measuring position at each fuel element position.
Further, all four outlet nozzles was equipped with sensors (4256 measuring points). LDA was applied for
velocity measurements. The tracer concentration fields established by coolant mixing under stationary and
transient flow conditions were then investigated. A general view of the facility is in Fig. 5-3 and the
Plexiglas model is shown in Fig. 5-4.

NEA/CSNI/R(2014)12
90
Fig. 5-3: General view of the ROCOM facility.
Fig. 5-4: ROCOM Plexiglas model.
Four different groups of mixing scenarios were investigated:
1. Flow distribution measurements at constant flow rates in the primary circuit. The mass flow rate, the
number of operating loops, the status of non-operating loops (reverse flow or closed) and the friction
losses at the core inlet were all varied. These scenarios cover steam line break accidents. Averaged
data for a quasi-stationary state were used, to gain mixing coefficients at the core inlet. The
experiments showed that, even for the turbulent flow in the reactor vessel (downcomer, lower
plenum, core, upper plenum), the mixing of a disturbance in one loop remains incomplete for all the
cases investigated. For the case of four-loop operation, the influence of perturbations of temperature
or boron concentrations in one loop is mainly concentrated in the corresponding 90° sector of the

NEA/CSNI/R(2014)12
91
core inlet. Maximum mixing coefficients of about 90% were obtained in that case.
2. Slug mixing experiments with a change of the flow rate in one or several loops. This event might
happen during boron dilution transients by an inadvertent start of a main coolant pump, with coolant
having reduced boron concentration, or by start of natural circulation following refilling after a small
break LOCA. After start of a main coolant pump, the deborated coolant in the loop first appears at
the core inlet on the opposite side to injection. During the transient, the perturbation at the core inlet
moves gradually to the side of the disturbed loop. This behaviour is caused by secondary turbulent
vortices in the downcomer, whose structure has been measured using LDA.
3. Density-driven experiments, which correspond to scenarios with the injection of cold Emergency
Core Cooling (ECC) water (increased density) into the cold leg, and incomplete mixing on the way
to the core. The flow of coolant in the downcomer may lead to pre-stressed thermal shock events.
The critical values of the Froude Number for the transition from momentum-driven to density-driven
flow were determined. Mixing experiments with reduced density were also performed.
4. Mixing experiments for determining of the relation between temperature and boron dilution
distribution at the reactor outlet, i.e., the upper plenum, were also performed. For these, the coolant
from one certain fuel element to the sensors in the four outlet nozzles was measured. Experiments
for all fuel elements of a 90° symmetry sector of the core were performed and stationary mixing
coefficients at each of the 864 measuring points were determined. By means of these coefficients,
the temperature or boron dilution profile in the outlet nozzles can be reconstructed.
Matrix of slug mixing tests performed at the ROCOM test facility is in the following Table.
Run Ramp length
(s)
Final volume
flow rate
(m3/h)
Slug volume
(m3)*
Initial slug
position (m)*
Status of
unaffected
loops
ROCOM-01 14 185.0 40.0 10.0 Open
ROCOM-02 14 185.0 20.0 10.0 Open
ROCOM-03 14 185.0 4.0 10.0 Open
ROCOM-04 14 185.0 4.0 2.5 Open
ROCOM-05 14 185.0 4.0 22.5 Open
ROCOM-06 14 185.0 4.0 40.0 Open
ROCOM-07 14 185.0 20.0 10.0 Closed
ROCOM-08 28 92.5 4.0 10.0 Open
ROCOM-09 56 46.3 4.0 10.0 Open
ROCOM-10 14 148.0 4.0 10.0 Open
ROCOM-11 14 222.0 4.0 10.0 Open
ROCOM-12 14 185.0 8.0 10.0 Open
* related to the original reactor
A comprehensive knowledge base on mixing phenomena in nuclear power reactors and an
experimental database has been created around these experiments, which is well suited for CFD code
validation. Simulations been carried out using the codes ANSYS-CFX-4, ANSYS-CFX-5 and TRIO_U
using a variety of turbulence modelling options. The ANSYS-CFX-5 simulation used the RSM turbulence
model, whereas the TRIO_U simulation used an LES approach. It was concluded that both simulations
required approximately the same CPU time since ANSYS-CFX-5 used large time steps (implicit scheme),
but RSM requires the solution of many transport equations. The LES approach uses smaller time steps, but
a smaller number of equations is solved. The results of LES seem to be slightly better at both the upper and
lower downcomer planes. DES (Detached Eddy Simulation) approach will be tested in the next step.

NEA/CSNI/R(2014)12
92
Gidropress Facility (FLOMIX-R)
Three tests were performed on the OKB Gidropress experimental facility (Fig. 5-5) with different
final flow rates: 225 m3/h (6 runs), 640 m3/h (8 runs), and 800 m3/h (6 runs). Temperatures at the reactor
core inlet were measured and the results were provided to the FLOMIX-R participants. Selected tests were
then simulated within the FLOMIX-R project with the ANSYS-CFX-5 and FLUENT computer codes.
Some problems with uncertainty of the measured quantities (loop flow rates) and with probable, but
unknown, wall heat transfer caused differences between measured data and numerical predictions.
Improved results were obtained once the walls were explicitly modelled, but solution of conjugate heat
transfer problems is much more demanding in terms of computer memory and CPU time. This is probably
a common problem of all experiments where temperatures are measured.
Fig. 5-5: Gidropress facility – model of the reactor
Vattenfall Experiments (FLOMIX-R)
The Vattenfall experiments are similar to the OKB Gidropress tests; in both cases, a slug of finite
volume enters the reactor core. Measurements of concentrations at the “core” inlet and velocities in the
downcomer for four transient cases, VATT-01 (large slug), VATT-02 (medium-sized slug), VATT-03
(small slug) and VATT-04 (slow transient), were planned within the FLOMIX-R project.
NEA/CSNI/R(2014)12
93
Both steady-state (only velocity field calculated) and transient simulations were made for VATT-02
within the project by several groups using the FLUENT and ANSYS-CFX-5 codes. A schematic of the
facility is given in Fig. 5-5.
Fig. 5-5: Vattenfall test facility: reactor vessel
A matrix of the slug mixing tests is given in the following Table.
Run Ramp length
(s)
Final volume
flow rate
(m3/h)
Slug volume
(m3)*
Initial slug
position (m)*
Status of
unaffected
loops
VATT-01 16 429 14.0 10.0 Open
VATT-02 16 429 8.0 10.0 Open
VATT-03 16 429 4.5 10.0 Open
VATT-04 40 172.8 8.0 10.0 Open
* related to the original reactor
Thorough review of the boron dilution experiments has been undertaken. Reynolds number scaling
effects have been investigated, showing that the effects are quite small for the flow rates used in the tests. It
was concluded from the tests that the structures in lower plenum have a significant influence on the mixing
of the slug. Analysis of the tests for which concentration measurement, velocity measurement and
visualization for two different slug sizes and several Reynolds numbers were obtained was carried out
within the FLOMIX-R project.
Ref. 1: Alavyoon, K.: Numerical approach to rapid boron dilution transients for a PWR mock-up – I. Grid
dependence studies of the flow field. US 95:34, Vattenfall, 1995.

NEA/CSNI/R(2014)12
94
Ref. 2: Alavyoon, F., Hemstroem, B., Andersson, N.-G., Karlsson, R. I.: Experimental and computational
approach to investigating rapid boron dilution transients in PWRs. OECD Specialist Meeting on
Boron Dilution Reactivity Transients, State College, PA, USA, October 18-20, 1995.
Ref. 3: Almenas, K. K., Dahlgren, C. N., Gavelli, F., DiMarzo, M.: Numerical diffusion issues in the
evaluation of boron mixing using the COMMIX code. MD-NUME-98-02.
Ref. 4: Alvarez, D. et al.: Three-dimensional calculations and experimental investigations of the primary
coolant flow in a 900 MW PWR vessel. NURETH-5, Salt Lake City, Sept. 1992, Vol. II, pp. 586
– 592.
Ref. 5: Andersson N.G., Hemström B., Karlsson R.I. & Jacobson S. "Physical modelling of a Rapid
Boron Dilution Transient." Proceedings of Nureth 7, Saratoga Springs, USA, 1995.
Ref. 6: Bezrukov, Yu. A., Logvinov, S. A.: Some experimental results related to the fast boron dilution in
the VVER-1000 scaled model. Presented in the 3rd Workshop Meeting of the EUBORA project,
PSI, Switzerland, 1999 (internal EUBORA document).
Ref. 7: Bezrukov, Yu. A.: Documentation on slug mixing experiments of OKB Gidropress. Presented at
3rd FLOMIX-R Meeting, PSI, 2002 (FLOMIX-R internal document).
Ref. 8: Bieder U., Fauchet G., Bétin S., Kolev N., Popov D.: Simulation of mixing effects in a VVER-
1000 reactor. The 11th Int. Topical Meeting on Nuclear Reactor Thermal-Hydraulics (NURETH-
11), Avignon, France, October 2-6, 2005. Paper 201.
Ref. 9: Boros, I., Aszodi, A.: Numerical analysis of coolant mixing in the RPV of VVER-440 type
reactors with the code ANSYS-CFX-5.5.1. Technical Meeting on Use of Computational Fluid
Dynamics (CFD) Codes for Safety Analysis of Reactor Systems, Including Containment. Pisa,
Italy, 11-14 November 2002.
Ref. 10: C.R. Choi, T.S. Kwon and C.H. Song, “Numerical analysis and visualization experiment on
behavior of borated water during MSLB at the RCP running mode in an advanced reactor”,
Nuclear Engineering and Design, to appear.
Ref. 11: Dury, T.: CFD simulation of steady-state conditions in a 1/5th-scale model of a typical 3-loop
PWR in the context of boron dilution events. Technical Meeting on Use of Computational Fluid
Dynamics (CFD) Codes for Safety Analysis of Reactor Systems, Including Containment. Pisa,
Italy, 11-14 November 2002.
Ref 12: Elter, J.: Experimental investigation of thermal mixing phenomena in a six-loop VVER type
reactor vessel. Summary report.
Ref. 13: Gango, P.: Application of numerical modelling for studying boron mixing in Loviisa NPP.
OECD/CNSI Spec. Meeting on Boron Dilution Reactivity transients. State College PA USA, Oct.
18-20, 1995.
Ref. 14: Gango, P.: Numerical boron mixing studies for Loviisa nuclear power plant. Nucl. Eng. Design
177(1997), 239-254.
Ref. 15: Gavrilas, M., Hoehne, T.: OECD/CSNI ISP Nr. 43 Rapid Boron Dilution transient tests for code
verification post-test calculation with ANSYS-CFX-4. Wissenschaftlich-Technische Berichte.
Forschungszentrum Rossendorf FZR-325, Juli 2001.
Ref. 16: Gavrilas, M., Kiger, K.: OECD/CSNI ISP Nr. 43 Rapid Boron-Dilution Transient Tests for Code
Verification, September 2000.
Ref. 17: Gavrilas M., Scheuerer M., Tietsch W.: Boron mixing experiments at the 2x4 UMCP test facility.
Wechselwirkungen Neutronenphysik und Thermofluiddynamik. Fachtagung der KTG-
Fachgruppen “Thermo- und Fluiddynamik” und “Reaktorphysik und Berechnungsmethoden”.
Forschungszentrum Rossendorf, January 31 to February 1, 2000, Germany.
Ref. 18: Gavrilas, M., Kiger, K.: ISP-43: Rapid Boron Dilution Transient Experiment. Comparison Report.
NEA/CSNI/R(2000)22, February 2001.

NEA/CSNI/R(2014)12
95
Ref. 19: Gavrilas, M., Woods, B. G.: Fr number effects on downcomer flowpattern development in cold
leg injection scenarios. Proc. of ICONE10, Arlington 2002, ICONE10-22728.
Ref. 20: Grunwald, G., Hoehne, T., Kliem, S., Prasser, H.-M., Rohde, U.: Status report on R&D activities
on boron dilution problems. Presented at the 1st EUBORA project Meeting, Vantaa, Finland, 1998
(EUBORA internal document).
Ref. 21: Grunwald, G., Hoehne, T., Prasser, H.-M.: Investigation of coolant mixing in pressurized water
reactors at the Rossendorf mixing test facility ROCOM. 8th International Conference on Nuclear
Engineering (ICONE8), Baltimore, USA, 2000.
Ref. 22: Grunwald, G.; Höhne, T.; Kliem, S.; Prasser, H.-M.; Rohde, U.; Weiß, F.-P. (2002): Experiments
and CFD Calculations on Coolant Mixing in PWR – Application to Boron Dilution Transient
Analysis. TECHNICAL MEETING on Use of Computational Fluid Dynamics (CFD) Codes for
Safety Analysis of Reactor Systems, including Containment, Pisa, Italy, 11–15 November 2002
Ref. 23: Grunwald, G.; Höhne, T.; Kliem, S.; Prasser, H.-M.; Rohde, U.; Weiß, F.-P.: Coolant mixing
studies for the analysis of hypothetical boron dilution transients in a PWR, 11th International
Conference on Nuclear Engineering ICONE-11, Tokyo, Japan, April 2003
Ref. 24: Hemstroem B. et al.: Validation of CFD codes based on mixing experiments (Final report on
WP4). EU/FP5 FLOMIX-R Report, FLOMIX-R-D11, Vattenfall Utveckling (Sweden), 2005.
Ref. 25: Hemstroem, B., Andersson, N.-G.: Physical modelling of a rapid boron dilution transient. The
EDF case. Report VU-S 94:B16, Vattenfall 1994.
Ref. 26: Hemstroem, B., Andersson, N.-G.: Physical modelling of a rapid boron dilution transient. – I.
Reynolds number sensitivity study for the Ringhals case. Report US 95:5, Vattenfall 1995.
Ref. 27: Hemstroem, B., Andersson, N.-G.: Physical modelling of a rapid boron dilution transient – II.
Study of the Ringhals case, using a more complete model. Report US 97:20, Vattenfall 1997.
Ref. 28: Hoehne T.: Numerical modelling of a transient slug mixing experiment at the ROCOM test
facility using ANSYS-CFX-5. The 11th Int. Topical Meeting on Nuclear Reactor Thermal-
Hydraulics (NURETH-11), Avignon, France, October 2-6, 2005. Paper 481.
Ref. 29: Hoehne, T., Grunvald, G., Rohde, U.: Coolant mixing in Pressurized Water Reactors. Proc. of the
8th AER Symposium on VVER Reactor Physics and reactor Safety, Bystrice nad Pernstejnem,
Czech Republic, September 21 – 25, 1998.
Ref. 30: Hoehne T., Kliem S., Bieder U.: Modelling of a buoyancy-driven flow experiment at the ROCOM
test facility using the CFD codes ANSYS-CFX-5 and Trio_U. Nucl. Eng. Design 236 (2006)
1309-1325.
Ref. 31: Hoehne, T., Rohde, U., Weiss, F.-P.: Experimental and numerical investigation of the coolant
mixing during fast deboration transients. 9th AER Symposium on VVER reactor physics and
reactor safety, Demanovská Dolina, Slovakia, Oct. 4-8, 1999.
Ref. 32: Kiger, K. T., Gavelli, F.: Boron mixing in complex geometries: flow structure details. Nucl.
Engineering and Design 208 (2001), 67 – 85.
Ref. 33: Kim, J. H.: Analysis of Oconee Unit 1 downcomer and lower plenum thermal mixing tests using
COMMIX-1A. EPRI NP-3780, November 1984.
Ref. 34: Kliem, S., Hoehne, T., Weiss, F.-P., Rohde, U.: Main Steam Line Break analysis of a VVER-440
reactor using the coupled thermohydraulics system/3D-neutron kinetics code DYN3D/ATHLET
in combination with the CFD code ANSYS-CFX-4. NURETH 9, San Francisco, USA 1999.
Ref. 35: Menant, B: Simulations numériques fines de la thermohydraulique monophasique des circuits
primaires de Réacteurs à Eau Pressurisée.Cours INSTN CEA Grenoble « Ecoulements et
transferts de chaleur monophasiques » 20-24 mars 2000.
NEA/CSNI/R(2014)12
96
Ref. 36: Prasser, H.- M.; Grunwald, G.; Höhne, T.; Kliem, S.; Rohde, U.; Weiss, F.-P.: Coolant mixing in a
PWR - deboration transients, steam line breaks and emergency core cooling injection -
experiments and analyses, Nuclear Technology 143 (2003) 37 – 56.
Ref. 37: Rohde, U., Kliem, S. Toppila, T., Hemstroem, B., Cvan, M., Bezrukov, Y., Elter, J., Muehlbauer,
P.: Identification of mixing and flow distribution key phenomena. FLOMIX-R Project Deliverable
D2 (internal document). 2002.
Ref. 38: Rohde U., Kliem S., Hoehne T., Prasser H.-M., Hemstroem B., Toppila T., Elter J., Bezrukov Y.,
Scheuerer M.: Measurement data base on fluid mixing and flow distribution in the reactor circuit.
The 11th Int. Topical Meeting on Nuclear Reactor Thermal-Hydraulics (NURETH-11), Avignon,
France, October 2-6, 2005. Paper 258.
Ref. 39: Rohde U., Kliem S., Hoehne T., Karlsson B., Hemstroem B., Lillington J., Toppila T., Elter J.,
Bezrukov Y.: Fluid mixing and flow distribution in the reactor circuit, measurement data base.
Nucl. Eng. Design 235 (2005a) 421-443.
Ref. 40: Schaffrath A., Fischer K.-C., Hahn T., Wussow S.: Validation of the CFD code FLUENT by post
test calculation of the ROCOM experiment T6655_21. The 11th Int. Topical Meeting on Nuclear
Reactor Thermal-Hydraulics (NURETH-11), Avignon, France, October 2-6, 2005. Paper 141.
Ref. 41: Scheuerer, M.: Numerical simulation of OECD/NEA International Standard Problem No. 43 on
Boron Mixing in a Pressurized Water Reactor. Report GRS GmbH.
Ref. 42: Scheuerer, M.: Simulation of OECD/NEA International Standard problem No. 43 on boron
mixing transients in a pressurized water reactor. Technical Meeting on Use of Computational
Fluid Dynamics (CFD) Codes for Safety Analysis of Reactor Systems, Including Containment.
Pisa, Italy, 11-14 November 2002.
Ref. 43: Tinoco, H., Hemstroem, B., Andersson, N.-G.: Physical modelling of a rapid boron dilution
transient. Report VU-S 93:B21, Vattenfall 1993.
Ref. 44: Toppila, T.: Experiences with validation of CFD methods for pressure vessel downcomer mixing
analyses. Technical Meeting on Use of Computational Fluid Dynamics (CFD) Codes for Safety
Analysis of Reactor Systems, Including Containment. Pisa, Italy, 11-14 November
2002.Lillington, J. N. (ed.): PHARE Project PH2.08/95 Prevention of Inadvertent Primary Circuit
Dilution. Report AEAT – 4026, Issue 2, January 1999.
Ref. 45: Um, K. – S., Ryu, S. – H., Choi, Y. - S., Park, G. – C.: Experimental and computational study of
the core inlet temperature pattern under asymmetric loop conditions. Nucl. Technology 125
(1999), 305 – 315.
Ref. 46: Umminger, K., Kastner, W., Liebert, J., Mull, T.: Thermal hydraulics of PWRS with respect to
boron dilution phenomena. Experimental results from the test facilities PKL and UPTF. Nucl.
Eng. Design 204 (2001) 191 – 203.
5.2 Pressurised Thermal Shock
A review of PTS-relevant experiments and numerical simulations should start with a quote from the
document entitled “Guidelines on Pressurized Thermal Shock Analysis for WWER Nuclear Power Plants.
Rev. 1”, AEA-EBP-WWER-08, Dec. 2001:
An important feature of some PTS transients is flow stagnation in the primary circuit. In such a case,
the flow distribution is governed by buoyancy forces, i.e. thermal stratification and mixing of cold high-
pressure injection water to the cold legs become dominant effects. These phenomena are not predicted
correctly with the existing thermal hydraulic system codes.
An extensive experimental database exists for thermal fluid mixing that is relevant to PTS issue,
Theofanous, Yan (1991). In this document, the following facilities and experimental runs are summarized:
NEA/CSNI/R(2014)12
97
Creare 1:5 (Tests 100, 101, 103, 104, 106) and 1:2 (tests May 105, May 106), USA
IVO (FORTUM) 2:5 (Tests T9, T10, T12, T16, T44, T45, T47, T51, T106, T111 to T116), Finland
Purdue 1:2 (Runs 0-1C, 0-1C-R, 0IV, 0-2C, 0-2C-R, 0-2V, CE-1C, W-1C,B&W-1C, CE-2C, W-1C-
90, CE-1C-PS, CE-3C-0), USA
HDR 1:1 (Tests T32.11 to T32.15, T32.18 to T32.22, T32.31 to T32.34, T32.36, T32.41, T32.51,
T32.52, T32.57, T32.58, T32.61), Germany
UPTF 1:1 (Runs 020, 021, 023, 025, 026), Germany
According to the ECORA Best Practice Guidelines, experimental data for validation of a CFD code
should be complete (geometry, boundary and initial conditions, well analysed as to the physical
phenomena involved), high quality (accurate within given error bounds, repeatable, consistent) and
publicly available. The data in this database are available only in graphical form; and there are only
references to reports with the detailed descriptions of geometry and instrumentation. The document is
intended for validation of the REMIX/NEWMIX computer codes, so only limited data are present. In the
present form, the database does not meet the BPG for validation of a CFD computer code, but could be
used for demonstration computations. For validation, the original reports referenced in the Theofanous,
Yan (1991) and cited below must be used.
The following reports describe the CREARE 1:5 tests: Rothe, Ackerson (1982), Fanning, Rothe
(1983), Rothe, Marscher (1982) and Rothe, Fanning (1982, 1983).
IVO (FORTUM) tests are described in Mustonen (1984), Tuomisto, Mustonen (1986, 1986a),
Tuomisto (1986) and Tuomisto (1987).
Tests on the Purdue facility are described in Theofanous et al. (1984), Iyer et al. (1984), Iyer,
Theofanous (1991), Theofanous et al. (1986), Theofanous et al. (1984) and Iyer (1985).
For the CREARE 1:2 test, the following reports are available: Dolan, Valenzuela (1985), and
Valenzuela, Dolan (1985).
Some HDR tests are described in Wolf et al. (1984, 1986), Wolf, Schygulla (1985) and Tenhumberg,
Wenzel (1985). Further information on experimental results from HDR facility is in Theofanous et al.
(1992).
Reports on some UPTF tests are: Sarkar, Liebert (1985), Weiss (1986, 1986a) and Weiss et al. (1987,
1987a).
Some characteristics of selected experimental facilities mentioned above are in Table 4.1, taken over
from Wolf et al. (1988).
Creare 1:5 Purdue 1:2 Creare 1:2 IVO 2:5 HDR 1:2, 1:4
Scaling Froude 1:5 Froude 1:2 Froude; 1:2 Froude; 1:2.56 Froude; 1:2, 1:4
Cold leg diameter (mm) 143 343 363.5 194 190
Downcomer geometry planar planar planar semi-annular annular, complete RPV
Downcomer gap (mm) 46 127 137.2 61c 150
Downcomer width (mm) 670 1180 1616 1840
HPI-nozzle (mm) 51 top 108 top 20.9 top 27 bottom 50
2 nozzles top
1 nozzle side
No of cold legs 1 1 1 3 1

NEA/CSNI/R(2014)12
98
During a PTS, several more local physical processes can be seen. The corresponding physical models
must be validated. A list of such phenomena is contained in Scheuerer (2002) and Pigny (2002). The list is
reproduced here since the selected suitable validation experiments should cover at least one of the items of
the list:
impingement of single-phase flow jets;
impingement of two-phase jets;
impinging jet heat transfer;
turbulent mixing of momentum and energy in and downstream of the impingement zone;
stratified two-phase flow (or free surface flow) within ducts;
phase change at the steam-water interface (condensation, evaporation);
rapid transients.
According to the verification and validation philosophy adopted within the ECORA project, also
carefully selected separate effect tests were admitted for code verification. Then, the following (single-
phase) verification tests were selected, Scheuerer (2002):
gravitational oscillations of water in a U-shaped tube, see Ransom (1992)
centralized liquid sloshing in a cylindrical pool, see Maschek et al. (1992)
single-phase water hammer, see Simpson (1989)
As a single-phase validation test, the following experiment was selected:
axisymmetric single-phase air jet in air environment, impinging on a heated flat plate, see Baughn,
Shimizu (1989).
Validation simulations performed within the ECORA project are summarized in the report Egorov
(2004), which is available at http://domino.grs.de/ecora/ecora.nsf, Public Docs.
Another region with possible substantial mixing is the sudden change of the reactor downcomer
width. This situation is close to the classic CFD benchmark – the backward-facing step. The relevant
experimental data can be found in Armaly et al. (1983), and some indications are also in Freitas (1995).
For low-Reynolds number situations, DNS data in Lee, Moin (1992) can be also used.
Some further relevant literature on experiments with vertical buoyant plumes or jets is in Kotsovinos
(1975) and in Chen, Rodi (1980).
Experimental data on normally impinging jet from a circular nozzle is available in the ERCOFTAC
database – Classic Collection. The relevant paper is Cooper et al. (1993).
IVO (FORTUM) test facility
Within the FLOMIX-R project (5th EU Framework Programme), the computer codes FLUENT and
ANSYS-CFX were validated against Tests 10, 20 and 21, from the IVO (FORTUM) test facility; see
Rohde et al. (2004). A diagram of the FORTUM PTS test facility is shown below. Experimental results
from IVO (FORTUM) test facility can also be found in Tuomisto (1987a) from which the Table below
showing the test matrix of the thermal mixing programme is reproduced. Later, the facility was
reconstructed within the IVO – USNRC PTS information exchange and now has asymmetric orientation of
the cold legs and injection nozzles at the top of the cold legs.

NEA/CSNI/R(2014)12
99
test
n°
QHPI
l/s
QL,A
l/s
QL,B
l/s
QL,C
l/s
FrCL,
HPI
salinity
Δρ/ρ
3 2.31 0 1.87 0 0.379 0.02
4 2.31 1.87 1.87 1.87 0.376 0.02
7 2.02 1.87 1.87 1.87 0.129 0.16
8 2.00 0 1.87 0 0.129 0.16
9 2.02 0 0 0 0.130 0.16
10 2.31 0 0 0 0.147 0.16
12 0.62 0 0 0 0.040 0.16
13 0.62 0.62 0.62 0.62 0.040 0.16
14 0.62 0 0.62 0 0.039 0.16
15 0.62 1.87 1.87 1.87 0.040 0.16
16 0.31 0 0 0 0.020 0.16
19 0.10 0.3 0 0.3 0.006 0.16
20 2.31 1.87 0 1.87 0.146 0.16
21 2.31 1.87 1.87 1.87 0.147 0.16
22 4.0 2.0 0 2.0 0.253 0.16
23 0.20 0.3 0 1.0 0.013 0.16
26 0.62 1.0 0 1.5 0.096 0.02
27 0.62 0.62 0.62 0.62 0.101 0.02
28 0.20 0.3 0 1.0 0.032 0.02
30 1.25 1.87 0 1.87 0.202 0.02
31 0.62 1.87 0 1.87 0.100 0.02
32 0.10 0.3 0 0.3 0.016 0.02
33 4.0 2.0 0 2.0 0.646 0.02
34 1.25 1.87 0 1.87 0.126 0.06
35 2.31 1.87 0 1.87 0.188 0.10
36 0.62 1.87 0 1.87 0.050 0.02
38 1.25 1.87 0 1.87 0.102 0.02
40 0.20 0.3 0 1.0 0.016 0.02
41 1.25 1.87 0 1.87 0.080 0.13
42 1.25 1.87 0 1.87 0.080 0.16
43 4.0 2.0 0 2.0 0.323 0.02
44 4.0 0 0 0 0.324 0.02
45 4.0 0 0 0 0.255 0.16
46 3.0 2.0 0 2.0 0.477 0.02
47 4.0 0 0 0 0.644 0.02
48 2.0 1.87 0 1.87 0.318 0.02
49 2.31 1.87 0 1.87 0.366 0.02
50 0.62 0 0.62 0 0.100 0.02
The original facility was constructed for study of thermal
mixing phenomena in the Loviisa VVER-440 reactor during
overcooling transients. It represents a 2:5 scale model of one
half of the Loviisa reactor downcomer, with three loops and
bottom injection into one loop. The pictures of cold plumes
reproduced here are taken from Toppila (2002).
Gango (1995) validated the PHOENICS code against data
from these tests. Since the facility is made of transparent
material with limited maximum temperature difference, salt
was added in some runs to increase the density differences.
Three tests were selected for validation: Test 22 and Test 33
differed by FrCL,HPI and salinity; Test 47 was performed with
stagnated loop flow (see Table). Altogether, nine variants of
computations were performed, differing in inlet turbulent
intensity, order of the discretization of convection terms, time
step, and turbulent Prandtl number.
Mixing Test 20 was analysed by Toppila (2002). The model
he used had 283000 cells and included also the cold legs with
safety injection line. The thermal stratification in the cold leg
and reactor downcomer was examined, and the asymmetrical
stratification under the cold leg corresponds to the
experimental results.

NEA/CSNI/R(2014)12
100
51 2.31 0 0 0 0.372 0.02
52 0.62 0 1.87 0 0.100 0.02
UPTF facility
Within the ECORA project, two almost industrial-scale tests were proposed, based on the UPTF
experimental facility: UPTF Test 1, and UPTF Test 8 (this test case is available in the OECD/NEA Data
Bank http://www.oecd-nea.org/html/dbprog/ccvm/). A schematic of this facility is given here
The UPTF Test 1 was simulated by Willemsen, Komen (2005). In this test, the primary system was
initially filled with stagnant hot water at 190°C. The cold ECC water, at 27°C, was injected into one cold
leg with mass flow rate of 40 kg/s. The authors found that the location of the cold plume along the
downcomer thickness depended on modelling of buoyancy as well as on other modelling details. For
example, inclusion of detailed models of internals, which should improve the results since it is closer to
reality, led to the cold ECC water flowing primarily along the core barrel, whereas an alternating hot and
cold fluid was seen to pass the core barrel and vessel wall in the experiment. As a result, the cooling of the
RPV wall is significantly underestimated in the computation (by about 50%). These, of course, represent
non-conservative results, and should be ignored.
ROCOM test facility
As mentioned in Chapter 3, some experiments with simulated ECC cold water injection were
performed in the ROCOM facility. Higher density of water was obtained by addition of glucose, and
sodium chloride was used as the tracer. Mass flow was varied between 0 and 15% of the nominal flow rate
(the order of magnitude of natural circulation); the density difference was between 0 and 10%. Altogether,
18 experiments were performed, covering density-dominated flows, momentum-dominated flows, and the
transition region. A short description of the experiments and numerical simulation of one case with the
ANSYS-CFX-5 computer code can be found in Hoehne et al. (2005). Experiments are also described in
Rohde et al. (2005), as mentioned in Chapter 3.
APEX Test Facility
The APEX Test Facility at Oregon State University (OSU) was used to perform a series of separate
effects and integral systems overcooling tests that examine the conditions that lead to primary loop
stagnation and cold leg thermal stratification, see Reyes et al. (2001). The thermal hydraulic phenomena of

NEA/CSNI/R(2014)12
101
specific interest are the onset of loop stagnation, the onset of thermal stratification in the cold legs, and
characterization of thermal fluid mixing and heat transfer in the downcomer. The former design of the
facility was based on the Westinghouse AP600 reactor and a summary of the non-proprietary results is
given in Reyes et al. (1999). The present facility APEX-CE simulates the Combustion Engineering
Palisades NPP. The modification included the addition of four cold-leg loop seals and HPI nozzles.
The objective of the APEX-CE experimental program was the removal of some conservatism and
uncertainties in the earlier PTS study at OSU: like more realistic prediction of the onset of loop stagnation,
and effects of asymmetric loop flow. Careful scaling based on PTS phenomena and identification ranking
table (PIRT) should ensure that the tests on APEX-CE facility adequately simulate the basic PTS
phenomena on the Palisades NPP: natural circulation, primary system depressurisation, secondary system
depressurisation, and thermal fluid mixing in the cold legs and downcomer. Both integral system and
separate effect tests have been planned. The integral system tests include a series of main steam-line break
(MSLB) tests, small hot leg loss-of-coolant accidents (SBLOCAs), and stuck open pressurizer PORV tests.
These tests were performed to examine their potential for overcooling the primary side. The conditions for
the onset of loop stagnation will be identified and the primary side pressure and temperature time course
will be recorded. The separate effect tests will examine the details of cold leg and downcomer fluid mixing
under low and stagnant primary loop flow conditions. Fluid temperature profiles in the cold leg and
downcomer will be measured as well as the local heat flux and wall temperatures. The data have been
analysed using the RELAP5, STAR-CD and REMIX computer codes.
Young, Reyes (2001) compare STAR-CD calculations with APEX-CE test data. Two parametric tests,
OSU-CE-0003E and OSU-CE-0003G were selected for the comparison. During the tests, there was natural
circulation in the cold leg. The computational model consisted of 839 348 cells and included two cold legs
with loop seal, reactor downcomer and lower plenum. The computed results compared well with the
APEX-CE data.

NEA/CSNI/R(2014)12
102
One interesting problem connected to the thermal-hydraulic analyses of the pressurized thermal shock
is the possibility of interaction of the neighbouring cold plumed in the reactor downcomer. Such
interaction was observed in the IVO (FORTUM) tests and was studied also on the APEX-CE facility. In
the experiments Tokuhiro, Kimura (1999) with interaction of a vertical non-buoyant jet and two parallel
buoyant jets, such interaction (merging) is visible – even when the “hot” jets are separated with the “cold”
one. That has one important implication: classic analyses of PTS with the REMIX codes taking into
account only one cold plume could be non-conservative.
Other simulations
In 1997, preliminary announcement of Pressurized Thermal Shock International Comparative Study
was released at OECD-NEA CSNI PWG-3 Intermediate Workshop in Paris, June 2-3, 1997. The problem
statement was distributed in December 1996 and the term for submission of final results was October 1997.
In the Task group THM (Thermal Hydraulic Mixing), a scenario with transient due to a 200 cm2 leak in a
hot leg of a 1300 MW 4 loop PWR was selected. The plant was fictitious, but some data from UPTF were
adopted. Two tasks, Task PMIX (influence of different minimum downcomer water levels) and Task PINJ
(influence of reduced emergency cooling water injection rate) were proposed. Distribution of water
temperature and heat transfer coefficients in the downcomer was required. Only one CFD analysis was
performed, that of Scheuerer (1998) who analysed the Task PINJ with TASCflow code. 180 000 cells were
used with adiabatic outer walls and conjugate heat transfer model. Up to 4000s of the transient were
calculated with an average time step size of 50s (8 iterations per step for convergence). No comparison
with experiments was made in this scoping study, but some conclusions were formulated: buoyancy effects
should be considered, and variable properties of water should be used.
A specific aspect of overcooling transients, oscillatory natural circulations during SB-LOCA
overcooling transients in a PWR when cold water is injected into cold leg loop seals was tested in
REWET-III facility, as described in Miettinen et al. (1987) and in Tuomisto (1987a).
Menant, Latrobe (2003) described an application of the TRIO-U CFD code to the computation of the
transient flow in the real geometry of a 3 loop PWR. The part from the pump to core inlet was modelled
with boundary conditions produced by CATHARE runs and a very detailed representation of the geometry
(1.5 million nodes). Dynamic Smagorinsky SGS model was used, with 2nd
order discretization in space,
3rd
order discretization in time. The computation lasted 4500 hours on Compaq IXIA supercomputer,
20 processors were used in parallel. The computation had a character of a feasibility study, and no
sensitivity study in the sense of the ECORA Best Practice guidelines could be performed.
In www.usnrc.gov/reading-rm/doc-collections/acrs/tr/subcommittee/2001/th010717.html, the website
of the NRC, and th010718.html, there is very lengthy transcription of discussion which took place during
an Advisory Committee on Reactor Safeguards, Thermal Hydraulic Phenomena Subcommittee Meeting in
Corvallis, Oregon, US. The subject of this meeting was an overview of the Oregon State University
Nuclear Reactor Research in the field of PTS. Both numerical (RELAP5, REMIX, STAR-CD) and
experimental (APEX-CE) programs were discussed, including many visualisations. Next two references
are in fact based on the discussed issues.
Haugh, Reyes (2001) applied STAR-CD computer code to CREARE one-half scale facility
representing a 90°planar section of downcomer, core barrel, and lower plenum with cold leg, pump and
loop seal. Only basic features of mixing after ECCS injection into the cold leg were studied. The solution
domain does not correspond to the domain recommended by the Regional Mixing Model. The initial
conditions were taken from the MAY 105 test with one stagnant loop, and three sensitivity calculations
NEA/CSNI/R(2014)12
103
were performed to assess the effect of wall heat transfer. The benchmark indicated that the STAR-CD
predicted well the type of mixing phenomena associated with PTS.
Yoon, Suh (1999) used the ANSYS-CFX code to analysis the effect of direct vessel injection on the
Korean next generation reactor RPV shell temperature. Both steam and water in reactor vessel were
considered for comparison. A similar computation is described by Matarazzo, Schwirian (1998).
Yoo, Jeon (2002) simulated four test cases with two or one jets flowing into a circular tube. The main
goal of the tests was thermal striping (two parallel jets, cases A and B), but the cases C and D are suitable
for PTS, since one jet flows into the tube either from below (case C) or from the top (case D). Three
different RANS turbulence models were used: k-ε, l-k- ε, and full RSM model. The results were compared
with simulations using the VLES (Very Large Eddy Simulation) approach. Since only limited measured
data on the simulated cases are available, no definite conclusions have been formulated so far.
Boros, Aszodi (2002) performed a numerical analysis of coolant mixing in the downcomer of a
VVER-440 type reactor with the code ANSYS-CFX-5.5.1.
Ref. 1: Armaly, B. F., Durst, F., Pereira, J. C. F., Schonung, B.: Experimental and theoretical
investigation of backward-facing step flow. J. Fluid Mechanics 127 (1983) 473 – 496.
Ref. 2: Baughn, J. W., Shimizu, S. S.: Heat transfer measurements from a surface with uniform heat flux
and a fully developed impinging jet. J. of Heat Transfer 111 (1989) 1096 – 1098.
Ref. 3: Boros, I., Aszodi, A.: Numerical analysis of coolant mixing in the RPV of VVER-440 type
reactors with the code ANSYS-CFX-5.5.1. Technical Meeting on Use of Computational Fluid
Dynamics (CFD) Codes for Safety Analysis of Reactor Systems, Including Containment. Pisa,
Italy, 11-14 November 2002.
Ref. 4: Chen, C. J., Rodi, W.: Vertical turbulent buoyant jets. A review of experimental data. Pergamon
Press 1980.
Ref. 5: Cooper, D., Jackson, D. C., Launder, B. E., Liao, G. X.: Impinging jet studies for turbulence
model assessment. Part I: Flow-field experiments. Int. J. Heat Mass Transfer 36 (1993) 2675 –
2684.
Ref. 6: Dolan, F. X., Valenzuela, J. A.: Thermal and fluid mixing in ½-scale test facility. Vol. 1 –
Facility and test design report. EPRI NP-3802, NUREG/CR-3426, September 1985.
Ref. 7: Egorov Y.: Validation of CFD codes with PTS-relevant test cases. ECORA deliverable 2004,
ECORA web page http://domino.grs.de/ecora/ecora.nsf, Public Docs.
Ref. 8: Fanning, M. W., Rothe, P. H.: transient cooldown in a model cold leg and downcomer. EPRI
NP-3118, May 1983.
Ref. 9: Freitas, C. J.: Perspective: Selected benchmarks from commercial CFD codes. Trans. ASME, J.
Fluids Eng. 117 (1995) 208 – 218.
Ref. 10: Gango, P.: Application of numerical modelling for studying boron mixing in Loviisa NPP.
OECD/CNSI Spec. Meeting on Boron Dilution Reactivity transients. State College PA USA,
Oct. 18-20, 1995.
Ref. 11: Haugh, B., Reyes, J. N.: The use of STAR-CD to assess thermal fluid mixing in PWR geometry.
Trans. ANS 85 (2001), 253 – 254.
Ref. 12: Hoehne T., Kliem S., Scheuerer M.: Experimental and Numerical Modelling of a Buoyancy-
driven flow in a reactor pressure vessel. The 11th Int. Topical Meeting on Nuclear Reactor
Thermal-Hydraulics (NURETH-11), Avignon, France, October 2-6, 2005. Paper 480.
Ref. 13: Hsu, J.-T., Ishii, M., Hibiki, T.: Experimental study on two-phase natural circulation and flow
termination in a loop. Nucl. Eng. Design 186 (1998) 395 – 409.
NEA/CSNI/R(2014)12
104
Ref. 14: Iyer, K. N.: Thermal hydraulic mixing in the primary system of a pressurized water reactor
during high pressure safety injection under stagnant loop conditions. PhD Thesis, Purdue
University, December 1985.
Ref. 15: Iyer, K., Gherson, P., Theofanous, T. G.: PURDUE’s one-half-scale high pressure injection
mixing tests. Proc. 2nd Nuclear Thermal-Hydraulics Meeting of ANS, New Orleans, June 3-7,
1984, pp. 859-861.
Ref. 16: Iyer, K., Theofanous, T. G.: Decay of buoyancy driven stratified layers with applications to PTS:
Reactor predictions. ANS Proc. 1985 National Heat Transfer Conf., Denver, CO, August 4-7,
1985, vol. 1, pp. 358. Nucl. Sci. Eng. 108 (1991), No. 2.
Ref. 17: Kotsovinos, N. E.: A study of the entrainment and turbulence in a plane buoyant jet. PhD thesis,
California Institute of Technology, 1975.
Ref. 18: Lee, H., Moin, P.: Direct numerical simulation of turbulent flow over a backward-facing step.
Stanford Univ. Center for Turbulence Research, Annual Research Briefs 1992, pp. 161 – 173.
Ref. 19: Maschek, W., Roth, A., Kirstahler, M., Meyer, L.: Simulation experiments for centralized liquid
sloshing motions. Kernforschungszentrum Karlsruhe, report Nr. 5090, 1992.
Ref. 20: Matarazzo, J. C., Schwirian, R. E.: CFD analysis of a direct vessel injection (DVI) transient to
calculate AP600 reactor vessel shell temperature. Proc. ASME Nuclear Engineering Division,
NE vol. 22, 1-7, 1998.
Ref. 21: Menant, B., Latrobe, A.: LES interpretation of single phase PTS following the injection of under
saturated water in the cold leg of a 3 loops PWR. Private communication, 2003.
Ref. 22: Miettinen, J., Kervinen, T., Tuomisto, H., Kanter, H.: Oscillations of single-phase natural
circulation during overcooling transients. ANS Topical Meeting, Atlanta, April 12.15, 1987.
Ref. 23: Mustonen, P.: Fluid and thermal mixing tests of the Loviisa pressure vessel downcomer. Report
IVO, Helsinki, April 1984.
Ref. 24: Pigny, S.: Description of selected test cases and physical models. Internal ECORA document,
CEA-DRN-DTP, Grenoble 2002.
Ref. 25: Ransom, in Hewitt, G. F., Delhaye, J. M., Zuber, N. (eds.): Multiphase Science and Technology.
9 (1992) 591 – 609.
Ref. 26: Reyes, J. N., Groome, J. T., Lafi, A. Y., Franz, S. C., Rusher, C., Strohecker, M, Wachs, D.,
Colpo, S., Binney, S.: Final report of NRC AP600 research conducted at Oregon State
University. US Nuclear Regulatory Commission, NUREG-CR-6641, August 1999.
Ref. 27: Reyes, J. N., Groome, J. T., Lafi, A. Y., Wachs, D., Ellis, C.: PTS thermal hydraulic testing in
the OSU APEX facility. Int. J. Pressure Vessels and Piping 78 (2001), 185-196.
Ref. 28: Rohde, U. et al.: Validation of CFD Codes Based on Mixing Experiments. Final Report of the
Work Package 4 of the FLOMIX-R Project, 2004.
Ref. 29: Rothe, P. H., Ackerson, M. F.: Fluid and thermal mixing in a model cold leg and downcomer
with loop flow. EPRI NP-2312, April 1982.
Ref. 30: Rothe, P. H., Fanning, M. W.: Evaluation of thermal mixing data from a model cold leg and
downcomer. EPRI NP-2773, December 1982.
Ref. 31: Rothe, P. H., Fanning, M. W.: Thermal mixing in a model cold leg and downcomer at low flow
rates. EPRI NP-2935, March 1983.
Ref. 32: Rothe, P. H., Marscher, W. D.: Fluid and thermal mixing in a model cold leg and downcomer
with vent valve flow. EPRI NP-2227, March 1982.
Ref. 33: Sarkar, J., Liebert, J.: UPTF test instrumentation; measurement system identification,
engineering units and computed parameters. KWU Work Report R515/85/23, Erlangen,
September 13, 1985.

NEA/CSNI/R(2014)12
105
Ref. 34: Scheuerer, M.: Reactor Pressure Vessel – International Comparative Assessment Study RPV
ICAS. Analyses on Thermal Hydraulics Mixing (THM) Tasks. Technical Note. Workshop on the
CSNI Project RPV ICAS, February 25 – 27, 1998, Orlando, Florida, USA.
Ref. 35: Scheuerer, M.: International Comparative Assessment Study of Pressurized-Thermal-Shock:
Task Group THM, Parametric Study PINJ. Report.
Ref. 36: Scheuerer, M.: Selection of PTS-relevant test cases. Internal ECORA document D05, 2002.
ECORA web page http://domino.grs.de/ecora/ecora.nsf, Public Docs.
Ref. 37: Simpson, A. R.: Large water-hammer pressures for column separation in pipelines. J. of
Hydraulic engineering 117 (1989) 1310 – 1316.
Ref. 38: Tenhumberg, M., Wenzel, H.-H.: Verzuchsprotokoll Temperaturschichtversuche im RDB
Versuchsgruppe TEMP Hauptuersuche T32.11-91. PHDR-Arbeitsbericht No. 3.468/85, KfK
GmbH, August 1985.
Ref. 39: Theofanous, T. G., Yan, H. A.: A unified interpretation of one-fifth to full scale thermal mixing
experiments related to pressurized thermal shock. NUREG/CR-5677 (1991).
Ref. 40: Theofanous, T. G., Nourbakhsh, H. P., Gherson, P., Iyer, K.: Decay of buoyancy-driven stratified
layers with applications to pressurized thermal shock. NUREG/CR-3700, May 1984.
Ref. 41: Theofanous, T. G., Iyer, K., Nourbakhsh, H. P., Gherson, P.: Buoyancy effects in overcooling
transients calculated for the NRC pressurized thermal shock study. NUREG/CR-3702, May
1986.
Ref. 42: Theofanous, T. G., Gherson, P., Nourbakhsh, H. P., Iyer, K.: Decay of buoyancy-driven stratified
layers with applications to pressurized thermal shock. Part II: PURDUE’s ½ scale experiments.
NUREG/CR-3700, May 1984. Nucl. Eng. Des. 1991.
Ref. 43: Theofanous, T. G., Angelini, S., Yan, H.: Universal treatment of plumes and stresses for
pressurized thermal shock evaluations. NUREG/CR-5854, June 1992.
Ref. 44: Tokuhiro, A., Kimura, N.: An experimental investigation on thermal striping mixing phenomena
of a vertical non-buoyant jet with two adjacent buoyant jets as measured by ultrasound Doppler
Velocimetry. Nucl. Eng. Design 188 (1999) 49 – 73.
Ref. 45: Toppila, T.: Experience with validation of CFD methods for pressure vessel downcomer mixing
analyses. Technical Meeting on Use of Computational Fluid Dynamics (CFD) Codes for Safety
Analysis of Reactor Systems, Including Containment. Pisa, Italy, 11-14 November 2002.
Ref. 46: Toppila, T.: Selected experiments at the Fortum PTS test facility. FLOMIX-R 2nd
Project
Meeting, Älvkarleby, Sweden, April 22-23, 2002.
Ref. 47: Tuomisto, H., Mustonen, P.: Thermal mixing tests in a semiannular downcomer with interacting
flows from cold legs. Test Report RLB-340, IVO, Helsinki, May 1986.
Ref. 48: Tuomisto, H., Mustonen, P.: Thermal mixing tests in a semiannular downcomer with interacting
flows from cold legs. NUREG/IA-0004, October 1986.
Ref. 49: Tuomisto, H.: Thermal mixing tests in a semiannular downcomer with interacting flows from
cold legs. Proc. 14th Water Reactor Safety Information Meeting, Gaithersburg, MD, October 27-
31, 1986, vol. 4, pp. 341-361.
Ref. 50: Tuomisto, H.: Experiments and analysis of thermal mixing and stratification during overcooling
accidents in a pressurized water reactor. ANS Proceedings 1987 National Heat Transfer
Conference, Pittsburgh, PA, August 9-12, 1987.
Ref. 51: Tuomisto, H.: Thermal-hydraulics of the LOVIISA reactor pressure vessel overcooling
transients. IVO-A-01/87, Helsinki 1987.
Ref. 52: Valenzuela, J. A., Dolan, F. X.: Thermal and fluid mixing in ½-scale test facility. Vol. 2 – Data
report. EPRI NP-3802, NUREG/CR-3426, September 1985.
NEA/CSNI/R(2014)12
106
Ref. 53: Weiss, P. A.: UPTF experiment operating specification of Test 1. KWU R515/Ws-et, Erlangen,
April 2, 1986.
Ref. 54: Weiss, P. A.: Fluid-fluid mixing test; A quick look at the essential results. KWU R515, 2D3D
Analysis Meeting, Erlangen, June 5-13, 1986.
Ref. 55: Weiss, P. A. et al.: Fluid-fluid mixing test; Quick look report. KWU R515/87/1, Erlangen,
January 1987.
Ref. 56: Weiss, P. A. et al.: Fluid-fluid mixing test; Experimental data report. KWU R515/87/09,
Erlangen, April 1987.
Ref. 57: Willemsen S. M., Komen Ed M. J.: Assessment of RANS CFD modelling for Pressurized
Thermal Shock analysis. The 11th Int. Topical Meeting on Nuclear Reactor Thermal-Hydraulics
(NURETH-11), Avignon, France, October 2-6, 2005. Paper 121.
Ref. 58: Wolf, L. et al.: Extracts of the design report 3.150/84 for thermal mixing experiments in cold leg
and downcomer. HDR-Test Group TEMB T32, KfK GmbH, November 1984.
Ref. 59: Wolf L., Schygulla U., Haefner W., Fischer K., Baumann W.: Results of thermal mixing tests at
the HDR-facility and comparisons with best-estimate and simple codes. Nucl. Eng. Design 99
(1987), 287-304.
Ref. 60: Wolf L., Haefner W., Fischer K., Schygulla U., Baumann W.: Application of engineering and
multidimensional finite difference codes to HDR thermal mixing experiments TEMB. Nucl. Eng.
Design 108 (1988), 137-165.
Ref. 61: Wolf, L., Schygulla, U.: Comparison between data and blind pre- and post-test calculations for
the three preliminary thermal mixing tests at the HDR facility; HDR-TEMB Experiments
T32.15, T32.17 and T32.18. PHDR Internal Working Report No. 3.452/85, KfK GmbH, April
1985.
Ref. 62: Yoo G. J., Jeon W. D.: Analysis of unsteady turbulent merging jet flows with temperature
difference. ICONE10-22235, Proceedings of ICONE10, 10th Int. Conf. On Nucl. Eng., Arlington,
VA, April 14-18, 2002.
Ref. 63: Yoon, S. H., Suh, K. Y.: Analysis of direct vessel injection flow pattern using the ANSYS-CFX
code. Trans. ANS 81(1999) 334-335.
Ref. 64: Young, E. P., Reyes, J. N.: A comparative analysis of APEX-CE and STAR-CD of fluid mixing
in the cold leg and downcomer of a PWR. Trans. ANS 85 (2001), 258 – 259.
5.3 Thermal Fatigue
Failures of parts of structures of NPPs caused by thermal fatigue have been recorded for Genkai Unit
1 (JP), Tihange Unit 1 (BE), Farley Unit 2 (US), Phénix (FR), PFR (UK), Tsuruga Unit 2 (JP) and Loviisa
(FI). Consequently, considerable effort has been devoted to research of the phenomenon, and both
experimental and numerical information is being gathered to aid understanding.
Thermal fatigue (thermal striping) is studied mainly for two geometric configurations: (1) T-junctions,
and (2) for two or more parallel jets in contact with neighbouring structures. The problem is complex, since
it involves several scientific disciplines and, consequently, several computer codes: computation of
velocity and temperature fields in flowing fluids, computation of temperature fields in solids, computation
of mechanical stresses in solids, and computation of behaviour of cracks in solids. Any experimental
database should reflect and comprehensively cover all these fields of discipline. Moreover, coupling
between the fields could be two-way, which means computations have to be carried out simultaneously, the
data from each being appropriately interfaced.

NEA/CSNI/R(2014)12
107
T-junctions
Liquid-Metal Reactors
The Phénix 300 MW(e) prototype reactor is a sodium-cooled fast breeder reactor. As a liquid metal,
sodium has a high thermal conductivity. This, combined with a large temperature difference (core inlet /
outlet = 400 / 550 °C) and highly turbulent flow conditions, leads to a potential thermal striping problem.
Early in the design process, this risk had been taken into account by installing static mixers in some of the
T-junctions of the secondary loops. In addition, local temperature measurements were taken in-situ in some
stratified or mixing zones with the reactor online.
Despite these precautions, in the 1990s, a crack was detected at a T-junction between a small pipe
(carrying hot sodium from the hydrogen detection device) and the main secondary loop (cold branch). A
sketch of the configuration is given in the Figure below.
The pipe was cut off and replaced, the original section then being analysed from a metallurgical
standpoint. Visual inspections of the cut piece revealed the shape of the thermal peak loading region on the
main branch pipe. In this configuration and for the given flow rates, the hot flow from the branch line does
not penetrate the main stream, but is deflected along the near surface of the cold pipe wall, and oscillates
azimuthally. Moreover, a slight swirl flow created by the pipe bends immediately upstream in the cold
branch leads to deviations of the thermally striped zone. The Figure below shows details of the crack
detected.

NEA/CSNI/R(2014)12
108
Temperature measurements were taken for the operating loop (Ref. 4). Thermocouples were located
on the pipe outer surface at 15 locations: 4 along the meridian line downstream of the junction on the hot
side, 2 at the junction, 4 around the circumference away from the meridian line; and 2 at 180° (i.e., on the
opposite wall) from the meridian line. Data acquisition intervals were 1 ms for the short record, and 1.5 s
for the long record. Temperature records showed a slight skew-symmetry of the temperature distribution,
indicating that the jet from the branch pipe had been directed sideways. Instantaneous temperatures were
recorded for each thermocouple over a time period of about 2000 seconds. The Figure below shows the
locations of the thermocouples.
The maximum linearised temperature difference across the wall is about 12K, with a non-linear peak
component of 2K. These estimates were obtained after reconstituting the temperatures on the inner wall
surface from the measured values and their associated frequencies. The maximum achievable frequency is
about 0.25 Hz; higher frequencies than this are not observable. The two Figures below show the

NEA/CSNI/R(2014)12
109
experimental results in terms of average temperatures and thermal fluctuations along the meridian line
versus the distance from the junction (Ref. 4).
Average Temperature Fluctuations of Temperature
The spectrum of temperature fluctuations, in the most fluctuating area, is plotted in the Figure below.
In the context of the international benchmark exercise sponsored by the IAEA in the 1990s, combined
CFD, stress analysis and fatigue calculations have been performed by several international teams,
conclusions from which are given in Ref. 4. As well as these tests, specific experiments on a scale model
T-junction in sodium were performed in the 1980s (the CASTOR tests). Here, a moving rake of
thermocouples, located downstream the tee provided average values and fluctuations of temperature. Some
details are given in Ref. 16.
Thermal striping was the subject of benchmark studies performed within the co-ordinated research
project Harmonization and Validation of Fast Reactor Thermomechanical and Thermo-Hydraulic Codes
and Relations using Experimental Data. A benchmark exercise on “T-junction of LMFBR secondary
circuit” was approved, representing the secondary circuit of the French Phénix LMFBR. A set of
experimental data was made available to the participating institutes. The CFD codes Trio-VF, STAR-CD,
AQUA, DINUS-3, PHOENICS and CFX-4 were used in the exercise. In the recommendations, application
of the pseudo-direct Navier-Stokes simulation is mentioned (LES without SGS models) as a possibility, but
full LES is recommended. Application of RANS models requires a priori assumptions regarding the
frequencies, and the range of the frequencies considered damaging for a particular pipe wall thickness must
Spectrum of temperature fluctuations (in the most fluctuating
area) Power Spectral Density vs. Frequency
1,00E-03
1,00E-01
1,00E+01
1,00E+03
0,010 0,100 1,000

NEA/CSNI/R(2014)12
110
be determined in advance. Frequencies lower than this band do not produce a sufficient ΔT across the wall,
and higher frequencies cannot penetrate the wall. The physical time of calculation had to cover at least 10
periods of the lower band of frequency, and the time step of the computation chosen in order to be able to
capture the upper bound of frequency. The boundary conditions should include secondary flows (e.g. swirl
flow) and low frequency variations of temperature and/or velocity.
Light Water Reactors
Nakamori et al. (1998) describe Japanese tests to investigate mixing behaviour of leak flow with
stagnant fluid in a branch pipe downstream of a check valve. The branch pipe was made of transparent
acrylic and connected to the simulated main coolant pipe. The leak-simulated fluid was coloured to
observe the mixing phenomena and contained 30% CaCl for simulating the density difference between the
high temperature main coolant and the low temperature leak fluid. The test conditions are detailed in the
Table below.
Test
cases
Type of
branch
Pressure
[MPa]
Hot water temperature in
the main coolant pipe4 [K]
Main coolant
pipe velocity
[m/s]
Leak flow
temperature [K]
Leak flow
rate [kg/h]
Small
leak test
Type 1, 2 15.49 563, 596 5.5, 16 290-300 10
Large
leak test
Type 2 15.49 596 16 290-300 30-300
The Type 1 branch is horizontal; the Type 2 branch is vertically downwards. Temperature measurements
were taken at 24 axial locations for the Type 1 branch, and at 8 axial locations for the Type 2 branch.
Thermal fatigue in T-junctions has also been studied within the EU 5th FWP project THERFAT
(Thermal Fatigue Evaluation of Piping System Tee-connections”). Within the project, thermal-hydraulic
tests were carried out to simulate, illustrate, measure and quantify the turbulent fluid flow and associated
thermal loads in various mixing tee configurations. The tests cover:
visualisation of the turbulent fluid phenomena in glass models,
electrical conductivity measurements in glass models simulating the temperature differences by using
salt water with different specific densities at ambient temperature,
measurement of the temperature fluctuation spectra occurring in steel models with test temperature
differences up to 90K.
The following tee configurations were selected for the thermo-hydraulic tests:
DN 50:50 mm tee: perpendicular branch in different configurations, glass and steel models;
DN 75:25 mm tee: perpendicular branch in different configurations, glass and steel models;
DN 50:50 tee: 45° branch in different configurations, glass model for visualisation only;
DN 100:100 mm tee: perpendicular branch, glass model.
The test with the DN 50:50 mm perpendicular branch was subsequently analysed using CFD
codes using the classical k-ε and LES turbulence modelling approaches. The determination of fluid-to-wall
heat transfer coefficients was the main focus of these computations. Only the LES approach was shown to
be able to reproduce the turbulent temperature fluctuations observed in the tests, though the k-ε
formulation was shown to be able to simulate those cases in which low-frequency thermal fluctuations are
produced due to non-convected, large-scale instabilities, such as those associated with pulses, pump
fluctuations, gravity waves, etc. Good agreement of computed and measured results was found, but long
computational times were needed, especially for the LES simulations.
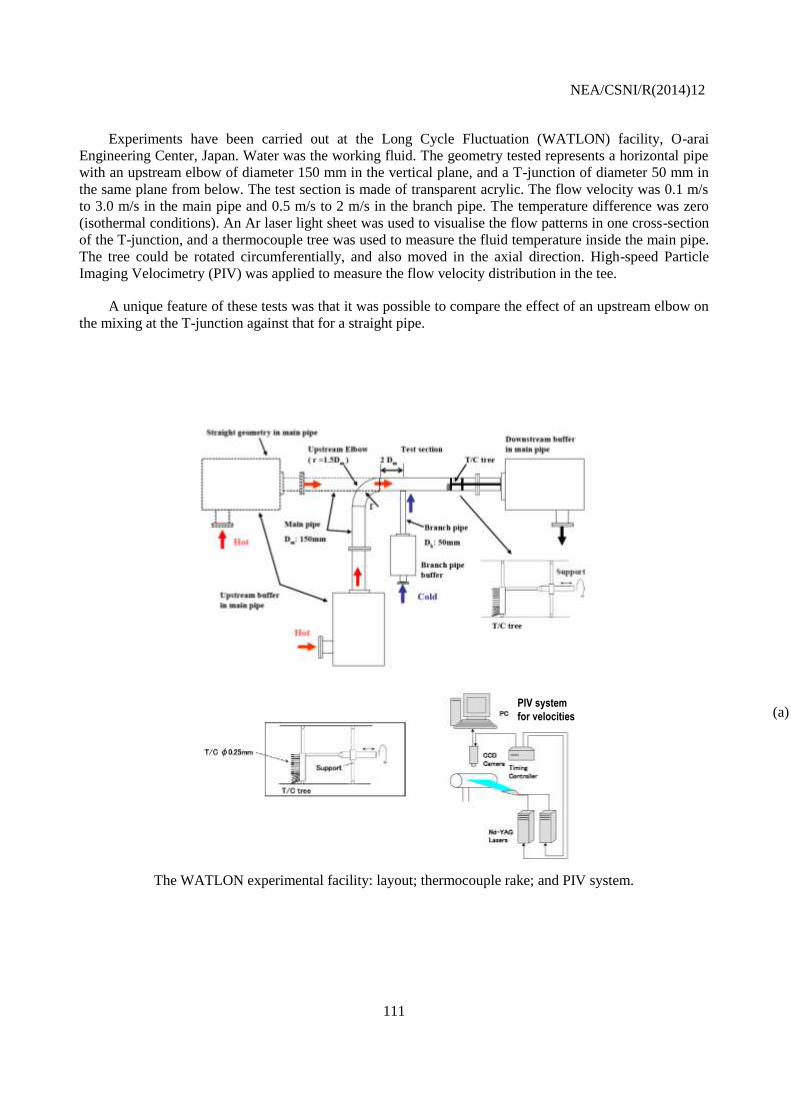
NEA/CSNI/R(2014)12
111
Experiments have been carried out at the Long Cycle Fluctuation (WATLON) facility, O-arai
Engineering Center, Japan. Water was the working fluid. The geometry tested represents a horizontal pipe
with an upstream elbow of diameter 150 mm in the vertical plane, and a T-junction of diameter 50 mm in
the same plane from below. The test section is made of transparent acrylic. The flow velocity was 0.1 m/s
to 3.0 m/s in the main pipe and 0.5 m/s to 2 m/s in the branch pipe. The temperature difference was zero
(isothermal conditions). An Ar laser light sheet was used to visualise the flow patterns in one cross-section
of the T-junction, and a thermocouple tree was used to measure the fluid temperature inside the main pipe.
The tree could be rotated circumferentially, and also moved in the axial direction. High-speed Particle
Imaging Velocimetry (PIV) was applied to measure the flow velocity distribution in the tee.
A unique feature of these tests was that it was possible to compare the effect of an upstream elbow on
the mixing at the T-junction against that for a straight pipe.
The WATLON experimental facility: layout; thermocouple rake; and PIV system.
PIV system
for velocities
PIV system
for velocities (a)

NEA/CSNI/R(2014)12
112
Three test cases with different flow combinations were performed:
Flow Pattern Velocity in the main
pipe [m/s]
Velocity in the branch
pipe [m/s]
Momentum ratio
(main/branch pipe)
Case 1 Wall jet 1.46 1.0 8.1
Case 2 Deflecting jet 0.46 1.0 0.8
Case 3 Impinging jet 0-23 1.0 0.2
Time-averaged velocities and temperatures, and their fluctuation intensities, at various positions in the
main pipe were provided for all cases. Dangerous frequency components around 6 Hz, or even lower, were
found in all cases. A kind of Karman vortex street behind the branch pipe jet appeared, which could be the
cause. Also, it was noted that the presence of the elbow could cause disturbances leading to low frequency
(less than 5 Hz) fluctuations.
Numerical simulations of flow in a mixing tee using the LES model of turbulence can be found for the
Civaux Unit 1 case, employing the thermal-hydraulic/thermo-mechanical computer code CAST3M.
Calculations have also been performed using the thermal-hydraulic code Saturne (FVM), coupled to the
conjugate heat transfer module Syrthes (FEM). In addition, FLUENT simulations have been carried out for
the Hitachi co-current experiment (one inlet in branch pipe, one inlet in main pipe, outlet in main pipe) and
the Toshiba collision-type experiment (both inlets in the main pipe, outlet in branch pipe).
T-junction test section showing LDV and PIV measurement stations
As part of an ongoing commitment to extend the assessment database for the application of CFD to
nuclear reactor safety issues, the Special CFD Group within the scope of activities of the OECD/NEA
Working Group on the Analysis and Management of Accidents (WGAMA) launched an blind international
numerical benchmarking exercise based on a T-junction experiment performed at the Älvkarleby
Laboratory of Vattenfall Research and Development in Sweden.
A date was fixed for the kick-off meeting for the benchmark exercise (20 May, 2009). An
announcement was prepared, with an invitation to register interest in receiving the benchmark
specifications. Of the 750 or so recipients of this invitation, 65 registrations were received from
organisations in 22 countries, of whom 28 attended the kick-off meeting.
1220 (>8 D)
150
47
0Plexiglass tube Di=140
with surrounding box
22
3
Plastic tube
D2=140
Steel pipe
DN100LDV measurements
3D upstream
PIV measurements
1.1D - 5D downstream
Q2
Q1
150
Plexiglass tube D1=100
with surrounding box
1070
Plastic tube
D2=140
1070
1220 (>8 D)
T-junction
(plexiglass)
xz
Plexiglass tube Di=140
with surrounding box
1220 (>8 D)
150
47
0Plexiglass tube Di=140
with surrounding box
22
3
Plastic tube
D2=140
Steel pipe
DN100LDV measurements
3D upstream
PIV measurements
1.1D - 5D downstream
Q2
Q1
150
Plexiglass tube D1=100
with surrounding box
1070
Plastic tube
D2=140
1070
1220 (>8 D)
T-junction
(plexiglass)
xz
Plexiglass tube Di=140
with surrounding box

NEA/CSNI/R(2014)12
113
A draft version of the specifications was circulated to all registered participants on June 30, 2009 with
an invitation for feedback concerning errors, clarity, ambiguity and possible misunderstandings. With very
few changes, the final and official version was circulated on July 15, 2009. This gave participants 9½
months to complete their calculations and submit their results by the deadline date of April 30, 2010. In
total, 29 were received by this date. These formed the basis of a thorough synthesis of the results.
Full details are given in Refs. 21, 22.
Parallel jets
Kimura et al. (2005) describe sodium and water experiments with parallel triple jet flow along a wall.
Unstable behaviour of the jets leads to temperature fluctuations in the wall, which could cause thermal
fatigue. The cases tested (cold central jet with hot side jets) are presented in the Table below.
Flow pattern Fluid Case
Name
Hot Jets Cold Jet Average
V (m/s) Re x104 T (°C) V (m/s) Rex104 T (°C) ΔT (°C) Vav(m/s)
Isovelocity Water WE3 0.49 1.47 39.3 0.52 1.25 28.5 10.8 0.50
Sodium SE3-V 0.51 2.82 347.5 0.51 2.60 304.5 43.0 0.51
SE3-R 0.30 1.67 349.9 0.30 1.55 310.0 39.9 0.30
Non-
isovelocity
Water WN3 0.49 1.47 39.3 0.34 0.79 26.2 13.1 0.44
Sodium SN3-V 0.51 2.87 349.8 0.32 1.68 311.0 38.8 0.45
SN3-R 0.31 1.71 352.3 0.20 1.04 311.0 41.3 0.27
Experiments with a vertical non-buoyant jet with two adjacent buoyant jets have also been carried out.
Another Japanese experiment with two jets of hot and cold water has been simulated with STAR-CD using
an LES model of turbulence. In the experiment, vertical hot (46°C) and cold (15°C) jets of water with
velocity 3.36 m/s impinge on a test piece placed above. Main frequencies of the thermal fluctuations were
7.5 Hz in the calculations and 5–7 Hz in the experiment.
Computational analysis of two test cases with parallel jets and two test cases with one jet flowing into
a circular tube is also available. An approach combining steady RANS, in order to identify possible regions
of strong thermal striping, and “pseudo-DNS”, used earlier is replaced here with an LES (or more precisely
a VLES) approach.
Ref. 1: F. Archambeau, N. Méchitoua, M. Sakiz: “Code_Saturne: a Finite Volume Code for the
Computation of Turbulent Incompressible Flows – Industrial Applications”, Int. J. on Finite
Volumes, 11, 2-62 (2001).
Ref. 2: S. Chapuliot, C. Gourdin, T. Payen, J.-P. Magnaud, A. Monavon: Hydro-thermal-mechanical
analysis of thermal fatigue in a mixing tee, Nucl. Eng. Des., 235, 575-596 (2005).
Ref. 3: S.-K. Choi, M.-H. Wi, W.-D. Jeon, S.-O. Kim, “Computational study of thermal striping in an
upper plenum of KALIMER”, Nucl. Technology 152, 223-238 (2005).
Ref. 4: O. Gélineau, M. Spérandio, J.-P. Simoneau, J.-M. Hamy, P. Roubin, 2002, “Validation of fast
reactor thermomechanical and thermohydraulic codes : thermomechanical and thermal hydraulic
analyses of a tee junction using experimental data”, Final report of a co-ordinated research project,
International Atomic Energy Agency, AIEA TECDOC-1318, Nov. 2002.
Ref. 5: O. Gélineau, C. Escaravage, J.-P. Simoneau, C. Faidy “High Cycle Thermal Fatigue: Experience
and State of the Art in French LMFR, Proc. SMIRT16, 2001.
NEA/CSNI/R(2014)12
114
Ref. 6: L.-W. Hu, M.S. Kazimi, “Large Eddy Simulation of Water Coolant Thermal Striping in a Mixing
Tee Junction”, NURETH-10, Seoul, Korea, Oct. 5-9, 2003.
Ref. 7: L.-W. Hu, M.S. Kazimi, “LES benchmark study of high cycle temperature fluctuations caused by
thermal striping in a mixing tee”, Int. J. Heat and Fluid Flow, 27, 54-64 (2006).
Ref. 8: N. Kimura, M. Nishimura, H. Kamide, “Study on convective mixing for thermal striping
phenomena – experimental analyses on mixing process in parallel triple-jet and comparisons
between numerical methods”, ICONE-9, 2001.
Ref. 9: N. Kimura, H. Miyakoshi, H. Ogawa, H. Kamide, Y. Miyake, K. Nagasawa, “Study on convective
mixing phenomena in parallel triple-jet along wall – comparison of temperature fluctuation
characteristics between sodium and water”, NURETH-11, Paper 427, 2005.
Ref. 10: K.-J. Metzner, U. Wilke, “European THERFAT project – thermal fatigue evaluation of piping
system Tee – connections”, Nucl. Eng. Des., 235, 473-484 (2005).
Ref. 11: T. Muramatsu, “Numerical analysis of non-stationary thermal response characteristics for a fluid-
structure interaction system”, Trans. ASME (J. Pressure Vessel Technol.), 121, 276–282 (1999).
Ref. 12: N. Nakamori, K. Hanzawa, K. Oketani, T. Ueno, J. Kasahara, S. Shirahama, “Research on thermal
stratification in unisolable piping of reactor coolant pressure boundary”, Proc. Specialists Meeting
on Experience with Thermal Fatigue in LWR Piping Caused by Mixing and Stratification, Paris,
France, 8-10 June 1998. NEA/CSNI/R(98)8, pp. 229-240.
http://www.oecdnea.org/html/nsd/docs/1998/csni-r98-8.pdf.
Ref. 13: H. Ogawa H., M. Igarashi, N. Kimura, H. Kamide, “Experimental study on fluid mixing
phenomena in T-pipe junction with upstream elbow”, NURETH-11, Paper 448, 2005.
Ref. 14: Ch. Péniguel, M. Sakiz, S. Benhamadouche, J.-M. Stephan, C. Vindelrinho, “Presentation of a
numerical 3D approach to tackle thermal striping in a PWR nuclear T-Junction”, PVP-Vol. 469,
Design and Analysis of Pressure Vessels and Piping: Implementation of ASME B31, Fatigue,
ASME Section VIII, and Buckling Analyses. PVP2003-2191. ASME 2003.
Ref. 15: J.-P. Simoneau, O. Gelineau, “Simulation of attenuation of thermal fluctuations near a plate
impinged by jets”, ICONE-9, 2001.
Ref. 16: J.-P. Simoneau H. Noé, B. Menant, “Large eddy simulation of sodium flow in a tee junction,
comparison of temperature fluctuations with experiments”, Proc. 8th Topical Mtg. Nuclear Reactor
Thermal Hydraulics (NURETH-8), Kyoto, Japan, 1997.
Ref. 17: H.G. Sonnenburg, “Thermal Stratification in Horizontal Pipes Investigated in UPTF-TRAM and
HDR Facilities”, Proc. Specialists Meeting on Experience with Thermal Fatigue in LWR Piping
Caused by Mixing and Stratification, Paris, France, 8-10 June 1998. NEA/CSNI/R(98)8, pp. 201-
228. http://www.oecdnea.org/html/nsd/docs/1998/csni-r98-8.pdf.
Ref. 18: Validation of fast reactor thermomechanical and thermohydraulic codes. Final report of a co-
ordinated research project 1996-1999, IAEA-TECDOC-1318, IAEA, Nov. 2002.
Ref. 19: J. Westin et al., “Experiments and Unsteady CFD Calculations of Thermal Mixing in a T-
Junction”, Proc. Int. Workshop on Benchmarking of CFD Codes for Application to Nuclear
Reactor Safety (CFD4NRS), Garching, Munich, Germany, 5-7 September 2006 (CD-ROM).
Ref. 20: R. Zboray et al., “Investigations on mixing phenomena in sigle-phase flows in a T-junction
geometry”, Proc. 12th Int. Topical Meeting on Nuclear Reactor Thermal Hydraulics (NURETH-
12) Pittsburgh, Pennsylvania, U.S.A., September 30-October 4, 2007.
Ref. 21: Report of the OECD/NEA—Vattenfall T-Junction Benchmark Exercise, OECD Nuclear Energy
Agency report, NEA/CSNI/R(2011)5, May 2011.
Ref. 22: B.L. Smith, J.H. Mahaffy, K. Angele, “A CFD benchmarking exercise based on flow mixing in a
T-Junction”, Paper 145, 14th Int. Topical Meeting on Nuclear Reactor Thermal Hydraulics
(NURETH-14), Toronto, Canada, Sept. 25-30, 2011.

NEA/CSNI/R(2014)12
115
5.4 Aerosol Transport in Containments
Despite that (based on PHEBUS experimental results), …“there is no indication that detailed CFD
models are needed to calculate the global behaviour (of aerosols)”…, see Section 3.18 of this report, CFD
codes could make a substantial contribution to the development of models or semi-empirical correlations to
be used for the formation, transport and deposition of aerosols in NPP circuits. The models and
correlations can then be used in less-detailed, lumped parameter codes. However, the detailed CFD
approach could bring better understanding of physical processes taking place during experiments involving
aerosol behaviour. It is therefore desirable to assess CFD codes also for this kind of application. Moreover,
the conclusions reached for the highly idealised PHEBUS containment geometry may not extrapolate to
the complex geometries of actual containments.
A possible experimental database could include former OECD/NEA activities in the field of aerosol
behaviour: ISP-37 (VANAM M3 Aerosol behaviour in the Battelle Model Containment), the AHMED
Code Comparison Exercise, ISP-44 (KAEVER test facility, VTT, Finland), and CEC benchmark problems.
However, the most cited reference remains the Phebus FP Severe Accident Experimental Program, in
which aerosol size distribution and composition, and interaction between vapours and aerosols are among
the outcomes of the experiments. These activities focused primarily on lumped parameter codes, but CFD
codes were used within Work Package 2 of the PHEBEN2 EU-supported project, based on the PHEBUS
FPT0 and FPT1 experiments. The aim of this WP was “…less to validate the codes themselves than to
understand the phenomena involved, and their quantitative contribution to the observed results.” It was
found that the coupling between the thermal-hydraulics and the aerosol physics in the PHEBUS
containment is rather weak, whereas in a real plant, where “…there is more opportunity for stratification,
the coupling could play a stronger role in determining local aerosol concentrations as functions of time…”
CFD codes CFX 4.3, CFX 5.7 (FPT1 only) and TRIO VF were used. There were problems with
comparison of measured values with calculated ones since “…only a few internal temperature
measurements and no velocity measurements are available from PHEBUS.” Comparison with computation
of FPT1 by means of the MELCOR 1.8.5 lumped parameter code was also made.
In Finland, aerosol behaviour is studied in the HORIZON facility, which is a scaled-down model of
VVER-440 steam generator, and in the VICTORIA multi-compartment test facility, which is a scaled–
down model of the containment of the Loviisa NPP. For this test, some experimental results were shown
alongside CFD simulations using the FLUENT computer code.
A multi-level simulation of aerosol dynamics after sodium combustion is described in Yamaguchi et
al. (2002). A set of tools is used including AQUA-SF CFD computer code. References on corresponding
experiments lead mostly to documents in Japanese. One of the computer codes of the described set,
SPHINCS for simulation of sodium fires on the largest scale was validated using experiments.
In summary, though there seems to be a consensus of opinion that aerosol deposition in containments
is a high priority one for NRS, and that CFD has the potential to bring better predictions of aerosol
deposition, the case for CFD playing an essential analysis role appears not to be proven. In any event, there
is a clear lack of validation data for CFD models for this topic.
Ref. 1: Auvinen A., et al., Severe accident aerosol research in Finland. Proc. 3rd Finnish-French
colloquium on Nuclear Power Plant safety, June 27-28, 2000, Lappeenranta, Finland.
Ref. 2: Clément B., et al., LWR severe accident simulation: synthesis of the results and interpretation of
the first Phebus FP experiment FPT0. Nucl. Eng. Design, 226, 5-82 (2003).
Ref. 3: Firnhaber M., Kanzleiter T. F., Schwarz S., Weber G.: International Standard problem ISP37.
VANAM M3 – A multi compartment aerosol depletion test with hygroscopic aerosol mterial.
Comparison Report OCDE/GD(97)16, December 1996.

NEA/CSNI/R(2014)12
116
Ref. 4: Firnhaber M., Fischer K., Schwarz S., Weber G.: International Standard Problem ISP-44
KAEVER. Experiments on the behavior of core-melt aerosols in a LWR containment.
NEA/CSNI/R(2003)5.
Ref. 5: Fischer K., Schall M., Wolf L.: CEC Thermal Hydraulic Benchmark Exercise on Fiploc
Verification Experimental Phases 2, 3 and 4 – Results of Comparisons. EUR 14454 EN, 1993.
Ref. 6: Futugami S. et al. Pool combustion behavior of liquid sodium. Proc. 36th Japanese Symposium on
Combustion, D311, 1998 (in Japanese).
Ref. 7: Gauvain J.: Post-test calculations of thermal hydraulic behaviour in DEMONA experiment B3
with various computer codes used in EC member states. EUR 12197 EN, 1989.
Ref. 8: Jones A. V., et al., Validation of severe accident codes against Phebus FP for plant applications:
Status of the PHEBEN2 project, Nucl. Eng. Design, 221, 225-240 (2003).
Ref. 9: Ludwig W., Brown C. P., Jokiniemi J. K., Gamble R. E. CFD simulation of aerosol deposition in a
single tube of a passive containment condenser, ICONE-9, 2001.
Ref. 10: Makynen J., Jokiniemi J. (eds.): CSNI/PWG4/FPC AHMED Code Comparison Exercise.
NEA/CSNI/R(95)23, October 1995.
Ref. 11: Martín-Fuertes F., Barbero R., Martín-Valdepenas J. M., Jiménez M. A. Analysis of source term
aspects in the experiment Phebus FPT1 with the MELCOR and CFX codes, Nucl. Eng. Des., 237,
509-523 (2007).
Ref. 12: Von der Hardt P., Jones A. V., Lecomte C., Tattegrain A. Nuclear Safety Research: The Phebus
FP Severe Accident Experimental Program, Nucl. Safety, 35, 187-205 (1994).
Ref. 13: Yamaguchi A., Tajima Y. Validation study of computer code SPHINCS for sodium fire safety
evaluation of fast reactor, Nucl. Eng. Des., 219, 19-34 (2003).
5.5 Sump Clogging
In 1992, a safety relief valve inadvertently opened on a steam line at the Barsebäck-2 BWR nuclear
plant in Sweden. The steam jet stripped fibrous insulation from the adjacent piping systems. Part of the
insulation debris was transported to the wetwell pool, and this debris subsequently clogged the intact
strainers of the drywell spray system about 1 h after the start of the incident. Although the event in itself
was not serious, it revealed a weakness in the defence-in-depth strategy of the plant, which under other
circumstances could have led to the emergency core cooling system (ECCS) failing to provide
recirculation water to the core. A similar incident occurred twice in 1993 at the Perry NPP in Ohio, USA.
Research and development efforts of varying degrees of intensity have been launched in many
countries as a consequence. The corresponding knowledge bases have been updated several times, and
workshops on the subject have also been organised. The international activities have been summarised in a
NUREG report of the US NRC, which includes a model of fibre release under the influence of a jet, an
empirical equation for the difference in pressure across the sieve as a function of fibre load, and the
respective results of specifically designed material loadings experiments. All these activities reflect, in
most cases, the views of the regulators and utilities. In parallel, efforts to investigate the problem in more
detail from a mechanistic standpoint, particularly with the aim of CFD model development, are also being
pursued.
As a result of these incidents, knowledge of insulation debris generation and transport is gaining in
importance in regard to reactor safety research for both PWRs and BWRs. The insulation debris released
near the break consists of a mixture of fibres and particles of very different sizes, shapes and consistency.
Experiments have been performed at the University of Applied Science, Zittau/Görlitz in Germany in
which original samples of mineral wool insulation material have been blasted by steam jets under break
conditions in a BWR. The fragments obtained from these tests have then been used as initial specimens for
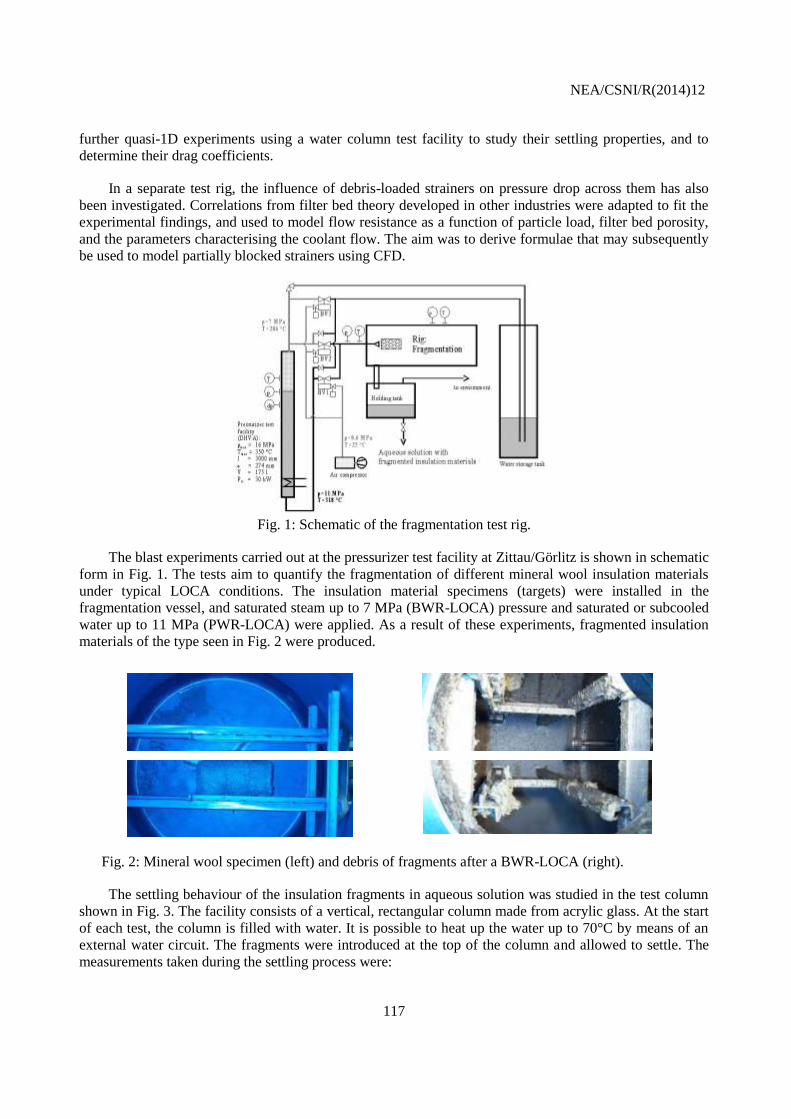
NEA/CSNI/R(2014)12
117
further quasi-1D experiments using a water column test facility to study their settling properties, and to
determine their drag coefficients.
In a separate test rig, the influence of debris-loaded strainers on pressure drop across them has also
been investigated. Correlations from filter bed theory developed in other industries were adapted to fit the
experimental findings, and used to model flow resistance as a function of particle load, filter bed porosity,
and the parameters characterising the coolant flow. The aim was to derive formulae that may subsequently
be used to model partially blocked strainers using CFD.
Fig. 1: Schematic of the fragmentation test rig.
The blast experiments carried out at the pressurizer test facility at Zittau/Görlitz is shown in schematic
form in Fig. 1. The tests aim to quantify the fragmentation of different mineral wool insulation materials
under typical LOCA conditions. The insulation material specimens (targets) were installed in the
fragmentation vessel, and saturated steam up to 7 MPa (BWR-LOCA) pressure and saturated or subcooled
water up to 11 MPa (PWR-LOCA) were applied. As a result of these experiments, fragmented insulation
materials of the type seen in Fig. 2 were produced.
Fig. 2: Mineral wool specimen (left) and debris of fragments after a BWR-LOCA (right).
The settling behaviour of the insulation fragments in aqueous solution was studied in the test column
shown in Fig. 3. The facility consists of a vertical, rectangular column made from acrylic glass. At the start
of each test, the column is filled with water. It is possible to heat up the water up to 70°C by means of an
external water circuit. The fragments were introduced at the top of the column and allowed to settle. The
measurements taken during the settling process were:

NEA/CSNI/R(2014)12
118
• x-y paths of the settling fragments,
• settling velocities of the insulation fragments,
• geometric properties, grey value, volume and shape parameters of individual fragments,
• solid phase concentration.
Fig. 3: Schematic and picture of the settling column test rig
Fig. 4: Distribution of settling velocities for 2497 individual MD2-insulations fragments.
Digital image processing was applied for measuring insulation fragment geometries, their motions and
velocities. A database of nearly 3000 fragments was compiled from the test data. The distribution of
fragments as a function of the settling velocity is shown in Fig. 4. These data were used to derive
appropriate drag coefficients for the accompanying CFD modelling.
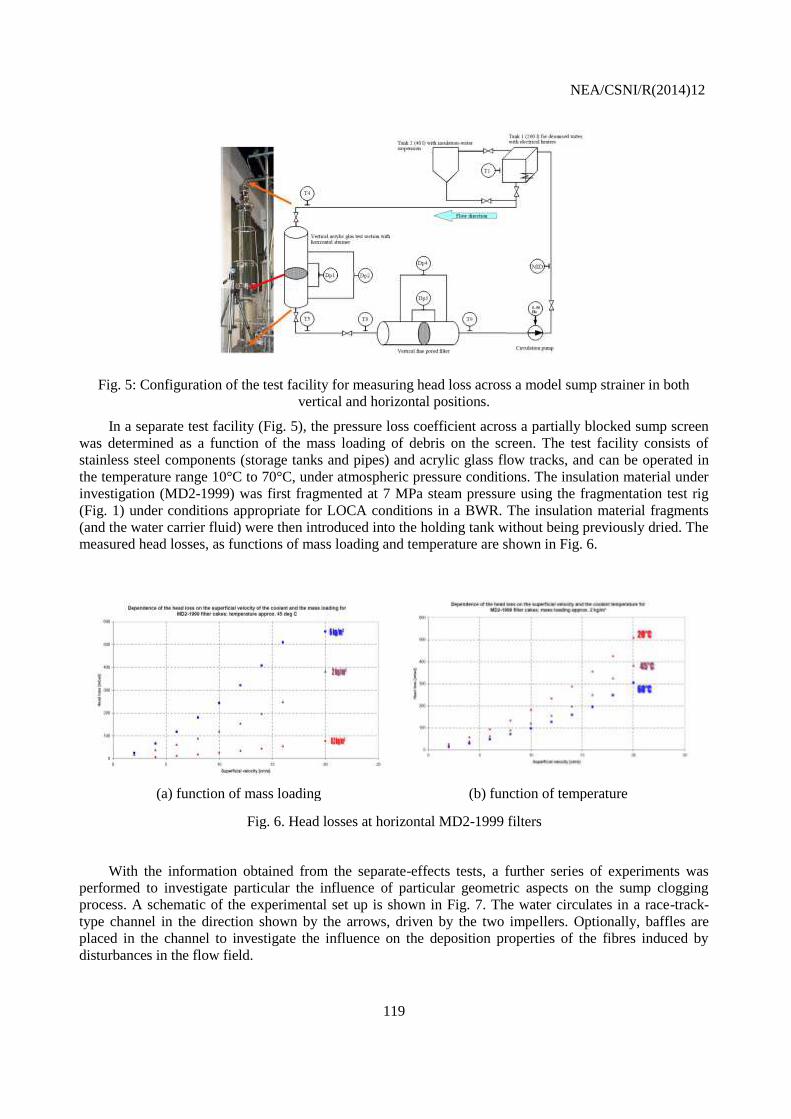
NEA/CSNI/R(2014)12
119
Fig. 5: Configuration of the test facility for measuring head loss across a model sump strainer in both
vertical and horizontal positions.
In a separate test facility (Fig. 5), the pressure loss coefficient across a partially blocked sump screen
was determined as a function of the mass loading of debris on the screen. The test facility consists of
stainless steel components (storage tanks and pipes) and acrylic glass flow tracks, and can be operated in
the temperature range 10°C to 70°C, under atmospheric pressure conditions. The insulation material under
investigation (MD2-1999) was first fragmented at 7 MPa steam pressure using the fragmentation test rig
(Fig. 1) under conditions appropriate for LOCA conditions in a BWR. The insulation material fragments
(and the water carrier fluid) were then introduced into the holding tank without being previously dried. The
measured head losses, as functions of mass loading and temperature are shown in Fig. 6.
(a) function of mass loading (b) function of temperature
Fig. 6. Head losses at horizontal MD2-1999 filters
With the information obtained from the separate-effects tests, a further series of experiments was
performed to investigate particular the influence of particular geometric aspects on the sump clogging
process. A schematic of the experimental set up is shown in Fig. 7. The water circulates in a race-track-
type channel in the direction shown by the arrows, driven by the two impellers. Optionally, baffles are
placed in the channel to investigate the influence on the deposition properties of the fibres induced by
disturbances in the flow field.
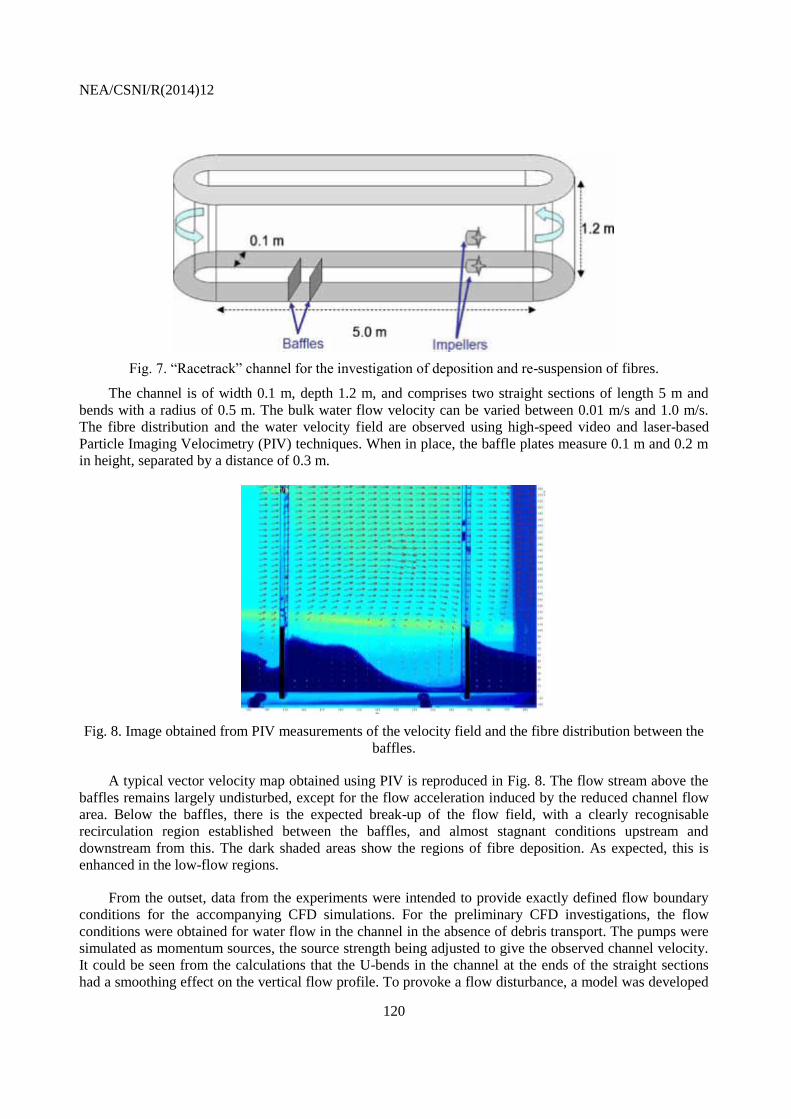
NEA/CSNI/R(2014)12
120
Fig. 7. “Racetrack” channel for the investigation of deposition and re-suspension of fibres.
The channel is of width 0.1 m, depth 1.2 m, and comprises two straight sections of length 5 m and
bends with a radius of 0.5 m. The bulk water flow velocity can be varied between 0.01 m/s and 1.0 m/s.
The fibre distribution and the water velocity field are observed using high-speed video and laser-based
Particle Imaging Velocimetry (PIV) techniques. When in place, the baffle plates measure 0.1 m and 0.2 m
in height, separated by a distance of 0.3 m.
Fig. 8. Image obtained from PIV measurements of the velocity field and the fibre distribution between the
baffles.
A typical vector velocity map obtained using PIV is reproduced in Fig. 8. The flow stream above the
baffles remains largely undisturbed, except for the flow acceleration induced by the reduced channel flow
area. Below the baffles, there is the expected break-up of the flow field, with a clearly recognisable
recirculation region established between the baffles, and almost stagnant conditions upstream and
downstream from this. The dark shaded areas show the regions of fibre deposition. As expected, this is
enhanced in the low-flow regions.
From the outset, data from the experiments were intended to provide exactly defined flow boundary
conditions for the accompanying CFD simulations. For the preliminary CFD investigations, the flow
conditions were obtained for water flow in the channel in the absence of debris transport. The pumps were
simulated as momentum sources, the source strength being adjusted to give the observed channel velocity.
It could be seen from the calculations that the U-bends in the channel at the ends of the straight sections
had a smoothing effect on the vertical flow profile. To provoke a flow disturbance, a model was developed

NEA/CSNI/R(2014)12
121
to include the presence of the flow baffles, and simulation results compared directly against PIV data. The
excellent agreement obtained for pure water flow conditions served as an essential starting point for the
further investigations of fibre laden flow.
The principal challenges for the CFD modellers were to define suitable drag coefficients for the
fibres, and to correctly account for their dispersion as a result of the turbulence in the water stream. Data
obtained from the special-effect tests provided valuable information on these aspects. In particular, the
settling velocities of the fibre material measured in the water column tests enabled appropriate drag
coefficients to be derived, and other physical properties of the fibre phase, both necessary for the CFD
model. The deposition and re-suspension behaviour of the fibres at low velocities was then investigated in
the race-track channel geometry. From measurements taken during the pressure drop tests a CFD model,
based on a porous medium approach with appropriate resistance factors, could be developed, and used to
calculate the pressure drops across the strainers. Correlations were needed for the flow resistance caused
by the fibre particle deposition. Initially, these were taken from the filter theory used in chemical
engineering applications, but then adapted to the experiments. This approach also provided resistance
coefficients for partially blocked strainers.
With all information in place, the sedimentation and re-suspension properties of the fibres observed in
the race-track test could be examined, especially for the region between the baffles. As seen in Fig. 8, the
presence of the baffles in the straight sections not only disturbs the motion of the carrier liquid (water), but
also promotes deposition of the insulation debris. The experiments have revealed that the fibres
agglomerate at a critical fibre volume fraction, which is manifested by a strong increase of the mixture
viscosity. In addition, the fibres are deposited at the bottom of the channel below a critical water velocity
of about 0.1 m/s, particularly at locations downstream of the obstacles. However, increasing the water
velocity beyond 0.1 m/s causes the fibres to be re-mobilised, and become carried along with the prevailing
flow stream.
The experiments carried out at HZDR, and the supporting analytical work performed by HZDR, have
produced valuable data and numerical insights, respectively, into the effects of strainer clogging on decay
heat removal following a LOCA incident. A broad database has been established from data produced from
separate-effect tests for MD2-1999 mineral wool insulation material under settling, sedimentation, re-
suspension and head loss build-up at horizontal strainers, has also been measures, all of which can be used
for validating CFD models. The work was carried out under the terms of a joint collaboration agreement,
but valuable data have been released in the open literature, and are available for CFD model development.
Ref. 1: Taylor, J.M. “Progress of resolution of generic safety issues”, US NRC Report SECY-96-
092, May 1996.
Ref. 2: “Knowledge Base for the Effect of Debris on Pressurized Water Reactor Emergency Core
Cooling Sump Performance”, NUREG/CR-6808, LA-UR-03-0880, Feb. 2003.
Ref. 3: NEA/NRC Workshop on Debris Impact on Emergency Coolant Recirculation, Albuquerque,
NM, USA, Feb. 2004 (CD-ROM).
Ref. 4: Sandervåg, O. “Knowledge Base for Strainer Clogging - Modifications Performed in
Different Countries since 1992”, OECD Nuclear Energy Agency report,
NEA/CSNI/R(2002)6, Oct. 2002.
Ref. 5: Alt, S., et al. “Experiments for CFD Modelling of Cooling Water and Insulation Debris Two-
Phase Flow Phenomena during Loff of Coolant Accidents”, Paper 22, NURETH-12,
Pittsburg, PA, USA, Sept. 30 – Oct. 4, 2007 (CD-ROM).
Ref. 6: Grahn, A.; Krepper, E.; Alt, S.; Kästner, W. “Modelling of differential pressure buildup
during flow through beds of fibrous materials”, Chemical Engineering & Technology, 29(8),
997-1000 (2006).

NEA/CSNI/R(2014)12
122
Ref. 7: Grahn, A.; Krepper, E.; Alt, S.; Kästner, W. “Implementation of a strainer model for
calculating the pressure drop across beds of compressible, fibrous materials”, Nuclear
Engineering and Design, 238, 2546-2553 (2008).
Ref. 8: Grahn, A.; Krepper, E.; Weiß, F.-P.; Alt, S.; Kästner, W.; Kratzsch, A.; Hampel, R.
“Implementation of a pressure drop model for the CFD simulation of clogged containment
sump strainers”, Journal of Engineering for Gas Turbines and Power - Transactions of the
ASME, 132, 082902 (2010).
Ref. 9: Höhne, T.; Grahn, A.; Kliem, S.; Weiss, F.-P, “CFD simulation of fibre material transport in a
PWR under loss of coolant conditions”, Kerntechnik, 76, 39-45 (2011).
Ref. 10: Krepper, E.; Cartland-Glover, G.; Grahn, A.; Weiss, F.-P.; Alt, S.; Hampel, R.; Kästner, W.;
Seeliger, A., “Numerical and experimental investigations for insulation particle transport
phenomena in water flow”, Annals of Nuclear Energy, 35, 1564-1579 (2008).
Ref. 11: Krepper, E.; Weiß, F.-P.; Alt, S.; Kratzsch, A.; Renger, S.; Kästner, W. “Influence of air
entrainment on the liquid flow field caused by a plunging jet and consequences for fibre
deposition”, Nuclear Engineering and Design, 241, 1047–1054 (2011).

NEA/CSNI/R(2014)12
123
6. IDENTIFICATION OF GAPS IN TECHNOLOGY AND ASSESSMENT BASES
As mentioned in the preceding section, an assessment matrix for a given application should comprise
three groups of items:
Verification problems with “highly-accurate” CFD solutions;
Validation experiments and their CFD simulations;
Demonstration simulations, possibly with some suitable supporting experiments.
Identification of gaps in the assessment matrices for a given application is possible only after
thorough analysis of corresponding exact solutions and experiments, and their CFD counterparts. More
than twenty NRS specific cases where CFD could bring substantial benefit were identified in Chapter 3.
Analysis of such a large number of NRS problems to identify specific knowledge gaps represents an
enormous task. Here, therefore, only some general guidance is given.
Verification Matrix
Code verification activities can be subdivided into Numerical Algorithm Verification, and Software
Quality Assurance Practices. Here, only the Numerical Algorithm Verification will be discussed in which
CFD solutions are compared with “correct answers”, which are highly accurate solutions for a set of well-
chosen test problems. Two pressing issues appear in designing and performing the Numerical Algorithm
Verification:
There is a hierarchy of confidence in these “highly accurate solutions”, ranging from high
confidence of exact analytical solutions and/or application of the Method of Manufactured
Solutions (MMS), through semi-analytic benchmark solutions (reduction to numerical integration of
ODEs) to highly accurate benchmark numerical solutions to PDEs.
It is necessary to select application-relevant test problems, which in most industrial cases includes
both complex physics and geometry.
Analytical solutions (closed solutions in the form of infinite series, complex integrals and asymptotic
expansions to special cases of the PDEs that are represented in the conceptual model) are the basic and
traditional tool of verification. Typically, inviscid or laminar flows in simple geometries can be treated
analytically, so that only limited features of the CFD computer codes (or, more precisely, of the conceptual
models) can be verified in this way.
One possible approach to expand the verification domain of CFD computer codes for problems with
complicated physics (like turbulent flows) is represented by the Method of Manufactured Solutions
(MMS). This method of custom-designing verification test problems proceeds roughly in the following
steps:
A specific form of the solution function is assumed to satisfy the PDE of interest.
This function is inserted into the PDE, and all the derivatives are analytically derived.

NEA/CSNI/R(2014)12
124
The equation is rearranged such that all remaining terms in excess of the terms in the original PDE
are grouped into an algebraic forcing-function or source term on the right hand side of the equation.
This source term is then simply added to the original PDE so that the assumed solution function
satisfies the new PDE exactly.
The boundary conditions of the Dirichlet, Neumann, or mixed type for the new PDE are calculated
from the assumed solution function.
The new PDE is then solved by the code to be verified and the result compared with the assumed
solution function.
This method therefore requires that the computed source term(s) and boundary conditions are
programmed into the code, which can represent a drawback. Not all CFD computer codes (mainly the
commercial ones) provide such access to the source modules for those users developing, for example, their
own physical models. Moreover, the difficulties associated with complex geometries are still present.
Application of numerical benchmarks requires thorough and well-documented verification of the code
on simpler cases, very comprehensive numerical error estimation, and accurate calculations of the same
case with independent experts, preferably using different numerical approaches and computer codes.
There is also a tendency to use some separate-effect experiments not only for development and
validation of physical models, but also for conceptual model verification. Here, similar requirements to
those related to numerical benchmarks must be met, not only by the computational solutions but also by
the experiments. Only well designed, performed and documented experiments should be used. Such an
activity represents in fact an interface between verification and validation on unit problems.
The primary responsibility for numerical algorithm verification should be placed upon the code
developers, but code users should have access to the relevant, properly documented, information.
Validation and Demonstration Matrices
According to the tiered approach to validation of conceptual models, four progressively simpler levels
of validation experiments,
complete system,
subsystem cases,
benchmark cases, and
unit problems
should be selected or proposed for each intended application of the CFD code, with at least one suitable
experiment (or a set of experiments in the case of unit problems and benchmark cases) at each level.
Unit problems are characterized by very simple geometries and a limited number (preferably one) of
important physical processes, since such experiments are very frequently aimed at development of physical
models. Validation of a CFD conceptual model should start at this level. Repeated experimental runs are
frequently possible, so that systematic errors can be detected. All the important code input data, initial
conditions and boundary conditions can, in principle, be accurately measured. In some cases, and only at
this level, multiple CFD computations are possible, enabling determination of probability of the output
quantities. Possible gaps are represented by missing significant parameters, or measurement of such
parameters at unsuitable locations, missing error analysis and, in the CFD simulations, missing analysis of
possible effects of estimated values of quantities not measured in the experiment, on the computed results.

NEA/CSNI/R(2014)12
125
Benchmark cases typically involve only two or three types of coupled flow physics in more complex
geometry than in the unit problems. Possible gaps at this level are in fact the same as in the case of unit
problems, but they are more frequent. As to the CFD simulations, problems with demonstration of grid-
independence of the solution are encountered.
Subsystem cases are at present the most complex cases solvable by a CFD code alone. It is difficult,
and sometimes impossible, to quantify most of the test conditions required for CFD modelling, so
estimation of the possible effects of such missing information on CFD simulation is essential.
Computational grids are generally large, and grid independence cannot be proved in most cases. When
meeting differences in measured and computed data, it is usually impossible to identify the cause of the
differences, especially when CFD simulations at the unit and benchmark levels have not been performed.
CFD simulations at the subsystem levels are very frequently close to demonstration simulations – it is
sometimes difficult, if not impossible, to determine the degree to which the conceptual model simulates the
reality.
As a complete system, the computational domain covered so far by system codes is understood here.
At the complete system level, coupled CFD and system codes represent the only realistic approach.
Verification and validation of such coupled codes is more complicated than verification and validation of
either CFD or system code alone. The coupling itself can often be a source of errors. Validation of such
coupled codes should be able to detect these errors if they are present. The unsteady nature of most
problems met in nuclear reactor safety applications makes such identification even more difficult than for
the steady problems. This field warrants more extensive research before application of such coupled codes
becomes routine.
To summarize, validation of CFD codes for NRS application frequently encounters deficiencies,
which includes (but is not restricted to):
Phenomena Identification and Ranking Table (PIRT) for the intended application is not prepared.
Quantified estimates of experimental and numerical uncertainties are not provided.
Validation metrics, figures of merit or target values for the intended application are not clearly
defined.
Experiments, selected for validation at some of the tiers do not meet requirements put on validation
experiments. Since validation experiments are very expensive, experiments intended for other
purpose (e.g. for study of physical phenomena or for development of physical models), or very old
experiments performed on already non-existing facilities (which excludes feedback between CFD
simulations and experiments), are sometimes used.
For some physical phenomena identified in the PIRT, suitable experiments are missing, so that new
experiments must be proposed.
Validation simulations cannot provide information on boundaries of regions of acceptability of the
conceptual model from regions where the model cannot be applied, or where its application is
questionable.
Demonstration simulations are frequently similar to subsystem or complete system cases when there
is no or very limited experimental support. Only very approximate conclusions on applicability of the
conceptual model can therefore be formulated. Nevertheless, demonstration simulations are very important
from the viewpoint of application, since such simulations can support decisions on funding of verification
and validation activities, or even of purchase of a CFD code. Especially at the complete system levels,
multi-scale and multi-physics coupling is frequently required, and balance of resource constraints,
including time, level of effort, available expertise and desired fidelity is very important. In many cases, a
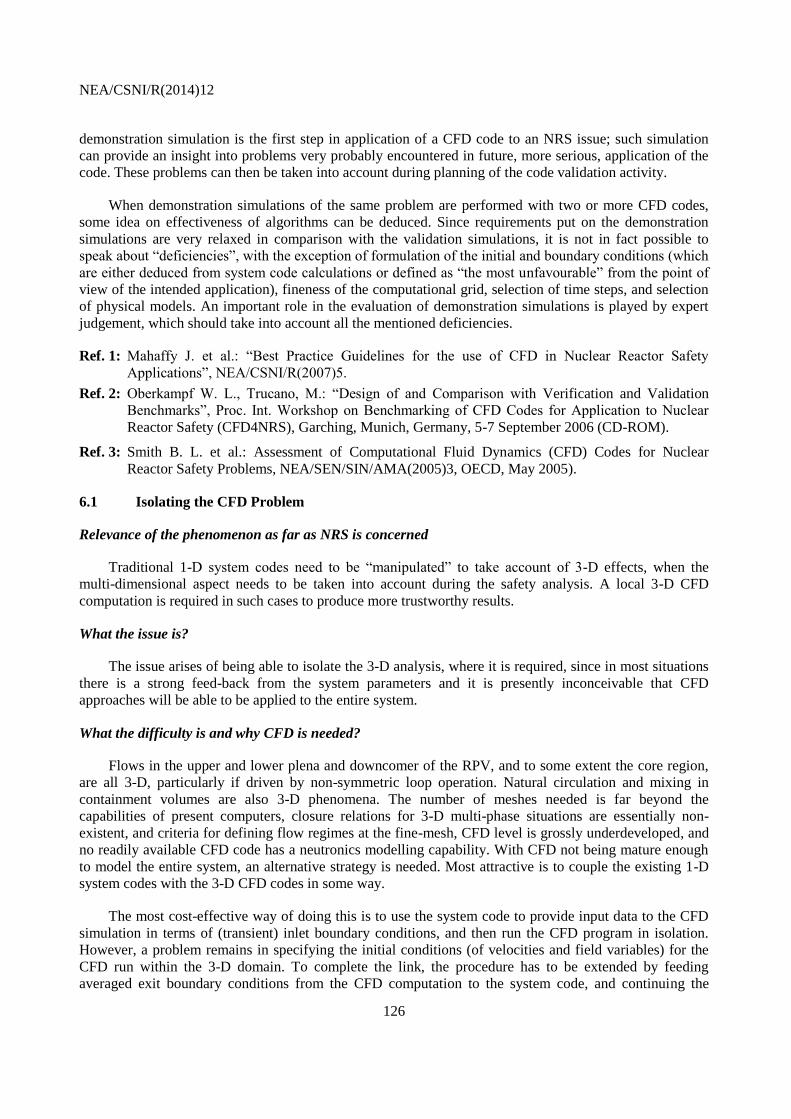
NEA/CSNI/R(2014)12
126
demonstration simulation is the first step in application of a CFD code to an NRS issue; such simulation
can provide an insight into problems very probably encountered in future, more serious, application of the
code. These problems can then be taken into account during planning of the code validation activity.
When demonstration simulations of the same problem are performed with two or more CFD codes,
some idea on effectiveness of algorithms can be deduced. Since requirements put on the demonstration
simulations are very relaxed in comparison with the validation simulations, it is not in fact possible to
speak about “deficiencies”, with the exception of formulation of the initial and boundary conditions (which
are either deduced from system code calculations or defined as “the most unfavourable” from the point of
view of the intended application), fineness of the computational grid, selection of time steps, and selection
of physical models. An important role in the evaluation of demonstration simulations is played by expert
judgement, which should take into account all the mentioned deficiencies.
Ref. 1: Mahaffy J. et al.: “Best Practice Guidelines for the use of CFD in Nuclear Reactor Safety
Applications”, NEA/CSNI/R(2007)5.
Ref. 2: Oberkampf W. L., Trucano, M.: “Design of and Comparison with Verification and Validation
Benchmarks”, Proc. Int. Workshop on Benchmarking of CFD Codes for Application to Nuclear
Reactor Safety (CFD4NRS), Garching, Munich, Germany, 5-7 September 2006 (CD-ROM).
Ref. 3: Smith B. L. et al.: Assessment of Computational Fluid Dynamics (CFD) Codes for Nuclear
Reactor Safety Problems, NEA/SEN/SIN/AMA(2005)3, OECD, May 2005).
6.1 Isolating the CFD Problem
Relevance of the phenomenon as far as NRS is concerned
Traditional 1-D system codes need to be “manipulated” to take account of 3-D effects, when the
multi-dimensional aspect needs to be taken into account during the safety analysis. A local 3-D CFD
computation is required in such cases to produce more trustworthy results.
What the issue is?
The issue arises of being able to isolate the 3-D analysis, where it is required, since in most situations
there is a strong feed-back from the system parameters and it is presently inconceivable that CFD
approaches will be able to be applied to the entire system.
What the difficulty is and why CFD is needed?
Flows in the upper and lower plena and downcomer of the RPV, and to some extent the core region,
are all 3-D, particularly if driven by non-symmetric loop operation. Natural circulation and mixing in
containment volumes are also 3-D phenomena. The number of meshes needed is far beyond the
capabilities of present computers, closure relations for 3-D multi-phase situations are essentially non-
existent, and criteria for defining flow regimes at the fine-mesh, CFD level is grossly underdeveloped, and
no readily available CFD code has a neutronics modelling capability. With CFD not being mature enough
to model the entire system, an alternative strategy is needed. Most attractive is to couple the existing 1-D
system codes with the 3-D CFD codes in some way.
The most cost-effective way of doing this is to use the system code to provide input data to the CFD
simulation in terms of (transient) inlet boundary conditions, and then run the CFD program in isolation.
However, a problem remains in specifying the initial conditions (of velocities and field variables) for the
CFD run within the 3-D domain. To complete the link, the procedure has to be extended by feeding
averaged exit boundary conditions from the CFD computation to the system code, and continuing the

NEA/CSNI/R(2014)12
127
system analysis. This means interfacing a CFD module to an existing system code in order to perform a
localised 3-D computation within the framework of an overall 1-D description of the circuit.
What has been attempted and achieved/what needs to be done (recommendations)?
Several attempts have been made to couple CFD and system codes. Details are given in Section 6.9 of
this document.
6.2 Range of Application of Turbulence Models
Relevance of the phenomenon as far as NRS is concerned
Almost exclusively, CFD simulations of NRS problems involve turbulent flow conditions.
What the issue is?
The turbulence community has assembled and classified a large selection of generic flow situations
(jets, plumes, flows though tee-junctions, swirling flow, etc.), and made recommendations of which
turbulence models are most appropriate. Care is needed to ensure that in NRS applications the turbulence
model has been chosen appropriately.
What the difficulty is?
CFD is not capable of modelling entire reactor systems, which means that sections of the system must
be isolated for CFD treatment. The range of scales can be large (e.g. in containments), and/or the flow
phenomena rather special (e.g. ECC injection). It is necessary to extend the database of recognised flow
configurations to include those particular to NRS applications of CFD, and build a suitable validation base.
What has been attempted and achieved/what needs to be done (recommendations)?
A very good exposé of this issue is given in the ECORA BPGs, so only a sketch will be given here.
In most industrial applications of CFD, RANS models are employed. However, due to the averaging
procedure, information is lost, which has then to be fed back into the equations via an appropriate
turbulence model. The lowest level of turbulence models offering sufficient generality and flexibility are
two-equation models. They are based on the description of the dominant length and time scale by two
independent variables. More complex models have been developed, and offer more general platforms for
the inclusion of physical effects. The most complex are Second Moment Closure (SMC) models. Here,
instead of two equations for the two main turbulent scales, the solution of seven transport equations for the
independent Reynolds stresses and one length (or related) scale is required.
The challenge for the user of a CFD method is to select the optimal model for the application at hand
from the models available in the CFD method. It is not trivial to provide general rules and
recommendations for the selection and use of turbulence models for complex applications. Two equation
models offer a good compromise between complexity, accuracy and robustness. The most popular models
are the standard k- model and different versions of the k-ω model. However, the latter shows a severe
free-stream dependency, and is therefore not recommended for general flow simulations, as the results are
strongly dependent on user input.
An important weakness of standard two-equation models is that they are insensitive to streamline
curvature and system rotation. Particularly for swirling flows, this can lead to an over-prediction of
turbulent mixing and to a strong decay of the core vortex. There are curvature correction models available,
NEA/CSNI/R(2014)12
128
but they have not been generally validated for complex flows. On the other hand, SMC models are much
less robust, and it is often recommended to perform a first simulation based on the k- model, and use this
as a starting point for the SMC approach. However, such an approach is hardly feasible for transient
simulations, which are usually required for NRS applications.
The first alternative to RANS is URANS (Unsteady RANS) or VLES (Very Large Eddy Simulation).
The former is more descriptive of the actual technique of application: i.e. to carry out an unsteady RANS
analysis, even if the boundary conditions are steady. Thus, if steady-state RANS calculation does not
converge, it may be that some unsteady behaviour is present in the flow, such as periodic behaviour, plume
or jet meandering, vortex shedding, etc. A URANS calculation can often identify the unsteady component,
but it has to be remembered that averaging over all turbulence scales remains implicit in the method, and
may not be appropriate to reliably capture the non-steady phenomena.
The amount of information to be provided by the turbulence model can be reduced if the large time
and length scales of the turbulent motion are resolved explicitly. In LES, the equations are filtered over the
grid size of the computational cells. All scales smaller than that provided by the resolution of the mesh are
modelled using a suitable Subgrid Scale (SGS) model, and all scales larger than the cells are computed
explicitly. Away from boundaries, LES appears trustworthy, even with very simplistic SGS models, such
as Smagorinsky. In the wall regions, pure LES becomes very inefficient due to the need to scale the lateral
dimensions in the same way as in the normal direction to capture the smaller scale eddies. This is not
necessary in RANS, because the mean flow parallel to the wall changes much less abruptly than in the
normal direction. Also, lack of sophistication of the SGS models may be tolerated in the bulk flow, but
near walls the SGS stresses become much more important, and need to be accounted for accurately.
An alternative, is to entrust the entire boundary layer treatment to a RANS model for the “attached”
eddies, and only use LES away from the walls, where the eddies are “detached”. This approach has
become known as Detached Eddy Simulation (DES), and leads to considerable savings in CPU time. The
case for continued use of LES in near-wall regions, probably in combination with a more complex SGS
model, has to be judged in terms of possible information lost using DES versus the extra computational
effort. This remains an active research area, particularly in the aerospace industry.
The Scale-Adaptive Simulation (SAS) model is a hybrid approach similar to DES, but operates
without an explicit grid dependency. The controlling parameter is the ratio of the turbulent length scale L,
for example, derived from the two-equation k-kL RANS model of Rotta (1972), and the von Karman
length scale LvK, which is determined in the usual way from the first and second velocity gradients. In
regions where the flow tends to be unstable, LvK is reduced, increasing the length scale ratio L/LvK. This
leads to a reduction in the eddy viscosity. The flow will become more unstable, and hence transient in
these regions, with vortices down to the scale of the local grid size being resolved, resulting in a LES-like
behaviour. In stable flow regions, LvK remains large, which leads to high values for the eddy viscosity. In
these areas, the model acts like a RANS model. Due to the model’s ability to resolve the turbulent
spectrum, it is termed a “scale-adaptive simulation” model. It has similarities to the DES model, but has
the advantage that it is not based on the local grid size and therefore avoids grid sensitivity problems.
As way of illustration, the picture shows how each approach to turbulence modelling is expected to
capture an instantaneous velocity signal, produced experimentally or using Direct Numerical Simulation
(DNS).
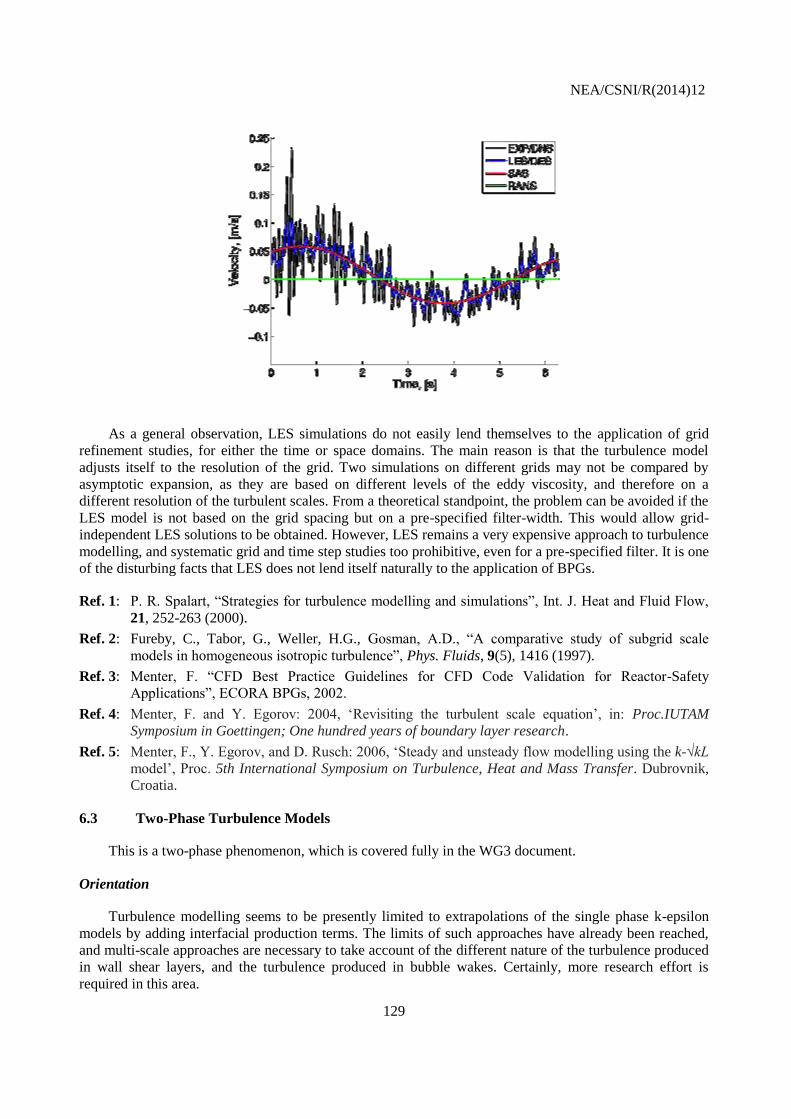
NEA/CSNI/R(2014)12
129
As a general observation, LES simulations do not easily lend themselves to the application of grid
refinement studies, for either the time or space domains. The main reason is that the turbulence model
adjusts itself to the resolution of the grid. Two simulations on different grids may not be compared by
asymptotic expansion, as they are based on different levels of the eddy viscosity, and therefore on a
different resolution of the turbulent scales. From a theoretical standpoint, the problem can be avoided if the
LES model is not based on the grid spacing but on a pre-specified filter-width. This would allow grid-
independent LES solutions to be obtained. However, LES remains a very expensive approach to turbulence
modelling, and systematic grid and time step studies too prohibitive, even for a pre-specified filter. It is one
of the disturbing facts that LES does not lend itself naturally to the application of BPGs.
Ref. 1: P. R. Spalart, “Strategies for turbulence modelling and simulations”, Int. J. Heat and Fluid Flow,
21, 252-263 (2000).
Ref. 2: Fureby, C., Tabor, G., Weller, H.G., Gosman, A.D., “A comparative study of subgrid scale
models in homogeneous isotropic turbulence”, Phys. Fluids, 9(5), 1416 (1997).
Ref. 3: Menter, F. “CFD Best Practice Guidelines for CFD Code Validation for Reactor-Safety
Applications”, ECORA BPGs, 2002.
Ref. 4: Menter, F. and Y. Egorov: 2004, ‘Revisiting the turbulent scale equation’, in: Proc.IUTAM
Symposium in Goettingen; One hundred years of boundary layer research.
Ref. 5: Menter, F., Y. Egorov, and D. Rusch: 2006, ‘Steady and unsteady flow modelling using the k-√kL
model’, Proc. 5th International Symposium on Turbulence, Heat and Mass Transfer. Dubrovnik,
Croatia.
6.3 Two-Phase Turbulence Models
This is a two-phase phenomenon, which is covered fully in the WG3 document.
Orientation
Turbulence modelling seems to be presently limited to extrapolations of the single phase k-epsilon
models by adding interfacial production terms. The limits of such approaches have already been reached,
and multi-scale approaches are necessary to take account of the different nature of the turbulence produced
in wall shear layers, and the turbulence produced in bubble wakes. Certainly, more research effort is
required in this area.

NEA/CSNI/R(2014)12
130
6.4 Two-Phase Closure Laws in 3-D
This is a two-phase phenomenon, which is covered fully in the WG3 document.
Orientation
Increasingly, the two-fluid (sometime three-fluid, to include a dispersed phase) model is being
adopted for the multi-phase CFD simulations currently being carried out. In this approach, separate
conservation equations are written for each phase. These equations require closure laws representing the
exchange of mass, momentum and energy between the phases. Except for rather particular flow regimes
(separated phases, dispersed second phase) genera-purpose expressions for such closure laws requires
extensive further development.
6.5 Experimental Database for Two-Phase 3-D Closure Laws
This is a two-phase phenomenon, which is covered fully in the WG3 document.
6.6 Stratification and Buoyancy Effects
Relevance of the phenomenon as far as NRS is concerned
Buoyancy forces develop in the case of heterogeneous density distributions in the flow. Most of the
events concern thermally stratified flows, which result from differential heating (e.g., in heat exchangers),
or from incomplete mixing of flows of different temperature (e.g., thermal stratification).
Other contributions to this report have underlined the possible occurrence of stratification and
buoyancy forces. For single phase flows, one can recall stratified flow developing in the case of
Pressurised Thermal Shock (see Section 5.2), hot leg heterogeneities (see Section 3.8), thermal shock
(Section 3.12), induced break (Section 3.14), and for natural convection in many relevant safety situations
for GFRs and LMFBRs in the context of PAHR (Post Accident Heat Removal); see specific Sections. For
two-phase flow problems, the reader is referred to the WG3 document, NEA/CSNI/R(2007)15.
Stratification may be one of the significant phenomena in the case of thermal shock, under some small-
break LOCA conditions (see Section 3.22 on the AP600), and for water-hammer condensation.
Stratification and buoyancy effects may lead to thermal fatigue, to modification of condensation rates, and
to difficulties in predicting the associated mixing processes.
What the issue is?
Stratified flows and buoyancy-induced effects take place in many parts of the flow circuit: main
vessel, lower and upper plena, pipes, and hot and cold legs. Most of the time, the phenomena are associated
with unsteady 3D flow situations. The issue is to derive a modelling strategy able to handle all the
situations of relevance to NRS.
What the difficulty is and why CFD is needed?
These complex phenomena are difficult to take into account using a system-code approach, and CFD
is needed to better predict the time evolution of such flows, in particular the mixing rate between flows of
different temperature (stratification may limit the action of turbulence, while buoyancy may in some cases
promote mixing), and, in case of two phase flows, the behaviour of the different phases of the flow and the
associated condensation rate.
NEA/CSNI/R(2014)12
131
For the case of single-phase flows, there remain difficulties and uncertainties concerning the
modelling of turbulence for such situations. The standard k-epsilon model is known to poorly take into
account mixing in strongly buoyant situations, and more complex closures (e.g., the Reynolds Stress
Model) may be recommended for obtaining satisfactory results (Ref. 1). Unfortunately, the RSM model is
much less robust that the k-epsilon model, and it may be difficult, or even impossible, to obtain converged
solutions in complex geometries. Additionally, two further issues may be underlined: (i) the transitional
state of such flows is difficult to handle in some situations, and (ii) the use of wall functions may lead to
uncertainties if they are not designed for buoyant situations. (CFD two-phase flow issues are covered in the
appropriate sections.)
What has been attempted and achieved/what needs to be done (recommendations)?
Numerous CFD simulations have already been undertaken for specific situations, including the use of
turbulence modelling, wall functions, etc. Due to the large number of the situations analysed, the main
recommendation may concern the development of specific experiments to assess the validity range of the
existing modelling capability.
Ref. 1: M. Casey, T. Wintergerste (Eds.), “ERCOFTAC Special Interest Group on Quality and Trust in
Industrial CFD: Best Practice Guidelines”, Version 1.0, January 2000.
6.7 Coupling of CFD code with Neutronics Codes
Relevance of the phenomenon as far as NRS is concerned
Precise prediction of the thermal loads to fuel rods, and of the main core behaviour, result from a
balance between the thermal hydraulics and the neutronics.
What the issue is?
Basic understanding consists of recognising that the thermal hydraulics is coupled with the neutronics
through the heat release due to neutronic activity (nuclear power distribution and evolution), and that the
neutronics is coupled with the thermal hydraulics through the temperature (fuel and moderator), density
(moderator), and the possible concentration of neutron absorber material (e.g. boron, see Section 3.7).
What the difficulty is and why CFD is needed?
The difficulty is to perform a coupled simulation, involving a CFD code adapted to the core
description and a neutronics code, and to ensure consistent space and time precision of the two aspects.
What has been attempted and achieved/what needs to be done (recommendations)?
Some progress has been made in this area.
The current state of the art is a coupling between a sub-channel description of the thermal hydraulics
and neutron diffusion at the assembly level, for both steady-state and transient situations (c.f. OECD/NEA
benchmarks). Pin or cell level coupling has also been investigated.
The coupling between a CFD code (Trio_U) and a Monte-Carlo neutronics code (MCNP) has been
tested in the context of a PhD programme for the MSRE prototype. The results obtained so far compare
well with the experimental data. Their extrapolation suggests ways of improving the safety coefficients of
power molten-salt reactors (Ref. 1).

NEA/CSNI/R(2014)12
132
CFD neutronic coupling between STAR-CD and VSOP is proposed in the case of PBMR (see Ref. 2).
Coupling between core thermal hydraulics and neutronics with the SAPHYR system [Ref. 3] is based
on the FLICA4 3D two-phase flow model and the CRONOS2 3D diffusion and transport models.
Several benchmarks have been computed in the frame of OECD/NEA [Ref. 4]: PWR Main Steam
Line Break [Ref. 5], BWR Turbine Trip [Ref. 6], and currently the VVER-1000 Coolant Transient (for
which fine-mesh CFD models are used). CRONOS2 and FLICA4 have also been successfully applied to
the TMI Reactivity Insertion Accident benchmark (with BNL and KI, Refs 7-8], with pin-by-pin
modelling, and within the NACUSP project (5th European FP, Ref. 9].
The 3D model of FLICA4 takes into account cross-flows between assemblies, related to core inlet
boundary conditions or neutronic power distribution. Feedback parameters, such as fuel temperature and
moderator density, are computed at the fuel assembly level, without collapsing several assemblies into
macro-channels, which results in a better accuracy for local parameters of interest for safety: i.e. power
peak and maximum fuel temperature. For conditions in which there is large asymmetry, like rod ejection or
main steam-line break(SLB), FLICA4 features a two-level approach (zoom): the assembly level and the
sub-channel level, either by coupling two FLICA4 calculations (exchange of boundary conditions), or by
using a non-conforming mesh.
The coupling of another CFD code (CAST3M) with the neutronics code (CRONOS2) has been
performed by CEA for the core of a gas-cooled reactor (GTMHR), in order to evaluate feedbacks
(Ref.1 11). Similar work is being performed at Framatome, with the development of the coupling of the
STAR-CD code with the CRONOS2 code.
Possible improvements would be (i) the coupling of CFD codes with more advanced (i.e.
deterministic or stochastic transport) neutronics models; (ii) the development of a multi-scale approach, in
order to optimise the level of description with the conditions, since, in many 3D cases, the power is very
peaked (rod ejection, boron dilution, SLB, etc.), and fine-scale models could be used only in a limited
region; and (iii) the development of time-step management procedures for complex transients in which the
thermal hydraulics and neutronics time-scales are not the same.
Ref. 1: F. Perdu “Contributions aux études de sûreté pour des filières innovantes de réacteurs nucléaires”,
PhD thesis, Université Joseph Fourier Grenoble, 2003.
Ref. 2: http://www.cd-adapco.com/news/18/reactor.htm.
Ref. 3: C. Fedon-Magnaud et al. “SAPHYR: a code system from reactor design to reference
calculations”, M&C 2003 (ANS), Gattlinburg, Tennessee, April 6-11, 2003.
Ref. 4: http://www.nea.fr/html/science/egrsltb.
Ref. 5: Caruso, A., Martino, E., Bellet, S., "Thermal-hydraulic behavior inside the upper upper plenum
and the hot legs of A 1300 MW PWR: Qualification on BANQUISE mock-up and application to
real reactor", American Society of Mechanical Engineers, Pressure Vessels and Piping Division
(Publication) PVP, 431, pp. 155-162, 2001
Ref. 6: Caruso, A., Martino, E., Bellet, S., "3D numerical simulations of the thermal-hydraulic behavior
into the upper plenum and the hot legs of a 1300 MW PWR configuration : Qualification on
BANQUISE mock-up", American Society of Mechanical Engineers, Pressure Vessels and Piping
Division (Publication) PVP, 414, pp. 117-121, 2000
Ref. 7: P. Ferraresi, S. Aniel, E. Royer, “Calculation of a reactivity initiated accident with a 3D cell-by-
cell method: application of the SAPHYR system to the TMI1-REA benchmark”, CSNI Workshop,
Barcelona, April 2000.

NEA/CSNI/R(2014)12
133
Ref. 8: J.C. Le Pallec, E. Studer, E. Royer, “PWR Rod Ejection Accident: Uncertainty analysis on a high
burn-up core configuration”, Int. Conf. On Supercomputing in Nuclear Applications (SNA). Paris,
2003.
Ref. 9: K. Ketelaar et al. « Natural Circulation and Stability Performance of BWRs (NACUSP)”, FISA-
2003, Luxembourg, November 10-13, 2003.
Ref. 10: E. Studer et al., “Gas-Cooled Reactor Thermal-Hydraulics using CAST3M and CRONOS2
codes”, Proc. 10th Int. Topical Meeting on Nuclear Thermal-Hydraulics, NURETH-10, Seoul,
Korea, October 5-9, 2003.
Ref. 11: Höhne, T.; Kliem, S.; Bieder, U., Modeling of a buoyancy-driven flow experiment at the
ROCOM test facility using the CFD-codes CFX-5 and TRIO_U, Nuclear Engineering and Design,
236(12), 1309-1325 (2006)
Ref. 12: Höhne, T.; Kliem, S.; Rohde, U.; Weiss, F.-P., Buoyancy driven coolant mixing studies of natural
circulation flows at the ROCOM test facility using ANSYS CFX, 14th International Conference
on Nuclear Engineering, ASME, 16-20 July, 2006, Miami, USA CD-ROM, Paper ICONE 14-
89120.
6.8 Coupling of CFD code with Structure Codes
Relevance of the phenomenon as far as NRS is concerned
The flows in the primary circuit components of reactors are often strong enough to induce vibrations
in, or damage to, confining or nearby structures, which may have consequences regarding plant safety. In
the case of thermal-hydraulic issues relating to the containment, there are instances of chugging and flow-
induced condensation producing jets in suppression pools in BWRs, and in large water pools for some
evolutionary reactions in which the mechanical loads on submerged surfaces need to determined and the
heat transfer to the walls have to be simulated simultaneously, usually by coupling implicitly a CFD code
and structure code.
What the issue is?
In order to obtain detailed information on the thermal and/or pressure loads to the structures, CFD
analysis of the flow field is often necessary. To facilitate the transfer of the load information, it is often
desirable, and sometimes necessary, to directly link CFD and structure codes. If there is no feed-back of
structural displacement on the flow field, it is sufficient to have a one-way coupling only, and the structural
analysis can be performed “off-line” to the CFD simulation. However, if there is a feed-back, for example
due to changes in flow geometry, a two-way coupling between the codes is needed, and the CFD and
structural analysis must be computed simultaneously (or perhaps just iteratively in simple cases).
What the difficulty is and why CFD is needed?
The pressure loading to structures may be computed at different levels of sophistication. In simple
cases, a static loading, estimated using lumped-parameter methods, may be input as a boundary condition
to the stress analysis program. Similarly with thermal loading, provided a reliable estimate of the
appropriate heat transfer coefficients are known. In these circumstances, the stress analysis may be
performed independently of any associated CFD. However, if there are significant spatial variations in the
loadings, it may be necessary to provide cell-by-cell information of the flow details. CFD is needed for
this.
NEA/CSNI/R(2014)12
134
What has been attempted and achieved/what needs to be done (recommendations)?
The code coupling of the structural mechanics code ANSYS and the CFD code ANSYS-CFX has
been applied for different aerodynamic test cases (Ref. 1). The analysis of a pitching airfoil demonstrates
the performance of ANSYS-CFX for the prediction of the transient lift and momentum coefficients.
Furthermore, the mechanical coupling example of an elastic-walled tube shows the flexible coupling
concept between structural and fluid software. The combination of both, transient and flexible coupling is
applied for the AGARD 445.6 wing flutter test. A good agreement has been obtained for the comparison of
the flutter frequency in a wide range of Mach numbers. The technology for NRS-related issues, e.g. flow-
induced vibrations, water-hammer, etc., would follow similar lines.
Coupling between STAR-CD and Permas is described on the Adapco website. The deformations and
stresses of the Sulzer Mixer, subjected to high-pressure load, was investigated by coupling STAR-CD and
Permas using MpCCI. The geometry model takes into account all the details of the structure, even welding
points. The mixer structure was built entirely as a 3D solid model using Unigraphics. As a first step, the
steady-state fluid flow was computed by STAR-CD without any code coupling. As a second step, the fluid
forces were transferred from the fluid code to the stress code by coupling the codes. This method (one-
way-coupling) assumes that the fluid flow topology is not affected by the structural displacement. This is
realistic for the kind of mixer under consideration, and would be true also for many NRS applications
involving heavy reactor components. The deformations, stresses and rotational movement agreed with
experimental observations. Work on the full coupling of the flow and stress computations, requiring
STAR-CD’s moving-mesh capability, is in progress. The use of STAR-CD, Permas and MpCCI provides
more realistic computation of the forces on the structures, and better design and optimisation of the mixer
geometry.
A very interesting approach to problems of fluid-structure interaction from the point of view of
methodology is described in De Sampaio et al. (2002). The authors combine a remeshing scheme with a
local time-stepping algorithm for transient problems. Since the solution at different locations is then not
synchronized, a time-interpolation procedure is used to synchronize the computation. Turbulence is
modelled via Large Eddy Simulation without an explicit sub-grid model; the effect of the unresolved sub-
grid scales on the mean flow is performed by the numerical method used. This approach is called ‘implicit
sub-grid modelling’ or ‘ILES’, and corresponds to ‘numerical LES’, see Pope (2004). The problem domain
is split into an ‘external Eulerian region’, for the fluid far from the structure, a ‘transition region’, where an
ALE reference frame is used, and a ‘Lagrangian description’ at the fluid-solid interface. The approach is
validated on the problem of vortex shedding on a square cylinder.
Sauvage and Grosjean (1998) at ENSIETA in France have validated an iterative approach to
modelling fluid-structure interaction. Their study examines the deformation of a thin aluminium slab in a
cross-flow of air by coupling an FLUENT simulation of the airflow to an ABAQUS prediction of the
structural deformation. Starting with a prediction of air flow around the non-deformed slab, the researchers
determined the pressure forces on the slab, and used these as input to ABAQUS. The ABAQUS
calculations predicted the slab deformation, which was used to redefine the FLUENT mesh defining the
flow geometry. Using the modified mesh, the FLUENT calculations predicted new pressure forces as
modified inputs to the ABAQUS run. By iterating between the two codes, convergence to a steady-state
prediction of the flow around the deformed slab could be obtained. The calculation procedure was
validated against wind tunnel test data on deformation and drag. Calculations were within about 3% of
measurements for both quantities. Again, this technique has potential application to many NRS issues
involving fluid-structure interaction.
CEA has made a study of the mechanisms leading to cracking in mixing zones of piping networks, as
a result of thermal loading. The overall analysis was performed with a single computer code: the CAST3M

NEA/CSNI/R(2014)12
135
code developed by CEA. Cracks appearing in a mixing tee, and its connection with the pipework in the
Civaux Unit 1 were adequately explained by the various calculations made.
A run-time coupling using PVM (Parallel Virtual Machine) has been established between the codes
COCOSYS (a lumped-parameter containment code) and ANSYS-CFX. The aim of the work was to replace
certain user-specified locations of the domain described by COCOSYS by a ANSYS-CFX model, and to
exchange the boundary fluxes of mass and energy between the codes on-line.
A comprehensive overview of experimental and theoretical work on flow-induced vibration of single
and multiple tubes in cross-flow is described in Blevins (1990). In Kuehlert et al. (2006), the FLUENT 6.3
code with a simple two degrees of freedom spring and damper model was applied to study flow-induced
vibration of individual tubes. The realizable k-epsilon model of turbulence in 2D was used at Re=3800.
Good correspondence was found. For Re=3106 and a single tube, a demonstration analysis was made in
3D using the DES turbulence modeling approach. Validation of flow past stationary tube banks was made
in preparation for a demonstration of tube oscillation. The FLUENT 6.3 code was coupled with the
ABAQUS structural analysis code for this purpose, and the experimental data of Simonin and Barcouda
(1988) were used. Both LES and RNG k-epsilon models of turbulence were tested in 3D.
Ref. 1: Kuntz, M., Menter, F.R., “Simulation of Fluid Structure Interaction in Aeronautical Applications”,
to be published in the ECCOMAS 2004 Conference, July 2004.
Ref. 2: http://www.cd-adapco.com/news/16/fsiinnotec.htm
Ref. 3: Sauvage, S., Grosjean, F., "ABAQUS Married with Fluent," ABAQUS Users' Conference,
Newport, Rhode Island, May 1998, pp. 597 – 602.
Ref. 4: Blevins R. D. Flow-induced Vibration, Van Nostrand Reinhold, New York 1990.
Ref. 5: De Sampaio P. A. B., Hallak P. H., Coutinho A. L. G. A., Pfeil M. S., “Simulation of turbulent
fluid-structure interaction using Large Eddy Simulation (LES), Arbitrary Lagrangian-Eulerian
(ALE) co-ordinates and adaptive time-space refinement”, Use of Computational Fluid Dynamics
(CFD) Codes for Safety Analysis of Reactor Systems, Including Containment. Pisa, Italy, 11-14
November 2002.
Ref. 6: Hover F. S., Techet A. H., Triantafyllou, M.S. “Forces on oscillating uniform and tapered
cylinders in cross flow”, J. Fluid Mech., 363, 97-114 (1998).
Ref. 7: Kuehlert K., Webb S., Joshl M., Schowalter D., “Fluid-structure interaction of a steam generator
tube in a cross-flow using large-eddy simulation”, Proc. ICONE 14, July 17-20, 2006, Miami,
USA.
Ref. 8: Pope S. B. “Ten questions concerning the large-eddy simulations of turbulent flows”, New
Journal of Physics, 6, 35 (2004).
Ref. 9: Simonin O., Barcouda M., “Measurements and prediction of turbulent flow entering a staggered
tube bundle”, 4th Int. Symp. Of Applications of Laser Anemometry to Fluid Mechanics, Lisbon,
Portugal, 1988.
6.9 Coupling CFD with System Codes: Porous Medium Approach
Validation of CFD-type computer codes on separate-effect experiments is discussed thoroughly in this
document and in the companion Best Practice Guidelines (NEA/CSNI/R(2007)5). The process of
validation in the context of nuclear reactor simulations are, in majority of cases, beyond the possibilities of
present hardware if a CFD code is used alone. Use of a less detailed, less demanding system analysis code
to produce initial and boundary conditions for the CFD code is a practical alternative. Such multi-scale
coupling is indispensable in the case of demonstration simulations and, of course, application of a CFD
code to real industrial problems. Moreover, in such problems it is very frequently necessary to simulate not
NEA/CSNI/R(2014)12
136
only thermal-hydraulics, but also phenomena belonging to different fields of physics or even to chemistry.
However, in this type of multi-physics coupling, problems with different spatial and temporal scales
appear.
General methods of coupling are treated in several books and papers, e.g., Zienkiewicz (1984),
Hackbush, Wittum (1995), Cadinu et al. (2007) and E et al. (2003). Most generally, couplings are
distinguished between those taking place on the same domain, by changing the differential equations
describing the corresponding physical phenomena (this approach is frequently realized by means of a
single computer code), or coupling on adjacent domains by matching boundary conditions at thir
interfaces. In this case, either the models are combined to produce a comprehensive model for the coupled
problem (joint, or simultaneous solution strategy), or there are modules solving the individual problems,
and coupling is effected via an outer iteration (changing of parameters, boundary conditions, or geometries
after each step or selected steps of the outer iteration – partitioned solution strategy). Whenever an outer
iteration is used, the problem of the optimum level of explicitness of the coupling has to be faced,
especially when two-way coupling is required. Generally, explicit coupling is easy to program compared
with implicit coupling, but is more prone to numerical instabilities.
Independently of the details of the particular coupling strategy, validation and assessment of the
coupled code is required. The individual codes usually solve problems with different spatial and time
scales and, particularly if two-way coupling is required, it is not enough to validate or assess the codes
individually. Design of corresponding experiments must take into account different requirements
concerning density of instrumentation (when multi-scale coupling of codes is tested) or requirements of
different type of instrumentation (in the case of multi-physics coupling).
There are several examples of coupled CFD or CFD-type codes with system codes, as can be seen in
the following Table, reproduced from Cadinu et al. (2007):
Table1: Examples of Coupled Codes
Authors, source System code CFD code Process
Jeong et al. (1997) RELAP5 COBRA/TF LOFT L2-3 LOCA Experiment
Graf (1998) ATHLET FLUBOX UPTF Experiment, Weiss et al. (1986)
Kliem et al. (1999) ATHLET CFX MSLB analysis
Aumiller et al. (2002) RELAP5 CFDS-FLOW3D Subcooled boiling experiments
Christensen (1961)
Gibeling, Mahaffy (2002) Authors’ 1D code NPHASE Pipe flow experiments Laufer (1953)
Schultz, Weaver (2003) RELAP5 FLUENT
Grgic et al. (2002) RELAP5 GOTHIC IRIS reactor 4-inch break
Coupling of the CAST3M/ARCTURUS CFD code with neutronics code CRONOS2 is described in
Studer et al. (2005). The architectures of the coupling algorithm and sensitivity studies are described. The
coupled code is aimed at applications to gas-cooled reactors. No validation has been possible so far, since
experimental data including both thermal hydraulic and neutronic parameters are missing. The facility
SIRIUS-F, built in Japan (see Furuya et al., 2007), could provide data for filling this gap.
An example of extensive research in the field of code coupling is the development of the methodology
for coupling of the RELAP5 and RELAP5-3D codes to different codes, as described in Weaver et al.
(2002), Schultz, Weaver (2002, 2003), Schultz et al. (2002), and Grgic et al. (2002). The coupling is
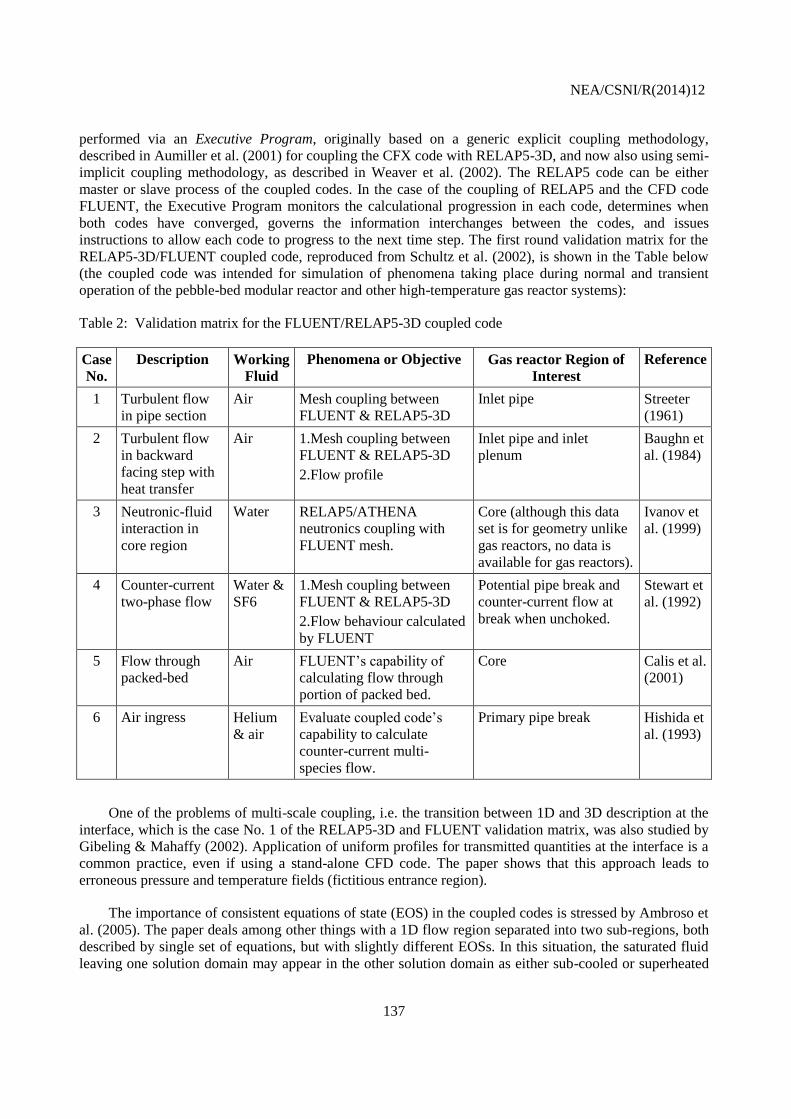
NEA/CSNI/R(2014)12
137
performed via an Executive Program, originally based on a generic explicit coupling methodology,
described in Aumiller et al. (2001) for coupling the CFX code with RELAP5-3D, and now also using semi-
implicit coupling methodology, as described in Weaver et al. (2002). The RELAP5 code can be either
master or slave process of the coupled codes. In the case of the coupling of RELAP5 and the CFD code
FLUENT, the Executive Program monitors the calculational progression in each code, determines when
both codes have converged, governs the information interchanges between the codes, and issues
instructions to allow each code to progress to the next time step. The first round validation matrix for the
RELAP5-3D/FLUENT coupled code, reproduced from Schultz et al. (2002), is shown in the Table below
(the coupled code was intended for simulation of phenomena taking place during normal and transient
operation of the pebble-bed modular reactor and other high-temperature gas reactor systems):
Table 2: Validation matrix for the FLUENT/RELAP5-3D coupled code
Case
No.
Description Working
Fluid
Phenomena or Objective Gas reactor Region of
Interest
Reference
1 Turbulent flow
in pipe section
Air Mesh coupling between
FLUENT & RELAP5-3D
Inlet pipe Streeter
(1961)
2 Turbulent flow
in backward
facing step with
heat transfer
Air 1.Mesh coupling between
FLUENT & RELAP5-3D
2.Flow profile
Inlet pipe and inlet
plenum
Baughn et
al. (1984)
3 Neutronic-fluid
interaction in
core region
Water RELAP5/ATHENA
neutronics coupling with
FLUENT mesh.
Core (although this data
set is for geometry unlike
gas reactors, no data is
available for gas reactors).
Ivanov et
al. (1999)
4 Counter-current
two-phase flow
Water &
SF6
1.Mesh coupling between
FLUENT & RELAP5-3D
2.Flow behaviour calculated
by FLUENT
Potential pipe break and
counter-current flow at
break when unchoked.
Stewart et
al. (1992)
5 Flow through
packed-bed
Air FLUENT’s capability of
calculating flow through
portion of packed bed.
Core Calis et al.
(2001)
6 Air ingress Helium
& air
Evaluate coupled code’s
capability to calculate
counter-current multi-
species flow.
Primary pipe break Hishida et
al. (1993)
One of the problems of multi-scale coupling, i.e. the transition between 1D and 3D description at the
interface, which is the case No. 1 of the RELAP5-3D and FLUENT validation matrix, was also studied by
Gibeling & Mahaffy (2002). Application of uniform profiles for transmitted quantities at the interface is a
common practice, even if using a stand-alone CFD code. The paper shows that this approach leads to
erroneous pressure and temperature fields (fictitious entrance region).
The importance of consistent equations of state (EOS) in the coupled codes is stressed by Ambroso et
al. (2005). The paper deals among other things with a 1D flow region separated into two sub-regions, both
described by single set of equations, but with slightly different EOSs. In this situation, the saturated fluid
leaving one solution domain may appear in the other solution domain as either sub-cooled or superheated

NEA/CSNI/R(2014)12
138
fluid having a different temperature in the receiving domain from its temperature in the sending domain –
see also Weaver et al. (2002). A similar statement is made by Schultz et al. (2002).
Clearly, a start has been made in the validation of CFD codes coupled to system (and neutronics)
codes for NRS applications. It is anticipated that coupled codes will be used much more frequently in the
future, and validation will remain a key issue. It is worth remarking again that it is necessary to perform
verification and validation exercises for the component parts of a coupled code, but this is not sufficient to
claim V&V for the coupled code itself: an additional programme is needed for this.
Ref. 1: Ambroso A. et al., Coupling of multiphase flow models. 11th International Topical Meeting on
Nuclear Thermal-Hydraulics (NURETH-11), Avignon, France, October 2-6, 2005. Paper 184.
Ref. 2: Aumiller D. L., Tomlinson E. T., Bauer R. C.: A coupled RELAP5-3D/CFD methodology with a
proof-of-principle calculation, Nucl. Eng. Design, 205, 83-90 (2001).
Ref. 3: Aumiller D. L., Tomlinson E. T., Weaver W. L.: An Integrated RELAP5-3D and Multiphase
CFD code System Utilizing a Semi-Implicit Coupling Technique, Nucl. Eng. Design, 216, 77-87
(2002).
Ref. 4: Cadinu F., Kozlowski T., Dinh T.-N.: Relating system-to-CFD coupled code analyses to
theoretical framework of a multiscale method. Proc. ICAPP 2007, Nice, France, May 13-18,
2007. Paper 7539.
Ref. 5: Calis H. P. A., Nijenhuis J., Paikert B. C., Dautzenberg F. M., van den Bleek C. M.: CFD
Modeling and Experimental Validation of Pressure Drop and Flow Profile in a Novel Structured
Catalytic Reactor Packing, Chemical Eng. Science, 56, 1713-1720 (2001).
Ref. 6: Chudanov v. v., Aksenova A. E., Pervichko V. A.: CFD to modeling molten core behavior
simultaneously with chemical phenomena. The 11th Int. Topical Meeting on Nuclear Thermal-
Hydraulics (NURETH-11), Avignon, France, October 2-6, 2005. Paper 048.
Ref. 7: E W., Engquist B., Huang Z.: Heterogeneous multiscale method: A general methodology for
multiscale modelling, Phys. Rev. B, 67, 92-101 (2003).
Ref. 8: Furuya M., Fukahori T., Mizokami S., Development of BWR regional stability experimental
facility SIRIUS-F, which simulates thermal hydraulics-neutronics coupling, and stability
evaluation of ABWRs, Nucl. Technol., 158, 191-207 (2007).
Ref. 9: Gibeling H., Mahaffy J.: Benchmarking simulations with CFD to 1-D coupling. Technical
Meeting on Use of Computational Fluid Dynamics (CFD) Codes for Safety Analysis of Reactor
Systems, Including Containment. Pisa, 11-14 November 2002.
Ref. 10: Graf U.: Implicit Coupling of Fluid-Dynamic Systems: Application to Multidimensional
Countercurrent Two-Phase Flow of Water and Steam. Nucl. Sci. Eng., 129, 305-310 (1998).
Ref. 11: Grgic D., Bajs T., Oriani L., Conway L. E.: Coupled RELAP5/GOTHIC model for accident
analysis of the IRIS reactor. Technical Meeting on Use of Computational Fluid Dynamics (CFD)
Codes for Safety Analysis of Reactor Systems, Including Containment. Pisa, 11-14 November
2002.
Ref. 12: Hackbusch W., Wittum G. (eds.): Numerical Treatment of Coupled Problems, Vol. 51 of Notes
on Numerical Fluid Mechanics, Vieweg, 1995.
Ref. 13: Hishida M., Fumizawa M., Takeda T., Ogawa M., Takenaka S., Researches on air ingress
accidents of the HTTR, Nucl. Eng. Design, 144, 317-325 (1993).
Ref. 14: Ivanov K. N., Beam T. M., Baratta A. J.: PWR Main Steam Line Break (MSLB) Benchmark,
Volume I: Final Specifications. NEA/NSC/DOC(99)8, April 1999.
Ref. 15: Jeong J. J., Kim S. K., Ban C. H., Park C. E.: Assessment of the COBRA/RELAP5 Code Using
the LOFT l2-3 Large-Break Loss-of-Coolant Experiment. Ann. Nucl. Energy 24 (1997) 1171-
1182.
NEA/CSNI/R(2014)12
139
Ref. 16: Kliem S., Hoehne T., Rohde U., Weiss F.-P.: Main Steam Line Break Analysis of a VVER-440
Reactor Using the Coupled Thermohydraulics System/3D-Neutron Kinetics Code
DYN3D/ATHLET in Combination with the CFD Code CFX-4. Proc. 9th Int. Topical Meeting on
Nuclear Reactor Thermal Hydraulics NURETH-9, San Francisco, California, October 3-8, 1999.
Ref. 17: Laufer J.: The structure of turbulence in fully developed pipe flow. NACA Report NACA-TN-
2954, 1953.
Ref. 18: Schultz R., Wieselquist W.: Validation & Verification: Fluent/RELAP5-3D Coupled Code. 2001
RELAP5 User’s Seminar Sun Valley, ID, September 2001.
Ref. 19: Schultz R. R., Weaver W. L.: Coupling the RELAP-3D© systems analysis code with commercial
and advanced CFD software. Technical Meeting on Use of Computational Fluid Dynamics
(CFD) Codes for Safety Analysis of Reactor Systems, Including Containment. Pisa, 11-14
November 2002.
Ref. 20: Schultz R., Weaver W. L.: Using the RELAP5-3D Advanced Systes Code with Commercial and
Advanced CFD Software. Proc. 11th Int. Conf. On Nuclear Engineering, Tokyo, Japan. April 20-
23, 2003.
Ref. 21: Schultz R. R., Weaver W. L., Ougouag A. M.: Validating & verifying a new thermal-hydraulic
analysis tool. Proc. ICONE10, 10th Int. Conf. on Nuclear Engineering, Arlington, VA, April 14-
18, 2002.
Ref. 22: Stewart W. A., Pieczynski A. T., Srinivas V.: Natural circulation experiments for PWR High
Pressure Accidents. EPRI Project RP2177-5, 1992.
Ref. 23: Streeter V. L.: Fluids Handbook. McGraw-Hill, 1961.
Ref. 24: Studer E., Beccatini A., Gounand S., Dabbene F., Magnaud J. P., Paillere H., Limaiem I.,
Damian F., Golfier H., Bassi C., Garnier J. C.: CAST3M/ARCTURUS: A coupled heat transfer
CFD code for thermal-hydraulic analyzes of gas cooled reactors. The 11th Int. Topical Meeting
on Nuclear Thermal-Hydraulics (NURETH-11), Avignon, France, October 2-6, 2005. Paper 318.
Ref. 25: Weiss P., Sawitzki M., Winkler F.: UPTF, a Full Scale PWR Loss-of-Coolant Accident
Experimental Program. Kerntechnik 49 (1986)
Ref. 26: Wieselquist W. A.: One validation case of the CFD software FLUENT: Part of the development
effort of a new reactor analysis tool. Proc. ICONE10, 10th Int. Conf. on Nuclear Engineering,
Arlington, VA, April 14-18, 2002.
Ref. 27: Weaver W. L., Tomlinson E. T., Aumiller D. L.: A generic semi-implicit coupling methodology
for use in RELAP5-3D. Nucl. Eng. Des., 211, 13-26 (2002).
Ref. 28: Yamaguchi a., Takata T., Okano Y.: Multi-level modeling in CFD coupled with sodium
combustion and aerosol dynamics in liquid metal reactor. Pisa 2002.
Ref. 29: Zienkiewicz O. C.: Coupled problems and their numerical solution. In Lewis R. W., Bettes P.,
Hinton E. (eds.): Numerical Methods in Coupled Systems, John Wiley & Sons, 1984.
6.10 Computing Power Limitations
The original version of Parkinson’s Law (Ref. 1), “Work expands to fill the time available”, was first
articulated by Prof. C. Northcote Parkinson in his book of the same name, and is based on an extensive
study of the British Civil Service. The scientific observations which contributed to the law’s development
included noting that as Britain’s overseas empire declined in importance, the number of employees at the
Colonial Office increased. From this have arisen a number of variants. Two pertinent ones from the sphere
of information technology are: Parkinson’s Law of Data, “Data expands to fill the space available for
storage”, and Parkinson’s Law of Bandwidth Absorption, “Network traffic expands to fill the available
bandwidth”. The application of CFD methodology also deserves a mention. Perhaps Parkinson’s Law of

NEA/CSNI/R(2014)12
140
Computational Fluid Dynamics could read: “The number of meshes expands to fill the available machine
capacity”.
Despite the overwhelming amount of possibilities and advantages of present CFD codes, their role
should not be exaggerated. The development of codes able to compute LOCA phenomena with some
realism began in the 1970s, which, by modern standards, was a period of very limited computing power.
Typically, good turn-round could only be achieved using supercomputers. Today, these system codes are
recognised internationally. The physical models are based on reasonable assumptions concerning the steam
and water flows, and their interaction. The circuits are treated as an assembly of 1D pipe elements, 0D
volumes, and eventually some 3D component modelling. Intensive experimental programs of validation on
system loops, or local component mock-ups, were carried out. So there is some confidence in their results,
provided they are used in their domain of validation, and by experienced users.
Today, a large part of the system calculations are made on workstations or PCs. In the mid-term, say 5
to 10 years, it is foreseen to improve the two-fluid models, perhaps with extension to three fields to include
droplets and bubbles, and incorporation of transport equations for interfacial area; 3D modelling would be
used, as required. During the same period, the increasing computer efficiency will allow the use of refined
nodalisation, and the capture of smaller scale phenomena, provided more sophisticated models are
available. Certainly, with the time needed for validation programmes, the development of modelling
sophistication will not keep pace with the upgrades in computer performance. It is unlikely then, that
system-code NRS analyses will ever again require super-computing power.
However, even with the advances in computer technology, it is difficult to see CFD codes being
capable of simulating the whole primary or secondary loop of a nuclear plant: system and component
codes will still remain the main tools for this. However, for those occasions when CFD is needed – and
many examples of this have been given in this document – the computations will stretch computing
resources to the limit, just as predicted by Parkinson’s Law.
The CFD codes will allow the zooming in on specific zones of a circuit, or may be used as a tool to
derive new closure relations for more macroscopic approaches, reducing the necessity of expensive
experimental programmes. Coupling between CFD and system codes may also be an efficient way to
improve the description of small-scale phenomena, while living within current computer limitations. As
soon as in-progress developments are available, Direct Numerical Simulation (DNS) codes will be used for
a better understanding of small-scale physical processes, and for the derivation of new models for averaged
approaches.
These days, CFD simulations using 10 million nodes are common in many industrial applications.
Such computations are possible because invariably the calculations are steady-state, single-phase, and
carried out using parallel-architecture machines. In NRS applications, many of the situations requiring
analysis are of a transient nature. CFD codes are computationally demanding, both in terms of memory
usage and in the number of operations. Since the accuracy of a solution can be improved by refining the
mesh, and by shortening the time step, there is a tendency to use whatever computational resources are
available, and there is a never-ending and never-compromising demand for faster machines and more
memory Parkinson’s Law again!
For a 3-D CFD simulation, with N meshes in each coordinate direction, the total number of grid
points is N3. The time-step, though usually not CFL limited, remains, for purely practical reasons, roughly
proportional to 1/N, so the number of time steps is also proportional to N. Present-day commercial CFD
codes are still based on a pressure-velocity coupling algorithm, which entails the iterative solution of a
large linear system of equations. Much of the CPU overhead (sometimes up to 90%) derives from this

NEA/CSNI/R(2014)12
141
procedure. Typically, the number of iterations M to convergence within a time step is also proportional to
N. Thus finally, the run-time for the CFD code should scale according to
5Nt
where the constant of proportionality, among other things, depends linearly on the total simulation time
and simulation times in NRS applications can be very long.
Despite the continual improvement in processor power, the commodity computer market has still not
overtaken the demands of CFD. Traditionally, programs were written to run on a single processor in a
serial manner, with one operation occurring after the next. One way to achieve a speed-up is to divide up
the program to run on a number of processors in parallel, either on a multiprocessor machine (a single
computer with multiple CPUs), or on a cluster of machines accessed in parallel. Since 1990, the use of
parallel computation has shifted from being a marginal research activity to the mainstream of numerical
computing.
A recent study (Ref. 3) has shown that the scaling up of performance with number of processors is
strongly dependent on the size of the system arrays (i.e. number of meshes), as well as on the details of the
computer architecture and memory hierarchy. The speed of a program also depends on the language
(generally, Fortran is faster than C), the compiler (levels of optimisation), and the syntax used to express
basic operations (machine-dependent). With regards to the syntax of operations, forms that are fast on one
platform might be slow on another. Modern workstations have proved to give good performance for small
array sizes that fit into the processor’s cache. However, when the array is too large to fit into the cache, the
speed of the computers can drop to half their peak performance. These machines commonly bank their
memory, and array sizes, which results in the same memory bank being accessed multiple times for the
same operation, and will incur a performance penalty as a result. This problem can commonly be solved by
increasing the leading dimension of an array.
Vector computers have an optimum speed when the array dimensions are a multiple of the size of the
vector registers, typically a multiple of 8. Thus, when comparing a vector computer to a workstation, the
optimum array size for the vector platform is the slowest (due to memory banking) on the workstation.
Shared memory parallel computers typically give good performance for small to moderate problem sizes,
for which the data fits within the cache of the computer’s processors, but if array sizes are too large for the
data to fit into the cache, there is a severe drop in speed, as all processors attempt to access the shared
memory. In comparison, it was found (Ref. 3) that distributed memory machines achieved poor speeds for
small to moderate array sizes, whereas for large problems, for which the memory access speed rather than
inter-processor communication speed dominated, the parallel paths to memory ensured a near linear
speedup with number of processors.
Given this linear speed-up, and the N 5 dependence of runtime on number of meshes in one coordinate
direction, doubling the number of processors, and keeping total runtime the same, the number of meshes in
each direction can be increased by about 15%, say from 100 to 115. Conversely, doubling the mesh
density, say from 100 to 200 in each coordinate direction, again keeping total runtime constant, means that
the number of processors has to be increased by a factor 32.
Given the above statistics, it is evident that the pursuit of quality and trust in the application of CFD to
transient NRS problems, adhering strictly to the dictates of a Best Practice Guidelines philosophy of multi-
mesh simulations, will stretch available computing power to the limit for some years to come. In the mid-
term, compromises will have to be made: for example, examining mesh sensitivity for a restricted part of
the computational domain, or to a specific period in the entire transient. Certainly, expanding efforts in
NRS will ensure that Parkinson’s Law will prevail for CFD.

NEA/CSNI/R(2014)12
142
Ref. 1: C. Northcote Parkinson, Parkinson's Law: The Pursuit of Progress, London, John Murray (1958).
Ref. 2: M. Livolant, M. Durin, J.-C. Micaeli, “Supercomputing and Nuclear Safety”, Int. Conf. on
Supercomputing in Nuclear Applications, SNA’2003, Paris, Sept. 22-24, 2003.
Ref. 3: S. E. Norris, “A Parallel Navier-Stokes Solver for Natural Convection and Free-Surface Flow”,
Ch. 6, PhD Thesis, Dept. Mech. Eng., University of Sydney, Sept. 2000.
6.11 Special Considerations for Liquid Metals
Relevance of the phenomena as far as NRS is concerned
The conventional fast breeder reactor uses liquid metal, such as Na, NaK or Pb etc., as coolant. The
following liquid-metal hydraulics phenomena are relevant as far as NRS is concerned: (i) natural
convection, (ii) thermal striping, (iii) sloshing of free surface, (iv) sodium fires, and (v) sodium boiling. It
seems that some established CFD studies have been carried out concerning natural convection and sodium
fires; these are described in Section 3.22 of this report. Identification of gaps in the technology base for
special considerations for liquid metals, therefore, is restricted to thermal striping, sloshing of the free
surface and sodium boiling.
What the issue is
Thermal striping phenomena in LMFBRs, characterised by stationary, random temperature
fluctuations, are typically observed in the region immediately above the core exit, and are due to the
interaction of cold sodium flowing out of a control rod assembly and hot sodium flowing out of adjacent
fuel assemblies. The same phenomenon occurs at a mixing tee, a combining junction pipe, etc. The
temperature fluctuations induce high-cycle fatigue in the structures.
The sodium in the reactor vessel has a free surface, and is covered by an inert gas. When the reactor
vessel is shaken by seismic forces, waves will form on the free surface: the so-called "sloshing behaviour".
If the amplitude of the wave increases, the inert gas may enter an inlet nozzle and be carried around the
primary circuit, resulting in the formation of gas bubbles in the core region, causing a positive reactivity
insertion. Another issue is the fluid force associated with slug movement caused by violent sloshing. The
vessel wall and internal structures of LMFBRs are relatively thin, and mitigate thermal stress attributed to
temperature variations during operation, which is characteristic of the high conductivity of liquid sodium.
The fluid force of a moving liquid slug, therefore, could threaten the integrity of the reactor vessel.
Sodium boiling in the core region of LMFBRs would cause a power excursion, through feedback of
positive reactivity coefficient of sodium void.
What the difficulty is and why CFD is needed to solve it
The design study associated with the protection of the Japanese LMFBR MONJU from thermal
striping was performed using experimental data from a 1/1 scale model with sodium. In such a
conventional approach, an increase in costs, as well as the time to perform the experiments, is inevitable,
because it is technically difficult to obtain adequate amounts of quality of data from sodium experiments.
CFD is needed to overcome this difficulty.
Linear-wave theory is applicable only to small-amplitude waves at the free surface. CFD is needed to
solve the (non-linear) violent sloshing phenomenon important for NRS.

NEA/CSNI/R(2014)12
143
High accuracy is required from the sodium-boiling model, whose function is first to predict the exact
time and location of the onset of boiling, and then to describe the possible progression to dryout. CFD has
the potential to improve the accuracy in prediction of these phenomena.
What has been attempted and achieved / what needs to be done (recommendations)
The IAEA coordinated a benchmark exercise with the goal of simulating an accident in which thermal
striping had caused a crack in a secondary pipe of the French LMFBR Phenix. JNC has been developing a
simulation system for the thermal striping phenomena consisting of two CFD codes: AQUA and DINUS-3.
AQUA is a 3D model for porous media with a RANS turbulent model, and DINUS-3 is a 3D model for
open medium, with a DNS turbulent model (see Ref. 1).
There are two approaches being used to simulate free surface flows numerically. One assumes
potential flow conditions, in which the basic equations to be solved are the Bernoulli equation with a
velocity potential, the kinematical equation of the liquid surface, and the mass conservation equation of the
liquid (see Ref. 2). The other uses a commercial CFD code that incorporates the VOF interface-tracking
technique (see Ref. 3).
Numerous out-of-pile and in-pile experiments have been conducted to obtain information on sodium
boiling, because in the past the power excursion scenario due to positive feedback of sodium void received
the most attention by the LMFBR safety community. Whole-core accident analysis codes, such as SAS4A
(see Ref. 4), have been developed for this purpose: they use a one-dimensional approach for the sodium-
boiling module.
Ref. 1: T. Muramatsu et al., “Validation of Fast Reactor Thermomechanical and Thermohydraulic
Codes”, Final report of a coordinated research project 1996-1999, IAEA-TECDOC-1318, 2002.
Ref. 2: M. Takakuwa et al., “Three-Dimensional Analysis Method for Sloshing Behavior of Fast Breeder
Reactor and its Application to Uni-vessel Type and Multi-vessel Type FBR”, Proc. Int. Conf. on
Fast Reactors and Related Fuel Cycles, Vol. I, Oct. 28-Nov. 1, 1991, Kyoto, Japan.
Ref. 3: Seong-O. Kim et al., “An Analysis Methodology of Free Surface Behavior in the KALIMER Hot
Pool”, Proc. Third Korea-Japan Symposium on Nuclear Thermal Hydraulics and Safety, Oct. 13-
16, 2002, Kyeongju, Korea.
Ref. 4: H.U. Wider et al., “Status and validation of the SAS4A accident code system”, Proc. Int. Topical
Meeting on LMFBR Safety and Related Design and Operational Aspects, Vol. II, p.2-13, Lyon,
1982.
6.12 Scaling and Uncertainty
6.12.1 The scaling issue
The word scaling can be used in a number of contexts: two of these may be listed here.
1. Scaling of an experiment is the process of demonstrating how and to what extent the simulation of a
physical process (e.g., a reactor transient) by an experiment at a reduced scale (or at different values
of some flow parameters, such as pressure and fluid properties) can be sufficiently representative of
the real process in the reactor.
2. Scaling applied to a numerical simulation tool is the process of demonstrating how and to what
extent the numerical simulation tool validated on one or several reduced scale experiments (or at
different values of some flow parameters, such as pressure and fluid properties) can be applied with
sufficient confidence to the real process.
NEA/CSNI/R(2014)12
144
One should emphasise that scaling is meant here in terms of the prediction of a result for the reactor
from a scaled experiment, as defined in Oberkampf & Roy in their book on V&V (2010).
When solving a reactor thermal-hydraulic problem, the answer to the issue may be:
1. Purely experimental: the experiments can tell what would occur in the reactor with sufficient
accuracy and reliability
2. Purely numerical: only numerical simulations are used to solve the problem
3. Both experiments and simulation tools are used to solve the issue.
The first case is not common, and is not considered here since CFD simulation tools are not involved.
The second case is also not common, due to the limited reliability and accuracy of thermal-hydraulic
simulation tools. So we will focus here on the third case, in which both experiments and simulation tools
are used to try to resolve the issue. This means that the simulation tool is used to extrapolate from
experiments to the reactor situation, and that the degree of confidence in this extrapolation is itself part of
the scaling issue.
The extrapolation to a reactor situation made by a single-phase CFD tool introduces several new
aspects, and raises several questions:
How to guarantee that a CFD code can extrapolate from a reduced-scale validation experiment to the
full-scale application?
How to extrapolate nodalisation from a reduced-scale validation experiment to the full-scale
application?
How to extrapolate:
– from one fluid to another?
– to a different value of the Re number and/or to a different value of any other non-dimensional
number important in the physical processes taking place?
In any case, numerical simulation of scaled experiments has a given accuracy defined by the error on
some target parameters, and one should determine how the code error changes when extrapolating to the
reactor situation.
Therefore, scaling associated with a CFD application is part of the CFD code uncertainty evaluation,
and is a necessary preliminary step in this uncertainty evaluation.
Both scaling and uncertainty are closely related to the process of Validation and Verification. The
definition of a metric for the validation is also part of the issue.
6.12.2 The scaling methodologies
6.12.2.1 General problems of scaling
Scaling analyses address the following question: how experimental results can be transferred from
experimental conditions to prototype conditions if differences exist with respect to the following
parameters:
i. Geometrical dimensions, power and shapes (e.g., small-scale experiments)

NEA/CSNI/R(2014)12
145
ii. The choice of materials (e.g., helium instead of hydrogen in the atmosphere, artificial aerosols
BiO2 instead of Sr or Cs)
iii. Time scales (e.g., accelerated thermal ageing), or material loads (e.g., artificial irradiation
sources).
In order to transfer experimental results to prototype conditions, the experimental data are often
condensed in the form of correlations for use in a numerical code. These correlations are expressed as
relations among non-dimensional pi-monomials, but what pi-monomial should be selected in order to scale
a given magnitude correctly to prototype conditions?
In this case, the structure of the code variables must be taken into account. Generally, codes are
formulated in terms of local coordinates; this means that introduction of non-local interaction terms (e.g.
heat transfer correlations with local coordinate dependency, such as the distance from the entrance of the
pipe) are difficult to implement.
Also, the correlations for lumped-parameter codes may be quite different from the corresponding
correlations for CFD codes. For instance, two-phase heat transfer correlations for a 1D channel in TH-
codes depends in general on average channel magnitudes, and are not applicable to CFD codes. Frequently,
a result of a scaling analysis is a scale-independent correlation that is derived from experiments and is
often implemented in a computer code for simulating some phenomena, like heat transfer, or condensation
rate.
6.12.2.2 General methodology on scaling H2TS
For application in nuclear reactor safety, a comprehensive methodology named H2TS (“Hierarchical
Two Tiered Scaling”) was developed by a Technical Program Group of the U.S. NRC under the
chairmanship N. Zuber. This work provided a theoretical framework and systematic procedures for
carrying out scaling analyses. The name is based on using a progressive and hierarchised scaling
methodology, organised in two basic steps. The first one is a top-down (T-D) approach and the second a
bottom-up (B-U) approach.
The first step (T-D) is organised at the system or plant level, and is used to deduce non-dimensional
groups obtained from the mass (M), energy (E) and momentum (MM) conservation equations, derived
from the systems that have been considered as important according to a Phenomena Identification and
Ranking Table (PIRT) exercise. These non-dimensional groups are used to establish the scaling hierarchy;
i.e., what phenomena have priority in order to be scaled, and to identify what phenomena must be included
in the bottom-up analysis.
The second part of the H2TS methodology is the B-U analysis itself. This is a detailed analysis at the
component level, performed in order to assure that all relevant phenomena are properly represented in the
balance equations that govern the evolution of the main variables in the different control volumes.
Most important steps to perform in the scaling analysis
This step consists of decomposition of the plant or system using the following hierarchy:
1. Systems (S): i.e., coolant system of a PWR.
2. Sub-systems (SS): RPV, accumulators, PRZ, RCP, SG.

NEA/CSNI/R(2014)12
146
3. Modules or Components (M): e.g., for the RPV, the main components are the downcomer, the
reactor core, the lower plenum and upper plenum.
4. The components are divided in its constituents (C): e.g., the SG is divided into the 1-Ф tube side, the
internals and the 2-Ф side.
5. The constituents are divided into phases (P): gas, liquid or solid.
6. Each phase can adopt different geometrical configurations (G): e.g., the liquid phase can be in the
form of drops, liquid in the bulk, or liquid on the walls (condensate).
7. Each geometrical configuration is described by three conservation equations: Mass (M), Energy (E)
and momentum (MM).
8. Finally, each conservation equation can be attributed different transfer processes.
II. The second step of the scaling analysis is to identify the scale level at which we must develop the
similarity criteria. This is determined by the phenomena to be considered.
III. Once we have identified the scaling level, we must define all the control volumes and flow paths
(convective and diffusive) connecting the identified control volumes (CV) of the system. Then we set the
conservation equations in each CV previously identified (M, E, MM) and non-dimensionalise these
conservation equations. After non-dimensionalisation, of the terms of the conservation equations, we will
notice that they appear multiplied by groups of pi-monomials, known as Ξ groups. These groups can be
expressed in terms of a minimum set of pi-monomials for each specific problem. Comparing the values of
the different Ξ groups that appear in a given equation, we can assess the relative importance of each
individual transfer process that contributes to a given conservation equation in a given CV.
IV. It is from these groups of pi-monomials that we deduce the scaling relations between the model and the
prototype, and the distortions.
From simple to complex cases of scaling
The classical methods of dimensional analysis normally valid for simple non-interacting systems aim
to produce the non-dimensional numbers that control a given phenomenon. These methods are usually
applicable to relatively simple situations or single phenomena (such as heat transfer or frictional pressure
loss), where the length and time scales of the problem are rather unique, and well-defined.
The classical, well-established methods are:
i) Use of the Buckingham Pi theorem: i.e., combination of all relevant variables to form
dimensionless groups.
ii) Dimensionless numbers from known governing equations.
iii) To form dimensionless numbers as ratios of “competing quantities”, like force balances (for
instance the Reynolds number formed as the ratio of the inertial to viscous forces).
iv) Dimensionless numbers as ratios of characteristic times for exchange of mass, energy and
momentum over specified areas and volumes.
In analysing complex systems, where several phenomena interact at different spatial and time scales,
one faces difficulties in applying the classical methods, since the multiplicity of scales results in too many
non-dimensional numbers that cannot be assigned identical values, and therefore all the similarity
conditions cannot be satisfied simultaneously.
NEA/CSNI/R(2014)12
147
In a certain number of scaling analyses, computer codes have been used. This may yield useful results
in some cases, but codes rely on certain closure relations, and the scaling of these correlations must be
assured. For example, a well validated code capable of spanning a range of scales could conceivably be
used to simulate the behaviour of scaled facilities, verify the adequacy of the scaling and quantify the
distortions. However, if one had sufficient faith in the predictions of a code at different scales, then tests at
reduced scales and scaling analyses would not be needed. But this does not seem to be the case.
6.12.2.3 Fractional Scaling Analysis
The fractional scaling analysis method originated during the course of a program designed to scale
severe accidents (Zuber 1991). For the purposes of thermal hydraulics, the information entities of interest
in Zuber terminology are mass, momentum and energy, and the agents of change are fluxes of mass,
momentum and energy across the system boundaries.
Fractional scaling is based on the integral approach, given that the interest is in spatial–temporal
scaling of a system; that is, an aggregate of interacting components. Furthermore, the integral formulation
has the following additional attributes:
1. it addresses and quantifies changes of a state variable within and around a finite region of space;
2. it is applicable to an aggregate of interacting components;
3. it introduces in the scaling analysis the initial and/or boundary conditions of interest to a specific
problem;
4. it allows the inclusion of two important concepts ─ turnover time and turnover length; as an
example, the first for a given volume V is defined as the inverse of the replacement frequency ;
5. the path integrals introduce in the scaling analysis the concept of action, which relates the initial
energy and the turnover time.
Fractional scaling is used to provide a synthesis of experimental data to generate quantitative criteria
for assessing the effects of various designs and operating parameters on thermal-hydraulic processes in a
nuclear power plant (NPP). The synthesis via fractional scaling is carried out at three hierarchical levels:
process, component and system. The fractional scaling analysis (FSA) identifies dominant processes, ranks
them quantitatively according to their importance, and provides thereby an objective basis for establishing
phenomena identification and ranking tables (PIRTs) as well as a basis for conducting uncertainty
analyses.
Consider a region of space referred to as the module M, characterised by a state variable SV,
undergoing a change caused by an agent denoted by Φ, then one writes:
dt
dSV.
Zuber defines the fractional rate of change (FRC) of this state variable SV as:
1
Effect
Cause
SVdt
dSV
SV
1
.
The FRC is the inverse of the characteristic time for the process causing the change.
If we have several agents Ф1,Ф2… causing the change, then the fractional rates of changes FRCs
quantify the intensity of each process (agent of change) affecting the state variables in terms of what
fraction of the variable total change the agent was responsible for. The spatial scale (characteristic length)

NEA/CSNI/R(2014)12
148
for a magnitude being transferred across an area A and integrated (felt) within a volume V, is given by the
inverse of the transfer area concentration A/V.
Two time scales are assigned to each module M, the first is the “clock” time; the time during which
the change is being observed. The second is the “process” time τ that characterises the change of a state
variable SV caused by a particular agent of change. Two or more interacting modules, each having its own
state variable SV, form an aggregate, and can be modelled as an aggregate-module characterised by an
effective state variable. Also, it is possible to have a module M with a state variable acted upon by two
agents Φ1 and Φ2.
Another important element of fractional scaling analysis is the effect metric Ω, which quantifies the
effect that the agent of change Φ has on one state variable during a period of time δt, and is given by
Ω=ωδt. Consequently, processes having the same effect metric will be similar because their state variables
have been changed by the same fractional amount.
The application of FSA to NPPs can be structured by addressing the problem at three hierarchical
levels, process, component and system. According to Zuber, at each hierarchical level one considers
questions of increasing complexity:
At the process level, the question is what is the effect on the change of the corresponding state
variable?
At the component level the questions are: given a component, what are the effects of various
processes on the change of a state variable? What is the ranking of their importance in that change?
What are the effects of scale distortions in geometry and/or time on the change of a state variable?
At the system level, the questions are: given a system and a postulated TH scenario, what are the
governing processes and the corresponding components? What is the ranking of their importance
on the postulated TH process? What are the effects of the component distortions, if present? What
are the component interactions?
The purpose of applying FSA to a NPP is to develop a method that can address all these questions at
all levels of interest. The application of FSA is structured at the three levels mentioned earlier: process,
component and system.
At the process level, a synthesis of the parameters governing a particular process is achieved
through the effect metrics Ω.
At the component level the synthesis is performed on process via the effect metrics Ω. When
several processes act together to change a state variable in a given component, the effect of each
one is quantified by the corresponding effect metric Ω. In this way ordering the effect metrics by
their magnitudes generates the hierarchy of processes, i.e. it ranks the importance of the processes
by their change in a given component. Therefore, this level produces quantitative criteria for
identifying governing processes that must be addressed in computations and experiments. For code
developers, this process hierarchy provides rational guidance and justification for simplifying
computer models and for concentrating on the important processes. For experiments, it establishes
scaling priorities.
At the system level, the synthesis is performed via the system matrix, which combines the
components as rows with their processes as columns. For a given component, the associated row ranks the
effect of each process by the Ω as a percentage change of a given quantity. For a given process, the column
ranks the effect of that process on each component according to its Ωj.

NEA/CSNI/R(2014)12
149
6.12.2.4 Examples of scaling analyses for an experiment
According to Wulff (1996), the purpose of scaling analyses is to provide:
1. the design parameters for reduced-size test facilities;
2. the conditions for operating experiments, such that at least the dominant phenomena taking place
in the full-size plant are reproduced in the experimental facility over the range of plant conditions;
3. the non-dimensional parameters that facilitate the efficient and compact presentation and
correlation of experimental results, which, by virtue of similarity and the parameter selection,
apply to many systems, including both the test facility and the full size plant;
4. to identify the dominant processes, events, and characteristics (properties), all called here
collectively “phenomena”, to substantiate quantitatively, or revise, the expert-opinion-based, but
still subjective, ranking of phenomena in the order of their importance, i.e. the ranking which is
normally arranged in the Phenomena Identification and Ranking Table (PIRT);
5. to select among all the available test facilities the one that produces optimal similarity and the
smallest scale distortion, and to establish thereby the test matrix;
6. to provide the basis for quantifying scale distortions; and
7. to derive the scaling criteria, or simulating component interactions, within a system from the global
component and system models, with the focus on systems, rather than component scaling.
Traditional scaling analyses embody first normalizing the conservation equations on the subsystem or
component level for the test section, then repeating this subsystem level scaling for all the components in
the system, and collecting all the local scaling criteria into a set of system scaling criteria. The claim is then
made that the dynamic component interaction and the global system response should be scaled successfully
with the set of criteria for local component scaling, because the system is the sum of its components. This
principle applies only if all the local criteria are met, and complete similitude exists. Complete similitude,
however, is physically impossible, because all scaling requirements cannot be met simultaneously for a
system in which areas and volumes, and, therefore area-dependent transfer rates and volume-dependent
capacities, scale with different powers of the length parameter, and thereby produce conflicting scaling
requirements.
Scaling groups can be derived using several methods, but two fundamental principles of scaling must
be met (Wulff, 1996):
the governing equations are normalised such that the normalised variables and their derivatives with
respect to normalised time and space coordinates are of order unity, and the magnitude of the
normalised conservation equation is measured by its normalising (constant) coefficient;
the governing equations are then scaled by division through by the coefficient of the driving term;
this renders the driving term of order unity, and yields fewer non-dimensional scaling groups, which
measure the magnitudes of their respective terms, and therewith the importance of the associated
transfer processes, relative to the driving term.
A categorisation of scaling approaches can be found, e.g., in Yadigaroglu & Zeller (1994).
The simplest scaling technique is linear scaling, in which all length ratios are preserved: the mass,
momentum and energy equations of a system, along which the equation of state, are non-
dimensionalised, and scaling criteria are then derived from the resulting parameters; linear scaling
leads to time distortion.
NEA/CSNI/R(2014)12
150
Volumetric or time-preserving scaling is another frequently used technique, also based on scaling
parameters coming from the non-dimensionalised conservation equations; models scaled by this
technique preserve the flow lengths, while areas, volumes, flow rates and power are reduced
proportionally.
Time-distorted scaling criteria, described e.g. in Ishii & Kataoka (1984), include both linear and
volumetric scaling as special cases, see Kiang (1985).
A “structured” scaling methodology, referred to as hierarchical two-tiered scaling (H2TS), and
proposed by Zuber (see e.g. Zuber, 1999), addresses the scaling issues in two tiers: a top-down
(inductive) system approach, followed by a bottom-up, process-and-phenomena approach, since
traditional local and component-level scaling cannot produce the scaling criteria for component
interaction.
The last approach is described, e.g., also in Zuber et al. (1998) and Wulff (1996), but its principles
and procedures can be best made clear by its application to design of the APEX test facility (Advanced
Plant Experiment, Oregon State University), see Reyes & Hochreiter (1998). A short summary of their
analysis follows. The objective of this scaling study was to obtain the physical dimensions of a test facility
that would simulate the flow and heat transfer during an AP600 Small Break LOCA. The APEX scaling
analysis was divided into four modes of operation, each corresponding to a different phase of the
SBLOCA:
closed loop natural circulation;
open system depressurization;
venting, draining and injection;
long-term recirculation.
For each mode of AP600 safety system operation, the following specific scaling objectives were met:
the similarity groups, which should be preserved between the test facility and the full-scale
prototype, were obtained;
the priorities for preserving the similarity groups were established;
the important processes were identified and addressed;
the dimensions for the test facility design, including the critical attributes, were specified; and
the facility biases due to scaling distortions were quantified.
To achieve this, eight tasks had to be performed during the scaling analyses.
To specify experimental objectives.
To prepare the SBLOCA Plausible Phenomena Identification and Ranking Tables (PPIRTs) for each
of the phases of a typical SBLOCA transient. Existing data on standard PWRs, coupled with
engineering judgment and calculations for the AP600, were used to determine which SBLOCA
thermal-hydraulic phenomena might impact core liquid inventory or fuel peak clad temperature.
H2TS analysis for each phase of the SBLOCA was performed. The four basic elements of the H2TS
method are:
System subdivision. The AP600 was subdivided into two major systems: a reactor coolant system
and a passive safety system. These systems were further subdivided into interacting subsystems

NEA/CSNI/R(2014)12
151
(or modules), which were further subdivided into interacting phases (liquid, vapour or solid).
Each phase was characterised by one or more geometrical configurations, and each geometrical
configuration was described by one or more field equations (mass, energy and momentum
conservation equations).
Scale identification. The scaling level (system level, subsystem level, component level,
constituent level) depending on the type of phenomena being considered was identified. A set of
control volume balance equations was written for each hierarchical level.
Top-down scaling analysis. For each hierarchical level, the governing control volume balance
equations were written and expressed in dimensionless form by specifying dimensionless groups
in terms of the constant initial and boundary conditions. Numerical estimates of the characteristic
time ratios, Πk, were obtained for the prototype and the model for each phase of the transient at
each hierarchical level of interest. Physically, each characteristic time ratio is composed of a
specific frequency, ωk, which is an attribute of the specific process, and the residence time
constant, τk, for the control volume. The specific frequency defines the mass, momentum or
energy transfer rate for a particular process. The residence time defines the total time available
for the transfer process to occur within the control volume. If Πk<<1, only a small amount of the
conserved property would be transferred in the limited time available for the specific process to
evolve, and the specific process would not be important to the phase of the transient being
considered. On the other hand, if Πk≥1, the specific process evolves at a high enough rate to
permit significant amounts of the conserved property to be transferred during the time period τk.
Bottom-up scaling analysis. This analysis provided closure relations for the characteristic time
ratios. The closure relations consisted of models or correlations for specific processes. These
closure relations were used to develop the final form of the scaling criteria for purposes of scaling
the individual processes of importance to system behaviour.
The scaling criteria were developed by setting the characteristic time ratios for the dominant
processes in the AP600 to those for APEX at each hierarchical level.
The effect of a distortion in APEX for a specific process was quantified by means of a distortion
factor DF, which physically represents the fractional difference in the amount of conserved property
transferred through the evolution of a specific process in the prototype to the amount of conserved
property transferred through the same process in the model during their respective residence times. A
distortion factor of zero means that the model ideally simulates the specific process.
System design specification. The outcome of the scaling analysis was therefore a set of characteristic
time ratios (dimensionless Π groups) and similarity criteria for each mode of operation. These
scaling criteria were expressed in terms of ratios of model to prototype fluid properties, material
properties, and geometrical properties. Now, working fluid, component materials, operating pressure,
and the length, diameter and time scales can be selected.
Evaluation of key T/H PPIRT processes to prioritise system design specification.
APEX test facility design specifications and Q/A critical attributes.
Recently, Yun et al. (2004) developed a new approach, called the modified linear scaling method,
from the incompressible, two-dimensional, two-fluid model for an annular and annular-mist flow patterns
without a priori considering the interfacial heat transfer. In the dimensionless governing equations, the
aspect ratio of the downcomer (the ratio between a height and a lateral length of downcomer) was
preserved as in a prototype, and the velocity of each phase was normalised by introducing the Wallis
parameter, which means the ratio between the inertia force and the gravitational force. The dimensionless
parameter was also used for the analysis of the UPTF Test 21D (MPR-1329, 1992) and it is defined as
follows;

NEA/CSNI/R(2014)12
152
1/ 2
*
( )
kk k k
f g
j ug d
The scaling criteria required for the modified linear scaling method are listed in the Table below,
where they are also compared with those for the standard linear scaling method.
Table: Comparison of the scaling methodologies
The present scaling method requires the same geometrical similarity as in the case of the standard
linear scaling method, whereas the flow velocity for steam and ECC water should be scaled in the form of
the Wallis type of a dimensionless velocity. In this scaling method, the velocity and time scales are reduced
according to the square root of the length scale. This naturally leads to preserving the gravity effect on the
flow phenomena even in the scaled tests.
The subject of scaling is very broad and cannot be dealt with in depth in this document. For CFD
applications to NRS, it is comforting that, in principle, the computational model can be at 1-1 scale, but it
remains important to ensure that the fluid-dynamic phenomena of relevance, validated against scaled
experiments, have been preserved. This may be difficult if the fluid behaviour is categorised by flow-
regime maps.
6.12.2.5 Example of non-dimensional analysis applied to CFD Codes
Each term in the conservation equations is associated to a physical process, and each one of these
processes has inherent length and time scales. One of the most important tools for determining the relative
magnitude of the various terms, and in this way to reduce the number of true parameter in the equations, is
through non-dimensional scaling analysis.
There are three are main objectives of the non-dimensional analysis applied to CFD codes. The first is
to know the non-dimensional numbers, such as Reynolds number Re, Prandtl number, Schmidt number,
and so on, that govern the solution of the given problem. The second one is to understand the relative
magnitudes of the various processes that contribute to a given conservation equation, and to reduce the

NEA/CSNI/R(2014)12
153
number of true parameters in the equations. The third is to make the equations more tractable for numerical
solution once all the non-dimensional variables have the same order.
The first step is therefore the conversion of the instantaneous conservation equations to their non-
dimensional forms in order to see the dependence of these equations with the classic non-dimensional
numbers for different situations. The non-dimensionalisation of the conservation equations in Cartesian
coordinates can be performed in different ways. To show the physical sense of all the terms is better to
define the non-dimensional magnitudes as follows:
g
gg
pp
ppptf
t
tt
L
xx
u
uu
j
j
j
ji
,,,,,,000
0
000
, (1)
where the sub-index 0 denotes the reference values for the problem, and p0-p∞ is the reference pressure
difference.
Also we need to non-dimensionalise the boundary conditions: for instance, if we have an inlet boundary
condition, we set:
(2)
The conservation equation for the i-th component of the momentum of an incompressible fluid is:
(3)
That, after non-dimensionalisation yields:
(4)
where we have used the standard definition of the Reynolds (Re), Strouhal (St), Froude (Fr) and Euler (Eu)
numbers:
(5)
In some flows, the boundary conditions define additional dimensionless numbers that do not appear
explicitly in the conservation equations. Equation (4) is written in non-dimensional form, but is not
necessary normalised. In order to normalise the equation properly, we need to choose the scaling
parameters L0, u0, t0,…appropriately for the flow problem being analysed in such a way that all non-
dimensional magnitudes, such as p+, t+, u+,… are of order of magnitude unity. Once we have normalised,
the momentum conservation equations, we can compare the relative importance of the different terms in
these equations by comparing the relative magnitudes of the coefficients of these terms, expressed in terms
of well-known non-dimensional numbers.
We note in equation (4) that if all the physical magnitudes are properly normalised, then, if for
instance for a given flow the Reynolds number is large, then advection dominates over the diffusion. If the
Froude number is large, the gravity effects are negligible. In this way, we can know for a given problem
what the most important terms are, and which terms can be neglected.
Let us turn our attention to the energy equation. In this case, for the sake of simplicity, we consider an
incompressible flow with constant heat capacity, cp, and we neglect the viscous heat generation and the
compression work terms. With these simplifications the energy conservation equation can take the form:
(6)
0
i,in
i,inu
uu
i2
j
i
2
ij
i
jig
x
u
x
p1
x
uuu
t
i22
i
i
2
ij
iji g
Fr
1
x
u
Re
1
x
pEu
x
uuu
tSt
2
00
0
0
0
0
0o
0
000
u
ppEu,
Lg
uFr,
u
LfSt,
LuRe
h
jjj
jppST
xk
xx
TucTc
t

NEA/CSNI/R(2014)12
154
The non-dimensionalisation of this equation is performed using expressions (1) and (2) and the
additional definitions:
;0k
kk
;0
0
T
TTT
;/ 0000
0
LuTc
SS
p
hh
(7)
where St is the Strouhal number, and
0
00Pr
k
cp is the Prandtl number. This means that if the Peclet
number (= RePr) number is large, then advection dominates over diffusion in problems involving
temperature change.
For the transport of a passive scalar a, with mass fraction Φa and concentration Ca = ρφa (kg/m3), the
conservation equation is given by:
(9)
where Γ is the diffusion coefficient. The non-dimensionalisation of this equation is performed defining the
following non-dimensional variables:
(10)
Then, on account of definitions (1) and (10), the conservation equation (9), for the concentration of a
passive scalar a, can be recast in the form:
(11)
where we have used the definition of the Schmidt number:
(12)
In this case, the non-dimensional numbers that govern the importance of the diffusion process are the
Reynolds and the Schmidt numbers.
We note that if all the physical magnitudes, geometric data, boundary conditions and source terms of
a given problem are expressed in non-dimensional form, the solution of that given problem will be
obtained by solving the non-dimensional conservations equations with the non-dimensional boundary
conditions for that specific problem, and that two different problems with the same non-dimensionalised
boundary conditions and geometric data in non-dimensional form will have the same non-dimensional
solution, if it is verified that certain non-dimensional numbers are the same for the two problems. In this
case, we can say that the two problems are similar. We note that this step is not required for the solution of
a flow problem, because most of the CFD codes work with dimensional variables, but makes the problem
set-up and subsequent analysis more convenient.
6.12.3 System code uncertainty methodologies
Code uncertainty methodologies for reactor thermal hydraulics were first developed for system codes,
which simulate many kinds of transients in a very large range of single-phase and two-phase conditions.
They were based on either propagation of the uncertainty of input parameters (so called uncertainty
propagation methods) or accuracy extrapolation methods (see D’Auria & Galassi, 2010). But in other
communities such as ASME, AIAA, marine hydrodynamics (F. Stern, et al,, 2001), other approaches
aa
j
aj
j
a Sx
uxt
)u/L(
SS,,,
000,a0
a
a
0
0
0,a
a
a
0
aa
jj
aj
j
aS
xxScRe
1u
xtSt
00
0
00
0
000
0
ReSc
1
uL
1
uL

NEA/CSNI/R(2014)12
155
adapted to CFD were more recently defined. These will be described in § 1.5. The system methods are
described first.
The method using propagation of code input uncertainties follows the pioneering work of CSAU
(NED Special Issue, 1990), later extended by GRS (Glaeser et al, 1994). It is the most often used method.
Uncertain input parameters are first listed, including initial and boundary conditions, material properties
and closure laws. Probability density functions (pdfs) are formulated for each input parameter. Then these
uncertainties are propagated by running a reactor simulation using the system code. In the GRS method, a
Monte Carlo approach is followed, with all input parameters being varied simultaneously according to their
pdfs. The Wilks theorem is often used, which makes it possible to estimate the boundaries of the
uncertainty range on any code response with a given degree of confidence. The number of code runs is
around 100 for an acceptable degree of confidence, though a slightly higher number of code runs, typically
150 to 200, is advisable to have a better precision on the uncertainty ranges of the code response. The
determination of the uncertainties of the closure laws can be made by simple engineering judgment, or
better by some statistical approach, which use sensitivity methods and the results from many validation
calculations (see de Crécy and Bazin, 2001-2004).
The method identified as propagation of code output errors is based upon the extrapolation of
accuracy, i.e. UMAE (D’Auria & Debrecin, 1995) and CIAU (D’Auria & Giannotti).
Benchmarking of the two approaches was made within international projects launched by the
OECD/CSNI. These are UMS (OECD/CSNI. 1998) and BEMUSE (de Crécy et al., 2007). These methods
have now reached a reasonable degree of maturity, even if the quantification of the uncertainty of the
closure laws remains a difficult issue.
The method using propagation of code input uncertainties require many calculations, which may be
difficult in the context of CFD due to large required CPU times involved. Accuracy extrapolation methods
require only one reactor simulation, but many preliminary validation calculations of Integral Test Facilities
are required. The preliminary validation calculations are also required for propagation methods to
determine the uncertainties of the closure laws if statistical methods are used. In this case, the calculated
tests are Separate Effect Tests. In both propagation and extrapolation methods, the experimental
uncertainties have to be taken into account.
6.12.4 Particularities of single-phase CFD applications
Many differences exist between the system codes, which solve mainly two-phase problems, and
single-phase CFD tools:
Single-phase CFD tools have very few physical models (turbulent viscosity, wall functions,…),
whereas system codes include hundreds of closure laws for wall transfers and interfacial transfers for
each flow regime, and for each flow geometry.
Single-phase flow issues depend on a relatively small number of non-dimensional numbers
compared to two-phase flow issues where many non-dimensional numbers may be involved. The
scaling of a single-phase flow is more straightforward and more reliable than in two-phase situations
for which many simplifying assumptions are often necessary.
Single phase CFD tools propose many options for the physical models (k-ε, k-ω, RST, SST, RNG k-
ε, LES, DES,…) whereas system codes generally propose one set of standard validated closure laws.
No extended validation exists for each physical option.

NEA/CSNI/R(2014)12
156
Single-phase CFD tools have many options available for the numerical scheme, whereas system
codes generally propose just one (CATHARE, ATHLET, TRACE, SPACE) or two (RELAP-5,
TRAC).
Single-phase CFD tools do not propose a comprehensive validation matrix for each set of physical
and numerical options, whereas system codes generally propose a very large validated matrix
applied to a standard set of closure laws.
Single-phase CFD tools may have CPU time difficulties to run simulations with a converged mesh
and time step. Therefore, many applications may have significant numerical errors. This numerical
error may be equal or larger than the error due to physical modelling. System codes may also use
non-converged meshing, but generally the numerical error is much smaller than the error due to
physical modelling, so that the latter may be ignored in the uncertainty analysis.
Single-phase CFD tools are able to simulate the effects of small-scale geometrical details of the
flow, whereas system codes are macroscopic tools which simplify the geometry of the flow and
effects of small-scale geometrical details (e.g. geometry of spacer grids in a fuel assembly) are
embedded in the closure laws which were fitted to data from prototypical experiments.
In summary, one can list the favourable and unfavourable aspects of scaling as an issue to be treated
by single-phase CFD, compared to two-phase issues, as follows.
The favourable aspects are:
Single-phase flow issues depend on a relatively small number of non-dimensional numbers. The
scaling is straightforward and reliable, since it does not require many simplifying assumptions.
Single-phase CFD tools have very few physical models the scalability of which has to be proven.
The simplifications of the flow geometry for single-phase CFD tools are less frequent and less
extreme than for system codes. Consequently, the portability of a physical model from a specific
geometry to another one has not to be proven.
The unfavourable aspects are:
When extrapolating from a scaled experiment simulation to a reactor simulation, the scalability of
the numerical scheme and of the nodalization has to be investigated in addition to the scalability of
the physical models.
If CFD is used with some degree of simplification of the geometry, the impact of such
simplifications should be taken into account in the scaling and uncertainty evaluation.
Methodologies for scaling and uncertainty evaluation which would require many calculations would
become very difficult in the context of CFD due to the high CPU cost of the calculations.
Since several options for the physical models (turbulence, wall laws) and several numerical schemes
are possible, if Best Practice Guidelines are not giving precise criteria to select the best choice of
options, this represents an additional source of uncertainty which must be taken into account.
Always for uncertainty evaluation, if a method of uncertainty propagation is chosen, quantifying the
input uncertainties is a more complex issue than for a system code.
The absence of the results of a comprehensive validation matrix for single-phase CFD does not help
in the scaling process.
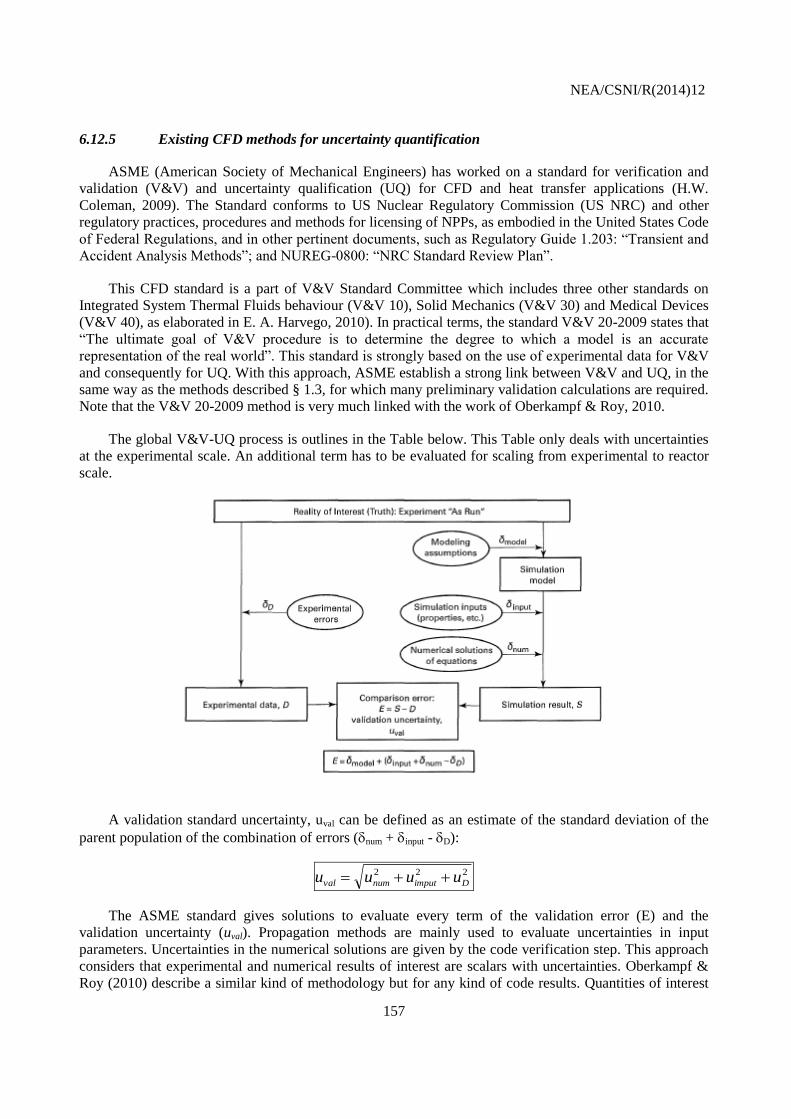
NEA/CSNI/R(2014)12
157
6.12.5 Existing CFD methods for uncertainty quantification
ASME (American Society of Mechanical Engineers) has worked on a standard for verification and
validation (V&V) and uncertainty qualification (UQ) for CFD and heat transfer applications (H.W.
Coleman, 2009). The Standard conforms to US Nuclear Regulatory Commission (US NRC) and other
regulatory practices, procedures and methods for licensing of NPPs, as embodied in the United States Code
of Federal Regulations, and in other pertinent documents, such as Regulatory Guide 1.203: “Transient and
Accident Analysis Methods”; and NUREG-0800: “NRC Standard Review Plan”.
This CFD standard is a part of V&V Standard Committee which includes three other standards on
Integrated System Thermal Fluids behaviour (V&V 10), Solid Mechanics (V&V 30) and Medical Devices
(V&V 40), as elaborated in E. A. Harvego, 2010). In practical terms, the standard V&V 20-2009 states that
“The ultimate goal of V&V procedure is to determine the degree to which a model is an accurate
representation of the real world”. This standard is strongly based on the use of experimental data for V&V
and consequently for UQ. With this approach, ASME establish a strong link between V&V and UQ, in the
same way as the methods described § 1.3, for which many preliminary validation calculations are required.
Note that the V&V 20-2009 method is very much linked with the work of Oberkampf & Roy, 2010.
The global V&V-UQ process is outlines in the Table below. This Table only deals with uncertainties
at the experimental scale. An additional term has to be evaluated for scaling from experimental to reactor
scale.
A validation standard uncertainty, uval can be defined as an estimate of the standard deviation of the
parent population of the combination of errors (num + input - D):
222
Dimputnumval uuuu
The ASME standard gives solutions to evaluate every term of the validation error (E) and the
validation uncertainty (uval). Propagation methods are mainly used to evaluate uncertainties in input
parameters. Uncertainties in the numerical solutions are given by the code verification step. This approach
considers that experimental and numerical results of interest are scalars with uncertainties. Oberkampf &
Roy (2010) describe a similar kind of methodology but for any kind of code results. Quantities of interest

NEA/CSNI/R(2014)12
158
are considered as “p-box” entities, which are probability distributions considering epistemic uncertainties.
Similar addition of terms is made to evaluate the code uncertainties, but specific mathematics for
probability distributions are used. This approach can be more suitable for complex quantities of interest
(for example CFD transient results).
Scaling uncertainty is not discussed in the ASME standard, but a chapter is dedicated to “prediction”
in the work of Oberkampf & Roy. The main issue of error and uncertainties evaluation for scaling is that
the "real" quantity of interest at reactor scale is generally unknown. One option is to use only code results
to evaluate the scaling uncertainties. The main assumption then is to consider that the variation of code
results between facility and reactor scale is equivalent to “real” variation between the scales. Another
option is to use multiple experiments with a variation of scaling factors, like Reynolds or Froude Numbers.
If available, a set of experiments can lead to the definition of a validation domain that contains the
application domain, or gives some information for extrapolation outside of the validation domain.
The ASME standard methodology for uncertainty analysis underlines the role of V&V in the process
of evaluating the confidence level of CFD code results. Uncertainties have to be evaluated step-by-step,
using clearly defined numerical aspects of the code, such as time and space discretisation (i.e. time step
and mesh convergence), or physical models (turbulence models, physical assumptions) with associated
error evaluation.
The ASME committee intends to publish a supplement of this standard that will include an extension
(as well as multivariate validation metrics). A presentation was made by P. Roache at the ASME 2012
V&V Symposium summarising the work in progress:
- The distinction between model quality vs. quality of the validation exercise.
- A brief review of interpolation vs. extrapolation curve-fitting, especially for high-dimensional
parameter spaces.
This new version of the Standard V&V 20 is scheduled for release in 2012.
6.12.6 Some recommendations with regard to scaling associated to CFD applications
For solving a reactor safety issue by the application of single-phase CFD, several successive steps are
necessary:
1. Scaling analysis is the first step. For this, the methods described above (H2TS and FSA) are
recommended. These include:
Use of a PIRT to identify the dominant physical phenomena and their influence parameters to
obtain a trustworthy analysis (see US-NRC Regulatory Guide 1.203)
The identification of the non-dimensional numbers that play an important role in the physical
processes taking place; this is part of the PIRT analysis
The selection of relevant experimental data, or the definition of new experimental programs.
2. Selection of a CFD code and choice of the relevant physical and numerical options, and
nodalisation; the choices should be made in accordance with Best Practice Guidelines, if they exist
for this application. Otherwise, the choice among different numerical schemes and/or different
physical models must be taken into account in terms of an uncertainty analysis.
3. Simulation of the relevant experimental data, as detailed elsewhere in this document.

NEA/CSNI/R(2014)12
159
4. Identification of the scale distortions of the available experimental data compared to the reactor
application:
Are there different values of the non-dimensional numbers?
Are there significant differences in the geometry of the flow?
5. If an interpolation or an extrapolation from the values of the non-dimensional numbers of the
experimental data to the values of the reactor application can give a sufficient confidence on the
CFD simulation of the reactor case, the scalability of the CFD tool is good. This may be the case
when the CFD simulations of several experiments having various values of the non-dimensional
numbers are equally accurate. In case the scalability of the CFD is not evident, a quantitative
evaluation of the CFD uncertainty has to be made either by accuracy extrapolation or by
uncertainty propagation.
6. If there are significant differences in the geometry of the flow between the experiments and the
reactor application, it should be demonstrated that this does not affect the accuracy of the
simulation.
7. The numerical scalability of the CFD application should be considered for the whole process of
experiments and reactor simulations. Several cases are possible:
if all experiments and reactor simulations were performed with converged time step and mesh
size, and with full control of all numerical errors (see Best Practice Guidelines), there is no
numerical scalability problem.
If some experiments or reactor simulations were performed with a non-fully-converged time step or
mesh size, the numerical error should be estimated for each calculation to see if it is scale dependent. If
necessary, such scale dependence should be taken into account in an uncertainty methodology. The
Richardson method may be applied to estimate the numerical error.
Ref. 1: F. D’Auria, G.M. Galassi, “Scaling in nuclear reactor system thermal hydraulics”, Nuclear
Engineering & Design, doi:10.1016/j.nucengdes.2010.06.010, 2010.
Ref. 2: F. D’Auria, N. Debrecin, G.M. Galassi, “Outline of the Uncertainty Methodology based on
Accuracy Extrapolation (UMAE)”, Nuclear Technology, 109(1), 21-38 (1995).
Ref. 3: F. D’Auria, W. Giannotti, “Development of Code with Capability of Internal Assessment of
Uncertainty”, Nuclear Technology, 131(1), 159-196 (2000).
Ref. 4: S. Banerjee, M.G. Ortiz, T.K. Larson, D.L. Reeder, “Scaling in the safety of next generation
reactors”, Nuclear Engineering and Design, 186, 111–133 (1998).
Ref. 5: H.K. Cho, et al., “Experimental Validation of the Modified Linear Scaling Methodology for
Scaling ECC Bypass Phenomena in DVI Downcomer”, Nuclear Engineering & Design, 235,
2310-2322 (2005).
Ref. 6: H.K. Cho, et al., “Experimental Study for Multidimensional ECC Behaviors in Downcomer
Annuli with a Direct Vessel Injection Mode during the LBLOCA Reflood Phase”, J. of Nuclear
Sci. & Technol., 42(6), (2005).
Ref. 7: H.W. Coleman, et al., “Standard for Verification and Validation in Computational Fluid Dynamics
and Heat Transfer”, ASME V&V 20-2009.
Ref. 8: A. de Crecy, P. Bazin, “Quantification of the uncertainties of the physical models of CATHARE
2”, M&C 2001, Salt lake City, Utah, USA, September 2001, ANS Winter Meeting, Washington,
DC, USA, Nov. 14-18, 2004.
Ref. 9: A. de Crécy, P. Bazin (Eds.) et al., Fujioka, Bemuse Phase III Report, Uncertainty and Sensitivity
Analysis of the LOFT L2-5 Test, OECD/CSNI Report NEA/CSNI/R(2007)4, October 2007.

NEA/CSNI/R(2014)12
160
Ref. 10: E.A. Harvego, R.R. Shultz, R.L. Crane, “Development of a standard of verification and validation
of software used to calculate nuclear system thermal fluids behaviour”, ICONE 18-30243, May
17-21, 2010 Xi’an , China.
Ref. 11: M. Ishii, I. Kataoka, “Scaling laws for thermal-hydraulic system under single phase and two-
phase natural circulation”, Nuclear Engineering and Design, 81, 411–425 (1984).
Ref. 12: M. Ishii, et al., “The three-level scaling approach with application to the Purdue University Multi-
Dimensional Integral Test Assembly (PUMA)”, Nuclear Engineering and Design, 186, 177–211
(1998).
Ref. 13: K. Fischer, “Scaling of Containment Experiments (SCACEX)”, FIR1-CT2001-20127, 2002.
Ref. 14: R.L. Kiang, “Scaling Criteria for Nuclear Reactor Thermal Hydraulics”, Nuclear Science and
Engineering, 89, 207–216 (1985).
Ref. 15: R.F. Kunz, et al., “On the automated assessment of nuclear reactor systems code accuracy”,
Nuclear Engineering and Design, 211(2-3), 245-272 (2002).
Ref. 16: S. Levy, Two Phase Flow in Complex Systems, Wiley and Sons.
Ref. 17: Nuclear Engineering and Design, Special Issue devoted to Scaling, 1998.
Ref. 18: Nuclear Engineering and Design, Special Issue devoted to CSAU, 119, 1 (1990).
Ref. 19: W.L. Oberkampf, C.J. Roy, Verification and Validation in Scientific Computing, Cambridge
University Press, 2010.
Ref. 20: P.F. Peterson, V.E. Schrock, R. Greif, “Scaling for integral simulation of mixing in large,
stratified volumes”, Nuclear Engineering and Design, 186, 213–224 (1998).
Ref. 21: A. Petruzzi, F. D’Auria, F. “Approaches, Relevant Topics, and Internal Method for Uncertainty
Evaluation in Predictions of Thermal-Hydraulic System Codes”, J. Science and Technology of
Nuclear Installations, Vol 2008, Art. ID 325071, 2008.
Ref. 22: A. Petruzzi, F. D’Auria, (Eds.), et al., “BEMUSE Programme. Phase 2 report: Re-Analysis of the
ISP-13 Exercise, post test analysis of the LOFT L2-5 experiment”, OECD/CSNI Report
NEA/CSNI/R(2006)2, 1-625, 2006.
Ref. 23: V.H. Ransom, W. Wang, M. Ishii, “Use of an ideal scaled model for scaling evaluation”, Nuclear
Engineering and Design, 186, 135–148, (1998).
Ref. 24: J.N. Reyes Jr., L. Hochreiter, “Scaling analysis for the OSU AP600 test facility (APEX)”, Nuclear
Engineering and Design, 186 53–109 (1998).
Ref. 25: W. Schenk, “Scaling Analysis of Passive Containment Cooling Test”, Inno Tepps (96) D004,
January 1997.
Ref. 26: C.-H. Song et al., “Scaling of the Multi-Dimensional Thermal-Hydraulic Phenomena in Advanced
Nuclear Reactors”, Keynote Lecture, Proc. NTHAS5 (5th Korea-Japan Symp. on Nuclear Thermal
Hydraulics and Safety), Jeju, Korea, Nov. 26- 29, (2006).
Ref. 27: F. Stern et al., “Comprehensive Approach to V&V of CFD. Part1: Methodology”, ASME Journal
of Fluids Engineering, 123, 793-802 (2001).
Ref. 28: F. Stern et al., “Comprehensive Approach to V&V of CFD. Part 2: Application for RANS
Simulation of a Cargo/Container Ship”, ASME Journal of Fluids Engineering, 123, 803-810
(2001).
Ref. 29: Scaling, Uncertainty and 3D Coupled Code Calculations in Nuclear Technology, J. STNI Special
Issue, 2008.
Ref. 30: K. Takeuchi, et al., “Scaling effects predicted by WCOBRA/TRAC for UPI plant best estimate
LOCA”, Nuclear Engineering and Design, 186, 257–278, (1998).
Ref. 31: Transient and accident analysis methods, U.S. NRC, Regulatory Guide 1.203, Dec. 2005.

NEA/CSNI/R(2014)12
161
Ref. 32: G.E. Wilson, B.E. Boyack, “The role of the PIRT process in experiments, code development and
code applications associated with reactor safety analysis”, Nuclear Engineering and Design, 186,
23–37 (1998).
Ref. 33: T. Wickett (ed.), Report of the Uncertainty Methods Study for Advanced Best Estimate Thermal-
Hydraulic Code Applications, Vols. I & II, OECD/CSNI Report, NEA/CSNI/R(97)35, 1997.
Ref. 34: W. Wulff, “Scaling of thermo-hydraulic systems”, Nuclear Engineering & Design, 163, 359-395
(1996).
Ref. 35: G. Yadigaroglu, M. Zeller, “Fluid-to-fluid scaling for a gravity- and flashing-driven natural
circulation loop”, Nuclear Engineering and Design, 151, 49–64 (1994).
Ref. 36: M.Y. Young, et al., “Application of code scaling applicability and uncertainty methodology to the
large break loss of coolant”, Nuclear Engineering and Design, 186, 39–52 (1998).
Ref. 37: B.J. Yun, et al., “Scaling for the ECC Bypass Phenomena during the LBLOCA Reflood Phase”,
Nuclear Engineering & Design, 231, 315-325 (2004).
Ref. 38: N. Zuber, “Appendix D: a hierarchical, two-tiered scaling analysis, an integrated structure and
scaling methodology for severe accident technical issue resolution. US NRC, Washington, DC
20555, NUREG/ CR-5809, Nov. 1991.
Ref. 39: N. Zuber, et al., “An integrated structure and scaling methodology for severe accident technical
issue resolution: development of methodology”, Nuclear Engineering and Design, 186, 1–21
(1998).
Ref. 40: N. Zuber, “A General Method for Scaling and Analyzing Transport Processes”, pp. 421-459, in
M. Lehner, D. Mewes, U. Dinglreiter, R. Tauscher, Applied Optical Measurements, Springer,
Berlin, 1999.
Ref. 41: N. Zuber, “The effects of complexity, of simplicity and of scaling in thermal-hydraulics”, Nuclear
Engineering and Design, 204, 1–27 (2001).
Ref. 42: N. Zuber, et al., “Application of Fractional Scaling Analysis (FSA) to Loss of Coolant Accidents
(LOCA). Part 1: Methodology Development”, 11th Int. Top. Mtg. on Nuclear Reactor Thermal
Hydraulics (NURETH-11), Avignon, France, Oct. 2-6, 2005.

NEA/CSNI/R(2014)12
162
NEA/CSNI/R(2014)12
163
7. NEW INITIATIVES: THE CFD4NRS SERIES OF WORKSHOPS, BENCHMARKING
ACTIVITIES AND WEB PORTAL
7.1 The CFD4NRS Series of Workshops
The present Writing Group has provided evidence to show that CFD is a tried-and-tested technology
and that the main commercial CFD vendors are taking active steps to quality-assure their software products
by testing the codes against standard test data and through their participation in international benchmark
exercises. However, it should always be remembered that the primary driving forces for the technology
remain non-nuclear: aerospace, automotive, marine, turbo-machinery, chemical and process industries and,
to a lesser extent, for environmental and biomedical studies. In the power-generation arena, we again find
that the principal applications are non-nuclear: combustion dynamics for fossil-fuel burning, gas turbines,
vanes for wind turbines, etc. Furthermore, the applications appear to focus mainly on design optimisation.
This is perhaps not surprising since CFD can supply detailed information at the local level, building on a
design originally conceived using traditional engineering approaches (though also computer-aided).
The most fruitful application of CFD in the nuclear power industry to date seems not to be a support
to design, though this area is expected to increase in the near future, but rather to Nuclear Reactor Safety
(NRS). The first step in fitting this particular application area into the “World of CFD”, and as a direct
product of the activities of the present Writing Group, was the organisation of the OECD/NEA and IAEA
sponsored Workshop CFD4NRS Workshops, the first of which took place in Garching, Munich, Germany
on 5-7 September 2006. The Workshop provided a forum for both numerical analysts and experimenters to
exchange information in the field of NRS-related activities relevant to CFD validation. Papers describing
CFD simulations were accepted only if there was a strong validation component, and were focussed in
phenomenological areas such as: heat transfer; buoyancy; heterogeneous flows, natural circulation; free-
surface flows; mixing in tee-junctions and complex geometries. Most papers related to topical NRS issues,
such as: pressurized thermal shock; boron dilution, hydrogen distribution; induced breaks; thermal striping;
etc. The use of Best Practice Guidelines (BPGs) was strongly encouraged. Selected papers appeared in a
special issue of Nuclear Engineering and Design.
The second workshop in the series, XCFD4NRS, took place in Grenoble, France in September 2008.
Here, the emphasis was more on new experimental techniques and two-phase CFD, addressing many of the
NRS issues identified in Chapter 3 of this document. The workshop attracted 147 participants. There were
5 invited speakers, 3 keynote talks, 44 technical papers and 15 posters. Again, selected papers were
collected in a special issue of the journal Nuclear Engineering and Design. The third workshop,
CFD4NRS-3, was held in Washington DC in September 2010 and its proceedings appeared during 2011
with selected papers in a topical issue of Nuclear Engineering and Design in 2012. The fourth workshop,
hosted by KAERI, took place in Daejeon, Rep. of Korea in September 2012 with the proceedings
published in early 2014 (http://home.nea.fr/nsd/docs/2014/csni-r2014-4.pdf). The fifth workshop,
CFD4NRS-5, was hosted by ETH Zurich in September 2014; at the time of writing, proceedings are being
prepared and some papers have been selected for a special issue of Nuclear Engineering and Design.
The CFD4NRS workshops are a very useful addition to the more general conferences aimed at the
nuclear technology community in that they are highly focused on CFD applications to nuclear safety issues
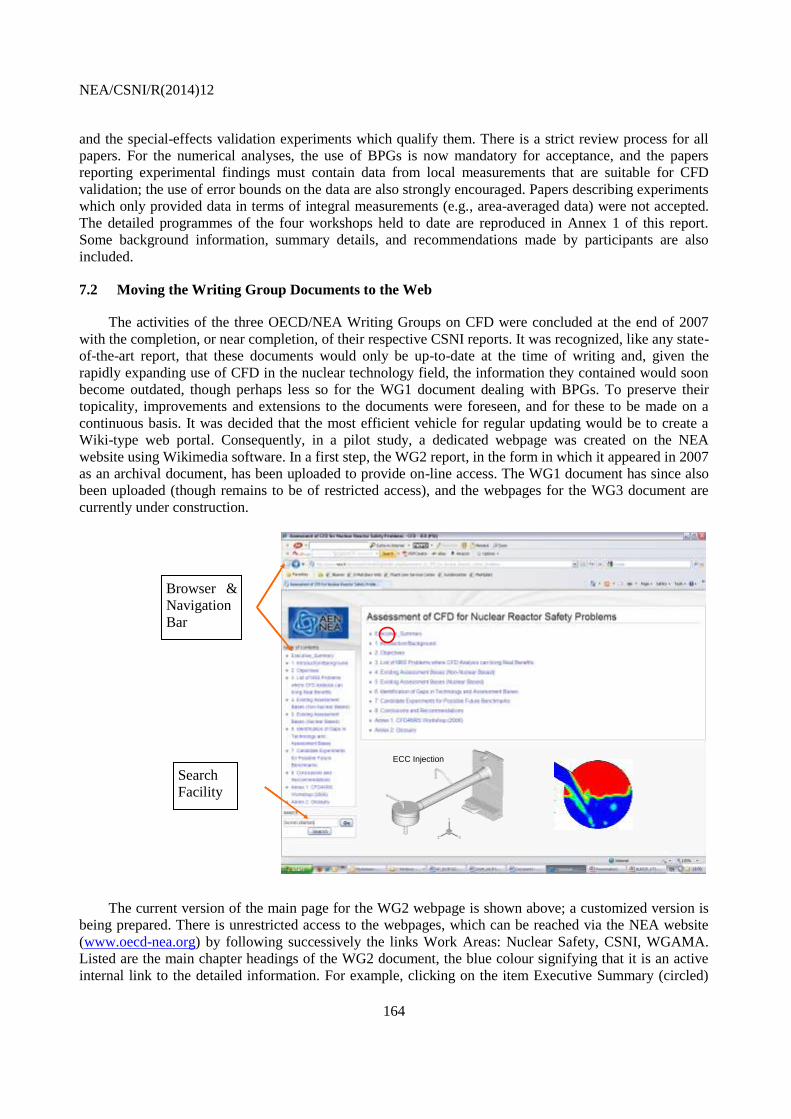
NEA/CSNI/R(2014)12
164
and the special-effects validation experiments which qualify them. There is a strict review process for all
papers. For the numerical analyses, the use of BPGs is now mandatory for acceptance, and the papers
reporting experimental findings must contain data from local measurements that are suitable for CFD
validation; the use of error bounds on the data are also strongly encouraged. Papers describing experiments
which only provided data in terms of integral measurements (e.g., area-averaged data) were not accepted.
The detailed programmes of the four workshops held to date are reproduced in Annex 1 of this report.
Some background information, summary details, and recommendations made by participants are also
included.
7.2 Moving the Writing Group Documents to the Web
The activities of the three OECD/NEA Writing Groups on CFD were concluded at the end of 2007
with the completion, or near completion, of their respective CSNI reports. It was recognized, like any state-
of-the-art report, that these documents would only be up-to-date at the time of writing and, given the
rapidly expanding use of CFD in the nuclear technology field, the information they contained would soon
become outdated, though perhaps less so for the WG1 document dealing with BPGs. To preserve their
topicality, improvements and extensions to the documents were foreseen, and for these to be made on a
continuous basis. It was decided that the most efficient vehicle for regular updating would be to create a
Wiki-type web portal. Consequently, in a pilot study, a dedicated webpage was created on the NEA
website using Wikimedia software. In a first step, the WG2 report, in the form in which it appeared in 2007
as an archival document, has been uploaded to provide on-line access. The WG1 document has since also
been uploaded (though remains to be of restricted access), and the webpages for the WG3 document are
currently under construction.
The current version of the main page for the WG2 webpage is shown above; a customized version is
being prepared. There is unrestricted access to the webpages, which can be reached via the NEA website
(www.oecd-nea.org) by following successively the links Work Areas: Nuclear Safety, CSNI, WGAMA.
Listed are the main chapter headings of the WG2 document, the blue colour signifying that it is an active
internal link to the detailed information. For example, clicking on the item Executive Summary (circled)
ECC InjectionECC Injection
Browser &
Navigation
Bar
Search
Facility

NEA/CSNI/R(2014)12
165
opens up the pages containing the Executive Summary in its entirety as it exists in the original document.
There is also an active scroll bar, and a hierarchical search facility for finding text strings in the pages.
Navigation can be via the Navigation Bar or by use of the Browser functions.
The larger chapters are subdivided, and clicking on the chapter heading leads to a page containing the
sub-division headings. These are themselves active links, and clicking here leads directly to the
documented material. Active links are being installed at this level too, to enable the user to navigate
quickly to other parts of the document. The webpage addresses, for example to the commercial CFD sites,
are also active, and it is planned to install a similar facility for the journal references too, which will be
useful for registered subscribers with electronic access to the material.
However, the most useful feature of the web portal will be the opportunity to modify, correct, update
and extend the information contained there, the Wiki software being the vehicle for this. The aim is to have
a static site, with unrestricted access. Readers will not be able to directly edit or change the information,
since this requires CSNI endorsement, but can communicate their suggestions to the website editors (the
authors of this paper). In parallel, a beta version of the webpage will be maintained for installing updates
prior to transfer to the static site. It will be the respective editor’s responsibility to review all new
submissions, and implement them into the open-access version of the site. A special CFD Task Group has
been set up within WGAMA (currently 38 members) to organize and coordinate the regular updating the
websites. The changes made to the original WG2 document, as described in this revised version, will be
uploaded to the website following CSNI approval.
7.3 CFD Benchmarking Exercises
7.3.1 Possible Benchmarks for Primary Circuits
Coolant mixing studies in primary/secondary circuits, e.g. thermal striping effects in or near a T-
junction, and horizontal channel flows, were originally identified by the group as potential sources for
future CFD benchmarking activities. Coolant mixing studies have been performed in the Rossendorf
Coolant Mixing Model (ROCOM) test facility of FZD (now HZDR), the corresponding experiments being
presented at the CFD4NRS Workshop by Kliem et al. (2006), and the CFD simulation results by Höhne
and Kliem (2006). A paper on thermal mixing experiments in a T-junction was presented by Westin et al.
(2006). In addition, Kliem (2007) and Vallée (2007) provided a detailed description of the test facilities at
HZDR Rossendorf.
ROCOM
Kliem et al. (2007) give a detailed description of the ROCOM test facility, its measurement
techniques and an error analysis of the experimental results. At the end of the report, the numerical
simulation results for the steady-state and transient experiments with and without ECC injection were
provided. The report is briefly summarised here.
The ROCOM test facility for the investigation of coolant mixing in the primary circuit of PWRs is
described in detail in Chapter 5 of this document. Here, we just recall the principal features. The pressure
vessel mock-up is made of Perspex, with detailed sub-models for the core barrel with the lower support
plate and the core simulator, the perforated drum in the lower plenum and the inlet and outlet nozzles of
the main coolant lines with diffuser elements. ROCOM is operated with de-mineralized water at ambient
temperatures. Density differences, for instance for the simulation of boron dilution transients, are
established by adding salt or ethyl alcohol.
Two loops of the test facility are equipped with fast-acting pneumatic gate valves. High-concentration
salt slugs are generated between these valves. Measurement of the concentration fields is performed with

NEA/CSNI/R(2014)12
166
high-resolution (in space and time) wire-mesh sensors that measure the electrical conductivity between two
orthogonal electrode grids. In addition to the measurements in the cold legs, two further wire-mesh sensors
with 4 radial and 64 azimuthal measuring positions in the downcomer and 193 conductivity measurements
at the core entrance are installed. All sensors provide 200 measurements per second. Since a measuring
frequency of 20 Hz is sufficient, ten successive images are averaged into one conductivity distribution.
Experiments are repeated at least five times so as to quantify uncertainties due to time-dependent
fluctuations of the flow field. The procedure for the error estimation is described in detail by Kliem et al.
(2007).
The ROCOM experiments are very well suited for validation of CFD calculations, as they provide
data with a high spatial and temporal resolution. The high quality of the data is consolidated by a thorough
error analysis. Data for code validation comprise three mixing scenarios:
Steady-state flow scenarios examining fluctuations in the boron concentration caused by sub-
cooled water arriving from the steam generators;
Transient flow scenarios including one or more operating loops, such as:
o start-up of the main coolant pumps with a de-borated slug;
o onset of natural convection occurring during a loss of coolant accident;
Gravity-driven flows caused by large density gradients which can occur during ECC water
injection.
The CFD4NRS paper of Kliem et al. (2006) gives an overview of these experiments. Data were made
available from selected tests to form the basis of a benchmark activity within the 5th FWP FLOWMIX-R,
but much more information is available on: (1) stationary experiments, in which the pumps in all loops are
driven with a constant mass flow rate; (2) transient experiments, in which the start-up of a main coolant
pump is simulated with a tracer (passive scalar) in one loop; and (3) experiments with density differences,
to explore the effects of buoyancy-driven mixing for some low-flow cases.
A number of the ROCOM experiments have already been simulated by different organisations, using
a variety of CFD codes. Details are given in the table below.
The series of ROCOM experiments represents a solid data base of validation data for CFD simulation
of the boron dilution event, and generally for in-vessel mixing phenomena. Due to lack of time and/or
funding, the full potential of validation data remains largely unexplored. Benchmark exercises based on
data from these experiments fulfil all the requirements of an NRS assessment matrix.

NEA/CSNI/R(2014)12
167
Experiments Boundary conditions Code Organization
Stationary
experiments
4 loop operation at nominal flow (equal
flow rates)
CFX-4
CFX-5
CFX-5
CFX-10
FLUENT
FLUENT
Trio_U
FZD
FZD
GRS
Uni Pisa
VUJE
AEKI
CEA & Uni Pisa
4 loop operation at reduced flow (equal
loop flow rates)
CFX-10 Uni Pisa
4 loop operation (different flow rates) CFX-4
FLUENT
FZD
AEKI
3 loop operation (equal flow rate) FLUENT VUJE
Transient
experiments
Start-up of the pump in loop 1 up to
nominal flow rate (different slug sizes)
CFX-4
CFX-5
FLUENT
CFX-5
CFX-10
FZD
FZD
FORTUM
NRG
Uni Pisa
Start-up of the pump in loop 1 up to
reduced flow rate
CFX-5 NRG
Start-up of the pump in loop 1 up to
nominal flow rate (velocity measure-
ments)
CFX-10 FZD
Experiments on
ECC-water
injection
/ = 10%,
Flow rate=5 %
CFX-5
TRIO-U
CFX-5
FZD
CEA
GRS
/ = 5 %,
Flow rate=5 %
CFX-5 NRG
HAWAC SEPARATED FLOW BENCHMARK
In different scenarios of Small-Break Loss-of-Coolant Accidents (SB-LOCAs), stratified two-phase
flow regimes can occur in the main cooling lines of PWRs. The corresponding horizontal air-water flows
have been investigated in the Horizontal Air/Water Channel (HAWAC) of HZDR on behalf of the German
Federal Ministry of Economy and Technology.

NEA/CSNI/R(2014)12
168
The HAWAC facility, shown in schematic form in the Figure above, provides observations of co-
current slug flow. A special inlet device provides well-defined inlet boundary conditions via a separate
injection of water and air into the test section. The test section is 8 m long and of cross-section is 100×30
mm; this gives a length-to-height ratio of 80.
The inlet device (Figure below) is designed for separate injection of water and air into the channel: the
air flows through the upper part and the water through the lower part of the device. In order to mitigate
flow perturbations at the inlet, 4 wire-mesh filters are mounted in each part of the inlet device, providing
homogenous velocity profiles at the test section inlet. Moreover, the filters produce a pressure drop that
attenuates the effect of the pressure surge created by slug flow on the fluid supply systems.
Air and water come in contact at the edge of a 500 mm long blade, which divides the two phases
downstream of the filter segment. The inlet cross-section for each phase can be controlled by inclining this
blade. Use of the filters and the blade provides well-defined inlet boundary conditions for the associated
CFD simulations.
If the velocities at the end of the blade are similar, air and water merge smoothly together, otherwise a
perturbation can be introduced in the channel. At high water flow rates, especially when the inlet blade is
inclined downwards, a hydraulic jump can be formed in the test-section. The hydraulic jump is the
turbulent transition zone between supercritical and subcritical flows.

NEA/CSNI/R(2014)12
169
In the supercritical region, the flow is always stratified, whereas after the hydraulic jump (i.e. in the
subcritical region) typical two-phase flow regimes are observed (e.g. elongated bubble flow and slug flow).
The position of the hydraulic jump in the channel depends on the flow rates and the inlet blade inclination.
When a hydraulic jump occurs, its position strongly influences the inlet length needed for the generation of
slug flow. A flow pattern map was generated on the basis of visual observations of the flow structure at
different combinations of gas and liquid superficial velocities. The observed flow patterns were stratified
flow, wavy flow, elongated bubbly flow and slug flow.
Sub-categories were defined to consider the slug generation frequency and the appearance of
elongated bubbles in the channel: sporadic (transition regime), periodic, but only one type of structure
(either slug or elongated bubble), and periodic with several types of structures present simultaneously.
Due to the rectangular cross-section, the flow can be observed very well from the side of the duct. To
make quantitative observations, the flow was filmed with a high-speed video camera at 400 frames per
second. The single pictures are stored in bitmap format and depict, for example, the generation of slugs.
The water level in a cross-section as a function of time was also measured, with a frequency of 400
Hz, which corresponds to the frame rate of the high-speed camera. Since direct comparison of the
measured water levels against CFD predictions is difficult, a statistical approach is proposed. First, a time-
averaged water level is calculated and bounded by the standard deviation in each cross-section. This results
in a mean water level profile along the channel which reflects the structure of the interface. Further, the
standard deviation σ quantifies the spread of the measured values which originate in the dynamics of the
free surface. Another possibility is to plot the probability distribution of the water levels.
The picture sequence recorded during slug flow was compared with CFD simulation results obtained
using ANSYS-CFX-10, the mesh consisting of 600,000 control volumes. Turbulence was modelled
separately for each phase using the k-ω based Shear Stress Transport (SST) model. Results showed that
with an Euler-Euler model approach, behaviour of slug generation and propagation seen in the experiment
could be qualitatively reproduced, but quantitative comparisons indicate that further model improvement is
needed. Again, data are available of sufficiently high quality to validate the treatment of separated flows in
CFD codes (without mass exchange between the phases).
VATTENFALL T-JUNCTION FACILITY
Unsteady temperature fluctuations in duct systems can lead to thermal fatigue in duct walls; examples
exist from nuclear power plants in which thermal fatigue has been the cause of leaks in the primary and
secondary circuits. A possibility to mitigate the risk is to install devices to enhance mixing. Static mixers
have, for example, been developed at Vattenfall R&D since the early 1980s, and are installed in some
Swedish nuclear power plants. The problem is that such devices are expensive, and increase pressure
drops. Therefore, significant cost reduction can be achieved by accurately predicting conditions which
promote thermal fatigue, and then adjusting operational conditions accordingly. This is a fertile area for
CFD simulation.
Analysis of crack growth due to cyclic loading requires accurate description of both the amplitudes
and the frequencies of the thermal fluctuations near pipe walls. Standard CFD approaches based on RANS
cannot provide data of this type, and careful validation of advanced turbulence models (e.g. DES or LES)
needs to be carried out. This requires appropriate experimental data measurements. Such tests have been
carried out at the Älvkarleby Laboratory of Vattenfall R&D.
The test rig was designed to simulate a typical T-junction in a nuclear power plant, using a model
scale of 1:1.5. The horizontal cold water main pipe had a diameter of 190 mm in the model tests, and the

NEA/CSNI/R(2014)12
170
water temperature was approximately 25°C. The vertical hot water branch pipe was connected from below
to the main pipe, and had a diameter of 123 mm and a water temperature of approximately 60°C. The pipes
were made of acrylic glass to allow optical access. The experimental set-up also included upstream bends
in order to obtain realistic flow conditions approaching the T-junction. An outline of the model geometry is
shown here, based on a simulation using the FLUENT code.
In addition to the temperature measurements, flow visualizations were used. Also, a limited number of
velocity measurements were carried out using Pitot-tube and Laser Doppler Velocimetry (LDV). However,
the quality of the velocity measurements is not considered trustworthy enough for CFD validation.
A number of different ratios between the cold (Q2) and hot (Q1) water flows were tested. Calculations
have been carried out for three of the test cases, and the test conditions are summarized in Table 1. The
penetration of the hot branch flow into the main pipe is significantly different between Tests 9 and 11,
which are illustrated in the flow visualizations in Figure 3. The mixing is characterized by large-scale
fluctuations, which is more evident in the cases with smaller flow ratios (Test 10 and 11).
Table I: Test conditions in the simulations. (*) In the simulation of test 10 a constant viscosity was used
which gave a slightly different Reynolds number in the hot water pipe.
Parameter Test 9 Test 10 Test 11
Q1 (l/s) 20.0 20.0 20.0
Q2 (l/s) 112.5 56.3 47.8
Q2/Q1 5.6 2.8 2.4
T1 (°C) 65.9 59.8 59.9
T2 (°C) 27.3 24.0 25.7
Re1 4.7×10⁵ 3.2×10
5 4.3×10
5
Re2 8.8×10⁵ 5.8×10
5 3.6×10
5
CFD results obtained from RANS and URANS simulations showed very poor comparisons, indicating
that scale-resolving methods such as LES and DES are essential for such applications. Several different

NEA/CSNI/R(2014)12
171
models have been used in the calculations and the Table below summarizes some of the numerical settings
and material properties used in the LES and DES calculations.
Settings Test 9 Test 10 Test 11
FLUENT version 6.2.16 6.1.22 6.2.5
Model DES and LES LES DES
DES model Spalart-Allmaras - Spalart-Allmaras
SGS model (LES) Dyn. Smagorinsky Smagorinsky -
Momentum Bounded central
differences (BCD)
Central diff. 2nd
order
Upwind, QUICK BCD
Pressure 2nd
order Standard Presto
Energy QUICK QUICK QUICK
Pressure-velocity
coupling Fractional step SIMPLE PISO and SIMPLE
Gradient option Node based Cell based Cell based
Transient scheme NITA ITA ITA
Time step 1 ms and 0.25 ms 0.5 ms (and 2ms) 2 ms and 1 ms
Iterations/time step - - 15 and 30
Density Curve fit Boussinesq Boussinesq and curve fit
Dynamic viscosity Curve fit 6.58x10⁻⁷
(const.) Curve fit
Cp 4178.6 (const.) 4178.6 (const.) 4182.5 (const.)
Thermal
Conductivity 0.6306 (const.) 0.6306 (const.) 0.62 (const.)
Ref. 1: Baker, O. (1954), Simultaneous Flow in Oil and Gas,Oil and Gas J., 53, 185- 195, 1954
Ref. 2: Braillard, O., Jarny, Y. and Balmigere, G. (2005) Thermal load determination in the mixing Tee
impacted by a turbulent flow generated by two fluids at large gap of temperature, ICONE13-
50361, 13th International Conference on Nuclear Engineering, Beijing, China, May 16-20, 2005
Ref. 3: Cartland Glover, G. M.; Höhne, T.; Kliem, S.; Rohde, U.; Weiss, F.-P.; Prasser, H.-M. (2007),
Hydrodynamic phenomena in the downcomer during flow rate transients in the primary circuit of
a PWR, Nucl. Eng. Design, vol. 237, pp. 732-748
Ref. 4: Harleman, M. (2004) Time dependent computations of turbulent thermal mixing in a T-junction.
Report FT-2004-685, Forsmarks Kraftgrupp AB
Ref. 5: Hemström, B., et al. (2005) Validation of CFD codes based on mixing experiments (Final report
on WP4) EU/FP5 FLOMIX-R report, FLOMIX-R-D11. Vattenfall Utveckling (Sweden)
Ref. 6: Höhne, T., Kliem, S. (2006), “Coolant mixing studies of natural circulation flows at the ROCOM
test facility using ANSYS ANSYS-CFX”, CFD4NRS 2006, 05.-07.09.2006, Garching,
Germany, Proceedings, Paper 23
Ref. 7: Janobi, M. (2003) CFD calculation of flow and thermal mixing in a T-junction (steady state
calculation), Report U 03:69, Vattenfall Utveckling AB
Ref. 8: Jungstedt, J., Andersson, M. and Henriksson, M. (2002) Termisk blandning i T-stycke –
Resultatrapport. Report U 02:134, Vattenfall Utveckling AB, 2002
Ref. 9: Kliem, S., Rohde, U., Sühnel, T., Höhne, T., Weiss, F.-P. (2007), „ A test facility for the
investigation of coolant mixing inside the reactor pressure vessel of PWRs“, Draft report,
personnel communication.
Ref. 10: Kliem, S., Sühnel, T., Rohde, U., Höhne, T., Prasser, H.-M., Weiss, F.-P. (2006), „ Experiments
at the mixing test facility ROCOM for benchmarking of CFD-codes“, CFD4NRS 2006, 05.-
07.09.2006, Garching, Germany, Proceedings, Paper 17.
NEA/CSNI/R(2014)12
172
Ref. 11: Lycklama à. Nijeholt, Jan-Aiso; Höhne, T. (2006), On the application of CFD modeling for the
prediction of the degree of mixing in a PWR during a boron dilution transient, ICAPP ‘06, ANS,
04.-08.06.2006, Reno, NV, USA, Proceedings, Paper 6155
Ref. 12: Mandhane, J. M., Gregory, G. A. and Aziz, K., (1974), A Flow Pattern Map for Gas-Liquid Flow
in Horizontal Pipes: Predictive Models, Int. J. Multiphase Flow, 1, 537-553, 1974
Ref. 13: Ohtsuka, M., Kawamura, T, Fukuda, T., Moriya, S., Shiina, K., Kurosaki, M., Minami, Y. and
Madarame, H. (2003) LES analysis of fluid temperature fluctuations in a mixing Tee pipe with
the same diameters, ICONE 11-36064, 11th International Conference on Nuclear Engineering,
Tokyo, Japan, April 20-23, 2003
Ref. 14: Péniguel, C., Sakiz, M., Benhamadouche, S., Stephan, J.-M. and Vindeirinho, C. (2003)
Presentation of a numerical 3D approach to tackle thermal striping in a PWR nuclear T-junction,
PVP/DA007, Proceedings of ASME PVP, July 20-24, 2003, Cleveland, USA
Ref. 15: Prasser, H.-M., Böttger, A., Zschau, J. (1998), A new electrode-mesh tomograph for gas-liquid
flows, Flow Measurement and Instrumentation 9, 111-119
Ref. 16: Prasser, H.-M, Grunwald, G., Höhne, T., Kliem, S., Rohde, U., Weiss, F.-P. (2003), Coolant
mixing in a PWR - deboration transients, steam line breaks and emergency core cooling injection
- experiments and analyses, Nuclear Technology, vol. 143 (1), pp. 37-56
Ref. 17: Rohde, U., Kliem, S., Höhne, T., Karlsson, R. et al. (2005), Fluid mixing and flow distribution in
the reactor circuit: Measurement data base, Nucl. Eng. Design, vol. 235, pp. 421-443
Ref. 18: Vallée C. (2007), “Stratified two-phase flow experiments in the horizontal air/water channel
(HAWAC)” FZD-report, personnel communication
Ref. 19: Vallée, C., Höhne, T., Prasser, H.-M. Sühnel T. (2006), Experimental investigation and CFD
simulation of horizontal air/water slug flow, Kerntechnik, Vol. 71 (3), 95-103
Ref. 20: Veber, P. and Andersson, L. (2004) CFD calculation of flow and thermal mixing in a T-junction
– time dependent calculation. Teknisk not 2004/7 Rev 0. Onsala Ingenjörsbyrå AB
Ref. 21: Veber, P. and Andersson, L. (2004) CFD calculation of flow and thermal mixing in a T-junction
– time dependent calculation – Part 2. Teknisk not 2004/21 Rev 0. Onsala Ingenjörsbyrå AB
Ref. 22: Westin, J. (2005) Thermal mixing in a T-junction: Steady and unsteady calculations, Report U
05:118, Vattenfall Utveckling AB
Ref. 23: Westin, J., Alavyoon, f., Andersson, L., Veber, P., Henriksson, M., Andersson, C., (2006),
“Experiments and unsteady CFD-calculations of thermal mixing in a T-junction”, CFD4NRS
2006, 05.-07.09.2006, Garching, Germany, Proceedings, Paper 25
7.3.2 Possible Containment Benchmarks
Experiments relevant to (primarily single-phase) containment issues involve considerations such as
thermal hydraulics, hydrogen distribution and hydrogen combustion. Though many experiments have been
performed over the last twenty years (some of which being the object of international standard problem
exercises), most have been dedicated to the validation of lumped-parameter containment codes. Data
suitable for CFD validation have only appeared over the last ten years with the construction of new
experimental facilities allowing better control of initial and boundary conditions, and the use of state-of-
the-art instrumentation techniques for detailed measurements.
A review of data suitable for validating CFD codes for containment issues was performed in part in
the framework of the ECORA project (Scheuerer et al., 2005). Also, the OECD/NEA are supporting
ongoing tasks leading to the elaboration of a so-called Containment Code Validation Matrix, which
addresses both lumped-parameter and CFD codes. As well as the distinction between containment thermal-
hydraulics and hydrogen combustion tests, one should also distinguish between so-called Separate Effect
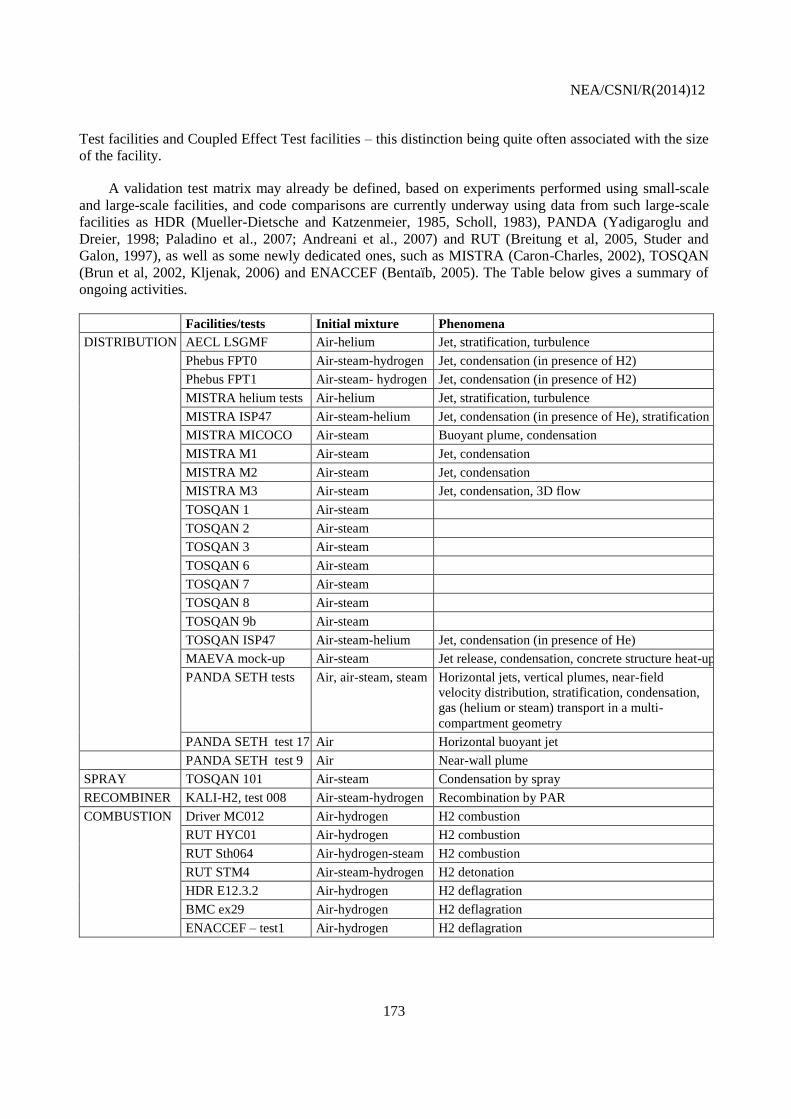
NEA/CSNI/R(2014)12
173
Test facilities and Coupled Effect Test facilities – this distinction being quite often associated with the size
of the facility.
A validation test matrix may already be defined, based on experiments performed using small-scale
and large-scale facilities, and code comparisons are currently underway using data from such large-scale
facilities as HDR (Mueller-Dietsche and Katzenmeier, 1985, Scholl, 1983), PANDA (Yadigaroglu and
Dreier, 1998; Paladino et al., 2007; Andreani et al., 2007) and RUT (Breitung et al, 2005, Studer and
Galon, 1997), as well as some newly dedicated ones, such as MISTRA (Caron-Charles, 2002), TOSQAN
(Brun et al, 2002, Kljenak, 2006) and ENACCEF (Bentaïb, 2005). The Table below gives a summary of
ongoing activities.
Facilities/tests Initial mixture Phenomena
DISTRIBUTION AECL LSGMF Air-helium Jet, stratification, turbulence
Phebus FPT0 Air-steam-hydrogen Jet, condensation (in presence of H2)
Phebus FPT1 Air-steam- hydrogen Jet, condensation (in presence of H2)
MISTRA helium tests Air-helium Jet, stratification, turbulence
MISTRA ISP47 Air-steam-helium Jet, condensation (in presence of He), stratification
MISTRA MICOCO Air-steam Buoyant plume, condensation
MISTRA M1 Air-steam Jet, condensation
MISTRA M2 Air-steam Jet, condensation
MISTRA M3 Air-steam Jet, condensation, 3D flow
TOSQAN 1 Air-steam
TOSQAN 2 Air-steam
TOSQAN 3 Air-steam
TOSQAN 6 Air-steam
TOSQAN 7 Air-steam
TOSQAN 8 Air-steam
TOSQAN 9b Air-steam
TOSQAN ISP47 Air-steam-helium Jet, condensation (in presence of He)
MAEVA mock-up Air-steam Jet release, condensation, concrete structure heat-up
PANDA SETH tests Air, air-steam, steam Horizontal jets, vertical plumes, near-field
velocity distribution, stratification, condensation,
gas (helium or steam) transport in a multi-
compartment geometry
PANDA SETH test 17 Air Horizontal buoyant jet
PANDA SETH test 9 Air Near-wall plume
SPRAY TOSQAN 101 Air-steam Condensation by spray
RECOMBINER KALI-H2, test 008 Air-steam-hydrogen Recombination by PAR
COMBUSTION Driver MC012 Air-hydrogen H2 combustion
RUT HYC01 Air-hydrogen H2 combustion
RUT Sth064 Air-hydrogen-steam H2 combustion
RUT STM4 Air-steam-hydrogen H2 detonation
HDR E12.3.2 Air-hydrogen H2 deflagration
BMC ex29 Air-hydrogen H2 deflagration
ENACCEF – test1 Air-hydrogen H2 deflagration

NEA/CSNI/R(2014)12
174
TOSQAN FACILITY
The TOSQAN experiment (see Figure) is a closed cylindrical vessel (7 m3, i.d. 1.5 m, total height of
4.8 m, condensing height of 2 m) into which steam or non-condensable gases are injected through a
vertical pipe located on the vessel axis. This vessel has thermostatically controlled walls so that steam
condensation may occur on one part of the wall (the condensing wall, CW), the other part being
superheated (the non-condensing wall, NCW). Over 150 thermocouples are located in the vessel (in the
main flow and near the walls). 54 sampling points for mass spectrometry are used for steam volume
fraction measurements. Optical accesses are provided by 14 overpressure resistant viewing windows
permitting non-intrusive optical measurements along an enclosure diameter at 4 different levels (LDV and
PIV for the gas velocities, Raman spectrometry for steam volume fractions.
The condensation tests in TOSQAN consist of steam injection into the enclosure, initially filled with
air at atmospheric pressure, the NCW and the CW having already reached their nominal temperatures.
After a transient stage corresponding to enclosure pressurization, a steady-state is reached in which the
steam injection and the condensation flow rates are equal. This corresponds to constant enclosure total
pressure and thermal equilibrium.
Qualification of TONUS (Bentaib, 2006) is performed on two levels: a global level on which only the
mean pressure during steady-state is evaluated, and a local level for which comparison of gas temperature,
steam concentration and velocity profiles at different locations are given. CFD simulations have been
carried out using the TONUS-CFD code (the lumped-parameter version of the code was also used). Total
pressure is predicted satisfactorily, and local gas temperatures are also well reproduced, as are gas
temperature horizontal profiles below the injection point. Similar curves can be obtained for all the
TOSQAN tests. The code-experiment temperature difference is generally around 1-3°C.
MISTRA FACILITY
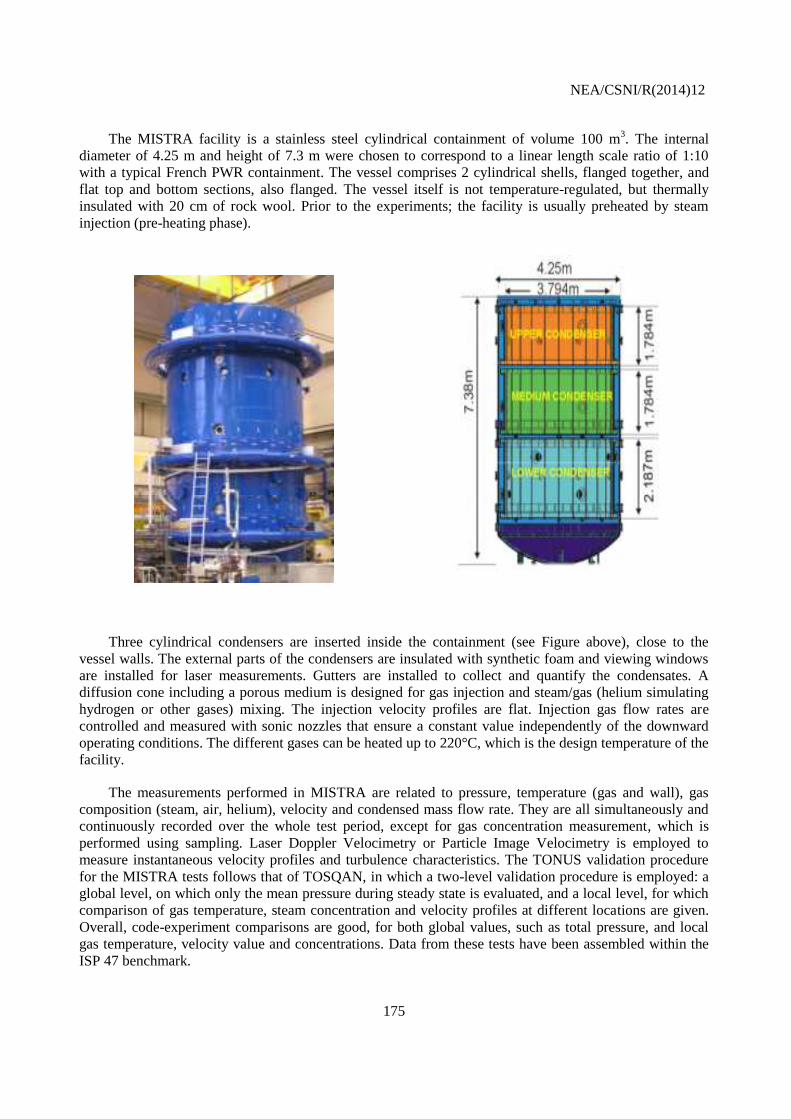
NEA/CSNI/R(2014)12
175
The MISTRA facility is a stainless steel cylindrical containment of volume 100 m3. The internal
diameter of 4.25 m and height of 7.3 m were chosen to correspond to a linear length scale ratio of 1:10
with a typical French PWR containment. The vessel comprises 2 cylindrical shells, flanged together, and
flat top and bottom sections, also flanged. The vessel itself is not temperature-regulated, but thermally
insulated with 20 cm of rock wool. Prior to the experiments; the facility is usually preheated by steam
injection (pre-heating phase).
Three cylindrical condensers are inserted inside the containment (see Figure above), close to the
vessel walls. The external parts of the condensers are insulated with synthetic foam and viewing windows
are installed for laser measurements. Gutters are installed to collect and quantify the condensates. A
diffusion cone including a porous medium is designed for gas injection and steam/gas (helium simulating
hydrogen or other gases) mixing. The injection velocity profiles are flat. Injection gas flow rates are
controlled and measured with sonic nozzles that ensure a constant value independently of the downward
operating conditions. The different gases can be heated up to 220°C, which is the design temperature of the
facility.
The measurements performed in MISTRA are related to pressure, temperature (gas and wall), gas
composition (steam, air, helium), velocity and condensed mass flow rate. They are all simultaneously and
continuously recorded over the whole test period, except for gas concentration measurement, which is
performed using sampling. Laser Doppler Velocimetry or Particle Image Velocimetry is employed to
measure instantaneous velocity profiles and turbulence characteristics. The TONUS validation procedure
for the MISTRA tests follows that of TOSQAN, in which a two-level validation procedure is employed: a
global level, on which only the mean pressure during steady state is evaluated, and a local level, for which
comparison of gas temperature, steam concentration and velocity profiles at different locations are given.
Overall, code-experiment comparisons are good, for both global values, such as total pressure, and local
gas temperature, velocity value and concentrations. Data from these tests have been assembled within the
ISP 47 benchmark.

NEA/CSNI/R(2014)12
176
Recent tests in MISTRA have focussed on flows within a compartmented geometry (see figure 12), in
which obstacles prevent the condensation-induced natural convection movements, thereby creating
conditions favourable to thermal and mass concentration gradients.
However, it should be mentioned that most of the validation so far has dealt with steady state flows,
so that the focus of future tests and validation will be on transient flows with thermal and gas stratification
and break-up.
PANDA FACILITY
PANDA is a large-scale thermal-hydraulics test facility designed and used for investigating
containment system behaviour and phenomena for different Advanced Light Water Reactor designs and
large-scale separate-effect tests (Yadigaroglu and Dreier, 1998). The facility consists of large
interconnected vessels, condensers and open water pools (see Figure below). Its modular structure provides
flexibility for investigating a variety of different integral and local phenomena. The total height of the
facility is 25m and is designed for 1MPa and 200oC maximum operating conditions. Auxiliary systems are
available to add or remove water, steam or gas to any vessel at desired conditions (temperature, pressure).
Though originally conceived to test the concept of passive decay heat removal from the containment
of the Simplified Boiling Water Reactor of General Electric in the US (at 1/25th volumetric scale, but 1:1
in height), it was reconfigured for the European version of the Simplified Boiling Water Reactor, the
ESBWR, and, in the BC series, building condensers were added to examine the containment cooling
concept put forward for the SWR-1000, an alternative passive Boiling Water Reactor design proposed by
Siemens. More recently (Auban et al., 2007), the two Dry-Well tanks have been used to perform special-
effect tests in the OECD/SETH test series, in which jets/plumes, gas mixing and stratification have been
investigated. Each of the two Dry-Well (DW) vessels is of height 8m, diameter 4m and an inner volume of
90m3, connected by a large (∼1m) diameter interconnecting pipe (IP), and have been heavily instrumented
for these tests. In addition, the vessels and adjacent piping are covered with a 200 mm-thick layer of
insulation rock-wool to minimize heat losses (estimated at 9 kW for an operating temperature of 110oC).
The instrumentation consists of numerous sensors for the measurements of fluid and wall
temperatures, absolute and differential pressures, flow rates, valve states and heater power. The facility is

NEA/CSNI/R(2014)12
177
also equipped with a gas concentration measurement system utilising a mass spectrometer. A ‘Particle
Image Velocimetry’ (PIV) system has been set-up for measuring 2D fluid velocity fields in some selected
areas.
The Figure shows in schematic form the layout for one of the early first tests in the series. Steam is
injected horizontally into DW1, which is initially filled with air. Flow rates are adjusted to reproduce wall
plumes, free plumes (illustrated in the Figure) and jet-like behaviour, as appropriate. Venting takes place at
the top of the second vessel. The well-characterized initial and boundary conditions of these tests are in
accordance with the objectives of the experimental campaign, and provide suitable data for CFD
validation. Moreover, the test results have been confirmed by repetitions of each test.
The dense instrumentation grid provides the time history of temperature and gas composition during
the transient enabling the flow structure in the vessels and the stratification patterns in them to be
determined. Data from the tests will come into the public domain during 2009.
RUT FACILITY
The RUT facility is operated by Kurchatov Institute, and the experimental tests here reported here
were carried out in this facility in the frame of the HYCOM (Breitung, 2005) project. A schematic of the
RUT facility is shown in the Figure.
The facility can be described as a large duct with variable cross-section, and subdivided into a number
of compartments. A channel (35 m long, and of volume 180 m3) with obstacles is connected to a block of 3
compartments (60 m3 each, divided by walls with Blockage Ratio (BR) equal to 0.3) and then to another
channel (60 m3). The gas distribution system provided the possibility to arrange different hydrogen
concentrations in the two parts of the facility. Local H2 concentrations were measured with a sampling
method using eight sampling ports with an accuracy of 0.25 % vol. The mixture was ignited with a weak
electric spark. The measurement system included 45 collimated photodiodes to measure local flame arrival
times, 16 piezoelectric pressure transducers (0.5 Hz 100 kHz) and 16 piezoresistive pressure transducers
(0 1 kHz), and 10 integrating heat-flux meters (0.02 10 Hz.

NEA/CSNI/R(2014)12
178
Large-scale tests carried out in the RUT facility were aimed at studying the processes of turbulent
flame propagation in multi-compartment geometries, and in non-uniform mixtures on typical reactor length
scales. Tests HYC01 and STH6 (see Table) are chosen here to illustrate the ability of TONUS to simulate
slow and fast deflagration regimes.
Test case Initial H2 molar fraction Initial air molar fraction Initial H2O molar fraction Pi (Pa) Ti (K) Regime
HYC01 0.1 0.9 0. 100200
290.7 Slow deflagration
STH06 0.162 0.388 0.45 100150 373 Fast deflagration
The TONUS model correctly calculates the slope of the pressure rise and maximum overpressure. For
fast deflagrations, the model shows relatively little sensitivity to the grid size, except for the peaks that
were captured better with the finer mesh.
Though previously used already for a benchmarking exercise, experiments from the TONUS and
MISTRA series continue to provide valuable data for CFD validation. It should be recalled that not all tests
involve two-phase aspects.
ENACCEF FACILITY
The ENACCEF facility is operated by CNRS, France in the frame of a cooperation agreement with
IRSN. A sketch of the test section, including dimensions is given in the attached Figure. The facility is
designed for the study of hydrogen flame propagation, and is a combination of two parts. The acceleration
tube (3.2 m long and 154 mm i.d.), is mounted at the lower end, and at its lowest point is equipped with
two tungsten electrodes to initiate a low energy ignition. At a distance of 1.9 m from the ignition point,
three rectangular quartz windows (40 mmx300 mm optical path) are mounted flush with the inner surface,
two of them are opposed to each other, while the third is perpendicular to these. The windows allow the
recording of the flame front during its propagation along the tube using either a shadowgraph or a
tomography system. The tube is also equipped with 11 small quartz windows (optical diameter: 8 mm,
thickness: 3 mm) distributed along its length. UV-sensitive photomultiplier tubes (HAMAMATSU, 1P28)
are placed in front of these windows in order to detect the flame passage. Several high speed pressure
transducers, (7 from CHIMIE METAL and 1 PCB) are mounted flush with the inner surface of the tube in
order to monitor the pressure variation in the tube as the flame propagates.

NEA/CSNI/R(2014)12
179
The dome (1.7 m long, 738 i.d.) is connected to the upper part of the acceleration tube via a flange in
which a diaphragm can be mounted in order to isolate the two parts when needed. This part of the setup is
also equipped with three silica windows (optical path: 170 mm, thickness: 40 mm), perpendicular to each
other, two by two. Through these windows, the arrival of the flame can be recorded via a schlieren or a
tomography system. Five UV-sensitive photomultiplier tubes, of the same series as above, are mounted
across the silica windows (optical diameter: 8 mm, thickness: 3 mm) in order to detect the flame as it
propagates through the dome. The pressure build up in this part is monitored via a PCB pressure transducer
mounted at the ceiling of the dome.
Several obstacles can be inserted in the acceleration tube. Two different shapes have been used,
annular obstacles of different blockage ratios (from 0.33 up to 0.63) and hexagonal mesh grids (with holes
of 10 mm diameter spaced by 15 mm) of blockage ratio 0.6.
The ENACCEF test matrix includes homogenous tests and heterogonous tests with hydrogen gradient
concentrations present in some tests. A version of the TONUS CREBCOM code has been validated against
flame speed propagation tests in this series. Code performance was generally satisfactory, but points of
discrepancy remain, thought to be due to the influence of turbulence on combustion speed and heat loss
effects, which were not taken into account in the model.
Tests in the ENACCEF series have been carefully performed, and the data collected are of high
quality. There is good potential here for benchmarking activities for other containment codes.
Ref. 1: Andreani, M., Haller, K., Heitsch, M., Hemström, B., Karppinen, I.,Macek, J., Schmid, J.,
Paillere, H., Toth, I. (2007), “A Benchmark Exercise on the use of CFD Codes for Containment
Issues using Best Practice Guidelines: a Computational Challenge”, Nuclear Eng. Design (in
press), Ref: Nuclear Eng. Design (2007), doi:10.1016/j.nucengdes.2007.01.021.
Ref. 2: Auban, O., Zboray, R., Paladino, D., “Investigation of large-scale gas mixing and stratification
phenomena related to LWR containment studies in the PANDA facility”, Nuclear Eng. Design,
237(4), 409-419 (2007).
3.3 m
i.d. 0
.15 m
1.7 m
i.d. 0
.74 m

NEA/CSNI/R(2014)12
180
Ref. 3: Bentaïb, A. Bleyer, A., Charlet, A., Malet, F., Djebaïli-Chaumeix, N., Cheikhvarat, H., Paillard,
C.E. (2005), “Experimental and numerical study of flame propagation with hydrogen gradient in
a vertical facility: ENACCEF,” European Review Meeting on Severe Accident Research, Aix-
en-Provence, November 14-16, 2005.
Ref. 4: Bentaib, A., Bleyer, A., Malet, J., Caroli, C., Vendel, J.; Kudriakov, S., Dabbene, F., Studer, E.,
Beccantini, A., Magnaud, J.P., Paillere, H. (2006), “Containment thermal-hydraulic simulations
with an LP-CFD approach: Qualification matrix of the tonus code,” Fourteenth International
Conference on Nuclear Engineering, Proceedings, ICONE 14.
Ref. 5: Breitung, W., Dorofeev, S., Kotchourko, A., Redlinger, R., Scholtyssek, W., Bentaib, A.,
L'Heriteau, J.-P., Pailhories, P., Eyink, J., Movahed, M., Petzold, K.-G., Heitsch, M., Alekseev,
V., Denkevits, A., Kuznetsov, M., Efimenko, A., Okun, M.V., Huld, T., Baraldi, D. (2005),
“Integral large scale experiments on hydrogen combustion for severe accident code validation-
HYCOM,” Nuclear Engineering and Design, v 235, February, 2005, p 253-270.
Ref. 6: Brun, P. Cornet, J. Malet, B. Menet, E. Porcheron, J. Vendel, M. Caron-Charles, J.J. Quillico, H.
Paillère and E. Studer (2002), “Specification of International Standard Problem on Containment
Thermal-Hydraulics ISP-47, Step 1: TOSQAN–MISTRA,” Institut de Radioprotection et de
Sureté Nucléaire and Comissariat à l’Energie Atomique (IRSN), Saclay, France.
Ref. 7: Caron-Charles, M., Quillico, J.J. Brinster, J. (2002). “Steam condensation experiments by the
MISTRA facility for field containment code validation,” International Conference on Nuclear
Engineering, Proceedings, ICONE, v 3, p 1041-1055
Ref. 8: Kljenak, Ivo (Jozef Stefan Institute); Babic, Miroslav; Mavko, Borut; Bajsic, Ivan (2006)
“Modeling of containment atmosphere mixing and stratification experiment using a CFD
approach,” Nuclear Engineering and Design, v 236, n 14-16, August, 2006, p 1682-1692.
Ref. 9: Mueller-Dietsche, W., Katzenmeier, G. (1985), “Reactor Safety Research At The Large Scale
Facility HDR,” Nuclear Engineering and Design, v 88, n 3, Oct, 1985, p 241-251.
Ref. 10: Scheuerer, M., Heitsch, M., Menter, F., Egorov, Y., Toth, I., Bestion, D., Pigny, S., Pail-lere, H.,
Martin, A., Boucker, M., et al., (2005), “Evaluation of Computational Fluid Dynamic Methods
for Reactor Safety Analysis (ECORA)”, Nuclear Engineering and Design 235, 359-368.
Ref. 11: Scholl, K.H. (1983), “Research At Full-Scale: The HDR Programme,” Nuclear Engineering
International, v 28, n 336, Jan, 1983, p 39-43
Ref. 12: Studer, E., Galon, P. (1997), “Hydrogen combustion loads - Plexus calculations,” Nuclear
Engineering and Design, v 174, n 2, Oct 4, 1997, p 119-134.
Ref. 13: Yadigaroglu, G., Dreier, J., (1998), “Passive advanced light water reactor design and the ALPHA
programme at the Paul Scherrer Institute”. Kerntechnik 63, 39.
7.3.3 Possible Core-Flow Benchmarks
MATIS-H
This is an experimental study of detailed turbulent flow structures in horizontal square sub-channel
geometry with typical mixing devices. For the fine-scale examination of the lateral flow structure on sub-
channel geometry, the size of the 5x5 rod bundle array was enlarged 2.6 times from that of the real bundle.
A 2-D LDA device was installed in front of the main flow cross-section of the 5x5 rod bundle array for
measuring the lateral velocity components on all the sub-channels. The axial velocity component was also
measured by changing the position of the LDA probe. Two spacer grids were installed to the rod bundle
array. The first spacer grid, which is placed upstream of the test section, has no mixing devices, and is for
the stabilization of the flow. The second spacer grid is placed at a distance 70 Dh from the first spacer grid
in the downstream direction. This second spacer grid has mixing devices and causes lateral mixing and/or
swirling flow. The mixing devices used in this study were typical split-type and swirl-type, respectively. A
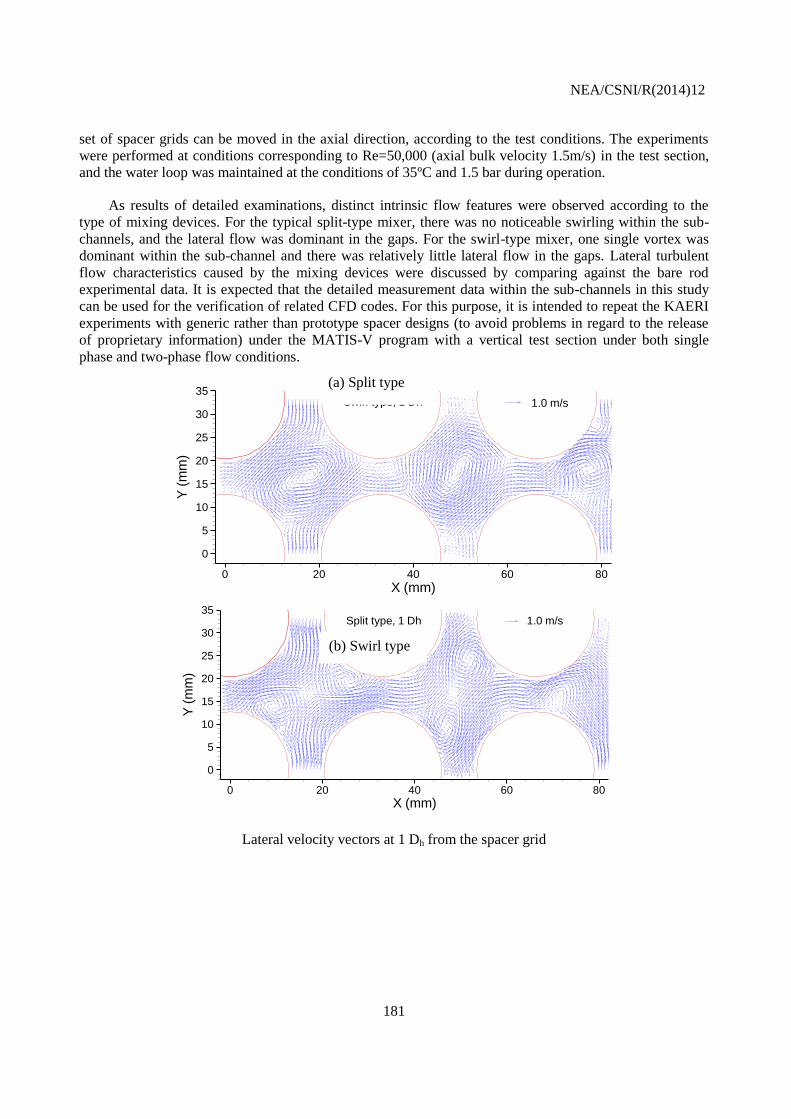
NEA/CSNI/R(2014)12
181
set of spacer grids can be moved in the axial direction, according to the test conditions. The experiments
were performed at conditions corresponding to Re=50,000 (axial bulk velocity 1.5m/s) in the test section,
and the water loop was maintained at the conditions of 35ºC and 1.5 bar during operation.
As results of detailed examinations, distinct intrinsic flow features were observed according to the
type of mixing devices. For the typical split-type mixer, there was no noticeable swirling within the sub-
channels, and the lateral flow was dominant in the gaps. For the swirl-type mixer, one single vortex was
dominant within the sub-channel and there was relatively little lateral flow in the gaps. Lateral turbulent
flow characteristics caused by the mixing devices were discussed by comparing against the bare rod
experimental data. It is expected that the detailed measurement data within the sub-channels in this study
can be used for the verification of related CFD codes. For this purpose, it is intended to repeat the KAERI
experiments with generic rather than prototype spacer designs (to avoid problems in regard to the release
of proprietary information) under the MATIS-V program with a vertical test section under both single
phase and two-phase flow conditions.
Lateral velocity vectors at 1 Dh from the spacer grid
X (mm)
Y(m
m)
0 20 40 60 80
0
5
10
15
20
25
30
35Swirl type, 1 Dh 1.0 m/s
X (mm)
Y(m
m)
0 20 40 60 80
0
5
10
15
20
25
30
35Split type, 1 Dh 1.0 m/s
(b) Swirl type
(a) Split type
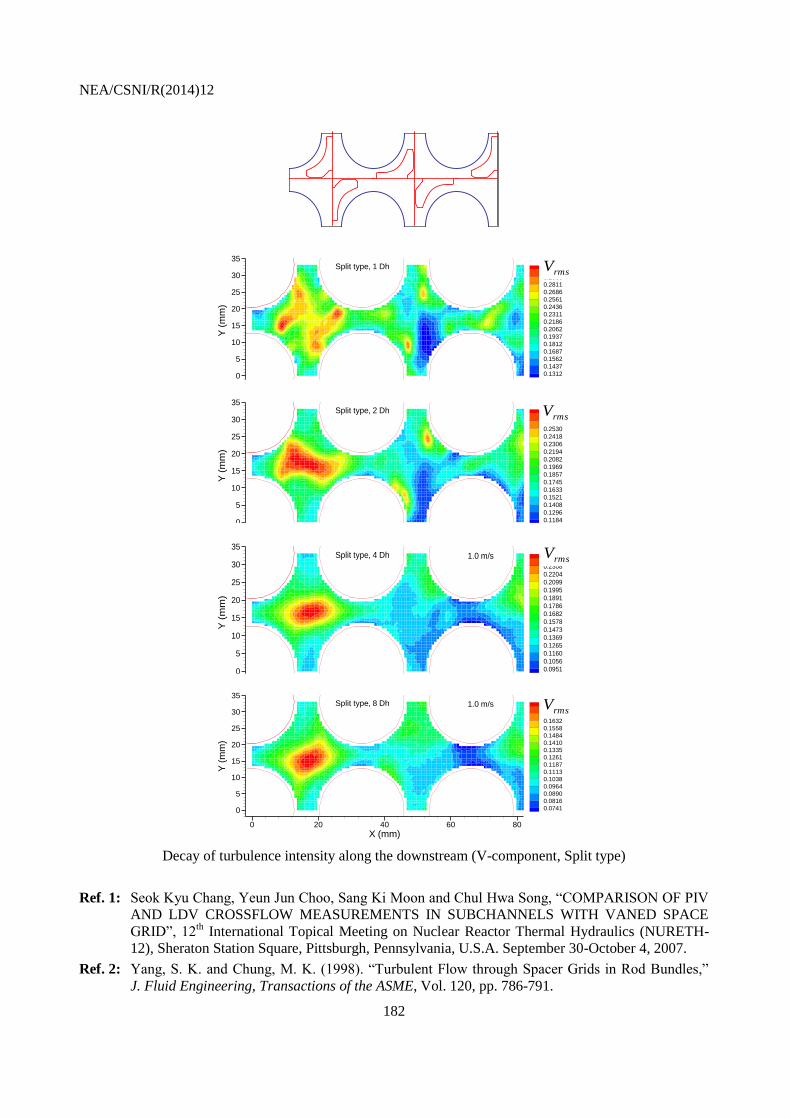
NEA/CSNI/R(2014)12
182
Decay of turbulence intensity along the downstream (V-component, Split type)
Ref. 1: Seok Kyu Chang, Yeun Jun Choo, Sang Ki Moon and Chul Hwa Song, “COMPARISON OF PIV
AND LDV CROSSFLOW MEASUREMENTS IN SUBCHANNELS WITH VANED SPACE
GRID”, 12th International Topical Meeting on Nuclear Reactor Thermal Hydraulics (NURETH-
12), Sheraton Station Square, Pittsburgh, Pennsylvania, U.S.A. September 30-October 4, 2007.
Ref. 2: Yang, S. K. and Chung, M. K. (1998). “Turbulent Flow through Spacer Grids in Rod Bundles,”
J. Fluid Engineering, Transactions of the ASME, Vol. 120, pp. 786-791.
X (mm)
Y(m
m)
0 20 40 60 80
0
5
10
15
20
25
30
35vrms
0.3060
0.2936
0.2811
0.2686
0.2561
0.2436
0.2311
0.2186
0.2062
0.1937
0.1812
0.1687
0.1562
0.1437
0.1312
Split type, 1 DhrmsV
X (mm)
Y(m
m)
0 20 40 60 80
0
5
10
15
20
25
30
35vrms
0.2755
0.2642
0.2530
0.2418
0.2306
0.2194
0.2082
0.1969
0.1857
0.1745
0.1633
0.1521
0.1408
0.1296
0.1184
Split type, 2 DhrmsV
X (mm)
Y(m
m)
0 20 40 60 80
0
5
10
15
20
25
30
35vrms
0.2412
0.2308
0.2204
0.2099
0.1995
0.1891
0.1786
0.1682
0.1578
0.1473
0.1369
0.1265
0.1160
0.1056
0.0951
Split type, 4 Dh 1.0 m/s rmsV
X (mm)
Y(m
m)
0 20 40 60 80
0
5
10
15
20
25
30
35vrms
0.1781
0.1707
0.1632
0.1558
0.1484
0.1410
0.1335
0.1261
0.1187
0.1113
0.1038
0.0964
0.0890
0.0816
0.0741
Split type, 8 Dh 1.0 m/srmsV

NEA/CSNI/R(2014)12
183
Ref. 3: Shen, Y. F. et al. (1991). “An Investigation of Cross-flow Mixing Effect Caused by Grid Spacer
with Mixing Blades in a Rod Bundle,” Nuclear Engineering Design, 125, pp. 111-119.
Ref. 4: Karoutas, Z., Gu, C. Y. and Scholin, B. (1995). “3-D Flow Analysis for Design of Nuclear Fuel
Spacer,” Proceedings of the 7th Int. Meeting on Nuclear Reactor Thermal-Hydraulics, New York,
Sept. 10-15, Vol. 4, pp. 3153-3174.
Ref. 5: McClusky, H. L. et al. (2002). “Development of Swirling Flow in a Rod Bundle Sub-channel,”
J. of Fluids Engineering, Vol. 124, pp. 747-755.
7.4 OECD/NEA-Sponsored CFD Benchmarking Exercises
OECD-VATTENFALL BENCHMARK
At a meeting of the chairmen of the NEA CFD Writing Groups in 2008, it was decided to utilize the
organization within the Special CFD Group of WGAMA to launch the first of a series of international
benchmark exercises. Both single-phase and two-phase flow options were considered. It was generally
agreed that it would be desirable to have the opportunity of setting up a blind benchmarking activity, in
which participants would not have access to measured data, apart from what was necessary to define initial
and boundary conditions for the numerical simulation. This would entail finding a completed, or nearly
completed, experiment for which the data had not yet been released, or encouraging a new experiment
(most likely in an existing facility) to be undertaken especially for this exercise. The group took on the
responsibility of finding a suitable experiment, for providing the organisational basis for launching the
benchmark exercise, and for the subsequent synthesis of the results.
Experiments to study mixing in T-junctions had been conducted at a number of facilities in France,
Germany, Sweden, Japan and Switzerland, but previously unreleased test data became available from tests
carried out at the Älvkarleby Laboratory of Vattenfall Research and Development in Sweden in November
2008. These became the basis of the first blind CFD benchmarking exercise to be organised within the
OECD-sponsored CFD activity.
Interest in mixing in T-junctions increased following the incident at the Civaux-1 plant in France in
1998 in which both circumferential and longitudinal cracks appeared near a T-junction in the Residual

NEA/CSNI/R(2014)12
184
Heat Removal (RHR) system of the N4-type PWR. The Vattenfall experiment (Fig. above) was an ideal
test basis for launching a blind CFD benchmarking exercise based on this safety issue. The reasoning is as
follows:
widespread interest in high-cycle thermal fatigue had already been identified by WG2 [50];
downstream data from the test had previously not been released;
temperatures, velocities and turbulence data upstream had been carefully measured to provide
precise boundary conditions for a CFD simulation [54,55];
uncertainty estimates were available for all measurements.
Vattenfall R&D agreed to release measured data to all those who submitted blind calculations to this
benchmarking exercise.
The activity ran from May 2009 (Kick-Off Meeting) to December 2010. In total, 29 participants
submitted blind numerical predictions for synthesis. A full CSNI report is available on the NEA website.
OECD-KAERI BENCHMARK
This activity focuses on the ability of CFD codes to predict turbulence characteristics downstream of a
spacer grid in a core channel geometry. The experiment is based on a special test performed under
isothermal conditions in a horizontal rod bundle configuration in the MATiS-H cold-flow facility at the
Korea Atomic Energy Research Institute (KAERI), carried out in early Spring, 2012.
Two spacer grids (of generic design), of the split type and swirl-type, were involved in the study.
Computer Aided Design (CAD) files of the spacer grids were made available by KAERI to aid CFD mesh
generation. The benchmark was launched in April 2011, and blind predictions collected one year later. A
synthesis report has been written, and was presented at the CFD4NRS-4 Workshop in September 2012. In
addition, a full CSNI report on the entire activity has just been approved and will be distributed in 2013.
NEA/CSNI/R(2014)12
185
8. CONCLUSIONS AND RECOMMENDATIONS
The use of computational methods for performing safety analyses of reactor systems has been
established for nearly 40 years. Very reliable codes have been developed for analysing the primary system
in particular, and results from these analyses are often used in the safety assessment of nuclear power
systems undertaken by the regulatory authorities. Similarly, but to a lesser extent, programs have also been
written for containment and severe accident analyses. Such codes are based on networks of 1-D or even 0-
D cells. However, the flow in many reactor primary components is essentially 3-D in nature, as is natural
circulation, mixing and stratification in containments. CFD has the potential to treat flows of this type, and
to handle geometries of almost arbitrary complexity. Already, CFD has been successfully applied to such
flows, and to a limited extent has made up for a lack of applicable test data in better quantifying safety
margins. Consequently, CFD is expected to feature more prominently in reactor safety analyses in the
future.
The traditional approaches to nuclear reactor safety (NRS) analysis, using system codes for example,
take advantage of the very large database of mass, momentum and energy exchange correlations that have
been built into them. The correlations have been formulated from essentially 1-D special-effects
experiments, and their range of validity is well known, and controlled internally within the numerical
algorithms. Herein lies the trustworthiness of the numerical predictions of such codes. Analogous
databases for 3-D flows are very sparse by comparison, and the issue of the trust and reliability of CFD
codes for use in NRS applications has therefore to be addressed before the use of CFD can be considered
as trustworthy. This issue represented the primary focus of the work carried out by the second of the
OECD/NEA Writing Groups (WG2), its findings, appropriately updated as a consequence of further
information produced by members of the CFD Task Group created by WGAMA, are embodied in the
present document.
The document provides a list of NRS problems for which it is considered CFD analysis is required, or
its application is expected to result in positive benefits in terms of better understanding and improved
safety margins. The list contains safety issues of relevance to fluid flows in the core, primary circuit and
containment, both under normal and abnormal operating conditions, and during accident sequences. The
list contains both single-phase and two-phase safety items, though in the latter case reference is made to
the document dealing with the Extension of CFD Codes to Two-Phase Flow Nuclear Reactor Safety
Problems, NEA/CSNI/R(2007)15 (update in preparation).
Recognising that CFD is already an established technology outside of the nuclear community, a list of
the existing assessment bases from other application areas has also been included, and their relevance to
NRS issues discussed. It is shown that these databases are principally of two types: those concerned with
aspects of trustworthiness of CFD code predictions in general industrial applications (ERCOFTAC,
QNET-CFD, FLOWNET), and those focussed on specialised topics (MARNET, NPARC, AIAA). The
usefulness and relevance of these databases to NRS has been assessed. In addition, most CFD codes
currently being used for NRS analysis have their own, custom-built assessment bases, the data being
provided from both within and external to the nuclear community. It was concluded that application of
CFD to NRS problems can benefit indirectly from these databases, and the continuing efforts to extend
them, but that a well-maintained, NRS-specific database would be a valuable addition.

NEA/CSNI/R(2014)12
186
Descriptions of the existing CFD assessment bases that have been established specifically within the
nuclear domain have been listed here, and their usefulness discussed. Typical examples are experiments
devoted to the boron dilution and in-vessel mixing issues (ISP-43, ROCOM, Vattenfall 1/5th Scale
Benchmark, UPTF TRAM C3, ), pressurised thermal shock (UPTF TRAM C2), and thermal fatigue in
pipes (THERFAT, Forsmarks), all of which have already been the subject of benchmarking activities.
Details of where this information may be obtained has been given, in particular the EU Framework
Programmes, such as ASTAR, ECORA, EUBORA, FLOWMIX-R and ASCHLIM, which have provided
direct NRS-specific data and/or have each focused on relevant aspects of the CFD modelling.
The technology gaps which need to be closed to make CFD a more trustworthy analytical tool have
also been identified. These include, for example, lack of a proper uncertainty methodology; limitations in
the range of application of turbulence models, for example in stratified and buoyant flows; coupling of
CFD with neutronics and system codes, needed to keep simulations to a manageable size; and generally
computer power limitations in simulating long transients. In each case, a discussion is given of the
relevance and importance of the problem to NRS analysis, what has been achieved to date, and what still
needs to be done in the future. Particular application areas for which CFD simulations need to be improved
are in stratified flows, containment modelling, aerosol transport and deposition and liquid-metal heat
transfer. In other areas, such as in-vessel mixing, the models may be adequate but grid resolution is
inadequate due to the current lack of machine power, a situation that will certainly improve with time.
This last point, the computational overhead of performing CFD simulations in comparison with
system code transient computations, may still be regarded as a definite limitation of the potential for
directly using CFD in licensing procedures, even for single-phase applications for which the underlying
models are well-established. The uncertainty quantification methodology for system codes generally
requires 50-100 computations to be carried out, and the statistical method of Latin Hypercube Sampling
(LHS) is becoming widespread in order to optimise the efficiency of the random parameter sampling. This
cannot, at the present time, be mirrored with CFD, and until it can a different methodology needs to be
established. However, in the spirit of BPGs, at least mesh-independency must be demonstrated, and some
limited study of sensitivity to input parameters should be attempted. The issue of access to the source code
of CFD software, particularly in regard to the commercial codes, will also have to be addressed before
CFD is accepted as an analysis tool by the regulatory bodies.
There is a distinct lack of quality validation data for aerosol transport, even though the phenomenon
was identified as a key process in containment modelling, and one that can only be treated mechanistically
by the use of CFD. The experiments carried out at the PHEBUS facility as part of the EU 5th Framework
Programme PHEBEN produced only data of an integral nature, and as such very limited in regard to
validating CFD models. Comprehensive, local aerosol deposition data appear only to be available for pipes
(straight and elbowed), and for some non-nuclear applications, such as atmospheric pollution. This is one
key area where future CFD assessment needs to be focused.
Important new information has been provided by the material presented at the CFD4NRS series of
Workshops, in which numerical simulations with a strong emphasis on validation were particularly
encouraged, and the reporting of experiments which provided high-quality data suitable for CFD
validation. Participation in the workshops has enabled a list of existing databases to be assembled of
possible candidates for future benchmarking activities for: (1) primary circuits, (2) core-flow regions, and
(3) containments, for which data of the type needed for CFD benchmarking already exists, or is likely to be
available in the near future.
This updated document represents a continuing process in establishing an assessment database for the
application of CFD to NRS problems, but in many places reflects the time and manpower restrictions
imposed on the authors by their parent organisations, and considerable further work still needs to be done
NEA/CSNI/R(2014)12
187
in terms of both presentation and technical content. Sections of the report remain unbalanced in terms of
detail, reflecting not only the subjective inputs of the authors, but whether the safety issue being addressed
is of a country-specific nature or of more common concern; the level of detail is higher in the latter case,
and with better perspectives. Part of the recommended obligation to regularly update this document must
include an attempt to equilibrate the information level. In addition, similar information appears in different
sections of the report. This was done to avoid excessive page-turning or scrolling, but gives the document
an appearance of disjointedness if read in a continuous manner. The updates to the original WG2 report
contained in the present document have not rectified these defects. A more efficient method of control
would be to install hyperlinks to the web-based version of the document, as recommended below.
CFD remains a very dynamic technology, and with its increasing use within the nuclear domain there
will be ever greater demands to document current capabilities and prove their trustworthiness by means of
validation exercises. It is therefore expected that any existing list of specific assessment databases will
soon require further updating. To prevent the important information assembled in this document from
becoming obsolete, the following recommendations are made.
Extend the process of consolidating the information contained here through continuous updating of
the web-based version of the WG2 document. This process is necessary to ensure that the NRS
assessment database is readily accessible to all, topical, and as dynamic and mobile as the CFD
technology itself.
The forum for numerical analysts and experimentalists to exchange information in the field of NRS-
related activities relevant to CFD validation provided by the series of CFD4NRS workshops should
continue, thus providing a continuous source of information to build into the web-based assessment
matrix.
New blind CFD benchmarking exercises should be defined, both to encourage the release of
previously restricted CFD-grade data from experiments, to test the skills of the CFD practitioners,
and perhaps persuade the software developers to improve their models, where these have proved
lacking. To this end, it is encouraging to note that representatives of the large commercial software
houses actively participate in the benchmarks.
The Special CFD Group, which was first set up within WGAMA in 2007, and initially comprised
the chairmen of the original three Writing Groups (together with the NEA secretariat), can continue
to act as the central organising body for the above activities, provided new members are appointed
to replace the “old guard”. The time-scale for this process is (i) overdue for the WG1 chairman (J.
H. Mahaffy reached pensionable age in 2009); (ii) imminent for the WG2 chairman (B. L. Smith
reached pensionable age in 2012); and within sight for the WG3 chairman (D. Bestion will reach
pensionable age in 2017). It is important to ensure a smooth transition to a new group membership
before the existing expertise is lost.

NEA/CSNI/R(2014)12
188

NEA/CSNI/R(2014)12
189
APPENDIX 1: OECD-IAEA WORKSHOPS IN THE CFD4NRS SERIES
CFD4NRS: Benchmarking of CFD Codes for Application to Nuclear Reactor Safety
Background
Computational Fluid Dynamics (CFD) is to an increasing extent being adopted in nuclear reactor
safety analyses as a tool that enables specific safety relevant phenomena occurring in the reactor coolant
system to be better described. The Committee on the Safety of Nuclear Installations (CSNI), which is
responsible for the activities of the Nuclear Energy Agency that support advancing the technical base of
the safety of nuclear installations, has in recent years conducted an important activity in the CFD area. This
activity has been carried out within the scope of the CSNI working group on the analysis and management
of accidents (GAMA), and has mainly focused on the formulation of user guidelines and on the assessment
and verification of CFD codes. It is in this WGAMA framework that the present workshop was organized
and carried out.
Computational methods have supplemented scaled model experiments, and even prototypic tests, in
the safety analysis of reactor systems for nearly 30 years. During this time, very reliable codes have been
developed for analysing the primary system, and similar programs have also been written for containment
and severe accident analyses. However, many traditional reactor system and containment codes are
modelled as networks of 1-D or even 0-D cells. It is evident, however, that the flow in components such as
the upper and lower plena, downcomer and core of a reactor vessel is essentially 3-D in nature. Natural
circulation, mixing and stratification in containments is also 3-D, and representing such complex flows by
5-7 September 2006,
Garching, Germany
OECD/NEA and IAEA Workshop
Benchmarking of CFD Codes for Application
to Nuclear Reactor Safety
CFD4NRS
5-7 September 2006,
Garching, Germany
OECD/NEA and IAEA Workshop
Benchmarking of CFD Codes for Application
to Nuclear Reactor Safety
CFD4NRS

NEA/CSNI/R(2014)12
190
pseudo 1-D or 0-D approximations may lead to erroneous, and not necessarily conservative, conclusions.
CFD has the potential to handle geometries of arbitrary complexity, and is poised to fill this technology
gap for single-phase applications, though considerable further development of closure relations will be
necessary before multi-phase Nuclear Reactor Safety (NRS) applications may be approached with
confidence using CFD.
Traditional approaches to NRS analysis using system codes for example have been successful because
a very large database of phasic exchange correlations has been built into them. The correlations have been
formulated from essentially 1-D special-effects experiments, and their range of validity well scrutinised.
Data on the exchange of mass, momentum and energy between phases for 3-D flows is very sparse in
comparison. Thus, although 1-D formulations may restrict the use of system codes in simulations in which
there is complex geometry, the physical models are well-established and reliable, provided they are used
within their specified ranges of validity. The trend has therefore been to continue with such approaches,
and live within their geometrical limitations.
For containment issues, lumped-parameter codes include models for system components, such as
recombiners, sprays, sumps, etc., which enable realistic simulations of accident scenarios to be undertaken
without excessive computational costs. To take into account such systems in a multi-dimensional (CFD)
simulation remains a challenging task, and attempts to do this have only recently begun, and these in
dedicated CFD codes rather than in commercial, general-purpose CFD software.
The issue of the validity range of CFD codes for 3-D NRS applications has to be addressed before the
use of CFD may be considered as routine and trustworthy as it is for example in the turbo-machinery,
automobile and aerospace industries. However, the application of CFD methods to NRS-related issues is
not straightforward. In many cases, even for single-phase problems, nuclear thermal-hydraulic flows lie
outside the range of current computer capacity, especially in the case of long, evolving transient flows with
strong heat transfer.
These issues were discussed in the group of experts designated by CSNI/WGAMA to carry out the
task of establishing an assessment matrix for CFD application to NRS, concentrating on single-phase
phenomena. As part of this process, it was decided to organise an international workshop to promote the
availability and distribution of experimental data suitable for NRS benchmarking, and to monitor the
current status of CFD validation exercises relevant to NRS issues. The workshop would also cover two-
phase aspects, and if the venture was successful, organisation of further workshops on this theme was
envisaged.
Scope and Objectives
The purpose of the workshop was to provide a forum for numerical analysts and experimentalists to
exchange information in the field of NRS-related activities relevant to CFD validation, with the objective
of providing input to WGAMA CFD experts to create a practical, state-of-the-art, web-based assessment
matrix on the use of CFD for NRS applications.
Numerical simulations with a strong emphasis on validation were welcomed in such areas as heat
transfer, buoyancy, stratification, natural circulation, free-surface modelling, turbulent mixing and multi-
phase flow. These would relate to such NRS-relevant issues as: pressurized thermal shocks, boron dilution,
hydrogen distribution, induced breaks, thermal striping, etc. The use of systematic error quantification and
Best Practice Guidelines was encouraged.
Papers reporting experiments providing high-quality data suitable for CFD validation, specifically in
the area of NRS, were given high priority. Here, emphasis was placed on the availability of local

NEA/CSNI/R(2014)12
191
measurements, especially multi-dimensional velocity measurements obtained using such techniques as
laser-doppler velocimetry, hot-film/wire anemometry, particle image velocimetry, laser induced
fluorescence, etc. A particular point of scrutiny for papers in this category was whether an assessment of
error bounds and measurement uncertainties was included.
Welcoming Address
L. Hahn (GRS, Germany)
Invited Lectures
1. M. Réocreux (IRSN, France)
Safety Issues Concerning Nuclear Power Plants: The Role of CFD
2. M. Gavrilas (NRC, USA)
Lessons Learned from International Standard Problem No. 43 on Boron Mixing
3. W. Oberkampf (SNL, USA)
Design of and Comparison with Verification and Validation Benchmarks
4. H-M.Prasser (HZDR, Germany/ETHZ, Switzerland)
Novel Experimental Measuring Techniques Required to Provide Data for CFD Validation
5. G. Yadigaroglu (ASCOMP/ETHZ, Switzerland)
CFD4NRS with a Focus on Experimental and CMFD Investigations of Bubbly Flows
Technical Session A1
Plant Applications
1. M. Böttcher
Detailed CFX-5 Study of the Coolant Mixing within the Reactor Pressure Vessel of a VVER-1000
Reactor during a Non-Symmetrical Heat-Up Test
2. I. Boros, A. Aszódi
Analysis of Thermal Stratification in the Primary Circuit with the CFX Code
3. E. Romero
CFD Modelling of a Negatively Buoyant Purge Flow in the Body of a Reactor Coolant
Circulator
4. G. Légrádi, I. Boros, A. Aszódi
Comprehensive CFD Analyses Concerning the Serious Incident which occurred in the PAKS
NPP in Spring 2003
Technical Session B1
Advanced Reactors
5. T. Morii
Hydraulic Flow Tests of APWR Reactor Internals for Safety Analysis
6. R. W. Johnson
Modeling Strategies for Unsteady Turbulent Flows in the Lower Plenum of the VHTR
7. H. S. Kang, C. H. Song
CFD Analysis of Thermal Mixing in a Subcooled Water Pool under High Steam Mass Flux
8. K. Velusamy, K. Natesan, P. Selvaraj, P. Chellapandi, S. C. Chetal, T. Sundararajan, S.
Suyambazhahan (WITHDRAWN)
CFD Studies in the Prediction of Thermal Striping in an LMFBR

NEA/CSNI/R(2014)12
192
Technical Session A2
Benchmark Exercises
9. M. Andreani, K. Haller, M. Heitsch, B. Hemström, I. Karppinen, J. Macek, J.Schmid, H. Paillere,
I. Toth
A Benchmark Exercise on the use of CFD Codes for Containment Issues using Best Practice
Guidelines: a Computational Challenge
10. T. Toppila
CFD Simulation of FORTUM PTS Experiment
Technical Session B2
CANDU Reactors
11. H. S. Kang
CFD Analysis for the Experimental Investigation of a Single Channel Post-Blowdown
12. T. Kim, B. W. Rhee, J. H. Park
CFX Simulation of a Horizontal Heater Rods Test
Technical Session A3
Novel Applications 13. U.Graf, P.Papadimitriou
Simulation of Two-Phase Flows in Vertical Tubes with the CFD Code FLUBOX
14. Y. A. Hassan
Large-Eddy Simulation in Pebble Bed Gas Cooled Core Reactors
Technical Session B3
Containment Issues I
15. Kljenak, M. Babić, B. Mavko
Prediction of Light Gas Distribution in Containment Experimental Facilities using CFX4 Code:
Jozef Stefan Institute Experience
16. S. Kudriakov, F. Dabbene, E. Studer, A. Beccantini, J.P. Magnaud, H. Paillère, A. Bentaib, A.
Bleyer, J. Malet, C. Caroli
The TONUS CFD Code for Hydrogen Risk Analysis: Physical Models, Numerical Schemes and
Validation Matrix
Technical Session A4
Boron Dilution
17. S. Kliem, T. Sühnel, U. Rohde, T. Höhne, H.-M. Prasser, F.-P. Weiss
Experiments at the Mixing Test Facility ROCOM for Benchmarking of CFD Codes
18. T. V. Dury, B. Hemström, S. V. Shepel
CFD Simulation of the Vattenfall 1/5th-Scale PWR Model for Boron Dilution Studies
19. E. Graffard, F. Goux
CFX Code Application to the French Reactor for Inherent Boron Dilution Safety Issue
Technical Session B4
Containment Issues II
20. E. Porcheron, P. Lemaitre, A. Nuboer, V. Rochas, J. Vendel
Experimental Study of Heat, Mass and Momentum Transfers in a Spray in the TOSQAN Facility
NEA/CSNI/R(2014)12
193
21. J. Malet, P. Lemaitre, E. Porcheron, J. Vende1
, L. Blumenfeld, F. Dabbene, I. Tkatschenko
Benchmarking of CFD and LP Codes for Spray Systems in Containment Applications: Spray Tests
at Two Different Scales in the TOSQAN and MISTRA Facilities
22. M. Houkema, N.B. Siccama
Validation of the CFX-4 CFD Code for Containment Thermal-Hydraulics
Technical Session A5
Mixing in Primary Circuit
23. T. Höhne, S. Kliem
Coolant Mixing Studies of Natural Circulation Flows at the ROCOM Test Facility using ANSYS
CFX
24. S. K. Chang, S. K. Moon, B. D. Kim, W. P. Baek, Y. D. Choi
Phenomenological Investigations on the Turbulent Flow Structures in a Rod Bundle Array with
Mixing Devices
25. J. Westin, F. Alavyoon, L. Andersson, P. Veber, M. Henriksson, C. Andersson
Experiments and Unsteady CFD-Calculations of Thermal Mixing in a T-junction
Technical Session B5
Containment Issues III
26. P. Royl, J. R. Travis, W. Breitung
Modelling and Validation of Catalytic Hydrogen Recombination in the 3D CFD Code GASFLOW
II
27. H. Wilkening, D. Baraldi, M. Heitsch
On the Importance of Validation when using Commercial CFD Codes in Nuclear Reactor Safety
28. R. Redlinger
DET3D - A CFD Tool for Simulating Hydrogen Combustion in Nuclear Reactor Safety
Technical Session A6
Stratification Issues
29. T. Wintterle, E. Laurien, T. Stäbler, L. Meyer, T. Schulenberg
Experimental and Numerical Investigation of Counter-Current Stratified Flows in Horizontal
Channels
30. L. Štrubelj, I. Tiselj, B. Končar
Modelling of Direct Contact Condensation in Horizontally Stratified Flow with CFX Code
31. C. Vallée, T. Höhne, H.-M. Prasser, T. Sühne
Experimental Investigation and CFD Simulation of Horizontal Stratified Two-Phase Flow
Phenomena
Technical Session B6
Code Validation
32. Th. Frank, P.J. Zwart,E. Krepper, H.-M. Prasser, D. Lucas
Validation of CFD Models for Mono- and Polydisperse Air-Water Two-Phase Flows in Pipes
33. V.Ustinenko, M.Samigulin, A.Ioilev, S.Lo, A.Tentner, A.Lychagin, A.Razin, V.Girin, Ye.Vanyukov
Validation of CFD-BWR: a New Two-Phase Computational Fluid Dynamics Model for Boiling
Water Reactor Analysis
34. U. Bieder, E. Graffard
Qualification of the CFD Code TRIO_U for Full-Scale Nuclear Reactor Applications
NEA/CSNI/R(2014)12
194
Technical Session A7
Boiling Models
35. B. J. Yun, D. J. Euh, C. H. Song
Experimental Investigation of Subcooled Boiling on One Side of a Heated Rectangular Channel
36. S. Mimouni, M. Boucker, J. Laviéville, D. Bestion
Modeling and Computation of Cavitation and Boiling Bubbly Flows with the NEPTUNE_CFD
Code
37. B. Končar, E. Krepper
CFD Simulation of Forced Convective Boiling in Heated Channels
Technical Session B7
Containment Issues IV
38. P. Royl, U. J. Lee, J. R. Travis, W. Breitung
Benchmarking of the 3D CFD Code GASFLOW II with Containment Thermal Hydraulic Tests
from HDR and ThAI
39. A. Dehbi
Assessment of a New FLUENT Model for Particle Dispersion in Turbulent Flows
Conclusions and Recommendations
There were 98 registered participants to the workshop to hear 5 invited talks and 39 technical papers.
This is perhaps a good measure of the level of general interest in the workshop. The messages coming back
to the organisers from the participants were that the workshop was well organised and that the subject
material well chosen. As there was only a 60% success rate for the extended abstracts sent in to the
organisers for acceptance, the quality of the papers was high, and the focus of them on the central issue
strong.
The case for future workshops in the series was discussed openly during the final panel session. It was
pointed out that 2/3 of the papers accepted for CFD4NRS were concerned with single-phase calculations
and experiments, while 1/3 were dedicated to multi-phase issues. The ratio probably reflects the degree of
maturity of CFD in the respective areas, but nonetheless suggests a growing acknowledgement of the role
of multi-phase CFD in nuclear NRS issues.
Following on from this observation, CEA proposed a follow-up meeting, perhaps hosted by CEA
Grenoble, in which the ratio of single-phase to two-phase papers would be inverted, and would expand the
area of advanced instrumentation needed for providing local data needed to validate the models currently
being proposed for multi-phase CFD. The suggestion received encouraging remarks from the audience. It
was also generally agreed that the frequency of future workshops should be 2-3 years, allowing sufficient
time for the technology to advance, and minimise the chance of overlap with the material presented at
CFD4NRS.
The Organising and Scientific Committees had discussed at an early stage whether the editor of an
appropriate archival journal should be approached in regard to offering publication of selected papers from
the workshop in a special issue of the journal. On balance, it was considered that it would be too great a
risk to an editor for a first-of-a-kind conference with an untried format. It therefore came as a bonus that
Professor Yassin Hassan, co-editor of Nuclear Engineering and Design, and a participant at CFD4NRS,
would make just this suggestion. The offer has been followed up, and some 25 authors of technical papers
and 3 invited speakers have expressed interest in this proposal. Again, the offer reflects the high quality of
the presented material, and the general level of interest in what the workshop aimed to achieve. It is
anticipated that the special issue of NED dedicated to CFD4NRS will appear in 2008.

NEA/CSNI/R(2014)12
195
Clear recommendations to come out of the workshop for the continuing use of CFD methods in NRS
issues are listed below.
Best Practice Guidelines should be followed as far as practical to ensure that CFD simulation results
are free of numerical errors, and that the physical models employed are well validated against data
appropriate to the flow regimes and physical phenomena being investigated.
Experimental data used for code validation should include estimates of measurement uncertainties,
and should include detailed information concerning initial and boundary conditions.
Experimenters involved in producing data for validating CFD models and/or applications should
collaborate actively with CFD practitioners in advance of setting up their instrumentation. This
interface is vital in ensuring that the information needed to set up the CFD simulation will actually
be available, the selection of “target variables” (i.e. the most significant measurements against
which to compare code predictions) is optimal, and the frequency of data acquisition is appropriate
to the time-scale(s) of significant fluid-dynamic/heat-transfer/phase-exchange events.
This workshop proved to be a very valuable means to assess the status of CFD code validation and
application. Specialised workshops of this type should be organised at suitable time intervals also in
the future, in order to maintain continuity, monitor progress, and exchange experiences on CFD
code validation and applications.

NEA/CSNI/R(2014)12
196
XCFD4NRS: Experiments and CFD Applications to Nuclear Reactor Safety
Background
Computational Fluid Dynamics (CFD) is to an increasing extent being adopted in nuclear reactor
safety analyses as a tool that enables specific safety relevant phenomena occurring in the reactor coolant
system to be better described. The Committee on the Safety of Nuclear Installations (CSNI), which is
responsible for the activities of the OECD Nuclear Energy Agency that support advancing the technical
base of the safety of nuclear installations, has in recent years conducted an important activity in the CFD
area. This activity has been carried out within the scope of the CSNI working group on the analysis and
management of accidents (WGAMA), and has mainly focused on the formulation of user guidelines and on
the assessment and verification of CFD codes. It is in this WGAMA framework that a first workshop,
CFD4NRS, was organized and held in Garching, Germany in 2006.
Following the success of the first workshop, XCFD4NRS was intended to extend the forum created
for numerical analysts and experimentalists to exchange information in the field of Nuclear Reactor Safety
(NRS) related activities relevant to Computational Fluid Dynamics (CFD) validation, but this time with
more emphasis placed on new experimental techniques and two-phase CFD applications.
Scope and Objectives
The purpose of the workshop was to provide a forum for numerical analysts and experimentalists to
exchange information in the field of NRS-related activities relevant to CFD validation, with the objective
of providing input to WGAMA CFD experts to create a practical, state-of-the-art, web-based assessment
matrix on the use of CFD for NRS applications.
The scope of XCFD4NRS includes:
Single-phase and two-phase CFD simulations with an emphasis on validation in areas such as:
boiling flows, free-surface flows, direct contact condensation and turbulent mixing. These
applications should relate to NRS-relevant issues such as: pressurized thermal shocks, critical heat
NEA/CSNI/R(2014)12
197
flux, pool heat exchangers, boron dilution, hydrogen distribution, thermal striping, etc. Discussion of
validation of the CFD tool, use of systematic error quantification and Best Practice Guidelines
(BPGs) was encouraged and considered in the paper review process.
Experiments providing data suitable for CFD validation, specifically in the area of NRS. These
should focus on local measurements using multi-sensor optical or electrical probes, laser-doppler
velocimetry, hot-film/wire anemometry, particle image velocimetry and laser induced fluorescence.
Papers should include a discussion of measurement uncertainties.
Welcoming Address
C. Chauliac (CEA, France)
Invited Lectures
1. V. Teschendorf (GRS, Germany)
The Role of CFD in NPP Safety
2. Y. Hassan (Texas A&M, USA)
Single Phase CFD Simulation and Experimental Validation for Advanced Nuclear System
Components
3. T. Hibiki (Purdue Univ., USA)
Modelling and Measurement of Interfacial Area Concentration in Two-phase Flow
4. S. Banerjee (City University of New York, USA)
Advanced Fine-Scale Modelling of Two-Phase Flow
5. T. Schulenberg (KIT, Germany)
Experimental Techniques for Heavy Liquid Metals
Summaries of the Activities of WGAMA Writing Groups on CFD
6. J. H. Mahaffy (PSU, USA)
Best Practice Guidelines for the use of CFD for NRS Applications
7. B. L. Smith(PSI, Switzerland)
Assessment of CFD for NRS
8. D. Bestion (CEA, France)
Extension of CFD use to two-phase NRS issues
Technical Session HOR
Horizontal Flow - Pipe Flow
HOR-01 Y. Bartosiewicz, J.-M. Seynhaeve, C. Vallée, T. Höhne, J.M. Laviéville
Modelling free surface flows relevant to a PTS scenario: comparison between experimental
data and three RANS based CFD-codes. Comments on the CFD-experiment integration and
best practice guidelines
HOR-02 H. Lemonnier
Nuclear Magnetic Resonance: A new tool for the validation of multi-phase multi-dimensional
CFD codes
HOR-03 M. Marchand, M. Bottin, J.P. Berlandis, E. Hervieu
Experimental investigation of stratification phenomena in horizontal two-phase flows for CFD
validation
HOR-04 L. Štrubelj, I. Tiselj
Numerical modelling of direct contact condensation in transition from stratified to slug flow
HOR-05
(Poster)
C. Vallée, D. Lucas, M. Beyer, H. Pietruske, P. Schütz, H. Car
Experimental CFD grade data for stratified two-phase flows

NEA/CSNI/R(2014)12
198
Technical Session AC
Accident Analysis
AC-01 E. Krepper, G. Cartland-Glover, A. Grahn, F.P. Weiss
Experiments and CFD-modelling of insulation debris transport phenomena in water flow
AC-02 T. Brandt, V. Lestinen, T. Toppila, J. Kähkönen, A. Timperi, T. Pättikangas, I. Karppinen
Fluid-structure interaction analysis of Large-Break Loss of Coolant Accident
AC-03 C. López del Prá, F. J. S. Velasco, L. E. Herranz
Simulation of a gas jet entering a failed steam generator during a SGTR sequence: validation
of a FLUENT 6.2 model
AC-04 C. T. Tran, P. Kudinov and T. N. Dinh
An approach to numerical simulation and analysis of molten corium coolability in a BWR
lower head
AC-05
(Poster)
Jeong Ik Lee, Soon Joon Hong, Jonguk Kim, Byung Chul Lee, Young Seok Bang, Deog Yeon
Oh, Byung Gil Huh
Experimental CFD grade data for stratified two-phase flows
AC-06
(Poster)
B.A. Gabaraev, E.K. Karasyov, O.Yu. Novoselsky, S.Z. Lutovinov, L.K. Tikhonenko, Ye.I.
Trubkin, A.V. Shishov
Data obtained at high coolant parameters suitable for validation of 3D models
Technical Session PTS
Pressurized Thermal Shock
PTS-01 P. Coste, J. Pouvreau, J. Laviéville, M. Boucker
Status of a two-phase CFD approach to the PTS issue
PTS-02 T. Farkas, I. Tóth
FLUENT analysis of a ROSA cold leg stratification
PTS-03 H. S. Kang, Y.-J. Youn, C.-H. Song
CFD analysis of a turbulent jet behaviour induced by a steam jet discharge through a single
hole in a subcooled water pool
PTS-04 Y. J. Choo, C.-H. Song, Y. J. Youn
PIV measurement of turbulent jet and pool mixing produced by a steam jet in a sub-cooled
water pool
PTS-05
(Poster)
M. Schmidtke, D. Lucas
On the modelling of bubble entrainment by impinging jets in CFD simulations
PTS-06
(Poster)
V. Tanskanen, D. Lakehal, M. Puustinen
Validation of Direct Contact Condensation CFD models against condensation pool experiment
Technical Session CO
Containment Thermal Hydraulics
CO-01 S. Mimouni, J-S. Lamy, J. Lavieville, S. Guieu, M. Martin
Modelling of sprays in containment applications with A CMFD code
CO-02 P. Royl, J.R. Travis, W. Breitung, Jongtae Kim, Sang Baik Kim
GASFLOW validation with Panda tests from the OECD SETH Benchmark covering steam/air
and steam/helium/air mixtures
CO-03 M. Ritterath, H.-M. Prasser, D. Paladino, N. Mitric
New PANDA instrumentation for assessing gas concentration distributions in Containment
Compartments
NEA/CSNI/R(2014)12
199
CO-04 M. Andreani, D. Paladino, T. George
On the unexpectedly large effect of re-vaporization of the condensate liquid film in two tests in
the PANDA facility revealed by simulations with the GOTHIC code
CO-05 M. Heitsch, D. Baraldi, H. Wilkening
Validation of CFD for Containment Jet Flows including Condensation
CO-06
(Poster)
S. Kelm, W. Jahn, E.A Reinecke
Operational behaviour of catalytic recombiners - experimental results and modelling
approaches
CO-07
(Poster)
Jinbiao Xiong, Yanhua Yang, Xu Cheng
Effects of spray modes on Hydrogen risk in a Chinese NPP
Technical Session MIX
Mixing Issues
MIX-01 M. Böttcher
Primary Loop Study of a VVER-1000 reactor with special focus on coolant mixing
MIX-02 M. J. Da Silva, S. Thiele, T. Höhne, R. Vaibar, U. Hampel
Experimental studies and CFD calculations for buoyancy driven mixing phenomena
MIX-03 S. Kliem, T. Höhne, U. Rohde, F.-P. Weiss
Experiments on slug mixing under natural circulation conditions at the ROCOM test facility
using high resolution measurement technique and numerical modelling
MIX-04 F. Ducros, U. Bieder, O. Cioni, T. Fortin, B. Fournier, P. Quéméré
Verification and validation considerations regarding the qualification of numerical schemes for
LES dilution problems
MIX-05 S. Tóth, A. Aszódi
CFD Study on coolant mixing in VVER-440 Fuel rod bundle and fuel assembly head
MIX-06 H.-M. Prasser, A. Manera, B. Niceno, M. Simiano, B. Smith, C. Walker, R. Zboray
Fluid mixing at a T-junction
MIX-07 Th. Frank, M. Adlakha, C. Lifante, H.-M. Prasser, F. Menter
Simulation of turbulent and thermal mixing in T-junctions using URANS and scale-resolving
turbulence models in ANSYS-CFX
MIX-08 A.K. Kuczaj, E.M.J. Komen
Large Eddy simulation of turbulent mixing in a T-junction
MIX-09
(Poster)
M. Bykov, A. Moskalev, A. Shishov, O. Kudryavtsev, D. Posysaev
Validation of CFD code ANSYS CFX against experiments with saline slug mixing performed
at the Gidropress 4-loop WWER-1000 test facility
MIX-10
(Poster)
M. Bykov, A. Moskalev, D. Posysaev, O. Kudryavtsev, A. Shishov
Validation of CFD code ANSYS CFX against experiments with asymmetric saline injection
performed at the Gidropress 4-loop WWER-1000 test facility
Technical Session BOI
Boiling Flow, Bubbly Flow and Critical Heat Flux
BOI-01 D. Lucas, M. Beyer, J. Kussin, P. Schütz
Benchmark database on the evolution of two-phase flows in a vertical pipe
BOI-02 B.J. Yun, B.U.Bae, W.M.Park, D.J.Euh, G.C.Park, C-.H. Song
Characteristics of local bubble parameters of sub-cooled boiling flow in an annulus
BOI-03 B. Končar, B. Mavko
Wall-to-fluid heat transfer mechanisms in boiling flows
BOI-04 B.U. Bae, B.J. Yun, H.Y. Yoon, G.C. Park, C.-H. Song
Development of two-phase flow CFD code (EAGLE) with interfacial area transport equation

NEA/CSNI/R(2014)12
200
for analysis of subcooled boiling flow
BOI-05 S. Mimouni, F. Archambeau, M. Boucker, J. Lavieville, C. Morel
A second order turbulence model based on a Reynolds Stress approach for two-phase boiling
flow and application to fuel assembly analysis
BOI-06 A. Bieberle, D. Hoppe, C. Zippe, E. Schleicher, M. Tschofen, T. Suehnel, W. Zimmermann, U.
Hampel
Void measurement in boiling water reactor rod bundles using high resolution gamma ray
Tomography
BOI-07 M. Damsohn, H.-M. Prasser
CFD validation of film flows by novel high speed liquid film sensor with high spatial
resolution
BOI-08 F. Fischer, U. Hampel
Ultra fast electron beam X-ray computed tomography for two-phase flow measurement
BOI-09 M. C. Galassi, F. Moretti, F. D’Auria
CFD code validation and benchmarking against BFBT boiling flow experiment
BOI-10 L. Vyskocil, J. Macek
Boiling flow simulation in NEPTUNE_CFD and FLUENT codes
BOI-11
(Poster)
J. Macek, L. Vyskocil
Simulation of critical heat flux experiments in NEPTUNE_CFD code
Technical Session MS
Multi-Scale Analysis
MS-01 F. Cadinu, T. Kozlowski, P. Kudinov
Study of algorithmic requirements for a system-to-CFD coupling Strategy
MS-02 D. Jamet, O. Lebaigue, C. Morel, and B. Arcen
Towards a multi-scale approach of two-phase flow modelling in the context of DNB modelling
MS-03 D. Lakehal
LEIS for the prediction of turbulent multi-fluid flows with and without phase change applied to
thermal-hydraulics
MS-04 A. Dehbi
Assessment against DNS data of a coupled CFD-stochastic model for particle dispersion in
turbulent channel flows
Technical Session CSG
Core and Steam Generators
CSG-01 M. E. Conner, E. Baglietto, A.M. Elmahdi
CFD methodology and validation for single-phase flow in PWR fuel assemblies
CSG-02 D. Tar, G. Baranyai, Gy. Ézsol, I. Tóth
Experimental investigation of coolant mixing in VVER reactor fuel bundles by particle image
velocimetry
CSG-03
(Poster)
K.S. Dolganov, A.V. Shishov
Cross-verification of one- and three-dimensional models for VVER steam generator
CSG-04
(Poster)
T. Ikeno, S. Kakinoki
Experimental and numerical approach to validate pressure loss predictability of a commercial
code
CSG-05
(Poster)
V.F. Strizhov, M.A. Bykov, A.Ye. Kiselev .V. Shishov, A.A. Krutikov, D.A. Posysaev, D.A.
Mustafina
Development of a 3D model of tube bundle of VVER reactor steam generator
NEA/CSNI/R(2014)12
201
Technical Session AR
Advanced Reactors
AR-01 K. D. Hamman, R. A. Berry
A CFD M&S Process for fast reactor fuel assemblies
AR-02 I. Kei Ito, T. Kunugi,. H. Ohshima
Development and validation of high-precision CFD method with Volume-Tracking algorithm
for gas-liquid two-phase flow simulation on unstructured mesh
AR-03 H. M. McIlroy, D. M. McEligot, R. J. Pink
Idaho National Laboratory program to obtain benchmark data on the flow phenomena in a
scaled model of a prismatic gas-cooled reactor lower plenum for the validation of CFD codes?
AR-04
(Poster)
N. Kimura, K. Hayashi, H. Kamide
Experimental approach to flow field evaluation in upper plenum of reactor vessel for
innovative sodium cooled fast reactor
AR-05
(Poster)
D.Ramdasu, N.S. Shivakumar, G. Padmakumar, C. Anand Babu, G. Vaidyanathan, S.
Rammohan, S.K Sreekala, S. Manikandan, S. Saseendran
Validation by Experiments for gas entrainment studies in 5/8 surge tank model of PFBR
Conclusions and Recommendations
There were over 140 participants to the XCFD4NRS workshop to hear 5 invited talks, 3 talks on
OECD-CSNI activities related to CFD, 44 technical papers, and to see 15 posters. This is about a 40%
increase with respect to the previous CFD4NRS held in Garching in 2006, and this confirms that there is a
real need for such workshops. The original objective that 2/3 of the papers be concerned with two-phase
issues and 1/3 dedicated to experimental techniques and CFD grade experimental data was achieved. Many
participants sent the message that the workshop was well organised.
The USA is a candidate to host a follow-up meeting, organized by the US-NRC (confirmed by NRC a
few days after the workshop). The suggestion received encouraging remarks from the audience during the
discussion at the panel session. KAERI also proposed to host and organize a future workshop. The
majority of participants considered they would be interested in attending a follow-up workshop within two
years. Comments were made during the panel session on the content of XCFD4NRS. It was considered
that some contributions were not directly related to the nuclear safety. Another comment suggested that
such workshops should be a forum to discuss novel approaches, but that one must also keep in mind that
the end users are people from the nuclear safety area. There was a consensus on the need to maintain the
high quality of the papers. It was also suggested to promote international benchmarks for CFD.
Both the CFD4NRS and XCFD4NRS workshops proved to be a very valuable means to assess the
status of CFD code capabilities and validation, to exchange experiences in CFD code applications, and to
monitor progress. There was again an offer to publish selected papers from the workshop in a special issue
of the Nuclear Engineering and Design (NED) journal. It was also mentioned that the special issue devoted
to CFD4NRS received a very high number of visits on the journal website, and many of the papers have
subsequently been downloaded. Session chairmen will make a selection of papers to be submitted to the
NED Journal. It was anticipated that the special issue of NED dedicated to XCFD4NRS would appear in
2010.
The following additional comments were made:

NEA/CSNI/R(2014)12
202
Current capabilities of two-phase measurement techniques are still too limitative for CFD
validation. Further efforts are required to develop more advanced techniques, such as X-ray PIV,
and international cooperation is necessary to support the high cost of development.
Most of CFD codes are commercial and do not offer a full transparency with access to sources,
which may be a problem from a regulation point of view.
Most of CFD codes are commercial and do not offer a full transparency with access to sources,
which may be a problem from a regulatory point of view.
Application of CFD to Nuclear Safety requires that code uncertainties are determined, as they are
now for system codes.
The participants made the following recommendations:
One should keep a close link between people developing experimental techniques and performing
validation experiments, and people developing CFD models and codes.
Best Practice Guidelines should still be promoted, which requires that they are further developed
and made more specific to each application. For two-phase CFD the establishment of Guidelines
on the choice of the physical models depending on the phenomena being investigated has to be
considered as a long-term activity.
Experimental techniques should be further developed to provide CFD-grade data for validating
CFD models, including estimates of measurement uncertainties.
A new item should be added in the scope of the workshop: the development and application of
uncertainty evaluation methods for CFD codes.

NEA/CSNI/R(2014)12
203
CFD4NRS-3: Experimental Validation and Application of CFD and CMFD Codes to Nuclear
Reactor Safety Issues
Background
Computational methods have been used in the safety analysis of nuclear reactor systems for more than
thirty years. During this time, reliable codes have been developed for analysing the primary system and the
secondary system response, and similar programmes have also been written for containment and severe
accident analyses. These codes are written as networks of 1-D or even 0-D cells. It is evident, however,
that the flow in many reactor primary components is essentially 3-D in nature, as e.g. in natural circulation,
and mixing and stratification in containments. Computational Fluid Dynamics (CFD) has the potential to
treat flows of this type, and to handle geometries of almost arbitrary complexity. Hence, CFD is expected
to feature more frequently in reactor thermal-hydraulics in the future, as over the last decade, three-
dimensional CFD codes have been increasingly used to predict steady-state and transient flows in nuclear
reactor safety (NRS) applications. The reason for the increased use of multidimensional CFD methods is
not only the increased availability of capable computer systems but also the ongoing drive to improve and
reduce uncertainty in our predictions of important phenomena, e.g., pressurized thermal shock, boron
mixing, and thermal striping and to address new design features such as advanced accumulators and helical
steam generators.
However, while traditional approaches to Nuclear Reactor Safety (NRS) analysis, using system codes
for example, have been successful because a large database of mass, momentum and energy exchange
correlations (from essentially 1-D special effect experiments) has been built to them, analogous data for
3-D flows is very sparse in comparison, making CFD codes for 3-D NRS applications limited. In fact, the
main difficulty is that industrial-type CFD is highly non-linear, and resolution of flow structures spanning
a wide range of scales (e.g. boundary and free-shear layers, vertical structures, zones of recirculation, etc.)
is required. CFD codes contain empirical models for simulating turbulence, heat transfer, multiphase flows,
and chemical reactions. Such models should be validated before they can be used with sufficient
confidence in NRS applications. The necessary validation is performed by comparing model results against
trustworthy data. A reliable model assessment requires CFD simulations with control of numerical errors to
avoid erroneous conclusions being drawn concerning the performance of the physical models employed in

NEA/CSNI/R(2014)12
204
the simulation. In addition, despite the increased availability of capable computer systems, challenges
abound when one is faced with a requirement to simulate a full-scale reactor scenario.
Although reactor system code models will still play a key role in the future for full transient analyses,
there will be critical safety issues requiring the resolution provided by advanced three dimensional CFD
codes. With proposed design features, CFD will play an ever-increasing role in the safety analysis of future
reactor designs. Currently, some safety authorities (e.g., NRC) and industry have started utilizing CFD
codes for a better estimation of uncertainties and to improve the basis for regulatory and design decisions.
It is therefore important that the nuclear community (research and safety authorities as well as the industry)
spend time and resources to validate and demonstrate the applicability of CFD codes for various reactor
safety issues. The mixing-T benchmark exercise presented in this workshop is a good example of these
efforts.
All these issues have prompted an Organization for Economic Cooperation and Development/Nuclear
Energy Agency (OECD/NEA) initiative to form writing groups of experts with the specific task of
assessing the maturity of CFD codes for NRS applications and to establish a database and best practice
guidelines for their validation and use. The CFD4NRS-3 Workshop is a development from these activities,
and follows the two previous CFD4NRS workshops held in Garching, Germany (Sept. 2006) and
Grenoble, France (Sept. 2008).
Scope
The purpose of the workshop was to provide a forum for numerical analysts and experimentalists to
exchange information in the field of NRS-related activities relevant to CFD validation, with the objective
of providing input to WGAMA CFD experts to create a practical, state-of-the-art, web-based assessment
matrix on the use of CFD for NRS applications. The workshop included single-phase and multiphase CFD
applications as well as new experimental techniques, including the following:
Single-phase and two-phase CFD simulations with an emphasis on validation were sought in areas
such as boiling flows, free-surface flows, direct contact condensation, and turbulent mixing. These
should relate to NRS-relevant issues such as pressurized thermal shock, critical heat flux, pool heat
exchangers, boron dilution, hydrogen distribution, and thermal striping. The use of systematic error
quantification and Best Practice Guidelines (BPGs) was encouraged.
Experiments providing data suitable for CFD validation — specifically in the area of NRS —
including local measurement devices such as multi-sensor optical or electrical probes, Laser Doppler
Velocimetry (LDV), hot-film/wire anemometry, Particle Image Velocimetry (PIV), Laser-Induced
Fluorescence (LIF), and other innovative techniques. It was strongly recommended that the papers
include a discussion of measurement uncertainties.
Welcoming Address
B. Sharon (US NRC, USA)
Invited Lectures
1. J. H. Mahaffy (PSU, USA)
Synthesis of T-Junction Benchmark Results
2. K. Okamoto (Univ. Tokyo, Japan)
Best Practice Procedures on Performing Two-Phase Flow Experiments for CFD Validation
3. K. C. Mousseau (INL, USA)
Computational Fluid Dynamics and Experimental Fluid Dynamics Database

NEA/CSNI/R(2014)12
205
4. O. Simonin (INPT, France)
CFD Modeling of Dispersed Two-Phase Flow
5. E. Laurien (Univ. Stuttgart, Germany)
Numerical Simulation of Flow and Heat Transfer of Fluids at Supercritical Pressure
Technical Session 1
Advanced Reactors (1)
1. M. Böttcher
CFD Analysis of Decay Heat Removal Scenarios of the Lead Cooled ELSY Reactor
2. R. W. Johnson
Evaluation of an Experimental Data Set to Be Validation Data for CFD for a VHTR
3. A. Onea, M. Böttcher, D. Struwe
Lead Pressure Loss in the Heat Exchanger of the ELSY Fast Lead-Cooled Reactor by CFD
Approach
4. U. Bieder, V. Barthel, F. Ducros, P. Quéméré, S. Vandroux
CFD Calculations of Wire Wrapped Fuel Bundles: Modelling and Validation Strategies
Technical Session 2
Containment (1)
5. B. Schramm, J. Stewering, M. Sonnenkalb
Validation of a Simple Condensation Model for Simulation of Gas Distributions in
Containments with CFX
6. M.A. Mohaved, J.R. Travis
Assessment of the Gasflow Spray Model Based on the Calculations of the Tosqan
Experiments 101 and 113
7. T.J.H. Pättikangas, J. Niemi, J. Laine, M. Puustinen, H. Purhonen
CFD Modelling of Condensation of Vapour in the Pressurized Poolex Facility
8. A. Zirkel, E. Laurien
Investigation of the Turbulent Mass Transport during the Mixing of a Stable Stratification
with a Free Jet Using CFD Methods
Technical Session 3
Boiling Flow (1)
9. I. Kataoka, K. Yoshida, M. Naitoh, H. Okada, T. Mori
Modeling of Turbulent Transport Term of Interfacial Area Concentration in Gas-Liquid
Two-Phase Flow
10. D. Bestion
Applicability of Two-Phase CFD to Nuclear Reactor Thermalhydraulics and Elaboration
of Best Practice Guidelines
11. P. Ruyer, K. Keshk, F. Deffayet, Ch. Morel, J. Pouvreau, F. François
Numerical Simulation of Condensation in Bubbly Flow
12. A. Douce, S. Mimouni, M. Guingo, C. Morel, J. Laviéville, C. Baudry
Validation of Neptune_CFD 1.0.8 for Adiabatic Bubbly Flow and Boiling Flow
Technical Session 4
NEA/CSNI/R(2014)12
206
Bundle Flow
13. E. Dominguez-Ontiveros, Y. A. Hassan, M. E. Conner, Z. Karoutas
Experimental Benchmark Data for PWR Rod Bundle with Spacer-Grids
14. H. S. Kang, S. K. Chang, C.-H. Song
CFD Analysis of the Matis-H Experiments on the Turbulent Flow Structures in a 5x5 Rod
Bundle with Mixing Devices
15. J. Yan, K. Yuan, E. Tatli, D. Huegel, Z. Karoutas
CFD Prediction of Pressure Drop for the Inlet Region of a PWR Fuel Assembly
16. E. Merzari, W.D. Pointer, J. G. Smith
Numerical Simulation of the Flow in Wire-Wrapped Pin Bundles: Effect of Pin-Wire
Contact Modeling
Technical Session 5
Fire
17. M.A. Mohaved
Recommendation for Maximum Allowable Mesh Size for Plant Combustion Analyses
with CFD Codes
18. C. Lapuerta, F. Babik, S. Suard, L. Rigollet
Validation Process of the Isis CFD Software for Fire Simulation
19. H. S. Kang, S. B. Kim, M.-H. Kim, H. C. No
CFD Analysis of a Hydrogen Explosion Test with High Ignition Energy in Open Space
Technical Session 6
Dry Cask
20. G. Banken, K. Tavassoli, J. Bondre
Validation of Computational Fluid Dynamics Code Models for Used Fuel Dry Storage
Systems
21. G. Zigh, J. Jolis, J. A. Fort
A 2-D Test Problem for CFD Modeling Heat Transfer in Spent Fuel Transfer Cask
Neutron Shields
22. E. Lindgren, S. Durbin
Pressure Drop Measurement of Laminar Air Flow in Prototypic BWR and PWR Fuel
Assemblies
23. K. Das, D. Basu, J. Solis, G. Zigh
Computational Fluid Dynamics Modeling Approach to Evaluate VSC-17 Dry Storage
Cask Thermal Designs
24. I. Rampall, K. K. Niyogi, D. Mitra-Majumdar
Validation of the FLUENT CFD Computer Program by Thermal Testing of a Full Scale
Double-Walled Prototype Canister for Storing Chernobyl Spent Fuel
Technical Session 7
Advanced Reactors (2)
25. S. B. Rodriguez, S. Domino, M. S. El-Genk
Fluid Flow and Heat Transfer Analysis of the VHTR Lower Plenum Using the Fuego CFD
Code

NEA/CSNI/R(2014)12
207
26. J.R. Buchanan, Jr., R.C. Bauer
Experimental Efforts for Predictive Computational Fluid Dynamics Validation
27. A. Dehbi, S. Martin
Particle Deposition on an Array of Spheres Using RANS-RSM Coupled to a Lagrangian
Random Walk
28. B. Wilson, J. Harris, B. Smith, R. Spall
Unsteady Validation Metrics for CFD in a Cylinder Array
Technical Session 8
Boiling Flow (2)
29. B.J. Yun, A. Splawski, S. Lo, C.-H. Song
Prediction of a Subcooled Boiling Flow with Mechanistic Wall Boiling and Bubble Size
Models
30. D. Prabhudharwadkar, M. Lopez de Bertodano, J. Buchanan Jr.
Assessment of the Heat Transfer Model and Turbulent Wall Functions for Two Fluid CFD
Simulations of Subcooled and Saturated Boiling
31. L. Vyskocil, J. Macek
CFD Simulation of Critical Heat Flux in a Tube
32. C. Gerardi, H. Kim, J. Buongiorno
Use of Synchronized, Infrared Thermometry and High-Speed Video for Generation of
Space- and Time-Resolved High-Quality Data on Boiling Heat Transfer
Technical Session 9
Mixing Flow (1)
33. G. Pochet, M. Haedens, C.R. Schneidesch, D. Léonard
CFD Simulations of the Flow Mixing in the Lower Plenum of PWRs
34. D. R. Shaver, S. P. Antal, M. Z. Podowski, D. H. Kim
Direct Steam Condensation Modeling for a Passive PWR Safety System
35. B. Yamaji, R. Szijártó, A. Aszódi
Study of Thermal Stratification and Mixing Using PIV
36. C. Boyd, K. Armstrong
Challenges for the Extension of Limited Experimental Data to Full-Scale Severe Accident
Conditions Using CFD
Technical Session 10
Plant Applications
37. T.J.H. Pättikangas, J. Niemi, V. Hovi, T. Toppila, T. Rämä
Three-Dimensional Porous Media Model of a Horizontal Steam Generator
38. G. M. Cartland Glover, E. Krepper, H. Kryk, F.-P. Weiss, S. Renger, A. Seelinger,
F. Zacharias, A. Kratzsch, S. Alt, W. Kästner
Fibre Agglomerate Transport in a Horizontal Flow
39. P. Nilsson, E. Lillberg, N. Wikström
LES with Acoustics and FSI for Deforming Plates in Gas Flow
40. L. Mengali, D. Melideo, F. Moretti, F. D'Auria, O. Mazzantini
CFD Calculation of the Pressure Drop through a Rupture Disk

NEA/CSNI/R(2014)12
208
41. Y. S. Bang, G. S. Lee, S.-W. Woo
A Shallow Water Equation Solver and Particle Tracking Method to Evaluate the Debris
Transport
Technical Session 11
Pressurized Thermal Shock
42. P. Apanasevich, D. Lucas, T. Höhne
Pre-Test CFD Simulations on Topflow-PTS Experiments with ANSYS CFX 12.0
43. M. Scheuerer, J. Weis
Transient Computational Fluid Dynamics Analysis of Emergency Core Cooling Injection
at Natural Circulation Conditions
44. P. Coste, J. Laviéville, J. Pouvreau, C. Baudry, M. Guingo, A. Douce
Validation of the Large Interface Method of Neptune_CFD 1.0.8 for Pressurized Thermal
Shock (PTS) Applications
45. M. Labois, D. Lakehal
PTS Prediction Using the CMFD Code TransAT: the COSI Test Case
Technical Session 12
Containment (2)
46. J. Stewering, B. Schramm, M. Sonnenkalb
Validation of CFD-Models for Natural Convection, Heat Transfer and Turbulence
Phenomena
47. D. Paladino, M. Andreani, R. Zboray, J. Dreier
Toward a CFD-Grade Database Addressing LWR Containment Phenomena
48. E. Studer, J. Brinster, I. Tkatschenko, G. Mignot, D. Paladino, M. Andreani
Interaction of a Light Gas Stratified Layer with an Air Jet Coming from Below: Large
Scale Experiments and Scaling Issues
49. J. Yáñez, A. Kotchourko, A. Lelyakin
Hydrogen Deflagration Simulations under Typical Containment Conditions for Nuclear
Safety
Technical Session 13
Boiling Flow (3)
50. D. Lucas, M. Beyer, L. Szalinski
Experimental Data on Steam Bubble Condensation in Poly-Dispersed Upward Vertical
Pipe Flow
51. J. L. Muñoz-Cobo, S. Chiva, S. Mendes, M. A. Abdelaziz
Coupled Lagrangian and Eulerian Simulation of Bubbly Flows in Vertical Pipes:
Validation with Experimental Data Using Multi-Sensor Conductivity Probes and Laser
Doppler Anemometry
52. C. Lifante, T. Frank, A.D. Burns, D. Lucas, E. Krepper
Prediction of Polydisperse Steam Bubble Condensation in Sub-Cooled Water Using the
Inhomogeneous Musig Model
Technical Session 14

NEA/CSNI/R(2014)12
209
Mixing Flow (2)
53. J. Kim, J. J. Jeong
Large Eddy Simulation of a Turbulent Flow in a T-Junction
54. M. Tanaka, H. Ohshima
Numerical Simulations of Thermal-Mixing in T-Junction Piping System Using Large
Eddy Simulation Approach
55. S.T. Jayaraju, E.M.J. Komen, E. Baglietto
Large Eddy Simulations for Thermal Fatigue Predictions in a T-Junction: Wall-Function
or Wall-Resolved-Based LES
56. V.M. Goloviznin, S.A. Karabasov, M.A. Zaitsev
Towards Empiricism-Free Large Eddy Simulation for Thermo-Hydraulic Problems
57. R.B. Oza, V.D. Puranik, H.S. Kushwaha, K. Prasad, A. Murthy
Dispersion of Radionuclides and Radiological Dose Computation over a Mesoscale
Domain Using Weather Forecast and CFD Model
Poster Session 2
1. L. Vyskocil, J. Macek
CFD Simulation of Critical Heat Flux in a Rod Bundle
2. R. Szijártó, B. Yamaji, A. Aszódi
Study of Natural Convection around a Vertical Heated Rod Using PIV/LIF Technique
3. V.V. Chudanov, A.E. Aksenova, V.A. Perchiko, A.A. Makarevich, N.A. Pribaturin, O.N. Kashinskii
3D CFD Conv Code: Validation and Verification
4. D. Melideo, F. Moretti, F. Terzuoli, F. D'Auria, O. Mazzantini
Calculation of Pressure Drops through Atucha-II Fuel Assembly Spacer Grids
5. S. Durbin, E. Lindgren, A. Zigh
Measurement of Laminar Velocity Profiles in a Prototypic PWR Fuel Assembly
6. S. Mimouni, N. Mechitoua, E. Moreau, M. Ouraou
CFD recombiner modelling and validation on the H2-Par and Kali-H2 experiments
Poster Session 3
7. I.A. Bolotnov, F. Behafarid, D.R. Shaver, S.P. Antal, K.E. Jansen, R. Samulyak, H. Wei and M.Z.
Podowski
Multiscale Computer Simulation of Fission Gas Discharge During Loss-of-Flow Accident in
Sodium Fast Reactor
8. A. Foissac, J. Malet, R.M. Vetrano, J.-M. Buchlin, S. Mimouni, F. Feuillebois, O. Simonin
Experimental Measurements of Droplet Size and Velocity Distributions at the Outlet of a
Pressurized Water Reactor Containment Swirling Spray Nozzle
9. S. Mimouni, N. Mechitoua, A. Foissac, M. Hassanaly, M. Ouraou
CFD Modeling of Wall Steam Condensation: Two Phase Flow Approach Versus Homogeneous
Flow Approach
10. A. Tentner, S. Lo, D. Pointer, A. Splawski
Advances in the development and validation of CFD- BWR, a Two-Phase Computational Fluid
Dynamics Model for the Simulation of Flow and Heat Transfer in Boiling Water Reactors
Poster Session 4
11. G. Tryggvason, J. Buongiorno
The Role of Direct Simulations in Validation and Verification

NEA/CSNI/R(2014)12
210
12. J.A. Dixon, A. Guijarro Valencia, P. Ireland, P. Ridland, N. Hills
A Coupled CFD Finite Element Analysis Methodology in a Bifurcation Pipe in a Nuclear Plant
Heat Exchanger
13. K. Myllymäki, T. Toppila, T. Brandt
Interpreting Thermocouple Reading in Fuel Assembly Head – A CFD Studyy on Coolant Mixing
14. H. Li, P. Kudinov
Effective Approaches to Simulation of Thermal Stratification and Mixing in a Pressure
Suppression Pool
15. C.-T. Tran, P. Kudinov
A Synergistic Use of CFD, Experiments and Effective Convectivity Model to Reduce Uncertainty
in BWR Severe Accident Analysis
Poster Session 5
16. D. Soussan, S. Pascal Ribot, M. Grandotto
2D Simulation of Two-Phase Flow across a Tube Bundle with Neptune_CFD Code
17. N. Mechitoua, S. Mimouni, M. Ouraou, E. Moreau
CFD Modelling of the Test 25 of the Panda Experiment
18. M. Labois, J. Panyasantisuk, T. Höhne, S. Kliem, D. Lakehal
On the Prediction of Boron Dilution Using the CMFD Code Transat: the Rocom Test Case
Conclusions and Recommendations
There were over 200 registered participants at the CFD4NRS-3 workshop. The program consisted of
about 75 technical papers. Of these, 57 were oral presentations and 18 were posters. An additional 20
posters related to the OECD/NEA–sponsored CFD benchmark exercise on thermal fatigue in a T-Junction
were presented. In addition, 5 keynote lectures were given by distinguished experts. This is about a 30%
increase with respect to the previous XCFD4NRS workshop held in Grenoble in 2008, and a 70% increase
compared to the first CFD4NRS workshop held in Garching in 2006, confirming that there is a real and
growing need for such workshops.
The papers presented in the conference tackled different topics related to nuclear reactor safety issues.
The conference consisted of 14 technical sessions. Among the topics included were containment, advanced
reactors, multiphase flows, flow in a rod bundle, fire analysis, flows in dry casks, thermal analysis, mixing
flows and pressurized thermal shock (PTS). About 1/3 of the papers were concerned with two-phase flow
issues and the rest were devoted to single-phase CFD validation.
South Korea is a candidate to host a follow-up meeting scheduled in 2012, organized by KAERI.
KAERI also volunteered to sponsor and organize the second OECD/NEA CFD benchmark exercise. In the
closure meeting after the panel session discussion, the representative from the Paul Scherrer Institut (PSI)
proposed to host a future workshop scheduled for 2014, and to organize and sponsor the third OECD/NEA
benchmark exercise based on a stratification experiment in the PANDA facility at PSI. The great majority
of participants were interested in attending a follow-up workshop within two years.
Comments were made during the panel session on the content of CFD4NRS-3. Two of the comments
are that experiments can provide insight into the physics, and that CFD is now an accepted analysis tool,
though it is very important to follow BPGs. There was a consensus on the need to maintain the high quality
of the papers. The promotion of international benchmarking exercises for CFD was strongly encouraged.
Another comment suggested that such workshops should be a forum to discuss novel approaches, but that
one must also keep in mind that the end users are people from the nuclear safety community. The
CFD4NRS, XCFD4NRS and CFD4NRS-3 workshops have proved to be very valuable means to assess the

NEA/CSNI/R(2014)12
211
status of CFD code capabilities and validation, to exchange experiences in CFD code applications, and to
monitor future progress.
There was again an offer to publish selected papers from the workshop in a special issue of the
Nuclear Engineering and Design (NED) journal. It was also mentioned that the special issue devoted to
CFD4NRS and XCFD4NRS received a very high number of visits on the journal website and a large
number of papers were subsequently downloaded. Session chairmen will make a selection of papers to be
submitted to the NED Journal. It is anticipated that the special issue of NED dedicated to CFD4NRS-3 will
appear early in 2012.
The following additional comments were made:
Collaboration between academia and industry is occurring and producing valuable results.
It is useful to keep a view of the physics when interpreting the adequacy of CFD predictions.
Challenges abound when one is faced with a requirement to simulate a full-scale reactor scenario,
because there is often little relevant experimental data, there is often uncertainty in the boundary
conditions, and that the need for grid sensitivity studies must be balanced against computational
resources.
When applying CFD to real problems, one should never lose sight of the overall picture in order to
guide the decision-making in respect to the details of the CFD modelling approach.
Current capabilities of two-phase measurement techniques are still too limited for CFD validation.
Further efforts are required to develop more advanced techniques, such as X-ray PIV, and
international cooperation is necessary to support the high cost of model development.
Many CFD codes are commercial in origin and do not offer full transparency in respect to access to
source code, which may be a problem from a regulatory point of view.
Application of CFD to NRS issues requires that code uncertainties be determined, as they are now
for system codes.
The participants made the following recommendations:
One should keep a close link between people developing experimental techniques and performing
validation experiments, and the people developing CFD models and codes.
There is still limited use of BPGs in many applications, and often there is use of only one
computational grid, sometimes even with first-order spatial discretization. This clearly limits
understanding, since the physical and numerical errors are still superimposed.
Best Practice Guidelines should still be promoted, which requires that they are further developed and
made more application-specific. For two-phase CFD, the establishment of guidelines on the choice
of the physical models depending on the phenomena being investigated has to be considered as a
longterm activity.
The papers indicated a consideration of CFD best practice guidelines, but their use is not
documented in a systematic way by the authors.
The presentations in the workshop demonstrated virtually universal awareness and attention to
BPGs, but with varied success in practical implementation.
A good application of CFD doesn’t necessarily provide “margin”, but helps to understand its
physical justification when such margin exists.
Experimental techniques should be further developed to provide CFD-grade data for validating CFD
models, including estimates of measurement uncertainties.

NEA/CSNI/R(2014)12
212
It appears that CFD is now state-of-the-art for computing adiabatic bubbly flows, and that the
implementation of heat and mass transfer models for boiling and condensation has begun. One can
also expect advancements in the use of CFD to study boiling and condensation at a fundamental
level in the near future.
CFD4NRS-4
The Experimental Validation and Application of CFD and CMFD Codes
to Nuclear Reactor Technology
Background
The last decade has seen an increasing use of three-dimensional CFD and CMFD codes in predicting
single-phase and multi-phase flows under steady-state or transient conditions in nuclear reactors. The
reason for the increased use of multi-dimensional CFD methods is that a number of important thermal-
hydraulic phenomena cannot be predicted using traditional one-dimensional system analysis codes with the
required accuracy and spatial resolution. CFD codes contain empirical models for simulating turbulence,
heat transfer, multi-phase interaction and chemical reactions. Such models must be validated before they
can be used with sufficient confidence in nuclear reactor safety (NRS) applications.
The necessary validation is performed by comparing model predictions against trustworthy data.
However, reliable model assessment requires CFD simulations to be undertaken with full control over
numerical errors and input uncertainties to avoid erroneous conclusions being drawn. These requirements
have prompted an OECD/NEA initiative to form writing groups of experts with the specific task of
assessing the maturity of CFD codes for NRS applications, and to establish a data base and Best Practice
Guidelines (BPGs) for their validation.
Scope
Following the CFD4NRS workshops held in Garching, Germany (Sept. 2006), Grenoble, France (Sep.
2008) and Washington D.C., USA (Sept. 2010), this Workshop is intended to extend the forum created for
numerical analysts and experimentalists to exchange information in the application of Computational Fluid
Dynamics (CFD) and Computational Multi-Fluid Dynamics (CMFD) to nuclear reactor safety issues. The
CFD4NRS-3
The Experimental Validation and Application of CFD and
CMFD Codes to Nuclear Reactor Technology
OECD/NEA & IAEA Workshop
Hosted by
Korea Atomic Energy Reserch Institute (KAERI)
Daejeon, S. Korea
10 - 12 September 2012

NEA/CSNI/R(2014)12
213
workshop includes single-phase and multi-phase CFD applications, and offers the opportunity to present
new experimental data for CFD validation. Emphasis has been in the following areas:
More emphasis has to be given on the experiments, especially on two-phase flow, for advanced
CMFD modeling for which sophisticated measurement techniques are required.
It is very important to deepen understanding the physics before numerical analysis.
Single-phase and multi-phase CFD simulations with a focus on validation are welcome in areas
such as: single-phase heat transfer, boiling flows, free-surface flows, direct contact condensation
and turbulent mixing. These should relate to NRS-relevant issues, such as pressurized thermal
shock, critical heat flux, pool heat exchangers, boron dilution, hydrogen distribution in
containments, thermal striping, etc. The use of systematic error quantification and the application
of BPGs are strongly encouraged.
Experiments providing data suitable for CFD or CMFD validation are also welcome. These should
include local measurements using multi-sensor probes, laser-based techniques (LDV, PIV or LIF),
hot-film/wire anemometry, imaging, or other advanced measuring techniques. Papers should
include a discussion of measurement uncertainties.
Welcoming Address
W.-P. Baek (KAERI)
Invited Lectures
1. D. Bestion (CEA, France)
The Difficult Challenge of a Two-Phase CFD Modelling for All Flow Regimes
2. C.-H. Song (KAERI)
Synthesis of OECD/NEA-KAERI Rod Bundle Benchmark Exercise
3. Richard R. Schultz (INL, USA)
Using CFD to Analyze Nuclear Systems Behaviour: Defining the Validation Requirements
4. S. J. Lee (POSTECH, S. Kore)
Advanced Flow Visualization Technique for CFD Validation
5. K. Ikeda (MHI, Japan)
CFD Application to Advanced Design for High Efficiency Spacer Grid
Technical Session 1
Advanced Reactors
1. B.-U. Bae, S. Kim, Y.-S. Park, B.-D. Kim, K.-H. Kang
Multi-dimensional temperature distribution in PCCT (Passive Condensation Cooling Tank) and
PCHX (Passive Condensation Heat Exchanger) of PAFS (Passive Auxiliary Feedwater System)
2. M. Tanaka
Uncertainty Quantification Scheme in V&V of Fluid-Structure Thermal Interaction Code for
Thermal Fatigue Issue in a Sodium-cooled Fast Reactor
3. Y. Xu, J. Yan, K. Yuan, C. Fu, P. Xu, S. Ray
CFD Multi-Physics Analysis of Fuel Bundles under Accidental Conditions for New Fuel
Designs
Technical Session 2
Condensation
4. P. Coste, A. Ortolan

NEA/CSNI/R(2014)12
214
Two-Phase CFD PTS Validation in an Extended Range of Thermo Hydraulics Conditions Covered
by the COSI Experiment
5. A. Dehbi, F. Janasz, B. Bell Validation of a CFD Model for Steam Condensation in the Presence of Non-condensable Gases
6. L. Vyskocil, J. Schmid, J. Macek CFD Simulation of Air-Steam Flow with Condensation
7. G. Zschaeck, T. Frank, A. D. Burns
CFD Modelling and Validation of Wall Condensation in the Presence of Non-condensable Gases
Technical Session 3
Boiling/Bubbly Flow (1)
8. K. Fu, H. Anglart
Implementation and Validation of Two-Phase Boiling Flow Models in OpenFOAM
9. J. Peltola, T.J.H. Pättikangas
Development and Validation of a Boiling Model for OpenFOAM Multiphase Solver
10. E. Krepper, R. Rzehak, C. Lifante, Th. Frank CFD for Subcooled Flow Boiling: Coupling Wall Boiling and Population Balance Models
11. Y. Liao, D. Lucas, E. Krepper
Application of New Closure Models for Bubble Coalescence and Breakup to Steam-Water Pipe
Flow
Technical Session 4
Bundle Flow (1)
12. S.-K. Chang, S. Kim, C.-H. Song
OECD/NEA – MATiS-H Rod Bundle CFD Benchmark Exercise Test
13. U. Bieder
Analysis of the Flow Down and Upwind of Split-Type Mixing Vanes
14. Th. Frank, S. Jain, A.A. Matyushenko, A.V. Garbaruk The OECD/NEA MATiS-H Benchmark – CFD Analysis of Water Flow through a 5x5 Rod Bundle
with Spacer Grids using ANSYS Fluent and ANSYS CFX
Technical Session 5
Bundle Flow (2)
15. A. Kiss, A. Aszódi
Sensitivity Studies on CFD Analysis for Heat Transfer of Supercritical Water Flowing in Vertical
Tubes
16. J. Yan, M. E. Conner, R. A. Brewster, Z. E. Karoutas, E. E. Dominguez-Ontiveros, Y. A. Hassan
Validation of CFD Method in Predicting Steady and Transient Flow Field Generated by PWR
Mixing Vane Grid
17. Y .V. Yudov Using the DINUS Code for Direct Numerical Simulation of Hydrodynamic Processes in VVER-
440 Fuel Rod Bundles
Technical Session 6
Hydrogen Transport and Fire

NEA/CSNI/R(2014)12
215
18. H. S. Kang, S. B. Kim, M.-H. Kim, H. C. No
CFD Analysis of a Hypothetical H2 Explosion Accident between the HTTR and the H2 Production
Facility in JAEA
19. S. Kelm, W. Jahn, E.-A. Reinecke, H.-J. Allelein
Passive Auto-Catalytic Recombiner Operation Validation of a CFD-approach against OECD-
THAI HR2-test
20. V. Shukla, P. Sivagangakumar, S. Ganju1, A. Kumar K. R. S. G. Markandeya Development of CFD Based Numerical Tool for Addressing Hydrogen Transport and Mitigation
Issues in the Containment of Nuclear Power Plants
21. S. Worapittayaporn, L. Rudolph
Validation of Coupled BVM-EDM Combustion Model in ANSYS CFX for Hydrogen Combustion
Calculation during Postulated Severe Accidents in NPP
Technical Session 7
Multi-scale & Multi-physics Analysis
22. S. Haensch, D. Lucas, E. Krepper, T. Höhne
A CMFD-model for Multi-scale Interfacial Structures
23. L. Vyskocil, J. Macek
Coupling of CFD Code with System Code and Neutron Kinetics Code
24. M. Jeltsolv, K. Kööp, P. Kudinov, W. Villanueva Development of Domain Overlapping STH/CFD Coupling Approach for Analysis of Heavy Liquid
Metal Thermal Hydraulics in TALL-3D Experiment
25. B. Gaudron, S. Jayaraju, S. Bellet, P. Freydier, D. Alvarez
Code_Saturne Integral Validation on ROCOM Test for Heterogeneous Inherent Boron
Dilution Transient
Technical Session 8
Plant Applications (1)
26. J. Bakosi, N. Barnett, M. A. Christon, M. M. Francois, R. B. Lowrie
Large-scale Turbulent Simulations of Grid-to-rod Fretting
27. D. Melideo, F. Moretti, F. Terzuoli, F. D’Auria, O. Mazzantini
Optimization of the Atucha-II Fuel Assembly Spacer Grids
28. D. Melideo, L. Mengali, F. Moretti, W. Giannotti, F. Terzuoli, F. D’Auria, O. Mazzantini Development of a CFD Model for Investigation of Atucha-II Containment
29. S.-G. Yang, E.-J. Park
CFD Simulations for APR+ Reactor Design
Technical Session 9
Bundle Flow (3)
30. F. Barthel, R. Franz, E. Krepper, U. Hampel
Experimental Studies on Sub-cooled Boiling in a 3x3 Rod Bundle
31. E. Dominguez-Ontiveros, Y. Hassan, R. Franz, R. Barthel, U. Hampel
Experimental study of a Simplified 3 X 3 Rod Bundle using DPIV
32. C. Lifante, B. Krull, Th. Frank, R. Franz, U. Hampel 3x3 Rod Bundle Investigations. Part II: CFD Single-Phase Numerical Simulations
Technical Session 10

NEA/CSNI/R(2014)12
216
Plant Applications (2)
33. C. Boyd, R. Skarda
CFD Predictions of Standby Liquid Control System Mixing in Generic BWR
34. T. Hoehne, A. Grahn, S. Kliem
Numerical Simulation of the Insulation Material Transport to a Pressurized Water Reactor Core
under Loss of Coolant Accident Conditions
35. T. Rämä, T. Toppila, T. Kelavirta,P. Martin CFD Analysis of the Temperature Field in Emergency Pump in LOVIISA NPP
36. M. Ishigaki, T. Watanabe, H. Nakamura
Numerical Simulation of Two-Phase Critical Flow in a Convergent-divergent Nozzle
Technical Session 11
Boiling/Bubbly Flow (2)
37. I.-C. Chu, H. C. No, C.-H. Song
Visualization of High Heat Flux Boiling and CHF Phenomena in a Horizontal Pool of Saturated
Water
38. D. Lucas, M. Banowski, D. Hoppe, M. Beyer, L. Szalinski, F. Barthel, U. Hampel
Experimental Data on Vertical Air-Water Pipe Flow Obtained by Ultrafast Electron Beam X-Ray
Tomography Measurements
39. R. Sugrue, T. McKrell, J. Buongiorno On the Effects of Orientation Angle, Subcooling, Mass Flux, Heat Flux, and Pressure on Bubble
Departure Diameter in Subcooled Flow Boiling
40. G.H. Yeoh, S.C.P. Cheung, J.Y. Tu, D. Lucas, E. Krepper
Validation of Models for Bubbly Flows and Cap Flows using One-Group and Two-Group Average
Bubble Number Density
Technical Session 12
Mixing
41. F. Moretti, F. D’Auria
Addressing the Accuracy Quantification issue for CFD Investigation of In-Vessel Flows
42. M. Gritskevich, A. V. Garbaruk, F. R. Menter
Investigation of the Thermal Mixing in a T-Junction Flow with Different SRS Approaches
43. D. Kloeren, M. Kuschewski, E. Laurien Large-Eddy Simulations of Stratified Flows in Pipe Configurations Influenced by a Weld Seam
44. J. Xiong, X. Pan, S. Koshizuka, L. Zhang, X. Cheng
CFD Analysis on Localized Mass Transfer Enhancement in the Downstream of an Orifice
Poster Session 1
1. M. A. Zaitsev, V. M. Goloviznin, S. A. Karabasov
A Highly Scalable Hybrid Mesh Cabaret Miles Method for MATIS-H Problem
2. L. A. Golibrodo, N. A. Strebnev, M. M. Kurnosov, I. U. Galkin, I. K. Vdovkina
CFD Simulation of Turbulent Flow Structure in a Rod Bundle Array with the Split-Type Spacer
Grid
3. A. Batta, A. G. Class
CFD (Computational Fluid Dynamics) Study of Isothermal Water Flow in Rod Bundles with Split-
type Spacer Grids: OECD/NEA Benchmark, MATiS-H

NEA/CSNI/R(2014)12
217
4. N. Cinosi, S. Walker, M. Bluck, R. Issa, G. Hewitt
MATIS-H benchmark exercise with code STAR-CCM
5. D. Chang, S. Tavoularis
Hybrid URANS/LES simulations of isothermal water flow in the MATiS-H rod bundle with a
split-vane spacer grid
6. A. Obabko, P. Fischer, E. Merzari, W. D. Pointer, T. Tautges
A Comparison of ID-DES and LES results for MATiS-H Benchmark
7. A. Rashkovan, D. Novog
Turbulence Modeling Sensitivity Study for 2x2 and 5x5 Fuel Bundle
8. L. Capone, S. Benhamadouche
MATiS-H benchmark. McMaster University contribution
9. H. S. Kang, S. K. Chang, C.-H. Song
CFD Analysis of the OECD/NEA-KAERI Rod Bundle Benchmark Exercise with a Split Vane by
RANS Turbulent Models of START-CCM+ 6.06
Poster Session 2
10. H. Kwon, S. J. Kim, K. W. Seo, D. H. Hwang
Computations of Transient Natural Circulation on PNL 2 by 2 Test Bundle Experiments
11. S. Kim, D. E. Kim, C. H. Song
Experimental Study on the Thermal Stratification and Natural Circulation Flow inside a Pool
12. A. Nakamura, Y. Utanohara, K. Miyoshi, N. Kasahara
Simulation of Thermal Stripping at T-Junction Pipe Using LES with Mode Parameters and
Temperature Diffusion Schemes
13. S. J. Lee, H. K. Cho, K. H. Kang, S. Kim, H. Y. Yoon
Numerical Analysis of the Passive Condensation Cooling Tank (PCCT) using the CUPID Code
Video Session
1. T. Yasui, S. Someya, K. Okamoto
Boiling Behavior of Droplets Impinging on Heated Liquid Metal Surface
2. A. Ylönen, H.-M. Prasser
Cross-mixing in a Fuel Rod Bundle, Enhanced by Functional Spacer Grids Portraits of Liquid Film
Flows
3. M. Damsohn, D. Ito, R. Zboray, H.-M. Prasser
Portraits of Liquid Film Flows
4. H.-M. Prasser
The Best of Wire-mesh Sensors -Inspirations for Their Future Use
5. B. Niceno, Y. Sato
Numerical Modeling of Pool and Flow Boiling
6. A.A. Matyushenko, A.V. Garbaruk, S. Jain, T. Frank
ANSYS Fluent results for the split type spacer grid geometry of the OECD/NEA MATiS-H
Benchmark
Conclusions and Recommendations
There were over 150 registered participants at the CFD4NRS-4 workshop. The programme consisted
of about 48 technical papers. Of these, 44 were presented orally and 4 as posters. An additional 8 posters
related to the OECD/NEA–KAERI sponsored CFD benchmark exercise on turbulent mixing in a rod
bundle with spacers (MATiS-H) were presented and a special session was allocated for 6 video
presentations. In addition, five keynote lectures were given by distinguished experts.

NEA/CSNI/R(2014)12
218
The number of participants represents a 25% decrease with respect to the previous CFD4NRS-3
Workshop held in Washington DC in Septemeber 2010. Nonetheless, this attendance record compared
favourably with the second Workshop in the series, XCFD4NRS, held in Grenoble in 2008, and a two-fold
increase compared to the first Workshop, held in Garching in 2006. Factors influencing the slight fall in
attendance are: (i) fewer domestic students; (ii) the NUTHOS-9 conference being held in Taiwan at exactly
the same time; (iii) the expense involved in making the trip to Korea from Europe and (especially) the US;
(iv) the negative impact on nuclear research following the Fukushima disaster in March 2011.
The papers given at the Workshop covered different nuclear safety topics, and, for the first time, some
reactor design issues. However, the ratio of papers devoted to experimentation to those devoted to analysis
was not as well balanced as previously seen, with too few experimental works reported. Progress in
modelling, and improvements in the use of the Best Practice Guidelines for performing quality CFD
computations can only result from pursuing a programme of analysis of a multitude of CFD-grade
experiments. A wrong idea circulates, particularly among managers, that CFD simulations may ultimately
replace costly experimentation. This is only partially true in the case of prototypic experiments, but CFD
tools include many models and closure laws: these have to be properly validated, and this can only be
achieved by means of experiments. It remains a primary objective of the CFD4NRS series of Workshops to
bring together the experimenters providing the data needed to improve the physical models in CFD codes,
and the analysts who utilise these models.
Switzerland is a candidate to host the next Workshop in 2014, and will be organised by staff at the
Paul Scherrer Institute (PSI), who have also volunteered to sponsor and organise the third OECD/NEA
CFD benchmark exercise, based on an experiment to be performed in the containment test facility
PANDA. In the panel session at the close of the Workshop, delegates confirmed their interest in attending
a follow-up Workshop, and considered the two-year interval to be appropriate.
As is customary at the panel session, which in this case was led by B. L. Smith (PSI) and D. Bestion
(CEA), summaries were made by the respective session chairpersons of the presentations that were given
during the 12 oral sessions, and comments invited from the audience. To open the session, A. Ulses
(IAEA) expressed satisfaction with the organisation and smooth-running of the Workshop, and
complimented the staff at KAERI on their efforts in this regard. The level of attendance confirmed the
international level of interest in the theme and objectives of the Workshop, and he pledged continuing
IAEA support for the future.
The session topics were wide and various, including advanced reactor modelling, flow mixing issues,
boiling and condensation modelling, multiphase and multiphysics problems, containment analysis, plant
application, hydrogen transport and fires, advanced measuring techniques, and single and multiphase flow
in rod bundles. Comments arising from the summaries included:
The nuclear CFD community should be encouraged to apply and further develop Uncertainty
Qualification (UQ) methods in regard to their simulations, including uncertainties arising from the
numerical solution procedure, the physical models employed, and in the initial and boundary
conditions.
Delegates appeared satisfied that the subject areas covered by the Workshop were comprehensive
within the nuclear CFD community, and that leading experts in the field adequately covered the
present state-of-the-art or projected future trends, as appropriate.
It was noted that CFD is no substitute for properly understanding the basic thermal-hydraulic
phenomena involved in the particular numerical analysis being undertaken. The CFD tools should be
used instead to quantify the complex interplay between the various physical processes taking place.

NEA/CSNI/R(2014)12
219
The current format, length and interval between CFD4NRS Workshops were generally considered
appropriate, as was the rotation of venues worldwide. Hence no changes were proposed.
The formula of combining the blind CFD benchmark activity with the occasion of the Workshop
was appreciated, giving participants the possibility to display their work (as posters without
accompanying papers), discuss their experiences with other participants, and visit the test facility on
which the exercise was based. This practice will therefore be continued as far as possible in the
future.
Considerable interest was raised in the proposed forthcoming CFD benchmark on containment
modelling and analysis, and to link the activity with CFD4NRS-5, giving people the opportunity to
visit the PANDA facility.
There was general appreciation of the local Workshop organisation (by KAERI staff), with only a
few minor mishaps being voiced in regard to the arrangements made.
All appreciated the open forum discussions that could take place during coffee breaks, the organised
lunches and the conference banquet.
Some concerns were raised that the quality of the papers was not as high as in previous Workshops
in the series, and the panel chairman, on behalf of the organising committee, promised to address
this issue seriously ahead of CFD4NRS-5.
The analytical presentations at the Workshop demonstrated the almost universal application of Best
Practice Guidelines in producing CFD simulations, including the use of higher order differencing
methods for the fundamental equations. However, in reactor applications, the need for grid
sensitivity studies still has to be balanced against computational resources.
A similar code of practice in conducting experiments appears not to be so widespread, but the need
for test data to be accompanied by error bars as a guide to measurement uncertainty is still to be
encouraged for code validation tests.
Several presentations showed that CFD was being used to guide the design of experiments in several
key areas, and in the placement of instrumentation. This is a very welcome development.

NEA/CSNI/R(2014)12
220

NEA/CSNI/R(2014)12
221
APPENDIX 2: GLOSSARY
General
ADS Automatic Depressurisation System (or Accelerator-Driven System)
AIAA American Institute of Aeronautics and Astronautics
ANS American Nuclear Society
APRM Average Power Range Monitor
APWR Advanced Pressurised Water Reactor
ASCHLIM Assessment of Computational Fluid Dynamics Codes for Heavy Liquid Metals (EU 5th
Framework Accompanying Measure)
ASME American Society of Mechanical Engineers
ASTAR Advanced Three-Dimensional Two-Phase Flow Simulation Tool for Application to
Reactor Safety (EU 5th Framework Programme)
BDBA Beyond Design-Basis Accident
BPGs Best Practice Guidelines
CFD Computational Fluid Dynamics
CMT Core Make-up Tank
CPU Central Processing Unit
CSNI Committee on the Safety of Nuclear Installations
DBA Design-Basis Accident
DES Detached Eddy Simulation
DHX Dumped Heat Exchanger
DNB Departure from Nucleate Boiling
DNS Direct Numerical Simulation
DRACS Direct Reactor Auxiliary Cooling System
DVI Direct Vessel Injection
ECCOMAS European Community on Computational Methods in Applied Sciences
ECCS Emergency Core-Cooling System
ECORA Evaluation of Computational Fluid Dynamic Methods for Reactor Safety Analysis
(EU 5th Framework Programme)
EOC End-Of-Cycle
ERCOFTAC European Research Community on Flow, Turbulence and Combustion
EUBORA Boron Dilution Experiments (EU 4th Framework Concerted Action)
FISA-2003 The Fifth International Symposium on EU Research and Reactor Safety
FLOWMIX-R Fluid Mixing and Flow Distribution in the Reactor Circuit (EU 5th Framework Shared-
Cost Action)

NEA/CSNI/R(2014)12
222
GAMA Working Group on the Analysis and Management of Accidents
HDC Hydrogen Distribution and Combustion
HTC Heat Transfer Coefficient
HPI High Pressure Injection
HYCOM Integral Large Scale Experiments on Hydrogen Combustion for Severe Accident Code
Validation (EU 5th Framework Project)
IAEA International Atomic Energy Agency
ICAS International Comparative Assessment Study
IPSS Innovative Passive Safety Systems (EU 4th Framework Programme)
IRWST In-Containment Refuelling Water Storage Tank
ISP International Standard Problem
JNC Japanese Nuclear Corporation
JSME Japanese Society of Mechanical Engineers
LANL Los Alamos National Laboratory
LBLOCA Large-Break Loss Of Coolant Accident
LES Large Eddy Simulation
LFWH Loss of Feedwater Heating
LOCA Loss Of Coolant Accident
LPIS Low Pressure Injection System
LPRM Local Power Range Monitor
LS Level Set
MCPR Minimum Critical Power Ratio
NEA Nuclear Energy Agency
NRS Nuclear Reactor Safety
OECD Organisation for Economic Cooperation and Development
PAHR Post Accident Heat Removal
PRHR Passive Residual Heat Removal
PIRT Phenomena Identification Ranking Table
PTS Pressurised Thermal Shock
RANS Reynolds-Averaged Navier-Stokes
RPT Recirculation Pump Trip
RPV Reactor Pressure Vessel
RSM Reynolds-Stress Model
SARA Severe Accident Recriticality Analysis
SG Steam Generator
SLB Steam-Line Break
SM Structure Mechanics
TEMPEST Testing and Enhanced Modelling of Passive Evolutionary Systems Technology for
containment cooling (EU 5th Framework Programme)
V&V Verification and Validation
VOF Volume-Of-Fluid
VTT Technical Research Centre of Finland

NEA/CSNI/R(2014)12
223
Codes
ABAQUS Commercial structural analysis program
AQUA In-house CFD code developed by JNC
ANSYS Commercial structural analysis program
APROS In-house thermal-hydraulic code, developed Technical Research Centre of Finland
ASTEC Accident Source Term Evaluation Code, developed jointly by IPSN and GRS for analysis
of severe accidents
ATHLET System analysis code, used extensively in Germany
CAST3M General-purpose finite element code, developed by CEA
CATHARE System analysis code, used extensively in France
ANSYS-CFX Commercial CFD software program
COCOSYS Containment code, developed by GRS for severe accident analysis
CONTAIN Lumped-parameter code, sponsored by the US NRC, for severe accident analysis
DINUS-3 Direct Numerical Simulation (DNS) tool, developed by JNC
FELIOUS Structural analysis code, developed by NUPEC
FLICA4 3-D, two-phase thermal-hydraulic code, developed by CEA/IPSN
FLUBOX In-house, two-phase flow code, developed by GRS
FLUENT Commercial CFD software program
GASFLOW In-house CFD code developed by FZK
GENFLO In-house CFD code, developed by VTT
GOTHIC General-purpose containment code with 3-D capability, developed by Numerical
Application Incorporated (NAI)
MCNP Monte-Carlo Neutronics Program
MELCOR Lumped-parameter code for analysing severe accidents, developed at Sandia NL
MpCCI Mesh-based parallel Code Coupling Interface, distributed by STAR-CD/Adapco, used to
couple CFD and SM codes
Permas Commercial finite-element SM program
PHEONICS Commercial CFD software program
RECRIT Computer code for BWR recriticality and reflooding analyses, developed by VTT
RELAP5 System analysis code, used extensively in US and elsewhere
SAS4A Sub-channel code, developed by ANL, used for analysis of severe accidents in liquid-
metal-cooled reactors
SATURNE 3D CFD code, developed by EDF
SCDAP Severe Core Damage Analysis Package, developed at Idaho National Laboratory
STAR-CD Commercial CFD software program
TONUS Containment code, developed by CEA under sponsorship of IRSN
TRAC Transient Reactor Analysis Code
TRACE TRAC/RELAP Combined Computational Engine
TRIO-U CFD software program, developed by CEA
VSOP Code for reactor physics and fuel cycle simulation, developed at FZJ

NEA/CSNI/R(2014)12
224
Experiments
MICOCO Mixed Convection and Condensation benchmark exercise, based on MISTRA data
MISTRA Experimental facility operated by CEA Saclay, used for containment studies
MSRE Molten Salt Reactor Experiment, operated by ORNL
NOKO Experimental facility at FZJ, used for studies of BWR condensers
PANDA Integral test facility at PSI for analysis containment transients
PHEBUS Experimental facility at CEA Cadarache, used for severe accident research
ROCOM Experimental facility at FZR, used to investigate upper plenum mixing
RUT Large-scale combustion experimental facility at the Kurchatov Institute, Russia
SETH Series of experiments, sponsored by OECD, to be performed in the PANDA facility at
PSI
UPTF Upper Plenum Test Facility at FZR, examining LOCA-related phenomena
Reactors
ABWR Advanced Boiling Water Reactor
ADS Accelerator-Driven System
BWR Boiling Water Reactor
EPR European Pressurised-Water Reactor
ESBWR European Simplified Boiling Water Reactor
GCR Gas-Cooled Reactor
GFR Gas-Cooled Fast Reactor
HDR Heissdampfreaktor; reactor concept using super-heated steam for cooling, now used
for containment experiments, situated at Karlstein, Germany
HTGR High Temperature Gas-Cooled Reactor
HTR High Temperature Reactor
KONVOI Siemens-KWU design of EPR
LMFBR Liquid Metal Fast Breeder Reactor
LWR Light Water Reactor
NPP Nuclear Power Plant
PWR Pressurised Water Reactor
SWR-1000 Siedenwasserreaktor (Boiling Water Reactor)-1000
VVER Russian version of the PWR
Related Documents