Assessment of anovulation in eumenorrheic women: comparison of ovulation detection algorithms Kristine E. Lynch, Ph.D., a,b Sunni L. Mumford, Ph.D., a Karen C. Schliep, Ph.D., a Brian W. Whitcomb, Ph.D., c Shvetha M. Zarek, M.D., a,d Anna Z. Pollack, Ph.D., a,e Elizabeth R. Bertone-Johnson, Sc.D., c Michelle Danaher, Ph.D., a Jean Wactawski-Wende, Ph.D., f Audrey J. Gaskins, B.S.E., a,g and Enrique F. Schisterman, Ph.D. a a Epidemiology Branch, Division of Intramural Population Health Research, and d Program of Reproductive and Adult Endocrinology, Eunice Kennedy Shriver National Institute of Child Health and Human Development, National Institutes of Health, US Department of Health & Human Services, Bethesda, Maryland; b Department of Public Health and Nursing, Westminster College, Salt Lake City, Utah; c Division of Biostatistics and Epidemiology, University of Massachusetts School of Public Health and Health Sciences, Amherst, Massachusetts; e Department of Global and Community Health, George Mason University, Fairfax, Virginia; f Department of Social and Preventive Medicine, University at Buffalo, Buffalo, New York; and g Departments of Nutrition and Epidemiology, Harvard School of Public Health, Boston, Massachusetts Objective: To compare previously used algorithms to identify anovulatory menstrual cycles in women self-reporting regular menses. Design: Prospective cohort study. Setting: Western New York. Patient(s): Two hundred fifty-nine healthy, regularly menstruating women followed for one (n ¼ 9) or two (n ¼ 250) menstrual cycles (2005–2007). Intervention(s): None. Main Outcome Measure(s): Prevalence of sporadic anovulatory cycles identified using 11 previously defined algorithms that use E 2 , P, and LH concentrations. Result(s): Algorithms based on serum LH, E 2 , and P levels detected a prevalence of anovulation across the study period of 5.5%–12.8% (concordant classification for 91.7%–97.4% of cycles). The prevalence of anovulatory cycles varied from 3.4% to 18.6% using algo- rithms based on urinary LH alone or with the primary E 2 metabolite, estrone-3-glucuronide, levels. Conclusion(s): The prevalence of anovulatory cycles among healthy women varied by algorithm. Mid-cycle LH surge urine-based algorithms used in over-the-counter fertility monitors tended to classify a higher proportion of anovulatory cycles compared with luteal-phase P serum- based algorithms. Our study demonstrates that algorithms based on the LH surge, or in conjunction with estrone-3-glucuronide, potentially estimate a higher percentage of anovulatory episodes. Addition of measurements of postovulatory serum P or urine pregnanediol may aid in detecting ovulation. (Fertil Steril Ò 2014;-:-–-. Ó2014 by American Society for Reproductive Medicine.) Key Words: Ovulation, menstrual cycles, progesterone, luteinizing hormone, estradiol Discuss: You can discuss this article with its authors and with other ASRM members at http:// fertstertforum.com/lynchk-anovulation-eumenorrheic-ovulation-detection-algorithms/ Use your smartphone to scan this QR code and connect to the discussion forum for this article now.* * Download a free QR code scanner by searching for “QR scanner” in your smartphone’s app store or app marketplace. C hronic anovulation has been associated with increased risk of infertility (1), decreased bone mineral density (2), endometrial cancer (3), and when associated with irregular menses is one of several diagnostic criteria for polycystic ovary synd- rome (4). The relationships between dietary (5–7), behavioral (8), and environmental factors (9) and anovulation represent modifiable factors to improve fertility and chronic health conditions. Valid estimates of these relationships, however, depend on accurately identifying anovulatory menstrual cycles. Identification of anovulatory cycles is challenging. Transvaginal ul- trasound, the gold standard (10), in- volves daily, mid-cycle ultrasound scans, which is resource intensive and Received January 30, 2014; revised April 8, 2014; accepted April 23, 2014. K.E.L. has nothing to disclose. S.L.M. has nothing to disclose. K.C.S. has nothing to disclose. B.W.W. has nothing to disclose. S.M.Z. has nothing to disclose. A.Z.P. has nothing to disclose. E.R.B.-J. has nothing to disclose. M.D. has nothing to disclose. J.W.-W. has nothing to disclose. A.J.G. has nothing to disclose. E.F.S. has nothing to disclose. This research was supported by the National Institutes of Health, Intramural Research Program of the Eunice Kennedy Shriver National Institute of Child Health and Human Development (NICHD), contract HHSN275200403394C to the University at Buffalo; and National Institutes of Health training grants T32DK007703-16 and T32HD060454 (to A.J.G.). Reprint requests: Enrique F. Schisterman, Ph.D., Eunice Kennedy Shriver National Institute of Child Health and Human Development, National Institutes of Health, 6100 Executive Blvd., 7B03, Rock- ville, Maryland 20852 (E-mail: [email protected]). Fertility and Sterility® Vol. -, No. -, - 2014 0015-0282/$36.00 Copyright ©2014 American Society for Reproductive Medicine, Published by Elsevier Inc. http://dx.doi.org/10.1016/j.fertnstert.2014.04.035 VOL. - NO. - / - 2014 1 ORIGINAL ARTICLE: GYNECOLOGY AND MENOPAUSE

Welcome message from author
This document is posted to help you gain knowledge. Please leave a comment to let me know what you think about it! Share it to your friends and learn new things together.
Transcript

ORIGINAL ARTICLE: GYNECOLOGY AND MENOPAUSE
Assessment of anovulation ineumenorrheic women: comparison ofovulation detection algorithms
Kristine E. Lynch, Ph.D.,a,b Sunni L. Mumford, Ph.D.,a Karen C. Schliep, Ph.D.,a Brian W. Whitcomb, Ph.D.,cShvetha M. Zarek, M.D.,a,d Anna Z. Pollack, Ph.D.,a,e Elizabeth R. Bertone-Johnson, Sc.D.,c
Michelle Danaher, Ph.D.,a Jean Wactawski-Wende, Ph.D.,f Audrey J. Gaskins, B.S.E.,a,g
and Enrique F. Schisterman, Ph.D.a
a Epidemiology Branch, Division of Intramural Population Health Research, and d Program of Reproductive and AdultEndocrinology, Eunice Kennedy Shriver National Institute of Child Health and Human Development, National Institutesof Health, US Department of Health & Human Services, Bethesda, Maryland; b Department of Public Health and Nursing,Westminster College, Salt Lake City, Utah; c Division of Biostatistics and Epidemiology, University of MassachusettsSchool of Public Health and Health Sciences, Amherst, Massachusetts; e Department of Global and Community Health,George Mason University, Fairfax, Virginia; f Department of Social and Preventive Medicine, University at Buffalo,Buffalo, New York; and g Departments of Nutrition and Epidemiology, Harvard School of Public Health, Boston,Massachusetts
Objective: To compare previously used algorithms to identify anovulatory menstrual cycles in women self-reporting regular menses.Design: Prospective cohort study.Setting: Western New York.Patient(s): Two hundred fifty-nine healthy, regularly menstruating women followed for one (n¼ 9) or two (n¼ 250) menstrual cycles(2005–2007).Intervention(s): None.Main OutcomeMeasure(s): Prevalence of sporadic anovulatory cycles identified using 11 previously defined algorithms that use E2, P,and LH concentrations.Result(s): Algorithms based on serum LH, E2, and P levels detected a prevalence of anovulation across the study period of 5.5%–12.8%(concordant classification for 91.7%–97.4% of cycles). The prevalence of anovulatory cycles varied from 3.4% to 18.6% using algo-rithms based on urinary LH alone or with the primary E2 metabolite, estrone-3-glucuronide, levels.Conclusion(s): Theprevalenceof anovulatory cycles amonghealthywomenvariedbyalgorithm.Mid-cycleLHsurgeurine-basedalgorithmsused in over-the-counter fertility monitors tended to classify a higher proportion of anovulatory cycles compared with luteal-phase P serum-
Use your smartphone
based algorithms. Our study demonstrates that algorithms based on the LH surge, or in conjunctionwith estrone-3-glucuronide, potentially estimate a higher percentage of anovulatory episodes.Addition of measurements of postovulatory serum P or urine pregnanediol may aid in detectingovulation. (Fertil Steril� 2014;-:-–-.�2014 by American Society for Reproductive Medicine.)Key Words: Ovulation, menstrual cycles, progesterone, luteinizing hormone, estradiol
Discuss: You can discuss this article with its authors and with other ASRM members at http://fertstertforum.com/lynchk-anovulation-eumenorrheic-ovulation-detection-algorithms/
to scan this QR codeand connect to thediscussion forum forthis article now.*
* Download a free QR code scanner by searching for “QRscanner” in your smartphone’s app store or app marketplace.
hronic anovulation has been mineral density (2), endometrial cancer criteria for polycystic ovary synd-
C associated with increased risk ofinfertility (1), decreased boneReceived January 30, 2014; revised April 8, 2014; accK.E.L. has nothing to disclose. S.L.M. has nothing to
has nothing to disclose. S.M.Z. has nothing tohas nothing to disclose. M.D. has nothing to dhas nothing to disclose. E.F.S. has nothing to di
This research was supported by the National InstituteEunice Kennedy Shriver National Institute of Ccontract HHSN275200403394C to the Universittraining grants T32DK007703-16 and T32HD060
Reprint requests: Enrique F. Schisterman, Ph.D., EunHealth and HumanDevelopment, National Instiville, Maryland 20852 (E-mail: [email protected]
Fertility and Sterility® Vol. -, No. -, - 2014 0015-Copyright ©2014 American Society for Reproductivehttp://dx.doi.org/10.1016/j.fertnstert.2014.04.035
VOL. - NO. - / - 2014
(3), and when associated with irregularmenses is one of several diagnostic
epted April 23, 2014.disclose. K.C.S. has nothing to disclose. B.W.W.disclose. A.Z.P. has nothing to disclose. E.R.B.-J.isclose. J.W.-W. has nothing to disclose. A.J.G.sclose.s of Health, Intramural Research Program of thehild Health and Human Development (NICHD),y at Buffalo; and National Institutes of Health454 (to A.J.G.).ice Kennedy Shriver National Institute of Childtutes of Health, 6100 Executive Blvd., 7B03, Rock-.gov).
0282/$36.00Medicine, Published by Elsevier Inc.
rome (4). The relationships betweendietary (5–7), behavioral (8), andenvironmental factors (9) andanovulation represent modifiablefactors to improve fertility and chronichealth conditions. Valid estimates ofthese relationships, however, dependon accurately identifying anovulatorymenstrual cycles.
Identification of anovulatorycycles is challenging. Transvaginal ul-trasound, the gold standard (10), in-volves daily, mid-cycle ultrasoundscans, which is resource intensive and
1

ORIGINAL ARTICLE: GYNECOLOGY AND MENOPAUSE
thus impractical in epidemiologic studies. In the absence ofgold-standard methods, daily or multiple well-timed mea-surements of reproductive hormone concentrations arecommonly used to identify ovulatory status in research set-tings. However, given previous research showing anovulationprevalence ranging from 3.7% (11) to 23% (12) among regu-larly menstruating women using hormone assessment, thebest strategy to identify ovulation remains under debate(6, 13–28). It is not clear whether differences in prevalenceestimates are due to ovulation assessment method ordifferences in study design, length of follow-up, or studypopulation.
Algorithms to identify anovulation differ in the hormonesassessed, thresholds used, and the cycle phase. A comparisonof algorithms used to assess ovulatory status has not beenperformed. Therefore, the purpose of the present study wasto compare the prevalence of anovulatory cycles across twomenstrual cycles using previously established algorithmsamong a cohort of healthy, premenopausal women.
MATERIALS AND METHODSStudy Population
The BioCycle Study enrolled 259 regularly menstruatingwomen for one (n ¼ 9) or two (n ¼ 250) cycles as previouslydescribed (29). Participants were female volunteers aged 18–44 years from the Western New York region. Women report-ing at least three regular menstrual periods in the past3 months, no cycle <21 days or >35 days in the past6 months, and no history of gynecologic disorders or chronicdisease were eligible. Women were excluded if they had usedhormonal contraceptives in the past 3 months (12 months iflong-acting) or were currently pregnant or breastfeeding.The University at Buffalo Health Sciences Institutional Re-view Board approved the study and served as the institutionalreview board designated by the National Institutes of Healthunder a reliance agreement. All participants provided writteninformed consent.
Hormone Assessment
Participants attended up to eight clinic visits per cycle. Thevisits were scheduled to occur on approximately the secondday of menstruation, one visit in the mid-follicular phase,three visits during the periovulatory phase, and one visiteach in the early, mid, and late luteal phases. Clinic visitswere initially scheduled using an algorithm accounting foreach woman's self-reported cycle length, with mid-cyclevisits adjusted according to fertility monitor indication ofdays of peak fertility (Clearblue Easy Fertility Monitor; Inver-ness Medical) (30). Participants synchronized the monitor totheir cycle and then checked the monitor daily for a promptfrom the monitor to submit a sample. Thus, between the sixthand the ninth days of a woman's cycle (depending on her cy-cle length history) the monitor begins to request daily tests for10 days. On test days, the woman briefly submerges a teststick in her first-morning urine and then inserts the test stickinto the monitor. The test stick has a nitrocellulose strip withan anti-LH antibody zone and an estrone-3-glucuronide
2
(E3G) conjugate zone. The monitor optically reads the levelof E3G and LH in the urine by the intensity of the lines inthe corresponding zones. Each day, the monitor assigns thewoman to low, high, or peak fertility on the basis of herE3G and LH levels (peak corresponds with approximately 30IU/L for LH). Thus, unlike home LH test sticks, the monitorprovides information to help anticipate the LH surge. Ifthe monitor indicated ‘‘peak fertility’’ on a day without ascheduled visit, the participant was asked to come in thatmorning and the following two mornings. Using the fertilitymonitor, menstrual cycle phase could be defined more accu-rately (31). Women were highly adherent to the study proto-col, with 94% of women completing seven or eight visits percycle.
Monitors were adapted to capture and store hormonelevels on an internal computer chip that was available fordownload for this study. Data card readers were used todownload daily urine E3G and LH values for each participantat every clinic visit. Fasting morning blood samples werecollected at each of the eight cycle visits and processed ac-cording to standardized protocols. Samples were frozen at�80�C and sent as complete participant cycle batches to theKaleida Health Center for Laboratory Medicine (Buffalo,New York) for analysis of hormone concentrations. Estradiol,P, LH, and FSH were measured using the IMMULITE 2000solid phase competitive chemiluminescent enzymatic immu-noassay by Specialty Laboratories on the DPC IMMULITE2000 analyzer (Siemens Medical Solutions Diagnostics).
Algorithm Descriptions
We compared 11 ovulation detection algorithms, 9 of whichhave been previously described (11, 14, 17–19, 22, 32–34),and 2 that were specifically adapted for the BioCycle Study(6, 35). Detailed descriptions of the algorithms are givenbelow. We applied algorithms designed for urinary hormonemeasures (18) to serum samples, because urinary and serumsteroid hormone levels have high concordance (1). Thealgorithms used to classify cycles fall into three categories:[1] luteal-phase P activity (algorithms 1–5); [2] luteal daytransition (algorithm 6); and [3] mid-cycle LH surge (algo-rithms 7–11).
Luteal-phasePActivityAlgorithms (Algorithms1–5)
After ovulation, the corpus luteum produces elevated amountsof P to prepare the endometrium for implantation (1).
Algorithm 1, P ratio (P-R), relative threshold of P. Designedfor daily P measurements, the relative threshold algorithmcompares daily P levels with baseline levels. The baseline levelis usually calculated by averaging daily P concentrationstaken on days 6–10 after the start of menses. The baselinelevel is used as the denominator, and the daily P level is thenumerator. A cycle is classified as anovulatory if the ratioof daily to baseline P does not exceed 3.0 for 3 or moredays. This threshold is thought to reflect steady P productionby the corpus luteum in the luteal phase (17).
Algorithm 2, absolute threshold of P 5 ng/mL (P5). Proges-terone above 5.0 ng/mL (1 ng/mL ¼ 3.2 nmol/L) on at least
VOL. - NO. - / - 2014

Fertility and Sterility®
one luteal-phase sample day from multiple measurements toconstitute an ovulatory cycle (11).
Algorithm 3, absolute threshold of P 3 ng/mL (P3). Proges-terone above 3.0 ng/mL on at least one luteal-phase sampleday from multiple measurements to constitute an ovulatorycycle (32).
Algorithm 4, BioCycle Study specific absolute threshold of
P and timing of LH peak (Bio-P5-LH). In the BioCycle Studythe Bio-P5-LH algorithm was operationalized as follows: acycle was defined as anovulatory if peak P concentrationswere %5.0 ng/mL and there was no observed serum LHpeak on the mid or late luteal-phase visits. For applicationto other studies with measures of LH peak and P, the timingof the LH peak in relation to the peak P measurements caninform whether an adequate number of luteal serum drawswere obtained to assess P rise (6).
Algorithm 5, BioCycle Study specific absolute threshold of
P and timing of LH peak (Bio-P3-LH). We applied the samealgorithm described above (Bio-P5-LH) using%3.0 ng/mL asthe threshold P level. Cycles were defined as anovulatory ifpeak P concentrations were %3 ng/mL and no serum LHpeak was observed on the mid or late luteal-phase visits (35).
LutealDayTransition (LDT)Algorithm(Algorithm6)
The LDT algorithm recognizes the hormonal changes thattranspire during the transition from ovulation to the lutealphase, which include decreased follicular estrogen (E) produc-tion and increased P production from the corpus luteum (20).The peak ratio of urinary E3G and pregnanediol-3-glucuronide, metabolites of E and P, respectively, serves asa proxy for ovulation because of its strong concordancewith the LH peak. The LDT algorithm compares 5-day se-quences of this ratio throughout the cycle and identifies aset of 5 days in which the ratio value is highest at day 1 ofthe sequence and is 40% less than day 1 at days 4 and 5. A cy-cle that does not have such a sequence is classified as anovu-latory, whereas the reverse is considered ovulatory.
In this study the LDT algorithm was applied using serumE2 and P levels, with linear interpolation used to estimatedaily hormone levels between measured levels (detailsdescribed in the statistical analysis section) (18).
Mid-cycle LH Surge (Algorithms 7–11)
The abrupt increase in mid-cycle LH levels is a positive feed-back response to the late follicular-phase increase in E levelsthat occur as ovarian follicles mature (1). Because LH is essen-tial for complete maturation of the ovarian follicle, initiationof follicular rupture, and the expulsion of the ovum from thefully matured follicle, a mid-cycle LH surge is commonly usedas a marker of ovulation. The majority of ovulation predictionkits or fertility monitors use the LH surge to identify estimatedday of ovulation.
Algorithm 7, LH fertility monitor (LH-FM), internal algo-
rithm of the fertility monitor to detect LH surge. TheClearblue Easy Fertility Monitor used for the BioCycle Studyidentified low, high, and peak fertility according to the
VOL. - NO. - / - 2014
manufacturer's proprietary algorithm. A reading of ‘‘highfertility’’ indicates urinary E3G concentrations (typically be-tween 20 and 30 ng/mL) that correlate with the E rise typicallyobserved in the follicular phase (33). The monitor continues toprovide a high reading until a threshold level of urinary LH isdetected, at approximately>30 IU/L, indicating peak fertility.Usually the monitor indicates at least 2 days of high fertilityfollowed by typically 2 days of peak fertility. Rarely, theday of the E threshold coincides with the day of the LH surge,and the monitor will register peak fertility immediatelyfollowing low fertility. Some women only see low and highsignals, particularly if they miss test days or if the cycle isanovulatory. We classified cycles with a ‘‘peak fertility’’reading as ovulatory and as anovulatory otherwise. Althoughfertility monitors are used by clinicians primarily to identifythe timing of ovulation rather than the presence of ovulation,fertility monitors have been used to identify ovulation inepidemiologic studies (36).
Algorithm 8, LH-S1. Luteinizing hormone surge defined as a2.5-fold increase in LH from that of baseline LH levels (14).
Algorithm 9, LH-S2. Luteinizing hormone surge defined as a4.0-fold increase in LH from that of baseline LH levels (19).
Algorithm 10, LH-S3. Luteinizing hormone surge defined asan LH level R180% above the average of the preceding fourLH values (22).
Algorithm 11, LH-S4. Luteinizing hormone surge defined asthe first LH value exceedingþ3 SD above the averages of boththe immediately preceding and following 5 days that is also of%2 days' duration (34).
For the above algorithms (LH-S1 to LH-S4), we classifiedcycles as anovulatory if no LH surge was observed and asovulatory otherwise.
Statistical Analysis
Descriptive statistics were calculated for the study population.We calculated the prevalence of anovulatory cycles observedacross the study period (two cycles) according to each algo-rithm. We further compared pairs of algorithms using percentagreement and Cohen's k statistics, along with calculatingpercentage of cycles that were considered anovulatory byall serum and/or urine algorithms. Linear interpolation wasused for two algorithms requiring daily measurements to es-timate hormone levels on days on which a serum sample wasnot collected (P-R, LDT). The five LH algorithms used avail-able daily urine LH and/or E3G data measured by theClearblue Easy Fertility Monitor. Algorithms using serumdata were applied to the full dataset (n ¼ 509 cycles; n ¼3,903 [95.8%] total visits), whereas cycles that had completefertility monitor data (n ¼ 445 [87.4%]) (30) were used forthe urine algorithm analyses. A sensitivity analysis on thefertility monitor data was conducted to determine whetherexcluding cycles that were thought to have failed to reach apeak for nonhormonal reasons (e.g., missed test, monitordata available only before peak, and test stick reading errors)affected our study conclusions (30).
We evaluated the hormonal patterns between womenwith cycles classified as ovulatory or anovulatory by all
3
ORIGINAL ARTICLE: GYNECOLOGY AND MENOPAUSE
algorithms, and we present geometric mean hormone levelsacross the cycle for two commonly used algorithms, P5 andLH-FM, to represent patterns utilizing both serum and urinealgorithms. All analyses were carried out using SAS version9.3 (SAS Institute).
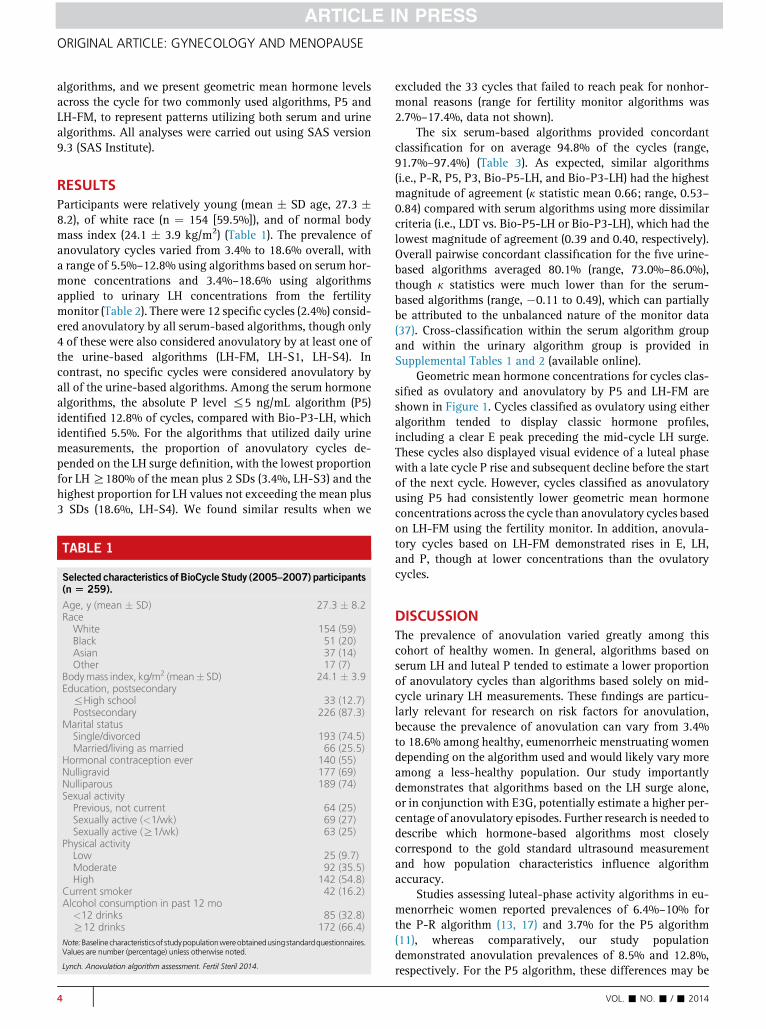
RESULTSParticipants were relatively young (mean � SD age, 27.3 �8.2), of white race (n ¼ 154 [59.5%]), and of normal bodymass index (24.1 � 3.9 kg/m2) (Table 1). The prevalence ofanovulatory cycles varied from 3.4% to 18.6% overall, witha range of 5.5%–12.8% using algorithms based on serum hor-mone concentrations and 3.4%–18.6% using algorithmsapplied to urinary LH concentrations from the fertilitymonitor (Table 2). There were 12 specific cycles (2.4%) consid-ered anovulatory by all serum-based algorithms, though only4 of these were also considered anovulatory by at least one ofthe urine-based algorithms (LH-FM, LH-S1, LH-S4). Incontrast, no specific cycles were considered anovulatory byall of the urine-based algorithms. Among the serum hormonealgorithms, the absolute P level %5 ng/mL algorithm (P5)identified 12.8% of cycles, compared with Bio-P3-LH, whichidentified 5.5%. For the algorithms that utilized daily urinemeasurements, the proportion of anovulatory cycles de-pended on the LH surge definition, with the lowest proportionfor LHR180% of the mean plus 2 SDs (3.4%, LH-S3) and thehighest proportion for LH values not exceeding the mean plus3 SDs (18.6%, LH-S4). We found similar results when we
TABLE 1
Selected characteristics of BioCycle Study (2005–2007) participants(n[ 259).
Age, y (mean � SD) 27.3 � 8.2Race
White 154 (59)Black 51 (20)Asian 37 (14)Other 17 (7)
Bodymass index, kg/m2 (mean� SD) 24.1 � 3.9Education, postsecondary
%High school 33 (12.7)Postsecondary 226 (87.3)
Marital statusSingle/divorced 193 (74.5)Married/living as married 66 (25.5)
Hormonal contraception ever 140 (55)Nulligravid 177 (69)Nulliparous 189 (74)Sexual activity
Previous, not current 64 (25)Sexually active (<1/wk) 69 (27)Sexually active (R1/wk) 63 (25)
Physical activityLow 25 (9.7)Moderate 92 (35.5)High 142 (54.8)
Current smoker 42 (16.2)Alcohol consumption in past 12 mo
<12 drinks 85 (32.8)R12 drinks 172 (66.4)
Note:Baselinecharacteristics of studypopulationwereobtainedusingstandardquestionnaires.Values are number (percentage) unless otherwise noted.
Lynch. Anovulation algorithm assessment. Fertil Steril 2014.
4
excluded the 33 cycles that failed to reach peak for nonhor-monal reasons (range for fertility monitor algorithms was2.7%–17.4%, data not shown).
The six serum-based algorithms provided concordantclassification for on average 94.8% of the cycles (range,91.7%–97.4%) (Table 3). As expected, similar algorithms(i.e., P-R, P5, P3, Bio-P5-LH, and Bio-P3-LH) had the highestmagnitude of agreement (k statistic mean 0.66; range, 0.53–0.84) compared with serum algorithms using more dissimilarcriteria (i.e., LDT vs. Bio-P5-LH or Bio-P3-LH), which had thelowest magnitude of agreement (0.39 and 0.40, respectively).Overall pairwise concordant classification for the five urine-based algorithms averaged 80.1% (range, 73.0%–86.0%),though k statistics were much lower than for the serum-based algorithms (range, �0.11 to 0.49), which can partiallybe attributed to the unbalanced nature of the monitor data(37). Cross-classification within the serum algorithm groupand within the urinary algorithm group is provided inSupplemental Tables 1 and 2 (available online).
Geometric mean hormone concentrations for cycles clas-sified as ovulatory and anovulatory by P5 and LH-FM areshown in Figure 1. Cycles classified as ovulatory using eitheralgorithm tended to display classic hormone profiles,including a clear E peak preceding the mid-cycle LH surge.These cycles also displayed visual evidence of a luteal phasewith a late cycle P rise and subsequent decline before the startof the next cycle. However, cycles classified as anovulatoryusing P5 had consistently lower geometric mean hormoneconcentrations across the cycle than anovulatory cycles basedon LH-FM using the fertility monitor. In addition, anovula-tory cycles based on LH-FM demonstrated rises in E, LH,and P, though at lower concentrations than the ovulatorycycles.
DISCUSSIONThe prevalence of anovulation varied greatly among thiscohort of healthy women. In general, algorithms based onserum LH and luteal P tended to estimate a lower proportionof anovulatory cycles than algorithms based solely on mid-cycle urinary LH measurements. These findings are particu-larly relevant for research on risk factors for anovulation,because the prevalence of anovulation can vary from 3.4%to 18.6% among healthy, eumenorrheic menstruating womendepending on the algorithm used and would likely vary moreamong a less-healthy population. Our study importantlydemonstrates that algorithms based on the LH surge alone,or in conjunction with E3G, potentially estimate a higher per-centage of anovulatory episodes. Further research is needed todescribe which hormone-based algorithms most closelycorrespond to the gold standard ultrasound measurementand how population characteristics influence algorithmaccuracy.
Studies assessing luteal-phase activity algorithms in eu-menorrheic women reported prevalences of 6.4%–10% forthe P-R algorithm (13, 17) and 3.7% for the P5 algorithm(11), whereas comparatively, our study populationdemonstrated anovulation prevalences of 8.5% and 12.8%,respectively. For the P5 algorithm, these differences may be
VOL. - NO. - / - 2014
TABLE 2
Description of algorithms for classifying anovulatory menstrual cycles and proportion observed in the BioCycle Study, 2005–2007.
Algorithm no. Algorithm name HormonesLinear interpolation
used?Anovulatory classification
criteriaAnovulatorycycles, n (%)
Luteal phase P activity algorithmsa
1 P-R Serum P Yes P ratio (daily:baseline) does notexceed 3 for 3 d
43 (8.5)
2 P5 Serum P No Absolute P levels %5 ng/mL 65 (12.8)3 P3 Serum P No Absolute P levels %3 ng/mL 46 (9.0)4 Bio-P5-LH Serum P, LH No P%5 ng/mL and no late LH peak
is observed42 (8.3)
5 Bio-P3-LH Serum P, LH No P%3 ng/mL and no late LH peakis observed
28 (5.5)
Luteal day transition algorithma
6 LDT Serum E2, P Yes Absence of a 5-d sequence ofE2/P, where day 4 and day 5are <day 1 and where day 1is the highest in thesequence
32 (6.3)
Mid-cycle LH surge algorithms (using fertilily monitor urine measurements)b
7 LH-FM Urinary E3G, LH No ‘‘Peak’’ reading on monitor notachieved
78 (17.4)
8 LH-S 1 Urinary LH No <2.5-fold increase in LH fromthat of baseline LH levels
70 (15.6)
9 LH-S 2 Urinary LH No <4.0 fold increase in LH fromany day taken in the follicularphase
47 (11.0)
10 LH-S 3 Urinary LH No No LH value R180% of themean plus 2 SD of the 4preceding days
15 (3.4)
11 LH-S 4 Urinary LH No No LH value exceeds the meanplus 3 SD of the 5 precedingdays
83 (18.6)
a Based on 509 cycles.b Based on 445 cycles with complete visit and ClearPlan Fertility Monitor data.
Lynch. Anovulation algorithm assessment. Fertil Steril 2014.
Fertility and Sterility®
due to the strict definition of eumenorrhea, which restricted tocycles that varied �1 day (11), as compared with the self-reported cycle range of 21–35 days in the present study. Theprevalence of anovulation was similar to studies using theLDT algorithm, which reported a prevalence of anovulationof 10%–13% (18) compared with 6.3% found in our study.
Defining anovulation by fertility monitor LH surge re-sulted in more than fourfold variability. Specifically, in previ-ous studies prevalences varied from 10.0% for LH-FM (33) to6.5% for LH-S1 (14), 17.0% for LH-S2 (19), and 29.0% for LH-S3 (22), whereas anovulation prevalences for these algorithmsin our study population were 17.4%, 15.6%, 11.0%, and 3.4%,respectively. The marked difference for LH-S3, which identi-fied 29.0% anovulatory cycles (22) compared with 3.4% in ourstudy, was most likely due to differences in study populationand sample size: Testart et al. followed only 20 participantsundergoing ovulation induction (22). Apart from this excep-tion, anovulation prevalence was fairly stable using the samealgorithms when comparing anovulation among differentpopulations of healthy, eumenorrheic women. Validationstudies comparing an ovulation algorithm with the gold stan-dard of ultrasound-guided ovulation detection would be idealbecause the one available ultrasound study was limited to 53participants and only identified one cycle as anovulatory (33).
Our results suggest that the proportion of cycles withsubtle hormonal fluctuations is common and explains the
VOL. - NO. - / - 2014
algorithm disagreement. Algorithm disagreement occurswhere there are subtle deviations from the classic hormonalprofiles, such as less-defined rises in LH and E mid-cycle. Inthe present study, the serum-based non–fertility monitor al-gorithms disagreed on ovulatory status in 17.3% of the cycles.Algorithms perform similarly when cycles display either theclassic menstrual cycle pattern or an obvious deviationfrom that pattern (i.e., low, flat levels of all hormones). Ourdata suggest that algorithm choice is important when thereare modest changes from typical ovulatory or anovulatorycycles.
We observed, on average, a higher proportion of anovu-latory cycles and lower percent agreement based on the LHsurge with daily urine measurements, compared with serumP alone or in combination with serum LH and/or E. Ourresults are not surprising given the variability in timing andmagnitude of an LH surge. Direito et al. (38) observedextreme variability in LH surge duration, amplitude, andconfiguration among a cohort of regularly menstruatingwomen 18–45 years of age. Using urinary samples, LH levels2.1 to 61 times baseline levels were observed (38). New mon-itors that include urinary measurements of P metabolites (24,25) should help reduce the variability in assessment ofovulatory status; however, further research is needed tocompare monitor performance with transvaginal ultrasoundamong larger cohorts of women (33).
5

TABLE3
Cross-classificationofserum
andurinealgorithmsandcorrespondingkstatisticsamongBioCycle
Studyparticipants
(n[
509cyclesforserum;n[
445cyclesforurine).
Algorithm
Algorithm
P-R
P5
P3
Bio-P5-LH
Bio-P3-LH
LDT
P-R
1P5
0.75
(0.66,
0.85
)(96
.3)
1P3
0.84
(0.75,
0.93
)(97
.4)
0.81
(0.73,
0.89
)(96
.3)
1Bio-P5
-LH
0.53
(0.39,
0.66
)(92
.7)
0.76
(0.67,
0.85
)(95
.4)
0.60
(0.48,
0.73
)(93
.7)
1Bio-P3
-LH
0.53
(0.39,
0.68
)(93
.9)
0.57
(0.45,
0.69
)(92
.7)
0.74
(0.62,
0.85
)(96
.4)
0.79
(0.68,
0.89
)(97
.2)
1LD
T0.73
(0.61,
0.84
)(96
.3)
0.58
(0.47,
0.70
)(92
.7)
0.67
(0.54,
0.79
)(95
.3)
0.39
(0.24,
0.54
)(91
.7)
0.40
(0.23,
0.56
)(93
.3)
1
LH-FM
LH-S1
LH-S2
LH-S3
LH-S4
LH-FM
LH-FM
1LH
-S1
0.34
(0.23,
0.45
)(81
.8)
10.34
(0.23,
0.45
)(81
.8)
1LH
-S2
�0.11(�
0.17
,�0.06
)(73
.0)
0.03
(�0.07
,0.13)
(77.8)
1�0
.11(�
0.17
,�0.06
)(73
.0)
0.03
(�0.07
,0.13)
(77.8)
LH-S3
0.08
(�0.01
,0.17)
(82.0)
�0.01(�
0.07
,0.05)
(81.8)
�0.05(�
0.08
,�0.03
)(86
.0)
10.08
(�0.01
,0.17)
(82.0)
�0.01(�
0.07
,0.05)
(81.8)
LH-S4
0.34
(0.24,
0.45
)(80
.7)
0.49
(0.38,
0.59
)(85
.4)
0.00
(�0.08
,0.09)
(74.8)
�0.06(�
0.09
,�0.03
)(78
.0)
0.34
(0.24,
0.45
)(80
.7)
0.49
(0.38,
0.59
)(85
.4)
Note:
Referto
Table2forfullde
scrip
tionof
algo
rithm
s.Value
sarekstatistic
and95
%CI(%
agreem
ent).C
I¼confi
denceinterval.
Lynch.
Ano
vulatio
nalgo
rithm
assessmen
t.FertilSteril20
14.
6
ORIGINAL ARTICLE: GYNECOLOGY AND MENOPAUSE
Each clinic visit in the present study was scheduledaccording to a calendar and aided by the use of a dailyhome fertility monitor. Although fertility monitors reliablydetect the LH surge (30, 33), their ability to do so decreaseswith short or long cycles (23). Therefore algorithms thatincorporate timing of the LH surge, such as Bio-P5-LH andBio-P3-LH, may be more appropriate in studies with samplingdesigns that are sensitive to varying cycle lengths.
The present study had some limitations. In particular, par-ticipants were healthy, regularly menstruating women, andresults may not be generalizable to populations at increasedrisk for chronic anovulatory cycles. The inclusion/exclusioncriteria were selected to represent those with no known gyne-cologic disorders or menstrual irregularities, and accordinglythese results are relevant to regularly cycling women. Manyof the algorithms we considered are based on daily hormoneurine samples, and our serum sampling scheme was limitedto eightmeasurements per cycle. Therefore,missing data couldhave limited our ability to apply such algorithms, though ourstudy had much more frequent measures than most. We usedlinear interpolation to generate hormone values for missingvalues between clinic visits. The days for bio-specimen collec-tion were intended as the most dynamic cycle days, such thatlinear interpolation should be a close approximation to thetrue curvilinear functions. Although the current study usedfertility monitors to help time the clinic visits, it is possiblethat visits weremistimed,whichwould affect the interpolationand prevalence estimates. Finally, our inability to comparealgorithms with gold-standard transvaginal ultrasound is alimitation, and future research is needed to distinguish trueanovulatory cycles from those with more subtle disorders,such as luteal-phase deficiency (39).
Our study had several strengths. Previous research evalu-ating anovulatory episodes has been limited to small cohortsof women (12, 15, 33, 36) who were seeking care (36) or hadfertility problems (15, 22). In contrast, our work is broadlyapplicable to healthy, premenopausal women. Additionally,ours is the first study to utilize both urinary daily fertilitymonitor data and serum hormone measurements timed atperiods of key hormonal variability among a relatively largesample of women.
The proportion of anovulatory cycles observed amonghealthy, regularly menstruating women varied by algorithm,with mid-cycle LH surge algorithms tending to identify ahigher proportion of anovulatory cycles (average 13.2%)and luteal P algorithms identifying a lower proportion(average 8.4%). These results suggest that addition of mea-surements of postovulatory P or urine pregnanediol may aidin detecting ovulation. Our findings advance knowledge inthe prevalence of sporadic anovulatory cycles amongregularly menstruating women, but future research iswarranted to determine which to use when ultrasound is un-available or not practical, such as in large epidemiologicstudies or randomized clinical trials. Practical considerations,including available hormone assays and timing and fre-quency of biospecimen collection, may also play a role indetermining the optimal algorithm for clinical or researchuse. A future validation study that compares algorithmswith a gold-standard method such as ultrasound is essential,
VOL. - NO. - / - 2014

FIGURE 1
Geometric mean hormone concentrations across the menstrual cycle for cycles classified as ovulatory and anovulatory using luteal P thresholdalgorithm (P5) and the fertility monitor algorithm (LH-FM). Refer to Table 2 for full descriptions of P5 and LH-FM algorithms.Lynch. Anovulation algorithm assessment. Fertil Steril 2014.
Fertility and Sterility®
particularly in determining the true prevalence of anovula-tory cycles among premenopausal women, risk factors for an-ovulation, long-term implications of anovulation, and forclinical recommendations.
REFERENCES1. Fauser BCJM. Medial approaches to ovarian stimulation in infertility. In:
Strauss JF III, Barbieri RL, editors. Yen & Jaffe's reproductive endocrinology:physiology, pathophysiology, and clinical management. Philadelphia: Elsev-ier Saunders; 2013:701–33.
2. Drinkwater BL, Nilson K, Chesnut CH 3rd, Bremner WJ, Shainholtz S,Southworth MB. Bone mineral content of amenorrheic and eumenorrheicathletes. N Engl J Med 1984;311:277–81.
3. Kaaks R, Lukanova A, Kurzer MS. Obesity, endogenous hormones, andendometrial cancer risk: a synthetic review. Cancer Epidemiol BiomarkersPrev 2002;11:1531–43.
4. Franks S. Polycystic ovary syndrome. N Engl J Med 1995;333:853–61.5. Fenster L, Quale C, Waller K, Windham GC, Elkin EP, Benowitz N, et al.
Caffeine consumption and menstrual function. Am J Epidemiol 1999;149:550–7.
6. Gaskins AJ, Mumford SL, Zhang C, Wactawski-Wende J, Hovey KM,Whitcomb BW, et al. Effect of daily fiber intake on reproductive function:the BioCycle Study. Am J Clin Nutr 2009;90:1061–9.
7. Schliep KC, Schisterman EF, Mumford SL, Pollack AZ, Zhang C, Ye A, et al.Caffeinated beverage intake and reproductive hormones amongpremenopausal women in the BioCycle Study. Am J Clin Nutr 2012;95:488–97.
8. De Souza MJ, Van Heest J, Demers LM, Lasley BL. Luteal phase deficiency inrecreational runners: evidence for a hypometabolic state. J Clin EndocrinolMetab 2003;88:337–46.
VOL. - NO. - / - 2014
9. Bretveld RW, Thomas CM, Scheepers PT, Zielhuis GA, Roeleveld N.Pesticide exposure: the hormonal function of the female reproductivesystem disrupted? Reprod Biol Endocrinol 2006;4:30.
10. Ecochard R, Boehringer H, Rabilloud M, Marret H. Chronological aspects ofultrasonic, hormonal, and other indirect indices of ovulation. BJOG 2001;108:822–9.
11. Malcolm CE, Cumming DC. Does anovulation exist in eumenorrheicwomen? Obstet Gynecol 2003;102:317–8.
12. Wathen NC, Perry L, Lilford RJ, Chard T. Interpretation of single progester-one measurement in diagnosis of anovulation and defective luteal phase:observations on analysis of the normal range. Br Med J (Clin Res Ed)1984;288:7–9.
13. Waller K, Swan SH, Windham GC, Fenster L, Elkin EP, Lasley BL. Use of urinebiomarkers to evaluate menstrual function in healthy premenopausalwomen. Am J Epidemiol 1998;147:1071–80.
14. Park SJ, Goldsmith LT, Skurnick JH, Wojtczuk A, Weiss G. Characteristics ofthe urinary luteinizing hormone surge in young ovulatory women. FertilSteril 2007;88:684–90.
15. McConnell HJ, O'Connor KA, Brindle E, Williams NI. Validity of methods foranalyzing urinary steroid data to detect ovulation in athletes. Med Sci SportsExerc 2002;34:1836–44.
16. O'Connor KA, Brindle E, Miller RC, Shofer JB, Ferrell RJ, Klein NA, et al.Ovulation detection methods for urinary hormones: precision, daily andintermittent sampling and a combined hierarchical method. Hum Reprod2006;21:1442–52.
17. Kassam A, Overstreet JW, Snow-Harter C, De Souza MJ, Gold EB, Lasley BL.Identification of anovulation and transient luteal function using a urinarypregnanediol-3-glucuronide ratio algorithm. Environ Health Perspect1996;104:408–13.
18. Baird DD, Weinberg CR, Wilcox AJ, McConnaughey DR, Musey PI. Using theratio of urinary oestrogen and progesterone metabolites to estimate day ofovulation. Stat Med 1991;10:255–66.
7
ORIGINAL ARTICLE: GYNECOLOGY AND MENOPAUSE
19. Johansson ED, Wide L, Gemzell C. Luteinizing hormone (LH) and progester-one in plasma and LH and oestrogens in urine during 42 normal menstrualcycles. Acta Endocrinol (Copenh) 1971;68:502–12.
20. Hoff JD, Quigley ME, Yen SS. Hormonal dynamics at midcycle: a reevalua-tion. J Clin Endocrinol Metab 1983;57:792–6.
21. Brown J, Skurnick J, Sharma N, Adel T, Santoro N. Frequent intermittentovarian function in women with premature menopause: a longitudinalstudy. Endocr J 1993;1:467–74.
22. Testart J, Frydman R, Feinstein MC, Thebault A, Roger M, Scholler R. Inter-pretation of plasma luteinizing hormone assay for the collection of matureoocytes from women: definition of a luteinizing hormone surge-initiatingrise. Fertil Steril 1981;36:50–4.
23. Ecochard R, Leiva R, Bouchard T, Boehringer H, Direito A, Mariani A, et al.Use of urinary pregnanediol 3-glucuronide to confirm ovulation. Steroids2013;78:1035–40.
24. Blackwell LF, Vigil P, Gross B, d'Arcangues C, Cooke DG, Brown JB.Monitoring of ovarian activity by measurement of urinary excretionrates of estrone glucuronide and pregnanediol glucuronide using theOvarian Monitor, part II: reliability of home testing. Hum Reprod 2012;27:550–7.
25. Blackwell LF, Vigil P, Cooke DG, d'Arcangues C, Brown JB. Monitoringof ovarian activity by daily measurement of urinary excretion rates ofoestroneglucuronideandpregnanediolglucuronideusingtheOvarianMonitor,part III: variability of normal menstrual cycle profiles. Hum Reprod 2013;28:3306–15.
26. McGovern PG, Myers ER, Silva S, Coutifaris C, Carson SA, Legro RS, et al.Absence of secretory endometrium after false-positive home urine luteiniz-ing hormone testing. Fertil Steril 2004;82:1273–7.
27. Santoro N, Crawford SL, Allsworth JE, Gold EB, Greendale GA, Korenman S,et al. Assessing menstrual cycles with urinary hormone assays. Am J PhysiolEndocrinol Metab 2003;284:E521–30.
28. Nielsen MS, Barton SD, Hatasaka HH, Stanford JB. Comparison of severalone-step home urinary luteinizing hormone detection test kits to OvuQuick.Fertil Steril 2001;76:384–7.
8
29. Wactawski-Wende J, Schisterman EF, Hovey KM, Howards PP, Browne RW,Hediger M, et al. BioCycle study: design of the longitudinal study of theoxidative stress and hormone variation during the menstrual cycle. PaediatrPerinat Epidemiol 2009;23:171–84.
30. Howards PP, Schisterman EF, Wactawski-Wende J, Reschke JE, Frazer AA,Hovey KM. Timing clinic visits to phases of the menstrual cycle by using afertility monitor: the BioCycle Study. Am J Epidemiol 2009;169:105–12.
31. Mumford SL, Schisterman EF, Gaskins AJ, Pollack AZ, Perkins NJ,Whitcomb BW, et al. Realignment and multiple imputation of longitudinaldata: an application to menstrual cycle data. Paediatr Perinat Epidemiol2011;25:448–59.
32. Abraham GE, Maroulis GB, Marshall JR. Evaluation of ovulation and corpusluteum function usingmeasurements of plasma progesterone. Obstet Gyne-col 1974;44:522–5.
33. Behre HM, Kuhlage J, Gassner C, Sonntag B, Schem C, Schneider HP,et al. Prediction of ovulation by urinary hormone measurements withthe home use ClearPlan Fertility Monitor: comparison with transvaginal ul-trasound scans and serum hormone measurements. Hum Reprod 2000;15:2478–82.
34. Brown JB. Timing of ovulation. Med J Aust 1977;2:780–3.35. Hambridge HL,Mumford SL, Mattison DR, Ye A, Pollack AZ, BloomMS, et al.
The influence of sporadic anovulation on hormone levels in ovulatory cycles.Hum Reprod 2013;28:1687–94.
36. MacGregor EA, Frith A, Ellis J, Aspinall L. Predicting menstrual migraine witha home-use fertility monitor. Neurology 2005;64:561–3.
37. Feinstein AR, Cicchetti DV. High agreement but low kappa: I. The problemsof two paradoxes. J Clin Epidemiol 1990;43:543–9.
38. Direito A, Bailly S, Mariani A, Ecochard R. Relationships between the luteiniz-ing hormone surge and other characteristics of the menstrual cycle in nor-mally ovulating women. Fertil Steril 2013;99:279–85.
39. Schliep KC, Mumford SL, Hammoud AO, Stanford JB, Kissell KA, Sjaarda LA,et al. Luteal phase deficiency in regularly menstruating women: prevalenceand overlap in identification based on clinical and biochemical diagnosticcriteria. J Clin Endocrinol Metab. In press.
VOL. - NO. - / - 2014

SUPPLEMENTAL TABLE 1
Cross-classification of serum anovulation algorithms (n [ 509).
Algorithm Algorithm % Classified same k (95% CI)
P5P-R No Yes
No 443 28 94.3 0.69 (0.58, 0.79)Yes 1 37
P3P-R No Yes
No 459 12 96.9 0.79 (0.69, 0.89)Yes 4 34
Bio-P5-LHP-R No Yes
No 450 21 92.5 0.48 (0.34, 0.63)Yes 17 21
Bio-P3-LHP-R No Yes
No 461 10 94.1 0.51 (0.36, 0.67)Yes 20 18
LDTP-R No Yes
No 467 10 97.2 0.79 (0.68, 0.89)Yes 4 28
P3P5 No Yes
No 444 0 96.3 0.81 (0.73, 0.89)Yes 19 46
Bio-P5-LHP5 No Yes
No 444 0 95.4 0.76 (0.67, 0.85)Yes 23 42
Bio-P3-LHP5 No Yes
No 444 0 92.7 0.57 (0.45, 0.69)Yes 37 28
LDTP5 No Yes
No 442 2 92.7 0.58 (0.47, 0.70)Yes 35 30
Bio-P5-LHP3 No Yes
No 449 14 93.7 0.60 (0.48, 0.73)Yes 18 28
Bio-P3-LHP3 No Yes
No 463 0 96.4 0.74 (0.62, 0.85)Yes 18 28
LDTP3 No Yes
No 458 5 95.3 0.67 (0.54, 0.79)Yes 19 27
Bio-P3-LHBio-P5-LH No Yes
No 467 0 97.2 0.79 (0.68, 0.89)Yes 14 28
LDTBio-P5-LH No Yes
No 451 16 91.7 0.39 (0.24, 0.54)Yes 26 16
LDTBio-P3-LH No Yes
No 462 19 93.3 0.40 (0.23, 0.56)Yes 15 13
Lynch. Anovulation algorithm assessment. Fertil Steril 2014.
Fertility and Sterility®
VOL. - NO. - / - 2014 8.e1

SUPPLEMENTAL TABLE 2
Cross-classification of urine anovulation algorithms (n [ 445).
Algorithm Algorithm% Classified
same k (95% CI)
LH-S1LH-FM No Yes
No 331 37 81.8 0.34 (0.23, 0.45)Yes 44 33
LH-S2LH-FM No Yes
No 323 45 73.0 �0.11 (�0.17, �0.06)Yes 75 2
LH-S3LH-FM No Yes
No 359 9 82.0 0.08 (�0.01, 0.17)Yes 71 6
LH-S4LH-FM No Yes
No 322 46 80.7 0.34 (0.24, 0.45)Yes 40 37
LH-S2LH-S1 No Yes
No 337 38 77.8 0.03 (�0.07, 0.13)Yes 61 9
LH-S3LH-S1 No Yes
No 362 13 81.8 �0.01 (�0.07, 0.05)Yes 68 2
LH-S4LH-S1 No Yes
No 336 39 85.4 0.49 (0.38, 0.59)Yes 26 44
LH-S3LH-S2 No Yes
No 383 15 86.0 �0.05 (�0.08, �0.03)Yes 47 0
LH-S4LH-S2 No Yes
No 324 74 74.8 0.00 (�0.08, 0.09)Yes 38 9
LH-S4LH-S3 No Yes
No 347 83 78.0 �0.06 (�0.09, �0.03)Yes 15 0
Lynch. Anovulation algorithm assessment. Fertil Steril 2014.
8.e2 VOL. - NO. - / - 2014
ORIGINAL ARTICLE: GYNECOLOGY AND MENOPAUSE
Related Documents