Assessment of air quality benefits from national air pollution control policies in China. Part II: Evaluation of air quality predictions and air quality benefits assessment Litao Wang a, b , Carey Jang c , Yang Zhang d , Kai Wang d , Qiang Zhang e , David Streets e , Joshua Fu f , Yu Lei b , Jeremy Schreifels b, g , Kebin He b , Jiming Hao b, * , Yun-Fat Lam f , Jerry Lin h , Nicholas Meskhidze d , Scott Voorhees c , Dale Evarts c , Sharon Phillips c a Department of Environmental Engineering, Hebei University of Engineering, Handan, Hebei 056038, China b Department of Environmental Science and Engineering, Tsinghua University, Beijing 100084, China c U.S. Environmental Protection Agency, Research Triangle Park, NC 27711, USA d Department of Marine, Earth and Atmospheric Science, North Carolina State University, Raleigh, NC 27695, USA e Decision and Information Sciences Division, Argonne National Laboratory, Argonne, IL 60439, USA f Department of Civil and Environmental Engineering, University of Tennessee, Knoxville, TN 37996, USA g U.S. Environmental Protection Agency, Washington, DC 20460, USA h Department of Civil Engineering, Lamar University, Beaumont, TX 77710, USA article info Article history: Received 17 October 2009 Received in revised form 25 May 2010 Accepted 28 May 2010 Keywords: Air pollution in China Air quality modeling Emission control MM5/CMAQ 11th FYP abstract Following the meteorological evaluation in Part I, this Part II paper presents the statistical evaluation of air quality predictions by the U.S. Environmental Protection Agency (U.S. EPA)’s Community Multi-Scale Air Quality (Models-3/CMAQ) model for the four simulated months in the base year 2005. The surface predictions were evaluated using the Air Pollution Index (API) data published by the China Ministry of Environmental Protection (MEP) for 31 capital cities and daily fine particulate matter (PM 2.5 , particles with aerodiameter less than or equal to 2.5 mm) observations of an individual site in Tsinghua University (THU). To overcome the shortage in surface observations, satellite data are used to assess the column predictions including tropospheric nitrogen dioxide (NO 2 ) column abundance and aerosol optical depth (AOD). The result shows that CMAQ gives reasonably good predictions for the air quality. The air quality improvement that would result from the targeted sulfur dioxide (SO 2 ) and nitrogen oxides (NO x ) emission controls in China were assessed for the objective year 2010. The results show that the emission controls can lead to significant air quality benefits. SO 2 concentrations in highly polluted areas of East China in 2010 are estimated to be decreased by 30e60% compared to the levels in the 2010 Business-As-Usual (BAU) case. The annual PM 2.5 can also decline by 3e15 mgm 3 (4e25%) due to the lower SO 2 and sulfate concentrations. If similar controls are implemented for NO x emissions, NO x concentrations are estimated to decrease by 30e60% as compared with the 2010 BAU scenario. The annual mean PM 2.5 concentrations will also decline by 2e14 mgm 3 (3e12%). In addition, the number of ozone (O 3 ) non-attainment areas in the northern China is projected to be much lower, with the maximum 1-h average O 3 concentrations in the summer reduced by 8e30 ppb. Ó 2010 Elsevier Ltd. All rights reserved. 1. Introduction As mentioned in Part I paper, the Chinese government published the 11th FYP (Five Year Plan, 2006e2010) for national environment protection in 2007. The 11th FYP set up a goal to reduce SO 2 emissions in 2010 by 10% from the 2005 level. In addition, national NO x emission control plan is under development and might be enforced in the near future. The objective of this study is to assess the air quality benefits that would result from the planned SO 2 and NO x emission control efforts during the 11th FYP. The Fifth- Generation NCAR/Penn State Mesoscale Model (MM5)eCMAQ modeling system is applied to simulate air quality in China. Following the meteorological evaluations in Part I paper, this Part II presents the evaluation of air quality predictions, including * Corresponding author. Tel.: þ86 10 62782195; fax: þ86 10 62773650. E-mail address: [email protected] (J. Hao). Contents lists available at ScienceDirect Atmospheric Environment journal homepage: www.elsevier.com/locate/atmosenv 1352-2310/$ e see front matter Ó 2010 Elsevier Ltd. All rights reserved. doi:10.1016/j.atmosenv.2010.05.058 Atmospheric Environment 44 (2010) 3449e3457

Welcome message from author
This document is posted to help you gain knowledge. Please leave a comment to let me know what you think about it! Share it to your friends and learn new things together.
Transcript

lable at ScienceDirect
Atmospheric Environment 44 (2010) 3449e3457
Contents lists avai
Atmospheric Environment
journal homepage: www.elsevier .com/locate/atmosenv
Assessment of air quality benefits from national air pollution controlpolicies in China. Part II: Evaluation of air quality predictions andair quality benefits assessment
Litao Wang a,b, Carey Jang c, Yang Zhang d, Kai Wang d, Qiang Zhang e, David Streets e, Joshua Fu f,Yu Lei b, Jeremy Schreifels b,g, Kebin He b, Jiming Hao b,*, Yun-Fat Lam f, Jerry Lin h,Nicholas Meskhidze d, Scott Voorhees c, Dale Evarts c, Sharon Phillips c
aDepartment of Environmental Engineering, Hebei University of Engineering, Handan, Hebei 056038, ChinabDepartment of Environmental Science and Engineering, Tsinghua University, Beijing 100084, ChinacU.S. Environmental Protection Agency, Research Triangle Park, NC 27711, USAdDepartment of Marine, Earth and Atmospheric Science, North Carolina State University, Raleigh, NC 27695, USAeDecision and Information Sciences Division, Argonne National Laboratory, Argonne, IL 60439, USAfDepartment of Civil and Environmental Engineering, University of Tennessee, Knoxville, TN 37996, USAgU.S. Environmental Protection Agency, Washington, DC 20460, USAhDepartment of Civil Engineering, Lamar University, Beaumont, TX 77710, USA
a r t i c l e i n f o
Article history:Received 17 October 2009Received in revised form25 May 2010Accepted 28 May 2010
Keywords:Air pollution in ChinaAir quality modelingEmission controlMM5/CMAQ11th FYP
* Corresponding author. Tel.: þ86 10 62782195; faxE-mail address: [email protected] (J. Hao)
1352-2310/$ e see front matter � 2010 Elsevier Ltd.doi:10.1016/j.atmosenv.2010.05.058
a b s t r a c t
Following the meteorological evaluation in Part I, this Part II paper presents the statistical evaluation ofair quality predictions by the U.S. Environmental Protection Agency (U.S. EPA)’s Community Multi-ScaleAir Quality (Models-3/CMAQ) model for the four simulated months in the base year 2005. The surfacepredictions were evaluated using the Air Pollution Index (API) data published by the China Ministry ofEnvironmental Protection (MEP) for 31 capital cities and daily fine particulate matter (PM2.5, particleswith aerodiameter less than or equal to 2.5 mm) observations of an individual site in Tsinghua University(THU). To overcome the shortage in surface observations, satellite data are used to assess the columnpredictions including tropospheric nitrogen dioxide (NO2) column abundance and aerosol optical depth(AOD). The result shows that CMAQ gives reasonably good predictions for the air quality.
The air quality improvement that would result from the targeted sulfur dioxide (SO2) and nitrogenoxides (NOx) emission controls in China were assessed for the objective year 2010. The results show thatthe emission controls can lead to significant air quality benefits. SO2 concentrations in highly pollutedareas of East China in 2010 are estimated to be decreased by 30e60% compared to the levels in the 2010Business-As-Usual (BAU) case. The annual PM2.5 can also decline by 3e15 mgm�3 (4e25%) due to thelower SO2 and sulfate concentrations. If similar controls are implemented for NOx emissions, NOx
concentrations are estimated to decrease by 30e60% as compared with the 2010 BAU scenario. Theannual mean PM2.5 concentrations will also decline by 2e14 mgm�3 (3e12%). In addition, the number ofozone (O3) non-attainment areas in the northern China is projected to be much lower, with themaximum 1-h average O3 concentrations in the summer reduced by 8e30 ppb.
� 2010 Elsevier Ltd. All rights reserved.
1. Introduction
Asmentioned in Part I paper, the Chinese government publishedthe 11th FYP (Five Year Plan, 2006e2010) for national environmentprotection in 2007. The 11th FYP set up a goal to reduce SO2
: þ86 10 62773650..
All rights reserved.
emissions in 2010 by 10% from the 2005 level. In addition, nationalNOx emission control plan is under development and might beenforced in the near future. The objective of this study is to assessthe air quality benefits that would result from the planned SO2 andNOx emission control efforts during the 11th FYP. The Fifth-Generation NCAR/Penn State Mesoscale Model (MM5)eCMAQmodeling system is applied to simulate air quality in China.
Following the meteorological evaluations in Part I paper, thisPart II presents the evaluation of air quality predictions, including
L. Wang et al. / Atmospheric Environment 44 (2010) 3449e34573450
surface concentration and column predictions for the base year2005. The air quality changes resulting from the planned nationalcontrols are assessed.
2. Evaluation of air quality predictions
2.1. Evaluation against surface observations
Few surface air quality observation data are available toevaluate CMAQ results. The only publicly available air qualitydata are the daily Air Pollution Index (API) values reported by thelocal governments of 47 major cities in China. The API calculationand its limitations for model evaluation are briefly describedbelow. In each of the 47 cities, an API is calculated for SO2, NO2,and coarse particulate matter (PM10, particles with aerodiameterless than or equal to 10 mm) based on the cities average dailyconcentration of the pollutant. The API for the key pollutantdthemaximum API valuedis published as the city-wide API for thatday. Using each city’s API and key pollutant details, it is possibleto back-calculate the daily average concentration for the keypollutant (Streets et al., 2007; Fu et al., 2009). A more detaileddescription can be found at the MEP’s website (http://www.zhb.gov.cn/english/airqualityinfo.htm).
The use of APIs for model evaluation, however, is subject toseveral limitations. For example, the derived concentration of thekey pollutant from API is an observed value averaged over allmonitoring stations in the city. It is, therefore, not strictly compa-rable with the predictions of the grid cell where the city center islocated. Since the exact locations of these monitoring stations arenot available, it is not possible to extract model results at the samelocations of these stations to calculate the corresponding predictedcity-average for comparison. In addition, because only the keypollutant’s API is published for the day, it may not be possible tocalculate concentrations of a specific pollutant for all days if the keypollutant in the city varies.
The API data (http://www.sepa.gov.cn/quality/air.php3) for the31 capital cities in mainland China are obtained for CMAQ modelevaluation. In these cities, PM10 is themajor air pollutant onmost ofthe days. The simulated and API-derived PM10 concentrations aretherefore compared. The simulated values are extracted from thegrid cell where the city center is located. The monthly-meanobservations are calculated when the API-derived PM10 concen-trations are available for more than twenty days in that month.
Fig. 1 presents the spatial distribution of simulated and API-derived monthly average PM10 concentrations for the four months.Themodel generally agreeswith the observed PM10 pollution levelsin central and eastern China, especially in provinces such asSichuan, Hubei, Hunan, Anhui, Jiangxi, Zhejiang and cities such asShanghai and Chongqing along the Yangtze River. The four-month-average normalized mean biases for those cities are between �8%and �25%. PM10 concentrations are underestimated in two regions.The first is in the northwestern China, including Xinjiang, Qinghai,and Xizang provinces, where wind-blown dust is a importantsource of PM. The current version of CMAQ does not predict wind-blown dust so this is not included in the PM10 emission inventory ofthis study, resulting in a significant underprediction of PM10 forthese provinces. The second region is the three prov-incesdHeilongjiang, Jilin, and Liaoningdin the northeastern China,where numerous heavy industries are located. The under-predictions are most likely due to uncertainties in the spatialallocation of the industrial emissions over these provinces,although the exclusion of the wind-blown dust emissions may alsocontribute to the underpredictions of PM10 in this region. In thenorthern China including Beijing, Tianjin, Hebei, Shanxi, andHenan, the model shows good performance in January, July, and
October but underpredicts significantly in April when dust stormsusually occur in this area, as a result of the exclusion of wind-blowndust emissions in CMAQ. The absence of wind-blown dust affectsmostly CMAQ predictions of coarse particles with little impact onPM2.5 predictions.
A number of statistical measures are calculated to providea more quantitative assessment for each month, as shown inTable 1. These include the number of data pairs (n), mean obser-vation (Mean OBS), mean prediction (Mean PRD), correlationcoefficient (Corr. Coeff., R), the mean normalized bias (MNB), themean normalized gross error (MNGE), the mean fractional bias(MFB), the mean fractional error (MFE), the normalized mean bias(NMB) and the normalized mean error (NME), for the API-derivedand the CMAQ-predicted PM10 daily concentrations in the 31capital cities. The formulas of these statistical measures are asfollows (U.S. EPA, 2007).
MNB¼1n
Xn1
�ðPRD�OBSÞOBS
�; MNGE¼1
n
Xn1
�jPRD�OBSjOBS
�; MFB
¼2n
Xn1
�ðPRD�OBSÞðPRDþOBSÞ
�;
MFE ¼ 2n
Xn1
� jPRD�OBSjðPRDþOBSÞ
�; NMB ¼
Pn1 ðPRD�OBSÞPn
1 OBS; NME
¼Pn
1 jPRD�OBSjPn1 OBS
:
(1)
According to the new guidance on PM2.5 modeling published byU.S. EPA in 2007, MFB, MFE, NMB, and NME are the key statisticalperformance indicators (U.S. EPA, 2007). Boylan (2005) proposedanMFB less than or equal to�60%, and anMFE less than or equal to75%. Morris et al. (2005) proposed an MFB less than or equal to�50% and an MFE less than or equal to 75%. If we apply this guid-ance on the PM10 evaluation in this study, the statistics in Januaryand October meet the criteria. But the MFB and MFE of the Aprilpredictions exceed the statistical criteria. This underestimation isdue primarily to the exclusion of wind-blown dust emissions in theCMAQ modeling. In the July prediction, the MFB (71%) exceedsthe criteria (�50%), in part, because of the greater uncertainties inthe summertime meteorological predictions.
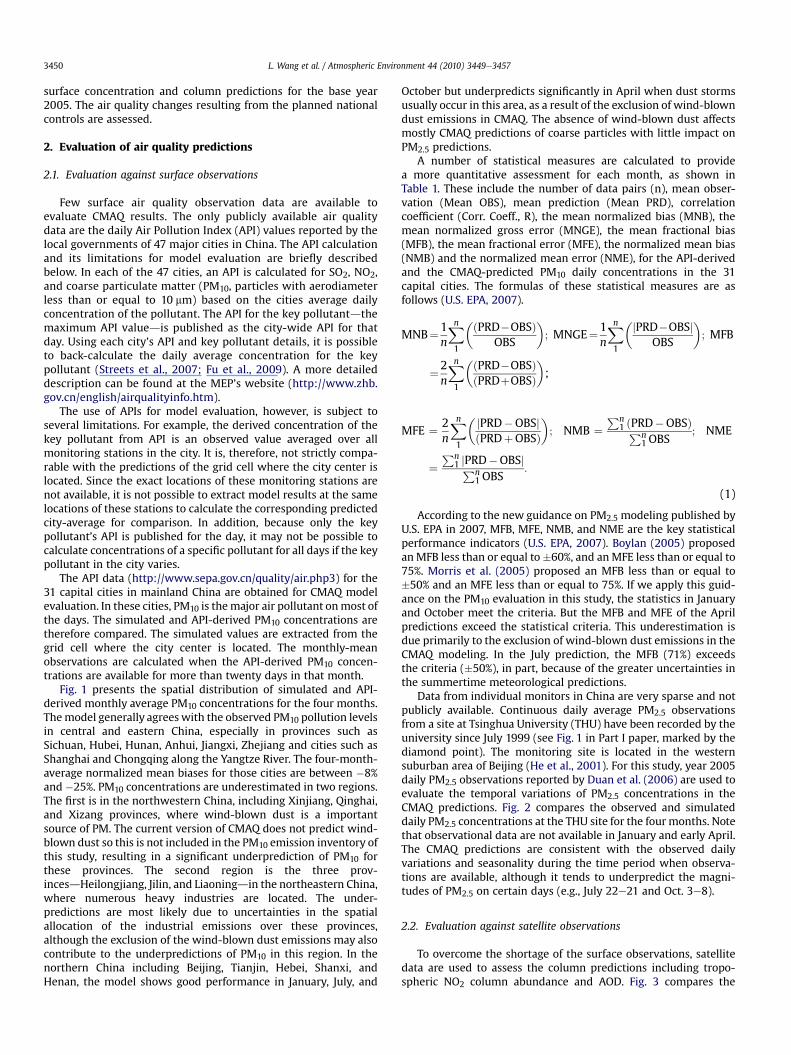
Data from individual monitors in China are very sparse and notpublicly available. Continuous daily average PM2.5 observationsfrom a site at Tsinghua University (THU) have been recorded by theuniversity since July 1999 (see Fig. 1 in Part I paper, marked by thediamond point). The monitoring site is located in the westernsuburban area of Beijing (He et al., 2001). For this study, year 2005daily PM2.5 observations reported by Duan et al. (2006) are used toevaluate the temporal variations of PM2.5 concentrations in theCMAQ predictions. Fig. 2 compares the observed and simulateddaily PM2.5 concentrations at the THU site for the four months. Notethat observational data are not available in January and early April.The CMAQ predictions are consistent with the observed dailyvariations and seasonality during the time period when observa-tions are available, although it tends to underpredict the magni-tudes of PM2.5 on certain days (e.g., July 22e21 and Oct. 3e8).
2.2. Evaluation against satellite observations
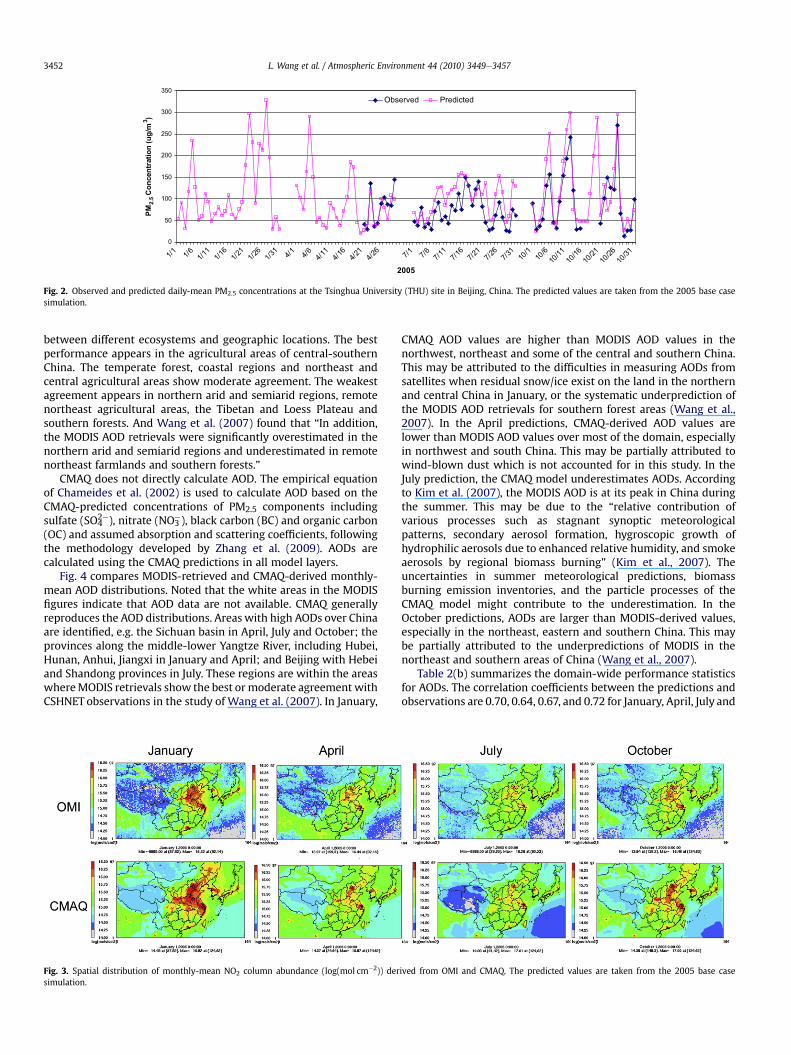
To overcome the shortage of the surface observations, satellitedata are used to assess the column predictions including tropo-spheric NO2 column abundance and AOD. Fig. 3 compares the

Fig. 1. Observed and predicted monthly PM10 concentrations in capital cities in China. The observed concentrations are derived from reported Air Pollution Index (API) by each city,and the predicted values are taken from the 2005 base case simulation.
L. Wang et al. / Atmospheric Environment 44 (2010) 3449e3457 3451
predicted monthly-mean tropospheric NO2 column with theobservations from the Ozone Measurement Instrument (OMI) onthe Aura Satellite. The OMI data are derived from its Level 2 NO2products with the spatial resolution of 13� 24 km2, and then pro-cessed into monthly average, as well as the CMAQ results. Themodel predictions agree with the observed variations, bothspatially and seasonally. The observed NO2 column mass observa-tions are the highest in January, followed by October, April, andJuly; CMAQ predictions match well. Fig. 3 shows that the high NO2column masses over the three biggest city clusters in Chinadthegreater Beijing area, the Yangtze River Delta, and the Pearl RiverDeltadare well represented by the model results and consistent
Table 1Performance statistics for API-derived daily PM10 concentration predictions at 31capital cities.
Variablesa January April July October
n 713 839 709 778Mean OBS, mgm�3 145 134 94 111Mean PRD, mgm�3 101 68 51 83Corr. Coeff. 0.15 0.32 0.45 0.45MNB, % �20 �47 �46 �23MNGE, % 50 54 52 47MFB, % �44 L76b L72b �43MFE, % 65 82b 73 61NMB, % �30 �49 �45 �25NME, % 51 55 51 46
a ndNumber of data pairs. Mean OBSdmean observation. Mean PRD dmeanprediction. Corr. Coeff.dcorrelation coefficient. MNBdthe mean normalized bias;MNGEdthe mean normalized gross error; MFBdthe mean fractional bias;MFEdthe mean fractional error; NMBdthe normalized mean bias; NMEdthenormalized mean error.
b All MFB��50% and MFE� 75% are considered to indicate a relatively poorperformance in this study and are highlighted in bold.
with the remotely-sensing data. Observations over other pollutedareas, such as larger cities in the southern Hebei Province, Taiyuancity in Shanxi Province, several industrial cities in southeasternSichuan Province, and major cities in Korea and Japan are alsoreproduced by the model. In addition, the simulated spatialdistributions of the NO2 column masses along the coastlines arefairly close to the observations. Table 2(a) summarizes performancestatistics of monthly-mean NO2 column abundance. The predic-tions correlate well with the observations with correlation coeffi-cients of 0.86, 0.80, 0.81, and 0.88 for January, April, July, andOctober, respectively. All the biases are small (less than 2%), indi-cating a good agreement. In the most polluted months, i.e., Januaryand October, the model overpredicts the NO2 column in easternChina (see Fig. 3), which may indicate larger uncertainties in theemissions during the heating season. In the Qinghai and Xizangareas, CMAQ slightly overpredicts the NO2 column for all monthsexcept July.
AOD can be used as an indicator of PM2.5 pollution (Wang andChristopher, 2003; Kumara et al., 2007; Paciorek et al., 2008). Inthis study, observed AOD values are derived from the level 2collection 5 aerosol products of the National Aeronautics and SpaceAdministration (NASA)’s Moderate Resolution Imaging Spectror-adiometer (MODIS) sensor aboard the Terra satellite. MODIS-derived total AODs at a wavelength of 550 nm are used to evaluatethe model results. The accuracy of the MODIS AOD retrievals hasbeen validated for some regions in China such as Beijing, HongKong, Taiwan, etc. (Li et al., 2003, 2005; Chen and Yang, 2005;Papayannis et al., 2006; Mi et al., 2007). Wang et al. (2007) evalu-ated the MODIS AOD data systematically over China using theChinese Sun Hazemeter Network (CSHNET) and found that thecorrelation coefficient (R) between the MODIS data and CSHNETresults was 0.72 with 44% of the data falling within the expectederror issued by NASA. There were large differences in data accuracy
0
50
100
150
200
250
300
350
1/1 6/1 11/161/1
12/162/1
13/11/4 6/4 11/4
61/4 4/21 62/4
1/7 6/7 11/761/7
12/762/7
13/71/01 10
/6 11/0161/01
12/0162/01
13/012005
MP
2.5
m/gu(
noitartnecnoC
3)
Observed Predicted
Fig. 2. Observed and predicted daily-mean PM2.5 concentrations at the Tsinghua University (THU) site in Beijing, China. The predicted values are taken from the 2005 base casesimulation.
L. Wang et al. / Atmospheric Environment 44 (2010) 3449e34573452
between different ecosystems and geographic locations. The bestperformance appears in the agricultural areas of central-southernChina. The temperate forest, coastal regions and northeast andcentral agricultural areas show moderate agreement. The weakestagreement appears in northern arid and semiarid regions, remotenortheast agricultural areas, the Tibetan and Loess Plateau andsouthern forests. And Wang et al. (2007) found that “In addition,the MODIS AOD retrievals were significantly overestimated in thenorthern arid and semiarid regions and underestimated in remotenortheast farmlands and southern forests.”
CMAQ does not directly calculate AOD. The empirical equationof Chameides et al. (2002) is used to calculate AOD based on theCMAQ-predicted concentrations of PM2.5 components includingsulfate (SO4
2�), nitrate (NO3�), black carbon (BC) and organic carbon
(OC) and assumed absorption and scattering coefficients, followingthe methodology developed by Zhang et al. (2009). AODs arecalculated using the CMAQ predictions in all model layers.
Fig. 4 compares MODIS-retrieved and CMAQ-derived monthly-mean AOD distributions. Noted that the white areas in the MODISfigures indicate that AOD data are not available. CMAQ generallyreproduces the AOD distributions. Areas with high AODs over Chinaare identified, e.g. the Sichuan basin in April, July and October; theprovinces along the middle-lower Yangtze River, including Hubei,Hunan, Anhui, Jiangxi in January and April; and Beijing with Hebeiand Shandong provinces in July. These regions are within the areaswhereMODIS retrievals show the best or moderate agreement withCSHNET observations in the study of Wang et al. (2007). In January,
Fig. 3. Spatial distribution of monthly-mean NO2 column abundance (log(mol cm�2)) dersimulation.
CMAQ AOD values are higher than MODIS AOD values in thenorthwest, northeast and some of the central and southern China.This may be attributed to the difficulties in measuring AODs fromsatellites when residual snow/ice exist on the land in the northernand central China in January, or the systematic underprediction ofthe MODIS AOD retrievals for southern forest areas (Wang et al.,2007). In the April predictions, CMAQ-derived AOD values arelower than MODIS AOD values over most of the domain, especiallyin northwest and south China. This may be partially attributed towind-blown dust which is not accounted for in this study. In theJuly prediction, the CMAQ model underestimates AODs. Accordingto Kim et al. (2007), the MODIS AOD is at its peak in China duringthe summer. This may be due to the “relative contribution ofvarious processes such as stagnant synoptic meteorologicalpatterns, secondary aerosol formation, hygroscopic growth ofhydrophilic aerosols due to enhanced relative humidity, and smokeaerosols by regional biomass burning” (Kim et al., 2007). Theuncertainties in summer meteorological predictions, biomassburning emission inventories, and the particle processes of theCMAQ model might contribute to the underestimation. In theOctober predictions, AODs are larger than MODIS-derived values,especially in the northeast, eastern and southern China. This maybe partially attributed to the underpredictions of MODIS in thenortheast and southern areas of China (Wang et al., 2007).
Table 2(b) summarizes the domain-wide performance statisticsfor AODs. The correlation coefficients between the predictions andobservations are 0.70, 0.64, 0.67, and 0.72 for January, April, July and
ived from OMI and CMAQ. The predicted values are taken from the 2005 base case

Table 2Performance statistics for CMAQ column predictions.
Variablesa January April July October
a. NO2 columnn 15,897 15,908 15,905 15,908Mean OBS, log(mol cm�2) 14.89 14.96 14.93 14.92Mean PRD, log(mol cm�2) 15.20 15.15 14.93 15.12Corr. Coeff. 0.86 0.80 0.81 0.88MNB, % 2 1 0.02 1MNGE, % 2 2 1 2MFB, % 2 1 0.03 1MFE, % 2 2 1 2NMB, % 2 1 0.03 1NME, % 2 2 1 2
b. AOD columnn 9895 12,389 13,589 13,636Mean OBS 0.29 0.46 0.37 0.24Mean PRD 0.33 0.31 0.22 0.27Corr. Coeff. 0.70 0.64 0.67 0.72MNB, % 40 �31 �33 53MNGE, % 62 42 52 88MFB, % 11 �47 �59 2MFE, % 39 55 69 51NMB, % 14 �34 �41 12NME, % 42 41 48 48
a ndNumber of data pairs. Mean OBSdmean observation. Mean PRDdmeanprediction. Corr. Coeff.dcorrelation coefficient. MNBdthe mean normalized bias;MNGEdthe mean normalized gross error; MFBdthe mean fractional bias;MFEdthe mean fractional error; NMBdthe normalized mean bias; NMEdthenormalized mean error.
L. Wang et al. / Atmospheric Environment 44 (2010) 3449e3457 3453
October, respectively, indicating a good correlation between theCMAQ and MODIS retrieval data. The MNB, MFB and NMB in Apriland July are negative, showing CMAQ underestimation in these twomonths, as discussed above. The MFB are 0.11, �0.47, �0.59, 0.02,and MNGE are 0.39, 0.55, 0.69, 0.51 for January, April, July andOctober, respectively, indicating the model predictions are rela-tively better in January and October than in the other two months.Overall, CMAQ gives reasonably good predictions for AODs.
3. Air quality benefits of emission controls
3.1. SO2 control benefit
The air quality benefits of emission controls can be evaluatedaccording to the improvements in the annual concentrations ofmajor air pollutants in China, which can be estimated by comparingthe CMAQ predictions averaged over the four months under the2010 BAU and 2010 emission control scenarios.
Fig. 4. Spatial distribution of monthly-mean AODs derived from MODIS and CM
If the economic growth rate during the 10th FYP (2000e2005)and the existing SO2 controls were maintained through 2010,national total SO2 emissions in 2010 would increase by 63.7%relative to the 2005 level (2010 BAU scenario). If the 11th FYPpolicies for SO2 controls are implemented successfully, the total SO2emissions will decline to 48% of 2010 BAU SO2 emissionsd79% ofthe 2005 emission level. Fig. 5 illustrates the changes to SO2 con-centrationsdthe difference SO2 concentrations between the 2010SO2 control scenario and 2010 BAU scenario. The most pollutedregions include the greater Beijing area, the Yangtze River Delta, thesouthern Hebei Province, Sichuan Province, and the southeasternHubei Province. As shown in Fig. 5, these regions experiencesignificant reductions in SO2 concentrations under the 2010 SO2control scenario, particularly Beijing, Hebei, Sichuan, Hubei, and theYangtze River Delta where the concentrations decline as much as12e60 ppb. In most areas of the eastern China, SO2 concentrationsare reduced by 30e60%. These results clearly indicate thatcontrolling SO2 from power plants in China can significantlyimprove air quality.
Reduced SO2 concentrations will lead to reduced SO42� PM
concentrations and total acidic deposition (sum of dry and wetdeposition), because SO2 is a precursor of SO4
2� PM in the atmo-sphere. Figs. 6 and 7 show the decreases in the SO4
2� PM concen-trations and total deposition under the 2010 SO2 control scenario.In the eastern China, the annual mean SO4
2� PM concentrationsdeclines by 2e16 mgm�3 (12e40% decrease). The largest reductionis in the southern Hebei Province. The spatial distributions of SO4
2�
deposition are somewhat different from those of SO2 or SO42� PM
concentrations, due largely to the influence of additional factorssuch as surface characteristics and meteorology that affect drydeposition and precipitation that affects wet deposition, and thecomplex interplay among those factors. Areas with high SO4
2� PMdeposition include Sichuan area, the southern Hebei Province, andsome areas in Hubei and Anhui Provinces. The total SO4
2� depositionin southern Hebei, Hubei, and Anhui Provinces are significantlyreduced (by 20e50%) under the 2010 SO2 control scenario. SinceSO4
2� PM is one of the major components of PM2.5 in China (Duanet al., 2006), reduction in SO4
2� concentrations lead to PM2.5reductions of 3e15 mgm�3 (4e25%) in the eastern China, where themost significant reductions occur in Beijing, Hebei, Henan, andShandong Provinces (by 8e15 mgm�3), as shown in Fig. 8.
Visibility improvements from SO2 controls are presented inFig. 9. Visibility is expressed in deciview, a linear unit reflecting toperceived visual changes (Pitchford and Malm, 1994). In the 2010BAU scenario, areas of east China, such as the southern HebeiProvince, Henan, and Shandong, and the northwest China such as
AQ. The predicted values are taken from the 2005 base case simulation.

Fig. 5. Spatial distributions of annual mean SO2 concentrations simulated by the 2010 BAU and SO2 control scenarios ((a) and (b)), and their absolute and percentage changes due to2010 SO2 controls.
Fig. 6. Spatial distributions of annual mean SO42� PM concentrations simulated by the 2010 BAU and SO2 control scenarios ((a) and (b)), and their absolute and percentage changes
due to 2010 SO2 controls.
Fig. 7. Spatial distributions of annual mean SO42� depositions simulated by the 2010 BAU and SO2 control scenarios ((a) and (b)), and their absolute and percentage changes due to
2010 SO2 controls.
Fig. 8. Spatial distributions of annual mean PM2.5 concentrations simulated by the 2010 BAU and SO2 control scenarios ((a) and (b)), and their absolute and percentage changes dueto 2010 SO2 controls.
Fig. 9. Spatial distributions of annual mean visibility simulated by the 2010 BAU and SO2 control scenarios ((a) and (b)), and their absolute and percentage changes due to 2010 SO2
controls.
L. Wang et al. / Atmospheric Environment 44 (2010) 3449e34573454
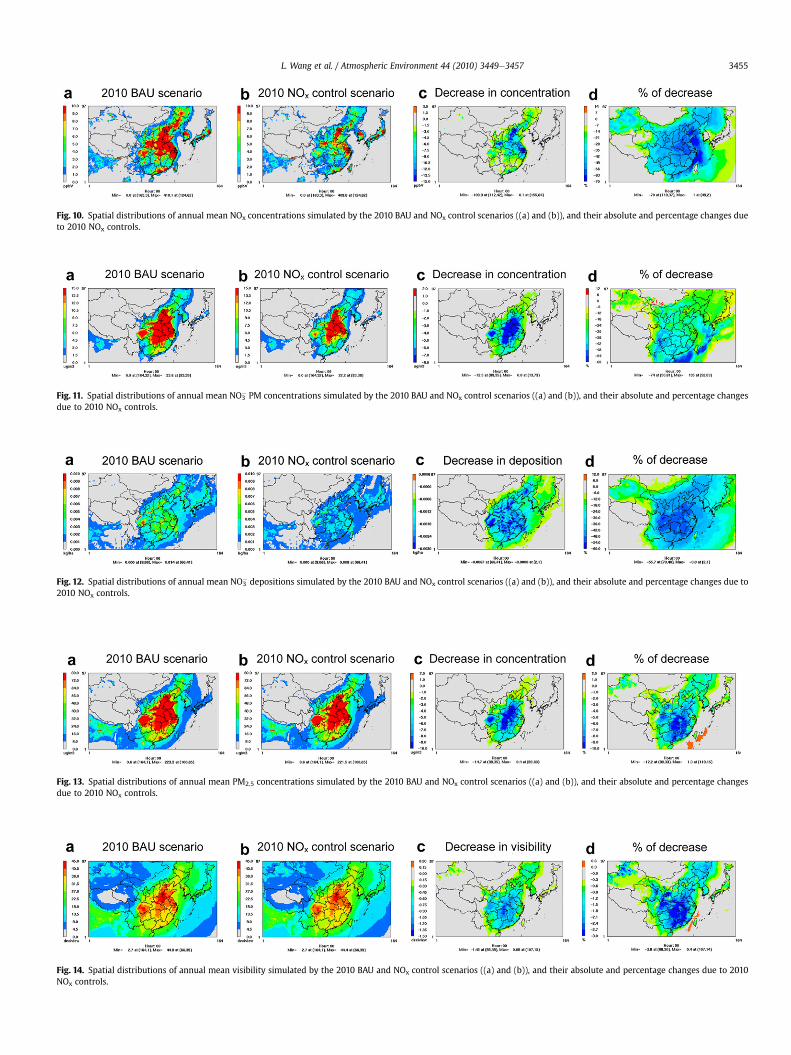
Fig. 10. Spatial distributions of annual mean NOx concentrations simulated by the 2010 BAU and NOx control scenarios ((a) and (b)), and their absolute and percentage changes dueto 2010 NOx controls.
Fig. 11. Spatial distributions of annual mean NO3� PM concentrations simulated by the 2010 BAU and NOx control scenarios ((a) and (b)), and their absolute and percentage changes
due to 2010 NOx controls.
Fig. 12. Spatial distributions of annual mean NO3� depositions simulated by the 2010 BAU and NOx control scenarios ((a) and (b)), and their absolute and percentage changes due to
2010 NOx controls.
Fig. 13. Spatial distributions of annual mean PM2.5 concentrations simulated by the 2010 BAU and NOx control scenarios ((a) and (b)), and their absolute and percentage changesdue to 2010 NOx controls.
Fig. 14. Spatial distributions of annual mean visibility simulated by the 2010 BAU and NOx control scenarios ((a) and (b)), and their absolute and percentage changes due to 2010NOx controls.
L. Wang et al. / Atmospheric Environment 44 (2010) 3449e3457 3455

Fig. 15. Spatial distributions of maximum 1-h O3 concentrations in July simulated by the 2010 BAU and NOx control scenarios ((a) and (b)), and their absolute and percentagechanges due to 2010 NOx controls.
L. Wang et al. / Atmospheric Environment 44 (2010) 3449e34573456
the eastern Sichuan Province, have poor visibility. The visibility inthese areas is over 35 deciview, whichmeans the visual range is lessthan about 12 km. Under the 2010 SO2 control scenario, visibilityimproves (0.5e2.7 deciview) over most areas in China, except thethree provinces of Qinghai, Xizang and Xinjiang, where visibility isgood in both the 2010 BAU and SO2 control scenarios. The largestimprovement appears in the southwest China, including Guizhouand Sichuan Provinces, and the southeastern coastal area. Thepercentage decrease shows a similar pattern over the land. Thelargest percentage change appears over the southwest Chinaincluding Sichuan, Yunan and Guizhou, and inner Mongolia byabout 4e12% (Fig. 9(d)).
3.2. NOx control benefit
Under the 2010 BAU scenario, the national NOx emissions areprojected to increase by 59% from the 2005 level. If NOx controlswere applied, the 2010 NOx control scenario predicts NOx emissionsreductions of 43% below the 2010 BAU scenario e a 10% from the2005 level.
Fig. 10 shows the change in NOx concentrations under the 2010NOx control scenario relative to the 2010 BAU scenario. Heavy NOxpollution in the eastern China under the 2010 BAU scenario can begreatly reduced (by 30e60%) under the 2010 NOx control scenario.The greatest reductions are over the greater Beijing area, thesouthern Hebei Province, and the Yangtze River Delta. In theseareas, annual mean NOx concentrations decline more than 10 ppb.
Fig. 11 shows the air quality benefits in terms of reduction inNO3
� PM concentrations. The NO3� PM concentrations in the eastern
China decline by 2e7 mgm�3 (20e40%). It is interesting that largereductions of NO3
� concentrations occur in the south of the regionswhere maximum NOx reduction occurs. The maximum reduction(>6 mgm�3) occurs in Shandong, Henan, Anhui, Hubei, and HunanProvinces, and the eastern Sichuan Province. As for the total NO3
�
deposition (see Fig. 12), the percent reduction is 24e55% in thepolluted areas of eastern China. The best improvement occurs inthe eastern Sichuan Province and southern Hebei, and the YangtzeRiver drainage area. NO3
� is also one of the major components ofPM2.5 (Duan et al., 2006). Fig. 13 shows 3e12% of reduction in thePM2.5 concentrations due to NOx control, with the largestimprovement of 2e14 mgm�3 in highly polluted areas in easternChina.
The visibility benefit of NOx emission control is shown in Fig. 14.The improvement from NOx controls is not as great as theimprovement from SO2 controls. The largest visibility improvement(0.9e1.5 deciview reduction) occurs in south-central China,including Hubei and Hunan Provinces. The largest percent reduc-tion (>2.4%) also occurs in that area.
Since NOx is one of the two major O3 precursors, NOx controlaffects O3 pollution, particularly in summer when O3 pollution isthe most severe. Fig. 15 shows the spatial distribution of themaximum 1-h concentrations of O3 in July under the 2010 BAU and
the 2010 NOx control scenarios. The China National Ambient AirQuality Standards (CNAAQS) for maximum 1-h O3 concentration is200 mgm�3 (equivalent to approximately 100 ppb, denoted in redcolor in Fig. 15). Under the 2010 BAU scenario, many areas in thenorthern China fail to O3 attain the CNAAQS, including the greaterBeijing area, Hebei, Shandong and Shanxi Provinces, and theYangtze River Delta. With NOx controls, the O3 non-attainmentareas are reduced significantly to the areas of Beijing, Hebei Prov-ince and the Yangtze River Delta. Maximum O3 concentrationsdecline 8e30 ppb (8e32%) in the polluted areas of northern China.It should be noted that there are some red spots in the areas ofBeijing, Tianjin and Shanghai city, indicating an O3 disbenefit (by24e79 ppb) from NOx control. This is consistent with the conclu-sions of other studies (Geng et al., 2008;Wang et al., 2008; Xu et al.,2008) that these cities are VOC-limited so that the reductions inNOx emissions can result in higher O3 concentrations.
4. Conclusions
In this Part II paper, the CMAQ performance is statisticallyevaluated for the base year 2005. The surface air quality predictionsof CMAQ are evaluated by comparing with the MEP published APIof 31 cities in China and the daily PM2.5 observations at theTsinghua University site. The model predictions are consistent withthe observations. To overcome the shortage of surface observations,satellite data of the NO2 columns from OMI and AOD from MODISare also used to evaluate the model. The simulations show a goodagreement with the OMI-derived NO2 column masses, but rela-tively poor agreement with the MODIS-derived AODs. Thediscrepancies in AODs may be attributed to uncertainties in theCMAQ predictions resulting from the uncertainties in the particu-late emission inventory, the meteorological predictions, and thephysical and chemical processes in the CMAQ model, as well as theuncertainties in the MODIS-derived AODs over China, especiallyover the winter time.
The SO2 emission controls planned in the 11th FYP will result inlarge air quality benefits across multiple air pollution problemsincluding pollution of SO2 and PM, and acid deposition. Relative tothe 2010 BAU scenario, the annualmean SO2 concentrations in 2010will decline by as much as 30e60% in polluted areas of the easternChina. The annual mean SO4
2� PM and PM2.5 concentrations willdecline by 2e16 mgm�3 (12e40%) and 3e15 mgm�3 (4e25%),respectively. The total SO4
2� deposition will decline by 20e50%.If NOx emissions were reduced by 10%, China would experience
appreciable air quality benefits, including reductions in NOx, O3,and PM concentrations, acid deposition, and nitrogen deposition.Relative to the 2010 BAU scenario, the NOx concentrations underthe 2010 NOx control scenario decline by 30e60% from predictionsunder the 2010 BAU scenario. The NO3
� PM concentrations anddepositions decline by 20e40% and 24e55%, respectively, in thepolluted areas of the eastern China. The annual mean PM2.5concentrations decline by 2e14 mgm�3 (3e12%). The O3 non-
L. Wang et al. / Atmospheric Environment 44 (2010) 3449e3457 3457
attainment areas are greatly reduced, with the declines inmaximum 1-h O3 concentrations in July of 8e30 ppb.
The results of this study give very important implications for thedevelopment and refinement of air quality control strategies inChina. To achieve the SO2 control targets, the China MEP is accel-erating the implementation of an integrated SO2 emission moni-toring system and an emission trading system. As a result,significant reduction in SO2 and sulfate pollution is expected acrossChina in the year 2010. Similar NOx controls, while not already inplace, are expected in the near future. If such SO2 and NOx controlstrategies are implemented successfully in China, they will result insignificant multiple air quality benefits, as demonstrated in thisstudy.
This study has several limitations. First, the sameMM5 fields areused in all scenariosdfuture climate change and its impact on airquality are not included, which may be important. Second, both the2010 SO2 and NO2 control scenarios are evaluated based on theassumption that there are no additional controls for other pollut-ants, which is unlikely given that China is placing significantresources and political support to reducing air pollution. Theinterplay of the various pollutants may result in considerabledifferences in air quality. Third, air quality observations are limitedand there are insufficient data to evaluate the SO2 predictions, theuncertainties may need to be considered when assessing thecontrol scenario. Satellite data appear as a useful tool for the modelevaluation and bridging some gaps in the absence of availableobservational data. The design of future studies should take theselimitations into consideration.
Acknowledgements
This study was sponsored by U.S. EPA/Office of Air QualityPlanning & Standards via contract #4-321-0210288 at North Car-olina State University and by MEP at Tsinghua University, China.Thanks are due to the U.S. EPA for its technical support in CMAQmodeling.
References
Boylan, J. VISTAS, 2005. PM Model Performance Goal and Criteria. Presented at theNational Regional Planning Organizations Modeling Meeting, Denver, CO, 2005.
Chameides, W.L., Luo, C., Salor, R., et al., 2002. Correlation between model-calcu-lated anthropogenic aerosols and satellite-derived cloud optical depths: indi-cation of indirect effect. Journal of Geophysical Research 107 (D10). doi:10.1029/2000JD000208.
Chen, B.Q., Yang, Y.M., 2005. Validation of MODIS aerosol optical thickness in theTaiwan Strait and its circumjacent sea area. Acta Oceanologica Sinica 27,170e176.
Duan, F., He, K., Ma, Y., et al., 2006. Concentration level and chemical characteristicof atmospheric aerosol in Beijing: 2001e2002. Science Total Environment 335(1e3), 264e275.
Fu, J.S., Streets, D.G., Jang, C.J., et al., 2009. Modeling regional/urban ozone andparticulate matter in Beijing, China. Journal of Air and Waste ManagementAssociation 59, 37e44.
Geng, F., Tie, X., Xu, J., et al., 2008. Characterizations of ozone, NOx, and VOCsmeasured in Shanghai, China. Atmospheric Environment 42 (29), 6873e6883.
He, K., Yang, F., Ma, Y., et al., 2001. The characteristics of PM2.5 in Beijing, China.Atmospheric Environment 35 (29), 4959e4970.
Kim, S., Yoon, S., Kim, J., et al., 2007. Seasonal and monthly variations of columnaraerosol optical properties over east Asia determined from multi-year MODIS,LIDAR, and AERONET Sun/sky radiometer measurements. Atmospheric Envi-ronment 41 (8), 1634e1651.
Kumara, N., Chu, A., Foster, A., 2007. An empirical relationship between PM2.5 andaerosol optical depth in Delhi Metropolitan. Atmospheric Environment 41 (21),4492e4503.
Li, C.C., Mao, J., Lau, A.K.H., et al., 2003. Characteristics of distribution and seasonalvariation of aerosol optical depth in eastern China with MODIS products.Chinese Science Bulletin 48 (22), 2488e2495.
Li, C.C., Mao, J.T., Lau, A.K.H., et al., 2005. Application of MODIS satellite products tothe air pollution research in Beijing. Science in China Series D: Earth Sciences 48(S2), 209e219.
Mi, W., Li, Z., Xia, X., et al., 2007. Evaluation of the moderate resolution imagingspectroradiometer aerosol products at two aerosol robotic network stations inChina. Journal of Geophysical Research 112, D22S08. doi:10.1029/2007JD008474.
Morris, R., Koo, B., McNally, D., et al., 2005. Application of Multiple Models toSimulation Fine Particulate in the Southeastern U.S. Presented at the NationalRegional Planning Organizations Modeling Meeting, Denver, CO, 2005.
Paciorek, C.J., Liu, Y., Moreno-Macias, H., et al., 2008. Spatio-temporal associationsbetween GOES aerosol optical depth retrievals and ground-level PM2.5. Envi-ronmental Science and Technology 42 (15), 5800e5806.
Papayannis, A., Zhang, H.Q., Amiridis, V., et al., 2006. Extraordinary dust event overBeijing, China, during April 2006: Lidar, Sun photometric, satellite observationsand model validation. Geophysical Research Letters 34, L07806. doi:10.1029/2006GL029125.
Pitchford, M.L., Malm, W.C., 1994. Development and applications of a standardvisual index. Atmospheric Environment 28 (5), 1049e1054.
Streets, D.G., Fu, J.S., Jang, C.J., et al., 2007. Air quality during the 2008 BeijingOlympic games. Atmospheric Environment 41 (3), 480e492.
U.S. EPA (U.S. Environmental Protection Agency), 2007. Guidance on the Use ofModels and Other Analyses for Demonstrating Attainment of Air Quality Goalsfor Ozone, PM2.5, and Regional Haze. Office of Air and Radiation/Office of AirQuality Planning and Standards, U.S. EPA, Research Triangle Park, NC.
Wang, Q., Han, Z., Wang, T., et al., 2008. Impacts of biogenic emissions of VOC andNOx on tropospheric ozone during summertime in eastern China. Science of theTotal Environment 395 (1), 41e49.
Wang, J., Christopher, S.A., 2003. Intercomparison between satellite-derived aerosoloptical thickness and PM2.5 mass: implications for air quality. GeophysicalResearch Letters 30 (21), 2095. doi:10.1029/2003GL018174.
Wang, L., Xin, J., Wang, Y., et al., 2007. Evaluation of the MODIS aerosol optical depthretrieval over different ecosystems in China during EAST-AIRE. AtmosphericEnvironment 41 (33), 7138e7149.
Xu, J., Zhang, Y., Fu, J.S., et al., 2008. Process analysis of typical summertime ozoneepisodes over the Beijing area. Science of the Total Environment 399 (1e3),147e157.
Zhang, Y., Vijayaraghavan, K., Wen, X.-Y., Snell, H.E., Jacobson, M.Z., 2009. Probinginto regional O3 and PM pollution in the U.S., part I. A 1-year CMAQ simulationand evaluation using surface and satellite data. Journal of Geophysical Research114, D22304. doi:10.1029/2009JD011898.
Related Documents