Body image has been described as “the picture we have in our minds of the size, shape and form of our bodies; and to our feelings concerning the size, shape and form of our bodies, and its constituent body parts” (p. 20) (Slade, 1988). This definition encompasses two key components that have been identified in the assessment of body image: (1) a perceptual component of body size and shape and (2) an emotional or attitudinal component as an index of body satisfaction (Skrzypek, Wehmeier, & Remschmidt, 2001; Slade, 1988). It has become increasingly important to examine this issue during adolescence as numerous studies have dem- onstrated a clear trend of increased childhood and adoles- cent obesity (Chinn & Rona, 2001; Ogden, Flegal, Carroll, & Johnson, 2002; Strauss & Pollack, 2001; Thomp- son, Baxter-Jones, Mirwald, & Bailey, 2002; Tremblay, Katzmarzyk, & Willms, 2002), as well as a relationship between adolescence and eating disorders (Hsu, 1990; Lucas, Beard, O’Fallon, & Kurland, 1991). A study inves- tigating the changes, between 1981 and 1996, in the body mass index (BMI) of Canadian children and adolescents (7–13 years of age) reported a 22% and 14% increase in the number of overweight boys and girls, respectively (Tremblay et al., 2002). With respect to body perception, some reports have indicated that obese individuals show no difference in body perception when compared with controls (Gardner, Martinez, & Espinoza, 1987; Gardner, Morrell, Watson, & Sandoval, 1989; Probst et al., 1995); in contrast, other studies have reported that obese indi- viduals overestimate the size of their body (Gardner, Ga- llegos, Martinez, & Espinoza, 1989; Gardner, Martinez, Espinoza, & Gallegos, 1988; Rhodes & O’Neil, 1997). These conflicting results are likely due to methodologi- cal variations. Nevertheless, these changes in the size and shape of child and adolescent bodies stress the importance of examining how such physical transformations interact with the image of the body in the adolescent’s mind. Clinically, perception of one’s own body may be of particular importance in anorexia and bulimia nervosa, two eating disorders that often begin during adolescence (Hsu, 1990). Perhaps not surprisingly, a larger perceived size and smaller ideal body size may predict higher eating disorder scores in adolescence (Gardner, Stark, Friedman, & Jackson, 2000). Thus, a fundamental understanding of adolescent body perception may offer insight into the de- velopment of anorexia and bulimia nervosa. Over the past four decades, numerous techniques have been used to assess body image in adolescents and adults. These techniques may be divided into three major catego- ries: (1) tools that do not utilize any visual presentation of 651 Copyright 2007 Psychonomic Society, Inc. Assessment of adolescent body perception: Development and characterization of a novel tool for morphing images of adolescent bodies ROSANNE ALEONG AND SIMON DUCHESNE McGill University, Montreal, Quebec, Canada AND TOMÁŠ PAUS McGill University, Montreal, Quebec, Canada and University of Nottingham, Nottingham, England We developed a computer-based method of distorting adolescent body images, which incorporates the cova- riation between body parts found during growth and sexual maturation. An Adolescent Body-Shape Database (AdoBSD) and Adolescent Body Morphing Tool (AdoBMT) are described; the AdoBSD comprises real (n 320) and morphed (n 41,000) images (front and side view) of 160 adolescents (9–17 years). We used a point distribution model, based upon principal components analysis, to characterize the covariation between pre- defined body tag-points manually positioned on the body images and to morph the body images in a realistic manner. Eight principal components (PCs) were found to characterize 96.3% of the covariation between body tag-points. Application of the PCs to the body images resulted in the manipulation of body parts including shoulder width, waist, hip, belly, thigh and calf sizes. The AdoBMT and AdoBSD may be used to investigate changes in body perception during adolescence, and the role of body perception in adolescent obesity and eating disorders. The AdoBSD is available to the research community (www.brainbody.nottingham.ac.uk). Behavior Research Methods 2007, 39 (3), 651-666 T. Paus, [email protected]

Welcome message from author
This document is posted to help you gain knowledge. Please leave a comment to let me know what you think about it! Share it to your friends and learn new things together.
Transcript

Body image has been described as “the picture we have in our minds of the size, shape and form of our bodies; and to our feelings concerning the size, shape and form of our bodies, and its constituent body parts” (p. 20) (Slade, 1988). This definition encompasses two key components that have been identified in the assessment of body image: (1) a perceptual component of body size and shape and (2) an emotional or attitudinal component as an index of body satisfaction (Skrzypek, Wehmeier, & Remschmidt, 2001; Slade, 1988).
It has become increasingly important to examine this issue during adolescence as numerous studies have dem-onstrated a clear trend of increased childhood and adoles-cent obesity (Chinn & Rona, 2001; Ogden, Flegal, Carroll, & Johnson, 2002; Strauss & Pollack, 2001; Thomp-son, Baxter-Jones, Mirwald, & Bailey, 2002; Tremblay, Katzmarzyk, & Willms, 2002), as well as a relationship between adolescence and eating disorders (Hsu, 1990; Lucas, Beard, O’Fallon, & Kurland, 1991). A study inves-tigating the changes, between 1981 and 1996, in the body mass index (BMI) of Canadian children and adolescents (7–13 years of age) reported a 22% and 14% increase in the number of overweight boys and girls, respectively (Tremblay et al., 2002). With respect to body perception, some reports have indicated that obese individuals show
no difference in body perception when compared with controls (Gardner, Martinez, & Espinoza, 1987; Gardner, Morrell, Watson, & Sandoval, 1989; Probst et al., 1995); in contrast, other studies have reported that obese indi-viduals overestimate the size of their body (Gardner, Ga-llegos, Martinez, & Espinoza, 1989; Gardner, Martinez, Espinoza, & Gallegos, 1988; Rhodes & O’Neil, 1997). These conflicting results are likely due to methodologi-cal variations. Nevertheless, these changes in the size and shape of child and adolescent bodies stress the importance of examining how such physical transformations interact with the image of the body in the adolescent’s mind.
Clinically, perception of one’s own body may be of particular importance in anorexia and bulimia nervosa, two eating disorders that often begin during adolescence (Hsu, 1990). Perhaps not surprisingly, a larger perceived size and smaller ideal body size may predict higher eating disorder scores in adolescence (Gardner, Stark, Friedman, & Jackson, 2000). Thus, a fundamental understanding of adolescent body perception may offer insight into the de-velopment of anorexia and bulimia nervosa.
Over the past four decades, numerous techniques have been used to assess body image in adolescents and adults. These techniques may be divided into three major catego-ries: (1) tools that do not utilize any visual presentation of
651 Copyright 2007 Psychonomic Society, Inc.
Assessment of adolescent body perception: Development and characterization of a novel tool
for morphing images of adolescent bodies
ROSANNE ALEONG AND SIMON DUCHESNEMcGill University, Montreal, Quebec, Canada
AND
TOMÁŠ PAUSMcGill University, Montreal, Quebec, Canada
and University of Nottingham, Nottingham, England
We developed a computer-based method of distorting adolescent body images, which incorporates the cova-riation between body parts found during growth and sexual maturation. An Adolescent Body-Shape Database (AdoBSD) and Adolescent Body Morphing Tool (AdoBMT) are described; the AdoBSD comprises real (n 320) and morphed (n 41,000) images (front and side view) of 160 adolescents (9–17 years). We used a point distribution model, based upon principal components analysis, to characterize the covariation between pre-defined body tag-points manually positioned on the body images and to morph the body images in a realistic manner. Eight principal components (PCs) were found to characterize 96.3% of the covariation between body tag-points. Application of the PCs to the body images resulted in the manipulation of body parts including shoulder width, waist, hip, belly, thigh and calf sizes. The AdoBMT and AdoBSD may be used to investigate changes in body perception during adolescence, and the role of body perception in adolescent obesity and eating disorders. The AdoBSD is available to the research community (www.brainbody.nottingham.ac.uk).
Behavior Research Methods2007, 39 (3), 651-666
T. Paus, [email protected]
652 ALEONG, DUCHESNE, AND PAUS
a body image, such as questionnaires, the image-marking technique and visual-size estimation technique ( Askevold, 1975; Maloney, McGuire, & Daniels, 1988; Mendelson, Mendelson, & White, 2001; Reitman & Cleveland, 1964; Slade & Russell, 1973), (2) tools that utilize a mock sil-houette or body image to represent the subject, such as the Figure Rating Scale and Collins’ pictorial figures (Col-lins, 1991; Stunkard, Sorenson, & Schulsinger, 1983) and (3) tools that utilize distortion of real body images, such as distorting mirrors, video-based distortions and computer morphing software (Allebeck, Hallberg, & Espmark, 1976; Benson, Emery, Cohen-Tovee, & Tovee, 1999; Probst, Van Coppenolle, Vandereycken, & Goris, 1992; Traub & Orbach, 1964). Computer-based morphing tools are the latest addition; these techniques simulate life-like changes in body-shape and size (Benson et al., 1999; Gardner & Boice, 2004; Gruber, Pope, Borowiecki, & Cohane, 1999; Harari, Furst, Kiryati, Caspi, & Davidson, 2001; R. Sands, Maschette, & Armatas, 2004; Shibata, 2002; Smeets, 1999; Stewart, Williamson, Smeets, & Greenway, 2001). Even the most recent software tools, however, may not be ideal for the study of adolescent body perception. To date, some tools use reference data from adult bodies (Benson et al., 1999); thus, the defined variation in adult body-shape would fail to account for the degree of variations in adolescent bod-ies due to growth and sexual maturation. Another potential limitation of these various computer-graphic techniques in-volves the morphing of individual body parts independently of each other with subsequent smoothing of adjacent areas. This type of morphing fails to take into account the natural covariation of individual body parts such as a correlated hip and thigh enlargement.
In order to address some of these methodological issues, we wished to use a modeling approach for body-shape mor-phing that was data-driven and not constrained by a priori information. Principal components analysis (PCA) of a large number of landmarks from a set of training images was thus selected to model body size and shape variations among healthy adolescents. PCA permits the integration of data regarding all body parts simultaneously into a single model with multiple image views. This characterization of variation across all body parts provides the opportunity to morph body images in a naturalistic, global manner.
Here, we describe the development of a computer- morphing tool specifically designed for the testing of adolescent body perception. In order to define natural variations in body-shape in an adolescent population, a novel Adolescent Body-Shape Database (AdoBSD) was created, consisting of front and side images of adolescent bodies; age, sex, height and weight data for each indi-vidual were also included. PCA of manually placed land-marks on these images was used to identify groupwise covariations between body parts across the two image views. The established principal components model was subsequently used to create a novel Adolescent Body Mor-phing Tool (AdoBMT). This tool was used to distort real images quantitatively according to natural covariations in adolescent body-shape, as defined by the individual prin-
cipal components (PCs). This step produced morphed but realistic body images of varying size that may be used in future tasks testing adolescent body perception and satisfaction.
In addition, we developed a two dimensional (2-D) anthropometric system to characterize the body dimen-sions of both real images (i.e., source population) and morphed images. This allowed us to characterize the in-duced variations in body-shape using parameters similar to 3-D anthropometrics, such as circumferences and BMI values. We then completed a behavioral study examining the perceptual realism of the morphed body images. In an effort to identify appropriate morphing parameters for future experiments, we report distinct distortion effects as well as response profiles for specific PCs. The current paper is organized into three sections detailing: (1) the Adolescent Body-Shape Database (AdoBSD), (2) the Adolescent Body Morphing Tool (AdoBMT), and (3) a behavioral validation experiment for the AdoBSD and AdoBMT.
ADOLESCENT BODY-SHAPE DATABASE (AdoBSD)
MethodSubjects. Male and female subjects ranging in age from 9 to 17
years were recruited from the Montreal community through local advertising (see Results for the description of the sample). The Re-search Ethics Board of the Montreal Neurological Institute and Hos-pital approved all experimental protocols. Informed parental/guard-ian consent and subject assent were obtained for all participants.
ProcedureSubject preparation. All subjects were asked to change into a
white cotton undershirt, red Lycra bodysuit and red fleece ski mask; various sizes of the Lycra bodysuit were available. The undershirt was worn underneath the bodysuit while the ski mask was utilized to pro-tect the subject’s identity. The Lycra bodysuits were purchased from a local dance-equipment supplier while the cotton undershirts and ski masks were purchased from a local general merchandise store.
The date of birth and sex were recorded, and height and weight measurements obtained at the beginning of the session. The child was positioned within the standard background and two digital im-ages were acquired. Movie certificates were given to all subjects as compensation for their time and inconvenience.
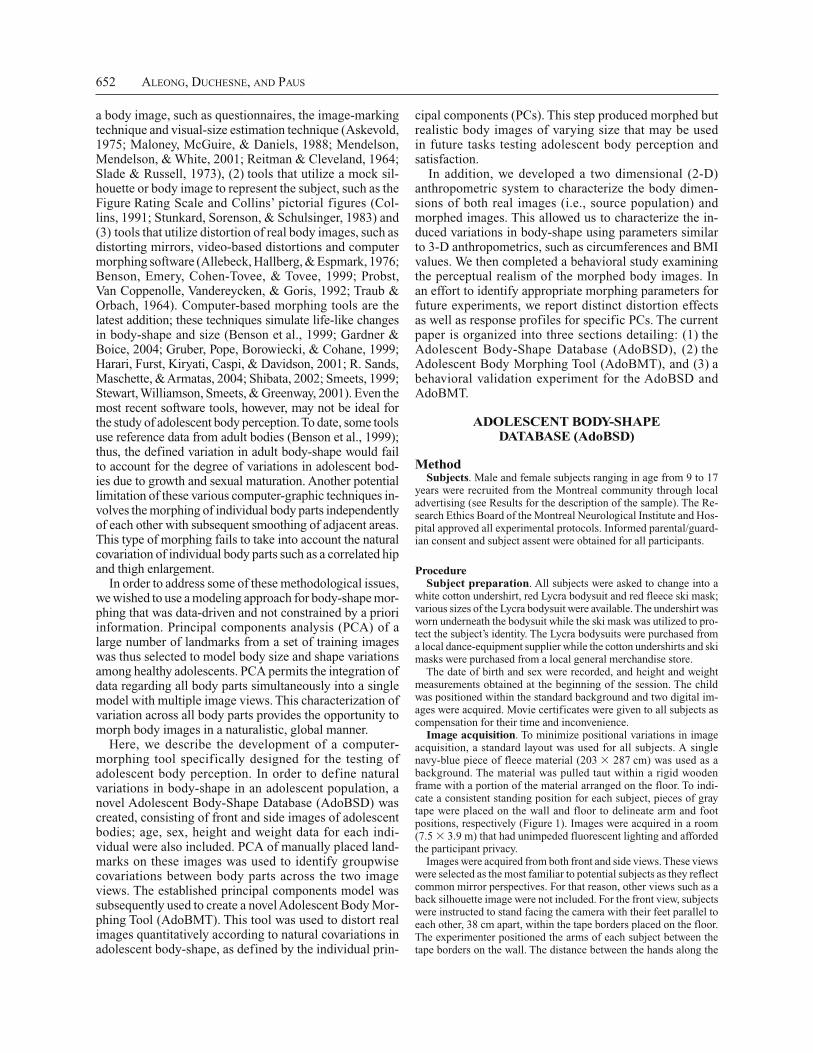
Image acquisition. To minimize positional variations in image acquisition, a standard layout was used for all subjects. A single navy-blue piece of fleece material (203 287 cm) was used as a background. The material was pulled taut within a rigid wooden frame with a portion of the material arranged on the floor. To indi-cate a consistent standing position for each subject, pieces of gray tape were placed on the wall and floor to delineate arm and foot positions, respectively (Figure 1). Images were acquired in a room (7.5 3.9 m) that had unimpeded fluorescent lighting and afforded the participant privacy.
Images were acquired from both front and side views. These views were selected as the most familiar to potential subjects as they reflect common mirror perspectives. For that reason, other views such as a back silhouette image were not included. For the front view, subjects were instructed to stand facing the camera with their feet parallel to each other, 38 cm apart, within the tape borders placed on the floor. The experimenter positioned the arms of each subject between the tape borders on the wall. The distance between the hands along the
ADOLESCENT BODY-SHAPE DATABASE AND BODY MORPHING TOOL 653
horizontal plane was 91 cm. Subjects were asked to look directly into the camera lens (through the ski mask), and to maintain a proper posture with rigid arms and legs (Figure 1A).
For images in the side view, subjects were instructed to rotate 90º to the left such that their right side was facing the camera. Each subject placed his/her right foot into the (right) foot border. Subjects positioned both feet tightly together and raised their right arm at a 90º angle to their torso (Figure 1B).
Images were acquired using a Canon PowerShot G2 digital cam-era (Canon, Tokyo). Image resolution was 2,272 1,704 pixels with automatic white-balance. Natural lighting (i.e., no flash) was used to limit glare. The camera was mounted on a Velbon video tripod (Velbon SX-621, Tokyo) with the distance between the camera lens midpoint and the ground equal to 109 cm. A constant distance of 194 cm was maintained between the subject and the camera. Mini-mum camera zoom was utilized for all images.
ResultsA total of 160 adolescents (73 males, 87 females) were re-
cruited for the AdoBSD. Frequency distributions for subject age and BMI are detailed in Figures 2A and 2B, respectively. The mean ages for male and female subjects were 12.78 years [standard error of the mean (SEM ) 0.25] and 12.95 years (SEM 0.25), respectively. The mean BMI values for male and female subjects were 19.91 kg/m2 (SEM 0.40) and 19.64 kg/m2 (SEM 0.35), respectively. Independent samples t tests revealed no significant differences between males and females for age or BMI ( p .05).
ADOLESCENT BODY MORPHING TOOL (AdoBMT)
MethodLinear registration. In order to perform comparative analysis
of body-shapes, images from the AdoBSD had to be first posi-tioned into a single spatial frame of reference. Reference tags were manually positioned on both front and side images using the inter-active volume display and point-tagging program, Register (David MacDonald: www.bic.mni.mcgill.ca/software/register/register .html). Six tags in the front view and four tags in the side view were placed at predetermined corners of the tape borders (Figure 1). A linear registration procedure was completed using MATLAB 7.1 (MathWorks, Natick, MA). Registration was used to match each image tag-point on the background tape markers with those from a selected reference using a transformation with 7 degrees of freedom (i.e., 3 rotations, 3 translations, 1 scale). The objective of this linear registration was to remove the global effects of pose, perspective and variation in the subjects’ position relative to the background.
Body tagging and interrater reliability. Following linear regis-tration, two raters manually positioned 36 (front view) and 18 (side view) body tag-points at defined body landmarks (Figure 3). These body tag-points were identified according to adapted anthropometric definitions (Lohman, Roche, & Martorell, 1991). The origin of our coordinate system was located at the bottom left corner of the im-ages. After tagging, the background of each image was set to black in order to remove all visual cues in the morphed images. Two raters completed the body-tagging process twice on the same 20 subjects in order to assess interrater reliability.
Figure 1. Subject image position and image linear registration. Subjects dressed in a red bodysuit were positioned in standard poses in front (A) and side (B) views. Manual tape borders were placed on the blue photography background as indicated by the measurements in order to standardize subject position. Manual reference tag-points (i.e., black circles) were positioned at the corners of the tape borders for sub-sequent translation, rotation, and scaling of the image.

654 ALEONG, DUCHESNE, AND PAUS
Point distribution model. All modeling and image morphing was completed with MATLAB 7.1. In order to capture shape varia-tions across individuals, a point distribution model (PDM) was used (Cootes, Taylor, Cooper, & Graham, 1995). Point distribution mod-els have been used extensively in the medical imaging literature; they rely on the assumption that global object-change variations can be reliably estimated by modeling the spatial distribution of series of appropriately placed and corresponding landmarks positioned on object representations.
Our model was built using data from both male and female sub-jects across all ages. Proper sampling of the object boundary is an important element of the model and thus, we identified 36 tag-points in the front view and 18 tag-points in the side view, corresponding to the edges of body areas of morphological interest. The PDM was created by completing PCA of the entire data set of body tag-points (i.e., 160 subjects [36 front and 18 side tag-points]) as represented by continuous vectors v of (x, y) coordinates (Cootes et al., 1995), concatenating front and side views together. With PCA, one can ex-press each instance of v as
v v P Bv v= + , where −v is the mean normalized shape vector, Pv is a set of orthogo-nal modes of variation, and Bv is a set of coordinate parameters. This representation spans a multidimensional ellipsoid including
all shape instances from the data set, as well as other possible shape instances that may not be present in the database.
In order to identify the contribution of each principle direction in the description of the total variance of the system, the ratio of rela-tive importance of the eigenvalue k associated with the eigenvector or principal component k is used:
rkk
jp
j1 where the fraction rk is the relative importance for eigenvalue k, over the sum of all , since p is the total number of eigenvectors.
Image morphing. Morphed body images were created by adding multiples (up to 0.8 SD in 0.1-SD steps) of the standard deviation (SD) of the mean of each PC to the (x, y) coordinates of the body tag-points of the original body images. These transformed points were then used as anchors to derive a smooth 2-D thin-plate spline transformation (Bookstein, 1989), thereby morphing the original images to produce a body of greater or smaller size. The thin-plate spline is the 2-D analog of the cubic spline in one dimension. We used it here to derive the transformation field interpolating between pre- and postwarped points.
The morphed images were then linearly transformed again (i.e., translation and rotation but no scaling) to the average shape −v, en-
Figure 2. Adolescent body-shape database. Age (A) and body mass index (B) frequency distributions for males and females are presented.

ADOLESCENT BODY-SHAPE DATABASE AND BODY MORPHING TOOL 655
suring that all images were properly centered when presented on the computer screen.
PCA characterizes covariations between body tag-points; there-fore, the morphing process resulted in a dynamic procedure whereby body parts that were found to covary among database subjects were also morphed simultaneously as dictated by the PCs. Moreover, PCA calculated covariations between tag-points in both front and side body images, thereby delineating the concurrent changes in body-shape and size across the two perspectives in a global manner.
2-D anthropometric measurements. Other body morphing techniques often quantify the degree of body distortion using a global percentage change value without any direct link to physiological body measurements (Harari et al., 2001; R. Sands et al., 2004). In order to quantify (1) the real body dimensions of the 160 AdoBSD subjects and (2) the anthropometric-like changes induced by appli-cation of each PC to the body images, we first defined a series of 2-D anthropometric measures within our images that best mimic 3-D anthropometric measures. The use of a 2-D anthropometric sys-tem allows for the qualitative and quantitative assessment of output stimuli, as well as a biological characterization of morphing, thereby giving researchers the capacity to select morphing parameters based on body morphology.
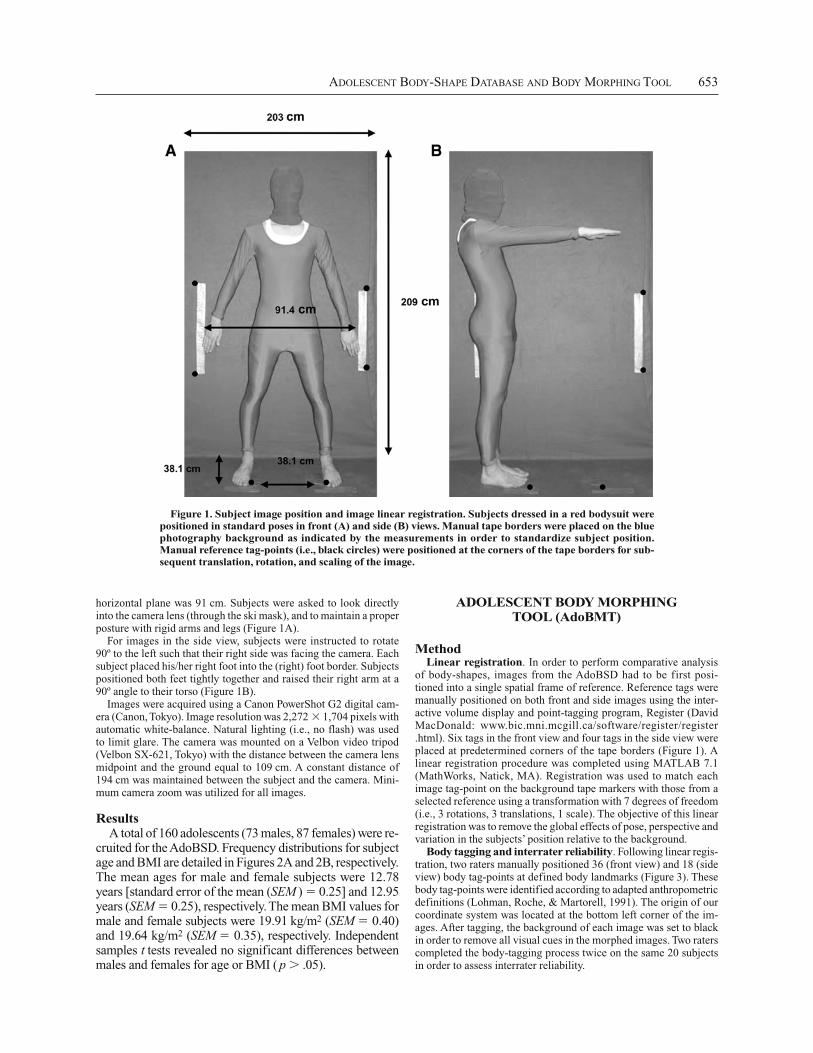
These 2-D measures were calculated as caliper distances between certain body tag-points as graphically represented in Figure 4. Anthropometric distances were calculated as the difference between the respective x and y coordinates for each body tag-point involved, converted into metric units using a pixel/cm constant. Distances were calculated for both real and morphed body images.
Characterization of body morphing using body mass index (BMI). Although the 2-D anthropometric system allows for the characterization of quantitative changes in body parts with chang-ing levels of imposed distortion, the system fails to provide global information about potential changes in BMI. The use of BMI in characterizing changes imposed by the AdoBMT would permit the use of biologically relevant terminology and facilitate comparison of the morphed body images to real-life measurements of potential volunteers.
Not knowing the weight of the distorted bodies represents an ob-vious difficulty for calculating the BMI of morphed images. We
estimated virtual BMI values from an estimate of body-volume and predicted the virtual BMI values using the observed linear relation-ship between the body-volume and BMI of the real 160 subjects (see below). The body-volume of an individual was estimated by segmenting the body into three cylindrical components: (1) torso, (2) right leg and (3) left leg. The radius and height of each of the three body cylinders were calculated using the distances between es-tablished body tag-points. Individual volumes were determined for each of the cylinders and then summed for a grand volume total.
ResultsBody tagging and interrater reliability. Two raters
(R.A. and S.D.) tagged a total of 40 images, including the front and side views of 20 subjects. In the front view, some tag-points were subject to wide positional variation across participants. For this reason, four tag-points were removed from the PCA model (i.e., left/right knee and left/right hand). The knee tag-points were excluded as the raters could not consistently identify the middle of the kneecap in each image. The hand tag-points were removed due to the variable nature of the arm position for individual sub-jects. In the side view, a total of three body tag-points were removed from the analysis, including the finger and two distal-thigh points. The finger point was excluded due to the great variability in arm position across subjects. The distal-thigh points were removed due to the inability of the raters to identify consistently those points in the im-ages across subjects. Thus, a total of 47 tag-points were included in the final PC analysis.
In order to measure interrater reliability of the posi-tioning of all 54 body tag-points, two dependent variables were assessed separately: (1) mean distance between the raters’ points as an indicator of tagging error and (2) cor-relation between anthropometric measures derived from each rater’s tag-points. In the first method, the mean
Figure 3. Standardized body tag-points. Manual body tag-points (i.e., black circles) were placed on each subject body, in accordance with adapted anthropometric definitions.
656 ALEONG, DUCHESNE, AND PAUS
Euclidean distance between the points of two raters was calculated for each body tag-point. In order to identify body tag-points where the tagging error was significantly different from the minimum error of zero, multisample 95% confidence intervals were used with the minimum tagging-error value arbitrarily set as a population mean of zero. Our analysis revealed that no body tag-point ful-
filled the statistical criteria for a mean error distance of zero ( p .05, Tables 1A and 1B).
In practical terms, however, the confidence intervals for only 7 out of 54 body tag-points showed a maximum interval value greater than 20 pixels. These seven body tag-points include the knee, breast and shoulder in the front view and the upper back and distal thigh in the side
Figure 4. Two-dimensional anthropometric measures. Dark black lines indicate the graphical represen-tation of the 2-D anthropometric measures in front (A) and side (B) views.
Shoulder Width
Waist
Hip
Hip Width A
Right Calf Width
Left Thigh Width
Left Calf Width
Sitting Height
Leg Length
Hip Width B
Virtual Height
Belly
Side Thigh
Right Thigh Width
A
B

ADOLESCENT BODY-SHAPE DATABASE AND BODY MORPHING TOOL 657
view. This measurement of error should be considered relative to the surface area of the computer screen. Given that all body images, whether they are real or morphed, will be presented on a computer screen, it is appropriate to assess interrater reliability differences in the context in which the images will be used. On a standard laptop screen with 1,024 768 pixels, an interrater reliability difference of 20 pixels represents approximately 2% of the screen. From a visual perception perspective, we contend that such a small difference is inconsequential.
A total of 14 anthropometric measures were calcu-lated for both raters for the same subset of 20 subjects. Individual Pearson’s correlations were conducted for each anthropometric measure and the results indicate that there were exceptionally strong positive correlations (r .90, p .05) between the two raters’ anthropometric measures, with the exception of the biacromial breadth measurement (r .492, p .05) (Table 2).
Point distribution model and PCA results. The mean location in (x, y) coordinates for each body tag-point was calculated so as to provide a visual representa-tion of the average body for both males and females in the front and side images. The final PCA characterized the covariation between body tag-points with the first
eight eigenvectors accounting for 96.3% of the distribu-tion variation (Table 3). Individual PCs can be depicted graphically as successive standard deviation increments are added to the mean body-shape (Figure 5).
All eight PCs were applied to male and female bod-ies. As PCA determines the covariance between body tag-points, distortion using the PCs displayed covariance in body-part distortion. As the morphing was done using front and side views concurrently, physical changes that may not have been identified in the front perspective, such as buttock size, were clearly changed in the side perspec-tive. This confirmed the importance of a PC analysis in which covariation of body parts in both front and side im-ages was determined.
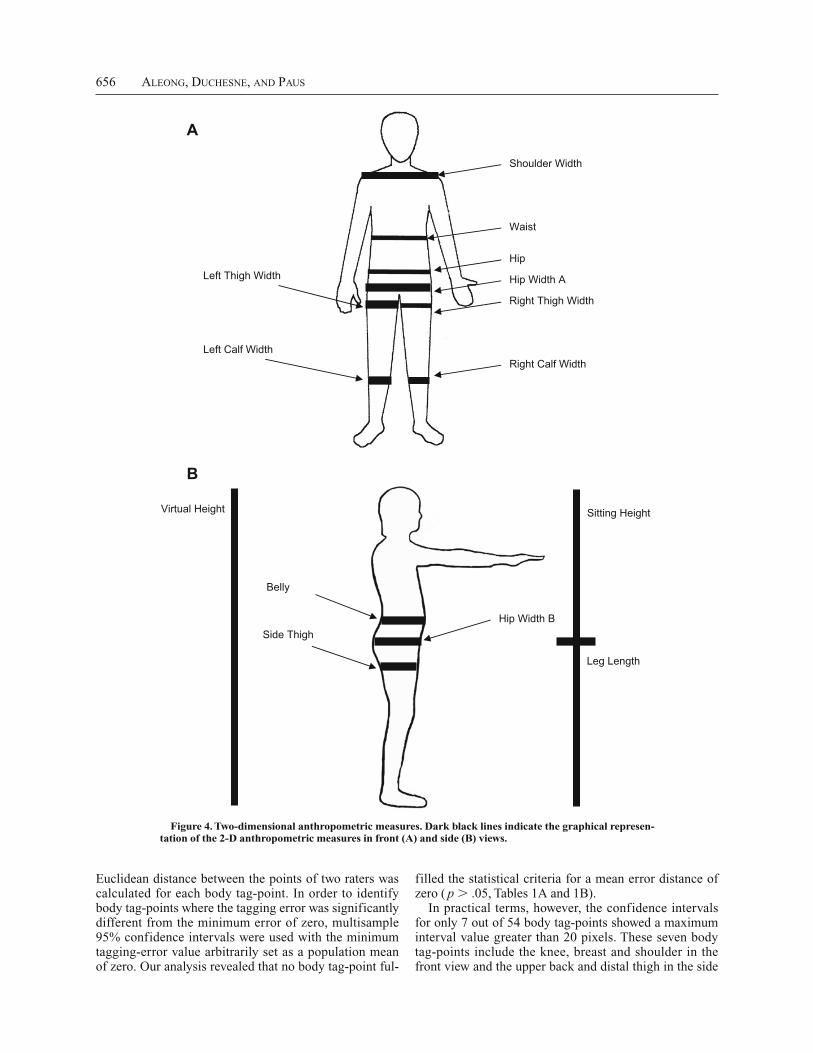
2-D anthropometric measurements, original im-ages. We measured the real 2-D anthropometric measures of the AdoBSD subjects (n 160). A multivariate anal-ysis with subject age and BMI as covariates revealed a significant effect of subject gender [F(13,144) 11.133, p .001] on a number of measures including virtual (i.e., image-derived) height, shoulder width, leg length, waist, belly and thigh width (Figure 6).
2-D anthropometric measurements, morphed im-ages. The 2-D anthropometric measures were also used to quantify physical changes induced in the body images by the AdoBMT. Change was described as the percent change relative to real (i.e., nonmorphed) measures calculated for the 160 adolescents in the AdoBSD. These changes are calculated as slopes in order to identify the rate of change as a function of the amount of distortion introduced, the latter defined by the standard deviation of the mean of each PC. Slopes were calculated for each PC for all 14 anthropometric measures. These results are summarized in Table 4.
BMI characterization of body image morphing. Although the slopes described above provide detailed numerical values identifying whether certain body parts grow larger or smaller with changing distortion levels,
Table 1A Interrater Reliability: Confidence Intervals (CIs) for the Mean
Error Distance, Front View
Tag-Point Picture Side Body Part M (cm) CI (cm)
1 Left Small toe 0.32 0.19–0.452 Big toe 0.29 0.23–0.353 Medial ankle 0.45 0.26–0.644 Medial calf 1.00 0.65–1.345 Knee 1.01 0.72–1.296 Medial proximal thigh 0.72 0.43–1.007 Right Medial proximal thigh 0.69 0.48–0.918 Knee 1.98 1.54–2.419 Medial calf 1.23 0.85–1.61
10 Medial ankle 0.46 0.32–0.5911 Big toe 0.22 0.15–0.2912 Small toe 0.25 0.17–0.3313 Lateral ankle 0.46 0.26–0.6614 Lateral calf 1.30 0.87–1.7315 Lateral distal thigh 1.07 0.47–1.6716 Finger 0.31 0.23–0.3817 Lateral proximal thigh 0.72 0.54–0.9118 Waist 0.79 0.52–1.0619 Hip midpoint 0.91 0.66–1.1620 Hip upper quarter 0.95 0.67–1.2221 Hip lower quarter 0.98 0.68–1.2922 Breast 1.89 1.48–2.3123 Collarbone 0.88 0.64–1.1324 Shoulder 1.51 1.04–1.9925 Left Shoulder 1.62 1.15–2.0926 Collarbone 1.25 0.94–1.5627 Breast 2.38 1.84–2.9228 Waist 0.97 0.64–1.3129 Lateral proximal thigh 0.70 0.44–0.9630 Hip midpoint 0.97 0.58–1.3631 Hip upper quarter 0.87 0.43–1.3132 Hip lower quarter 0.83 0.62–1.0433 Finger 0.22 0.15–0.2934 Lateral distal thigh 0.91 0.68–1.1335 Lateral calf 1.39 1.01–1.7736 Lateral ankle 0.42 0.34–0.51
Table 1B Interrater Reliability: Confidence Intervals (CIs) for the Mean
Error Distance, Side View
Tag-Point Body Part M (cm) CI (cm)
1 Upper back 1.94 0.91–2.962 Lower back 1.05 0.79–1.313 Posterior hip 0.54 0.31–0.764 Posterior proximal thigh 1.47 1.13–1.805 Posterior distal thigh 1.56 0.93–2.196 Posterior midthigh 1.54 1.13–1.947 Posterior calf 1.00 0.65–1.348 Heel 0.55 0.42–0.689 Right foot small toe 0.21 0.16–0.25
10 Right foot big toe 0.26 0.21–0.3011 Anterior distal thigh 1.47 0.78–2.1612 Anterior proximal thigh 1.39 1.05–1.7313 Anterior midthigh 1.19 0.79–1.6014 Anterior hip 1.30 0.88–1.7315 Anterior belly 0.76 0.41–1.1216 Right breast 1.08 0.74–1.4117 Finger 0.41 0.26–0.56
18 Head 0.62 0.46–0.79

658 ALEONG, DUCHESNE, AND PAUS
they do not provide a global outlook of change as defined by BMI. A significant positive correlation was found be-tween the real BMI values of the 160 AdoBSD subjects and calculated total body-volume [r .585, p .001; F(1,158) 82.16, p .001—see Figure 7]. Based upon this linear relationship, the changes in BMI induced by the AdoBMT were calculated from the virtual body-volume, and the ranges of these virtual BMI induced by each PC are graphically presented in Figure 8. All PCs showed a significant cubic relationship between virtual BMI and the degree of distortion ( p .001).
BEHAVIORAL VALIDATION OF THE AdoBMT
MethodSubjects. All experimental protocols were granted ethics ap-
proval under the provisions of the Research Ethics Board of the Montreal Neurological Institute and Hospital. Healthy adult volun-teers (18–46 years) were recruited from the Montreal community through local advertisements. Informed consent was obtained for all participants. All subjects included in the study reported no history of or current serious medical condition.
A total of 72 subjects (38 females) were recruited for the study. Two female subjects were excluded following testing as they re-ported suffering from a prior psychiatric illness. One female was excluded as she halted testing due to physical illness. A final total of 69 healthy subjects were included in the analysis (35 females, 34 males). The mean age and BMI were: females: 22.71 years (SEM 1.0), 22.63 kg/m2 (SEM 0.58); males: 23.74 years (SEM 1.0), 23.88 kg/m2 (SEM 0.58). Independent samples t tests revealed no significant effect of gender for subject age and BMI ( p .05).
Procedure. Height and weight measurements were recorded for all subjects. Testing was completed during two 40-min sessions with an approximate 4-h break between the sessions. The entire experi-ment was implemented using Presentation software (Version 9.10 Build 10.20.04— Neurobehavioral Systems, San Francisco, CA). Subjects were presented with real and morphed body images from the AdoBSD (see below) and asked to rate each body image on an integer scale as to whether they agreed or disagreed with a statement declaring the body to be odd. The term “odd” was not defined further in order to prevent biasing subjects to particular body parts or shapes. The scale ranged from ( 3) to ( 3) where ( 3) indicated that they disagreed with the statement (i.e., the body was not odd) and ( 3) that they agreed with the statement (i.e., the body was odd).
The AdoBSD was divided into eight stimuli categories as defined by gender, the median age of the AdoBSD (i.e., 13 years) and the median BMI of each gender–age category. A different randomly selected combination of eight AdoBSD children (i.e., one from each category) was chosen for each subject in order to ensure maximum sampling of the AdoBSD. For each AdoBSD child, real images in front and side views were used. Front and side body images were also morphed with PC2, PC4 and PC5 and with 0.1, 0.3 and
0.5 levels of distortion with the estimated BMI of the morphed bodies ranging from 16.5–24.1 kg/m2. PC1 was not selected as it morphs significantly the height of the body, a factor of no experi-mental interest to the authors. PC3 was also not used as we discov-ered that warping in the knee region did not provide realistic body images. Thus, the remaining three PCs (PC2, PC4 and PC5) that accounted for the most model variation were selected. Although it would have been ideal to include also PCs 6–8, the duration of such an experiment was deemed excessive and taxing for the subjects, po-tentially jeopardizing the quality of the acquired data. Consequently, subjects were presented with a total of 304 different body images (288 morphed images [8 AdoBSD children 2 views 3 PCs 6 distortion levels] plus 16 real images [8 AdoBSD children 2 views]) with each image repeated six times.
All images were randomly presented for 1,000 msec followed by a 250-msec interstimulus interval. The “oddness” scale was then presented on the screen for a maximum of 2,000 msec during which subjects were requested to make their response. An intertrial interval of 250 msec was used.
ResultsFor the real images, a repeated measures ANOVA was
conducted with one between- subjects variable (subject gender) and four within- subjects variables; the latter in-cluded image gender, image view (front vs. side), age of the image (high [ 13 yr] vs. low [ 13 yr]) and BMI of the image (high vs. low). A significant three-way inter-action between image view, image BMI and subject gen-der was found [F(1,67) 5.307, p .05] (Figure 9A). Subsequent simple main effects analysis and pairwise comparisons with Bonferroni correction revealed that female subjects rated low BMI images as significantly less odd than high BMI images ( p .05); note that this finding was observed even though our healthy adult vol-unteers were being shown the real images of adolescent bodies.
For the morphed images, a repeated measures ANOVA was completed with subject gender as a between-subjects variable and five within-subjects variables; the latter in-cluded image gender, image view (front vs. side), type of distortion (PC2, PC4, PC5), direction of distortion (large vs. small morph size) and amount of distortion
Table 2 Interrater Reliability: Anthropometric Measures
Tag-Point
Anthropometric Measure
Pearson’s Correlation (r)
p value
1 Virtual height .997 .002 Sitting height .985 .003 Leg length .989 .004 Shoulder width/biacromial breadth .492 .035 Hip width A/bicristal breadth .988 .006 Hip width B/bicristal breadth .981 .007 Left calf width .967 .008 Right calf width .966 .009 Left thigh width .902 .00
10 Right thigh width .973 .0011 Waist .995 .0012 Hip .982 .0013 Belly .991 .0014 Side thigh .978 .00
Table 3 Principal Components Analysis
Principal Component Cumulative Weight (%) Individual Weight (%)
1 82.9 82.92 88.9 6.03 91.4 2.54 93.3 1.95 94.4 1.26 95.3 0.877 95.8 0.538 96.3 0.37

ADOLESCENT BODY-SHAPE DATABASE AND BODY MORPHING TOOL 659
( 0.1, 0.3, 0.5 SD of the mean of the PC). ANOVA revealed a significant five-way interaction between all of the within-subjects variables [F(4,268) 5.661, p .001]. This complex interaction, however, would likely fail to provide any substantial insight into the data. Conse-quently, we examined the significant three-way interac-tion between our three variables of interest (i.e., amount of distortion, type of distortion and image view) [F(4,268) 11.660, p .001] (Figure 9B). Simple main effects anal-ysis and pairwise comparisons with Bonferroni correc-tion revealed a significant effect of image view, with the front view showing significantly higher mean scores (i.e., higher “oddness”) than the side view for all conditions ( p .05). In addition, an effect of principal component was revealed whereby PC2 morphing was found to result in significantly lower (i.e., less odd) mean scores than PC4 or PC5 across all conditions ( p .05). Finally, a signifi-cant distortion effect was found only for PC4 and PC5 and not PC2, with higher mean scores associated with greater introduced distortion ( p .05).
In order to determine the relative degree of “oddness” associated with morphed body images, 95% confidence intervals of the mean scale scores for the real front and side photographs were used as statistical baseline values. Mean scale scores for 0.3 and 0.5 SD of distortion for
PCs 4 and 5 were found to be greater than the maximum interval level.
GENERAL DISCUSSION AND CONCLUSIONS
We have described a novel age-specific body-morphing tool that transforms 2-D (front and side view) images of ad-olescent bodies according to the natural covariations across individual body parts. PCA of landmarks positioned on the 320 images constituting our database revealed eight primary principal components that characterized 96.3% of the co-variation between body tag-points across male and female subjects. This analysis also revealed covariation between tag-points within and between front and side views. These PCs, when applied to real body images using our image- morphing software, resulted in the standardized distortion of various body dimensions including the body’s height, and the size of the shoulders, waist, hip, thighs, belly and calves. These changes in body-shape and size were generated such that specific body parts were morphed simultaneously as dictated by the variation present in the subject population of our database. We then characterized the resulting image dis-tortion using both a 2-D anthropometric system and an esti-mation of BMI from a calculation of total body-volume.
Figure 5. Principal component analysis-based body morphing. On the left, line drawings indicate changes in body size and shape with sequential addition of distortion to the (x, y) coordinates of the mean location of the body tag-points. On the right, a female subject is morphed using PC4 in the front and side perspectives. Images represent (from left to right) 0.4, 0.2, 0.2, and 0.4 SD from the mean of each respective PC.
660 ALEONG, DUCHESNE, AND PAUS
The use of a point distribution model based upon PCA of the covariance of the tag-point coordinates was suc-cessful in that it effectively simulated global changes in adolescent morphology. The PCA results clearly showed that body-part changes rarely occurred in isolation. When morphing body images, covariances must be incorporated if realism is to be maintained and if reliable assessment of perceptual changes is to be achieved.
The AdoBMT was characterized using two quanti-tative methods including a 2-D (i.e., image-derived) anthropometric system and an estimated BMI. Analysis of the real BMI for all 160 AdoBSD subjects revealed a significant linear relationship between the real BMI and body-volume estimated from the 2-D images. This linear relationship allowed us to estimate BMI for all morphed body images. The results clearly indicated that changes
Figure 6. Real 2-D anthropometric measurements of the adolescent body-shape database. A multivariate analysis revealed a significant effect of subject gender on 2-D anthropometric measurements. Significant differences between males and females were reported for the following anthropometric measures: virtual height, leg length, shoulder width, thigh width, waist width, and belly width ( p .05).

ADOLESCENT BODY-SHAPE DATABASE AND BODY MORPHING TOOL 661
in body-shape induced by the AdoBMT translated into tangible changes in BMI. The range of BMI change in-duced by each PC was proportionate to the amount of variation accounted for in the point distribution model by each PC. Standardized morphing changes were also found to result in a significant cubic relationship with changes in estimated BMI. In spite of linear changes induced in the anthropometric measures used to calculate total body-volume, cubic changes in estimated BMI would be pro-duced by virtue of the volume calculation. Although the precision of the BMI estimation may be broad in nature, the results clearly demonstrate that body size and shape changes induced by the AdoBMT may be characterized quantitatively using a biologically relevant descriptor.
The unique nature of our PCA-based analyses provides us with various types of morphed images. For example, PC1 induces a gross distortion of body-shape, driven pri-marily by the subject’s height, whereas the other PCs offer an opportunity for a subtler distortion with emphasis on particular body regions (i.e., lower body) while always respecting the natural variations between body parts. In addition, the degree of distortion may be manipulated by varying the standard deviation of the mean of the PC used in the distortion. The amount of distortion intro-duced is entirely arbitrary; for practical reasons, we se-lected a standard-deviation range of 0.8 to 0.8. With this range of distortion across all eight PCs, the maximum BMI range of the morphed images was 12.52–51.79 kg/
Table 4 Body Morphing Software: Body-Shape Changes
Relative %/SD of the Mean
ID Body Part PC1 PC2 PC3 PC4 PC5 PC6 PC7 PC8
1 Virtual height 92.91 2.50 5.59 9.90 5.31 7.33 1.15 1.082 Sitting height 78.45 6.31 8.73 28.93 18.89 21.72 2.49 2.813 Leg length 107.42 1.27 2.48 9.00 8.19 6.95 4.77 0.644 Shoulder width 99.04 0.22 38.32 36.64 9.61 10.53 4.17 4.815 Hip A 91.40 0.75 52.63 51.88 25.87 35.82 5.76 9.376 Hip B 74.68 5.35 78.25 39.48 32.05 68.73 6.46 8.527 Left calf 90.50 7.19 60.14 57.16 36.85 53.64 7.49 4.898 Right calf 98.08 10.77 62.58 49.93 44.27 49.03 6.08 2.629 Left thigh 73.87 15.46 30.76 50.50 70.69 58.22 6.44 14.33
10 Right thigh 75.43 11.63 29.22 48.58 62.12 56.08 2.14 13.0911 Waist 66.30 1.76 74.10 26.38 8.05 46.61 2.90 2.9112 Hip 91.86 4.27 54.78 46.45 27.25 38.33 0.76 4.9213 Belly 42.85 0.15 98.00 20.50 14.95 78.43 11.37 5.1714 Side thigh 91.11 6.41 88.26 45.91 48.29 88.14 2.85 8.87
Note—The rate of change in each anthropometric measure is expressed as a slope [i.e., relative percent change (%) over standard deviation of the mean of each PC].
Figure 7. Linear regression of BMI and total body-volume. A significant linear relationship be-tween BMI and total cylindrical body-volume [F(1,158) 82.16, p .001] was established. Lin-ear regression analysis determined a function [BMI 12.379 101.699 * total cylindrical body- volume] to estimate the BMI of a given body.

662 ALEONG, DUCHESNE, AND PAUS
m2. Thus, with a database of 160 adolescent images and the flexibility in our distortion technique, we generated a library of nearly 41,000 body images for use as stimuli. Researchers can make use of this established library of images along with the associated age, gender and BMI information to create generalized body perception experi-ments for large groups of participants. In addition, the AdoBMT software can be used to create individualized stimuli for each study participant given that a standardized source image (Figure 1) is available.
Which PCs and what amount of distortion should be used in future experiments? With respect to the different PCs, PC1 accounts for the greatest amount of variation in our model with a total of 82.9%. Although PC1 in-duces gross changes in all of the anthropometric mea-sures, the single largest change is in the height of the body. As such, it is unlikely that PC1 will prove useful in future experiments. In contrast, PCs 2–8 account for variation ranging from 0.37%–6.0%. These PCs ac-count for much less of the variation in our model; yet,
Figure 8. Estimated mean BMI of morphed body images. Significant cubic relationships were established between estimated BMI and level of distortion for PC1 (A) and PCs 2–8 (B), ( p .05).

ADOLESCENT BODY-SHAPE DATABASE AND BODY MORPHING TOOL 663
they also allow for greater variety in the combination of body parts that are manipulated. Although PC2 accounts for 6.0% of the variation, it does not appear to generate much in the way of physical changes in body size and shape. This is likely due to the fact that PC2 models changes in subject stance. Variation in subject stance would not be reflected in the anthropometric measures
of Table 4 and thus, we see little in the way of changes in body-shape and size.
Given the inherent difficulties with PCs 1 and 2, we will likely focus on the remaining PCs (i.e., 3–8) for use in future experiments. As indicated in Table 3, PCs 3–8 account for 0.37%–2.5% of the variation in the model. In spite of these low values, one should note that use of these
Figure 9. A significant three-way interaction between subject gender, image perspective and image BMI on mean scale scores was detected. (A) Female subjects rated low BMI body images as signifi-cantly less odd than high BMI images ( p .05). A three-way interaction between image view, type of distortion, and amount of distortion was found to be significant. (B) Front images were found to be more odd than side images ( p .05). PC2 morphed images were found to be less odd than PC4 or PC5 images ( p .05). A significant distortion effect was also noted with greater distortion associ-ated with a higher mean score (i.e., more odd) ( p .05).

664 ALEONG, DUCHESNE, AND PAUS
five PCs still results in substantial BMI changes. In fact, PCs 3 and 4 both induce an 11-point change in BMI when using a standard deviation range from 0.8 to 0.8. These PCs appear to affect primarily body size and shape in the lower body; this may be particularly useful as prior studies have revealed that both adolescent males and fe-males overestimate the size of their body parts includ-ing the waist, buttocks and thighs (Bergstrom, Stenlund, & Svedjehall, 2000; Halmi, Goldberg, & Cunningham, 1977).
We believe that the AdoBSD and AdoBMT represent novel morphing tools with three key advantages over many of the techniques currently in use (e.g., paper-and-pencil tools). These advantages include: (1) the use of high- fidelity digital images, (2) the use of adolescent bod-ies as the source, and (3) the use of a morphing procedure that accounts for natural covariations between individual body parts and body views.
The use of a computerized morphing technique is of particular importance as morphing allows the real-time production of individualized body-image stimuli, the flexibility to generate body images with a wider range of size and the ability to quantify the scale of measurement. This enhances the tools’ use in clinical populations. For example, the morphing technique allows researchers to generate extremely large bodies for use with the obese and extremely thin bodies for use with anorexic patients. Although body morphing may appear quite complex, use of the image library will be made easy with online ac-cess and a simple online interface with which researchers can identify desired images using various parameters (i.e., gender, age, height, weight).
In the perceptual-realism experiment, we asked a group of healthy adult subjects to rate the “oddness” of both real and morphed images selected from the AdoBSD. We found linear distortion effects for PC4 and PC5 but not PC2; for the former two PCs, greater introduced distortion was as-sociated with higher “oddness” scores. This effect indi-cates that adult subjects are able to detect subtle changes in body-shape and size induced by morphing real images using these two PCs. The fact that PC2 failed to display any significant distortion effect for both front and side views is not surprising as this PC appears to model changes in subject stance. Consequently, PC2 will be excluded from future experiments. In contrast, PC4 will be selected as the morphing parameter of choice as it accounts for a greater percentage of the PCA model than PC5.
Another key finding lies in the relative degree of “odd-ness” of the morphed images when compared to the rat-ings of the real images. Healthy adult volunteers found body images distorted with 0.3 and 0.5 SD of PC4 and PC5 to be clearly more odd than the real images. It is clear that 0.5 SD of distortion is extreme; this level of distortion may, nevertheless, prove to be useful in clinical populations.
The primary goal of the behavioral experiment was to characterize the perceptual realism of the morphed im-ages and consequently, aide in the selection of appropri-ate morphing parameters. Nevertheless, analysis of mean scale scores revealed interesting effects of subject gender
and image BMI with respect to the real body images. In particular, the females rated low BMI images as signifi-cantly less odd than high BMI images. Although these findings are not definitive in their ability to establish per-ceptual biases among the adults with respect to real body perception, they are consistent with published studies in-vestigating body dissatisfaction and ideal body perception in both adolescents and adults. Numerous studies using various techniques have reported that adolescent and adult females select an ideal body size that is smaller or thinner than the perceived size of their real body (Brodie, Bagley, & Slade, 1994; Fallon & Rozin, 1985; Fernandez, Probst, Meermann, & Vandereycken, 1994; Kostanski, Fisher, & Gullone, 2004; Rozin & Fallon, 1988; E. R. Sands & Wardle, 2003; R. Sands et al., 2004; Zellner, Harner, & Adler, 1989). In contrast, males have been found to select a larger or more muscular body size as their ideal when compared to their perceived body size (Brodie, Slade, & Riley, 1991; Cohn et al., 1987; Pope et al., 2000). Overall, some studies have also found that females report more body dissatisfaction when compared to males (Altabe & Thompson, 1993; Kostanski et al., 2004). These findings, however, are often dependent on the BMI of the subject in question (Kostanski et al., 2004). Taken as a whole, these ideal and body dissatisfaction studies support the results reported in the current study.
Our implicit experimental design has produced signifi-cant findings in spite of the fact that our volunteers were asked no explicit questions regarding the shape and size of the presented body images. The very fact that the results appear to be in accordance with published results supports the validity of our tools.
Here, we have described the development, characteriza-tion and validation of a novel adolescent body-shape da-tabase and adolescent body morphing tool. Although we have carefully described the development and biological characterization of the AdoBSD and AdoBMT, it would be of interest to compare this novel method with existing techniques by utilizing multiple techniques within a single study to explore the potential limitations or differences in an applied setting.
For future studies with healthy adolescents, the exist-ing database of real and morphed images could be used such that participants would not have to pose for a source image but rather be simply matched to an existing child in the database. Once this matching has been achieved, the real and morphed images of the AdoBSD child could be used as experimental stimuli. In order to facilitate the widespread use of this novel tool, we provide free access to the images used in the current study. This will allow an interested researcher to select and download real and morphed images for their studies. The image selection is facilitated by a matching algorithm: a researcher inputs participants’ age, height and/or weight and is provided with those AdoBSD images that best match those pa-rameters. These tools may be accessed via the University of Nottingham Brain and Body Centre Web site (www .brainbody.nottingham.ac.uk/).
Although the AdoBSD and AdoBMT pertain to healthy adolescent children, the methodology of image acquisi-

ADOLESCENT BODY-SHAPE DATABASE AND BODY MORPHING TOOL 665
tion, body tagging, and body morphing can also be applied to other populations of interest, such as obese adults or athletes. In order to re-create these tools for other specific populations, participants would have to pose for source pictures in similar bodysuits and researchers would have to body-tag and individually morph these images.
Ultimately, future studies can now utilize these tools to explore the underlying cognitive processes of healthy adolescent body perception, as well as clinical conditions such as obesity and eating disorders.
AUTHOR NOTE
Funding was provided by the Canadian Institutes for Health Research and the Santa Fe Institute Consortium. The authors acknowledge the con-tributions of Louis Collins, Zdenka Pausova, and Rhonda Amsel. Corre-spondence regarding this article should be addressed to T. Paus, Brain and Body Centre, University of Nottingham, University Park, Nottingham NG7 2RD, England (e-mail: [email protected]).
REFERENCES
Allebeck, P., Hallberg, D., & Espmark, S. (1976). Body image: An apparatus for measuring disturbances in estimation of size and shape. Journal of Psychosomatic Research, 20, 583-589.
Altabe, M., & Thompson, J. K. (1993). Body image changes during early adulthood. International Journal of Eating Disorders, 13, 323-328.
Askevold, F. (1975). Measuring body image. Psychotherapy & Psycho-somatics, 26, 71-77.
Benson, P. J., Emery, J. L., Cohen-Tovee, E. M., & Tovee, M. J. (1999). A computer-graphic technique for the study of body size per-ception and body types. Behavior Research Methods, Instruments, & Computers, 31, 446-454.
Bergstrom, E., Stenlund, H., & Svedjehall, B. (2000). Assessment of body perception among Swedish adolescents and young adults. Journal of Adolescent Health, 26, 70-75.
Bookstein, F. L. (1989). Principle warps: Thin-plate splines and the de-composition of deformations. IEEE Transactions on Pattern Analysis & Machine Intelligence, 11, 567-585.
Brodie, D. A., Bagley, K., & Slade, P. D. (1994). Body-image percep-tion in pre- and postadolescent females. Perceptual & Motor Skills, 78, 147-154.
Brodie, D. A., Slade, P. D., & Riley, V. J. (1991). Sex differences in body-image perceptions. Perceptual & Motor Skills, 72, 73-74.
Chinn, S., & Rona, R. J. (2001). Prevalence and trends in overweight and obesity in three cross sectional studies of British children, 1974–1994. British Medical Journal, 322, 24-26.
Cohn, L. D., Adler, N. E., Irwin, C. E., Jr., Millstein, S. G., Kegeles, S. M., & Stone, G. (1987). Body-figure preferences in male and fe-male adolescents. Journal of Abnormal Psychology, 96, 276-279.
Collins, M. E. (1991). Body figure perceptions and preferences among preadolescent children. International Journal of Eating Disorders, 10, 199-208.
Cootes, T. F., Taylor, C. J., Cooper, D. H., & Graham, J. (1995). Ac-tive shape models: Their training and application. Computer Vision & Image Understanding, 61, 38-59.
Fallon, A. E., & Rozin, P. (1985). Sex differences in perceptions of de-sirable body-shape. Journal of Abnormal Psychology, 94, 102-105.
Fernandez, F., Probst, M., Meermann, R., & Vandereycken, W. (1994). Body size estimation and body dissatisfaction in eating dis-order patients and normal controls. International Journal of Eating Disorders, 16, 307-310.
Gardner, R. M., & Boice, R. (2004). A computer program for measur-ing body size distortion and body dissatisfaction. Behavior Research Methods, Instruments, & Computers, 36, 89-95.
Gardner, R. M., Gallegos, V., Martinez, R., & Espinoza, T. (1989). Mirror feedback and judgments of body size. Journal of Psycho-somatic Research, 33, 603-607.
Gardner, R. M., Martinez, R., & Espinoza, T. (1987). Psychophysical measurement of body image of self and others in obese subjects. Journal of Social Behaviour & Personality, 2, 205-217.
Gardner, R. M., Martinez, R., Espinoza, T., & Gallegos, V. (1988). Distortion of body image in the obese: A sensory phenomenon. Psychological Medicine, 18, 633-641.
Gardner, R. M., Morrell, J. A., Watson, D. N., & Sandoval, S. L. (1989). Subjective equality and just noticeable differences in body-size judgments by obese persons. Perceptual & Motor Skills, 69, 595-604.
Gardner, R. M., Stark, K., Friedman, B. N., & Jackson, N. A. (2000). Predictors of eating disorder scores in children ages 6 through 14: A longitudinal study. Journal of Psychosomatic Research, 49, 199-205.
Gruber, A. J., Pope, H. G., Jr., Borowiecki, J. J., & Cohane, G. (1999). The development of the somatomorphic matrix: A bi-axial instrument for measuring body image in women and men. In T. S. Olds, J. Dollman, & K. I. Norton (Eds.), Kinanthropometry VI (pp. 221-231). Adelaide: International Society for the Advancement of Kinanthropometry.
Halmi, K. A., Goldberg, S. C., & Cunningham, S. (1977). Perceptual distortion of body image in adolescent girls: Distortion of body image in adolescence. Psychological Medicine, 7, 253-257.
Harari, D., Furst, M., Kiryati, N., Caspi, A., & Davidson, M. (2001). A computer-based method for the assessment of body-image distor-tions in anorexia-nervosa patients. IEEE Transactions on Information Technology in Biomedicine, 5, 311-319.
Hsu, L. K. G. (1990). Eating disorders. New York: Guilford.Kostanski, M., Fisher, A., & Gullone, E. (2004). Current concep-
tualisation of body image dissatisfaction: Have we got it wrong? Jour-nal of Child Psychology & Psychiatry, 45, 1317-1325.
Lohman, T. G., Roche, A. F., & Martorell, R. (1991). Anthropometric standardization reference manual. Champaign: Human Kinetics Books.
Lucas, A. R., Beard, C. M., O’Fallon, W. M., & Kurland, L. T. (1991). 50-year trends in the incidence of anorexia nervosa in Roches-ter, Minn.: A population-based study. American Journal of Psychiatry, 148, 917-922.
Maloney, M. J., McGuire, J. B., & Daniels, S. R. (1988). Reliability testing of a children’s version of the eating attitude test. Journal of the American Academy of Child & Adolescent Psychiatry, 27, 541-543.
Mendelson, B. K., Mendelson, M. J., & White, D. R. (2001). Body-esteem scale for adolescents and adults. Journal of Personality Assessment, 76, 90-106.
Ogden, C. L., Flegal, K. M., Carroll, M. D., & Johnson, C. L. (2002). Prevalence and trends in overweight among US children and adolescents, 1999–2000. Journal of the American Medical Associa-tion, 288, 1728-1732.
Pope, H. G., Jr., Gruber, A. J., Mangweth, B., Bureau, B., deCol, C., Jouvent, R., & Hudson, J. I. (2000). Body image perception among men in three countries. American Journal of Psychiatry, 157, 1297-1301.
Probst, M., Braet, C., Vandereycken, W., De Vos, P., Van Coppenolle, H., & Verhofstadt-Deneve, L. (1995). Body size estimation in obese children: A controlled study with the video distor-tion method. International Journal of Obesity & Related Metabolic Disorders, 19, 820-824.
Probst, M., Van Coppenolle, H., Vandereycken, W., & Goris, M. (1992). Body image assessment in anorexia nervosa patients and university students by means of video distortion: A reliability study. Journal of Psychosomatic Research, 36, 89-97.
Reitman, E. E., & Cleveland, S. E. (1964). Changes in body image following sensory deprivation in schizophrenic and control groups. Journal of Abnormal Psychology, 68, 168-176.
Rhodes, S. K., & O’Neil, P. M. (1997). Effects of body fat distribution on body size estimation accuracy among obese women. International Journal of Obesity, 21, 250-253.
Rozin, P., & Fallon, A. (1988). Body image, attitudes to weight, and misperceptions of figure preferences of the opposite sex: A com-parison of men and women in two generations. Journal of Abnormal Psychology, 97, 342-345.
Sands, E. R., & Wardle, J. (2003). Internalization of ideal body-shapes in 9–12-year-old girls. International Journal of Eating Disorders, 33, 193-204.
Sands, R., Maschette, W., & Armatas, C. (2004). Measurement of body image satisfaction using computer manipulation of a digital image. Journal of Psychology, 138, 325-337.
Shibata, S. (2002). A Macintosh and Windows program for assessing

666 ALEONG, DUCHESNE, AND PAUS
body-image disturbance using adjustable image distortion. Behavior Research Methods, Instruments, & Computers, 34, 90-92.
Skrzypek, S., Wehmeier, P. M., & Remschmidt, H. (2001). Body image assessment using body size estimation in recent studies on anorexia nervosa: A brief review. European Child & Adolescent Psy-chiatry, 10, 215-221.
Slade, P. D. (1988). Body image in anorexia nervosa. British Journal of Psychiatry, 153, 20-22.
Slade, P. D., & Russell, G. F. M. (1973). Awareness of body dimen-sions in anorexia nervosa: Cross-sectional and longitudinal studies. Psychological Medicine, 3, 188-199.
Smeets, M. A. M. (1999). Body size categorization in anorexia nervosa using a morphing instrument. International Journal of Eating Disor-ders, 25, 451-455.
Stewart, T. M., Williamson, D. A., Smeets, M. A. M., & Greenway, F. L. (2001). Body morph assessment: Preliminary report on the de-velopment of a computerized measure of body image. Obesity Re-search, 9, 43-50.
Strauss, R. S., & Pollack, H. A. (2001). Epidemic increase in child-hood overweight, 1986–1998. Journal of the American Medical As-sociation, 286, 2845-2848.
Stunkard, A. J., Sorenson, T., & Schulsinger, F. (1983). Use of the Danish adoption register for the study of obesity and thinness. In S. S. Kety, L. P. Rowland, R. L. Sidman, & S. W. Matthysse (Eds.), Genetics of neurological and psychiatric disorders (pp. 115-120). New York: Raven Press.
Thompson, A. M., Baxter-Jones, A. D. G., Mirwald, R. L., & Bai-ley, D. A. (2002). Secular trend in the development of fatness during childhood and adolescence. American Journal of Human Biology, 14, 669-679.
Traub, A. C., & Orbach, J. (1964). Psychophysical studies of body-image: I. The adjustable body-distorting mirror. Archives of General Psychiatry, 11, 53-66.
Tremblay, M. S., Katzmarzyk, P. T., & Willms, J. D. (2002). Tempo-ral trends in overweight and obesity in Canada, 1981–1996. Interna-tional Journal of Obesity, 26, 538-543.
Zellner, D. A., Harner, D. E., & Adler, R. L. (1989). Effects of eat-ing abnormalities and gender on perceptions of desirable body-shape. Journal of Abnormal Psychology, 98, 93-96.
(Manuscript received June 12, 2006; revision accepted for publication September 1, 2006.)
Related Documents


![Adolescent Body Perception: Urban, Rural and Suburban ... · Findings on rural–urban differences in perception have been inconsistent [22], showing variation in weight-related behaviors](https://static.cupdf.com/doc/110x72/5f7cb259bfbc7459381089a7/adolescent-body-perception-urban-rural-and-suburban-findings-on-ruralaurban.jpg)


![Human Body Shape Modeling Using 3D Range Data for ...HBSM, for instance, woman body attractiveness [10], or adolescent body perception [1]. Various methods and tools are used in HBSM](https://static.cupdf.com/doc/110x72/5e8d15a8bdc046461504bcde/human-body-shape-modeling-using-3d-range-data-for-hbsm-for-instance-woman.jpg)


