Assessing your Key Risk Indicators Are you Lagging Behind, or Leading the Pack? Presented by Jessica A. Rice, SPHR, ARM Risk Management Specialist City of Charlottesville, Virginia November, 2017

Welcome message from author
This document is posted to help you gain knowledge. Please leave a comment to let me know what you think about it! Share it to your friends and learn new things together.
Transcript

Assessing your Key Risk Indicators Are you Lagging Behind, or Leading
the Pack?
Presented by Jessica A. Rice, SPHR, ARM Risk Management Specialist
City of Charlottesville, Virginia
November, 2017

Session Objectives
• Articulate the difference between lagging and leading Key Risk Indicators and the benefits of each type
• Site examples of lagging and leading Key Risk Indicators • Utilize both lagging and leading indicators to conduct a
holistic Risk Analysis used to identify loss trends • Utilize a risk analysis to formulate a treatment strategy
and initiate the Continuous Improvement process
November, 2017 November, 2017
Understanding Key Risk Indicators
1. Warn us when an exposure is beginning to occur 2. Provide enough lead time to mitigate the risk
“Not everything that can be counted counts, and not everything that counts can be counted.” -Albert Einstein
Objectives of KRIs
November, 2017

Importance of KRIs KRIs play an important role in risk management by predicting potential high risk exposure and enabling timely action.
KRIs enable organizations to: • Identify current risk exposure and emerging risk trends. • Identify current control weaknesses and allow for continuous
improvement of poor controls. • Facilitate the risk reporting to critical decision- makers • Validate the value of Risk Management programming
Understanding Key Risk Indicators
November, 2017
Characteristics • Measurable- quantifiable metrics • Predictable- used as early warning system • Comparable- trend analysis • Informational- executive reporting
Understanding Key Risk Indicators
November, 2017

Leading v. Lagging Indicators
Examples: • Safety training • Ergonomic assessments • Safety culture surveys • Worksite hazard assessments • Behavior Based Safety Observations • Program and Policy audits • Vehicle ride-alongs • Emergency response drills/ tabletop
November, 2017
Understanding Key Risk Indicators
Leading KRI- Predictive and help to forecast future occurrences
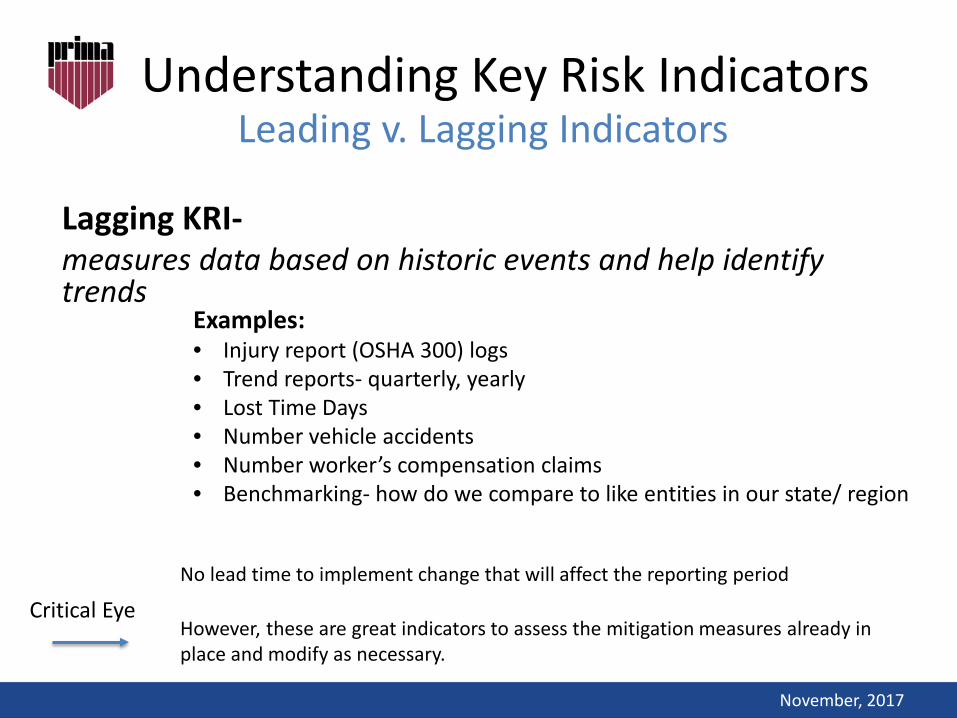
Lagging KRI- measures data based on historic events and help identify trends
Examples: • Injury report (OSHA 300) logs • Trend reports- quarterly, yearly • Lost Time Days • Number vehicle accidents • Number worker’s compensation claims • Benchmarking- how do we compare to like entities in our state/ region
No lead time to implement change that will affect the reporting period However, these are great indicators to assess the mitigation measures already in place and modify as necessary.
November, 2017
Understanding Key Risk Indicators Leading v. Lagging Indicators
Critical Eye

Why use lagging indicators at all? Lagging indicators are the traditional metrics used to indicate progress toward goals and regulatory compliance.
November, 2017 November, 2017
Understanding Key Risk Indicators Leading v. Lagging Indicators
Lagging KRI- a closer look
Lagging indicators are reactionary!

Effective Risk Management Programming
1) Identify critical risk exposures
2) Define Risk Appetite
3) Identify indicators
November, 2017
Selecting Key Risk Indicators
Effective Risk Management Programming Selecting Key Risk Indicators
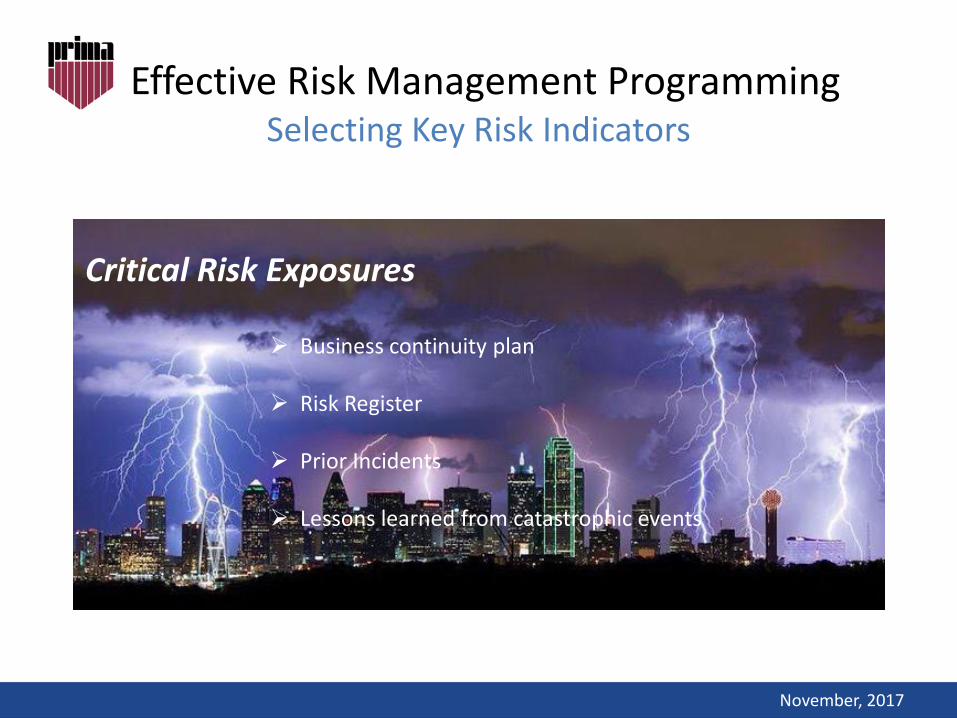
Critical Risk Exposures
Business continuity plan
Risk Register
Prior Incidents
Lessons learned from catastrophic events
November, 2017

Effective Risk Management Programming Selecting Key Risk Indicators
Define Risk Appetite
November, 2017
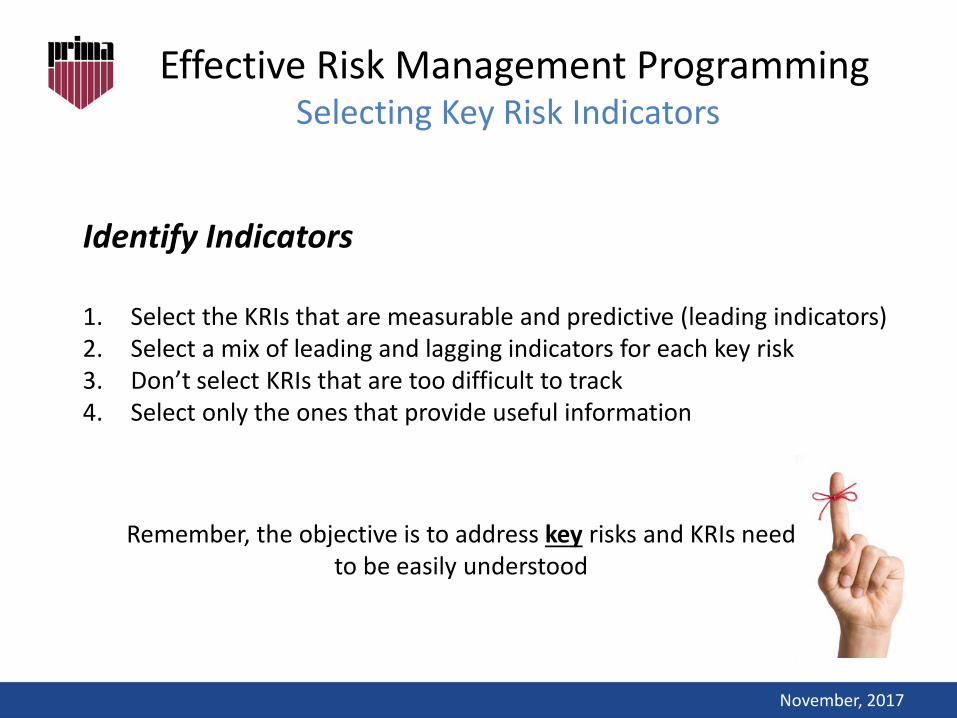
Identify Indicators 1. Select the KRIs that are measurable and predictive (leading indicators) 2. Select a mix of leading and lagging indicators for each key risk 3. Don’t select KRIs that are too difficult to track 4. Select only the ones that provide useful information
November, 2017
Effective Risk Management Programming Selecting Key Risk Indicators
Remember, the objective is to address key risks and KRIs need to be easily understood
November, 2017
Effective Risk Management Programming Monitoring & Reporting
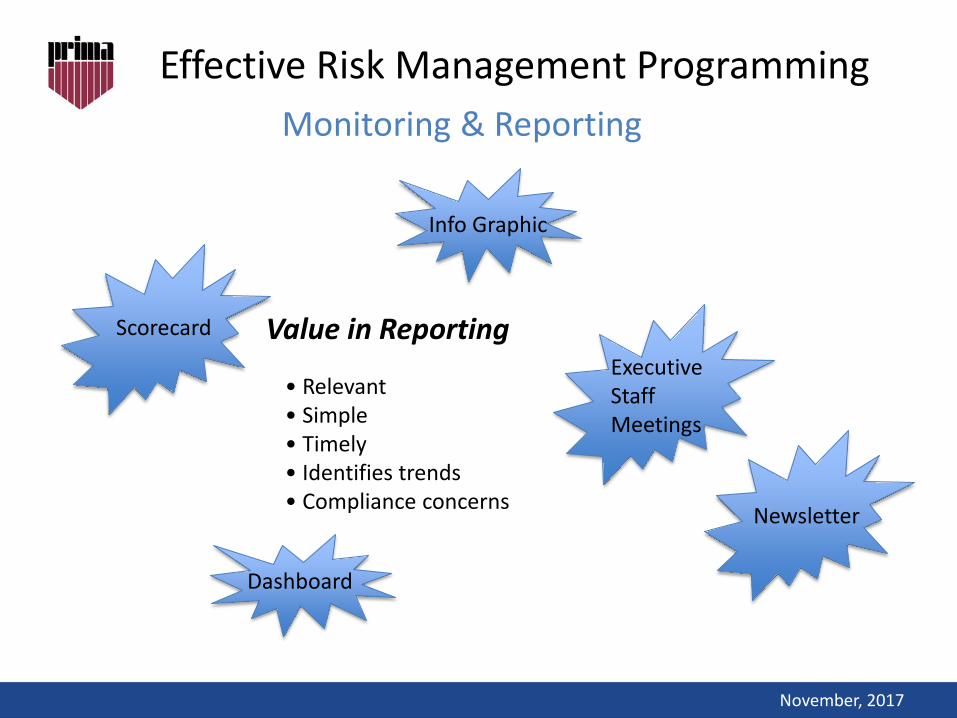
Value in Reporting
• Relevant • Simple • Timely • Identifies trends • Compliance concerns
Scorecard
Dashboard
Newsletter
Info Graphic
Executive Staff Meetings

Assessing your Key Risk Indicators Are you Lagging Behind, or Leading the Pack?
Presented by Jessica A. Rice, SPHR, ARM Risk Management Specialist
City of Charlottesville, Virginia
November, 2017
Related Documents