Natural Hazards and Earth System Sciences (2003) 3: 377–389 c European Geosciences Union 2003 Natural Hazards and Earth System Sciences Assessing tsunami vulnerability, an example from Herakleio, Crete M. Papathoma 1 , D. Dominey-Howes 2 , Y. Zong 3 , and D. Smith 4 1 Coventry Centre for Disaster Management, School of Sciences and the Environment, Coventry University, Coventry, CV1 5FB, UK 2 Risk Frontiers, Department of Physical Geography, Macquarie University, North Ryde, NSW 2109, Australia 3 Department of Geography, University of Durham, DH1 3LE, UK 4 Centre for Quaternary Research, Division of Geography, School of Sciences and the Environment, Coventry University, Coventry, CV1 5FB, UK Received: 17 September 2002 – Accepted: 28 October 2002 Abstract. Recent tsunami have caused massive loss of life, destruction of coastal infrastructures and disruption to eco- nomic activity. To date, tsunami hazard studies have concen- trated on determining the frequency and magnitude of events and in the production of simplistic flood maps. In general, such maps appear to have assumed a uniform vulnerability of population, infrastructure and business. In reality however, a complex set of factors interact to produce a pattern of vul- nerability that varies spatially and temporally. A new vulner- ability assessment approach is described, that incorporates multiple factors (e.g. parameters relating to the natural and built environments and socio-demographics) that contribute to tsunami vulnerability. The new methodology is applied on a coastal segment in Greece and, in particular, in Crete, west of the city of Herakleio. The results are presented within a Geographic Information System (GIS). The application of GIS ensures the approach is novel for tsunami studies, since it permits interrogation of the primary database by several different end-users. For example, the GIS may be used: (1) to determine immediate post-tsunami disaster response needs by the emergency services; (2) to pre-plan tsunami mitigation measures by disaster planners; (3) as a tool for local planning by the municipal authorities or; (4) as a basis for catastrophe modelling by insurance companies. We show that population density varies markedly with the time of the year and that 30% of buildings within the inundation zone are only sin- gle story thus increasing the vulnerability of their occupants. Within the high inundation depth zone, 11% of buildings are identified as in need of reinforcement and this figure rises to 50% within the medium inundation depth zone. 10% of busi- nesses are located within the high inundation depth zone and these may need to consider their level of insurance cover to protect against primary building damage, contents loss and business interruption losses. Correspondence to: M. Papathoma ([email protected]) 1 Introduction Tsunami may cause catastrophic loss of life, destruction of property and engineered structures and coastal infrastruc- ture and lead to major economic and business interruption losses. Highly destructive tsunami were recorded at a num- ber of locations during the 1990’s: in Flores, Indonesia in 1992 (Tsuji et al., 1995), in Hokkaido, Japan in 1993 (Shuto and Matsutomi, 1995; Shimamoto et al., 1995) and in Papua New Guinea in 1998 (Goldsmith et al., 1999; Kawata et al., 1999). It is clear therefore, that tsunami may pose a signifi- cant hazard in a number of coastal areas of the world. Con- sequent to the United Nations International Decade for Nat- ural Disaster Reduction (IDNDR), efforts were made to un- derstand the mechanisms of tsunami generation, propagation and coastal run-up, to determine their frequency, magnitude and impacts in different locations and to develop mechanisms by which they may be detected and monitored (Hebenstreit, 2001). Disaster and emergency management agencies then integrate this information for the purposes of issuing tsunami warnings and for developing disaster management plans in- cluding (1) pre-planning appropriate response activities in or- der to minimise the disruption following an event including those events that allow a rapid response and recovery and; (2) preparing and mitigating the likely impacts of future events. Such activities will include risk assessments, public aware- ness and education programmes; identification of evacuation routes and safe zones; the construction of flood barriers and the development of planning regulations and construction codes. To do this effectively, they must have reliable and ac- curate information concerning the likely spatial and temporal characteristics and impacts of potentially damaging tsunami at different frequency-magnitude scales. Greece and surrounding regions (Fig. 1) have long been affected by tsunami. More than 160 events have been cata- logued for the last 3500 years (Papadopoulos, 2001). The po- tential impacts of future tsunami are likely to be much greater than in the past (Dominey-Howes, 2002). It is therefore ger- mane to enquire to what level are selected coastal segments

Welcome message from author
This document is posted to help you gain knowledge. Please leave a comment to let me know what you think about it! Share it to your friends and learn new things together.
Transcript
Natural Hazards and Earth System Sciences (2003) 3: 377–389c© European Geosciences Union 2003 Natural Hazards
and EarthSystem Sciences
Assessing tsunami vulnerability, an example from Herakleio, Crete
M. Papathoma1, D. Dominey-Howes2, Y. Zong3, and D. Smith4
1Coventry Centre for Disaster Management, School of Sciences and the Environment, Coventry University, Coventry, CV15FB, UK2Risk Frontiers, Department of Physical Geography, Macquarie University, North Ryde, NSW 2109, Australia3Department of Geography, University of Durham, DH1 3LE, UK4Centre for Quaternary Research, Division of Geography, School of Sciences and the Environment, Coventry University,Coventry, CV1 5FB, UK
Received: 17 September 2002 – Accepted: 28 October 2002
Abstract. Recent tsunami have caused massive loss of life,destruction of coastal infrastructures and disruption to eco-nomic activity. To date, tsunami hazard studies have concen-trated on determining the frequency and magnitude of eventsand in the production of simplistic flood maps. In general,such maps appear to have assumed a uniform vulnerability ofpopulation, infrastructure and business. In reality however, acomplex set of factors interact to produce a pattern of vul-nerability that varies spatially and temporally. A new vulner-ability assessment approach is described, that incorporatesmultiple factors (e.g. parameters relating to the natural andbuilt environments and socio-demographics) that contributeto tsunami vulnerability. The new methodology is applied ona coastal segment in Greece and, in particular, in Crete, westof the city of Herakleio. The results are presented withina Geographic Information System (GIS). The application ofGIS ensures the approach is novel for tsunami studies, sinceit permits interrogation of the primary database by severaldifferent end-users. For example, the GIS may be used: (1)to determine immediate post-tsunami disaster response needsby the emergency services; (2) to pre-plan tsunami mitigationmeasures by disaster planners; (3) as a tool for local planningby the municipal authorities or; (4) as a basis for catastrophemodelling by insurance companies. We show that populationdensity varies markedly with the time of the year and that30% of buildings within the inundation zone are only sin-gle story thus increasing the vulnerability of their occupants.Within the high inundation depth zone, 11% of buildings areidentified as in need of reinforcement and this figure rises to50% within the medium inundation depth zone. 10% of busi-nesses are located within the high inundation depth zone andthese may need to consider their level of insurance cover toprotect against primary building damage, contents loss andbusiness interruption losses.
Correspondence to:M. Papathoma([email protected])
1 Introduction
Tsunami may cause catastrophic loss of life, destruction ofproperty and engineered structures and coastal infrastruc-ture and lead to major economic and business interruptionlosses. Highly destructive tsunami were recorded at a num-ber of locations during the 1990’s: in Flores, Indonesia in1992 (Tsuji et al., 1995), in Hokkaido, Japan in 1993 (Shutoand Matsutomi, 1995; Shimamoto et al., 1995) and in PapuaNew Guinea in 1998 (Goldsmith et al., 1999; Kawata et al.,1999). It is clear therefore, that tsunami may pose a signifi-cant hazard in a number of coastal areas of the world. Con-sequent to the United Nations International Decade for Nat-ural Disaster Reduction (IDNDR), efforts were made to un-derstand the mechanisms of tsunami generation, propagationand coastal run-up, to determine their frequency, magnitudeand impacts in different locations and to develop mechanismsby which they may be detected and monitored (Hebenstreit,2001). Disaster and emergency management agencies thenintegrate this information for the purposes of issuing tsunamiwarnings and for developing disaster management plans in-cluding (1) pre-planning appropriate response activities in or-der to minimise the disruption following an event includingthose events that allow a rapid response and recovery and; (2)preparing and mitigating the likely impacts of future events.Such activities will include risk assessments, public aware-ness and education programmes; identification of evacuationroutes and safe zones; the construction of flood barriers andthe development of planning regulations and constructioncodes. To do this effectively, they must have reliable and ac-curate information concerning the likely spatial and temporalcharacteristics and impacts of potentially damaging tsunamiat different frequency-magnitude scales.
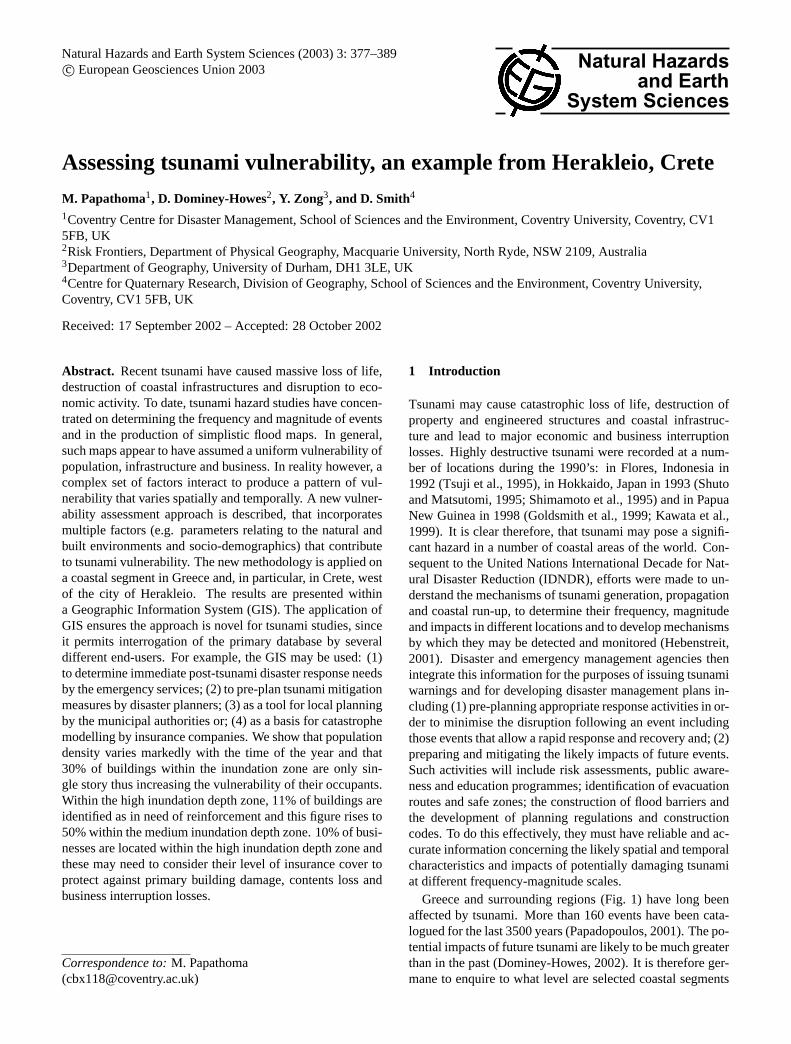
Greece and surrounding regions (Fig. 1) have long beenaffected by tsunami. More than 160 events have been cata-logued for the last 3500 years (Papadopoulos, 2001). The po-tential impacts of future tsunami are likely to be much greaterthan in the past (Dominey-Howes, 2002). It is therefore ger-mane to enquire to what level are selected coastal segments
378 M. Papathoma et al.: Assessing tsunami vulnerability
Figure 1. The Map of Crete and the study area Fig. 1. The map of Crete and the study area.
of Greece at risk from and vulnerable to tsunami inundationand impacts.
2 Background
Tsunami vulnerability analysis is fundamental to effectivedisaster planning as, until a meaningful analysis has been un-dertaken, sensible mitigative measures cannot be developedfully or implemented effectively. Examination of tsunamirisk maps (such as those that appear in telephone directoriesof coastal American cities or on the World Wide Web sites ofthe Federal Emergency Management Agency, USA and theJapan Meteorological Agency), indicate that tsunami floodrisk (and therefore likely damage) is assumed to be uniformwithin the flood zone. Such maps show that all structures andpeople within this flood area are uniformly at risk of damage.While this appears to be the accepted approach, it should beclear that both the population and infrastructure within anygiven tsunami flood zone are not uniformly at risk. This isbecause risk (the probability for damage) is intimately re-lated to vulnerability (the potential for damage) (Alexander,2000) which in turn is a function of a number of parametersthat include amongst others: distance from the shore, depthof flood water, construction standards of buildings, prepared-ness activities, socio-economic status and means, level of un-derstanding and hazard perception and amount of warningand ability to move away from the flood zone. Therefore, atsunami vulnerability analysis should be developed that in-cludes as many of these factors as possible in order to gaina more realistic picture of spatial and temporal patterns ofvulnerability. In this paper, we outline a new tsunami vulner-ability assessment approach to do just this. Our approach isconstructed and presented within a Geographic InformationSystem (GIS) since tsunami vulnerability is spatially variableand a GIS helps to understand such variability once the basedata have been compiled, alternative scenarios (hazard mag-
nitudes) may be examined. GIS has been used in such anal-ysis for several different hazard types (e.g. river and coastalfloods, earthquakes, volcanic eruptions and hurricanes) andfor integrated peril studies, but with few exceptions (e.g.Wood and Stein, 2001) has not been used for tsunami vul-nerability analysis.
3 Estimating tsunami hazard probability (return peri-ods) within Greece
It is first necessary to establish the probability that a tsunamiof a particular magnitude will occur within a given periodof time and therefore, that tsunami pose a major hazard inGreece. Fortunately, during the last forty years or so, anumber of authors have collated large amounts of data andhave published catalogues for the eastern Mediterranean andGreek area (e.g. Antonopoulos, 1980; Papadopoulos, 1998;Soloviev et al., 2000). During the same period very detailedcatalogues of earthquakes, which contain references to coin-cidental tsunami events, were compiled and published (e.g.Papazachos and Papazachou, 1997). From these catalogues ithas been possible to calculate the probability (return periods)for different magnitude tsunami. From an analysis of thesedatasets, Papazachos and Papazachou (1997) and Dominey-Howes (2002) report that tsunami in Greece and the sur-rounding areas with a maximum intensity orKo (on theAmbraseys-Sieberg six grade Intensity Scale (Ambraseys,1962)) of III or larger, occur on average, every 4 years. Thereturn periods of tsunamis with intensity IV or larger is 26years, whereas tsunamis with intensity V or larger occur onaverage, every 170 years. Tsunamis with intensity VI orlarger, have average return period of 1100 years. Of equalimportance is an estimate of the likely wave height on-shorefor tsunami of intensity III, IV, V and VI. Soloviev (1978) av-eraged wave heights for all known tsunami and determinedmaximum wave heights(H(m)max) for intensity (Ko) III as
M. Papathoma et al.: Assessing tsunami vulnerability 379
Table 1. Wave height according to Soloviev (1978) and according to Greek records for each grade of tsunami intensity and number of eventsper grade
K0 Wave height for each Wave height documented in Return period Number of eventstsunami intensity grade Greece and the in Greece (years) in Greece
according to Soloviev (1978) surrounding areas
III + 2 m + 1 m 4 55IV + 4 m + 5 m 26 25V + 8 m + 11 m 170 10VI + 16 m + 20 m 1100 2
+2 m, forKo IV as +4 m, forKo V as +8 m and forKo VI as+16 m. Since these calculations are more than twenty yearsold and relate to tsunami from all over the world, the meanH(m)max for all tsunami (Ko III to VI) from the Greek areais calculated from the data of Papadopoulos (1998) which isthe most complete dataset with 159 entries. It is calculatedthat theH(m)max for intensity (Ko) III is +1.6 m, forKo IV is+4.8 m, forKo V is +11.5 m and forKo VI is +20 m. As canbe seen in Table 1, our values forKo III and IV are broadlysimilar to those of Soloviev (1978), but are somewhat largerfor Ko V and VI. This is due: (1) to a smaller dataset forthe Greek area alone and (2) the presence of two very largetsunami in the near recent period skewing the data. Theseevents are the AD1650 and the AD1956 tsunami. Accord-ing to Papazachos and Papazachou (1997) and Papadopoulosand Chalkis (1984) the maximum wave heights for the spe-cific events were 30 and 25 m, respectively.
The data presented above are significant as they suggestthat tsunami with a maximum wave height ofc.+5 m have areturn period of as little as 26 years. Given that coastal areasof Greece have experienced significant development duringthe last 40 years in which no major tsunami has occurred,the probability for damage and insured losses is very high. Itshould also be noted that the last majorKo VI tsunami oc-curred on 21 July AD365 (1637 years ago) associated with alarge subduction earthquake beneath the Outer Hellenic Arc.Therefore, a major tectonic tsunami is long overdue. In ad-dition, the north coast of Crete, which has been selected asthe application region in this study, is characterised by thehighest tsunamicity in Greece given that at least 15 tsunamievents, four of them being destructive, were reported fromantiquity up to the present. In Table 1 the number of tsunamievents in each Intensity (K0) category is shown together withthe expected (Soloviev, 1978) and recorded wave height inGreece.
4 Previous work
A number of authors have recognised the hazard probabil-ity that particular coastal areas of Greece face with regard totsunami (Papazachos et al., 1986; Fritzalas and Papadopou-los, 1988; Fytikas et al., 1990; Dominey-Howes, 1998; Pa-padopoulos and Dermentzopoulos, 1998). The most com-
prehensive tsunami risk analysis in Greece is the study ofPapadopoulos and Dermentzopoulos (1998). These authorsdeveloped a “Tsunami Risk Management Pilot Study” forwestern Herakleio city, Crete. Their approach incorporatesseveral steps: (1) collection and analysis of risk assess-ment parameters (e.g. natural environment, land use/landcover types, road network, functions and lifelines, socio-economics and demographics); (2) qualitative description ofa hypothetical tsunami and semi-quantitative description ofprobable tsunami impacts based on those parameters out-lined in step 1 and; (3) the qualitative description of tsunamicounter measures based upon a semi-quantitative descrip-tion of expected impacts. The results of their investigationare presented in a series of 1:10 000 hand-drawn thematicmaps. The results were then presented using GIS (Ganaset al., 2001). The results of the tsunami risk analysis of Pa-padopoulos and Dermentzopoulos (1998) are informative butproblems arise in the application: (1) the results are basedupon analysis of only 1 tsunami of a particular magnitude. Ifany other magnitude event were to occur, the likely impactscannot be assessed from the thematic maps; (2) the semi-quantitative approach described, is extremely complicated tofollow and not easily transferred to other coastal locationsand; (3) the methodology does not allow an assessment ofpotential impacts for a specific magnitude tsunami at differ-ent times of the day or year. That is, there is no temporaldimension to the analysis. The new approach presented inthis paper solves these problems by using a database ratherthan a series of static maps.
5 Research methodology
5.1 Approach and preliminary results
In this section we describe the study area selected, the step bystep process that has been completed during the developmentof our vulnerability analysis approach and, highlight somepreliminary results. Data collection took place in July 2000.
5.1.1 Step 1: Identification of field site
In order to test the methodology, a representative coastal seg-ment of Greece was selected. The western section of Herak-
380 M. Papathoma et al.: Assessing tsunami vulnerability
Table 2. Selected tsunamis known to have impacted Herakleio, Crete (ER = earthquake, VO = volcanic eruption)
Date Cause Short description Intensity K0
1628BC VO Large wave in the eastern Mediterranean Sea 6AD1303 ER Large destructive waves 5AD1650 VO Large destructive waves 6AD1956 ER Moderately destructive waves 5
Source: Papadopoulos (1998) and Papadopoulos and Chalkis (1984)
leio, Crete, was chosen because it has a developed urban in-frastructure, a wide economic base and is an important centreof tourist activity. The area chosen also has a long historicalrecord of tsunami floods and reliable information document-ing specific tsunami wave heights and/or distances of inunda-tion. Such information is a necessary first step in identifyinglikely inundation zones.
5.1.2 Step 2: Estimation of worse case scenario
Catalogues of historic tsunami were examined and thoseevents that impacted the area of Herakleio were selected(Table 2). By collecting information about these events itwas possible to identify the extreme inundation zone as thearea between the coastline and the contour of the highestever documented/recorded wave. In our study area the in-undation zone is defined as the area between the coastlineand the 5 m contour since this is the height of the largestrecorded tsunami which occurred on 29 September AD1650(Dominey-Howes et al., 2000). Therefore, the worse casescenario has aH(m)max of c.+5 m and correlates with atsunami intensity ofKo IV.
The purpose of this paper is not to consider physical mech-anisms or hydrodynamic characteristics of tsunami duringgeneration, propagation or inundation, but to identify andquantify the vulnerability to a hypothetical tsunami achiev-ing a +5 m wave height in a deterministic way. Therefore,we do not consider factors such as tsunami source region, di-rection of wave approach, off-shore bathymetry, coastal con-figuration, coastal geomorphology and hydrodynamic pro-cesses during inundation as these parameters are of concernmore to theoretical modellers.
5.1.3 Step 3: Identification of parameters that may con-tribute to vulnerability
Since the vulnerability to tsunami damage and destructionis not uniform within the study area, a variety of parameterswere identified and then information concerning each param-eter was collected to generate the primary database. The in-formation relating to each of these parameters was collectedfor each building or open space within the study area. Itshould therefore, be possible to determine spatial vulnerabil-ity and display temporal patterns depending on the scenariosbeing investigated. The parameters that we identify and takein to consideration are:
1. The built environment
Number of stories in each building:
– Only one floor (vertical evacuation is impossible).
– More than one floor (vertical evacuation is possi-ble).
Here, the actual number of floors is not of interest. Whatdoes matter is whether there is the opportunity for verti-cal evacuation of the occupants. Therefore, where thereis only one floor, the occupants are highly vulnerable totsunami attack whereas, with two or more floors, occu-pants may vertically evacuate and as such, have a lowervulnerability.
Description of ground floor:
– Open plan with movable objects e.g. tables andchairs (high vulnerability to injury/damage).
– Open plan or with big glass windows without mov-able objects (moderate vulnerability).
– None of the above (low vulnerability).
Building surroundings:
– No barrier (very high vulnerability).
– Low/narrow earth embankment (high vulnerabil-ity).
– Low/narrow concrete wall (moderate vulnerabil-ity).
– High concrete wall (low vulnerability).
Building material, age, design:
– Buildings of fieldstone, unreinforced, crumblingand/or deserted (high vulnerability).
– Ordinary brick buildings, cement mortar, no rein-forcement (moderate vulnerability).
– Precast concrete skeleton, reinforced concrete (lowvulnerability).
Movable objects:
– Movable objects (objects considered moveable arethose that can cause injuries to people, damage to
M. Papathoma et al.: Assessing tsunami vulnerability 381
buildings or block evacuation routes. Such ob-jects include old cars, barrels, refrigerators, con-tainers, construction materials and car componentsetc.) (high vulnerability).
– No movable objects (low vulnerability).
2. Sociological Data
Population density:
– Population density during the night.
– Population density during the day.
– Population density in the summer.
– Population density in the winter.
It would be preferable to have absolute figures for pop-ulation density (i.e. people per building) but such datais not available for Greece. As such, we estimate rel-ative population density for individual buildings andopen spaces dependent upon their use. This is a use-ful technique since it may be applied to different studyareas very easily.
Number of people per building:
– High or low (high or low vulnerability).
The National Census Office of Greece does not publishinformation on the absolute number of people per build-ing (particularly residential units). However, dependingon the number of units within a residential block, it ispossible to estimate the average number of people. Ac-cording to the European Commission (EC, 2000), themean number of people per Greek household is 3.
3. Economic Data
Land use:
– Business (shops, storage rooms, taverns, hotels,etc.).
– Residential.
– Services (schools, hospitals, power stations, etc.).
4. Environmental/Physical Data.
Physical or man-made barriers/sea defence:
– Natural (sandy beach or marsh) (low protectionagainst flooding – high vulnerability).
– Soil embankment (moderate protection againstflooding – moderate vulnerability).
– Concrete stone wall (high protection against flood-ing – low vulnerability).
Natural environment:
– Wide intertidal zone (high protection against flood-ing – low vulnerability).
– Intermediate intertidal zone (moderate protectionagainst flooding – moderate vulnerability).
– Narrow intertidal zone (low protection againstflooding – high vulnerability). It should be notedthat Crete tidal range is minimal.
Land cover – vegetation:
– No vegetation cover (high vulnerability).
– Scrub and low vegetation (moderate vulnerability).
– Trees and dense scrub (low vulnerability).
The parameters we selected were chosen following an ex-amination of tsunami impact surveys (e.g. Maramai andTinti, 1997; Tsuji et al., 1995; Shuto and Matsutomi, 1995)and other risk/vulnerability studies of storm surge flooding;river flooding; earthquakes and volcanic eruptions (see Dun-can et al., 1996; Fischer, et al., 1996; Synolakis et al., 1998;Bush et al., 1999; Camilleri, 1999; Solomon and Forbes,1999).
5.1.4 Step 4: Establishing the GIS base map and generationof the primary database
A GIS operates by using two types of data: spatial data andattribute data. These data sets may then be combined in orderto answer the questions being investigated.
1. Spatial data – the spatial data of the study area has tobe digitised from an original topographic map or an airphotograph in a scale that will allow the user to iden-tify individual buildings and open spaces. A suitablescale is 1:5000. A 1:5000 1998 aerial photograph and a1:5000 topographic map, both of which were suppliedby the Greek Military Geographical Service, were usedas base maps. The spatial data relates to each individualbuilding, open space, road and stream.
2. Attribute data – the attribute data (the parameters) iden-tified in Step 3 once collected, must be entered into theGIS. Tables for each attribute are established and linkedto each building or open space in the spatial base map.
Attribute and spatial data were input into the GIS in theform of multiple coverages. A major advantage of our ap-proach relates to the very fine scale at which primary datahas been collected. In this study, the unit of data relates toan individual building or open space rather than to averagedblocks of buildings, cities or even entire regions. This meansthat high-resolution analyses may be performed. The datawere collected during a ground based building-to-buildingsurvey where every unit was identified, coded and subject toassessment for each of the parameters listed in Sect. 5.1.3.Data were collected for 759 buildings.
6 Results
Analysis of the primary database according to different end-users (e.g. disaster planners, local authorities and insurancecompanies).
382 M. Papathoma et al.: Assessing tsunami vulnerability
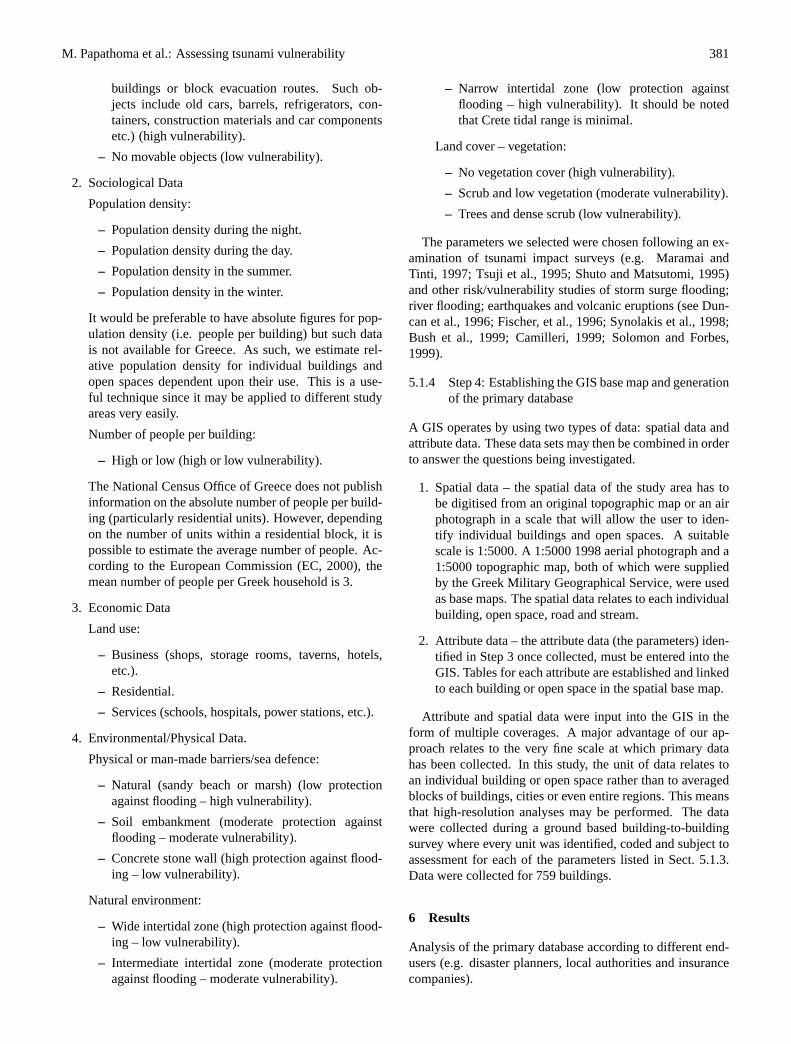
Fig. 2. The Inundation Depth Zones (IDZs) of the study area.
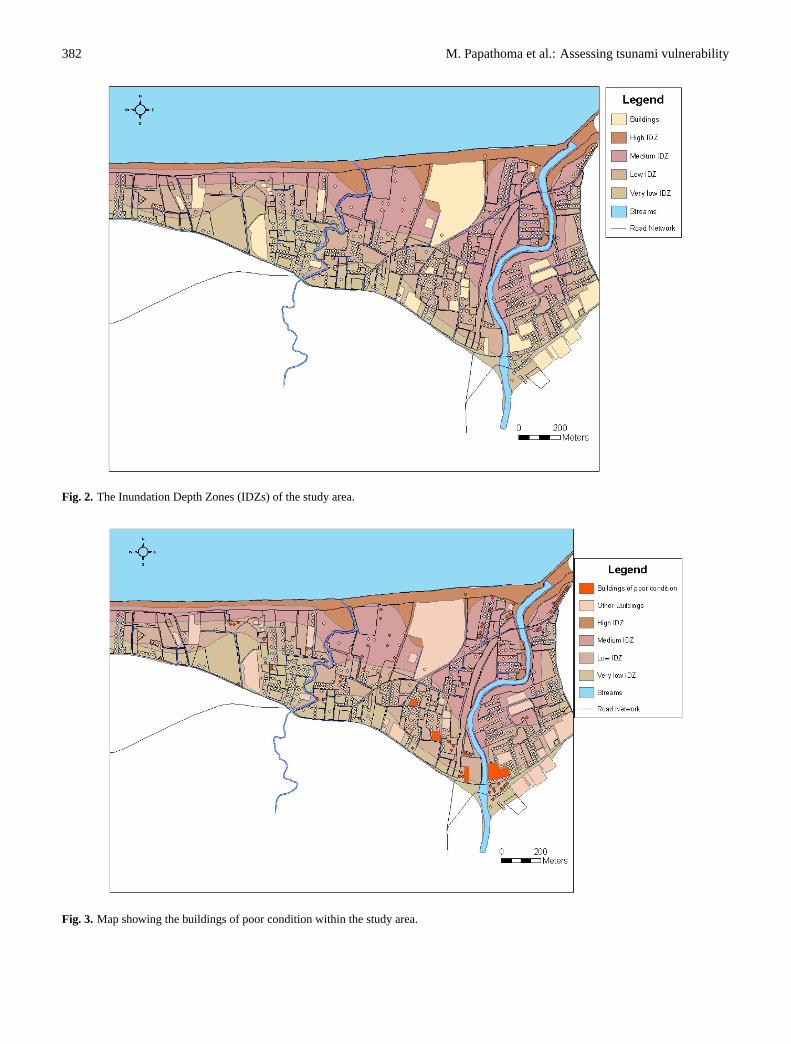
Fig. 3. Map showing the buildings of poor condition within the study area.
M. Papathoma et al.: Assessing tsunami vulnerability 383
Table 3. Thematic maps produced and list of input attribute data
Thematic maps Feature Attribute data
Road Network Lines –
Rivers and streams Lines –
Buildings Points • Number of floors• Condition of ground floor• Use• Population density during the day• Population density during the night• Population density during the summer• Population density during the winter• Number of residents• Surroundings• Natural Environment• Sea defence
Open spaces and large units Polygons• Number of floors(buildings that were too large • Condition of ground floorto be digitized as points) • Use
• Population density during the day• Population density during the night• Population density during the summer• Population density during the winter• Number of residents• Surroundings• Natural Environment• Sea defence• Movable objects
The primary database generated in Step 4 may be utilisedby different end-users according to their particular require-ments and a range of thematic maps may be generated fromthe primary database (Table 3). We envisage several end-users that might include:
• The Local Authorities– Fig. 2 shows tsunami inun-dation depth (ID) zones based on contour elevation.The inundation zone is divided in to four units: high,medium, low and very low inundation depth (ID). Thehigh ID zone relates to the area from the coast to the2 m contour. The medium ID zone lies between the 2 mand 3 m contours. The low ID zone lies between the3 m and 4 m contours and the very low ID zone liesbetween the 4 m and 5 m contours. Local authoritiesmay be interested in knowing which public and privatebuildings (e.g. homes, hospitals and schools) should bereinforced or even relocated because of their vulnerabil-ity to tsunami damage (Fig. 3). There are 78 buildings(approx. 10% of total housing stock) of poor condi-tion within the inundation zone. From Fig. 3, it is clearthat there are just a few houses of very poor conditionwithin the high ID zone (4 buildings which is 5% oftotal housing stock) and may require reinforcement. Alarge amount of buildings of poor condition are locatedin the medium ID zone (40%). The rest of the buildingsof poor condition are located within the low and very
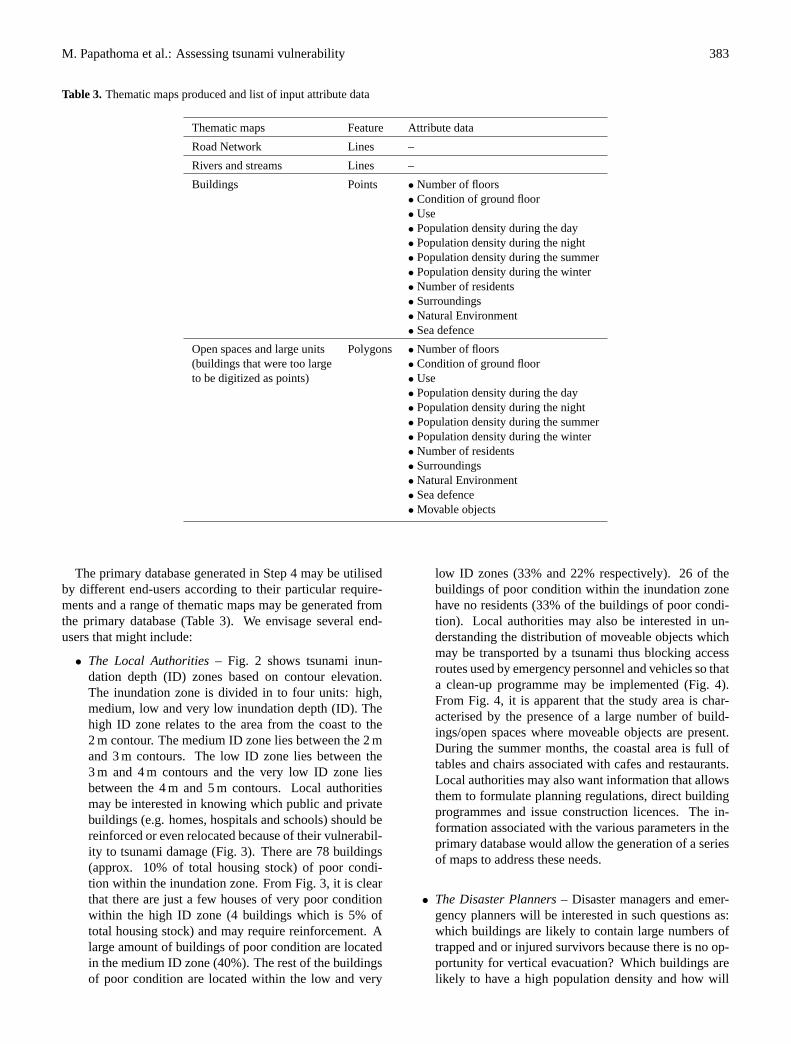
low ID zones (33% and 22% respectively). 26 of thebuildings of poor condition within the inundation zonehave no residents (33% of the buildings of poor condi-tion). Local authorities may also be interested in un-derstanding the distribution of moveable objects whichmay be transported by a tsunami thus blocking accessroutes used by emergency personnel and vehicles so thata clean-up programme may be implemented (Fig. 4).From Fig. 4, it is apparent that the study area is char-acterised by the presence of a large number of build-ings/open spaces where moveable objects are present.During the summer months, the coastal area is full oftables and chairs associated with cafes and restaurants.Local authorities may also want information that allowsthem to formulate planning regulations, direct buildingprogrammes and issue construction licences. The in-formation associated with the various parameters in theprimary database would allow the generation of a seriesof maps to address these needs.
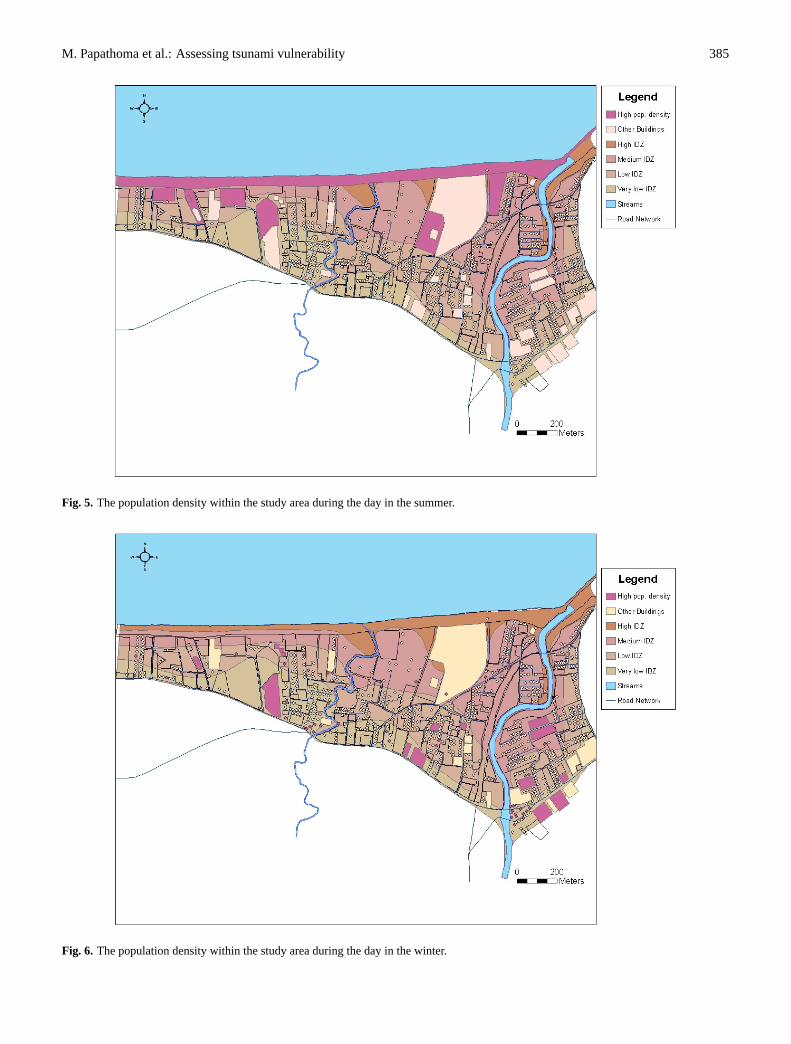
• The Disaster Planners– Disaster managers and emer-gency planners will be interested in such questions as:which buildings are likely to contain large numbers oftrapped and or injured survivors because there is no op-portunity for vertical evacuation? Which buildings arelikely to have a high population density and how will
384 M. Papathoma et al.: Assessing tsunami vulnerability
Fig. 4. The location of movable objects within the study area.
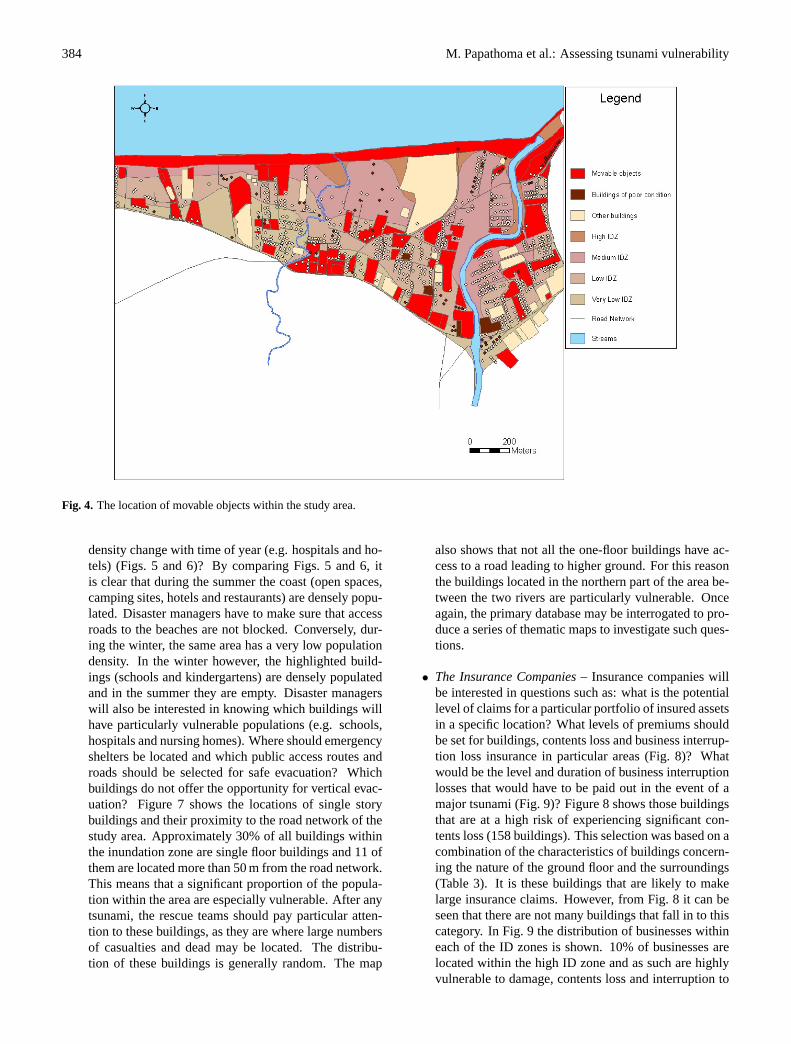
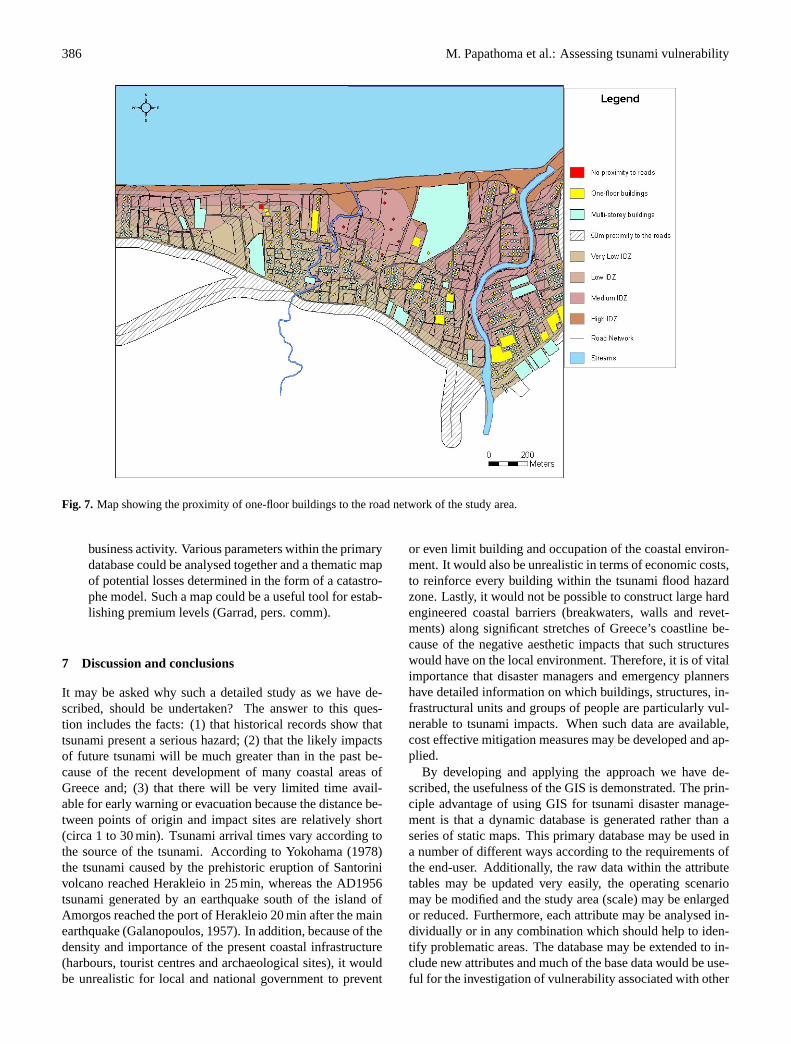
density change with time of year (e.g. hospitals and ho-tels) (Figs. 5 and 6)? By comparing Figs. 5 and 6, itis clear that during the summer the coast (open spaces,camping sites, hotels and restaurants) are densely popu-lated. Disaster managers have to make sure that accessroads to the beaches are not blocked. Conversely, dur-ing the winter, the same area has a very low populationdensity. In the winter however, the highlighted build-ings (schools and kindergartens) are densely populatedand in the summer they are empty. Disaster managerswill also be interested in knowing which buildings willhave particularly vulnerable populations (e.g. schools,hospitals and nursing homes). Where should emergencyshelters be located and which public access routes androads should be selected for safe evacuation? Whichbuildings do not offer the opportunity for vertical evac-uation? Figure 7 shows the locations of single storybuildings and their proximity to the road network of thestudy area. Approximately 30% of all buildings withinthe inundation zone are single floor buildings and 11 ofthem are located more than 50 m from the road network.This means that a significant proportion of the popula-tion within the area are especially vulnerable. After anytsunami, the rescue teams should pay particular atten-tion to these buildings, as they are where large numbersof casualties and dead may be located. The distribu-tion of these buildings is generally random. The map
also shows that not all the one-floor buildings have ac-cess to a road leading to higher ground. For this reasonthe buildings located in the northern part of the area be-tween the two rivers are particularly vulnerable. Onceagain, the primary database may be interrogated to pro-duce a series of thematic maps to investigate such ques-tions.
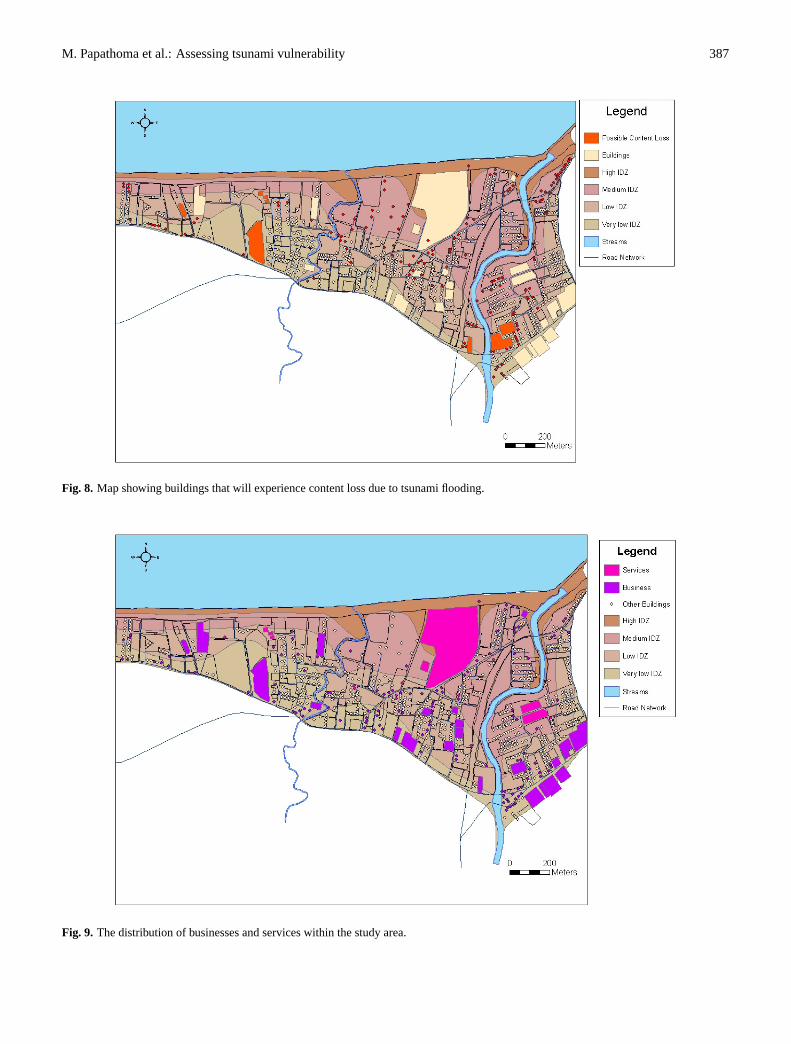
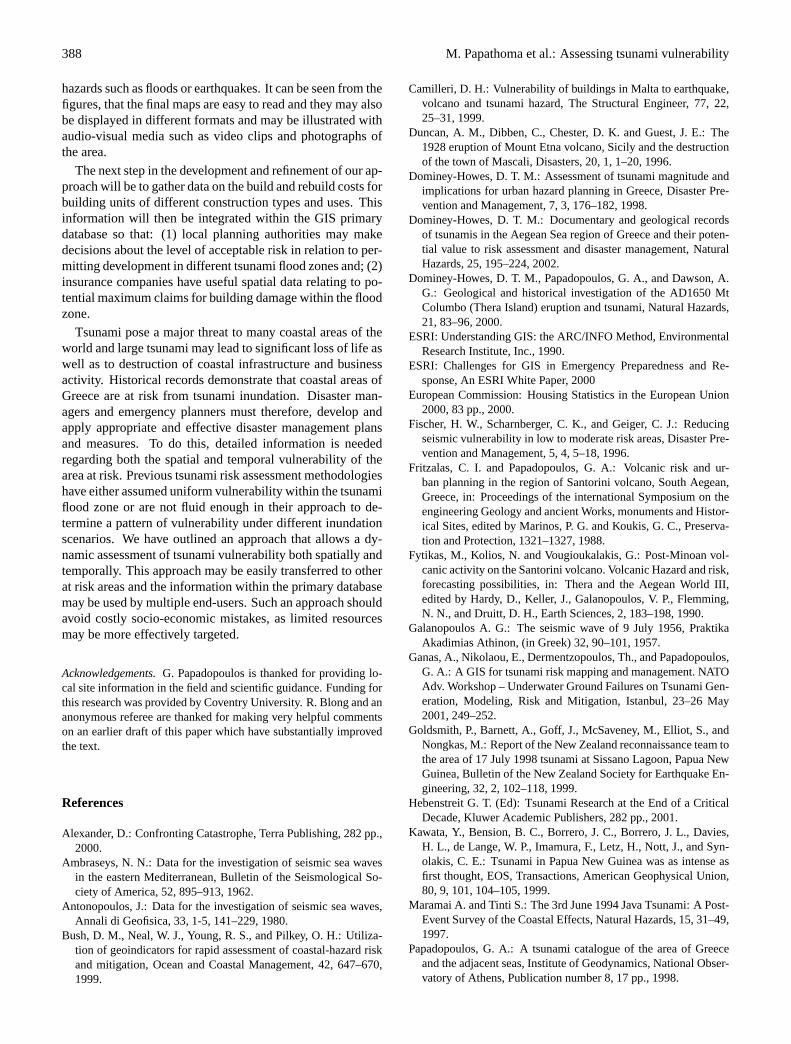
• The Insurance Companies– Insurance companies willbe interested in questions such as: what is the potentiallevel of claims for a particular portfolio of insured assetsin a specific location? What levels of premiums shouldbe set for buildings, contents loss and business interrup-tion loss insurance in particular areas (Fig. 8)? Whatwould be the level and duration of business interruptionlosses that would have to be paid out in the event of amajor tsunami (Fig. 9)? Figure 8 shows those buildingsthat are at a high risk of experiencing significant con-tents loss (158 buildings). This selection was based on acombination of the characteristics of buildings concern-ing the nature of the ground floor and the surroundings(Table 3). It is these buildings that are likely to makelarge insurance claims. However, from Fig. 8 it can beseen that there are not many buildings that fall in to thiscategory. In Fig. 9 the distribution of businesses withineach of the ID zones is shown. 10% of businesses arelocated within the high ID zone and as such are highlyvulnerable to damage, contents loss and interruption to
M. Papathoma et al.: Assessing tsunami vulnerability 385
Fig. 5. The population density within the study area during the day in the summer.
Fig. 6. The population density within the study area during the day in the winter.
386 M. Papathoma et al.: Assessing tsunami vulnerability
Fig. 7. Map showing the proximity of one-floor buildings to the road network of the study area.
business activity. Various parameters within the primarydatabase could be analysed together and a thematic mapof potential losses determined in the form of a catastro-phe model. Such a map could be a useful tool for estab-lishing premium levels (Garrad, pers. comm).
7 Discussion and conclusions
It may be asked why such a detailed study as we have de-scribed, should be undertaken? The answer to this ques-tion includes the facts: (1) that historical records show thattsunami present a serious hazard; (2) that the likely impactsof future tsunami will be much greater than in the past be-cause of the recent development of many coastal areas ofGreece and; (3) that there will be very limited time avail-able for early warning or evacuation because the distance be-tween points of origin and impact sites are relatively short(circa 1 to 30 min). Tsunami arrival times vary according tothe source of the tsunami. According to Yokohama (1978)the tsunami caused by the prehistoric eruption of Santorinivolcano reached Herakleio in 25 min, whereas the AD1956tsunami generated by an earthquake south of the island ofAmorgos reached the port of Herakleio 20 min after the mainearthquake (Galanopoulos, 1957). In addition, because of thedensity and importance of the present coastal infrastructure(harbours, tourist centres and archaeological sites), it wouldbe unrealistic for local and national government to prevent
or even limit building and occupation of the coastal environ-ment. It would also be unrealistic in terms of economic costs,to reinforce every building within the tsunami flood hazardzone. Lastly, it would not be possible to construct large hardengineered coastal barriers (breakwaters, walls and revet-ments) along significant stretches of Greece’s coastline be-cause of the negative aesthetic impacts that such structureswould have on the local environment. Therefore, it is of vitalimportance that disaster managers and emergency plannershave detailed information on which buildings, structures, in-frastructural units and groups of people are particularly vul-nerable to tsunami impacts. When such data are available,cost effective mitigation measures may be developed and ap-plied.
By developing and applying the approach we have de-scribed, the usefulness of the GIS is demonstrated. The prin-ciple advantage of using GIS for tsunami disaster manage-ment is that a dynamic database is generated rather than aseries of static maps. This primary database may be used ina number of different ways according to the requirements ofthe end-user. Additionally, the raw data within the attributetables may be updated very easily, the operating scenariomay be modified and the study area (scale) may be enlargedor reduced. Furthermore, each attribute may be analysed in-dividually or in any combination which should help to iden-tify problematic areas. The database may be extended to in-clude new attributes and much of the base data would be use-ful for the investigation of vulnerability associated with other
M. Papathoma et al.: Assessing tsunami vulnerability 387
Fig. 8. Map showing buildings that will experience content loss due to tsunami flooding.
Fig. 9. The distribution of businesses and services within the study area.
388 M. Papathoma et al.: Assessing tsunami vulnerability
hazards such as floods or earthquakes. It can be seen from thefigures, that the final maps are easy to read and they may alsobe displayed in different formats and may be illustrated withaudio-visual media such as video clips and photographs ofthe area.
The next step in the development and refinement of our ap-proach will be to gather data on the build and rebuild costs forbuilding units of different construction types and uses. Thisinformation will then be integrated within the GIS primarydatabase so that: (1) local planning authorities may makedecisions about the level of acceptable risk in relation to per-mitting development in different tsunami flood zones and; (2)insurance companies have useful spatial data relating to po-tential maximum claims for building damage within the floodzone.
Tsunami pose a major threat to many coastal areas of theworld and large tsunami may lead to significant loss of life aswell as to destruction of coastal infrastructure and businessactivity. Historical records demonstrate that coastal areas ofGreece are at risk from tsunami inundation. Disaster man-agers and emergency planners must therefore, develop andapply appropriate and effective disaster management plansand measures. To do this, detailed information is neededregarding both the spatial and temporal vulnerability of thearea at risk. Previous tsunami risk assessment methodologieshave either assumed uniform vulnerability within the tsunamiflood zone or are not fluid enough in their approach to de-termine a pattern of vulnerability under different inundationscenarios. We have outlined an approach that allows a dy-namic assessment of tsunami vulnerability both spatially andtemporally. This approach may be easily transferred to otherat risk areas and the information within the primary databasemay be used by multiple end-users. Such an approach shouldavoid costly socio-economic mistakes, as limited resourcesmay be more effectively targeted.
Acknowledgements.G. Papadopoulos is thanked for providing lo-cal site information in the field and scientific guidance. Funding forthis research was provided by Coventry University. R. Blong and ananonymous referee are thanked for making very helpful commentson an earlier draft of this paper which have substantially improvedthe text.
References
Alexander, D.: Confronting Catastrophe, Terra Publishing, 282 pp.,2000.
Ambraseys, N. N.: Data for the investigation of seismic sea wavesin the eastern Mediterranean, Bulletin of the Seismological So-ciety of America, 52, 895–913, 1962.
Antonopoulos, J.: Data for the investigation of seismic sea waves,Annali di Geofisica, 33, 1-5, 141–229, 1980.
Bush, D. M., Neal, W. J., Young, R. S., and Pilkey, O. H.: Utiliza-tion of geoindicators for rapid assessment of coastal-hazard riskand mitigation, Ocean and Coastal Management, 42, 647–670,1999.
Camilleri, D. H.: Vulnerability of buildings in Malta to earthquake,volcano and tsunami hazard, The Structural Engineer, 77, 22,25–31, 1999.
Duncan, A. M., Dibben, C., Chester, D. K. and Guest, J. E.: The1928 eruption of Mount Etna volcano, Sicily and the destructionof the town of Mascali, Disasters, 20, 1, 1–20, 1996.
Dominey-Howes, D. T. M.: Assessment of tsunami magnitude andimplications for urban hazard planning in Greece, Disaster Pre-vention and Management, 7, 3, 176–182, 1998.
Dominey-Howes, D. T. M.: Documentary and geological recordsof tsunamis in the Aegean Sea region of Greece and their poten-tial value to risk assessment and disaster management, NaturalHazards, 25, 195–224, 2002.
Dominey-Howes, D. T. M., Papadopoulos, G. A., and Dawson, A.G.: Geological and historical investigation of the AD1650 MtColumbo (Thera Island) eruption and tsunami, Natural Hazards,21, 83–96, 2000.
ESRI: Understanding GIS: the ARC/INFO Method, EnvironmentalResearch Institute, Inc., 1990.
ESRI: Challenges for GIS in Emergency Preparedness and Re-sponse, An ESRI White Paper, 2000
European Commission: Housing Statistics in the European Union2000, 83 pp., 2000.
Fischer, H. W., Scharnberger, C. K., and Geiger, C. J.: Reducingseismic vulnerability in low to moderate risk areas, Disaster Pre-vention and Management, 5, 4, 5–18, 1996.
Fritzalas, C. I. and Papadopoulos, G. A.: Volcanic risk and ur-ban planning in the region of Santorini volcano, South Aegean,Greece, in: Proceedings of the international Symposium on theengineering Geology and ancient Works, monuments and Histor-ical Sites, edited by Marinos, P. G. and Koukis, G. C., Preserva-tion and Protection, 1321–1327, 1988.
Fytikas, M., Kolios, N. and Vougioukalakis, G.: Post-Minoan vol-canic activity on the Santorini volcano. Volcanic Hazard and risk,forecasting possibilities, in: Thera and the Aegean World III,edited by Hardy, D., Keller, J., Galanopoulos, V. P., Flemming,N. N., and Druitt, D. H., Earth Sciences, 2, 183–198, 1990.
Galanopoulos A. G.: The seismic wave of 9 July 1956, PraktikaAkadimias Athinon, (in Greek) 32, 90–101, 1957.
Ganas, A., Nikolaou, E., Dermentzopoulos, Th., and Papadopoulos,G. A.: A GIS for tsunami risk mapping and management. NATOAdv. Workshop – Underwater Ground Failures on Tsunami Gen-eration, Modeling, Risk and Mitigation, Istanbul, 23–26 May2001, 249–252.
Goldsmith, P., Barnett, A., Goff, J., McSaveney, M., Elliot, S., andNongkas, M.: Report of the New Zealand reconnaissance team tothe area of 17 July 1998 tsunami at Sissano Lagoon, Papua NewGuinea, Bulletin of the New Zealand Society for Earthquake En-gineering, 32, 2, 102–118, 1999.
Hebenstreit G. T. (Ed): Tsunami Research at the End of a CriticalDecade, Kluwer Academic Publishers, 282 pp., 2001.
Kawata, Y., Bension, B. C., Borrero, J. C., Borrero, J. L., Davies,H. L., de Lange, W. P., Imamura, F., Letz, H., Nott, J., and Syn-olakis, C. E.: Tsunami in Papua New Guinea was as intense asfirst thought, EOS, Transactions, American Geophysical Union,80, 9, 101, 104–105, 1999.
Maramai A. and Tinti S.: The 3rd June 1994 Java Tsunami: A Post-Event Survey of the Coastal Effects, Natural Hazards, 15, 31–49,1997.
Papadopoulos, G. A.: A tsunami catalogue of the area of Greeceand the adjacent seas, Institute of Geodynamics, National Obser-vatory of Athens, Publication number 8, 17 pp., 1998.
M. Papathoma et al.: Assessing tsunami vulnerability 389
Papadopoulos, G. A. and Chalkis, B. J.: Tsunamis observed inGreece and the surrounding area from Antiquity up to the presenttimes, Marine Geology, 56, 309–317, 1984.
Papadopoulos, G. A. and Dermetzopoulos, T.: A tsunami risk as-sessment pilot study in Heraklion, Crete, Natural Hazards, 18,91–118, 1998.
Papazachos, B. C. and Papazachou, C.: The Earthquakes of Greece,Ziti Editions, Thessaloniki, 1997.
Papazachos, B. C., Koutitas, C., Hatzidimitriou, P. M., Karakostas,B. C., and Papaioannou, C. A.: Tsunami Hazard in Greece andthe surrounding area, Annales Geophysicae, 4B, 1, 79–90, 1986.
Scholten, J. and Stillwell, C. H.: Geographic Information Systems:the emerging requirements, in: Geographical Information sys-tems for Urban and Regional Planning, edited by Scholten, J.and Stillwell, C. H., 3–15, 1990.
Shimamoto, T., Tsutsumi, A., Kawamoto, E., Miyawaki, M, andSato, H.: Field survey report on tsunami disasters caused by the1993 Southwest Hokkaido earthquake, Pure and Applied Geo-physics, 144, 3/4, 665–692, 1995.
Shuto, N. and Matsutomi, H.: Field survey of the 1993 HokkaidoNansei-Oki earthquake tsunami, Pure and applied Geophysics,144, 3/4, 649–665, 1995.
Siebert, A.: Tools for Risk and Catastrophe Assessment in the In-
surance Industry, in: 20th Annual ESRI International User con-ference Proceedings 26–30 June, San Diego, USA, 2000.
Solomon, S. M. and Forbes, D. L.: Coastal hazards and associatedmanagement issues on South Pacific islands, Ocean and CoastalManagement, 42, 523–554, 1999.
Soloviev, S. L.: Tsunamis, The assessment and the mitigation ofearthquake and risk, UNESCO, 118–143, 1978.
Soloviev, S. L., Solovieva, O. N., Go, C. N., Kim, K. S., and Shchet-nikov, N. A.: Tsunamis in the Mediterranean Sea 2000BC –2000AD, Kluwer Academic Publishers, 237pp., 2000.
Synolakis, C. E., McCarthy, D., Titov, V. V., and Borrero, J.: Eval-uating the tsunami risk in California, California and the WorldOcean, 1225–1236, 1998.
Tsuji, Y., Matsutomi, H., Imamura, F., Takeo, M., Kawata, Y., Mat-suyama, M., Takahashi, T., and Harjadi, P.: Damage to coastalvillages due to the 1992 Flores Island earthquake tsunami, Pureand Applied Geophysics, 144, 3/4, 481–524, 1995.
Wood, N. and Stein, D.: A GIS-based vulnerability assessment ofPacific Northwest ports and harbours to tsunami hazards, in: ITS2001 Proceedings, Session 1, 1–13, 367–374, 2001.
Yokoyama, I.: The tsunami caused by the prehistoric eruptionof Thera, in: Thera and the Aegean World I, 2nd ScientificCongress, Santorini, Greece, 1978.
Related Documents


