International Journal of Environmental Research and Public Health Article Assessing the Water Quality of Lake Hawassa Ethiopia—Trophic State and Suitability for Anthropogenic Uses—Applying Common Water Quality Indices Semaria Moga Lencha 1,2, * , Jens Tränckner 1 and Mihret Dananto 2 Citation: Lencha, S.M.; Tränckner, J.; Dananto, M. Assessing the Water Quality of Lake Hawassa Ethiopia— Trophic State and Suitability for Anthropogenic Uses—Applying Common Water Quality Indices. Int. J. Environ. Res. Public Health 2021, 18, 8904. https://doi.org/10.3390/ ijerph18178904 Academic Editors: Soon-Jin Hwang, Young-Seuk Park and Ihn-Sil Kwak Received: 26 June 2021 Accepted: 19 August 2021 Published: 24 August 2021 Publisher’s Note: MDPI stays neutral with regard to jurisdictional claims in published maps and institutional affil- iations. Copyright: © 2021 by the authors. Licensee MDPI, Basel, Switzerland. This article is an open access article distributed under the terms and conditions of the Creative Commons Attribution (CC BY) license (https:// creativecommons.org/licenses/by/ 4.0/). 1 Faculty of Agriculture and Environmental Sciences, University of Rostock, 18051 Rostock, Germany; [email protected] 2 Faculty of Biosystems and Water Resource Engineering, Institute of Technology, Hawassa University, Hawassa P.O. Box 05, Ethiopia; [email protected] * Correspondence: [email protected]; Tel.: +491-521-121-2094 Abstract: The rapid growth of urbanization, industrialization and poor wastewater management practices have led to an intense water quality impediment in Lake Hawassa Watershed. This study has intended to engage the different water quality indices to categorize the suitability of the water quality of Lake Hawassa Watershed for anthropogenic uses and identify the trophic state of Lake Hawassa. Analysis of physicochemical water quality parameters at selected sites and periods was conducted throughout May 2020 to January 2021 to assess the present status of the Lake Watershed. In total, 19 monitoring sites and 21 physicochemical parameters were selected and analyzed in a laboratory. The Canadian council of ministries of the environment (CCME WQI) and weighted arithmetic (WA WQI) water quality indices have been used to cluster the water quality of Lake Hawassa Watershed and the Carlson trophic state index (TSI) has been employed to identify the trophic state of Lake Hawassa. The water quality is generally categorized as unsuitable for drinking, aquatic life and recreational purposes and it is excellent to unsuitable for irrigation depending on the sampling location and the applied indices. Specifically, in WA WQI, rivers were excellent for agricultural uses and Lake Hawassa was good for agricultural uses. However, the CCME WQI findings showed rivers were good for irrigation but lake Hawassa was marginal for agricultural use. Point sources were impaired for all envisioned purposes. The overall category of Lake Hawassa falls under a eutrophic state since the average TSI was 65.4 and the lake is phosphorous-deficient, having TN:TP of 31.1. The monitored point sources indicate that the city of Hawassa and its numerous industrial discharges are key polluters, requiring a fast and consequent set-up of an efficient wastewater infrastructure, accompanied by a rigorous monitoring of large point sources (e.g., industry, hospitals and hotels). In spite of the various efforts, the recovery of Lake Hawassa may take a long time as it is hydrologically closed. Therefore, to ensure safe drinking water supply, a central supply system according to World Health organization (WHO) standards also for the fringe inhabitants still using lake water is imperative. Introducing riparian buffer zones of vegetation and grasses can support the direct pollution alleviation measures and is helpful to reduce the dispersed pollution coming from the population using latrines. Additionally, integrating aeration systems like pumping atmospheric air into the bottom of the lake using solar energy panels or diffusers are effective mitigation measures that will improve the water quality of the lake. In parallel, the implementation and efficiency control of measures requires coordinated environmental monitoring with dedicated development targets. Keywords: water quality index; eutrophication; Lake Hawassa water quality; point sources; contam- inants; monitoring and assessment Int. J. Environ. Res. Public Health 2021, 18, 8904. https://doi.org/10.3390/ijerph18178904 https://www.mdpi.com/journal/ijerph

Welcome message from author
This document is posted to help you gain knowledge. Please leave a comment to let me know what you think about it! Share it to your friends and learn new things together.
Transcript
International Journal of
Environmental Research
and Public Health
Article
Assessing the Water Quality of Lake Hawassa Ethiopia—TrophicState and Suitability for Anthropogenic Uses—ApplyingCommon Water Quality Indices
Semaria Moga Lencha 1,2,* , Jens Tränckner 1 and Mihret Dananto 2
�����������������
Citation: Lencha, S.M.; Tränckner, J.;
Dananto, M. Assessing the Water
Quality of Lake Hawassa Ethiopia—
Trophic State and Suitability for
Anthropogenic Uses—Applying
Common Water Quality Indices.
Int. J. Environ. Res. Public Health 2021,
18, 8904. https://doi.org/10.3390/
ijerph18178904
Academic Editors: Soon-Jin Hwang,
Young-Seuk Park and Ihn-Sil Kwak
Received: 26 June 2021
Accepted: 19 August 2021
Published: 24 August 2021
Publisher’s Note: MDPI stays neutral
with regard to jurisdictional claims in
published maps and institutional affil-
iations.
Copyright: © 2021 by the authors.
Licensee MDPI, Basel, Switzerland.
This article is an open access article
distributed under the terms and
conditions of the Creative Commons
Attribution (CC BY) license (https://
creativecommons.org/licenses/by/
4.0/).
1 Faculty of Agriculture and Environmental Sciences, University of Rostock, 18051 Rostock, Germany;[email protected]
2 Faculty of Biosystems and Water Resource Engineering, Institute of Technology, Hawassa University,Hawassa P.O. Box 05, Ethiopia; [email protected]
* Correspondence: [email protected]; Tel.: +491-521-121-2094
Abstract: The rapid growth of urbanization, industrialization and poor wastewater managementpractices have led to an intense water quality impediment in Lake Hawassa Watershed. This studyhas intended to engage the different water quality indices to categorize the suitability of the waterquality of Lake Hawassa Watershed for anthropogenic uses and identify the trophic state of LakeHawassa. Analysis of physicochemical water quality parameters at selected sites and periods wasconducted throughout May 2020 to January 2021 to assess the present status of the Lake Watershed.In total, 19 monitoring sites and 21 physicochemical parameters were selected and analyzed in alaboratory. The Canadian council of ministries of the environment (CCME WQI) and weightedarithmetic (WA WQI) water quality indices have been used to cluster the water quality of LakeHawassa Watershed and the Carlson trophic state index (TSI) has been employed to identify thetrophic state of Lake Hawassa. The water quality is generally categorized as unsuitable for drinking,aquatic life and recreational purposes and it is excellent to unsuitable for irrigation depending onthe sampling location and the applied indices. Specifically, in WA WQI, rivers were excellent foragricultural uses and Lake Hawassa was good for agricultural uses. However, the CCME WQIfindings showed rivers were good for irrigation but lake Hawassa was marginal for agricultural use.Point sources were impaired for all envisioned purposes. The overall category of Lake Hawassafalls under a eutrophic state since the average TSI was 65.4 and the lake is phosphorous-deficient,having TN:TP of 31.1. The monitored point sources indicate that the city of Hawassa and itsnumerous industrial discharges are key polluters, requiring a fast and consequent set-up of anefficient wastewater infrastructure, accompanied by a rigorous monitoring of large point sources(e.g., industry, hospitals and hotels). In spite of the various efforts, the recovery of Lake Hawassamay take a long time as it is hydrologically closed. Therefore, to ensure safe drinking water supply, acentral supply system according to World Health organization (WHO) standards also for the fringeinhabitants still using lake water is imperative. Introducing riparian buffer zones of vegetation andgrasses can support the direct pollution alleviation measures and is helpful to reduce the dispersedpollution coming from the population using latrines. Additionally, integrating aeration systemslike pumping atmospheric air into the bottom of the lake using solar energy panels or diffusersare effective mitigation measures that will improve the water quality of the lake. In parallel, theimplementation and efficiency control of measures requires coordinated environmental monitoringwith dedicated development targets.
Keywords: water quality index; eutrophication; Lake Hawassa water quality; point sources; contam-inants; monitoring and assessment
Int. J. Environ. Res. Public Health 2021, 18, 8904. https://doi.org/10.3390/ijerph18178904 https://www.mdpi.com/journal/ijerph
Int. J. Environ. Res. Public Health 2021, 18, 8904 2 of 31
1. Introduction
Surface waters play the lion’s share in transportation and assimilation of municipaland industrial effluents and agricultural runoff; consequently, they are most prone to pollu-tants [1]. Industrialization on top of rapid population growth triggers land developmentalong a river basin, exerting greater pressure on water bodies by giving rise to waterpollution and ecological impediment [2].
Surface water pollution with chemical, physical and biological contaminants by an-thropogenic activities from the point and non-point sources is of great environmentalconsideration all over the world [3].
In Ethiopia, due to lack of access to improved water supply and sanitation, peopleare suffering from water communicable diseases that are associated with unsafe andinadequate water supply. Additionally, water quality problems are booming in watersources of the country that demand effective monitoring and evaluation for the properprotection of water sources from contamination [4]. A study conducted by Angello et al. [5]revealed that increased urbanization has prompted the opening of medium- to large-scale industries resulting in pollution of most surface water resources by the wastewaterreleased from different sources. Wastewater from residential areas, runoff from urban andagricultural activities near surface waters contribute a significant quantity of contaminants.Additionally, industrial effluents that are released directly with little or no treatment intosurface water bodies were one of the major pollution sources in Akaki river. Lake Hawassais one of the major Ethiopian Rift Valley Lakes basins and it is used for manifold purposeslike irrigation, human consumption by some city and rural inhabitants close to the city,recreation, livestock, watering and fish farming [6].
Studies showed a high amount of pesticides in water, sediments and fish species inLake Hawassa due to its exposure to effluents from factories, urban and agricultural runoff.As a result, the lake is contaminated and affects the biodiversity of the aquatic ecosystemincluding fish [7]. The growth and death of floating aquatic plants are supplementing thealgal growth and sediments that accumulates at the bottom of the lake and yield culturaleutrophication [8].
The impact on the lake is mainly due to anthropogenic activities in its catchment.Sanitation is a great concern. Most of the population, even in the inner part of the cityof Hawassa are using latrines. Larger buildings provide conventional flushing systemsbut without any wastewater treatment. Furthermore, industrial and commercial pollutionsources (i.e., BGI, Moha soft drinks, flour factory and ceramic factory) are known to releaseeffluents into streams or rivers that end up in the small marshy land after which Tikur-Wuha river got its name and fed Lake Hawassa. In addition, Hawassa Industrial park andthe Referral hospital are releasing their effluents directly to the lake. This is a danger tothe people that depend on rivers, streams and lake for domestic and other uses and to theexistence of marine species [9].
The study conducted by Zemede et al. [10] made use of different water quality indicesand discovered that the status of water quality of Lake Hawassa was under the hypertrophiccondition and generally unsuitable for all uses.
Evaluating the status of water quality from analytically determined data of parameterswith the international and national permissible values does not guarantee the wholevisualization of the water quality situation. Therefore, developing a sole value of WQI thatcan convey information more easily in a way that can be more rapidly understood than alist of large parameter values is vital [11].
The water quality index (WQI) is a very effective tool to integrate and deliver informa-tion regarding water quality to experts and the wider community [12] and is also used toassociate the water quality of different sources and monitoring sites [13]. By addressingusage criteria, the negative impact of environmental pollution becomes tangible. It isa unit-less number that combines information from manifold analytical data into a soleaggregate through a method that portrays the situation of water quality well for the publicand experts [14].
Int. J. Environ. Res. Public Health 2021, 18, 8904 3 of 31
Numerous indices had been established so far in various parts of the world to estimatewater quality status and pollution extents of the water bodies. Just to mention a few, theNational Sanitation Foundation (NSF) index Water quality index (NSF WQI) [15], CanadianCouncil of Ministries of the Environment Water Quality Index (CCME WQI) [16], OregonWater quality index (Oregon WQI) [13], Bascarón index [17], Fuzzy index [18], Boyacioglu’sindex [19], Weighted Arithmetic water quality index (WA WQI) [20] and many more. NSFWQI, CCME WQI, Oregon WQI and WA WQI are the most widely used techniques aroundthe globe [20].
To conduct all-inclusive water quality valuation for lakes besides the water quality in-dices approach, implementing the trophic state index approach to identify the productivityof the lake is mandatory. The Organization for Economic Cooperation and Developmentprovides specific criteria for temperate lakes in terms of the average annual values of totalphosphorus, chlorophyll a and Secchi depth [21]. The limitations of these criteria werethat the same lake could be assigned in one or another trophic class based on the appliedparameters. Studies showed the computation of trophic state ranking of lakes or reservoirsfrom variables like Total nitrogen (TN), Total phosphorous (TP) and phytoplankton massthat are responsible for eutrophication of lakes. Kratzer and Brezonik [22] established anindex for eutrophication based on TN from the Carlson index; whereas Boyle et al. [23]established a pH and dissolved oxygen-based index. Additionally, Hailin and Baoyin [24]also formulated an index that depends on Biochemical demand (BOD) by formulatingstatistical association between chlorophyll a (Chl-a), TP and TN. Köklüa and Alkıs [25]also established a new trophic level index using quality indicators that are known byaffecting eutrophication with limited applicability. The Carlson trophic status index (TSI)has long been established to evaluate the trophic state of lots of reservoirs and lakes andis determined using the procedures explained by Carlson [26]. Carlson trophic statusindex TSI has been commonly used approach-and separately estimated from total nitrogenconcentration, Secchi depth (SD), (chl-a) and total phosphorus concentration (TP) [27].
This study has, therefore, tried to elucidate the use of weighted average (WA), CCMEand TSI water quality indices to categorize the water quality of Lake Hawassa Watershedand identify the trophic state of Lake Hawassa.
2. Materials and Methods2.1. Study Area
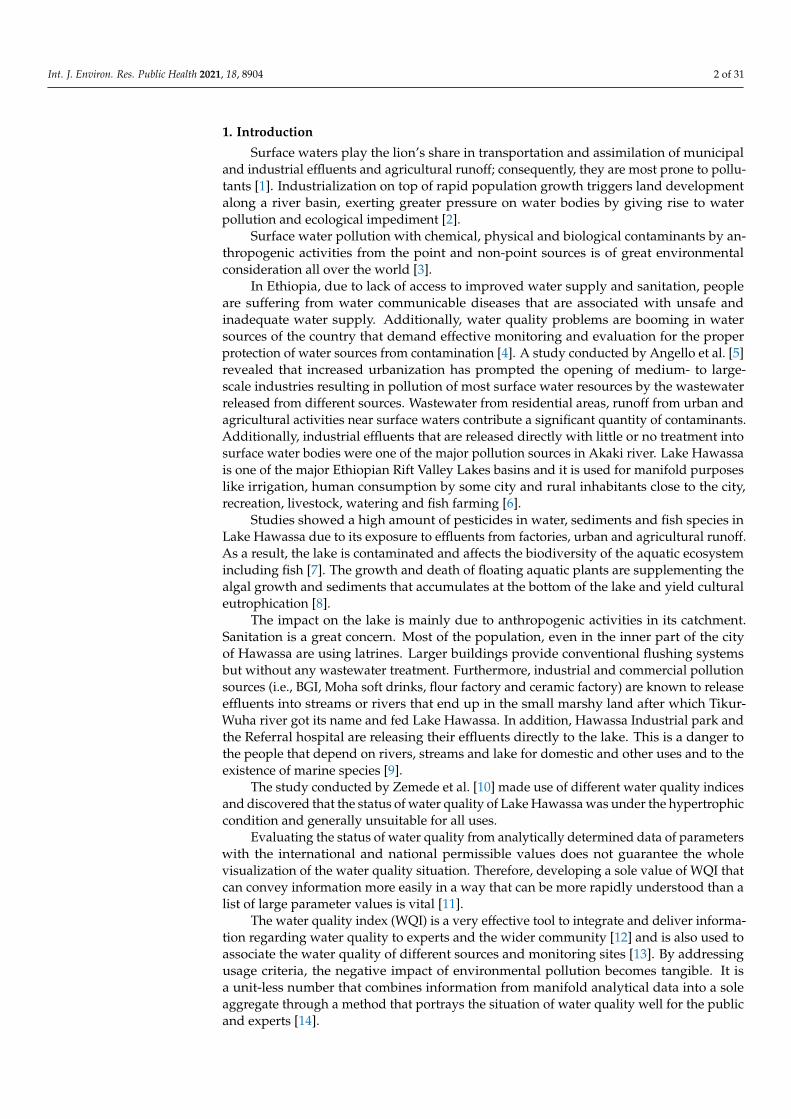
Lake Hawassa watershed is located in the center of the Rift Valley Lakes basin, betweenlatitudes of 6◦4′45′′ N to 7◦14′49′′ N and longitudes of 38◦16′34′′ E to 38◦43′26′′ E [28,29].Amongst the seven lakes in the Rift Valley Lakes basin, Lake Hawassa is located betweenthe latitude of 6◦33′–7◦33′ N and longitude of 38◦22′–38◦29′ E (Figure 1). The Lake Hawassawatershed is located in Oromiya and Sidama regional state, having a total area of 1407 km2
and 113 km2 of which is Lake surface area [30]. Streams from the eastern catchment flowto Lake Cheleleka and are drained by the Tikur-Wuha river that feeds the Lake Hawassa.This river water has been extensively affected by various point sources [31]. The lake hasno surface water outflow except evaporation and abstraction and it is used for commercialfishing and tourist destinations [32].
The months from April to October are wet and humid; the main rainy season isbetween July and September, having mean annual precipitation of about 955 mm. Themean minimum precipitation is 17.8 mm in December (dry season) and the mean maximumprecipitation is 119.8 mm in August (rainy season) [33]. The long-term mean annualtemperature is around 19 ◦C while the mean monthly evapotranspiration in the low landsranges from 39 mm in July to 100 mm in January [34].
Int. J. Environ. Res. Public Health 2021, 18, 8904 4 of 31Int. J. Environ. Res. Public Health 2021, 18, x 4 of 33
Figure 1. Location of Lake Hawassa Watershed and monitoring stations.
2.2. Sampling and Analysis of Monitoring Parameters Water and effluent samples were collected from rivers, point sources and different
monitoring points from Lake Hawassa Watershed depending on the Lakes exposure to anthropogenic activities. The coordinate of each sampling station was determined apply-ing GNSS.
In total 19 monitoring sites were selected purposively in close proximity to potential pollutants, accessibility, availability of point and non-point sources and level of disturb-ance where their effluents end up in the lake.
Four (4) monitoring sites selected from the eastern catchment of Lake Hawassa Wa-tershed that exclusively comprises rivers namely Wesha (MS1), Hallow (MS2), Wedessa (MS3) and Tikur-Wuha (MS6) river mouths of the respective sub-watersheds. Eleven (11) monitoring sites were evenly distributed along the entire course of Lake Hawassa for es-timation of the eutrophic status of the lake and water quality monitoring. Three (3) mon-itoring sites were selected from the industrial disposal site and one monitoring site is from the health care center as shown in Table 1 and Figure 1.
Table 1. Monitoring stations in Lake Hawassa Watershed.
Code Monitoring Sites Latitude (Y)
Longitude (X)
Altitude (Z)
MS1 Wesha river 783,404 457,401 1746 MS2 Hallo river 779,736 457,149 1724 MS3 Wedessa river 774,914 454,915 1764 MS4 BGI effluent discharge site 776,594 446,537 1686 MS5 Moha soft drinks factory 776,274 446,603 1671 MS6 Tikur-Wuha river 783,685 445,564 1677 MS7 Amora-Gedel (Fish market) 778,279 439,983 1676 MS8 Amora-Gedel (Gudumale) 778,862 439,661 1672 MS9 Nearby Lewi resort 779,941 439,791 1683
Figure 1. Location of Lake Hawassa Watershed and monitoring stations.
2.2. Sampling and Analysis of Monitoring Parameters
Water and effluent samples were collected from rivers, point sources and differentmonitoring points from Lake Hawassa Watershed depending on the Lakes exposureto anthropogenic activities. The coordinate of each sampling station was determinedapplying GNSS.
In total 19 monitoring sites were selected purposively in close proximity to potentialpollutants, accessibility, availability of point and non-point sources and level of disturbancewhere their effluents end up in the lake.
Four (4) monitoring sites selected from the eastern catchment of Lake Hawassa Wa-tershed that exclusively comprises rivers namely Wesha (MS1), Hallow (MS2), Wedessa(MS3) and Tikur-Wuha (MS6) river mouths of the respective sub-watersheds. Eleven (11)monitoring sites were evenly distributed along the entire course of Lake Hawassa forestimation of the eutrophic status of the lake and water quality monitoring. Three (3)monitoring sites were selected from the industrial disposal site and one monitoring site isfrom the health care center as shown in Table 1 and Figure 1.
Samples of lakes and rivers were collected from different depths and intervals ofthe entire water column and mixed to make the sample composite. Referral hospital,Hawassa Industrial park, St. George Brewery industry (BGI) and Moha soft drinks factoryeffluents were collected from their respective oxidation ponds and discharge points usingpre-cleaned 2 L polyethylene plastic bottles sterilized for Biochemical oxygen demand(BOD5) and Chemical oxygen demand (COD). The physicochemical and biological proper-ties of water quality parameters can be monitored based on the required water parametersof concern. BOD and COD were selected to assess the presence of organic pollution. TN, TP,Nitrate (NO3
) and Soluble reactive phosphorous (SRP) were selected to monitor non-pointsources pollution from agricultural land, urban drainage and residential lawns and theuse of inorganic nitrogen fertilizers. Magnesium ion (Mg+2), Calcium ion (Ca+2), Sodiumion (Na+), Potassium ion (K+) and their empirical values Sodium Adsorption Ratio (SAR),Kelly’s ratio (KR), Magnesium Adsorption ratio (MAR) and Soluble sodium percentage
Int. J. Environ. Res. Public Health 2021, 18, 8904 5 of 31
(SSP) were selected to test the suitability of water for agricultural use and Mg+2, Ca+2, Na+,K+ were also selected to monitor water suitability for drinking purposes. Nitrite (NO2
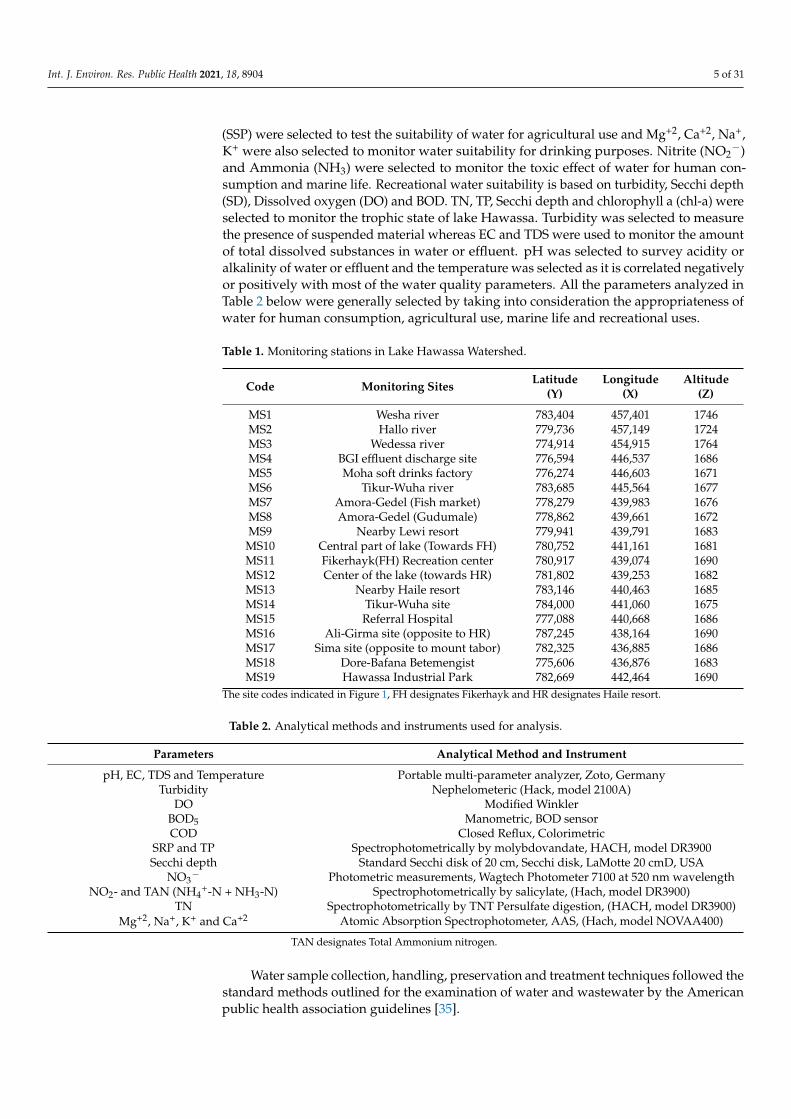
−)and Ammonia (NH3) were selected to monitor the toxic effect of water for human con-sumption and marine life. Recreational water suitability is based on turbidity, Secchi depth(SD), Dissolved oxygen (DO) and BOD. TN, TP, Secchi depth and chlorophyll a (chl-a) wereselected to monitor the trophic state of lake Hawassa. Turbidity was selected to measurethe presence of suspended material whereas EC and TDS were used to monitor the amountof total dissolved substances in water or effluent. pH was selected to survey acidity oralkalinity of water or effluent and the temperature was selected as it is correlated negativelyor positively with most of the water quality parameters. All the parameters analyzed inTable 2 below were generally selected by taking into consideration the appropriateness ofwater for human consumption, agricultural use, marine life and recreational uses.
Table 1. Monitoring stations in Lake Hawassa Watershed.
Code Monitoring Sites Latitude(Y)
Longitude(X)
Altitude(Z)
MS1 Wesha river 783,404 457,401 1746MS2 Hallo river 779,736 457,149 1724MS3 Wedessa river 774,914 454,915 1764MS4 BGI effluent discharge site 776,594 446,537 1686MS5 Moha soft drinks factory 776,274 446,603 1671MS6 Tikur-Wuha river 783,685 445,564 1677MS7 Amora-Gedel (Fish market) 778,279 439,983 1676MS8 Amora-Gedel (Gudumale) 778,862 439,661 1672MS9 Nearby Lewi resort 779,941 439,791 1683MS10 Central part of lake (Towards FH) 780,752 441,161 1681MS11 Fikerhayk(FH) Recreation center 780,917 439,074 1690MS12 Center of the lake (towards HR) 781,802 439,253 1682MS13 Nearby Haile resort 783,146 440,463 1685MS14 Tikur-Wuha site 784,000 441,060 1675MS15 Referral Hospital 777,088 440,668 1686MS16 Ali-Girma site (opposite to HR) 787,245 438,164 1690MS17 Sima site (opposite to mount tabor) 782,325 436,885 1686MS18 Dore-Bafana Betemengist 775,606 436,876 1683MS19 Hawassa Industrial Park 782,669 442,464 1690
The site codes indicated in Figure 1, FH designates Fikerhayk and HR designates Haile resort.
Table 2. Analytical methods and instruments used for analysis.
Parameters Analytical Method and Instrument
pH, EC, TDS and Temperature Portable multi-parameter analyzer, Zoto, GermanyTurbidity Nephelometeric (Hack, model 2100A)
DO Modified WinklerBOD5 Manometric, BOD sensorCOD Closed Reflux, Colorimetric
SRP and TP Spectrophotometrically by molybdovandate, HACH, model DR3900Secchi depth Standard Secchi disk of 20 cm, Secchi disk, LaMotte 20 cmD, USA
NO3− Photometric measurements, Wagtech Photometer 7100 at 520 nm wavelength
NO2- and TAN (NH4+-N + NH3-N) Spectrophotometrically by salicylate, (Hach, model DR3900)
TN Spectrophotometrically by TNT Persulfate digestion, (HACH, model DR3900)Mg+2, Na+, K+ and Ca+2 Atomic Absorption Spectrophotometer, AAS, (Hach, model NOVAA400)
TAN designates Total Ammonium nitrogen.
Water sample collection, handling, preservation and treatment techniques followed thestandard methods outlined for the examination of water and wastewater by the Americanpublic health association guidelines [35].
Int. J. Environ. Res. Public Health 2021, 18, 8904 6 of 31
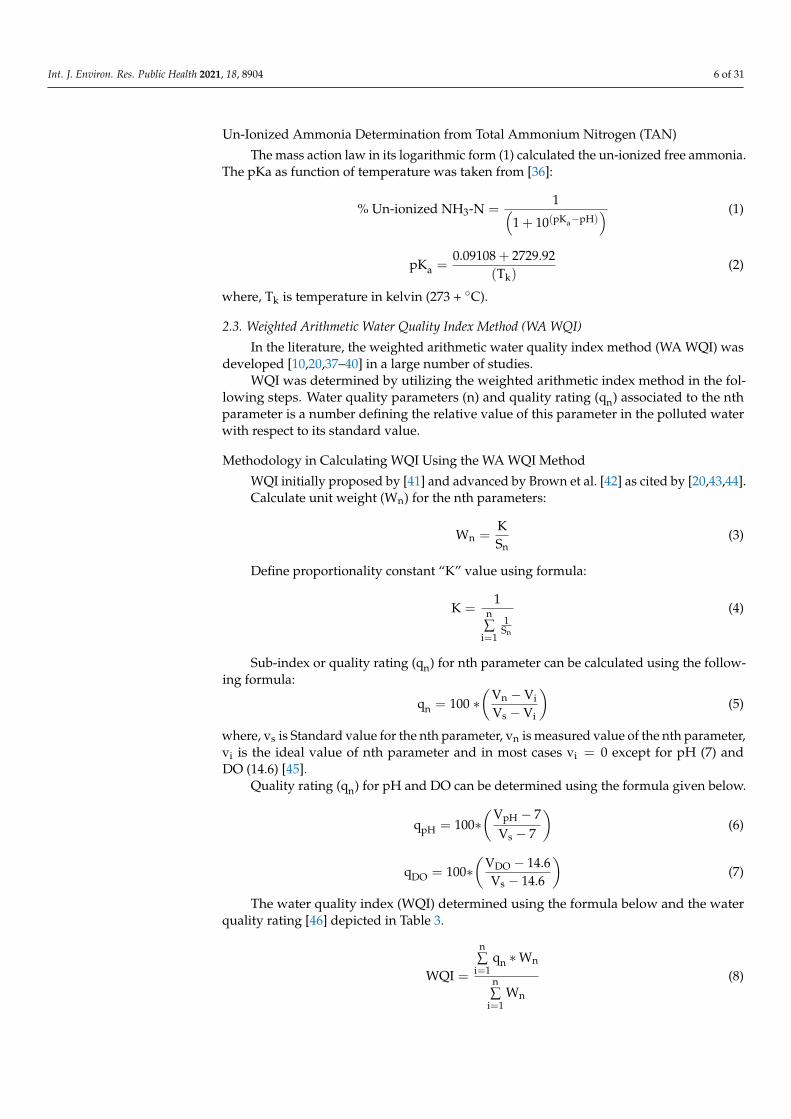
Un-Ionized Ammonia Determination from Total Ammonium Nitrogen (TAN)
The mass action law in its logarithmic form (1) calculated the un-ionized free ammonia.The pKa as function of temperature was taken from [36]:
% Un-ionized NH3-N =1(
1 + 10(pKa−pH)) (1)
pKa =0.09108 + 2729.92
(Tk)(2)
where, Tk is temperature in kelvin (273 + ◦C).
2.3. Weighted Arithmetic Water Quality Index Method (WA WQI)
In the literature, the weighted arithmetic water quality index method (WA WQI) wasdeveloped [10,20,37–40] in a large number of studies.
WQI was determined by utilizing the weighted arithmetic index method in the fol-lowing steps. Water quality parameters (n) and quality rating (qn) associated to the nthparameter is a number defining the relative value of this parameter in the polluted waterwith respect to its standard value.
Methodology in Calculating WQI Using the WA WQI Method
WQI initially proposed by [41] and advanced by Brown et al. [42] as cited by [20,43,44].Calculate unit weight (Wn) for the nth parameters:
Wn =KSn
(3)
Define proportionality constant “K” value using formula:
K =1
n∑
i=1
1Sn
(4)
Sub-index or quality rating (qn) for nth parameter can be calculated using the follow-ing formula:
qn = 100 ∗(
Vn −Vi
Vs −Vi
)(5)
where, vs is Standard value for the nth parameter, vn is measured value of the nth parameter,vi is the ideal value of nth parameter and in most cases vi = 0 except for pH (7) andDO (14.6) [45].
Quality rating (qn) for pH and DO can be determined using the formula given below.
qpH = 100∗(
VpH − 7Vs − 7
)(6)
qDO = 100∗(
VDO − 14.6Vs − 14.6
)(7)
The water quality index (WQI) determined using the formula below and the waterquality rating [46] depicted in Table 3.
WQI =
n∑
i=1qn ∗Wn
n∑
i=1Wn
(8)
Int. J. Environ. Res. Public Health 2021, 18, 8904 7 of 31
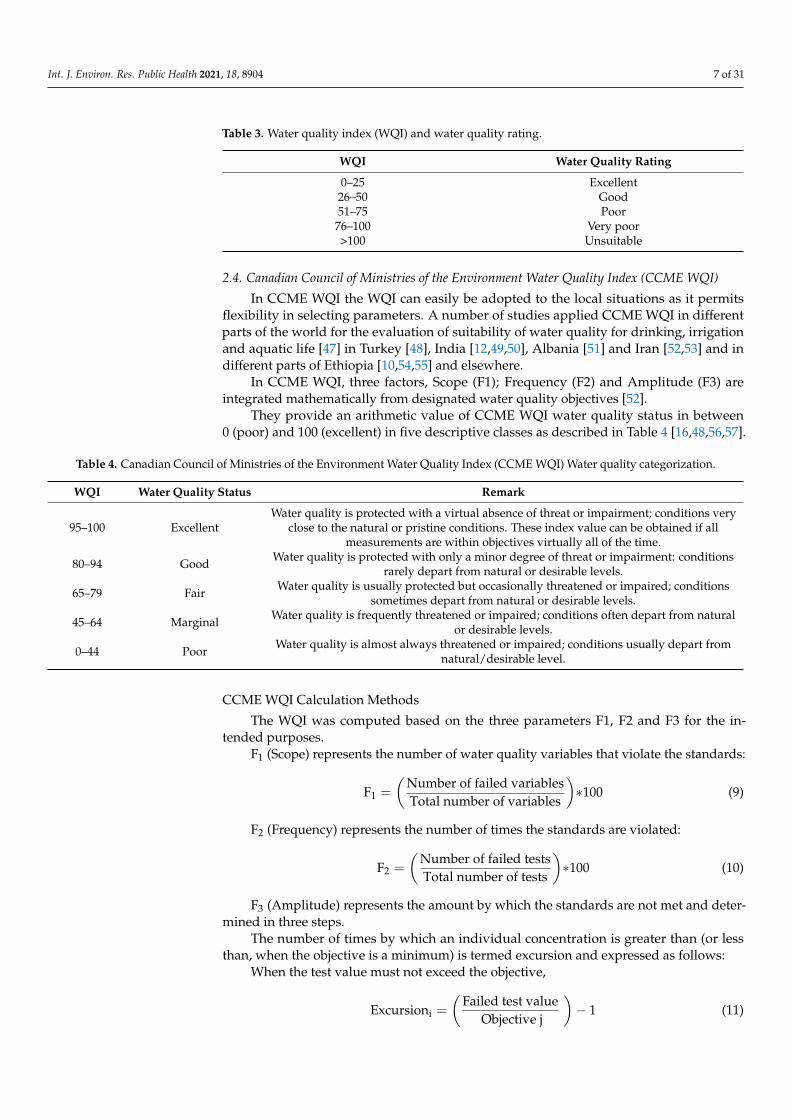
Table 3. Water quality index (WQI) and water quality rating.
WQI Water Quality Rating
0–25 Excellent26–50 Good51–75 Poor76–100 Very poor>100 Unsuitable
2.4. Canadian Council of Ministries of the Environment Water Quality Index (CCME WQI)
In CCME WQI the WQI can easily be adopted to the local situations as it permitsflexibility in selecting parameters. A number of studies applied CCME WQI in differentparts of the world for the evaluation of suitability of water quality for drinking, irrigationand aquatic life [47] in Turkey [48], India [12,49,50], Albania [51] and Iran [52,53] and indifferent parts of Ethiopia [10,54,55] and elsewhere.
In CCME WQI, three factors, Scope (F1); Frequency (F2) and Amplitude (F3) areintegrated mathematically from designated water quality objectives [52].
They provide an arithmetic value of CCME WQI water quality status in between0 (poor) and 100 (excellent) in five descriptive classes as described in Table 4 [16,48,56,57].
Table 4. Canadian Council of Ministries of the Environment Water Quality Index (CCME WQI) Water quality categorization.
WQI Water Quality Status Remark
95–100 ExcellentWater quality is protected with a virtual absence of threat or impairment; conditions very
close to the natural or pristine conditions. These index value can be obtained if allmeasurements are within objectives virtually all of the time.
80–94 Good Water quality is protected with only a minor degree of threat or impairment: conditionsrarely depart from natural or desirable levels.
65–79 Fair Water quality is usually protected but occasionally threatened or impaired; conditionssometimes depart from natural or desirable levels.
45–64 Marginal Water quality is frequently threatened or impaired; conditions often depart from naturalor desirable levels.
0–44 Poor Water quality is almost always threatened or impaired; conditions usually depart fromnatural/desirable level.
CCME WQI Calculation Methods
The WQI was computed based on the three parameters F1, F2 and F3 for the in-tended purposes.
F1 (Scope) represents the number of water quality variables that violate the standards:
F1 =
(Number of failed variablesTotal number of variables
)∗100 (9)
F2 (Frequency) represents the number of times the standards are violated:
F2 =
(Number of failed testsTotal number of tests
)∗100 (10)
F3 (Amplitude) represents the amount by which the standards are not met and deter-mined in three steps.
The number of times by which an individual concentration is greater than (or lessthan, when the objective is a minimum) is termed excursion and expressed as follows:
When the test value must not exceed the objective,
Excursioni =
(Failed test value
Objective j
)− 1 (11)
Int. J. Environ. Res. Public Health 2021, 18, 8904 8 of 31
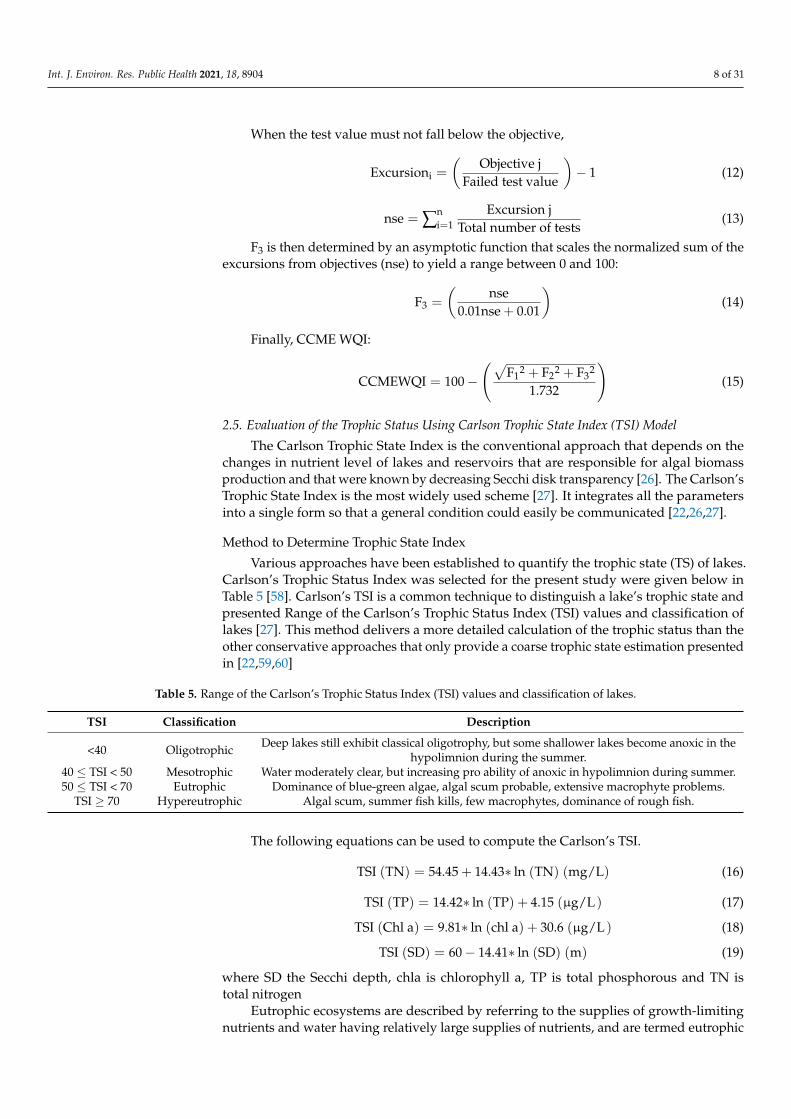
When the test value must not fall below the objective,
Excursioni =
(Objective j
Failed test value
)− 1 (12)
nse = ∑ni=1
Excursion jTotal number of tests
(13)
F3 is then determined by an asymptotic function that scales the normalized sum of theexcursions from objectives (nse) to yield a range between 0 and 100:
F3 =
(nse
0.01nse + 0.01
)(14)
Finally, CCME WQI:
CCMEWQI = 100−(√
F12 + F22 + F32
1.732
)(15)
2.5. Evaluation of the Trophic Status Using Carlson Trophic State Index (TSI) Model
The Carlson Trophic State Index is the conventional approach that depends on thechanges in nutrient level of lakes and reservoirs that are responsible for algal biomassproduction and that were known by decreasing Secchi disk transparency [26]. The Carlson’sTrophic State Index is the most widely used scheme [27]. It integrates all the parametersinto a single form so that a general condition could easily be communicated [22,26,27].
Method to Determine Trophic State Index
Various approaches have been established to quantify the trophic state (TS) of lakes.Carlson’s Trophic Status Index was selected for the present study were given below inTable 5 [58]. Carlson’s TSI is a common technique to distinguish a lake’s trophic state andpresented Range of the Carlson’s Trophic Status Index (TSI) values and classification oflakes [27]. This method delivers a more detailed calculation of the trophic status than theother conservative approaches that only provide a coarse trophic state estimation presentedin [22,59,60]
Table 5. Range of the Carlson’s Trophic Status Index (TSI) values and classification of lakes.
TSI Classification Description
<40 Oligotrophic Deep lakes still exhibit classical oligotrophy, but some shallower lakes become anoxic in thehypolimnion during the summer.
40 ≤ TSI < 50 Mesotrophic Water moderately clear, but increasing pro ability of anoxic in hypolimnion during summer.50 ≤ TSI < 70 Eutrophic Dominance of blue-green algae, algal scum probable, extensive macrophyte problems.
TSI ≥ 70 Hypereutrophic Algal scum, summer fish kills, few macrophytes, dominance of rough fish.
The following equations can be used to compute the Carlson’s TSI.
TSI (TN) = 54.45 + 14.43∗ ln (TN) (mg/L) (16)
TSI (TP) = 14.42∗ ln (TP) + 4.15 (µg/L ) (17)
TSI (Chl a) = 9.81∗ ln (chl a) + 30.6 (µg/L ) (18)
TSI (SD) = 60− 14.41∗ ln (SD) (m) (19)
where SD the Secchi depth, chla is chlorophyll a, TP is total phosphorous and TN istotal nitrogen
Eutrophic ecosystems are described by referring to the supplies of growth-limitingnutrients and water having relatively large supplies of nutrients, and are termed eutrophic
Int. J. Environ. Res. Public Health 2021, 18, 8904 9 of 31
(well nourished), poor nutrient supplies (oligotrophic) and intermediate nutrient suppliesare termed mesotrophic They categorize the trophic status of the lake based on the to-tal nitrogen (TN) and total phosphorous (TP) loads in Table 6 that are supposed to beaccumulated in the lake bottom [61–63].
Table 6. Trophic classification of lakes based on total nitrogen and total phosphorous.
Trophic State TN (mg/L) TP (mg/L)
Oligotrophic <0.35 <0.01Mesotrophic 0.35 ≤ TN < 0.65 0.01 ≤ TP < 0.03
Eutrophic 0.65 ≤ TN < 1.2 0.03 ≤ TP < 0.1Hypertrophic TN > 1.2 TP > 0.1
3. Result and Discussion3.1. Water Quality Status for Envisioned Purposes
Selection of parameters is imperative for calculation of WQI and depends on theintended use. A selection of large number of parameters broaden the water quality index,pH, EC, TDS, turbidity, NH3, NH3-N, NO2-, NO3
−, NO3-N, DO, BOD, COD, Mg+2, Ca+2,Na+, K+, temperature, SAR, KR, MAR, SSP and SD are used to evaluate the suitability ofLake Hawassa Watershed for drinking, irrigation uses, recreation and aquatic life [46].
3.1.1. pH
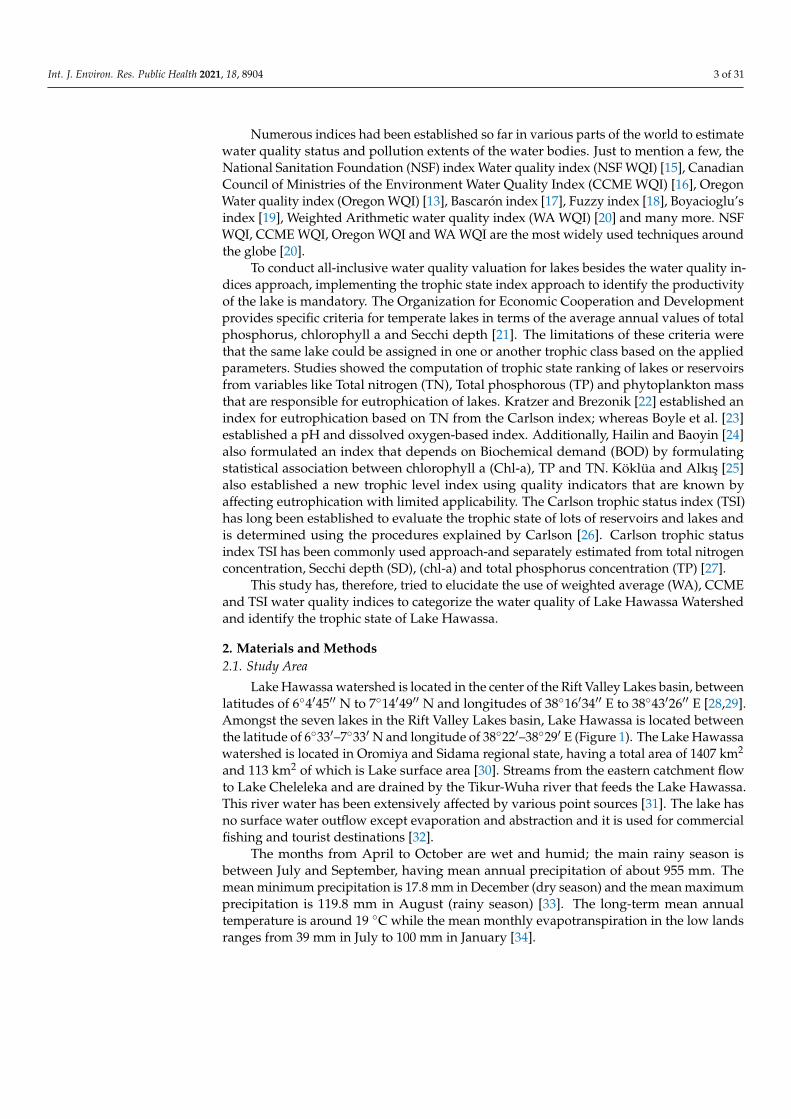
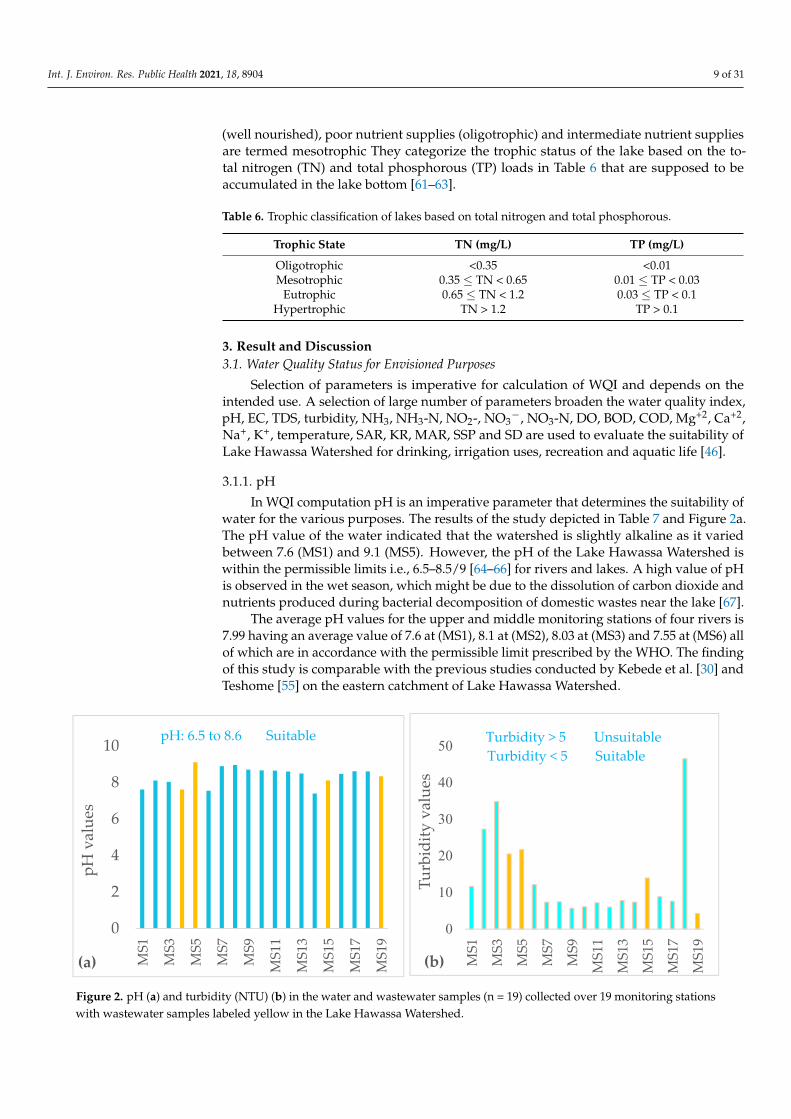
In WQI computation pH is an imperative parameter that determines the suitability ofwater for the various purposes. The results of the study depicted in Table 7 and Figure 2a.The pH value of the water indicated that the watershed is slightly alkaline as it variedbetween 7.6 (MS1) and 9.1 (MS5). However, the pH of the Lake Hawassa Watershed iswithin the permissible limits i.e., 6.5–8.5/9 [64–66] for rivers and lakes. A high value of pHis observed in the wet season, which might be due to the dissolution of carbon dioxide andnutrients produced during bacterial decomposition of domestic wastes near the lake [67].
The average pH values for the upper and middle monitoring stations of four rivers is7.99 having an average value of 7.6 at (MS1), 8.1 at (MS2), 8.03 at (MS3) and 7.55 at (MS6) allof which are in accordance with the permissible limit prescribed by the WHO. The findingof this study is comparable with the previous studies conducted by Kebede et al. [30] andTeshome [55] on the eastern catchment of Lake Hawassa Watershed.
Int. J. Environ. Res. Public Health 2021, 18, x 12 of 33
Figure 2. pH (a) and turbidity (NTU) (b) in the water and wastewater samples (n = 19) col-lected over 19 monitoring stations with wastewater samples labeled yellow in the Lake Ha-wassa Watershed.
The average pH values for the upper and middle monitoring stations of four riv-ers is 7.99 having an average value of 7.6 at (MS1), 8.1 at (MS2), 8.03 at (MS3) and 7.55 at (MS6) all of which are in accordance with the permissible limit prescribed by the WHO. The finding of this study is comparable with the previous studies conducted by Kebede et al. [30] and Teshome [55] on the eastern catchment of Lake Hawassa Water-shed.
The average value of pH measured from point sources in monitoring stations MS4, MS5, MS15 and MS19 were 7.62, 9.1, 8.1 and 8.34, respectively. The average pH value of the Lake Hawassa is 8.5 for this study and comparative observations were made in Lake Hawassa with previous studies conducted by Abiye [33] who found an average value (pH = 8.5) and showed an increment from the results of Worako [6] and Yogendra and Puttaiah [44] (pH = 7.5) elsewhere. It is very probable that the increased pH values are mainly due to the consumption of dissolved carbon dioxide by the au-totrophic biomass in the upper layer of the eutrophic lake. These conditions may com-pletely change in deeper layers, where due to the absence of light heterotrophic deg-radation processes should be dominant [68].
3.1.2. Turbidity The turbidity in monitoring stations ranges from 4.24 to 46.5 NTU. The average
turbidity value for rivers were 21.5 NTU, Lake Hawassa was 10.7 NTU and point sources were 15.1 NTU. The turbidity of the study watershed is higher than the rec-ommend value by [16,65,69] for drinking and aquatic life, except at MS19 (4.24). The highest value of turbidity was recorded at MS18 (46.5 NTU) followed by MS3 (34.8) sampling stations; whereas, the minimum value of turbidity was recorded at MS19 (4.24 NTU) sampling station (Table 7 and Figure 2b).
The high values of turbidity could be attributed to agricultural and urban runoff from the catchment area, the loading of rivers and the lake with silt during the wet season and high human intervention in the river and lake water for multi purposes, and discharge of effluents from MS4, MS5, MS15 and MS19. The high turbidity value from industries might be due to organic matter decomposition present in the effluents [9,10,67,70]. There is also a moderate positive correlations observed between turbidity with chl-a (r = 0.6 at p < 0.005) and COD values (r = 0.6at p < 0.005). The result of this study also showed Lake Hawassa water clarity is low as evidenced by lower SD (0.76
0
2
4
6
8
10
MS1
MS3
MS5
MS7
MS9
MS1
1
MS1
3
MS1
5
MS1
7
MS1
9
pH v
alue
s
(a)
pH: 6.5 to 8.6 Suitable
0
10
20
30
40
50
MS1
MS3
MS5
MS7
MS9
MS1
1
MS1
3
MS1
5
MS1
7
MS1
9
Turb
idity
val
ues
(b)
Turbidity > 5 UnsuitableTurbidity < 5 Suitable
Figure 2. pH (a) and turbidity (NTU) (b) in the water and wastewater samples (n = 19) collected over 19 monitoring stationswith wastewater samples labeled yellow in the Lake Hawassa Watershed.
Int. J. Environ. Res. Public Health 2021, 18, 8904 10 of 31
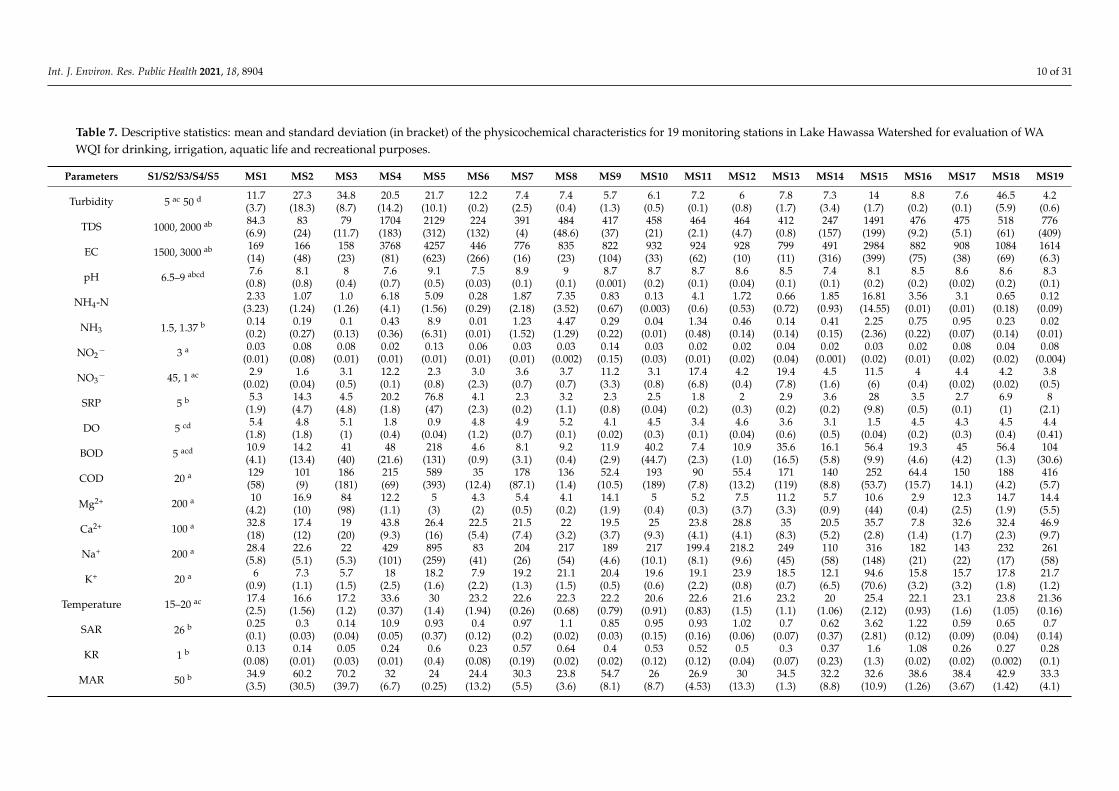
Table 7. Descriptive statistics: mean and standard deviation (in bracket) of the physicochemical characteristics for 19 monitoring stations in Lake Hawassa Watershed for evaluation of WAWQI for drinking, irrigation, aquatic life and recreational purposes.
Parameters S1/S2/S3/S4/S5 MS1 MS2 MS3 MS4 MS5 MS6 MS7 MS8 MS9 MS10 MS11 MS12 MS13 MS14 MS15 MS16 MS17 MS18 MS19
Turbidity 5 ac 50 d 11.7(3.7)
27.3(18.3)
34.8(8.7)
20.5(14.2)
21.7(10.1)
12.2(0.2)
7.4(2.5)
7.4(0.4)
5.7(1.3)
6.1(0.5)
7.2(0.1)
6(0.8)
7.8(1.7)
7.3(3.4)
14(1.7)
8.8(0.2)
7.6(0.1)
46.5(5.9)
4.2(0.6)
TDS 1000, 2000 ab 84.3(6.9)
83(24)
79(11.7)
1704(183)
2129(312)
224(132)
391(4)
484(48.6)
417(37)
458(21)
464(2.1)
464(4.7)
412(0.8)
247(157)
1491(199)
476(9.2)
475(5.1)
518(61)
776(409)
EC 1500, 3000 ab 169(14)
166(48)
158(23)
3768(81)
4257(623)
446(266)
776(16)
835(23)
822(104)
932(33)
924(62)
928(10)
799(11)
491(316)
2984(399)
882(75)
908(38)
1084(69)
1614(6.3)
pH 6.5–9 abcd 7.6(0.8)
8.1(0.8)
8(0.4)
7.6(0.7)
9.1(0.5)
7.5(0.03)
8.9(0.1)
9(0.1)
8.7(0.001)
8.7(0.2)
8.7(0.1)
8.6(0.04)
8.5(0.1)
7.4(0.1)
8.1(0.2)
8.5(0.2)
8.6(0.02)
8.6(0.2)
8.3(0.1)
NH4-N 2.33(3.23)
1.07(1.24)
1.0(1.26)
6.18(4.1)
5.09(1.56)
0.28(0.29)
1.87(2.18)
7.35(3.52)
0.83(0.67)
0.13(0.003)
4.1(0.6)
1.72(0.53)
0.66(0.72)
1.85(0.93)
16.81(14.55)
3.56(0.01)
3.1(0.01)
0.65(0.18)
0.12(0.09)
NH3 1.5, 1.37 b 0.14(0.2)
0.19(0.27)
0.1(0.13)
0.43(0.36)
8.9(6.31)
0.01(0.01)
1.23(1.52)
4.47(1.29)
0.29(0.22)
0.04(0.01)
1.34(0.48)
0.46(0.14)
0.14(0.14)
0.41(0.15)
2.25(2.36)
0.75(0.22)
0.95(0.07)
0.23(0.14)
0.02(0.01)
NO2− 3 a 0.03
(0.01)0.08
(0.08)0.08
(0.01)0.02
(0.01)0.13
(0.01)0.06
(0.01)0.03
(0.01)0.03
(0.002)0.14
(0.15)0.03
(0.03)0.02
(0.01)0.02
(0.02)0.04
(0.04)0.02
(0.001)0.03
(0.02)0.02
(0.01)0.08
(0.02)0.04
(0.02)0.08
(0.004)
NO3− 45, 1 ac 2.9
(0.02)1.6
(0.04)3.1
(0.5)12.2(0.1)
2.3(0.8)
3.0(2.3)
3.6(0.7)
3.7(0.7)
11.2(3.3)
3.1(0.8)
17.4(6.8)
4.2(0.4)
19.4(7.8)
4.5(1.6)
11.5(6)
4(0.4)
4.4(0.02)
4.2(0.02)
3.8(0.5)
SRP 5 b 5.3(1.9)
14.3(4.7)
4.5(4.8)
20.2(1.8)
76.8(47)
4.1(2.3)
2.3(0.2)
3.2(1.1)
2.3(0.8)
2.5(0.04)
1.8(0.2)
2(0.3)
2.9(0.2)
3.6(0.2)
28(9.8)
3.5(0.5)
2.7(0.1)
6.9(1)
8(2.1)
DO 5 cd 5.4(1.8)
4.8(1.8)
5.1(1)
1.8(0.4)
0.9(0.04)
4.8(1.2)
4.9(0.7)
5.2(0.1)
4.1(0.02)
4.5(0.3)
3.4(0.1)
4.6(0.04)
3.6(0.6)
3.1(0.5)
1.5(0.04)
4.5(0.2)
4.3(0.3)
4.5(0.4)
4.4(0.41)
BOD 5 acd 10.9(4.1)
14.2(13.4)
41(40)
48(21.6)
218(131)
4.6(0.9)
8.1(3.1)
9.2(0.4)
11.9(2.9)
40.2(44.7)
7.4(2.3)
10.9(1.0)
35.6(16.5)
16.1(5.8)
56.4(9.9)
19.3(4.6)
45(4.2)
56.4(1.3)
104(30.6)
COD 20 a 129(58)
101(9)
186(181)
215(69)
589(393)
35(12.4)
178(87.1)
136(1.4)
52.4(10.5)
193(189)
90(7.8)
55.4(13.2)
171(119)
140(8.8)
252(53.7)
64.4(15.7)
15014.1)
188(4.2)
416(5.7)
Mg2+ 200 a 10(4.2)
16.9(10)
84(98)
12.2(1.1)
5(3)
4.3(2)
5.4(0.5)
4.1(0.2)
14.1(1.9)
5(0.4)
5.2(0.3)
7.5(3.7)
11.2(3.3)
5.7(0.9)
10.6(44)
2.9(0.4)
12.3(2.5)
14.7(1.9)
14.4(5.5)
Ca2+ 100 a 32.8(18)
17.4(12)
19(20)
43.8(9.3)
26.4(16)
22.5(5.4)
21.5(7.4)
22(3.2)
19.5(3.7)
25(9.3)
23.8(4.1)
28.8(4.1)
35(8.3)
20.5(5.2)
35.7(2.8)
7.8(1.4)
32.6(1.7)
32.4(2.3)
46.9(9.7)
Na+ 200 a 28.4(5.8)
22.6(5.1)
22(5.3)
429(101)
895(259)
83(41)
204(26)
217(54)
189(4.6)
217(10.1)
199.4(8.1)
218.2(9.6)
249(45)
110(58)
316(148)
182(21)
143(22)
232(17)
261(58)
K+ 20 a 6(0.9)
7.3(1.1)
5.7(1.5)
18(2.5)
18.2(1.6)
7.9(2.2)
19.2(1.3)
21.1(1.5)
20.4(0.5)
19.6(0.6)
19.1(2.2)
23.9(0.8)
18.5(0.7)
12.1(6.5)
94.6(70.6)
15.8(3.2)
15.7(3.2)
17.8(1.8)
21.7(1.2)
Temperature 15–20 ac 17.4(2.5)
16.6(1.56)
17.2(1.2)
33.6(0.37)
30(1.4)
23.2(1.94)
22.6(0.26)
22.3(0.68)
22.2(0.79)
20.6(0.91)
22.6(0.83)
21.6(1.5)
23.2(1.1)
20(1.06)
25.4(2.12)
22.1(0.93)
23.1(1.6)
23.8(1.05)
21.36(0.16)
SAR 26 b 0.25(0.1)
0.3(0.03)
0.14(0.04)
10.9(0.05)
0.93(0.37)
0.4(0.12)
0.97(0.2)
1.1(0.02)
0.85(0.03)
0.95(0.15)
0.93(0.16)
1.02(0.06)
0.7(0.07)
0.62(0.37)
3.62(2.81)
1.22(0.12)
0.59(0.09)
0.65(0.04)
0.7(0.14)
KR 1 b 0.13(0.08)
0.14(0.01)
0.05(0.03)
0.24(0.01)
0.6(0.4)
0.23(0.08)
0.57(0.19)
0.64(0.02)
0.4(0.02)
0.53(0.12)
0.52(0.12)
0.5(0.04)
0.3(0.07)
0.37(0.23)
1.6(1.3)
1.08(0.02)
0.26(0.02)
0.27(0.002)
0.28(0.1)
MAR 50 b 34.9(3.5)
60.2(30.5)
70.2(39.7)
32(6.7)
24(0.25)
24.4(13.2)
30.3(5.5)
23.8(3.6)
54.7(8.1)
26(8.7)
26.9(4.53)
30(13.3)
34.5(1.3)
32.2(8.8)
32.6(10.9)
38.6(1.26)
38.4(3.67)
42.9(1.42)
33.3(4.1)
Int. J. Environ. Res. Public Health 2021, 18, 8904 11 of 31
Table 7. Cont.
Parameters S1/S2/S3/S4/S5 MS1 MS2 MS3 MS4 MS5 MS6 MS7 MS8 MS9 MS10 MS11 MS12 MS13 MS14 MS15 MS16 MS17 MS18 MS19
SSP 50 b 30.8(14.9)
28.1(1.96)
12.9(8.5)
78.3(1.97)
92.6(5.8)
60.9(12.8)
79.2(6.2)
81.7(1.8)
72.7(0.06)
79.4(5)
78.5(2.8)
76.2(0.3)
73(1.9)
66.7(14.7)
82.1(0.34)
89.4(0.33)
62(1.24)
70.3(0.42)
68.5(1.8)
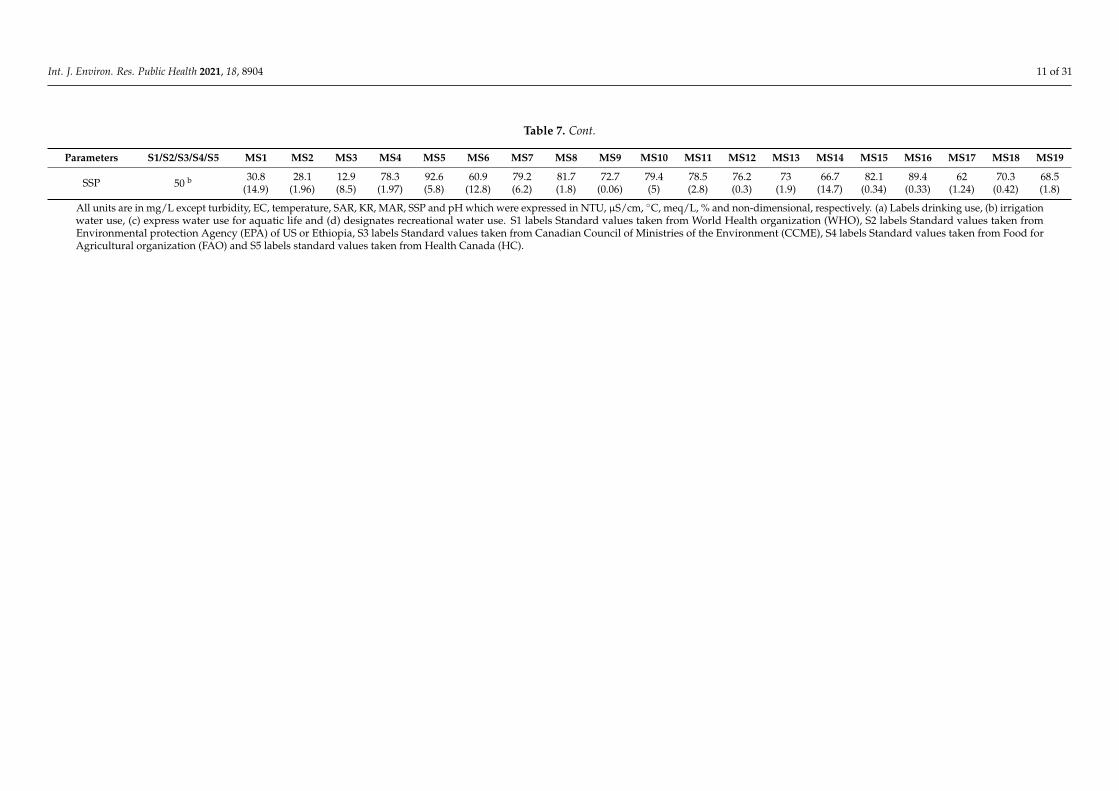
All units are in mg/L except turbidity, EC, temperature, SAR, KR, MAR, SSP and pH which were expressed in NTU, µS/cm, ◦C, meq/L, % and non-dimensional, respectively. (a) Labels drinking use, (b) irrigationwater use, (c) express water use for aquatic life and (d) designates recreational water use. S1 labels Standard values taken from World Health organization (WHO), S2 labels Standard values taken fromEnvironmental protection Agency (EPA) of US or Ethiopia, S3 labels Standard values taken from Canadian Council of Ministries of the Environment (CCME), S4 labels Standard values taken from Food forAgricultural organization (FAO) and S5 labels standard values taken from Health Canada (HC).
Int. J. Environ. Res. Public Health 2021, 18, 8904 12 of 31
The average value of pH measured from point sources in monitoring stations MS4,MS5, MS15 and MS19 were 7.62, 9.1, 8.1 and 8.34, respectively. The average pH value ofthe Lake Hawassa is 8.5 for this study and comparative observations were made in LakeHawassa with previous studies conducted by Abiye [33] who found an average value(pH = 8.5) and showed an increment from the results of Worako [6] and Yogendra andPuttaiah [44] (pH = 7.5) elsewhere. It is very probable that the increased pH values aremainly due to the consumption of dissolved carbon dioxide by the autotrophic biomass inthe upper layer of the eutrophic lake. These conditions may completely change in deeperlayers, where due to the absence of light heterotrophic degradation processes should bedominant [68].
3.1.2. Turbidity
The turbidity in monitoring stations ranges from 4.24 to 46.5 NTU. The averageturbidity value for rivers were 21.5 NTU, Lake Hawassa was 10.7 NTU and point sourceswere 15.1 NTU. The turbidity of the study watershed is higher than the recommend valueby [16,65,69] for drinking and aquatic life, except at MS19 (4.24). The highest value ofturbidity was recorded at MS18 (46.5 NTU) followed by MS3 (34.8) sampling stations;whereas, the minimum value of turbidity was recorded at MS19 (4.24 NTU) samplingstation (Table 7 and Figure 2b).
The high values of turbidity could be attributed to agricultural and urban runoff fromthe catchment area, the loading of rivers and the lake with silt during the wet season andhigh human intervention in the river and lake water for multi purposes, and dischargeof effluents from MS4, MS5, MS15 and MS19. The high turbidity value from industriesmight be due to organic matter decomposition present in the effluents [9,10,67,70]. Thereis also a moderate positive correlations observed between turbidity with chl-a (r = 0.6 atp < 0.005) and COD values (r = 0.6 at p < 0.005). The result of this study also showed LakeHawassa water clarity is low as evidenced by lower SD (0.76 m) and TSI of 65.4 leading tohigh nutrient concentrations, high algal blooms but low light penetration and low waterclarity. Lack of clarity limits the light penetration rendering greater impacts on algaeand macrophytes while degradation of organic matter in deeper layers can lead to thedepletion of oxygen and subsequently fish kill [71]. The recreational use of water is reduceddue to lack of clarity as the value of Secchi depth for lake Hawassa was lower than therecommended limit of 1.2 m [72] and turbidity value was higher [73]. Most natural watershave turbidities less than 50 NTU [74].
High turbidity also reduces the efficiency of disinfectant in water supplies for drinkingpurposes and cause a health risk by enhancing the growth of bacteria during storage. Hence,special attention ought to be given to the turbidity of Lake Hawassa Watershed as its valuelies within a level that could pose a health risk and reduces the disinfection process inwater supplies.
3.1.3. Nitrate (NO3−), Nitrate-Nitrogen (NO3-N) and Nitrite (NO2
−), Nitrite Nitrogen (NO2-N)
The WHO guideline recommends 50 mg/L for nitrate ion, (11 mg/L) as NO3-N and3 mg/L of nitrite ion and (0.9 mg/L) as NO2-N for safe human consumption. In thestudied watershed, these values were far below the prescribed limit. The average nitrate(NO3
−), nitrate-nitrogen (NO3-N) and nitrite (NO2−) concentrations of rivers were 2.7,
0.6 and 0.06 mg/L respectively and that of point sources were 7.5, 1.7 and 0.06 mg/L,respectively. The average nitrate (NO3
−), nitrate-nitrogen (NO3-N) and nitrite (NO2−)
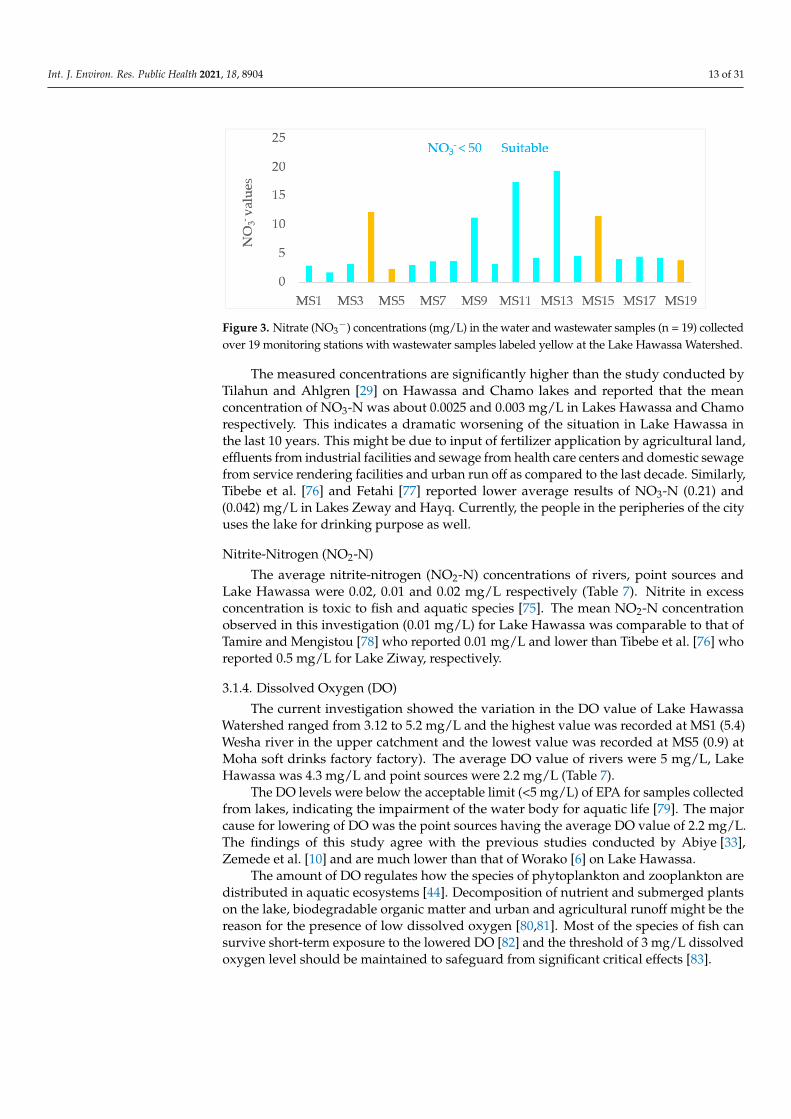
concentrations of Lake Hawassa were 7, 1.7 and 0.04 mg/L, respectively (Table 7 andFigure 3). The study conducted by Camargo and Alonso [75] have shown that a NO3-Nconcentration of 10 mg/L NO3-N can adversely affect sensitive aquatic animals in thecourse of long-term exposure.
Int. J. Environ. Res. Public Health 2021, 18, 8904 13 of 31
Int. J. Environ. Res. Public Health 2021, 18, x 13 of 33
m) and TSI of 65.4 leading to high nutrient concentrations, high algal blooms but low light penetration and low water clarity. Lack of clarity limits the light penetration ren-dering greater impacts on algae and macrophytes while degradation of organic matter in deeper layers can lead to the depletion of oxygen and subsequently fish kill [71]. The recreational use of water is reduced due to lack of clarity as the value of Secchi depth for lake Hawassa was lower than the recommended limit of 1.2 m [72] and tur-bidity value was higher [73]. Most natural waters have turbidities less than 50 NTU [74].
High turbidity also reduces the efficiency of disinfectant in water supplies for drinking purposes and cause a health risk by enhancing the growth of bacteria during storage. Hence, special attention ought to be given to the turbidity of Lake Hawassa Watershed as its value lies within a level that could pose a health risk and reduces the disinfection process in water supplies.
3.1.3. Nitrate (NO3−), Nitrate-Nitrogen (NO3-N) and Nitrite (NO2−), Nitrite Nitrogen (NO2-N)
The WHO guideline recommends 50 mg/L for nitrate ion, (11 mg/L) as NO3-N and 3 mg/L of nitrite ion and (0.9 mg/L) as NO2-N for safe human consumption. In the studied watershed, these values were far below the prescribed limit. The average ni-trate (NO3−), nitrate-nitrogen (NO3-N) and nitrite (NO2−) concentrations of rivers were 2.7, 0.6 and 0.06 mg/L respectively and that of point sources were 7.5, 1.7 and 0.06 mg/L, respectively. The average nitrate (NO3−), nitrate-nitrogen (NO3-N) and nitrite (NO2−) concentrations of Lake Hawassa were 7, 1.7 and 0.04 mg/L, respectively (Table 7 and Figure 3). The study conducted by Camargo and Alonso [75] have shown that a NO3-N concentration of 10 mg/L NO3-N can adversely affect sensitive aquatic animals in the course of long-term exposure.
Figure 3. Nitrate (NO3−) concentrations (mg/L) in the water and wastewater samples (n = 19) collected over 19 monitoring stations with wastewater samples labeled yellow at the Lake Ha-wassa Watershed.
The measured concentrations are significantly higher than the study conducted by Tilahun and Ahlgren [29] on Hawassa and Chamo lakes and reported that the mean concentration of NO3-N was about 0.0025 and 0.003 mg/L in Lakes Hawassa and Chamo respectively. This indicates a dramatic worsening of the situation in Lake Ha-wassa in the last 10 years. This might be due to input of fertilizer application by agri-cultural land, effluents from industrial facilities and sewage from health care centers and domestic sewage from service rendering facilities and urban run off as compared to the last decade. Similarly, Tibebe et al. [76] and Fetahi [77] reported lower average results of NO3-N (0.21) and (0.042) mg/L in Lakes Zeway and Hayq. Currently, the people in the peripheries of the city uses the lake for drinking purpose as well. Nitrite-nitrogen (NO2-N)
Figure 3. Nitrate (NO3−) concentrations (mg/L) in the water and wastewater samples (n = 19) collected
over 19 monitoring stations with wastewater samples labeled yellow at the Lake Hawassa Watershed.
The measured concentrations are significantly higher than the study conducted byTilahun and Ahlgren [29] on Hawassa and Chamo lakes and reported that the meanconcentration of NO3-N was about 0.0025 and 0.003 mg/L in Lakes Hawassa and Chamorespectively. This indicates a dramatic worsening of the situation in Lake Hawassa inthe last 10 years. This might be due to input of fertilizer application by agricultural land,effluents from industrial facilities and sewage from health care centers and domestic sewagefrom service rendering facilities and urban run off as compared to the last decade. Similarly,Tibebe et al. [76] and Fetahi [77] reported lower average results of NO3-N (0.21) and(0.042) mg/L in Lakes Zeway and Hayq. Currently, the people in the peripheries of the cityuses the lake for drinking purpose as well.
Nitrite-Nitrogen (NO2-N)
The average nitrite-nitrogen (NO2-N) concentrations of rivers, point sources andLake Hawassa were 0.02, 0.01 and 0.02 mg/L respectively (Table 7). Nitrite in excessconcentration is toxic to fish and aquatic species [75]. The mean NO2-N concentrationobserved in this investigation (0.01 mg/L) for Lake Hawassa was comparable to that ofTamire and Mengistou [78] who reported 0.01 mg/L and lower than Tibebe et al. [76] whoreported 0.5 mg/L for Lake Ziway, respectively.
3.1.4. Dissolved Oxygen (DO)
The current investigation showed the variation in the DO value of Lake HawassaWatershed ranged from 3.12 to 5.2 mg/L and the highest value was recorded at MS1 (5.4)Wesha river in the upper catchment and the lowest value was recorded at MS5 (0.9) atMoha soft drinks factory factory). The average DO value of rivers were 5 mg/L, LakeHawassa was 4.3 mg/L and point sources were 2.2 mg/L (Table 7).
The DO levels were below the acceptable limit (<5 mg/L) of EPA for samples collectedfrom lakes, indicating the impairment of the water body for aquatic life [79]. The majorcause for lowering of DO was the point sources having the average DO value of 2.2 mg/L.The findings of this study agree with the previous studies conducted by Abiye [33],Zemede et al. [10] and are much lower than that of Worako [6] on Lake Hawassa.
The amount of DO regulates how the species of phytoplankton and zooplankton aredistributed in aquatic ecosystems [44]. Decomposition of nutrient and submerged plantson the lake, biodegradable organic matter and urban and agricultural runoff might be thereason for the presence of low dissolved oxygen [80,81]. Most of the species of fish cansurvive short-term exposure to the lowered DO [82] and the threshold of 3 mg/L dissolvedoxygen level should be maintained to safeguard from significant critical effects [83].
Int. J. Environ. Res. Public Health 2021, 18, 8904 14 of 31
3.1.5. Chemical Oxygen Demand (COD) and Biological Oxygen Demand (BOD5)Chemical Oxygen Demand (COD)
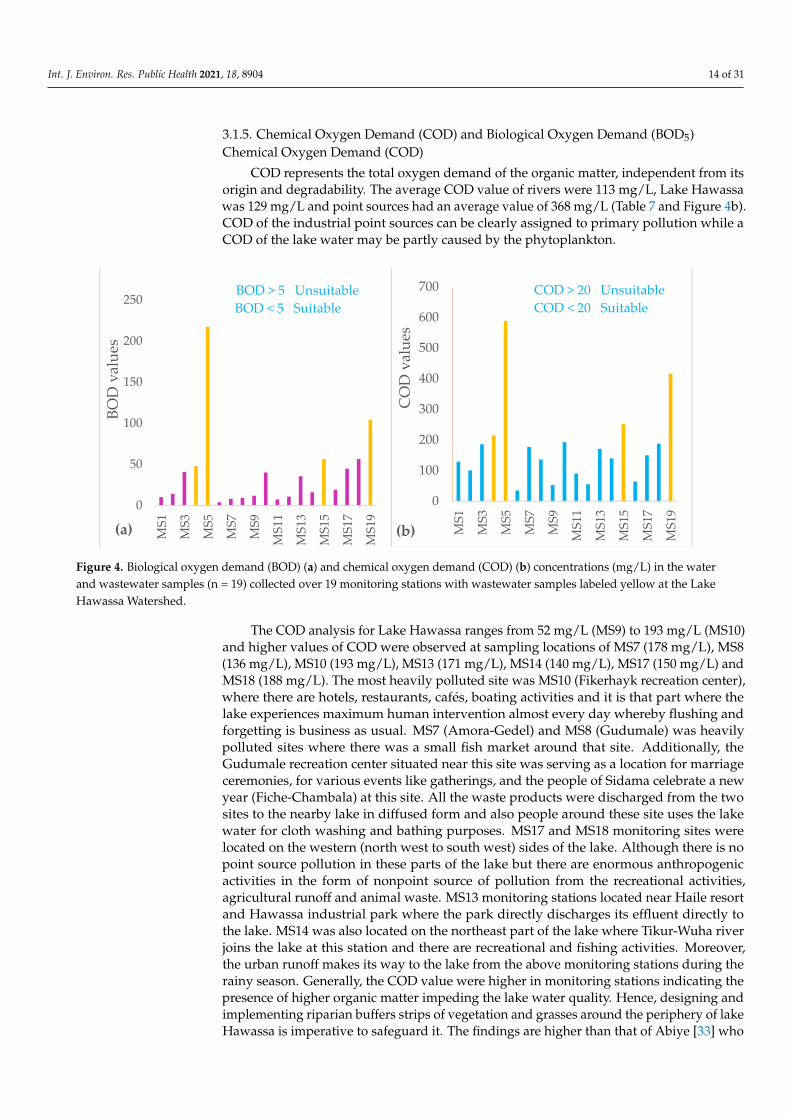
COD represents the total oxygen demand of the organic matter, independent from itsorigin and degradability. The average COD value of rivers were 113 mg/L, Lake Hawassawas 129 mg/L and point sources had an average value of 368 mg/L (Table 7 and Figure 4b).COD of the industrial point sources can be clearly assigned to primary pollution while aCOD of the lake water may be partly caused by the phytoplankton.
Int. J. Environ. Res. Public Health 2021, 18, x 14 of 33
The average nitrite-nitrogen (NO2-N) concentrations of rivers, point sources and Lake Hawassa were 0.02, 0.01 and 0.02 mg/L respectively (Table 7). Nitrite in excess concentration is toxic to fish and aquatic species [75]. The mean NO2-N concentration observed in this investigation (0.01 mg/L) for Lake Hawassa was comparable to that of Tamire and Mengistou [78] who reported 0.01 mg/L and lower than Tibebe et al. [76] who reported 0.5 mg/L for Lake Ziway, respectively.
3.1.4. Dissolved Oxygen (DO) The current investigation showed the variation in the DO value of Lake Hawassa
Watershed ranged from 3.12 to 5.2 mg/L and the highest value was recorded at MS1 (5.4) Wesha river in the upper catchment and the lowest value was recorded at MS5 (0.9) at Moha soft drinks factory factory). The average DO value of rivers were 5 mg/L, Lake Hawassa was 4.3 mg/L and point sources were 2.2 mg/L (Table 7).
The DO levels were below the acceptable limit (<5 mg/L) of EPA for samples col-lected from lakes, indicating the impairment of the water body for aquatic life [79]. The major cause for lowering of DO was the point sources having the average DO value of 2.2 mg/L. The findings of this study agree with the previous studies conducted by Abiye [33], Zemede et al. [10] and are much lower than that of Worako [6] on Lake Hawassa.
The amount of DO regulates how the species of phytoplankton and zooplankton are distributed in aquatic ecosystems [44]. Decomposition of nutrient and submerged plants on the lake, biodegradable organic matter and urban and agricultural runoff might be the reason for the presence of low dissolved oxygen [80,81]. Most of the spe-cies of fish can survive short-term exposure to the lowered DO [82] and the threshold of 3 mg/L dissolved oxygen level should be maintained to safeguard from significant critical effects [83].
3.1.5. Chemical Oxygen Demand (COD) and Biological Oxygen Demand (BOD5)
Chemical Oxygen Demand (COD) COD represents the total oxygen demand of the organic matter, independent
from its origin and degradability. The average COD value of rivers were 113 mg/L,
0
50
100
150
200
250
MS1
MS3
MS5
MS7
MS9
MS1
1
MS1
3
MS1
5
MS1
7
MS1
9
BOD
val
ues
(a)
BOD > 5 UnsuitableBOD < 5 Suitable
0
100
200
300
400
500
600
700
MS1
MS3
MS5
MS7
MS9
MS1
1
MS1
3
MS1
5
MS1
7
MS1
9
CO
D v
alue
s
(b)
COD > 20 UnsuitableCOD < 20 Suitable
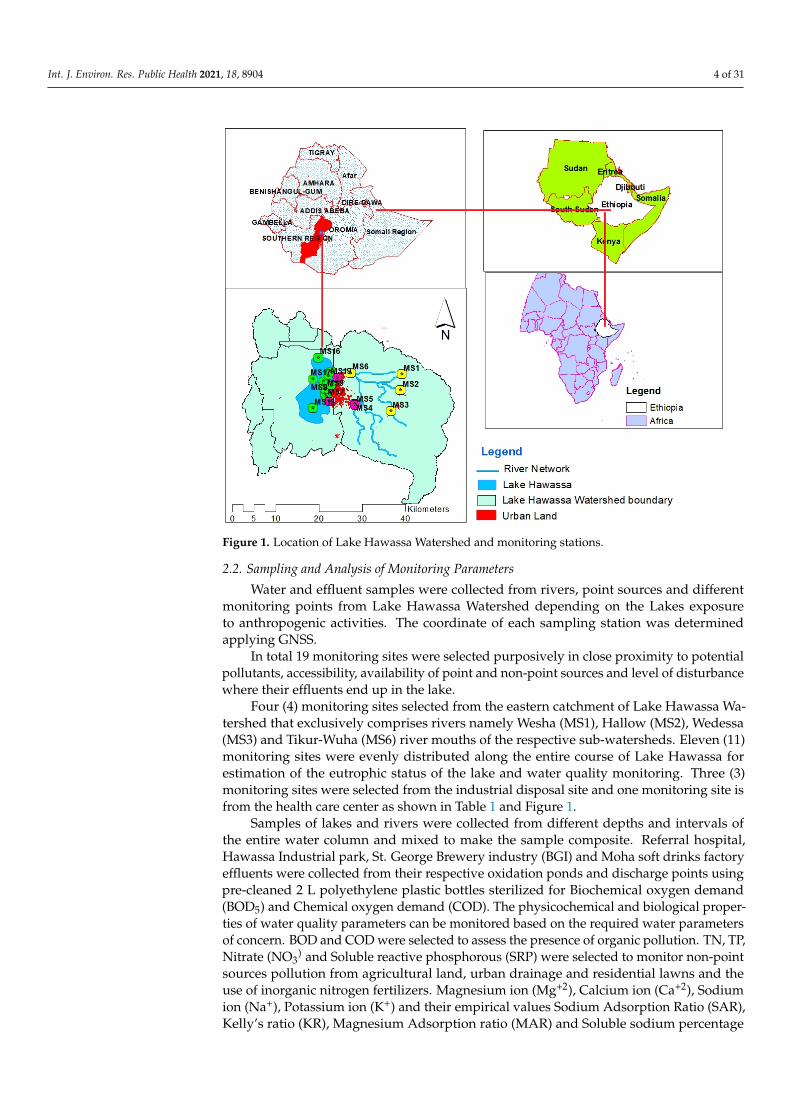
Figure 4. Biological oxygen demand (BOD) (a) and chemical oxygen demand (COD) (b) concentrations (mg/L) in the waterand wastewater samples (n = 19) collected over 19 monitoring stations with wastewater samples labeled yellow at the LakeHawassa Watershed.
The COD analysis for Lake Hawassa ranges from 52 mg/L (MS9) to 193 mg/L (MS10)and higher values of COD were observed at sampling locations of MS7 (178 mg/L), MS8(136 mg/L), MS10 (193 mg/L), MS13 (171 mg/L), MS14 (140 mg/L), MS17 (150 mg/L) andMS18 (188 mg/L). The most heavily polluted site was MS10 (Fikerhayk recreation center),where there are hotels, restaurants, cafés, boating activities and it is that part where thelake experiences maximum human intervention almost every day whereby flushing andforgetting is business as usual. MS7 (Amora-Gedel) and MS8 (Gudumale) was heavilypolluted sites where there was a small fish market around that site. Additionally, theGudumale recreation center situated near this site was serving as a location for marriageceremonies, for various events like gatherings, and the people of Sidama celebrate a newyear (Fiche-Chambala) at this site. All the waste products were discharged from the twosites to the nearby lake in diffused form and also people around these site uses the lakewater for cloth washing and bathing purposes. MS17 and MS18 monitoring sites werelocated on the western (north west to south west) sides of the lake. Although there is nopoint source pollution in these parts of the lake but there are enormous anthropogenicactivities in the form of nonpoint source of pollution from the recreational activities,agricultural runoff and animal waste. MS13 monitoring stations located near Haile resortand Hawassa industrial park where the park directly discharges its effluent directly tothe lake. MS14 was also located on the northeast part of the lake where Tikur-Wuha riverjoins the lake at this station and there are recreational and fishing activities. Moreover,the urban runoff makes its way to the lake from the above monitoring stations during therainy season. Generally, the COD value were higher in monitoring stations indicating thepresence of higher organic matter impeding the lake water quality. Hence, designing andimplementing riparian buffers strips of vegetation and grasses around the periphery of lakeHawassa is imperative to safeguard it. The findings are higher than that of Abiye [33] who
Int. J. Environ. Res. Public Health 2021, 18, 8904 15 of 31
found an average value of 78 mg/L for lake Hawassa owing to the impact of urbanization-related activities, such-as domestic sewage and urban runoff that contains organic matter.This reveals that there has been a visible change of water quality impediment in the last13 years due to the domestic and industrial sewage and urban runoff.
Biological Oxygen Demand (BOD5)
The average BOD5 value of rivers were 17.3 mg/L, Lake Hawassa was 23.6 mg/L andpoint sources were 106.6 mg/L showing point sources are the cause for pollution of thelake (Table 7 and Figure 4a). Rivers or lakes are considered unpolluted if the average valueof BOD < 3 mg/L, however, BOD > 5.0 mg/L was recorded in all 19 monitoring stationssignposting possible pollution [38].
Releasing liquid wastewater with higher BOD causes impairments in water qualitysuch as DO decline and fish kills in the receiving water bodies [84]. The concentration ofBOD5 in the area under investigation is beyond the permissible limits of WHO and EPAguidelines (<5 mg/L) for human consumption and aquatic life in the study watershed;which indicates the water in the watershed is highly polluted by organic matter.
BOD is a parameter used to judge the presence of organic load in a water body andalso used as an indicator of whether a water body is in a eutrophied state. Higher BODlevels of a water body are associated with lower dissolved oxygen levels [44]. Thoseinvolved in recreational facilities are probably most at risk due to eutrophic conditions [85].The findings are lower than that of Zemede et al. [10] who recorded an average value of44.9 mg/L for Lake Hawassa.
3.1.6. Total Ammonia Nitrogen (NH4-N + NH3-N)
Total ammonia nitrogen (TAN) is the sum of ammonium nitrogen in ionized form(NH4-N) and un-ionized ammonia nitrogen (NH3-N) that are the principal water qualityindicators, with their relative concentrations dependent on both pH and temperature. Theun-ionized form is toxic as it is neutral and can penetrate gill membranes more readily thanthe NH4
+ ions. Studies showed the toxicity of total ammonia ascribed due to the effect offree ammonia only [86,87].
Aquatic organisms are extremely sensitive to elevated levels from the natural ammonialevel and the un-ionized form of ammonia is deadly to aquatic animals including fish.At the pH of 8.75 to 9.75, unionized ammonia and ammonium ions coexists in aqueousstate and the fraction of un-ionized ammonia increases with temperature and pH. Whenthe pH (<8.75), ammonium ions are the principal species in water bodies, unionizedammonia becomes the pre-dominant species at pH (>8.75) [88–90]. In the lake watershedunder investigation, the mean ammonium nitrogen ranges from 0.12 mg/L (MS19) to16.8 mg/L (MS15). The average ammonium nitrogen value of rivers was 1.17 mg/L, LakeHawassa was 2.35 mg/L, and point sources were 7.2 mg/L (Table 7). The findings revealedthe point sources were the major source for ammonium nitrogen to the rivers and LakeHawassa. While ammonium is less toxic and the most desirable source for phytoplanktongrowth, it becomes toxic to fishes and may result in eutrophication of lakes at higherconcentrations [91,92].
On the other hand, a good quality water body must have an ammonia levels less than0.05 mg/L and when this level goes beyond 2 mg/L fish are killed [75,93,94]. Nonetheless,in the watershed under investigation, the mean ammonia ranges from 0.01 mg/L (MS6)to 8.9 mg/L (MS5). The average ammonia value of rivers was 0.11 mg/L, Lake Hawassawas 0.94 mg/L, point sources were 2.9 mg/L, and these values are higher than the rec-ommended value (Table 7). In addition, point sources were contributing larger amountsof ammonia to the river and Lake Hawassa. The findings are in line with the previousstudies conducted by Kebede et al. [30] and Teshome [55] on the eastern catchment ofLake Hawassa. Ammonia is an indicator for elevated pollution from organic substancesproducing a noxious odors and are often indicative of sewage pollution and agriculturalrunoff [51,89].
Int. J. Environ. Res. Public Health 2021, 18, 8904 16 of 31
3.1.7. Soluble Reactive Phosphorus (SRP)
The mean values of SRP ranged from 1.8 to 76.8 mg/L and higher values observed atMS5 (Moha soft drinks factory). The recommended concentration of phosphate for goodquality water that maintains the aquatic life is in the range of 0.005 to 0.02 mg/L [69].
The average SPR concentration in the upper catchment of three rivers (MS1, MS2and MS3) was 6.56 mg/L which is higher than the study conducted by Kebede et al. [30].Moreover, the SPR of the four rivers including Tikur-Wuha river (MS1, MS2, MS3 andMS6) was 6.5 mg/L (Table 7), that is greater than the study conducted on the easterncatchment by Teshome [55]. This might be due to increased population due to urbanization,use of detergents, the practice of open defecation, and intensive usage of fertilizers inagricultural land.
The overall mean of SRP concentration in Lake Hawassa was 3.34 mg/L that is greaterthan the previously reported value of Zinabu et al. [95], Tilahun and Ahlgren [29] andTamire and Mengistou [78] which was 0.035, 0.01 and 0.029 mg/L respectively. Hence, thephosphate level in the study watershed exhibited non-conformity with the standard valuesthat can exacerbate eutrophication in fresh water systems and loss of aquatic biodiversity.This might be due to an increased usage of fertilizers in agricultural lands, industrialeffluents, excessive usage of detergents in domestic and industrial facilities, soil erosion,and increased sewage pollution showing an ongoing pollution of the lake. Additionally,phosphate carrying pollutants like fertilizers, domestic wastewater, detergents, industrialeffluents, runoff from agricultural and urban setup leading to algal blooms, eutrophicationand elevated BOD [85,96]. The results of this study showed an increment from the previ-ous studies conducted on the eastern catchment of Lake Hawassa by Kebede et al. [30],Teshome [55] and on Lake Hawassa conducted by Worako [6].
3.2. Summary of Irrigation Indices3.2.1. Total Dissolved Solids (TDS) and Electrical Conductivity (EC)
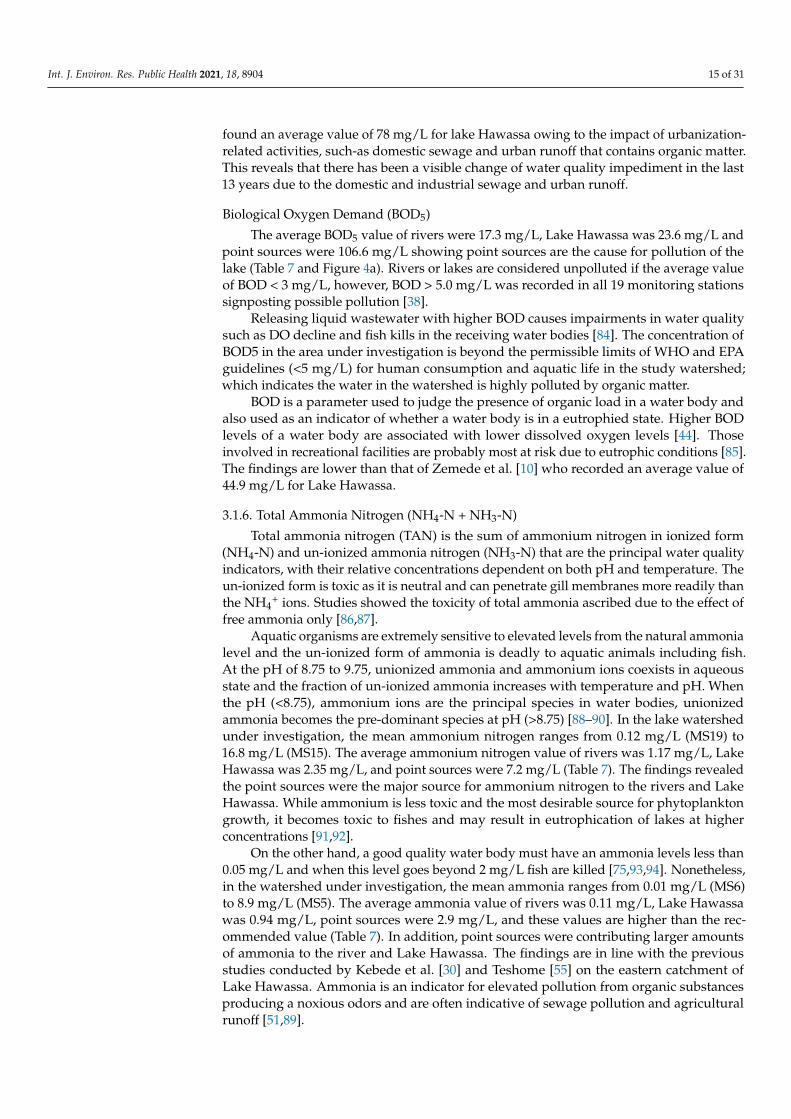
TDS plays a critical role in estimating the suitability of water bodies for both do-mestic and agricultural uses [97]. The overall mean value of TDS and EC in the studywatershed was 598.7 mg/L and 1207.4 µS/cm, respectively (Table 7 and Figure 5a,b). Thesamples in the study watershed fell well below the prescribed values (<2000 mg/L) forTDS and (<3000 µS/cm) for EC recommended for human consumption and agriculturalpurposes [65,98]. However, samples collected from MS4, MS5 and MS15 were far abovethe recommended limits for human consumption and agricultural purposes. The meanvalue of TDS in this study for Lake Hawassa (455.6 mg/L) were greater than that of LakeZiway (200 to 400 mg/L) conducted by Hengsdijk and Jansen [99].
Int. J. Environ. Res. Public Health 2021, 18, x 17 of 33
wastewater, detergents, industrial effluents, runoff from agricultural and urban setup leading to algal blooms, eutrophication and elevated BOD [85,96]. The results of this study showed an increment from the previous studies conducted on the eastern catch-ment of Lake Hawassa by Kebede et al. [30], Teshome [55] and on Lake Hawassa con-ducted by Worako [6].
3.2. Summary of Irrigation Indices 3.2.1. Total Dissolved Solids (TDS) and Electrical Conductivity (EC)
TDS plays a critical role in estimating the suitability of water bodies for both do-mestic and agricultural uses [97]. The overall mean value of TDS and EC in the study watershed was 598.7 mg/L and 1207.4 µS/cm, respectively ((Table 7 and Figure 5a,b). The samples in the study watershed fell well below the prescribed values (<2000 mg/L) for TDS and (<3000 µS/cm) for EC recommended for human consumption and agricul-tural purposes [65,98]. However, samples collected from MS4, MS5 and MS15 were far above the recommended limits for human consumption and agricultural purposes. The mean value of TDS in this study for Lake Hawassa (455.6 mg/L) were greater than that of Lake Ziway (200 to 400 mg/L) conducted by Hengsdijk and Jansen [99].
Figure 5. Total dissolved solids (TDS) (a) concentrations (mg/L) and electrical conductivity (EC) (b) concentrations (µS/cm) in the water and wastewater samples (n = 19) collected over 19 monitoring stations with wastewater samples labeled yellow at the Lake Hawassa Watershed.
The major source for TDS is due to livestock waste, landfills and dissolved min-erals [100]. Electrical conductivity can be categorized low when EC< = 250 µS/cm (C1), medium when 250–750 µS/cm (C2), high when it ranges from 750–2250 µS/cm (C3) and very high when > 2250 µS/cm (C4) [100–102]. If applied for irrigation, high salt concen-tration (high EC) in water leads to formation of saline soil and a high sodium concen-tration leads to development of an alkaline soil.
3.2.2. Sodium Adsorption Ratio (SAR) and Kelly Ratio (KR) The appropriateness of water bodies for agricultural purpose was estimated by
computing several parameters like salinity (EC), sodium absorption ratio (SAR), Kelly’s ratio (KR), soluble sodium percentage (SSP) and magnesium adsorption ratio (MAR) [100]. The above parameters were categorized based on the literature review [98,103].
The average EC in the study watershed ranged from 168.62 µS/cm (MS1) for We-sha River to 4257.4 µS/cm (MS5) for the Moha soft drink factory. The intake of water by plants decreases with increasing TDS or electrical conductivity value of water. Hence, the maximum yield reduction of crops occurred when the EC in agricultural
0
500
1000
1500
2000
MS1
MS3
MS5
MS7
MS9
MS1
1M
S13
MS1
5M
S17
MS1
9
TDS
valu
es
(a)
TDS > 2000 UnsuitableTDS < 2000 Suitable
0
1000
2000
3000
4000
MS1
MS3
MS5
MS7
MS9
MS1
1M
S13
MS1
5M
S17
MS1
9
EC v
alue
s
(b)
EC > 3000 UnsuitableEC < 3000 Suitable
Figure 5. Total dissolved solids (TDS) (a) concentrations (mg/L) and electrical conductivity (EC) (b) concentrations (µS/cm)in the water and wastewater samples (n = 19) collected over 19 monitoring stations with wastewater samples labeled yellowat the Lake Hawassa Watershed.
Int. J. Environ. Res. Public Health 2021, 18, 8904 17 of 31
The major source for TDS is due to livestock waste, landfills and dissolved minerals [100].Electrical conductivity can be categorized low when EC ≤ 250 µS/cm (C1), mediumwhen 250–750 µS/cm (C2), high when it ranges from 750–2250 µS/cm (C3) and veryhigh when > 2250 µS/cm (C4) [100–102]. If applied for irrigation, high salt concentration(high EC) in water leads to formation of saline soil and a high sodium concentration leadsto development of an alkaline soil.
3.2.2. Sodium Adsorption Ratio (SAR) and Kelly Ratio (KR)
The appropriateness of water bodies for agricultural purpose was estimated by com-puting several parameters like salinity (EC), sodium absorption ratio (SAR), Kelly’s ratio(KR), soluble sodium percentage (SSP) and magnesium adsorption ratio (MAR) [100]. Theabove parameters were categorized based on the literature review [98,103].
The average EC in the study watershed ranged from 168.62 µS/cm (MS1) for WeshaRiver to 4257.4 µS/cm (MS5) for the Moha soft drink factory. The intake of water byplants decreases with increasing TDS or electrical conductivity value of water. Hence, themaximum yield reduction of crops occurred when the EC in agricultural water exceeds3000 µS/cm [98,104]. SAR values for each water sample were calculated by using thefollowing Equation [101].
SAR =Na+√(
Ca+2+Mg+2
2
) , (20)
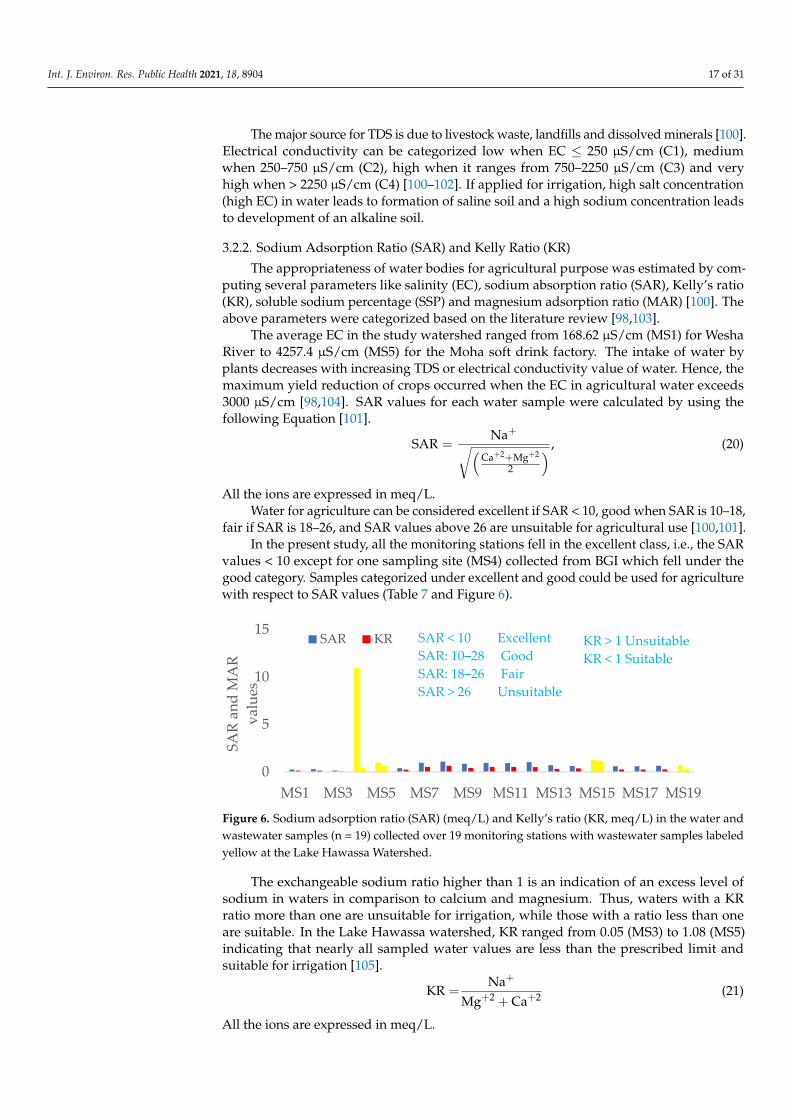
All the ions are expressed in meq/L.Water for agriculture can be considered excellent if SAR < 10, good when SAR is 10–18,
fair if SAR is 18–26, and SAR values above 26 are unsuitable for agricultural use [100,101].In the present study, all the monitoring stations fell in the excellent class, i.e., the SAR
values < 10 except for one sampling site (MS4) collected from BGI which fell under thegood category. Samples categorized under excellent and good could be used for agriculturewith respect to SAR values (Table 7 and Figure 6).
Int. J. Environ. Res. Public Health 2021, 18, x 18 of 33
water exceeds 3000 µS/cm [98,104]. SAR values for each water sample were calculated by using the following Equation [101].
,
2
2Mg2Ca
Na = SAR
+++
+
(20)
All the ions are expressed in meq/L. Water for agriculture can be considered excellent if SAR <10, good when SAR is
10–18, fair if SAR is 18–26, and SAR values above 26 are unsuitable for agricultural use [100,101].
In the present study, all the monitoring stations fell in the excellent class, i.e., the SAR values <10 except for one sampling site (MS4) collected from BGI which fell under the good category. Samples categorized under excellent and good could be used for agriculture with respect to SAR values (Table 7 and Figure 6).
Figure 6. Sodium adsorption ratio (SAR) (meq/L) and Kelly’s ratio (KR, meq/L) in the water and wastewater samples (n = 19) collected over 19 monitoring stations with wastewater sam-ples labeled yellow at the Lake Hawassa Watershed.
The exchangeable sodium ratio higher than 1 is an indication of an excess level of sodium in waters in comparison to calcium and magnesium. Thus, waters with a KR ratio more than one are unsuitable for irrigation, while those with a ratio less than one are suitable. In the Lake Hawassa watershed, KR ranged from 0.05 (MS3) to 1.08 (MS5) indicating that nearly all sampled water values are less than the prescribed limit and suitable for irrigation [105].
2Ca2Mg
Na = KR +++
+ (21)
All the ions are expressed in meq/L.
3.2.3. Soluble Sodium Percentage (SSP) and Magnesium Adsorption Ratio (MAR) Wilcox [106] has suggested a classification system for ranking agricultural water
use depending on SSP and estimated using the formula below.
,010*2Mg2caNa
Na = SSP +++++
+ (22)
All the ions are expressed in meq/L. SSP values above 50% mean the sampled water is not suitable for agricultural use
and values lower than 50% indicate good quality of water [106]. The values of SSP in the watershed under investigation were far above the recommended limit (>50%) by Wilcox except samples collected from monitoring stations MS1(30.79%), MS2 (28.14%) and for MS3 (12.86%) (Table 7 and Figure 7).
0
5
10
15
MS1 MS3 MS5 MS7 MS9 MS11 MS13 MS15 MS17 MS19
SAR
and
MA
R va
lues
SAR KR SAR < 10 ExcellentSAR: 10–28 GoodSAR: 18–26 FairSAR > 26 Unsuitable
KR > 1 UnsuitableKR < 1 Suitable
Figure 6. Sodium adsorption ratio (SAR) (meq/L) and Kelly’s ratio (KR, meq/L) in the water andwastewater samples (n = 19) collected over 19 monitoring stations with wastewater samples labeledyellow at the Lake Hawassa Watershed.
The exchangeable sodium ratio higher than 1 is an indication of an excess level ofsodium in waters in comparison to calcium and magnesium. Thus, waters with a KRratio more than one are unsuitable for irrigation, while those with a ratio less than oneare suitable. In the Lake Hawassa watershed, KR ranged from 0.05 (MS3) to 1.08 (MS5)indicating that nearly all sampled water values are less than the prescribed limit andsuitable for irrigation [105].
KR =Na+
Mg+2 + Ca+2 (21)
All the ions are expressed in meq/L.
Int. J. Environ. Res. Public Health 2021, 18, 8904 18 of 31
3.2.3. Soluble Sodium Percentage (SSP) and Magnesium Adsorption Ratio (MAR)
Wilcox [106] has suggested a classification system for ranking agricultural water usedepending on SSP and estimated using the formula below.
SSP =Na+
Na+ + Ca+2 + Mg+2 ∗100, (22)
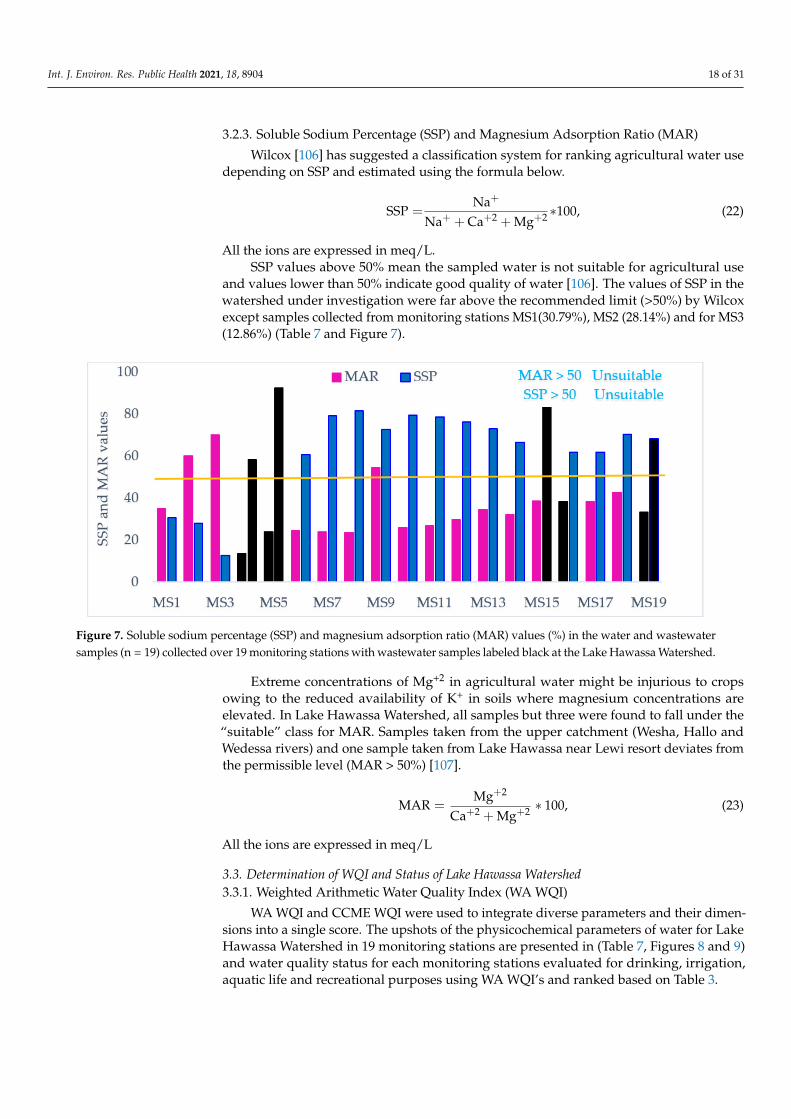
All the ions are expressed in meq/L.SSP values above 50% mean the sampled water is not suitable for agricultural use
and values lower than 50% indicate good quality of water [106]. The values of SSP in thewatershed under investigation were far above the recommended limit (>50%) by Wilcoxexcept samples collected from monitoring stations MS1(30.79%), MS2 (28.14%) and for MS3(12.86%) (Table 7 and Figure 7).
Int. J. Environ. Res. Public Health 2021, 18, x 19 of 33
Figure 7. Soluble sodium percentage (SSP) and magnesium adsorption ratio (MAR) values (%) in the water and wastewater samples (n = 19) collected over 19 monitoring stations with wastewater samples labeled black at the Lake Hawassa Watershed.
Extreme concentrations of Mg+2 in agricultural water might be injurious to crops owing to the reduced availability of K+ in soils where magnesium concentrations are elevated. In Lake Hawassa Watershed, all samples but three were found to fall under the “suitable” class for MAR. Samples taken from the upper catchment (Wesha, Hallo and Wedessa rivers) and one sample taken from Lake Hawassa near Lewi resort devi-ates from the permissible level (MAR >50%) [107].
100,* 2Mg2Ca
2Mg = MAR +++
+ (23)
All the ions are expressed in meq/L
3.3. Determination of WQI and Status of Lake Hawassa Watershed 3.3.1. Weighted Arithmetic Water Quality Index (WA WQI)
WA WQI and CCME WQI were used to integrate diverse parameters and their dimensions into a single score. The upshots of the physicochemical parameters of wa-ter for Lake Hawassa Watershed in 19 monitoring stations are presented in (Table 7, Figures 8 and 9) and water quality status for each monitoring stations evaluated for drinking, irrigation, aquatic life and recreational purposes using WA WQI’s and ranked based on Table 3.
Figure 7. Soluble sodium percentage (SSP) and magnesium adsorption ratio (MAR) values (%) in the water and wastewatersamples (n = 19) collected over 19 monitoring stations with wastewater samples labeled black at the Lake Hawassa Watershed.
Extreme concentrations of Mg+2 in agricultural water might be injurious to cropsowing to the reduced availability of K+ in soils where magnesium concentrations areelevated. In Lake Hawassa Watershed, all samples but three were found to fall under the“suitable” class for MAR. Samples taken from the upper catchment (Wesha, Hallo andWedessa rivers) and one sample taken from Lake Hawassa near Lewi resort deviates fromthe permissible level (MAR > 50%) [107].
MAR =Mg+2
Ca+2 + Mg+2 ∗ 100, (23)
All the ions are expressed in meq/L
3.3. Determination of WQI and Status of Lake Hawassa Watershed3.3.1. Weighted Arithmetic Water Quality Index (WA WQI)
WA WQI and CCME WQI were used to integrate diverse parameters and their dimen-sions into a single score. The upshots of the physicochemical parameters of water for LakeHawassa Watershed in 19 monitoring stations are presented in (Table 7, Figures 8 and 9)and water quality status for each monitoring stations evaluated for drinking, irrigation,aquatic life and recreational purposes using WA WQI’s and ranked based on Table 3.
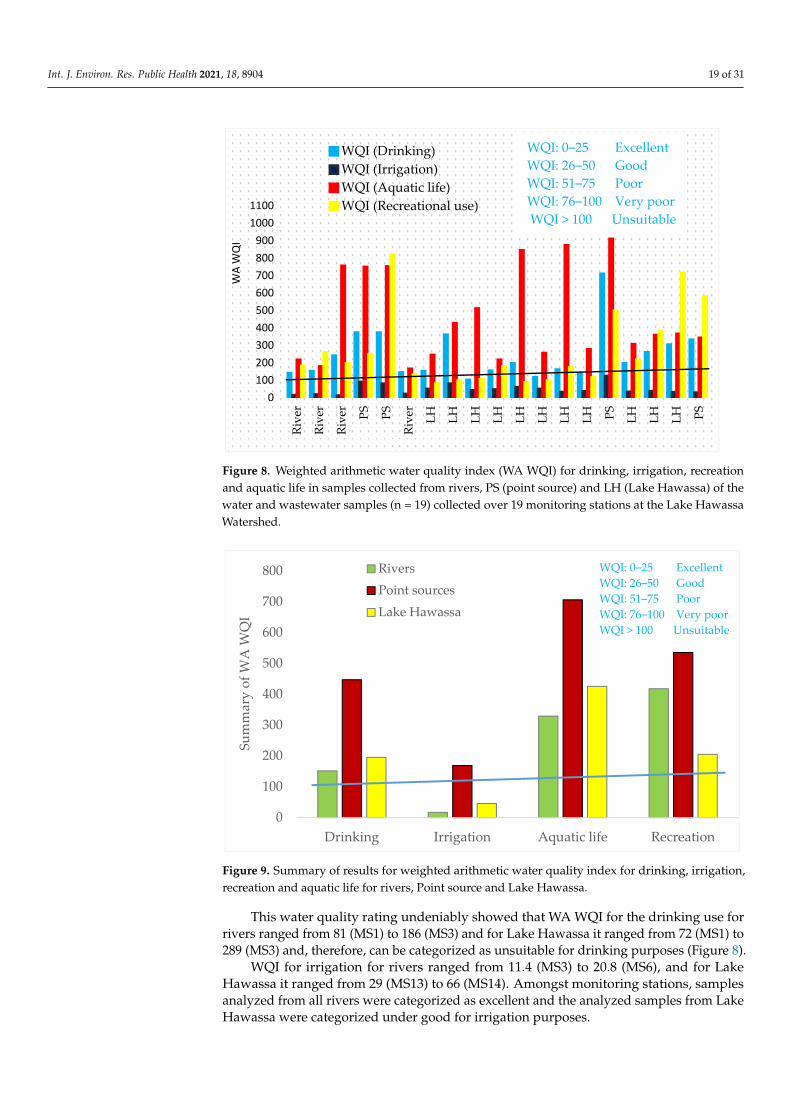
Int. J. Environ. Res. Public Health 2021, 18, 8904 19 of 31Int. J. Environ. Res. Public Health 2021, 18, x 20 of 33
Figure 8. Weighted arithmetic water quality index (WA WQI) for drinking, irrigation, recrea-tion and aquatic life in samples collected from rivers, PS (point source) and LH (Lake Ha-wassa) of the water and wastewater samples (n = 19) collected over 19 monitoring stations at the Lake Hawassa Watershed.
This water quality rating undeniably showed that WA WQI for the drinking use for rivers ranged from 81 (MS1) to 186 (MS3) and for Lake Hawassa it ranged from 72 (MS1) to 289 (MS3) and, therefore, can be categorized as unsuitable for drinking pur-poses (Figure 8).
WQI for irrigation for rivers ranged from 11.4 (MS3) to 20.8 (MS6), and for Lake Hawassa it ranged from 29 (MS13) to 66 (MS14). Amongst monitoring stations, sam-ples analyzed from all rivers were categorized as excellent and the analyzed samples from Lake Hawassa were categorized under good for irrigation purposes.
Additionally, WA WQI was also computed to evaluate the suitability of the stud-ied watershed for aquatic life and recreational purposes. It was observed that the com-puted WQI for rivers ranged from 159 (MS2) and 168 (MS1) and for Lake Hawassa it ranged from 210 (MS7) and 860 (MS13) for the aquatic life and, therefore, can be cate-gorized as unsuitable. The water bodies in the studied watershed were also very poor and unsuitable for recreational purposes as the WA WQI was above 80 in all monitored water sources.
To compare monitoring stations, we divided them in to three categories by taking into consideration the upper catchment, the middle catchment and Lake Hawassa. WA WQI was computed separately for rivers in the upper catchment (MS1–MS3 and MS6), Industrial effluents and the Referral Hospital (MS4, MS5, MS15 and MS19) and Lake Hawassa (MS7–MS18) to pinpoint where the problem precisely lies.
The findings revealed that the water quality of rivers in the upper catchment namely Wesha, Hallo, Wedessa and Tikur-Wuha (middle part) and Lake Hawassa was generally unsuitable for drinking, aquatic life and recreational purposes. However, the rivers possessed excellent water quality and Lake Hawassa water quality was good for irrigation purposes (Figure 9).
0100200300400500600700800900
10001100
Rive
r
Rive
r
Rive
r
PS PS
Rive
r
LH LH LH LH LH LH LH LH PS LH LH LH PS
WA
WQ
I
WQI (Drinking)WQI (Irrigation)WQI (Aquatic life)WQI (Recreational use)
WQI: 0–25 ExcellentWQI: 26–50 Good WQI: 51–75 PoorWQI: 76–100 Very poorWQI > 100 Unsuitable
Figure 8. Weighted arithmetic water quality index (WA WQI) for drinking, irrigation, recreationand aquatic life in samples collected from rivers, PS (point source) and LH (Lake Hawassa) of thewater and wastewater samples (n = 19) collected over 19 monitoring stations at the Lake HawassaWatershed.
Int. J. Environ. Res. Public Health 2021, 18, x 21 of 33
Figure 9. Summary of results for weighted arithmetic water quality index for drinking, irrigation, recreation and aquatic life for rivers, Point source and Lake Hawassa.
The topo to raster interpolation is among areal interpolation techniques that de-pict the spatial distribution of parameters. The interpolation result of appropriateness of water for agricultural use in Lake Hawassa Watershed revealed the irrigation water quality of the rivers on the uppermost part of the catchment is in the excellent and good classes that are in agreement with WA WQI and CCME WQI. The irrigation wa-ter quality of the watershed was reduced towards the industrial sites. The water qual-ity deterioration is because the two point sources (Moha soft drinks factory and BGI) releasing their effluents into the adjoining rivers. Additionally, the result also showed unsuitability of water quality for irrigation in some points of the watershed due to samples taken from Referral Hospital, BGI, Moha soft factory showing the point sources were not in a good condition. Generally, this interpolation result also revealed the city of Hawassa takes the lion’s share in Lake Hawassa pollution followed by ag-ricultural land use contribution. Here, the topo to raster interpolation was not applied for the western part of the Lake Hawassa Watershed, as there are no perennial streams feeding the lake (Figure 10).
Furthermore, the topo to raster interpolation of Lake Hawassa was conducted separately and the result showed that nearly all the sampling points are in the category of good quality for irrigation except one of the sampling points, the result of which was found to be poor for the sample taken from MS8 (Gudumale). This is because there was a small fish market near the site and it is nearer to the recreational facility that was serving for marriage ceremonies and for various events. Additionally, the site is near to the city of Hawassa, and as a result the urban runoff makes its way to the lake via this site. Additionally, this site is near to referral hospital and the service rendering facility. Due to this, the irrigation water quality is poor at this particular site. Generally, it was possible to conclude that the overall water quality of Lake Hawassa was in a good class for irrigation purposes, which is in agreement with WA WQI (Figure 11).
0
100
200
300
400
500
600
700
800
Drinking Irrigation Aquatic life Recreation
Sum
mar
y of
WA
WQ
I
Rivers
Point sources
Lake Hawassa
WQI: 0–25 ExcellentWQI: 26–50 Good WQI: 51–75 PoorWQI: 76–100 Very poorWQI > 100 Unsuitable
Figure 9. Summary of results for weighted arithmetic water quality index for drinking, irrigation,recreation and aquatic life for rivers, Point source and Lake Hawassa.
This water quality rating undeniably showed that WA WQI for the drinking use forrivers ranged from 81 (MS1) to 186 (MS3) and for Lake Hawassa it ranged from 72 (MS1) to289 (MS3) and, therefore, can be categorized as unsuitable for drinking purposes (Figure 8).
WQI for irrigation for rivers ranged from 11.4 (MS3) to 20.8 (MS6), and for LakeHawassa it ranged from 29 (MS13) to 66 (MS14). Amongst monitoring stations, samplesanalyzed from all rivers were categorized as excellent and the analyzed samples from LakeHawassa were categorized under good for irrigation purposes.
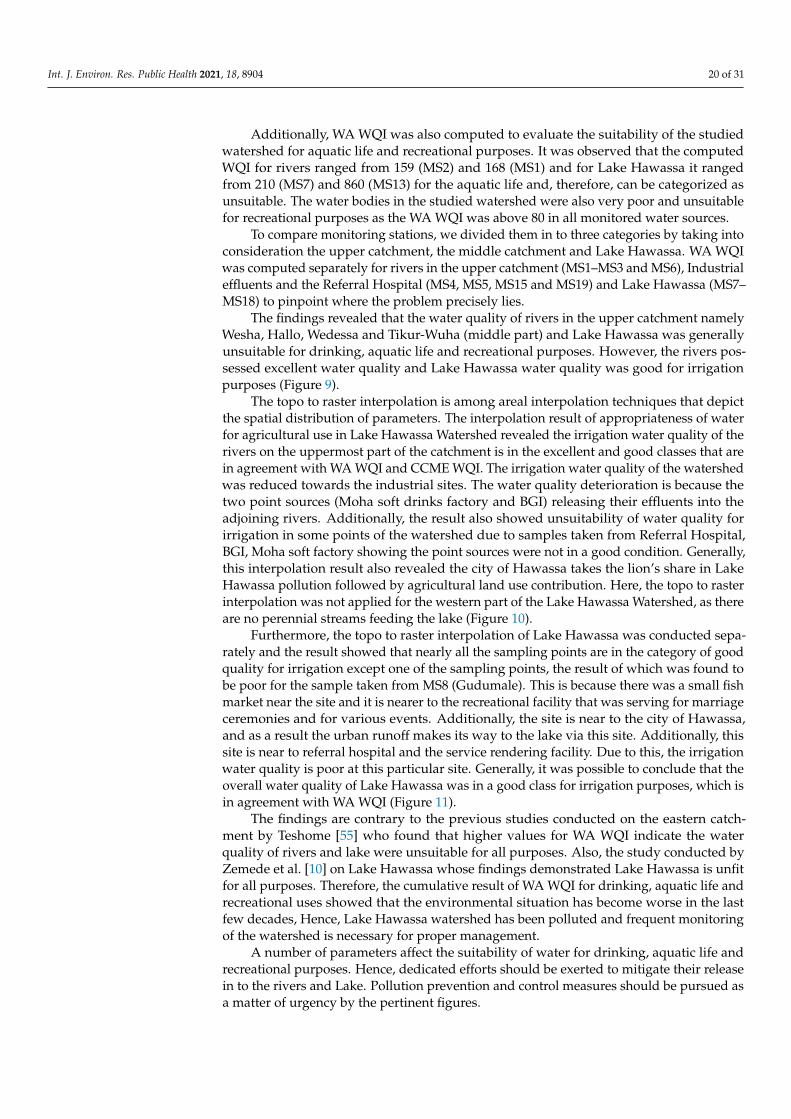
Int. J. Environ. Res. Public Health 2021, 18, 8904 20 of 31
Additionally, WA WQI was also computed to evaluate the suitability of the studiedwatershed for aquatic life and recreational purposes. It was observed that the computedWQI for rivers ranged from 159 (MS2) and 168 (MS1) and for Lake Hawassa it rangedfrom 210 (MS7) and 860 (MS13) for the aquatic life and, therefore, can be categorized asunsuitable. The water bodies in the studied watershed were also very poor and unsuitablefor recreational purposes as the WA WQI was above 80 in all monitored water sources.
To compare monitoring stations, we divided them in to three categories by taking intoconsideration the upper catchment, the middle catchment and Lake Hawassa. WA WQIwas computed separately for rivers in the upper catchment (MS1–MS3 and MS6), Industrialeffluents and the Referral Hospital (MS4, MS5, MS15 and MS19) and Lake Hawassa (MS7–MS18) to pinpoint where the problem precisely lies.
The findings revealed that the water quality of rivers in the upper catchment namelyWesha, Hallo, Wedessa and Tikur-Wuha (middle part) and Lake Hawassa was generallyunsuitable for drinking, aquatic life and recreational purposes. However, the rivers pos-sessed excellent water quality and Lake Hawassa water quality was good for irrigationpurposes (Figure 9).
The topo to raster interpolation is among areal interpolation techniques that depictthe spatial distribution of parameters. The interpolation result of appropriateness of waterfor agricultural use in Lake Hawassa Watershed revealed the irrigation water quality of therivers on the uppermost part of the catchment is in the excellent and good classes that arein agreement with WA WQI and CCME WQI. The irrigation water quality of the watershedwas reduced towards the industrial sites. The water quality deterioration is because thetwo point sources (Moha soft drinks factory and BGI) releasing their effluents into theadjoining rivers. Additionally, the result also showed unsuitability of water quality forirrigation in some points of the watershed due to samples taken from Referral Hospital,BGI, Moha soft factory showing the point sources were not in a good condition. Generally,this interpolation result also revealed the city of Hawassa takes the lion’s share in LakeHawassa pollution followed by agricultural land use contribution. Here, the topo to rasterinterpolation was not applied for the western part of the Lake Hawassa Watershed, as thereare no perennial streams feeding the lake (Figure 10).
Furthermore, the topo to raster interpolation of Lake Hawassa was conducted sepa-rately and the result showed that nearly all the sampling points are in the category of goodquality for irrigation except one of the sampling points, the result of which was found tobe poor for the sample taken from MS8 (Gudumale). This is because there was a small fishmarket near the site and it is nearer to the recreational facility that was serving for marriageceremonies and for various events. Additionally, the site is near to the city of Hawassa,and as a result the urban runoff makes its way to the lake via this site. Additionally, thissite is near to referral hospital and the service rendering facility. Due to this, the irrigationwater quality is poor at this particular site. Generally, it was possible to conclude that theoverall water quality of Lake Hawassa was in a good class for irrigation purposes, which isin agreement with WA WQI (Figure 11).
The findings are contrary to the previous studies conducted on the eastern catch-ment by Teshome [55] who found that higher values for WA WQI indicate the waterquality of rivers and lake were unsuitable for all purposes. Also, the study conducted byZemede et al. [10] on Lake Hawassa whose findings demonstrated Lake Hawassa is unfitfor all purposes. Therefore, the cumulative result of WA WQI for drinking, aquatic life andrecreational uses showed that the environmental situation has become worse in the lastfew decades, Hence, Lake Hawassa watershed has been polluted and frequent monitoringof the watershed is necessary for proper management.
A number of parameters affect the suitability of water for drinking, aquatic life andrecreational purposes. Hence, dedicated efforts should be exerted to mitigate their releasein to the rivers and Lake. Pollution prevention and control measures should be pursued asa matter of urgency by the pertinent figures.
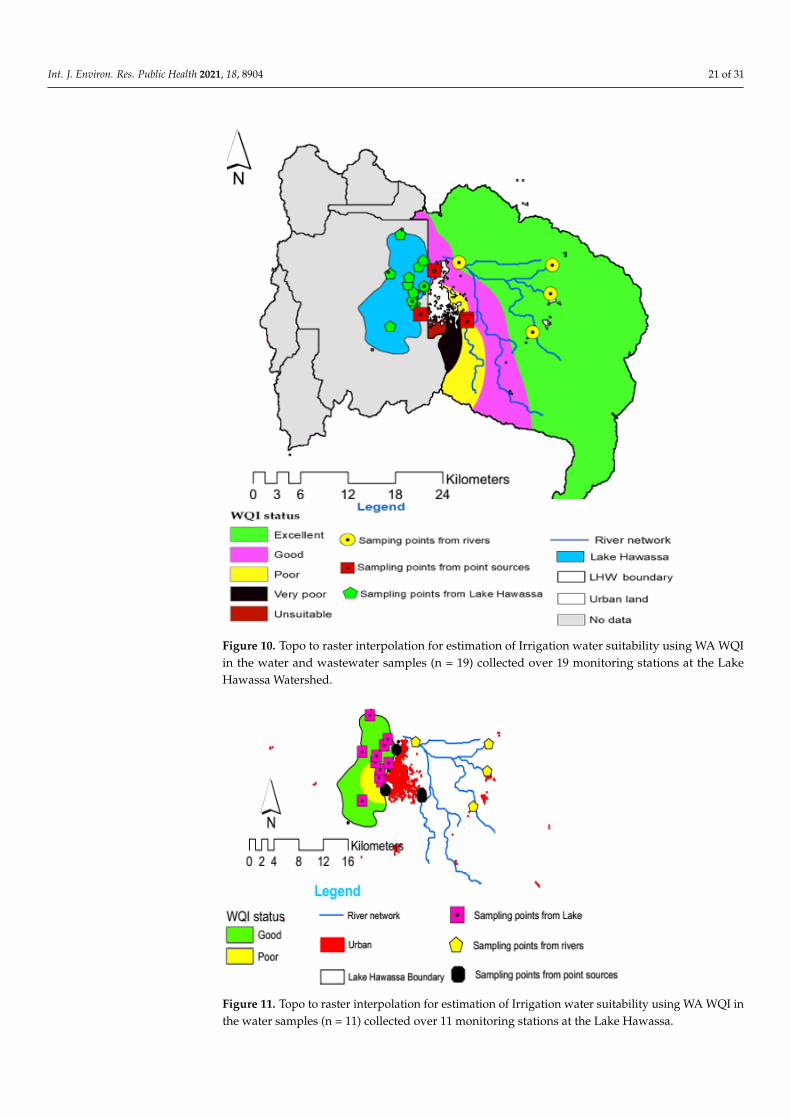
Int. J. Environ. Res. Public Health 2021, 18, 8904 21 of 31Int. J. Environ. Res. Public Health 2021, 18, x 22 of 33
Figure 10. Topo to raster interpolation for estimation of Irrigation water suitability using WA WQI in the water and wastewater samples (n = 19) collected over 19 monitoring stations at the Lake Hawassa Watershed.
Figure 11. Topo to raster interpolation for estimation of Irrigation water suitability using WA WQI in the water samples (n = 11) collected over 11 monitoring stations at the Lake Hawassa.
Figure 10. Topo to raster interpolation for estimation of Irrigation water suitability using WA WQIin the water and wastewater samples (n = 19) collected over 19 monitoring stations at the LakeHawassa Watershed.
Int. J. Environ. Res. Public Health 2021, 18, x 22 of 33
Figure 10. Topo to raster interpolation for estimation of Irrigation water suitability using WA WQI in the water and wastewater samples (n = 19) collected over 19 monitoring stations at the Lake Hawassa Watershed.
Figure 11. Topo to raster interpolation for estimation of Irrigation water suitability using WA WQI in the water samples (n = 11) collected over 11 monitoring stations at the Lake Hawassa. Figure 11. Topo to raster interpolation for estimation of Irrigation water suitability using WA WQI inthe water samples (n = 11) collected over 11 monitoring stations at the Lake Hawassa.
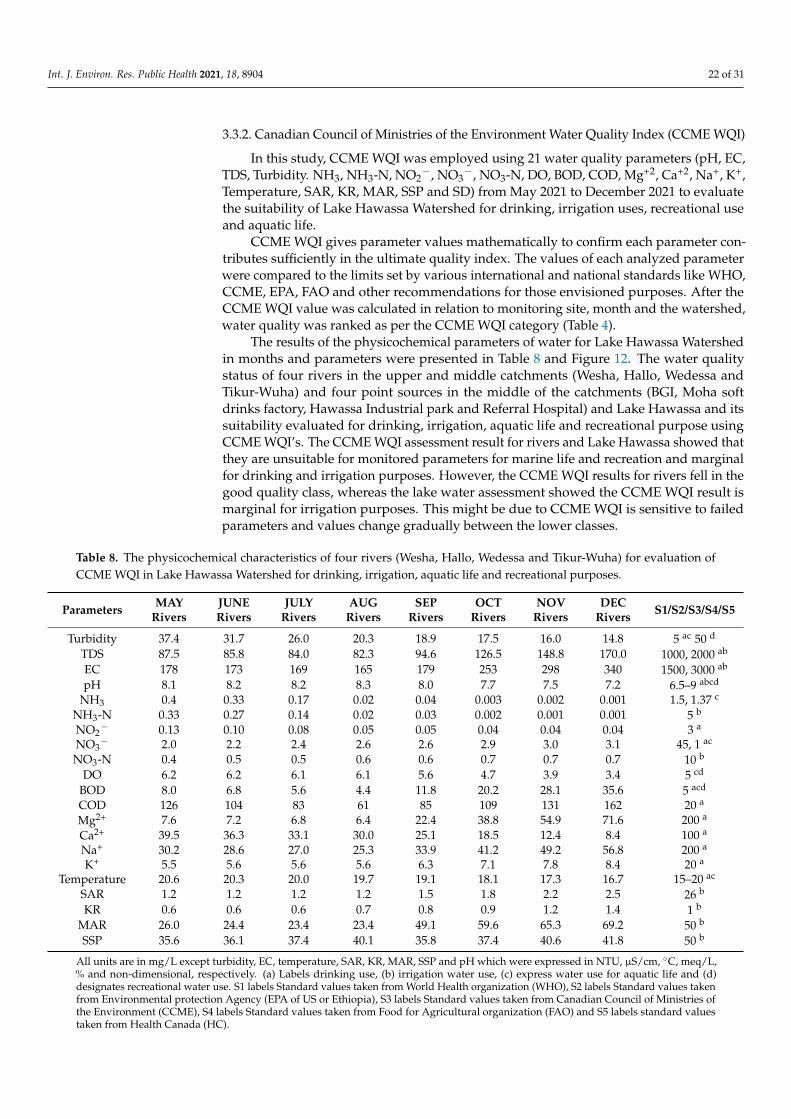
Int. J. Environ. Res. Public Health 2021, 18, 8904 22 of 31
3.3.2. Canadian Council of Ministries of the Environment Water Quality Index (CCME WQI)
In this study, CCME WQI was employed using 21 water quality parameters (pH, EC,TDS, Turbidity. NH3, NH3-N, NO2
−, NO3−, NO3-N, DO, BOD, COD, Mg+2, Ca+2, Na+, K+,
Temperature, SAR, KR, MAR, SSP and SD) from May 2021 to December 2021 to evaluatethe suitability of Lake Hawassa Watershed for drinking, irrigation uses, recreational useand aquatic life.
CCME WQI gives parameter values mathematically to confirm each parameter con-tributes sufficiently in the ultimate quality index. The values of each analyzed parameterwere compared to the limits set by various international and national standards like WHO,CCME, EPA, FAO and other recommendations for those envisioned purposes. After theCCME WQI value was calculated in relation to monitoring site, month and the watershed,water quality was ranked as per the CCME WQI category (Table 4).
The results of the physicochemical parameters of water for Lake Hawassa Watershedin months and parameters were presented in Table 8 and Figure 12. The water qualitystatus of four rivers in the upper and middle catchments (Wesha, Hallo, Wedessa andTikur-Wuha) and four point sources in the middle of the catchments (BGI, Moha softdrinks factory, Hawassa Industrial park and Referral Hospital) and Lake Hawassa and itssuitability evaluated for drinking, irrigation, aquatic life and recreational purpose usingCCME WQI’s. The CCME WQI assessment result for rivers and Lake Hawassa showed thatthey are unsuitable for monitored parameters for marine life and recreation and marginalfor drinking and irrigation purposes. However, the CCME WQI results for rivers fell in thegood quality class, whereas the lake water assessment showed the CCME WQI result ismarginal for irrigation purposes. This might be due to CCME WQI is sensitive to failedparameters and values change gradually between the lower classes.
Table 8. The physicochemical characteristics of four rivers (Wesha, Hallo, Wedessa and Tikur-Wuha) for evaluation ofCCME WQI in Lake Hawassa Watershed for drinking, irrigation, aquatic life and recreational purposes.
Parameters MAYRivers
JUNERivers
JULYRivers
AUGRivers
SEPRivers
OCTRivers
NOVRivers
DECRivers S1/S2/S3/S4/S5
Turbidity 37.4 31.7 26.0 20.3 18.9 17.5 16.0 14.8 5 ac 50 d
TDS 87.5 85.8 84.0 82.3 94.6 126.5 148.8 170.0 1000, 2000 ab
EC 178 173 169 165 179 253 298 340 1500, 3000 ab
pH 8.1 8.2 8.2 8.3 8.0 7.7 7.5 7.2 6.5–9 abcd
NH3 0.4 0.33 0.17 0.02 0.04 0.003 0.002 0.001 1.5, 1.37 c
NH3-N 0.33 0.27 0.14 0.02 0.03 0.002 0.001 0.001 5 b
NO2− 0.13 0.10 0.08 0.05 0.05 0.04 0.04 0.04 3 a
NO3− 2.0 2.2 2.4 2.6 2.6 2.9 3.0 3.1 45, 1 ac
NO3-N 0.4 0.5 0.5 0.6 0.6 0.7 0.7 0.7 10 b
DO 6.2 6.2 6.1 6.1 5.6 4.7 3.9 3.4 5 cd
BOD 8.0 6.8 5.6 4.4 11.8 20.2 28.1 35.6 5 acd
COD 126 104 83 61 85 109 131 162 20 a
Mg2+ 7.6 7.2 6.8 6.4 22.4 38.8 54.9 71.6 200 a
Ca2+ 39.5 36.3 33.1 30.0 25.1 18.5 12.4 8.4 100 a
Na+ 30.2 28.6 27.0 25.3 33.9 41.2 49.2 56.8 200 a
K+ 5.5 5.6 5.6 5.6 6.3 7.1 7.8 8.4 20 a
Temperature 20.6 20.3 20.0 19.7 19.1 18.1 17.3 16.7 15–20 ac
SAR 1.2 1.2 1.2 1.2 1.5 1.8 2.2 2.5 26 b
KR 0.6 0.6 0.6 0.7 0.8 0.9 1.2 1.4 1 b
MAR 26.0 24.4 23.4 23.4 49.1 59.6 65.3 69.2 50 b
SSP 35.6 36.1 37.4 40.1 35.8 37.4 40.6 41.8 50 b
All units are in mg/L except turbidity, EC, temperature, SAR, KR, MAR, SSP and pH which were expressed in NTU, µS/cm, ◦C, meq/L,% and non-dimensional, respectively. (a) Labels drinking use, (b) irrigation water use, (c) express water use for aquatic life and (d)designates recreational water use. S1 labels Standard values taken from World Health organization (WHO), S2 labels Standard values takenfrom Environmental protection Agency (EPA of US or Ethiopia), S3 labels Standard values taken from Canadian Council of Ministries ofthe Environment (CCME), S4 labels Standard values taken from Food for Agricultural organization (FAO) and S5 labels standard valuestaken from Health Canada (HC).
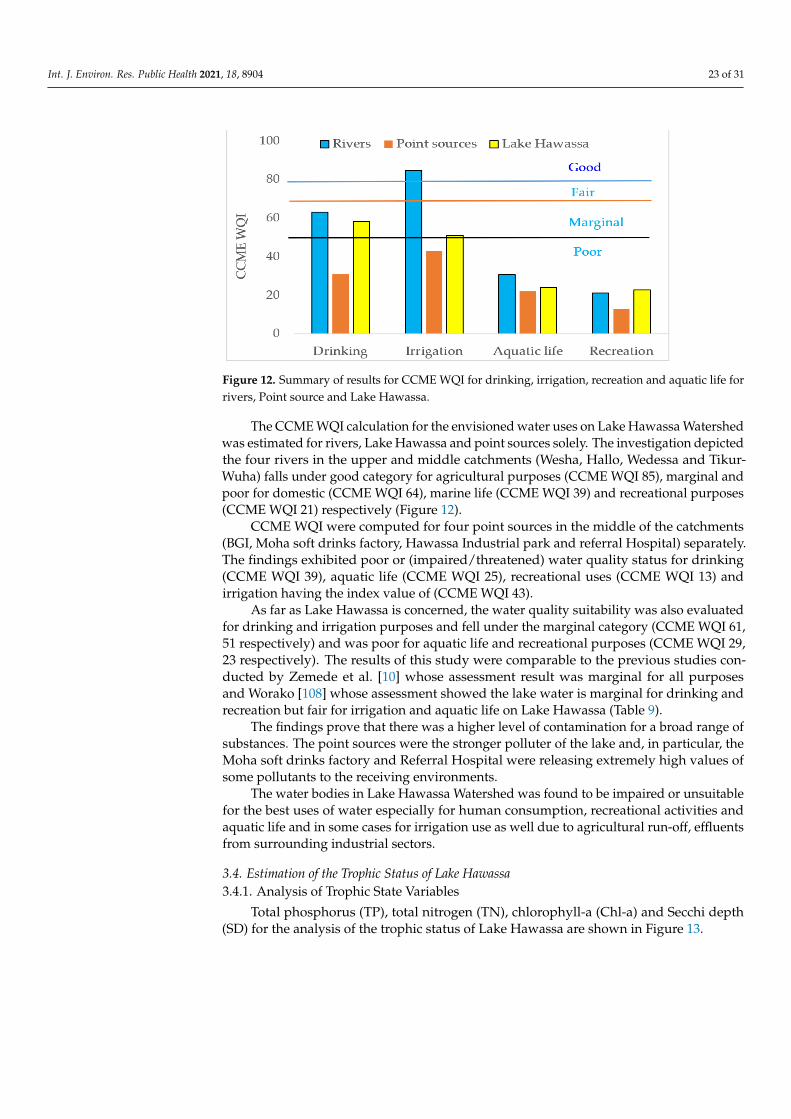
Int. J. Environ. Res. Public Health 2021, 18, 8904 23 of 31
Int. J. Environ. Res. Public Health 2021, 18, x 23 of 33
The findings are contrary to the previous studies conducted on the eastern catch-ment by Teshome [55] who found that higher values for WA WQI indicate the water quality of rivers and lake were unsuitable for all purposes. Also, the study conducted by Zemede et al. [10] on Lake Hawassa whose findings demonstrated Lake Hawassa is unfit for all purposes. Therefore, the cumulative result of WA WQI for drinking, aquatic life and recreational uses showed that the environmental situation has become worse in the last few decades, Hence, Lake Hawassa watershed has been polluted and frequent monitoring of the watershed is necessary for proper management.
A number of parameters affect the suitability of water for drinking, aquatic life and recreational purposes. Hence, dedicated efforts should be exerted to mitigate their release in to the rivers and Lake. Pollution prevention and control measures should be pursued as a matter of urgency by the pertinent figures.
3.3.2. Canadian Council of Ministries of the Environment Water Quality Index (CCME WQI)
In this study, CCME WQI was employed using 21 water quality parameters (pH, EC, TDS, Turbidity. NH3, NH3-N, NO2−, NO3−, NO3-N, DO, BOD, COD, Mg+2, Ca+2, Na+, K+, Temperature, SAR, KR, MAR, SSP and SD) from May 2021 to December 2021 to evaluate the suitability of Lake Hawassa Watershed for drinking, irrigation uses, rec-reational use and aquatic life.
CCME WQI gives parameter values mathematically to confirm each parameter contributes sufficiently in the ultimate quality index. The values of each analyzed pa-rameter were compared to the limits set by various international and national stand-ards like WHO, CCME, EPA, FAO and other recommendations for those envisioned purposes. After the CCME WQI value was calculated in relation to monitoring site, month and the watershed, water quality was ranked as per the CCME WQI category (Table 4).
The results of the physicochemical parameters of water for Lake Hawassa Water-shed in months and parameters were presented in Table 8 and Figure 12. The water quality status of four rivers in the upper and middle catchments (Wesha, Hallo, Wedessa and Tikur-Wuha) and four point sources in the middle of the catchments (BGI, Moha soft drinks factory, Hawassa Industrial park and Referral Hospital) and Lake Hawassa and its suitability evaluated for drinking, irrigation, aquatic life and recreational purpose using CCME WQI’s. The CCME WQI assessment result for rivers and Lake Hawassa showed that they are unsuitable for monitored parameters for ma-rine life and recreation and marginal for drinking and irrigation purposes. However, the CCME WQI results for rivers fell in the good quality class, whereas the lake water assessment showed the CCME WQI result is marginal for irrigation purposes. This might be due to CCME WQI is sensitive to failed parameters and values change grad-ually between the lower classes.
Figure 12. Summary of results for CCME WQI for drinking, irrigation, recreation and aquatic life forrivers, Point source and Lake Hawassa.
The CCME WQI calculation for the envisioned water uses on Lake Hawassa Watershedwas estimated for rivers, Lake Hawassa and point sources solely. The investigation depictedthe four rivers in the upper and middle catchments (Wesha, Hallo, Wedessa and Tikur-Wuha) falls under good category for agricultural purposes (CCME WQI 85), marginal andpoor for domestic (CCME WQI 64), marine life (CCME WQI 39) and recreational purposes(CCME WQI 21) respectively (Figure 12).
CCME WQI were computed for four point sources in the middle of the catchments(BGI, Moha soft drinks factory, Hawassa Industrial park and referral Hospital) separately.The findings exhibited poor or (impaired/threatened) water quality status for drinking(CCME WQI 39), aquatic life (CCME WQI 25), recreational uses (CCME WQI 13) andirrigation having the index value of (CCME WQI 43).
As far as Lake Hawassa is concerned, the water quality suitability was also evaluatedfor drinking and irrigation purposes and fell under the marginal category (CCME WQI 61,51 respectively) and was poor for aquatic life and recreational purposes (CCME WQI 29,23 respectively). The results of this study were comparable to the previous studies con-ducted by Zemede et al. [10] whose assessment result was marginal for all purposesand Worako [108] whose assessment showed the lake water is marginal for drinking andrecreation but fair for irrigation and aquatic life on Lake Hawassa (Table 9).
The findings prove that there was a higher level of contamination for a broad range ofsubstances. The point sources were the stronger polluter of the lake and, in particular, theMoha soft drinks factory and Referral Hospital were releasing extremely high values ofsome pollutants to the receiving environments.
The water bodies in Lake Hawassa Watershed was found to be impaired or unsuitablefor the best uses of water especially for human consumption, recreational activities andaquatic life and in some cases for irrigation use as well due to agricultural run-off, effluentsfrom surrounding industrial sectors.
3.4. Estimation of the Trophic Status of Lake Hawassa3.4.1. Analysis of Trophic State Variables
Total phosphorus (TP), total nitrogen (TN), chlorophyll-a (Chl-a) and Secchi depth(SD) for the analysis of the trophic status of Lake Hawassa are shown in Figure 13.
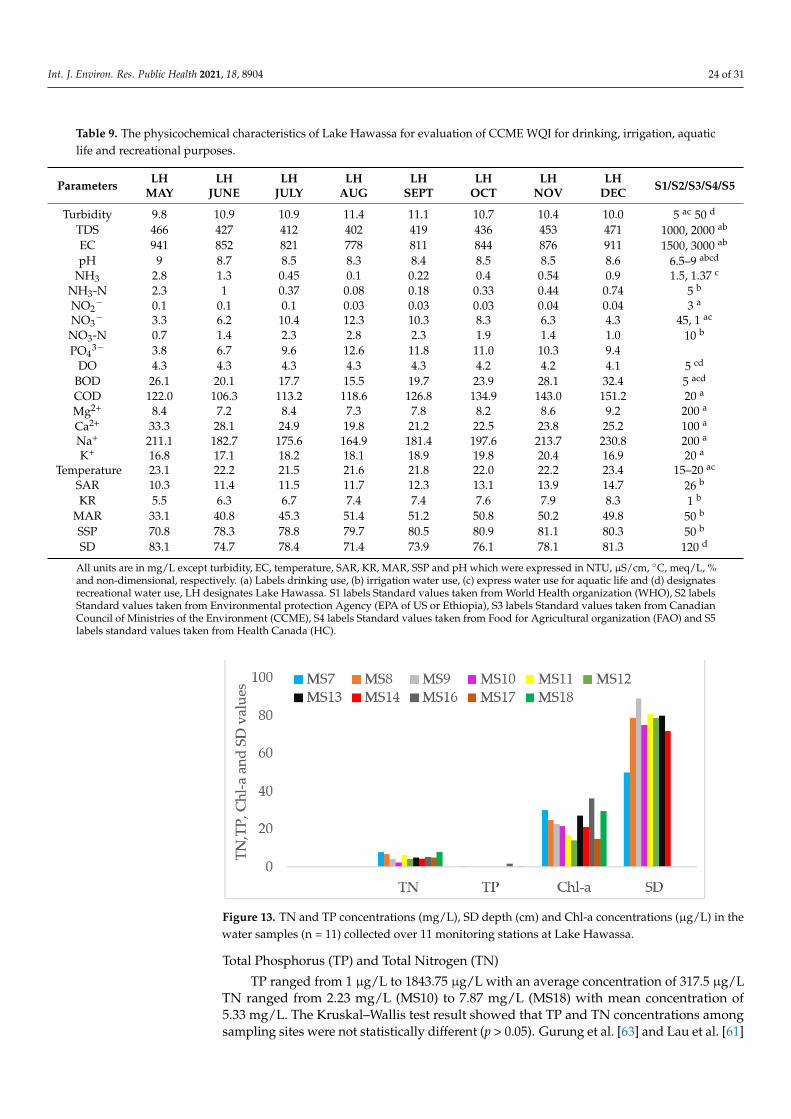
Int. J. Environ. Res. Public Health 2021, 18, 8904 24 of 31
Table 9. The physicochemical characteristics of Lake Hawassa for evaluation of CCME WQI for drinking, irrigation, aquaticlife and recreational purposes.
Parameters LHMAY
LHJUNE
LHJULY
LHAUG
LHSEPT
LHOCT
LHNOV
LHDEC S1/S2/S3/S4/S5
Turbidity 9.8 10.9 10.9 11.4 11.1 10.7 10.4 10.0 5 ac 50 d
TDS 466 427 412 402 419 436 453 471 1000, 2000 ab
EC 941 852 821 778 811 844 876 911 1500, 3000 ab
pH 9 8.7 8.5 8.3 8.4 8.5 8.5 8.6 6.5–9 abcd
NH3 2.8 1.3 0.45 0.1 0.22 0.4 0.54 0.9 1.5, 1.37 c
NH3-N 2.3 1 0.37 0.08 0.18 0.33 0.44 0.74 5 b
NO2− 0.1 0.1 0.1 0.03 0.03 0.03 0.04 0.04 3 a
NO3− 3.3 6.2 10.4 12.3 10.3 8.3 6.3 4.3 45, 1 ac
NO3-N 0.7 1.4 2.3 2.8 2.3 1.9 1.4 1.0 10 b
PO43− 3.8 6.7 9.6 12.6 11.8 11.0 10.3 9.4
DO 4.3 4.3 4.3 4.3 4.3 4.2 4.2 4.1 5 cd
BOD 26.1 20.1 17.7 15.5 19.7 23.9 28.1 32.4 5 acd
COD 122.0 106.3 113.2 118.6 126.8 134.9 143.0 151.2 20 a
Mg2+ 8.4 7.2 8.4 7.3 7.8 8.2 8.6 9.2 200 a
Ca2+ 33.3 28.1 24.9 19.8 21.2 22.5 23.8 25.2 100 a
Na+ 211.1 182.7 175.6 164.9 181.4 197.6 213.7 230.8 200 a
K+ 16.8 17.1 18.2 18.1 18.9 19.8 20.4 16.9 20 a
Temperature 23.1 22.2 21.5 21.6 21.8 22.0 22.2 23.4 15–20 ac
SAR 10.3 11.4 11.5 11.7 12.3 13.1 13.9 14.7 26 b
KR 5.5 6.3 6.7 7.4 7.4 7.6 7.9 8.3 1 b
MAR 33.1 40.8 45.3 51.4 51.2 50.8 50.2 49.8 50 b
SSP 70.8 78.3 78.8 79.7 80.5 80.9 81.1 80.3 50 b
SD 83.1 74.7 78.4 71.4 73.9 76.1 78.1 81.3 120 d
All units are in mg/L except turbidity, EC, temperature, SAR, KR, MAR, SSP and pH which were expressed in NTU, µS/cm, ◦C, meq/L, %and non-dimensional, respectively. (a) Labels drinking use, (b) irrigation water use, (c) express water use for aquatic life and (d) designatesrecreational water use, LH designates Lake Hawassa. S1 labels Standard values taken from World Health organization (WHO), S2 labelsStandard values taken from Environmental protection Agency (EPA of US or Ethiopia), S3 labels Standard values taken from CanadianCouncil of Ministries of the Environment (CCME), S4 labels Standard values taken from Food for Agricultural organization (FAO) and S5labels standard values taken from Health Canada (HC).
Int. J. Environ. Res. Public Health 2021, 18, x 26 of 33
Figure 13. TN and TP concentrations (mg/L), SD depth (cm) and Chl-a concentrations (µg/L) in the water samples (n = 11) collected over 11 monitoring stations at Lake Hawassa.
Total Phosphorus (TP) and Total Nitrogen (TN) TP ranged from 1 µg/L to 1843.75 µg/L with an average concentration of 317.5
µg/L TN ranged from 2.23 mg/L (MS10) to 7.87 mg/L (MS18) with mean concentration of 5.33 mg/L. The Kruskal–Wallis test result showed that TP and TN concentrations among sampling sites were not statistically different (p > 0.05). Gurung et al. [63] and Lau et al. [61] classified the trophic status based on the level of phosphorous and ni-trogen. The lake is labelled as oligotrophic when TN (0.65–1.2) mg/L, TP (0.03–0.1) mg/L, mesotrophic if TN (0.35–0.65) mg/L, TP (0.01–0.03) mg/L, eutrophic when TN (0.65–1.2) mg/L and TP (0.03–0.1) mg/L and hypertrophic if TN > 1.2 mg/L and TP > 0.1 mg/L (Table 6).
Hence, Lake Hawassa is categorized as hypertrophic having mean TP and TN value of 320 µg/L and 5.33 mg/L, respectively. Phosphorus concentration greater than 300 µg/L [109] shows the impairment of the lake water by anthropogenic factors. The findings are comparable to the previous studies conducted on Lake Hawassa by Worako [6] and lower than the findings of Tibebe et al. [76] conducted on Zeway Lake.
Total Nitrogen to Total Phosphorus (TN:TP) Ratio The TN:TP ratio in lakes and reservoirs is a key element as it gives an idea of
which of these nutrients are either in excess or limiting to growth, and it was used to estimate the nutrient limitation in the lake. According to Smith [110] blue-green algae (cyanobacteria) had a capacity to dominate in the lake section when the TN:TP ratio was less than 29 and it tends to be rare in the lake when TN:TP >29.
On the other hand, Fisher et al. [111] used more conservative ratio of the TN:TP and the ratio >20 designated as phosphorus limitation and nitrogen limitation when the ratio is <10, while TN:TP ratio 10 to 16 demonstrates either phosphorus or nitrogen (or both) are limiting for growth. The estimated ratio for Lake Hawassa was 31.1 which is higher than 20 and 30 in the lake under investigation revealing cyanobacteria dom-inance in the lake section is rare. The TN:TP ratio >20 in Lake Hawassa indicated that phytoplankton growth in the lake might be phosphorous deficient. Studies conducted on some Rift Valley lakes, namely Lakes Ziway and Hawasa, by Tilahun and Ahlgren, [29] and Lake Zeway by Tibebe et al. [76] revealed that the lakes were found to be phosphorus limiting having a TN:TP ratio higher than 20.
Figure 13. TN and TP concentrations (mg/L), SD depth (cm) and Chl-a concentrations (µg/L) in thewater samples (n = 11) collected over 11 monitoring stations at Lake Hawassa.
Total Phosphorus (TP) and Total Nitrogen (TN)
TP ranged from 1 µg/L to 1843.75 µg/L with an average concentration of 317.5 µg/LTN ranged from 2.23 mg/L (MS10) to 7.87 mg/L (MS18) with mean concentration of5.33 mg/L. The Kruskal–Wallis test result showed that TP and TN concentrations amongsampling sites were not statistically different (p > 0.05). Gurung et al. [63] and Lau et al. [61]
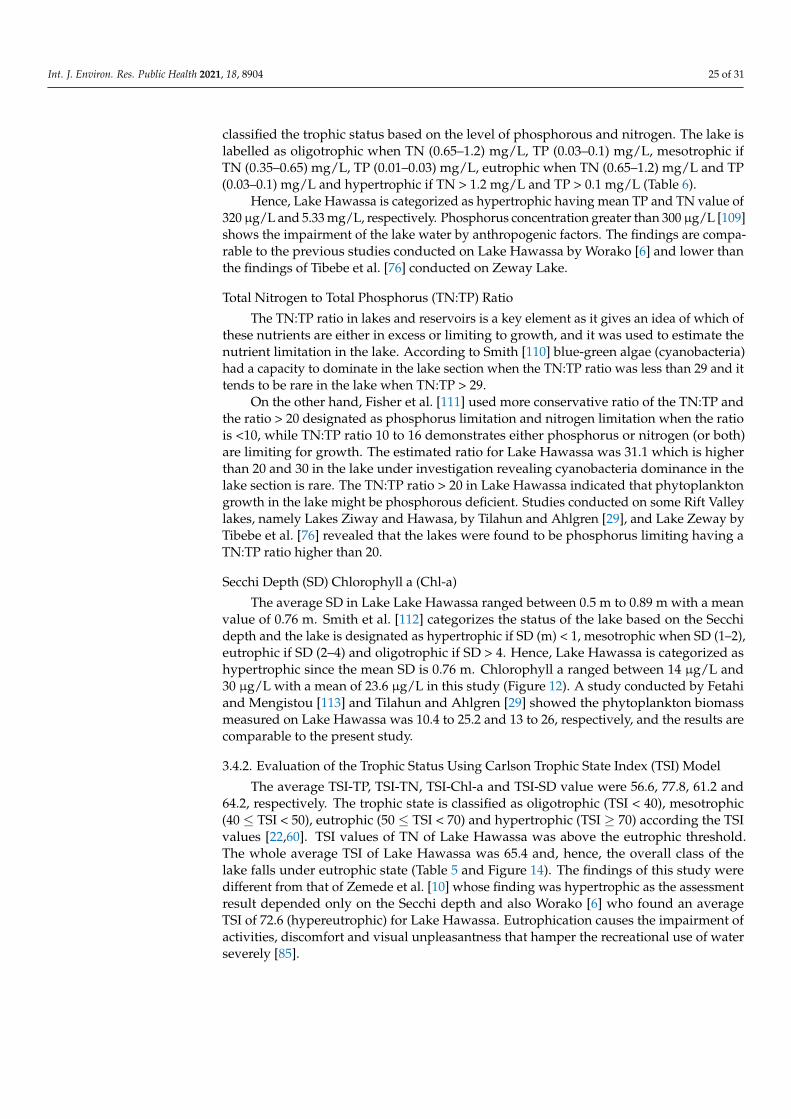
Int. J. Environ. Res. Public Health 2021, 18, 8904 25 of 31
classified the trophic status based on the level of phosphorous and nitrogen. The lake islabelled as oligotrophic when TN (0.65–1.2) mg/L, TP (0.03–0.1) mg/L, mesotrophic ifTN (0.35–0.65) mg/L, TP (0.01–0.03) mg/L, eutrophic when TN (0.65–1.2) mg/L and TP(0.03–0.1) mg/L and hypertrophic if TN > 1.2 mg/L and TP > 0.1 mg/L (Table 6).
Hence, Lake Hawassa is categorized as hypertrophic having mean TP and TN value of320 µg/L and 5.33 mg/L, respectively. Phosphorus concentration greater than 300 µg/L [109]shows the impairment of the lake water by anthropogenic factors. The findings are compa-rable to the previous studies conducted on Lake Hawassa by Worako [6] and lower thanthe findings of Tibebe et al. [76] conducted on Zeway Lake.
Total Nitrogen to Total Phosphorus (TN:TP) Ratio
The TN:TP ratio in lakes and reservoirs is a key element as it gives an idea of which ofthese nutrients are either in excess or limiting to growth, and it was used to estimate thenutrient limitation in the lake. According to Smith [110] blue-green algae (cyanobacteria)had a capacity to dominate in the lake section when the TN:TP ratio was less than 29 and ittends to be rare in the lake when TN:TP > 29.
On the other hand, Fisher et al. [111] used more conservative ratio of the TN:TP andthe ratio > 20 designated as phosphorus limitation and nitrogen limitation when the ratiois <10, while TN:TP ratio 10 to 16 demonstrates either phosphorus or nitrogen (or both)are limiting for growth. The estimated ratio for Lake Hawassa was 31.1 which is higherthan 20 and 30 in the lake under investigation revealing cyanobacteria dominance in thelake section is rare. The TN:TP ratio > 20 in Lake Hawassa indicated that phytoplanktongrowth in the lake might be phosphorous deficient. Studies conducted on some Rift Valleylakes, namely Lakes Ziway and Hawasa, by Tilahun and Ahlgren [29], and Lake Zeway byTibebe et al. [76] revealed that the lakes were found to be phosphorus limiting having aTN:TP ratio higher than 20.
Secchi Depth (SD) Chlorophyll a (Chl-a)
The average SD in Lake Lake Hawassa ranged between 0.5 m to 0.89 m with a meanvalue of 0.76 m. Smith et al. [112] categorizes the status of the lake based on the Secchidepth and the lake is designated as hypertrophic if SD (m) < 1, mesotrophic when SD (1–2),eutrophic if SD (2–4) and oligotrophic if SD > 4. Hence, Lake Hawassa is categorized ashypertrophic since the mean SD is 0.76 m. Chlorophyll a ranged between 14 µg/L and30 µg/L with a mean of 23.6 µg/L in this study (Figure 12). A study conducted by Fetahiand Mengistou [113] and Tilahun and Ahlgren [29] showed the phytoplankton biomassmeasured on Lake Hawassa was 10.4 to 25.2 and 13 to 26, respectively, and the results arecomparable to the present study.
3.4.2. Evaluation of the Trophic Status Using Carlson Trophic State Index (TSI) Model
The average TSI-TP, TSI-TN, TSI-Chl-a and TSI-SD value were 56.6, 77.8, 61.2 and64.2, respectively. The trophic state is classified as oligotrophic (TSI < 40), mesotrophic(40 ≤ TSI < 50), eutrophic (50 ≤ TSI < 70) and hypertrophic (TSI ≥ 70) according the TSIvalues [22,60]. TSI values of TN of Lake Hawassa was above the eutrophic threshold.The whole average TSI of Lake Hawassa was 65.4 and, hence, the overall class of thelake falls under eutrophic state (Table 5 and Figure 14). The findings of this study weredifferent from that of Zemede et al. [10] whose finding was hypertrophic as the assessmentresult depended only on the Secchi depth and also Worako [6] who found an averageTSI of 72.6 (hypereutrophic) for Lake Hawassa. Eutrophication causes the impairment ofactivities, discomfort and visual unpleasantness that hamper the recreational use of waterseverely [85].
Int. J. Environ. Res. Public Health 2021, 18, 8904 26 of 31
Int. J. Environ. Res. Public Health 2021, 18, x 27 of 33
Secchi Depth (SD) Chlorophyll a (Chl-a) The average SD in Lake Lake Hawassa ranged between 0.5 m to 0.89 m with a
mean value of 0.76 m. Smith et al. [112] categorizes the status of the lake based on the Secchi depth and the lake is designated as hypertrophic if SD (m) <1, mesotrophic when SD (1–2), eutrophic if SD (2–4) and oligotrophic if SD >4. Hence, Lake Hawassa is categorized as hypertrophic since the mean SD is 0.76 m. Chlorophyll a ranged be-tween 14 µg/L and 30 µg/L with a mean of 23.6 µg/L in this study (Figure 12). A study conducted by Fetahi and Mengistou [113] and Tilahun and Ahlgren [29] showed the phytoplankton biomass measured on Lake Hawassa was 10.4 to 25.2 and 13 to 26, re-spectively, and the results are comparable to the present study.
3.4.2. Evaluation of the Trophic Status Using Carlson Trophic State Index (TSI) Model The average TSI-TP, TSI-TN, TSI-Chl-a and TSI-SD value were 56.6, 77.8, 61.2 and
64.2, respectively. The trophic state is classified as oligotrophic (TSI < 40), mesotrophic (40 < = TSI < 50), eutrophic (50 < = TSI < 70) and hypertrophic (TSI > = 70) according the TSI values [22,60]. TSI values of TN of Lake Hawassa was above the eutrophic thresh-old. The whole average TSI of Lake Hawassa was 65.4 and, hence, the overall class of the lake falls under eutrophic state (Table 5 and Figure 14). The findings of this study were different from that of Zemede et al. [10] whose finding was hypertrophic as the assessment result depended only on the Secchi depth and also Worako [6] who found an average TSI of 72.6 (hypereutrophic) for Lake Hawassa. Eutrophication causes the impairment of activities, discomfort and visual unpleasantness that hamper the recre-ational use of water severely [85].
Figure 14. TSI-TN concentrations (mg/L), TSI-TP and TSI-Chl-a concentrations (µg/L) and TSI-SD depth (cm) of trophic variables in the water samples (n = 11) collected over 11 monitoring stations at Lake Hawassa.
4. Conclusions WQIs connote analysis of a variety of parameters into a sole value that offers the
chance to evaluate existing water quality situations by classifying water bodies into definite classes. Likewise, in WQIs a communal summary for reference is provided for ranking different water bodies and identifying variations in quality conditions. De-spite the various uses, WQI might not convey satisfactory information about the exist-ing water quality statuses of water bodies. Therefore, the water users and water au-thorities may adopt the WQIs with slight modifications to conform to local situations.
This investigation made use of two different WQI indices to evaluate the water quality status of Lake Hawassa Watershed in order to obtain comparative performance of the different approaches. In addition, Carlson’s TSI, were used to obtain a compre-
Figure 14. TSI-TN concentrations (mg/L), TSI-TP and TSI-Chl-a concentrations (µg/L) and TSI-SDdepth (cm) of trophic variables in the water samples (n = 11) collected over 11 monitoring stations atLake Hawassa.
4. Conclusions
WQIs connote analysis of a variety of parameters into a sole value that offers thechance to evaluate existing water quality situations by classifying water bodies into definiteclasses. Likewise, in WQIs a communal summary for reference is provided for rankingdifferent water bodies and identifying variations in quality conditions. Despite the varioususes, WQI might not convey satisfactory information about the existing water qualitystatuses of water bodies. Therefore, the water users and water authorities may adopt theWQIs with slight modifications to conform to local situations.
This investigation made use of two different WQI indices to evaluate the water qualitystatus of Lake Hawassa Watershed in order to obtain comparative performance of thedifferent approaches. In addition, Carlson’s TSI, were used to obtain a comprehensivevisualization of the quality of Lake Hawassa. The water quality of the watershed wasbroadly classified into unsuitable to excellent based on the envisioned usage and samplinglocations. The findings of the water quality index of rivers and lakes showed, they wereunsuitable for drinking, marine life and recreational purposes. In particular, in WA WQIclassifications rivers fall in the excellent category and Lake Hawassa falls in the goodcategory for irrigation purposes; while, the CCME WQI is a conservative approach whoserange of values change gradually between the lower classes and rivers fall in the goodcategory and Lake Hawassa falls in the marginal category for irrigation purposes. Hence,the discrepancy in the results of the two indices observed are imperative in order to considermeasures that are more reliable. The topo to raster interpolation were carried out for boththe watershed and Lake Hawassa separately and the results were in line with the findingsof WA WQI and CCME WQI. To sum up, according to all indices, both lake and river waterare unsuitable for drinking, marine life and recreational purposes. Even for irrigationpurposes, the lake water is not suitable. Similarly, the overall category of Lake Hawassafalls under the eutrophic state and the lake is phosphorous-deficient. Similarly, the overallcategory of Lake Hawassa falls in the eutrophic state and the lake is phosphorous-deficient.These alarming assessments show the urgent need for pollution mitigation and controlmeasures as a matter of urgency.
The findings publicize that the lake is suffering from various deficits, high nutrientconcentrations, ammonia toxicity and oxygen depletion. The high COD and BOD valuesare partly due to direct emissions but also to the growth of organic matter in the lake water.Its degradation leads to reduced DO levels or even anaerobic conditions in deeper layers.The resulting threat to marine life is also endangering the fishery in the lake.
Also, the observed high nutrient concentrations and ammonia toxicity were attributedto TN, TP, NO2
−, NO3−, TP, SRP and the un-ionized form of ammonia. These values
emanated from the direct release from point sources that are the principal contributors
Int. J. Environ. Res. Public Health 2021, 18, 8904 27 of 31
and non-point sources such as agricultural land use (inorganic nitrogen and phosphorousfertilizers) and urban runoff during rainy season.
The findings of the study showed the environmental situation became worse in thelast decade and Lake Hawassa watershed is known to be polluted. The dramatic worseningof the situation in Lake Hawassa Watershed was due to urbanization, usage of fertilizersin agricultural lands, effluents from industrial facilities, excessive usage of detergents indomestic and industrial facilities, soil erosion, increased sewage pollution, practice of opendefecation and urban runoff. On top of that, there is insufficient sanitation in Lake HawassaWatershed from diffused sources like sewage, animal waste pollution and the practiceof open field defecation. The point sources have been known to take the leading role incontributing more pollutants to the river and Lake Hawassa followed by non-point sourcesfrom agricultural and urban runoff showing an ongoing pollution.
The monitored point sources indicate that the city of Hawassa and its numerousindustrial discharges are key polluters, requiring a fast and consequent set-up of an efficientwastewater infrastructure, accompanied by a rigorous monitoring of large point sources(e.g., industry, hospitals and hotels). In spite of the various efforts, the recovery of LakeHawassa may take long time as it is hydrologically closed. Therefore, to ensure safedrinking water supply, a central supply system according to WHO standards also for thefringe inhabitants still using lake water is imperative. Introducing the riparian bufferzones of vegetation and grasses can support the direct pollution alleviation measuresand is helpful for reducing the dispersed pollution coming from the population mostlyusing latrines. Additionally, integrating aeration systems like pumping atmospheric airinto the bottom of the lake using solar energy panels or diffusers are effective mitigationmeasures that will improve the water quality of the lake. In parallel, implementationand efficiency control of measures requires coordinated environmental monitoring withdedicated development targets.
Author Contributions: Conceptualization and improvement of the methodology, S.M.L., J.T. andM.D.; Data Collection, analysis and interpretation, S.M.L.; Writing of the original manuscript, S.M.L.;Follow-up of the work, reviewing and modifying of the manuscript, J.T. and M.D. All authors haveread and agreed to the published version of the manuscript.
Funding: This research was part of the DAAD-EECBP Home Grown PhD Scholarship Program atEECBP Homegrown PhD Program, 2019 (57472170). The Open Access Department, University ofRostock has funded the APC.
Institutional Review Board Statement: Not applicable.
Informed Consent Statement: Not applicable.
Data Availability Statement: The data presented in this study are available on request from the firstauthor. The data are not publicly available as it is experimental.
Acknowledgments: German Academic Exchange Service (DAAD) be grateful for offering a stipendfor the first author in the course of the study and CERVaS for providing transportation servicesduring data collection.
Conflicts of Interest: The authors claim no conflict of interest in connection with the work.
References1. Noori, R.; Sabahi, M.S.; Karbassi, A.R.; Baghvand, A.; Zadeh, H.T. Multivariate Statistical Analysis of Surface Water Quality
Based on Correlations and Variations in the Data Set. Desalination 2010, 260, 129–136. [CrossRef]2. Olal, F.O. Assessment of the Impact of Urban Runoff from Migori Town on the Concentration Levels of Selected Heavy Metals in
Migori. J. Environ. Earth Sci. 2015, 5, 24–30.3. Fan, X.; Cui, B.; Zhao, H.; Zhang, Z.; Zhang, H. Assessment of River Water Quality in Pearl River Delta Using Multivariate
Statistical Techniques. Procedia Environ. Sci. 2010, 2, 1220–1234. [CrossRef]4. Duressa, G.; Assefa, F.; Jida, M. Assessment of Bacteriological and Physicochemical Quality of Drinking Water from Source to
Household Tap Connection in Nekemte, Oromia, Ethiopia. Hindawi J. Environ. Public Health 2019, 2019, 2129792. [CrossRef][PubMed]
Int. J. Environ. Res. Public Health 2021, 18, 8904 28 of 31
5. Angello, Z.A.; Behailu, B.M.; Tränckner, J. Selection of Optimum Pollution Load Reduction and Water Quality ImprovementApproaches Using Scenario Based Water Quality Modeling in Little Akaki River, Ethiopia. Water 2021, 13, 584. [CrossRef]
6. Worako, A.W. Physicochemical and Biological Water Quality Assessment of Lake Hawassa for Multiple Designated Water Uses.J. Urban Environ. Eng. 2015, 9, 146–157. [CrossRef]
7. Gilbertson, M.; Carpenter, D.O. An Ecosystem Approach to the Health Effects of Mercury in the Great Lakes Basin Ecosystem.Environ. Res. 2004, 95, 240–246. [CrossRef]
8. Kassaye, Y.A.; Skipperud, L.; Meland, S.; Dadebo, E.; Einset, J.; Salbu, B. Trace Element Mobility and Transfer to Vegetation withinthe Ethiopian Rift Valley Lake Areas. J. Environ. Monit. 2012, 14, 2698–2709. [CrossRef]
9. Zigde, H.; Tsegaye, M.E. Evaluation of the Current Water Quality of Lake Hawassa, Ethiopia. Int. J. Water Resour. Environ. Eng.2019, 11, 120–128. [CrossRef]
10. Zemed, M.; Mogesse, B.; Reddythota, D. Evaluation of Water Quality and Eutrophication Status of Hawassa Lake Based onDifferent Water Quality Indices. Appl. Water Sci. 2021, 11, 1–10. [CrossRef]
11. Lakshmi, E.; Madhu, G. An Assessment of Water Quality in River Periyar, Kerala, South India Using Water Quality Index.IOSR J. Environ. Sci. Toxicol. Food Technol. 2014, 8, 11–16. [CrossRef]
12. Puri, P.J.; Yenkie, M.K.; Rana, D.B.; Meshram, S.U. Application of Water Quality Index (WQI) for the Assessment of Surface WaterQuality (Ambazari Lake). Eur. J. Exp. Biol. 2015, 5, 37–52.
13. Sarkar, C.; Abbasi, S.A. Qualidex—A New Software for Generating Water Quality Indice. Environ. Monit. Assess. 2006, 119,201–231. [CrossRef] [PubMed]
14. Briciu, A.; Graur, A.; Oprea, D.I. Water Quality Index of Suceava River in Suceava City Metropolitan Area. Water 2020, 12, 2111.[CrossRef]
15. Bonanno, G.; Giudice, R.L. Application of Two Quality Indices as Monitoring and Management Tools of Rivers. Case Study: TheImera Meridionale River, Italy. Springer Sci. Media Environ. Manag. 2010, 45, 856–867. [CrossRef]
16. CCME. Canadian Water Quality Index 1.0 Technical Report and User’s Manual. In Canadian Water Quality Guidelines for theProtection of Aquatic Life; Canadian Council of Ministers of the Environment: Ontario, ON, Canada, 2001; pp. 1–5.
17. Koçer, M.T.; Sevgili, H. Parameters Selection for Water Quality Index in the Assessment of the Environmental Impacts ofLand-Based Trout Farms. Ecol. Indic. 2014, 36, 672–681. [CrossRef]
18. Ocampo-Duque, W.; Ferré-Huguet, N.; Domingo, J.L.; Schuhmacher, M. Assessing Water Quality in Rivers with Fuzzy InferenceSystems: A Case Study. Environ. Int. 2006, 32, 733–742. [CrossRef] [PubMed]
19. Boyacioglu, H. Development of a Water Quality Index Based on a European Classification Scheme. Water SA 2007, 33, 101–106.[CrossRef]
20. Chandra, D.S.; Asadi, S.; Raju, M.V. Estimation of Water Quality Index by Weighted Arithmetic Water Quality Index Method:A Model Study. Int. J. Civ. Eng. Technol. 2017, 8, 1215–1222.
21. Vollenweider, R.A.; Kerekes, J. Eutrophication of Waters: Monitoring, Assessment and Control; Organization for Economic Co-Operation and Development (OECD): Paris, France, 1982; p. 156.
22. Kratzer, C.R.; Brezonik, P.L. A Carlson-Type Trophic State Index for Nitrogen in Florida Lakes. Water Resour. Bull. Am. WaterResour. Assoc. 1981, 17, 713–715. [CrossRef]
23. Boyle, S.O.; Mcdermott, G.; Noklegaard, T.; Wilkes, R. A Simple Index of Trophic Status in Estuaries and Coastal Bays Based onMeasurements of PH and Dissolved Oxygen. Estuaries Coasts 2013, 36, 158–173. [CrossRef]
24. Hailin, Z.; Baoyin, H. Evaluating Lake Eutrophication with Enhanced Thematic Mapper Data in Wuhan. Chin. J. Oceanol. Limnol.2006, 24, 285–290. [CrossRef]
25. Köklüa, R.; Alkıs, A. A New Statistical Perspective on Trophic Indexes for Shallow Lakes. Water Resour. 2021, 48, 324–330. [CrossRef]26. Carlson, R.E. A Trophic State Index for Lakes1. Limnol. Oceanogr. 1977, 22, 361–369. [CrossRef]27. Ramesh, N.; Krishnaiah, S. Assessment of Trophic Status of Bellandur Lake, Bangalore, India by Using USEPA Technique.
Int. J. Curr. Eng. Technol. 2014, 4, 3467–3472.28. Mereta, S.T.; Ambelu, A.; Ermias, A.; Abdie, Y.; Moges, M.; Haddis, A.; Hailu, D.; Beyene, H.; Kebede, B.; Mulat, W.L. Effects of
Untreated Industrial Effluents on Water Quality and Benthic Macroinvertebrate Assemblages of Lake Hawassa and Its Tributaries,Southern Ethiopia. Afr. J. Aquat. Sci. 2020, 45, 285–295. [CrossRef]
29. Tilahun, G.; Ahlgren, G. Seasonal Variations in Phytoplankton Biomass and Primary Production in the Ethiopian Rift ValleyLakes Ziway, Awassa and Chamo—The Basis for Fish Production. Limnologica 2010, 40, 330–342. [CrossRef]
30. Kebede, W.; Tefera, M.; Habitamu, T.; Alemayehu, T. Impact of Land Cover Change on Water Quality and Stream Flow in LakeHawassa Watershed of Ethiopia. Agric. Sci. 2014, 5, 647–659. [CrossRef]
31. Tekle-Giorgis, Y. Prediction of Bio-Economically Sustainable Yield and Optimum Fishing Effort for the Nile Tilapia (OreochromisNiloticus L.) Fishery of Lake Hawassa, Ethiopia. Ethiop. J. Sci. Technol. 2018, 11, 57. [CrossRef]
32. Ayenew, T.; Becht, R.; van Lieshour, A.; Gebreegziabher, Y.; Legesse, D.; Onyando, J. Hydrodynamics of Topographically ClosedLakes in the Ethio-Kenyan Rift: The Case of Lakes Awassa and Naivasha. J. Spat. Hydrol. 2007, 7, 81–100.
33. Abiye, T.A. Environmental Resources and Recent Impacts in the Awassa Collapsed Caldera, Main Ethiopian Rift. Quat. Int. 2008,189, 152–162. [CrossRef]
34. Abebe, Y.; Bitew, M.; Ayenew, T.; Alo, C.; Cherinet, A.; Dadi, M. Morphometric Change Detection of Lake Hawassa in theEthiopian Rift Valley. Water 2018, 10, 625. [CrossRef]
Int. J. Environ. Res. Public Health 2021, 18, 8904 29 of 31
35. APHA. Standard Methods for the Examination of Water and Wastewater, 23rd ed.; Baird, R.B., Eaton, A.D., Rice, E.W., Brigewater,L.L., Eds.; American Public Health Association (APHA), American Water Works Association (AWWA) and Water EnvironmentFederati; Water Environment Federation: Washington, DC, USA, 2017. [CrossRef]
36. Emerson, K.; Russo, R.C.; Lund, R.E.; Thuston, R.V. Aqueous Ammonia Equilibrium Calculations: Effect of PH and Temperature.Fish Res. Board Can. 1975, 32, 2379–2383. [CrossRef]
37. Srivastava, A.K.; Mishra, D.K.; Tripathi, S.; Singh, P. Determination of Water Quality Index and Suitability of Ground Water in aCollege in Balrampur, U.P. Nat. Environ. Pollut. Technol. 2007, 6, 315–319.
38. Alobaidy, J.A.; Abid, H.S.; Maulood, B.K. Application of Water Quality Index for Assessment of Dokan Lake Ecosystem, KurdistanRegion, Iraq. J. Water Resour. Prot. 2010, 2, 792–798. [CrossRef]
39. Bhagat, D.V.; Take, S.S.; Shirke, S.B. Assessment of Physicochemical Parameters of Well Water of Villages in Roha Tahsil,Dist-Raigad (Maharashtra). Int. J. Appl. Pure Sci. Agric. 2017, 3, 42–47. [CrossRef]
40. Debels, P.; Figueroa, R.; Urrutia, R.; Barra, R.; Niell, X. Evaluation of Water Quality in the Chillán River (Central Chile) UsingPhysicochemical Parameters and a Modified Water Quality Index. Environ. Monit. Assess. 2005, 110, 301–322. [CrossRef] [PubMed]
41. Horton, R.K. An Index Number System for Rating Water Quality. J. Water pollu.Cont. Fed. 1965, 37, 300–305.42. Brown, R.M.; McClelland, N.I.; Deininger, R.A.; O’Connor, M.F. A Water Quality Index -Crashing the Psychological Barrier.
Indic. Environ. Qual. 1972, 173–182. [CrossRef]43. Boah, D.K.; Twum, S.B.; Pelig-Ba, K.B. Mathematical Computation of Water Quality Index of Vea Dam in Upper East Region of
Ghana. Environ. Sci. 2015, 3, 11–16. [CrossRef]44. Yogendra, K.; Puttaiah, E.T. Determination of Water Quality Index and Suitability of an Urban Waterbody in Shimoga Town, Kar-
nataka. In Proceedings of the Taal2007: The 12th World Lake Conference, Jaipur, Rajasthan, India, 28 October–2 November 2007;pp. 342–346.
45. Tripathy, J.K.; Sahu, K.C. Seasonal Hydrochemistry of Groundwater in the Barrier Spit System of the Chilika Lagoon, India.J. Environ. Hydrol. 2005, 13, 1–9.
46. Chatterjee, P.R.; Raziuddin, M. Studies on the Water Quality of a Water Body at Asansol town, West Bengal. Nat. Environ. Pollut.Technol. 2007, 6, 289–292.
47. Sutadian, A.D.; Muttil, N.; Yilmaz, A.; Perera, C. Development of River Water Quality Indices—A Review Arief. Environ. Monit.Assess. 2016, 188, 58. [CrossRef] [PubMed]
48. Boyacioglu, H. Utilization of the Water Quality Index Method as a Classification Tool. Environ. Monit. Assess. 2010, 167, 115–124.[CrossRef]
49. Sharma, D.; Kansal, A. Water Quality Analysis of River Yamuna Using Water Quality Index in the National Capital Territory,India (2000–2009). Appl. Water Sci. 2011, 1, 147–157. [CrossRef]
50. Kumar, K.M.K.; Mahesh, M.K.; Sushmitha, B.R. CCME Water Quality Index and Assessment of Physico- Chemical Parameters ofChikkakere, Periyapatna, Mysore District, Karnataka State, India. Int. J. Innov. Res. Sci. Eng. Technol. 2014, 3. [CrossRef]
51. Damo, R.; Icka, P. Evaluation of Water Quality Index for Drinking Water. Pol. J. Environ. Stud. 2013, 22, 1045–1051.52. Rabee, A.M.; Hassoon, H.A.; Mohammed, A.J. Application of CCME Water Quality Index to Assess the Suitability of Water for
Protection of Aquatic Life in Al- Radwaniyah-2 Drainage in Baghdad Region. J. Al-Nahrain Univ. Sci. 2017, 17, 137–146. [CrossRef]53. Mostafaei, A. Application of Multivariate Statistical Methods and Water-Quality Index to Evaluation of Water Quality in the
Kashkan River. Environ. Manag. 2014, 53, 865–881. [CrossRef]54. Keraga, A.S.; Kiflie, Z.; Engida, A.N. Evaluating Water Quality of Awash River Using Water Quality Index. Int. J. Water Resour.
Environ. Eng. 2017, 9, 243–253. [CrossRef]55. Teshome, F. Seasonal Water Quality Index and Suitability of the Water Body to Designated Uses at the Eastern Catchment of Lake
Hawassa. Environ. Sci. Pollut. Res. 2020, 27, 279–290. [CrossRef] [PubMed]56. Marvin, C.; Grapentine, L.; Painter, S. Application of a Sediment Quality Index to the Lower Laurentian Great Lakes. Environ.
Monit. Assess. 2004, 91, 1–16. [CrossRef] [PubMed]57. Nikoo, M.R.; Kerachian, R.; Malakpour-Estalaki, S.; Bashi Azghadi, S.N.; Azimi-Ghadikolaee, M.M. A Probabilistic Water Quality
Index for River Water Quality Assessment: A Case Study. Environ. Monit. Assess. 2011. [CrossRef] [PubMed]58. Sharma, M.P.; Kumar, A.; Rajvanshi, S. Assessment of Trophic State of Lakes: A Case of Mansi Ganga Lake in India. Hydro Nepal J.
Water Energy Environ. 2010, 6, 65–72. [CrossRef]59. Tan, L.; Cai, Q.; Zhang, H.; Shen, H.; Ye, L. Trophic Status of Tributary Bay Aggregate and Their Relationships with Basin
Characteristics in a Large, Subtropical Dendritic Reservoir, China. Fresenius Environ. Bull. 2014, 23, 650–659.60. Barki, D.N.; Singa, P. Assessment of Trophic State of Lakes in Terms of Carlson’s Trophic State Index. Int. J. Innov. Res. Sci. Eng.
Technol. 2014, 3, 14297–14302.61. Lau, S.S.; Lane, S.N. Biological and Chemical Factors Influencing Shallow Lake Eutrophication: A Long-Term Study. Sci. Total
Environ. 2002, 288, 167–181. [CrossRef]62. Srebotnjak, T.; Polzin, C.; Giljum, S.; Herbert, S.; Lutter, S. Establishing Environmental Sustainability Thresholds and Indicators.
Vienna, Austria. Ecol. Inst. SERI 2010, 139.63. Gurung, D.P.; Githinji, L.J.; Ankumah, R.O. Assessing the Nitrogen and Phosphorus Loading in the Alabama (USA) River Basin
Using PLOAD Model. Air Soil Water Res. 2014, 6, 23–36. [CrossRef]
Int. J. Environ. Res. Public Health 2021, 18, 8904 30 of 31
64. ESA. Compulsory Ethiopian Standard, Drimking Water Specifications, 1st ed.; CES 58; Ethiopian Standards Agency: Addis Ababa,Ethiopia, 2013.
65. WHO. Guidelines for Drinking-Water Quality Fourth Edition Incorporsting the First Addendum; World Health Organization: Geneva,Switzerland, 2017.
66. EEPA. Guideline Ambient Environment Standards for Ethiopia. Prepared by EPA and UNIDO under ESDI Project US/ETH/99/068/Ethiopia;Ethiopian Environmental Protection Authority: Addis Ababa, Ethiopia, 2003.
67. Walakira, P.; Okot-Okumu, J. Impact of Industrial Effluents on Water Quality of Streams in Nakawa-Ntinda, Uganda. J. Appl. Sci.Environ. Manag. 2011, 15, 289–296. [CrossRef]
68. Lammers, J.M.; Reichart, C.J.; Schubert, J.J.; Middelburg, G.J. Carbon Flows in Eutrophic Lake Rotsee: A Experiment C-Labelling.Biogeochemistry 2016, 131, 147–162. [CrossRef]
69. USEPA. National Management Measures for the Control of Nonpoint Pollution from Agirculture EPA 841-B-03-004; US EnvironmentalProtection Agency Office of Water: Washington, DC, USA, 2003; pp. 243–246.
70. Bhateria, R.; Jain, D. Water Quality Assessment of Lake Water: A Review. Sustain. Water Resour. Manag. 2016, 2, 161–173. [CrossRef]71. Ling, T.; Soo, C.; Heng, T.; Nyanti, L.; Sim, S.; Grinang, J.; Lee, K.S.; Ganyai, T. Water Quality Assessment of Tributaries of Batang
Baleh in Sarawak Using Cluster Analysis. Sci. World J. 2018, 2018. [CrossRef] [PubMed]72. HC. Guidelines for Canadian Recreational Water Quality, 3rd ed.; Health Canada: Ottowa, ON, Canada, 2012; ISBN 978-100-20892-3.73. Tiwari, A.K.; Singh, A.K. Hydrogeochemical Investigation and Groundwater Quality Assessment of Pratapgarh District, Uttar
Pradesh. J. Geol. Soc. India 2014, 83, 329–343. [CrossRef]74. Boyd, C.E. Water Quality, an Introduction; Springer International Publishing: Cham, Switzerland, 2015; pp. 101–112. [CrossRef]75. Camargo, J.A.; Alonso, Á. Ecological and Toxicological Effects of Inorganic Nitrogen Pollution in Aquatic Ecosystems: A Global
Assessment. Environ. Int. 2006, 32, 831–849. [CrossRef] [PubMed]76. Tibebe, D.; Zewge, F.; Lemma, B.; Kassa, Y.; Bhaskarwar, A.N. External Nutrient Load and Determination of the Trophic Status of
Lake Ziway. CSVTU Int. J. Biotechnol. Bioinforma. Biomed. 2018, 3, 1–16. [CrossRef]77. Fetahi, T. Plankton Communities and Ecology of Tropical Lakes Hayq and Awasa; Ethiopia, Universitat Wien: Vienna, Austria, 2010.78. Tamire, G.; Mengistou, S. Macrophyte Species Composition, Distribution and Diversity in Relation to Some Physicochemical
Factors in the Littoral Zone of Lake Ziway, Ethiopia. Afr. J. Ecol. 2012, 66–77. [CrossRef]79. USEPA. Short Term Methods for Estimating the Chronic Toxicity of Effluents and Receiving Water to Freshwater Organisms, 3rd ed.;
United States Environmental Protection Agency, Office of Research and Development: Washingron, DC, USA, 1998.80. Bojarczuk, A.; Jelonkiewicz, Ł.; Lenart-Boron, A. The Effect of Anthropogenic and Natural Factors on the Prevalence of
Physicochemical Parameters of Water and Bacterial Water Quality Indicators along the River Białka, Southern Poland. Environ.Sci. Pollut. Res. 2018, 25, 10102–10114. [CrossRef]
81. Jothivel, N.; Paul, V.I. International Journal of Modern Research and Reviews Original Article Comparative Physico-ChemicalProfiling of Two Coastal Water Bodies from South East Coast of India with Special Reference to Their Pollution Status.Int. J. Mod. Res. Rev. 2014, 2, 544–553.
82. Kramer, D.L. Dissolved Oxygen and Fish Behavior. Environ. Biol. Fishes 1987, 18, 81–92. [CrossRef]83. Franklin, P.A. Dissolved Oxygen Criteria for Freshwater Fish in New Zealand: A Revised Approach. N. Zeal. J. Mar. Freshw. Res.
2014, 48, 112–126. [CrossRef]84. Penn, M.R.; Pauer, J.J.; Mihelcic, J.R. Biochemical Oxygen Demand. Environmental and Ecological Chemistry. In Environmental
and Ecological Chemistry; Sabjic, A., Ed.; UNESCO-EOLSS: Wisconsin, DC, USA, 2013; Volume II, pp. 278–297.85. Breen, B.; Curtis, J.; Hynes, S. Water Quality and Recreational Use of Public Waterways. J. Environ. Econ. Policy 2018, 7, 1–15.
[CrossRef]86. Downing, K.M.; Merkens, J.C. The Influence of Dissolved-Oxygen Concentration on the Toxicity of Un-Ionized Ammonia to
Rainbow Trout (Salmo GairdnerII Richardson). Ann. Appl. Biol. 1955, 43, 243–246. [CrossRef]87. Körner, S.; Sanjeev, K.D.; Veenstra, S.; Vermaat, J.E. The Effect of PH Variation at the Ammonium/Ammonia Equilibrium in
Wastewater and Its Toxicity to Lemna Gibba. Aquat. Bot. 2001, 71, 71–78. [CrossRef]88. Molins-Legua, C.; Meseguer-Lloret, S.; Moliner-Martinez, Y.; Campıns-Falco, P. A Guide for Selecting the Most Appropriate
Method for Ammonium Determination in Water Analysis. Trends Anal. Chem. 2006, 25, 282–290. [CrossRef]89. Lin, K.; Zhu, Y.; Zhang, Y.; Lin, H. Determination of Ammonia Nitrogen in Natural Waters: Recent Advances and Applications.
Trends Environ. Anal. Chem. 2019, 24, e00073. [CrossRef]90. Thurston, R.V.; Russo, R.C. Ammonia Toxicity to Fishes. Effect of PH on the Toxicity of the Un-Ionized Ammonia Species.
Am. Chem. Soc. 1981, 15, 837–840.91. Liew, H.J.; Sinha, A.K.; Nawatab, C.M.; Ronny, B.; Wood, C.M.; Gudrun, D.B. Differential Responses in Ammonia Excretion,
Sodium Fluxes and Gill Permeability Explain Different Sensitivities to Acute High Environmental Ammonia in Three FreshwaterTeleosts. Aquat. Toxicol. 2020, 126, 63–76. [CrossRef]
92. Xia, X.; Zhang, S.; Li, S.; Zhang, L.; Wang, G.; Zhang, L.; Wang, J.; Li, Z. The Cycle of Nitrogen in River Systems: Sources,Transformation and Flux. Environ. Sci. Process. Impacts 2018, 20. [CrossRef] [PubMed]
93. Francis-floyd, R.; Watson, C.; Petty, D.; Pouder, D.B. Ammonia in Aquatic Systems; Institute of Food and Agricultural Sciences(IFAS): Gainesville, FL, USA, 2014.
94. Eddy, F.B. Ammonia in Estuaries and Effects on Fish. J. Fish Biol. 2005, 67, 1495–1513. [CrossRef]
Int. J. Environ. Res. Public Health 2021, 18, 8904 31 of 31
95. Zinabu, G.M.; Kebede-Westhead, E.; Desta, Z. Long-Term Changes in Chemical Features of Waters of Seven Ethiopian Rift-ValleyLakes. Hydrobiol. Kluwer Acad. Publ. 2002, 477, 81–91. [CrossRef]
96. Fadiran, A.O.; Dlamini, S.C.; Mavuso, A. A Comparative Study of the Phosphate Levels in Some Surface and Ground WaterBodies of Swaziland. Bull. Chem. Soc. Ethiop. 2008, 22, 197–206. [CrossRef]
97. Alagbe, S.A. Preliminary Evaluation of Hydrochemistry of the Kalambaina Formation, Sokoto Basin, Nigeria. Environ. Geol. 2006,51, 39–45. [CrossRef]
98. Ayers, R.S.; Westcot, D.W. Water Quality for Agriculture. Food and Agriculture Organization of the United Nations; FAO Irrigation andDrainage: Rome, Italy, 1985.
99. Hengsdijk, H.; Jansen, H. Agricultural Development in the Central Ethiopian Rift Valley: A Desk-Study Agricultural Development inthe Central Ethiopian Rift Valley: A Desk-Study on Water-Related Issues and Knowledge to Support a Policy Dialogue; Plant ResearchInternational B.V.: Wageningen, The Netherlands, 2006.
100. Kumar, S.V.; Amarender, B.; Dhakate, R.; Sankaran, S.; Kumar, K.R. Assessment of Groundwater Quality for Drinking andIrrigation Use in Shallow Hard Rock Aquifer of Pudunagaram, Palakkad District Kerala. Appl. Water Sci. 2016, 6, 149–167. [CrossRef]
101. Richards, L.A. Diagnosis and Improvement of Saline and Alkali Solids; Soil and Water Conservative Research Branch, AgriculturalResearch Service, US Department of Agriculture: Washington, DC, USA, 1954. [CrossRef]
102. Singh, A.; Panda, S.N. Effect of Saline Irrigation Water on Mustard (Brassica Juncea) Crop Yield and Soil Salinity in a Semi-AridArea of North India. Exp. Agric. 2011, 48, 99–110. [CrossRef]
103. WHO. Guidelines for Drinking-Water Quality Fourth Edition, 4th ed.; World Health organization: Geneva, Switzerland, 2011;ISBN 978-92-4-154815-1.
104. Zouahri, A.; Dakak, H.; Douaik, A.; El Khadir, M.; Moussadek, R. Evaluation of Groundwater Suitability for Irrigation in theSkhirat Region, Northwest of Morocco. Environ. Monit. Assess. 2015, 187, 1–15. [CrossRef]
105. Kelly, W.P. Use of Saline Irrigation Water; University of Calfornia: Berkeley, CA, USA, 1963; Volume 17.106. Wilcox, L.V. Classification and Use of Irrigation Waters; Department of Agriculture, United States: Washington, DC, USA, 1955;
Volume 969.107. Thapa, R.; Gupta, S.; Reddy, D.V.; Kaur, H. An Evaluation of Irrigation Water Suitability in the Dwarka River Basin through the
Use of GIS-Based Modelling. Environ. Earth Sci. 2017, 76, 1–12. [CrossRef]108. Worako, A.W. Evaluation of the Water Quality Status of Lake Hawassa by Using Water Quality Index, Southern Ethiopia.
Int. J. Water Resour. Environ. Eng. 2015, 7, 58–65. [CrossRef]109. USEPA. An Ecological Assessement of Western Streams and Rivers; EPA 620/R-05/005; United States Environmental protection
Agency, Office of Research and Development: Washington, DC, USA, 2005.110. Smith, V.H. Low Nitrogen to Phosphorus Ratios Favor Dominance by Blue-Green Algae in Lake Phytoplankton. Science 1983, 221,
669–672. [CrossRef]111. Fisher, M.M.; Reddy, K.R.; James, R.T. Internal Nutrient Loads from Sediments in a Shallow, Subtropical Lake. Lake Reserv. Manag.
2005, 21, 338–349. [CrossRef]112. Smith, L.M.; Engle, V.D.; Summers, J.K. Assessing Water Clarity as a Component of Water Quality in Gulf of Mexico Estuaries.
Environ. Monit. Assess. 2006, 115, 291–305. [CrossRef] [PubMed]113. Fetahi, T.; Mengistou, S. Trophic Analysis of Lake Awassa (Ethiopia) Using Mass-Balance Ecopath Model. Ecol. Model. 2007, 201,
398–408. [CrossRef]
Related Documents