Assessing the Viability of Lowland Tapir Populations in a Fragmented Landscape By Emília Patrícia Medici Thesis submitted for the degree of Doctor of Philosophy in Biodiversity Management Durrell Institute of Conservation and Ecology (DICE) University of Kent Canterbury, United Kingdom January 2010

Welcome message from author
This document is posted to help you gain knowledge. Please leave a comment to let me know what you think about it! Share it to your friends and learn new things together.
Transcript

Assessing the Viability of
Lowland Tapir Populations in a
Fragmented Landscape
By
Emília Patrícia Medici
Thesis submitted for the degree of
Doctor of Philosophy
in Biodiversity Management
Durrell Institute of Conservation and Ecology (DICE)
University of Kent
Canterbury, United Kingdom
January 2010

ii
To Dr. Maurício Pompilio, Dr. José Tadeu dos Santos and
the entire staff of Clínica Campo Grande for saving
my husband's life and ultimately allowing
me to finish this thesis …
… and to the tapirs of the Atlantic Forest …

iii
Abstract
This thesis aimed to assess the ecological factors that determine the long-term persistence and viability of animal populations across severely fragmented landscapes. The lowland tapir, Tapirus terrestris, and the fragmented Atlantic Forests of the Interior of the Pontal do Paranapanema Region, São Paulo State, Brazil, were used as a model to illustrate this assessment. Both empirical and modelling approaches were used. The empirical approach focused on aspects of tapir spatial ecology, intra-specific interactions, spatial and temporal interactions between tapirs and the landscape, as well as estimates of tapir abundance in Morro do Diabo State Park (370 km²) and seven smaller forest fragments (4-18 km²) where tapirs were present. The modelling approach consisted of a Population Viability Analysis (PVA) using the software VORTEX. Spatial ecology, intra-specific interactions, and interactions between tapirs and the landscape were estimated by radio-telemetry. Population sizes were derived from tapir densities obtained by radio-telemetry, nocturnal line-transect sampling, and Footprint Identification Technique (FIT). Lowland tapirs in Morro do Diabo had very large home ranges (4.7 km²) when compared to other sites, particularly contiguous habitats. Tapir home ranges had very complex internal structures, including multiple core areas of use, which comprised a very small proportion of the home range (50% core area, 17% of the home range; 25% core area, 6% of the home range). Little seasonal variation in size and location of home ranges and core areas of use were observed. These patterns were consistent for both sexes and different age classes. Telemetry results have shown that a minimum of 20 months of data collection and approximately 300 locations are necessary to determine home range size for adult lowland tapirs. Tapirs exhibited extensive home range overlap (30%), as well as overlap of core areas of use (20%). No evidence of spatial territoriality was noted. Tapirs incorporated portions of all available habitat types within their home ranges and core areas of use, but significantly selected riparian habitats, where they performed most of their main activities, particularly foraging. Tapirs avoided areas of agricultural and pastoral land, as well as secondary growth forests. It was estimated that Morro do Diabo hosts a population of 130 tapirs and, altogether, the seven forest fragments host 22 additional individuals. Tapirs have low population growth rates and so are very susceptible to threats such as road-kill, infectious disease, and fire, particularly in the small forest fragments. Results from the PVA model projected that the tapir population in Morro do Diabo has zero probability of extinction and is likely to persist over the next 100 years. However, the population is not large enough to maintain 95% of genetic diversity over the long-term. A Minimum Viable Population of 200 tapirs would be required to ensure long-term viability. The model showed that, without dispersal of tapirs from Morro do Diabo, tapirs in the small fragments will go extinct over the next 100 years. However, this study showed that tapirs in the Pontal do Paranapanema Region moved fairly easily through areas of non-natural habitat in between patches of forest, indicating a certain level of landscape functional connectivity. This provided evidence of a tapir metapopulation scenario, which proved to be a determinant factor for the persistence and viability of lowland tapirs in the Atlantic Forest of the Interior. Overall, the long-term persistence and viability of animal populations across severely fragmented landscapes appears to be dependent on the maintenance and full protection of complex landscape networks. These networks must include some large patches of habitat that can host larger animal populations and function as source areas for dispersal of individuals to smaller populations in sink habitats. Patches of forest comprising these networks must incorporate required habitat types where animals can find the resources they need in order to survive and persist. Most essentially, there must be an appropriate level of landscape connectivity, either structurally or functionally, in order to facilitate biological fluxes between patches and promote the maintenance of a demographically and genetically healthy metapopulation.

iv
Resumo
Esta tese teve como meta principal avaliar os fatores ecológicos determinantes para a persistência e viabilidade de populações animais em paisagens severamente fragmentadas no longo prazo. A Anta Brasileira, Tapirus terrestris, e a Floresta Atlântica do Interior da região do Pontal do Paranapanema, São Paulo, Brasil, foram utilizadas como modelos ilustrativos para esta avaliação. Duas abordagens foram utilizadas, a primeira delas empírica e a segunda baseada em modelagem. A abordagem empírica avaliou aspectos de ecologia espacial, interações intra-específicas e interações espaciais e temporais entre as antas e a paisagem, bem como estimativas de abundância no Parque Estadual Morro do Diabo (370 km²) e sete outros fragmentos de floresta (4-18 km²) onde a presença da espécie havia sido previamente confirmada. A modelagem consistiu de uma Análise de Viabilidade Populacional (AVP) realizada através do uso do software VORTEX. Parâmetros de ecologia espacial, interações intra-específicas e interações entre antas e paisagem foram estimados através de rádio-telemetria. Tamanhos populacionais foram derivados a partir de densidades obtidas através de rádio-telemetria, censo noturno por transectos lineares, e uma técnica de identificação de pegadas (FIT). As antas no Morro do Diabo apresentaram áreas de uso (home range) bastante grandes (4,7 km²) quando comparadas a outras áreas, em particular em florestas contínuas. As áreas de uso apresentaram estruturas internas complexas, incluindo múltiplos centros de alta intensidade de uso (core areas), os quais representaram proporções bastante pequenas da área de uso total (50% core, 17% da área de uso; 25% core, 6% da área de uso). Pouca variação sazonal foi encontrada tanto em tamanho quanto em localização de áreas de uso e áreas core. Todos esses padrões foram consistentes para ambos os sexos e diferentes classes de idade. Resultados de telemetria mostraram ser necessários um mínimo de 20 meses de coleta de dados e aproximadamente 300 localizações para determinar a área de uso de antas adultas. As antas tiveram alta sobreposição de área de uso (30%), bem como de áreas core (20%). Territorialidade não foi observada. As antas incorporaram em suas áreas de uso e áreas core porções de todos os tipos de habitat disponíveis, mas selecionaram significativamente florestas ripárias, onde pareceram executar grande parte de suas atividades, particularmente forrageamento. As antas evitaram áreas de agricultura e pastagem, bem como florestas secundárias. A população de antas no Morro do Diabo foi estimada em 130 indivíduos e os sete outros fragmentos de floresta, conjuntamente, devem conter cerca de 22 outros indivíduos. A taxa de crescimento populacional da espécie é baixa e, conseqüentemente, as antas são bastante susceptíveis a ameaças tais como atropelamentos, doenças infecciosas e fogo, particularmente em fragmentos de menor tamanho. Os resultados do modelo de AVP projetaram que a população de antas no Morro do Diabo tem zero probabilidade de extinção e deve persistir ao longo dos próximos 100 anos. Entretanto, a população não é suficientemente grande para manter 95% de diversidade genética no longo prazo. Seria necessária uma População Mínima Viável de 200 antas para garantir a viabilidade no longo prazo. O modelo demonstrou que na ausência de dispersão de indivíduos do Morro do Diabo, as populações de antas nos fragmentos menores serão extintas ao longo dos próximos 100 anos. Todavia, este estudo mostrou que as antas apresentaram relativa facilidade em se deslocar pela matriz da paisagem entre os fragmentos, indicando certo nível de conectividade funcional. Isso evidenciou um cenário metapopulacional, o qual provou ser determinante para a persistência das antas na Floresta Atlântica do Interior. De maneira geral, a persistência e viabilidade de populações animais em paisagens severamente fragmentadas parecem depender da manutenção e proteção de complexas networks de habitat. Tais networks devem incluir alguns fragmentos de maior tamanho que possam dar suporte a populações maiores e funcionar como fontes de dispersores para pequenas populações em habitats sumidouro. Os fragmentos de floresta compondo essas networks devem incorporar os tipos de habitat requeridos onde os animais possam encontrar os recursos necessários para sua sobrevivência e persistência. Mais importante, deve haver um nível apropriado de conectividade de paisagem, seja ela estrutural ou funcional, de forma a facilitar fluxos biológicos entre os fragmentos e promover a manutenção de uma metapopulação saudável tanto em termos demográficos quanto genéticos.

v
Acknowledgements
First and foremost, I would like to thank my friend José Maria de Aragão, the most resourceful, committed field assistant any researcher could wish for. Zezinho has been working with me for the past 14 years, and he has been both my right and left arms for all this time. The Atlantic Forest Tapir Programme would not have been possible without his constant dedication and active involvement in all different phases of the project. Other important participants of this project, particularly in the early stages, were Seu Zé de Souza, my "pai do mato", who taught me everything I know about the Atlantic Forests of the Pontal do Paranapanema Region, and Luizinho Homero, who was largely responsible for developing and testing our tapir capture methods. I will always be profoundly grateful to them. Other field assistants and park rangers who have worked with us over the years included Robertinho, Raul Cabeça Branca, Seu Antônio, Cicinho, Gessy, Edivaldinho, Zé Gomes Gurdão, Alemão, Seu Cícero, Fabinho and many others.
Special gratitude goes to Claudio Valladares-Padua, my friend, my mentor, on some occasions even my father. He brought me into the conservation world and gave me the inspiration and all the tools I needed to fulfil my dreams. Most importantly, both Claudio and his wife Suzana Padua shared their dreams and passion for conservation with me and with so many other young researchers who are today part of this wonderful conservation organisation called IPÊ - Instituto de Pesquisas Ecológicas. The word gratitude will never completely reflect how much I appreciate everything Claudio and Suzana have done for me. Many other friends from IPÊ have been endless sources of support, both professionally as well as personally, most especially Cristiana Martins, Andréa Déca Peçanha, Jeffelson Lima, Eduardo Duda Ditt, Fabiana Prado, Eduardo Badialli, Herculóides Quelu, Gracinha de Souza, and Laury Cullen.
The Atlantic Forest Tapir Programme was a long-term research and conservation initiative and several professionals participated in different components of the programme along the way. I would like to thank Paulo Rogerio Mangini, my "padinho", who is the most competent, passionate wildlife veterinarian I have ever met. Paulinho embraced this programme since its establishment in 1996 and was largely responsible for the success of the veterinarian component of our work. Many thanks to other veterinarians who also had important participations in the programme throughout the years including George Velastin, Joares May, Paulinha Mangini, Danilo Kluyber, and Ralph Vanstreels. Anders Gonçalves da Silva, my little bro, developed and carried out the genetic component of the program, which became his Ph.D. thesis. Cristina Tininha Tófoli carried out the study on tapir feeding ecology, which became her M.Sc. thesis.
This programme had the institutional support from several organisations. In Brazil, I would like to thank the Forestry Institute of São Paulo State (Instituto Florestal do Estado de São Paulo) and the Brazilian Federal Agency for the Conservation of Nature and Natural Resources (Instituto Brasileiro do Meio Ambiente e dos Recursos Naturais Renováveis). Most especially, I would like to thank Andréa Pires, Director of Morro do Diabo State Park. Internationally, the programme had the institutional support from the IUCN/SSC Tapir Specialist Group (TSG), Association of Zoos & Aquariums (AZA) Tapir Taxon Advisory Group (TAG), European Association of Zoos & Aquaria (EAZA) Tapir Taxon Advisory Group (TAG), and Tapir Preservation Fund (TPF). I am very grateful to Sheryl Todd, President of TPF, for her endless support and friendship throughout the duration of this programme. Sheryl, as well as Sharon Matola, former chair of the TSG, introduced me to the tapir conservation world and for that I will forever be grateful. Several members of the TSG, a group which I have the honour to have been chairing since January 2000, have provided me with countless opportunities for the exchange of ideas and constructive criticism. The TSG is an extraordinary group of extremely passionate tapir conservationists from around the world. Tapirs could not wish for better, more committed advocates. I am very grateful to Charles Foerster, Sonia Hernández, and Donald Janssen for their extremely helpful advice in the early stages of the project when we were designing our capture methods and immobilisation protocols.

vi
The AZA and EAZA Tapir TAGs were instrumental in raising institutional and financial support for the activities of the Atlantic Forest Tapir Programme. Specifically, I would like to express my deepest gratitude to Rick Barongi, Bengt Holst, Alan Shoemaker, Lewis Greene, and Mike Dee for their tireless efforts to assist me in obtaining funds from zoological institutions in the United States and Europe. This research programme would most definitely not have been possible without the support from these five gentlemen. Zoo grants comprised approximately 80% of our funding and guaranteed the sustainability of our 12 years of field work.
From 1996 to 2008, the Atlantic Forest Tapir Programme received grants from the following organisations: American Association of Zoo Keepers (AAZK), Houston Zoo Chapter; AAZK, Los Angeles Chapter; AAZK, Nashville Zoo Chapter; AAZK, Puget Sound Chapter; Chicago Zoological Society, Brookfield Zoo, USA; Cleveland Metroparks Zoo, USA; Columbus Zoo, USA; Discovery Channel Canada; Disney Worldwide Conservation Fund, USA; Dutch Zoos Conservation Fund, Netherlands; Fundo Nacional do Meio Ambiente (FNMA), Brazil; Givskud Zoo, Denmark; Houston Zoo, USA; IUCN/SSC Tapir Specialist Group Conservation Fund (TSGCF); John Ball Zoo, USA; Lincoln Park Zoo, USA; Chester Zoo, UK; Oregon Zoo, USA; Parc Zoologique d’Amnéville, France; Sophie Danforth Conservation Biology Fund, Roger Williams Park Zoo, USA; Tapir Preservation Fund (TPF) - Club Tapir, USA; The Ledder Family Charitable Trust, USA; and, Woodland Park Zoo, USA. Many of these organisations provided annual grants for several consecutive years and became long-term partners of this initiative. In addition, this programme received donations of field equipment and supplies from Idea Wild, Nellcor, and Smithsonian Institution. The programme also received private donations from several individuals around the world including: Alex & Suzan Sze, Alex Cardenas, Andre Maerz, Andy Markley, Andy Schultz, Ayessa Rourke, Brandie Smith, Brenda Stringer, Bryony Angell, Carol & Mark Reid, Charles Foerster, Christine Kim & Rob Lyman, Corinna Bechko & Gabriel Hardman, Deanne Holsworth, Diego Orlando, Elaine & Paul Beckham (in memoriam), Gilia Angell & Aaron Abrams, Heidi Frohring (in memoriam), Kae Kawanishi, Katalin Pinter, Keith Sproule, Kevin Burkhill, Kristin Leus, Leonardo Salas, Michael & Donna Dee, Mickael Michault, Mitch Finnegan, Morty Ortega, Phil Schaeffer, Pierre de Wit, and William Bob Harris. I am fairly certain I will ever be able to articulate how immensely grateful I am for the incredible support I received from all these organisations and individuals.
Over 100 undergraduate and graduate students, as well as members of the staff of zoos supporting our work have participated in the Atlantic Forest Tapir Programme as interns or trainees. I would like to mention a few of them, for their remarkable enthusiasm and dedication while in the field with us: Anders Gonçalves da Silva, Corinne Kendall, Frederico, Gilia Angell, Heidi Frohring (in memoriam), Julinho, Kéka Guimarães, Kelly Russo, Leandro Robinho Abade, Livinha Cordeiro, Marcelo Baixinho, Mariana Faria, Paulão, Phil Coleman, Ralph Vanstreels, Rodrigo Pinho, Rossano, Sandra Róseo, Tati Carioca, Tati Paulista, and Tio Alexey.
I am deeply thankful to CAPES - Coordenação de Aperfeiçoamento de Pessoal de Nível Superior, an agency of the Ministry of Education in Brazil, for providing a full scholarship for this Ph.D., which certainly made it all possible. This scholarship included a monthly stipend for my living expenses while in the United Kingdom, tuition and registration fees for the grant period, among other expenses. The Durrell Institute of Conservation and Ecology (DICE) of the University of Kent is an outstanding institution. I truly enjoyed being part of DICE for the duration of this four-year Ph.D. programme. Many thanks to Dr. Nigel Leader-Williams, former Director of DICE, for all his support during my participation in the programme. I gratefully acknowledge Dr. Richard E. Bodmer for his supervision during this Ph.D. His advice, comments and suggestions were extremely valuable.
A number of people have provided enormous help in developing different components of this thesis. I would like to thank Zoe Jewell and Sky Alibhai from WildTrack for their tireless support on the development of the FIT algorithm for lowland tapirs. This tool is now ready to be applied in the field, and it is all thanks to Zoe and Sky who dedicated huge amounts of time and energy to this
vii
project. In addition, I would like to thank the zoos, tapir breeding facilities, and field researchers who helped us collect photos of tapir footprints for the development of FIT including: Laura Fernandes at the Criadouro Conservacionista CBMM (Companhia Brasileira de Metalurgia e Mineração), Brazil; Juscelino Martins from the Criadouro Conservacionista Martins, Brazil; Adauto Nunes Veloso, Rodrigo Teixeira, Cecília Pessutti and Índio from the Sorocaba Zoo, Brazil; Viviana Quse formerly from the Fundación Temaikén, Argentina; Zoológico de Cali, Colombia; Parc Zoologiqué Amnéville and Safari de Peaugres, France; Andrés Tapia, Ecuador; and, Benoit de Thoisy, French Guiana. Many thanks to Rafael Ruas Martins who was my GIS guru and helped me analyse and map tapir ranging behaviour and habitat use using ArcGIS. Arnaud Desbiez provided constant support on the use of DISTANCE, VORTEX, and R-ADEHABITAT software. Alexandre Uezu, Anders Gonçalves da Silva, and Eduardo Ditt provided maps to illustrate some of the chapters. Arnaud Desbiez and Sonia di Fiore patiently reviewed the English of this entire thesis.
I must say that since the early days of my conservation career, I have been tremendously privileged to have met and to count on the support from a multitude of friends and mentors from different corners of the world. Among these are: Alan Shoemaker, Alberto Betinho Mendoza, Alexine Pentelha Keuroghlian, Alexis Maillot, Anders Little Bro Gonçalves da Silva, Annabel Lea, Anne Warner, Anthony Tonico Rylands, Aude Desmoulins, Bart Romijn, Bengt Holst, Beth Armstrong, Bob Lacy, Brenda Stringer, Byron Pedro Jorjorian, Carl Traeholt, Catherine Faulks, Charles Foerster, Darin Collins, Diane Ledder, Don Eaton, Don Goff, Eduardo Naranjo, Edward Whitley, Elaine & Paul Beckham (in memoriam), Evan Blumer, Fernando Seixas, Georgina Domberger, Gilia Angell, Giselda Durigan, Harmony Frazier, Heidi Frohring (in memoriam), Hilton Thadeu Zarate do Couto, Jeffrey Flocken, Jenny van Leeuwen, Joep Wensing, Jonathan Ballou, Josè Kok, Joseph Roman, Kathy Traylor-Holzer, Keith Sproule, Kelly Russo, Kevin Flesher, Kristen Lukas, Kristin Leus, Kym Gopp, Lars Versteege, Laura Cancino, Leonardo Salas, Lewis Greene, Lisa Dabek, Mariano Gimenez-Dixon, Mark McCollow, Matthew Colbert, Michael & Donna Dee, Mickael Michault, Mitch Finnegan, Nico van Strien (in memoriam), Nigel Leader-Williams, Norah Fletchal, Olga Montenegro, Onnie Byers, Patty Peters, Paulo Padinho Mangini, Peter Riger, Philip Miller, Pierre de Wit, Pierre Gay, Rebecca Becky Rose, Renaud Fulconis, Richard Bodmer, Richard Østerballe, Rick Barongi, Rick Hick Schwartz, Roger Wilkinson, Rudy Rudran, Sharon Matola, Sheryl Todd, Sky Alibhai, Sonia di Fiore, Sonia Hernández, Stephanie Forbes, Viviana Quse, Wally Wally Van Sickle, William Konstant, and Zoe Jewell. All of these incredibly special individuals are one way or the other part of my professional and personal history. Thank you all very, very much for your friendship and for your support. Very special thanks to Rudy Rudran for not having any doubt in his heart that I was unquestionably capable of climbing this imaginary Everest! Here I am Rudy, on the top of this mountain!
Last but most definitely not least, I would like to thank my family. First, I would like to thank my mom, Dona Jô, for constantly fighting for my education and for ultimately making it all possible to me; my brother Cecéu, for singing Deep Purple every time I asked him to; Françoise, Jacques, Helene, Nathalie, Nicolas, and kids, for their love and support at all times, particularly over the last year during which we all went through some of the hardest times of our lives. Many thanks to Nathalie and Nicolas for allowing me to stay with them in London while I was working on the final corrections of this thesis.
More than anybody else, and always, I would like to thank my husband Arnaud for his infinite love and constant support and encouragement. I would not have done this without you. Thank you so much for being alive so that we can continue to share our lives and dreams into the future.

viii
Table of Contents
Chapter 1 General Introduction & Thesis Aims and Structure
1.1 General Introduction 002
1.1.1 Habitat Fragmentation 002 1.1.2 Long-Term Viability of Animal Populations 003 1.1.3 Why is the tapir a good model? 004 1.1.4 Why is the Atlantic Forest of the Interior a good model? 010
1.2 Thesis Aims and Structure 013
Chapter 2 Study Species, Study Area, and General Methods
2.1 Introduction 017
2.2 The Lowland Tapir 017 2.2.1 Taxonomy and Evolution 017 2.2.2 Morphology 017 2.2.3 Geographic Distribution 024 2.2.4 Ecology and Behaviour 027
2.2.4.1 Habitat Requirements 027 2.2.4.2 Feeding Behaviour 029 2.2.4.3 Spatial Requirements 031 2.2.4.4 Population Density 031 2.2.4.5 Social Behaviour and Activity Patterns 035 2.2.4.6 Reproduction 035 2.2.4.7 Predators 036
2.2.5 Status and Threats 036 2.3 The Atlantic Forest Biome 039
2.3.1 Historical Outline 030 2.3.2 Ecological Outline 040 2.3.3 Current Conservation Status 041
2.4 The Atlantic Forest of the Interior and the Pontal do Paranapanema Region
045
2.5 Study Site: Morro do Diabo State Park 049 2.5.1 Location and Legal Protection 049 2.5.2 Landscape Matrix 049 2.5.3 Climate 049 2.5.4 Abiotic Factors 050 2.5.5 Biotic Factors 050
2.5.5.1 Fauna 050 2.5.4.2 Flora 051
2.6 General Methods 056 2.6.1 Logistics and Personnel 056 2.6.2 Field Methods 056 2.6.3 Timeframe of Study 057 2.6.4 Research Permits 057
Chapter 3 Spatial Ecology and Intra-Specific Interactions
3.1 Introduction 059 3.2 Methods 063
3.2.1 Radio-Telemetry 063 3.2.2 Capture Sites 063 3.2.3 Capture Methods 064
3.2.3.1 Iron Box Traps 065 3.2.3.2 Pitfalls 066 3.2.3.3 Anaesthetic Dart Shooting 066 3.2.3.4 Wooden Corrals 067 3.2.3.5 Trapping Effort and Trapping Success 069

ix
3.2.4 Chemical Immobilisation 069 3.2.5 Manipulation and Collection of Biological Samples 071 3.2.6 Captured Individuals 072 3.2.7 Telemetry Equipment 073 3.2.8 Telemetry Data Collection 076 3.2.9 Telemetry Data Screening 077 3.2.10 Tapir Spatial Ecology 077
3.2.10.1 Home Range Size 077 3.2.10.2 Maximum Distance Moved (MDM) 078 3.2.10.3 Size of Core Areas of Use 078 3.2.10.4 Seasonal Home Range 078 3.2.10.5 Determination of Home Range Size over Time 079
3.2.11 Tapir Intra-Specific Interactions 079 3.2.11.1 Home Range Overlap 079 3.2.11.2 Overlap of Core Areas of Use 080
3.2.12 Statistical Significance 080 3.3 Results 081
3.3.1 Tapir Spatial Ecology 081 3.3.1.1 Home Range Size 081 3.3.1.2 Maximum Distance Moved (MDM) 085 3.3.1.3 Size of Core Areas of Use 087 3.3.1.4 Seasonal Home Range and Core Areas of Use 090 3.3.1.5 Determination of Home Range Size over Time 094 3.3.1.6 Tapir Movements throughout the Fragmented Landscape of the Pontal
do Paranapanema Region 099
3.3.2 Intra-Specific Interactions 101 3.3.2.1 Home Range Overlap 101 3.3.2.2 Overlap of Core Areas of Use 101 3.3.2.3 Social Organisation 103
3.4 Discussion 107 3.4.1 Use of Radio-Telemetry for Studying Tapirs 107
3.4.1.1 Tapir Capture and Chemical Restraint 107 3.4.1.2 Timeframe of Telemetry Monitoring for Tapir Studies 108
3.4.2 Methodological Considerations on the Estimate of Tapir Home Range Size 109 3.4.3 Spatial Ecology of Tapirs in Morro do Diabo State Park 109
3.4.3.1 Home Range Size 109 3.4.3.2 Home Range Internal Structure: Core Areas of Use 112 3.4.3.3 Seasonal Variations in Home Range and Core Areas of Use 113 3.4.3.4 Tapir Movements throughout the Fragmented Landscape of the Pontal
do Paranapanema Region 114
3.4.4 Tapir Intra-Specific Interactions in Morro do Diabo State Park 115 3.4.4.1 Tapir Spatial Territoriality in Morro do Diabo State Park 115 3.4.4.2 General Inferences about Tapir Social Organisation in Morro do Diabo
State Park 117
3.4.5 Lowland Tapir Spatial Requirements and Implications for Population Viability 118
Chapter 4 Determining Population Size
4.1 Introduction 122 4.2 Methods 125
4.2.1 Estimate of Tapir Population Density using Radio-Telemetry Data 125 4.2.2 Nocturnal Line-Transect Sampling 126
4.2.2.1 Line-Transect Sampling Methodology 126 4.2.2.2 Line-Transect Sampling Data Collection 127 4.2.2.3 Estimate of Tapir Population Density using DISTANCE Analysis 128
4.2.3 Footprint Identification Technique (FIT) 130 4.2.3.1 Development of the FIT Algorithm for Lowland Tapirs 130 4.2.3.2 Validation of the FIT Algorithm for Lowland Tapirs 135 4.2.3.3 Estimate of Tapir Population Density using FIT 135

x
4.2.4 Estimates of Lowland Tapir Population Size 137 4.2.5 Comparisons between Density Estimators 137
4.3 Results 138 4.3.1 Estimate of Tapir Population Density using Radio-Telemetry Data 138 4.3.2 Estimate of Tapir Population Density using Nocturnal Line-Transect Sampling 140 4.3.3 Estimate of Tapir Population Density using Footprint Identification Technique 140
4.3.3.1 FIT Identification of Individual Tapirs 140 4.3.3.2 Estimate of Tapir Population Density using FIT 142
4.3.4 Estimate of Lowland Tapir Population Sizes in Morro do Diabo State Park and Surrounding Atlantic Forest Fragments of the Pontal do Paranapanema Region
143
4.3.5 Comparison between Density Estimators 146 4.4 Discussion 147
4.4.1 Methodological Considerations on the Estimate of Tapir Population Size 147 4.4.1.1 Comparing Density Estimators: Cost, Personnel, and Field Effort 147 4.4.1.2 Comparing Density Estimators: Invasiveness of the Method 150 4.4.1.3 Comparing Density Estimators: Accuracy of Estimates 152
4.4.2 Lowland Tapir Population Density in Morro do Diabo State Park 157 4.4.3 Lowland Tapir Population Sizes in the Atlantic Forests of the Pontal do
Paranapanema Region and Implications for Population Viability 159
Chapter 5 Spatial and Temporal Interactions between Tapirs and the Landscape
5.1 Introduction 166
5.2 Methods 169
5.2.1 Radio-Telemetry 169 5.2.2 Habitat Composition within Tapir Home Ranges and Core Areas of Use 169 5.2.3 Tapir Habitat Selection 170
5.2.3.1 Habitat Availability 170 5.2.3.2 Habitat Use 170 5.2.3.3 Habitat Selection Index 170
5.2.4 Tapir Activity Patterns 171 5.2.5 Patterns of Tapir Habitat Use in Relation of Activity 171
5.3 Results 172
5.3.1 Habitat Composition in Tapir Home Ranges and Core Areas of Use 172 5.3.2 Tapir Habitat Selection 176
5.3.2.1 Habitat Availability and Habitat Use 176 5.3.2.2 Habitat Selection Index 178
5.3.3 Tapir Activity Patterns 180 5.3.3.1 Activity Patterns in Different Seasons 181 5.3.3.2 Activity Patterns of Different Sexes 182 5.3.3.3 Activity Patterns of Different Age Classes 183
5.3.4 Patterns of Tapir Habitat Use in Relation to Activity 184 5.4 Discussion 187
5.4.1 Spatial Interactions between Lowland Tapirs and the Landscape 187 5.4.1.1 Habitat Composition in Tapir Home Ranges and Core Areas of Use 187 5.4.1.2 Tapir Habitat Use and Habitat Selection 188
5.4.2 Temporal Interactions between Lowland Tapirs and the Landscape 190 5.4.2.1 Tapir Activity Patterns 190 5.4.2.2 Patterns of Tapir Habitat Use in Relation to Activity 193
5.4.3 Spatial and Temporal Interactions between Lowland Tapirs and the Landscape and Implications for Population Viability
193
Chapter 6 Population Viability Analysis (PVA): Using a Modelling Tool to Assess the
Viability of Tapir Populations in a Fragmented Landscape
6.1 Introduction 197
6.2 Methods 199
6.2.1 VORTEX Simulation Model 199 6.2.2 VORTEX Input Parameters: Baseline Model 200
6.2.2.1 Scenario Settings 200

xi
6.2.2.2 Species Description 200 6.2.2.3 Reproductive System and Rates 201 6.2.2.4 Mortality Rates 204 6.2.2.5 Population Description 205
6.2.3 Sensitivity Analysis 207 6.2.4 Minimum Viable Population Analysis 207 6.2.5 Modelling of Alternative Scenarios 208
6.2.5.1 Impact of Fire 209 6.2.5.2 Impact of Road-Kill 209 6.2.5.3 Impact of Infectious Disease 210 6.2.5.4 Metapopulation Scenario 211 6.2.5.5 Establishment of Corridors 213
6.3 Results 215
6.3.1 VORTEX Baseline Model 215 6.3.1.1 Deterministic Output 215 6.3.1.2 Stochastic Baseline Results 215
6.3.2 Sensitivity Analysis 216 6.3.3 Minimum Viable Population (MVP) 216 6.3.4 Modelling of Alternative Scenarios 217
6.3.4.1 Impact of Fire 217 6.3.4.2 Impact of Road-Kill 218 6.3.4.3 Impact of Infectious Disease 218 6.3.4.4 Metapopulation Scenario 218 6.3.4.5 Establishment of Corridors 221
6.4 Discussion 222
6.4.1 Biological Potential of Tapirs in Morro do Diabo State Park 222 6.4.2 Sensitivity Analysis: Uncertainty in Input Parameters 222 6.4.3 Minimum Viable Population (MVP): Morro do Diabo State Park 223 6.4.4 Modelling of Scenarios: Threats, Metapopulation and Conservation Strategies 223
6.4.4.1 Impact of Threats: Fire 223 6.4.4.2 Impact of Threats: Road-Kill 224 6.4.4.3 Impact of Threats: Infectious Disease (Leptospirosis) 225 6.4.4.4 Tapir Metapopulation Scenario 226 6.4.4.5 Corridors: A Potential Conservation Strategy for Tapirs? 227
Chapter 7 Conclusions & Conservation Recommendations
7.1 Viability of Lowland Tapir Populations in the Atlantic Forest of the Interior of the Pontal do Paranapanema Region
230
7.2 Conservation Recommendations: A First Step in Building a Regional Action Plan for the Conservation of Lowland Tapirs in the Pontal do Paranapanema Region
232
7.2.1 Action Planning for Species Conservation 233 7.2.2 Recommendations for the Conservation of Lowland Tapirs in the Atlantic
Forests of the Pontal do Paranapanema Region 234
7.2.2.1 Future Research Priorities and Research Gaps 234 7.2.2.2 Habitat Protection 235 7.2.2.3 Habitat Restoration and Re-Establishment of Landscape Connectivity 237 7.2.2.4 Neutralisation of Threats 238 7.2.2.5 Tapir Management: Translocations and Re-Introduction 239
7.3 Determinants for Long-Term Persistence of Animal Populations across Fragmented Landscapes
239
References 243
Appendix I 270
Appendix II 271
Appendix III 273

xii
List of Figures
Figure 2.1. The lowland tapir (Tapirus terrestris), also known as South American or Brazilian tapir ....................................................................................................................................................................................................................................
023
Figure 2.2. Captive lowland tapir calf at approximately 30 days of age .............................................................
023
Figure 2.3. Map of current distribution and probability of survival of the lowland tapir ……...........
025
Figure 2.4. Map of main categories of habitat where lowland tapirs occur ………………….……...........................
028
Figure 2.5. Reference maps indicating the location of the Pontal do Paranapanema Region in the extreme western portion of the State of São Paulo, Brazil ……………………………….........................................………..
047
Figure 2.6. Map of the Pontal do Paranapanema Region indicating Morro do Diabo State Park, Black-Lion-Tamarin Ecological Station, and other remaining forest fragments ……...............………
048
Figure 2.7. Map of habitat types found in Morro do Diabo State Park, and surrounding buffer zone ……………………………………………………………………………………….....................................................................................................................…………………..………
055
Figure 3.1. Lowland tapir capture sites within Morro do Diabo State Park .....................................................
064
Figure 3.2. Capture methods used during the lowland tapir study in Morro do Diabo State Park …………………………………………………………………………………………………………………..............................................................................................................................…………..
068
Figure 3.3. 1- Picture of radio-collar designed for the lowland tapir study in Morro do Diabo State Park; 2- View of a radio-collar on a tapir …………………………………......…………………..…..................................................................…
075
Figure 3.4. Cumulative monthly areas of use of six lowland tapirs monitored for over 22 months in Morro do Diabo State Park ………………………………..………………………...............................................................................……............…..
097
Figure 3.5. 1- Map of home range and core areas of use of sub-adult female Chu-Chu; 2- Map of home range and core areas of use of adult female Xuxa …………………………………….........................................…..
100
Figure 4.1. Locations of 8 line-transects used for the lowland tapir nocturnal line-transect sampling in Morro do Diabo State Park ………………………………………..……………….............................................................................….............…..
128
Figure 4.2. Histogram of frequency of lowland tapir encounters against distance from the transect during the nocturnal line-transect sampling in Morro do Diabo State Park ……...............…….….
129
Figure 4.3. 1- Lowland tapir track along a dirt road; 2- Lowland tapir footprint prepared to be photographed; 3- Photography being taken ………………………………………………………....................................................................….…..
131
Figure 4.4. 1- Lowland tapir plantar cushion, distal metatarsals and digits; 2- Close up image of a left hind footprint of a lowland tapir in Morro do Diabo State Park …….……….....................….……
133
Figure 4.5. 1- Overlap of 95% confidence interval ellipses of two self tapir tracks indicating correct identification; 2- Absence of overlap of ellipses of two non-self tapir tracks once again indicating correct identification and separation of different individuals ……………….......................……….
134
Figure 4.6. Map of Morro do Diabo State Park and seven surrounding forest fragments in the Pontal do Paranapanema Region, where the presence of tapirs was confirmed ..............................
144
Figure 5.1. Mean percentages of active locations of 19 lowland tapirs radio-tracked in Morro do Diabo State Park ……………..................……………………………………………………...............................................................................................…………
180
Figure 5.2. Mean percentages of active locations of 19 lowland tapirs radio-tracked in periods of wet season in Morro do Diabo State Park …………...................................................................................………………………
181
Figure 5.3. Mean percentages of active locations of 19 lowland tapirs radio-tracked in periods of dry season in Morro do Diabo State Park ………….........................………………...........................................................…..….
181
Figure 5.4. Mean percentages of active locations of 13 female lowland tapirs radio-tracked in Morro do Diabo State Park …………….........................………………………………..………...........................................................................................………….
182

xiii
Figure 5.5. Mean percentages of active locations of 6 male lowland tapirs radio-tracked in Morro do Diabo State Park …………………………............................…………………..………...............................................................................................………….
182
Figure 5.6. Mean percentages of active locations of 15 adult lowland tapirs radio-tracked in Morro do Diabo State Park …………………………...........................................................................................................................………..…………………………….
183
Figure 5.7. Mean percentages of active locations of 4 sub-adult lowland tapirs radio-tracked in Morro do Diabo State Park …………………….........................…………………...............................................................................……..………
183
Figure 6.1. 1- Highway crossing Morro do Diabo State Park; 2- Tapir road-kill ……………....................……. 210
Figure 6.2. Potential routes of tapir dispersal between Morro do Diabo State Park and seven surrounding forest fragments where the presence of tapirs was confirmed in the Pontal do Paranapanema Region ……………………………………………...............................................................................................................………………
212
Figure 6.3. Potential locations for the establishment of agro-forestry corridors connecting Morro do Diabo State Park to surrounding forest fragments in the Pontal do Paranapanema Region …………………………………………………………………………………………………………...........................................................................................................................……………….
213
Figure 6.4. Results from sensitivity analysis .………………………………………….…………....................................................................…………….
216
Figure 6.5. Impact of fire events on stochastic growth rate as the frequency of fires increases for populations of tapir with different initial population sizes ……………….................................…………….
217

xiv
List of Tables
Table 2.1. Mean weights of 33 lowland tapirs captured in Morro do Diabo State Park …...........….….
019
Table 2.2. Mean values of 13 corporal measurements obtained from 30 adult lowland tapirs captured in Morro do Diabo State Park …………………..........................…………..............................................................................………………………
020
Table 2.3. Mean values of 13 corporal measurements obtained from 6 sub-adult lowland tapirs captured in Morro do Diabo State Park ………..........................……….....................................................................………..………………..
021
Table 2.4. Mean values of 13 corporal measurements obtained from 2 juvenile lowland tapirs captured in Morro do Diabo State Park ………..........................………………………..….....................................................................……..
022
Table 2.5. List of 21 biomes where lowland tapirs occur …………………………....................................................………………………..
026
Table 2.6. Estimates of lowland tapir home range size and other ranging behaviour parameters obtained for different study areas and biomes in Brazil, Bolivia, and Peru …….............……
032
Table 2.7. Estimates of lowland tapir population density obtained for different study areas and biomes across the species distribution range ………………........…………………………………...............................................................……
033
Table 2.8. Threats analysis for 21 biomes where lowland tapirs occur …………….……................................……………
038
Table 2.9. Ranking of lowland tapir threats for the Atlantic Forest of the Interior, Brazil …........….
038
Table 2.10. Past and present extent of the Atlantic Forest ……………………………………................................................………..…
042
Table 2.11. Monthly temperature, relative humidity, and rainfall in Morro do Diabo State Park ………………………...……………………………………………………………………………………………................................................................................................................................……..
050
Table 3.1. Trapping effort, number of tapirs captured, and trapping success of the capture methods used in Morro do Diabo State Park ………....................................................................................................................……..…………
069
Table 3.2. Parameters of anaesthesia monitoring obtained during 44 lowland tapir manipulations carried in Morro do Diabo State Park ……............................................................................................…………..…………
070
Table 3.3. Home range size of 19 lowland tapirs radio-tracked in four different sections of Morro do Diabo State Park ……………..………………………………………………………….................................................................................................………….….……
083
Table 3.4. Mean home range size of lowland tapirs in Morro do Diabo State Park ….......................….….
084
Table 3.5. Maximum Distance Moved (MDM) by 19 lowland tapirs radio-tracked in four different sections of Morro do Diabo State Park …………………..………………….……..................................................................…….…….………
086
Table 3.6. Size of core areas of use of 19 lowland tapirs radio-tracked in four different sections of Morro do Diabo State Park …….……………………………..………………….......................................................................................……………..
088
Table 3.7. Mean core areas of use of lowland tapirs radio-tracked in Morro do Diabo State Park …………………………………………………………………………………………………………................................................................................................................................…………………..
089
Table 3.8. Home range and core areas of use in wet and dry seasons for 14 tapirs radio-tracked from 8-36 months in Morro do Diabo State Park …………………….……………..…......................................................…………..
091
Table 3.9. Mean lowland tapir home range and core areas of use in wet and dry seasons in Morro do Diabo State Park …………………………….………………………………………………................................................................................................……………….
093
Table 3.10. Annual areas of use of 12 tapirs radio-tracked for over 18 months in Morro do Diabo State Park ………………………………………………………………………………………………...............................................................................................................……………
095
Table 3.11. Mean annual areas of use of 12 tapirs radio-tracked for over 18 months in Morro do Diabo State Park ……………………………………………………………………………………................................................................................................………..
095
Table 3.12. Cumulative areas of use for consecutive years of radio-tracking of the same tapir, overlap of areas of use in consecutive years, and gradual increase in estimate of home range size over time for 12 tapirs radio-tracked in Morro do Diabo State Park …………......................…...……..
096

xv
Table 3.13. Intra- and inter-sexual home range overlap in Morro do Diabo State Park ……..........….
101
Table 3.14. Intra- and inter-age home range overlap in Morro do Diabo State Park …….............…..….
101
Table 3.15. Intra- and inter-sexual overlap of core areas of use in Morro do Diabo State Park ………………………………………………………………………………………………………................................................................................................................................……………………..
102
Table 3.16. Intra- and inter-age overlap of core areas of use in Morro do Diabo State Park, São Paulo, Brazil ……………………………………………………………………………………………………...............................................................................................................………
102
Table 3.17. Home range overlap and overlap of core areas of use between intra- and inter-sexual pairs of tapirs in different sections of Morro do Diabo State Park ………………...............................………………
105
Table 4.1. Zoological institutions and breeding facilities where captive lowland tapir footprint images were collected for the establishment of the initial reference library for Footprint Identification Technique (FIT) analysis ……………………….………………………….................................................................…………..
132
Table 4.2. Estimates of lowland tapir density in Morro do Diabo State Park using radio-telemetry data ………………………………………………………………………………………..................................................................................................................………………………
139
Table 4.3. Estimates of lowland tapir density in Morro do Diabo State Park using nocturnal line-transect sampling …………………………………………………….………………….......................................................................................................…………………………..
140
Table 4.4. Relatedness of the 27 sets of footprints of wild lowland tapirs in Morro de Diabo State Park determined by Footprint Identification Technique (FIT) ............................................................................…
141
Table 4.5. Estimates of lowland tapir density in Morro do Diabo State Park using Footprint Identification Technique (FIT) data ……………………………………………………………….……...................................................................................…….……..
142
Table 4.6. Estimates of lowland tapir population size in Morro do Diabo State Park and seven forest fragments in the Pontal do Paranapanema Region ……………………………...........................................…….………
145
Table 4.7. Paired ranking score of the three density estimators (radio-telemetry, nocturnal line-transect sampling, and FIT) used during the lowland tapir study in Morro do Diabo State Park ……………………………………………………………………...………………………………………...............................................................................................................................………………
146
Table 5.1. Percentage of each habitat type in the home range and core areas of use of 19 lowland tapirs radio-tracked in four different sections of Morro do Diabo State Park …................…….….
174
Table 5.2. Percentage of each habitat type in the home range used in dry and wet season by 14 lowland tapirs radio-tracked in four different sections of Morro do Diabo State Park ….....…
175
Table 5.3. Total area available for 19 lowland tapirs radio-tracked in four different sections of Morro do Diabo State Park ………………………….……………………………….....................................................................................................................……..
176
Table 5.4. Habitat availability and habitat use in the home range of 19 lowland tapirs radio-tracked in four different sections of Morro do Diabo State Park …………………...........................................…………………..……
177
Table 5.5. Manly’s standardised habitat selection index for 19 lowland tapirs radio-tracked in four different sections of Morro do Diabo State Park ………….............................………...........................................................…………..
179
Table 5.6. Percentages of tapir activity and inactivity in different habitat types in four different sections of Morro do Diabo State Park ………………………….………………………….................................................................…………..
185
Table 6.1. Mortality rates and standard deviations estimated for different age classes of male and female lowland tapirs in Morro do Diabo State Park …………………………………..............................................………….
205
Table 6.2. Summary of parameter input values used in the VORTEX baseline model for the lowland tapir population in Morro do Diabo State Park ………………………….…………………........................................................…………
206
Table 6.3. Highest and lowest reproductive and mortality lowland tapir parameter values and standard deviations used for sensitivity analysis …………………………………………...........................................................………….…..
207
Table 6.4. Estimates of lowland tapir population sizes in Morro do Diabo State Park and seven forest fragments where the presence of tapirs was confirmed (Ditt 2002), and potential carrying capacity of six forest fragments where tapirs are absent ………………...........................………….
214

xvi
Table 6.5. Results of genetic diversity, probability of extinction, mean rate of stochastic population growth, and population size at the end of simulations obtained through the analysis of MVP for lowland tapirs in Morro do Diabo State Park ………………………………..........................................…………
217
Table 6.6. Results of mean rate of stochastic population growth, probability of extinction, mean time to extinction in years, genetic diversity of extant population, and population size at the end of simulations obtained through the analysis of the impact of road-kill on the lowland tapir population at Morro do Diabo State Park ………………………….….......................................................…………………………
218
Table 6.7. Impact of probability of survival and dispersal rate on stochastic growth rate and probability of extinction of the lowland tapir sub-populations and metapopulation in the Pontal do Paranapanema Region (radio-telemetry estimate, N=126) ....…………………...................................……….……
220
Table 6.8. Impact of probability of survival and dispersal rate on stochastic growth rate and probability of extinction of the lowland tapir sub-populations and metapopulation in the Pontal do Paranapanema Region (line-transect estimate, N=237) ……………………........................................…………….…..
220
Table 6.9. Impact of dispersal rate on stochastic growth rate and probability of extinction of the lowland tapir sub-populations and metapopulation in the Pontal do Paranapanema Region considering a carrying capacity of 100 tapirs in each forest fragment, 90% of survival during dispersal (radio-telemetry estimate, N=126) ........………………………………………..............................................................…………
220
Table 6.10. Impact of the establishment of corridors on the stochastic growth rate, probability of extinction, population size at the end of simulations, and genetic diversity of extant population of the lowland tapir sub-populations in the Pontal do Paranapanema Region (radio-telemetry estimate, N=126; line-transect estimate, N=237) …………………..............................……..
221

Chapter 1
General Introduction
&
Thesis Aims and Structure
Photo by Rolex Awards

2
1.1 General Introduction
Worldwide, natural habitats are increasingly threatened by escalating human population and
the resulting conversion for agriculture and urban development (Vitousek et al. 1997). Habitat
loss and fragmentation are considered to be the primary causes of the present extinction crisis
(Wilcox & Murphy 1985; Gibb & Hochul 2002; Schmiegelow & Monkkonen 2002; Vié et al.
2009). The underlying question posed by this thesis is: What are the ecological factors that
determine the long-term persistence and viability of animal populations across severely
fragmented landscapes? I used the lowland tapir, Tapirus terrestris, living in the Atlantic
Forests of the Interior of the Pontal do Paranapanema Region, São Paulo State, Brazil, as a
model to illustrate and answer this question.
1.1.1 Habitat Fragmentation
Habitat fragmentation is defined as “the simultaneous reduction of the area of a focal habitat
and increased isolation of the remaining habitat patches with a net habitat loss” (Saunders et
al. 1991). Fragmented ecosystems usually fail to provide the necessary resources to support
species assemblages found in the intact ecosystem, in turn leading to a general reduction in
the abundance of species (Lovejoy et al. 1984; Quinn & Hastings 1987; Bierregaard et al.
1992; Burkey 1993; Kattan & Alvarez-Lopez 1996). The process of habitat fragmentation
involves several factors, which have serious repercussions on plant and animal species that
originally occupied large contiguous areas of wild habitat (Schmiegelow & Monkkonen 2002;
Gehring & Swihart 2003). Fragmentation can exacerbate the effects of pure habitat loss
potentially producing population declines at landscape scales (Andren 1994; Bender et al.
1998). This may result in population extinctions even if suitable habitat still exists. In addition
to causing immediate local extinctions, fragmentation may have long-term effects on
populations through changes in ecological processes such as pollination, predation, use of
space, territorial behaviour, and feeding habits. Moreover, microclimatic consequences of
fragmentation, such as changes in solar radiation, humidity and wind pattern, are detrimental
to many organisms (Laurance 1991; Laurance 1994; Young & Mitchell 1994). Lastly, by
opening core areas, fragmentation of contiguous habitat patches leads to a dramatic increase
in edges in the landscape, which provides distinct microclimatic conditions from the core and
may become less suitable for some species (Sih et al. 2000).
Ultimately, habitat fragmentation results in the geographic isolation of “habitat islands” among
a matrix of urban or agricultural land uses. The mobility of some organisms might thus
become restricted thereby isolating populations (Andreassen et al. 1996; Vos et al. 2001). As
the isolation of habitat fragments increases, the probability of their recolonisation decreases
(Parker & MacNally 2002). The contention that small, isolated populations are more vulnerable

3
to extinction through stochastic processes has a sound theoretical basis in both demography
and population genetics (Shaffer 1981; Lande 1988; Roelke et al. 1993). Small populations are
more sensitive to stochastic events, such as fires or epidemic outbreaks, which can rapidly
drive a population to extinction (Lacy 1993; Lacy 2000; Aurambout et al. 2005). Likewise,
isolated populations are more susceptible to genetic drift, which can also lead, in the case of
severe inbreeding, to population extinctions (Templeton et al. 1990). The chance of extinction
increases exponentially with decreasing population size and increasing population isolation.
Conservationists around the world are increasingly going to be called upon to mastermind
rescue operations designed to manage and conserve wildlife species in severely fragmented
landscapes, and they must be prepared for this undertaking. More than ever, there is a
pressing need to understand how animal populations cope with the past and current patterns
of habitat loss and fragmentation, and what these populations require in order to persist and
be viable over the long-term.
1.1.2 Long-Term Viability of Animal Populations
Concern about the long-term persistence of animal populations (Smith 1974; Shaffer &
Sampson 1985; Goodman 1987; Newmark 1987) has led to questions about the ecological
requirements and the size a population should be to increase its chances of survival and
minimise its chances of extinction (Gilpin & Diamond 1980; Wilcox & Murphy 1985). Some
qualitative factors of population persistence include the existence of suitable habitats largely
connected, large habitat areas, high reproductive rates, and environmental conditions that
increase habitat carrying capacity and population growth rates (Ruggiero et al. 1994). Thus
far, only evidence from simulation models (Diamond 1984; Harris et al. 1987; Iwasa &
Mochhizuki 1988; Lacy 1993; Lacy 2000) and of the historical loss of species of unknown
population sizes (Brown 1971; Patterson 1984) has been available to suggest how long
fragmented animal populations might persist. However, it has generally not been possible to
assess empirically the generality of these models or the appropriateness of conservation
strategies (Lande 1988). Neither the timeframe of persistence in relation to population size,
nor the effects of various factors are well understood. As entire biomes continue to be
destroyed and fragmented, and questions arise about the ecological requisites to assure the
persistence of many species, empirical assessments of the viability of animal populations
become increasingly important.
The viability of a population is the probability that this population will persist for some
specified period of time (White 2000). The viability of animal populations is usually evaluated
quantitatively. The procedures commonly used include the estimation of Minimum Viable
Populations (MVP) and Population Viability Analysis (PVA). Minimum Viable Population is the

4
smallest population size that will persist for some specified length of time with a specified
probability (Shaffer 1981). Population Viability Analysis evaluates the probability of a
population of a specified size declining or going extinct over a specified length of time (Gilpin
& Soulé 1986; Boyce 1992; Lacy 2000; Clark et al. 2002). For both MVP and PVA, the
definitions and criteria for viability, persistence, and extinction are set as arbitrary targets,
such as a 95% probability of a population persisting for 100 years (Boyce 1992).
In this thesis, I used two different approaches to assess the long-term persistence and
viability of lowland tapir populations in the Atlantic Forest fragments of the Pontal do
Paranapanema Region. The first approach was based on the empirical information obtained
for the species during this study. This empirical approach focused on aspects of tapir spatial
ecology and intra-specific interactions, spatial and temporal interactions between tapirs and
the landscape, as well as estimates of tapir abundance, which are all determinant factors for
persistence and viability. The second approach consisted of modelling tapir population
viability, using a computer simulation known as Population Viability Analysis. This modelling
approach was based on biological characteristics of the species including reproductive and
mortality rates. The PVA process produced an estimate of the probability of extinction, and of
minimum viable population size for long-term viability, as well as the analysis of the impact of
threats and management scenarios. The results from both the empirical and modelling
approaches were used to substantiate the discussion of management and conservation
strategies that should be implemented in order to reduce the risk of extinction of lowland tapir
populations, and therefore promote their long-term persistence and viability in the Atlantic
Forests of the Pontal do Paranapanema Region.
1.1.3 Why is the tapir a good model?
The lowland tapir was considered to be a suitable model for this assessment because of the
various particular intrinsic and extrinsic biological aspects of the species. Regarding intrinsic
aspects, the most important are life-history characteristics, spatial and habitat requirements,
as well as the role played in the ecological functioning of ecosystems. In terms of extrinsic
aspects, the most critical ones for tapirs in the Atlantic Forest are inter-specific competition
and predation, both factors that are important in population regulation (Dublin et al. 1990;
Sinclair 2003).
The lowland tapir is the second largest terrestrial mammal in South America, the first being
the Baird's tapir (Tapirus bairdii). Tapir populations do not easily recover after a severe
reduction, and can rapidly be driven to extinction. Tapirs are what was formerly called K-
selected species, but are now considered to be “slow species” in the “fast-slow continuum” of
life-histories (MacArthur & Wilson 1967; Dobson & Oli 2007). Slow species have large body

5
size, long life span, and produce fewer offspring that require high levels of parental care until
they mature. Populations of slow species tend to be maintained at carrying capacity. In
addition, tapirs have very low reproductive rates. Females do not become sexually mature
until they are nearly 2 years of age (Eisenberg 1997), and they produce a single offspring
after a lengthy gestation of 13-14 months (Barongi 1993). Lastly, tapirs have a long
generation length, estimated to be between 11-15 years (Medici et al. 2007a; IUCN 2008a).
Given these life-history characteristics, tapir populations do not attain high levels of local
abundance and are particularly susceptible to habitat fragmentation. Furthermore, while
habitat fragmentation leads to small populations, other threats such as hunting, road-kill, and
disease among others override the impact of fragmentation strongly impacting the likelihood
of extirpation of remaining tapir populations (Bodmer et al. 1997). All this makes the tapir an
appropriate candidate for the purpose of this assessment.
Tapirs are wide-ranging species. Home range area and body mass are positively correlated for
most animal feeding styles and seasons (McNab 1963; Mysterud et al. 2001). Large terrestrial
mammals - such as tapirs - have larger home ranges and a greater absolute mobility than do
small mammals (Eisenberg 1980). While the spatial requirements of tapirs vary with the
carrying capacity of different habitats found within their distribution range (Eisenberg 1997;
Medici et al. 2007a), they usually require considerably large home ranges (Williams 1978;
Williams 1984; Foerster 1998; Herrera et al. 1999; Foerster & Vaughan 2002; Noss et al.
2003; Ayala 2003; Lizcano & Cavelier 2004; Tobler 2008; Abdul Ghani 2009; Naranjo 2009).
This is particularly important for the persistence of tapirs in fragmented habitats, given that
species with large spatial requirements generally cannot find sufficient food or other vital
resources to survive over the long-term in a smaller area (McNab 1963; Redford & Robinson
1991). Chiarello (1999) analysed the effects of the Atlantic Forest fragmentation on mammal
communities, and observed that tapirs were present in larger patches but not recorded in the
smaller forest fragments. In addition to large home range sizes, tapirs have complex home
range structures, with multiple core areas of use (Tobler 2008) that are established according
to the distribution of patches of preferred habitat types. Moreover, tapir species exhibit
extensive home range overlap (Foerster & Vaughan 2002; Ayala 2003; Noss et al. 2003),
which is a determinant factor for tapir spatial territoriality and intra-specific interactions.
Ensuring the long-term persistence of a species with large, complex spatial requirements also
promotes the survival and persistence of other species living in the same area.
Population size is a critical demographic attribute and the most important parameter to
determine extinction risk (Shaffer 1981; Gilpin & Soulé 1986; Lacy 1993; Lacy 2000; Shaffer
et al. 2000; Aurambout et al. 2005). Whereas controversy remains as to how large
populations need to be to ensure the viability of a given species over the long-term (Reed &
Hobbs 2004), population size is considered to be the major determinant of viability for a

6
variety of animal species (Newmark 1987; Pimm et al. 1988; Richman et al. 1988; Soulé et al.
1988; Berger 1990; Schoener & Spiller 1992; Foufopoulos & Ives 1999). Lowland tapir
population density tends to be low. Estimates range from a relatively high of 1.6 tapirs km-² in
Neotropical forests in undisturbed, non-hunted, or lightly hunted sites (Robinson & Redford
1986; Robinson & Redford 1991) to less than 0.3 tapirs km-² in different regions and habitats
where they occur (Cullen et al. 2000; Aquino et al. 2001; Aquino & Calle 2003; Haugaasen &
Peres 2005; Desbiez 2009). Ensuring the persistence of a species which occurs at low density
in a severely fragmented habitat is considerably more challenging than doing so for a species
which occurs at higher densities.
The lowland tapir has a broad geographic distribution (Hershkovitz 1954; Emmons & Feer
1997; Eisenberg 1997), and seems to be adapted to a wide range of habitat types (Medici et
al. 2007a; Taber et al. 2008). In spite of that, a number of studies have identified patterns of
habitat preference and selection in tapir species (Bodmer 1990b; Fragoso 1991a; Fragoso
1991b; Naranjo 1995; Salas 1996; Foerster 1998; Naranjo & Cruz-Aldán 1998; Herrera et al.
1999; Foerster & Vaughan 2002; Ayala 2003; Lizcano 2006; Tobler et al. 2006; Tobler 2008;
Steinmetz et al. 2008). There is growing evidence that besides large home ranges, tapirs also
require certain habitat types that contain the resources they need or prefer in order to persist
over the long-term. Thus, ensuring the persistence and viability of lowland tapir populations
over the long-term requires the protection of habitat integrity and diversity, which will in turn
benefit a number of other species.
Forest reduction and fragmentation are generally accompanied by a loss of habitat diversity,
which in turn affects resource diversity (Wright & Duber 2001; Tabarelli et al. 2004). While
tapirs are essentially browsers, they consume fruit extensively when available (Bodmer 1991b;
Fragoso & Huffman 2000; Henry et al. 2000; Salas & Fuller 1996; Tobler 2008). There is
growing evidence that the availability of fruit in small forest fragments is lower than that in
continuous tracts of tropical forest (Terborgh 1986; Terborgh 1992). As a consequence, some
frugivores will emigrate from these areas during periods of fruit scarcity, while others may
alter their diets (Lovejoy et al. 1986; Terborgh 1986; Rylands & Keuroghlian 1988). In
general, decreased fruit productivity will reduce the viability of frugivore populations in forest
fragments (Wright et al. 1999; Fleury & Galetti 2004; Keuroghlian & Eaton 2008). A suite of
resource-related factors specific to different habitat types, such as the spatial distribution of
fruit sources, total fruit availability, seasonal fruit availability, and severity of fruit scarcity
periods, will affect habitat use, area requirements, and ultimately the persistence of frugivore
populations in habitat fragments (Keuroghlian & Eaton 2008). Tófoli (2006) analysed the
impact of fragmentation of the Atlantic Forests of the Pontal do Paranapanema Region on the
diet of lowland tapirs and showed that tapirs in Morro do Diabo State Park, the largest forest
remnant in the Pontal do Paranapanema Region, consumed significantly higher percentages of

7
fruit and lower percentages of fibrous material when compared with tapirs in the smaller
forest fragments of the Pontal do Paranapanema Region. In addition, estimates of fruit
species richness in the diet of tapirs indicated a considerably higher diversity in Morro do
Diabo than in the forest fragments (Tófoli 2006). Thus, it is evident that habitat fragmentation
has had an effect on the diet of tapirs, negatively affecting the tapir populations in small
forest fragments. Lowland tapirs are therefore an excellent candidate to illustrate the impacts
of decreasing resources due to fragmentation.
Due to the combination of all factors described above, tapirs are widely recognised as
“umbrella species”. Umbrella species are “species with large area requirements, which if given
sufficient protected habitat area, will bring many other species under protection” (Noss 1990;
Caro & O’Doherty 1999; Entwistle & Dunstone 2000; Caro 2003). In other words, meeting the
needs of an umbrella species will provide protection for the species with which they co-occur
and the natural habitats on which they all depend. Determining the ecological requirements
that will ensure the long-term persistence of an umbrella species population in a severely
fragmented landscape will also ensure the long-term persistence of many other species.
Tapirs are also considered to be “landscape species”, i.e. “species that occupy large home
ranges often extending beyond protected area boundaries, that require a diversity of
ecosystem types, and that have a significant impact on the structure, productivity and
resilience of natural ecosystems” (Sanderson et al. 2002; Coppolillo et al. 2003). Exclusion
experiments carried out with large terrestrial herbivores in Bolivia have demonstrated that
lowland tapir, white-lipped peccary (Tayassu pecari), collared peccary (Tayassu tajacu), grey-
brocket deer (Mazama gouazoubira), and red-brocket deer (Mazama americana) affect
ecosystem dynamics in different ways (Painter 1998). Generally speaking, these animals
impact the structure and diversity of plant communities by decreasing the abundance of
preferred species (Bazely & Jefferies 1986; Virtanen et al. 1997; Olofsson 2001; Brathen &
Oksanen 2001; Grellmann 2002), and by changing competitive interactions between plants
(Virtanen 1998; Mulder & Ruess 1998; Olofsson et al. 2002), therefore maintaining habitat
heterogeneity (Terborgh 1988; Dirzo & Miranda 1991). The relative impact of herbivores is a
function of body size (Demment & Van Soest 1985; Freeland 1989; Olff & Ritchie 1998). Large
animals such as tapirs, even at low population densities, can comprise a significant biomass
and consume large amounts of food. Foerster (1998) estimated that Baird's tapirs consumed
an average of 16 kg of fruit and fibrous materials per day. In addition, tapirs selectively
browse vegetative parts of different food plants (Salas & Fuller 1996), and seem to play an
important role as long-distance seed dispersers (Janzen 1981; Eisenberg 1990; Bodmer
1991b; Rodrigues et al. 1993; Henry et al. 2000; Galetti et al. 2001; Fragoso et al. 2003). The
pattern of movements of tapirs affects seed shadows by determining where seeds are
dispersed and in what amount, and the intensity of predation to which they are subjected

8
(Fragoso 1994). Tapirs ingest whole seeds and either spit or drop large numbers of viable
seeds within their faeces (Varela & Brown 1995; Painter & Rumiz 1999). These seeds may
experience lower rates of predation than seeds not in faeces, which suggest that tapirs may
increase the effectiveness of seed dispersal if they deposit faeces away from parent plants
(Fragoso 1994; Olmos et al. 1999). Bodmer (1991b) found that the lowland tapir is the only
ungulate that regularly disperses seeds in the Amazon. Lowland tapirs are especially important
for the dispersal of seeds of some palm trees, such as Syagrus romanzoffiana in the semi-
deciduous Atlantic Forest (Olmos et al. 1999). Fragoso (1997) anticipated that the
reproductive success and distribution of Mauritia maripa palm in the Amazon was due largely
to tapirs. Lastly, tapir seed dispersal also allows for secondary dispersal by small rodents that
remove the seeds deposited by tapirs in latrines (Fragoso 1994; Fragoso 1997). Tapirs are not
ruminants, they have a hypertrophic cecum and, consequently, seed predation by digestion is
lower when compared to other large-sized mammalian herbivores, such as deer and peccaries
(Janzen 1981; Bodmer 1991b; Fragoso et al. 2003). For all these reasons, tapirs play a critical
role in shaping the structure and maintaining the functioning of ecosystems, and thus have
been recognised as “ecological engineers” (Fragoso 1998) as well as “gardeners of the forest”
(Painter 1998). Therefore, local tapir extinctions or drastic population declines may trigger a
breakdown of key ecological processes, eventually jeopardising the integrity of the ecosystem
over the long-term (Foerster & Medici 2002; Medici et al. 2007a). Determining the ecological
factors that will ensure the long-term persistence of a landscape species will ensure the
ecological integrity of the ecosystem.
Landscape species use a variety of habitats and their movements can functionally link
different habitat types or regions within a given landscape (Sanderson et al. 2002). Large
animals likely have a greater perceptual range (Zollner 2000), thereby influencing the
detection of suitable habitat and the perception of landscape structure and interrelatedness
(Wiens 1996). Therefore, the elimination of a landscape species may undermine these
functional links between different habitats and lead to cascading changes in ecological
communities or even the loss of the ecosystem functions critical to the persistence of other
species, communities, and the larger landscape itself (Sanderson et al. 2002). The use of the
umbrella and landscape species concepts have been advocated as efficient tools for identifying
priority areas in need of protection (Shafer 1990; Sanderson et al. 2002; Caro 2003).
In addition to lowland tapirs, the community of large herbivores of the Atlantic Forests of the
Pontal do Paranapanema Region includes the white-lipped peccary (Tayassu pecari), collared
peccary (Tayassu tajacu), grey-brocket deer (Mazama gouazoubira), and red-brocket deer
(Mazama americana). These five species are sympatric throughout most of their ranges. They
all have broad diets including fruit, browse and fibre in different proportions (Bodmer 1991b;
Gayot et al. 2004; Beck 2005; Tobler 2008). Bodmer (1991a) studied resource partitioning

9
among these five species in the Peruvian Amazon, and analysed the diet and habitat use of all
five species concluding that each species partitioned at least one resource type from every
other species. In another site of the Peruvian Amazon, Tobler et al. (2009) observed a high
spatial overlap among these five species, and claims that diet was the most important factor
in resource partitioning among them. Even though Tobler et al. (2009) observed an apparent
competition for fruit, the high diversity and spatial distribution of plant species in the Amazon
appeared to allow for enough variation in their diet to permit the five species to coexist.
Nevertheless, this might be different in fragmented landscapes. When compared to continuous
tracts of forest, fragmented landscapes have lower fruit diversity (Wright & Duber 2001;
Tabarelli et al. 2004), as well as lower fruit availability (Terborgh 1986; Terborgh 1992), which
can potentially lead to a disruption of natural patterns of inter-specific competition.
Inter-specific competition is one of the major selective forces causing the differential use of
resources (Schoener 1986), and population regulation (Dublin et al. 1990; Sinclair 2003),
therefore playing an important role in the structure of ecological communities (Connell 1983;
Schoener 1983; Schoener 1984; Maurer 1985; Goldberg & Barton 1992; Gurevitch et al.
1992). The theory of community ecology predicts that resource partitioning, fluctuations in
population densities, and responses to changes in environmental factors in space and time will
have major effects on species coexistence (Chesson 2000; Simberloff 2004; Chase 2005;
Guisan & Thuiller 2005; Sinclair & Byrom 2006). Inter-specific competition for food resources
on herbivore assemblages arises whenever one species reduces shared food resources below
the level that can be exploited efficiently by other species (Tokeshi 1999; Murray & Illius
2000). Instead, by reducing plant biomass, one species may benefit others by facilitating
access to forage of a suitable height or quality (Gordon 1988; McNaughton et al. 1997), or the
quality of eventual re-growth may be higher (Alpe et al. 1999; Arsenault & Owen-Smith 2002).
Disrupted patterns of inter-specific competition could potentially lead to rapid demise of small
tapir populations and have consequences on the community of frugivores with which it shares
several niches.
Lowland tapirs are part of the prey base of jaguars (Panthera onca) and pumas (Puma
concolor) in the Atlantic Forests of the Pontal do Paranapanema Region. However, tapirs are
not the primary food source for these large cats, which prefer small- to medium-sized preys
(Polisar et al. 2003; Astete et al. 2008). In addition, tapirs occur at low population densities,
so making it difficult for predators to encounter them. Nevertheless, a few studies have
recorded tapir predation by jaguar (Taber et al. 1997; Garla et al. 2001; Astete et al. 2008).
Furthermore, tapir predation was observed on several occasions during this study. Three out
of 25 radio-collared tapirs were predated by either jaguar or puma, while I found three
carcasses of non-tagged tapirs killed by jaguars. Thus, tapir predation should be considered as
one of the components of tapir population regulation, especially when considering small,

10
isolated populations in fragmented habitats. Fragmented landscapes can exacerbate the effect
of predation on prey population dynamics by allowing carnivores to concentrate their hunting
efforts on islands of preferred prey habitat (Wirsing et al. 2002). Likewise, edge habitats
resulting from fragmentation also contribute to higher predation rates by favouring generalist
predator influx (Schmiegelow & Monkkonen 2002).
For all the reasons described, the tapir is a suitable species to be used as a tool for the
assessment of long-term persistence and viability of animal populations across fragmented
landscapes. The evaluation of the ecological requirements of tapir populations in the
fragmented landscape of the Pontal do Paranapanema Region should provide critical
information for the evaluation of the current status of these populations, as well as for the
understanding of how tapirs were affected by the past process of habitat loss and
fragmentation. Furthermore, this information should allow for the assessment of the ability of
tapirs to survive and persist in fragmented landscapes over the long-term.
1.1.4 Why is the Atlantic Forest of the Interior a good model?
Habitat fragmentation is a worldwide phenomenon, and the ecologically complex tropical rain
forests have been one of the prime targets (Wilcove et al. 1986; Skole & Tucker 1993; Cuarón
2000). Amazonian forests are experiencing rapid and unprecedented changes due to
deforestation and habitat conversion, and these changes are having major impacts on wildlife,
regional hydrology and the global climate (Laurance 2005; Perz et al. 2005). Likewise, the
Atlantic Forest biome has suffered large-scale habitat destruction and fragmentation for the
past 500 years (Ribeiro et al. 2009). The loss of the Atlantic Forest biome has been widely
acknowledged as one of the most alarming conservation issues in the world (Mori et al. 1981;
Terborgh 1992; Viana et al. 1997).
In historical times, the Atlantic Forest biome stretched almost continuously for 4,000 km along
the eastern Brazilian coast from Rio Grande do Norte at the easternmost tip of the South
American continent to as far as Rio Grande do Sul, the southernmost Brazilian state (Eiten
1970; Collins 1990; Dean 1997; Morellato & Haddad 2000; SOS Mata Atlântica & INPE 2008),
extending inland into eastern Paraguay and north eastern Argentina. The original extent of the
Atlantic Forest in the three countries of occurrence was estimated to be ~1.5 million km²
(Sanjurjo & Gauto 1996; Cartes 2003; Giraudo et al. 2003; Ribeiro et al. 2009). Today, this
biome has been reduced to ~88% of its original size (Ribeiro et al. 2009). Atlantic Forests
were largely and rapidly converted to anthropogenic systems (Brown & Brown 1992; Coimbra-
Filho & Câmara 1996; Dean 1997). The Atlantic Forest was cleared mainly for timber,
firewood, charcoal, agriculture, cattle ranching, and the construction of cities (Morellato &
Haddad 2000). The remaining Atlantic Forest consists of small and isolated forest islands

11
scattered across a landscape dominated by agricultural uses and urban development and are
still under severe pressure, suffering from various patterns of habitat fragmentation (Morellato
& Haddad 2000).
The Atlantic Forest domain can be subdivided into two major regions based on vegetation
types and geographical features (Mori et al. 1981; Morellato & Haddad 2000). The first
vegetation type is classified as Tropical Evergreen Mesophytic Broadleaf Forest or Atlantic Rain
Forest. The second is the Tropical Semi-Deciduous Mesophytic Broadleaf Forest or Atlantic
Semi-Deciduous Forest, also known as Atlantic Forest of the Interior. The Atlantic Rain Forest
covers mostly the low to medium elevations (≤1,000 m) of the eastern slopes of the mountain
chain that runs along the coastline from southern to north eastern Brazil (Eiten 1970). The
Atlantic Semi-Deciduous Forest extends across the western range of the coastal hills,
stretching to the Plateau region (≥600 m) in the centre and south eastern interior of Brazil
and stretching into Paraguay and Argentina (Leitão-Filho & Morellato 1997; Oliveira-Filho &
Fontes 2000). This lowland tapir study took place in the Atlantic Forest of the Interior.
Nowadays, only 2% of the Brazilian Atlantic Forest of the Interior still remains (Dean 1997;
SOS Mata Atlântica & INPE 2008). Some of the most significant remnants of these forests are
found in the Plateau region of Brazil (SOS Mata Atlântica & INPE 2008), and 84% of the
remaining Plateau forests are found in the Pontal do Paranapanema Region, in the
westernmost extremity of São Paulo State (Valladares-Padua et al. 2002). In 1941, while still
entirely forested, the entire western part of São Paulo, comprising an area of ~2,600 km²,
was decreed a forest reserve, the “Grande Reserva do Pontal” (Great Reserve of the Pontal)
(Valladares-Padua 1993; Leite 1998). Since then, the history of the Pontal do Paranapanema
Region has been marked by a series of conflicts over land ownership and a complex process
of Agrarian Reform, which has led to the almost complete destruction and fragmentation of its
forests. Deforestation in the region from 1987 to 2001 occurred at a rate of 1.5% year-¹
(Cullen 2007).
Only 17% of the Pontal do Paranapanema Region remains covered with forests (Uezu et al.
2008). The remaining forests includes: Morro do Diabo State Park, which protects 370 km² of
forest; Black-Lion-Tamarin Ecological Station, a federal protected area created in 2002
encompassing the four largest forest fragments located around Morro do Diabo and
comprising an additional 67 km² of protected habitat; and a multitude of small forest
fragments from 0.02-20 km² scattered throughout the region, comprising a further 60 km² of
forest (Ditt 2002; Uezu et al. 2008). Most of the small forest fragments lie within private
properties, while some are located in Agrarian Reform settlements and so are owned by the
State. The landscape matrix is mainly composed of pasture land for cattle ranching (60%) and
agricultural crops (15%) (Uezu et al. 2008).

12
In contrast to the eastern part of the Atlantic Forest biome, the process of deforestation of the
Atlantic Forest of the Interior in the Pontal do Paranapanema Region is relatively recent,
approximately 60 years. Therefore, while there has been an extensive loss of habitat, most of
the forest remnants of the Pontal do Paranapanema Region still support an outstanding
diversity of species of flora and fauna of the Atlantic Forest of the Interior, many of them
endemic and/or threatened with extinction. Some of the larger forest fragments in the region,
particularly Morro do Diabo State Park, still support populations of several species of large
mammals, including lowland tapirs. During a biodiversity assessment carried out in the Pontal
do Paranapanema Region, all forest fragments larger than 4 km² were surveyed for flora and
fauna (Ditt 2002). The presence of tapirs was confirmed in eight of these forest fragments,
including Morro do Diabo and seven smaller forest fragments in its surroundings. Tapirs were
absent in six forest fragments surveyed during the study, characterising local extinctions most
probably due to overhunting (Cullen 1997; Cullen et al. 2000). Nevertheless, although tapirs
have been affected by the past processes of habitat fragmentation, they still survive in some
of these forests.
Additionally, tapirs have the ability to cross areas of low quality habitat, such as agricultural
crops and pasture lands, and move through the landscape matrix in between forest fragments
(Flesher 2007). During this study, I gathered a considerable amount of data on tapir
movements throughout the fragmented landscape of the Pontal do Paranapanema Region.
Tapirs moved between Morro do Diabo and the surrounding small forest fragments, as well as
amongst the small forest fragments themselves, thus characterising a certain level of
metapopulation dynamics. These landscape movements were observed across rather short-
scales when compared to the long distance movements observed for large cats such as
jaguars, pumas and ocelots also in the Pontal do Paranapanema Region (Cullen 2007).
Nevertheless, data from this study indicates that given the proper conditions in terms of
habitat quality and resources and in the absence of threats, tapirs have the capability to
recolonise forest fragments and maintain a certain level of genetic flow between different
populations. In genetic terms, the short period since fragmentation occurred in the landscape
of the Pontal do Paranapanema Region (from 5-6 tapir generations) probably means that
patterns of genetic structure are still in transition, and therefore genetic drift and inbreeding
have not been observed yet (Gonçalves da Silva 2007). Thus, the Atlantic Forest of the
Interior of the Pontal do Paranapanema Region is the perfect environment for the assessment
of the long-term persistence and viability of animal populations across fragmented landscapes.

13
1.2 Thesis Aims and Structure
In this thesis, I used data from a 12-year study on lowland tapirs in the Atlantic Forests of the
Interior of the Pontal do Paranapanema Region, São Paulo State, Brazil, to substantiate an
assessment of the long-term persistence and viability of tapir populations across a severely
fragmented landscape. The main goal of this thesis was to understand what lowland tapirs
require in terms of space, habitat and population abundance in order to remain
demographically and genetically healthy, persist and be viable across the fragmented
landscape of the Atlantic Forest of the Interior.
This goal was achieved through two different approaches:
• Empirical assessment of the persistence and viability of tapir populations based on
ecological characteristics of the species including: (i) spatial ecology, (ii) intra-specific
interactions, (iii) spatial and temporal interactions between tapirs and the landscape, and
(iv) population sizes. The different aspects of the empirical assessment were explored in
Chapters 3, 4, and 5.
• Modelling of tapir population viability through the use of a computer simulation model of
Population Viability Analysis (PVA). The modelling approach was explored in Chapter 6.
Chapter 1 has already introduced the main questions posed by this thesis and explained
why lowland tapirs and the Atlantic Forest of the Interior in the Pontal do Paranapanema, São
Paulo, Brazil, are appropriate models to illustrate an assessment of the viability of animal
populations across severely fragmented landscapes.
Chapter 2 provides detailed information about the study species and the study area. The
first part of the chapter describes lowland tapirs, providing information about taxonomy and
evolution, morphology, geographic distribution, ecology and behaviour, and lastly the
conservation status of the species and the threats it faces in the wild. The second part of the
chapter is dedicated to a comprehensive overview of the history of destruction and
fragmentation of the Atlantic Forest biome and its current conservation status, providing
specific details about the Atlantic Forest of the Interior and the Pontal do Paranapanema
Region. This includes a description of Morro do Diabo State Park where most of the tapir data
were collected during this study. The third and final part of the chapter provides general
information about the study including details about logistics and personnel, different field
methods used for data collection, timeframe of study, as well as required research permits.

14
Chapter 3 is dedicated to analysing tapir spatial ecology and intra-specific interactions.
The purpose of this chapter was to determine tapir spatial requirements and how these
influence the long-term survival and persistence of tapir populations in the Atlantic Forest.
Analysis of tapir home range size, structure, and seasonality in Morro do Diabo, as well as the
description of tapir movements through the fragmented landscape of the Pontal do
Paranapanema Region, were used to determine tapir spatial ecology. Estimates of home range
overlap and overlap of core areas of use were used to examine aspects of territoriality and
intra-specific interactions. A large part of this chapter was dedicated to providing an overview
of the use and reliability of radio-telemetry for studying tapirs over the long-term. I presented
detailed information about the different phases involved in the process of using radio-
telemetry including methods of capture, immobilisation protocols and manipulation
procedures, as well as data collection and sampling design. An additional analysis included in
this chapter involved the determination of the minimum amount of time and minimum number
of locations required to determine tapir home range size, a critical piece of information for the
design of future tapir studies.
Chapter 4 is dedicated to determining the abundance of tapir populations in Morro do
Diabo State Park and surrounding Atlantic Forest fragments in the Pontal do Paranapanema
Region. Population size is a fundamental demographic element and a cornerstone of ecology,
which has widespread implications for population structure and dynamics, as well as for
determining the viability of animal populations over the long-term. Yet, making accurate
estimates of population size is very difficult. Animals are often difficult to capture or observe,
and the associated costs and effort of making absolute counts or censuses are prohibitive.
Consequently, animal ecologists have to rely on indirect methods to estimate population
abundance and then derive or estimate population size. I estimated the density of the tapir
population in Morro do Diabo through the use of three different methodologies including
radio-telemetry, nocturnal line-transect sampling, and Footprint Identification Technique (FIT).
Various methods of data analysis were applied and I obtained 10 different estimates of tapir
density for Morro do Diabo. I then selected the most appropriate density estimate to derive
tapir population sizes in Morro do Diabo and surrounding forest fragments where the presence
of tapirs had been previously confirmed. Additionally, part of this chapter was dedicated to
comparing the three density estimators according to a selected set of criteria including cost,
requirement of personnel, and field effort. Another criterion was the invasiveness of the
method. The growing need to census and monitor wildlife populations over time makes the
development, evaluation, and validation of suitable techniques for estimating abundance a
priority. The advantages and disadvantages of each method applied during this study, as well
as their accuracy and reliability for long-term tapir monitoring were presented and discussed.

15
Chapter 5 explores the spatial and temporal interactions between tapirs and the
fragmented landscape of the Pontal do Paranapanema Region. I first looked at the extent of
occurrence of different habitat types within tapir home ranges and core areas of use in Morro
do Diabo. This allowed me to gain knowledge into how tapirs establish and structure their
home ranges, and what kinds of habitats they incorporate within their main areas of use.
Second, I examined how tapirs actually use these different habitat types. I determined the
availability and use of different habitat types within tapir home ranges, and examined which
habitats were significantly selected or avoided by them. The examination of habitat selection
provided evidence of whether tapir use of different habitat types occurred in proportion to
their availability in the study site. Lastly, I analysed tapir activity patterns in Morro do Diabo. I
determined the main peaks of activity, as well as patterns of habitat use in relation to activity.
These analyses provided information about what types of habitat tapirs use for their main
activities including foraging, travelling, and resting. All this information was then used to
determine how the spatial and temporal interactions between tapirs and the mosaic of
different habitats found within the landscape of the Pontal do Paranapanema Region relate to
the survival and long-term persistence of tapir populations in the Atlantic Forest.
Chapter 6 focuses on modelling the viability of tapir populations through the use of
Population Viability Analysis (PVA). I developed a robust VORTEX baseline model reflecting the
biological potential of tapirs in Morro do Diabo, and carried out sensitivity analysis to evaluate
the effect of selected reproductive and mortality parameters on the stochastic growth rate of
lowland tapir populations. Next, I carried out an analysis of the Minimum Viable Population
(MVP) for tapirs in Morro do Diabo. I then used the baseline model to evaluate the impact of
fire, road-kill and infectious diseases, analysing how these factors affect the probability of
long-term persistence of tapirs in Morro do Diabo. Lastly, I created a metapopulation scenario
including Morro do Diabo and surrounding forest fragments and analysed the probability of
extinction of the different populations and of the metapopulation as a whole. As an example
of conservation strategy, I modelled the establishment of corridors between Morro do Diabo
and surrounding forest fragments, and analysed the impact these corridors would have on the
long-term viability of the lowland tapir populations in the Pontal do Paranapanema Region.
Chapter 7 concludes this thesis by using information about tapir ecological requirements
and results from population modelling to substantiate the design of conservation strategies to
promote the long-term survival and persistence of tapir populations in severely fragmented
landscapes. In addition, this chapter provides recommendations on what further data are
needed to allow for the assessment of viability of tapir populations over the long-term. Lastly,
I conclude with a general discussion about the factors that are determinant for the long-term
persistence and viability of animal populations across fragmented landscapes.

Chapter 2
Study Species, Study Area and
General Methods
Photo by Patrícia Medici

17
2.1 Introduction
This chapter provides detailed information about the study species and the study area, as well
as general methods used in this long-term research study. The first part of the chapter
consists of a detailed description of lowland tapirs, providing information on aspects of
taxonomy and evolution, morphology, geographic distribution, ecology and behaviour, as well
as the conservation status of the species and the threats it faces in the wild. The second part
provides an overview of the history of destruction and fragmentation of the Atlantic Forest
biome and its current conservation status, especially in Brazil, including specific details about
the Atlantic Forest of the Interior and the Pontal do Paranapanema Region. This includes a
description of Morro do Diabo State Park, the protected area where most of the tapir data
were collected during this study. The third and final part of the chapter provides general
information about the study including details of logistics and personnel, required permits, field
methodologies used for data collection, and timeframe of study.
2.2 The Lowland Tapir
2.2.1 Taxonomy and Evolution
The lowland tapir, Tapirus terrestris, also known as Brazilian or South American tapir, is an
ungulate of the order Perissodactyla. The lowland tapir is one of the four surviving species of
a taxon that has been very successful in the past (Eisenberg 1997). The other three species
are the Baird's tapir (Tapirus bairdii) in Central and northern South America, the mountain
tapir Tapirus pinchaque), in the Andes of South America, and the Malayan tapir (Tapirus
indicus) in Southeast Asia. According to Eisenberg (1997), the family Tapiridae was first
recognisable as a taxonomic entity in the Eocene of North America, nearly 50 Million years
ago. The genus Tapirus first appeared in the Miocene (25-5 Million years ago), so extant tapirs
derive from an ancient lineage that is related to the primitive horse and to the rhinoceros.
Prehistoric tapirs inhabited Europe, North America and Southeast Asia, including China. No
remains have been found on the continents of Africa or Australia. Given the intermittent
connections between North America and Asia via the Bering Strait, tapirs soon appeared in
Euro-Asia. With the completion of the Isthmus of Panama between North and South America,
during the Pliocene (7-2 Million years ago), tapirs entered South America (Eisenberg 1997).
2.2.2 Morphology
Many of the morphological characteristics of tapirs are primitive, including unreduced dental
formula, short legs with retention of complete ulna and fibula, and retention of tetradactyl

18
manus and tridactyl pes, all features seen in the first member of the Perissodactyla, the
Hyracotherium (Janis 1984). The dental formula of adult tapirs is 2X (I-3/3, C-1/1, PM-4/3, M-
3/3) giving a total of 42 teeth in both males and females. The upper third incisors are large
and well developed, while the upper canines are reduced and separated from the incisors by a
narrow diastema. The lower third incisors are reduced and the lower canine is well developed,
occluding with the canine-like upper third incisors. There is a large diastema between canines
and premolars in both jaws (Padilla & Dowler 1994).
Tapirs have a solid body structure, shaped round in the back and tapering in the front, well-
suited for rapid movement through thick underbrush (Eisenberg 1997) (Figure 2.1). The
colour of adult lowland tapirs is blackish brown dorsally with the ears edged in white; the
chest, venter and limbs are dark brown; the cheeks are grizzled brown and gray (Padilla &
Dowler 1994). A fibrous tissue layer lies beneath the epidermis of tapirs (Frädrich & Thenius
1972). The skin of lowland tapirs is thickest at the nape, and often covered by scars,
scratches, and bruises (Hershkovitz 1954). Lowland tapirs have a well developed sagittal crest
that runs from the base of the muzzle to the middle of the back (Padilla & Dowler 1994),
which is derived from fat and soft tissues and covered by long black hair (Hershkovitz 1954).
The sagittal crest is thought to help escape predators, which usually seize the dorsum of the
neck (Medici 2001). Young of all four tapir species are dark with yellow or white stripes and
spots, which serves as camouflage against predation (Figure 2.2). This pattern begins to fade
at three months and is completely gone after 5-6 months of life, although some vestiges of
spotting may remain in young adults (Hershkovitz 1954).
Tapirs have relatively long, laterally compressed skulls with a high braincase and convex
profile. The nasal bones are short, arched and freely projecting. The nasal opening is very
large. Tapirs have a short, fleshy proboscis derived from muscle and soft tissues from the
snout and upper lip. The proboscis is highly mobile and sensitive to touch, and is important for
food manipulation and ingestion (Padilla & Dowler 1994). Tapir eyes are small and flush with
the side of the head; their ears are oval, erect, and not very mobile (Eisenberg 1997). Tapirs
have poor eyesight but good hearing and olfactory senses (Frädrich & Thenius 1972).
The feet of tapirs are mesaxonic (Padilla & Dowler 1994). The forefoot has four main digits,
and a smaller one (the fifth) is only used when the tapir is walking on soft ground. The hind
feet have three digits. All the toes are hoofed. The splayed feet, help tapirs walk in muddy
and soft ground. The weight of the body is divided between an elastic cushion under the feet
and the central digits, which becomes evident in the tapir footprints.
The lowland tapir is the second largest terrestrial mammal in South America, the first being
the Baird's tapir (Tapirus bairdii). According to Padilla & Dowler (1994), adult lowland tapirs

19
weigh from 150-250 kg. In captivity, adult female lowland tapirs were usually observed to be
25-100 kg heavier than males (Barongi 1986; Barongi 1993). According to data collected from
captured lowland tapirs during this study in Morro do Diabo, average tapir weights were 233
kg for adult females, 208 kg for adult males, 200 kg for sub-adult females, and 195 kg for
sub-adult males (Table 2.1). There was no difference in weight when comparing between the
sexes for both adults (T=94.000; N=10-14; P=0.074) and sub-adults (t=-0.156; DF=4;
P=0.884). Two juveniles captured during the study (1 male and 1 female) weighed from 80-
100 kg. Newborn tapirs usually weigh from 3-6 kg (Padilla & Dowler 1994). In captivity,
lowland tapir calves gain an average of 2.5 kg per week and are completely weaned at 4
months of age (Barongi 1993). Growth is usually completed at 18 months of age (Young
1961).
Table 2.1. Mean weights (kg) of 33 lowland tapirs (19 females and 14 males, or 27 adults and 6 sub-adults) captured in Morro do Diabo State Park, São Paulo, Brazil. (N=number of tapirs; AV=average; SD=standard deviation; Min=minimum; Max=maximum).
Weight (kg)
N
AV
SD
Min
Max
ADULT FEMALES 17 233 38.3 200 300 ADULT MALES 10 208 37.6 180 280 SUB-ADULT FEMALES 2 200 14.1 180 200 SUB-ADULT MALES 4 195 42.0 150 250
Mallinson (1969) observed that female lowland tapirs in captivity seemed to be longer on
average than males. Padilla & Dowler (1994) noted a total body length of 204 cm for adult
male lowland tapirs, and 221 cm for females. Data collected during this study in Morro do
Diabo showed that for the great majority of the corporal measurements obtained from
captured tapirs, females presented higher averages than males, in both adult and sub-adult
age classes (Tables 2.2 and 2.3). For six out of 13 measurements adult females were
significantly larger than adult males (Table 2.2). No differences were observed between the
sexes in sub-adults (Table 2.3). Table 2.4 provides corporal measurements of two juvenile
tapirs captured during the study.

20
Table 2.2. Mean values of 13 corporal measurements (cm) obtained from 30 adult lowland tapirs (19 females and 11 males) captured in Morro do Diabo State Park, São Paulo, Brazil. (N=number of tapirs; AV=average; SD=standard deviation; Min=minimum; Max=maximum; *Indicates a significant difference between the sexes).
Corporal Measurements (cm)
ADULT Females ADULT Males Significant Differences N AV SD Min Max N AV SD Min Max
Neck circumference* 18 86 7.4 74 98 11 79 6.9 64 88 t=2.448; DF=27; P=0.021
Head length 18 48 4.8 40 55 9 48 5.2 39 55 t=-0.357; DF=25; P=0.724
Head width 15 42 9.9 29 70 10 38 4.6 31 44 t=1.223; DF=23; P=0.234
Full length (dorsum)* 19 221 9.8 208 242 11 205 11.7 191 223 t=3.992; DF=28; P=<0.001
Full length (lateral)* 16 202 12.3 174 223 9 186 23.4 130 216 T=79.500; N=9-16; P=0.036
Front leg length 18 70 9.0 51 81 8 65 9.7 53 79 t=1.376; DF=24; P=0.181
Rear leg length 17 72 8.3 58 83 8 65 6.9 52 75 t=2.058; DF=23; P=0.051
Thorax circumference* 17 144 12.8 118 168 10 129 7.8 120 146 t=3.224; DF=25; P=0.004
Abdomen circumference 14 169 19.0 132 198 4 152 9.1 142 164 t=1.615; DF=16; P=0.126
Front height* 17 108 8.4 83 118 10 101 9.7 83 113 T=94.500; N=10-17; P=0.024
Rear height* 18 110 8.5 90 120 10 101 7.0 89 109 T=89.000; N=10-18; P=0.008
Ear length 16 13 1.7 11 16 9 13 1.5 10 15 t=0.439; DF=23; P=0.665
Distance between eyes 15 23 3.6 15 28 9 24 2.5 20 28 t=-0.947; DF=22; P=0.354

21
Table 2.3. Mean values of 13 corporal measurements (cm) obtained from 6 sub-adult lowland tapirs (2 females and 4 males) captured in Morro do Diabo State Park, São Paulo, Brazil. (N=number of tapirs; AV=average; SD=standard deviation; Min=minimum; Max=maximum).
Corporal Measurements (cm)
SUB-ADULT Females SUB-ADULT Males Significant Differences N AV SD Min Max N AV SD Min Max
Neck circumference 4 83 6.2 76 91 2 81 2.1 80 83 t=0.264; DF=4; P=0.805
Head length 4 46 5.0 42 53 2 47 8.5 41 53 t=-0.191; DF=4; P=0.858
Head width 4 36 4.0 32 41 2 32 2.1 31 34 t=1.187; DF=4; P=0.301
Full length (dorsum) 4 213 5.2 207 219 2 198 9.2 192 205 t=2.611; DF=4; P=0.059
Full length (lateral) 2 165 10.6 158 173 1 184 12.4 184 184 N too small to perform test
Front leg length 3 69 7.1 61 75 2 64 7.8 59 70 t=0.623; DF=3; P=0.578
Rear leg length 3 68 6.8 60 73 2 65 2.8 63 67 t=0.504; DF=3; P=0.649
Thorax circumference 3 140 17.3 130 160 2 118 0.7 118 119 t=1.665; DF=3; P=0.195
Abdomen circumference 1 144 8.3 144 144 1 142 8.3 142 142 N too small to perform test
Front height 4 103 7.9 92 111 2 97 7.8 92 103 t=0.771; DF=4; P=0.484
Rear height 4 108 8.1 97 115 2 102 7.8 97 108 t=0.831; DF=4; P=0.453
Ear length 4 16 1.8 14 18 2 13 1.4 12 14 t=2.000; DF=4; P=0.116
Distance between eyes 3 23 4.2 20 28 2 20 1.4 19 21 t=1.044; DF=3; P=0.373

22
Table 2.4. Mean values of 13 corporal measurements (cm) obtained from 2 juvenile lowland tapirs (1 male and 1 female) captured in Morro do Diabo State Park, São Paulo, Brazil. (N=number of tapirs; AV=average; SD=standard deviation; Min=minimum; Max=maximum).
Corporal Measurements (cm)
JUVENILES
N AV SD Min Max
Neck circumference 2 73 9.9 66 80
Head length 2 44 2.1 43 46
Head width 2 34 1.4 33 35
Full length (dorsum) 2 176 5.7 172 180
Full length (side) 2 158 9.2 152 165
Front leg length 2 66 8.5 60 72
Rear leg length 2 70 5.7 66 74
Thorax circumference 2 110 5.7 106 114
Abdomen circumference 2 132 2.8 130 134
Rear height 2 89 2.1 88 91
Front height 2 89 0.0 89 89
Ear length 2 13 0.7 13 14
Distance between eyes 2 14 2.8 12 16

23
Figure 2.1. The lowland tapir (Tapirus terrestris), also known as South American or Brazilian tapir. Photo by Richard E. Bodmer.
Figure 2.2. Captive lowland tapir calf at approximately 30 days of age. Photo by Kelly Russo.
24
2.2.3 Geographic Distribution
The lowland tapir has the widest range of the four living species and which extends from
north-central Colombia and east of the Andes throughout most of tropical South America
down to north eastern Argentina and Paraguay, at elevations up to 2000 m (Hershkovitz
1954; Emmons & Feer 1997; Eisenberg 1997; Medici et al. 2007a). The species occurs in 11
different countries including Argentina, Bolivia, Brazil, Colombia, Ecuador, Guyana, French
Guyana, Paraguay, Peru, Suriname and Venezuela. The historic distribution of this species
covered ~13.1 million km² (Taber et al. 2008).
The Lowland Tapir Range-Wide Assessment carried out by the Wildlife Conservation Society
(WCS) has identified the presence of lowland tapirs at 1,213 sites and the species was judged
extinct in another 40 sites across its range (Taber et al. 2008). According to this assessment,
the lowland tapir has become extinct across ~14% of its range, and its current distribution
has declined to 11.2 million km². Range contractions have mostly occurred in north western
South America, coastal Venezuela, northeast Brazil, and along the southern fringes of the
species distribution in Argentina and Brazil. Approximately 41% of the historic range of the
species was classified as being of low or medium probability for long-term survival, in which
only small, isolated, and scattered populations will persist. However, populations were still
broadly intact across 44% of its historic range. In Brazil specifically, the lowland tapir has
disappeared from over 1 million km² or 12% of its country range. The species distribution
range in Brazil still covers over 7 million km², but appears to have a high probability of long-
term survival in only about a third of its historic range (Taber et al. 2008) (Figure 2.3).

25
Figure 2.3. Map of current distribution and probability of survival of the lowland tapir. Extracted from the Lowland Tapir Range-Wide Assessment Report (Taber et al. 2008).

26
The Lowland Tapir Population and Habitat Viability Assessment (PHVA) Workshop (Medici et
al. 2007a) was held by the IUCN/SSC Tapir Specialist Group (TSG) and the IUCN/SSC
Conservation Breeding Specialist Group (CBSG), and identified 21 different biomes where
lowland tapirs are still found throughout their range (Table 2.5), with the largest populations
currently existing in the Amazon. Some of these biomes are specific of certain range countries.
In Brazil, lowland tapirs are found in five biomes: Amazon, Atlantic Forest, Cerrado, Pantanal,
and Araucaria Forests.
Table 2.5. List of 21 biomes where lowland tapirs occur. Extracted from the Lowland Tapir Population and Habitat Viability Assessment (PHVA) Workshop Final Report (Medici et al. 2007a).
General Biomes
North Eastern Amazon South Eastern Amazon Upper Amazon Amazonian Savannas Dry Chaco Humid Chaco Subtropical Andean Forests Llanos Atlantic Forest of the Interior Pantanal Yunga Forests
Brazilian Biomes
Araucária Forests Cerrado Coastal Atlantic Forest
Colombian Biomes
Oriental Amazon Occidental Amazon Orinoquía Northeast Antioqueño Sierra Nevada de Santa Marta
Suriname Biomes
Coastal Forests
Venezuelan Biomes
Northern Andes

27
2.2.4 Ecology and Behaviour
2.2.4.1 Habitat Requirements
As its name indicates, the lowland tapir commonly inhabits tropical lowland South American
rainforests but can also be found in a wide range of other habitat types including tropical
moist forests, xeric Chaco and Cerrado forest, savannah wetlands and lower montane forests
(Eisenberg 1997). The Lowland Tapir Range-Wide Assessment (Taber et al. 2008) identified
six main categories of habitat where lowland tapirs occur comprising: (i) tropical and sub-
tropical moist broadleaf forests; (ii) tropical and sub-tropical moist to seasonally moist
montane forests; (iii) tropical and sub-tropical dry forests, savannahs and shrub lands; (iv)
tropical and sub-tropical seasonally moist grasslands and savannahs; (v) montane grasslands;
and, (vi) mangroves (Figure 2.4). Therefore, the lowland tapir appears to be adapted to a
diverse array of environments found throughout its distribution range. Nevertheless, a number
of studies have identified patterns of habitat preference and selection in tapir species (Bodmer
1990b; Fragoso 1991a; Fragoso 1991b; Naranjo 1995; Foerster 1998; Naranjo & Cruz-Aldán
1998; Muench 2001; Foerster & Vaughan 2002; Ayala 2003; Lizcano 2006; Tobler et al. 2006;
Tobler 2008).
Palm forests are thought to be important tapir habitat (Brooks et al. 1997; Fragoso 1997;
Olmos et al. 1999; Tófoli 2006). In the north eastern region of the Brazilian Pantanal, tapirs
show high preference for Acuri palm forests (Scheelea phalerata) when compared to other
vegetation types. Accordingly, potential tapir distribution models demonstrate high occurrence
probabilities in such habitat areas (Cordeiro 2004). In addition, tapirs are generally closely
associated with riparian forests, marshes, lakes and streams (Padilla & Dowler 1994; Medici
2001). Tapirs defecate in water or in dry seasonal streams and ponds (Eisenberg 1989;
Bodmer 1991a). However, exceptions to this behaviour have been observed in other areas
where tapir faeces were found in dry areas or near forest edges (Affonso 1998; Galetti et al.
2001; Tófoli 2006). Some studies have found that tapirs may use seasonal latrines including
numerous faecal piles all together in the same location (Galetti et al. 2001; Tófoli 2006).

28
Figure 2.4. Map of main categories of habitat where lowland tapirs occur. Extracted from the Lowland Tapir Range-Wide Assessment Report (Taber et al. 2008).

29
2.2.4.2 Feeding Behaviour
Tapirs shelter themselves in forests and thickets during the day and emerge at night to feed in
bordering grassy or scrubland areas, marshes, lakes and streams (Padilla & Dowler 1994;
Medici 2001). These daily movements result in well-worn paths (Husson 1978). Tapirs spend
up to 90% of their active hours on foraging. They consume multiple small meals throughout
their active periods, a behaviour that is, in part, a function of their limited stomach capacity
when compared to the ruminant stomach. As a hindgut fermenter, the tapir gastrointestinal
tract is very similar to that of the horse. When foraging, tapirs usually do not follow a regular
path, but prefer to push their way through the jungle. The extensible proboscis is used to strip
leaves and pluck fruits. Fruit may be taken from low shrubs or as fallen fruit on the ground.
Tapirs will occasionally stand on their hind feet and reach with their prehensile proboscis
nearly three metres from the ground in order to obtain food (Medici 2001).
Tapirs are exclusively herbivorous. They have a broad diet composition, feeding on a wide
array of plant species and many different plant parts including the leaves, buds, twigs, bark,
flowers and fruits of low-growing, terrestrial plants and they also consume aquatic vegetation
occasionally (Terwilliger 1978; Janzen 1982; Williams 1984; Bodmer 1991a; Naranjo 1995;
Salas & Fuller 1996; Tobler 2002; Tófoli 2006; Tobler 2008). In the Bolivian Chaco, lowland
tapirs have successfully adapted to seasonal droughts, and to diets that include a large
proportion of cactus fibre (Soto 2002). Over 170 species of fruit in over 60 different families
have so far been identified as being eaten by the lowland tapir throughout its range (Bodmer
1991a; Rodrigues et al. 1993; Salas & Fuller 1996; Olmos 1997; Herrera et al. 1999; Fragoso
& Huffman 2000; Henry et al. 2000; Galetti et al. 2001; Tófoli 2006; Tobler 2008). A study in
a lowland rainforest of the Tabaro River Valley, Venezuela, showed that tapirs selectively
browsed on 88 out of a total of at least 256 plant species and consumed fruit of 33 species
(Salas & Fuller 1996). Tobler (2008) collected 135 lowland faecal samples in Los Amigos
Conservation Concession in the Peruvian Amazon and found a total of 122 species of seeds,
representing 68 genera and 33 families. In the semi-deciduous Atlantic Forest in Brazil, a
study based on the analysis of 170 faecal samples and two stomach contents collected in
Morro do Diabo State Park and surrounding forest fragments showed that lowland tapirs
consumed 58 species of fruit from 23 different plant families (Tófoli 2006).
While tapirs are essentially browsers, they consume fruit extensively when available (Bodmer
1990a; Bodmer 1991a; Salas & Fuller 1996; Fragoso 1997; Fragoso & Huffman 2000; Henry et
al. 2000; Foerster & Vaughan 2002; Tófoli 2006; Tobler 2008). Different studies in various
parts of the geographic distribution of lowland tapirs have found different diet compositions.
Tófoli (2006) showed that the diet of lowland tapirs in the Atlantic Forests of Morro do Diabo
State Park consisted of 37% of fruit/seed and 63% of leaf/fibre. Bodmer (1990a) analysed

30
stomach, cecal, and faecal samples of lowland tapirs in the Peruvian Amazon and reported
that the species consumed 33% of fruit and 66% of leaf/fibre. A study carried out by Henry et
al. (2000) in the tropical rainforests of French Guiana analysed the contents of 27 lowland
tapir stomachs collected from local hunters; fruit comprised 24%, leaf 22%, and fibre 53%. In
Noel Kempff Mercado National Park, Bolivia, 59 lowland tapir faecal samples were made up of
17% fruit, 62% leaf, and 21% fibre (Herrera et al. 1999). Affonso (1998) found that the diet
of lowland tapirs at the Turvo State Park in Rio Grande do Sul, Brazil, consisted of ~56% of
fruit. It has been suggested that tapirs consume fibrous vegetation for protein and depend on
more digestible foliage and fruit for energy (Foose 1982). Depending on the availability of
different food items, tapirs can shift their foraging strategy among habitat types and seasons.
Several studies have shown that palm fruits are important food resources for lowland tapirs
(Bodmer 1991a; Fragoso 1997; Fragoso & Huffman 2000; Galetti et al. 2001; Tófoli 2006;
Tobler 2008). Bodmer (1990a) found Mauritia flexuosa to be the single most important food
item (76%) in the diet of tapirs in the Peruvian Amazon. The distribution of these palm
patches appears to strongly influence the movement patterns of tapirs in the area. In a semi-
deciduous fragment of Atlantic Forest in São Paulo State, Brazil, Galetti et al. (2001) found
seeds of Syagrus romanzoffiana in 54% of 46 faecal samples collected over a period of four
years. In Morro do Diabo, Tófoli (2006) showed that Syagrus romanzoffiana was the most
frequently found fruit (18%) in lowland tapir faecal samples. Syagrus romanzoffiana is the
most abundant and widespread palm species in the semi-deciduous Atlantic Forest (Galetti et
al. 2001). These palms are abundant in Morro do Diabo and produce many fruits throughout
the year (Faria & Pires 2006). This palm fruit is rich in carbohydrates and is widely consumed
by a great diversity of birds and mammals, particularly during the dry season when other
species of fruit are less available (Keuroghlian 1990).
Although the diet of lowland tapirs has been studied in several tropical locations in different
countries including Brazil (Fragoso 1997; Olmos 1997; Fragoso et al. 2000; Galetti et al. 2001;
Tófoli 2006), Colombia (Peña et al. 1996), French Guiana (Henry et al. 2000), Peru (Bodmer
1990a; Tobler 2008), and Venezuela (Salas & Fuller 1996), very little is known about the
nutritional contents of food items consumed by tapirs in the wild. Lopes et al. (1980) provides
results on fat, carbohydrate and protein content of several Amazonian fruits consumed by
tapirs.

31
2.2.4.3 Spatial Requirements
The spatial requirements of tapirs are thought to vary with the carrying capacity of different
habitats (Eisenberg 1997; Medici et al. 2007a). Lowland tapirs monitored by radio-telemetry in
Kaa-Iya del Gran Chaco National Park, Bolivia, had a home range of 2.8 km² for males and
2.2 km² for females (Ayala 2003). Subsequent telemetry studies in Kaa-Iya National Park
found an average tapir home range size of 2.5 km² (Noss et al. 2003) with little seasonal
variation in size and some overlap between different individuals. The sizes of home ranges of
lowland tapirs radio-tracked through GPS telemetry in Los Amigos Conservation Concession in
the Peruvian Amazon varied from 1.1-3.9 km², with an average of 2.6 km² (Tobler 2008).
Table 2.6 presents further estimates of lowland tapir home range size in different study areas.
2.2.4.4 Population Density
Lowland tapir population density tends to be low with estimates ranging from a high of 1.6
tapirs km-² reported in Neotropical forests in undisturbed, non-hunted, or lightly hunted sites
(Robinson & Redford 1986; Robinson & Redford 1991) to less than 0.3 tapirs km-² (Cullen et
al. 2000; Aquino et al. 2001; Aquino & Calle 2003; Haugaasen & Peres 2005; Desbiez 2007) in
different regions and habitat types. In Amazonian forests, lowland tapirs are usually found in
densities of 0.5 tapirs km-² (Janson & Emmons 1990). Mendes-Pontes (2004) found
exceptionally high densities of lowland tapirs (3.3-3.7 tapirs km-²) in the Amazonian dry
forests of Roraima, Brazil. In the Brazilian Pantanal, Schaller (1983) reports a density of 0.64
tapirs km-², while Desbiez (2007) found an average density of 0.21 tapirs km-² (0.40 tapirs
km-² in forest habitat, and 0.13 tapirs km-² in open grasslands habitat). For the semi-
deciduous Atlantic Forest, lowland tapir densities estimated by Cullen et al. (2000) for three
different forest fragments of different sizes and levels of conservation ranged from 0.30-0.47
tapirs km-². Table 2.7 presents all estimates of lowland tapir population density found in the
available literature.

32
Table 2.6. Estimates of lowland tapir home range size (km²) and other ranging behaviour parameters (home range overlap, core areas of use) obtained for different study areas and biomes in Brazil, Bolivia, and Peru.
Location
Biome
Country
Method
Home Range Size (km²)
Reference
Brasília National Park Distrito Federal Cerrado Brazil
VHF radio-telemetry (1 month; 20 locations)
-- 1 male -- MCP 100%: 39.14 km²
Tarcísio Santos Jr. (unpublished results)
Lago Caiman - Noel Kempff Mercado National Park
Southern Amazon Bolivia
VHF radio-telemetry (12 months; 10 locations)
-- 1 female -- MCP 95%: 16.4 km²
Ellipse 95%: 48.78 km² Core Area = ≤ 4 km² Herrera et al. (1999)
Kaa-Iya del Gran Chaco National Park
Chaco Bolivia
VHF radio-telemetry (12 months; 2100 locations)
-- 5 tapirs - 2 females & 3 males -- MCP 95% - Males: 2.81 km² MCP 95% - Females: 2.18 km² Home range overlap: 25-75% Ayala (2003)
Kaa-Iya del Gran Chaco National Park Chaco Bolivia camera-trapping
0.97-3.74 km² (4 individuals 1st survey) 1.03-4.83 km² (4 individuals 2nd survey) 0.50-5.78 km² (6 individuals 3rd survey) Noss et al. (2003)
Kaa-Iya del Gran Chaco National Park Chaco Bolivia
VHF radio-telemetry (22-29 months; 645-955 locations)
-- 5 tapirs - 2 females & 3 males -- MCP 95%: 2.48 km²
Home range overlap: 32-55% (average 43.5%) Noss et al. (2003)
Los Amigos Conservation Concession Amazon Peru
GPS radio-telemetry (7-182 days; 78-6185 locations)
-- 6 tapirs - 4 females & 2 males -- Kernel 95%: 1.06-3.86 km²
Average: 2.61 km² Core Area 50% = 0.14-0.88 km² Core Area 25% = 0.05-0.33 km²
Females: 2.86 km² Males: 2.11 km²
MCP 95%: 0.95-3.53 km² Average: 2.25 km² Females: 2.53 km² Males: 1.66 km² Tobler (2008)

33
Table 2.7. Estimates of lowland tapir population density (tapirs km-²) obtained for different study areas and biomes across the species distribution range. Field method used and bibliographical reference are shown for each estimate.
Location
Biome
Country
Method
Density Estimate (tapirs km-²)
Reference
Morro do Diabo State Park São Paulo State
Semi-Deciduous Atlantic Forest Brazil
line transect (diurnal) 0.20-0.41-0.84 Cullen et al. (2000)
Caetetús Ecological Station São Paulo State
Semi-Deciduous Atlantic Forest Brazil
line transect (diurnal) 0.47 Cullen et al. (2000)
Mosquito Farm São Paulo State
Semi-Deciduous Atlantic Forest Brazil
line transect (diurnal) 0.30 Cullen et al. (2000)
Mata dos Godoy State Park Paraná State
Semi-Deciduous Atlantic Forest Brazil direct count/area 2.20-2.50 Rocha (2001)
Brazilian Amazon Amazon Brazil line transect (diurnal) 0.11-0.52 Peres (2000)
Kayapó Centre for Ecological Studies Pará State Amazon Brazil
line transect (diurnal) 0.62 Zimmerman et al. (2001)
Lago Uauaçú Central Western Amazonia Amazon Brazil
line transect (diurnal)
0.23 (terra firme) Haugaasen & Peres (2005)
Cocha Cachu Biological Station Manu National Park Amazon Peru
line transect (diurnal/nocturnal) 0.5 Janson & Emmons (1990)
Cocha Cachu Biological Station Manu National Park Amazon Peru < 0.5 Terborgh (1992) Manu National Park Amazon Peru 5.0 Ojasti (1993)
Reserva Comunal Tamshiyacu-Tahuayo Amazon Peru line transect (diurnal)
0.40 (persistently hunted site) Bodmer et al. (1994)
Reserva Yavari Miri Amazon Peru line transect (diurnal)
0.60 (slightly hunted site) Bodmer et al. (1994)
Reserva Nacional Pacaya Samiria Amazon Peru line transect (diurnal) 0.20 Aquino & Calle (2003)
Reserva Nacional Pacaya Samiria Amazon Peru 0.06-0.08 Aquino et al. (2001) Reserva Yavari Miri Amazon Peru 0.31 Salovaara et al. (2003)

34
Maracá Ecological Station Roraima State Dry Forest Amazon Brazil
line transect (diurnal/nocturnal)
3.3-3.7 terra firme
4.1 (wet) / 2.5 (dry) mixed forest
3.7 (wet) / 3.7 (dry) Mendes-Pontes (2004) Acurizal Ranch Paraguay River Sub-Region Pantanal Brazil direct count/area 0.64 Schaller (1983)
SESC Pantanal Barão de Melgaço Sub-Region Pantanal Brazil
line transect (diurnal)
23 sightings
Average 0.55 forest - 0.71
grasslands - 0.37 Cordeiro (2004)
Nhumirim Farm Nhecolândia Sub-Region Pantanal Brazil
line transect (diurnal)
16 sightings
Average 0.21 forest - 0.40 cerrado - 0.13
Desbiez (2007) Desbiez (2009)
SESC Pantanal Barão de Melgaço Sub-Region Pantanal Brazil
line transect (diurnal) 0.30-0.55-1.01 Trolle et al. (2007)
SESC Pantanal Barão de Melgaço Sub-Region Pantanal Brazil camera-trapping 0.58 ± 0.11 Trolle et al. (2007)
Private Ranches Paraguay River Basin
Cerrado-Pantanal Transition Brazil
line transect (diurnal)
camera-trapping 2.04-2.34
(2 study areas) Tarcísio Santos Jr. (unpublished results)
Kaa-Iya del Gran Chaco National Park Chaco Bolivia
VHF radio-telemetry (12 months) 0.50 Ayala (2003)
Kaa-Iya del Gran Chaco National Park Chaco Bolivia camera-trapping 0.22-0.80
(4 study areas) Noss et al. (2003)
Kaa-Iya del Gran Chaco National Park Chaco Bolivia
VHF radio-telemetry (29 months) 0.26-0.71-1.16 Noss et al. (2003)
Guatopo National Park, Llanos Llanos Venezuela 0.6 (crude)
0.8 (ecological) Eisenberg et al. (1989) The Density and Biomass of Tropical Mammals 0.53 Eisenberg (1980) Neotropical forests 1.60 +/- 2.6
Robinson & Redford (1986)
Neotropical forests 1.60
Robinson & Redford (1991)

35
2.2.4.5 Social Behaviour and Activity Patterns
Tapirs are shy, silent and very difficult to see due to their inconspicuousness in dense forested
habitats. Tapirs are primarily solitary, and aside from a courting pair or a mother and her
young, tapirs usually travel and feed alone (Eisenberg 1997). However, adults with juveniles
or feeding groups are not completely unusual (Terwilliger 1978; Williams 1984; Eisenberg
1989; Eisenberg 1997). Data collected during this long-term tapir study in Morro do Diabo
corroborates these observations. Through the use of nocturnal line-transect sampling for
density estimates, I encountered tapirs in 81 occasions, of which 78% were solitary
individuals. Only 12% of the encounters were of pairs of tapirs (adult female and adult male,
or adult female with offspring), while three tapirs were sighted on one occasion. In one
occasion, three tapirs were sighted. Among 36 lowland tapir sightings in Noel Kempff Mercado
National Park, Bolivia, 86% were of solitary individuals and 14% were of male and female
pairs (Herrera et al. 1999).
Tapirs are predominantly nocturnal and crepuscular. Noss et al. (2003) noted that lowland
tapirs in Kaa-Iya del Gran Chaco National Park, Bolivia, were mostly active from 18:00-22:00
h, and from 24:00-06:00 h. In the same study area, Ayala (2003) observed that the main
activity peak was from 01:00-06:30 h, with very little activity from 11:00-15:30 h. A camera-
trap study in Madidi National Park, Bolivia, obtained 81 lowland tapir photos during night time,
11 during day time, and 8 during crepuscular periods (Gómez et al. 2005). Lowland tapirs at
the Peruvian Amazon rested during the day and began their activity after sunset around 18:00
h, presenting activity peaks between 19:00-20:00 h and between 03:00-04:00 h, with the
main foraging time from 21:00-03:00 h (Tobler 2008).
2.2.4.6 Reproduction
There is very little data about the reproduction of tapirs in the wild. Overall, tapirs have a very
slow reproductive cycle. Adult female tapirs usually produce a single offspring after a lengthy
gestation period from 13-14 months (390-410 days) (Barongi 1993). Twin births are very rare.
Female tapirs are polyestrous with an oestrus cycle from 28-32 days. The oestrus period lasts
from 1-4 days. Post partum oestrus is possible from 9-27 days after the calf is born. Thus, a
female lowland tapir may conceive within a month after giving birth. In the wild, under ideal
circumstances a young can be born every 14 months in habitats exhibiting little seasonality in
food availability (Eisenberg 1997). In seasonally dry habitats, the interval between births may
be longer. Inter-birth interval for captive lowland tapirs is can be as high as 18 months
(Barongi 1993). Captive lowland tapirs are usually sexually mature by 14-24 months and
conceive at an average of 4 years of age (Barongi 1993). The maximum age of reproduction
for the species is 15 years for females and 19 years for males (D. Goff, AZA Lowland Tapir

36
Studbook Keeper, personal communication). Data on lowland tapir longevity comes from
captivity and says that these animals live from 30-35 years (Barongi 1993). The generation
length of wild lowland tapirs was estimated to be 11 years, considering age of first
reproduction at 4 years and longevity of 25 years (Medici et al. 2007a; IUCN 2008a). Further
data on lowland tapir reproductive rates and other life table parameters are discussed in
Chapter 6.
2.2.4.7 Predators
Being such massive mammals, tapirs have very few natural predators. The main predators of
lowland tapirs are jaguars (Panthera onca) and pumas (Puma concolor) (Hershkovitz 1954).
Taber et al. (1997) recorded the presence of tapir remains in two jaguar scats among a total
of 106 scat samples collected in the Paraguayan Chaco. Garla et al. (2001) collected 101
jaguar scats in the Atlantic Forests of Linhares Forest Preserve in Espírito Santo State, Brazil,
and registered 0.7% of occurrence of lowland tapir remains. Astete et al. (2008) presented
average frequencies of occurrence of tapir remains in jaguar scats in four Brazilian biomes:
0.4% in the Pantanal, 2.2% in the Atlantic Forest, 3.2% in the Amazon, and 4% in the
Cerrado. During this 12-year field study on lowland tapirs in Morro do Diabo tapir predation by
jaguar and puma was observed on several occasions. Three out of 25 radio-collared tapirs
were predated by large cats. Two tapirs, one adult female and a sub-adult male, were
predated by jaguar, while one sub-adult male tapir was predated by puma. Three carcasses of
non-tagged adult tapirs killed by jaguars were found in different areas of Morro do Diabo
during the study. Several of the captured tapirs presented scars, apparently from large cat
attacks. Park rangers reported two sightings of jaguars chasing tapirs along the shoreline of
the Paranapanema River. Jaguars and pumas usually attack tapirs at night when they leave
the riverbanks and marshes to feed in the forest. Tapirs are able to walk away alive from such
powerful predators due to the very thick skin around their neck, which is said to be 2-30 cm
thick and very hard (when seizing and killing prey, the main target of a cat is the neck). In
addition, tapirs have the ability to run off very fast through dense forest undergrowth, which
may be a way of shaking off or out-running a predator.
2.2.5 Status and Threats
Globally, the lowland tapir is currently listed by IUCN - International Union for Conservation of
Nature as “Vulnerable” under the criteria A2cde+3cde (IUCN 2008a; Schipper et al. 2008).
The previous Red List assessment (IUCN 1996) listed lowland tapirs as “Lower Risk/Near
Threatened”. Therefore, the Red List status of the species has deteriorated over the past 12
years. Additionally, lowland tapirs are listed in CITES Appendix II (CITES 2005). Although the
species is not included in the national list of species threatened with extinction in Brazil, it is

37
reported in lists released recently by six states including Espírito Santo, Minas Gerais, Paraná,
Rio de Janeiro, Rio Grande do Sul, and São Paulo. In Espírito Santo, Paraná, Rio de Janeiro,
and São Paulo, it is listed as Endangered, and in Minas Gerais and Rio Grande do Sul, as
Critically Endangered.
The tapir is one of the first species in its habitat to be adversely affected by human
disturbance (Janzen 1981). The IUCN/SSC Tapir Status Survey and Conservation Action Plan
identified habitat destruction and fragmentation, with resulting population isolation, and
intensive hunting as the main factors behind the decline of lowland tapir populations
throughout their geographic range (Brooks et al. 1997). Tapirs are among the preferred game
species for subsistence and commercial hunters throughout the Amazon (Redford & Robinson
1991; Vickers 1991; Bodmer 1995; Bodmer & Lozano 2001). Estimates of lowland tapir
harvest in the State of Loreto in the Peruvian Amazon range from 15,447-17,886 individuals
per year (Bodmer 1995). Due to their individualistic lifestyle, low reproduction rate, long
generation time, and relatively low population density, lowland tapirs do not achieve a high
local abundance, which makes them highly susceptible to overhunting, and populations show
rapid decline when harvested (Robinson & Redford 1986; Robinson & Redford 1991; Peres
1996; Bodmer et al. 1997; Cullen 1997; Cullen et al. 2000; Novaro et al. 2000; Peres 2000;
Medici et al. 2007a). Another issue mentioned by Brooks et al. (1997) is that many lowland
tapir populations are found outside the boundaries of legally protected areas, which hinders
their protection.
A threat analysis carried out during the Lowland Tapir Population and Habitat Viability
Assessment (PHVA) Workshop identified the main threats for each of the 21 different biomes
where lowland tapirs occur (Medici et al. 2007a). Thirteen threats were identified including:
hunting, habitat deforestation and/or alteration, resource extraction, habitat fragmentation
(resulting in small populations and low connectivity), cattle ranching, infectious diseases,
road-kill, fire, human density, plantations of monocultures, lack of patrolling in protected
areas, small size of protected areas, and impact of tourism. For each biome, threats were
ranked according to their severity into High, Medium, Low, or Non-Applicable, when the threat
did not apply or when information on the threat was lacking (Table 2.8). A ranking of threats
made specifically for the Atlantic Forest of the Interior suggests that the main threat for tapirs
in this region is habitat fragmentation, closely followed by hunting pressure (Table 2.9). Other
important threats for the region are habitat deforestation and/or alteration, cattle ranching,
resource extraction, and road-kill. Plantation of monocultures also appears to be an important
threat, which is mostly related to the expansion of soybean and sugar cane industries (Medici
et al. 2007a).

38
Table 2.8. Threat analysis for 21 biomes where lowland tapirs occur (HUN: hunting; HDA: habitat deforestation, alteration; REX: resource extraction; FSP: habitat fragmentation, small populations; CR: cattle ranching; DIS: disease; RK: road-kill). Extracted from the Lowland Tapir Population and Habitat Viability Assessment (PHVA) Workshop Final Report (Medici et al. 2007a).
General Biomes HUN HDA REX FSP CR DIS RK
North Eastern Amazon X
South Eastern Amazon X X X
Upper Amazon X X X X
Amazonian Savannas X
Dry Chaco X X X X X
Humid Chaco X X X X
Subtropical Andean Forests X X X X X
Llanos X X X X X X
Atlantic Forest of the Interior X X X X X X X
Pantanal X X X X
Yunga Forests X X X
Brazilian Biomes HUN HDA REX FSP CR DIS RK
Araucária Forests X X
Cerrado X X X X X X
Coastal Atlantic Forest X X X X
Colombian Biomes HUN HDA REX FSP CR DIS RK
Oriental Amazon X X X X X
Occidental Amazon X X X X
Orinoquía X X X X X
Northeast Antioqueño X X X X X
Sierra Nevada de Santa Marta X X X X X X
Suriname Biomes HUN HDA REX FSP CR DIS RK
Coastal Forests X X X X
Venezuelan Biomes HUN HDA REX FSP CR DIS RK
Northern Andes X X X X X
Table 2.9. Ranking of lowland tapir threats for the Atlantic Forest of the Interior, Brazil. Extracted from the Lowland Tapir Population and Habitat Viability Assessment (PHVA) Workshop Final Report (Medici et al. 2007a).
Threats Ranking
Habitat fragmentation (resulting in small populations and low connectivity) 13 Hunting 12 Habitat deforestation and/or alteration 9 Cattle ranching 7 Resource extraction 5 Road-kill 4 Plantations of monocultures 2 Human density 1 Lack of patrolling in protected areas 1 Small size of protected areas 1 Infectious diseases 1 Fire 0 Impact of tourism 0

39
2.3 The Atlantic Forest Biome
2.3.1 Historical Outline
When Africa and South America split apart some 100 Million years ago, the Brazilian shield
was exposed as a series of ridges running parallel to the new coast. It was upon these
mountains of Precambrian stone, lashed by southern Atlantic trade winds that the Atlantic
Forest evolved (Dean 1997; Câmara 2003). Despite the long period of geological stability that
followed the separation of the continents, climatic change caused the forest to repeatedly
expand and retract affecting the course of the biome's evolution and driving species
differentiation (Whitmore & Prance 1987; Dean 1997).
In historical times, the Atlantic Forest stretched almost continuously for 4,000 km along the
eastern Brazilian coast from Rio Grande do Norte State at the easternmost tip of the South
American continent to as far as Rio Grande do Sul, the southernmost Brazilian state (Eiten
1970; Collins 1990; Dean 1997; Morellato & Haddad 2000; SOS Mata Atlântica & INPE 2008)
and extending inland into eastern Paraguay and north eastern Argentina. The original size of
the biome remains unclear because the Europeans, and later the Brazilians, altered so much
of the landscape before the advent of scientific recording (Dean 1997). Nevertheless, a recent
study by Ribeiro et al. (2009) mapped and estimated the original extent of the Atlantic Forest
biome in Brazil to be 1.4 million km². Sanjurjo & Gauto (1996) estimated the original Atlantic
Forest cover in Paraguay at 93,888 km², while Cartes (2003) gives a lower estimate of 88,050
km². Giraudo et al. (2003) estimated the original size of the Argentine Atlantic Forest to be
26,450 km². The sum of these estimates, using the broadest definition of the biome, gives a
total area of ~1.5 million km².
The destruction of the Atlantic Forest and its wildlife began in the early 1500's, when the
Portuguese first reached Brazil, beginning the European colonisation in the eastern part of
South America (Dean 1997). The Atlantic Forest was cleared mainly for timber, firewood,
charcoal, agriculture, cattle ranching, and the construction of cities (Morellato & Haddad
2000). Since the start of the century, crop and pasture lands have steadily expanded (Fonseca
1985) and the Atlantic Forests were rapidly converted to anthropogenic systems (Brown &
Brown 1992; Coimbra-Filho & Câmara 1996; Dean 1997). As a result of its geographical
location, the coastal region of the Atlantic Forest was the first to be exploited (Fonseca 1985).
Ports and trading posts were established all along the coast, especially in Bahia and Rio de
Janeiro states, and provided the first routes of penetration inland. Large-scale human
settlements followed and agriculture became the most important economic activity in the
region (Val 1972). The fertile lands of the coastal plains were first used for sugar cane, and
supplying Europe with sugar rapidly became a major economic activity in the colony in the

40
16th and 17th centuries (Burns 1980). Coffee plantations developed in the 19th and 20th
centuries. The logging of the Pau-Brasil tree (Caesalpinia echinata) was another important
economic activity (Dean 1997). This process of occupation of the Atlantic Forest, marked by
centuries of unsustainable use, caused a drastic reduction of this biome (Galindo-Leal &
Câmara 2003).
2.3.2 Ecological Outline
Despite their high level of endangerment, Atlantic Forests make up the second largest tropical
moist forest area of South America, after the vast Amazonian domain. The Atlantic Forest
extends from 4-32°S and covers a wide range of climatic belts and vegetation formations,
from tropical to subtropical. Elevation ranges from sea level to 2,900 masl, with abrupt
changes in soil type and depth and average air temperature (Mantovani 2003). Longitudinal
variation is also marked. The Atlantic Forest is extremely heterogeneous in composition and
includes very complex natural landscapes (Oliveira-Filho & Fontes 2000).
The Atlantic Forest domain can be subdivided into two major regions based on its vegetation
types and geographical features (Mori et al. 1981; Morellato & Haddad 2000). The first
vegetation type is classified as Tropical Evergreen Mesophytic Broadleaf Forest or Atlantic Rain
Forest sensu stricto. The second vegetation type is the Tropical Semi-Deciduous Mesophytic
Broadleaf Forest or Semi-Deciduous Atlantic Forest sensu lato, also known as Atlantic Forest
of the Interior, where this study took place.
The Atlantic Rain Forest covers mostly the low to medium elevations (≤1,000 masl) of the
eastern slopes of the mountain chain (Serra do Mar) that runs along the coastline from
southern to north eastern Brazil (Eiten 1970). The Atlantic Rain Forest comprises only the
coastal rain forests up to 300 km inland, where rainfall is locally boosted by oceanic winds and
seaside mountain ranges. It is one of the most spectacular forests growing under a tropical
wet climate. The Semi-Deciduous Atlantic Forest extends across the western range of the
coastal hills, stretching to the Plateau region (Mata de Planalto, usually ≥600 masl in
elevation) in the centre and south eastern interior of Brazil and stretching into Paraguay and
Argentina (Leitão-Filho & Morellato 1997; Oliveira-Filho & Fontes 2000). The Atlantic Rain
Forest experiences high mean annual temperatures (16-19°C) and ever-wet forest climate
with annual precipitation from 2,000-4,000 mm and without a dry season. An increasingly
seasonal climate with average annual rainfall dropping from 4,000-1,000 mm and a relatively
severe dry season, generally from April to September, corresponding to the winter season,
predominates over the distribution of the Semi-Deciduous Atlantic Forest (Morellato et al.
2000; Oliveira-Filho & Fontes 2000; Mantovani 2003).

41
The broad view of Atlantic Forest sensu lato attaches semi-deciduous forests to coastal
Atlantic Rain Forests, pushing the limits of the Atlantic Forest domain up to 700 km inward
from the coast (Fernandes & Bezerra 1990). The Federal Decree 750/1993 defines the Atlantic
Forest vegetation as “the formations and associated ecosystems inserted in the Atlantic Forest
domain, with the following delimitations established by the Brazilian Vegetation Map (IBGE
1988): ombrophilous dense Atlantic Forests; mixed ombrophilous forests; open ombrophilous
forests; semidecidual stational forests; decidual stational forests; the countryside swamps, the
north eastern forest enclaves and the associated ecosystems - mangroves and restingas.”
This definition of Atlantic Forests has become widely accepted (CEPF 2002). However, as
might be expected for a vast and diversified vegetation province, the classification and
geographic distribution of the Atlantic Forest is still a matter of controversy (Câmara 1991;
Oliveira-Filho & Fontes 2000). Fixing inland limits to the Atlantic Forest domain is very
complicated, since their transition to the hinterland open formations is very complex and
gradual. This transition can be classified into three regions according to the adjacent open
formation (Oliveira-Filho & Fontes 2000). A relatively abrupt transition to the semiarid
Caatingas occurs in north eastern Brazil where a narrow strip (50 km) of coastal Atlantic Rain
Forest is bordered by an equally narrow inland belt of seasonal semi-deciduous forests
(Andrade-Lima 1982). The transition between coastal Atlantic Forest and the Cerrado in south
eastern Brazil involves a much larger extent of semi-deciduous forests that becomes
increasingly wide toward the south and forms complex mosaics with Cerrado vegetation to the
west. These semi-deciduous forests also stretch southward along the Paraná River basin into
eastern Paraguay and north eastern Argentina where they are transitional to the Chaco biome.
A number of associated formations include mangroves, restingas (coastal scrub forest on
sandy soils), high-elevation grasslands (campo rupestre), and brejos (humid forests resulting
from orographic rainfall in otherwise semi desert scrub in the northeast of Brazil) (Câmara
2003). For academics and conservationists supporting the Atlantic Forest sensu stricto, the
neighbouring semi-deciduous forests are a distinct vegetation formation, known as Matas de
Planalto (Plateau Forests), due to their distribution on the hinterland highlands. The flora of
semi-deciduous forests is considered by many as either transitional between that of Atlantic
Rain Forests and Cerrado or part of a continuum of forest species distribution that includes
central Brazilian gallery forests that eventually links Atlantic to Amazonian forests (Oliveira-
Filho & Ratter 1995).
2.3.3 Current Conservation Status
The year 2000 marked 500 years of destruction of the Atlantic Forest in all three countries of
occurrence - Argentina, Brazil, and Paraguay - which is seen as one of the most alarming
conservation problems in the world (Mori et al. 1981; Terborgh 1992; Viana et al. 1997). The

42
original extent of the Atlantic Forest biome in Brazil, including forests, mangroves and
restingas, has been reduced by ~88% (Ribeiro et al. 2009). The remaining forest cover
ranges from 11-16%, which is actually more than previously estimated (Ribeiro et al. 2009).
Further estimates of the original cover and remaining forest cover of the Atlantic Forest biome
in Brazil, Argentina and Paraguay are shown in Table 2.10.
Approximately 70% of Brazil’s 184 million people are concentrated in 3,000 cities built on
cleared lands of the Atlantic Forest, even though it accounts for only 11% of the nation's
territory (Fonseca 1985; Chiarello 1999). Some of these cities are among the largest in Latin
America and in the world, such as São Paulo and Rio de Janeiro, the main industrial poles in
the country. About 80% of the Brazilian GDP is generated in the Atlantic Forest region. The
remaining Atlantic Forest consists of small and isolated forest islands scattered throughout a
landscape dominated by agricultural uses and urban development (Fonseca 1985; Morellato &
Haddad 2000). According to Ribeiro et al. (2009), the Brazilian Atlantic Forest is currently
distributed in 245,173 forest fragments. The best-preserved bio-geographical sub-region is the
Serra do Mar along the coast, which holds ~36% of its original vegetation. The largest Atlantic
Forest fragment (11,095 km²), as well as the second- and third-largest fragments, are indeed
located in the Serra do Mar. Altogether, these three fragments account for more than 20,000
km² or 13% of the remaining forest. In contrast, 83% of the remaining Atlantic Forest
fragments are smaller than 0.5 km², and together they account for 31,780 km² or 20% of the
total forest. The fragments smaller than 2.5 km² represent more than 97% of the total
number, and account for almost 42% of the total forest cover. Only 77 fragments are larger
than 100 km² (Ribeiro et al. 2009).
Table 2.10. Past and present extent of the Atlantic Forest, extracted from Flesher (2007).
Original Cover (km²)
Amount Remaining
(km²)
% of Original Cover
Reference
Comments
1-1,500,000 20,000-90,000 2-10 Por (1992 ) ENTIRE BIOME 1,500,000 120,000 8 Galindo-Leal & Câmara (2003) ENTIRE BIOME 1,205,780 146,024 12 Brown & Brown (1992) BRAZIL 1,000,000 <10 Dean (1997) BRAZIL 1,090,000 1,250,000
100,000 130,000
9.2 10.4
Fearnside (1996) SOS Mata Atlântica (1992)
BRAZIL Top number excludes Araucária forests
1,227,600 91,930 7.5 Myers et al. (2000) BRAZIL 1,350,000 216,623 17 SOS Mata Atlântica & INPE (2002) BRAZIL 1,306,421 98,878 7.25 Câmara (2003) BRAZIL 1,395,849 163,775 11.4-16 Ribeiro et al. (2009) BRAZIL 93,888
47,488
51
Sanjurjo & Gauto (1996) PARAGUAY 11,827 km² of degraded lowland forest
88,050 11,618 13.2 Cartes (2003) PARAGUAY 26,450 11,303 44 Giraudo et al. (2003) ARGENTINE

43
Despite severe legal restrictions on deforestation in Brazil, the Atlantic Forest is still under
severe anthropogenic pressure, and suffers from various patterns of habitat fragmentation.
The rate of forest loss is still high, approaching 350 km² or 0.25% year-¹ (SOS Mata Atlântica
& INPE 2008). The remaining Atlantic Forest fragments are threatened in all three countries of
occurrence by logging, deforestation driven by agriculture and expansion of pasture land for
cattle ranching, cutting of firewood, forest fires, poaching and animal trading, urban and
industrial development, construction of infrastructure such as roads and dams, and
uncontrolled tourism (CEPF 2002). In addition, the establishment of agrarian reform
settlements that use unsustainable land-use practices within their boundaries or in adjacent
areas is a problem (Cullen et al. 2005).
Most of the Atlantic Forest remnants are privately owned, and their fate is highly dependent
upon the attitudes of farmers and local communities (Viana et al. 1997). Many of these areas
are not effectively protected, and their land tenure is unresolved (Furlan et al. 2000). No more
than 3% of the Atlantic Forest occurs within protected areas, and only one-quarter of all
protected areas remaining in the Atlantic Forest are large enough to sustain viable animal
populations (Chiarello 2000). Nevertheless, these remaining fragments are vital to watershed
protection, prevention of soil erosion and siltation, and in maintaining microclimates and other
environmental conditions necessary for the very existence of Brazil’s most populated cities and
rural areas (Tabarelli et al. 2003).
The Atlantic Forest biome is a global conservation priority as it harbours one of the highest
plant and vertebrate diversity on Earth, containing nearly 8% of the world’s total species,
many of which are endemic to this biome and/or threatened with extinction (Myers et al.
2000; Brooks et al. 2002; Galindo-Leal & Câmara 2003; Ceballos & Ehrlich 2006). A recent
assessment of the Atlantic Forest highlighted the large number of endemic species in several
groups, such as 8,000 tree species (40% of the total), 200 birds (16%), 71 mammals (27%),
94 reptiles (31%), and 286 amphibians (60%), to mention only the best-known taxonomic
groups (Mittermeier et al. 2005). The degree of mammal endemism in the Atlantic Forest,
estimated at 27%, is exceeded only by the Amazon, in which 59% of its total mammal fauna
restricted to that biome. The high level of endemism among Atlantic Forest mammal species is
mainly due to three orders: marsupials, rodents, and primates, which together comprise 84%
of all endemics (Pires-Costa et al. 2000). More than two thirds of the primate species found in
the Atlantic Forest is endemic to this biome (CEPF 2002).
Most species officially threatened with extinction in Brazil are inhabitants of the Atlantic Forest
(Tabarelli et al. 2003). Currently, more than 530 species of plants, birds, mammals, reptiles,
and amphibians of the Atlantic Forest are threatened—some at the biome level, some at the
country level, and the endemic species, at the global level. At least 158 species of birds of the

44
Atlantic Forest are Critically Endangered (Ferraz et al. 2007). Of 24 species of primates
occurring in the Atlantic Forest, 22 are threatened and restricted to small fragments, where
long-term survival is unlikely (Pires-Costa et al. 2005). Forest destruction has resulted in the
elimination of many populations, and potentially, in the erosion of the genetic diversity of
several species (Brown & Brown 1992; Ribon et al. 2003). Based on the nearly total
destruction of this biome and the high number of endemic species specialised to the forest
environment, it is reasonable to suppose that many species have already gone extinct before
they were described (Morellato & Haddad 2000). It is reasonable to speculate that as global
warming occurs and habitats change, this already alarming number of threatened species will
increase because the widespread fragmentation of the Atlantic Forest limits species migration
and colonisation necessary for the long-term persistence of populations (Tabarelli et al. 2005).
Consequently, the Atlantic Forest is considered a “hotspot” for biodiversity conservation
(Myers et al. 2000). Myers (1988) identified 10 tropical forest “hotspots” characterised both by
exceptional levels of plant endemism and by extensive habitat loss. In 1989, Conservation
International adopted Myers’ hotspots as its institutional blueprint. Three years later an
extensive global review was undertaken, which introduced quantitative thresholds for the
designation of hotspots. To qualify, a hotspot must contain at least 1,500 species of vascular
plants as endemics, and it has to have lost at least 70% of its original habitat. Twenty-five
biodiversity hotspots were identified and the Atlantic Forest was classified as the 4th hottest
hotspot, demonstrating its conservation priority (Mittermeier et al. 1999; Myers et al. 2000).
Likewise, the Atlantic Forest is among the 867 defined terrestrial Ecoregions defined by the
World Wildlife Fund (Olson et al. 2001). Ecoregions are defined as large areas of relatively
uniform climate that can harbour a characteristic set of species and ecological communities
(Bailey 1998). As used by WWF, Ecoregions focus on large, biologically distinct areas of land
and water, and set the stage for conserving biodiversity as a science-based global ranking of
the Earth's most biologically outstanding habitats. WWF’s Global Ecoregions Program is the
first comparative analysis of terrestrial biodiversity to cover every major habitat type in five
continents (Olson et al. 2001). The Ecoregion concept also provides a blueprint for biodiversity
conservation at a global scale, ensuring that the full range of ecosystems is represented within
regional conservation strategies (Grooves 2003).

45
2.4 The Atlantic Forest of the Interior and the Pontal do
Paranapanema Region
The Atlantic Forest of the Interior is included in the Federal Decree n°750 of 1993 that legally
defines the geographical domains of the Atlantic Forest biome in Brazil and regulates its use
(Valladares-Padua et al. 2002). Approximately 22,000 km² of the Atlantic Forest of the Interior
remains in the Plateau region of Brazil (SOS Mata Atlântica & INPE 2008); 11,303 km² lies in
Argentina, where it stretches as a contiguous corridor covering a large part of the province of
Missiones (Di Bitetti et al. 2003; Giraudo et al. 2003); and 11,618 km² lies in Paraguay (Cartes
2003). The Atlantic Forest of the Interior has been extremely fragmented, mostly due to
agricultural and industrial expansion, resulting in the loss of more than 98% of its forests
(Dean 1997; SOS Mata Atlântica & INPE 2008). Some of the most significant remnants of the
Atlantic Forest of the Interior in Brazil are found in the Pontal do Paranapanema Region, a
wedge-shaped region bounded in the south by the Paranapanema River (22°27'-22°40'S) and
in the west by the Paraná River (52°10'-52°22'W), marking the westernmost extremity of São
Paulo State (Figure 2.5).
The history of the Pontal do Paranapanema Region is marked by land disputes and conflicts.
In 1941, while still entirely forested, the entire western part of São Paulo, comprising an area
of ~2,600 km², was decreed a forest reserve, the “Grande Reserva do Pontal” (Great Reserve
of the Pontal do Paranapanema) (Valladares-Padua 1993; Leite 1998) (Figure 2.5). However,
it was never formally protected. In the same year, Morro do Diabo State Reserve was legally
created through the Federal Decree nº12.278 (Schlittler 1990). During the 1950's, the State
Governor Ademar de Barros distributed large parts of the “Grande Reserva” to his friends and
allies. This rapidly initiated a wave of deforestation as a means to guarantee their ownership
and forestall any future attempts to return it to its status of wildlife reserve (Valladares-Padua
et al. 2002). In 1986, Morro do Diabo was decreed a state park (Decree nº25.342), consisting
of the largest remaining area of native forest in the western portion of São Paulo.
In the mid 1990's, large cattle ranches, which had been carved out of the “Grande Reserva”
during the 1950's, began to be occupied by landless rural workers, led primarily by the
Movement of Rural Landless Workers (Movimento dos Trabalhadores Rurais Sem Terra, or
MST) (Cullen 2007). These lands were later expropriated for public land reform settlements by
the São Paulo State Institute of Agrarian Reform (ITESP). ITESP subdivided the land for
thousands of landless settlers coming from many different parts of the country, dramatically
increasing the human density in the region (Cullen 2007). Over 5,000 landless families have
been settled in the Pontal do Paranapanema Region and are now farming along forest edges
(Cullen et al. 2005).

46
As a result of all the conflicts over land ownership and widespread destruction of the forests of
the Pontal do Paranapanema Region during the last 60 years, less than 2% of the “Grande
Reserva” remained (Dean 1997). Deforestation in the Pontal from 1987-2001 occurred at a
rate of 1.5% year-¹ (Cullen 2007). Interestingly, the process of deforestation of the Pontal do
Paranapanema Region is relatively recent in the history of destruction of the Atlantic Forest
when compared to areas in the eastern part of the biome.
Nevertheless, the Pontal do Paranapanema Region alone still comprises 84% of the remaining
Plateau forest cover, mostly in a single patch - Morro do Diabo State Park - which protects 370
km² of forest (Figure 2.6). In July 2002, the Federal Government of Brazil declared the
creation of another protected area in the region, the Black-Lion-Tamarin Ecological Station,
comprising an additional 67 km² of protected habitat in the Pontal do Paranapanema Region.
The Black-Lion-Tamarin Ecological Station encompasses the four largest forest fragments
situated around Morro do Diabo - Santa Maria Cachoeirinha, Tucano, Ponte Branca, and Água
Sumida Estrela da Alcídia - and is under the administration of IBAMA - Instituto Brasileiro do
Meio Ambiente e Recursos Naturais Renováveis. Small forest fragments from 0.02-20 km² are
scattered around both protected areas, adding up to a further 60 km² of forest (Ditt 2002;
Uezu et al. 2008). Most of these non-protected forest remnants lie within private properties
but some are located in landless settlements and are owned by the State. Some of the
remaining forests still exist due to the Brazilian law that requires properties within the legal
geographical domain of the Atlantic Forest to maintain at least 20% of their land covered with
original forests (Reserva Legal) (Cullen et al. 2001b). According to Uezu et al. (2008), 17% of
the Pontal do Paranapanema Region is still covered with forests. The landscape matrix is
mainly composed of pasture land (60%) and agriculture (15%) (Uezu et al. 2008).
Because of the extensive loss of forest, the conservation of the forest remnants of the Pontal
do Paranapanema Region is of utmost importance, as they still harbour the rich and endemic
biodiversity of the region, and many of its endangered species. The biological value of even
the small remaining Atlantic Forest fragments is unquestionable. Although most of these forest
fragments are very small and degraded, they still support an outstanding diversity of species
of flora and fauna of the Atlantic Forest of the Interior.
These forest patches provide habitats for a wide variety of species that disperse and pollinate
native vegetation, increasing regional genetic flow. These patches also represent the only and
last remaining “seed banks” for these endangered ecosystems that can be used for forest
restoration programs and landscape linkages. Most importantly, these forest patches serve as
“stepping-stones,” or small patches of native forest that increase connectivity among forest
fragments facilitating the dispersal of organisms (Cullen et al. 2001b).

47
Figure 2.5. Reference maps indicating the location of the Pontal do Paranapanema Region in the extreme western portion of São Paulo State, Brazil. Lower map indicates the historic range of the “Great Reserve of the Pontal do Paranapanema” and the current location of Morro do Diabo State Park (Devil´s Hill State Park). Sketch maps designed by Anders Gonçalves da Silva.

48
Figure 2.6. Map of the Pontal do Paranapanema Region indicating Morro do Diabo State Park, Black-Lion-Tamarin Ecological Station, and other remaining forest fragments in the surroundings. The Black-Lion-Tamarin Ecological Station encompasses the four largest forest fragments situated around Morro do Diabo. Map designed by Alexandre Uezu.

49
2.5 Study Site: Morro do Diabo State Park
2.5.1 Location and Legal Protection
Morro do Diabo State Park (Devil’s Hill State Park) is located in the southern part of the Pontal
do Paranapanema Region, São Paulo State (22º16'-22º40'S; 52º05'-52º30'W), and protects
370 km² of the Atlantic Forest of the Interior. Morro do Diabo is administered by the Forestry
Institute of São Paulo State (Instituto Florestal do Estado de São Paulo). Morro do Diabo is
well protected with legally demarcated, undisputed boundaries.
2.5.2 Landscape Matrix
The landscape matrix around Morro do Diabo is mainly composed of pasture land and
agriculture. The great majority of the properties surrounding Morro do Diabo and the other
forest fragments in the Pontal do Paranapanema Region are very small. Most of these
properties have been distributed to hundreds of landless families as part of a country-wide
programme of Agrarian Reform. Most of the Agrarian Reform settlements are located near the
western and northern borders of Morro do Diabo. Most of the landscape matrix in between
forest fragments consists of pasture land for cattle ranching and agricultural crops such as
sugar cane, manioc, corn, and cotton. Sugar cane plantations dominate the landscape near
the north western and north eastern borders of Morro do Diabo. Cattle ranching is the main
activity in the south eastern border.
The Paranapanema River, a large, wide river and the main permanent source of water in the
area, runs along the southern limit of Morro do Diabo. The Ribeirão Bonito stream, a very
important source of water for wildlife in Morro do Diabo, runs along the entire western edge
of Morro do Diabo. The vegetation along the Ribeirão Bonito stream is characterised by
several islands of swamp vegetation and patches of humid fields, both surrounded by riparian
forests. The other water courses in Morro do Diabo are small streams that during extreme dry
seasons have their levels of water considerably reduced.
2.5.3 Climate
The climate in the Pontal do Paranapanema Region is Cfa, following the Köppen classification.
Winters are cold and dry, and temperatures range from 15-20°C, and summers are hot and
humid, with temperatures as high as 40°C. The average annual temperature is ~22°C. The
region is characterised by a pronounced dry season (April-September). Annual rainfall is 1,347
mm, of which about 70% falls during the wet season (October-March) (Faria & Pires 2006)
(Table 2.11).

50
Table 2.11. Monthly temperature (°C), relative humidity (%), and rainfall (mm) in Morro do Diabo State Park, São Paulo, Brazil. Data gathered from 1977-2002 (Faria & Pires 2006).
Month
Temperature Relative Humidity Monthly Rainfall (mm)
Min (°C)
Mean (°C)
Max (°C)
Min (%)
Mean (%)
Max (%)
Jan 20.7 25.3 32.3 57 82 92 132 Feb 20.5 25.3 32.8 58 82 94 156 Mar 19.7 24.6 32.3 57 80 94 128 Apr 17.4 22.5 30.3 56 82 95 85 May 13.6 19.1 26.9 57 85 96 103 Jun 11.1 17.2 25.4 54 85 96 72 Jul 11.5 17.5 26.5 48 81 94 37 Aug 12.1 18.8 27.9 45 77 92 50 Sep 14.2 20.1 27.6 50 77 90 118 Oct 17.0 23.1 31.1 50 77 90 129 Nov 18.6 24.2 31.6 51 78 90 125 Dec 19.9 25.1 32.0 57 80 92 212
Total 1,347
MEAN 16.4 21.9 29.7 53 81 93 112 MAX 20.7 25.3 32.8 58 85 96 212 MIN 11.1 17.2 25.4 45 77 90 37
2.5.4 Abiotic Factors
The average altitude in Morro do Diabo State Park is ~320 masl. The Pontal do Paranapanema
Region is characterised by open hills, with gentle slopes less than 15% (Ross & Moroz 1997),
with exception of Devil’s Hill itself, which has an elevation of ~570 m. The region is known for
its nutrient-poor soils, which are for the most part sandy dark-red latosols and oxisols (Setzer
1949; Schlittler 1990; Oliveira et al. 1999).
2.5.5 Biotic Factors
2.5.5.1 Fauna
The Morro do Diabo State Park Management Plan (Faria & Pires 2006) includes lists of
mammals, reptiles, amphibians, birds and fish found in Morro do Diabo and surrounding forest
fragments in the Pontal do Paranapanema Region. These lists include 60 species of mammals,
53 reptiles, 15 amphibians, 288 birds, and 26 fishes. Carnivores include jaguar (Panthera
onca), puma (Puma concolor), ocelot (Leopardus pardalis), margay (Leopardus weidi), crab-
eating fox (Cerdocyon thous), coati (Nasua nasua), tayra (Eira barbara), and river-otter (Lutra
longicaudis) among others. Primates include howler monkey (Alouatta fusca), capuchin
monkey (Cebus apella), and the endangered black-lion-tamarin (Leontopithecus chrysopygus).
The species of ungulates that occur in Morro do Diabo are white-lipped peccaries (Tayassu
pecari), collared peccaries (Pecari tajacu), red-brocket deer (Mazama americana), gray-
brocket deer (Mazama gouazoubira), and lowland tapir (Tapirus terrestris).

51
2.5.5.2 Flora
According to the official classification by IBGE - Instituto Brasileiro de Geografia e Estatística
(Brazilian Institute of Geography and Statistics), Morro do Diabo State Park is the largest
single remnant of Seasonal Tropical Semi-Deciduous Forest (Atlantic Forest of the Interior) in
the State of São Paulo (IBGE 1988; Veloso et al. 1991; Oliveira-Filho & Fontes 2000). Most of
the emergent trees lose from 20 to 50% of their leaves during the dry season (Hueck 1972).
The forests of Morro do Diabo are considered a transitional ecosystem, bordered by tropical
evergreen broadleaf forests to the east, which originally covered the Atlantic coastline, and
the dry Cerrado vegetation to the north and west (Ab'Saber 1977). Durigan & Franco (2006)
provided detailed descriptions of the flora of the Pontal do Paranapanema Region, including
Morro do Diabo and surrounding forest fragments.
In 2006, the Forestry Institute of São Paulo State (Instituto Florestal do Estado de São Paulo,
Secretaria do Meio Ambiente) and a number of partners including IPÊ - Instituto de Pesquisas
Ecológicas - developed a Management Plan for Morro do Diabo (Faria & Pires 2006). The plan
identified and mapped 10 different vegetation types found in Morro do Diabo, as well as in the
forest fragments located within its designated buffer zone (Figure 2.7). Detailed descriptions
of each vegetation type are provided below:
1) Tall mature forest: This vegetation type is mostly found in the southern part of
Morro do Diabo. This forest type is crossed by several water courses and vegetation is
exuberant. It includes key tree species such as Gallesia integrifólia, Metrodorea nigra,
and Bouganivillea glabra, which suggest the occurrence of fertile soils in these areas.
This forest type also presents high densities of species from the Lauraceae, Meliaceae,
and Myrtaceae families. Campos & Heinsdijk (1970) estimated significant volumes of
wood (54 m³ ha-¹) in this forest, with high concentrations of hard wood trees such as
Aspidosperma polyneuron, Cedrella fissilis, and Balfourodendron riedelianum. Schlittler
(1990) carried out vegetation surveys in this area of Morro do Diabo and found a total
density of 1,119 trees ha-¹, including 104 different tree species. The average height of
these forests is ~15 m with the occurrence of emergent trees of up to 40 m in height.
It is believed that the emergent trees survived forest fires in the past and the forest
underneath is the result of secondary regeneration. There is a visible gradient of
vegetation biomass in this forest type with the biomass increasing as the forest
approaches the riparian forests along the Paranapanema River in the southern part of
Morro do Diabo.
2) Low mature forest: This vegetation type is mostly found in the western part of
Morro do Diabo, especially in areas close to water courses. The soil presents low levels

52
of fertility and permeability. The forest is low (~12 m), but presents a high density of
plants. However, the vegetation biomass and volume of wood are lower than the
values found for tall mature forest. Most of the trees found in this forest type belong
to the Myrtaceae family, represented by a large number of species including Myrcia
multiflora, Myrcia fallax, Myrciaria cuspidata, Myrciaria ciliolata, and Eugenia sp among
others. Some species that are characteristic of the Cerrado biome have been identified
in low densities in this forest type, including Qualea cordata, Ouratea floribunda, Pera
obovata, Roupala montana, and Tabebuia ochracea among others. This forest type
has low occurrence of lianas, which facilitates the penetration of light. On the other
hand, the forest floor is mostly covered with Plumier (Bromelia balansae), a
bromeliaed from the family Bromeliacea, which due to the large thorns on its leaves
makes it very difficult to walk through this forest. Both the Myrtaceae and bromeliads
provide abundant fruit for wildlife.
3) Secondary forest in early stages of regeneration: This vegetation type, also
known as Sapezal (Sapé is a type of tall grass, Imperata brasiliensis, very susceptible
to forest fires) or scrub grassland, was identified and described by Campos & Heinsdijk
(1970). This vegetation occurs in a patch of ~10 km² in the eastern limits as well as in
several small patches inside Morro do Diabo. The areas of Sapezal near the edges of
Morro do Diabo have been affected by several fire events over the past 40 years. Most
of the forest fragments surrounding Morro do Diabo have been classified within this
vegetation type, which shows their level of degradation. In Morro do Diabo, the
patches of Sapezal are slowly being occupied by the forests in their surroundings.
Today, the Sapezal is reduced to ~10% of the original area it covered 40 years ago,
and it is expected that this vegetation type will disappear over time. This vegetation
type is mostly composed of Sapé grass and tree species of early stages of
regeneration such as Gochnatia polymorpha, Syagrus romanzoffiana, Platypodium
elegans, Guarea guidonea, Casearia gossypiosperma and Didymopanax morototonii.
4) Secondary forest in late stages of regeneration: This vegetation type comprises
10 km² or approximately one third of the area of Morro do Diabo. Campos & Heinsdijk
(1970) estimated a volume of wood for this forest of ~26 m³ ha-¹. This vegetation
type is mostly found along the highway that crosses Morro do Diabo, as well as on the
north eastern limits of Morro do Diabo. These areas have been impacted by several
forest fires, and therefore present high densities of lianas forming a wall of vegetation
that one cannot go through. Today, this vegetation type is described as a very diverse
forest, with continuous tree canopy composed by young individuals of small size,
resulting in low biomass. Emergent trees are very rare. This vegetation type also
presents high concentrations of bamboo in the forest understory. There is a

53
predominance of tree species characteristic of early stages of regeneration such as
Gochnatia polymorpha, Croton floribundus, Helietta apiculata, Didymopanax
morototonii, and Casearia gossypiosperma. However, young individuals of several tree
species characteristic of late stages of regeneration can also be found.
5) Cerrado (Savannah): This vegetation type is represented by a very small patch
(0.034 km²) of Cerrado with very low biomass of plants immersed in the middle of tall
mature forests in the north western part of Morro do Diabo. This small island of
Cerrado vegetation is of great value for the understanding of the dynamics of
transition between Cerrado and forest. Satellite images show other small patches of
savannah type vegetation (non-continuous canopy) in the north western part of Morro
do Diabo, but this has yet to be confirmed through field expeditions to these areas. In
this vegetation type, adult trees are very rare. Most plant species found in the area are
typical of the Cerrado biome, including Diospyros híspida and Anadenanthera falcata
with predominance of Campomanesia adamantium, Duguetia furfuracea, Tallisia
pygmaea, Byrsonima intermedia, Allagoptera campestris and Pradosia brevipes. The
high density of Campomanesia adamantium is a factor that attracts wildlife to this area
during the fruiting season (November, December). The forest floor is covered with
different species of grass as well as Bromelia plumieri and Ananas ananassoides. Two
species of Cactaceae can be found in this vegetation type, Cereus hildmanianus and
Praecereus euchlorus.
6) Riparian forest along the Ribeirão Bonito Stream: The Ribeirão Bonito stream
runs along the western edge of Morro do Diabo. Although on the satellite images this
vegetation type appears to be similar to the tall mature forest or Sapezal, the
vegetation is very peculiar. It is characterised by a combination of islands of swamp
forest (Talauma ovata, Tabebuia umbellata, Styrax pohlii, Nectandra nitidula,
Geonoma brevisphata, Cedrella odorata) and humid fields surrounded by riparian
forests including tree species less tolerant to wet soils such as Endlicheria paniculata,
Tapira guianensis, Eugenia speciosa and Ocotea corymbosa. The result is a mosaic of
vegetation types. This part of Morro do Diabo has several areas of ecological instability
due to siltation of the Ribeirão Bonito stream caused by agricultural activities outside
of Morro do Diabo.
7) Riparian forest along the Paranapanema River: Most of the vegetation that
covered the areas along the Paranapanema River was submerged during the flooding
of the Rosana Dam in 1987. The forest along the river was cleared before the flooding
in order to reduce the amount of organic matter in the water of the reservoir. In some
areas the clearing went too far beyond the pre-established elevations to be deforested

54
and those areas were never flooded. Today, these areas, especially the ones next to
the headquarters of Morro do Diabo, are formed by a high concentration of exotic
grasses, with predominance of Panicum maximum and sparse tree species in different
stages of regeneration. In the humid areas, next to the river, there is a predominance
of species that tolerate drenched soils such as Croton urucurana, Inga vera and
Psidium guajava. In the dry areas, there is a predominance of species of legumes and
pioneers, all colonisers or coming from the seed banks (Peltophorum dubium, Trema
micrantha, Croton floribundus, Solanum spp among others). This vegetation type is
currently going through the process of natural secondary regeneration, which is in
great part limited by the proliferation of Panicum maximum. This grass obstructs the
germination of seeds and development of trees, and increases the risk of forest fires.
8) Low, dense forest in various stages of regeneration: This vegetation type is
also considered secondary forest in regeneration, presenting plant species in several
stages of regeneration including pioneer species and species of the later stages of the
regeneration process. The density of plants and the concentration of lianas are very
high. Most of the patches of this vegetation type can be found along the highway that
crosses Morro do Diabo, as well as along the old, deactivated railroad that goes
through Morro do Diabo.
9) Temporary lakes: There are some areas in the southern part of Morro do Diabo that
appear on satellite images sometimes as water and sometimes as herbaceous
vegetation. These patches are temporary lakes that dry out during the dry season,
becoming a field of different species of grass and sedges (Cyperaceous plants) from
50-100 cm of height. In the edges of these lakes, where the terrain has better
drainage, tree species such as Sebastiania klotzchyana and Copaifera langsdorffii can
be found, however, the colonisation by tree species is certainly limited by the drainage
of the soil during the wet season.
10) Agricultural and pastoral land: This includes areas of agriculture and pasture for
cattle ranching in the farms and ranches located in the surroundings of Morro do
Diabo, outside the boundaries of the protected area. Some of the most important,
traditional agricultural crops in the Pontal do Paranapanema Region are sugar cane,
corn, cotton, and manioc among others. Most of the pastures in the region are
composed of exotic grasses, especially Brachiaria spp.

55
Figure 2.7. Map of habitat types found in Morro do Diabo State Park, São Paulo, Brazil, and surrounding buffer zone. Extracted from the Morro do Diabo State Park Management Plan (Faria & Pires 2006). Figures 2.5 and 2.6 provide further reference on the location of Morro do Diabo State Park.

56
2.6 General Methods
2.6.1 Logistics and Personnel
This 12-year lowland tapir study in Morro do Diabo was based at the field station of IPÊ -
Instituto de Pesquisas Ecológicas (Institute for Ecological Research) in the Municipality of
Teodoro Sampaio, São Paulo State, Brazil. IPÊ is a non-governmental-organisation (NGO)
founded in 1992, in São Paulo, Brazil. While most of IPÊ’s projects and initiatives are carried
out in the Atlantic Forests of São Paulo and Paraná States, the organisation is also very active
in other regions and biomes of Brazil, including the Amazon and, more recently, the Pantanal.
Today, IPÊ works with a small core of approximately 100 professionals. IPÊ’s work focuses on
five main conservation programmes: (i) Wildlife Research, Conservation and Management; (ii)
Wildlife Medicine; (iii) Environmental Education; (iv) Landscape Restoration; and, (v) Training
and Capacity-Building. As a founding member of IPÊ, I have been working for the organisation
as a research coordinator since January 1996.
The study area of Morro do Diabo is located at ~15 km from Teodoro Sampaio. Transportation
to and from the field site as well as most field activities were carried out by car. The project
owned two Volkswagen vehicles.
The field team included a multidisciplinary group of professionals that participated in, or were
responsible for, different components of the study for varying lengths of time. The team
included biologists, forest engineers, wildlife veterinarians, and geneticists from a variety of
institutional affiliations as well as local field assistants.
2.6.2 Field Methods
Radio-telemetry was selected as the most appropriate methodology to conduct long-term
monitoring of tapirs at Morro do Diabo. VHF radio-telemetry was used to study tapir ranging
behaviour, habitat use and selection, and activity patterns.
From July 1997 to July 2008, a total of 35 individual tapirs, comprising 20 females and 15
males, or 27 adults, 6 sub-adults, and 2 juveniles were captured, immobilised, and sampled
for biological materials in four different sections of Morro do Diabo: (i) West Border (N=8
tapirs), (ii) Northwest Border (N=2), (iii) Southeast Border (N=7), and (iv) Centre (N=18).
The capture methods used were: (i) iron box traps, (ii) pitfalls, (iii) anaesthetic dart shooting,
and (iv) wooden corrals. Seven different anaesthetic protocols were developed and used
during the study. Twenty-five of the 35 captured tapirs were radio-collared, and 19 of them
(13 females and 6 males, or 15 adults and 4 sub-adults) were monitored from July 1997 to

57
December 2006. Fourteen of the radio-collared tapirs (11 females and 3 males, or 12 adults
and 2 sub-adults) were radio-tracked for extended periods of time from 8-36 months, while
five individuals (2 females and 3 males, or 3 adults and 2 sub-adults) were radio-tracked for
short periods from 2-4 months.
Three methods were used to estimate tapir population density: (i) Radio-Telemetry, (ii)
Nocturnal Line-Transect Sampling, and (iii) Footprint Identification Technique (FIT).
Population Viability Analysis (PVA) was carried out through the use of VORTEX software.
2.6.3 Timeframe of Study
Field work was carried out from October 1996 to July 2008, comprising approximately 12
years of data collection. Appendix I provides the timeframe of different activities carried out
during this study in Morro do Diabo, including fieldwork, data analysis and fundraising.
2.6.4 Research Permits
This study required and obtained annual research permits from the Forestry Institute of São
Paulo State (permit to conduct research activities in Morro do Diabo State Park - Processo
SECRETARIA DO MEIO AMBIENTE Number 40.624/97) and from the Brazilian Federal Agency
for the Conservation of Nature and Natural Resources of the Brazilian Ministry of the
Environment (IBAMA - Instituto Brasileiro de Meio Ambiente e Recursos Naturais Renováveis)
(permit for tapir capture, chemical immobilisation and manipulation, including collection of
biological samples for epidemiological and genetics studies - Processo IBAMA Number
02027.004507/97-84).

58
Chapter 3
Spatial Ecology and Intra-Specific Interactions
Photo by Jefferson Lima

59
3.1 Introduction
Understanding the ways in which animals organise themselves in space and time is critical for
addressing broader questions of ecology, behaviour, and conservation. Most importantly,
knowledge of the ways in which animal populations use space in fragmented landscapes is
vital for the design of management strategies that can promote the persistence of these
populations over the long-term. The information required to answer these ecological and
socio-biological questions typically involves parameters of spatial ecology, most importantly
home range size, as well as parameters of intra-specific interactions, such as home range
overlap, spatial territoriality, and social organisation. Patterns of spatial ecology and intra-
specific interactions may be tied directly to life-history parameters such as body size (McNab
1963), reproduction (Gregory et al. 1987), growth (Bronikowski 2000), resource acquisition
(Luiselli 2006), and reflect the results of complex interactions between animals and the
external environment (Forester et al. 2007).
Home range is the fundamental measure of the use of space and time by animals (White &
Garrot 1990; Hemson et al. 2005), and has important consequences for ecological processes
(Jetz et al. 2004). Home range is the normal area an animal uses over some specified period
of time to carry out the activities of securing food, mating, and caring for young (Burt 1943).
The description of home range is vital to determine habitat preferences (Aebischer et al.
1993), carrying capacities, and aspects of species-extinction susceptibility (Woodroffe &
Ginsberg 2000; Brashares 2003). Home range is typically characterised with descriptors of its
size, shape and structure (Kenward 2001). Estimates of home range size may be needed for
management purposes, such as designing protected areas, and establishing corridors between
isolated patches of habitat (Schoener 1968; Hulbert et al. 1996). Shape may be important for
analysing how home ranges conform to the landscape when meeting resource and security
requirements (Redpath 1995). Home range structure provides information about core areas of
use and centres of activity used with different degrees of intensity according to habitat
content, or in extent of home range overlap with neighbouring animals (Poullé et al. 1994).
Home ranges are the spatial expressions of the behaviours animals perform to survive and
reproduce (Burt 1943). Because survival and reproduction are often food-limited, the
abundance and predictability of food resources in time and space are likely important factors
influencing spatial organisation. Therefore, food is often cited as an important limiting factor
determining the size of an individual's home range (McLoughlin & Ferguson 2000). Animals
move and establish their home ranges in response to energetic needs, or to build a memory
map of patches of food resources, or in response to the distribution of resting sites (South
1999). In fact, optimal foraging theory assumes that animals have complete knowledge of the
spatio-temporal distribution of resources within their home ranges, allowing predictions of the

60
resource depletion level at which an animal should leave each food patch (Stephens & Krebs
1986). Such area-restricted space use behaviour has fundamental consequences for many
ecological processes, such as the distribution and abundance of organisms and population
regulation (Gautestad & Mysterud 2005; Wang & Grimm 2007), habitat selection (Rhodes et
al. 2005), predator–prey dynamics (Lewis & Murray 1993), biological transport processes and
community structure (Fagan et al. 2007), or spread of diseases (Kenkre et al. 2007). In
addition, animals interact with their neighbours and other conspecifics in a variety of ways,
ranging from the use of non-exclusive home ranges to defence of exclusive territories (Begon
et al. 1990; Geffen et al. 1999). Home ranges of conspecifics often overlap, sometimes even
extensively. The determination of extent of home range overlap provides indications of the
degree of dynamic interactions between individuals (Macdonald et al. 1980; Kernohan et al.
2001), and therefore elucidates aspects of spatial territoriality and social organisation
(Macdonald & Amlaner 1980; Wronski 2005). Previous studies have showed that tapir species
exhibit home range overlap between neighbouring individuals (Foerster & Vaughan 2002;
Ayala 2003; Noss et al. 2003).
Body size is a major determinant of parameters of spatial ecology, and particularly of home
range size (McNab 1963). Home range size and body mass are positively correlated for most
animal feeding styles and seasons (Mysterud et al. 2001). Therefore, large terrestrial
mammals - such as tapirs - have larger home ranges and a greater absolute mobility than do
small mammals (Eisenberg 1980). Thus, while the spatial requirements of tapirs vary with the
carrying capacity of different habitats found within their distribution range (Eisenberg 1997;
Medici et al. 2007a), they usually require considerably large home ranges (Williams 1978;
Williams 1984; Foerster 1998; Herrera et al. 1999; Foerster & Vaughan 2002; Noss et al.
2003; Ayala 2003; Lizcano & Cavelier 2004; Tobler 2008; Abdul Ghani 2009; Naranjo 2009).
In addition to large home range sizes, tapirs have complex home range structures, with
multiple core areas of use (Tobler 2008) that are established according to the distribution of
patches of preferred habitat types.
Tapirs are widely recognised as “landscape species”, i.e. “species that occupy large home
ranges often extending beyond protected area boundaries, that have a significant impact on
the structure and functioning of natural ecosystems, and that require a diversity of ecosystem
types” (Sanderson et al. 2002; Coppolillo et al. 2003). Landscape species are usually large-
bodied and wide-ranging, have large habitat and nutritional requirements, have relatively low
reproductive rates, and tend to occur naturally at low population densities (Sanderson et al.
2002), all of which represent the life-history characteristics of tapirs. As a typical landscape
species, the density of lowland tapir populations tend to be as low as 0.3 tapirs km-² in
different regions and habitats where they occur (Cullen et al. 2000; Aquino et al. 2001; Aquino
& Calle 2003; Haugaasen & Peres 2005; Desbiez 2009).

61
Tapir populations rarely attain a high local abundance and so are particularly susceptible to
habitat loss and fragmentation. Small, isolated tapir populations show rapid decline or even go
extinct when disturbed (Medici et al. 2007a). Wide-ranging species with large spatial
requirements generally cannot find sufficient food and other vital resources to survive in small,
isolated areas over the long-term (McNab 1963; Redford & Robinson 1991). Chiarello (1999)
analysed the effects of the Atlantic Forest fragmentation on resident mammal communities in
six forest patches of different sizes, and recorded the presence of tapirs in the large patches
but not in the small ones. Likewise, a biome-wide tapir survey has been under way for the
past four years, and preliminary assessments of lowland tapir status in the Brazilian Atlantic
Forests of Bahia, Espírito Santo, Paraná, Rio de Janeiro, Rio Grande do Sul, Santa Catarina,
and São Paulo states have shown that tapirs rarely survive in forests smaller than 20 km²
without recourse to larger forest patches. While tapirs persist in some areas where habitat is
reduced to small scattered fragments, they appear to need recourse to fragments larger than
5 km² in clusters that total at least 15 km². On the other hand, tapirs disappear completely in
landscapes where all the forest fragments are smaller than 5 km², even when these smaller
fragments constitute a large percentage of the landscape (Flesher 2007). However, lowland
tapirs are adapted to diverse natural habitats and have the ability to traverse areas of low
quality habitat, such as agricultural crops and pasture lands, and so should be fairly resistant
to landscape changes as long as large tracts of forest remain (Flesher 2007). Nevertheless,
given the additional intensive pressures of hunting, road-kill, forest fires among other threats,
the existence of large forest fragments does not necessarily guarantee that tapirs will survive
and persist over the long-term. There are several large forest fragments throughout the
Atlantic Forest range where there should still be tapirs, but where they have been extirpated
by hunting (Flesher 2007). The low rates of population growth, long generation time, slow
reproductive rate, and delay in first reproduction are life-history characteristics that make
tapirs particularly susceptible to overhunting (Bodmer et al. 1997). Cullen et al. (2000)
compared the abundance of mammalian species in slightly and heavily hunted fragments of
Atlantic Forest of the Interior, including Morro do Diabo as one of the slightly hunted sites,
and observed that tapirs could not cope with persistent hunting and were extirpated from
heavily hunted sites.
The Atlantic Forest of the Interior of the Pontal do Paranapanema Region is the perfect
environment for the assessment of the long-term viability of tapir populations in fragmented
landscapes. The description of the species requirements in terms of space should provide a
measure of the tapir behavioural plasticity to human-induced fragmentation of habitat. The
characterisation of the spatial ecology and intra-specific interactions of lowland tapirs in Morro
do Diabo, one of the last significant remnants of the Atlantic Forest of the Interior, will provide
critical information for the assessment of the ability of tapir populations to survive and persist
in severely fragmented landscapes over the long-term. In addition, the process of destruction

62
and fragmentation of the Atlantic Forest of the Interior of the Pontal do Paranapanema Region
is relatively recent when compared to areas in the eastern part of the biome. The short period
since fragmentation, equivalent to 5-6 tapir generations, most probably means that patterns
of genetic structure are still in transition, and therefore genetic drift and inbreeding may not
have been observed yet (Gonçalves da Silva 2007).
In this Chapter, I examine aspects of tapir ranging behaviour and spatial territoriality and
provide insights into their spatial ecology and intra-specific interactions. Analysis of tapir home
range size, home range structure, and seasonal home range in Morro do Diabo, as well as the
description of tapir movements throughout the fragmented landscape of the Pontal do
Paranapanema Region, allowed for the characterisation of tapir spatial ecology. Estimates of
home range overlap and overlap of core areas of use were used to examine aspects of tapir
territoriality and intra-specific interactions. This information was used to determine tapir
spatial requirements and how these influence the long-term survival and persistence of tapir
populations in the fragmented landscape of the Atlantic Forest. This chapter also provides an
overview on the use and reliability of radio-telemetry for studying tapirs.

63
3.2 Methods
3.2.1 Radio-Telemetry
Radio-telemetry was selected as the most appropriate methodology to study the movements
of lowland tapirs in Morro do Diabo. Tapirs are mostly solitary, nocturnal, secretive animals, a
combination of factors that makes it very difficult to study them through direct observations.
Radio-telemetry was first used for wildlife research studies during the 1960's and since then
has revolutionised studies of the use of space by animals, providing a valuable tool to learn
more about their respective life histories (Kenward 2001). Locations of radio-tagged animals
can be collected systematically, free from the restrictions and bias that may be imposed on
visual records by elusive behaviour or dense vegetation. When carefully applied, the resulting
sets of locations provide a solid basis for estimating aspects of spatial ecology, including home
range size and structure, seasonal home range, and population density; intra-specific
interactions such as home range overlap, territoriality, and social behaviour; as well as habitat
use and selection, activity patterns, predation, mortality and survivorship, migration timing
and routes (Samuel & Fuller 1994; Rodgers et al. 1996; Kenward 2001).
Until 1995, only two previous studies by the same researcher had utilised radio-telemetry to
gather information on tapirs, first on Malayan tapirs in Malaysia (Williams 1978; Williams
1979; Williams 1980; Williams & Pétrides 1980), and later on Baird's tapirs in Costa Rica
(Williams 1984). Since then, other tapir researchers have employed this methodology,
although only a few of them have successfully collected data over the long-term: (i) Lowland
Tapir: Tarcísio Silva Jr. (1997, unpublished results) in Brazil; Herrera et al. (1999), Ayala
(2002), Ayala (2003), and Noss et al. (2003) in Bolivia; Tobler (2008) in Peru; (ii) Baird's
Tapir: Foerster (1998), Foerster & Vaughan (2002) in Costa Rica; (iii) Mountain Tapir: Downer
(2003) in Ecuador; Lizcano & Cavelier (2004), Lizcano (2006) in Colombia; and, (iv) Malayan
Tapir: Traeholt (2002), Abdul Ghani (2009) in Malaysia.
3.2.2 Capture Sites
Radio-telemetry was used in four different sections of Morro do Diabo including: West Border,
Southeast Border, Northwest Border, and Centre (Figure 3.1). Initial capture efforts in 1997
focused on the western and south eastern borders of Morro do Diabo. An early objective of
the study was to evaluate if tapirs left the boundaries of Morro do Diabo to feed on
agricultural crops so causing human-tapir conflict, an issue recorded in other areas of Atlantic
Forest where tapirs caused damage to sugar cane, manioc and coffee plantations. Tapirs have
also been known to damage young corn and other grain crops (McCabe 1970). Therefore, I
initially sought to capture and radio-collar tapirs in the border areas of Morro do Diabo where

64
I would have a better chance to investigate this aspect. Indeed, I placed pitfall traps outside
the boundaries, in the middle of sugar cane plantations and areas of pasture land, on several
occasions. In 2002, I started captures in the north western border, for the same reason.
Starting in 2003, I directed our capture efforts to the centre of Morro do Diabo, away from the
borders, where I found significant sign of tapirs. I also made sporadic attempts to bait and
capture tapirs in some of the small forest fragments in the surroundings of Morro do Diabo.
However, the capture process in these areas proved time-consuming and costly given the
small number of tapirs in the fragments.
Figure 3.1. Lowland tapir capture sites within Morro do Diabo State Park, São Paulo, Brazil. Figures 2.5 and 2.6 (Chapter 2) provide further reference on the location of Morro do Diabo State Park.
3.2.3 Capture Methods
I organised our capture efforts into short-term capture rounds, which were scheduled
according to the season of the year and availability of the team's veterinarians. Most of the
capture rounds were held during the dry season (June/July/August) when weather conditions
were more favourable. Capture rounds were carried out for periods from 2-4 weeks. From July
1997 to December 2002, nine capture rounds were carried out. From January 2003 to July
2004, I hired a full time wildlife veterinarian and therefore managed to keep our traps open
on a constant basis. From July 2004 to July 2006, I did not conduct any captures as I focused
2
1
3
4

65
on monitoring radio-collared individuals. From July 2006 to July 2008, I carried out four
capture rounds for the single purpose of collecting biological samples for long-term genetics
and epidemiological monitoring. During each capture round, different capture methods would
be attempted simultaneously.
The capture methods used were: (i) iron box traps (N=1 capture), (ii) pitfalls (N=15), (iii)
anaesthetic dart shooting, by foot or from platform, with CO2 pistols and rifles (N=5), and (iv)
wooden corrals (N=23). Iron box traps, pitfalls, and wooden corrals provided physical restraint
of the tapirs before anaesthesia. In all cases, before the construction of the actual traps, areas
frequently used by tapirs were identified, scouted and pre-baited with mineral salt. On some
occasions, I tried other types of bait such as a native palm fruits (Syagrus romanzoffiana),
mangos, guavas and bananas, but salt proved to be the most efficient bait in Morro do Diabo.
The bait only serves as extra incentive to tapirs to return to that area on a repeated basis.
Therefore, the bait stations must be placed in areas where tapirs would be expected to be
travelling regardless of the bait. Depending on the density of the tapir population to be
studied, this first step is not necessarily an easy one. Prior local knowledge of tapir behaviour
and the study area usually helps the researcher focus in on areas of greater tapir traffic. Once
tapirs were visiting a particular bait station on a regular basis I would make a decision about
the most appropriate capture method for the area and build the trap or a platform high on a
tree brunch for the case of anaesthetic dart shooting.
3.2.3.1 Iron Box Traps
Iron box traps were made of stainless iron and had the following measurements: 2 m long,
1.2 m wide and 1.5 m high (Figure 3.2.1). These traps were fairly small and there was not
enough internal space for a trigger. Therefore, when using this method a team member was
up on a tree waiting to close the trap (with the help of a rope tied to the trap's door) in the
case a tapir went inside. The rest of the team would be nearby and in the case of a capture
would be called on a walkie-talkie to come to the site as rapidly as possible. One individual
tapir was captured in one of our box traps and it was immobilised inside the trap through the
use of a blow-pipe and an anaesthetic dart (Telinject). Once the animal fell under the effect of
the anaesthesia it was carried outside of the trap for the manipulation procedures and
recovery. The main advantage of this method was that box traps were portable and could be
moved to different capture locations according to our needs. The main disadvantage was that
due to lack of internal trap space the team had to manipulate the tapir outside of the trap and
had little control of the recovery process. Another disadvantage was having a team member
up on a tree platform waiting to close the trap. In some cases, tapirs approaching the traps
felt the presence of human beings and walked away.

66
3.2.3.2 Pitfalls
Pitfalls consisted of 2.3 m long, 1.5 m wide and 2.2 m deep holes in the ground covered with
corrugated roofing tiles and camouflaged with forest debris (Figure 3.2.2). In my experience,
pitfalls less than 2 m deep allowed tapirs to escape. Pitfalls were checked twice a day, at
05:30 h and 16:00 h. Nearly all tapirs captured in pitfalls were found early in the morning. In
the event of a capture, the tapir was immobilised and manipulated inside the pitfall. Tapirs
were immobilised through the use of a blow-pipe and anaesthetic darts (Telinject). Once the
capture procedures where finished the veterinarian would inject the reversal agent and the
team would monitor the recovery of the animal very closely. When the tapir had fully
recovered from the anaesthesia a ramp was opened into one of the sides of the hole and the
animal was free to exit the hole via the ramp. The main advantage of the pitfalls was that
tapirs were manipulated inside the trap and the team had full control of the recovery and
release processes. Another advantage of this method was that it did not require baiting. The
biggest disadvantage of the pitfall traps was that once a tapir had been captured I could not
use that same trap again. The trap had to be closed and another pitfall had to be built nearby.
Other important disadvantages of the pitfall traps were the difficulty and cost of digging such
large holes. Groups of 4-5 people would take ~5-6 hours to dig and camouflage a pitfall.
Other animals captured in the pitfall traps were jaguar, white-lipped peccary, brocket deer,
small rodents, frogs, and snakes.
3.2.3.3 Anaesthetic Dart Shooting
Anaesthetic dart shooting usually required the construction of a platform up on a tree where
one or two members of the team would sit and wait for tapirs to come to the bait station
under the platform (Figure 3.2.3). The rest of the team would be waiting nearby. Waiting
hours would be usually from 17:00-02:00 h. In some cases, it was possible to dart tapirs from
the ground. When shooting from a distance we used a CO2 powered rifle (Pneu-Dart), and
anaesthetic darts (1.5-inch barbed needles) equipped with telemetry transmitters (Pneu-Dart)
to facilitate the process of following and locating darted tapirs. Once a tapir had been darted
the team would wait for ~10 min and then radio-track the anaesthetised animal in order to
locate it. Darted tapirs were usually found no farther than 200-300 m from the darting site.
The main advantage of the darting method was that it was very practical as it did not require
any major constructions, which meant that the selected capture site was fairly undisturbed.
Low cost was another important advantage. The main disadvantage of this method relied on
the fact that darted tapirs were not physically restrained. There are some inherent dangers in
darting an animal that is not confined. If the animal becomes frightened from the dart impact,
it can easily run, covering a lot of ground prior to the effect of the anaesthetic drugs. In
addition, the physiologic effect of stress may delay anaesthetic induction or even prevent an

67
animal from becoming sedated enough to stop moving (Hernández-Divers & Foerster 2001).
Darting from tree platforms was the main capture method used in a long-term Baird's tapir
study in Corcovado National Park, Costa Rica (Foerster & Vaughan 2002).
3.2.3.4 Wooden Corrals
The wooden corrals were large wooden enclosures 3.5 m long, 1.5 m wide and 2 m high
(Figure 3.2.4). The pillars of the traps were wider than 10 cm and the wooden boards thicker
than 2.5 cm. These traps were equipped with a trigger installed in the back of the trap and
attached to the door, which closed automatically when a tapir stepped on the trigger. Corrals
were checked twice a day, at 05:30 h and 16:00 h. In the event of a capture, the tapir was
immobilised and manipulated inside the corral. Tapirs were immobilised through the use of a
CO2 powered pistol (Telinject) and anaesthetic darts (Telinject). Once the capture procedures
were finished, the veterinarian would administer the reversal agent and the team would
monitor the recovery of the animal very closely. Once the tapir had fully recovered from the
anaesthesia the door of the corral was opened and the animal was free to exit the trap
through the door. As for the pitfalls, the main advantage of the corrals was that we could
manipulate tapirs inside the trap and had full control of the recovery and release processes.
Another important advantage of this method was that despite the high initial effort and cost to
construct the traps, many different individual tapirs from the same area could be captured in
the same trap. This reduced capture costs per tapir over the long-term and maximised our
chances to collect data about home range overlap and intra-specific interactions between
neighbouring individuals. In three of our wooden corrals we captured several different
individual tapirs: 4 tapirs were captured in the Taquara Ceva Caçador trap; 6 tapirs were
captured in the Taquara Areião trap; and 8 tapirs were captured in the Taquara Córrego trap.
In four occasions, known individual tapirs were recaptured in these corral traps. The only
disadvantage of the wooden corrals was that we had to repair and renovate them on a regular
basis. Some of our wooden corrals have been in use since January 2003. Wooden corrals were
used during 2003 and 2004 and during four capture rounds from July 2006 to July 2008.
Other animals captured in the corrals were white-lipped peccary, collared peccary, brocket
deer, and agouti.

68
Figure 3.2. Capture methods used during the lowland tapir study in Morro do Diabo State Park, São Paulo, Brazil: 1- Iron box trap (N=1 captured tapir); 2- Pitfall trap (N=15); 3- Platform for anaesthetic darting (N=5); 4- Wooden corral (N=23). Photos by Patrícia Medici and Charles Foerster. Total number of tapir manipulations=44.
2 1
3 4

69
3.2.3.5 Trapping Effort and Trapping Success
Iron box traps were used in three capture rounds during the study. The trapping effort for this
method was 165 24-hour periods of open traps. Forty-four pitfall traps were constructed
during the study, 24 in the west border, 8 in the southeast border, 6 in the northwest border,
and 6 in the centre. Eleven of them (25%) were successful in capturing tapirs. Pitfall traps
were used in eight capture rounds, and the trapping effort was 1,230 24-hour periods of open
traps. Anaesthetic dart shooting was attempted in 12 capture rounds and the trapping effort
for this method was 260 nights (8 h/night). Nine wooden corrals were built during the study,
two in the west border, two in the southeast border, and five in the centre of Morro do Diabo.
Five of these traps were successful in capturing tapirs (55%). The trapping effort for this
method was ~1,935 24-hour periods of open traps. Table 3.1 provides results of trapping
success of each capture method.
Table 3.1. Trapping effort (hour), number of tapirs captured (N), and trapping success (tapirs/h) of the capture methods used in Morro do Diabo State Park, São Paulo, Brazil.
Capture Method
Trapping Effort (h)
Tapir Captures
(N)
Trapping Success (tapirs/h)
Iron box traps 3,960 1 0.00025 Pitfalls 29,520 15 0.00050 Anaesthetic dart shooting 2,080 5 0.0024 Wooden corrals 46,440 23 0.00049
3.2.4 Chemical Immobilisation
Several anaesthetic protocols have been used previously for captive tapirs (Janssen et al.
1999; Nunes et al. 2001; Janssen 2003). However, anaesthetic protocols developed for
captive animals may not be well-suited for the capture and immobilisation of free-ranging
tapirs (Mangini & Medici 1998; Mangini et al. 2001a; Mangini et al. 2001b). Seven anaesthetic
protocols based on a variety of anaesthetic agents were developed and tested by the project’s
veterinarians during this study. All protocols were based on combinations of Alpha-2-agonists
with either dissociative drugs or opioid derivates. Two of the protocols were selected as the
most appropriate for the chemical restraint of free-ranging lowland tapirs based on the
following criteria: type of capture method, rapid induction and recovery, adequate
immobilisation and muscle relaxation, reversibility, cost, and safety of the field team.
The first anaesthetic protocol selected was based on the association of Medetomidine
Cloridrate (Domitor), Tiletamine/Zolazepan Cloridrate (Telazol), and Atropine. Atipemazole
Cloridrate (Antisedan) was used as the antagonist to Medetomidine. This protocol was mostly
used for dart shooting as it provided a short induction time (4-5 min), which is desirable for a
capture method that does not provide physical restraint. The average manipulation time for

70
this protocol was 130 min (N=9 manipulations; SD=53). The second protocol was based on a
combination of Butorphanol (Torbugesic), Medetomidine, and Atropine. In some cases,
Ketamine (Ketaset) was added to the protocol to extend the immobilisation. Naltrexone
(Trexonil) was used as the antagonist to Butorphanol. Atipemazole was used as the antagonist
to Medetomidine. This protocol was mostly used for situations where tapirs were physically
restrained such as in pitfalls and wooden corrals. This protocol takes longer to take effect (11-
12 min), but the anaesthesia occurs more smoothly as the animals attain a higher level of
muscle relaxation. An important advantage of this protocol is that it is entirely and quickly
reversible (1-2 min). The average manipulation time was 74 min (N=15 manipulations;
SD=20). Atropine is not an anaesthetic agent. It was added to both anaesthetic protocols to
inhibit excessive salivation and respiratory secretions as well as to reverse the blood pressure
drop due to Alpha-2-agonists or dissociatives, which can potentially hamper the collection of
blood samples. All of the anaesthetic and reversal agents used in both protocols have a large
margin of safety for both humans and animals and have often been often recommended for
Neotropical ungulates (Nunes et al. 2001). Anaesthetic and reversal doses were calculated
using inter-specific allometric scaling based on estimated body weights of captured animals.
Anaesthetic agents were injected intramuscularly (IM) through the use of either a blow-pipe
(Telinject), CO2 powered pistol (Telinject) or rifle (Pneu-Dart), and anaesthetic disposable
darts (Pneu-Dart). Reversal agents were injected intravenously (IV). The parameters of
anaesthesia monitoring included heart rate and rhythm, rate of ventilations, rectal
temperature, and oxygen saturation through pulse-oximetry (Table 3.2). Data on anaesthesia
monitoring during immobilisations was continually evaluated and protocols adjusted
accordingly in order to guarantee the well-being of the animals under anaesthesia, as well as
the safety of the research team. Safety and emergency drugs used to improve respiratory and
cardiac functions, such as Epinephrine, Atropine, Doxapran, Dopamine and oxygen
supplementation, were available during manipulations.
Table 3.2. Parameters of anaesthesia monitoring obtained during 44 lowland tapir manipulations carried out in Morro do Diabo State Park, São Paulo, Brazil (N=number of manipulations; AV=average; SD=standard deviation; Max=maximum; Min=minimum).
Parameter of Anaesthesia Monitoring N AV SD
Heart rate (Max) 18 80 19.0 Heart rate (Min) 18 67 16.6 Rate of ventilations (Max) 21 26 8.4 Rate of ventilations (Min) 21 19 8.0 Oxygen saturation % (Max) 17 95 3.8 Oxygen saturation % (Min) 17 80 18.9 Temperature ºC (Max) 9 36 0.8 Temperature ºC (Min) 9 36 0.8

71
3.2.5 Manipulation and Collection of Biological Samples
The first procedure carried out during tapir manipulations was the installation of the radio-
collar. The transmitter package of the collar was placed right under the throat of the tapir.
Collars were carefully fitted for the safety of the animals, sufficiently loose as to be
comfortable and not interfere with swallowing or panting or any other regular activities of the
animals. Initially, I attempted to ear tag tapirs (N=10) for visual identification by direct
sightings, but without exception all ear tags fell off. Other procedures carried out during
immobilisation included sexing, aging via tooth wear and appearance of foot cushions,
corporal measurements, and collection of biological samples. The age estimations separated
individuals into three different age classes including: juvenile (6 months to 1 year), sub-adult
(1-4 years), and adult (over 4 years of age). Estimated weights and corporal measurements of
tapirs captured in Morro do Diabo are presented in Chapter 2.
Biological samples were collected, adequately preserved and stored for genetics and
epidemiological studies. Samples for genetics studies included blood (N=32 samples), skin
biopsy tissues (N=23), faeces (N=4), and hair (N=13). Blood samples consisted of an average
of 50 ml collected through venipuncture on the saphenous or jugular veins. The jugular vein is
deep and not always easy to access. Biopsy samples consisted of 1cm² of skin collected from
the tip of the ear. For the genetics assessment, fresh faecal samples were also systematically
collected while walking trails in Morro do Diabo and surrounding forest fragments (N=170).
Samples for genetics studies were analysed and DNA extracted at the EMBRAPA-CENARGEN
laboratory in Brasília, Distrito Federal, Brazil. The results of genetics analysis carried out as a
component of this study can be found in Gonçalves da Silva (2007).
Samples for health studies included blood (N=32 samples) for serology, haematology, blood
chemistry, and blood parasites; swabs (N=20) for bacterial cultures (nasal, oral, ear, rectal,
vaginal, urethra and preputial); urine (N=8) for urinalysis and sediment analysis; and
ectoparasites (N=22) for identification. Samples were properly preserved and immediately
transported or sent to reference laboratories for analysis. The serology analyses tested for 12
different types of infectious diseases relevant to tapirs and domestic livestock (cattle, horses
and swine) in the Pontal do Paranapanema Region. Preliminary results of the epidemiological
analyses were used for the Population Viability Analysis (PVA) modelling in Chapter 6. The
complete results of epidemiological evaluation and long-term monitoring of tapir health in
Morro do Diabo will be included in a Master’s thesis currently under way.
Finally, during capture procedures I conducted a detailed evaluation of the general conditions
of the tapirs inspecting for any visible external injuries, presence of scars, and ectoparasite
load among others. For females, I inspected for any evidence of reproductive activity

72
(lactating females, presence of vaginal secretions, superficial wounds caused by mounting).
Four adult female tapirs were captured in their pre or post parturition period and it was
possible to collect milk samples for bromatological and chemical analysis. All data collected
during tapir manipulations was recorded through field data sheets, photographs and, in some
occasions, videos.
Without exception, all captures and animal manipulations were carried out by one of the
project's veterinarians. Veterinarians in the team were specialised in wildlife medicine and
through this project have acquired many years of experience on the immobilisation and
handling of free-ranging lowland tapirs. Capture stress and traumas are intrinsic risks of the
handling of wild animals. However, well-planned capture procedures and the selection of a
safe chemical restraint protocol can significantly reduce these risks. All our protocols for the
capture, immobilisation and manipulation of tapirs, as well as for the collection, storage and
analysis of tapir biological samples were reviewed and approved by the Veterinary Advisors of
the Association of Zoos & Aquariums (AZA) Tapir Taxon Advisory Group (TAG), as well as the
Veterinary and Genetics Committees of the IUCN/SSC Tapir Specialist Group (TSG). Further
details about different tapir capture methods and anaesthetic protocols, as well as guidelines
for the collection and storage of tapir biological samples can be found on the “Tapir Field
Veterinary Manual” compiled and published by the Veterinary Committee of the IUCN/SSC
Tapir Specialist Group (TSG) (Medici et al. 2007b). The Manual was largely based on results
and experiences from this long-term lowland tapir study in Morro do Diabo.
3.2.6 Captured Individuals
From July 1997 to July 2008, a total of 35 different tapirs (20 females and 15 males, or 27
adults, 6 sub-adults, and 2 juveniles) were captured, immobilised through anaesthesia,
manipulated and sampled for biological materials: (i) West Border (N=8; 5 females and 3
males, or 3 adults and 5 sub-adults), (ii) Northwest Border (N=2; 1 female and 1 male, or 2
adults), (iii) Southeast Border (N=7; 3 females and 4 males, or 7 adults), and (iv) Centre
(N=18; 11 females and 7 males, or 15 adults, 1 sub-adult, and 2 juveniles).
Twenty-five of those 35 captured tapirs (13 females and 12 males, or 20 adults and 5 sub-
adults) were radio-collared: (i) West Border (N=8 tapirs), (ii) Northwest Border (N=2), (iii)
Southeast Border (N=6), and (iv) Centre (N=9). Six of the 25 radio-collared tapirs were not
monitored because their collars fell off (N=5) or they died a few weeks after the capture
(N=1). The individual that died was an adult male captured in June 2003 in the centre of
Morro do Diabo. This male was very old and its teeth were almost completely worn down to
the roots. It was severely thin and apparently very weak. I radio-collared the tapir in order to
gather further information about its health conditions, but the animal was found dead 25 days

73
after the capture. Ten of the 35 tapirs (7 females and 3 males, or 7 adults, 1 sub-adult, and 2
juveniles) were captured from July 2006 to July 2008 for the single purpose of collecting
biological samples for a long-term genetics and epidemiological monitoring programme
established in the later stages of the study. These individuals were not radio-collared.
Therefore, from July 1997 to December 2006, I radio-tracked a total of 19 tapirs (13 females
and 6 males, or 15 adults and 4 sub-adults) for varying amounts of time: (i) West Border
(N=7 tapirs), (ii) Northwest Border (N=2), (iii) Southeast Border (N=3), and (iv) Centre
(N=7). Fourteen of the radio-collared tapirs (11 females and 3 males, or 12 adults and 2 sub-
adults) were radio-tracked for extensive periods of time (8-36 months). Five of the radio-
collared tapirs (2 females and 3 males, or 3 adults and 2 sub-adults) were radio-tracked for
short periods of time (2-4 months) before their collars fell off (N=2) or stopped working
(N=1), or before they were predated by either jaguar (N=1) or puma (N=1).
On two occasions, I captured adult females with offspring, the first time in a pitfall trap and
the second time in a wooden corral. One calf was a male no older than 3-4 months of age,
and the second was a female calf of ~5-6 months of age. These two calves were neither
anaesthetised nor manipulated. The two juvenile tapirs captured during the study were
immobilised and sampled for biological materials, but not radio-collared. Young tapirs gain
weight and grow very fast; therefore placing collars on them may unnecessarily risk their
lives.
I carried out nine tapir recaptures during the study for either collar retrieval (N=5) and/or
collection of biological samples. Overall, during the study in Morro do Diabo I performed a
total of 44 tapir immobilisations and manipulations. Appendix II provides complete information
about each individual lowland tapir captured in Morro do Diabo State Park.
3.2.7 Telemetry Equipment
Very High Frequency (VHF) telemetry was used to study tapir movements in Morro do Diabo.
The telemetry equipment was purchased from Telonics, a wildlife telemetry company based in
Arizona, USA. The receiving system included a TR-4 VHF tracking receiver (150-164MHz) and
a RA-14K VHF antenna (150-164MHz). The TR-4 receiver is small, lightweight, and designed
for easy field use. The RA-14K antenna is a handheld directional "H" antenna made of flexible
rubber. The antenna was connected to the receiver through a RW-2 coaxial cable.
The transmitter collar model was an adapted version of MOD-500 HCP (High Capacity
Transmitter), which was designed and manufactured by Telonics especially for lowland tapirs
based on several intrinsic characteristics of the species (Figures 3.3.1 and 3.3.2). These

74
characteristics included size, weight, shape of the neck, presence of the sagittal crest and,
most importantly, the fact that these animals are constantly in the water. The weight of the
radio-collar was ~300 grams. All electronic components, including transmitter, batteries,
sensors, and power sources were totally enclosed in a hermetically sealed metal housing
(CAST-1 Protective Casting), which eliminated the possibility of moisture penetration into the
package. The collar itself was 1-m long to allow for different neck perimeters and made of 10"
urethane over 1/8" butyl layers. The transmitter's antenna was placed internally in between
the layers of the collar to prevent it from breaking off. I requested Telonics to place metallic
rivets all along the length of the collar, in both sides of the internal antenna, in order to
prevent the layers from coming apart. The frequency of the transmitters was 164MHz. The
batteries of the transmitters were made to last for 36 months. In the field, they lasted for an
average of 30 months (minimum=18 months, maximum=36 months).
The transmitters were equipped with a MS6A Mortality-Motion Sensor programmed with a 1-
minute delay. A motion-sensitive sensor switch detects animal movement and provides
"active/alive" or "inactive/dead" pulse periods depending on the activity of the animal. The
microprocessor continuously monitors the motion switch to determine when motion occurs.
Once per second, the microprocessor increments an "activity counter" if motion was detected
during the preceding 1-second time period. This "activity counter" keeps a running total of the
number of times motion was detected over a user-defined mortality evaluation time (in the
case of this study, 1 min). This adaptation of the mortality sensor allowed for the study of
activity patterns of tapirs in Morro do Diabo.

75
1
2
Figure 3.3. 1- Picture of radio-collar designed for the lowland tapir study in Morro do Diabo State Park, São Paulo, Brazil. Photo shows the metallic rivets placed along the length of the collar. 2- View of a radio-collar on a tapir. Photos by Patrícia Medici.

76
3.2.8 Telemetry Data Collection
I started radio-tracking tapirs immediately following their radio-collaring. After the capture,
tapirs were continuously monitored for 72 h in order to ensure that the capture procedures
had not affected them in any way. After this initial period, I continued to radio-track collared
individuals following a pre-established sampling design.
Tapirs were radio-tracked on foot or by car, depending on terrain and weather conditions.
Radio-collared tapirs were located by using the receiver and directional antenna to determine
the direction of maximum signal strength and obtain a compass bearing (azimuth angle) to
the target animal (transmitter). Coordinates of tapir locations were calculated by triangulation.
Triangulation bearings were taken from two separate fixed stations along trails and roads
inside and around Morro do Diabo. I established 162 fixed triangulation stations with known
UTM locations (Universal Transverse Mercator) in four sections of Morro do Diabo.
Triangulation stations were located at an average distance of 850 m from each other.
Bearings were taken within 5 min of each other in order to maximise location accuracy. For
each bearing, I recorded date, time, azimuth angle, and activity (active or inactive). The main
problem with applying VHF telemetry in forest habitat is that the reach of the transmitter
signal is usually less than 2 km, making it difficult to locate study animals. Therefore, I
established the triangulation stations as I moved forward with data collection of each study
tapir and as I learned more about their respective areas of use.
During the first five years of the study, I monitored each radio-collared tapir for 5 days per
month, 24 hours a day. Each tapir was located every 30 minutes during the sampling period.
This initial intensive sampling design generated ~240 locations per study animal per month,
which allowed me to gather detailed data about tapir activity patterns. In the later four years
of the study, I simplified the sampling design and concentrated data collection on crepuscular
times, 3 hours at dawn (04:00-07:00 h) and 3 hours at dusk (17:00-20:00 h), for 2 days per
month. Based on our preliminary data analysis and reviewed literature, these periods
appeared to be the two main peaks of tapir activity. I continued to triangulate tapirs every 30
min. However, if a given tapir was inactive in the same location for long periods of time I
would triangulate that particular location only once. With this sampling design I obtained ~24
locations per study animal per month. Appendix III provides detailed information about
timeframes of monitoring of all 19 radio-tracked tapirs.

77
3.2.9 Telemetry Data Screening
The triangulation bearings obtained for each study animal were used to calculate the
coordinates of tapir locations using the computer software TRACKER 1.1 (Camponotus Radio
Location Systems AB 1994). The coordinates of tapir locations were then plotted on digitalised
maps and satellite images of Morro do Diabo and surrounding forest fragments, and studied in
a geo-referenced context produced by ArcGIS 9.X. software (ESRI-GIS Mapping Software,
USA) and the Home Range Extension (HRE) for ArcView 3.3 (Hooge & Eichenlaub 2000).
Before the actual data analysis, I carried out a process of data screening and cleaned up the
datasets of each one of the 19 radio-tracked tapirs. First, I removed all locations generated by
triangulations where the difference between the two compass bearings was smaller than 30°.
These triangulations generate intrinsic errors that can significantly alter the estimates of
ranging behaviour parameters, particularly home range size. This is usually a result of human
error (i.e. failure to determine the direction of maximum signal strength leading to a failure to
obtain an accurate bearing), equipment failure (i.e. malfunctioning of receiver, antenna, or
compass), presence of a water course near the triangulation station or in between the data
collector and the target animal/transmitter (water causes signal reflection), presence of dense
forest between the data collector and the target animal/transmitter, or a combination of two
or more of these factors. Second, I removed all repeated locations obtained when an animal
was inactive and in the same location for long periods of time. This usually occurred during
the hottest periods of the day. Repeat locations can cause significant statistical dependence
among data samples.
A total of 7,537 tapir locations were obtained during the study. After data screening, 3,103 of
these or ~40% of the locations were omitted from the analysis. Most of the omitted locations
(3,037) came from the datasets of 10 tapirs monitored during the initial intensive sampling in
the first five years of the study. A total of 2,699 of these were repeated locations, and 338
generated large error ellipses. Only 66 locations were removed from the datasets of the nine
tapirs monitored during the later four years of the study.
3.2.10 Tapir Spatial Ecology
3.2.10.1 Home Range Size
Home range size (km²) for each of the 19 tapirs (13 females and 6 males, or 15 adults and 4
sub-adults) radio-tracked during the study in Morro do Diabo was calculated by using two
different estimators: Kernel Density Estimator 95% (KDE95%) and Minimum Convex Polygon
95% (MCP95%). Mean home range size was calculated for all 19 tapirs, both sexes, and

78
different age classes. KDE is widely viewed as the most reliable method of home range
estimate in ecology (Powell 2000; Kernohan et al. 2001; Hemson et al. 2005). KDE has the
advantage over MCP in that it not only outlines the outer home range boundary, but also
describes the internal structure of the home range allowing for the identification of higher-
usage areas within the home range, i.e. core areas of use and centres of activity (Hooge et al.
2001). KDE do not rely on outlying points to anchor their corners, and are less influenced by
distant points, thereby excluding unused areas and leading to more accurate depictions of
space use (Hemson et al. 2005). KDE and MCP results were compared, but MCP results were
mostly reported to allow for comparisons with other lowland tapir studies. MCP was calculated
using the Home Range Extension (HRE) for computer software ArcView 3.3 (Hooge &
Eichenlaub 2000). KDE was calculated using ArcGIS 9.X (ESRI-GIS Mapping Software, USA).
The most important input parameter to be defined when employing KDE estimates is the
smoothing factor “h” (Silverman 1986). I used a Gaussian bivariate normal kernel and the
Least Squares Cross-Validation (LSCV) method to estimate smoothing factor. LSCV is often
recommended as the most appropriate technique for estimating “h” (Seaman & Powell 1996;
Hemson et al. 2005). Data were rescaled for unit variance.
3.2.10.2 Maximum Distance Moved (MDM)
I used tapir home range results obtained through MCP95% to calculate the Maximum Distance
Moved (MDM) for each one of the 19 tapirs radio-tracked in Morro do Diabo. Mean MDM was
calculated for all 19 tapirs, both sexes, and different age classes. MDM was calculated using
the Home Range Extension (HRE) for computer software ArcView 3.3 (Hooge & Eichenlaub
2000). Half MDM is generally used as a proxy of home range radius and gives a measure of
home range structure.
3.2.10.3 Size of Core Areas of Use
The size of core areas of use (km²) within the home ranges of each of the 19 tapirs radio-
tracked in Morro do Diabo was calculated by using Kernel Density Estimator at both the
KDE50% and KDE25% levels, using ArcGIS 9.X (ESRI-GIS Mapping Software, USA). Mean
core area of use was calculated for all 19 tapirs, both sexes, and different age classes.
3.2.10.4 Seasonal Home Range
Seasonal home range (km²) in dry and wet seasons for each of the 14 tapirs radio-tracked
from 8-36 months was calculated by using Kernel Density Estimator (KDE95%), using ArcGIS
9.X (ESRI-GIS Mapping Software, USA). Mean seasonal home range in dry and wet seasons
was calculated for all 14 tapirs, both sexes, and different age classes. In addition, I calculated

79
core areas of use (KDE50% and KDE25%) in dry and wet seasons. Lastly, I calculated the
overlap between the home ranges used in dry and wet seasons and examined the variation in
location of seasonal home ranges.
3.2.10.5 Determination of Home Range Size over Time
I examined home range determination over time in two different ways. First, I calculated the
overlap of annual areas of use between consecutive years of radio-tracking of the same tapir,
and analysed the gradual increase in estimate of home range size over the years. The size of
annual areas of use (KDE95%, km²) and overlap between consecutive years (% and km²)
was calculated using ArcGIS 9X (ESRI-GIS Mapping Software, USA). For this analysis, I
included 12 tapirs (10 females and 2 males, or 10 adults and 2 sub-adults) radio-tracked for
over 18 months. Six of these tapirs were radio-tracked for periods from 18-24 months and so
the increase in estimate of their home range size was analysed over a period of 2 years. The
other six tapirs were radio-tracked for periods from 28-36 months, so the increase in estimate
of their home range size was analysed over a period of 3 years.
Second, I plotted the cumulative size of monthly areas of use of six tapirs monitored for over
22 months, and determined the point in time or the number of locations required for their
home ranges to reach an asymptote (Laver 2005). This allowed me to determine the minimum
number of months of radio-tracking, as well as the minimum number of locations needed, to
determine the full extent of the home range size for lowland tapirs. Home range analysis
should be estimated using data that encompass the full range of variation in movement
behaviour attributable to sex and age differences (Harris et al. 1990). To ensure that the
sampling duration covers the full range of behaviours exhibited by the study species, it is
necessary to calculate asymptotes.
3.2.11 Tapir Intra-Specific Interactions
3.2.11.1 Home Range Overlap
Home range overlap between neighbouring tapirs was calculated by Kernel Density Estimator
(KDE95%) using ArcGIS 9.X (ESRI-GIS Mapping Software, USA). I calculated both percentage
and area of overlap (km²). Initial calculations of home range overlap were carried out for all
possible combinations of pairs of individual tapirs radio-tracked concurrently. I then obtained
mean values of home range overlap between the sexes (female-female, female-male, male-
male), and between age classes (adult-adult, sub-adult-sub-adult, adult-sub-adult), as well as
general mean values of tapir home range overlap for the study area.

80
3.2.11.2 Overlap of Core Areas of Use
Overlap of core areas of use between neighbouring tapirs was calculated by Kernel Density
Estimator at both the KDE50% and KDE25% levels using ArcGIS 9.X (ESRI-GIS Mapping
Software, USA). I calculated both percentage and area (km²) of core area overlap. Initial
calculations of 50% and 25% core area overlap were carried out for all possible combinations
of pairs of tapirs radio-tracked concurrently. I then obtained mean values of core area overlap
between the sexes (female-female, female-male, male-male), and between age classes (adult-
adult, sub-adult-sub-adult, adult-sub-adult), as well as general mean values of tapir 50% and
25% core area overlap for the study area. Results of home range overlap and overlap of core
areas of use were used to make inferences about the social organisation of tapirs in Morro do
Diabo.
3.2.12 Statistical Significance
When appropriate, I compared results for differences in ranging parameters using Student’s t-
test, Mann-Whitney Rank Sum Test and One-Way Analysis of Variance (ANOVA). For these
analyses I used the Sigma Stat 3.1 software package.

81
3.3 Results
3.3.1 Tapir Spatial Ecology
3.3.1.1 Home Range Size
Individual home range size varied widely among the 19 tapirs radio-tracked during the study
in Morro do Diabo, including 14 tapirs radio-tracked from 8-36 months (long-term) and 5
tapirs radio-tracked from 2-4 months (short-term) (Table 3.3). The home range size varied
from 1.1-14.2 km² when estimated using Kernel Density Estimator (KDE95%), with an
average of 4.9 km². The home range size varied from 1-13.2 km² when estimated using
Minimum Convex Polygon (MCP95%), with an average of 4.1 km² (Tables 3.3 and 3.4). There
was no difference between home range size obtained by KDE95% and MCP95% (T=353.000;
N=19-19; P=0.620).
The mean home range size for females was 4.7 km² when using KDE95%, and 3.8 km² when
using MCP95%. The mean home range size for males was 5.4 km² when using KDE95%, and
4.7 km² when using MCP95% (Table 3.4). There were no differences in home range size
between the sexes, either when estimated using KDE95% (T=69.000; N=6-13; P=0.456) or
MCP95% (T=62.000; N=6-13; P=0.895).
The mean home range size for adults was 3.9 km² when using KDE95%, and 3.7 km² when
using MCP95%. The mean home range size for sub-adults was 8.5 km² when using KDE95%,
and 5.7 km² when using MCP95% (Table 3.4). There were no differences in home range size
between different age classes, either when estimated using KDE95% (t=-2.398; DF=17;
P=0.028) or MCP95% (T=54.000; N=4-15; P=0.177).
When running the same analyses for a second group of tapirs that only included the 14 tapirs
radio-tracked from 8-36 months, results were very similar. I was interested to determine if
removing the animals monitored in the short-term from the dataset would affect final results.
While the home range curves of most individuals monitored in the long-term reached
asymptotes over time, the home ranges of the five tapirs radio-tracked for short periods of
time did not reach an asymptote.
For the second group, the mean home range size was 4.7 km² when estimated using
KDE95%, and 4.4 km² when estimated using MCP95% (Table 3.4, Group 2). The mean home
range size for females was 5.0 km² when using KDE95%, and 3.8 km² when using MCP95%.
The mean home range size for males was 3.6 km² when using KDE95%, and 6.5 km² when
using MCP95% (Table 3.4, Group 2). There was no difference in home range size between the

82
sexes, either when estimated using KDE95% (t=-0.529; DF=12; P=0.607) or MCP95%
(T=26.000; N=3-11; P=0.640). The mean home range size for adults was 3.3 km² when
using KDE95%, and 3.7 km² when using MCP95%. The mean home range size for sub-adults
was 12.7 km² when using KDE95%, and 8.1 km² when using MCP95% (Table 3.4, Group 2).
There was no difference in home range size between different age classes, either when
estimated using KDE95% (t=-6.800; DF=12; P=<0.001) or MCP95% (T=23.000; N=2-12;
P=0.171).

83
Table 3.3. Home range size (KDE95% and MCP95%, km²) of 19 lowland tapirs radio-tracked in four different sections (West Border, Southeast Border, Northwest Border, and Centre) of Morro do Diabo State Park (MDSP), São Paulo, Brazil. Fourteen tapirs were radio-tracked from 8-36 months (long-term, G2=Group 2). Five tapirs were radio-tracked from 2-4 months (short-term). The number of telemetry locations and number of months of radio-tracking are shown for each tapir. (*Minimum; **Maximum)
Individual
Sex
Age Class
Area MDSP
KDE95% (km²)
MCP95% (km²)
Telemetry Locations (number)
Period of Radio-Tracking
(months)
Timeframe of Radio-Tracking
JOANA Female Adult West Border 4.4 6.2 903 36 Long-term, G2 PAULETE Female Adult West Border 4.2 6.3 439 33 Long-term, G2 CHU-CHU Female Sub-Adult West Border 14.2** 10.7 294 35 Long-term, G2 PATRICIA Female Sub-Adult West Border 11.2 5.5 184 30 Long-term, G2 DOCINHO Female Adult Southeast Border 3.1 1.9 74 22 Long-term, G2 JAMES BOND Male Adult Southeast Border 1.9 1.5 292 29 Long-term, G2 GEORGETE Female Adult Southeast Border 2.0 1.0* 205 25 Long-term, G2 CHICO Male Adult Centre 5.2 13.2** 440 28 Long-term, G2 JULIA Female Adult Centre 7.4 2.3 60 12 Long-term, G2 CIDAO Male Adult Centre 3.8 4.8 28 8 Long-term, G2 TONHA Female Adult Centre 3.1 2.2 535 33 Long-term, G2 TINA Female Adult Centre 2.0 2.1 451 27 Long-term, G2 MAMA Female Adult Centre 1.9 1.6 234 18 Long-term, G2 ESPERTA Female Adult Northwest Border 1.1* 1.5 105 22 Long-term, G2 LUIZINHO Male Sub-Adult West Border 4.6 3.4 37 3 Short-term XUXA Female Adult West Border 5.1 4.9 71 3 Short-term JOAO Male Sub-Adult West Border 4.1 3.2 26 2 Short-term BABY Female Adult Centre 1.5 3.5 40 4 Short-term DEDINHO Male Adult Northwest Border 12.7 2.0 10 2 Short-term

84
Table 3.4. Mean home range size (KDE95% and MCP95%, km²) of lowland tapirs in Morro do Diabo State Park (MDSP), São Paulo, Brazil. Results for all 19 tapirs, Group 2 (14 tapirs radio-tracked from 8-36 months), both sexes, and different age classes are shown. (N=number of tapirs; SD=standard deviation; Min=Minimum; Max=Maximum)
19 tapirs Group 2 (14 tapirs) KDE95%
(km²) MCP95%
(km²) KDE95%
(km²) MCP95%
(km²)
ALL INDIVIDUALS
4.9 (N=19; SD=3.8) Min 1.1 / Max 14.2
4.1 (N=19; SD=3.2)
Min 1.0 / Max 13.2
4.7 (N=14; SD=3.8) Min 1.1 / Max 14.2
4.4 (N=14; SD=3.7)
Min 1.0 / Max 13.2
FEMALES
4.7 (N=13; SD=4.0) Min 1.1 / Max 14.2
3.84 (N=13; SD=2.8)
Min 1.0 / Max 10.7
5.0 (N=11; SD=4.2) Min 1.1 / Max 14.2
3.8 (N=11; SD=3.0)
Min 1.0 / Max 10.7
MALES
5.4 (N=6; SD=3.7)
Min 1.9 / Max 12.7
4.7 (N=6; SD=4.3)
Min 1.5 / Max 13.2
3.6 (N=3; SD=1.6) Min 1.9 / Max 5.2
6.5 (N=3; SD=6.0)
Min 1.5 / Max 13.2
ADULTS
3.9 (N=15; SD=3.0) Min 1.1 / Max 12.7
3.7 (N=15; SD=3.2)
Min 1.0 / Max 13.2
3.3 (N=12; SD=1.8) Min 1.1 / Max 7.4
3.7 (N=12; SD=3.5)
Min 1.0 / Max 13.2
Adult Females
3.2 (N=11; SD=1.9) Min 1.1 / Max 7.4
3.1 (N=11; SD=1.9) Min 1.0 / Max 6.3
3.2 (N=9; SD=1.9) Min 1.1 / Max 7.4
2.8 (N=9; SD=2.0)
Min 1.0 / Max 6.3
Adult Males
5.9 (N=4; SD=4.7)
Min 1.9 / Max 12.7
5.4 (N=4; SD=5.4)
Min 1.5 / Max 13.2
3.6 (N=3; SD=1.6) Min 1.9 / Max 5.2
6.5 (N=3; SD=6.0)
Min 1.5 / Max 13.2
SUB-ADULTS
8.5 (N=4; SD=5.0)
Min 4.1 / Max 14.2
5.7 (N=4; SD=3.5)
Min 3.2 / Max 10.7
12.7 (N=2; SD=2.1)
Min 11.2 / Max 14.2
8.1 (N=2; SD=3.7)
Min 5.5 / Max 10.7
Sub-Adult Females
12.7 (N=2; SD=2.1)
Min 11.2 / Max 14.2
8.1 (N=2; SD=3.7)
Min 5.5 / Max 10.7
12.7 (N=2; SD=2.1)
Min 11.2 / Max 14.2
8.1 (N=2; SD=3.7)
Min 5.5 / Max 10.7
Sub-Adult Males
4.3 (N=2; SD=0.3) Min 4.1 / Max 4.6
3.3 (N=2; SD=0.2) Min 3.2 / Max 3.4
0 (N=0)
0 (N=0)

85
3.3.1.2 Maximum Distance Moved (MDM)
The Maximum Distance Moved (MDM) within the home ranges calculated for each of the 19
tapirs radio-tracked in Morro do Diabo varied from 1,595-6,112 m (Table 3.5). The mean MDM
was 3,233 m. The mean MDM for females was 3,032 m and for males 3,667 m. The mean
MDM for adult tapirs was 2,949 m and for sub-adults 4,294 m. There were no differences in
MDM between the sexes (t=-0.939; DF=17; P=0.361), nor between different age classes (t=-
1.867; DF=17; P=0.079).

86
Table 3.5. Maximum Distance Moved (m) by 19 lowland tapirs radio-tracked in four different sections (West Border, Southeast Border, Northwest Border, and Centre) of Morro do Diabo State Park (MDSP), São Paulo, Brazil. The home range size (MCP95%, km²), number of locations, and number of months of radio-tracking are shown for each tapir. Mean MDM for all tapirs, both sexes, and different age classes are provided. (N=number of tapirs; *Minimum; **Maximum).
Individual
Sex
Age Class
Area MDSP
MCP95% (km²)
MDM (m)
Telemetry Locations (number)
Period of Radio-Tracking
(months)
Timeframe of Radio-Tracking
JOANA Female Adult West Border 6.2 3,314 903 36 Long-term PAULETE Female Adult West Border 6.3 3,226 439 33 Long-term CHU-CHU Female Sub-Adult West Border 10.7 6,112** 294 35 Long-term PATRICIA Female Sub-Adult West Border 5.5 3,818 184 30 Long-term DOCINHO Female Adult Southeast Border 1.9 2,135 74 22 Long-term JAMES BOND Male Adult Southeast Border 1.5 1,691 292 29 Long-term GEORGETE Female Adult Southeast Border 1.0 1,613 205 25 Long-term CHICO Male Adult Centre 13.2 5,740 440 28 Long-term JULIA Female Adult Centre 2.3 3,496 60 12 Long-term CIDAO Male Adult Centre 4.8 5,010 28 8 Long-term TONHA Female Adult Centre 2.2 2,704 535 33 Long-term TINA Female Adult Centre 2.1 1,807 451 27 Long-term MAMA Female Adult Centre 1.6 1,595* 234 18 Long-term ESPERTA Female Adult Northwest Border 1.5 2,196 105 22 Long-term LUIZINHO Male Sub-Adult West Border 3.4 3,017 37 3 Short-term XUXA Female Adult West Border 4.9 4,346 71 3 Short-term JOAO Male Sub-Adult West Border 3.2 4,231 26 2 Short-term BABY Female Adult Centre 3.5 3,055 40 4 Short-term DEDINHO Male Adult Northwest Border 2.0 2,314 10 2 Short-term
Mean MDM (N=19) 3,233
Mean MDM Females (N=13) 3,032 Mean MDM Males (N=6) 3,667 Mean MDM Adults (N=15) 2,949 Mean MDM Sub-Adults (N=4) 4,294

87
3.3.1.3 Size of Core Areas of Use
The size of core areas of use varied widely among the 19 tapirs radio-tracked in Morro do
Diabo (Table 3.6). Core areas of use varied from 0.1-2.5 km² when estimated using KDE50%,
with an average of 0.83 km². Core areas of use calculated at the 25% level varied from 0.03-
0.9 km², with an average of 0.3 km² (Tables 3.6 and 3.7). The number of separate core units
(kernels) within the home range of tapirs varied from 1-17 units at the 50% level, and from 1-
9 units at the 25% level.
The mean core area of use for females was 0.8 km² at the 50% level, and 0.3 km² at the
25% level. For males, the mean core area of use at the 50% level was 0.9 km², and 0.3 km²
at the 25% level (Table 3.7). There were no differences in size of core areas of use between
the sexes, either at the 50% (T=72.000; N=6-13; P=0.313) or 25% level (T=71.000; N=6-
13; P=0.357).
The mean core area of use for adults was 0.6 km² at the 50% level, and 0.2 km² at the 25%
level. For sub-adults, the mean core area of use at the 50% level was 1.5 km², and 0.5 km²
at the 25% level (Table 3.7). There was no difference in size of core areas of use between
different age classes at the 50% level (T=60.000; N=4-15; P=0.051). However, sub-adult
tapirs had significantly larger 25% core area of use than adults (T=61.000; N=4-15;
P=0.040).

88
Table 3.6. Size of core areas of use (KDE50% and KDE25%, km²) of 19 lowland tapirs radio-tracked in four different sections (West Border, Southeast Border, Northwest Border, and Centre) of Morro do Diabo State Park (MDSP), São Paulo, Brazil. Fourteen tapirs were radio-tracked from 8-36 months (long-term). Five tapirs were radio-tracked from 2-4 months (short-term). The home range size (KDE95%, km²) is shown for each tapir. (*Minimum; **Maximum; Value in () is the number of separate core units within the home range of each tapir).
Individual
Sex
Age Class
Area MDSP
KDE95% (km²)
KDE50% (km²)
KDE25% (km²)
Timeframe of Radio-Tracking
JOANA Female Adult West Border 4.4 0.8 (17) 0.2 (9) Long-term PAULETE Female Adult West Border 4.2 0.6 (10) 0.1 (4) Long-term CHU-CHU Female Sub-Adult West Border 14.2 2.5 (2)** 0.7 (1) Long-term PATRICIA Female Sub-Adult West Border 11.2 2.4 (2) 0.9 (2)** Long-term DOCINHO Female Adult Southeast Border 3.1 0.4 (2) 0.2 (3) Long-term JAMES BOND Male Adult Southeast Border 1.9 0.3 (2) 0.1 (3) Long-term GEORGETE Female Adult Southeast Border 2.0 0.2 (1) 0.1 (1) Long-term CHICO Male Adult Centre 5.2 0.8 (14) 0.2 (8) Long-term JULIA Female Adult Centre 7.4 1.6 (2) 0.6 (1) Long-term CIDAO Male Adult Centre 3.8 0.7 (4) 0.2 (4) Long-term TONHA Female Adult Centre 3.1 0.3 (1) 0.1 (1) Long-term TINA Female Adult Centre 2.0 0.4 (8) 0.1 (9) Long-term MAMA Female Adult Centre 1.9 0.3 (9) 0.1 (6) Long-term ESPERTA Female Adult Northwest Border 1.1 0.2 (11) 0.05 (5) Long-term LUIZINHO Male Sub-Adult West Border 4.6 0.6 (2) 0.2 (1) Short-term XUXA Female Adult West Border 5.1 0.4 (2) 0.2 (1) Short-term JOAO Male Sub-Adult West Border 4.1 0.7 (4) 0.2 (2) Short-term DEDINHO Male Adult Northwest Border 1.5 2.4 (1) 0.9 (1) Short-term BABY Female Adult Centre 12.7 0.1 (3)* 0.03 (1)* Short-term

89
Table 3.7. Mean core areas of use (KDE50% and KDE25%, km²) of lowland tapirs in Morro do Diabo State Park (MDSP), São Paulo, Brazil. Mean core areas of use for both sexes and different age classes are shown. (N=number of tapirs; SD=standard deviation; Min=Minimum; Max=Maximum).
KDE50%
(km²) KDE25%
(km²)
ALL INDIVIDUALS
0.8 (N=19; SD=0.9) Min 0.1 / Max 2.5
0.3 (N=19; SD=0.3) Min 0.03 / Max 0.9
FEMALES
0.8 (N=13; SD=0.8) Min 0.1 / Max 2.5
0.3 (N=13; SD=0.3) Min 0.03 / Max 0.9
MALES
0.9 (N=6; SD=0.7) Min 0.3 / Max 2.4
0.3 (N=6; SD=0.3) Min 0.1 / Max 0.9
ADULTS
0.6 (N=15; SD=0.6) Min 0.1 / Max 2.4
0.2 (N=15 ;SD=0.2) Min 0.03 / Max 0.9
Adult Females
0.5 (N=11; SD=0.4) Min 0.1 / Max 1.6
0.1 (N=11; SD=0.1) Min 0.03 / Max 0.6
Adult Males
1.0 (N=4; SD=0.9) Min 0.3 / Max 2.4
0.3 (N=4; SD=0.4) Min 0.1 / Max 0.9
SUB-ADULTS
1.5 (N=4; SD=1.1) Min 0.6 / Max 2.5
0.5 (N=4; SD=0.4) Min 0.2 / Max 0.9
Sub-Adult Females
2.5 (N=2; SD=0.02) Min 2.4 / Max 2.5
0.8 (N=2; SD=0.1) Min 0.7 / Max 0.9
Sub-Adult Males
0.6 (N=2; SD=0.1) Min 0.6 / Max 0.7
0.2 (N=2; SD=0.02) Min 0.2 / Max 0.2

90
3.3.1.4 Seasonal Home Range and Core Areas of Use
The wet season home range of tapirs was an average of 2.5 km², varied from 0.3-7.1 km². In
the dry season, the home range of tapirs was an average of 2.6 km², varied from 0.4-16.7
km² (Table 3.8 and 3.9). There was no difference between tapir home range in wet and dry
seasons (T=627.500; N=24-25; P=0.589). The overlap between tapir home range in wet and
dry seasons varied from 19-98%, with an average of 69%.
There were no differences in size of seasonal home ranges between the sexes in either wet
(t=-1.712; DF=22; P=0.101) or dry seasons (T=60.000; N=4-21; P=0.578). Likewise, there
was no difference in size of seasonal home range between adult and sub-adult tapirs in the
dry season (T=70.000; N=4-21; P=0.195). However, the wet season home range of sub-adult
tapirs was significantly larger than adults (t=-2.472; DF=22; P=0.022).
The core area used by tapirs in the wet season was 0.4 km² at the 50% level, and 0.1 km² at
the 25% level. The core areas used by tapirs in the dry season were exactly the same (Table
3.9). There were no differences between the core areas used by tapirs in wet and dry seasons
either at the 50% (T=620.500; N=24-25; P=0.689) or 25% levels (T=620.000; N=24-25;
P=0.697).
There were no differences in seasonal core areas of use at the 50% level between the sexes
in either wet (t=-1.385; DF=22; P=0.180) or dry seasons (T=56.500; N=4-21; P=0.767).
Likewise, there were no differences in seasonal core areas of use at the 25% level between
the sexes tapirs in either wet (t=-1.201; DF=22; P=0.210) or dry seasons (T=52.500; N=4-
21; P=1.000). There was no difference in seasonal core area of use at the 50% level between
age classes in the dry season (T=71.000; N=4-21; P=0.170). However, the core area of use
at the 50% level of sub-adult tapirs in the wet season was significantly larger than adults (t=-
2.552; DF=22; P=0.018). Lastly, there were no differences in seasonal core area of use at the
25% level between age classes in either wet (T=68.000; N=4-18; P=0.067) or dry seasons
(T=72.500; N=4-21; P=0.138).

91
Table 3.8. Home range (KDE95%, km²) and core areas (KDE50% and KDE25%, km²) in wet and dry seasons for 14 tapirs radio-tracked from 8-36 months in Morro do Diabo State Park (MDSP), São Paulo, Brazil. (F=female; M=male; A=adult; SA=sub-adult; *Minimum; **Maximum).
Individual Tapir (Age Class; Sex) Area MDSP
Season/Year (Wet/Dry-Year)
Home Range
Core Area
KDE95% (km²)
KDE50% (km²)
KDE25% (km²)
JOANA (A;F) West Border
Wet Season-1997-1998 2.9 0.4 0.1 Wet Season-1998-1999 2.5 0.5 0.1 Wet Season-1999-2000 1.8 0.2 0.03 Dry Season-1998 3.2 0.6 0.2 Dry Season-1999 0.4* 0.05 0.01*
PAULETE (A;F) West Border
Wet Season-1998-1999 4.1 0.8 0.2 Wet Season-1999-2000 0.5 0.04* 0.01* Dry Season-1998 2.6 0.5 0.1 Dry Season-1999 3.4 0.7 0.3 Dry Season-2000 0.5 0.03* 0.01*
CHU-CHU (SA;F) West Border
Wet Season-1998-1999 4.2 0.7 0.2 Wet Season-1999-2000 5.1 1.2 0.4** Wet Season-2000-2001 7.1** 1.2** 0.4 Dry Season-1999 0.6 0.1 0.02 Dry Season-2000 16.7** 2.3** 0.7**
PATRICIA (SA;F) West Border
Wet Season-2000-2001 1.8 0.3 0.1 Wet Season-2001-2002 3.0 0.4 0.1 Dry Season-2001 2.8 0.5 0.2 Dry Season-2002 6.5 1.6 0.6
DOCINHO (A;F) Southeast Border
Wet Season-1998-1999 0.9 0.2 0.1 Dry Season-1998 3.1 0.5 0.2 Dry Season-1999 1.4 0.3 0.1
JAMES BOND (A;M) Southeast Border
Wet Season-2001-2002 1.5 0.3 0.1 Wet Season-2002-2003 2.4 0.3 0.1 Dry Season-2001 0.7 0.1 0.03 Dry Season-2002 1.8 0.2 0.05
GEORGETE (A;F) Southeast Border
Wet Season-2001-2002 1.0 0.2 0.04 Dry Season-2001 2.2 0.3 0.1 Dry Season-2002 0.8 0.1 0.1
CHICO (A;M) Centre
Wet Season-2003-2004 5.7 0.9 0.3 Wet Season-2004-2005 6.3 1.0 0.3 Dry Season-2004 3.2 0.6 0.2
JULIA (A;F) Centre Wet Season-2003-2004 0.7 0.1 0.03 CIDAO (A;M) Centre Dry Season-2004 3.4 0.6 0.2
TONHA (A;F) Centre
Wet Season-2004-2005 1.4 0.2 0.1 Wet Season-2005-2006 0.6 0.1 0.04 Dry Season-2004 1.5 0.3 0.1 Dry Season-2005 0.8 0.1 0.04 Dry Season-2006 1.2 0.2 0.1

92
TINA (A;F) Centre
Wet Season-2004-2005 2.1 0.4 0.1 Wet Season-2005-2006 1.8 0.3 0.1 Dry Season-2004 1.8 0.3 0.1 Dry Season-2005 1.6 0.3 0.1
MAMA (A;F) Centre
Wet Season-2004-2005 1.9 0.2 0.1 Dry Season-2004 1.8 0.3 0.1 Dry Season-2005 1.6 0.3 0.1
ESPERTA (A;F) Northwest Border
Wet Season-2002-2003 1.2 0.2 0.1 Wet Season-2003-2004 0.3* 0.1 0.02 Dry Season-2003 0.7 0.1 0.03

93
Table 3.9. Mean lowland tapir home range (KDE95%, km²) and core areas of use (KDE50% and KDE25%, km²) in wet and dry seasons in Morro do Diabo State Park (MDSP), São Paulo, Brazil. Mean seasonal home range size and core areas of use are shown for both sexes and different age classes. (N=number of wet/dry seasons considered for estimates; SD=standard deviation; Min=Minimum; Max=Maximum).
Wet Season
Dry Season
KDE95% (km²)
KDE50% (km²)
KDE25% (km²)
KDE95% (km²)
KDE50% (km²)
KDE25% (km²)
ALL INDIVIDUALS
2.5 N=48; SD=1.9
Min 0.3 Max 7.1
0.4 N=48; SD=0.3
Min 0.04 Max 1.2
0.1 N=48; SD=0.1
Min 0.01 Max 0.4
2.6 N=50; SD=3.2
Min 0.4 Max 16.7
0.4 N=50; SD=0.5
Min 0.03 Max 2.3
0.1 N=50; SD=0.2
Min 0.01 Max 0.7
Females
2.2 N=20; SD=1.7
Min 0.3 Max 7.1
0.4 N=20; SD=0.3
Min 0.04 Max 1.2
0.1 N=20; SD=0.1
Min 0.01 Max 0.4
2.6 N=21; SD=3.5
Min 0.4 Max 16.7
0.4 N=21; SD=0.5
Min 0.03 Max 2.3
0.1 N=21; SD=0.2
Min 0.01 Max 0.7
Males
4.0 N=4; SD=2.4
Min 1.5 Max 6.3
0.6 N=4; SD=0.4
Min 0.3 Max 1.0
0.2 N=4; SD=0.1
Min 0.1 Max 0.3
2.3 N=4; SD=1.3
Min 0.7 Max 3.4
0.4 N=4; SD=0.3
Min 0.1 Max 0.6
0.1 N=4; SD=0.1 Min 0.03 Max 0.2
Adults
2.1 N=19; SD=1.7
Min 0.3 Max 6.3
0.3 N=19; SD=0.3
Min 0.04 Max 1.0
0.1 N=19; SD=0.1
Min 0.01 Max 0.3
1.8 N=21; SD=1.0
Min 0.4 Max 3.4
0.3 N=21; SD=0.2
Min 0.03 Max 0.7
0.1 N=21; SD=0.1
Min 0.01 Max 0.3
Sub-Adults
4.2 N=5; SD=2.0
Min 1.8 Max 7.1
0.7 N=5; SD=0.4
Min 0.3 Max 1.2
0.2 N=5; SD=0.2
Min 0.1 Max 0.4
6.6 N=4; SD=7.2
Min 0.6 Max 16.7
1.1 N=4; SD=1.0
Min 0.1 Max 2.3
0.4 N=4; SD=0.3 Min 0.02 Max 0.7

94
3.3.1.5 Determination of Home Range Size over Time
The annual areas of use calculated for 12 tapirs radio-tracked for over 18 months varied from
0.4-8.2 km², with an average of 2.5 km² (Tables 3.10 and 3.11). The home ranges of seven
adult tapirs included in this analysis (Paulete, Tonha, Tina, Mama, James Bond, Georgete, and
Esperta) reached an asymptote during the second year of data collection (Table 3.12). In
contrast, the home ranges of the other five tapirs (3 adults: Joana, Chico, and Docinho; 2
sub-adults: Chu-Chu and Patrícia) only reached an asymptote during the third year of data
collection.
In order to determine the minimum number of months of radio-tracking and the minimum
number of locations needed to estimate the full extent of the home range size of tapirs, I
plotted the cumulative size of monthly areas of use over time for six of the seven adult tapirs
for which their home ranges reached asymptotes over periods of two years. The home ranges
of these six tapirs reached asymptotes at an average of 16 months of radio-tracking (varied
from 7-28 months) and 201 radio-telemetry locations (varied from 63-496) (Figure 3.4). When
including the estimates of 36 months of radio-tracking of adult female Joana and adult male
Chico in this analysis, the minimum number of months to reach an asymptote rises to 20 and
the minimum number of locations rises to 319.

95
Table 3.10. Annual areas of use (KDE95%, km²) of 12 tapirs radio-tracked for over 18 months in Morro do Diabo State Park, São Paulo, Brazil. The period of radio-tracking and number of locations are shown for each tapir. (F=female; M=male; A=adult; SA=sub-adult; *Minimum; **Maximum).
Individual Tapir (Age Class; Sex)
(Period of data collection) Period
(month, year)
Period of Radio-Tracking
(months)
Telemetry Locations (number)
Annual Area KDE95%
(km²)
JOANA (A;F) (36 months)
Jul1997-Jun1998 12 573 3.4 Jul1998-Jun1999 12 249 2.2 Jul1999-Jun2000 12 81 1.0
PAULETE (A;F) (33 months)
Feb1998-Jan1999 12 263 5.0 Feb1999-Jan2000 12 112 2.3
CHU-CHU (SA;F) (35 months)
Aug1998-Jul1999 12 91 2.3 Aug1999-Jul2000 12 101 8.2** Aug2000-Jun2001 11 102 6.0
PATRICIA (SA;F) (30 months)
Aug2000-Jul2001 12 83 0.7 Aug2001-Jul2002 12 59 3.1
CHICO (A;M) (28 months)
Jun2003-May2004 12 217 2.7 Jun2004-May2005 12 119 4.3
TONHA (A;F) (33 months)
Apr2004-Mar2005 12 154 2.1 Apr2005-Mar2006 12 253 0.9
TINA (A;F) (27 months)
May2004-Apr2005 12 118 3.5 May2005-Apr2006 12 261 1.8
MAMA (A;F) (18 months) May2004-Apr2005 12 130 2.1
DOCINHO (A;F) (22 months)
Feb1998-Jan1999 12 23 0.6 Feb1999-Nov1999 10 51 3.1
JAMES BOND (A;M) (29 months)
Feb2001-Jan2002 12 111 1.0 Feb2002-Jan2003 12 113 1.5
GEORGETE (A;F) (25 months)
Feb2001-Jan2002 12 109 2.2 Feb2002-Jan2003 12 80 0.7
ESPERTA (A;F) (22 months)
Jun2002-May2003 12 44 1.0 Jun2003-Feb2004 10 61 0.4*
Table 3.11. Mean annual areas of use (KDE95%, km²) of 12 tapirs radio-tracked for over 18 months in Morro do Diabo State Park, São Paulo, Brazil. Separate results for both sexes and different age classes are shown. (N=number of periods of 10-12 months considered as an annual sample; SD=standard deviation; Min=Minimum; Max=Maximum).
Annual Area KDE95%
(km²)
ALL INDIVIDUALS 2.5
(N=25; SD=1.9; Min 0.4; Max 8.2)
Females 2.5
(N=21; SD=1.9; Min 0.4; Max 8.2)
Males 2.4
(N=4; SD=1.5; Min 1.0; Max 4.3)
Adults 2.1
(N=20; SD=1.3; Min 0.4; Max 5.0)
Sub-Adults 4.1
(N=5; SD=3.0; Min 0.7; Max 8.2)

96
Table 3.12. Cumulative areas of use (KDE95%, km²) for consecutive years of radio-tracking of the same tapir, overlap of areas of use between consecutive years, and gradual increase in estimate of home range size over time for 12 tapirs radio-tracked in Morro do Diabo State Park, São Paulo, Brazil. (F=female; M=male; A=adult; SA=sub-adult; *Area of use in the 1st year; **Increase in HR estimate in the 2nd year; ***Increase in HR estimate in the 3rd year)
Individual Tapir (Age Class; Sex) (Period of data collection)
Period (month, year)
Period of Radio-
Tracking (months)
Cumulative Area of Use
(km²) Overlap (km²)
Increase in Estimate of
Home Range Size
(km²)
JOANA (A;F) (36 months)
Jul1997-Jun1998 12 3.4*
0.8 1.3** Jul1998-Jun1999 12 2.2 Jul1997-Jun1999 24 4.7
0.7 0.3*** Jul1999-Jun2000 12 1.0
PAULETE (A;F) (33 months)
Feb1998-Jan1999 12 5.0*
2.2 0.1** Feb1999-Jan2000 12 2.3 Feb1998-Jan2000 24 5.2
0.6 0.0*** Feb2000-Oct2000 9 0.6 CHU-CHU (SA;F) (35 months)
Aug1998-Jul1999 12 2.3*
1.9 6.3** Aug1999-Jul2000 12 8.2 Aug1998-Jul2000 24 8.6
3.6 2.4*** Aug2000-Jun2001 11 6.0 PATRICIA (SA;F) (30 months)
Aug2000-Jul2001 12 0.7*
0.4 2.7** Aug2001-Jul2002 12 3.1 Aug2000-Jul2002 24 3.4
2.8 3.0*** Aug2002-Jan2003 6 5.8 CHICO (A;M) (28 months)
Jun2003-May2004 12 2.7*
1.5 2.8** Jun2004-May2005 12 4.3 Jun2003-May2005 24 5.4
2.5 0.9*** Jun2005-Sep2005 4 3.4 TONHA (A;F) (33 months)
Apr2004-Mar2005 12 2.1*
0.8 0.1** Apr2005-Mar2006 12 0.9 Apr2004-Mar2006 24 2.2
1.1 0.1*** Apr2006-Dec2006 9 1.2
TINA (A;F) (27 months)
May2004-Apr2005 12 3.5*
1.7 0.1** May2005-Apr2006 12 1.8
MAMA (A;F) (18 months)
May2004-Apr2005 12 2.1*
1.3 0.2** May2005-Oct2005 6 1.5
DOCINHO (A;F) (22 months)
Feb1998-Jan1999 12 0.6*
0.5 2.5** Feb1999-Nov1999 10 3.1
JAMES BOND (A;M) (29 months)
Feb2001-Jan2002 12 1.5*
0.9 0.1** Feb2002-Jan2003 12 1.0
GEORGETE (A;F) (25 months)
Feb2001-Jan2002 12 2.2*
0.7 0.0** Feb2002-Jan2003 12 0.7
ESPERTA (A;F) (22 months)
Jun2002-May2003 12 1.0*
0.2 0.2** Jun2003-Feb2004 10 0.4

97
Esperta (A;F) - NORTHWEST BORDER22 Months
0
500
1 2 3 4 5 6 7 8 9 10 11 12 13 14 15 16 17 18 19 20 21
Number of Months
Ho
me
Ra
ng
e (
ha
)
Paulete (A;F) - WEST BORDER 33 Months
0
1000
1 3 5 7 9 11 13 15 17 19 21 23 25 27 29 31
Number of Months
Ho
me
Ra
ng
e (
ha
)
James (A;M) - SOUTHEAST BORDER 29 Months
0
500
1 3 5 7 9 11 13 15 17 19 21 23 25 27 29
Number of Months
Ho
me
Ra
ng
e (
ha
)
Georgete (A;F) - SOUTHEAST BORDER 25 Months
0
500
1 3 5 7 9 11 13 15 17 19 21 23
Number of MonthsH
om
e R
an
ge
(h
a)

98
Figure 3.4. Cumulative monthly areas of use (km²) of six lowland tapirs monitored for over 22 months in Morro do Diabo State Park, São Paulo, Brazil. Graphs indicate the point (month) where the home range of each tapir reached an asymptote. (A=adult; F=female; M=male).
Tonha (A;F) - CENTRE33 Months
0
500
1 3 5 7 9 11 13 15 17 19 21 23 25 27 29 31 33
Number of Months
Ho
me
Ra
ng
e (
ha
)
Tina (A;F) - CENTRE 27 Months
0
500
1 3 5 7 9 11 13 15 17 19 21 23 25
Number of Months
Ho
me
Ra
ng
e (
ha
)

99
3.3.1.6 Tapir Movements throughout the Fragmented Landscape of the Pontal do
Paranapanema Region
Initial capture efforts were focused in the borders of Morro do Diabo to investigate if tapirs left
the boundaries to feed on agricultural crops in the surroundings. All the radio-collared tapirs in
the western border spent much of their active/foraging time along the Ribeirão Bonito stream
and some left the boundaries of Morro do Diabo to explore the surrounding environments
(Chapter 5 includes complete results on tapir habitat use and habitat selection).
Two radio-collared female tapirs - adult Xuxa and sub-adult Chu-Chu - were captured in pitfall
traps placed ~500 m outside the western border of Morro do Diabo, in the middle of a small
field of pasture. Throughout their periods of monitoring, these two females used to cross the
agricultural and pastoral land landscape matrix outside Morro do Diabo to reach Ribeirão
Bonito, a 4.2 km² forest fragment located 1,500 m from the western edge of Morro do Diabo.
Tapirs only crossed the actual landscape matrix during evening and night hours. These visits
to the Ribeirão Bonito forest fragment were fairly frequent. Chu-Chu was radio-tracked for 35
months and visited the forest fragment on 18 different occasions during monitoring periods. A
total of 89 (30%) of the telemetry locations (N=294) obtained for Chu-Chu were in the area
of the Ribeirão Bonito fragment. Xuxa was radio-tracked for three months and visited the
fragment on three occasions. A total of eight (11%) of the telemetry locations (N=71)
obtained for Xuxa were in the area of the Ribeirão Bonito fragment. During these visits, tapirs
would usually stay in the forest fragment for periods from 1-8 days. However, from late
January 1999 to early June 1999, all locations obtained for Chu-Chu were in the area of the
forest fragment. The research team followed a sampling design and therefore did not monitor
radio-collared tapirs every day. Consequently, it was not possible to determine if this female
stayed in the fragment for the entire 4-month period.
Chu-Chu had the largest home range size of 14.2 km² (KDE95%) among all 19 radio-tracked
tapirs, and this can be easily explained by her regular excursions outside Morro do Diabo
(Figure 3.5.1). The home range size of Xuxa was 5.1 km² (KDE95%) but she was monitored
for only three months, so this most probably does not reflect her true home range size (Figure
3.5.2). The 50% core areas of use of Chu-Chu (2 core units, 2.5 km²) were located in
between the edges of Morro do Diabo and of the Ribeirão Bonito fragment, while her 25%
core area (1 core unit, 0.7 km²) was located on the edge of Morro do Diabo. Both the 50% (2
core units, 0.5 km²) and 25% (1 core unit, 0.2 km²) core areas of use of Xuxa were located
inside Morro do Diabo.
In the north western edge of Morro do Diabo, two tapirs (1 adult female and 1 adult male)
were monitored from January 2002 to March 2004. The female (Esperta) was monitored for

100
22 months, and the male (Dedinho) for only two months. Both these tapirs regularly left the
boundaries of Morro do Diabo to explore the surrounding sugar cane plantations for short
periods of time. Both tapirs were captured in pitfall traps built right outside the forest in the
immediate edge of Morro do Diabo. Although there were some small forest fragments of
2,200 m from that edge of Morro do Diabo, these two tapirs never visited those fragments
and their 50% and 25% core areas of use were located inside Morro do Diabo and away from
the border.
1
2
Figure 3.5. 1- Map of home range and core areas of use of sub-adult female Chu-Chu. 2- Map of home range and core areas of use of adult female Xuxa. (BLACK=KDE95%; RED=KDE50%; YELLOW=KDE25%). Maps show the western edge of Morro do Diabo State Park to the right and the Ribeirão Bonito forest fragment (4.2 km²) to the left. Figures 2.5 and 2.6 (Chapter 2) provide further reference on the location of Morro do Diabo State Park.
1 km

101
3.3.2 Intra-Specific Interactions
3.3.2.1 Home Range Overlap
The mean home range overlap calculated for 11 tapirs (8 females and 3 males, or 9 adults
and 2 sub-adults) monitored in the long-term in Morro do Diabo was 37%. The mean home
range overlap between the sexes was: 33.4% for pairs of females, 34.9% for pairs of female-
male, and 43.2% for pairs of males (Table 3.13). There was no difference in home range
overlap when comparing pairs of females, pairs of female-male, and pairs of males (H=1.473;
DF=2; P=0.479). The mean home range overlap between age classes was: 32.2% for pairs of
adults, 39% for pairs of sub-adults, and 37.2% for pairs of adult-sub-adult (Table 3.14).
There was no difference in home range overlap when comparing pairs of adults, pairs of sub-
adults, and pairs of adult-sub-adult (F=0.412; DF=2; P=0.665).
Table 3.13. Intra- and inter-sexual home range overlap (% and km²) in Morro do Diabo State Park, São Paulo, Brazil. (N=number of tapirs; F=female; M=male; Min=Minimum; Max=Maximum).
Female - Female (N=8 tapirs; 10 pairs)
Female - Male (N=14; 13 pairs; 9F & 5M)
Male - Male (N=2; 1 pair)
Overlap (%)
Overlap (km²)
Overlap (%)
Overlap (km²)
Overlap (%)
Overlap (km²)
33.4 Min 4.6 Max 82.1
2.0
34.9 Min 6.9 Max 92.3
1.5
43.2 Min 36.6 Max 49.8
1.9
Table 3.14. Intra- and inter-age home range overlap (% and km²) in Morro do Diabo State Park, São Paulo, Brazil. (N=number of tapirs; A=adult; SA=sub-adult; Min=Minimum; Max=Maximum).
Adult - Adult (N=11 tapirs; 14 pairs)
Sub-Adult - Sub-Adult (N=4; 4 pairs)
Adult - Sub-Adult (N=6; 6 pairs; 3A & 3SA)
Overlap (%)
Overlap (km²)
Overlap (%)
Overlap (km²)
Overlap (%)
Overlap (km²)
32.2 Min 4.6 Max 92.3
1.2
39.0 Min 9.2 Max 82.8
3.0
37.2 Min 14.4 Max 82.1
2.2
3.3.2.2 Overlap of Core Areas of Use
The mean overlap of core areas of use calculated for the same 11 tapirs was 19.5% at the
50% level, and 21.2% at the 25% level. The mean overlap of core areas between pairs of
females was 21.4% at the 50% level, and 23.1% at the 25% level. The mean overlap of core
areas between pairs of female-male was 18.9% at the 50% level, and 19.4% at the 25%
level. The mean overlap of core areas between pairs of males was 12.9% at the 50% level,
and there was no overlap at the 25% level (Table 3.15). There were no differences in overlap
of core areas of use between pairs of females, pairs of female-male, and pairs of males either

102
at the 50% (F=0.230; DF=2; P=0.797) or at the 25% level (t=0.286; DF=6; P=0.784). The
mean overlap of core areas between pairs of adults was 17.2% at the 50% level, and 24% at
the 25% level. The mean overlap of core areas between pairs of sub-adults was 32% at the
50% level, and there was no overlap at the 25% level. The mean overlap of core areas
between pairs of adult-sub-adult was 22.4% at the 50% level, and 13% at the 25% level
(Table 3.16). There were no differences in overlap of core areas of use between pairs of
adults, pairs of sub-adults, and pairs adult-sub-adult either at the 50% (F=0.826; DF=2;
P=0.453) or at the 25% level (t=0.760; DF=6; P=0.476) levels.
Table 3.15. Intra- and inter-sexual overlap of core areas of use (KDE50% and KDE25%, % and km²) in Morro do Diabo State Park, São Paulo, Brazil. (N=number of tapirs; F=female; M=male; Min=Minimum; Max=Maximum).
50% Female - Female
(N=6 tapirs) Female - Male (N=8; 5F & 3M)
Male - Male (N=2)
Overlap (%)
Overlap (km²)
Overlap (%)
Overlap (km²)
Overlap (%)
Overlap (km²)
21.4 Min 1.6 Max 45.1
0.3
18.9 Min 0.01 Max 52.2
0.1
12.9 Min 12.3 Max 13.5
0.1
25% Female - Female
(N=3 tapirs) Female - Male (N=4; 2F & 2M)
Male - Male (N=2)
Overlap (%)
Overlap (km²)
Overlap (%)
Overlap (km²)
Overlap (%)
Overlap (km²)
23.1 Min 6.0 Max 45.5
0.1
19.4 Min 2.8 Max 46.2
0.03
---
---
Table 3.16. Intra- and inter-age overlap of core areas of use (KDE50% and KDE25%, % and km²) in Morro do Diabo State Park, São Paulo, Brazil. (N=number of tapirs; A=adult; SA=sub-adult; Min=Minimum; Max=Maximum).
50% Adult - Adult (N=9 tapirs)
Sub-Adult - Sub-Adult (N=2)
Adult - Sub-Adult (N=3; 2A & 1SA)
Overlap (%)
Overlap (km²)
Overlap (%)
Overlap (km²)
Overlap (%)
Overlap (km²)
17.2 Min 0.01 Max 52.2
0.1
32.0 Min 31.7 Max 32.2
0.8
22.4 Min 5.6 Max 45.1
0.2
25% Adult - Adult (N=6 tapirs)
Sub-Adult - Sub-Adult (N=2)
Adult - Sub-Adult (N=2; 1A & 1SA)
Overlap (%)
Overlap (km²)
Overlap (%)
Overlap (km²)
Overlap (%)
Overlap (km²)
24.0 Min 2.8 Max 46.2
0.03
---
---
13.0 Min 6.0 Max 19.9
0.04

103
3.3.2.3 Social Organisation
Based on results of home range overlap and overlap of 50% and 25% core areas of use
between pairs of individual tapirs (Table 3.17), I examined possible relations among different
individual tapirs and made inferences about social organisation in three sections of Morro do
Diabo (western border, centre, and south eastern border). These inferences were made
without information on genetic relatedness among individuals.
In the western border of Morro do Diabo, three female tapirs, including two adults (Joana and
Paulete) and one sub-adult (Chu-Chu), exhibited extensive home range overlap amongst
themselves: 69% overlap between Joana and Chu-Chu, 66% overlap between Joana and
Paulete, and 49% overlap between Paulete and Chu-Chu. The core areas of use of adult
Joana and sub-adult Chu-Chu also overlapped extensively: 45% of overlap at the 50% level,
and 20% at the 25% level. Similarly, the core areas of use of Joana and Paulete overlapped:
29% at the 50% level, and 45% at the 25% level. The core areas of use of Paulete and Chu-
Chu presented an overlap of 25% at the 50% level, but there was no overlap at the 25%
level. These results indicate that the sub-adult female Chu-Chu could be a 1-3 year old
offspring of adult female Joana, who was staying together with her mother for a few years
before dispersing from the area to establish her own home-range.
Only two sub-adult males were radio-tracked in the western border (Luizinho and João) were
sub-adults, which limited opportunities to identify adult mating pairs in the area. In addition,
these two sub-adults were monitored for very short periods of time and not concurrently,
which limited the analysis of area overlap between them and the females in the area.
However, results of home range overlap between Luizinho and four females in the area,
including three adult females (Joana, Paulete, and Xuxa), and one sub-adult (Chu-Chu) show
that the most extensive home range overlap occurred between Luizinho and Joana (36%).
There was no overlap of core areas of use. Therefore, there is the possibility that Luizinho
could also be Joana’s offspring. There was also extensive home range overlap between Chu-
Chu and Luizinho (72%), which corroborates the indication that they could be both offspring
of Joana, still living in the vicinity of their mother’s home range prior to dispersal. Another
possibility is that Chu-Chu and Luizinho formed a young mating pair, in which case only one of
them would be Joana’s offspring, most probably Chu-Chu. Also in the western area of Morro
do Diabo, the home ranges of sub-adult male João and sub-adult female Patrícia, showed an
extensive home range overlap of 83%, which could indicate that they were either offspring of
the same adult female, or a young mating pair.
In the centre of Morro do Diabo, the home ranges of adult females Mama, Tina and Tonha,
were all monitored concurrently and over the long-term, and did not overlap. In fact, Tina’s

104
home range was actually 4 km from her capture site, to which she went back on only a few
occasions during the time of her monitoring. The most extensive home range overlap between
the sexes in this area of Morro do Diabo was 92%, between adult female Mama and adult
male Chico, followed by 55% between adult female Tonha and adult male Cidão. Mama and
Chico also presented extensive overlap of their core areas of use: 52% at the 50% level, and
46% at the 25% level. Tonha and Cidão showed an overlap of 51% at the 50% level, but a
much smaller overlap of 4% at the 25% level. Mama and Cidão, as well as Tonha e Chico
exhibited very little home range overlap. These results indicate that Mama and Chico, as well
as Tonha and Cidão might be reproductive pairs in that part of Morro do Diabo. Another
aspect that could corroborate this inference is that both Mama’s and Chico’s home ranges
overlapped with sub-adult Julia’s home range, which could be an indication that Julia might be
a previous offspring of Mama and Chico. Mama and Julia showed an extensive home range
overlap of 45%. Chico and Julia showed a home range overlap of 33%. Mama, Chico, and
Julia were all captured and radio-collared in the same wooden corral in the central area of
Morro do Diabo.
In the southeast border of Morro do Diabo, only one adult female - Georgete - and one adult
male - James Bond - were radio-tracked concurrently for long periods. The home ranges of
these two individuals showed an overlap of 45%, and their core areas of use showed 0.02%
of overlap at the 50% level. However, the percentage of home range overlap between these
two adult tapirs was not as high as the extent of overlap between males and females in the
centre of Morro do Diabo. Therefore, there is no strong evidence that Georgete and James
Bond formed a reproductive pair, although the possibility cannot be discarded.

105
Table 3.17. Home range overlap (HR; KDE95%, % and km²) and overlap of core areas of use (CA; KDE50% and KDE25%, % and km²) between intra- and inter-sexual pairs of tapirs in different sections of Morro do Diabo State Park (MDSP), São Paulo, Brazil. (N=number of tapirs; F=female; M=male; A=adult; SA=sub-adult)
Female-Female
(N=8)
Area MDSP HR Overlap
KDE95% CA Overlap KDE50%
CA Overlap KDE25%
Timeframe of Radio-Tracking
% km² % km² % km² JOANA (A;F) X PAULETE (A;F)
West Border 61.8
2.7 21.7
0.2 21.0
0.05 Both radio-tracked in the long-term PAULETE (A;F) X JOANA (A;F) 65.6 29.5 45.5
JOANA (A;F) X CHU-CHU (SA;F) West Border
68.7 3.0
45.1 0.3
19.9 0.04
Both radio-tracked in the long-term CHU-CHU (SA;F) X JOANA (A;F) 21.3 13.7 6.0
PAULETE (A;F) X CHU-CHU (SA;F) West Border
49.3 2.0
25.0 0.1
---
--- Both radio-tracked in the long-term CHU-CHU (SA;F) X PAULETE (A;F) 14.4 5.6 ---
PATRICIA (SA;F) X CHU-CHU (SA;F) West Border
34.7 3.9
31.7 0.8
---
--- Both radio-tracked in the long-term CHU-CHU (SA;F) X PATRICIA (SA;F) 27.5 32.2 ---
JOANA (A;F) X XUXA (A;F) West Border
36.5 1.6
---
---
---
--- Xuxa (A;F) radio-tracked for only 3 months XUXA (A;F) X JOANA (A;F) 31.7 --- ---
PAULETE (A;F) X XUXA (A;F) West Border
11.7 0.5
---
---
---
--- Xuxa (A;F) radio-tracked for only 3 months XUXA (A;F) X PAULETE (A;F) 9.5 --- ---
CHU-CHU (SA;F) X XUXA (A;F) West Border
29.4 4.2
---
---
---
--- Xuxa (A;F) radio-tracked for only 3 months XUXA (A;F) X CHU-CHU (SA;F) 82.1 --- ---
JULIA (A;F) X MAMA (A;F) Centre
11.4 0.8
1.6 0.03
---
--- Both radio-tracked in the long-term MAMA (A;F) X JULIA (A;F) 45.2 7.6 ---
BABY (A;F) X MAMA (A;F) Centre
5.8 0.1
---
---
---
--- Baby (A;F) radio-tracked for only 4 months MAMA (A;F) X BABY (A;F) 4.6 --- ---
BABY (A;F) X JULIA (A;F) Centre
47.4 0.7
---
---
---
--- Baby (A;F) radio-tracked for only 4 months JULIA (A;F) X BABY (A;F) 9.5 --- ---
Male-Male
(N=2)
Area MDSP
HR Overlap
KDE95% CA Overlap KDE50%
CA Overlap KDE25%
Timeframe of Radio-Tracking
% km² % km² % km² CHICO (A;M) X CIDAO (A;M)
Centre 36.6
1.9 12.3
0.1
---
--- Both radio-tracked in the long-term CIDAO (A;M) X CHICO (A;M) 49.8 13.5 ---

106
Female-Male (N=14; 9F & 5M)
Area MDSP
HR Overlap
KDE95% CA Overlap KDE50%
CA Overlap KDE25%
Timeframe of Radio-Tracking
% km² % km² % km² LUIZINHO (SA;M) X JOANA (A;F)
West Border 34.0
1.6
---
---
---
--- Luizinho (SA;M) radio-tracked for only 3 months JOANA (A;F) X LUIZINHO (SA;M) 35.6 --- ---
LUIZINHO (SA;M) X PAULETE (A;F) West Border
21.1 1.0
---
---
---
--- Luizinho (SA;M) radio-tracked for only 3 months PAULETE (A;F) X LUIZINHO (SA;M) 23.4 --- ---
LUIZINHO (SA;M) X CHU-CHU (SA;F) West Border
72.5 3.3
---
---
---
--- Luizinho (SA;M) radio-tracked for only 3 months CHU-CHU (SA;F) X LUIZINHO (SA;M) 23.6 --- ---
LUIZINHO (SA;M) X XUXA (A;F) West Border
34.9 1.6
---
---
---
--- Luizinho (SA;M) radio-tracked for only 3 months XUXA (A;F) X LUIZINHO (SA;M) 31.8 --- ---
JOAO (SA;M) X PATRICIA (SA;F) West Border
82.8 3.4
---
---
---
--- Joao (SA;M) radio-tracked for only 2 months PATRICIA (SA;F) X JOAO (SA;M) 30.4 --- ---
JOAO (SA;M) X CHU-CHU (SA;F) West Border
31.5 1.3
---
---
---
--- Joao (SA;M) radio-tracked for only 2 months CHU-CHU (SA;F) X JOAO (SA;M) 9.2 --- ---
CHICO (A;M) X MAMA (A;F) Centre
33.2 1.7
23.1 0.2
24.2 0.05
Both radio-tracked in the long-term MAMA (A;F) X CHICO (A;M) 92.3 52.2 46.2
CHICO (A;M) X TONHA (A;F) Centre
22.5 1.2
9.1 0.1
---
--- Both radio-tracked in the long-term TONHA (A;F) X CHICO (A;M) 37.9 21.8 ---
CHICO (A;M) X JULIA (A;F) Centre
32.7 1.7
5.2 0.04
---
--- Both radio-tracked in the long-term JULIA (A;F) X CHICO (A;M) 22.9 2.5 ---
CIDAO (A;M) X TONHA (A;F) Centre
44.9 1.7
23.7 0.2
2.8 0.005
Both radio-tracked in the long-term TONHA (A;F) X CIDAO (A;M) 55.5 51.4 4.3
CIDAO (A;M) X MAMA (A;F) Centre
9.1 0.3
---
---
---
--- Both radio-tracked in the long-term MAMA (A;F) X CIDAO (A;M) 18.6 --- ---
CIDAO (A;M) X JULIA (A;F) Centre
13.4 0.5
---
---
---
--- Both radio-tracked in the long-term JULIA (A;F) X CIDAO (A;M) 6.9 --- ---
JAMES (A;M) X GEORGETE (A;F) Southeast Border
45.0 0.8
---
---
---
--- Both radio-tracked in the long-term GEORGETE (A;F) X JAMES (A;M) 40.4 --- ---

3.4 Discussion
3.4.1 Use of Radio-Telemetry for Studying Tapirs
Tapirs are mostly solitary, nocturnal, secretive animals, a combination of factors that makes it
extremely complicated to study them through direct observations. Thus, radio-telemetry has
been widely recognised as one of the most appropriate methodologies for the study of tapirs.
This study in the Atlantic Forests of Morro do Diabo in Brazil was the first to apply radio-
telemetry to monitor lowland tapirs over the long-term. This study included a large sample
size of 19 radio-tracked tapirs, most of which were monitored over the long-term. The radio-
telemetry data gathering techniques employed in this study, while relatively costly and labour-
intensive, resulted in very detailed and precise results on several parameters including tapir
ranging behaviour among others.
3.4.1.1 Tapir Capture and Chemical Restraint
One of the main limiting factors to using radio-telemetry for tapirs is placing radio-collars on
these highly elusive, nocturnal animals. This requires the capture and immobilisation of the
individuals. As a result of the more widespread use of radio-telemetry for tapir studies over
the last 15 years, the need for appropriate protocols for the capture and immobilisation of
free-ranging tapirs has arisen.
The capture of tapirs in Morro do Diabo went relatively smoothly once the team determined
that salt was the most appropriate bait and the optimal capture techniques for the area.
Pitfalls and wooden corrals were considered to be the most appropriate capture methods for
tapirs in Morro do Diabo. Both these traps had the main advantage that tapirs were physically
restrained and could be manipulated once inside the trap. This gave the team full control of
the recovery and release processes. Another advantage of these methods was that rapid
anaesthetic induction was not a concern when using pitfalls and corrals. Therefore, once the
animal was observed inside the trap, veterinarians had time to select anaesthetic agents that
were most appropriate for the situation. It was possible to estimate of the size of the animal
more precisely, and evaluate its behaviour and level of stress, all important factors to
determine the most appropriate anaesthetic protocol to be employed. While pitfall traps did
not require the use of bait, the success of this capture method was fully dependant on the
placement of the pitfall in frequently used tapir paths. In contrast, wooden corrals depended
heavily on the use of bait and on tapirs becoming comfortable to going inside the trap to lick
the salt, a very long process that sometimes took more than a year before these traps were
ready for captures.

108
In terms of anaesthetic protocols, 44 tapir immobilisations and manipulations were carried out
during this long-term study in Morro do Diabo, and the chemical restraint of tapirs proved to
be quite challenging. All these tapir manipulations were different from one another given that
the anaesthetic agents applied appeared to have different effects on different individual tapirs.
As a consequence, the research team was under no circumstances able to determine a clear
pattern of tapir cardiac and respiratory rates during anaesthesia. Possible explanations for this
include the different metabolisms of different individuals, the amount of time spent inside the
trap before manipulation, the time since last food consumption, and temperature among other
factors (P.R. Mangini, personal communication). The respiratory rate, type and amplitude are
the most important parameters to monitor anaesthetic depression and identify emergencies.
The most common emergencies during tapir immobilisations include hypothermia,
hyperthermia, bradicardia and apnoea (Medici et al. 2007b). Tapirs are capable of going into
long periods of physiological apnoea while swimming, therefore short periods of apnoea
during chemical restraint tend to be less compromising for the species. However, the
veterinarian responsible for a tapir immobilisation must be capable of noticing an apnoea and
rapidly taking the necessary measures.
The data on tapir anaesthesia monitoring during immobilisations in Morro do Diabo was
constantly evaluated and anaesthetic protocols adjusted accordingly in order to guarantee the
well being of the animals under anaesthesia, as well as the safety of the members of the
research team. All tapir captures and immobilisations were carried out in the presence of at
least one veterinarian specialised in wildlife medicine, who through this project had acquired
many years of experience with the immobilisation and handling of free-ranging lowland tapirs.
Capture stress and emergencies are intrinsic risks of the handling of wild animals. However,
well-planned capture procedures and the participation of a well-prepared veterinarian can
significantly reduce these risks.
3.4.1.2 Timeframe of Telemetry Monitoring for Tapir Studies
Another limiting factor to applying radio-telemetry and obtaining precise estimates of
parameters of tapir ranging behaviour, particularly home range size, is the timeframe of
monitoring. Tapirs are wide-ranging species with large spatial requirements. Thus, telemetry
studies on tapirs must be planned for and carried out over the long-term.
The tapir telemetry data gathered during this study have shown that a minimum of ~300
locations and 20 months of data collection are necessary to determine home range size for
adult lowland tapirs, while for sub-adults, a minimum of 32 months is needed. This
information is particularly valuable for the sampling design and budgeting of future telemetry
studies on tapirs. Indeed, this information has already been extremely helpful for the design

109
of the Lowland Tapir Research and Conservation Programme established in the Brazilian
Pantanal in early 2008. In the Pantanal, I am using GPS telemetry to study tapirs. Based on
data from Morro do Diabo, I have programmed the GPS units according to a schedule of fixes
that will make their batteries last for 20 months. For the sub-adults in the Pantanal, I will need
to recapture them after 20 months of data collection and replace their collars in order to
monitor them for 20 more months.
3.4.2 Methodological Considerations on the Estimate of Tapir Home
Range Size
Both Kernel Density Estimator (KDE95%) and Minimum Convex Polygon (MCP95%) were used
to estimate tapir home range size in Morro do Diabo. While KDE is widely recognised as the
most reliable method to estimate home range (Powell 2000; Kernohan et al. 2001; Hemson et
al. 2005), I did not observe significant differences between tapir home range sizes estimated
by KDE and MCP. Tobler (2008) also compared lowland tapir home range estimates obtained
by KDE and MCP and observed that the two estimators were very similar. Nevertheless, KDE
estimates have the further advantage of providing further descriptions of the internal structure
of the home range, allowing for the identification of core areas of use (Hooge et al. 2001).
3.4.3 Spatial Ecology of Tapirs in Morro do Diabo State Park
3.4.3.1 Home Range Size
The estimates of lowland tapir home range size reported in the literature vary widely (Chapter
2, Table 2.6). This variation can be explained by differences in environments and habitat types
studied, as well as by different levels of habitat conservation, in turn reflecting different
carrying capacities in different habitats found within the species distribution range (Eisenberg
1997; Medici et al. 2007a). The variation can also be attributed to different methods of
estimating used, the timeframe of monitoring, and the number of individuals monitored. At
any rate, tapirs are large-bodied, wide-ranging mammals that usually require very large home
ranges (Williams 1978; Williams 1984; Foerster 1998; Herrera et al. 1999; Foerster &
Vaughan 2002; Noss et al. 2003; Ayala 2003; Lizcano & Cavelier 2004; Tobler 2008; Abdul
Ghani 2009; Naranjo 2009). This long-term lowland tapir study in Morro do Diabo further
supports these findings.
The sizes of the individual tapir home ranges in Morro do Diabo varied from 1.1-14.2 km²,
resulting in an overall mean home range size of 4.7 km² (Group 2, 14 tapirs radio-tracked
from 8-36 months). Thus, the home range size of tapirs in Morro do Diabo was found to be
much larger than in other areas where the species was previously studied. In Kaa-Iya del Gran

110
Chaco National Park, Bolivia, a telemetry study showed a mean home range size of 2.5 km²
(Noss et al. 2003). In Los Amigos Research Station in the Peruvian Amazon lowland tapirs
used a mean home range of 2.6 km² (Tobler 2008). Only two other telemetry studies have
observed larger lowland tapir home ranges than in Morro do Diabo. Tarcísio Silva Jr. (1997,
unpublished results) obtained a home range of ~39 km² in Brasília National Park, Brazil, while
Herrera et al. (1999) showed a home range of 16.4 km² in the Amazonian forests of the Lago
Caiman Noel Kempff Mercado National Park, Bolivia. However, both these studies relied on
very small sample sizes, involving the radio-tracking of only one individual tapir each, and
were based on very few locations (20 and 10, respectively).
The large tapir home range sizes in the Atlantic Forests of Morro do Diabo might be explained
by one or more factors. First, it might be associated with the extensive forest fragmentation in
the Pontal do Paranapanema Region. Both Kaa-Iya del Gran Chaco National Park (34,400
km²) in Bolivia, as well as Los Amigos (1,400 km²) in Peru, consist of expanses of contiguous
habitat. In contrast, Morro do Diabo is a relatively small forest fragment of no more than 370
km² immersed in a landscape matrix of agricultural and pastoral land. Forest reduction and
fragmentation are generally accompanied by loss of habitat diversity, which in turn affects
resource diversity and availability (Wright & Duber 2001; Tabarelli et al. 2004). There is
growing evidence that the availability of fruit in forest fragments is lower when compared to
continuous tracts of tropical forest (Terborgh 1986; Terborgh 1992). A suite of resource-
related factors specific to different habitat types, such as spatial distribution of fruit sources,
total fruit availability, seasonal fruit availability, and severity of fruit scarcity periods, will affect
habitat use, spatial requirements, and ultimately the persistence of frugivore populations in
habitat fragments (Keuroghlian & Eaton 2008). Although recent, the process of destruction
and fragmentation of the Atlantic Forest of the Interior in the Pontal do Paranapanema Region
have most certainly led to a reduction in the habitat diversity of Morro do Diabo. In addition,
before its establishment as a protected area in 1986, Morro do Diabo had already suffered
from severe processes of habitat degradation. These included the construction of both a
railway and a highway that crossed Morro do Diabo, causing the clearing of several patches of
forest within the area of Morro do Diabo for the extraction of timber, selective logging of
valuable hard woods, and several major fire events (Faria & Pires 2006). The combination of
all these factors has most certainly caused a reduction in the carrying capacity of Morro do
Diabo.
A second factor may be the very heterogeneous, semi-deciduous habitats of Morro do Diabo.
In these habitats, primary production is lower and more erratic than in more moist forests
(Cullen et al. 2001a). Habitat heterogeneity results in different fruiting periods for different
plant species (Durigan & Franco 2006). Lowland tapirs feed accordingly to the availability and
abundance of food resources (Bodmer 1990a; Salas 1996). Therefore tapirs in Morro do Diabo

111
need their home ranges to include large expanses of forest so that they can fulfil their
nutritional requirements. In addition, the availability of water in semi-deciduous habitats is
very low (Cullen et al. 2001a). Some areas of Morro do Diabo are extremely poor in water
resources. With the exception of the Paranapanema River, which is a large, wide river, the
other water courses in Morro do Diabo are small streams that during extreme dry seasons
have their levels of water considerably reduced. Therefore, tapirs in Morro do Diabo need their
home ranges to be large enough to include a permanent source of water.
The third factor is methodological. It is directly related to the timeframe of monitoring and
sample size of the study in Morro do Diabo. A large number of different individual tapirs were
monitored over the long-term. Therefore, the home range estimates obtained in Morro do
Diabo may have been more precise relative to other studies. Some of the previous estimates
of lowland tapir home range size were obtained from small datasets collected from just a few
individuals monitored in the short-term. Tobler (2008) noted that due to the short duration of
many of his lowland tapir datasets from the Peruvian Amazon, his home range size estimates
were likely underestimated for some individuals.
Although there were no significant differences in home range size between the sexes, male
tapirs in Morro do Diabo tended to have larger home ranges than females. This may be
related to aspects of social organisation and mating system. Direct and indirect evidence from
a field study on Baird's tapirs in Corcovado National Park in Costa Rica indicate that tapirs are
not monogamous but probably facultative polygymous (C.R. Foerster, personal
communication). This mating system predicts that a single male can mate with several
females, without any restriction in the number of females per male, while females typically
mate with only one male. Most large herbivores have a polygymous mating system, and males
typically do not help females raise their young (Davies 1991). As a consequence, home ranges
of male tapirs may incorporate larger areas so that they overlap with the home ranges of two
or more females. Ayala (2003) observed that male lowland tapirs in Kaa-Iya del Gran Chaco
National Park, Bolivia, had larger home ranges than females. Foerster & Vaughan (2002)
observed that the home range of male Baird's tapirs in Corcovado were larger, but not
significantly, than female home range.
In terms of age, although there were no significant differences in home range size between
adults and sub-adults in Morro do Diabo, sub-adults tended to use larger home ranges. When
sub-adult tapirs start to separate from their mothers they go through a process of exploring
the areas in the surroundings and choosing where to disperse in order to establish their own
home ranges. At any rate, it is important to note that the sample size of sub-adult individuals
(N=4) was smaller than the adult sample size (N=15) and so final results for this age class
may not be as accurate.

112
The lowland tapir home range size observed in Morro do Diabo was considerably larger than
the other two Latin American tapir species. Lizcano & Cavelier (2004) used GPS telemetry to
monitor mountain tapirs in Los Nevados National Park, Colombia. The authors estimated a
mean home range size of 2.5 km² (KDE), while the mean home range size of Baird's tapirs
studied via radio-telemetry in Corcovado National Park, Costa Rica, was 1.2 km² (MCP95%)
(Foerster 1998; Foerster & Vaughan 2002). Williams (1984) estimated a mean home range
size of 1.71 km² for Baird's tapirs in the dry forests of Santa Rosa National Park, also in Costa
Rica. In contrast, a telemetry study on Malayan tapirs in Taman Negara, Malaysia, revealed
very large home ranges of up to 12.75 km² (Williams 1978). A recent study on Malayan tapirs
in Krau Wildlife Reserve, also in Malaysia, estimated a home range of ~10-15 km²
(MCP100%) (Abdul Ghani 2009). Therefore, it appears that the home range of Malayan tapirs
is much larger than the three Latin American tapir species.
3.4.3.2 Home Range Internal Structure: Core Areas of Use
Home range is typically characterised with descriptors of its size, shape and structure
(Kenward 2001). Internal home range structure is usually described by size and distribution of
core areas utilised with higher degrees of intensity (Poullé et al. 1994). Studies on various
animal species show that, for a number of environment-related reasons, certain areas within
the home range are more frequently used than others (Dixon & Chapman 1980; Springer
1982; Konecny 1989; Macdonald & Courtenay 1996). The core area of more intensive use
may be related to the greater availability of food resources, water, and refuges (Burt 1943;
Samuel et al. 1985; Samuel & Garton 1987), or in extent of home range overlap with
neighbouring animals (Poullé et al. 1994).
Overall, tapirs in Morro do Diabo had very complex home range structures, including multiple
core areas of use. The number of different core areas of use within the home range was as
high as 17 core units at the 50% core level, and as many as 9 units at the 25% level. When
summed up, the total size of these core areas comprised very small portions of the tapir home
ranges. The 50% core areas of use comprised ~17% of the tapir home range, while the 25%
core areas comprised no more than 6% of the home range. This pattern was very consistent
for both sexes and different age classes. The core areas of use estimated for both sexes were
very similar both in terms of size, as well as in terms of proportion of the entire home range.
When looking at different age classes, while the 50% core areas of adults and sub-adults
were also very similar in size; sub-adult tapirs had significantly larger 25% core areas of use
than adult individuals. This is consistent with previous results on home range sizes for
different age classes, where sub-adults, although not significantly, tended to have larger
home ranges than adults. It is important to mention once more that the sample size of sub-
adults was much smaller than for adults, which most probably affected the results.
113
Tobler (2008) recorded very similar results in terms of proportion of core areas of use within
lowland tapir home ranges in the Peruvian Amazon: 50% core areas of use comprised ~19%
of the range, and 25% core areas ~7%, with similar patterns obtained for both sexes.
However, the home ranges of lowland tapirs in the Peruvian Amazon were less complex when
compared with Morro do Diabo. Tobler (2008) noted that tapir home ranges included only 2-3
different core units. This difference might be once again explained by the habitat
heterogeneity found in the semi-deciduous forests of Morro do Diabo (Durigan & Franco
2006). Lowland tapirs feed according to the availability and abundance of fruit, and might
therefore establish their core areas of use in conjunction with the spatial and temporal
heterogeneous distribution of fruiting trees. Another reason for the greater complexity of
home range structure in Morro do Diabo might be related to the scarcity of water, and some
of the core units may be associated with locations where water sources could be found.
Lastly, the establishment of core areas of use by tapirs in Morro do Diabo did not seem to be
related to the extent of home range overlap with neighbouring tapirs, given that results from
this study have shown high percentages of overlap of core areas of use.
3.4.3.3 Seasonal Variations in Home Range and Core Areas of Use
In general, lowland tapirs in Morro do Diabo showed very little seasonal changes in size and
location of home ranges and core areas of use. The sizes of tapir home ranges as well as core
areas of use in wet and dry seasons in Morro do Diabo were very similar. Seasonal home
ranges used in both wet and dry seasons consisted of ~55% of the entire home range of 4.7
km² (Group 2, 14 tapirs radio-tracked from 8-36 months). The small variation in location of
seasonal home ranges was evidenced by a high percentage of overlap (70%) between home
ranges used in wet and dry seasons. The sizes of the seasonal home ranges used by female
and male tapirs were very similar for both seasons. Although the sizes of the home ranges
calculated for different age classes were very similar in the dry season; sub-adult tapirs used
significantly larger areas than adults in the wet season. The sizes of core areas intensively
used by tapirs in wet and dry seasons were very similar. When examining seasonal core areas
of use between the sexes and between different age classes, sub-adult tapirs had significantly
larger core areas of use at the 50% level when compared to adults.
Other studies on tapirs have obtained similar results. Ayala (2003) found little seasonal
variation in size of home range of lowland tapirs in Kaa-Iya del Gran Chaco National Park,
Bolivia. Lizcano & Cavelier (2004) demonstrated that seasonal difference in home range size
for mountain tapirs in Los Nevados National Park, Colombia, was not significant. Foerster &
Vaughan (2002) found no seasonal changes in size or location of home ranges of Baird's tapirs
in Corcovado National Park, Costa Rica.

114
The results from Morro do Diabo provided evidence that tapirs do not need to expand their
ranges to meet seasonal deficiencies in habitat quality. Indeed, Tófoli (2006) studied the
feeding ecology of lowland tapirs in the Atlantic Forests of the Pontal do Paranapanema
Region, including Morro do Diabo and six small forest fragments in the surroundings, and
observed that there were no differences in terms of consumption of fruit and fibrous materials
in different seasons of the year. The absence of differences was once more explained by the
heterogeneous, semi-deciduous habitats of Morro do Diabo (Durigan & Franco 2006),
characterised by different fruiting periods of different plant species. Thus, the absence of
seasonal differences in terms of consumption of fruit was most probably conditioned to habitat
diversity (Tófoli 2006).
3.4.3.4 Tapir Movements throughout the Fragmented Landscape of the Pontal do
Paranapanema Region
Approximately 17% of the Pontal do Paranapanema Region is still covered with Atlantic
Forests. Besides Morro do Diabo, the fragmented landscape of the region includes the Black-
Lion-Tamarin Ecological Station, which encompasses four forest fragments, and a multitude of
other forest fragments scattered around both protected areas (Ditt 2002; Uezu et al. 2008).
The landscape matrix is mainly composed of pasture land and agriculture (Uezu et al. 2008).
Tapirs are known to have the ability to traverse areas of low quality habitat, such as
agricultural crops and pastoral lands, in order to move through the landscape matrix in
between patches of forest (Flesher 2007). There have been a few records of lowland tapirs
crossing patches of Eucalyptus plantations in between fragments of Atlantic Forest in Espírito
Santo State, Brazil (A. Gatti, personal communication). In Malaysia, there have been sporadic
records of Malayan tapirs crossing areas of palm oil estates, which seemed to occur primarily
due to lack of choice as the animals seemed to be travelling from one forested area to the
next (C. Traeholt, personal communication). Indeed, this study in Morro do Diabo further
supports these observations.
Although not thoroughly quantified, I observed a considerable amount of tapir movement
throughout the fragmented landscape of the Pontal do Paranapanema Region. Tapir signs
including footprints, faeces and evidences of foraging were found in the landscape matrix in
between the western and northern edges of Morro do Diabo and forest fragments in those
areas. Two of the radio-collared tapirs in the western border travelled regularly between
Morro do Diabo and a smaller forest fragment located at ~1,500 m from Morro do Diabo
(Figure 3.5 in this Chapter). In the north western border, two radio-collared tapirs left the
boundaries of Morro do Diabo regularly. Also by using signs, tapir pathways in between small
forest fragments located to the north, northwest, and northeast of Morro do Diabo were

115
identified. Overall, 12 possible tapir movement pathways were identified in the fragmented
landscape of the Pontal do Paranapanema Region. Nevertheless, telemetry results were clear
in showing that the radio-collared tapirs that used to cross the landscape matrix outside of the
western and north western borders maintained their core areas of use inside Morro do Diabo,
where they concentrated their main activities. While the tapir landscape crossings I am
referring to were observed in rather short-scale (no further than 1.5-2.0 km) and apparently
at low rates, they provided evidence of a tapir metapopulation scenario in the Pontal do
Paranapanema Region.
During these landscape crossings, tapirs usually travelled through open areas of pasture land
or agriculture, especially sugar cane plantations. In some instances, they crossed areas of
forest regeneration, degraded forest corridors, and riparian forests along small rivers. Park
rangers reported sightings of tapirs crossing the Paranapanema River in the southern limit of
Morro do Diabo. There were several records of tapirs feeding on sugar cane, manioc and corn
in the agricultural areas around Morro do Diabo, however this seemed to occur in a very small
scale and never appeared to characterise a situation of human-tapir conflict.
3.4.4 Tapir Intra-Specific Interactions in Morro do Diabo State Park
3.4.4.1 Tapir Spatial Territoriality in Morro do Diabo State Park
Neighbouring tapirs in Morro do Diabo exhibited extensive home range overlap. This included
extensive overlap between intra- and inter-sexual pairs, as well as between pairs of same and
different age classes. In addition, several examples of extensive overlap of core areas of use
were observed. The great majority of the tapirs radio-tracked in Morro do Diabo shared
portions of their home ranges with several other tapirs. In the western border, one of the
radio-tracked sub-adult females (Chu-Chu) shared portions of her home range with six other
tapirs, including three adult females, other sub-adult female, and two sub-adult males. Two
adult females in the same area (Joana and Paulete) each shared portions of their home
ranges with four other tapirs. Two adult females radio-tracked in the centre of Morro do Diabo
(Mama and Julia) each shared portions of their home ranges with four other tapirs.
Overall, the home range overlap between neighbouring tapirs was around 30%, although in
some cases it was as high as 92%. The home range overlap could be even higher considering
that I may not have been able to capture and monitor all tapirs in a given area. There were
no significant differences in home range overlap between intra- and inter-sexual pairs, or
between pairs of same and different age classes. It is important to mention that the analysis
of home range overlap included only one pair of males and only one pair of sub-adult
individuals, which might have affected some of these results.

116
The lowland tapir home range overlap in Morro do Diabo was fairly similar to previous results
obtained for lowland and Baird's tapirs. Noss et al. (2003) obtained a mean home range
overlap of 43.5% for lowland tapirs in Kaa-Iya del Gran Chaco National Park, Bolivia. In the
same site in Bolivia, Ayala (2003) observed a home range overlap of 80% between an adult
male and a juvenile male, and a 30% overlap between the same juvenile male and an adult
female. Foerster & Vaughan (2002) observed a mean home range overlap of 33.2% for
Baird's tapirs in Corcovado National Park, Costa Rica.
The overlap of core areas of use among tapirs in Morro do Diabo was around 20%, at both
the 50% and 25% levels. Although there were no significant differences in overlap of core
areas of use between intra- and inter-sexual pairs, pairs of females tended to present the
most extensive overlap of core areas of use. The only pair of males included in the analysis -
two adult individuals in the centre of Morro do Diabo - showed very little overlap of core areas
of use at the 50% level and did not overlap at the 25% level. Similarly, there were no
significant differences in overlap of core areas when comparing pairs of same and different
age classes. However, the only pair of sub-adults included in the analysis - two females in the
western border - showed an extensive overlap of core areas at the 50% level and did not
overlap at the 25% level.
On the strength of the available evidence provided by the extensive home range overlap and,
most importantly, the overlap of core areas of use, I found no indication whatsoever that
spatial territoriality was present in the tapir population in Morro do Diabo. Territoriality usually
arises when animals exhibit spatially oriented aggressive behaviour (Burt 1943; Brown &
Orians 1970; Davies & Houston 1984; Maher & Lott 1995; Moorcroft et al. 1999; Jetz et al.
2004). The territory of an animal may be limited to a circumscribed area within the home
range, where specific activities are performed (e.g. mating), or to core areas of use richest in
resources, or may extend to the whole home range (Brown & Orians 1970). Tobler (2008)
observed that lowland tapirs monitored through GPS telemetry in the Peruvian Amazon
regularly walked along the boundaries of their home ranges, most probably defining their
territory against other individuals by maintaining clear home range boundaries. This behaviour
was not observed in Morro do Diabo although it would have been difficult to obtain this level
of detail through the use of VHF telemetry. While tapirs in Morro do Diabo had well defined
home ranges and lived within their boundaries, no evidence was found that they defended
their areas against conspecifics. The only result of this study that could possibly might possibly
indicate a certain level of spatial territoriality would be the small percentage of 50% core area
overlap and complete absence of 25% core area overlap between male tapirs. This might also
indicate polygamy. At any rate, this result was obtained from a single pair of adult males and,
the spatial territoriality in this case, if present, was restricted to a very small portion of their
home ranges.
117
3.4.4.2 General Inferences about Tapir Social Organisation in Morro do Diabo State
Park
Baird's tapir offspring normally remain with their mother from 12-18 months (C.R. Foerster,
personal communication). Once they separate, in most of the occasions, young tapirs stay in
the vicinity of the mother's home range from 3-4 years prior to dispersal from the area and
establishment of their own home ranges. Therefore, the ranging behaviour of tapirs in
Corcovado included the establishment of so called “family units” where pairs of adult male and
female tapirs maintained an almost entirely exclusive “territory” with no other resident adults
over long periods of time, which they shared with 1-3 offspring from previous years (Foerster
& Vaughan 2002). While extensive home range overlap was observed within the family units,
very little overlap occurred between neighbouring tapir families (C.R. Foerster, personal
communication). In the Peruvian Amazon, Tobler (2008) observed an almost 100% home
range overlap between a male and a female lowland tapir. Genetic analysis carried out in Peru
demonstrated that the two individuals were possibly siblings sharing their parents' territory.
Both examples from Costa Rica and Peru provide evidence that the spatial and social
organisation of tapirs in these areas was closely associated with the relatedness among
different individuals, which most probably led to an increased level of tolerance among
neighbours (Kitchen et al. 2005).
The lowland tapir study in Morro do Diabo did not indicate the establishment of such well
defined family units. Nevertheless, results on home range overlap and overlap of core areas of
use allowed for preliminary inferences on possible interactions and relatedness among
individual tapirs, as well as for general observations about social organisation. It is important
to clarify that these inferences were made without recourse to information on genetic
relatedness among individuals. In the western border of Morro do Diabo, where I monitored
seven different individual tapirs, there were indications of potential relatedness between an
adult female (Joana) and two sub-adult individuals (female Chu-Chu and male Luizinho). Both
these sub-adults could have been offspring of Joana. If Charles Foerster's concept of “family
units” could be applied to Morro do Diabo, Chu-Chu and Luizinho could be sub-adult
individuals with ~1-3 years of age, who were living within the home range of their mother
Joana for a few years prior to dispersal and establishment of their own home ranges.
Alternatively, the extensive home range overlap between Chu-Chu and Luizinho could indicate
that they were a young mating pair. At the moment of her capture in June 1997, Joana
appeared to be old enough to be one of the matriarchs in the western border. Still in the
western area of Morro do Diabo, a pair of sub-adult male and sub-adult female exhibited
extensive home range overlap, which could indicate that they were either offspring of the
same adult female, or a young mating pair. In the centre of Morro do Diabo, where I
monitored seven tapirs, very extensive inter-sexual overlap in home range as well as in core

118
areas were observed for two pairs of female and male. These four individuals were adults in
age of reproduction and could have been reproductive pairs in that section of Morro do Diabo.
Over the past few years since I concluded the telemetry study in Morro do Diabo, specific
genetic markers for lowland tapirs have been well developed and made available. Biological
samples from all the 35 tapirs captured in Morro do Diabo have been properly preserved. In
the next few years, it will be possible to analyse the relatedness of these individuals and
determine the social organisation of tapirs in Morro do Diabo in much more detail.
3.4.5 Lowland Tapir Spatial Requirements and Implications for
Population Viability
Understanding the spatial requirements of animal populations across severely fragmented
landscapes such as the Atlantic Forest is critical for the design and implementation of
management and conservation strategies that can promote the survival and persistence of
these populations over the long-term. Tapirs are wide-ranging species and have large spatial
requirements. This long-term lowland tapir study in Morro do Diabo has further supported
these observations. Tapirs in Morro do Diabo used very large home ranges. However, most
essential in the context of examining the viability of tapir populations in the fragmented
landscape of the Pontal do Paranapanema Region is the comparison of tapir spatial
requirements found in Morro do Diabo, an Atlantic Forest fragment of 370 km², with large
areas of contiguous habitat.
Some important patterns of tapir home range structure and intra-specific interactions
observed in Morro do Diabo were very similar to what has been previously found for the
species in non-fragmented habitats. The proportion of core areas of use in relation to home
range size in Morro do Diabo was almost equal to what has been observed for the same
parameter in the 1,400 km² of contiguous forests of Los Amigos Conservation Concession in
the Peruvian Amazon (Tobler 2008). Likewise, the percentages of home range overlap
observed in Morro do Diabo were very similar to estimates observed both at Los Amigos
(Tobler 2008) and in Kaa-Iya del Gran Chaco National Park (34,400 km²) in Bolivia (Noss et
al. 2003). Nevertheless, the tapir home ranges in Morro do Diabo were considerably larger,
almost twice as much, when compared to tapir home ranges observed in these large tracts of
contiguous habitat (Ayala 2003; Noss et al. 2003; Tobler 2008).
As detailed previously, the main factors that might possibly explain the larger tapir home
ranges in Morro do Diabo include the extensive habitat fragmentation, which led to a
reduction in resource diversity and availability (Wright & Duber 2001; Tabarelli et al. 2004), as
well as the characteristics of the semi-deciduous forests of Morro do Diabo, known for their

119
low primary production and scarcity of water resources. Survival and reproduction are often
food-limited. The abundance and predictability of food resources in time and space are
important factors influencing spatial organisation (McLoughlin & Ferguson 2000). Food is often
cited as an important limiting factor determining the home range size. Animals move and
establish their home ranges in response to energetic needs, or to build a memory map of
patches of food resources, or in response to the distribution of resting sites (South 1999).
Tapirs in Morro do Diabo required large home ranges in order to obtain the resources they
needed to fulfil their nutritional requirements and consequently survive and reproduce.
Nevertheless, tapirs in Morro do Diabo appeared to be fulfilling these requirements and the
population appeared to be healthy and stable. In fact, tapirs in Morro do Diabo appeared to
be reproducing rather well. During this study, I obtained various evidences of tapir
reproduction including the capture of two adult female tapirs with young calves, four adult
females that were lactating (pre or post parturition), and a number of other captured females
presented vaginal secretions characteristic of reproductive periods. In some occasions, I
captured females that had superficial wounds on their backs caused by mounting. In addition,
members of the research team as well as other field researchers and park rangers reported
regular sightings of female tapirs with calf.
Species with large spatial requirements generally cannot find sufficient food and other vital
resources to survive and persist in small areas over the long-term (McNab 1963; Redford &
Robinson 1991). Thus, the smaller forest fragments of the Pontal do Paranapanema Region
may be too small to provide tapirs with the amount of space they require. Chiarello (1999)
analysed the effects of the Atlantic Forest fragmentation on mammal communities, and
observed that tapirs were present in large patches but not recorded in small ones. While
Morro do Diabo benefits from a higher level of habitat diversity and conservation, the smaller
forest fragments continue to suffer from habitat degradation.
Apart from Morro do Diabo State Park and the Black-Lion-Tamarin Ecological Station, all the
other forest fragments in the Pontal do Paranapanema Region lie within private properties or
Agrarian Reform landless settlements (owned by the State), therefore lacking legal protection.
As a result, the impact of rural communities living in the vicinities of these small forest
fragments - including erosion of forest edges by fires and cattle grazing, spread of aggressive
weeds, and use of pesticides - have been seriously modifying forest structure and reducing
habitat quality and carrying capacity for a number of species (Cullen 1997). Another
consequence of habitat fragmentation is the reduction in diversity and availability of fruit
(Terborgh 1986; Terborgh 1992), which is a serious limiting factor for the persistence of
frugivore species such as tapirs. Tófoli (2006) analysed the impact of fragmentation of the
Atlantic Forests of the Pontal do Paranapanema Region on the diet of tapirs and showed that

120
tapirs in Morro do Diabo consumed significantly higher percentages of fruit and lower
percentages of fibrous material when compared with tapirs in the smaller forest fragments. In
addition, estimates of fruit species richness in the diet of tapirs indicated considerably higher
fruit diversity in Morro do Diabo than in the forest fragments (Tófoli 2006). This indicates that
the carrying capacity of these very small, largely degraded, non-protected forest fragments in
the Pontal do Paranapanema Region might be indeed much lower than Morro do Diabo. In
consequence, tapirs in these small areas might not be given the proper conditions to fulfil
their large spatial requirements.
Small tapir populations in the Pontal do Paranapanema Region might be able to survive and
persist over the long-term if they are connected to the Morro do Diabo. Preliminary results of
a large scale lowland tapir survey currently underway throughout the entire range of the
Atlantic Forest biome has already demonstrated that while tapirs appear to fulfil their spatial
requirements and persist in some areas where habitat is reduced to small scattered
fragments; they need to be able to resort to large forest fragments (Flesher 2007).
Evidences gathered during this study have shown that tapirs in the Pontal do Paranapanema
Region move through the fragmented landscape in between different patches of forest. This
indicates that the inter-habitat landscape matrix found in the Pontal do Paranapanema Region
provides a satisfactory level of functional connectivity (Greenberg 1989; Sieving et al. 1996),
in other words being fairly permeable for tapirs. During their landscape wonderings
throughout the region, tapirs usually moved through areas of pasture land or agriculture. In
other instances, they crossed areas of forest regeneration, degraded forest corridors, and
riparian forests and swamps along small rivers. The fact that tapirs are mobile and can use
these marginal non-natural habitat areas surrounding the forests where they live, most
certainly helps them fulfil their spatial requirements in the smaller forest fragments. The tapir
landscape crossings in between different patches of forest were observed in rather short-
scales, and at apparently low rates. Nevertheless, they did provide evidence of a tapir
metapopulation dynamics. This metapopulation can potentially allow tapirs in the small forest
fragments to have access to the larger patches of forest, therefore promoting their
persistence over the long-term. This is only deemed to be accurate if Morro do Diabo remains
intact and effectively protected.
In addition to spatial requirements, population size is another critical determinant for the long-
term persistence of animal species in severely fragmented landscapes. The next chapter
focuses on estimating the size of the tapir populations in Morro do Diabo and surrounding
Atlantic Forest fragments, providing essential information for predicting future population
trends and assessing long-term viability of tapirs in the Pontal do Paranapanema Region.

Chapter 4
Determining Population Size
Photo by Anders Gonçalves da Silva

122
4.1 Introduction
Population size is considered to be the major determinant of species capacity for long-term
persistence in a given area (Diamond et al. 1987; Newmark 1987; Pimm et al. 1988; Richman
et al. 1988; Soulé et al. 1988; Berger 1990; Schoener & Spiller 1992; Foufopoulos & Ives
1999). Population size is a critical demographic attribute and the single most important
parameter to determine extinction risk (Shaffer 1981; Gilpin & Soulé 1986; Lacy 1993; Lacy
2000; Shaffer et al. 2000; Aurambout et al. 2005). Determining extinction risk is at the heart
of conservation biology (Burgman et al. 1993; Fagan et al. 2001; Fieberg & Ellner 2001;
Beissinger & McCullough 2002). Population size is also the most important parameter for
predicting future population trends and assessing population viability (Shaffer 1981; Gilpin &
Soulé 1986). Most species-specific conservation efforts require reliable estimates of population
size for making management decisions, establishing conservation priorities, and monitoring
the success of conservation strategies (Matter 2000).
The size of animal populations is a particularly important factor in fragmented habitats.
Fragmented habitats usually fail to provide the necessary resources to support species
assemblages found in the intact ecosystem, which in turn leads to a general reduction in the
number of individuals that can be supported (Lovejoy et al. 1984; Quinn & Hastings 1987;
Bierregaard et al. 1992; Burkey 1993; Kattan & Alvarez-Lopez 1996). Since the 1980's, the
understanding of the different processes that may bring small populations to extinction has
increased considerably and is now well known as the “small population paradigm” (Terborgh &
Winter 1980; Goodman 1987; Pimm et al. 1988; Berger 1990; Caughley 1994; Newmark
1994; Mace & Kershaw 1997; McKinney 1997; Belovsky et al. 1999; Foufopoulos & Ives
1999). The contention that small, isolated populations are more vulnerable to extinction has a
sound theoretical basis in both demography and population genetics (Shaffer 1981; Lande
1988; Roelke et al. 1993; Lande 1995; Lynch & Lande 1998). At small population size,
demography plays a critical role in population persistence (Goodman 1987; Nunney &
Campbell 1993; Lande 1995; Lindenmayer & Lacy 1995). Small populations are more sensitive
to stochastic events, such as fires or epidemic outbreaks, which could rapidly drive a
population to extinction (Lacy 1993; Lacy 2000; Aurambout et al. 2005). Likewise, small,
isolated populations are more susceptible to genetic drift, which could also lead, in the case of
severe inbreeding, to population extinctions (Templeton et al. 1990). Overall, the chance of
extinction increases exponentially with decreasing population size and increasing population
isolation. In addition, population size has implications for population structure and dynamics,
as well as community-level patterns (Matter 2000). The size of a population is integral to the
concepts of density-dependence (Ray & Hastings 1996), population regulation (Clutton-Brock
et al. 1985), as well as the functional and numerical responses of predators to prey (Morgan
et al. 1997).

123
Making accurate estimates of population size is very difficult. Direct counts of animal
populations are exceptionally difficult, if not impossible, to obtain. Animals are frequently
difficult to capture or observe, and the associated costs and effort of making absolute counts
are prohibitive (Gittleman 1996). Thus, animal ecologists have no other alternative but to rely
on indirect methods that provide indices of population abundance and then derive or estimate
population size. Some examples of indirect methods used for the estimate of animal
abundance include radio-telemetry, camera-traps, line-transect sampling, track and dung
counts among others (Emmons 1987; Emmons 1988; Konecny 1989; Ludlow & Sunquist
1987; Jewell et al. 2001; Maffei et al. 2002; Noss et al. 2003; Lizcano 2006; Cullen 2007;
Alibhai et al. 2008).
Large terrestrial mammals - such as tapirs - occur at lower population densities when
compared to small mammals (Eisenberg 1980). Thus, while estimates of lowland tapir density
reported in the literature vary, due to both differences in the methods of estimation used and
in the environments and types of habitat studied, they tend to occur naturally at low densities
(Cullen et al. 2000; Aquino et al. 2001; Aquino & Calle 2003; Haugaasen & Peres 2005;
Desbiez 2009). With wide-ranging behaviour and slow reproductive rates, tapir populations
rarely reach a high local abundance. For these reasons, tapirs are particularly susceptible to
habitat fragmentation. Population density is limited to the number of animals that a given area
can support (Robinson & Redford 1986). Furthermore, while habitat fragmentation leads to
small populations, further threats such as hunting, road-kill, and disease among others
override the impact of fragmentation strongly impacting the likelihood of extirpation of
remaining tapir populations (Bodmer et al. 1997; Cullen et al. 2000). Small tapir populations
can show rapid decline and even local extinctions when affected by such threats (Medici et al.
2007a). The low rates of population growth, long generation time, long reproductive cycles,
and delay in first reproduction are life-history characteristics that make tapirs particularly
susceptible to overhunting (Bodmer et al. 1997). Lowland tapir populations showed rapid
declines when overhunted in intact Amazonian forests in Peru (Bodmer et al. 1997). Peres
(2000) predicted that the extinction rate of large terrestrial vertebrates is a function of
fragment size in Amazonian forests, and is aggravated by hunting pressure. Cullen et al.
(2000) compared the abundance of mammalian species in slightly and heavily hunted
fragments of Atlantic Forest of the Interior - including Morro do Diabo State Park as one of the
slightly hunted sites - and observed that tapirs could not cope with persistent hunting and
were extirpated from heavily hunted sites.
The destruction and fragmentation of the Atlantic Forest of the Interior of the Pontal do
Paranapanema Region is relatively recent when compared to areas in the eastern part of the
biome. Despite the extensive loss of habitat, some of the larger forest fragments in the
region, particularly Morro do Diabo, still host populations of several species of large mammals,

124
including lowland tapirs. During a biodiversity assessment, all the forest fragments larger than
4 km² in the Pontal do Paranapanema Region were surveyed for flora and fauna (Ditt 2002).
The presence of tapirs was confirmed in eight of these forest fragments, including Morro do
Diabo and seven smaller forest fragments in its surroundings. Tapirs were absent in six forest
fragments surveyed during the study, local extinctions that were most probably due to
overhunting (Cullen 1997; Cullen et al. 2000). The estimate of the size of these remaining
tapir populations in the Pontal do Paranapanema Region will allow for an evaluation of their
current conservation status, and for the understanding of how tapirs have been affected by
the past process of habitat fragmentation. In addition, this information will be vital for the
evaluation of the potential impact of existing threats to tapirs in the region, and for the
assessment of the viability of these tapir populations over the long-term. Finally, this
information will be used to determine the tapir population parameters, most importantly
population size and carrying capacity, for the process of Population Viability Analysis (PVA)
presented in Chapter 6.
In this Chapter, I used different methodologies to estimate the size of tapir populations in the
Atlantic Forest fragments in the Pontal do Paranapanema Region. Radio-telemetry, nocturnal
line-transect sampling, and Footprint Identification Technique (FIT) were used to estimate
tapir density in Morro do Diabo. Various methods of data analysis were used and one density
estimate was selected as the most appropriate to derive tapir population sizes in Morro do
Diabo and surrounding forest fragments. The advantages and disadvantages of each method,
as well as their reliability for long-term tapir monitoring, are presented and discussed.

125
4.2 Methods
I used three methods to estimate tapir population density in Morro do Diabo:
• Radio-Telemetry
• Nocturnal Line-Transect Sampling
• Footprint Identification Technique (FIT)
4.2.1 Estimate of Tapir Population Density using Radio-Telemetry Data
Radio-telemetry has been extensively used to derive animal density, by providing data on
home range size and home range overlap (Karanth 1995; Keuroghlian et al. 2004; Crawshaw
2004; Soisalo & Cavalcanti 2006). VHF telemetry was used to study tapir ranging behaviour in
Morro do Diabo. A complete overview of the use of radio-telemetry as well as results of home
range size, home range radius, and home range overlap obtained from 19 tapirs radio-tracked
in Morro do Diabo for varying amounts of time have been presented in Chapter 3. Tapir home
range size was calculated using Kernel Density Estimator (KDE95%) and Minimum Convex
Polygon (MCP95%). Home range overlap was calculated by KDE95%.
I used four analytical methods based on different parameters of tapir ranging behaviour
obtained by radio-telemetry to estimate tapir population density in Morro do Diabo. I was
interested in evaluating the importance of different ranging parameters in estimating tapir
density. The methods were the following:
Method 1 Tapir density was estimated by extrapolating mean tapir home range size
obtained by both KDE95% (4.7 km²) and MCP95% (4.4 km²) to the entire
area of 370 km² of Morro do Diabo. The density estimates obtained through
this method did not consider home range overlap. For this analysis I used only
the ranging results obtained from the 14 tapirs radio-tracked from 8-36
months.
Method 2 Tapir density was estimated by subtracting mean home range overlap (37%,
KDE95%) from mean tapir home range size (4.7 km², KDE95%). The value
obtained was then extrapolated to the entire area of 370 km² of Morro do
Diabo to obtain a density estimate. Once more, for this analysis I used only
the ranging results obtained from the 14 tapirs radio-tracked from 8-36
months.
Method 3 Tapir density was estimated as the number of radio-tracked tapirs (in this
case, all 19 individuals monitored during the study in Morro do Diabo) divided
by the total area which they used, known as the Effective Sampled Area (ESA).
126
ESA was estimated as the total area making up the tapir home ranges and was
calculated through both KDE95% and MCP95% for comparison. The resulting
density of tapirs in the ESA was then extrapolated to the entire area of 370
km² of Morro do Diabo to obtain a density estimate. Densities for females and
males were estimated separately. This method of estimating density from
radio-collared animals takes overlap between individuals into consideration
(Crawshaw 1995; Burch 2001).
Method 4 Mean home range radius (½ Mean Maximum Distance Moved - MMDM) was
calculated for the 14 tapirs radio-tracked from 8-36 months (Chapter 3). This
value was used to determine the ESA by placing circular buffers around all
locations where different tapirs were captured during the study (N=35 tapirs;
N=14 capture sites) (Wilson & Anderson 1985; Karanth & Nichols 2002). The
resulting density of tapirs in the ESA was then extrapolated to the entire area
of 370 km² of Morro do Diabo to obtain a density estimate. Additionally, I
calculated home range radius for females (N=20; N=11 capture sites) and
males (N=15; N=9 capture sites) and estimated their densities separately. This
method takes overlap between individuals into consideration (Wilson &
Anderson 1985; Karanth & Nichols 2002).
4.2.2 Nocturnal Line-Transect Sampling
4.2.2.1 Line-Transect Sampling Methodology
Line-transect sampling is a convenient and relatively inexpensive technique (Buckland et al.
2001). It has been commonly used to estimate densities and abundance of large- and
medium-sized Neotropical mammals (Bodmer et al. 1997; Chiarello 2000; Cullen et al. 2000;
Mendes-Pontes 2004; Desbiez 2010).
Line-transect estimation of wildlife populations can be based on either right-angle distances or
radial distances, and sighting angles to the detected objects (Hayes & Buckland 1983;
Buckland et al. 2001). In the standard method, all objects (animals) on or near the line should
be detected, but the method allows a proportion of objects to be missed. As the distance from
the line increases, animals are harder to detect and more animals go undetected. The
reliability of line-transects to estimate density depends largely on the sample size of
observations (Burnham et al. 1980; Buckland et al. 1993; Wilson et al. 1996).
The principle behind line-transect sampling is to use the distribution of observed distances to
estimate a “detection function”, and then model the probability of detecting animals as a

127
function of distance from the transect line. The estimation procedures are described in detail
by Buckland et al. (2001). Other factors besides distance from the line, such as habitat type,
experience of observer and weather conditions may affect the probability of detecting an
animal along the line-transect (Burnham et al. 1980; Buckland et al. 2001; Buckland et al.
2004). In this study, line-transects were always carried out by the same observers, when it
was not raining, and the habitats sampled were always forested.
Five assumptions are essential for reliable estimation of density from line-transect sampling,
and every possible effort was made to ensure that these assumptions were not violated during
this study:
• line-transects are located at random within the study area and are independent of
animal distribution;
• animals directly on the line-transect are always detected (probability=1);
• animals are detected at their initial location, prior to any movement in response to the
observer;
• distances and angles are measured accurately; and
• detections are independent events.
4.2.2.2 Line-Transect Sampling Data Collection
In July 2006, a total of eight line-transects from 6-7.7 km, and with an average length of
7,125 km, were selected within Morro do Diabo. Internal dirt roads distributed throughout the
area of Morro do Diabo were used as transects (Figure 4.1). These same roads had been
previously used for a diurnal census of terrestrial mammal species in Morro do Diabo during
the 1990's (Cullen 1997; Cullen et al. 2000), which allowed for comparisons between diurnal
and nocturnal line-transect sampling for tapirs. These roads were rarely used by the park staff
and/or other researchers, and tapirs were initially assumed not to avoid or prefer these areas.
Data collection on transects was carried out over 20 months from August 2006 to March 2008.
Transects were walked by two observers equipped with head-lights and a 60-watt hand-held
spotlight. Observers walked slowly at ~1-2 km/h. Transects were censused between 18:00-
23:00 h, but census was terminated during rain. The direction of travel was changed from
start to end, from end to start, every two months. Date, time, GPS coordinates, radial distance
from the line-transect, angle (azimuth) to the animal, and number of individuals were
recorded for each tapir encounter. Tapirs either visualised or heard were recorded. Radial
distances from the observer to the sighted/heard tapir were estimated to the nearest meter by
counting steps. I also made general notes about sex, age class, behaviour, weather
conditions, and phase of the moon. Each transect was walked once a month, completing a
monthly census effort of 57 km, and a final total censusing effort of 1,140 km walked.

128
Figure 4.1. Locations of eight line-transects used for the lowland tapir nocturnal line-transect sampling in Morro do Diabo State Park, São Paulo, Brazil. (Transects: (1) Taquara, (2) Córrego Seco-Pinus, (3) Pinus-Linha de Trem, (4) 7000-3000, (5) Angelim, (6) Estreito de Baixo, (7) Caldeirão, and (8) Aeroporto). Figures 2.5 and 2.6 (Chapter 2) provide further reference on the location of Morro do Diabo State Park.
4.2.2.3 Estimate of Tapir Population Density using DISTANCE Analysis
Tapir density was analysed using DISTANCE 5.0 software (Buckland et al. 2001). DISTANCE is
a Windows-based computer package that allows users to analyse line-transect sampling
surveys and estimate densities of wildlife populations. As a first step, I carried out an
exploratory analysis of the line-transect data using the DISTANCE's Data Filter in order to
check for violation of assumptions. I plotted a histogram of frequency of tapir encounters
against distance from the line-transect (Figure 4.2). Two problems were found. The first was a
high frequency of encounters at zero distance. In line-transect sampling, it is common to find
the highest frequency of animal sighting counts at zero distance or at distances near zero.
However, this prevents the data from fitting the model. Normally, the frequency of animal
sightings during the first few distance intervals should not be radically different since almost
all animals at short distances from the line-transect should be detected. The histogram should
present a “shoulder” at short distances before decreasing. The spike at zero distance
illustrates a violation in the initial assumptions. The second problem relied on the fact that one
of the line-transects was located along the southern border of Morro do Diabo and one of its
sides was a crop field. On the side of this particular transect, I had a visibility of over 100 m
666
777
555 111 222
333
444
888
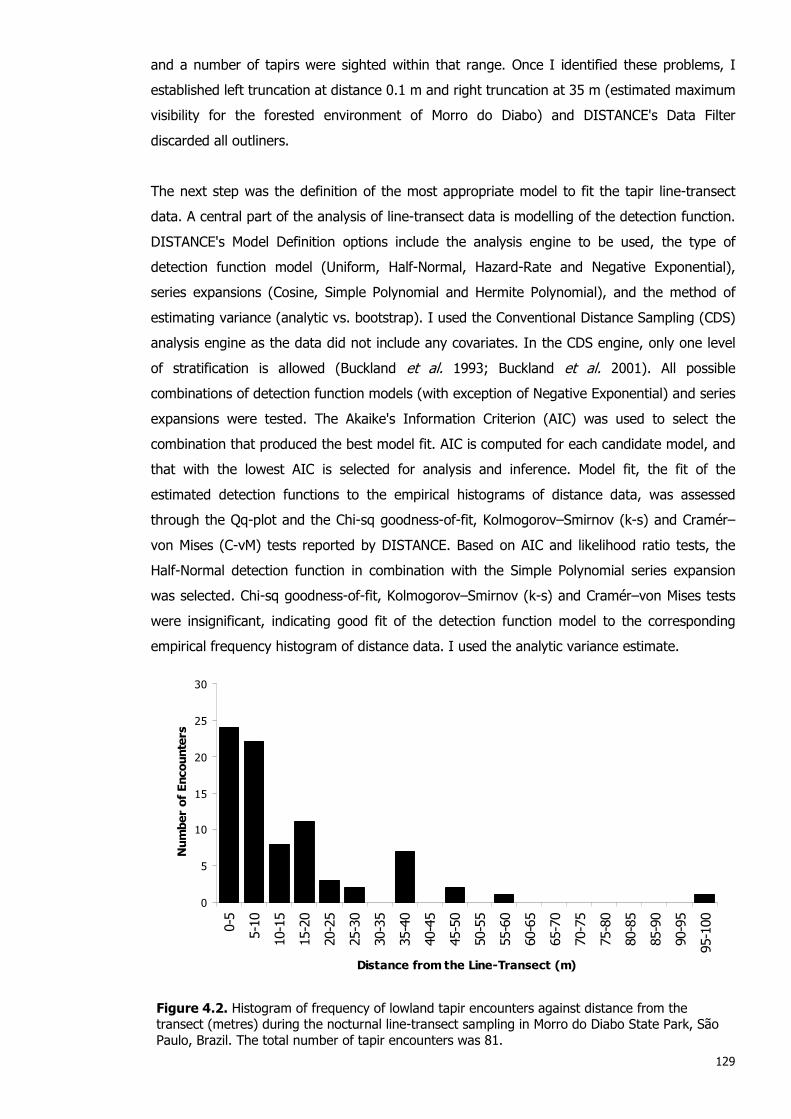
129
and a number of tapirs were sighted within that range. Once I identified these problems, I
established left truncation at distance 0.1 m and right truncation at 35 m (estimated maximum
visibility for the forested environment of Morro do Diabo) and DISTANCE's Data Filter
discarded all outliners.
The next step was the definition of the most appropriate model to fit the tapir line-transect
data. A central part of the analysis of line-transect data is modelling of the detection function.
DISTANCE's Model Definition options include the analysis engine to be used, the type of
detection function model (Uniform, Half-Normal, Hazard-Rate and Negative Exponential),
series expansions (Cosine, Simple Polynomial and Hermite Polynomial), and the method of
estimating variance (analytic vs. bootstrap). I used the Conventional Distance Sampling (CDS)
analysis engine as the data did not include any covariates. In the CDS engine, only one level
of stratification is allowed (Buckland et al. 1993; Buckland et al. 2001). All possible
combinations of detection function models (with exception of Negative Exponential) and series
expansions were tested. The Akaike's Information Criterion (AIC) was used to select the
combination that produced the best model fit. AIC is computed for each candidate model, and
that with the lowest AIC is selected for analysis and inference. Model fit, the fit of the
estimated detection functions to the empirical histograms of distance data, was assessed
through the Qq-plot and the Chi-sq goodness-of-fit, Kolmogorov–Smirnov (k-s) and Cramér–
von Mises (C-vM) tests reported by DISTANCE. Based on AIC and likelihood ratio tests, the
Half-Normal detection function in combination with the Simple Polynomial series expansion
was selected. Chi-sq goodness-of-fit, Kolmogorov–Smirnov (k-s) and Cramér–von Mises tests
were insignificant, indicating good fit of the detection function model to the corresponding
empirical frequency histogram of distance data. I used the analytic variance estimate.
0
5
10
15
20
25
30
0-5
5-10
10-15
15-20
20-25
25-30
30-35
35-40
40-45
45-50
50-55
55-60
60-65
65-70
70-75
75-80
80-85
85-90
90-95
95-100
Distance from the Line-Transect (m)
Number of Encounters
Figure 4.2. Histogram of frequency of lowland tapir encounters against distance from the transect (metres) during the nocturnal line-transect sampling in Morro do Diabo State Park, São Paulo, Brazil. The total number of tapir encounters was 81.

130
4.2.3 Footprint Identification Technique (FIT)
The Footprint Identification Technique (FIT) is a cost-effective and non-invasive research tool
developed by WildTrack, an independent wildlife research group based in Portugal (Jewell et
al. 2001; Alibhai et al. 2008). This method is an adaptation of ancient bushman tracking
techniques to take advantage of the scientific objectivity modern technology can provide. The
technique is based on the identification of animals at the species, individual, age-class and sex
levels, using digital images of their footprints (Jewell et al. 2001; Alibhai et al. 2008).
4.2.3.1 Development of the FIT Algorithm for Lowland Tapirs
The first step in using FIT is to build a reference library of footprint images from a group of
identifiable individuals of the species one is working with.
WildTrack has developed a very specific protocol to photograph animal footprints:
1) It is required to have a clear “track” (series of footprints of the same individual along a
trail). A minimum of 15-20 left hind (LH) footprints from the same animal must be
photographed (Figure 4.3.1).
2) Once the first footprint of the “track” is selected, it is necessary to place a cm ruler for
scale on bottom and left hand axis of footprint, in relation to direction of travel. It is
important to make sure the ruler does not obscure footprint detail at all. The same
procedure is done for every footprint to be photographed (Figure 4.3.2).
3) A photo ID slip giving details of each footprint must be included in the photograph. The
slip contains the date, name of photographer, and animal ID, as well as a footprint number
that refers to the number allocated to the footprint for that day’s work. The first LH
footprint in the “track” is called 1A, the second 1B, the third 1C and so on. Footprints from
a second “track” will be 2A, 2B and so on (Figure 4.3.2).
4) Photographs should be taken with a minimum 300KB image size, using 768X1024
resolution or higher. Camera lens should be directly overhead of the footprint, and fill the
camera frame with the footprint, ruler and ID slip so that the photo is filled with details of
spoor. It is important to try and get the best possible light contrast - usually found early
morning and later afternoon, and avoiding casting shadow on the footprint (Figure 4.3.3).

131
Figure 4.3. 1- Lowland tapir “track” along a dirt road; 2- Lowland tapir footprint prepared to be photographed (cm tape measures for scale on bottom and left hand axis of footprint, and photo ID slip providing details of the footprint); 3- Photography being taken. Photos by Patrícia Medici.
3
2
1

132
From April 2005 to April 2006, I organised the collection of sets of footprint images from 28
captive lowland tapirs (15 females and 13 males; all individuals of known age) from four
zoological institutions and breeding facilities in Brazil and Argentina (Table 4.1). Additionally, I
received contributions of additional footprint images from two zoos in France (Parc Zoologiqué
Amnéville and Safari de Peaugres), one zoo in Colombia (Zoológico de Cali), and from tapir
field researchers in Ecuador (Andrés Tapia) and French Guiana (Benoit de Thoisy). However,
these additional datasets were too small to be included in the analysis.
Table 4.1. Zoological institutions and breeding facilities where captive lowland tapir footprint images were collected for the establishment of the initial reference library for Footprint Identification Technique (FIT). Number of photos taken and average number of footprints per track in each facility are shown. (N=number of tapirs; F=female; M=male).
Facility
N
Number of photos taken
Average number of
footprints/set
Criadouro Conservacionista CBMM - Brazil 10 (5F/5M) 265 27 Criadouro Conservacionista Martins, Brazil 10 (7F/3M) 224 22
Sorocaba Zoo, Brazil 6 (2F/4M) 116 19 Fundación Temaikén, Argentina 2 (1F/1M) 21 10
All photographs were taken in fine sand substrate. At the Sorocaba Zoo, where I personally
conducted the process of photographing the footprints, we carried large amounts of sand into
the tapir exhibit and prepared a 1.5-m wide, 10-m long sand path. One by one, tapirs were
lured with bananas and encouraged to walk over the sand path while we marked their left
hind footprints. Each individual tapir had to be walked over the sand path twice so that I could
obtain the minimum number of footprint images per animal. All photographs were taken in
high resolution and I followed the WildTrack protocol very closely.
Our reference library of footprints of captive tapirs was then subjected to pre-processing and
statistical analysis by WildTrack researchers aiming at developing an algorithm function for the
identification of individual lowland tapirs. Pre-processing consisted of selecting the images to
be included in the analysis and posterior image enhancement. From a total of 626
photographs taken, 362 confirmed left hind footprints were considered to be adequate for
analysis. The best images were those where protocol had been followed closely.
The identification of an individual through FIT is based on the geometric profiles of its
footprints. Therefore, the implementation of FIT to a new species requires the choice of a set
of natural landmarks determined by the structure and complexity of the footprint. The forefeet
of lowland tapirs have three main digits, and a smaller one, which only leaves an impression
when the tapir is walking on soft ground. The hind feet have only three digits. All the toes are
hoofed. The plantar cushion helps support the distal metatarsals and digits where they make
ground contact (Figure 4.4.1). The impression made by the foot can reveal clear outlines of
the outside edge of each hoof (Figure 4.4.2).

133
Figure 4.4. 1- Lowland tapir plantar cushion, distal metatarsals and digits; 2- Close up image of a left hind (LH) footprint of a lowland tapir in Morro do Diabo State Park, São Paulo, Brazil. Photos by Patrícia Medici and Joares May.
The natural landmark points are selected on the basis of foot anatomy to include those points,
which are clearly definable and repeatable across many footprints. Footprint images are
downloaded into a computer and landmark points are marked using an image processing
computer package such as ADOBE PHOTOSHOP (Adobe Inc). After placing these landmark
points, a set of derived landmarks, geometrically constructed from the set of natural
landmarks, is then defined, including lengths and angles (variables). This set of measurements
constitutes the geometric profile of the footprint image, and provides the data upon which all
FIT analyses are performed (JMP Statistical Software).
The set of measurements typically contains many variables (90 in the case of the lowland
tapir). The FIT analysis is based on 95% confidence interval ellipses around Reference
Centroid Values (RCV) generated using two canonical variables for each “track” (each animal).
The first step in constructing a specific FIT algorithm is the reduction of the set of
measurements to the variables that will actually be used in FIT analyses. Using a stepwise
technique, a reduced number of measurements with the highest F-ratios (optimum
discrimination) are then selected (14 for lowland tapirs) for the generation of ellipses. The
sets of footprints are then compared in a pair-wise interaction in the presence of the
Reference Centroid Value (RCV) using those 14 variables in the algorithm. The presence or
absence of overlap of the 95% confidence interval ellipses is used as the classifier. If two
“tracks” belong to the same individual then the ellipses should overlap (Figure 4.5.1). With
“tracks” from different individuals there should be an absence of overlap (Figure 4.5.2). The
system is based on being able to accurately identify tracks with 6-8 footprints in the presence
of a constant ‘Reference Centroid Value’ (Jewell et al. 2001; Alibhai et al. 2008).
1 2

134
1
82
83
84
85
86
87
88
89
Ca
no
nic
al2
Ch
uva
A
Ch
uva
B
RC
V
51 52 53 54 55 56 57 58
Canonical1
2
34
35
36
37
38
39
40
41
42
43
Canonic
al2
Chuva AR
CV
Rosin
ha
-24 -23 -22 -21 -20 -19 -18 -17
Canonical1
Figure 4.5. 1- Overlap of 95% confidence interval ellipses of 2 self tapir tracks (Chuva A and Chuva B, adult female) indicating correct identification; 2- Absence of overlap of ellipses of 2 non-self tapir tracks (Rosinha & Chuva A, both adult females) once again indicating correct identification and separation of different individuals.
The FIT algorithm function for lowland tapirs resulted in an overall accuracy of 97% that any
one “track” could be identified correctly. The system was thus very accurate in discriminating
different individuals. Besides developing an algorithm that could discriminate at the individual
level, I wanted to determine gender and age of the tapirs. For this purpose, WildTrack
researchers developed specific algorithms for sex and age class. Based on the age estimates
provided for each captive tapir sampled, five age classes were established: A (0-1 year old), B
(1.1-3), C (3.1-6), D (6.1-10), and E (10.1 and older). The accuracy for gender determination
was 82% and for age determination 83%. It was not possible to validate the accuracy of age
determination, since ages for some of the initial library animals were estimates. The Sorocaba
Zoo and the two breeding facilities in Brazil did not have complete records of the ages of their
tapirs as some of the animals were exchanges from other facilities and some were wild-born.

135
4.2.3.2 Validation of the FIT Algorithm for Lowland Tapirs
Once the initial algorithm was developed, its robustness was tested in two different ways.
First, WildTrack researchers used verification footprints collected from wild tapirs for testing
against the primary database and refining the algorithm. I collected six different sets of
footprint images from unknown wild tapirs in Morro do Diabo (56 pictures taken, average of 9
footprints per set). These sets of footprint images were collected in areas of Morro do Diabo
that were very far apart so I assumed with confidence that I was not photographing footprints
of the same individual. Of these, only five sets were usable. Sets 2, 3 and 5 separated out
completely from the others discriminating three different individuals. Sets 1 and 6 were very
close to each other and they were both classified as females. However, their age classes were
different enough to suggest that they came, in all likelihood, from different tapirs. The
verification sets of footprints from wild tapirs were consistent with the main database in their
characteristics. The initial algorithm appeared to be robust and adaptable for wild tapirs.
The second step on the process of testing the robustness of the algorithm was to build on the
main database with some larger sets of footprints from known captive tapirs. WildTrack
researchers wanted to have a few databases of captive tapirs with 30 footprints per set so
that these sets could be split up into small clusters of footprints from the same animal and
tested against themselves in order to finalise the validation of the algorithm.
In August 2006, I went back to the Sorocaba Zoo and collected sets of footprint images from
four of the tapirs I had photographed previously (2 females and 2 males). I took an average
of 17 footprints per animal, which enlarged the databases of those four tapirs considerably.
Additionally, in January 2007, I collected sets of footprints from two captive lowland tapirs (2
males) from the Houston Zoo Inc. in the United States (60 photos taken - 30 footprints per
set). With this, we had six samples (tapirs) with databases equal or larger than 30 footprints.
Analyses of comparison of clusters of the same animal were carried out, the algorithm was
adjusted and indeed continued to present high accuracy in discriminating between individuals.
After this final step, the algorithm was finalised and the Footprint Identification Technique for
lowland tapirs was ready to be applied in the field.
4.2.3.3 Estimate of Tapir Population Density using FIT
From February to April 2007, I collected 27 sets of left hind (LH) footprint images from wild
lowland tapirs along two internal roads in the central area of Morro do Diabo. The total length
of transect surveyed was 11,535 m (road 1 = 6,400 m; road 2 = 5,135 m). The soil in Morro
do Diabo is very sandy, which is a perfect substrate for finding and photographing tapir
footprints.

136
A total of 393 photos were taken, with an average of 15 footprint images per set. The
maximum number of footprint images per set was 27 and the minimum was 4. Once again, all
photographs were taken in high resolution and following the WildTrack protocol very closely.
The coordinates of every set of footprints photographed was recorded with a GPS. Only fresh
prints were photographed. We avoided the risk of collecting a footprint more than once by
obliterating each footprint after photography. WildTrack researchers processed and analysed
the 27 sets of footprints and determined the number of different individual tapirs identified
through FIT analysis, as well as their gender and age classes.
In order to calculate the Effective Sampled Area (ESA) where the FIT tapir population size (N)
was estimated, I used an approximation of the method applied for camera-trap studies. In
camera-trap studies, the ESA is determined by placing a buffer, equal to ½ the Mean
Maximum Distance Moved (½MMDM) of all ‘recaptured’ animals, around the entire camera
trapping grid, or around each camera station (Karanth 1995). Because most camera studies
lack data on the target animal's home-range, the ½MMDM buffer is used as a proxy for home
range radius (Wilson & Anderson 1985; Karanth & Nichols 2002).
I calculated Maximum Distance Moved (MDM) using different types of data and three
analytical methods. I was interested to evaluate most appropriate way to establish Effective
Sampled Area (ESA) for FIT analysis. The methods were the following:
Method 1 I used the dataset of FIT footprint photos to calculate the Mean Maximum
Distance Moved (MMDM) among locations where the same individual tapir had
its footprints photographed. The MDM was calculated by plotting the GPS
coordinates of photos of the footprints of the same individual tapir in the
software TRACKER1.1 (Camponotus Radio Location Systems AB 1994).
Method 2 I used radio-telemetry results to calculate the Mean Maximum Distance Moved
(MMDM) by 7 tapirs (5 females and 2 males) radio-tracked in the Centre of
Morro do Diabo, where FIT was applied. The MDM for each radio-tracked tapir
was calculated through analysis of their home-ranges estimated by MCP95% in
the software TRACKER1.1.
Method 3 I used data on locations of tapir capture sites to calculate the Mean Maximum
Distance Moved (MMDM) among traps where the same individual tapirs had
been re-captured during the study. For this analysis, I included 17 tapirs (11
females and 6 males) captured and re-captured in five wooden corrals in the
centre of Morro do Diabo, where FIT was applied. The MDM was calculated by
plotting the GPS coordinates of tapir capture and re-capture sites in the
software TRACKER1.1.

137
The results of Mean Maximum Distance Moved (MMDM) were used to calculate three different
values of home range radius (½MMDM), which were then used to establish a buffer around
the total length of the two roads sampled for FIT and calculate Effective Sampled Area (ESA).
Three different results of ESA where the FIT tapir population size (N) was determined were
obtained. The resulting densities of tapirs in the calculated ESAs were then extrapolated to the
entire area of 370 km² of Morro do Diabo, and three different density estimates were
obtained.
4.2.4 Estimates of Lowland Tapir Population Size
I selected one density estimate as the most appropriate from among those estimated for this
study, and used it to derive tapir population sizes in Morro do Diabo and surrounding forest
fragments where the presence of tapirs had been previously confirmed (Ditt 2002).
4.2.5 Comparisons between Density Estimators
I compared the three density estimators used during the study through paired ranking
according to a selected set of criteria including: (i) cost, (ii) requirement of personnel, and (iii)
field effort.

138
4.3 Results
4.3.1 Estimate of Tapir Population Density using Radio-Telemetry Data
The radio-telemetry density estimates were carried out using four analytical methods that
generated six different density results that varied from 0.21 tapirs km-² to 0.43 tapirs km-².
For ease of reference, estimates of tapir population size derived from all radio-telemetry
estimates of tapir density in Morro do Diabo are presented in Table 4.2.
Method 1 - Tapir density was calculated through extrapolating mean tapir home range size to
the entire area of 370 km² of Morro do Diabo. This produced an estimate of 0.21 tapirs km-²
when using KDE95%, and 0.23 tapirs km-² when using MCP95%.
Method 2 - Tapir density was based on subtracting mean home range overlap of 37%
(KDE95%) from the mean tapir home range size of 4.7 km² (KDE95%) and extrapolating the
obtained value to the entire area of 370 km² of Morro do Diabo. This produced an estimate of
0.34 tapirs km-².
Method 3 - Tapir density was based on the number of radio-tracked tapirs (N=19) divided by
the total area which they used, known as the Effective Sampled Area (ESA), and extrapolating
the obtained value to the entire area of 370 km² of Morro do Diabo. This produced an
estimate of 0.33 tapirs km-² when using KDE95%, and 0.43 tapirs km-² when using MCP95%.
Density estimates for both sexes resulted in estimates of 0.31 females km-² and 0.21 males
km-² when using KDE95%, and 0.38 females km-² and 0.26 males km-² when using MCP95%.
Method 4 - Tapir density was based on estimating home range radius and placement of
circular buffers around locations of tapir capture sites using the ESA, and extrapolating the
obtained value to the entire area of 370 km² of Morro do Diabo. This produced an estimate of
0.32 tapirs km-². Density estimates for both sexes resulted in estimates of 0.27 females km-²
and 0.12 males km-².

139
Table 4.2. Estimates of lowland tapir density (tapirs km-²) in Morro do Diabo State Park, São Paulo, Brazil, using radio-telemetry data. Four different analytical methods were applied. Home range size (km²), home range overlap, Effective Sampled Area (km²), and home range radius (m) used for different density estimates, as well as estimates of population size are shown. (N=number of tapirs; F=female; M=male; KDE=Kernel Density Estimator; MCP=Minimum Convex Polygon; NA=not applicable).
Home Range Size (km²)
Overlap
ESA (km²)
Density Estimate (tapirs km-²)
Population Size
Method 1
KDE95% (N=14) 4.7 Not considered NA 0.21 79
MCP95% (N=14) 4.4 Not considered NA 0.23 85
Method 2 KDE95%
(N=14) 4.7 37% NA 0.34 126
Method 3
KDE95% (N=19) NA Considered 57.7 0.33 122
F (N=13) NA Considered 42.3 0.31 females km-² 114 females
M (N=6) NA Considered 28.6 0.21 males km-² 78 males MCP95%
(N=19) NA Considered 44.3 0.43 159
F (N=13) NA Considered 34.0 0.38 females km-² 142 females
M (N=6) NA Considered 22.9 0.26 males km-² 97 males
Method 4
All captured tapirs (N=35) 14 capture sites NA Considered
111 (½MMDM = 1,616 m) 0.32 118
All captured F (N=20) 11 capture sites NA Considered
73 (½MMDM = 1,516 m) 0.27 females km-² 101 females
All captured M (N=15) 9 capture sites NA Considered
121 (½MMDM = 1,834 m) 0.12 males km-² 44 males

140
4.3.2 Estimate of Tapir Population Density using Nocturnal Line-
Transect Sampling
I recorded 81 tapir encounters while walking 1,140 km over 20 months of nocturnal line-
transect tapir censusing in Morro do Diabo. Fifty-two of the encounters (64%) were actual
sightings, and tapirs were heard in 29 occasions (36%). This was equivalent to an average of
4 encounters per month, and 0.1 tapir encounters per km walked. Put another way, it was
necessary to walk 14 km to record a tapir encounter. Forty-one of the encounters took place
in the wet season, and 40 during the dry season.
Most encounters (78%) were of solitary individuals, while 12% of the encounters were of
pairs of tapirs (adult female with adult male or adult female with offspring). In 9% of the
encounters, I could not determine the number of tapirs. On one occasion (1%), three tapirs
were sighted. Tapir encounters took place from 18:42-21:31 h. Most encounters (47%) took
place from 20:00-21:00 h, which coincides with the main peak of tapir activity calculated
through radio-telemetry (Chapter 5). Most encounters occurred during the darker phases of
the moon: 47% during the waning crescent, 21% during the new moon, 18% during the
waxing crescent, and only 14% during the full moon.
The density of tapirs estimated by nocturnal line-transect sampling was 1.35 tapirs km-².
Based on a 95% confidence interval, the minimum density was 0.64 tapirs km-², and the
maximum was 2.86 tapirs km-². For ease of reference, estimates of tapir population size
derived from line-transect sampling estimates of tapir density in Morro do Diabo are presented
in Table 4.3.
Table 4.3. Estimates of lowland tapir density (tapirs km-²) in Morro do Diabo State Park, São Paulo, Brazil, using nocturnal line-transect sampling. Standard error (SE), coefficient of variation (%CV), 95% confidence interval (95%CI), and estimates of population size are shown.
Density Estimate (tapirs km-²)
SE
% CV
95% CI (tapirs km-²)
Population Size
1.35
0.454
33.69
0.64-2.86
237-499-1058
4.3.3 Estimate of Tapir Population Density using Footprint Identification
Technique (FIT)
4.3.3.1 FIT Identification of Individual Tapirs
The analyses of the 27 sets of footprint images from tapirs in the centre of Morro do Diabo
identified 13 different individuals in the sample. Gender wise, these included 10 females and 3
males. Age wise, identified animals included 1 individual in category A (0-1 year old), 6 in

141
category C (3.1-6), 1 in D (6.1-10), and 4 in E (10.1+). Tapir #1 could not be discriminated
between categories C and D (Table 4.4). Because the analytical methods employed were
deterministic rather than stochastic, it was not possible to attach confidence intervals to the
figures. The accuracy of correct classification was over 90%.
With regard to relatedness of “tracks” (sets of footprints), while 11 tapirs were represented by
either one or two tracks, Tapir #7 (female) was represented by 8 tracks and Tapir #10 (male)
was represented by 5 tracks. This could be an indicative that Tapirs #7 and #10 could be the
main reproductive pair in the sampled area in the centre of Morro do Diabo. Another indicative
of social organisation was the fact that Tapir #4, a juvenile male (predicted age ≤12 months),
had its tracks (Tracks 4 and 22) in close association with the tracks of Tapir #3 (Tracks 3 and
21), an adult female. The classification of Tapir #4 as a juvenile is very accurate given that
age class A (≤12 months) ellipse in a two-way canonical plot separates out very clearly from
the rest of the age classes. Looking at the footprint collection dates, it is noticeable that the
images for adult female Tapir #3 were collected on the same dates as those of the juvenile
Tapir #4. Moreover, the track numbers are in sequence i.e. Track 3 (mother) & Track 4 (calf),
and Track 21 (mother) & Track 22 (calf) (Table 4.4).
Table 4.4. Relatedness of the 27 sets of footprints of wild lowland tapirs in Morro de Diabo State Park, São Paulo, Brazil, determined by FIT. The gender/age classes were established independent of track relatedness. For Tapir #1 the age class could not be separated out to a single category. Age classes were: A (0-1 year), B (1.1-3), C (3.1-6), D (6.1-10), and E (10.1+).
Tapir ID
Footprint Set # & Relatedness
Date of Collection
Gender Age Class
1 01 28 February 2007 Female C/D 2 02
05 28 February 2007 28 February 2007
Female D
3 03 21
28 February 2007 10 April 2007
Female C
4 04 22
28 February 2007 10 April 2007
Male A
5 06 28 February 2007 Male C 6 07 28 February 2007 Female E 7 08
09 14 15 16 18 19 27
01 March 2007 01 March 2007 03 April 2007 03 April 2007 03 April 2007 03 April 2007 03 April 2007 10 April 2007
Female E
8 10 01 March 2007 Female C 9 11 01 March 2007 Female E 10 12
13 17 23 26
01 March 2007 01 March 2007 03 April 2007 10 April 2007 10 April 2007
Male C
11 20 10 April 2007 Female C 12 24 10 April 2007 Female E 13 25 10 April 2007 Female C

142
4.3.3.2 Estimate of Tapir Population Density using FIT
The FIT density estimates were carried out using three different analytical methods, resulting
that generated three different results that varied from 0.26 tapirs km-² to 0.43 tapirs km-².
For ease of reference, all estimates of tapir population size derived from FIT estimates of tapir
density in Morro do Diabo are presented in Table 4.5.
Method 1 was based on calculating MMDM in between locations where the same individual
tapir had its footprints photographed through FIT. This method resulted in a home range
radius of 1,091 m (ESA=30 km²) and a tapir density of 0.43 tapirs km-². Density estimates for
both sexes resulted in estimates of 0.33 females km-² and 0.10 males km-².
Method 2 was based on calculating MMDM within the home ranges of seven tapirs radio-
tracked in the centre of Morro do Diabo. This method resulted in a home range radius of
1,672 m (ESA=50 km²) and a tapir density of 0.26 tapirs km-². Density estimates for both
sexes resulted in estimates of 0.20 females km-² and 0.06 males km-².
Method 3 was based on calculating MMDM among traps where the same individual tapirs had
been re-captured during the study. This resulted in a home range radius of 1,270 m (ESA=36
km²) and a tapir density of 0.36 tapirs km-². Density estimates for both sexes resulted in
estimates of 0.28 females km-² and 0.08 males km-².
Table 4.5. Estimates of lowland tapir density (tapirs km-²) in Morro do Diabo State Park, São Paulo, Brazil, using FIT data. Four different analytical methods were applied. Values of ½MMDM - Mean Maximum Distance Moved (home range radius, in m) and ESA - Effective Sampled Area (km²) used for different density estimates, as well as estimates of population size are shown. (N=number of tapirs; F=female; M=male).
½MMDM
(m)
ESA (km²)
Density Estimate (tapirs km-²)
Population Size
Method 1
Tapirs Footprinted 1,091
30
0.43 159 F (N=10) 0.33 females km-² 122 females M (N=3) 0.10 males km-² 37 males
Method 2
Radio-tracked Tapirs 1,672
50
0.26 96 F (N=10) 0.20 females km-² 74 females M (N=3) 0.06 males km-² 22 males
Method 3
Traps/Recaptures 1,270
36
0.36 133 F (N=10) 0.28 females km-² 103 females M (N=3) 0.08 males km-² 31 males

143
4.3.4 Estimate of Lowland Tapir Population Sizes in Morro do Diabo
State Park and Surrounding Atlantic Forest Fragments of the Pontal do
Paranapanema Region
The lowland tapir densities estimated by radio-telemetry, nocturnal line-transect sampling,
and Footprint Identification Technique (FIT) varied from 0.21 tapirs km-² to 1.35 tapirs km-². I
selected one of the density estimates (radio-telemetry Method 2, 0.34 tapirs km-²), as the
most appropriate within the study for estimating population size. This estimate was selected
based on two main reasons. First, it incorporated the mean home range size of 4.7 km² and
mean home range overlap of 37% calculated for the 14 tapirs radio-tracked from 8-36
months. Thus, this estimate was strongly based on the ranging parameters of tapirs whose
home ranges had reached asymptotes during their periods of monitoring. Second, this
estimate was based on home range size and home range overlap calculated by Kernel Density
Estimator (KDE). KDE is widely viewed as the most reliable method of home range estimate in
ecology (Powell 2000; Kernohan et al. 2001; Hemson et al. 2005).
Therefore, I used this radio-telemetry density estimate to derive tapir population sizes in
Morro do Diabo and seven other forest fragments where the presence of tapirs had been
previously confirmed (Ditt 2002) (Figure 4.6). According to the selected density, there were
126 tapirs in Morro do Diabo and ~22 additional individuals distributed in the seven forest
fragments. This resulted in a total number of ~148 tapirs in the entire Pontal do
Paranapanema Region.
For reference, I also selected one tapir density calculated by nocturnal line-transect and one
calculated by FIT for the estimate of tapir population sizes. The overall tapir density estimate
obtained through line-transect (1.35 tapirs km-²) was considered to be overly high. I decided
to be conservative and selected the lower value of the DISTANCE 95%CI (0.64 tapirs km-²) as
a tolerable, although still very high, tapir density for the area. The resulting estimates were
237 tapirs in Morro do Diabo and 40 in the fragments, resulting in a total of ~277 tapirs in the
entire Pontal do Paranapanema Region. Among the estimates obtained by FIT, I selected the
one calculated through Method 1 (0.43 tapirs km-²). Although high, this was the only FIT
estimate totally based on the FIT's dataset of footprints, which could therefore allow for a full
assessment of the effectiveness of the use of this technique without the support of other data.
The resulting estimates were 159 tapirs in Morro do Diabo and 27 tapirs in the fragments,
resulting in a total of ~186 tapirs in the entire Pontal do Paranapanema Region.

144
Figure 4.6. Map of Morro do Diabo State Park (MDSP) and seven surrounding forest fragments in the Pontal do Paranapanema Region, São Paulo, Brazil, where the presence of tapirs was confirmed (Ditt 2002). (MDSP: Morro do Diabo State Park; SMC: Santa Maria/Cachoeirinha; PB: Ponte Branca; ASEA: Água Sumida/Estrela da Alcídia; LN; Lua Nova/Santa Tereza da Água Sumida; SMM: Santa Maria dos Micos; SMSP: Santa Mônica/São Paulo; RB: Ribeirão Bonito). Note: SMC, ASEA, and PB are three of the four forest fragments encompassed by the Black-Lion-Tamarin Ecological Station. Figures 2.5 and 2.6 (Chapter 2) provide further reference on the location of Morro do Diabo State Park.
SMSP
MDSP
RB
SMSP
PB
LN
SMM
ASEA
SMC

145
Table 4.6. Estimates of lowland tapir population size in Morro do Diabo State Park (MDSP) and seven surrounding forest fragments in the Pontal do Paranapanema Region, São Paulo, Brazil, where the presence of tapirs was confirmed (Ditt 2002). Density estimates were obtained by radio-telemetry, nocturnal line-transect sampling, and Footprint Identification Technique (FIT).
MDSP & Forest Fragments
Area (km²)
Population Size (number of individuals)
Radio-Telemetry 0.34 tapirs km-²
FIT 0.43 tapirs km-²
Line-Transect 0.64 tapirs km-²
Morro do Diabo State Park (MDSP) 370 126 159 237
Santa Maria/Cachoeirinha (SMC) 18.3 6 8 12 Ponte Branca (PB) 13.0 4 6 8 Água Sumida/Estrela da Alcídia (ASEA) 12.1 4 5 8 Lua Nova/Santa Tereza da Água Sumida (LN) 5.4 2 2 3 Santa Maria Micos (SMM) 5.1 2 2 3 Santa Mônica/São Paulo (SMSP) 4.9 2 2 3 Ribeirão Bonito (RB) 4.2 2 2 3
Total number of Tapirs in Forest Fragments 22 27 40
Total number of Tapirs in the Pontal do Paranapanema Region (MDSP + fragments)
148
186
277

4.3.5 Comparison between Density Estimators
The three density estimators - radio-telemetry, nocturnal line-transect sampling, and Footprint
Identification Technique (FIT) - were compared against each other based on the following
criteria: (i) cost, (ii) requirement of personnel, and (iii) field effort (Table 4.7). It is important
to note that the costs considered here involved only the implementation of the density
estimators in the field, but excluded costs associated with data analysis.
Paired ranking resulted in the lowest score (0) for radio-telemetry. Radio-telemetry is by far
the most expensive method, it requires large, multidisciplinary field teams for the different
phases of the process (captures and monitoring among others), and its application requires a
considerable field effort. Nocturnal line-transect sampling received a medium score (3). While
this method does not require large field teams, it is relatively expensive as it requires
extended periods of data collection in order to obtain the minimum number of sightings for
DISTANCE analysis. FIT received the highest score (6). This method is inexpensive, it does not
demand more than one or two team members for its application in the field, and it does not
require large amounts of field effort.
Table 4.7. Paired ranking score of the three density estimators (radio-telemetry, nocturnal line-transect sampling, and Footprint Identification Technique) used during the lowland tapir study in Morro do Diabo State Park, São Paulo, Brazil. The criteria for ranking included cost, personnel, and field effort.
Density Estimator
Cost
Personnel
Field Effort
Score
Radio-Telemetry High High High 0
Nocturnal Line-Transect Sampling Medium Low Medium 3
Footprint Identification Technique (FIT) Low Low Low 6

147
4.4 Discussion
4.4.1 Methodological Considerations on the Estimate of Tapir Population
Size
Making accurate estimates of animal population size is very complex. Direct counts of animal
populations are exceptionally difficult, if not impossible, to obtain. Animals are frequently
difficult to capture or observe, and the associated costs and effort of making absolute counts
are often prohibitive (Gittleman 1996). Thus, animal ecologists have no other alternative but
to rely on indirect methods that provide indices of population abundance that are then applied
to derive or estimate population size.
When selecting methods for estimating animal density, animal ecologists must be cautious to
weigh the advantages and disadvantages of available methods and to make appropriate
choices based on the circumstances in which they are working. The choice of a technique
must consider the characteristics of the species being studied, the aim of the census, the
degree of accuracy required, the costs involved, as well as the features of the environment
(Caughley 1977; Seber 1973; Burnham et al. 1980; Riney 1982). Previous studies on lowland
tapirs have applied a number of different methods to estimate population density including:
radio-telemetry, diurnal and nocturnal line-transect sampling, and camera-trapping (Chapter
2, Table 2.7 provides a compilation of density estimates and bibliographical references). While
methods of estimating animal population density have received considerable theoretical
attention (Burnham et al. 1980; Clarke 1986; Pollock & Kendall 1987; Norton-Griffiths 1988;
Buckland et al. 1993; Campbell & Borner 1995), empirical comparisons of methods have been
less rehearsed (White et al. 1989; Bergstedt & Anderson 1990; Pojar et al. 1995; Noss et al.
2003; Soisalo & Cavalcanti 2006; Trolle et al. 2007; Dillon & Kelly 2008). Noss et al. (2003)
used radio-telemetry simultaneously with camera-traps to estimate lowland tapir ranging
parameters and population density in Kaa-Iya del Gran Chaco National Park, Bolivia. Trolle et
al. (2007) used camera-trapping and diurnal line-transect sampling to estimate tapir density in
a site of the Brazilian Pantanal. Nevertheless, to my knowledge, this long-term study in Morro
do Diabo is the only one to date where three different methods to estimate population density
- radio-telemetry, nocturnal line-transect sampling and Footprint Identification Technique -
were used simultaneously on the same population.
4.4.1.1 Comparing Density Estimators: Cost, Personnel, and Field Effort
When comparing the three density estimators using the criteria of cost, requirement of
personnel, and demand for field effort, radio-telemetry received the lowest score. Radio-
telemetry was, without any doubt, the most expensive of all three methods. The use of radio-

148
telemetry requires the purchase of very expensive pieces of equipment, large, multidisciplinary
field teams, and considerable field effort. In terms of equipment, the purchase of 10 VHF
radio-collars, one telemetry receiver, and a directional antenna for a telemetry study can
easily cost over US$5,000. The costs escalate if GPS telemetry technology is used. Nowadays,
a simple store-on-board GPS collar equipped with a VHF beacon and a drop-off component
costs over US$3,000. In addition, the use of radio-telemetry requires the purchase of all the
equipment and supplies necessary for the capture and immobilisation of the animals. These
include a multitude of different items such as materials for trap construction, capture
equipment such as CO2 rifles and pistols, CO2 cartridges, blow-pipes, darts, telemetry
transmitters for darts (highly recommended when using the dart shooting capture method),
drugs for chemical restraint (anaesthetics, reversal drugs, safety drugs among others), and all
the veterinary gear for anaesthesia monitoring. The cost to build one wooden corral trap can
be as high as US$850, including materials (wood, nails, rope, wire mesh among others),
transportation of materials to the study site, and stipends for the personnel involved in the
construction (usually 3-4 people). The cost of immobilising one individual tapir, including only
the drugs can be as high as US$500. If the researcher chooses to take advantage of having
an anaesthetised animal on his/her hands to collect samples of biological materials for
epidemiological and genetic studies - which is strongly recommended given the urgent need
for these types of information on tapirs - then an assortment of different types of materials for
the collection, processing and storage of the samples is necessary.
An important factor that must be considered relies on the fact that most of the companies that
manufacture reliable telemetry and capture equipment are based in the United States or
Europe, usually far away from the countries where field research is being carried out. As a
consequence, in order to purchase the equipment they need, researchers have to go through
the process of importing the equipment, which almost always proves to be bureaucratic, time-
consuming and expensive. In addition, in the case of equipment failure the malfunctioning
item has to be sent back to the international company for repair, which incurs in more time
lost and expenses.
Overall, the use of radio-telemetry demands considerable field effort on the part of the
research team, particularly if using VHF telemetry, which requires radio-tracking animals. The
results of this long-term telemetry study in Morro do Diabo showed that a minimum of 20
months of data collection is necessary to determine home range size for adult tapirs. For sub-
adults, 32 months are needed. In addition, it is necessary to radio-track a large number of
tapirs to have an adequate dataset to precisely estimate home range overlap, another
important parameter for the estimate of population size. Radio-tracking a large number of
different individuals for long periods of time can be very demanding. Thus, another significant
cost that must be considered when budgeting for a tapir telemetry study is transportation.

149
During this study in Morro do Diabo, I radio-tracked tapirs mostly by car and the monthly
expenses with fuel and car maintenance were considerably high. Sometimes airplanes are
required for radio-tracking tapirs in remote areas.
In terms of personnel, the use of radio-telemetry requires large, multidisciplinary field teams
for the different phases of the process. A minimum of three people is needed to build a corral
trap. The construction of a pitfall trap requires 4-5 people. More importantly, the capture
process requires the presence of at least one wildlife veterinarian to be in charge of
immobilising animals, monitoring anaesthesia, and performing other procedures such as
collection of biological samples. Forty-four tapir immobilisations and manipulations were
carried out during this long-term study in Morro do Diabo, and the chemical restraint of free-
ranging tapirs proved to be challenging. The involvement of a veterinarian who can select a
safe anaesthetic protocol and carefully monitor the animals during anaesthesia will
significantly reduce intrinsic risks of the capture process. Veterinarians are the only
professionals qualified to quickly identify anaesthetic depression and take the appropriate
measures. Thus, any researcher planning on capturing and immobilising tapirs in the wild
must budget for a stipend for a well-experienced wildlife veterinarian.
Nocturnal line-transect sampling received a medium score. Neither large field teams nor a lot
of equipment are necessary for the application of this method. Two people equipped with
headlamps, a spotlight, a compass and a notepad can carry out the census. However,
extended periods of data collection are needed in order to obtain the minimum number of
observations required for DISTANCE analysis. For the study in Morro do Diabo it was
necessary to accumulate 20 months of data collection and 1,140 km walked in order to obtain
the minimum number of sightings. This was a considerable field effort and incurred in
substantial expenses including stipends for the personnel involved as well as costs of
transportation to and from the field site for 8 nights per month. There is also the danger of
working at night.
The Footprint Identification Technique (FIT) received the highest score. This method is fairly
inexpensive when compared to the others. The only pieces of equipment required for the
application of FIT in the field are a good digital camera capable of taking high resolution
pictures, a GPS unit, two rulers and a notepad, which are more often than not already
available in most research programmes. The expenses involved in the use of FIT in the field
included mostly the costs of transportation to and from the field site once a week. In addition,
FIT does not demand more than 1-2 people for data collection. Furthermore, FIT does not
require large amounts of field work. In Morro do Diabo, it was possible to walk through the
entire length of the sampled roads and photograph as many as 5-7 different sets of tapir
footprints in a single morning. However, the FIT sampling in Morro do Diabo was carried out

150
for only three months and the results indicate that it would have been advisable to continue
sampling for a longer period of time. It would have increased the probability of photographing
and identifying all the different tapir individuals in the sampling area. However, even if I had
increased the FIT sampling in Morro do Diabo, there would be still a smaller demand of field
work when compared to nocturnal line-transect sampling and radio-telemetry.
Nonetheless, while the actual use of FIT in the field was inexpensive, practical and very
straight forward, a great deal of time and financial resources were necessary to develop and
validate the FIT algorithm for lowland tapirs until it was ready to be applied in the field. The
creation of the reference library of footprint images from captive tapirs was exceptionally
time-consuming and incurred in quite a few related costs, including travelling expenses for
several trips to the Sorocaba Zoo in São Paulo. Most importantly, the development of FIT for
lowland tapirs required considerable amounts of time and financial resources on the part of
WildTrack researchers who processed almost 1,000 tapir footprint images initially added to the
reference library, developed and validated the algorithm, and later analysed hundreds of tapir
footprint images collected in the field in Morro do Diabo. The entire process took almost three
years. Regardless, these are one-off costs now that the algorithm for lowland tapirs has been
established and is ready to be used by other lowland tapir researchers whenever appropriate.
It is important to point out that FIT may not be a suitable methodology to be used inside
dense forest. FIT is heavily dependent on the likelihood of finding long, clear sets of
footprints, which may be unlikely inside the forest. In Morro do Diabo, I benefited from using
internal dirt roads inside Morro do Diabo, where I had a perfect, sandy substrate to work with.
There have been attempts to sample lowland tapir footprints for the use of FIT in the Peruvian
Amazon, but the resulting sets of photos were not satisfactory for FIT analyses. The great
majority of the footprints were photographed in deep mud substrate in the vicinities of salt
licks or in the forest floor usually covered with leaves, therefore not providing a clear view of
the contours of the footprints.
4.4.1.2 Comparing Density Estimators: Invasiveness of the Method
Another criterion I would like to add to the discussion of advantages and disadvantages of
each methodology used is the level of invasiveness of the method. There is a growing trend in
wildlife biology toward research methods that are less invasive. Over the past few years, the
wildlife research community has been working on the development and application of several
non-invasive field research techniques using sign survey methods for gaining information
about animal populations. Some examples of animal signs that can be used include footprints,
pictures taken by camera-traps, faecal and hair samples (Van Dyke et al. 1986; Koster & Hart
1988; Petrak 1990; Putman 1990; Smallwood & Fitzhugh 1993; Smallwood & Fitzhugh 1995;
Zielinski & Stauffer 1996; Komers & Brotherton 1997; Noss et al. 2003). Indeed, non-invasive

151
genetic methods have recently been developed and applied to estimate population sizes
through DNA extracted from animal samples such as faeces and hair (Kohn et al. 1999; Banks
et al. 2003; Eggert et al. 2003; Flagstad et al. 2004; Bellemain et al. 2005). Indirect methods
have advantages in that they are relatively inexpensive, logistically straightforward and they
do not require direct contact with the target animals (Putman 1984; Clevenger 1993).
While telemetry studies provide researchers with unparalleled data on ranging behaviour and
habitat use among others, it is an extremely invasive method as it requires the capture and
immobilisation of the animals for the placement of radio-collars. In most cases, animals must
be recaptured several times for replacement or removal or collars. This is an important issue
as there is a rapidly growing body of empirical evidence outlining the behavioural and
physiological effects of repeat immobilisation and concomitant capture stress (Alibhai et al.
2001a; Alibhai et al. 2001b). Line-transect sampling does not require direct manipulation of
the animals, but it can still affect animal behaviour through the encounters during data
collection. The Footprint Identification Technique, on the other hand, is completely non-
invasive as it does not require any type of contact between the researcher and the study
animal. FIT was developed under the principle that the future of wildlife conservation depends
to a large extent on the development of non-invasive methods of censusing and monitoring
wildlife populations. For species which inhabit a landscape in which individuals regularly
produce clear footprints and whose foot is of sufficient complexity to create a footprint with
individual characteristics, tracks may serve as an alternative for natural marks. When
compared with more direct methods, such as mark-recapture or radio-tracking, the data
gained from sign surveys may not be as rigorous (Servin et al. 1987). However, while it is
very difficult and time-consuming to capture a large enough number of animals for a
telemetry study, using non-invasive methods researchers can sample larger number of
animals.
An indirect, non-invasive method that has been commonly used to study lowland tapirs is
camera-trapping (Noss et al. 2003; Trolle et al. 2007). Noss et al. (2003) used camera-traps
simultaneously with telemetry to estimate lowland tapir ranging behaviour and population
density in Kaa-Iya del Gran Chaco National Park, Bolivia, and compared both methods. The
authors noted that while radio-telemetry provided considerably more precise and complete
information on ranging patterns, camera-trapping provided more precise density estimates.
However, while camera traps are acknowledged as important tools for monitoring cryptic
species and estimating population size of naturally marked animals by means of well
consolidated capture-recapture models (Karanth 1995; Karanth & Nichols 1998), their ability
to individually identify non-spotted or non-striped animal species such as lowland tapirs is
debatable (Oliveira-Santos et al. 2009).

152
4.4.1.3 Comparing Density Estimators: Accuracy of Estimates
Ten different estimates of tapir population density for Morro do Diabo were obtained: 6
estimates were obtained through 4 different analytical methods using radio-telemetry data; 1
was obtained by nocturnal line-transect sampling; and, 3 were obtained through 3 analytical
methods using data from Footprint Identification Technique (FIT). The resulting tapir densities
varied from a low estimate of 0.21 tapirs km-² to a high estimate of 1.35 tapirs km-². Thus, it
was deemed necessary to examine this variation in density estimates as well as the accuracy
of each method before using any of these estimates to calculate tapir population sizes.
Karanth (1995) has argued that the presence of untagged animals in the population limits the
usefulness of the radio-telemetry approach for estimating population density. In other words,
the fact that it may not be possible to radio-collar all resident individuals in a given area can
lead to an underestimation of population density, which will in turn affect the estimate of
population size. Nevertheless, the main strength of most telemetry density estimates relies on
the fact that they are strongly based on animal ranging behaviour parameters. This is deemed
to be correct in long-term studies during which a large number of individuals is monitored
therefore providing precise results of home range size and home range overlap, which is the
case of this study in Morro do Diabo.
The tapir population density obtained by radio-telemetry Method 2 (0.34 tapirs km-²) was
considered to be the most appropriate estimate within the study, and all the other estimates
were compared against it. This density estimate took into consideration the mean home range
size of 4.7 km² and mean home range overlap of 37% calculated for the 14 tapirs radio-
tracked from 8-36 months. At any rate, two other radio-telemetry density estimates provided
very similar results. Radio-Telemetry Method 3, based on the number of radio-tracked tapirs
divided by the Effective Sampled Area (KDE95%) and extrapolation of the obtained value to
the entire area of 370 km² of Morro do Diabo, resulted in an estimate of 0.33 tapirs km-².
Radio-telemetry Method 4, based on the calculation of mean values of home range radius and
placement of circular buffers around locations of tapir captures to calculate Effective Sampled
Area, resulted in an estimate of 0.32 tapirs km-². These three density estimates incorporated
home range overlap in some manner, while radio-telemetry Method 1, based on the
extrapolation of mean tapir home range size to the entire area of 370 km² of Morro do Diabo,
did not. Therefore, Method 1 resulted in considerably lower density estimates of 0.21 tapirs
km-² (KDE95%) and 0.23 tapirs km-² (MCP95%).
Results provided in Chapter 3 demonstrated that tapirs in Morro do Diabo exhibited extensive
home range overlap between neighbouring individuals, usually around 30%, but sometimes as
high as 90%. Extensive overlap was observed between pairs of the same and different sexes,

153
as well as between pairs of same and different age classes. In addition, several examples of
strong overlap of core areas of use were observed. Other studies on tapirs have also identified
high percentages of home range overlap. Noss et al. (2003) obtained a mean home range
overlap of 43.5% for lowland tapirs in Kaa-Iya del Gran Chaco National Park, Bolivia. In the
same site in Bolivia, Ayala (2003) found home range overlaps of 80% between an adult male
and a juvenile male, and a 30% overlap between the same juvenile male and an adult female.
Foerster & Vaughan (2002) observed a mean home range overlap of 33.2% for Baird's tapirs
in Corcovado National Park, Costa Rica. Thus, it appears to be critical that a density estimator
for tapir species incorporates home range overlap in order not to underestimate population
size.
The great majority of lowland tapir density estimates available in the literature have been
obtained by diurnal line-transect sampling (Bodmer et al. 1994; Cullen et al. 2000; Peres
2000; Zimmerman et al. 2001; Cordeiro 2004; Desbiez 2010). However, most studies on
lowland tapir activity patterns have demonstrated that this species is primarily nocturnal and
crepuscular (Ayala 2002; Maffei et al. 2002; Wallace et al. 2002; Ayala 2003; Noss et al. 2003;
Trolle 2003; Goméz et al. 2005; Tobler 2008). Indeed, the results on tapir activity patterns
obtained through this telemetry study in Morro do Diabo have confirmed this pattern (Chapter
5). Therefore, a critical methodological question presents itself. Would not nocturnal line-
transect sampling be a more suitable technique for assessing lowland tapir population density
and surveying tapir populations? Answering this question would not be beneficial only to
lowland tapirs, but to all four tapir species.
Cullen et al. (2000) carried out a diurnal line-transect mammal survey in Morro do Diabo, and
obtained an estimate of lowland tapir density for the area. In 2006, I started a nocturnal line-
transect sampling for the species in Morro do Diabo, to attempt to answer the question above.
Thus, I selected the same line-transects used by Cullen et al. (2000) (internal dirt roads
distributed throughout the area of Morro do Diabo) so that our results could be compared.
While Cullen et al. (2000) censused his transects from 06:00-10:00 h, and again from 15:00-
19:00 h, with a much greater sampling effort for diurnal species, I concentrated the sampling
effort on the main period of tapir activity in Morro do Diabo. Telemetry results from Morro do
Diabo had already shown that the main period of activity of monitored tapirs was from 19:00-
24:00 h, with a strong peak between 20:00-21:00 h (63% active). Therefore, I designed the
nocturnal line-transect census to be carried out from 18:00-23:00 h, focusing data collection 2
hours before, during, and 2 hours after the main peak of tapir activity. In fact, the nocturnal
line-transect sampling itself obtained the highest percentage of tapir encounters (47%) from
20:00-21:00 h, corroborating the results obtained by telemetry.

154
The results obtained by nocturnal line-transect sampling were largely different when
compared to results obtained by Cullen et al. (2000). Cullen et al. (2000) had 8 tapir sightings
with a sampling effort of 18 months of data collection, and obtained a tapir density estimate
of 0.41 tapirs km-² (95%CI, 0.20-0.84 tapirs km-²). During the nocturnal census, I had 81
tapir encounters (actual tapir sightings or tapirs that were heard) in 20 months of data
collection and 1,140 km walked, and obtained a tapir density of 1.35 tapirs km-² (95%CI,
0.64-2.86 tapirs km-²). It was thus evident that concentrating line-transect sampling during
peaks of tapir activity increased the number of tapir sightings and consequently the density
estimate. The reliability of line-transects to estimate density depends largely on the sample
size of observations (Burnham et al. 1980; Buckland et al. 1993; Wilson et al. 1996).
However, while the higher number of sightings obtained by nocturnal line-transect sampling
provided some indication that this could be a more suitable method to survey tapirs, the
resulting density estimate appeared to be exceedingly high for the species, particularly in the
semi-deciduous forests of Morro do Diabo. This becomes particularly evident when comparing
this estimate with the tapir density previously selected as the most appropriate within the
study in Morro do Diabo (0.34 tapirs km-², radio-telemetry Method 2). I identified two very
high estimates of lowland tapir density in the available literature: 2.20-2.50 tapirs km-² in the
Atlantic Forest of the Interior of Paraná State, Brazil (Rocha 2001), and 3.3-3.7 tapirs km-² in
the dry Amazon forests of Maracá Ecological Station in Roraima State, Brazil (Mendes-Pontes
2004). However, these studies applied non-replicable or questionable methods, and are
therefore not comparable to the results of this study.
The overly high density estimate obtained by nocturnal line-transect sampling might be
related to three different factors. First, I obtained a high frequency of encounters with tapirs
walking on the roads (transects). Harmsen et al. (2009) used camera-trap and track data to
analyse the detection probabilities of several Neotropical mammals on trails in dense
secondary forests in Belize. While the camera-trap capture rates of Baird's tapirs were high in
off-trail locations, Baird's tapir tracks were only found following trails. Harmsen et al. (2009)
observed that half of the tapir footprint sets re-entered the forest within 1 km, indicating that
they left larger trails and created their own paths through the forest. During this study in
Morro do Diabo, I observed the same pattern. Long sets of tapir footprints were constantly
observed along the internal roads of Morro do Diabo, many of them used as line-transects for
nocturnal line-transect sampling. Tapirs regularly used these roads to travel in between
different parts of their home ranges and this violates the DISTANCE sampling assumption that
animals are randomly distributed. However, I still had to use these roads as line-transects so
that the results of this study could be compared to Cullen et al. (2000). The second factor
relies on the fact that one of the line-transects (Figure 4.1, line-transect 8, Aeroporto) was
located along the south eastern border of Morro do Diabo, and one of its sides (opposite to
the forest edge) was a crop field. As a consequence, on the crop field side of this particular

155
transect, I had a visibility of over 100 m and a number of tapirs were sighted within that
range. Both of these problems were identified in the very beginning of DISTANCE analysis. In
an attempt to solve them, I established left data truncation at distance 0.1 m and right
truncation at 35 m (estimated maximum visibility in the forested environment of Morro do
Diabo), and the DISTANCE's Data Filter discarded all outliners from the dataset. This
procedure should have solved these problems.
The third factor which may have also contributed to the high density estimate obtained by
nocturnal line-transect was, once more, related to the transect that bordered the crop field.
For the most part of the 20 months of nocturnal census, this field was planted with corn and
tapirs appeared to be attracted to it. As a consequence, this was the line-transect where I had
the highest percentage of tapir encounters (39%), also probably due to the fact that I was
censusing during peaks of tapir activity. The other seven transects presented nearly even
percentages of encounters. Given that DISTANCE assumes a random distribution of animals
throughout the study area, the high percentage of tapir encounters in this particular transect
most certainly affected the final density estimate. Thus, this transect should probably have
been removed from the analysis. One might argue that another factor that could have led to
this high density estimate could be double counting of individual tapirs along the line-transect.
However, I have no evidence that this has happened.
This was the very first study to attempt the application of WildTrack's Footprint Identification
Technique (FIT) for the estimate of tapir population density. The only previous study to apply
a similar approach was carried out on mountain tapirs in Los Nevados National Park,
Colombia, using a multivariate analysis of eight variables measured in left rear mountain tapir
footprints to estimate population density (Lizcano & Cavelier 2000a).
The analyses of 27 sets of tapir footprint images photographed in a section of Morro do Diabo
successfully identified 13 different individuals in the sample, including 10 females and 3 males.
The lowland tapir foot proved to be of sufficient complexity to create footprints with specific
characteristics appropriate for individual identification. The accuracy of correct classification of
the FIT algorithm for lowland tapirs was over 90%.
Among the density estimates obtained by FIT, the one where Effective Sampled Area (ESA)
was based on the home range radius provided by the mean distance between photos of
footprints of the 13 identified tapirs (Method 1), resulting in an estimate of 0.43 tapirs km-²,
was the only estimate completely based on the FIT's dataset of footprints. The other two FIT
density estimates were based on either home range (Method 2) or capture-recapture (Method
3) data to calculate home range radius. Thus, Method 1 was the only one to provide a density

156
estimate that could allow for a full assessment of the reliability of this technique on estimating
tapir density without the support of other data.
The home range radius calculated by FIT Method 1 was 1,091 m, which was much lower than
the home range radius obtained from the home range size of the seven tapirs radio-tracked in
the centre of Morro do Diabo (1,672 m, FIT Method 2) or from data on tapir capture-recapture
in different traps (1,270 m, FIT Method 3). Therefore, the FIT estimate through Method 1
resulted in a smaller ESA and a higher density estimate, when compared to Methods 2 and 3.
When compared to the selected density estimate obtained by radio-telemetry Method 2 (0.34
tapirs km-²), the FIT estimate of 0.43 tapirs km-² appears to overestimate tapir density in
Morro do Diabo. This may be attributed to three different factors. First, the area sampled for
FIT (two internal dirt roads in the centre of Morro do Diabo) may not have been large or
inclusive enough to cover the entire home ranges of the 13 identified tapirs. This may have
led to an underestimate of home range radius, thus resulting in a smaller ESA and a higher
estimate of density. This provides evidence that it would have been advisable to sample a
larger area. The fact that data collection was concentrated on the roads might have been a
limiting factor as well, given that tapirs might have used these roads intensively. Second, the
FIT sampling in Morro do Diabo was carried out for only three months and it is quite possible
that I have not managed to photograph the footprints of all resident tapirs in the area. The
cumulative curve of number of different individual tapirs identified over time did not reach an
asymptote. Therefore, it is probable that had I continued sampling the area for a longer
period of time, additional tapirs would have been identified, thus changing the final density
estimate. Third, the 1,091 m FIT estimate of home range radius was considerably lower than
the mean home range radius obtained by radio-telemetry (1,616 m, Chapter 3, Table 3.5),
which is by itself evidence that the FIT home range radius was underestimated.
Noss et al. (2003) noted that the buffer width estimated from mean maximum distance
covered by individual lowland tapirs during camera trap surveys (1.2-1.3 km) was very similar
to the average of half the distance across home ranges of five radio-tracked individuals (1.35
km), which confirmed that the ESA was measured appropriately. On the other hand, Soisalo &
Cavalcanti (2006) used both camera-traps and radio-telemetry to study jaguars in the
Brazilian Pantanal and noted that the jaguar home range radius calculated by radio-telemetry
was twice the length of the radius calculated by photo captures. Therefore, Soisalo &
Cavalcanti (2006) suggested that the home range radius calculated from camera-traps can be
underestimated and consequently overestimate jaguar density.
FIT was designed by WildTrack researchers to survey “closed” animal populations with the
final result being total animal counts. The use of FIT to sample a small, “open” section of

157
Morro do Diabo and then extrapolate the estimated tapir density in an ESA to the entire area
of 370 km² of Morro do Diabo proved to be quite a challenge. The main difficulty was the
determination of ESA. At any rate, if the projected figure of 13 lowland tapirs for the sampled
section of Morro do Diabo is deemed to be correct, then this indicates that FIT could be a
practical and reliable method for censusing and monitoring lowland tapir populations in
habitats where individuals regularly produce clear footprints. Moreover, since this method is
based on track versus track comparisons, it would be a reliable method for monitoring
individual movement patterns as well. For example, during this study, which was carried out
over a relatively short period of time, for Tapir #7 there appeared to be 8 different localities
where its footprints were photographed, thus providing information about the movement
patterns of this tapir. Furthermore, since there appeared to be a marked consistency in the
relatedness of tracks and gender/age class predictions, it is safe to conclude that the
gender/age class predictions are likely to be accurate. This study also demonstrated that it
was possible to successfully develop the FIT algorithms for lowland tapirs using footprint
images from captive individuals.
4.4.2 Lowland Tapir Population Density in Morro do Diabo State Park
The estimates of lowland tapir density reported in the literature are quite variable (Chapter 2,
Table 2.7). Lowland tapir population density ranges from a high estimate of 1.6 tapirs km-² in
undisturbed, non-hunted, or lightly hunted Neotropical forest sites (Robinson & Redford 1986;
Robinson & Redford 1991) to less than 0.3 tapirs km-² in different parts of the species
distribution range (Cullen et al. 2000; Aquino et al. 2001; Aquino & Calle 2003; Desbiez 2010).
This variation in density estimates can be explained by several different factors including
differences in environments, habitat types studied, levels of habitat conservation, different
levels of hunting and, most importantly, differences in the methods used. Evidence of
variation in density estimates due to methods applied is well illustrated in this lowland tapir
study. The 10 different tapir density estimates obtained by three different density estimators
and several analytical methods varied from 0.21-1.35 tapirs km-².
Nevertheless, the density estimate based on radio-telemetry results of tapir home range size
and home range overlap was selected as the most appropriate for Morro do Diabo (0.34 tapirs
km-²). When comparing this estimate with other lowland tapir densities obtained by radio-
telemetry in other parts of the species distribution range, the tapir density in Morro do Diabo
appears to be lower. Ayala (2003) conducted a telemetry study on lowland tapirs in Kaa-Iya
del Gran Chaco National Park, Bolivia, and obtained a density of 0.50 tapirs km-². In the same
national park in Bolivia, Noss et al. (2003) estimated the lowland tapir density to be 0.71
tapirs km-². Noss et al. (2003) noted that tapirs in the dry Chaco forests have successfully

158
adapted to conditions of seasonal drought and appeared to sustain relatively high population
densities, provided that they were protected from hunting.
I attribute the lower tapir density in Morro do Diabo to three main factors. First, the difference
seems to be largely associated with larger home range sizes. The mean home range size
calculated for the 14 tapirs radio-tracked from 8-36 months in Morro do Diabo was 4.7 km²
when estimated by KDE95%, and 4.4 km² when estimated by MCP95% (Chapter 3), both of
which larger than most radio-telemetry estimates obtained for the species in other areas. Noss
et al. (2003) obtained a mean home range size of 2.5 km² (MCP95%) in Kaa-Iya del Gran
Chaco National Park, Bolivia. Tobler (2008) carried out a GPS telemetry study on lowland
tapirs at Los Amigos Conservation Concession in the Peruvian Amazon and obtained a mean
home range size of 2.6 km² by KDE95%, and 2.2 km² by MCP95%. The larger home range
sizes in Morro do Diabo can be attributed to the lower carrying capacity of the heterogeneous,
semi-deciduous Atlantic Forests. The primary production of semi-deciduous forests is lower
and more erratic when compared to moister forests and, at the same time, water availability is
lower (Cullen et al. 2001a). Therefore, tapirs in semi-deciduous forests most probably need
their home ranges to be large enough to include large expanses of forest in order to
incorporate all the different habitat types they need and prefer (Chapter 5), ultimately fulfilling
their nutritional and water requirements.
Second, the lower tapir density in Morro do Diabo might be associated with the extensive
fragmentation of the Atlantic Forest of the Interior. Population density is limited to the number
of animals that a given area can support (Robinson & Redford 1986). Forest reduction and
fragmentation are generally accompanied by a loss of habitat diversity, which in turn affects
resource diversity (Wright & Duber 2001; Tabarelli et al. 2004). While both Kaa-Iya del Gran
Chaco National Park (34,400 km²) in Bolivia, as well as Los Amigos (1,400 km²) in Peru,
consist of much larger expanses of contiguous habitat, Morro do Diabo is a relatively small
forest fragment of 370 km² immersed in a landscape matrix of agricultural and pastoral land.
Although recent, the processes of destruction and fragmentation of the Atlantic Forests of the
Pontal do Paranapanema Region have most certainly led to a reduction in habitat diversity and
consequently in carrying capacity of Morro do Diabo. It is also important to mention that
before its establishment as a protected area in 1986, the forests of Morro do Diabo had
already suffered from a number of additional processes of habitat degradation. These included
the construction of both a railway and a highway crossing Morro do Diabo in different places,
the clearing of several patches of forest within Morro do Diabo for the extraction of timber,
the selective logging of valuable hard woods, and several major fire events (Faria & Pires
2006). All these events have contributed to the loss of habitat diversity in Morro do Diabo.

159
The third factor that could have potentially contributed to the lower tapir density in Morro do
Diabo is the presence of healthy populations of jaguars and pumas. Cullen (2007) estimated a
jaguar population of 13 individuals (95%CI 11-22) in Morro do Diabo and observed that tapirs
were an important prey item for these cats. Data and anecdotal information collected during
this study in Morro do Diabo included several records of tapir predation by large cats. Three
out of 25 radio-collared tapirs were predated by large cats. An adult female and a sub-adult
male tapirs were predated by jaguar, and one sub-adult male tapir was predated by puma.
Three carcasses of non-tagged adult tapirs killed by jaguars were found in different areas of
Morro do Diabo during the study. Several of the captured tapirs presented scars, apparently
from large cat attacks. Park rangers reported two sightings of jaguars chasing tapirs along the
shoreline of the Paranapanema River. Therefore, while jaguars and pumas naturally prefer
small- to medium-sized preys (Polisar et al. 2003; Astete et al. 2008), in Morro do Diabo these
cats appear to prey on tapirs regularly. As a consequence, it seems pertinent to consider tapir
predation by large cats as one of the components of tapir population regulation in Morro do
Diabo. Fragmented landscapes are known to exacerbate the effect of predation on prey
population dynamics in different ways, one of them by allowing carnivores to concentrate their
hunting efforts on islands of preferred prey habitat (Wirsing et al. 2002).
When looking at radio-telemetry density estimates obtained for other tapir species, results
once more vary. Nevertheless, overall, lowland tapirs appear to occur at higher population
densities than the other three species. Williams (1984) radio-tracked Baird's tapirs in the dry
forests of Santa Rosa National Park, Costa Rica, and estimated a density of 0.21 tapirs km-².
Foerster (1998) carried out a long-term telemetry study on Baird's tapirs in Corcovado
National Park, Costa Rica, and obtained a much higher density (1.6 tapirs km-²). Corcovado
National Park is a unique area with an extremely high diversity and availability of resources,
particularly fruit, which certainly allows for a much higher carrying capacity and higher density
of tapirs (Foerster & Vaughan 2002). Mountain tapir telemetry density estimates appear to be
much lower when compared to lowland and Baird's tapirs. Downer (1996) estimated a
mountain tapir density of 0.17 tapirs km-² in Sangay National Park, Ecuador. Lizcano (2006)
used GPS telemetry to study mountain tapirs in Los Nevados National Park, Colombia, and
estimated a density of 0.10 tapirs km-². The only density estimate I found for Malayan tapirs
used a combination of tapir signs on line-transects and camera-traps, resulting in an estimate
of 0.15 tapirs km-² in Kerinci Seblat National Park, Sumatra (Andri 2006).
4.4.3 Lowland Tapir Population Sizes in the Atlantic Forests of the Pontal
do Paranapanema Region and Implications for Population Viability
Population size is a critical demographic attribute and the single most important parameter to
determine species extinction risk (Shaffer 1981; Gilpin & Soulé 1986; Lacy 1993; Lacy 2000;

160
Shaffer et al. 2000; Aurambout et al. 2005). Whereas controversy remains as to how large
populations need to be to ensure the viability of a given species over the long-term (Lande
1995; Lynch & Lande 1998; Reed & Hobbs 2004), population size is considered to be the
major determinant of species long-term persistence in a given area (Diamond et al. 1987;
Newmark 1987; Pimm et al. 1988; Richman et al. 1988; Soulé et al. 1988; Berger 1990;
Schoener & Spiller 1992; Foufopoulos & Ives 1999). The tapir density estimates obtained in
Morro do Diabo varied. Consequently, the estimates of tapir population size ranged from 79
(radio-telemetry, Method 1) to 499 (nocturnal line-transect sampling) tapirs in Morro do
Diabo. Nevertheless, the selected telemetry density estimate of 0.34 tapirs km-² was used to
derive tapir population sizes in Morro do Diabo and seven Atlantic Forest fragments where the
presence of tapirs had been previously confirmed (Ditt 2002).
The population size estimates resulted in ~130 tapirs in the 370 km² of forests of Morro do
Diabo, and no more than 22 additional individuals distributed in the seven forest fragments.
Three of the forest fragments were larger than 10 km² and resulted in tapir populations from
4-6 individuals each. Four of the forest fragments were much smaller (4-5 km²), and did not
appear to hold up more than 2 tapirs each. In total, the Atlantic Forests of the Pontal do
Paranapanema Region should include ~150 tapirs in 8 main patches of forest.
While Morro do Diabo hosts a rather large tapir population, the smaller forest fragments fail to
provide enough space for more than just a few individuals each. Wide-ranging species with
large spatial requirements - such as tapirs - generally cannot survive in small areas over the
long-term (Redford & Robinson 1991). Chiarello (1999) analysed the effects of the Atlantic
Forest fragmentation on mammal communities, and observed that tapirs were present in large
patches but not recorded in small forests. Such reduced tapir populations in the small forest
fragments of the Pontal do Paranapanema Region are most certainly not large enough to
persist over the long-term. In fact, even if we considered some of the higher density
estimates obtained during this study in Morro do Diabo, the resulting population sizes in the
small fragments would still be too small to ensure long-term persistence.
This scenario could potentially be even worse if we considered that tapirs in the smaller
Atlantic Forest fragments in the Pontal do Paranapanema Region may not occur at the same
density as observed in Morro do Diabo. Morro do Diabo is a relatively large patch of protected
forest, which overall benefits from a higher level of habitat conservation. Therefore, it
certainly has a higher carrying capacity for tapirs and other species. It is quite possible that
tapirs in the forest fragments might have even larger spatial requirements in order to fulfil
their resource needs. In that case, the tapir population numbers in the small forest fragments
would be even lower. During this study, I have not obtained specific tapir densities for the
small forest fragments in the Pontal do Paranapanema Region. As a result, by using the tapir

161
density obtained in Morro do Diabo to estimate tapir numbers in the forest fragments, I may
have overestimated tapir population sizes in these small forests. Evidence that tapirs might
occur at a higher density in Morro do Diabo when compared to the small forest fragments of
the Pontal do Paranapanema Region was provided by Cullen et al. (2000). While the authors
estimated the tapir density in Morro do Diabo to be 0.41 tapirs km-², a lower density of 0.30
tapirs km-² was estimated for a smaller patch of forest (2.1 km²).
Other factors, in addition to fragment size, must be considered when estimating tapir
population sizes and assessing tapir viability over the long-term. One of these factors is the
loss of habitat diversity caused by forest fragmentation, which in turn affects the diversity and
availability of resources (Wright & Duber 2001; Tabarelli et al. 2004). There is growing
evidence that, when compared to contiguous tracts of forest, the availability of fruit resources
in small forest fragments is lower (Terborgh 1986; Terborgh 1992). This is a major limiting
factor for the persistence of frugivore species such as tapirs. Tófoli (2006) analysed the
impact of fragmentation of the Atlantic Forests of the Pontal do Paranapanema Region on the
diet of tapirs and showed that tapirs in Morro do Diabo consumed significantly higher
percentages of fruit and lower percentages of fibrous material when compared with tapirs in
the smaller forest fragments. In addition, estimates of fruit species richness in the diet of
tapirs indicated considerably higher fruit diversity in Morro do Diabo than in the forest
fragments (Tófoli 2006). In general, fragmented habitats fail to provide the necessary
resources to support species assemblages found in intact habitats. This leads to a general
reduction in the number of individuals that can be hosted (Lovejoy et al. 1984; Quinn &
Hastings 1987; Bierregaard et al. 1992; Burkey 1993; Kattan & Alvarez-Lopez 1996). When it
comes to frugivore species, a suite of resource-related factors such as spatial distribution of
fruit sources, total fruit availability, seasonal fruit availability, and severity of fruit scarcity
periods, will affect habitat use and spatial requirements in fragmented habitats (Wright et al.
1999; Fleury & Galetti 2004; Keuroghlian & Eaton 2008), which will ultimately affect
population size.
The conservation status, levels of habitat disturbance, and impact of existing threats in these
small areas of forest must also be considered when evaluating population size. Besides Morro
do Diabo, the only other protected area in the Pontal do Paranapanema Region is the Black-
Lion-Tamarin Ecological Station, created in 2002. This protected area encompasses the four
largest forest fragments in the region: Santa Maria Cachoeirinha (18.3 km²), Tucano (18
km²), Ponte Branca (13 km²), and Água Sumida Estrela da Alcídia (12.1 km²) (Chapter 2,
Figure 2.6). Tapirs are known to be present in three of these forest fragments, the only
exception being the Tucano fragment (Ditt 2002). All the other forest fragments in the Pontal
do Paranapanema Region lie within private properties or Agrarian Reform settlements (owned
by the State), therefore lacking legal protection. Some of these forests were left standing in

162
obedience to the Brazilian law that obligates landowners within the Atlantic Forest domain to
maintain 20% of their land covered with original forests (Cullen 1997). As a consequence of
the lack of effective protection of these areas, the activities of rural communities living in the
vicinities of Morro do Diabo and other forest fragments in the region have been leading to a
gradual loss of biodiversity (Cullen 1997). Practices of illegal hunting, erosion of forest edges
by fires and cattle grazing, as well as the spread of aggressive weeds, and pesticides have
been seriously modifying forest structure and reducing habitat quality and carrying capacity
for a number of species.
Although the above-mentioned law protects these forest fragments from further cutting or
use, tapir populations in these fragments suffer from higher levels of illegal hunting when
compared to Morro do Diabo. Hunting activities in the Pontal do Paranapanema Region are
more of sport or recreational rather than subsistence or commercial activities, mostly because
of the lack of traditional hunting practices, the small size of fragments, and the biomass of
game (Cullen 1997). However, hunting in this region is still a cherished past-time for men and
adds variation in the diet. While peccaries, deer, armadillos and agoutis are largely preferred
by hunters in the region, tapirs are also sought after (Cullen 1997). The low rates of
population growth, long generation time, and long reproductive cycles, are life-history
characteristics that make tapirs particularly susceptible to overhunting, which considerably
increases the likelihood of extirpation of small tapir populations (Bodmer et al. 1997). Cullen
et al. (2000) compared the abundance of mammalian species in slightly and heavily hunted
fragments of Atlantic Forest of the Interior - including Morro do Diabo as one of the slightly
hunted sites - and observed that tapirs could not cope with persistent hunting and were
extirpated from heavily hunted sites. In fact, tapirs were observed to be locally extinct in six
out of 13 forest fragments surveyed in the Pontal do Paranapanema Region (Ditt 2002). This
could be at least partially attributed to overhunting.
Tapirs are wide-ranging species and have the ability to traverse areas of low quality habitat in
order to move through the landscape matrix in between patches of forest (Flesher 2007).
During this study, I gathered a considerable amount of data and anecdotal information on
tapir movements throughout the fragmented landscape of the Pontal do Paranapanema
Region. Two of the radio-collared tapirs in the western border travelled regularly between
Morro do Diabo and the 4.2 km² Ribeirão Bonito forest fragment (Chapter 3, Figure 3.5). In
addition, tapir footprints, faeces and foraging signs were recorded in between the northern
edge of Morro do Diabo and three forest fragments in that area. Also by using tapir signs,
movement pathways were identified in between forest fragments located to the north,
northwest, and northeast of Morro do Diabo. Lastly, park rangers provided a few reports of
tapirs crossing the Paranapanema River in the southern limit of Morro do Diabo.

163
While the landscape crossings I am referring to were observed in rather short-scales (no
further than 1.5-2.0 km) and at low rates, they provided evidence of the occurrence of a tapir
metapopulation scenario in the Pontal do Paranapanema Region. The fact that tapirs in the
Pontal do Paranapanema Region appear to move fairly easily through areas of non-natural
habitat indicates that the landscape matrix of the region provides a certain level of functional
connectivity for them (Greenberg 1989; Sieving et al. 1996). In other words, the inter-habitat
matrix permeability in the Pontal do Paranapanema Region appears to be reasonable for
tapirs. Functional connectivity depends on the landscape pattern, but most importantly on the
interactions between this pattern and the biological characteristics of the target species, such
as their ability to traverse areas of low quality habitat (Greenberg 1989; Sieving et al. 1996).
Given that connectivity is a vital parameter for the persistence of animal species in severely
fragmented landscapes (Karr 1982; Blake & Karr 1987; Bierregaard & Stouffer 1997; Stratford
& Stouffer 1999; Crooks et al. 2000; Uezu et al. 2005), the functional connectivity observed
for tapir populations in the Pontal do Paranapanema Region could potentially facilitate their
persistence over the long-term.
The functional connectivity of the tapir population of the Pontal do Paranapanema Region will
only be maintained if Morro do Diabo remains well protected. Preliminary results of a large
scale lowland tapir survey currently underway throughout the entire range of the Atlantic
Forest biome has already shown that tapirs rarely survive in forests smaller than 20 km²
without recourse to larger forest patches (Flesher 2007). While tapirs appear to persist in
some areas where habitat is reduced to small scattered fragments, they need recourse to
fragments larger than 5 km² in clusters that total at least 15 km². In contrast, tapirs
disappear completely in landscapes where all the forest fragments are smaller than 5 km²,
even when these fragments constitute a large percentage of the landscape (Flesher 2007).
Novaro et al. (2000) noted that demographic characteristics of tapirs determine lower
dispersal ability when compared to other Neotropical species. Thus, the persistence of tapirs
at sites where potential sources of dispersers exist (Novaro et al. 2000) corroborates the
prediction that even low levels of dispersal may be sufficient to maintain populations in sink
areas (Pulliam 1988).
In conclusion, the long-term persistence of the lowland tapir populations in the Atlantic
Forests of the Pontal do Paranapanema Region, particularly the smaller populations in the
forest fragments, completely depends on the maintenance of the existing metapopulation
dynamics. While the tapir populations in the small forest fragments are too small to be viable
over the long-term, a viable metapopulation of 150 tapirs in the entire Pontal do
Paranapanema Region may persist. In genetic terms, the short period since fragmentation
occurred in the landscape of the Pontal do Paranapanema Region (5-6 tapir generations)
probably means that patterns of genetic structure are still in transition, and therefore genetic

164
drift and inbreeding have not been observed yet (Gonçalves da Silva 2007). Therefore, the
maintenance of the tapir metapopulation dynamics can allow for genetic flow between
different patches of forest, thus maintaining genetic diversity over the long-term.
Nevertheless, in order to ensure the viability of this tapir metapopulation, several conservation
measures must be implemented. First of all, Morro do Diabo must remain intact and
effectively protected. Second, measures must be taken to ensure the permeability of the
landscape matrix, therefore allowing for and facilitating tapir movements in between forest
patches. Third, threats impacting tapirs in the smaller forest fragments, particularly hunting,
must be neutralised. The tapir population in Morro do Diabo (130 tapirs) is not large enough
to maintain a disrupted “source-sink” structure (Pulliam 1988; Hanski & Simberloff 1996),
which could destabilise the metapopulation and seriously compromise persistence and viability
over the long-term. If given proper conditions in terms of habitat quality and neutralisation of
threats, tapirs might be capable of re-colonising the forest fragments from which they have
been extirpated in the past.
Understanding the ecological interactions between animal populations and their habitat in
fragmented landscapes is another important factor for the assessment of the viability of tapir
populations over the long-term. The next chapter focuses on analysing the spatial and
temporal interactions between tapirs and the different types of habitat found in the semi-
deciduous forests of Morro do Diabo and its surrounding landscape. Results on tapir habitat
use and habitat selection will be used to understand how tapirs establish and use their ranges
in a forest fragment, thus offering hypotheses concerning their long-term persistence in the
Pontal do Paranapanema Region.

Chapter 5
Spatial and Temporal Interactions between
Tapirs and the Landscape
Photo by Patrícia Medici

166
5.1 Introduction
One of the main challenges in ecology is understanding the spatial and temporal distribution
of animals in heterogeneous landscapes (Pusenius et al. 2000; Lin & Batzli 2001; Calsson-
Granér & Thrall 2002), and how these patterns are determined by the interactions between
these animals and the landscape (Lima & Zollner 1996; Turchin 1998; Wiegand et al. 1999;
Matthiopoulos 2003). Studies on habitat requirements are usually used to address these
questions. In-depth assessments of species' habitat requirements usually include a study of
habitat use, i.e. “the extents to which different vegetative associations are used by an animal”
(Hall et al. 1997), and then, based on these results, habitat selection (MacArthur & Pianka
1966; Neu et al. 1974; Rosenzweig 1981). The concept of habitat selection (MacArthur &
Pianka 1966) is based on the evaluation of habitat quality or suitability, i.e. “the ability of the
habitat to sustain life and support population growth” (Garshelis 2000). By selecting certain
types of habitat, an animal attempts to maximise its survival, reproductive success, and the
net rate of energy intake (Johnson 1980; Abrams 2000; Delibes et al. 2001). Presumably,
species should survive and reproduce better (i.e. their fitness should be higher) in habitats
that they tend to prefer (Rosenzweig & Abramsky 1986). Thus, once habitats can be ordered
by their relative preference, they can be evaluated as to their relative importance in terms of
fitness. By understanding the composition, availability, and selection of habitat patches
required by a healthy, functioning population of tapirs, the landscape necessary for its long-
term survival is explicitly defined.
According to classical theories of foraging and habitat selection, a forager should continue to
exploit a patch until its harvest rate in the patch drops to its average over all patches
(including foraging time in patches and travel time between patches) (Charnov 1976;
Rosenzweig 1981). Under these conditions, the animal will spend most of its time in those
habitats richest in food, and habitat selection is likely to reflect food availability. However,
there are trade-offs between selecting different resources (Kotler 1997), such as between
foraging and predator avoidance (Lima & Dill 1990; Turner 1997). Thus, it is likely that an
animal's habitat selection may reflect a multitude of requirements that an individual must fulfil
to successfully complete its life cycle, and not just availability of forage (Orians &
Wittenberger 1991; Dunning et al. 1992; Mysterud et al. 2001). Furthermore, habitat selection
is often a scale dependent process (Johnson 1980; Levin 1992), that is, different mechanisms
and trade-offs that determine an animal's resource use may come into play on different spatial
and temporal scales (Wiens 1989). Patch selection within the home range may depend on the
activity patterns of an animal (Morris 1987; Morris 1992).
Understanding the ecological interactions between animal populations and their habitat in
fragmented landscapes is an important factor for the assessment of the viability of these

167
populations over the long-term. Losses of habitat quality and diversity in forest fragments are
important proximal causes of species extinctions (MacArthur & Wilson 1967; Gilpin & Soulé
1986; Wilcove et al. 1986; Terborgh 1992). Hence, in addition to area restrictions and direct
threats caused or facilitated by landscape fragmentation, factors related to habitat quality and
diversity may also affect the persistence of animal populations in forest fragments. Some of
these factors include topography, edaphic characteristics, and moisture gradients among
others (Saunders et al. 1991; Wright & Duber 2001; Tabarelli et al. 2004; Keuroghlian & Eaton
2008). Most importantly, the process of habitat fragmentation leads to reductions in fruit
diversity (Wright & Duber 2001; Tabarelli et al. 2004) and fruit availability (Terborgh 1986;
Terborgh 1992), which is a particularly limiting factor for the long-term persistence of
frugivore species such as lowland tapirs. Nevertheless, aspects of tapir habitat requirements in
fragmented landscapes are largely unknown.
The lowland tapir has a broad geographic distribution (Hershkovitz 1954; Emmons & Feer
1990; Eisenberg 1997), and seems to be adapted to a wide range of habitat types (Medici et
al. 2007a; Taber et al. 2008). In spite of that, a number of studies have identified patterns of
habitat preference in tapir species (Bodmer 1990b; Fragoso 1991a; Fragoso 1991b; Naranjo
1995; Salas 1996; Foerster 1998; Naranjo & Cruz-Aldán 1998; Herrera et al. 1999; Muench
2001; Foerster & Vaughan 2002; Ayala 2003; Lizcano 2006; Tobler et al. 2006; Tobler 2008;
Steinmetz et al. 2008). There is growing evidence that besides large home ranges, tapirs also
require certain habitat types that contain the resources they need or prefer in order to survive
and reproduce, and ultimately persist over the long-term.
The destruction and fragmentation of the Atlantic Forest of the Interior of the Pontal do
Paranapanema Region is relatively recent when compared to areas in the eastern part of the
biome. Despite the extensive loss of habitat, some of the larger forest fragments in the
region, especially Morro do Diabo, still support tapir populations. Thus, the assessment of the
ecological interactions between tapirs and their habitat in Morro do Diabo provided critical
information on how tapirs use their ranges in a forest fragment, offering hypotheses
concerning their long-term persistence in fragmented landscapes.
In this Chapter, I explore the aspects related to the spatial and temporal interactions between
tapirs and the fragmented landscape of the Pontal do Paranapanema Region. This includes the
interactions between tapirs and the different types of habitat available to them. I first looked
at the extent of occurrence of different types of habitat within tapir home ranges and core
areas of use in Morro do Diabo. This allowed me to gain some insight into how tapirs establish
and structure their home ranges. Most importantly, this allowed me to examine what kinds of
habitats tapirs incorporate within their home ranges and core areas of use, provided that
aspects of intra-specific competition allow them to do so. Second, I focused on how tapirs

168
actually use the different habitat types. I determined the availability and use of different
habitat types within tapirs' home ranges, and examined which habitats were significantly
selected or avoided by tapirs. The examination of habitat selection provided some perspective
in terms of tapir habitat requirements, and whether tapir use of different habitat types
occurred in proportion to their availability in the study site. Lastly, I analysed tapir activity
patterns in Morro do Diabo, obtaining information about main peaks of activity, and examined
patterns of habitat use in relation to activity. These analyses provided useful information
about what types of habitat tapirs use for their main activities including foraging, travelling,
and resting. All this information was then utilised to characterise the spatial and temporal
interactions between tapirs and the mosaic of different habitats found within the landscape of
the Pontal do Paranapanema Region, and how this relates to the survival and persistence of
tapir populations in the Atlantic Forest over the long-term.

169
5.2 Methods
5.2.1 Radio-Telemetry
Radio-telemetry was used to study tapir ranging behaviour in Morro do Diabo. Ranging
behaviour maps were then used to analyse habitat composition within tapir home ranges and
core areas of use, as well as tapir habitat use and selection. The study of activity patterns was
carried out through the use of radio-collars equipped with a mortality-motion sensor
programmed with a 1-minute delay, which provided "active/alive" or "inactive/dead" pulse
depending on the activity of the study animals. A complete overview of the use of radio-
telemetry methodology and data analysis is provided in Chapter 3.
5.2.2 Habitat Composition within Tapir Home Ranges and Core Areas of
Use
The analysis of habitat composition within tapir home ranges and core areas of use was
carried out by superimposing tapir ranging maps onto Morro do Diabo's vegetation map (Faria
& Pires 2006) in ArcGIS 9.X (ESRI-GIS Mapping Software, USA). This analysis was carried out
separately for the different sections of Morro do Diabo where the study took place: (i) West
Border (N=7 tapirs), (ii) Southeast Border (N=3), (iii) Centre (N=7), and (iv) Northwest
Border (N=2), given that different habitat types were available to tapirs in each section. The
analytical methods were the following:
1) Maps of home range (KDE95%) and core areas of use (KDE50% and KDE25%) of all 19
tapirs radio-tracked during the study were superimposed onto Morro do Diabo's vegetation
map. Percentages of occurrence of each habitat type within the home range and core
areas of use were calculated for each individual tapir. Results were then used to calculate
mean percentages of occurrence of each habitat type within tapir home range and core
areas of use in each section of Morro do Diabo.
2) Maps of home range used in dry and wet season (KDE95%) of the 14 tapirs radio-tracked
from 8-36 months were superimposed onto Morro do Diabo's vegetation map. Percentages
of occurrence of each habitat type within home ranges used in dry and wet seasons were
calculated for each individual tapir. Results were then used to calculate mean percentages
of occurrence of each habitat type within tapir home ranges used in dry and wet seasons
in each section of Morro do Diabo.
170
5.2.3 Tapir Habitat Selection
5.2.3.1 Habitat Availability
The analysis of habitat availability was based on Morro do Diabo’s vegetation map (Faria &
Pires 2006) using ArcGIS 9.X (ESRI-GIS Mapping Software, USA). This analysis was carried
out separately for the different sections of Morro do Diabo where the study took place, given
that different habitat types were available to tapirs in each section. The first step of the
analysis was to define the area available to radio-tracked tapirs in each section, which was
done as following:
1) The total area used by radio-tracked tapirs in each section of Morro do Diabo was mapped
as the total area making up their home ranges calculated using Kernel Density Estimator
(KDE95%).
2) The area available to radio-tracked tapirs in each section of Morro do Diabo was extended
by establishing a buffer around the total area which they used. The width of the buffer
was calculated as half the Mean Maximum Distance Moved (½MMDM, home range radius)
by tapirs radio-tracked in each section, as detailed in Chapter 3. The area encompassed by
the limits of the buffer was then considered to be available to tapirs in each section of
Morro do Diabo.
3) The maps of areas available to tapirs in each section were then superimposed onto Morro
do Diabo's vegetation map. The availability of different habitat types within the delimited
area available to tapirs in each section was calculated as a percentage.
5.2.3.2 Habitat Use
Using ArcGIS 9.X (ESRI-GIS Mapping Software, USA), I superimposed the maps of habitat
availability in each section of Morro do Diabo with the locations of tapirs radio-tracked in each
section. I obtained counts of tapir locations within each habitat type and calculated
percentages of use of different habitat types separately for each section. The same
procedures were performed for radio-tracking locations obtained in wet and dry seasons.
5.2.3.3 Habitat Selection Index
Percentages of availability of different habitat types and percentages of use of each habitat
type were then used to analyse habitat selection. I used Manly's standardised habitat selection
index for constant resources (Manly et al. 2002). Manly's standardised habitat selection index

171
is based on the selection ratio Wi, which is the proportional use divided by the proportional
availability of each habitat type: Wi = oi /πi
Where:
oi = Proportion of the sample of used resource units in category i or proportion of habitat used
πi = Proportion of available resource units in category i or proportion of habitat available
A Wi value larger than 1 indicates a positive selection for the habitat type and a value less
than 1 indicates avoidance of the habitat. A value around 1 indicates that the habitat type was
used proportionally to its availability and no habitat selection was noted. The
preference/avoidance for each habitat was calculated from the selection ratio Wi and tested
using a chi-square test adjusted by Bonferroni. These analyses were carried out with the
ADEHABITAT extension of the statistical package R Version 2.9.0 (The R Project for Statistical
Computing, R Development Core Team 2008).
5.2.4 Tapir Activity Patterns
Triangulation bearings of radio-collared tapirs were taken from two different fixed stations,
and the activity of the animal at the moment (active, inactive) was recorded for each bearing.
For this analysis, I used only the activity record obtained for the first bearing. As described in
Chapter 3, the datasets of each radio-tracked tapir were screened and cleaned up for tapir
ranging behaviour analysis. However, for the analyses of tapir activity patterns, I included all
7,537 locations before screening.
For all 19 tapirs radio-tracked in Morro do Diabo combined, I calculated percentages of activity
and inactivity for each period of 1 hour. I then used these percentages to build a graph of
activity patterns over a period of 24 hours. Additionally, I did the same analysis separately for
both sexes and different age classes, as well as for all tapirs in wet and dry seasons. Main
periods of tapir activity were considered to be those periods when tapirs were found to be
active in over 50% of the locations. Main periods of inactivity were those periods when tapirs
were found to be active in less than 30% of the locations. Peaks of activity were identified
within main periods of activity.
5.2.5 Patterns of Tapir Habitat Use in Relation of Activity
I calculated percentages of active and inactive tapir locations obtained in different habitat
types in the four different sections of Morro do Diabo where the study took place, and
determined the types of habitat tapirs use for their main activities including travelling,
foraging, and resting. These analyses were carried out for all tapir locations within their home
ranges, as well as separately for wet and dry seasons.

172
5.3 Results
Ten different vegetation types are found in Morro do Diabo: (i) Tall mature forest; (ii) Low
mature forest; (iii) Secondary forest in early stages of regeneration; (iv) Secondary forest in
later stages of regeneration; (v) Cerrado (Savannah); (vi) Riparian forest along the Ribeirão
Bonito stream; (vii) Riparian forest along the Paranapanema River; (viii) Low, dense forest in
various stages of regeneration; (ix) Temporary lakes; and (x) Agricultural and pastoral land
(outside the boundaries of Morro do Diabo) (Faria & Pires 2006).
5.3.1 Habitat Composition in Tapir Home Ranges and Core Areas of Use
Seven habitat types were found within the home ranges and core areas of use of tapirs radio-
tracked in the western border of Morro do Diabo (Table 5.1). The most represented habitat
type in tapir home ranges in the western border was Tall mature forest (33%), followed by
Agricultural and pastoral land (16%). Likewise, Tall mature forest was the most strongly
represented habitat type in the tapirs' core areas of use at the 50% level (30%), closely
followed by Riparian forest along the Ribeirão Bonito stream (29%). The most strongly
represented habitat type in the 25% core areas of use was Riparian forest along the Ribeirão
Bonito stream (45%). Agricultural and pastoral land and Secondary forest in late stages of
regeneration were the least represented habitat types in the core areas of use of tapirs in the
west border. Tall mature forest was the most represented habitat type within tapir home
ranges in both dry and wet seasons (Table 5.2).
Seven habitat types were found within the home ranges and core areas of use of tapirs radio-
tracked in the south eastern border of Morro do Diabo (Table 5.1). The most represented
habitat type in tapir home ranges in the south eastern border was Riparian forest along the
Paranapanema River (31%), closely followed by Tall mature forest (30%). Likewise, Riparian
forest along the Paranapanema River was the most strongly represented habitat type in the
tapirs' core areas of use at both the 50% (48%) and 25% (71%) levels. Agricultural and
pastoral land, Low dense forest, and Temporary lakes were the least represented habitat
types in the core areas of use of tapirs in the southeast border. Riparian forest along the
Paranapanema River was the most represented habitat type within tapir home ranges in both
dry and wet seasons (Table 5.2).
Four habitat types were found within the home ranges and core areas of use of tapirs radio-
tracked in the centre of Morro do Diabo (Table 5.1). The most represented habitat type in
tapir home ranges in the centre was Tall mature forest (63%). Likewise, Tall mature forest
was the most strongly represented habitat type in the tapirs' core areas of use at both the
50% (68%) and 25% (73%) levels. Secondary forest in early stages of regeneration and Low

173
dense forest were the least represented habitat types in the core areas of use of tapirs in the
centre. Tall mature forest was the most represented habitat type within tapir home ranges in
both dry and wet seasons (Table 5.2). It is important to mention that the two main
permanent water courses that run through the central area of Morro do Diabo - Onça and
Taquara streams - are located within patches of Tall mature forest.
Six habitat types were found within the home ranges and core areas of use of tapirs radio-
tracked in the north western border of Morro do Diabo (Table 5.1). The most represented
habitat type in tapir home ranges in the north western border was Tall mature forest (48%).
Likewise, Tall mature forest was the most strongly represented habitat type in the tapirs' core
areas of use at both the 50% (53%) and 25% (54%) levels. Agricultural and pastoral land,
Low mature forest, and Low dense forest were the least represented habitat types in the core
areas of use of tapirs in the northwest border. Tall mature forest was the most represented
habitat type within tapir home ranges in the wet season (52%), while Secondary forest in late
stages of regeneration was the most represented habitat type (39%) in the dry season (Table
5.2).

174
Table 5.1. Percentage of each habitat type within the home range (HR, KDE95%) and core areas of use (CA KDE50%, CA KDE25%) of 19 lowland tapirs radio-tracked in four different sections of Morro do Diabo State Park, São Paulo, Brazil. (N=number of tapirs; TMF: Tall mature forest; LMF: Low mature forest; SFESR: Secondary forest in early stages of regeneration; SFLSR: Secondary forest in late stages of regeneration; RFRB: Riparian forest along the Ribeirão Bonito stream; RFPR: Riparian forest along the Paranapanema River; LDFV: Low, dense forest in various stages of regeneration; TL: Temporary lakes; AGPL: Agriculture/pasture).
West Border (N=7) Habitat Type
HR KDE95%
Habitat Type
CA KDE50%
Habitat Type
CA KDE25%
TMF 33.4 TMF 29.8 RFRB 45.2 AGPL 16.2 RFRB 28.9 TMF 19.6 LMF 13.6 LDFV 12.0 LDFV 11.8 RFRB 10.6 LMF 11.9 LMF 9.6 SFLSR 9.5 SFESR 9.5 SFESR 7.5 LDFV 8.7 AGPL 5.5 AGPL 5.4 SFESR 8.2 SFLSR 2.6 SFLSR 0.9
Southeast Border (N=3) Habitat Type
HR KDE95%
Habitat Type
CA KDE50%
Habitat Type
CA KDE25%
RFPR 31.1 RFPR 48.3 RFPR 71.0 TMF 29.9 SFLSR 21.0 SFLSR 12.3 SFLSR 18.7 SFESR 12.0 TMF 6.6 AGPL 11.8 TMF 11.0 SFESR 4.9 SFESR 6.3 AGPL 4.6 AGPL 4.7 TL 2.0 TL 1.8 LDFV 0.5 LDFV 0.4 LDFV 1.1 TL 0
Centre (N=7) Habitat Type
HR KDE95%
Habitat Type
CA KDE50%
Habitat Type
CA KDE25%
TMF 62.6 TMF 67.7 TMF 73.3 SFLSR 35.5 SFLSR 31.2 SFLSR 24.8 SFESR 1.3 SFESR 1.0 SFESR 1.8 LDFV 0.5 LDFV 0.1 LDFV 0
Northwest Border (N=2) Habitat Type
HR KDE95%
Habitat Type
CA KDE50%
Habitat Type
CA KDE25%
TMF 48.2 TMF 53.3 TMF 54.0 SFLSR 27.3 SFLSR 28.5 SFLSR 33.3 AGPL 11.5 SFESR 11.6 SFESR 12.2 SFESR 11.0 AGPL 4.9 LDFV 0.3 LMF 1.8 LMF 1.5 AGPL 0.1 LDFV 0.1 LDFV 0.1 LMF 0

175
Table 5.2. Percentage of each habitat type within the home range (HR, KDE95%) used in dry and wet seasons by 14 lowland tapirs radio-tracked in four different sections of Morro do Diabo State Park, São Paulo, Brazil. (N=number of tapirs; TMF: Tall mature forest; LMF: Low mature forest; SFESR: Secondary forest in early stages of regeneration; SFLSR: Secondary forest in late stages of regeneration; RFRB: Riparian forest along the Ribeirão Bonito stream; RFPR: Riparian forest along the Paranapanema River; LDFV: Low, dense forest in various stages of regeneration; TL: Temporary lakes; AGPL: Agriculture/pasture).
West Border (N=4)
Habitat Type HR-Dry KDE95% Habitat Type HR-Wet KDE95% TMF 39.5 TMF 34.6 AGPL 13.5 AGPL 14.8 SFLSR 11.8 SFLSR 13.0 RFRB 10.9 RFRB 12.1 LMF 10.1 LMF 11.9 LDFV 7.3 LDFV 6.9 SFESR 6.9 SFESR 6.7
Southeast Border (N=3)
Habitat Type HR-Dry KDE95% Habitat Type HR-Wet KDE95% RFPR 31.9 RFPR 30.1 TMF 27.1 TMF 28.9 SFLSR 20.5 SFLSR 24.8 AGPL 11.0 AGPL 7.8 SFESR 6.5 SFESR 6.4 TL 2.6 TL 1.3 LDFV 0.4 LDFV 0.6
Centre (N=6)
Habitat Type HR-Dry KDE95% Habitat Type HR-Wet KDE95% TMF 63.8 TMF 68.2 SFLSR 34.2 SFLSR 30.4 SFESR 1.2 SFESR 1.2 LDFV 0.7 LDFV 0.2
Northwest Border (N=1)
Habitat Type HR-Dry KDE95% Habitat Type HR-Wet KDE95% SFLSR 39.2 TMF 52.1 TMF 28.1 SFLSR 44.8 AGPL 17.2 LMF 3.1 SFESR 10.9 AGPL 0 LMF 4.5 SFESR 0 LDFV 0 LDFV 0

176
5.3.2 Tapir Habitat Selection
5.3.2.1 Habitat Availability and Habitat Use
The total areas available to radio-tracked tapirs in each section of Morro do Diabo are
presented in Table 5.3.
Table 5.3. Total area available (km²) for 19 lowland tapirs radio-tracked in four different sections of Morro do Diabo State Park (MDSP), São Paulo, Brazil. Total area used by tapirs in each section (KDE95%, km²) and ½MMDM values used to calculate areas available are shown. (N=number of tapirs; MMDM=Mean Maximum Distance Moved).
Area MDSP
N
Area Used
(KDE95%) (km²)
½MMDM (km)
Area Available
(KDE95%+Buffer) (km²)
West Border 7 24 2.0 92
Southeast Border 3 4 0.9 16
Centre 7 16 1.7 74
Northwest Border 2 13 1.1 32
Eight habitat types were available to tapirs radio-tracked in the western border of Morro do
Diabo (Table 5.4). Tall mature forest had the highest percentage of use (30%), closely
followed by Riparian forest along the Ribeirão Bonito stream (25%). Likewise, Tall mature
forest had the highest percentage of use in both dry (31%) and wet (28%) seasons.
Seven habitat types were available to tapirs radio-tracked in the south eastern border of
Morro do Diabo (Table 5.4). Riparian forest along the Paranapanema River had the highest
percentage of use (49%). Likewise, Riparian forest along the Paranapanema River had the
highest percentage of use in both dry (47%) and wet (50%) seasons.
Five habitat types were available to tapirs radio-tracked in the centre of Morro do Diabo
(Table 5.4). Tall mature forest had the highest percentage of use (73%). Likewise, Tall
mature forest had the highest percentage of use when analysing the data separately for dry
(70%) and wet (78%) seasons.
Six habitat types were available to tapirs radio-tracked in the north western border of Morro
do Diabo (Table 5.4). Tall mature forest had the highest percentage of use (46%), closely
followed by Secondary forest in late stages of regeneration (44%). Secondary forest in late
stages of regeneration had the highest percentage of use in the dry season (54%), while Tall
mature forest had the highest percentage of use in the wet season (56%).

177
Table 5.4. Habitat availability (km² and %) and habitat use (%) in the home range of 19 lowland tapirs radio-tracked in four different sections of Morro do Diabo State Park, São Paulo, Brazil. Habitat use in wet and dry seasons is shown. (N=number of tapirs; *Maximum; **Minimum; TMF: Tall mature forest; LMF: Low mature forest; SFESR: Secondary forest in early stages of regeneration; SFLSR: Secondary forest in late stages of regeneration; RFRB: Riparian forest along the Ribeirão Bonito stream; RFPR: Riparian forest along the Paranapanema River; LDFV: Low, dense forest in various stages of regeneration; TL: Temporary lakes; AGPL: Agriculture/pasture).
West Border (N=7) Habitat Type
Habitat Availability
(km²)
Habitat Availability
(%)
Habitat Use Home Range
(%)
Habitat Use Wet Season
(%)
Habitat Use Dry Season
(%) AGPL 37.6 41.1 4.9 5.1 4.6 TMF 30.6 33.4 29.6* 28.0* 31.2* SFLSR 7.8 8.5 9.1 10.6 7.6 LMF 5.5 6.0 10.3 9.8 10.8 SFESR 4.0 4.3 10.7 9.0 12.5 LDFV 3.2 3.5 10.2 10.8 9.5 RFRB 2.9 3.1 25.2 26.6 23.8 TL 0 0 0** 0** 0**
Southeast Border (N=3) Habitat Type
Habitat Availability
(km²)
Habitat Availability
(%)
Habitat Use Home Range
(%)
Habitat Use Wet Season
(%)
Habitat Use Dry Season
(%) AGPL 6.2 38.1 4.4 4.8 3.9 TMF 4.0 24.7 18.9 19.0 18.7 SFLSR 2.0 12.4 15.8 14.9 16.8 RFPR 1.8 11.0 48.7* 50.2* 46.9* SFESR 1.3 8.0 8.9 7.9 10.2 TL 0.9 5.5 2.8 2.5 3.1 LDFV 0 0.2 0.5** 0.6** 0.4**
Centre (N=7) Habitat Type
Habitat Availability
(km²)
Habitat Availability
(%)
Habitat Use Home Range
(%)
Habitat Use Wet Season
(%)
Habitat Use Dry Season
(%) TMF 42.9 57.6 72.6* 78.2* 69.7* SFLSR 20.3 27.3 25.1 20.3 27.6 AGPL 5.6 7.5 0** 0** 0** SFESR 3.9 5.2 2.0 1.5 2.2 LDFV 1.8 2.4 0.3 0** 0.4
Northwest Border (N=2) Habitat Type
Habitat Availability
(km²)
Habitat Availability
(%)
Habitat Use Home Range
(%)
Habitat Use Wet Season
(%)
Habitat Use Dry Season
(%) TMF 11.2 35.0 46.1* 56.5* 30.4 AGPL 8.5 26.4 2.6 0** 6.5 SFLSR 6.5 20.3 44.3 37.7 54.3* SFESR 4.7 14.7 4.3 4.3 4.3 LMF 1.0 3.1 2.6 1.4 4.3 LDFV 0.1 0.4 0** 0** 0**

178
5.3.2.2 Habitat Selection Index
In the western border of Morro do Diabo, tapirs selected Riparian forest along the Ribeirão
Bonito stream (Wi>1; P<Bonferroni level 0.00625). Agricultural and pastoral land was avoided
(Wi<1; P<Bonferroni level 0.00625). Riparian forest along the Ribeirão Bonito stream was
selected in both wet and dry seasons (Table 5.5).
In the south eastern border of Morro do Diabo, tapirs selected Riparian forest along the
Paranapanema River was selected (Wi>1; P<Bonferroni level 0.00714). Agricultural and
pastoral land was avoided (Wi<1; P<Bonferroni level 0.00714). Riparian forest along the
Paranapanema River was selected in both wet and dry seasons (Table 5.5).
In the centre of Morro do Diabo, tapirs selected Tall mature forest (Wi>1; P<Bonferroni level
0.01). Agricultural and pastoral land and Low dense forest were avoided (Wi<1; P<Bonferroni
level 0.01). Tall mature forest was selected in both wet and dry seasons. Agricultural and
pastoral land, Secondary forest in early stages of regeneration, and Low dense forest were
avoided in the wet season. Agricultural and pastoral land and Low dense forest were avoided
in the dry season (Table 5.5).
In the north western border of Morro do Diabo, tapirs selected Secondary forest in late stages
of regeneration (Wi>1; P< Bonferroni level 0.00833). Agricultural and pastoral land,
Secondary forest in early stages of regeneration, and Low dense forest were avoided (Wi<1;
P<Bonferroni level 0.00833). In the wet season, Tall mature forest and Secondary forest in
late stages of regeneration were selected, while Agricultural and pastoral land, Secondary
forest in early stages of regeneration, and Low dense forest were avoided. In the dry season,
Secondary forest in late stages of regeneration was selected, while Agricultural and pastoral
land, Secondary forest in early stages of regeneration, and Low dense forest were avoided
(Table 5.5).

179
Table 5.5. Manly’s standardised habitat selection index for 19 lowland tapirs radio-tracked in four different sections of Morro do Diabo State Park, São Paulo, Brazil. (N = number of tapirs; *Habitat type positively selected; **Habitat type significantly selected; ***Habitat type significantly avoided; TMF: Tall mature forest; LMF: Low mature forest; SFESR: Secondary forest in early stages of regeneration; SFLSR: Secondary forest in late stages of regeneration; RFRB: Riparian forest along the Ribeirão Bonito stream; RFPR: Riparian forest along the Paranapanema River; LDFV: Low, dense forest in various stages of regeneration; TL: Temporary lakes; AGPL: Agriculture/pasture).
West Border (N=7) Habitat Type
Habitat Used
Habitat Available
Selection Index Wi
P (0.00625)
AGPL 0.05 0.41 0.118 0.000*** TMF 0.30 0.33 0.887 0.407 SFLSR 0.09 0.08 1.069* 0.838 LMF 0.10 0.06 1.709* 0.160 SFESR 0.11 0.04 2.488* 0.038 LDFV 0.10 0.03 2.942* 0.026 RFRB 0.25 0.03 8.043* 0.000** TL 0.00 0.00 0.000 0.000
Southeast Border (N=3) Habitat Type
Habitat Used
Habitat Available
Selection Index Wi
P (0.00714)
AGPL 0.04 0.38 0.115 0.000*** TMF 0.19 0.25 0.764 0.137 SFLSR 0.16 0.12 1.268* 0.360 RFPR 0.49 0.11 4.416* 0.000** SFESR 0.09 0.08 1.112* 0.752 TL 0.03 0.05 0.513 0.108 LDFV 0.01 0.00 2.206* 0.691
Centre (N=7) Habitat Type
Habitat Used
Habitat Available
Selection Index Wi P (0.01)
TMF 0.73 0.58 1.261* 0.001** SFLSR 0.25 0.27 0.920 0.616 AGPL 0.00 0.07 0.000 0.000*** SFESR 0.02 0.05 0.374 0.018 LDFV 0.00 0.02 0.119 0.000***
Northwest Border (N=2) Habitat Type
Habitat Used
Habitat Available
Selection Index Wi
P (0.00833)
TMF 0.46 0.35 1.316* 0.027 AGPL 0.03 0.26 0.099 0.000*** SFLSR 0.44 0.20 2.181* 0.000** SFESR 0.04 0.15 0.295 0.000*** LMF 0.03 0.03 0.845 0.764 LDFV 0.00 0.00 0.000 0.000***

180
5.3.3 Tapir Activity Patterns
The study of tapir activity patterns in Morro do Diabo shows that tapirs rest during the day
and begin their activity after sunset. The main periods of activity of the 19 tapirs radio-tracked
during this study were from 19:00-24:00 h, with a peak between 20:00-21:00 h (63% active),
and from 01:00-07:00 h, with a peak between 05:00-06:00 h (60%). Tapirs were largely
inactive from 11:00-16:00 h, with the lowest percentage of activity between 12:00-13:00 h
(25%) (Figure 5.1).
0 10 20 30 40 50 60 70
0
10
20
30
40
50
60
70
010203040506070
0
10
20
30
40
50
60
70
24:00-24:59
01:00-01:59
02:00-02:59
03:00-03:59
04:00-04:59
05:00-05:5906:00-06:59
07:00-07:59
08:00-08:59
09:00-09:59
10:00-10:59
11:00-11:59
12:00-12:59
13:00-13:59
14:00-14:59
15:00-15:59
16:00-16:59
17:00-17:5918:00-18:59
19:00-19:59
20:00-20:59
21:00-21:59
22:00-22:59
23:00-23:59
Figure 5.1. Mean percentages of active locations of 19 lowland tapirs radio-tracked in Morro do Diabo State Park, São Paulo, Brazil.

181
5.3.3.1 Activity Patterns in Different Seasons
In the wet season, the main period of tapir activity was from 19:00-06:00 h, including two
peaks: 20:00-21:00 h (65% active) and 05:00-06:00 h (66%). The main peak of inactivity was
between 13:00-14:00 h (16%) (Figure 5.2). In the dry season, the main periods of activity
were from 19:00-24:00 h, with a peak between 20:00-21:00 h (62%), and from 02:00-07:00
h, with a peak between 02:00-03:00 h (60%). The main peak of inactivity in the dry season
was between 12:00-13:00 h (22%) (Figure 5.3).
0 10 20 30 40 50 60 70
0
10
20
30
40
50
60
70
010203040506070
0
10
20
30
40
50
60
70
24:00-24:59
01:00-01:59
02:00-02:59
03:00-03:59
04:00-04:59
05:00-05:5906:00-06:59
07:00-07:59
08:00-08:59
09:00-09:59
10:00-10:59
11:00-11:59
12:00-12:59
13:00-13:59
14:00-14:59
15:00-15:59
16:00-16:59
17:00-17:5918:00-18:59
19:00-19:59
20:00-20:59
21:00-21:59
22:00-22:59
23:00-23:59
Figure 5.2. Mean percentages of active locations of 19 lowland tapirs radio-tracked in periods of WET season in Morro do Diabo State Park, São Paulo, Brazil.
0 10 20 30 40 50 60 70
0
10
20
30
40
50
60
70
010203040506070
0
10
20
30
40
50
60
70
24:00-24:59
01:00-01:59
02:00-02:59
03:00-03:59
04:00-04:59
05:00-05:5906:00-06:59
07:00-07:59
08:00-08:59
09:00-09:59
10:00-10:59
11:00-11:59
12:00-12:59
13:00-13:59
14:00-14:59
15:00-15:59
16:00-16:59
17:00-17:5918:00-18:59
19:00-19:59
20:00-20:59
21:00-21:59
22:00-22:59
23:00-23:59
Figure 5.3. Mean percentages of active locations of 19 lowland tapirs radio-tracked in periods of DRY season in Morro do Diabo State Park, São Paulo, Brazil.

182
5.3.3.2 Activity Patterns of Different Sexes
The main period of activity of female tapirs was from 19:00-07:00 h, including two peaks:
20:00-21:00 h (66% active) and 05:00-06:00 h (64%). Females were largely inactive from
12:00-16:00 h, with the lowest percentage of activity between 15:00-16:00 h (25%) (Figure
5.4). The main peaks of activity of male tapirs were: 21:00-22:00 h (56%) and 08:00-09:00 h
(59%). Males were largely inactive from 10:00-13:00 h, with 0 active locations between
11:00-12:00 h (Figure 5.5).
0 10 20 30 40 50 60 70
0
10
20
30
40
50
60
70
010203040506070
0
10
20
30
40
50
60
70
24:00-24:59
01:00-01:59
02:00-02:59
03:00-03:59
04:00-04:59
05:00-05:5906:00-06:59
07:00-07:59
08:00-08:59
09:00-09:59
10:00-10:59
11:00-11:59
12:00-12:59
13:00-13:59
14:00-14:59
15:00-15:59
16:00-16:59
17:00-17:5918:00-18:59
19:00-19:59
20:00-20:59
21:00-21:59
22:00-22:59
23:00-23:59
Figure 5.4. Mean percentages of active locations of 13 FEMALE lowland tapirs radio-tracked in Morro do Diabo State Park, São Paulo, Brazil.
0 10 20 30 40 50 60 70
0
10
20
30
40
50
60
70
010203040506070
0
10
20
30
40
50
60
70
24:00-24:59
01:00-01:59
02:00-02:59
03:00-03:59
04:00-04:59
05:00-05:5906:00-06:59
07:00-07:59
08:00-08:59
09:00-09:59
10:00-10:59
11:00-11:59
12:00-12:59
13:00-13:59
14:00-14:59
15:00-15:59
16:00-16:59
17:00-17:5918:00-18:59
19:00-19:59
20:00-20:59
21:00-21:59
22:00-22:59
23:00-23:59
Figure 5.5. Mean percentages of active locations of 6 MALE lowland tapirs radio-tracked in Morro do Diabo State Park, São Paulo, Brazil.

183
5.3.3.3 Activity Patterns of Different Age Classes
The main period of activity of adult tapirs was from 19:00-07:00 h, including two peaks:
21:00-22:00 h (65% active) and 03:00-04:00 h (61%). The main peak of inactivity for adults
was between 13:00-14:00 h (25%) (Figure 5.6). The main periods of activity of sub-adult
tapirs were from 19:00-21:00 h, with a peak between 20:00-21:00 h (67%), and from 03:00-
07:00 h, with a peak between 05:00-06:00 h (66%). Sub-adults were largely inactive from
12:00-16:00 h, with the lowest activity between 15:00-16:00 h (6%) (Figure 5.7).
0 10 20 30 40 50 60 70
0
10
20
30
40
50
60
70
010203040506070
0
10
20
30
40
50
60
70
24:00-24:59
01:00-01:59
02:00-02:59
03:00-03:59
04:00-04:59
05:00-05:5906:00-06:59
07:00-07:59
08:00-08:59
09:00-09:59
10:00-10:59
11:00-11:59
12:00-12:59
13:00-13:59
14:00-14:59
15:00-15:59
16:00-16:59
17:00-17:5918:00-18:59
19:00-19:59
20:00-20:59
21:00-21:59
22:00-22:59
23:00-23:59
Figure 5.6. Mean percentages of active locations of 15 ADULT lowland tapirs radio-tracked in Morro do Diabo State Park, São Paulo, Brazil.
0 10 20 30 40 50 60 70
0
10
20
30
40
50
60
70
010203040506070
0
10
20
30
40
50
60
70
24:00-24:59
01:00-01:59
02:00-02:59
03:00-03:59
04:00-04:59
05:00-05:5906:00-06:59
07:00-07:59
08:00-08:59
09:00-09:59
10:00-10:59
11:00-11:59
12:00-12:59
13:00-13:59
14:00-14:59
15:00-15:59
16:00-16:59
17:00-17:5918:00-18:59
19:00-19:59
20:00-20:59
21:00-21:59
22:00-22:59
23:00-23:59
Figure 5.7. Mean percentages of active locations of 4 SUB-ADULT lowland tapirs radio-tracked in Morro do Diabo State Park, São Paulo, Brazil.

184
5.3.4 Patterns of Tapir Habitat Use in Relation to Activity
In the western border of Morro do Diabo, tapirs spent the highest percentage of their active
time (29%) in Tall mature forest, closely followed by Riparian forest along the Ribeirão Bonito
stream (24%). The same habitat types presented the highest percentages of inactive time:
Tall mature forest (27%) and Riparian forest along the Ribeirão Bonito stream (22%).
Therefore, these seemed to be the habitat types where tapirs travelled, foraged, and rested in
the western border. The same patterns were observed when looking at percentages of active
and inactive time separately for wet and dry seasons (Table 5.6).
In the south eastern border of Morro do Diabo, tapirs spent 51% of their active time and 45%
of their inactive time in Riparian forest along the Paranapanema River. Therefore, this seemed
to be the habitat type where tapirs travelled, foraged, and rested in the south eastern border.
The same patterns were observed when looking at percentages of active and inactive time
separately for wet and dry seasons (Table 5.6).
In the centre of Morro do Diabo, tapirs spent 71% of their active time and 74% of their
inactive time in Tall mature forest. In both cases, Secondary forest in late stages of
regeneration came in second place. Tall mature forest was by far the habitat type in the
centre of Morro do Diabo where tapirs performed most of their travelling, foraging, and
resting activities. The same patterns were observed when looking at percentages of active and
inactive time separately for wet and dry seasons (Table 5.6).
In the north western border of Morro do Diabo, tapirs spent 49% of their active time in Tall
mature forest, followed by 38% in Secondary forest in late stages of regeneration. Secondary
forest in late stages of regeneration had the highest percentage of inactive time (53%). In the
wet season, tapirs in the north western border spent the highest percentage of their active
time (63%) in Tall mature forest, while in the dry season they spent 49% of their active time
in Secondary forests in late stages of regeneration (Table 5.6).

Table 5.6. Percentages of tapir activity and inactivity in different habitat types in four sections of Morro do Diabo State Park, São Paulo, Brazil. Results for all tapir locations within their home ranges, as well as in wet and dry seasons are shown. (%ACT=% active; %INA=% inactive; TMF: Tall mature forest; LMF: Low mature forest; SFESR: Secondary forest in early stages of regeneration; SFLSR: Secondary forest in late stages of regeneration; RFRB: Riparian forest along the Ribeirão Bonito stream; RFPR: Riparian forest along the Paranapanema River; LDFV: Low, dense forest in various stages of regeneration; TL: Temporary lakes; AGPL: Agriculture/pasture).
West Border Home Range Wet Season Dry Season
Habitat Type %ACT Habitat Type %ACT Habitat Type %ACT
TMF 29.3 TMF 27.4 TMF 31.0 RFRB 24.5 RFRB 25.3 RFRB 23.8 SFESR 11.7 LDFV 11.7 SFESR 13.0 LDFV 10.3 SFESR 10.2 LMF 9.6 SFLSR 9.4 SFLSR 9.9 LDFV 9.1 LMF 9.2 LMF 8.8 SFLSR 9.0 AGPL 5.5 AGPL 6.7 AGPL 4.5 Habitat Type %INA Habitat Type %INA Habitat Type %INA
TMF 26.7 RFRB 25.4 TMF 29.0 RFRB 22.5 TMF 24.7 RFRB 19.4 LMF 14.7 LMF 13.6 LMF 15.9 LDFV 12.0 SFESR 10.9 LDFV 13.6 SFESR 10.8 LDFV 10.7 SFESR 10.6 AGPL 8.1 AGPL 8.2 AGPL 8.0 SFLSR 5.1 SFLSR 6.6 SFLSR 3.6
Southeast Border Home Range Wet Season Dry Season
Habitat Type %ACT Habitat Type %ACT Habitat Type %ACT
RFPR 51.4 RFPR 51.6 RFPR 51.1 TMF 17.5 TMF 16.8 TMF 18.3 SFLSR 15.1 SFLSR 16.0 SFLSR 14.1 SFESR 7.6 SFESR 7.4 SFESR 7.8 AGPL 4.1 AGPL 4.5 TL 4.1 TL 3.7 TL 3.3 AGPL 3.6 LDFV 0.6 LDFV 0.4 LDFV 0.9 Habitat Type %INA Habitat Type %INA Habitat Type %INA
RFPR 45.5 RFPR 48.4 RFPR 41.7 TMF 19.6 TMF 22.0 SFLSR 26.0 SFLSR 17.5 SFESR 12.7 TMF 16.6 SFESR 11.7 SFLSR 11.0 SFESR 10.3 AGPL 3.5 AGPL 3.1 AGPL 4.0 LDFV 1.4 LDFV 2.4 TL 1.3 TL 0.8 TL 0.3 LDFV 0.0
Centre Home Range Wet Season Dry Season
Habitat Type %ACT Habitat Type %ACT Habitat Type %ACT
TMF 70.9 TMF 77.5 TMF 67.0 SFLSR 28.3 SFLSR 22.5 SFLSR 31.7 SFESR 0.6 SFESR 0.0 SFESR 1.0 LDFV 0.2 LDFV 0.0 LDFV 0.2 Habitat Type %INA Habitat Type %INA Habitat Type %INA
TMF 73.9 TMF 78.0 TMF 71.8 SFLSR 23.2 SFLSR 19.6 SFLSR 25.1 SFESR 2.6 SFESR 2.3 SFESR 2.7 LDFV 0.3 LDFV 0.0 LDFV 0.4

186
Northwest Border
Home Range Wet Season Dry Season
Habitat Type %ACT Habitat Type %ACT Habitat Type %ACT
TMF 48.9 TMF 62.7 SFLSR 48.8 SFLSR 38.0 SFLSR 29.4 TMF 31.7 SFESR 5.4 SFESR 3.9 SFESR 7.3 LMF 4.3 LMF 3.9 AGPL 7.3 AGPL 3.3 AGPL 0.0 LMF 4.9 Habitat Type %INA Habitat Type %INA Habitat Type %INA
SFLSR 52.9 TMF 48.0 SFLSR 66.7 TMF 44.1 SFLSR 48.0 TMF 33.3 SFESR 2.9 SFESR 4.0 SFESR 0.0 AGPL 0.0 AGPL 0.0 AGPL 0.0 LMF 0.0 LMF 0.0 LMF 0.0

187
5.4 Discussion
5.4.1 Spatial Interactions between Lowland Tapirs and the Landscape
5.4.1.1 Habitat Composition in Tapir Home Ranges and Core Areas of Use
Overall, tapirs in Morro do Diabo incorporated varying portions of all available habitat types
within their home ranges and core areas of use. Tall mature forest was the habitat type most
largely represented in tapir home ranges. Riparian environments were the most strongly
represented habitats in core areas of use. These included the forests along the Ribeirão Bonito
stream in the western limit of Morro do Diabo, the forests along the Paranapanema River
along the southern limit, and some patches of Tall mature forest in the centre of Morro do
Diabo. The two main permanent water courses that run through the central area of Morro do
Diabo - Onça and Taquara streams - are located within patches of Tall mature forest.
Secondary forest habitats, found in Morro do Diabo in various stages of regeneration, were, in
most cases, the least represented habitats within the home ranges and core areas of use of
tapirs in Morro do Diabo. All these patterns showed very little seasonal variation.
Interestingly, the second most strongly represented habitat type within the home ranges of
tapirs in the western border of Morro do Diabo was agricultural and pastoral land (16%), a
pattern that was also observed when running separate analyses for different seasons. This
result might be explained by the fact that two of the tapirs radio-tracked in the western
border left the boundaries of Morro do Diabo and crossed the agricultural and pasture land
matrix in order to reach another forest fragment nearby (Chapter 3). In fact, one of these
radio-collared tapirs, a sub-adult female (Chu-Chu), had the largest home range size of all 19
tapirs radio-tracked during this study (14.2 km², KDE95%), and her home range area included
a high percentage of the agricultural and pastoral land habitat type (Chapter 3, Figure 3.5.1).
At any rate, while these tapir movements through agricultural and pastoral land were fairly
frequent, this habitat type was the least represented in the core areas of use of these tapirs,
which were in effect located inside Morro do Diabo (Chapter 3, Figures 3.5.1 and 3.5.2).
Indeed, the agricultural and pastoral land habitat was overall scantily represented in the core
areas of use of tapirs in all sections of Morro do Diabo. This provided indication that tapirs
crossed these areas of agricultural crops and cattle ranching while travelling in between forest
fragments, but did not necessarily use the landscape matrix for their main activities such as
foraging and resting.

188
5.4.1.2 Tapir Habitat Use and Habitat Selection
Overall, tapirs in Morro do Diabo used most of the habitat types available to them to varying
degrees. Tall mature forest was by far the most used habitat type by tapirs. The only
exception to this occurred in the south eastern border of Morro do Diabo where the most used
habitat was Riparian forests along the Paranapanema River. The least used habitat types in
Morro do Diabo were Agricultural and pastoral land, Temporary lakes, and Low dense forests.
Very little seasonal variation in habitat use was observed. The same was observed for lowland
tapirs in Lago Caiman, Bolivia, where no seasonal variation in track encounter rates in
different habitat types was found (Herrera et al. 1999). In contrast, Salas (1996) found
seasonal variations in lowland tapir habitat use in the Tabaro River Valley in Venezuela, with
tapirs using different habitats in different seasons in order to search for and ingest more fruit
in season. Ayala (2003) also observed that lowland tapirs in Kaa-Iya del Gran Chaco National
Park, Bolivia, did use different habitat types in different seasons.
Habitat use by lowland tapirs in Morro do Diabo was not as predicted by habitat availability.
While tapirs in Morro do Diabo used most of the available habitat types, they showed strong
patterns of habitat selection and habitat avoidance. In three out of four sections of Morro do
Diabo, tapirs strongly selected riparian habitats during both seasons. In the western border,
tapirs significantly selected the riparian forests along the Ribeirão Bonito stream. This stream
runs along the entire western edge of Morro do Diabo and is the most important source of
water for wildlife in that area. The vegetation along the stream is characterised by several
islands of swamp vegetation and patches of humid fields, both surrounded by riparian forests.
In the south eastern border, tapirs significantly selected the riparian forests along the
Paranapanema River, the major permanent source of water in Morro do Diabo. In the centre
of Morro do Diabo, tapirs significantly selected tall mature forest. The two main permanent
water courses that run through the central part of Morro do Diabo are located in patches of
tall mature forests therefore providing another evidence of tapir selection of riparian habitats.
The only exception to this pattern was observed in the north western border of Morro do
Diabo, where tapirs significantly selected secondary forests in late stages of regeneration,
where no permanent water courses were found.
The strong selection of riparian environments corroborated the previous finding of this study
that riparian habitats are highly represented in the tapir core areas of use in Morro do Diabo.
This provides evidence that tapirs not only select riparian habitats, but they establish their
main core areas of use in these habitats. This may be because the riparian forests along the
permanent water courses in Morro do Diabo are the most diverse and abundant in food
resources for wildlife (Faria & Pires 2006). Moreover, tapirs are known to be closely associated
with riparian forests, marshes, lakes and streams all throughout their distribution ranges

189
(Padilla & Dowler 1994; Medici 2001). In the Peruvian Amazon, Bodmer (1990b) observed
that lowland tapirs select moist forests such as floodplains. Naranjo (1995) found that Baird's
tapir sign in Corcovado National Park, Costa Rica, was positively correlated with distance from
perennial water bodies. Among the habitat types preferred by Baird's tapirs in the Lacandon
Forest, Mexico, were palm swamps and riparian forests (Muench 2001). Naranjo (2009) noted
that Baird's tapirs prefer habitats that include great availability of permanent water bodies and
large extensions of riparian vegetation.
Overall, tapirs in Morro do Diabo showed very little use and in some cases avoidance of areas
of secondary growth. Secondary forests in early stages of regeneration were significantly
avoided by tapirs in the centre of Morro do Diabo during the dry season, while in the north
western border this habitat type was significantly avoided in both seasons. This contradicts
what has been observed by other tapir studies in different areas were secondary growth
habitats were largely used and selected. In the Lacandon Forest, Mexico, Muench (2001)
found that Baird's tapirs preferred secondary regeneration vegetation over mature forest.
Likewise, evidence from Corcovado National Park, Costa Rica, and Montes Azules Biosphere
Reserve, Mexico, showed that Baird's tapirs were more abundant in second-growth forests
and palm swamps than in drier, higher areas (Naranjo 1995; Bolaños & Naranjo 2001;
Foerster & Vaughan 2002; Naranjo & Bodmer 2002). Foerster & Vaughan (2002) observed
that study-long habitat utilisation by Baird's tapirs in Corcovado National Park, Costa Rica, was
not as predicted by habitat availability given that secondary forests were used more than
expected while primary forests were used less than expected. Foerster & Vaughan (2002) also
noted seasonal variations in habitat selection, which were correlated with fruit availability.
Lizcano (2006) found that mountain tapirs in Los Nevados National Park, Colombia, selected
secondary forests and avoided páramos and ecotones, and showed no preference for or
against mature forests. The high levels of degradation of secondary growth habitats in Morro
do Diabo may explain why tapirs did not select these areas. Most of the areas of secondary
growth in Morro do Diabo originated from past and recurrent fire events. In addition, some of
these patches originated during the construction of both the highway and the railway that
crossed Morro do Diabo, and continue to suffer degradation from “edge effect”. Overall, the
secondary forests in Morro do Diabo have been largely invaded by grasses, lianas, and
bamboo, and present very low quality in terms of providing food resources for wildlife.
Areas of agricultural and pastoral land were significantly avoided by tapirs in all four sections
of Morro do Diabo where the study took place. This is another indication that tapirs cross
these areas while travelling in between forest fragments, but do not necessarily use the
landscape matrix outside Morro do Diabo for their main activities such as foraging and resting.
Similar observations have been made in Southeast Asia, where Malayan tapirs have been
recorded in agricultural areas (Williams & Pétrides 1980; Brooks et al. 1997). In Malaysia,

190
there have been sporadic records of Malayan tapirs crossing areas of palm oil estates. This
seemed to occur primarily due to lack of choice, as the animals travelled from one forested
area to the next (C. Traeholt, personal communication). While the areas of agricultural and
pastoral land around Morro do Diabo consist of an anthropogenic habitat type, tapir species in
general appear to avoid open areas, even in natural environments. Desbiez (2009) applied
diurnal line-transect sampling in the mosaic of natural habitat types found in the Pantanal and
estimated higher densities of lowland tapirs in forest habitats, when compared to open
grasslands and floodplains. Naranjo & Cruz-Aldán (1998) as well as Lira et al. (2004) noted
that Baird's tapirs prefer densely forested areas, rather than opener, and more disturbed
habitats. Downer (2001) noted that mountain tapirs rarely use open habitats (pampas) in the
Andes, in spite of their considerable food value.
5.4.2 Temporal Interactions between Lowland Tapirs and the Landscape
5.4.2.1 Tapir Activity Patterns
As widely published in the available literature, tapirs are primarily nocturnal and crepuscular
species. Large animals - such as tapirs - have a difficult time dissipating excess body heat due
to their low surface to volume ratio (Schmidt-Nielsen 1990). Therefore, the nocturnal
behaviour of tapirs may help with thermoregulation, with tapirs resting during the hot
daytime, and confining their activities to the cooler night-time hours (Foerster & Vaughan
2002). This study has corroborated these previous findings and shows that tapirs rest during
the day and begin their activity after sunset. Tapir activity in Morro do Diabo showed a very
clear bimodal pattern, including two main peaks of activity, the first in the early hours of the
evening from 20:00-21:00 h, and the second in the early hours of the day from 05:00-06:00
h. Overall, tapirs in Morro do Diabo foraged for ~5 hours in the early evening, and then rested
for a few hours in the middle of the night, and then made a second foraging bout of ~6 hours
in the early hours of the day.
Previous studies on lowland and mountain tapir activity patterns have obtained similar results.
Tobler (2008) observed that the main peaks of lowland tapir activity in the Peruvian Amazon
were from 19:00-20:00 h and from 03:00-04:00 h. Maffei et al. (2002) used camera-traps in
the Chiquitano Forest, Bolivia, and noted that most lowland tapir pictures were taken from
24:00-08:00 h. Telemetry and camera-trapping studies of lowland tapirs in Kaa-Iya del Gran
Chaco National Park, Bolivia, indicated that the main peak of tapir activity was from 01:00-
06:30 h (Ayala 2003; Noss et al. 2003). Daily activity of mountain tapirs in Los Nevados
National Park, Colombia, showed a bimodal pattern, with maxima during the early hours of
the day (05:00-07:00 h) and early hours of the evening (18:00-20:00 h) (Lizcano & Cavelier
2000b). Lowland tapirs in Morro do Diabo were largely inactive in the middle of the day, from

191
11:00-16:00 h. The same was observed for lowland tapirs in Kaa-Iya del Gran Chaco National
Park, Bolivia, where very little activity was observed from 11:00-15:30 h (Ayala 2002).
Padilla & Dowler (1994) noted that tapirs shelter themselves in forests and thickets during day
hours. Tapirs in Morro do Diabo appeared to have defined shelters they used as resting sites.
These locations were used repeatedly over long periods of time. The same was observed by
Tobler (2008) in the Peruvian Amazon. In Morro do Diabo, tapirs rested at one site during
most of the day but occasionally moved between different spots a few metres away from each
other, most probably searching for shade. In addition, tapirs in Morro do Diabo rested during
day time in areas different from those they used for foraging at night, and daily movements
between resting and feeding sites resulted in well-worn paths. In fact, the observed peaks of
tapir activity in Morro do Diabo most probably corresponded to tapirs moving between resting
and foraging areas. Tobler (2008) observed very little overlap and low similarity between day
time and night time lowland tapir home ranges.
Tapir activity patterns analysed separately for wet and dry seasons, as well for both sexes and
different age classes in Morro do Diabo were fairly consistent. They presented two main peaks
of activity, one in the early hours of the evening and a second one in the early hours of the
morning. However, a few variations on the patterns were observed. First, during the wet
season, tapirs did not seem to rest at all during the night and were active for ~11 hours, from
19:00-06:00 h. In addition, tapirs rested more during the day. Ayala (2003) found a similar
pattern in Kaa-Iya National Park, Bolivia, were lowland tapirs were more active during the
night during the wet season, which was explained by the highest availability of food resources
in the Bolivian Chaco during the wet season. Availability of food resources does not seem to
explain the higher levels of nocturnal tapir activity during the wet season in Morro do Diabo.
In the semi-deciduous forests of the Atlantic Forest of the Interior the availability of fruit is not
related to rainfall, with most of the plant species fruiting during the middle and end of the dry
season and at the beginning of the wet season (Valladares-Padua 1993). Therefore, the
higher nocturnal tapir activity during the wet season must be due to the fact that the highest
annual temperatures in the Pontal do Paranapanema Region occur in the wet season. During
the night, temperatures are considerably lower.
An interesting aspect of the activity patterns of tapirs in Morro do Diabo is that, female tapirs
overall tended to be more active than males. Females were more active during crepuscular
and night times, and for longer periods of time (~12 hours), than males. Female tapirs did not
seem to rest at all during the night. In some cases, this might be related to the fact that
females lactating and caring for a young calf may need to forage more in order to fulfil
nutritional requirements. Ayala (2003) found a different pattern in the Bolivian Chaco, where
male tapirs presented higher percentages of activity during the night than females. In terms

192
of different age classes, adult tapirs in Morro do Diabo tended to be largely more active than
sub-adults. While adult tapirs were greatly active for ~12 hours during crepuscular and night
times, sub-adults made shorter bouts of activity in the early hours of the evening (~2 hours)
and early hours of the day (roughly 4 hours). Adult tapirs did not seem to rest at all during
the night, while sub-adults tended to take long breaks. Additionally, sub-adult tapirs rested for
longer periods of time during day hours. Discussions about differences in activity patterns
between the sexes and between age classes might be limited by the fact that the sample
included small numbers of males (N=6) and sub-adults (N=4).
The results of tapir activity patterns obtained by radio-telemetry coincided with some general
observations obtained by nocturnal line-transect sampling in Morro do Diabo (Chapter 4).
Line-transect sampling was carried out from 18:00-23:00 h and resulted in 81 tapir
encounters. Most encounters took place from 20:00-21:00 h (47%), which coincides with the
main peak of activity estimated by radio-telemetry. Nocturnal line-transect sampling also
provided some interesting information about the effect of moonlight intensity on tapir activity.
Tapirs in Morro do Diabo were considerably less active during the brighter phases of the
moon. Previous studies suggested that a lower level of animal activity during moonlit nights is
a result of a higher predation risk (Leaver 2004; Meyer et al. 2004; Griffin et al. 2005; Lang et
al. 2006). Regardless, this result could be biased by the fact that line-transect sampling in
Morro do Diabo was carried out in dirt roads, where tapirs would be more vulnerable to
predators such as jaguars and pumas during moonlit nights. Coelho et al. (2008) used
camera-traps to evaluate the possible effects of moonlight on the frequency of use of natural
licks by lowland tapirs in the Brazilian Pantanal. A similar frequency of use of licks by tapirs
was recorded across all phases of the moon, and neither lunar phobia nor lunar philia were
observed (Coelho et al. 2008). A camera-trap study carried out in Los Nevados National Park,
Colombia, resulted in higher mountain tapir night time activity along trails and at a natural lick
during the full moon (Lizcano & Cavelier 2000b).
Knowledge of tapir activity patterns is critical for understanding basic aspects of tapir biology
and ecology. This information can be used to evaluate, select and adapt field methodologies
while designing future research efforts. Given the predominant levels of activity occurring
during crepuscular and nocturnal times, future studies focused on tapir species should
concentrate research efforts during those periods. As pointed out by Wallace et al. (2002) and
as evidenced by this study in Morro do Diabo, diurnal line-transect sampling may not be the
most appropriate method to study primarily nocturnal animals such as tapirs, for which
nocturnal censuses would be a better choice of method. Likewise, radio-telemetry studies on
tapirs should concentrate data collection during times when tapirs are most active so as to
increase the chances to obtain locations that will provide a good representation of tapir
ranging behaviour. In addition, capture efforts for the placement of radio-collars should be

193
performed in crepuscular and nocturnal periods. The information on tapir activity patterns
obtained in Morro do Diabo has been already useful for the design of the Lowland Tapir
Research and Conservation Programme established in the Brazilian Pantanal in 2008. In the
Pantanal, I am using GPS telemetry to monitor tapirs and I have programmed the GPS collars
to obtain at least 80% of the locations from 19:00-07:00 h.
5.4.2.2 Patterns of Tapir Habitat Use in Relation to Activity
Overall, tapirs in Morro do Diabo spent most of their active and inactive time in habitat types
where they could have access to permanent water sources throughout the year. The same
pattern was observed when running separate analyses for dry and wet seasons. These results
corroborated the previous finding of this study that riparian habitats were strongly selected by
tapirs and highly used in their main core areas. As a result, this provides evidence that tapirs
in Morro do Diabo performed most of their foraging and resting activities in these habitats.
Riparian habitats appeared to be particularly important for foraging activities, given that in
most cases tapirs spent from 50-70% of their active time in these forests. On the other hand,
tapirs spent very little of their active and inactive time in areas of agricultural and pastoral
land, secondary forests, and temporary lakes. Therefore, tapirs did not seem to forage or rest
in these habitat types, but only passed through them while travelling in between different
patches of tall mature forest and riparian forests.
5.4.3 Spatial and Temporal Interactions between Lowland Tapirs and
the Landscape and Implications for Population Viability
The semi-deciduous forests of Morro do Diabo are extremely heterogeneous, consisting of a
complex mosaic of different habitat types in various states of conservation. In semi-deciduous
forests, primary production of food resources is overall considerably lower and more
unpredictable when compared to moister forests (Cullen et al. 2001a). In addition, the
availability of water in these forests is very low (Cullen et al. 2001a). Most importantly, the
habitat heterogeneity found in Morro do Diabo leads to different fruiting periods for different
plant species found in different habitat types (Durigan & Franco 2006). Lowland tapirs are
frugivores, and feed accordingly to the availability and abundance of fruit resources (Bodmer
1990a; Salas 1996). Thus, the spatial and temporal interactions between tapirs and the
habitats available to them in Morro do Diabo were most likely determined by habitat
heterogeneity. Tapirs included different types of habitat within their large home ranges so that
they could encompass all the resources required to fulfil their energetic needs. Indeed,
optimal foraging theory assumes that animals have complete knowledge of the spatial-
temporal distribution of resources within their home ranges, allowing predictions of the
resource depletion level at which an animal should leave each food patch (Stephens & Krebs

194
1986). Furthermore, large animals likely have a greater perceptual range (Zollner 2000),
thereby influencing their ability to detect suitable habitat and perceive landscape structure and
interrelatedness (Wiens 1996).
Tapirs in Morro do Diabo showed strong levels of selection for some of the available habitat
types, particularly riparian forests. The concept of habitat selection precludes that an animal
selects certain types of habitat in an attempt to maximise its survival, reproductive success,
and the net rate of energy intake (MacArthur & Pianka 1966; Johnson 1980; Abrams 2000;
Delibes et al. 2001). If this is deemed to be true, than species should survive and reproduce
better (i.e. their fitness should be higher) in habitats that they tend to prefer (Rosenzweig &
Abramsky 1986). Therefore, the strong selection tapirs have shown for riparian habitats
clearly demonstrates the relative importance of these habitats in terms of tapir fitness when
compared to other habitat types in Morro do Diabo. Tapirs in Morro do Diabo use riparian
habitats for their main activities, particularly foraging, and therefore need them in order to
survive, reproduce, and persist over the long-term.
Patterns of tapir habitat use and habitat selection observed in the 370 km² of forest of Morro
do Diabo seemed to be different from results obtained in areas of contiguous moist forest,
which are usually more homogeneous in terms of habitat types, and have higher primary
production of food resources and more water. Tobler (2008) studied lowland tapirs in Los
Amigos Research Station (1,400 km²) in the Peruvian Amazon, and observed that habitat use
varied with the availability of habitat types within the home ranges of the animals. However,
given that most individuals had their home ranges exclusively in either one or two habitat
types, they did not seem to select among habitats, the only exception being patches of
Mauritia flexuosa palm swamp which were infrequently visited by some of the radio-collared
tapirs (Tobler 2008).
Although tapirs in Morro do Diabo appeared to benefit from the existence of habitat types that
fulfilled their nutritional requirements, the situation in the smaller forest fragments of the
Pontal do Paranapanema Region might be different. Morro do Diabo provides for the large
spatial requirements of tapirs. The forest fragments, on the other hand, are very small and
extremely degraded. The impact of rural communities living in the vicinities of these small
forest fragments, including erosion of forest edges by fires and cattle grazing, spread of
aggressive weeds, and use of pesticides, have seriously modified forest structure and reduced
habitat quality and carrying capacity for a number of species (Cullen 1997). The Morro do
Diabo Management Plan describes the vegetation in most of the forest fragments surrounding
Morro do Diabo as secondary forests in early stages of regeneration (Faria & Pires 2006). The
plan states that most of these forests have been affected by several fire events over the last

195
40 years and are, therefore, mostly composed by tree species of early stages of regeneration,
grasses and lianas.
The small forest fragments have very low diversity and availability of fruit, which is a serious
limiting factor for the persistence of frugivore species such as tapirs. Tófoli (2006) analysed
the impact of fragmentation of the Atlantic Forests of the Pontal do Paranapanema Region on
the diet of tapirs and observed that tapirs in Morro do Diabo consumed significantly higher
percentages of fruit (37%) and lower percentages of fibrous material (63%) when compared
with tapirs in the smaller forest fragments (17% fruits, 83% fibrous materials). Furthermore,
estimates of fruit species richness in the diet of tapirs indicated considerably higher fruit
diversity in Morro do Diabo than in the forest fragments (Tófoli 2006). Lastly, the small forest
fragments in the Pontal do Paranapanema Region are even poorer than Morro do Diabo in
terms of availability of water. Therefore, these areas cannot provide tapirs with the riparian
habitats they prefer and need for their main activities. Thus, results from this study provide
enough evidence to say that the carrying capacity of these very small, largely degraded, non-
protected forest fragments in the Pontal do Paranapanema Region might be indeed much
lower when compared to Morro do Diabo. In consequence, tapirs in these small areas might
not be given the proper conditions to fulfil their habitat requirements.
Nevertheless, evidence gathered during this study has shown that tapirs in the Pontal do
Paranapanema Region move through the fragmented landscape in between different patches
of forest. This characterises a tapir metapopulation scenario. During these landscape
wonderings, tapirs move through areas of pasture land or agricultural crops. In some areas,
tapirs cross patches of forest regeneration, degraded forest corridors, and riparian forests and
swamps along small rivers. The fact that tapirs can use these marginal non-natural habitat
areas surrounding the forests where they live, most certainly helps them fulfil both their
spatial and habitat requirements in the smaller forest fragments. At any rate, tapir populations
in the Pontal do Paranapanema Region still need recourse to Morro do Diabo in order to
persist and be viable over the long-term.
Chapters 3, 4, and 5 focused on an empirical approach to assess the long-term persistence of
lowland tapir populations in the Atlantic Forest fragments of the Pontal do Paranapanema
Region. The next chapter will apply some of these results as well as information on tapir
reproductive and mortality rates on modelling the viability of the tapir sub-populations and
metapopulation in the Pontal do Paranapanema Region. Population Viability Analysis (PVA)
carried out through the use of computer simulations will be used to model risks of extinction,
Minimum Viable Population (MVP), impact of threats, and effects of conservation strategies,
ultimately evaluating the viability of these tapir populations in the next 100 years.

Chapter 6
Population Viability Analysis (PVA):
Using a Modelling Tool to Assess the Viability of
Tapir Populations in a Fragmented Landscape
Photo by Patrícia Medici

197
6.1 Introduction
Population Viability Analysis (PVA) provides a quantitative means for predicting the probability
of extinction and viability of a population (Shaffer 1981; Gilpin & Soulé 1986; Beissinger &
Westphal 1998). PVA examines threats to persistence and evaluates the probability of a
population of a specified size declining or going extinct over a specified length of time (Boyce
1992; Beissinger & Westphal 1998; Groom & Pascual 1998; Clark et al. 2002). Extinction risk
is the likelihood of a population or species going extinct under various natural conditions and
scenarios of management (Akçakaya 2000). The PVA process explores the consequences of
different assumptions on population dynamics, especially for small populations (Lindenmayer
& Lacy 1995) and evaluates which of a suite of management or conservation strategies is
likely to maximise the probability of a population persisting over the long-term (Lindenmayer
& Possingham 1996).
Simple empirical, analytical methods have yielded qualitative insights into population viability
questions (Dennis et al. 1991). However, population growth is generally nonlinear, with
nonlinear dynamics making most stochastic models intractable for analysis (Ludwig 1996).
Catastrophes and their distribution pose even more difficult statistical problems (Ludwig
1996). Thus, analytical methods are generally inadequate to compute these probabilities.
Consequently, Population Viability Analysis (PVA) is usually carried out through computer
simulation models. Computer modelling is a valuable and versatile tool for analysing complex
and interacting factors that influence population persistence, including natural and
anthropogenic causes. These models incorporate the interacting deterministic and stochastic
factors threatening animal populations and simulate the future of the species based on
parameters on the ecology and demography of these populations (Burgman et al. 1993; Lacy
2000; Akçakaya 2000).
PVA works by using life-history or population growth-rate data to parameterise a population
model that is then used to project population dynamics (Ludwig 1999). Under almost any set
of circumstances, wildlife populations fluctuate in size over time. These fluctuations result
from random (stochastic) variation acting on a set of processes - most notably birth, offspring
sex ratio, dispersal, and death - that, acting together, determine the dynamics of population
change. Numbers of individuals comprising a given population are determined largely by
specified rates of reproduction, survival, and dispersal in addition to the ecological limitations
of habitat carrying capacity. Variation in these rates is influenced by processes both intrinsic
(demographic stochasticity, genetic drift and/or inbreeding depression, deviations in age or
social structure) and extrinsic (environmental variation and catastrophic events) to the
population (Shaffer 1981; Soulé 1987).

198
The primary use of PVA is to estimate the probability of extinction of a population, the mean
time to extinction, or other measures of population performance such as growth rate, stability,
or genetic diversity (Lacy 2000). The definitions and criteria for viability and extinction are set
as arbitrary targets, such as a 95% probability of a population persisting for 100 years (Boyce
1992). A comparison of such measures of population viability for a set of different scenarios
then allows comparison of which threats are most important. In addition, sensitivity analysis
can be used to determine the primary demographic determinants of population growth
(Wisdom & Mills 1997), and management alternatives can be compared to determine the most
effective conservation strategies (Hamilton & Moller 1995).
A number of scientists have discussed the limitations of PVA (Beissinger & Westphal 1998;
Coulson et al. 2001). However, the problem with PVA does not seem to be the model itself,
but obtaining the data to drive it (Ruggiero et al. 1994). In a comprehensive study of the
predictive capability of PVA modelling packages, Brook et al. (2000) demonstrated that, when
adequately parameterised with reliable field data on the species or population of concern, PVA
methods can provide a consistent technique for demographic population projection. Despite
criticism, the use of PVA continues to grow and has become a valuable tool in the arsenal of
conservation biologists (Beissinger & McCullough 2002). For example, PVA has become one of
the primary tools for classification of threatened and endangered species by national wildlife
management agencies and the International Union for Conservation of Nature (IUCN). PVA is
a powerful method for classification because it provides objective, quantitative criteria on
which decisions about risks of extinction can be made (Mace & Lande 1991). Furthermore,
PVA is becoming increasingly important for both the formulation and implementation of
conservation policy and legislation (Lindenmayer et al. 1993; Possingham et al. 1993).
In this Chapter, I focused on modelling the viability of tapir populations in the fragmented
landscape of the Pontal do Paranapanema Region through the use of Population Viability
Analysis (PVA). I used VORTEX software. First, I developed a robust VORTEX baseline model
reflecting the biological potential of tapirs in Morro do Diabo, and carried out sensitivity
analysis to evaluate the effect of selected reproductive and mortality parameters on the
stochastic growth rate of this population. Second, I carried out an analysis of the Minimum
Viable Population (MVP) for tapirs in Morro do Diabo. Third, I used the baseline model to
evaluate the impact of potential catastrophes such as fire, and threats such as road-kill and
infectious disease, analysing how these factors affect the probability of long-term persistence
and viability of tapirs in Morro do Diabo. Lastly, I created a metapopulation scenario including
Morro do Diabo and surrounding forest fragments in the Pontal do Paranapanema Region and
analysed the probability of extinction of the different populations and of the metapopulation
as a whole. As an example of conservation strategy, I modelled the establishment of corridors
between Morro do Diabo and surrounding forest fragments, and analysed the impact this
measure would have on the long-term viability of the lowland tapir populations in the region.

199
6.2 Methods
6.2.1 VORTEX Simulation Model
The modelling of the viability of the lowland tapir populations in the Atlantic Forests of the
Pontal do Paranapanema Region, São Paulo, Brazil, was carried out through the use of
VORTEX 9.94 software (Lacy 1993). VORTEX is a long-standing Population Viability Analysis
(PVA) computer package that employs a Monte Carlo simulation of the impact of deterministic
forces as well as demographic, environmental, and genetic stochastic events on wildlife
population dynamics (Lacy 1993; Lacy 2000). It provides a platform to model many of the
extinction vortices that can threaten persistence of small populations (hence, its name).
VORTEX has been widely used to model the dynamics of wildlife populations (Miller & Lacy
2005).
VORTEX models population dynamics as discrete, sequential events that occur according to
probabilities that are random variables following user-specified distributions. VORTEX is an
individual-based model, which is mostly appropriate for analysing extinction dynamics in small
populations (Lacy 2000). The software begins by creating individuals to form the starting
population and stepping through life cycle events (e.g. births, deaths, dispersal, removals,
supplementations) and catastrophic events, typically on an annual basis. Outcomes such as
breeding success, litter size, sex at birth, and survival are determined based upon designated
probabilities. As a result, each one of the iterations of the model generates distribution of
fates that each individual, and consequently the population as a whole, might experience and
gives a different result. By running the model hundreds of times, it is possible to examine the
most probable outcome and the range of possibilities.
VORTEX is mostly used to simulate population trends, and evaluate current and future risk of
population decline or extinction under alternative management scenarios (Lacy 2000; Miller &
Lacy 2003). VORTEX is not intended to give absolute answers, since it is stochastically
projecting the interactions of the several parameters used as input to the model and because
of the random processes involved in nature. Interpretation of the output depends upon the
knowledge of the biology of the species one is working with, the environmental conditions
affecting the species, and possible future changes in these conditions. In essence, VORTEX
provides a neutral platform upon which the user can examine the current status of a given
species and determine which factors, if changed or manipulated, may have the greatest effect
on causing or preventing extinction.

200
6.2.2 VORTEX Input Parameters: Baseline Model
A lowland tapir VORTEX baseline model was developed reflecting the biological potential of
the species in Morro do Diabo. This baseline model was based on three main sources of data
and information:
1) Data from this 12-year lowland tapir study in Morro do Diabo State Park.
2) Field and captivity data generated and/or compiled during previous Population and
Habitat Viability Assessment (PHVA) Workshops held by the IUCN/SSC Tapir
Specialist Group (TSG) and the IUCN/SSC Conservation Breeding Specialist Group
(CBSG) for the four species of tapirs: Malayan Tapir PHVA Workshop, Malaysia, 2003
(Medici et al. 2003); Mountain Tapir PHVA Workshop, Colombia, 2004 (Lizcano et al.
2005); Baird's Tapir PHVA Workshop, Belize, 2005 (Medici et al. 2006); and Lowland
Tapir PHVA Workshop, Brazil, 2007 (Medici et al. 2007a).
3) Published literature and personal observations on lowland tapir life table parameters,
including information coming from both wild and captive studies.
6.2.2.1 Scenario Settings
• Duration of Simulation: The lowland tapir population in Morro do Diabo was
modelled for 100 years, so that long-term population trends could be observed and
evaluated. The generation length of lowland tapirs is estimated to be 11 years,
considering age of sexual maturity at 3 years and longevity of ~25 years (IUCN 2008a).
Therefore, a 100-year simulation covers ~9 generations. One hundred years is far
enough into the future so as to decrease the chances of omitting a yet unknown event,
but also not too short to fail to observe a slowly developing event.
• Number of Iterations: One thousand replicate simulations were run for each
modelling scenario to provide adequate precision (Harris et al. 1987; Burgman et al.
1993).
6.2.2.2 Species Description
• Definition of Extinction: I defined extinction to mean the total removal of at least
one sex. In other words, I was not looking at the decline of the population below some
threshold size, otherwise known as quasi-extinction (Ginzburg et al. 1982).
• Concordance of Environmental Variation (EV) between Reproductive Rates
and Survival Rates: No evidence of such concordance exists in tapir species. It is
generally assumed that large, long-lived animals with long gestation periods show little

201
correlation between breeding and survival. Radio-tracked Baird's tapirs in Corcovado
National Park, Costa Rica, continued to breed throughout the severe droughts of El Niño
in 1997 and 1998 (C.R. Foerster, personal communication). Previous VORTEX modelling
for all four species of tapirs did not include Concordance of Environmental Variation (EV)
between reproductive rates and survival rates (Medici et al. 2003; Lizcano et al. 2005;
Medici et al. 2006; Medici et al. 2007a).
• Inbreeding Depression: VORTEX has the ability to model the detrimental effects of
inbreeding through reduced first-year survival of inbred individuals. Inbreeding is
thought to have major effects on reproduction and survival, especially in small
populations. As tapir populations continue to decline and become fragmented, genetic
considerations are becoming very important. The impact of inbreeding was modelled as
3.14 Lethal Equivalents (LE), the median value estimated from an analysis of studbook
data for 40 captive mammal populations (Ralls et al. 1988), with 50% of the effect of
inbreeding ascribed to recessive lethal alleles.
6.2.2.3 Reproductive System and Rates
• Breeding System: Previous direct and indirect evidence from field studies on Baird's
Tapirs in Corcovado National Park in Costa Rica indicate that tapirs are probably
facultative polygymous (C.R. Foerster, personal communication). Previous VORTEX
modelling for all four tapir species considered tapirs to be monogamous (Medici et al.
2003; Lizcano et al. 2005; Medici et al. 2006; Medici et al. 2007a). The reason behind
this modelling decision relies on the fact that VORTEX is not spatially explicit and the
selection of a polygymous system would suggest a panmictic scenario, which is less
similar to what current data suggest than monogamy. Given that the sex ratio between
males and females is equal and threats are generally not sex-specific, the choice of
short-term monogamy or polygyny does not have an impact on population dynamics of
lowland tapirs. For the purpose of this modelling, tapirs were categorised as
“monogamous”.
• Age of First Reproduction: VORTEX precisely defines reproduction as the time at
which offspring are born and not the age of sexual maturity. The software uses the
mean age rather than the earliest recorded age of offspring production. The earliest
recorded conception of a female Malayan tapir at Saint Louis Zoo in the United States
has been at 36 months (3 years), although females have bred as early as 31-32 months
of age (Read 1986). Female Baird's tapirs in the wild reach sexual maturity from 2-3
years of age, and males at 3 (C.R. Foerster, personal communication). Eisenberg (1997)
notes that a female lowland tapir does not become sexually mature until she is nearly 2
years of age under ideal conditions. According to Barongi (1993), captive lowland tapirs
are usually sexually mature by 14-24 months and conceive at an average of 4 years of

202
age. At Madrid Zoo in Spain, a 27 months old female lowland tapir gave birth to a fully
developed calf (Barongi 1993). At Rio de Janeiro Zoo in Brazil, a 30 months old female
lowland tapir successfully gave birth to a healthy calf (G. Landau-Remy, personal
communication). More recent results coming from the 2008 North-American Studbook
for Lowland Tapirs show that female lowland tapirs reach their sexual maturity at 19
months of age (1.6 years) and first reproduce at 32 months (2.7 years) (D. Goff, AZA
Lowland Tapir Studbook Keeper, personal communication). I assumed that natural
situations impose a toll on growth and achieving sexual maturity, and thus assumed
that both sexes are capable of siring their first offspring at age 4.
• Maximum Age of Reproduction: VORTEX initially assumes that animals can
reproduce (at the normal rate) throughout their adult life. According to Eisenberg
(1997), a female lowland tapir can remain reproductively active into her 10th year of life
and beyond. According to Robinson & Redford (1986), the average age of last
reproduction for wild lowland tapirs is 23 years. Results from the 2008 North-American
Studbook for Lowland Tapirs indicate that the maximum age of reproduction for the
species is 15 years for females and 19 years for males (D. Goff, AZA Lowland Tapir
Studbook Keeper, personal communication). I set a maximum age of reproduction at 20
years for both males and females.
• Maximum Number of Offspring per Year: Data on gestation periods comes from
captive tapir populations. The four species of tapirs have a gestation period of 13-14
months (390-407 days) (Barongi 1993). Older records from captive lowland tapirs have
noted that this species have a gestation period from 335-439 days (von Richter 1966;
Mallinson 1974). Inter-birth interval in captivity is close to 18 months (Barongi 1993).
According to Eisenberg (1997), a female lowland tapir may conceive within a month
after giving birth and under ideal circumstances a young can be born every 14 months
in habitats exhibiting little seasonality in food availability. In seasonally dry habitats, the
interval between births may be longer. For the purpose of this modelling I considered a
maximum number of 1 offspring per year.
• Maximum Litter Size: Female tapirs rarely give birth to more than 1 young per litter
(Barongi 1993). Only one twinning event was recorded in the 2008 North-American
Studbook for Lowland Tapirs (D. Goff, AZA Lowland Tapir Studbook Keeper, personal
communication). A female Malayan tapir held at the Malay Tapir Conservation Centre at
the Sungai Dusun Wildlife Reserve in Malaysia gave birth to twin calves in May 2007.
This was the first recorded twinning in Malayan tapirs (Z. Zainuddin & C. Traeholt,
personal communication). However, these are rare events. For the purpose of the
modelling, I considered a maximum litter size of 1 progeny.

203
•
• Sex Ratio at Birth: The 2008 North-American Studbook for Lowland Tapirs reports a
sex ratio at birth of 3 males to 1 female (D. Goff, AZA Lowland Tapir Studbook Keeper,
personal communication). However, there is no evidence to suggest a skewed sex ratio
at birth in the wild. Among 35 different tapirs captured during this long-term study in
Morro do Diabo, 20 were females and 15 were males, resulting in a sex ratio of 1.33
females to 1 male (57% females and 43% males). The sample size of 35 individuals
represented ~30% of the tapir population in Morro do Diabo (~126 tapirs), and should
therefore have yielded a fairly precise estimate of sex ratio for the population. Souza-
Mazurek et al. (2000) monitored subsistence hunting among the Waimiri Atroari Indians
in Central Amazon in Brazil and recorded a sex ratio of kills of 1.03 females to 1 male.
Therefore, I assumed the sex ratio at birth to be 50% females and 50% males.
• Female Breeding Success (Percentage of Adult Females Breeding): As
mentioned above, the inter-birth interval for captive tapirs is close to 18 months
(Barongi 1993). A pair of lowland tapirs kept together at the National Zoo in the United
States gave birth to 9 calves with an average inter-birth rate of 20 months (from 17-22
months) (Baker 1920). Other zoo evidences and field observations for wild Baird's tapirs
in Corcovado National Park in Costa Rica indicate that females may become pregnant
while lactating, which can reduce the interval to as few as 16 months (C.R. Foerster,
personal communication). In addition, some females may lose their offspring during
lactation, or due to stillbirths or neonatal deaths, and come into oestrus sooner
afterward, therefore reducing the inter-birth interval. In a semi-captivity centre in
Ecuador, the average interval between lowland tapir births was 19 months (A. Tapias,
personal communication). For this modelling, I assumed that 60% of the females would
be reproducing in a given year.
• Environmental Variation in Breeding: Annual environmental variation in female
reproduction is modelled in VORTEX by specifying a standard deviation (SD) for the
proportion of adult females that successfully produce offspring in a given year. No data
are available for this parameter. Given their body size and reproductive rate, it is
expected that tapirs show very little variation (Robinson & Eisenberg 1985). Assuming
no variation in breeding may be less realistic than assuming a small variation. Thus,
10% of the initial rate, or 6%EV, was used in the simulation.
• Density Dependent Reproduction: Density dependent reproduction was not
included in the baseline model for Morro do Diabo.
• Mate Monopolisation: In many species, some adult males may be socially restricted
from breeding, despite being physiologically capable. Young males might be sexually
mature but, because they are still dispersing or have not yet established their own
territory, they might not be an effective part of the breeding pool. This can be modelled

204
in VORTEX by specifying a portion of the total pool of adult males that may be
considered “available” for breeding each year. Although there is a lack of field data
about this parameter, it was considered that an average of 90% of the male tapirs in
Morro do Diabo was reproducing each year.
6.2.2.4 Mortality Rates
There is virtually no data available on mortality rates for wild tapirs. However, some of the
information gathered during this study in Morro do Diabo allowed me to attempt calculations
of annual mortality of adult and sub-adult tapirs. A total of 25 tapirs (20 adults and 5 sub-
adults) were radio-collared (Appendix II, for complete details about captured/radio-collared
tapirs). Five of them died (3 adults and 2 sub-adults). Among the adults, two died of natural
causes, and the third one was predated by jaguar. One of the adults that died of natural
causes, an adult male, seemed to be very old and weak at the time of capture. I radio-
collared the animal and recorded its death 25 days after the capture. Therefore, I did not
include this animal on the calculations of mortality rates. Among the sub-adults (2 males), one
was predated by puma and the other one by jaguar. By dividing the number of deaths
(separately for adults and sub-adults) by the total number of months of radio-tracking, I
calculated annual mortality rates of adult and sub-adult tapirs in Morro do Diabo. Monthly
mortality of adult tapirs was 3/315=0.0095, which means that the monthly survival was 1-
0.0095=0.9905 and that the annual survival was 0.9905^12=0.892. As a result, the estimated
annual mortality for adult tapirs in Morro do Diabo was 10.8% (1-0.892=0.108). Similar
calculations yielded a mortality rate of 29% for sub-adult tapirs in Morro do Diabo. When
considering only the 14 tapirs radio-tracked from 8-36 months (Group 2), there were two
records of adult mortality and no records of sub-adult mortality. Therefore, monthly mortality
of adult tapirs was 2/293=0.0068, which means that the monthly survival was 1-
0.0068=0.9932 and that the annual survival was 0.9932^12=0.9214. Annual mortality for
adult tapirs in Morro do Diabo was 8% (1-0.9214=0.0786) according to the radio-tracking
information from tapirs monitored in Morro do Diabo over the long-term. Similar calculations
yielded a mortality rate of 0% for sub-adults.
For the purpose of this modelling, I set the mortality rate of adult tapirs in Morro do Diabo at
8%. Field studies on Baird's tapirs in Corcovado National Park, Costa Rica, demonstrated
evidence of risk-prone behaviour in sub-adults from ages 3 to 5, which precludes a high
mortality rate for this age class (C.R. Foerster, personal communication). However, I found
the sub-adult mortality rate based on data from this study (29%) to be excessively high,
probably due to small sample size of sub-adults. Therefore, I set the mortality rates of sub-
adult tapirs (ages 1-2, 2-3, and 3-4) in Morro do Diabo at a more conservative 15%.

205
According to Eisenberg (1997), mortality in lowland tapirs may be heavy during the first year
of life since predators (jaguar and puma) take younger animals. Additionally, zoo personnel
attending the Lowland Tapir PHVA Workshop reported relatively high expected mortality of
newborns. Therefore, I set the mortality rate for this age class at 10%. I assumed mortality
rates to be equivalent between males and females. Standard deviations were calculated as
20% of the mortality rate, which seemed to provide a sensible interval. Mortality rates and
standard deviations are presented in Table 6.1.
Table 6.1. Mortality rates and standard deviations estimated for different age classes of male and female tapirs in Morro do Diabo State Park, São Paulo, Brazil.
Age Class
Mortality Rate (%)
Standard Deviation (%)
From age 0 to 1 10 2 From age 1 to 2 - sub-adult 15 3 From age 2 to 3 - sub-adult 15 3 From age 3 to 4 - sub-adult 15 3 After age 4 - adult 8 1.6
6.2.2.5 Population Description
• Number of Populations: In the baseline model, only 1 population was considered
(Morro do Diabo). Metapopulation dynamics was not explored at this stage.
• Dispersal among Populations: In the baseline model only 1 population was
considered (Morro do Diabo), with no immigration or emigration of individuals.
• Initial Population Size (N): I used three values of initial tapir population size based
on tapir densities estimated through three different methods: (i) Radio-telemetry: 126
tapirs; (ii) Footprint Identification Technique (FIT): 159 tapirs; and, (iii) Nocturnal line-
transect sampling: 237 tapirs (Chapter 4, Table 4.6).
• Carrying Capacity (K): The carrying capacity was considered to be the same as the
initial population size. In VORTEX, if the population size N exceeds K at the end of a
particular time cycle, additional mortality is imposed across all age and sex classes in
order to reduce the population back to this upper limit (Miller & Lacy 2005).
• Catastrophe: Reed et al. (2003) determined the frequency and severity of die-offs in
88 species of vertebrates. The authors noted that the frequency of severe die-offs in
vertebrate populations is strongly related to the generation length of the organism and
that the probability of a severe die-off for a particular population is ~14% per
generation. The per year probability was calculated simply from the per generation
probability by the following formula: P(Y)=P(G)/T. Where P(Y) is the probability of a
catastrophe per year, P(G) is the probability of a catastrophe per generation (14%), and
T is the generation length of the species (10 years for tapirs). P(Y)=0.014. Catastrophes

206
in Morro do Diabo could be fire or perhaps infectious disease. None of these
catastrophes where thought to result in more than 10% decrease in tapir mortality or
reproduction. For the purpose of this modelling, I included a catastrophe with a per year
probability of 1.4% causing a 10% decrease in mortality and reproduction.
• Harvest: The model included harvest by road-kill. Currently, speed radars and
educational sign posts have been placed on the highway crossing Morro do Diabo. As a
result, only one tapir was killed on the highway over the last three years. For the
purpose of this modelling, 1 male and 1 female were considered to be killed on the
highway every 2 years.
• Supplementation: Supplementation from other unrelated populations, wild or captive,
was not incorporated into the baseline model.
A compilation of all parameters used in the baseline model is presented in Table 6.2.
Table 6.2. Summary of parameter input values used in the VORTEX baseline model for the lowland tapir population in Morro do Diabo State Park, São Paulo, Brazil. (SD=standard deviation; LE=lethal equivalent).
Parameter
Baseline Value
Number of Populations 1
Initial Population Size (N)
126 (radio-telemetry) 159 (FIT) 237 (line-transect)
Carrying Capacity (K) Same as N Inbreeding Depression 3.14 LE % of the effect of inbreeding due to recessive lethal alleles 50 Breeding System Monogamy Age of First Reproduction (♀ / ♂) 4 years Maximum Age of Reproduction 20 years Annual % of Adult Females Reproducing (SD) 60% (6%) Density Dependent Reproduction? No Maximum Litter Size 1 Overall Offspring Sex Ratio 50:50 % Adult Males in Breeding Pool 90 Mortality Rates: % Mortality from age 0-1 (SD) 10 (2) % Mortality from age 1-2 (SD) - sub-adult 15 (3) % Mortality from age 2-3 (SD) - sub-adult 15 (3) % Mortality from age 3-4 (SD) - sub-adult 15 (3) % Mortality from age above 4 (SD) - adult 8 (1.6) Catastrophe* YES Harvest* 1♀ + 1 ♂ / 2 years Supplementation None
*These values were used in the baseline model as well as for the estimate of Minimum Viable Population (MVP)

207
6.2.3 Sensitivity Analysis
It is important to recognise that uncertainty regarding the biological parameters of a given
population occurs at several levels especially for parameters that have never been measured
in the population. Therefore, sensitivity testing is required to determine the extent to which
uncertainty in input parameters results in uncertainty regarding the future fate of the
population. This tool is used to uncover particularly sensitive parameters that, if changed,
could significantly alter the results and conclusions derived from the model. If alternative
plausible parameter values result in divergent predictions for the population, then it is
important to resolve the uncertainty with better data to produce more confident results.
Sensitivity of population dynamics to certain parameters indicates that those parameters
describe factors that could be critical determinants of population viability. Additionally,
sensitivity analysis evaluates the robustness of the baseline model to variations in selected
parameter values. The more robust the model is to variations in a particular parameter, the
less sensitive the model’s results are to the input values of that parameter.
Sensitivity analysis was performed to evaluate the effect of reproductive and mortality
parameters on the stochastic growth rate (rstoc) of the lowland tapir population in Morro do
Diabo. In each analysis, only one parameter was varied at a time, using the highest and
lowest estimated values (Table 6.3). Results of sensitivity analysis were plotted against the
(rstoc) value observed for the baseline model. Catastrophe and harvest were not considered.
Table 6.3. Highest and lowest reproductive and mortality lowland tapir parameter values and standard deviations (SD) used for sensitivity analysis. (*Sub-adult mortality obtained from field data collected in Morro do Diabo State Park).
Parameter Low Baseline Highest
% juvenile mortality (age 0-1) 5 (1) 10 (2) 20 (4)
% sub-adult mortality (age 1-4) 10 (2) 15 (3) 29 (5.8)*
% adult mortality (age above 4) 5 (1) 8 (2) 15 (3)
Age of first reproduction (♀) 3 4 5
Age of first reproduction (♂) 3 4 5
Annual % of adult females reproducing 50 (6) 60 (6) 65 (6)
6.2.4 Minimum Viable Population Analysis
The Minimum Viable Population (MVP) is an estimate of the minimum number of organisms of
a particular species that constitutes a viable population over the long-term. More specifically,
MVP is the smallest possible population size at which a biological population can exist without
facing extinction from natural disasters or demographic, environmental, or genetic
stochasticity (Shaffer 1981; Gilpin & Soulé 1986; Soulé 1987).

208
Lowland tapirs have a wide geographic distribution, across different biomes, where they face
various types and levels of threats. It is thus almost impossible to establish a common
definition of MVP for the species. In some areas, populations are small and fragmented, while
in others, populations are large and contiguous. Therefore, an analysis of MVP depends on the
objectives and measures used to characterise it. I carried out an analysis of the MVP for
lowland tapirs in Morro do Diabo using two different measures:
• Average probability that the population will go extinct (P(E)100): Extinction is
defined in the model as no animals of one or both sexes remaining. P(E)100 is
determined by the proportion of the 1000 iterations within a given scenario that go
extinct within 100 years. For the purpose of this modelling, I set a goal of P(E)100=0.
• The genetic diversity of the extant populations (GD): It is expressed as a
percent of the initial genetic diversity of the population that is maintained within 100
years. For the purpose of this modelling, I set a goal of maintaining 95% of genetic
diversity after 100 years.
6.2.5 Modelling of Alternative Scenarios
The baseline model was used to analyse different scenarios and conservation challenges
facing lowland tapirs in the Atlantic Forests of the Pontal do Paranapanema Region, including
Morro do Diabo and surrounding forest fragments. I evaluated which factors, if changed or
manipulated, may have the greatest effect on causing or preventing the extinction of lowland
tapirs in the Pontal do Paranapanema Region. For some of these analyses, the baseline model
excluded catastrophes and harvest as values for these threats were specifically tested.
The scenarios modelled as part of these analyses included:
(i) Impact of fire
(ii) Impact of road-kill
(iii) Impact of infectious disease
(iv) Metapopulation scenario
(v) Establishment of corridors
The measures used to evaluate results of different alternative scenarios were:
(i) Mean rate of stochastic population growth (rstoc)
(ii) Probability of extinction (P(E)100)
(iii) Mean time to extinction (MeanTE)
(iv) Gene diversity of extant population (GD)
(v) Population size at the end of simulations (N-extant)

209
6.2.5.1 Impact of Fire
Fire was considered to be a potential catastrophe for the tapir population in Morro do Diabo
and surrounding forest fragments. Catastrophes are singular environmental events that are
outside of the bounds of normal environmental variation affecting animal survival and/or
reproduction. Natural catastrophes include volcanic eruptions, tornadoes, fires, floods,
droughts, and disease, among others. Catastrophes are modelled in VORTEX by assigning an
annual probability of occurrence and a pair of severity factors describing their impact on
survival (across all age and sex classes) and the proportion of females successfully breeding in
a given year. These factors range from 0 (maximum or absolute effect) to 1 (no effect), and
are imposed during the single year of the catastrophe, after which time the demographic rates
rebound to their baseline values (Miller & Lacy 2005).
From 1963 to date, several forest fires have occurred in Morro do Diabo, most of them caused
by fire management of pasture fields that accidentally entered Morro do Diabo (Faria & Pires
2006). The two major fire events occurred in 1968 and 1989, destroying 8 km² and 1.6 km²
of forest respectively. For the purpose of modelling the impact of fire on the tapir population
in Morro do Diabo, I modelled the occurrence of relevant fire events starting with a frequency
of 1 event every 20 years (5%) and gradually increasing the frequency up to 1 event per year
(100%). A relevant fire event was considered to destroy double the area destroyed by the
major fire occurred in Morro do Diabo in 1968 (16 km²), an area which according to tapir
densities provided in Chapter 4 would host ~6 tapirs or roughly 5% of the resident tapir
population when considering a population size of 126 individuals. Therefore, fire was modelled
as a catastrophe that kills 5% of the tapirs in the population each time it occurs, but it does
not affect reproduction.
6.2.5.2 Impact of Road-Kill
One of the main threats to lowland tapirs and many other animal species in Morro do Diabo is
the highway that crosses the protected area (SP-613 - Rodovia Estadual Arlindo Bétio) (Figure
6.1.1). The Forestry Institute of São Paulo State, the governmental agency responsible for the
administration of Morro do Diabo, and researchers from IPÊ - Instituto de Pesquisas
Ecológicas have monitored the annual rates of road-kill on the highway for over a decade.
From 1996 to 2006, an average of 6 tapirs were hit by cars and killed on the highway every
year (Figure 6.1.2). In 1998 alone, 8 tapirs were killed. Most of the tapirs killed on the road
were adult individuals capable of breeding. Since 2007, the Forestry Institute has taken
several effective measures to reduce wildlife road-kill in Morro do Diabo. Speed radars and
educational sign posts were placed on the highway and road-kill was drastically reduced. Over
the last 3 years (2007-2009), only 1 tapir was killed on the SP-613 (A.S. Pires, Director of
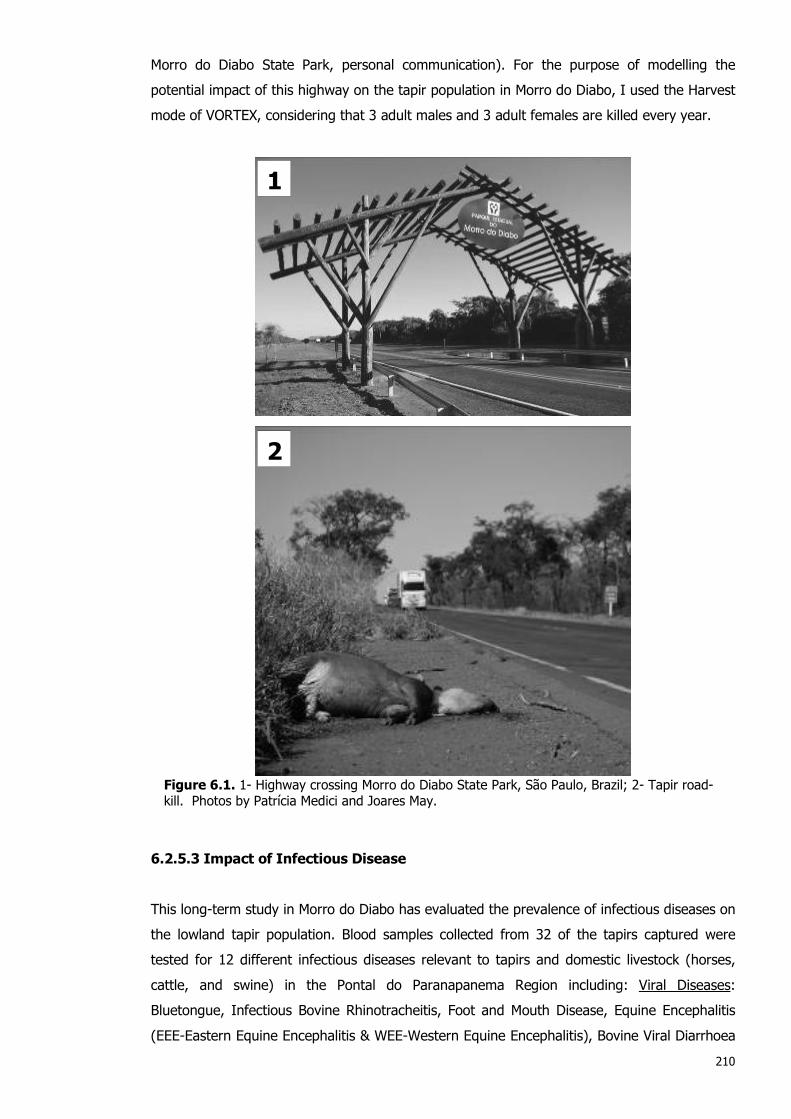
210
Morro do Diabo State Park, personal communication). For the purpose of modelling the
potential impact of this highway on the tapir population in Morro do Diabo, I used the Harvest
mode of VORTEX, considering that 3 adult males and 3 adult females are killed every year.
Figure 6.1. 1- Highway crossing Morro do Diabo State Park, São Paulo, Brazil; 2- Tapir road-kill. Photos by Patrícia Medici and Joares May.
6.2.5.3 Impact of Infectious Disease
This long-term study in Morro do Diabo has evaluated the prevalence of infectious diseases on
the lowland tapir population. Blood samples collected from 32 of the tapirs captured were
tested for 12 different infectious diseases relevant to tapirs and domestic livestock (horses,
cattle, and swine) in the Pontal do Paranapanema Region including: Viral Diseases:
Bluetongue, Infectious Bovine Rhinotracheitis, Foot and Mouth Disease, Equine Encephalitis
(EEE-Eastern Equine Encephalitis & WEE-Western Equine Encephalitis), Bovine Viral Diarrhoea
1
2

211
(BVD), Bovine Viral Leucosis, New Jersey Vesicular Stomatitis, Aujeszky’s Disease, Swine
Parvovirus, and Equine Infectious Anaemia; Bacterial Diseases: Brucella spp and Leptospira
spp. Positive titles were found for four diseases: Bluetongue (N=5), Infectious Bovine
Rhinotracheitis (N=1), Equine Encephalitis (N=6 for both EEE and WEE), and Leptospira spp
(N=8; sorovar pomona N=6; sorovar Autumnalis N=1; and sorovar Hebdomadis N=1). These
results show that tapirs in Morro do Diabo have been exposed to diseases, especially
Leptospirosis, which presented the highest prevalence of the study (25% of the tapirs).
Infectious disease can be modelled in VORTEX as a catastrophe that decreases survival and/or
fertility of the individuals during the year(s) in which it occurs in the population. Once the
disease has completed its cycle, the survival and/or fertility rates return to normal values and
the population, if large enough and in the absence of other threats, can probably recover
without further consequences. Thus, modelling an epidemic in VORTEX is not different from
modelling the effects of a fire. An epidemic disease, however, once present will probably last
in the population and in the environment for several generations. In addition, such pathogens
usually do not kill their hosts, but often just reduce fertility and the lifetime of the carrier
individuals, resulting in a reduction in the stochastic growth rate of the population.
Nonetheless, the long-term results of this reduction are still unknown.
Using the baseline model, I modelled a closed lowland tapir population, in which all the
individuals are already infected since the start with the bacteria that causes Leptospirosis
(Leptospira spp). Judging from the effects of the bacteria on horses (domestic animals related
to tapirs) and other wildlife species, veterinarians suggest that the presence of the disease
can potentially cause a 1% increase in the mortality rate of all age classes, and a 5%
decrease in the percentage of females breeding (P.R. Mangini, personal communication).
6.2.5.4 Metapopulation Scenario
There is a multitude of Atlantic Forest fragments of different sizes and levels of habitat
disturbance throughout the Pontal do Paranapanema Region. Ditt (2002) surveyed all forest
patches larger than 4 km² in the region (13 fragments). Lowland tapir presence was
confirmed in seven of them, while no tapir evidence was found in the other six. During this
study, 12 tapir dispersal routes between Morro do Diabo and surrounding forest fragments, as
well as between the fragments amongst themselves were identified (Figure 6.2). The average
distance between forest fragments was 4,150 m (varied from 1,318-8,950 m).
For the purpose of modelling the tapir metapopulation for the entire Pontal do Paranapanema
Region, I included 8 different sub-populations: Morro do Diabo and the 7 forest fragments
where tapirs were known to be present. I tested two different rates of tapir dispersal among
forest patches as 1% or 0.5%. Additionally, I tested the impact of rate of tapir mortality

212
during dispersal (10% or 0% mortality). Dispersing tapirs where individuals of both sexes
from 2-4 years of age (sub-adults). Maximum and minimum population sizes were established
using results of tapir densities provided in Chapter 4. In all the models, the carrying capacity
(K) was equal to the initial population size. Nevertheless, I also tested what would happen if
the carrying capacity of each of the forest fragments was much higher (K=100).
Figure 6.2. Potential routes of tapir dispersal between Morro do Diabo State Park (MDSP) and seven surrounding forest fragments where the presence of tapirs was confirmed (Ditt 2002) in the Pontal do Paranapanema Region, São Paulo, Brazil. (SMC: Santa Maria/Cachoeirinha; PB: Ponte Branca; ASEA: Água Sumida/Estrela da Alcídia; LN; Lua Nova/Santa Tereza da Água Sumida; SMM: Santa Maria dos Micos; SMSP: Santa Mônica/São Paulo; RB: Ribeirão Bonito). Figures 2.5 and 2.6 (Chapter 2) provide further reference on the location of Morro do Diabo State Park. Note: SMC, ASEA, and PB are part of the Black-Lion-Tamarin Ecological Station.
MDSP
RB
SMSP
SMC
PB
LN
SMM
ASEA

213
6.2.5.5 Establishment of Corridors
I modelled the establishment of corridors between Morro do Diabo and surrounding forest
fragments, and analysed the impact the increase in landscape connectivity would have on the
viability of the lowland tapir populations. The Landscape Restoration Programme of IPÊ -
Instituto de Pesquisas Ecológicas has been working on the design and establishment of agro-
forestry corridors and stepping-stones in the Pontal do Paranapanema Region for the past 14
years. A map of potential locations for the placement of recommended wildlife corridors has
been designed (Figure 6.3).
The establishment of corridors would benefit the tapir populations of the Pontal do
Paranapanema Region if they linked the different forest fragments together, and rates of tapir
mortality were not increased when using corridors. For the purpose of modelling this scenario
in VORTEX, the initial population size and carrying capacity were increased from 126 to 147
(radio-telemetry density estimate) or from 237 to 277 (line-transect sampling density
estimate) (Table 6.4). I also tested what would happen if I included in this analysis the 6
forest fragments where tapirs were absent (Ditt 2002), increasing the initial population size
and carrying capacity from 126 to 163 (radio-telemetry density estimate) or from 237 to 307
(line-transect sampling density estimate) (Table 6.4).
Figure 6.3. Potential locations for the establishment of agro-forestry corridors connecting Morro do Diabo State Park to surrounding forest fragments in the Pontal do Paranapanema Region, São Paulo, Brazil. Map designed by IPÊ - Instituto de Pesquisas Ecológicas. Figures 2.5 and 2.6 (Chapter 2) provide further reference on the location of Morro do Diabo State Park.

214
Table 6.4. Estimates of lowland tapir population sizes in Morro do Diabo State Park and seven forest fragments where the presence of tapirs was confirmed (Ditt 2002) (A), and potential carrying capacity of six forest fragments where tapirs were absent (B). Estimates of tapir population size were based on densities obtained by radio-telemetry, nocturnal line-transect sampling, and Footprint Identification Technique. (*Potential carrying capacity of fragments where tapirs were absent; **Potential total population size including forest fragments where tapirs were absent).
MDSP & Forest Fragments
Area (km²)
Population Size (number of individuals)
Radio-Telemetry 0.34 tapirs km-²
FIT 0.43 tapirs km-²
Line-Transect 0.64 tapirs km-²
Morro do Diabo State Park (MDSP) 370.0 126 159 237
Santa Maria / Cachoeirinha (SMC) 18.3 6 8 12 Ponte Branca (PB) 13.0 4 6 8 Água Sumida / Estrela da Alcídia (ASEA) 12.1 4 5 8 Lua Nova / Santa Tereza da Água Sumida (LN) 5.4 2 2 3 Santa Maria Micos (SMM) 5.1 2 2 3 Santa Mônica / São Paulo (SMSP) 4.9 2 2 3 Ribeirão Bonito (RB) 4.2 2 2 3
Total population size in fragments where tapirs are present (A) 22 27 40
Tucano (TU) 18.0 0 (6*) 0 (8*) 0 (12*) Santa Rita (SR) 8.7 0 (3*) 0 (4*) 0 (5*) Água Sumida / Santa Maria (ASSM) 5.5 0 (3*) 0 (2*) 0 (4*) 6R (6R) 4.3 0 (1*) 0 (2*) 0 (3*) Nova Pontal (NP) 4.3 0 (1*) 0 (2*) 0 (3*) Água do Peão (AP) 4.2 0 (1*) 0 (2*) 0 (3*)
Carrying capacity in fragments where tapirs are absent (B) 15 20 30
Total Tapir Population (MDSP + fragments A)
Potential Total Tapir Population (MDSP + A + B) 148
(163**) 186
(206**) 277
(307**) Note: SMC, PB, ASEA, and TU are the fragments that compose the Black-Lion-Tamarin Ecological Station.

6.3 Results
6.3.1 VORTEX Baseline Model
The VORTEX baseline model of the lowland tapir population in Morro do Diabo was based on
the parameters previously described and reflected the biological potential of the species in
Morro do Diabo. These parameters were based on the biology of this population in the
absence of stochastic fluctuations (both demographic and environmental variation), inbreeding
depression, limitation of mates, and immigration or emigration.
6.3.1.1 Deterministic Output
The demographic rates (reproduction and mortality) included in the baseline model were used
to calculate deterministic characteristics of the model population. The baseline model resulted
in a deterministic growth rate (rdet) of 0.047 (λ= 1.048). This represented a potential annual
growth rate of almost 5%, which enables the population to grow when below carrying
capacity. Generation time (the average age of reproduction) resulted in ~10 years for both
males and females. Adult sex ratio of adult males to adult females was 1. Overall, these
population characteristics were accepted as realistic for lowland tapirs and lend validity to this
model as a reasonable representation of the lowland tapir population in Morro do Diabo.
6.3.1.2 Stochastic Baseline Results
Results from the baseline model projected that a population of 126 tapirs (Radio-telemetry
Method 2 density estimate, 0.34 tapirs km-²), in the complete absence of catastrophes and
threats, is likely to persist over the next 100 years. The stochastic growth rate (rstoch) of this
population was 0.040, probability of extinction was zero, and the population size at the end of
simulations at 100 years N-extant was 124 tapirs with 92% of genetic diversity remaining.
When including catastrophe and harvest as described in the baseline model, the population
still appears to be capable of persisting over the next 100 years. However, the stochastic
growth rate (rstoch) was reduced to 0.029, N-extant was 122 tapirs, and 92% of genetic
diversity remaining.

216
6.3.2 Sensitivity Analysis
The results from the sensitivity analysis showed that the parameters sub-adult mortality and
adult mortality have the strongest influence on the dynamics of lowland tapir populations
(Figure 6.4). The age of first reproduction for female tapirs appeared to be a sensitive
parameter as well.
Parameter
Su
bM
ort
Ad
Mo
rt
FA
1R
%F
B
Ma
xA
R
Ju
Mo
rt
MA
1R
Sto
ch
astic r
valu
e
-0.04
-0.02
0.00
0.02
0.04
0.06
0.08Lowest Parameter Value
Highest Parameter Value
Figure 6.4. Results from sensitivity analysis. The line represents the value of stochastic population growth from the baseline model (SubMort: Sub-adult mortality; AdMort: Adult mortality; FA1R: Age of first reproduction for females; %FB: Annual percent of adult females breeding in the population; MaxAR: Maximum age of reproduction; JuMort: Juvenile mortality; MA1R: Age of first reproduction for males)
6.3.3 Minimum Viable Population (MVP)
MVP was previously defined as a population of tapirs with P(E)100=0 and 95% of genetic
diversity remaining after 100 years. According to the VORTEX model, ~200 individual tapirs
would be necessary to maintain a viable population for the next 100 years (Table 6.5).

217
Table 6.5. Results of genetic diversity (GD, %), probability of extinction (P(E)100, in %), mean rate of stochastic population growth (rstoc), and population size at the end of simulations (N-extant) obtained through the analysis of Minimum Viable Population (MVP) for lowland tapirs.
Population Size (N)
GD (%)
P(E)100 (%)
rstoc
N-extant
25 0 100 -0.063 0 50 77 67 -0.013 30 75 86 6 0.014 61 100 90 0 0.024 94 125 92 0 0.028 121 150 93 0 0.032 147 175 94 0 0.034 172 200 95 0 0.035 197 225 95 0 0.037 223 250 96 0 0.037 247 275 96 0 0.038 273 300 96 0 0.038 297
6.3.4 Modelling of Alternative Scenarios
6.3.4.1 Impact of Fire
As the frequency of fire events increased, the stochastic growth rate of the tapir population in
Morro do Diabo dramatically decreased. In addition, as the size of the tapir population
increased, the impact of fire events decreased (Figure 6.5).
Frequency of Occurence of Fire in 100 Years
0 20 40 60 80 100
Sto
ch
astic G
row
th R
ate
(r)
-0.03
-0.02
-0.01
0.00
0.01
0.02
0.03
0.04
0.05 Initial Population 126
Initial Population 159
Initial Population 237
Figure 6.5. Impact of fire events on stochastic growth rate as the frequency of fires increases for populations of tapir with different initial population sizes (N=126; N=159; N=237).

218
6.3.4.2 Impact of Road-Kill
Removing 6 adult tapirs (3 females and 3 males) from the population every year due to road-
kill had a major impact on the tapir population of Morro do Diabo. A tapir population of 126
individuals (radio-telemetry estimate) resulted in a 100% probability of extinction in 100
years. Nevertheless, the higher the initial population size, the lower the probability of
extinction (Table 6.6). Road-kill also reduced the genetic diversity of the population.
Table 6.6. Results of mean rate of stochastic population growth (rstoc), probability of extinction (P(E)100, %), mean time to extinction in years (MeanTE, years), genetic diversity of extant population (GD, %), and population size at the end of simulations (N-extant) obtained through the analysis of the impact of road-kill on the lowland tapir population in Morro do Diabo State Park.
Population Size (N)
rstoc
P(E)100 (%)
MeanTE (years)
GD (%)
N-extant
126 -0.082 100 38 0 0 159 -0.043 88 61 91 85 237 0.013 3 78 95 215
6.3.4.3 Impact of Infectious Disease
A disease such as Leptospirosis can cause a 1% increase in the mortality rate of all tapir age
classes, and a 5% decrease in percentage of females breeding in the population (P.R.
Mangini, personal communication). When using an initial population size and carrying capacity
of 126 individual tapirs, the impact of the disease caused a decrease of stochastic growth rate
(rstoch) from 0.040 to 0.019, which amounts to a decrease of almost 50%. When using an
initial population size and carrying capacity of 237 tapirs, (rstoch) decreased from 0.043 to
0.023. In both cases, the impact of the disease did not increase the probability of extinction of
tapirs.
6.3.4.4 Metapopulation Scenario
Without dispersal from Morro do Diabo, all the tapir populations in the small forest fragments
of the Pontal do Paranapanema Region will go extinct over the next 100 years. However, this
dispersal of individuals from Morro do Diabo to the forest fragments had a major impact on
the resident tapir population of Morro do Diabo. In the absence of dispersal, the tapir
population growth in Morro do Diabo was almost 4%. For an initial population size of 126
tapirs in Morro do Diabo (radio-telemetry estimate), a 1% dispersal of tapirs aged from 2-4
years (sub-adults), decreased the growth rate in Morro do Diabo to almost 0% (Table 6.7).
When decreasing the dispersal rate by half (0.5%), the tapir population in Morro do Diabo
maintained a population growth rate of 2% (Table 6.7). When considering an initial population
size of 237 tapirs (line-transect sampling estimate), a 1% dispersal of tapirs from Morro do

219
Diabo still reduced the growth rate in Morro do Diabo to ~1%, while a 0.5% dispersal rate
maintained an almost 3% growth rate (Table 6.8). In VORTEX, if the initial population size
exceeds the carrying capacity at the end of a particular time cycle, additional mortality is
imposed across all age and sex classes in order to reduce the population back to this upper
limit (Miller & Lacy 2005). Therefore, due to their small sizes, the forest fragments are acting
as sink habitats for tapirs dispersing from Morro do Diabo and decreasing the stochastic
growth rate of the tapir population in Morro do Diabo. The probability of survival of tapirs
during dispersal did not impact the tapir population in Morro do Diabo as much as this loss of
tapirs due to the low carrying capacity of the small fragments (Tables 6.7 and 6.8). Dispersal
rate, rather than survival during dispersal or initial population size, was the parameter that
had the most impact on the overall tapir metapopulation in the Pontal do Paranapanema
Region.
If the forest fragments were larger and had a potential carrying capacity of 100 tapirs each,
the stochastic growth rate of Morro do Diabo would be less impacted as fewer animals would
die as a result of lack of habitat carrying capacity (Table 6.9). The forest fragments still acted
as a sink for Morro do Diabo. However, the lower the tapir dispersal rates between Morro do
Diabo and the forest fragments, the higher the stochastic growth rate of the tapir population
in Morro do Diabo.

220
Table 6.7. Impact of probability of survival and dispersal rate on stochastic growth rate and probability of extinction (%) of the lowland tapir sub-populations and metapopulation in the Pontal do Paranapanema Region, São Paulo, Brazil (radio-telemetry estimate, N=126).
Sub-Populations &
Metapopulation
1% dispersal
0.5% dispersal
90% survival
100% survival
90% survival
100% survival
rstoc P(E)100 rstoc P(E)100 rstoc P(E)100 rstoc P(E)100
MDSP 0.002 1 0.003 0 0.022 0 0.022 0
SMC -0.010 98 -0.007 97 -0.008 100 -0.007 100 PB 0.166 22 0.182 20 0.110 27 0.120 24 ASEA 0.161 24 0.177 21 0.105 28 0.115 23 SMM 0.167 99 0.172 98 0.158 100 0.161 100 SMSP 0.158 100 0.159 100 0.152 100 0.152 10 RB 0.545 61 0.582 64 0.389 62 0.411 62 LN 0.151 100 0.154 100 0.151 100 0.149 100 METAPOPULATION 0.028 0 0.031 0 0.032 0 0.034 0
Table 6.8. Impact of probability of survival and dispersal rate on stochastic growth rate and probability of extinction (%) of the lowland tapir sub-populations and metapopulation in the Pontal do Paranapanema Region, São Paulo, Brazil (line-transect estimate, N=237).
Sub-Populations &
Metapopulation
1% dispersal
0.5% dispersal
90% survival
100% survival
90% survival
100% survival
rstoc P(E)100 rstoc P(E)100 rstoc P(E)100 rstoc P(E)100
MDSP 0.007 0 0.007 0 0.026 0 0.026 0
SMC -0.009 89 -0.007 87 -0.008 94 -0.007 92 PB 0.178 2 0.195 1 0.105 2 0.116 3 ASEA 0.191 3 0.212 2 0.114 4 0.126 3 SMM 0.056 95 0.059 92 0.042 98 0.048 98 SMSP 0.044 100 0.049 99 0.039 100 0.039 100 RB 0.701 35 0.756 34 0.460 35 0.492 35 LN 0.030 100 0.032 100 0.027 100 0.027 100 METAPOPULATION 0.034 0 0.037 0 0.037 0 0.038 0
Table 6.9. Impact of dispersal rate on stochastic growth rate of the lowland tapir sub-populations and metapopulation in the Pontal do Paranapanema Region, São Paulo, Brazil, considering a carrying capacity of 100 tapirs in each forest fragment, 90% of survival during dispersal (radio-telemetry estimate, N=126).
Sub-Populations &
Metapopulation
rstoc
1% dispersal
0.5% dispersal
MDSP 0.024 0.032
SMC 0.027 0.021 PB 0.051 0.051 ASEA 0.040 0.037 SMM 0.041 0.040 SMSP 0.047 0.036 RB 0.065 0.057 LN 0.044 0.030 METAPOPULATION 0.034 0.036

221
6.3.4.5 Establishment of Corridors
The establishment of corridors was modelled as an increase in landscape connectivity. The
initial population size and carrying capacity were increased from 126 to 148 individuals (radio-
telemetry estimate), and from 237 to 277 individuals (line-transect estimate) (Table 6.10).
The increase from 126 to 148 tapirs did not result in an increase in stochastic growth rate, but
presented an increase in percentage of genetic diversity maintained (Table 6.10). The
increase from 237 to 277 tapirs resulted in a fairly small increase in stochastic growth rate
(Table 6.10).
Similarly, when adding to the analysis the potential carrying capacity of the forest fragments
where tapirs were absent - increase in the initial population size and carrying capacity from
126 to 163 (radio-telemetry estimate), or from 237 to 307 (line-transect estimate) (Table 6.4)
- increases in tapir population’s stochastic growth rate and genetic diversity were observed.
Table 6.10. Impact of the establishment of corridors on the stochastic growth rate (rstoc), probability of extinction (P(E)100), population size at the end of simulations (N-extant), and genetic diversity of extant population (GD) of the lowland tapir sub-populations in the Pontal do Paranapanema Region, São Paulo, Brazil (radio-telemetry estimate: MDSP - Morro do Diabo State Park=126 tapirs, Entire population=147 tapirs; line-transect estimate: MDSP=237 tapirs, Entire population=277 tapirs).
Population Size (N)
rstoc
P(E)100 (%)
N-extant
GD (%)
WITHOUT Corridors N=126 (MDSP) 0.040 0 124 92
WITH Corridors N=148 (Entire Population) 0.040 0 145 93 WITHOUT Corridors
N=237 (MDSP) 0.043 0 235 96 WITH Corridors
N=277 (Entire Population) 0.044 0 275 96

222
6.4 Discussion
6.4.1 Biological Potential of Tapirs in Morro do Diabo State Park
The resulting VORTEX baseline model projected the biological potential of the tapir population
in Morro do Diabo. The resulting potential annual growth rate of almost 5% enables the
population to grow when below carrying capacity. Nevertheless, this growth rate provided
evidence that even in the absence of additional threats or stochastic events, the tapir
population in Morro do Diabo will not grow very rapidly and, most importantly, will take a
considerable amount of time to recover from any events that severely reduce their numbers.
Results from the baseline model projected that a tapir population of 126 tapirs is likely to
persist in Morro do Diabo over the next 100 years, even when facing regular fire events and
annual road-kill. However, while the probability of extinction was zero, only 93% of genetic
diversity remained at the end of simulations at 100 years. The loss of genetic diversity was in
part due to the relatively small population size and also because I modelled a closed
population in which no immigration of unrelated animals occurred.
6.4.2 Sensitivity Analysis: Uncertainty in Input Parameters
The results from the sensitivity analysis showed that the parameters sub-adult mortality and
adult mortality have the strongest influence on the dynamics of the lowland tapir population in
Morro do Diabo. Tapirs are long-lived, late maturing species with slow reproductive rates and
these species are typically characterised by high adult survival (Oli & Dobson 2003). This
means that any threats impacting this parameter, such as hunting or road-kill of adults will
have a major impact on the tapir population. The age of first reproduction for female tapirs
appeared to be a sensitive parameter as well. This might be explained by the fact that a year
of sub-adult mortality (the highest mortality rate of all age classes) is either added or
subtracted along with the age of first reproduction for females. Therefore, this parameter
actually shows the impact of sub-adult mortality. These results show that it would be
extremely important to obtain more accurate values of tapir mortality rates in the wild.
Obtaining more accurate values for these parameters would be critical to improve current
VORTEX models for lowland tapirs. The more accurate the parameters used are, the more
robust the model is. Nevertheless, as shown by this long-term lowland tapir study in Morro do
Diabo, accurate estimates for these parameters in wild populations of tapirs are the most
difficult to obtain.

223
6.4.3 Minimum Viable Population (MVP): Morro do Diabo State Park
One of the most important results of the PVA for the lowland tapir population in Morro do
Diabo was the estimate of Minimum Viable Population (MVP). While population size is the
major determinant of persistence in populations of a variety of animal species (Brown 1971;
Jones & Diamond 1976; Toft & Schoener 1983; Diamond et al. 1987; Newmark 1987; Pimm et
al. 1988; Richman et al. 1988; Soulé et al. 1988; Berger 1990; Kindvall & Ahlén 1992;
Schoener & Spiller 1992; Foufopoulos & Ives 1999), controversy remains as to how large
these populations need to be to ensure long-term persistence (Reed et al. 2003).
The analysis of tapir MVP for Morro do Diabo considered two very strict parameters including
zero probability of extinction and 95% of genetic diversity remaining after 100 years. In
particular, maintenance of genetic diversity should be seriously taken into consideration given
that small populations may persist in the model, but suffer such loss of genetic diversity
resulting in deleterious genes impacting the population over the long-term. According to the
VORTEX model, ~200 individual tapirs would be required to maintain a viable tapir population
in Morro do Diabo for the next 100 years. Thus, this modelling provided evidence that the
estimated tapir population of 126 tapirs in Morro do Diabo is not large enough to be viable
over the long-term. While it is likely to persist over the next 100 years, it is not large enough
to maintain 95% of genetic diversity. Thus, conservation measures must be taken in order to
promote maintenance of genetic diversity in Morro do Diabo.
6.4.4 Modelling of Scenarios: Threats, Metapopulation and Conservation
Strategies
6.4.4.1 Impact of Threats: Fire
Fire was modelled as a catastrophe. The VORTEX modelling showed that as the frequency of
fire events increased, the stochastic growth rate of the tapir population in Morro do Diabo
decreased. Fortunately, the frequency of fires in Morro do Diabo is much lower nowadays
since several effective measures have been taken to prevent forest fires in Morro do Diabo.
Nevertheless, the modelling did illustrate that future fire events could potentially decrease the
resilience of the tapir population in Morro do Diabo to other threats, ultimately compromising
their long-term persistence. More importantly, the VORTEX model demonstrated that the
smaller the tapir population, the higher the impact of fires. This provided evidence that in the
smaller forest fragments of the Pontal do Paranapanema Region, where the initial population
size of resident tapirs is considerably lower, the impact of fire could be potentially
catastrophic.

224
In order to perfect the modelling of the impact of fires on tapirs, it would be necessary to
estimate the number of tapirs killed, as well as the ability of tapirs to escape and walk away
from burning zones. Silveira et al. (1999) evaluated the impact of two wildfires on the large
mammal fauna in the Cerrado of Emas National Park, central Brazil. One of these fires, in
1994, was particularly large and burned 100% of Emas grasslands, and killed 13 giant
anteaters, 2 giant armadillos, and 1 juvenile tapir. The authors noted that tapirs are most
probably less vulnerable to fire because they can detect it and run from the flames more
rapidly. Koproski (2005) studied the impact of fire on the community of mammals in the
forests and floodplains of the Ilha Grande National Park in Mato Grosso do Sul State, Brazil,
and from a helicopter observed a tapir walking away from a large forest fire.
6.4.4.2 Impact of Threats: Road-Kill
Among the most widespread forms of modification of natural landscapes during the past
century has been the construction and maintenance of roads (Diamondback 1990; Bennett
1991; Noss & Cooperrider 1994). As conservation biologists seek to understand the forces that
influence the viability of animal populations, it is critical that we understand the scope of the
ecological effects of roads (Trombulak & Frissell 2000). Roads affect ecosystems in many
different ways, one of these being the increased mortality of animals from collisions with
vehicles. Road-kill can have a major effect on animal populations (Spellerberg 1998;
Trombulak & Frissell 2000; Kerley et al. 2002).
From 1996 to 2006, an average of six tapirs were hit by cars and killed every year on the
highway that crosses Morro do Diabo. To make matters worse, it is very probable that even
more tapirs were killed on the road, given that some tapirs may have been removed for meat
consumption. The VORTEX model showed that losing six adult tapirs to road-kill every year
has a major impact on the resident tapir population of Morro do Diabo. This level of road-kill
would lead the estimated tapir population of 126 tapirs to extinction in ~38 years. As
demonstrated in the sensitivity analysis, adult mortality is a very sensitive parameter for tapirs
and therefore road-kill greatly reduces the stochastic growth rate.
Fortunately, since 2007, the Forestry Institute of São Paulo State has taken several effective
measures to reduce wildlife road-kill in the highway. Speed radars and educational sign posts
were placed along the highway and tapir road-kill was drastically reduced. Over the last three
years (2007-2009), only one tapir was killed on the highway. Nevertheless, road-kill is still
considered a serious threat to tapirs in Morro do Diabo. In fact, road-kill is one of the major
threats to lowland tapirs in other parts of the Atlantic Forest, as well as in the Cerrado and
Pantanal biomes. In April 2009, I observed and photographed seven dead tapirs, all adults,
killed in a section of less than 10 km of a highway that connects the western part of São Paulo

225
State to the Pantanal, through the Cerrado. The VORTEX modelling demonstrated very clearly
the kind of impact mortality like this can impose on a population of tapirs.
6.4.4.3 Impact of Threats: Infectious Disease (Leptospirosis)
Disease is frequently mentioned as a serious threat to wildlife species (Fiorello et al. 2006).
However disease risk has proven to be very complex and difficult to assess and quantify, there
is growing recognition that disease issues can profoundly affect the viability of populations
and consequently the success or failure of conservation programs. Most diseases impacting
animal conservation are infectious in origin, although genetic and toxic diseases also influence
population viability (Munson 2003). In herbivores in general, and in ungulates in particular,
there are several known diseases affecting cattle and other domestic animals, such as horses
and swine, which are problematic from the point of view of wildlife health (e.g. foot-and-
mouth disease). Regarding tapir species, there is only one published study about the health of
free-ranging Baird's tapirs in Corcovado National Park, Costa Rica (Hernández-Divers et al.
2005). Overall, there is very little information available to understand the potential individual
and population effects of both epidemic and endemic diseases on tapirs.
In Morro do Diabo, tapirs were positive for four types of infectious disease. Leptospirosis
presented the highest prevalence of the study (25% of 32 sampled tapirs). Leptospirosis is an
acute, febrile and infectious disease, caused by a bacterium of the genus Leptospira. This
disease is distributed worldwide and has a complex epidemiology. It affects both wildlife and
domestic livestock. Rodents are the main hosts. Nava (2008) conducted an epidemiological
survey of the domestic livestock in the Pontal do Paranapanema Region and observed that
33% of the horses in the region were positive for Leptospirosis. The fact that tapirs and
horses are closely related and due to the high possibility of contact between the two species
in the areas alongside the edges of Morro do Diabo could explain the high prevalence of this
disease in this tapir population. However, five of the eight tapirs were positive for
Leptospirosis were captured and had their home ranges in the centre of Morro do Diabo, far
away from the borders, and where tapirs were unlikely to encounter livestock. This provided
evidence that the Leptospirosis bacteria are indeed spread throughout Morro do Diabo and the
entire tapir population might have been exposed. Furthermore, this provides evidence that
disease can be more spread in wild tapir populations than previously thought.
Judging from the known effects of the Leptospirosis bacteria on horses and other wildlife
species, this disease can potentially cause an increase in tapir mortality rates, as well as a
decrease in the percentage of females breeding in the population (P.R. Mangini, personal
communication). With this kind of impact, the estimated tapir population of 126 tapirs in
Morro do Diabo showed a decrease in growth rate. A decrease in the stochastic growth rate

226
means that the population will recover more slowly from other threats or events that decrease
its population size. The impact of disease will be more pronounced when it is coupled to other
threats. Although the disease did not increase the probability of extinction of tapirs in Morro
do Diabo, it most certainly made the tapir population less resilient to other threats such as fire
or road-kill, therefore making it harder for the population to recover from these other threats.
This could most certainly compromise the long-term persistence of the tapir population in
Morro do Diabo. These results, even being very simple, do suggest that disease can
potentially be a significant threat, and efforts should thus be made to investigate the
epidemiology of free-ranging tapir populations. An important aspect of assessing disease risk
is distinguishing whether the animals actually have a disease or simply harbour or have been
exposed to potentially infectious agents. Future tapir health studies must focus on
investigating the morbidity and mortality effects of diseases.
6.4.4.4 Tapir Metapopulation Scenario
While Morro do Diabo hosts a rather large tapir population of 126 individuals, the smaller
forest fragments in the Pontal do Paranapanema Region fail to provide enough space for more
than just a few individuals each. Three of these forest fragments are larger than 10 km² and
resulted in tapir populations from 4-6 individuals each. Four of the forest fragments are much
smaller (4-5 km²), and did not appear to hold up more than 2 tapirs each (Table 6.4).
VORTEX modelling demonstrated that in the absence of dispersal of tapirs from Morro do
Diabo, none of the tapir populations in the smaller forest fragments of the Pontal do
Paranapanema Region will be viable over the long-term. Without dispersal from Morro do
Diabo, all these small tapir populations will go extinct over the next 100 years. However, the
dispersal of individuals from Morro do Diabo to the forest fragments had a negative effect on
the resident tapir population of Morro do Diabo.
The VORTEX baseline model demonstrated that, in the absence of dispersal, the tapir
population in Morro do Diabo would present a population growth of almost 4%. However, a
1% dispersal of tapirs aged from 2-4 years decreased the growth rate of the tapir population
in Morro do Diabo to almost 0%. When decreasing the dispersal rate by half (0.5%), the
population maintained a population growth rate of 2%. Even when considering a viable tapir
population of over 200 individuals (Table 6.5), more precisely 237 tapirs (line-transect
estimate), dispersal of tapirs from Morro do Diabo still reduced the growth rate in Morro do
Diabo dramatically. In VORTEX, when the initial population size exceeds the carrying capacity
at the end of a particular time cycle, additional mortality is imposed across all age and sex
classes in order to reduce the population back to this upper limit (Miller & Lacy 2005). Thus,
due to their reduced sizes, the small forest fragments in the Pontal do Paranapanema Region
are acting as sink habitats for tapirs dispersing from Morro do Diabo and decreasing the

227
stochastic growth rate of the tapir population in Morro do Diabo. Dispersal rate, rather than
survival during dispersal or initial population size, was the parameter that had the most impact
on the tapir metapopulation in the Pontal do Paranapanema Region.
If the forest fragments were larger and had a potential carrying capacity of 100 tapirs each,
the stochastic growth rate of Morro do Diabo would be less impacted as fewer animals would
die as a result of lack of habitat carrying capacity. Even so, the fragments still acted as a sink
for Morro do Diabo. In general, the VORTEX metapopulation modelling showed that dispersal
of tapirs from Morro do Diabo to the forest fragments in the surroundings can be detrimental
to the overall metapopulation if the carrying capacity in the fragments is low. Overall, the
fragments act as a sink as their initial population sizes are very low. Higher initial populations
in the fragments and higher carrying capacity of the fragments would benefit Morro do Diabo
and tapir conservation in the Pontal do Paranapanema Region since tapirs from the fragments
would act as both source and sink.
6.4.4.5 Corridors: A Potential Conservation Strategy for Tapirs?
Conservation biologists generally agree that landscape connectivity enhances population
viability for many species (Gilpin & Soulé 1986; Noss 1987; Primack 1993; Noss & Cooperrider
1994; Hunter 1996; Meffe & Carroll 1997). Because habitat fragmentation often breaks
natural connections, many conservationists have advocated the establishment of wildlife
corridors in order to promote landscape connectivity. Several authors have argued that
corridors can promote the spread of diseases, catastrophic disturbances such as wildfires,
introduction of exotic species into the areas connected by corridors, or the luring of animals
into areas where they might experience high mortality (Simberloff & Cox 1987; Hobbs 1992;
Simberloff et al. 1992; Hess 1994). In addition, corridors sceptics have pointed out that the
scientific evidence in support of corridors as a conservation tool is very weak, and have
objected to the financial costs involved (Simberloff & Cox 1987; Simberloff et al. 1992).
Nevertheless, corridors are seen as the main landscape element that enhances biological
fluxes (Rosemberg et al. 1997; Beier & Noss 1998; Haddad & Baum 1999; Tewksbury et al.
2002; Orrock et al. 2003; Pardini et al. 2005; Uezu et al. 2005; Damschen et al. 2006). In
spite of that, the main question surrounding the use of corridors as a conservation strategy
still remains: Do corridors enhance or diminish the population viability of target species in the
habitat patches connected by them? Any attempts to answer this question must use a species-
specific approach.
The VORTEX modelling of the establishment of corridors connecting Morro do Diabo to the
surrounding forest fragments in the Pontal do Paranapanema Region reflected an increase in
landscape connectivity for tapirs. This increase in landscape connectivity resulted in an

228
increase in stochastic growth rate, which made the tapir populations more resilient to
anthropogenic threats, infectious diseases and catastrophes such as fires. Furthermore, it
resulted in an increase in percentage of genetic diversity maintained over the long-term,
which particularly benefited the smaller tapir populations. Nevertheless, this model implied
that rates of tapir mortality were not increased when using corridors. If mortality does occur
(e.g. dispersing tapirs have to cross a road, or become an easier target for hunters), then the
impact of corridors can be very different, and can in fact cause the extinction of the
metapopulation. If tapirs using the corridors do not experience increased mortality rates,
corridors can be important tools for maintaining long-term genetically viable populations of
lowland tapirs in smaller forest fragments as well as in Morro do Diabo.

Chapter 7
Conclusions
&
Conservation Recommendations
Photo by Gilia Angell

230
7.1 Viability of Lowland Tapir Populations in the Atlantic
Forest of the Interior of the Pontal do Paranapanema Region
In this thesis, I used two different approaches to assess the long-term persistence and
viability of lowland tapir populations in the Atlantic Forest fragments of the Pontal do
Paranapanema Region. The first approach was based on the empirical data collected during
this study. This empirical approach focused on aspects of tapir spatial ecology and intra-
specific interactions, spatial and temporal interactions between tapirs and the landscape, as
well as estimates of tapir abundance, which are all determinant factors for persistence and
viability. The second approach consisted of modelling tapir population viability through the use
of a computer simulation of Population Viability Analysis. This modelling approach was based
on biological characteristics of the species including reproductive and mortality rates.
Lowland tapirs in Morro do Diabo had very large home ranges. Tapir home ranges had
remarkably complex internal structures, including multiple core areas of use, which comprised
only a very small proportion of the entire home range. These large, complex home ranges
were mostly explained by the habitat heterogeneity of the semi-deciduous Atlantic Forests of
Morro do Diabo. In addition, the lowland tapir home ranges in Morro do Diabo were
considerably larger when compared with previous estimates of home range for the species in
large, non-fragmented areas of contiguous habitat (Noss et al. 2003; Tobler 2008). This
provides evidence that the current tapir home ranges in Morro do Diabo may have been
altered by the extensive habitat loss and fragmentation of the Atlantic Forest of the Interior.
Regarding intra-specific interactions, tapirs in Morro do Diabo exhibited extensive home range
overlap between neighbouring individuals, including considerably high percentages of overlap
between intra- and inter-sexual pairs, as well as between pairs of same and different age
classes. Several examples of extensive overlap of core areas of use were also observed. There
was no indication whatsoever that spatial territoriality was present in the resident tapir
population in Morro do Diabo. While tapirs in Morro do Diabo had very well defined home
ranges and lived within their boundaries, no evidence was found that they defended their
areas against conspecifics. The patterns of intra-specific interactions observed in Morro do
Diabo, particularly home range overlap, were very similar to what has been previously found
for the species in non-fragmented habitats.
Concerning habitat requirements, tapirs in Morro do Diabo incorporated varying portions of all
available habitat types within their home ranges and core areas of use. In spite of that, tapirs
showed strong levels of habitat selection and habitat avoidance. Overall, tapirs strongly
selected riparian habitats, and avoided areas of agricultural and pastoral land as well as
secondary forest habitats. Tapirs in Morro do Diabo established their core areas of use in
231
riparian forests and performed most of their main activities, especially foraging and resting, in
these habitats. This provides evidence that in order to persist over the long-term, besides
large home ranges, tapirs also require certain habitat types that contain the resources they
need or prefer in order to survive.
Morro do Diabo hosts a rather large and apparently stable, healthy tapir population of ~130
individuals. Results from the Population Viability Analysis projected that a tapir population this
size has zero probability of extinction and is likely to persist over the next 100 years even
when considering the occurrence of sporadic fire events and a low rate of road-kill. However,
this population is not large enough to maintain 95% of genetic diversity over the next 100
years and, therefore, it is not considered to be viable over the long-term. According to the
VORTEX model, a Minimum Viable Population of 200 individual tapirs would be necessary to
ensure the long-term viability of the tapir population in Morro do Diabo. Thus, there is an
urgent need to design and implement conservation strategies for tapirs in Morro do Diabo
aiming at promoting an increase in carrying capacity and the maintenance of 95% of genetic
diversity. Tapirs have low population growth rates. The modelling exercises that examined the
impact of road-kill, infectious disease, and fire on the tapir population of Morro do Diabo, have
clearly shown how susceptible this population can be to these threats. These threats would
have even more drastic effects for the much smaller tapir populations in the forest fragments.
While Morro do Diabo is the largest Atlantic Forest remnant in the Pontal do Paranapanema
Region, the smaller forest fragments are too small to provide enough space for more than just
a few individuals each. The largest of the seven forest fragments where the presence of tapirs
had been previously confirmed (Santa Maria/Cachoeirinha with 18 km²), is not large enough
to host more than six tapirs according to spatial requirements results from this study. The
estimates of tapir population sizes in these small areas resulted in a rather small total number
of 22 individual tapirs still surviving in these seven fragments. Altogether, the Atlantic Forests
of the Pontal do Paranapanema Region should comprise ~150 tapirs in eight different patches
of forest. Unfortunately, these demographic estimates could be potentially overestimated if we
considered that tapirs in the smaller forest fragments may not occur at the same density as
observed in Morro do Diabo.
This study has gathered strong evidences of tapir movements throughout the fragmented
landscape of the Pontal do Paranapanema Region. Tapirs moved fairly easily through areas of
non-natural habitat, including fields of agricultural crops and pasture lands. This indicated that
the landscape matrix in the Pontal do Paranapanema Region provides a certain level of
functional connectivity for these animals. While these movements were observed in relatively
short-scales and at low rates, they evidenced a tapir metapopulation scenario. The VORTEX
model showed that the maintenance of this metapopulation dynamics might be a determinant

232
factor for the persistence of tapir populations in the Pontal do Paranapanema Region,
particularly in the smaller fragments. The tapir populations in the forest fragments are
excessively small to persist.
The functioning of the tapir metapopulation in the Pontal do Paranapanema Region is
completely dependent on three main conservation factors. The first and most important is that
Morro do Diabo must remain intact and effectively protected. The small tapir populations in
the forest fragments require recourse to the larger tapir population in Morro do Diabo in order
to be demographically and genetically viable over the long-term. Second, the functional
connectivity of the landscape matrix in the Pontal do Paranapanema Region must be
maintained and, whenever possible, enhanced. Tapirs must be able to move and disperse
between different patches of forest. The VORTEX model clearly illustrated this, but also
revealed the complexity involved in this measure. Potential mortality rates during dispersal
and levels of threats in the unprotected forest fragments being important considerations. The
third factor relies on the fact that any threats affecting tapirs in the smaller forest fragments,
particularly hunting, must be neutralised. As evidenced by the VORTEX metapopulation model,
the tapir population in Morro do Diabo is not large enough to maintain a disrupted “source-
sink” structure. It could destabilise the metapopulation and seriously compromise its
persistence and viability over the long-term.
7.2 Conservation Recommendations: A First Step in Building a
Regional Action Plan for the Conservation of Lowland Tapirs
in the Pontal do Paranapanema Region
The results from both the empirical and modelling assessments of the viability of tapir
populations in the Atlantic Forest fragments of the Pontal do Paranapanema Region will
provide the scientific basis for the design of management and conservation strategies that
should be implemented in order to reduce the risk of tapir extinction, and therefore promote
their long-term persistence and viability. This is a first step in building a “Regional Action Plan
for the Research and Conservation of Lowland Tapirs in the Atlantic Forests of the Pontal do
Paranapanema Region.” The development of such a plan was, since the beginning, one of the
major expected outcomes of this long-term tapir study in Morro do Diabo. Conservation
recommendations made here will be used as the foundation for the development of the
Regional Action Plan, which will be implemented over the coming years.
Long-term research programmes generate unparalleled amounts of data and information, thus
providing the necessary scientific background for the development of comprehensive
conservation action plans. Effective conservation planning, particularly when focused on

233
species, can only be done on the basis of a solid scientific knowledge. Therefore, this
approach should be potentially very useful for other animal species in other fragmented
landscapes worldwide.
7.2.1 Action Planning for Species Conservation
In an effort to save species and overall biodiversity, a number of approaches to conservation
have been suggested. Most approaches focused on protected areas, ecosystems, biomes, or
other area-based classifications such as “Hotspots” and “Ecoregions” among others. Although
critical to conservation, area-based approaches are insufficient on their own. Many wildlife
species, and species groups, require species-focused conservation action plans (IUCN 2008b).
Several conservation organisations worldwide have created their own methodologies for the
development of species action plans. A few examples include the Population and Habitat
Viability Assessment (PHVA), an action planning process developed by the IUCN/SSC
Conservation Breeding Specialist Group (CBSG) (Westley & Miller 2003); Range-Wide Priority-
Setting and the Landscape Species Approach (LSA), both methodologies designed by the
Wildlife Conservation Society (WCS) (Sanderson et al. 2002); Conservation Action Planning
(CAP) developed by The Nature Conservancy (TNC) (TNC 2007); Habitat Conservation Plan
(HCP) developed under the US Endangered Species Act; as well as a number of other species
conservation action planning models developed by governmental agencies in range countries.
The Species Survival Commission (SSC) of the International Union for Conservation of Nature
(IUCN) has been developing Species Action Plans since 1986. In 2006, the Steering
Committee of the SSC authorised a Species Conservation Planning Task Force to review all
available methods of species-focused conservation planning and prepare a new set of
guidelines on strategic planning for species conservation (IUCN 2008b). A handbook has been
developed and is now being largely used and, whenever necessary, adapted for the
development of local, national, regional and global species action plans.
Action plans are designed to promote species conservation strategies backed by sound
scientific information, which is synthesised and translated into prioritised conservation
recommendations suggesting realistic solutions attainable by specific actions. These
documents are designed for any person or decision-making body that can promote or catalyse
conservation action financially, technically, or logistically, influencing key players in the
conservation sphere at local, national, regional, and global levels. Action plans provide a
common framework and focus for a range of players from decision-makers at the governmental
level, to those who will implement the conservation recommendations on the ground. Action
plans provide all the information needed to explain why species conservation action needs to
be undertaken, including the conservation status of the species, major problems associated

234
with its viability and long-term survival, and what specific actions should be undertaken. An
action plan is a "snapshot in time", serving as a baseline set of data and information against
which to measure change and monitor progress, indicating where changes of emphasis or
direction may be needed to conserve the species. Additionally, action plans identify gaps in
species research and policy and give directions for future endeavours through prioritised
conservation activities.
7.2.2 Recommendations for the Conservation of Lowland Tapirs in the
Atlantic Forests of the Pontal do Paranapanema Region
7.2.2.1 Future Research Priorities and Research Gaps
• Tapir Population Monitoring: Demography, Epidemiology, and Genetics
It is fundamental that the tapir population in Morro do Diabo continues to be closely
monitored in the long-term. Now that a very detailed baseline of information is
available, it is very important to continuously monitor parameters of population
demography, epidemiology and genetics. Population demography should be assessed
annually in order to detect any future population fluctuations. In order to do so, it
would be advisable to employ a non-invasive, less expensive methodology than radio-
telemetry. Regarding epidemiology and genetic monitoring, it would be highly
recommended to carry out annual tapir capture rounds aiming at collecting biological
samples from tapirs in different areas of Morro do Diabo, including the borders as well
as the centre of Morro do Diabo. Future tapir health studies should focus on the study
of prevalence of infectious diseases in tapir populations. Furthermore, the morbidity
and mortality effects of diseases should be investigated. Population genetics can also
be monitored through DNA extracted from tapir faecal samples that can be easily
found and collected in the forest. Over the past few years since the tapir telemetry
study in Morro do Diabo was concluded, specific genetic markers for lowland tapirs
have been developed, tested and made available. Biological samples from all the 35
tapirs captured in Morro do Diabo have been properly preserved for further analyses.
In the near future, it will be possible to analyse the relatedness of these 35 individuals
and determine the social organisation of tapirs in Morro do Diabo in much more detail.
This long-term tapir population monitoring programme should be extended to some of
the smaller forest fragments in the Pontal do Paranapanema Region. It would be
extremely helpful to obtain estimates of tapir population density in at least some of
these areas.

235
• Research on Reproductive and Mortality Parameters for Lowland Tapirs
The VORTEX sensitivity analysis carried out in Chapter 6 demonstrated that the
parameters of sub-adult mortality and adult mortality have the strongest influence on
the dynamics of lowland tapir populations. The age of first reproduction for female
tapirs appeared to be a sensitive parameter as well. There is virtually no data available
on mortality rates, and very little data on reproductive parameters for tapirs in the
wild. Therefore, it would be extremely important to design and implement a long-term
study to obtain more precise estimates for these parameters that appear to be critical
determinants of population persistence and viability. This would allow for an increase
in the robustness of the lowland tapir VORTEX model, which would ultimately produce
more confident results in the future. This would benefit several other researchers
working on lowland tapirs in different parts of the species geographic distribution.
7.2.2.2 Habitat Protection
• Continuous and Effective Protection of Existing Protected Areas
The protected areas in the Pontal do Paranapanema Region, including Morro do Diabo
State Park, administered by the Forestry Institute of São Paulo State, and Black-Lion-
Tamarin Ecological Station, administered by the Brazilian Federal Agency for the
Conservation of Nature and Natural Resources, must remain intact and effectively
protected. The administration of Morro do Diabo follows a Management Plan
developed and published in 2006. The Black-Lion-Tamarin Ecological Station was
created more recently and does not yet have a Management Plan. At any rate, the
governmental agencies responsible for the protection of these areas must count on
the necessary financial resources to cover the annual operation costs of these
protected areas. Considerable amounts of funding are required for the maintenance of
infra-structure and effective protection of these protected areas. This includes salaries
and benefits for park personnel including a sufficient number of park rangers,
maintenance of internal roads and paths, funding for the proper management of
buffer zones which includes measures of fire prevention, and prevention of road-kill
among many other essential activities.
• Creation of Private Protected Reserves: Reservas Particulares do Patrimônio
Natural (RPPN)
The Brazilian Atlantic Forest is one of the South American biomes with the highest
number of strictly protected areas (parks, reserves, ecological stations, and private
reserves) - more than 600 new areas were created during the last 40 years (Galindo-
Leal & Câmara 2003). However, the system is far from adequate mostly because these
protected areas cover less than 2% of the entire biome, the strictly protected areas

236
(IUCN categories I and II) protect only 24% of the remnants and, most importantly,
most of the remnants are too small (about 75% of protected areas are smaller than
100 km²) to guarantee long-term species persistence (Tabarelli et al. 2005). Much of
what is left to preserve in the Atlantic Forest is on private land (Rambaldi & Oliveira
2003), and the establishment of a large and well-designated network of private
reserves is now recognised as indispensable for the conservation of this biome. The
Reserva Particular do Patrimônio Natural (RPPN) is an official protected area category
that private landowners can create voluntarily and in perpetuity. There are now 443
RPPNs in the Atlantic Forest domain, totalling almost 1,000 km² (Vieira & Mesquita
2004). Several of the small forest fragments in the Pontal do Paranapanema Region
would be potential candidates to be converted into RPPNs, which would add to the
local network of protected areas, which would most certainly benefit the long-term
persistence and viability of populations of tapirs and many other species. Results from
the tapir study in Morro do Diabo should be used to identify priority areas to be legally
protected. For example, the strong evidence that tapirs select certain habitat types,
particularly riparian environments, must be taken into consideration when creating
new protected areas. Tapirs require more than just large home ranges for their
survival; they require certain habitat types that contain the resources they need. Thus,
new protected areas should incorporate these required habitat types.
• Protection and Restoration of Riparian Habitats
In Brazil, the importance of riparian vegetation has been widely recognised, which has
led to very strict laws. The Brazilian Forestry Code, a group of laws that regulates the
occupation and use of the nation’s forests, determined the need to maintain buffer
zones of natural vegetation along and around water bodies (Brazilian Environmental
Law Nº 4.771/1965). These areas around and along water courses are considered to
be “areas of permanent protection” (Áreas de Preservação Permanente - APP). The
widths of riparian buffers are calculated based upon width and size of the water
course. The fact that lowland tapirs in Morro do Diabo strongly selected riparian
habitats calls for urgent measures to promote the protection and, whenever
necessary, the restoration of these habitats in the Pontal do Paranapanema Region,
both inside and outside of protected areas. The law that regulates APPs must be
widely and continuously promoted and enforced among private landowners as well as
among the state and federal agencies that coordinate the establishment of Agrarian
Reform settlements in the region.

237
7.2.2.3 Habitat Restoration and Re-Establishment of Landscape Connectivity
• Establishment of Forested Buffer-Zones around Forests Fragments
The establishment of forested buffers around Morro do Diabo and other Atlantic Forest
fragments in the Pontal do Paranapanema Region should provide an
insulative/protective “belt” around fragments, which would most certainly improve
habitat quality for tapirs. First, it would increase habitat availability and therefore the
habitat carrying capacity. Second, and most importantly, it would mitigate edge effects
caused by the process of fragmentation itself as well as by activities of local people.
Fire, cattle grazing and spreading of aggressive grasses cause serious damage and
gradually erodes the edges of the forests, affecting forest structure. Forested buffer-
zones would protect these forest edges from these effects as well as from the wind
and the sun, therefore improving the microclimatic conditions of edges. For the
successful implementation of forested buffer zones it would be critical to apply the
concept of benefit zones. This includes the use of multipurpose trees and shrubs that
can be used as valuable resources to families living in Agrarian Reform settlements
surrounding the forests of the Pontal do Paranapanema Region. Agro-forestry benefit
zones would be another adequate option.
• Establishment of Wildlife Corridors and Stepping-Stones
The establishment of wildlife corridors and stepping-stones connecting Morro do Diabo
to the surrounding forest fragments in the Pontal do Paranapanema Region would
promote both an increase in habitat availability as well as in landscape connectivity.
The increase in habitat availability would increase the carrying capacity for tapirs. The
increase in landscape connectivity was modelled in VORTEX and resulted in an
increase of the stochastic growth rate of the populations, which should ultimately
make these populations more resilient to threats and catastrophes. Furthermore, the
model also showed that the increase in landscape connectivity leads to an increase in
percentage of genetic diversity maintained over the long-term. Overall, the increase in
landscape connectivity appeared to be critical for the long-term persistence and
viability of the tapir populations in the region. During this study, 12 possible tapir
dispersal routes between Morro do Diabo and surrounding forest fragments, as well as
between the fragments amongst themselves, were identified. These tapir pathways
should be considered as potential locations for the establishment of corridors and
stepping-stones. Once more, for the successful implementation of corridors and
stepping-stones, it would be important to apply the concept of benefit zones using
multipurpose trees and shrubs and agro-forestry models. Nevertheless, the VORTEX
corridor model implied that if tapir mortality rates increased during dispersal then
corridors could have a negative impact on the overall metapopulation. Therefore,

238
measures must be taken to ensure that tapirs will not experience increased mortality
when using corridors or stepping-stones. Lastly, it would be advisable to design and
establish experiments to monitor the use of corridors by tapirs so that more precise
estimates of dispersal rates can be obtained. This would allow for an increase in the
robustness of the VORTEX metapopulation and corridor models, which would
ultimately produce more confident results in the future.
7.2.2.4 Neutralisation of Threats
The Forestry Institute of São Paulo State and the Brazilian Federal Agency for the
Conservation of Nature and Natural Resources must continue to implement effective
measures to prevent the occurrence of forest fires in Morro do Diabo and Black-Lion-
Tamarin Ecological Station. These measures include the complete clearing of the
vegetation, mostly grass, along the edges of Morro do Diabo before and during the dry
season, and increased patrolling during the sugar cane burning season. Likewise, the
Forestry Institute must continue to employ existing measures to decrease the impact
of road-kill on the highway that crosses Morro do Diabo (SP-613 - Rodovia Estadual
Arlindo Bétio). The speed radars and educational sign posts that were placed on the
highway in 2007 have dramatically decreased tapir road-kill and must continue to be
used and, whenever possible, improved. Another important strategy would be to
enlarge the diameter of six tunnels that already exist under the highway. These
tunnels were built during the construction of the highway but are too small to be used
by tapirs. Brochures providing information about Morro do Diabo and depicting
pictures of road-kill and damaged vehicles should be distributed to all drivers using the
road. Posters including the same information and pictures should be placed in local
businesses, schools and community centres in all municipalities near Morro do Diabo.
Lastly, attention should be given at preventing tapir hunting in the smaller forest
fragments of the Pontal do Paranapanema Region. Hunting was most probably
responsible for the extirpation of tapirs from some of the forest fragments in the
region (Cullen et al. 2001a). The Brazilian Environmental Police (Polícia Ambiental)
should be provided with the proper vehicles, equipment and resources to effectively
patrol these areas and enforce the law that forbids hunting of wildlife in the Atlantic
Forest biome. Governmental agencies in charge of establishing and managing Agrarian
Reform settlements should be involved and contribute to the process. Current
environmental education initiatives carried out by IPÊ - Instituto de Pesquisas
Ecológicas and other conservation organisations working in the Pontal do
Paranapanema Region must address the issues of fire, road-kill and hunting in their
educational activities and materials.

239
7.2.2.5 Tapir Management: Translocations and Re-Introduction
Translocation and re-introduction could potentially become useful tools for the
management and restoration of tapir populations in severely fragmented landscapes
such as the Atlantic Forest. The four species of tapirs are good candidates for
translocation and re-introduction programmes. Previous studies have shown that
ungulate translocations have high success rates (Shepherdson 1994). Studies have
further revealed that tapirs are adaptable to changes in diet and environmental
conditions (Brooks et al. 1997), and hence have the potential to successfully overcome
some of the greatest challenges presented to relocated animals. Nevertheless, it is
fundamental that we learn how to use these techniques properly. Thus, it would be
useful to design and establish tapir translocation and re-introduction experiments.
These experimental tapir translocations and re-introductions should follow and test the
appropriateness of the Guidelines for Tapir Re-Introductions and Translocations
(Medici et al. 2008), recently published by the IUCN/SSC Tapir Specialist Group (TSG).
Initially, candidate animals should be tapirs confiscated from illegal owners or traders,
or displaced by habitat loss (e.g. filling of dams, deforestation, sugar cane burning
fields, forest fires). Local zoos, breeding centres and wildlife rehabilitation centres
could be potential sources of animals. It would be advisable to start with small-scale
translocations and re-introductions in release sites where tapirs are not present. Other
factors that should be considered when selecting release sites include: area carrying
capacity (e.g. presence of large patches of fruiting plant species, large water bodies
and riparian habitats), threats (it is critically important that the causes of local tapir
extinction are no longer in place), conservation category of release site (protected
area, private reserve), presence/absence of predators (large cats), genetic and health
assessments, possible ecological effects of tapirs in the area, logistic concerns,
participation of local communities among others. Availability of personnel and funding
are critical aspects that must be considered when establishing such experiments.
These experiments should be used to gather baseline information for future large-
scale, long-term translocation and re-introduction programmes aiming at restoring
tapir populations.
7.3 Determinants for Long-Term Persistence of Animal
Populations across Fragmented Landscapes
Worldwide, tropical forests are increasingly threatened by escalating human population and
the resulting conversion for agriculture, cattle ranching and urban development. Habitat
destruction and fragmentation are considered to be the primary causes of the present species
extinction crisis (Wilcox & Murphy 1985; Gibb & Hochul 2002; Schmiegelow & Monkkonen

240
2002; Vié et al. 2009). The underlying question proposed by this thesis was: What are the
ecological factors that determine the survival and long-term persistence of animal populations
in severely fragmented landscapes? Lowland tapirs and the fragmented Atlantic Forests of the
Interior of the Pontal do Paranapanema Region, São Paulo State, Brazil, were used as a model
to illustrate and answer this question.
The long-term persistence and viability of animal populations across severely fragmented
landscapes is strongly determined by life-history parameters (e.g. body size, reproductive
cycles, and generation length among others). These will determine the species ability to
recover after severe decreases. Other determinant factors are species spatial requirements
and population sizes. Aspects of patch size and availability of required habitat types, as well as
landscape composition, connectivity and the species capability to disperse, are equally
important. Lastly, the level of protection of forest patches and the impact of existing threats to
the target species are also determinant factors.
Animal populations across fragmented landscapes, particularly wide-ranging species with large
spatial requirements such as tapirs, are usually found in small sizes. The abundance and
predictability of food resources both in time and space are particularly limited in fragmented
landscapes. Survival and reproduction are food-limited. In fragmented areas, animals must be
capable of adapting and acquiring a certain level of behavioural plasticity, most particularly
with regards to spatial and habitat requirements. Animals in fragmented patches of forest
likely need larger home ranges in order to find sufficient food and other vital resources to
survive and persist. The smaller and more degraded the forest patch, the more space animals
will need to fulfil their resource requirements. Overall, fragmented habitats usually fail to
provide these resources, which in turn leads to a general reduction in the number of
individuals that can be hosted in a given area (Lovejoy et al. 1984; Quinn & Hastings 1987;
Bierregaard et al. 1992; Burkey 1993; Kattan & Alvarez-Lopez 1996).
Population size is the major determinant of species capacity for long-term persistence and
viability (Diamond et al. 1987; Newmark 1987; Pimm et al. 1988; Richman et al. 1988; Soulé
et al. 1988; Berger 1990; Schoener & Spiller 1992; Foufopoulos & Ives 1999). Small, isolated
populations are more sensitive to stochastic events, such as fires or epidemic outbreaks (Lacy
1993; Lacy 2000; Aurambout et al. 2005) as well as to genetic drift (Templeton et al. 1990).
All these factors can very rapidly drive an animal population to extinction. Similarly, losses of
habitat quality in forest fragments are important causes of species extinctions (MacArthur &
Wilson 1967; Gilpin & Soulé 1986; Wilcove et al. 1986; Terborgh 1992). Hence, in addition to
area restrictions and small population sizes, factors related to habitat quality will also affect
the persistence of animal populations in forest fragments.

241
As demonstrated by the tapirs in this study, animals usually show selection or avoidance for
different types of habitat found within their home ranges. By selecting a certain habitat type,
an animal attempts to maximise its survival, reproductive success, and the net rate of energy
intake (Johnson 1980; Abrams 2000; Delibes et al. 2001). Presumably, species should survive
and reproduce better (i.e. their fitness should be higher) in habitats that they select
(Rosenzweig & Abramsky 1986). The existence of patches of selected habitats is fundamental
for the long-term persistence of a healthy, functioning population.
As a consequence of the combination of all the factors described above, for most animal
species, small populations in fragmented landscapes may not be able to persist and be viable
over the long-term unless a certain level of landscape connectivity exists. Connectivity is a
vital parameter for the persistence of animal species in severely fragmented landscapes (Karr
1982; Blake & Karr 1987; Bierregaard & Stouffer 1997; Stratford & Stouffer 1999; Crooks et
al. 2000; Uezu et al. 2005). While patch size is mainly related to the probability of local
extinction (Levins 1970; Hanski & Gilpin 1997), connectivity is associated with migration rates,
and thus with the (re)colonisation probability and the rescue effect (Uezu et al. 2005).
Landscape connectivity facilitates biological fluxes by allowing animals to move and disperse in
between patches of forest. This is critical for the maintenance of metapopulation dynamics,
which in fragmented landscapes is a major determinant for the resilience of animal
populations to catastrophes and threats, as well as for the maintenance of genetic diversity.
Results from this tapir study in the Pontal do Paranapanema Region demonstrated that tapirs
move fairly easily through areas of non-natural habitat in between forest fragments and that
this is extremely important for the long-term survival of tapir populations in the region.
Functional connectivity depends not only on the landscape pattern, but also on the
interactions between this pattern and the biological characteristics of the target species, such
as their ability to move through areas of non-natural habitat (Greenberg 1989; Sieving et al.
1996).
Animal responses to habitat alteration and fragmentation are species-specific. Some taxa are
more affected by fragment size, while others by landscape connectivity. Limited dispersal
capacity of certain species may be a key factor determining their sensitivity to fragmentation
(Sekercioglu et al. 2002), as well as their ability to persist over the long-term. Regarding
connectivity, some species may be more sensitive to inter-patch distance, whereas others are
more sensitive to the presence of corridors (Uezu et al. 2005). These different perceptions are
particularly relevant since they can elucidate which landscape components play major roles for
the viability of each animal species. Large animals such as tapirs are highly mobile and likely
have a greater perceptual range (Zollner 2000), thereby being able to detect suitable habitat
and perceive landscape structure and interrelatedness (Wiens 1996). Smaller, less mobile
animal species with more restricted ranges may not be capable of doing so and may thus

242
require more intense landscape management, such as the establishment of corridors or
stepping-stones, or the employment of animal management techniques, such as
translocations, re-introductions, or managed dispersals, in order to persist and be viable over
the long-term. At any rate, even low levels of dispersal in between patches of forest may be
sufficient to maintain small populations in sink areas (Pulliam 1988), as long as potential
sources of dispersers exist (Novaro et al. 2000). The quality of the intervening non-habitat
matrix for the survival of dispersing individuals is particularly important (Fahrig 2001) given
that increased mortality during dispersal outweighs the potential positive effect of dispersal on
metapopulation dynamics (Gibbs 1998; Fahrig 2001).
Results from this tapir study have shown that non-protected forest fragments in the Pontal do
Paranapanema Region continue to suffer from habitat degradation in many different ways,
which leads to a continuous reduction in habitat quality and consequently carrying capacity for
tapirs. The effective protection of existing parks and reserves as well as the creation of new
protected areas including patches of required habitat types could have a major impact in
promoting the persistence of animal species. Furthermore, the impact of different threats
affecting different species (e.g. hunting, road-kill, fire, infectious disease, tourism,
construction of infra-structure among many others) must be addressed and, whenever
possible, neutralised. While habitat destruction and fragmentation lead to small, isolated
populations, lowland tapirs in the fragmented Atlantic Forests of the Interior of the Pontal do
Paranapanema Region showed that other threats override the impact of fragmentation.
Threats can rapidly accelerate the likelihood of extirpation of remaining small animal
populations. Disrupted source-sink structures can seriously destabilise metapopulation
dynamics and compromise the long-term persistence and viability of animal populations.
In conclusion, the long-term persistence and viability of animal populations across severely
fragmented landscapes completely depends on the maintenance and full protection of
complex landscape networks. These networks must include some large patches of habitat that
can host larger animal populations and function as sources of dispersers for smaller
populations in sink habitats. In addition, patches composing these landscape networks must
incorporate required habitat types where animals can find the resources they need in order to
survive. Lastly and most essentially, there must be an appropriate level of landscape
connectivity, either structurally or functionally, in order to allow for biological fluxes between
patches and for the maintenance of a demographically and genetically healthy
metapopulation.

243
References
Abdul-Ghani, S.K. (2009). Home range size, density estimation and behaviour of Malayan tapirs (Tapirus indicus) at Krau Wildlife Reserve. M.Sc. Dissertation. University of Science, Malaysia. 226pp.
Abrams, P.A. (2000). The impact of habitat selection on the spatial heterogeneity of resources in varying environments. Ecology 81: 2902-2913.
Ab’Saber, A.N. (1977). Os domínios morfoclimáticos na América do Sul. Geomorfologia 52: 1-22.
Aebischer, N.J., Robertson, P.A. & Kenward, R.E. (1993). Compositional analysis of habitat use from animal radio-tracking data. Ecology 74: 1313-1325.
Affonso, R.O. (1998). Tapirus terrestris (Linnaeus, 1758) (Mammalia, Perissodactyla) em uma área de Floresta Subtropical no sul do Brasil: Dieta, uso da área e densidade populacional. M.Sc. Dissertation. Universidade Federal do Rio de Janeiro (UFRJ), Rio de Janeiro, Brazil. 90pp.
Akçakaya, H.R. (2000). Viability analyses with habitat-based metapopulation models. Population Ecology 42: 45-53.
Alibhai, S. & Jewell, Z.C. (2001a). Hot under the collar: The failure of radio-collars on black rhinoceros Diceros bicornis. Oryx 35(4): 284-288.
Alibhai, S., Jewell, Z.C. & Towindo, S.S. (2001b). Effects of immobilization on fertility in female black rhino (Diceros bicornis). Journal of Zoology, London, 253: 333-345.
Alibhai, S., Jewell, Z.C. & Law, P.R. (2008). A footprint technique to identify white rhino Ceratotherium simum at individual and species levels. Endangered Species Research 4: 205-218.
Alpe, M.J., Kingery, J.L. & Mosley, J.C. (1999). Effects of summer sheep grazing on browse nutritive quality in autumn and spring. Journal of Wildlife Management 63: 346-354.
Andrade-Lima, D. (1982). Present-day forest refuges in northeastern Brazil. In: G.T. Prance (Ed). Biological Diversification in the Tropics. pp. 220-245. Plenum Press, New York, USA.
Andreassen, H.P., Ims, R.A. & Steinset, O.K. (1996). Discontinuous habitat corridors: Effects on male root vole movements. Journal of Applied Ecology 33: 555-560.
Andren, H. (1994). Effects of habitat fragmentation on birds and mammals in landscapes with different proportions of suitable habitat: A review. Oikos 71: 355-366.
Andri, M. (2006). Study of presence, activity and distribution of Malayan tapir in Sipurak Hook, Kerinci Seblat National Park, Sumatra. B.S. Thesis. University of Islam, Asyafi'iyah, Jakarta. Unpublished.
Aquino, R. & Calle, A. (2003). Evaluación del estado de conservación de los mamíferos de caza: Un modelo comparativo en comunidades de la Reserva Nacional Pacaya Samiria (Loreto, Peru). Revista Peruana de Biologia 10(2): 163-174.
Aquino, R., Bodmer, R.E. & Gil, G. (2001). Mamíferos de la cuenca del río Samiria: Ecología poblacional y sustentabilidad de la caza. Publicación Junglevagt for Amazonas, AIF-WWF/DK-WCS. Lima, Peru. 108pp.
Arsenault, R. & Owen-Smith, N. (2002). Facilitation versus competition in grazing herbivore assemblages. Oikos 97: 313-318.
Astete, S., Sollmann, R. & Silveira, L. (2008). Comparative ecology of jaguars in Brazil. CAT News Special Issue 4 - The Jaguar in Brazil. IUCN/SSC Cat Specialist Group (CSG).
Aurambout, J.P., Endress, A.G. & Deal, B.M. (2005). A spatial model to estimate habitat fragmentation and its consequences on long-term persistence of animal populations. Environmental Monitoring and Assessment 109: 199-225.
Ayala, G.M.C. (2002). Tapir ranging behavior and activity patterns in the tropical dry forest of the Gran Chaco. Tapir Conservation: The Newsletter of the IUCN/SSC Tapir Specialist Group (TSG) 11: 15.

244
Ayala, G.M.C. (2003). Monitoreo de Tapirus terrestris en el Izozog (Cerro Cortado) mediante el uso de telemetria como base para un plan de conservación. M.Sc. Dissertation. Universidad Mayor de San Andres, Santa Cruz, Bolivia. 90pp.
Bailey, R.G. (1998). Ecoregions: The ecosystem geography of oceans and continents. Springer-Verlag. New York, USA.
Baker, A.B. (1920). Breeding of the Brazilian tapir. Journal of Mammalogy 1(3): 143-144.
Banks, S.C., Hoyle, S.D., Horsup, A.B., Sunnucks, P. & Taylor, A.C. (2003). Demographic monitoring of an entire species by genetic analysis of non-invasively collected material. Animal Conservation 6: 101-107.
Barongi, R.A. (1986). Tapirs in captivity and their management at Miami Metrozoo. AAZPA Annual Proceedings 1986: 96-108. Wheeling, WV, USA.
Barongi, R.A. (1993). Husbandry and conservation of tapirs. International Zoo Yearbook 32: 7-15.
Bazely, D.R. & Jefferies, R.L. (1986). Changes in the composition standing crop of salt-marsh communities in response to removal of grazer. Journal of Ecology 74: 693-706.
Beck, H. (2005). Seed predation and dispersal by peccaries throughout the Neotropics and its consequences: A review and synthesis. In: P.M. Forget, J.E. Lambert, P.E. Hulme & S.B. Vander-Wall (Eds). Seed Fate: Predation, Dispersal and Seedling Establishment. pp. 77-115. CABI Publishing, Wallingford, CT, USA.
Begon, M., Harper, J.L. & Townsend, C.R. (1990). Ecology: Individuals, populations, and communities. Blackwell Scientific Publisher, Cambridge, UK.
Beier, P. & Noss, R.F. (1998). Do habitat corridors really provide connectivity? Conservation Biology 12: 1241-1252.
Beissinger, S.R. & Westphal, M.I. (1998). On the use of demographic models of population viability in endangered species management. Journal of Wildlife Management 62: 821-841.
Beissinger, S.R. & McCullough, D.R. (2002). Population Viability Analysis. University of Chicago Press, Chicago, Illinois, USA.
Bellemain, E., Swenson, J., Tallmon, D., Brunberg, S. & Taberlet, P. (2005). Estimating population size from hunter-collected feces: Four methods for brown bears. Conservation Biology 19: 150-161.
Belovsky, G.E., Mellison, C., Larson, C. & Van Zandt, P.A. (1999). Experimental studies of extinction dynamics. Science 286: 1175-1177.
Bender, D.J., Contreras, T.A. & Fahrig, L. (1998). Habitat loss and population decline: A meta-analysis of the patch size effect. Ecology 79: 517-533.
Bennett, A.F. (1991). Roads, roadsides and wildlife conservation: A review. In: D.A. Saunders & J. Hobbs (eds). Nature Conservation: The Role of Corridors. pp. 99-118. Surrey Beatty & Sons, Sydney, Australia.
Berger, J. (1990). Persistence of different-sized populations: An empirical assessment of rapid extinctions in bighorn sheep. Conservation Biology 4: 91-98.
Bergstedt, R.A. & Anderson, D.R. (1990). Evaluation of line-transect sampling on remotely sensed data from underwater video. Transactions of the American Fisheries Society 119: 86-91.
Bierregaard Jr, R.O. & Stouffer, P. (1997). Understory birds and dynamic habitat mosaics in Amazonian rainforests. In: W.F. Laurance & R.O. Bierregaard Jr. (Eds) Tropical Forest Remnants: Ecology, Management, and Conservation of Fragmented Communities. pp. 138-155. University of Chicago Press, Chicago, Illinois, USA.
Bierregaard Jr, R.O., Lovejoy, T.E., Kapos, V., Santos, A.A. & Hutchings, R.W. (1992). The biological dynamics of tropical rainforest fragments. BioScience 42: 859-866.
Blake, J.G. & Karr, J.R. (1987). Breeding birds of isolated woodlots: Area and habitat relationships. Ecology 68: 1724-1734.
Bodmer, R.E. & Lozano, E.P. (2001). Rural development and sustainable wildlife use in Peru. Conservation Biology 15: 1163-1170.

245
Bodmer, R.E. (1990a). Fruit patch size and frugivory in the lowland tapir (Tapirus terrestris). Journal of Zoology 222: 121-128.
Bodmer, R.E. (1990b). Responses of ungulates to seasonal inundations in the Amazon floodplain. Journal of Tropical Ecology 6: 191-201.
Bodmer, R.E. (1991a). Influence of digestive morphology on resource partitioning in Amazonian ungulates. Oecologia 85: 361-365.
Bodmer, R.E. (1991b). Strategies of seed dispersal and seed predation in Amazonian ungulates. Biotropica 23: 255-261.
Bodmer, R.E. (1995). Managing Amazonian wildlife: Biological correlates of game choice by detribalized hunters. Ecological Applications 5: 872-877.
Bodmer, R.E., Eisenberg, J.F. & Redford, K.H. (1997). Hunting and the likelihood of extinction of amazonian mammals. Conservation Biology 11: 460-466.
Bodmer R.E., Fang, T.G., Moya, L. & Gill, R. (1994). Managing wildlife to conserve Amazonian forests: Population biology and economic consideration of game hunting. Biological Conservation 67: 29-35.
Bolaños, J.E. & Naranjo, E.J. (2001). Abundancia, densidad y distribución de las poblaciones de ungulados en la cuenca del Río Lacantún, Chiapas, México. Revista Mexicana de Mastozoología 5: 45-57.
Boyce, M.S. (1992). Population viability analysis. Annual Review of Ecology and Systematics 23: 481-506.
Brashares, J.S. (2003). Behavioral, ecological, and life-history correlates of mammal extinctions in West Africa. Conservation Biology 17: 733-743.
Brathen, K.A. & Oksanen, J. (2001). Reindeer reduce biomass of preferred plant species. Journal of Vegetation Science 12: 473-480.
Bronikowski, A.M. (2000). Experimental evidence for the adaptive evolution of growth rate in the garter snake Thamnophis elegans. Evolution 54: 1760-1767.
Brook, B.W., O’Grady, J.J., Chapman, A.P., Burgman, M.A., Akçakaya, H.R. & Frankham F. (2000). Predictive accuracy of population viability analysis in conservation biology. Nature 404: 385-387.
Brook, B.W., Burgman, M.A., Akçakaya, H.R., O’Grady, J.J. & Frankham, R. (2002). Critiques of PVA ask the wrong questions: Throwing the heuristic baby out with the numerical bath water. Conservation Biology 16: 262-263.
Brooks, D.M., Bodmer, R.E. & Matola, S. (1997). Tapirs: Status Survey and Conservation Action Plan. IUCN/SSC Tapir Specialist Group (TSG). IUCN, Gland, Switzerland.
Brooks, T.M., Mittermeier, R.A., Mittermeier, C.G., Fonseca, G.A.B., Rylands, A.B., Konstant, W.R., Flick, P., Pilgrim, J., Oldfield, S., Magin, G. & Hilton-Taylor, C. (2002). Habitat loss and extinction in the hotspots of biodiversity. Conservation Biology 16: 909-923.
Brown, J.H. (1971). Mammals on mountaintops: Nonequilibrium insular biogeography. American Naturalist 105: 467-478.
Brown, K.S. & Brown, G.G. (1992). Habitat alteration and species loss in Brazilian forests. In: T.C. Whitmore & J.A. Sayer (Eds). Tropical Deforestation and Species Extinction. pp. 119-142. Chapman & Hall, London, UK.
Brown, J.L. & Orians, G.H. (1970). Spacing patterns in mobile animals. Rev. Ecol. Syst. 1: 239-62.
Buckland, S.T., Anderson, D.R., Burnham, K.P. & Laake, J.L. (1993). Distance sampling: Estimating abundance of biological populations. Chapman & Hall, London, UK.
Buckland, S.T., Anderson, D.R., Burnham, K.P., Laake, J.L., Borchers, D.L. & Thomas, L. (2001). Introduction to distance sampling: Estimating abundance of biological populations. Oxford University Press, Oxford, UK.
Buckland, S.T., Anderson, D.R., Burnham, K.P., Laake, J.L., & Borchers, D.L. (2004). Advanced distance sampling. Oxford University Press, Oxford, UK.

246
Burch, J.W. (2001). Evaluation of wolf density estimation from radio-telemetry data. Ph.D. Dissertation. University of Alaska, Fairbanks, Alaska, USA.
Burgman, M.A., Ferson, S. & Akçakaya, H.R. (1993). Risk assessment in conservation biology. Chapman & Hall, London, UK.
Burkey, T.V. (1993). Edge effects in seed and egg predation at two neotropical rainforest sites. Biological Conservation 66: 139-143.
Burnham, K.P., Anderson, D.R. & Laake, J.L. (1980). Estimation of density from line-transect sampling of biological populations. Wildlife Monographs 72: 198-201.
Burns, E.B. (1980). A history of Brazil. Columbia University Press, New York, USA.
Burt, W.H. (1943). Territoriality and home range concepts as applied to mammals. Journal of Mammalogy 24: 346-352.
Calsson-Granér, U. & Thrall, P.H. (2002). The spatial distribution of plant populations, disease dynamics and evolution of resistance. Oikos 97: 97-110
Câmara, I.G. (1991). Plano de ação para a Mata Atlântica. Fundação SOS Mata Atlântica, São Paulo, Brazil.
Câmara, I.G. (2003). Brief history of conservation in the Atlantic forest. In: C. Galindo-Leal & I.G. Câmara (Rds). The Atlantic Forest of South America: Biodiversity Status, Threats, and Outlook. pp. 31-42. Center for Applied Biodiversity Science and Island Press, Washington DC, USA.
Campbell, K. & Borner, M. (1995). Population trends and distribution of Serengeti herbivores: Implications for management. In: A.R.E. Sinclair & P. Arcese (Eds). Serengeti II: Dynamics, Management, and Conservation of an Ecosystem. pp. 117-145. University of Chicago Press, Chicago, Illinois, USA.
Camponotus Radio Location Systems AB (1994). TRACKER Software Version 1.1.
Campos, J.C.C. & Heinsdijk, D. (1970). A Floresta do Morro do Diabo. Revista Silvicultura em São Paulo 7: 43-58.
Caro, T.M. & O’Doherty, G. (1999). On the use of surrogate species in conservation biology. Conservation Biology 13: 805-814.
Caro, T.M. (2003). Umbrella species: Critique and lessons from East Africa. Animal Conservation 6: 171-181.
Cartes, J.L. (2003). Brief history of conservation in the interior Atlantic Forest. In: C. Galindo-Leal & I.G. Câmara (Eds). The Atlantic Forest of South America: Biodiversity Status, Threats, and Outlook. pp. 269-287. Center for Applied Biodiversity Science and Island Press, Washington DC, USA.
Caughley, G. (1977). Analysis of vertebrate populations. Wiley, Chichester. 234pp.
Caughley, G. (1994). Directions in conservation biology. Journal of Animal Ecology 57: 771-785.
Ceballos, G. & Ehrlich, P.R. (2002). Mammal population losses and the extinction crisis. Science 296: 904-907.
CEPF - Critical Ecosystem Partnership Fund (2002). Ecosystem Profile: Atlantic Forest Biodiversity Hotspot. Conservation International.
Charnov, E.L. (1976). Optimal foraging, the marginal value theorem. Theoretical Population Biology 9: 129-136.
Chase, J.M. (2005). Towards a really unified theory for metacommunities. Functional Ecology 19: 182-186.
Chesson, P. (2000). General theory of competitive coexistence in spatially varying environments. Theoretical Population Biology 58: 211-237.
Chiarello, A.G. (1999). Effects of forest fragmentation of the Atlantic Forest on mammal communities in south-eastern Brazil. Biological Conservation 89: 71-82.
Chiarello, A.G. (2000). Density and population size of mammals in remnants of Brazilian Atlantic Forest. Conservation Biology 14: 1649-1657.
CITES (2005). CITES-listed Species Database www.cites.org/eng/resources/species.html

247
Clark, J.A., Hoekstra, J.M., Boersma, P.D. & Kareiva, P. (2002). Improving U.S. Endangered Species Act recovery plans: Key findings and recommendations of the SCB Recovery Plan Project. Conservation Biology 16: 1510-1519.
Clarke, R. (1986). The handbook of ecological monitoring: A GEMS/UNEP publication. Oxford: Clarendon Press, UK.
Clevenger, A.P. (1993). Sign survey as an important tool in carnivore conservation research and management programmes. In: Seminar on the Management of Small Populations of Threatened Mammals. Convention on the Conservation of European Wildlife and Natural Habitats (Bern Convention). pp. 36-46. Strasbourg, France.
Clutton-Brock, T.H., Major, M. & Guinness, F.E. (1985). Population regulation in male and female red deer. Journal of Animal Ecology 54: 831-846.
Coelho, I.P., Oliveira, L.F.B. & Oliveira, M.E. (2008). Does moonlight affect the use of natural licks by lowland tapir (Tapirus terrestris Linnaeus, 1758) in the Northeastern Brazilian Pantanal? Tapir Conservation: The Newsletter of the IUCN/SSC Tapir Specialist Group (TSG) 17(2): 10-14.
Coimbra-Filho, A.F. & Câmara, I.G. (1996). Os limites originais do bioma Mata Atlântica na Região Nordeste do Brasil. Fundação Brasileira para a Conservação da Natureza (FBCN), Rio de Janeiro, Brazil.
Collins, M. (1990). The last rain forests. Mitchell Beazley Publisher & IUCN, London, UK. 200pp.
Connell, J.H. (1983). On the prevalence and relative importance of interspecific competition: Evidence from field experiments. American Naturalist 122: 661-696.
Coppolillo, P., Gómez, H., Maisels, F. & Wallace, R. (2003). Selection criteria for suites of landscape species as a basis for site-based conservation. Biological Conservation 115: 419-430.
Cordeiro, J.L.P. (2004). Estrutura e heterogeneidade da paisagem de uma unidade de conservação no nordeste do Pantanal (RPPN SESC Pantanal), Mato Grosso, Brasil: Efeitos sobre a distribuição e densidade de antas (Tapirus terrestris) e de cervos-do-pantanal (Blastocerus dichotomus). Ph.D. Dissertation. Universidade Federal do Rio Grande do Sul (UFRGS), Porto Alegre, Brazil.
Coulson, T., Mace, G.M., Hudson, E. & Possingham, H. (2001). The use and abuse of population viability analysis. Trends in Ecology & Evolution 16: 219-221.
Crawshaw Jr., P.G. (1995). Relatório sobre o monitoramento de grandes felinos na área de influência da futura UHE de Porto Primavera, São Paulo e Mato Grosso do Sul. Themag/CESP - Compania Energética do Estado de São Paulo, São Paulo, Brazil.
Crawshaw Jr., P.G. (2004). Uma perspectiva sobre a depredação de animais domésticos por grandes felinos no Brasil. Natureza e Conservação 1: 7-11.
Crooks, K.R., Suarez, A.V., Bolger, D.T. & Soulé, M.E. (2000). Extinction and colonization of birds on habitat islands. Conservation Biology 15: 159-172.
Cuarón, A.D. (2000). A global perspective on habitat disturbance and tropical rainforest mammals. Conservation Biology 14(6): 1574-1579.
Cullen, L. (1997). Hunting and biodiversity in Atlantic Forest fragments, São Paulo, Brazil. M.Sc. Dissertation. University of Florida, Florida, USA.
Cullen, L. (2007). Jaguars as landscape detectives for the conservation of Atlantic Forests in Brazil. Ph.D. Dissertation. Durrell Institute of Conservation and Ecology (DICE), University of Kent, UK.
Cullen, L., Bodmer, R.E. & Valladares-Padua, C.B. (2000). Effects of hunting in habitat fragments of the Atlantic Forests, Brazil. Biological Conservation 95: 49-56.
Cullen, L., Bodmer, R.E. & Valladares-Padua, C.B. (2001a). Ecological consequences of hunting in Atlantic Forest patches, São Paulo, Brazil. Oryx 35: 137-144.
Cullen, L., Schmink, M., Valladares-Padua, C.B. & Morato, I. (2001b). Agroforestry benefit zones: A tool for the conservation and management of Atlantic Forest fragments, São Paulo, Brazil. Natural Areas Journal 21(4): 345-355.

248
Cullen, L., Alger, K. & Rambaldi, D.M. (2005). Land reform and biodiversity conservation in Brazil in the 1990's: Conflict and the articulation of mutual interests. Conservation Biology 19: 747-755.
Damschen, E.I., Haddad, N.M., Orrock, J.L., Tewksbury, J.J. & Levey, D.J. (2006). Corridors increase plant species richness at large scales. Science 313: 1284-1286.
Davies, N.B. & Houston, A.I. (1984). Territory economics. In: J.R. Krebs & N.B. Davies (Eds). Behavioural Ecology: An Evolutionary Approach. 2nd Edition. pp. 148-169. Blackwell Scientific Publisher, Cambridge, UK.
Davies, G. (1991). Seed-eating by red leaf monkeys (Presbytis rubicunda) in dipterocarp forest of northern Borneo. International Journal of Primatology 12: 119-144.
Dean, W. (1997). With broadax and firebrand: The destruction of the Brazilian Atlantic Forest. University of California Press, San Francisco, USA.
Delibes, M., Gaona, P. & Ferreras, P. (2001). Effects of an attractive sink leading into mal-adaptive habitat selection. American Naturalist 158: 277-285.
Demment, M.W. & Van-Soest, P.J. (1985). A nutritional explanation for body-size patterns of ruminant and nonruminant herbivores. American Naturalist 125: 641-672.
Dennis, B., Munholland, P.L. & Scott, J.M. (1991). Estimation of growth and extinction parameters for endangered species. Ecological Monographs 6: 115-143.
Desbiez, A.L.J. (2007). Wildlife conservation in the Pantanal: Habitat alteration, invasive species and bushmeat hunting. Ph.D. Dissertation. Durrell Institute of Conservation and Ecology (DICE), University of Kent, UK.
Desbiez, A.L.J. (2009). Lowland tapirs in the Nhecolândia Region of the Brazilian Pantanal: Population density, habitat use and threats. Tapir Conservation: The Newsletter of the IUCN/SSC Tapir Specialist Group (TSG) 25: 7-12.
Desbiez, A.L.J., Bodmer, R.E. & Tomas, W.M. (2010). Mammalian densities in a neotropical wetland subject to extreme climatic events. Biotropica: in press, published online in 2009.
Di Bitetti, M.S., Placci, G. & Dietz, L.A. (2003). A biodiversity vision for the upper Paraná Atlantic Forest eco-region: Designing a biodiversity conservation landscape and setting priorities for conservation action. World Wildlife Fund (WWF). Washington DC, USA.
Diamond, J. M. (1984). “Normal” extinctions of isolated populations. In: M.H. Nitecki (Ed). Extinctions. pp. 193-246. University of Chicago Press, Chicago, Illinois, USA.
Diamond, J.M., Bishop, K.D. & Van Balen, S. (1987). Bird survival in an isolated Javan woodland: Island or mirror? Conservation Biology 2: 132-142.
Diamondback, A. (1990). Ecological effects of roads. In: J. Davis (Ed). Killing Roads: A Citizens’ Primer on the Effects and Removal of Roads. Earth First! pp. 1-5. Biodiversity Project Special Publication. Tucson, AZ, USA.
Dillon, A.G. & Kelly, M.J. (2007). Ocelot Leopardus pardalis in Belize: The impact of trap spacing and distance moved on density estimates. Oryx 41: 469-477.
Dirzo, R. & Miranda, A. (1991). Altered patterns of herbivory and diversity in the forest understory: A case study of possible consequences of contemporary defaunation. In: W.P. Price, T.M. Lewinsohn, G.W. Fernandes & W.W. Benson (Eds). Plant-Animal Interactions: Evolutionary Ecology in Tropical and Temperate Regions. pp. 273-87. John Wiley & Sons, Chichester, New York, USA.
Ditt, E.H. (2002). Fragmentos florestais no Pontal do Paranapanema. Annablume Editora, IPÊ - Instituto de Pesquisas Ecológicas, IIEB, São Paulo, Brazil.
Dixon, K.R. & Chapman, J.A. (1980). Harmonic mean measure of animal activity areas. Ecology 61: 1040-1044.
Dobson, F.S. & Oli, M.K. (2007). Fast and slow life histories of mammals. Ecoscience 14(3): 292-297.
Downer, C.C. (1996). The montain tapir, endangered ‘‘flagship’’ species of the high Andes. Oryx 30: 45-58.

249
Downer, C.C. (2001). Observations on the diet and habitat of the mountain tapir (Tapirus pinchaque). Journal of Zoology 254: 279-291.
Downer, C.C. (2003). Ambito hogareño y utilización de hábitat del tapir andino e ingreso de ganado en el Parque Nacionál Sangay, Ecuador. Lyonia 4(1): 31-34.
Dublin, H.T., Sinclair, A.R.E. & Boutin, S. (1990). Does competition regulate ungulate populations? Further evidence from Serengeti, Tanzania. Oecologia 82: 283-288.
Dunning, J.B., Danielson, B.J. & Pulliam, H.R. (1992). Ecological processes that affect populations in complex landscapes. Oikos 65: 169-175.
Durigan, G. & Franco, G.A.D.C. (2006). Caracterização dos fatores bióticos: Vegetação. In: H.H. Faria & A.S. Pires (Eds). Parque Estadual Morro do Diabo - Plano de Manejo. pp. 111-118. Editora Viena, Santa Cruz Do Rio Pardo, São Paulo, Brazil.
Eggert, L.S., Eggert, A. & Woodruff, D.S. (2003). Estimating population size for elusive animals: The forest elephants of Kakum National Park, Ghana. Molecular Ecology 12: 1389-1402.
Eisenberg, J.F. (1980). The density and biomass of tropical mammals. In: M.E. Soulé & B. Wilcox (Eds). Conservation Biology. pp. 35-55. Sinauer Associates Inc. Sunderland, Massachusetts, USA.
Eisenberg, J.F. (1989). Mammals of the Neotropics. The Northern Neotropics Vol. 3. University of Chicago Press, Chicago, Illinois, USA.
Eisenberg, J.F. (1990). Neotropical mammal communities. In: A.H. Gentry (Ed). Four Neotropical Forests. pp. 358-368. New Haven: Yale University Press, USA.
Eisenberg, J.F. (1997). Introduction. In: D.M. Brooks, R.E. Bodmer & S. Matola (Eds). Tapirs: Status Survey and Conservation Action Plan. pp. 5-7. IUCN/SSC Tapir Specialist Group (TSG). IUCN, Gland, Switzerland.
Eiten, G. (1970). An outline of the vegetation of South America. Symp. Congr. Int. Primatol. Soc. 5th: 529-45.
Emmons, L.H. (1987). Comparative feeding ecology of felids in a Neotropical rainforest. Behavioral Ecology and Sociobiology 20: 45-64.
Emmons, L.H. (1988). A field study of ocelots (Felis pardalis). Terre Vie 43: 133-157.
Emmons, L.H. & Feer, F. (1997). Neotropical rainforest mammals: A field guide. University of Chicago Press, Chicago, Illinois, USA.
Entwistle, A.C. & Dunstone, N. (2000). Future priorities for mammalian conservation. In: A. Entwistle & N. Dunstone (Eds). Priorities for the Conservation of Mammalian Diversity. Has the Panda had its Day? pp. 369-387. Cambridge University Press, New York, USA.
Fagan, W.F., Meir, E., Prendergast, J., Folarin, A. & Karieva, P. (2001). Characterizing population vulnerability for 758 species. Ecology Letters 4: 132-138.
Fagan, W.F., Lutscher, F. & Schneider, K. (2007). Population and community consequences of spatial subsidies derived from central-place foraging. American Naturalist 170: 902-915.
Fahrig, L. (2001). How much habitat is enough? Biological Conservation 100: 65-74.
Faria, H.H. & Pires, A.S. (2006). Parque Estadual Morro do Diabo - Plano de Manejo. Governo do Estado de São Paulo, Secretaria do Meio Ambiente, Instituto Florestal. Viena, Santa Cruz Do Rio Pardo, São Paulo, Brazil. 311pp.
Fearnside, P. (1996). Brazil. In: C.S. Harcourt & J.A. Sayer (Eds). The Conservation Atlas of Tropical Forests: The Americas. pp. 229-248. Simon and Schuster, New York, USA.
Fernandes, A. & Bezerra, P. (1990). Estudo fitogeográfico do Brasil. Stylus Com., Fortaleza, Brazil. 205pp.
Ferraz, G., Nichols, J.D., Hines, J.E., Stouffer, P.C., Bierregaard Jr., R.O. & Lovejoy, T.E. (2007). A large-scale deforestation experiment: Effects of patch area and isolation on Amazon birds. Science 315: 238-241.
Fieberg, J. & Ellner, S.P. (2001). Stochastic matrix models for conservation and management: A comparative review of methods. Ecology Letters 4: 244-266.

250
Fiorello, C.V., Noss, A.J. & Deem, S.L. (2006). Demography, hunting ecology, and pathogen exposure of domestic dogs in the Isoso of Bolivia. Conservation Biology 20: 762-771.
Flagstad, O., Hedmark, E., Landa, A., Broseth, H., Persson, J., Andersen, R., Segerstom, P. & Ellegren, H. (2004). Colonization history and non-invasive monitoring of a re-established wolverine population. Conservation Biology 18(3): 676-688.
Flesher, K. (2007). Tapirs of the Atlantic Forest. Unpublished Report prepared for the Lowland Tapir Population and Habitat Viability Assessment (PHVA) Workshop. IUCN/SSC Tapir Specialist Group (TSG) & IUCN/SSC Conservation Breeding Specialist Group (CBSG). Sorocaba, São Paulo, Brazil.
Fleury, M. & Galetti, M. (2004). Effects of microhabitat on palm seed predation in two forest fragments in southeast Brazil. Acta Oecologica 26: 179-184.
Foerster, C.R. (1998). Ecología de la danta centroamericana (Tapirus bairdii) en un bosque lluvioso tropical de Costa Rica. M.Sc. Dissertation. Universidad Nacional de Costa Rica, Heredia, Costa Rica. 82pp.
Foerster, C.R. & Medici, E.P. (2002). The influence of large herbivores on Neotropical forests. Tapir Conservation: The Newsletter of the IUCN/SSC Tapir Specialist Group (TSG) 11(1): 9-10.
Foerster, C.R. & Vaughan, C. (2002). Home range, habitat use, and activity of Baird's tapir in Costa Rica. Biotropica 34: 423-437.
Fonseca, G.A.B. (1985). The vanishing Brazilian Forest. Biological Conservation 34: 17-34.
Fonseca, G.A.B., Pinto, L.P. & Rylands, A.B. (1997). Biodiversidade e unidades de conservação. In: Proceedings of the “I Congresso Brasileiro de Unidades de Conservação: Conferências e Palestras.” pp. 189-209. Universidade Livre do Meio Ambiente, Rede Pró-Unidades de Conservação e Instituto Ambiental do Paraná, Curitiba, Brazil.
Foose, T.J. (1982). Trophic strategies of ruminant versus nonruminant ungulates. Ph.D. Dissertation. University of Chicago, Chicago, Illinois, USA.
Forester, J.D., Ives, A.R., Turner, M.G., Anderson, D.P., Fortin, D., Beyer, H.L. et al. (2007). State-space models link elk movement patterns to landscape characteristics in Yellowstone National Park. Ecological Monographs 77: 285-299.
Foufopoulos, J. & Ives, A.R. (1999). Reptile extinctions on land-bridge islands: Life-history attributes and vulnerability to extinction. American Naturalist 153: 1-25.
Frädrich, H. & Thenius, E. (1972). Tapirs. In: B. Grzimek (Ed). Animal Life Encyclopedia. Vol. 13. pp 17-33. Van Nostrand Reinhold, New York, USA.
Fragoso, J.M.V. (1991a). The effect of hunting on tapirs in Belize. In: J.G. Robinson & K.H. Redford (Eds). Neotropical Wildlife Use and Conservation. pp.154-162. University of Chicago Press, Chicago, Illinois, USA.
Fragoso, J.M.V. (1991b). The effect of selective logging on Baird’s tapir. In: M.A. Mares & D.J. Schmidly (Eds). Latin American Mammalogy: History, Biodiversity and Conservation. pp.295-304. University of Oklahoma Press, Norman, Oklahoma, USA.
Fragoso, J.M.V. (1994). Large mammals and the community dynamics of an Amazonian rain forest. Ph.D. Dissertation. University of Florida. Gainesville, USA. 310pp.
Fragoso, J.M.V. (1997). Tapir-generated seed shadows: Scale-dependent patchiness in the Amazon rain forest. Journal of Ecology 85: 519-529.
Fragoso, J.M.V & Huffman, J.M. (2000). Seed-dispersal and seedling recruitment patterns by the last Neotropical megafauna element in Amazonia, the tapir. Journal of Tropical Ecology 16: 369-385.
Fragoso, J.M.V., Silvius, K.M. & Villa-Lobos, M. (2000). Wildlife management at the Rio das Mortes Xavante Reserve, MY, Brazil: Integrating indigenous culture and scientific method for conservation. World Wildlife Fund (WWF), Brasilia, Brazil. Vol. 4, 68pp.
Fragoso, J.M.V., Silvius, K.M. & Correa, J.A. (2003). Long-distance seed dispersal by tapirs increases seed survival and aggregates tropical trees. Ecology 84: 1998-2006.

251
Freeland, W.J. (1989). Plant secondary metabolites: Biochemical coevolution with herbivores. In: R.T. Palo & C.T. Robbins (Eds). Plant Defences Against Mammalian Herbivores. pp. 61-81; CRC Press.
Furlan, S.A., Arruda Sampaio, F.A. & Gomide, M.L. (2000). Diagnóstico sócio ambiental das Ecorregiões da Mata Atlântica (Preliminary Text). Report to WWF (World Wildlife Fund) - Brazil. Department of Geography, University of São Paulo (USP), São Paulo, Brazil.
Galetti, M., Keuroghlian, A., Hanada, L. & Morato, M.I. (2001). Frugivory and seed dispersal by the lowland tapir (Tapirus terrestris) in southeast Brazil. Biotropica 33: 723-726.
Galindo-Leal, C. & Câmara, I.G. (2003). The Atlantic Forest of South America: Biodiversity Status, Threats and Outlook. Center for Applied Biodiversity Science and Island Press, Washington DC, USA.
Garla, R.C., Setz, E.Z.F. & Gobbi, N. (2001). Jaguar (Panthera onca) food habits in Atlantic Rain Forest of southeastern Brazil. Biotropica 33: 691-696.
Garshelis, D.L. (2000). Delusions in habitat evaluation: Measuring use, selection, and importance. In: L. Boitani & T.K. Fuller (Eds). Research Techniques in Animal Ecology: Controversies and Consequences. pp. 111-164. Columbia University Press, New York, USA.
Gautestad, A.O. & Mysterud, I. (2005). Intrinsic scaling complexity in animal dispersion and abundance. American Naturalist 165: 44-55.
Gayot, M., Henry, O., Dubost, G. & Sabatier, D. (2004). Comparative diet of the two forest cervids of the genus Mazama in French Guiana. Journal of Tropical Ecology 20: 31-43.
Geffen, H., Perevolotsky, A., Geffen, E. & Yom-Tov, Y. (1999). Use of space and social organization of female mountain gazelles (Gazella gazella gazella) in Ramat HaNadiv, Israel. Journal of Zoology, London, 247: 113-119.
Gehring, T.M. & Swihart, R.K. (2003). Body size, niche breadth, and ecologically scaled responses to habitat fragmentation: Mammalian predator in agricultural landscape. Biological Conservation 109: 283-295.
Gibb, H. & Hochul, D.F. (2002). Habitat fragmentation in an urban environment: Large and small fragments support different arthropod assemblages. Biological Conservation 106: 91-100.
Gibbs, J.P. (1998). Amphibian movements in response to forest edges, roads, and streambeds in southern New England. Journal of Wildlife Management 62: 584-589.
Gilpin, M.E. & Diamond, J.M. (1980). Subdivision of nature reserves and the maintenance of species diversity. Nature 285: 567-568.
Gilpin, M.E. & Soulé, M.E. (1986). Minimum viable populations: Processes of species extinctions. In: M.E. Soulé (Ed). Conservation Biology: The Science of Scarcity and Diversity. pp. 19-34. Sinauer Associates Inc. Sunderland, Massachusetts, USA.
Ginzburg, L.R., Slobodkin, L.B., Johnson, K. & Bindman, A.G. (1982). Quasi-extinction probabilities as a measure of impact on population growth. Risk Analysis 2: 171-181.
Giraudo, A.R., Krauczuk, E., Arzamendia, V. & Povedano, H. (2003). Critical analysis of protected areas in the Atlantic forest of Argentina. In: C. Galindo-Leal & I.G. Câmara (Eds). The Atlantic Forest of South America: Biodiversity Status, Threats, and Outlook. pp. 245-261. Center for Applied Biodiversity Science and Island Press, Washington DC, USA.
Gittleman, J.L. (1996). Carnivore behavior, ecology, and evolution (Vol. 2). Cornell University Press, Ithaca, NY, USA.
Goldberg, D.E. & Barton, A.M. (1992). Patterns and consequences of inter-specific competition in natural communities: A review of field experiments with plants. American Naturalist 139: 771-801.
Gómez, H., Wallace, R.B., Ayala, G.M.C. & Tejada, R. (2005). Dry season activity periods of some Amazonian mammals. Studies on Neotropical Fauna and Environment 40: 91-95.

252
Gonçalves da Silva, A. (2007). Causes of spatial genetic structure in mammals: A case study in the Atlantic Forest, Brazil. Ph.D. Dissertation. Columbia University, New York, USA.
Goodman, D. (1987). The demography of chance extinction. In: M.E. Soulé (Ed). Viable Populations for Conservation. Cambridge University Press, New York, USA.
Gordon, I.J. (1988). Facilitation of red deer grazing by cattle and its impact on red deer performance. Journal of Applied Ecology 25: 1-10.
Greenberg, R. (1989). Neophobia, aversion to open space, and ecological plasticity in song and swamp sparrows. Canadian Journal of Zoology 67: 1194-1199.
Gregory, P.T., Macartney, J.M. & Larsen, K.W. (1987). Spatial patterns and movements. In: R.A. Seigel, J.T. Collins & S.S. Novak (Eds). Snakes: Ecology and Evolutionary Biology. pp. 366-395. Macmillan Publishing Co., New York, USA.
Grellmann, D. (2002). Plant responses to fertilization and exclusion of grazers on an arctic tundra heath. Oikos 98: 190-204.
Griffin, P.C., Griffin, S.C., Waroquiers, C. & Mills, L.S. (2005). Mortality by the moonlight: Predation risk and the snowshoe hare. Behavioral Ecology 16(5): 938-944.
Groom, M.J. & Pascual, M.A. (1998). The analysis of population persistence: An outlook on the practice of viability analysis. In: P.L. Fiedler & P.M. Kareiva. Conservation Biology. pp. 4-27. Chapman & Hall, New York, USA.
Grooves, C.R. (2003). Drafting a conservation blueprint: A practitioner’s guide toplanning for biodiversity. Island Press, Washington DC, USA.
Guisan, A. & Thuiller, W. (2005). Predicting species distribution: Offering more than simple habitat models. Ecology Letters 8: 993-1009.
Gurevitch, J., Morrow, L.L., Wallace, A. et al. (1992). A meta-analysis of competition in field experiments. American Naturalist 140: 539-572.
Haddad, N.M. & Baum, K.A. (1999). An experimental test of corridor effects on butterfly densities. Ecological Applications 9: 623-633.
Hall, L.S., Krausman, P.R. & Morrison, M.L. (1997). The habitat concept and a plea for standard terminology. Wildlife Society Bulletin 25: 173-182.
Hamilton, S. & Moller, H. (1995). Can PVA models using computer packages offer useful conservation advice? Sooty shearwaters Puffinus griseus in New Zealand as a case study. Biological Conservation 73: 107-117.
Hanski, I.A. & Gilpin, M.E. (1997). Metapopulation biology: Ecology, genetics, and evolution. Academic Press, San Diego, USA.
Hanski, I.A. & Simberloff, D. (1996). The metapopulation approach, its history, conceptual domain and application to conservation. In: I.A. Hanski & M.E. Gilpin (Eds). Metapopulation Biology, Ecology, Genetics and Evolution. pp. 5-26. Academic Press, San Diego, USA.
Harmsen, B.J., Foster, R.J., Silver, S., Ostro, L. & Doncaster, C.P. (2009). Differential use of trails by forest mammals and the implications for camera-trap studies: A case study from Belize. Biotropica: in press.
Harris, R.B., Maguire, L.A. & Shaffer, M.L. (1987). Sample sizes for minimum viable population estimation. Conservation Biology 1: 72-76.
Harris, S., Cresswell, W.J., Forde, P.G., Trewhella, W.J., Woollard, T. & Wray, S. (1990). Home-range analysis using radio-tracking data: A review of problems and techniques particularly as applied to the study of mammals. Mammal Review 20: 97-123.
Haugaasen, T. & Peres, C.A. (2005). Mammal assemblage structure in Amazonian flooded and unflooded forests. Journal of Tropical Ecology 21: 133-145.
Hemson, G., Johnson, P., South, A., Kenward, R., Ripley, R. & Macdonald, D. (2005). Are kernels the mustard? Data from global positioning system (GPS) collars suggests problems for kernel home-range analyses with least-squares crossvalidation. Journal of Animal Ecology 74: 455-463.
Henry, O., Feer, F. & Sabatier, D. (2000). Diet of the lowland tapir (Tapirus terrestris L) in French Guiana. Biotropica 32(2): 364-368.

253
Hernández-Divers, S.M. & Foerster, C.R. (2001). Capture and immobilization of freeliving Baird's Tapirs (Tapirus bairdii) for an ecological study in Corcovado National Park, Costa Rica. In: D. Heard (Ed). Zoological Restraint and Anesthesia. International Veterinary Information Service, Ithaca, USA.
Hernández-Divers, S.M., Aguilar, R., Loria, D.L. & Foerster, C.R. (2005). Health evaluation of a radiocollared population of free-ranging baird’s tapirs (Tapirus bairdii) in costa rica. Journal of Zoo and Wildlife Medicine 36(2): 176-187.
Herrera, J.C., Taber, A.B., Wallace, R.B. & Painter, R.L.E. (1999). Lowland tapir (Tapirus terrestris) behavioral ecology in a southern Amazonian tropical forest. Vida Silvestre Neotropical 8: 31-37.
Hershkovitz, P. (1954). Mammals of northern Colombia, Preliminary Report No. 7: Tapirs (Genus Tapirus), with a systematic review of American species. Proceedings of the United States National Museum 103: 465-496.
Hess, G.R. (1994). Conservation corridors and contagious disease: A cautionary note. Conservation Biology 8: 256-262.
Hobbs, R.J. (1992). The role of corridors in conservation: Solution or bandwagon? Trends in Ecology and Evolution 7: 389-391.
Hooge, P.N. & Eichenlaub, B. (2000). Animal movement extension to Arcview. Version.2.0. Alaska Science Center - Biological Science Office, U.S. Geological Survey, Anchorage, Alaska, USA.
Hooge, P.N., Eichenlaub, W.M. & Solomon, E.K. (2001). Using GIS to analyze animal movements in the marine environment. The Animal Movement Analyst Extension (AMAE) to ArcView GIS.
Hueck, K. (1972). As florestas da América do Sul. Editora Polígono e Editora Universidade de Brasilia, Brasília, Distrito Federal, Brazil.
Hulbert, I.A.R., Iason, G.R., Elston, D.A. & Racey, P.A. (1996). Home-range sizes in a stratified upland landscape of two lagomorphs with different feeding strategies. Journal of Applied Ecology 33: 1479-1488.
Hunsaker, D. & Hahn, T.C. (1965). Vocalization of the South American tapir, Tapirus terrestris. Animal Behaviour XIII: 69-74.
Hunter, M.L. (1996). Fundamentals of conservation biology. Blackwell Science, USA.
Husson, A.M. (1978). The mammals of Suriname. E. J. Brill, Leiden, The Netherlands.
IBGE - Instituto Brasileiro de Geografia e Estatística (1988). Mapa de Vegetação do Brasil. Ministério do Planejamento, Orçamento e Gestão, Brazil.
IUCN (1996). Red List of Threatened Species. www.iucnredlist.org
IUCN (2008a). Red List of Threatened Species. www.iucnredlist.org
IUCN (2008b). Strategic Planning for Species Conservation: A Handbook. Version 1.0. The Species Conservation Planning Task Force, IUCN Species Survival Commission. www.iucn.org
Iwasa, Y. & Mochizuki, H. (1988). Probability of population extinction accompanying a temporary decrease of population size. Researches on Population Ecology 30: 145-164.
Janis, C. (1984). Tapirs as living fosils. In: N. Eldrege & S.M. Stanley (Eds). Living Fossils. pp. 80-86. Springer-Verlag, New York, USA.
Janson, C.H. & Emmons, L.H. (1990). Ecological structure of the non-flying mammal community at Cocha Cachu Biological Station, Manu National Park, Peru. In: A.H. Gentry (Ed). Four Neotropical Forests. pp. 314-338. New Haven: Yale University Press, USA.
Janssen, D.L. (2003). Tapiridae. In: M.E. Fowler & R.E. Miller (Eds). Zoo and Wild Animal Medicine. pp. 569-577. Elsevier Science, St. Louis, Missouri, USA.
Janssen, D.L., Rideout, B.A. & Edwards, M.S. (1999). Tapir Medicine. In: M.E. Fowler & R.E. Miller (Eds). Zoo and Wild Animal Medicine, Current Therapy 4. pp. 562-568. W.B. Saunders Co., Philadelphia, Pennsylvania, USA.

254
Janzen, D.H. (1981). Digestive seed predation by a Costa Rican Baird's tapir (Tapirus bairdii). Biotropica 13: 59-63.
Janzen, D.H. (1982). Seeds in tapir dung in Santa Rosa National Park, Costa Rica. Brenesia 19/20: 129-135.
Jetz, W., Carbone, C., Fulford, J. & Brown, J.H. (2004). The scaling of animal space use. Science 306: 266-268.
Jewell, Z.C., Alibhai S.K. & Law, P.R. (2001). Censusing and monitoring black rhino (Diceros bicornis) using an objective spoor (footprint) identification technique. Journal of Zoology, London, 254: 1-16.
Johnson, D.H. (1980). The comparasion of usage and availability measurements for evaluating resource preference. Ecology 61: 65-71.
Jones, H.L. & Diamond, J.M. (1976). Short-time-base studies of turnover in breeding bird populations on the California Channel Islands. Condor 78: 526-549.
Karanth, U.K. (1995). Estimating tiger (Panthera tigris) populations from cameratrap data using capture-recapture models. Biological Conservation 71: 333-338.
Karanth, U.K. & Nichols, J.D. (1998). Estimation of tiger densities in India using photographic captures and recaptures. Ecology 79: 2852-2862.
Karanth, U.K. & Nichols, J.D. (2002). Monitoring tigers and their prey: A manual for researchers, managers and conservationists in Tropical Asia. Centre for Wildlife Studies, Bangalore.
Karr, J.R. (1982). Avian extinction on Barro Colorado Island, Panama: A reassessment. American Naturalist 119: 220-239.
Kattan, G.H. & Alvarez-López, H. (1996). Preservation and management of biodiversity in fragmented landscapes in the Colombian Andes. In: J. Schelhas & R. Greenberg (Eds). Forest Patches in Tropical Landscapes. pp. 3-18. Island Press, Washington DC, USA.
Kenkre, V.M., Guiggioli, L., Abramsom, G. & Camelo-Neto, G. (2007). Theory of hantavirus infection spread incorporating localized adult and itinerant juvenile mice. The European Physical Journal B. 55: 461-470.
Kenward, R.E. (2001). Historical and practical perspectives. In: J.J. Millspaugh & J.M. Marzluff (Eds). Radio Tracking and Animal Populations. pp. 3-12. Academic Press, San Diego, CA, USA.
Kerley, L.L., Goodrich, J.M., Miquelle, D.G., Smirnov, E.N., Quigley, H.B. & Hornocker, M.G. (2002). Effects of roads and human disturbance on Amur tigers. Conservation Biology 16: 97-108.
Kernohan, B.J., Gitzen, R.A. & Millspaugh, J.J. (2001). Analysis of animal space use and movements. In: J.J. Millspaugh & J.M. Marzluff (Eds). Radio Tracking and Animal Populations. pp. 125-166. Academic Press, San Diego, CA, USA.
Keuroghlian, A. (1990). Observations on the behavioral ecology of the black lion tamarin (Leontopithecus chrysopygus) at Caetetús Reserve, São Paulo, Brazil. M.Sc. Dissertation. University of West Virginia, West Virginia, USA.
Keuroghlian, A. & Eaton, D.P. (2008). Fruit availability and peccary frugivory in an isolated Atlantic Forest fragment: Effects on peccary ranging behavior and habitat use. Biotropica 40: 62-70.
Keuroghlian, A., Eaton, D.P. & Longland, W.S. (2004). Area use by white-lipped and collared peccaries (Tayassu pecari and Tayassu tajacu) in a tropical forest fragment. Biological Conservation 120: 411-425.
Kindvall, O. & Ahlén, I. (1992). Geometrical factors and metapopulation dynamics of the bush cricket, Metrioptera bicolor Philippi (Orthoptera: Tettigoniidae). Conservation Biology 6: 520-529.
Kitchen, A.M., Gese, E.M., Waits, L.P., Karki. S.M. & Schauster, E.R. (2005). Genetic and spatial structure within a swift fox population. Journal of Animal Ecology 74: 1173-1181.

255
Kohn, M.H., York, E.C., Kamradt, D.A., Haught, G., Sauvajot, R.M. & Wayne, R.K. (1999). Estimating population size by genotyping faeces. Proceedings of the Royal Society of London B 266: 657-663.
Komers, P.E. & Brotherton, P.N.M. (1997). Dung pellets used to identify the distribution and density of dik-dik. African Journal of Ecology 35(2): 124-132.
Konecny, M.J. (1989). Movement patterns and food habits of four sympatric carnivore species in Belize, Central America. In: K.H. Redford & J.F. Eisenberg (Eds). Advances in Neotropical Mammalogy. pp. 243-264. The Sandhill Crane Press, Gainnesville, Florida, USA.
Koproski, L.P. (2005). O fogo e seus efeitos sobre a herpeto e a mastofauna terrestre no Parque Nacional de Ilha Grande (PR/MS), Brasil. M.Sc. Dissertation. Universidade Federal do Paraná (UFPR), Curitiba, Brazil. 126pp.
Koster, S.H. & Hart, J.A. (1988). Methods of estimating ungulate populations in tropical forests. African Journal of Ecology 26: 117-126.
Kotler, B.P. (1997). Patch use by gerbils in a risky environment: Manipulating food and safety to test four models. Oikos 78: 274-282.
Lacy, R.C. (1993). VORTEX: A computer simulation model for population viability analysis. Wildlife Research 20: 45-65.
Lacy, R.C. (2000). Structure of the VORTEX simulation model for population viability analysis. Ecological Bulletins 48: 191-203.
Lande, R. (1988). Genetics and demography in biological conservation. Science 241: 1455-1460.
Lande, R. (1995). Mutation and conservation. Conservation Biology 9: 782-91.
Lang, A.B., Kalko, E.K.V., Römer, H., Bockholdt, C. & Dechmann, D.K.N. (2006). Activity levels of bats and katydids in relation to the lunar cycle. Oecologia 146: 659-666.
Laurance, W.F. (1991). Edge effects in tropical forest fragments: Application of a model for the design of nature reserves. Biological Conservation 57: 205-19.
Laurance, W.F. (1994). Rainforest fragmentation and the structure of small mammal communities in tropical Queensland. Biological Conservation 69: 23-32.
Laurance, W.F. (2005). When bigger is better: The need for Amazonian megareserves. Trends in Ecology & Evolution 20: 645-648.
Laver, P. (2005). Kernel Home Range Estimation for ArcGIS, using VBA and ArcObjects. ABODE User Manual (Beta Version 2 - 7 February, 2005)
Leaver, L.A. (2004). Effects of food value, predation risk, and pilferage on the caching decisions of Dipodomys merriami. Behavioral Ecology 15(5): 729-734.
Leitão-Filho, E. & Morellato, L.P. (1997). Semi-deciduous forests of Southeastern Brazil-Serra do Japi. In: S.D. Davis, V.H. Heywood, O. Herrera-MacBride, J. Villa-Lobos & A.C. Hamilton (Eds). Centers for Plant Diversity: A Guide and Strategy for their Conservation. Vol. 3—The Americas. IUCN/WWF, Washington DC, USA.
Leite, J.F. (1998). A ocupação do Pontal do Paranapanema. Editora Hucitec, Fundação UNESP, São Paulo, Brazil.
Levin, S.A. (1992). The problem of pattern and scale in ecology. Ecology 73: 1943-1967.
Levins, R. (1970). Extinction. In: M. Gerstenhaber (Ed). Some Mathematical Questions in Biology. pp. 77-107. American Mathematical Society, Providence, USA.
Lewis, M.A. & Murray, J.D. (1993). Modelling territoriality and wolf-deer interactions. Nature 366: 738-740.
Lima, S.L. & Dill, L.M. (1990). Behavioural decisions made under the risk of predation: a review and prospectus. Canadian Journal of Zoology 68: 619-640.
Lima, S.L. & Zollner, P.A. (1996). Towards a behavioral ecology of ecological landscapes. Trends in Ecology and Evolution 11: 131-135.
Lin, Y.K. & Batzli, G.O. (2001). The influence of habitat quality on dispersal, demography and population dynamics of voles. Ecological Monographs 71: 245-275.

256
Lindenmayer, D.B. & Lacy, R.C. (1995). A simulation study of the impacts of population subdivision on the mountain brushtail possum Trichosurus caninus Ogilby (Phalangeridae: Marsupialia) in south-eastern Australia. I. Demographic stability and population persistence. Biological Conservation 73: 119-129.
Lindenmayer, D.B. & Possingham, H.P. (1996). Ranking conservation and timber management options for Leadbeater’s possum in southeastern Australia using population viability analysis. Conservation Biology 10: 235-251.
Lindenmayer, D.B., Clark, T.W., Lacy, R.C. & Thomas, V.C. (1993). Population viability analysis as a tool in wildlife conservation policy: With reference to Australia. Environmental Management 17: 745-758.
Lira, I., Naranjo, E.J., Güiris, D.M. & Cruz-Aldán, E. (2004). Ecología de Tapirus bairdii (Perissodactyla: Tapiridae) en la Reserva de la Biósfera El Triunfo (Polígono I), Chiapas, México. Acta Zoológica Mexicana 20: 1-21.
Lizcano, D.J. & Cavelier, J. (2000a). Densidad poblacional y disponibilidad de hábitat de la danta de montaña (Tapirus pinchaque) en los Andes centrales de Colombia. Biotropica 32: 165-173.
Lizcano, D.J. & Cavelier, J. (2000b). Daily and seasonal activity of the mountain tapir (Tapirus pinchaque) in the Central Andes of Colombia. Journal of Zoology 252: 429-435.
Lizcano, D.J. & Cavelier, J. (2004). Características químicas de salados y hábitos alimenticios de la danta da montaña (Tapirus pinchaque Roulin, 1829) en los Andes Centrales de Colombia. Mastozoologia Neotropical 11(2): 193-201.
Lizcano, D.J., Medici, E.P., Montenegro, O.L., Carrillo, L., Camacho, A. & Miller, P.S. (2005). Mountain Tapir (Tapirus pinchaque) Population and Habitat Viability Assessment (PHVA): Final Report. IUCN/SSC Tapir Specialist Group (TSG) and IUCN/SSC Conservation Breeding Specialist Group (CBSG), Apple Valley, MN, USA.
Lizcano, D.J. (2006). Ecology and conservation of large mammals in the Nothern Andes. Ph.D. Dissertation. Durrell Institute of Conservation and Ecology (DICE), University of Kent, UK. 197pp.
Lopes, J.P., Marinho, H.A., Robelo, S. & Shrimpton, R. (1980). Aspectos nutritivos de alguns frutos da Amazônia. Acta Amazonica 10: 755-758.
Lovejoy, T.E., Rankin, J.M., Bierregaard Jr, R.O., Brown, K.S., Emmons, L.H. & Van der Voort, M.E. (1984). Ecosystem decay of Amazon forest remnants. In: M.H. Nitecki (Ed). Extinctions. pp. 295-326. University of Chicago Press, Chicago, Illinois, USA.
Lovejoy, T.E., Bierregaard Jr, R.O., Rylands, A.B., Malcolm, J.R., Quintela, C.E., Harper, L.H., Brown, K.S., Powell, A.H., Powell, G.N.V., Schubart, H.O.R. & Hays, M.B. (1986). Edge and other effects of isolation on Amazon forest fragments. In: M.E. Soulé (Ed). Conservation Biology: The Science of Scarcity and Diversity. pp. 257-285. Sinauer Associates Inc. Sunderland, Massachusetts, USA.
Ludlow, M.E. & Sunquist, M.E. (1987). Ecology and behavior of ocelots in Venezuela. National Geographic 3: 447-461.
Ludwig, D. (1996). The distribution of population survival times. American Naturalist 147: 506-526.
Ludwig, D. (1999). Is it meaningful to estimate a probability of extinction? Ecology 80: 298-310.
Luiselli, L. (2006). Resource partitioning and interspecific competition in snakes: The search for general geographical and guild patterns. Oikos 114(2): 193-211.
Lynch, M. & Lande. R. (1998). The critical effective size for a genetically secure population. Animal Conservation 1: 70-72.
MacArthur, R.H. & Pianka, E.R. (1966). Optimal use of a patchy environment. American Naturalist 100: 603-609.
MacArthur, R.H. & Wilson, E.O. (1967). The theory of island biogeography. Princeton University Press, New Jersey, USA.
257
MacDonald, D.W. & Amlaner, C.J. (1980). A practical guide to radio tracking. In: C.J. Amlaner & D.W. MacDonald (Eds). A Handbook on Biotelemetry and Radio Tracking. pp. 143-159. Pergamon Press, Oxford, UK.
MacDonald, D.W. & Courtenay, O. (1996). Enduring social relationships in a population of crab-eating zorros, Cerdocyon thous, in Amazonian Brazil. Journal of Zoology 239: 329-355.
MacDonald, D.W., Ball, F.G. & Hough, N.G. (1980). The evaluation of home range size and configuration using radio racking data. In: C.J. Amlaner & D.W. MacDonald (Eds). A Handbook on Biotelemetry and Radio Tracking. pp. 405-424. Pergamon Press, Oxford, UK.
Mace, G.M. & Kershaw, M. (1997). Extinction risk and rarity on an ecological timescale. In: W.E. Kunin & K.J. Gaston (Eds). The Biology of Rarity: Causes and Consequences of Rare-Common Differences. pp. 130-149. Chapman & Hall, London, UK.
Mace, G.M. & Lande, R. (1991). Assessing extinction threats: Toward a re-evaluation of IUCN threatened species categories. Conservation Biology 5: 148-157.
Maffei, L., Cuéllar, E. & Noss, A.J. (2002). Uso de trampas-cámara para la evaluacón de mamíferos en el ecotono Chaco-Chiquitanía. Revista Boliviana de Ecología y Conservación 11: 55-65.
Maher, C.R. & Lott, D.F. (1995). Definitions of territoriality used in the study of variation in vertebrate spacing systems. Animal Behaviour 49: 1581-1597.
Mallinson, J.J.C. (1969). Reproduction and development of Brazilian Tapir, Tapirus terrestris, in a zoological park setting. Annual Report of the Jersey Wildlife Preservation Trust 6: 47-52.
Mallinson, J.J.C. (1974). Establishing mammal gestation periods at the Jersey Zoological Park. International Zoo Yearbook 14: 184-187.
Mangini, P.R. & Medici, E.P. (1998). Utilização da associação de Cloridrato de Medetomidina com Cloridrato de Tiletamina e Cloridrato de Zolazepam na contenção química de Tapirus terrestris em vida livre: Relato de dois casos. In: Book of Abstracts of the XXI Annual Conference of the Brazilian Association of Zoos. Salvador, Bahia, Brazil.
Mangini, P.R., Medici, E.P. & Velastin, G.O. (2001a). Chemical restraint of wild Tapirus terrestris at the Pontal do Paranapanema Region, São Paulo State, Brazil. In: Book of Abstracts of the First International Tapir Symposium. IUCN/SSC Tapir Specialist Group (TSG), Association of Zoos & Aquariums (AZA) Tapir Taxon Advisory Group (TAG), and Tapir Preservation Fund (TPF). San José, Costa Rica.
Mangini, P.R., Velastin, G.O. & Medici, E.P. (2001b). Protocols of chemical restraint used in 16 wild Tapirus terrestris. In: Proceedings of the V Encontro de Anestesiologia Veterinária. Archives of Veterinary Science. Universidade Federal do Paraná (UFPR), Curitiba, Brazil.
Manly, B.F.J., McDonald, L.L., Thomas, D.L., McDonald, T.L. & Erickson, W.P. (2002). Resource selection by animals, statistical design and analysis for field studies. 2nd Edition. Kluwer Academic Publishers, Dordrecht, The Netherlands.
Mantovani, W. (2003). A degradação dos biomas brasileiros. In: W.C. Ribeiro (Ed). Patrimônio Ambiental Brasileiro. pp. 367-439. Editora Universidade de São Paulo (USP), São Paulo, Brazil.
Matter, S.F. (2000). The importance of the relationship between population density and habitat area. Oikos 89: 613-618.
Matthiopoulos, J. (2003). Model-supervised kernel smoothing for the estimation of spatial usage. Oikos 102: 367-377.
Maurer, B.A. (1985). On the ecological and evolutionary roles of interspecific competition. Oikos 45: 300-302.
McCabe, R.A. (1970). Vertebrate pests: Problems and control. National Academy of Sciences. Washington DC, USA.
McKinney, M.L. (1997). Extinction vulnerability and selectivity: Combining ecological and paleontological views. Annual Review of Ecology and Systematics 28: 495-516.

258
McLoughlin, P.D. & Ferguson, S.H. (2000). A hierarchical pattern of limiting factors helps to explain the variation in home range size. Ecoscience 7: 123-130.
McNab, B.K. (1963). Bioenergetics and the determination of home range size. American Naturalist 97: 133-140.
McNaughton, S.J., Banyikwa, F.F. & McNaughton M.M. (1997). Promotion of the cycling of diet-enhancing nutrients by African grazers. Science 278: 1798-1800.
Medici, E.P. (2001). Order Perissodactyla, Family Tapiridae: Tapir Biology. In: M.E. Fowler & Z.S. Cubas (Eds). pp. 35-53. Biology, Medicine, and Surgery of South American Wild Animals. Iowa State Univerty Press/Ames, USA.
Medici, E.P., Lynam, A., Boonratana, R., Kawanishi, K., Hawa Yatim, S., Traeholt, C., Holst, B. & Miller, P.S. (2003). Malayan Tapir (Tapirus indicus) Population and Habitat Viability Assessment (PHVA): Final Report. IUCN/SSC Tapir Specialist Group (TSG) and IUCN/SSC Conservation Breeding Specialist Group (CBSG), Apple Valley, MN, USA.
Medici, E.P., Carrillo, L., Montenegro, O.L., Miller, P.S., Carbonell, F., Chassot, O., Cruz-Aldán, E., García, M., Estrada-Andino, N., Shoemaker, A.H. & Mendoza, A. (2006). Baird´s Tapir (Tapirus bairdii) Population and Habitat Viability Assessment (PHVA): Final Report. IUCN/SSC Tapir Specialist Group (TSG) and IUCN/SSC Conservation Breeding Specialist Group (CBSG), Apple Valley, MN, USA.
Medici, E.P., Desbiez, A.L.J., Gonçalves da Silva, A., Jerusalinsky, L., Chassot, O., Montenegro, O.L., Rodríguez, J.O., Mendoza, A., Quse, V.B., Pedraza, C., Gatti, A., Oliveira-Santos, L.G.R., Tortato, M.A., Ramos Jr., V., Reis, M.L., Landau-Remy, G., Tapia, A. & Morais, A.A. (2007a). Lowland Tapir (Tapirus terrestris) Population and Habitat Viability Assessment (PHVA): Final Report. IUCN/SSC Tapir Specialist Group (TSG) and IUCN/SSC Conservation Breeding Specialist Group (CBSG), Sorocaba, São Paulo, Brazil.
Medici, E.P., Mangini, P.R. & Sarria-Perea, J.A. (2007b). Tapir Field Veterinary Manual (English, Spanish, Portuguese). IUCN/SSC Tapir Specialist Group (TSG). Available online in English, Portuguese and Spanish at www.tapirs.org.
Medici, E.P., Mangini, P.R., Gonçalves da Silva, A. & Salas, L.A. (2008). Guidelines for Tapir Re-Introductions and Translocations (English, Spanish, Portuguese). IUCN/SSC Tapir Specialist Group (TSG). Available online in English, Portuguese and Spanish at www.tapirs.org.
Meffe, G.K. & Carroll, C.R. (1997). Principles of conservation biology. Sinauer Associates Inc. Sunderland, Massachusetts, USA.
Mendes-Pontes, A.R.M. (2004). Ecology of a community of mammals in a seasonally dry forest in Roraima, Brazilian Amazon. Mammalian Biology 69: 319-336.
Meyer, C.F.J., Schwarz, C.J. & Fahr, J. (2004). Activity patterns and habitat preferences of insectivorous bats in a West African forest-savanna mosaic. Journal of Tropical Ecology 20: 397-407.
Miller, P.S. & Lacy, R.C. (2003). VORTEX: A stochastic simulation of the extinction process. Version 9.00 User's Manual. IUCN/SSC Conservation Breeding Specialist Group (CBSG), Apple Valley, MN, USA.
Miller, P.S. & Lacy, R.C. (2005). VORTEX: A stochastic simulation of the extinction process. Version 9.50 User's Manual. IUCN/SSC Conservation Breeding Specialist Group (CBSG), Apple Valley, MN, USA.
Ministério do Meio Ambiente - MMA & Instituto Brasileiro do Meio Ambiente e Recursos Naturais Renováveis - IBAMA (2003). Lista de Espécies da Fauna Brasileira Ameaçadas de Extinção.
Mittermeier, R.A., Myers, N., Gil, P.R. & Mittermeier, C.G. (1999). Hotspots: Earth’s biologically richest and most endangered terrestrial ecoregions. Conservation International & CEMEX, Mexico City, Mexico.
Mittermeier, R.A., Fonseca, G.A.B., Rylands, A.B. & Brandon, K. (2005). A brief history of biodiversity conservation in Brazil. Conservation Biology 19(3): 601-607.

259
Moorcroft, P.R., Lewis, M.A. & Crabtree, R.L. (1999). Home range analysis using a mechanistic home range model. Ecology 80: 1656-1665.
Morellato, L.P.C. & Haddad, C.F.B. (2000). Introduction: The Brazilian Atlantic Forest. Biotropica 32(4b): 786-792.
Morellato, L.P.C., Talora, D.C., Takahasi, A., Bencke, C.C.; Romera, E.C. & Ziparro, V.B. (2000). Phenology of atlantic rain forest trees: A comparative study. Biotropica 32: 811-823.
Morgan, R.A., Brown, J.S. & Thorson, J.M. (1997). The effect of spatial scale on the functional response of fox squirrels. Ecology 78: 1087-1097.
Mori, S.A., Boom, B.M. & Prance, G.T. (1981). Distribution patterns and conservation of eastern Brazilian coastal forests species. Brittonia 33(2): 233-245.
Morris, D.W. (1987). Ecological scale and habitat use. Ecology 68: 362-369.
Morris, D.W. (1992). Scales and costs of habitat selection in heterogenous landscapes. Evolutionary Ecology 6: 412-432.
Muench, C.E. (2001). Patrones de uso del hábitat del tapir (Tapirus bairdii) en dos localidades de la Selva Lacandona, Chiapas. B.S. Thesis. Universidad Nacional Autónoma de México, México DF, Mexico.
Mulder, C.P.H. & Ruess, R.W. (1998). Relationships between size, biomass allocation, reproduction, and survival in Triglochin palustris: Implications for the effects of goose herbivory. Canadian Journal of Botany 76: 2164-2176.
Munson, L. (2003). Scope and magnitude of disease in species conservation. In: Animal Movements and Disease Risk: A Workbook. 5th Edition. Omaha’s Henry Doorly Zoo, IUCN/SSC Conservation Breeding Specialist Group (CBSG), and IUCN/SSC Veterinary Specialist Group (VSG).
Murray, M.G. & Illius, A.W. (1996). Multispecies grazing in the Serengeti. In: J. Hodgson & A.W. Illius (Eds). pp. 247-272. The Ecology and Management of Grazing. CAB International, Wallingford, UK.
Myers, N. (1988). Threatened biotas: ‘Hotspots’ in tropical forests. Environmentalist 8: 1-20.
Myers, N., Mittermeier, R.A., Mittermeier, C.G., Fonseca, G.A.B. & Kent, J. (2000). Biodiversity hotspots for conservation priorities. Nature 403: 853-858.
Mysterud, A., Yoccoz, N., Stenseth, N. & Langvatn, R. (2001). Effects of age, sex and density on body weight of Norwegian red deer: Evidence of density-dependent senescence. Proceedings of the Royal Society London: Biological Sciences 268: 911-919.
Naranjo, E.J. & Bodmer, R.E. (2002). Population ecology and conservation of Baird’s tapir (Tapirus bairdii) in the Lacandon Forest, México. Tapir Conservation: The Newsletter of the IUCN/SSC Tapir Specialist Group (TSG) 11: 25-32.
Naranjo, E.J. & Cruz-Aldán, E. (1998). Ecología del tapir (Tapirus bardii) en la Reserva de la Biosfera La Sepultura, Chiapas, México. Acta Zoologica Mexicana 73: 111-125.
Naranjo, E.J. (1995). Abundancia y uso de hábitat del tapir (Tapirus bairdii) en un bosque tropical húmedo de Costa Rica. Vida Silvestre Neotropical 4: 20-31.
Naranjo, E.J. (2009). Ecology and conservation of Baird’s tapir in México. Tropical Conservation Science 2(2): 140-158.
Nava, A.F.D. (2008). Espécies sentinelas para a Mata Atlântica: As conseqüências epidemiológicas da fragmentação florestal no Pontal do Paranapanema, São Paulo. Ph.D. Dissertation. Universidade de São Paulo (USP), São Paulo, Brazil. 147pp.
Neu, C.W., Byers, C.R. & Peek, J.M. (1974). A technique for analysis of utilization-availability data. Journal of Wildlife Management 38: 541-545.
Newmark, W.D. (1987). A land-bridge island perspective on mammalian extinctions in western North American parks. Nature 325: 430-432.
Newmark, W.D. (1994). Extinction of mammal populations in western North American national parks. Conservation Biology 9: 512-526.

260
Norton-Griffiths, M. (1988). Aerial point sampling for land use surveys. Journal of Biogeography 15: 149-156.
Noss, R.F. & Cooperrider, A.Y. (1994). Saving nature’s legacy: Protecting and restoring biodiversity. Island Press, Covelo, CA, USA.
Noss, R.F. (1987). Protecting natural areas in fragmented landscapes. Natural Areas Journal 7: 2-13.
Noss, R.F. (1990). Indicators for monitoring biodiversity: A hierarchical approach. Conservatin Biology 4: 355-364.
Noss, A.J., Cuéllar, R.L., Barrientos, J., Cuéllar, E., Arispe, R., Rúmiz, D. & Rivero, K. (2003). A camera trapping and radio telemetry study of lowland tapir (Tapirus terrestris) in Bolivian dry forests. Tapir Conservation: The Newsletter of the IUCN/SSC Tapir Specialist Group (TSG) 12: 24-32.
Novaro, A.J., Redford, K.H. & Bodmer, R.E. (2000). Effect of hunting in source–sink systems in the neotropics. Conservation Biology 14: 713-721.
Nunes, L.A.V., Mangini, P.R. & Ferreira, J.R.V. (2001). Order Perissodactyla, Family Tapiridae: Capture and Medicine. In: M.E. Fowler & Z.S. Cubas (Eds). pp. 367-376. Biology, Medicine, and Surgery of South American Wild Animals. Iowa State Univerty Press/Ames, USA.
Nunney, L. & Campbell, K.A. (1993). Assessing minimum viable population size: Demography meets population genetics. Trends in Ecology and Evolution 8: 234-239.
Ojasti, J. (1993). Utilización de la fauna silvestre en América Latina: Situación y perspectivas para un manejo sostenible. Guía FAO Conserv 25: 1-248.
Olff, H. & Ritchie, M.E. (1998). Effects of herbivores on grassland plant diversity. Trends in Ecology and Evolution 13: 261-265.
Oli, M.K. & Dobson, F.S. (2003). The relative importance of life-history variables to population growth rate in mammals: Cole’s prediction revisited. American Naturalist 161: 422-440.
Oliveira, J.B., Camargo, M.N., Rossi, M. & Calderano-Filho, B. (1999). Mapa Pedológico do Estado de São Paulo: Legenda expandida. Campinas: Instituto Agronômico: Rio de Janeiro, Embrapa Solos, Campinas, Brazil.
Oliveira-Filho, A.T. & Fontes, M.A.L. (2000). Patterns of floristic differentiation among Atlantic Forests in southeastern Brazil and the influence of climate. Biotropica 32(4b): 793-810.
Oliveira-Filho, A.T. & Ratter, J.A. (1995). A study of the origin of central Brazilian forests by the analysis of plant species distribution patterns. Edinburgh Journal of Botany 52: 141-194.
Oliveira-Santos, L.G.R., Zucco, C.A., Antunes, P.C. & Crawshaw Jr, P.G. (2009). Is it possible to individually identify mammals with no natural markings using camera-traps? A controlled case-study with lowland tapirs. Mammallian Biology: in press.
Olmos, O. (1997). Tapirs as seed dispersers and predators. In: D.M. Brooks, R.E. Bodmer & S. Matola (Eds). Tapirs: Status Survey and Conservation Action Plan. pp. 3-9. IUCN/SSC Tapir Specialist Group (TSG), Gland, Switzerland.
Olmos, F., Pardini, R., Boulhosa, R.L.P., Burgi, R. & Morsello, C. (1999). Do tapirs steal food from palm seed predators or give them a lift? Biotropica 31: 375-379.
Olofsson, J. (2001). Influence of herbivory and abiotic factors on the distribution of tall forbs along a productivity gradient: A transplantation experiment. Oikos 94: 351-357.
Olofsson, J., Moen, J. & Oksanen, L. (2002). Effects of herbivory on competition intensity in two arctic-alpine tundra communities with different productivity. Oikos 96: 265-272.
Olson, D.M., Dinerstein, E., Wikramanayake, E.D., Burgess, N.D., Powell, G.V.N., Underwood, E.C., D’Amico, J.A., Strand, H.E., Morrison, J.C., Loucks, C.L., Allnutt, T.F., Lamoreux, J.F., Ricketts, T.H., Itoua, I., Wettengel, W., Kura, Y., Hedao, P. & Kassem, K. (2001). Terrestrial ecoregions of the world: A new map of life on Earth. BioScience 51: 933-938.

261
Orians, G.H. & Wittenberger, J.F. (1991). Spatial and temporal scales in habitat selection. American Naturalist 137: S29-S49.
Orrock, J.L., Danielson, B.J., Burns, M.J. & Levey, D.J. (2003). Spatial ecology of predator–prey interactions: Corridors and patch shape affect seed predation. Ecology 84: 2589-2599.
Padilla, M. & Dowler, R.C. (1994). Tapirus terrestris. Mammalian Species 481: 1-8.
Painter, R.L.E. (1998). Gardeners of the forest: Plant-animal interactions in a Neotropical forest ungulate community. Ph.D. Dissertation. University of Liverpool, Liverpool, UK.
Painter, R.L.E. & Rumiz, D.I. (1999). Por qué son importantes los herbívoros terrestres para los bosques de producción forestal? Revista Boliviana de Ecología 5: 61-74.
Pardini, R., Marques de Souza, S., Braga-Neto, R. & Metzger, J.P. (2005). The role of forest structure, fragment size and corridors in maintaining small mammal abundance and diversity in an Atlantic Forest landscape. Biological Conservation 124: 253-266.
Parker, M. & MacNally, R. (2002). Habitat loss and the habitat fragmentation threshold: An experimental evaluation of impacts on richness and total abundances using grassland invertebrates. Biological Conservation 105: 217-229.
Patterson, B.D. (1984). Mammalian extinction and biogeography in the southern Rocky Mountains. In: M.H. Nitecki (Ed). pp. 247-293. University of Chicago Press, Chicago, Illinois, USA.
Peña, J.A., Solano, C.L. & Vargas, N. (1996). Aspectos ecológicos del tapir de tierras bajas Tapirus terrestris en un sector del río Duda, Parque Nacional Natural Tinigua, Colombia. In: C. Campos, A. Ulloa & H. Rubio (Eds). Manejo de Fauna con Comunidades Rurales. Pp. 157-163. Fundación Natura, Organización Regional Indígena Embera Woaunan (Orewa), Organización de Estados Iberoamericanos para la Educación, la Ciencia y la Cultura (OEI) & Unidad Administrativa Especial del Sistema de Parques Naturales Nacionales, Ministeriodel Medio Ambiente. Bogotá, Colombia.
Peres, C. (1996). Population status of white-lipped Tayassu pecari and collared peccaries T. tajacu in hunted and unhunted Amazonian forests. Biological Conservation 77: 115-123.
Peres, C.A. (2000). Synergistic effects of subsistence hunting and habitat fragmentation on Amazonian Forest vertebrates. Conservation Biology 15: 1490-1505.
Perz, S.G., Arambur, C. & Bremner, J. (2005). Population, land use and deforestation in the pan Amazon basin: A comparison of Brazil, Bolivia, Colombia, Ecuador, Peru and Venezuela. Environment, Development and Sustainability 7: 23-49.
Petrak, M. (1990). Habitat use as assessed by vegetation survey. In: G.W.T.A. Groot Bruinderink & S.E. van Wieren (Eds). Methods for the Study of Large Mammals in Forest Ecosystems. pp. 22-31. Research Institute for Nature Management, Arnhem, The Netherlands.
Pimm, S.L., Jones, L. & Diamond, J. (1988). On the risk of extinction. American Naturalist 132: 757-785.
Pires-Costa, L.P., Leite, Y.L.R., Fonseca, G.A.B. & Fonseca, M.T. (2000). Biogeography of South American forest mammals: Endemism and diversity in the Atlantic Forest. Biotropica 32(4b): 872-881.
Pires-Costa, L.P., Leite, Y.L.R., Mendes, S.L. & Ditchfield, A.D. (2005). Mammal conservation in Brazil. Conservation Biology 19(3): 672-679.
Pojar, T.M., Bowden, D.C. & Gill, R.B. (1995). Aerial counting experiments to estimate pronghorn density and herd structure. Journal of Wildlife Management 59: 117-128.
Polisar, J., Maxit, I., Scognamillo, D., Farrell, L., Sunquist, M.E & Eisenberg, J.F. (2003). Jaguars, pumas, their prey base and cattle ranching: Ecological interpretations of a management problem. Biological Conservation 109: 297-310.
Pollock, K.H. & Kendall, W.L. (1987). Visibility bias in aerial surveys: A review of estimation procedures. Journal of Wildlife Management 51: 502-510.

262
Por, F.D. (1992). Sooretama: The Atlantic Rain Forest of Brazil. SPB Academic Publishing, The Hague, The Netherlands.
Possingham, H.P., Lindenmayer, D.B. & Norton, T.W. (1993). A framework for improved threatened species management using population viability analysis. Pacific Conservation Biology 9: 39-45.
Poullé, M.L., Artois, M. & Roeder, J.J. (1994). Dynamics of spatial relationships among members of a fox group (Vulpes vulpes: Mammalia: Carnivora). Journal of Zoology, London, 233: 93-106.
Powell, R.A. (2000). Animal home ranges and territories and home range estimators. In: L. Boitani & T.K. Fuller (Eds). Research Techniques in Animal Ecology: Controversies and Consequences. pp. 65-110. Columbia University, New York, USA.
Primack, R.B. (1993). Essentials of conservation biology. Sinauer Associates Inc. Sunderland, Massachusetts, USA.
Pulliam, H.R. (1988). Source, sinks and population regulation. American Naturalist 132(5): 652-661.
Pusenius, J., Ostfeld, R.S. & Kessing, F. (2000). Patch selection and tree-seedling predation by resident vs immigrant meadow voles. Ecology 81: 2951-2956.
Putman, R.J. (1984). Facts from faeces. Mammal Review 14: 79-97.
Putman, R.J. (1990). Patterns of habitat use: An examination of the available methods. In: G.W.T.A. Groot Bruinderink & S.E. van Wieren (Eds). Methods for the Study of Large Mammals in Forest Ecosystems. pp. 44-58. Research Institute for Nature Management, Arnhem, The Netherlands.
Quinn, J.F. & Hastings, A. (1987). Extinction in subdivided habitats. Conservation Biology 1: 198-208.
R Development Core Team (2008). R: A language and environment for statistical computing. R Foundation for Statistical Computing, Vienna, Austria. ISBN 3-900051-07-0, www.R-project.org
Ralls, K., Ballou, J.D. & Templeton, A.R. (1988). Estimates of lethal equivalents and the cost of inbreeding in mammals. Conservation Biology 2: 185-193.
Rambaldi, D.M. & Oliveira, D.A.S. (2003). Fragmentação de ecossistemas: Causas, efeitos sobre a biodiversidade e recomendações de políticas públicas. Ministério do Meio Ambiente, Brasília, Brazil.
Ray, C. & Hastings, A. (1996). Density dependence: Are we searching at the wrong spatial scale? Journal of Animal Ecology 65: 556-566.
Read, B. (1986). Breeding and management of the Malayan tapir Tapirus indicus at the St. Louis Zoo. International Zoo Yearbook 24/25: 294-297.
Redford, K.H. & Robinson, J.G. (1991). Subsistence and commercial uses of wildlife in Latin America. In: J.G. Robinson & K.H. Redford (Eds). Neotropical Wildlife Use and Conservation. pp. 53-81. University of Chicago Press, Chicago, Illinois, USA.
Redpath, S.M. (1995). Habitat fragmentation and the individual: Tawny owls Strix aluco in woodland patches. Journal of Animal Ecology 64: 652-661.
Reed, D.H. & Hobbs, G.R. (2004). The relationship between population size and temporal variability in population size. Animal Conservation 7: 1-8.
Reed, D.H., O'Grady, J.J., Brook, B.W., Ballou, J.D. & Frankham, R. (2003). Estimates of minimum viable population sizes for vertebrates and factors influencing those estimates. Biological Conservation 113: 23-34.
Rhodes, J.R., McAlpine, C.A., Lunney, D. & Possingham, H.P. (2005). A spatially explicit habitat selection model incorporating home range behavior. Ecology 86: 1199-1205.
Ribeiro, M.C., Metzger, J.P., Martensen, A.C., Ponzoni, F.J. & Hirota, M.M. (2009). The Brazilian Atlantic Forest: How much is left, and how is the remaining forest distributed? Implications for conservation. Biological Conservation 142: 1141-1153.
Ribon, R., Simon, J.E. & De Mattos, G.T. (2003). Bird extinctions in Atlantic Forest fragments of Viçosa region, Southeastern Brazil. Conservation Biology 17: 1827-1839.

263
Richman, A.D., Case, T.J. & Schwaner, T.D. (1988). Natural and unnatural extinction rates of reptiles on islands. American Naturalist 131: 611-630.
Riney, T. (1982). Study and management of large mammals. John Wiley & Sons, Chichester, New York, USA.
Robinson, J.G. & Eisenberg, J.F. (1985). Group size and foraging habits of the collared peccaries Tayassu tajacu. Journal of Mammalogy 66: 153-155.
Robinson, J.G. & Redford, K.H. (1986). Body size, diet, and population density of Neotropical forest mammals. American Naturalist 128: 665.
Robinson, J.G. & Redford, K.H. (1991). Sustainable harvest of Neotropical forest mammals. In: J.G. Robinson & K.H. Redford (Eds). Neotropical Wildlife Use and Conservation. University of Chicago Press, Chicago, Illinois, USA.
Rocha, V.J. (2001). Ecologia de mamíferos de médio e grande porte do Parque Estadual Mata dos Godoy, Londrina (PR). Ph.D. Dissertation. Universidade Federal do Paraná (UFPR), Curitiba, Brazil. 131pp.
Rodgers, A.R., Rempel, R.S. & Abraham, K.F. (1996). A GPS-based telemetry system. Wildlife Society Bulletin 24: 559-566.
Rodrigues, M., Olmos, F. & Galetti, M. (1993). Seed dispersal by tapir in southeastern Brazil. Mammalia 57: 460-461.
Roelke, M.E., Martenson, J.S. & O’Brien, S.J. (1993). The consequences of demographic reduction and genetic depletion in the endangered Florida panther. Current Biology 3: 340-350.
Rosenberg, D.K., Noon, B.R. & Meslow, E.C. (1997). Biological corridors: Form, function, and effcacy. BioScience 47: 677-687.
Rosenzweig, M.L. (1981). A theory of habitat selection. Ecology 62: 327-335.
Rosenzweig, M.L. & Abramsky, Z. (1986). Centrifugal community organization. Oikos 46: 339-348.
Ross, J.L. & Moroz, I.C. (1997). Mapa Geomorfológico do Estado São Paulo 1:500.000 (Report and Maps). Vols. 1 and 2. IPT, São Paulo, Brazil.
Ruggiero, L.F., Hayward, G.D. & Squires, J.R. (1994). Viability analysis in biological evaluations: Concepts of population viability analysis, biological population, and ecological scale. Conservation Biology 8: 364-372.
Rylands, A.B. & Keuroghlian, A. (1988). Primate populations in continuous forest and forest fragments in central Amazonia. Acta Amazônica 18: 291-307.
Salas, L.A. (1996). Habitat use by lowlands tapirs (Tapirus terrestris L) in the Tabaro River valley, Southern Venezuela. Canadian Journal of Zoology 74: 1452-1458.
Salas, L.A. & Fuller, T.K. (1996). Diet of the lowland tapir (Tapirus terrestris L) in the Tabaro River valley, Southern Venezuela. Canadian Journal of Zoology 74: 1444-1451.
Salovaara, K., Bodmer, R.E., Recharte, M. & Reyes, C. (2003). Diversity and abundance of mammals. In: N. Pitman, C. Vriesendorp & D. Moskovits (Eds). Peru: Yavari. Rapid Biological Inventories Report 11. pp. 156-164. The Field Museum, Chicago, Illinois, USA.
Samuel, M.D. & Fuller, M.R. (1994). Wildlife radio-telemetry. In: T.A. Bookhout (Ed). Research and Management Techniques for Wildlife and Habitats. pp. 370-418. Bethesda: Wildlife Society, USA.
Samuel, M.D. & Garton, E.O. (1987). Incorporating activity time in harmonic home range analysis. Journal of Wildlife Management 51: 254-257.
Samuel, M.D., Pierce, D.J. & Garton, E.O. (1985). Identifying areas of concentrated use within the home range. Journal of Animal Ecology 54: 711-719.
Sanderson, E.W., Redford, K.H., Vedder, A., Coppolillo, P.B. & Ward, S.E. (2002). A conceptual model for conservation planning based on landscape species requirements. Landscape and Urban Planning 58: 41-56.

264
Sanjurjo, M. & Gauto, R. (1996). Paraguay. In: C.S. Harcourt & J.A. Sayer (Eds). The Conservation Atlas of Tropical Forests: The Americas. pp. 286-293. Simon & Schuster. New York, USA.
Saunders, D.A., Hoobs, R.J. & Margules, C.R. (1991). Biological consequences of ecosystem fragmentation: A review. Conservation Biology 5: 18-32.
Schaller, G.B. (1983). Mammals and their biomass on a Brazilian ranch. Arquivos de Zoologia 31: 1-36.
Schipper, J. et al. (2008). The status of the world’s land and marine mammals: Diversity, threat, and knowledge. Science 322: 225-230.
Schlittler, F.H.M. (1990). Fitossociologia e ciclagem de nutrientes na floresta tropical do Parque Estadual Morro do Diabo (Região do Pontal do Paranapanema, Estado de São Paulo). Ph.D. Dissertation. UNESP, Rio Claro, São Paulo, Brazil. 279pp.
Schmidt-Nielsen, K. (2005). Fisiologia Animal: Adaptação e Meio Ambiente. Santos Editora, São Paulo, Brazil.
Schmiegelow, F.K. & Monkkonen, M. (2002). Habitat loss and fragmentation in dynamic landscapes: Avian perspectives from the boreal forest. Ecological Applications 12: 375-389.
Schoener, T.W. (1968). Sizes of feeding territories among birds. Ecology 49: 123-41.
Schoener, T.W. (1983). Field experiments on interspecific competition. American Naturalist 122: 240-285.
Schoener, T.W. (1984). Size differences among sympatric, bird-eating hawks: A world-wide survey. In: D.R. Strong, D. Simberloff, L.G. Abele et al. (Eds). Ecological Communities: Conceptual Issues and the Evidence. pp. 254-279. Princeton University Press, New Jersey, USA.
Schoener, T.W. (1986). The analysis of competition by field experiments. In: J. Kikkawa & D.J. Anderson (Eds). Community Ecology: Pattern and Process. pp. 91-126. Blackwell Scientific Publications, London, UK.
Schoener, T.W. & Spiller, A. (1992). Is extinction rate related to temporal variability in population size? An empirical answer for orb spiders. American Naturalist 139: 1176-1207.
Seaman, D.E. & Powell, R.A. (1996). An evaluation of the accuracy of kernel density estimators for home range analysis. Ecology 77: 2075-2088.
Seber, G.A.F. (1973). The Estimation of Animal Abundance. Hafner Publishing Company, New York, USA.
Sekercioglu, C.H., Ehrlich, P.R., Daily, G.C., Aygen, D., Goehring, D. & Sandí, R.F. (2002). Disappearance of insectivorous birds from tropical forest fragments. Proceedings of the National Academy of Sciences 99: 263-267.
Servin, J., Rau, J.R. & Delibes, M. (1987). Use of radio tracking to improve the estimation by track counts of the relative abundance of red fox. Acta Theriologica 32: 489-492.
Setzer, J. (1949). Os Solos do Estado de Sao Paulo, 1st Edition. Conselho Nacional de Geografia, Rio de Janeiro, Brazil.
Shafer, C.L. (1990). Introduction. In: C.L. Shafer (Ed). Nature Reserves: Island Theory and Conservation Practice. pp. 1-10. Smithsonian Institution Press, Washington DC, USA.
Shaffer, M.L. (1981). Minimum population sizes for species conservation. BioScience 31: 131-134.
Shaffer, M.L. & Sampson, F.B. (1985). Population size and extinction: A note on determining critical population size. American Naturalist 125: 146-152.
Shaffer, M.L., Hood, L., Snape, W.J.I. & Latchis, I. (2000). Population viability analysis and conservation policy. In: S.R. Beissinger & D.R. McCullough (Eds). Population Viability Analysis. University of Chicago Press, Chicago, Illinois, USA.

265
Shepherdson, D.J. (1994). The role of environmental enrichment in the captive breeding and reintroduction of endangered species. In: P.J.S. Olney, G.M. Mace & A.T.C. Feistner (Eds). Creative Conservation: Interactive Management of Wild and Captive Animals. pp. 167-177. Chapman & Hall, London, UK.
Sieving, K.E., Wilson, M.F. & De Santo, T.L. (1996). Habitat barriers to movement of understory birds in fragmented South-Temperate Rainforest. The Auk 113: 944-949.
Sih, A., Jonsson, B.G. & Luikart, G. (2000). Do edge effects occur over large spatial scale? Tree 15: 134-135.
Silveira, L., Rodrigues, F.H.G., Jacomo, A.T.A. & Diniz-Filho, J.A.F. (1999). Impact of wildfires on the megafauna of Emas National Park, central Brazil. Oryx 33: 106-114.
Silverman, B.W. (1986). Density estimation for statistics and data analysis. Chapman & Hall, London, UK.
Simberloff, D. (2004). Community ecology: is it time to move on? American Naturalist 163: 787-799.
Simberloff, D. & Cox, J. (1987). Consequences and costs of conservation corridors. Conservation Biology 1: 63-71.
Simberloff, D., Farr, J.A., Cox, J. & Mehlman, D.W. (1992). Movement corridors: Conservation bargains or poor investments. Conservation Biology 6: 493-504.
Sinclair, A.R.E. & Byrom, A.E. (2006). Understanding ecosystem dynamics for conservation of biota. Journal of Animal Ecology 75: 64-79.
Sinclair, A.R.E. (2003). Mammal population regulation, keystone processes and ecosystem dynamics. Philosophical Transactions: Biological Sciences 358: 1729 – 1740.
Skole, D. & Tucker, C.J. (1993). Tropical deforestation and habitat fragmentation in the Amazon: Satellite data from 1978 to 1988. Science 260: 1905-1910.
Smallwood, K.S. & Fitzhugh, E.L. (1993). A rigorous technique for identifying individual mountain lions (Felis concolor) by their tracks. Biological Conservation 65: 51-59.
Smallwood, K.S. & Fitzhugh, E.L. (1995). A track count for estimating mountain lion, Felis concolor, Californian population trend. Biological Conservation 71: 251-259.
Smith, A.T. (1974). The distribution and dispersal of pikas: Consequences of insular population structure. Ecology 55: 1112-1119.
Soisalo, K.M. & Cavalcanti, S.M.C. (2006). Estimating the density of a jaguar population in the Brazilian Pantanal using camera-traps and capture–recapture sampling in combination with GPS radio-telemetry. Biological Conservation 129: 487-496.
SOS Mata Atlântica (1992). Dossiê Mata Atlântica. São Paulo, Brazil.
SOS Mata Atlântica & INPE - Instituto Nacional de Pesquisas Espaciais (2002). Atlas dos remanescentes florestais da Mata Atlântica: Período 1995-2000. Relatório Final: SOS Mata Atlântica, São Paulo, and Instituto Nacional de Pesquisas Espaciais (INPE), São José dos Campos, São Paulo, Brazil.
SOS Mata Atlântica & INPE - Instituto Nacional de Pesquisas Espaciais (2008). Atlas dos remanescentes florestais da Mata Atlântica: Período 2000-2005. Relatório Final: SOS Mata Atlântica, São Paulo, and Instituto Nacional de Pesquisas Espaciais (INPE), São José dos Campos, São Paulo, Brazil.
Soto, Q. G. (2002). Dieta del tapir Tapirus terrestris y su rol como dispersor de semillas en el Chaco (Cerro Cortado), Provincia Cordillera, Santa Cruz, Bolivia. B.S. Thesis. Universidad Autonóma Gabriel René Moreno, Santa Cruz, Bolivia.
Soulé, M.E. (1987). Viable populations for conservation. Cambridge University Press, New York, USA.
Soulé, M.E., Bolger, D.T., Alberts, A.C., Sauvajot, R., Wright, J., Sorice, M. & Hill, S. (1988). Restructured dynamics of rapid extinctions of chaparral-requiring birds in urban habitat islands. Conservation Biology 2: 75-92.
South, A. (1999). Dispersal in spatially explicit population models. Conservation Biology 13: 1039-1046.

266
Souza-Mazurek, R.R., Pedrinho, T., Feliciano, X, Hilário, W., Gerôncio, S. & Marcelo, E. (2000). Subsistence hunting among the Waimiri Atroari Indians in Central Amazonia, Brazil. Biodiversity and Conservation 9: 579-596.
Spellerberg, I.F. (1998). Ecological effects of roads and traffic: A literature review. Global Ecology and Biogeography Letters 7: 317-333.
Springer, J.T. (1982). Movement patterns of coyotes in south central Washington. Journal of Wildlife Management 46: 191-200.
Steinmetz, R., Chutipong, W., Seuaturien, N. & Cheungsa-ad, E. (2008). Community structure of large mammals in tropical montane and lowland forest in the Tenasserim–Dawna mountains, Thailand. Biotropica 40: 344-353.
Stephens, D.W. & Krebs, J.R. (1986). Foraging theory. Princeton University Press, New Jersey, USA.
Stratford, J.A. & Stouffer, P.C. (1999). Local extinctions of terrestrial insectivorous birds in a fragmented landscape near Manaus, Brazil. Conservation Biology 13: 1416-1423.
Tabarelli, M., Pinto, L.P., Silva, J.M.C. & Costa, C.M.R. (2003). The Atlantic Forest of Brazil: Endangered species and conservation planning. In: C. Galindo-Leal & I.G. Câmara (Eds). The Atlantic Forest of South America: Biodiversity Status, Trends, and Outlook. pp. 86-94. Center for Applied Biodiversity Science e Island Press, Washington DC, USA.
Tabarelli, M., Silva, J.M.C. & Gascon, C. (2004). Forest fragmentation, synergisms and the impoverishment of neotropical forests. Biodiversity and Conservation 13: 1419-1425.
Tabarelli, M., Pinto, L.P., Silva, J.M.C., Hirota, M. & Bedê, L. (2005). Challenges and oportunities for biodiversity conservation in the Brazilian Atlantic Forest. Conservation Biology 19: 695-700.
Taber, A.B., Navarro, G. & Arribas, M.A. (1997). A new park in the Bolivian Gran Chaco - an advance in tropical dry forest conservation and community-based management. Oryx 31: 189-198.
Taber, A.B., Chalukian, S., Minkowski, K., Sanderson, E. et al. (2008). Range-wide status analysis of lowland tapir (Tapirus terrestris) and white-lipped peccary (Tayassu pecari): Final report. Wildlife Conservation Society (WCS), Buenos Aires, Argentina.
Templeton, A.R., Shaw, K., Routman, E. & Davis, S.K. (1990). The genetic consequences of habitat fragmentation. Annals of the Missouri Botanical Garden 77: 13-27.
Terborgh, J. (1986). Keystone plant resources in the tropical florest. In: M.E. Soulé (Ed). Conservation Biology: The Science of Scarcity and Diversity. pp. 330-344. Sinauer Associates Inc. Sunderland, Massachusetts, USA.
Terborgh, J. (1988). The big things that run the world: A sequel to E.O. Wilson. Conservation Biology 2(4): 402-403.
Terborgh, J. (1992). Maintenance of diversity in tropical forests. Biotropica 24(2B): 243-292.
Terborgh, J. & Winter, B. (1980). Some causes of extinction. In: M.E. Soulé & B. Wilcox (Eds). Conservation Biology: An Evolutionary - Ecological Perspective. pp 119-133. Sinauer Associates Inc. Sunderland, Massachusetts, USA.
Terwilliger, V.J. (1978). Natural history of Baird’s tapir on Barro Colorado Island, Panamá Canal Zone. Biotropica 10(3): 211-220.
Tewksbury, J.J., Levey, D.J., Haddad, N.M., Sargent, S., Orrock, J.L., Weldon, A., Danielson, B.J., Brinkerho, V.J., Damschen, E.I. & Townsend, P. (2002). Corridors affect plants, animals, and their interactions in fragmented landscapes. Proceedings of the National Academy of Sciences 99: 12923-12926.
TNC - The Nature Conservancy (2007). Conservation Action Planning (CAP): Developing strategies, taking action, and measuring success at any scale (Overview of Basic Principles). The Nature Conservancy (TNC), Seatlle, Washington, USA.
Tobler, M.W. (2002). Habitat use and diet of Baird’s tapir (Tapirus bardii) in a montane cloud forest of the Cordillera de Tallamanca, Costa Rica. Biotropica 34(3): 468-474.

267
Tobler, M.W. (2008). The ecology of the lowland tapir in Madre de Dios, Peru: Using new technologies to study large rainforest mammals. Ph.D. Dissertation. University of Texas, USA.
Tobler, M.W., Naranjo, E.J. & Lira-Torres, I. (2006). Habitat preference, feeding habits and conservation of Baird’s tapir in Neotropical montane oak forests. In: M. Kappelle (Ed). Ecology and Conservation of Neotropical Montane Oak Forests. pp. 347-361. Springer-Verlag, Germany.
Tobler, M.W., Carrillo-Percasteguia, S.E. & Powell, G. (2009). Habitat use, activity patterns and use of mineral licks by five species of ungulate in south-eastern Peru. Journal of Tropical Ecology 25: 261-270.
Tófoli, C.F. (2006). Frugivoria e dispersão de sementes por Tapirus terrestris (Linnaeus, 1758) na paisagem fragmentada do Pontal do Paranapanema, São Paulo. M.Sc. Dissertation. Universidade de São Paulo (USP), São Paulo, Brazil. 89pp.
Toft, C.A. & Schoener, T.W. (1983). Abundance, diversity of orb spiders on 106 Bahamian islands: Biogeography at an intermediate trophic level. Oikos 41: 411-426.
Tokeshi, M. (1999). Species coexistence. Ecological and evolutionary perspectives. Blackwell Scientific Publisher, Oxford, UK.
Traeholt, C. (2002). Malayan Tapir Project Report, Krau Wildlife Reserve, Malaysia. Tapir Conservation: The Newsletter of the IUCN/SSC Tapir Specialist Group (TSG) 11(2): 22.
Trolle, M. (2003). Mammal survey in the southeastern Pantanal, Brazil. Biodiversity Conservation 12: 823-836.
Trolle, M., Noss, A.J., Cordeiro, J.L.P. & Oliveira, L.F.B. (2007). Brazilian tapir density in the Pantanal: A comparison of systematic camera trapping and line transect surveys. Biotropica 40: 211-217.
Trombulak, S. & Frissell, C.A. (2000). Review of ecological effects of roads on terrestrial and aquatic communities. Conservation Biology 14: 18-30.
Turchin, P. (1998). Quantitative analysis of movement. Sinauer Associates Inc. Sunderland, Massachusetts, USA.
Turner, A.M. (1997). Contrasting short-term and long-term effects of predation risk on consumer habitat use and resources. Behavioural Ecology 8: 120-125.
Uezu, A., Metzger, J.P. & Vielliard, J.M. (2005). The effect of structural and functional connectivity and patch size on the abundance of seven Atlantic Forest bird species. Biological Conservation 123: 507-519.
Uezu, A., Beyer, D.D. & Metzger, J.P. (2008). Can agroforest woodlots work as stepping Stones for birds in the Atlantic Forest region? Biodiversity Conservation 17(8): 1907-1922.
Val, L.D. (1972). Cronologia da Regiao de Caratinga. Editora e Gráfica Alvorada, Brasília, Distrito Federal, Brazil.
Valladares-Padua, C.B. (1993). The ecology, behavior and conservation of the black lion tamarins (Leontopithecus chrysopygus, Mikan, 1823). Ph.D. Dissertation. University of Florida, Florida, USA. 182pp.
Valladares-Padua, C.B., Padua, S.M. & Cullen, L. (2002). Within and surrounding the Morro do Diabo State Park: Biological value, conflicts, mitigation and sustainable development alternatives. Environmental Science & Policy 5: 69-78.
Van Dyke, F.G., Brocke, R.H. & Shaw, H.G. (1986). Use of road track counts as indices of mountain lion presence. Journal of Wildlife Management 50(1); 102-109.
Varela, R.O. & Brown, A.D. (1995). Tapires y pecaríes como dispersores de plantas de los bosques húmedos subtropicales de Argentina. In: A.D. Brown & H.R. Grau (Eds). Investigación, Conservación y Desarrollo en Selvas Subtropicales de Montaña. pp. 129-140. Facultad de Ciencias Naturales e Instituto Miguel Lillo, Tucumán, Argentina.
268
Veloso, H.P., Rangel-Filho, A.L. & Lima, J.C.A. (1991). Classificação da vegetação brasileira, adaptada a um sistema universal. Fundação Instituto Brasileiro de Geografia e Estatística-IBGE, Rio de Janeiro, Brazil.
Viana, V.M., Tabanez, A.A.J. & Batista, J.L.F. (1997). Dynamics and restoration of forest fragments in the Brazilian Atlantic moist forest. In: W.F. Laurance & R.O. Bierregaard Jr (Eds). Tropical Forest Remnants: Ecology, Management, and Conservation of Fragmented Communities. pp 351-365. University of Chicago Press, Chicago, Illinois, USA.
Vickers, W.T. (1991). Hunting yields and game composition over ten years in an Amazon Indian territory. In: J.G. Robinson & K.H. Redford (Eds). Neotropical Wildlife Use and Conservation. pp. 53-81. University of Chicago Press, Chicago, Illinois, USA.
Vié, J.C., Hilton-Taylor, C. & Stuart, S.N. (2009). Wildlife in a changing world: An analysis of the 2008 IUCN Red List of Threatened Species. IUCN, Gland, Switzerland.
Vieira, M.C.W. & Mesquita, C.A.B. (2004). RPPN: Reservas Particulares do Patrimônio Natural na Mata Atlântica. Caderno da Reserva da Biosfera da Mata Atlântica 28. Conselho Nacional da Reserva da Biosfera da Mata Atlântica e Aliança para Conservação da Mata Atlântica, São Paulo, Brazil.
Virtanen, R. (1998). Impact of grazing and neighbour removal on a heath plant community transplanted onto a snowbed site, NW Finnish Lapland. Oikos 81: 359-367.
Virtanen, R., Henttonen, H. & Laine, K. (1997). Lemming grazing and structure of a snowbed plant community: A long-term experiment at Kilpisjarvi, NW Finnish Lapland. Oikos 79: 155-166.
Vitousek, P.M., D’Antonio, C.M., Loope, L.L., Rejmanek, M. & Westbrooks, R. (1997). Introduced species: A significant component of human-induced global change. New Zealand Journal of Ecology 21: 1-16.
von Richter, W. (1966). Investigations on the inherent behavior of the Malayan tapir (Tapirus indicus) and of the South American tapir (Tapirus terrestris). Zoo Beitrage 12: 157-159.
Vos, C.C., Verboom, J., Opdam, P.F.M. & Ter Braak, C.J.F. (2001). Toward ecologically scaled landscape indices. American Naturalist 157: 24-41.
Wallace, R., Ayala, G.M.C. & Gómez, H. (2002). Lowland tapir activity patterns and capture frequencies in lowland moist tropical forest. Tapir Conservation: The Newsletter of the IUCN/SSC Tapir Specialist Group (TSG) 11:14.
Wang, M. & Grimm, V. (2007). Home range dynamics and population regulation: An individual-based model of the common shrew Sorex ayaneus. Ecological Modelling 205: 397-409.
Westley, F.W., & Miller, P.S. (2003). Experiments in consilience: Integrating social and scientific responses to save endangered species. Island Press, Washington DC, USA.
White, G.C. (2000). Population viability analysis: Data requirements and essential analyses. In: L. Boitani & T.K. Fuller (Eds). Research Techniques in Animal Ecology: Controversies and Consequences. pp. 288-331. Columbia University Press, New York, USA.
White, G.C., Bartmann, R.M., Carpenter, L.H. & Garrott, R.A. (1989). Evaluation of aerial line transects for estimating mule deer densities. Journal of Wildlife Management 53: 625-635.
White, G.C. & Garrot, R.A. (1990). Analysis of wildlife radio-tracking data. In: J.H. Zar (Ed). Biostatistical Analysis. Prentice Hall, New Jersey, USA.
Whitmore, T.C. & Prance, G.T. (1987). Biogeography and quaternary history in tropical America. Oxford Monographs of Biogeography 3. Clarendon Press, Oxford, UK.
Wiegand, T., Moloney, K., Naves, J. & Knauer, F. (1999). Finding the missing link between landscape structure and population dynamics: A spatially explicit perspective. American Naturalist 154: 605-627.
Wiens, J.A. (1989). Spatial scaling in ecology. Functional Ecology 3: 385-397.
269
Wiens, J.A. (1996). Wildlife in patchy environments: Metapopulations, mosaics, and management. In: D.R. McCullough (Ed). Metapopulations and Wildlife Conservation. pp. 53-84. Island Press, Washington DC, USA.
Wilcove, D.S., McLellen, C.H. & Dobson, A.P. (1986). Habitat fragmentation in the temperate zone. In: M.E. Soulé (Ed). Conservation Biology: The Science of Scarcity and Diversity. pp. 237-256. Sinauer Associates Inc. Sunderland, Massachusetts, USA.
Wilcox, B.A. & Murphy, D.D. (1985). Conservation strategy: The effects of fragmentation on extinction. American Naturalist 125: 879-887.
Williams, K.D. (1978). Aspects of the ecology and behavior of the Malayan tapir in the national park of West Malaysia. M.Sc. Dissertation. Michigan State University, East Lansing, MI, USA.
Williams, K.D. (1979). Radio-tracking tapirs in the rain forest of West Malaysia. Malayan Nature Journal 32: 253-258.
Williams, K.D. (1980). Browse use, feeding behaviour, and management of the Asian tapir. Journal of Wildife Management 44: 489-494.
Williams, K.D. (1984). The central american tapir (Tapirus bairdii) in northwestern Costa Rica. Ph.D. Dissertation. Michigan State University, East Lansing, MI, USA.
Williams, K.D. & Pétrides, G.A. (1980). Browse use, feeding behavior, and management of the Malayan tapir. Journal of Wildlife Management 44(2): 489-494.
Wilson, K.R. & Anderson, D.R. (1985). Evaluation of two density estimators of small mammal population size. Journal of Mammalogy 66: 13-21.
Wilson, D.E., Cole, F.R., Nichols, J.D., Rudran, R. & Foster, M.S. (1996). Measuring and monitoring biological diversity: Standard methods for mammals. Smithsonian Institution Press, Washington DC, USA.
Wirsing, A.J., Steury, T.D. & Murray, D.L. (2002). A demographic analysis of a southern snowshoe hare population in a fragmented habitat: Evaluating the refugium model. Canadian Journal of Zoology 80: 169-177.
Wisdom, M.J. & Mills, L.S. (1997). Sensitivity analysis to guide population recovery: Prairie chickens as an example. Journal of Wildlife Management 61: 302-312.
Woodroffe, R. & Ginsberg, J. (2000). Ranging behaviour and vulnerability to extinction in carnivores. In: L. Morris Gosling & W.J. Sutherland (Eds). Behaviour and Conservation. pp. 125-140. Cambridge University Press, New York, USA.
Wright, S.J. & Duber, H.C. (2001). Poachers and forest fragmentation alter seed dispersal, seed survival, and seedling recruitment in the palm Attalea butyraceae, with implications for tropical tree diversity. Biotropica 33: 421-434.
Wright, S.J., Carrasco, C., Calderon, O. & Paton, D.S. (1999). The El Nino southern oscillation, variable fruit production, and famine in a tropical forest. Ecology 80: 1632-1647.
Wronski, T. (2005). Home-range overlap and spatial organization as indicators for territoriality among male bushbuck (Tragelaphus scriptus). Journal of Zoology, London 226: 227-235.
Young, A., & Mitchell, N. (1994). Microclimate and vegetation edge effects in a fragmented podocarp-broadleaf forest in New Zealand. Biological Conservation 67: 63-72.
Young, W.A. (1961). Rearing of an American Tapir (Tapirus terrestris). International Zoo Yearbook 3: 14-15.
Zielinski, W.J. & Stauffer, H.B. (1996). Monitoring martes populations in California: Survey design and power analysis. Ecological Applications 6: 1254-1267.
Zimmerman, B., Peres, C.A., Malcolm, J.R. & Turner, T. (2001). Conservation and development alliances with the Kayapó of south-eastern Amazonia, a tropical forest indigenous people. Environmental Conservation 28(1): 10-22.
Zollner, P.A. (2000). Comparing the landscape level perceptual abilities of forest sciurids in fragmented agricultural landscapes. Landscape Ecology 15: 523-533.

270
Appendix I. Timeframe of different activities carried out during the long-term lowland tapir research study in Morro do Diabo State Park, São Paulo, Brazil, from 1996-2008, including field work, data analysis and fundraising activities.
Activity 1996 1997 1998 1999 2000 2001 2002 2003 2004 2005 2006 2007 2008
Initial tests of appropriate radio-transmitter attachments
Tapir captures for radio-tagging and collection of biological samples
Radio-telemetry monitoring of 19 radio-collared tapirs
Collection of faecal samples for genetics, epidemiology and diet studies
Tapir captures for epidemiological and genetics monitoring
Nocturnal line-transect sampling data collection
Data collection for the FIT reference library
Data collection for application of the FIT in the wild
Development of the lowland tapir baseline model for VORTEX
Data analysis
Fundraising and reporting

271
Appendix II. Complete information about 35 lowland tapirs (20 females and 15 males, or 27 adults, 6 sub-adults, and 2 juveniles) captured from June 1996 to July 2008 in four different sections of Morro do Diabo State Park, São Paulo, Brazil. Animal identification (ID), date of capture (dd.mm.yyyy), capture site (WB: West Border, SB: Southeast Border, NB: Northwest Border, CE: Centre, Figure 3.1), sex (F: female, M: male), age (A: adult, SA: sub-adult, J: juvenile), timeframe of monitoring (LT: long-term, ST: short-term, NM: not monitored, number of months), and general notes (predation, recapture, mortality, loss of collar) are shown.
Animal ID
Date of Capture
dd.mm.yyyy
Capture Site
Sex
Age Class
Monitoring
Period of Radio-Tracking (months)
Note 1
Note 2
Joana 24.06.1997 WB F A Radio-Collared - LT 36 Mortality record (Aug2000, natural causes)
Paulete 21.01.1998 WB F A Radio-Collared - LT 33 Recaptured in 25.03.2000
Docinho 21.01.1998 SB F A Radio-Collared - LT 22 Recaptured in 15.11.1999, 10.7.2000
Luizinho 14.07.1998 WB M SA Radio-Collared - ST 3 Mortality record (Oct1998, predated by puma)
Chu-Chu 23.07.1998 WB F SA Radio-Collared - LT 35
Batista 28.07.1998 CE M A Radio-Collared - NM Collar fell off right after the capture
Xuxa
(+calf) 31.07.1998 WB F A Radio-Collared - ST 3 Collar stopped working 3 months after the capture
Gringo 11.12.1998 SB M A Radio-Collared - NM Collar fell off right after the capture
Marinho 05.07.2000 WB M SA Radio-Collared - NM Collar fell off right after the capture
Mikilique 10.07.2000 SB M A Radio-Collared - NM Collar fell off right after the capture
João 11.07.2000 WB M SA Radio-Collared - ST 2 Mortality record (Sep2000, predated by jaguar)
Patrícia 17.07.2000 WB F SA Radio-Collared - LT 30 Recaptured in 23.07.2008

272
Sem Nome 14.01.2001 SB M A Radio-Collared - NM Collar fell off right after the capture
James Bond 17.01.2001 SB M A Radio-Collared - LT 29 Georgete
(+calf) 18.01.2001 SB F A Radio-Collared - LT 25 Recaptured in 10.11.2003
Dedinho 16.01.2002 NB M A Radio-Collared - ST 2 Collar fell off 2 months after the capture
Esperta 20.01.2002 NB F A Radio-Collared - LT 22 Mortality record (Nov2003, predated by jaguar)
Baby 10.04.2003 CE F A Radio-Collared - ST 4 Collar fell off 4 months after the capture
Cicinho 01.06.2003 CE M A Radio-Collared - NM Mortality record (25 days after capture, natural causes)
Chico 25.06.2003 CE M A Radio-Collared - LT 28 Recaptured in 22.07.2008
Júlia 01.07.2003 CE F A Radio-Collared - LT 12 Recaptured in 29.07.2004
Cidão 14.04.2004 CE M A Radio-Collared - LT 8
Tonha 19.04.2004 CE F A Radio-Collared - LT 33
Tina 27.04.2004 CE F A Radio-Collared - LT 27 Recaptured in 19.07.2006
Mama 19.05.2004 CE F A Radio-Collared - LT 18 Recaptured in 05.01.2007
Tunga 11.07.2006 CE F A Epidemiology/Genetic
Joares 13.07.2006 CE M A Epidemiology/Genetic
Diana 08.01.2007 CE F A Epidemiology/Genetic
Cris 12.01.2007 SB F A Epidemiology/Genetic
Gatinho 18.01.2007 CE M SA Epidemiology/Genetic
Branquinha 02.06.2007 CE F A Epidemiology/Genetic
Volverina 07.06.2007 CE F A Epidemiology/Genetic
Regininha 10.06.2007 CE F J Epidemiology/Genetic
Fêmea 08JL 20.07.2008 CE F A Epidemiology/Genetic
Robinho 20.07.2008 CE M J Epidemiology/Genetic

273
Appendix III. Timeframe of radio-tracking of 19 tapirs (13 females and 6 males, or 15 adults and 4 sub-adults) monitored in four sections of Morro do Diabo State Park, São Paulo, Brazil. Value in () is the total number of months of radio-tracking of each radio-collared tapir.
Year/ Month
West Border
Southeast Border
Northwest Border Centre
JOAn PAU LUI CHU XUX JOAo PAT DOC JAM GEO DED ESP BAB CHI JUL CID TON TIN MAM
1997 J 1 A 2 S 3 O 4 N 5 D 6
1998 J 7 F 8 1 1 M 9 2 2 A 10 3 3 M 11 4 4 J 12 5 5 J 13 6 1 6 A 14 7 2 1 1 7 S 15 8 (3) 2 2 8 O 16 9 3 (3) 9 N 17 10 4 10 D 18 11 5 11
1999 J 19 12 6 12 F 20 13 7 13 M 21 14 8 14 A 22 15 9 15 M 23 16 10 16 J 24 17 11 17 J 25 18 12 18 A 26 19 13 19 S 27 20 14 20 O 28 21 15 21 N 29 22 16 (22) D 30 23 17
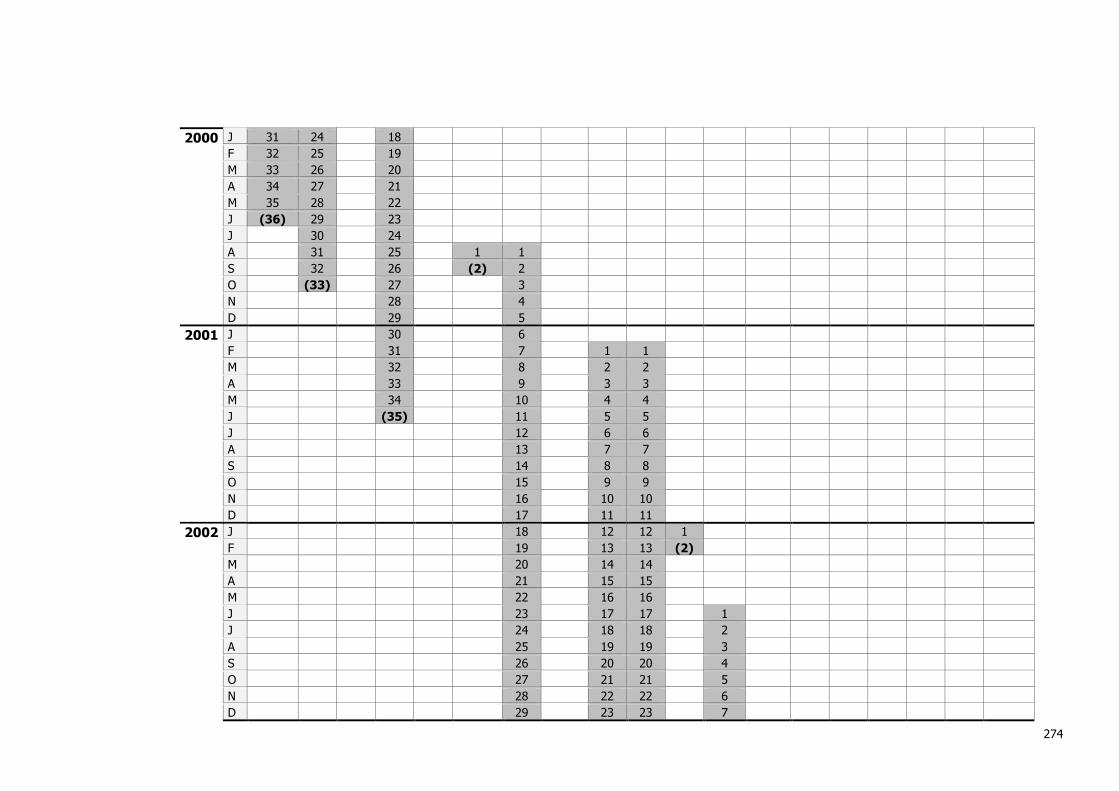
274
2000 J 31 24 18 F 32 25 19 M 33 26 20 A 34 27 21 M 35 28 22 J (36) 29 23 J 30 24 A 31 25 1 1 S 32 26 (2) 2 O (33) 27 3 N 28 4 D 29 5
2001 J 30 6 F 31 7 1 1 M 32 8 2 2 A 33 9 3 3 M 34 10 4 4 J (35) 11 5 5 J 12 6 6 A 13 7 7 S 14 8 8 O 15 9 9 N 16 10 10 D 17 11 11
2002 J 18 12 12 1 F 19 13 13 (2) M 20 14 14 A 21 15 15 M 22 16 16 J 23 17 17 1 J 24 18 18 2 A 25 19 19 3 S 26 20 20 4 O 27 21 21 5 N 28 22 22 6 D 29 23 23 7

275
2003 J (30) 24 24 8 F 25 (25) 9 M 26 10 A 27 11 1 M 28 12 2 J (29) 13 3 1 J 14 (4) 2 1 A 15 3 2 S 16 4 3 O 17 5 4 N 18 6 5 D 19 7 6
2004 J 20 8 7 F 21 9 8 M (22) 10 9 A 11 10 1 1 M 12 11 2 2 1 1 J 13 (12) 3 3 2 2 J 14 4 4 3 3 A 15 5 5 4 4 S 16 6 6 5 5 O 17 7 7 6 6 N 18 (8) 8 7 7 D 19 9 8 8
2005 J 20 10 9 9 F 21 11 10 10 M 22 12 11 11 A 23 13 12 12 M 24 14 13 13 J 25 15 14 14 J 26 16 15 15 A 27 17 16 16 S (28) 18 17 17 O 19 18 (18)
N 20 19
D 21 20

276
2006 J 22 21 F 23 22 M 24 23 A 25 24 M 26 25 J 27 26 J 28 (27) A 29 S 30 O 31 N 32 D (33)
Related Documents