Assessing the suitability of community-based management for the Nyungwe Forest Reserve, Rwanda Michel K. Masozera a , Janaki R.R. Alavalapati b, * , Susan K. Jacobson c , Ram K. Shrestha b a Wildlife Conservation Society, P.O. Box 1699, Kigali, Rwanda b School of Forest Resources and Conservation, Institute of Food and Agricultural Sciences, University of Florida, P.O. Box 110410, Gainesville, FL 32611-0410, USA c Department of Wildlife Ecology and Conservation, Institute of Food and Agricultural Sciences, University of Florida, P.O.Box 110430, Gainesville, FL 32611-0430, USA Received 4 March 2004; received in revised form 2 August 2004; accepted 20 August 2004 Abstract This study assesses the perceptions of representatives from three stakeholder groups—local communities, a government agency, and an environmental organization—towards the suitability of community-based management (CBM) approach to the Nyungwe Forest Reserve (NFR), Rwanda. A strengths, weaknesses, opportunities, and threats (SWOT) technique in combination with an analytic hierarchy process (AHP) was used to achieve the task. Results show that representatives of local communities perceive positive aspects of CBM outweigh its negative aspects. However, representatives of a government agency and a nongovernmental organization anticipate that weaknesses associated with CBM approach outweigh its strengths. Our analyses show that stakeholder groups view CBM differently, suggesting a need for better understanding about this approach. Implementation of CBM in small scales first along with outreach activities might bring stakeholders together and will ensure conservation and rural community stability. D 2004 Elsevier B.V. All rights reserved. Keywords: Biodiversity conservation; Community-based management; Community development; Protected area; Rwanda; Nyungwe Forest; SWOT-AHP 1. Introduction The continuous loss of biodiversity in tropical forests has led to the creation of protected areas in many developing countries. However, conventional management strategies such as dfences and fines 1389-9341/$ - see front matter D 2004 Elsevier B.V. All rights reserved. doi:10.1016/j.forpol.2004.08.001 * Corresponding author. Tel.: +1 352 846 0899; fax: +1 352 846 1277. E-mail address: [email protected] (J.R.R. Alavalapati). Forest Policy and Economics 8 (2006) 206 – 216 www.elsevier.com/locate/forpol

Welcome message from author
This document is posted to help you gain knowledge. Please leave a comment to let me know what you think about it! Share it to your friends and learn new things together.
Transcript
www.elsevier.com/locate/forpol
Forest Policy and Economic
Assessing the suitability of community-based management for the
Nyungwe Forest Reserve, Rwanda
Michel K. Masozeraa, Janaki R.R. Alavalapatib,*,
Susan K. Jacobsonc, Ram K. Shresthab
aWildlife Conservation Society, P.O. Box 1699, Kigali, RwandabSchool of Forest Resources and Conservation, Institute of Food and Agricultural Sciences, University of Florida,
P.O. Box 110410, Gainesville, FL 32611-0410, USAcDepartment of Wildlife Ecology and Conservation, Institute of Food and Agricultural Sciences, University of Florida,
P.O.Box 110430, Gainesville, FL 32611-0430, USA
Received 4 March 2004; received in revised form 2 August 2004; accepted 20 August 2004
Abstract
This study assesses the perceptions of representatives from three stakeholder groups—local communities, a government
agency, and an environmental organization—towards the suitability of community-based management (CBM) approach to the
Nyungwe Forest Reserve (NFR), Rwanda. A strengths, weaknesses, opportunities, and threats (SWOT) technique in
combination with an analytic hierarchy process (AHP) was used to achieve the task. Results show that representatives of local
communities perceive positive aspects of CBM outweigh its negative aspects. However, representatives of a government agency
and a nongovernmental organization anticipate that weaknesses associated with CBM approach outweigh its strengths. Our
analyses show that stakeholder groups view CBM differently, suggesting a need for better understanding about this approach.
Implementation of CBM in small scales first along with outreach activities might bring stakeholders together and will ensure
conservation and rural community stability.
D 2004 Elsevier B.V. All rights reserved.
Keywords: Biodiversity conservation; Community-based management; Community development; Protected area; Rwanda; Nyungwe Forest;
SWOT-AHP
1389-9341/$ - see front matter D 2004 Elsevier B.V. All rights reserved
doi:10.1016/j.forpol.2004.08.001
* Corresponding author. Tel.: +1 352 846 0899; fax: +1 352 846
1277.
E-mail address: [email protected] (J.R.R. Alavalapati).
1. Introduction
The continuous loss of biodiversity in tropical
forests has led to the creation of protected areas in
many developing countries. However, conventional
management strategies such as dfences and fines
s 8 (2006) 206–216
.
M.K. Masozera et al. / Forest Policy and Economics 8 (2006) 206–216 207
approachT that prohibit local access to protected areas
have escalated conflicts between local communities
and management authorities in the tropics (Wells et
al., 1992). These conflicts are more pronounced in
places where communities are heavily dependent on
protected areas for their subsistence needs. Commun-
ity-based management (CBM), which explicitly rec-
ognizes the basic needs of local people in and around
the protected areas, is thought to alleviate the conflicts
related to biodiversity conservation (Western and
Wright, 1994; Gibson and Marks, 1995).1 Following
Uphoff (1998), we consider CBM as a way of
engaging local people in resource management by
incorporating their ideas, experiences, values, and
capabilities and sharing the benefits of management.
This approach is expected to increase local access to
protected areas, sense of ownership among locals, and
income to local communities through benefit sharing
arrangement. Although factors such as the lack of
resources for law enforcement, growing support for
decentralized decision making, and increased recog-
nition to customary rights of local communities are
providing impetus for CBM (Lewis and Carter, 1993;
Gibson and Marks, 1995; Murombedzi, 1998; Salaf-
sky and Wollenberg, 2000), there is skepticism among
resource managers about its potential in achieving
conservation goals (Wells et al., 1992; Barrett and
Arcese, 1995; Gibson and Marks, 1995; Hackel,
1998; Kellert et al., 2000; Songorwa et al., 2000).
Involving stakeholders in planning and manage-
ment is a necessary condition for sustainable con-
servation of protected areas. However, factors such as
the nature of resource under consideration, socio-
economic and cultural milieu of the area, opportuni-
ties to generate employment and economic activities,
community capacity to undertake management
responsibilities, and policy and institutional uncer-
tainties would influence stakeholders’ perceptions
about CBM and their involvement. If the resource
under consideration is sensitive and likely to be
threatened and if local communities have limited
skills and experience to deal with resource conserva-
tion, for example, government agencies in-charge of
1 In the literature, CBM is also referred to community-based
natural resource management (CBNRM), community wildlife/range
management (CWM), and integrated conservation and developmen
programs (ICDP).
t
that protected area would be hesitant to engage in
CBM. Furthermore, environmental agencies may not
embrace CBM if they perceive that the resource under
consideration will become endangered or extinct due
to shortcomings associated with CBM implementa-
tion. Therefore, identification and assessment of
factors influencing stakeholders’ perceptions about
the suitability of CBM are critical before it is
implemented.
This study assesses the potential of CBM approach
to the Nyungwe Forest Reserve (NFR), Rwanda as
perceived by representatives of three stakeholder
groups—local communities, a government agency,
and an environmental organization. We apply
strengths, weaknesses, opportunities, and threats
(SWOT) in combination with analytic hierarchy
process (AHP) to achieve this task. While SWOT
analysis uses a diagnostic approach to identify key
factors determining the success or failure of an
approach or a plan (Weihrich, 1982; Kotler, 1994;
Smith, 1999), AHP measures the relative importance
of factors from stakeholders’ view (Saaty, 1977, 1982,
1993; Zahedi, 1986; Wind, 1987). These approaches
have been widely used to assess factors influencing
forest management planning (Mendoza and Sprouse,
1989; Kuusipalo and Kangas, 1994; Kurttila et al.
(2000) and Ananda and Herath, 2003), biodiversity
protection (Kangas and Kuusipalo, 1993), manage-
ment of national parks (Peterson et al., 1994;
Schmoldt et al., 1994), and buffer zone management
of a nature reserve (Li et al., 1999).
2. SWOT-AHP method
SWOT is a convenient way of conducting a
situation analysis or a diagnostic analysis of factors
influencing a particular decision. In conventional
SWOT analysis, the magnitude of factors is not
quantified to determine the effect of each factor on
the proposed plan or strategy. One can overcome this
problem by using the AHP method, which assigns
relative priority to each factor through pair-wise
comparison (Zahedi, 1986; Wind, 1987; Saaty,
1993). Furthermore, this analysis can be conducted
even with a small sample of individuals or groups
who are knowledgeable with the issue under inves-
tigation (see Kurttila et al., 2000; Ananda and Herath,
able 1
WOT factors relating to CBC approach
trengths
1: Additional source of income
– Income generation
– Employment opportunities
2: Management benefits
– Reduction of management cost
3: Favorable institutional setup
– Existing decentralization process helps succeed CBNRM
– Existing government policies and CBNRM are similar
eaknesses
1: Limited income generation
– Lack of uniformity in forestry activities
– Insufficient income from forest products
– Widespread poverty in communities
– Limited access to markets
2: Limited awareness about conservation and development
activities
– Low-level perception about conservation
– Limited skills in conservation and development
3: Unfavorable traditions pose challenges
4: Limited control by governmental control of on community
actions
– Weak control from government agencies
pportunities
1: Better community–agency relationship
– Relations between communities and agencies would improve
– Profit sharing
2: Reduction of poverty
– Socioeconomic improvement of communities
– Promotes equality in distribution of income
3: Improved community awareness
– Increasing understanding of the importance of forest
4: Additional future benefits
– Rural–urban exodus might drop
– CBNRM may lead to overall buffer zone management by
communities
– Leads to sustainable forests
– Improvement in forest protection
hreats
1: Biodiversity loss
– Wildlife and habitats may suffer
– Potential negative impacts of tourism
2: Potential collapse of CBNRM
– Potential conflicts within and between communities
– Communities may go out of control
3: Uncertainty associated with high-level decisions
– Limited influence of communities/agencies in high-level
decision-making
– Limited influence of field staff over high-level decisions
M.K. Masozera et al. / Forest Policy and Economics 8 (2006) 206–216208
T
S
S
S
S
S
W
W
W
W
W
O
O
O
O
O
T
T
T
T
2003). As such, it is a decision analysis method that is
different from statistical analyses, wherein large
samples are required to derive confidence intervals
around the means.
Following Kurttila et al. (2000), we explain
SWOT-AHP analysis in three steps. The first step is
to identify possible SWOT factors relating to the
proposed strategy or decision (see Table 1 for the list
of factors relating to CBM). It is often suggested to
include less than 10 factors within each SWOT group
so that the number of pair-wise comparisons is
manageable. Human cognitive limitations are taken
into account in constructing the AHP model, con-
ducting pair-wise comparisons, and including the
number of factors (Saaty, 1977). Pair-wise comparison
of factors within each SWOT group is the second step
(Fig. 1 indicates a portion of the questionnaire used
for pair-wise comparison). Pair-wise comparisons will
be conducted separately for all factors and a priority
value for each factor is computed using the eigenvalue
method (see Appendix A for details). The factor with
the highest priority value under each SWOT group
will be brought forward for further comparisons. The
third step involves pair-wise comparison of four
factors that are brought forward and computation of
a scaling factor for each factor. Scaling factors and
priority values are used to calculate the overall priority
of each factor as shown below:
Overall priority of factorij
¼ priority value of ij
�scaling factor of groupj
���
where j =4 (strength, weakness, opportunity, and
threat). The overall priority scores of all factors across
groups sum to one and each score indicates the
relative importance of each factor in decision.
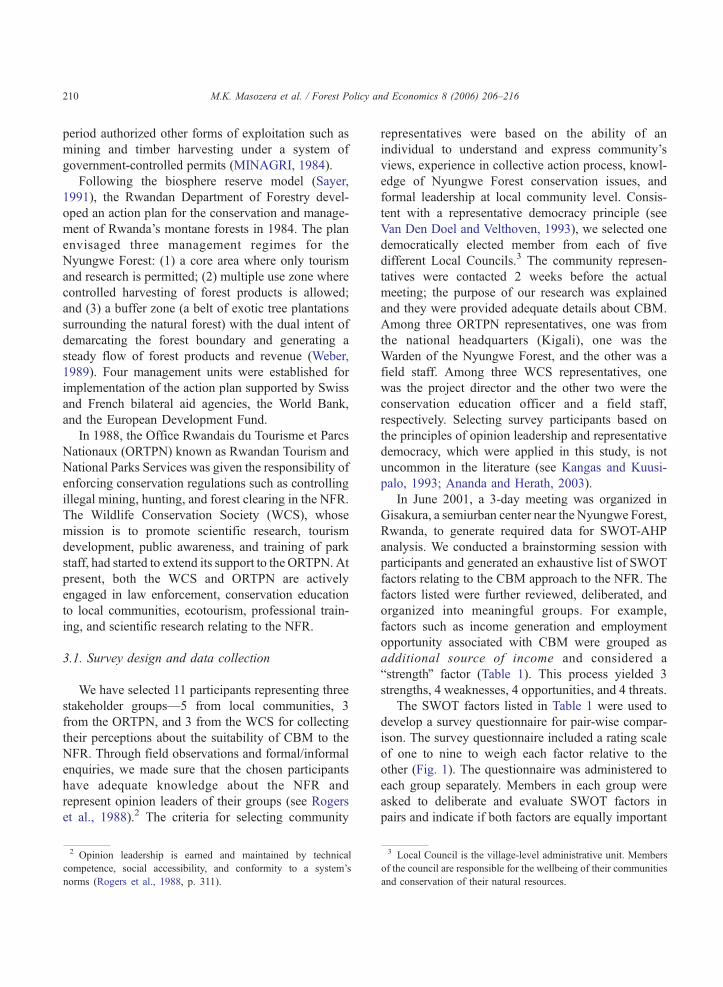
3. Description of the study site
The Nyungwe Forest Reserve (NFR), located in
the Southwest part of Rwanda (Fig. 2), covers 970
km2 of mountainous terrain. It is one of the largest
tracts of forest remaining in the Albertine Rift
Highlands of east-central Africa. The NFR contains
more than 275 bird species, of which 25 are endemic
to the Albertine Rift Highlands. Thirteen primate
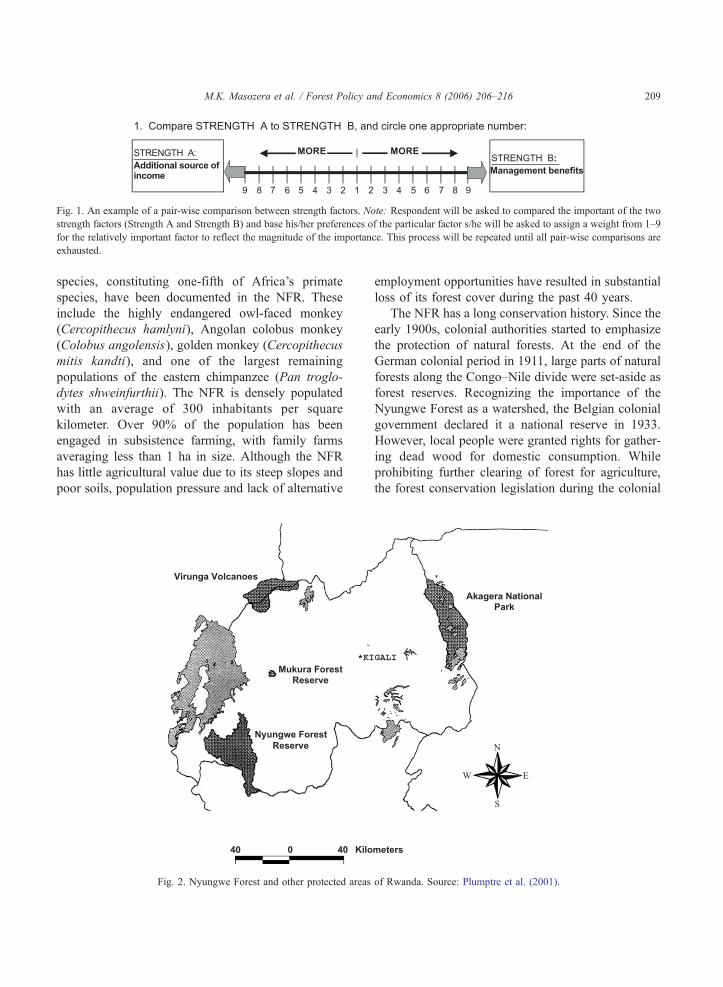
Fig. 1. An example of a pair-wise comparison between strength factors. Note: Respondent will be asked to compared the important of the two
strength factors (Strength A and Strength B) and base his/her preferences of the particular factor s/he will be asked to assign a weight from 1–9
for the relatively important factor to reflect the magnitude of the importance. This process will be repeated until all pair-wise comparisons are
exhausted.
M.K. Masozera et al. / Forest Policy and Economics 8 (2006) 206–216 209
species, constituting one-fifth of Africa’s primate
species, have been documented in the NFR. These
include the highly endangered owl-faced monkey
(Cercopithecus hamlyni), Angolan colobus monkey
(Colobus angolensis), golden monkey (Cercopithecus
mitis kandti), and one of the largest remaining
populations of the eastern chimpanzee (Pan troglo-
dytes shweinfurthii). The NFR is densely populated
with an average of 300 inhabitants per square
kilometer. Over 90% of the population has been
engaged in subsistence farming, with family farms
averaging less than 1 ha in size. Although the NFR
has little agricultural value due to its steep slopes and
poor soils, population pressure and lack of alternative
Fig. 2. Nyungwe Forest and other protected areas
employment opportunities have resulted in substantial
loss of its forest cover during the past 40 years.
The NFR has a long conservation history. Since the
early 1900s, colonial authorities started to emphasize
the protection of natural forests. At the end of the
German colonial period in 1911, large parts of natural
forests along the Congo–Nile divide were set-aside as
forest reserves. Recognizing the importance of the
Nyungwe Forest as a watershed, the Belgian colonial
government declared it a national reserve in 1933.
However, local people were granted rights for gather-
ing dead wood for domestic consumption. While
prohibiting further clearing of forest for agriculture,
the forest conservation legislation during the colonial
of Rwanda. Source: Plumptre et al. (2001).
M.K. Masozera et al. / Forest Policy and Economics 8 (2006) 206–216210
period authorized other forms of exploitation such as
mining and timber harvesting under a system of
government-controlled permits (MINAGRI, 1984).
Following the biosphere reserve model (Sayer,
1991), the Rwandan Department of Forestry devel-
oped an action plan for the conservation and manage-
ment of Rwanda’s montane forests in 1984. The plan
envisaged three management regimes for the
Nyungwe Forest: (1) a core area where only tourism
and research is permitted; (2) multiple use zone where
controlled harvesting of forest products is allowed;
and (3) a buffer zone (a belt of exotic tree plantations
surrounding the natural forest) with the dual intent of
demarcating the forest boundary and generating a
steady flow of forest products and revenue (Weber,
1989). Four management units were established for
implementation of the action plan supported by Swiss
and French bilateral aid agencies, the World Bank,
and the European Development Fund.
In 1988, the Office Rwandais du Tourisme et Parcs
Nationaux (ORTPN) known as Rwandan Tourism and
National Parks Services was given the responsibility of
enforcing conservation regulations such as controlling
illegal mining, hunting, and forest clearing in the NFR.
The Wildlife Conservation Society (WCS), whose
mission is to promote scientific research, tourism
development, public awareness, and training of park
staff, had started to extend its support to the ORTPN. At
present, both the WCS and ORTPN are actively
engaged in law enforcement, conservation education
to local communities, ecotourism, professional train-
ing, and scientific research relating to the NFR.
3.1. Survey design and data collection
We have selected 11 participants representing three
stakeholder groups—5 from local communities, 3
from the ORTPN, and 3 from the WCS for collecting
their perceptions about the suitability of CBM to the
NFR. Through field observations and formal/informal
enquiries, we made sure that the chosen participants
have adequate knowledge about the NFR and
represent opinion leaders of their groups (see Rogers
et al., 1988).2 The criteria for selecting community
3 Local Council is the village-level administrative unit. Members
f the council are responsible for the wellbeing of their communities
nd conservation of their natural resources.
2 Opinion leadership is earned and maintained by technical
ompetence, social accessibility, and conformity to a system’s
orms (Rogers et al., 1988, p. 311).
c
n
representatives were based on the ability of an
individual to understand and express community’s
views, experience in collective action process, knowl-
edge of Nyungwe Forest conservation issues, and
formal leadership at local community level. Consis-
tent with a representative democracy principle (see
Van Den Doel and Velthoven, 1993), we selected one
democratically elected member from each of five
different Local Councils.3 The community represen-
tatives were contacted 2 weeks before the actual
meeting; the purpose of our research was explained
and they were provided adequate details about CBM.
Among three ORTPN representatives, one was from
the national headquarters (Kigali), one was the
Warden of the Nyungwe Forest, and the other was a
field staff. Among three WCS representatives, one
was the project director and the other two were the
conservation education officer and a field staff,
respectively. Selecting survey participants based on
the principles of opinion leadership and representative
democracy, which were applied in this study, is not
uncommon in the literature (see Kangas and Kuusi-
palo, 1993; Ananda and Herath, 2003).
In June 2001, a 3-day meeting was organized in
Gisakura, a semiurban center near the Nyungwe Forest,
Rwanda, to generate required data for SWOT-AHP
analysis. We conducted a brainstorming session with
participants and generated an exhaustive list of SWOT
factors relating to the CBM approach to the NFR. The
factors listed were further reviewed, deliberated, and
organized into meaningful groups. For example,
factors such as income generation and employment
opportunity associated with CBM were grouped as
additional source of income and considered a
bstrengthQ factor (Table 1). This process yielded 3
strengths, 4 weaknesses, 4 opportunities, and 4 threats.
The SWOT factors listed in Table 1 were used to
develop a survey questionnaire for pair-wise compar-
ison. The survey questionnaire included a rating scale
of one to nine to weigh each factor relative to the
other (Fig. 1). The questionnaire was administered to
each group separately. Members in each group were
asked to deliberate and evaluate SWOT factors in
pairs and indicate if both factors are equally important
o
a
M.K. Masozera et al. / Forest Policy and Economics 8 (2006) 206–216 211
or one is more important than the other. In Fig. 1, if
the response was b3Q on the right side, it implies that
badditional source of incomeQ factor is three times
more important than bmanagement benefitQ factor.
Members within groups were asked to deliberate and
come to a consensus in assigning relative weights.
Because it is not uncommon for members of an
agency or organization to have a unified position or
statement on a policy issue, we followed this bgroupconsensusQ approach. Following pair-wise compari-
sons, as explained earlier, overall priority scores were
calculated for each factor within each SWOT group.
Throughout our analysis, consistency ratios are
maintained below 0.1 and we used Expert Choice
computer software to analyze the pair-wise compar-
ison data (Expert Choice, 2001).
4. Results and discussion
The overall priority scores of factors for three
stakeholder groups are given in columns 5–7 of
Table 2. Because the overall priority scores add up to
one, each priority score can be interpreted as the
Table 2
SWOT factors and their priority and overall priority scores
SWOT groups Factors priority scores
Community ORTPN
Strengths
S1: Additional source of income 0.627 0.674
S2: Management benefits 0.094 0.226
S3: Favorable institutional setup 0.28 0.101
Weaknesses
W1: Limited income generation 0.096 0.096
W2: Limited awareness. . . 0.55 0.55
W3: Unfavorable traditions. . . 0.053 0.053
W4: Limited control by govt. . . . 0.301 0.301
Opportunities
O1: Better community relations 0.054 0.301
O2: Reduction of poverty 0.558 0.539
O3: Improved comm. awareness 0.289 0.104
O4: Additional future benefits 0.102 0.057
Threats
T1: Biodiversity loss 0.627 0.234
T2: Potential collapse of CBNRM 0.094 0.081
T3: Uncertainty associated. . . 0.28 0.685
Figures in bold are factors of each SWOT group.
weight of each factor on the proposed CBM. The
scores of strength and opportunity factors can be
interpreted as positives of CBM, while the scores of
weakness and threat factors as negatives. For
example, overall priority scores of 0.572 and 0.127
(column 5 of Table 2) suggest that strengths and
opportunities of CBM would account, respectively,
for about 57% and 13%. This result indicates that
representatives of communities perceive CBM as a
suitable strategy for the NFR. The overall priority
scores of other stakeholder groups can be interpreted
in the same way. The relative importance of each
factor within each SWOT group provides valuable
insights for decision-making. For example, a priority
value of 0.627 reported in the second column of
Table 2 indicates that community representatives
perceive that additional source of income (S1) alone
accounts for about 63% of the total strength of CBM.
The overall priority scores of each stakeholder
group are presented in Figs. 3–5 to provide more
intuitive explanation. The lines in the top two
quadrants indicate the weights of positive factors
(strengths and opportunities), while those in the
bottom two quadrants reflect the weights of negative
Overall priority scores
WCS Community ORTPN WCS
0.572 0.289 0.056
0.627 0.387 0.195 0.035
0.094 0.049 0.065 0.005
0.28 0.154 0.029 0.016
0.24 0.061 0.529
0.093 0.025 0.006 0.049
0.242 0.16 0.034 0.128
0.052 0.011 0.003 0.028
0.613 0.064 0.019 0.324
0.127 0.113 0.153
0.104 0.007 0.034 0.016
0.061 0.071 0.061 0.009
0.23 0.036 0.012 0.035
0.605 0.013 0.006 0.093
0.062 0.536 0.262
0.682 0.039 0.125 0.179
0.082 0.006 0.043 0.021
0.236 0.017 0.367 0.062
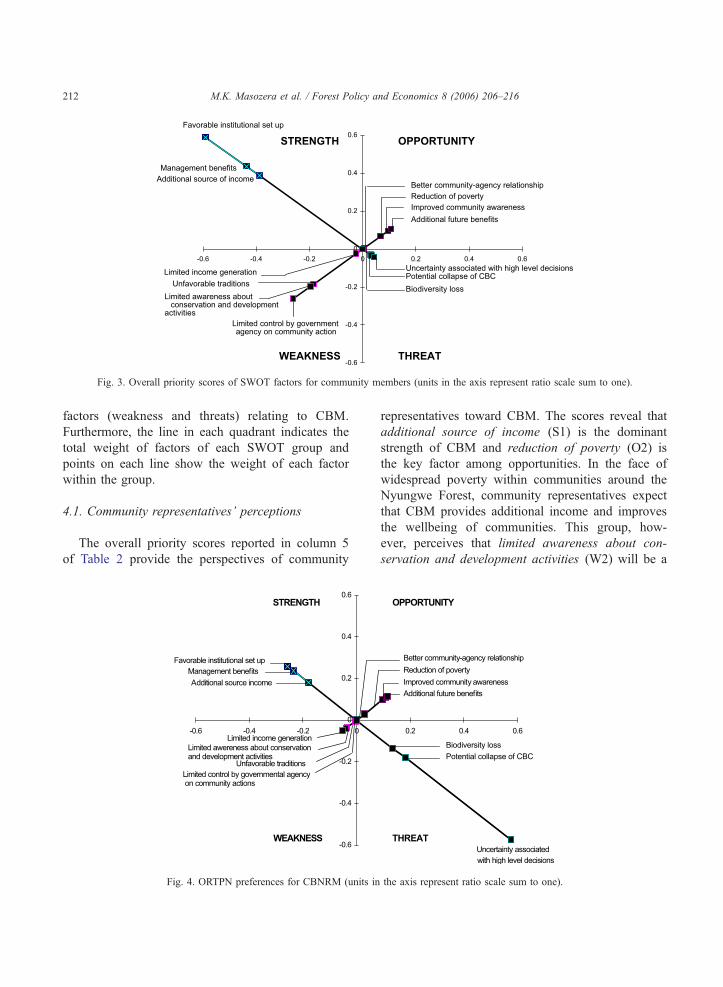
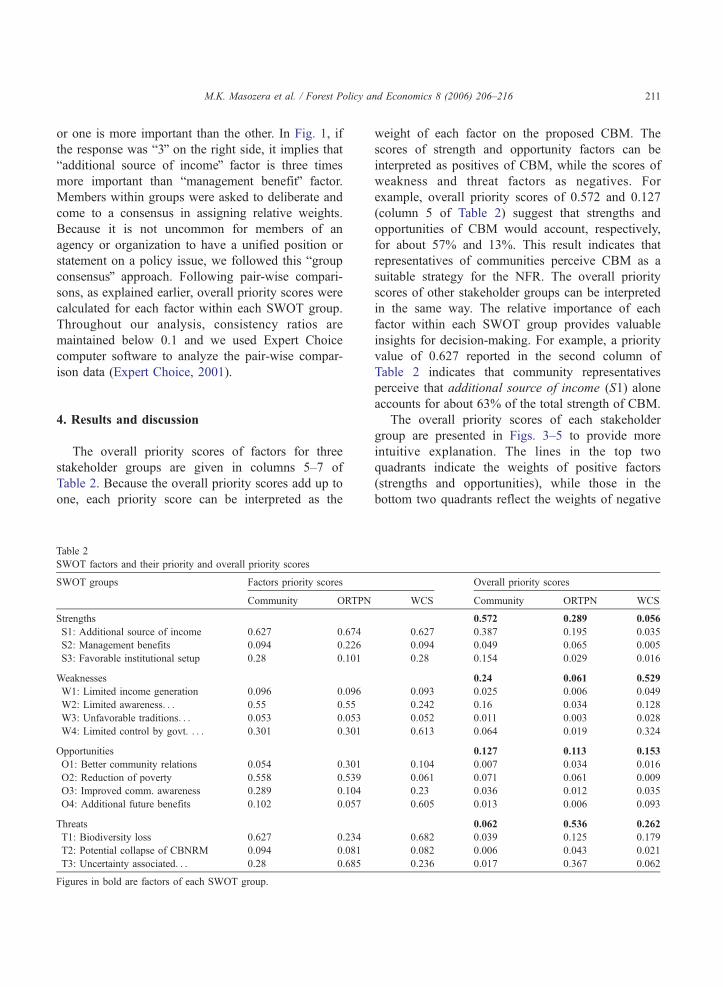
Fig. 3. Overall priority scores of SWOT factors for community members (units in the axis represent ratio scale sum to one).
M.K. Masozera et al. / Forest Policy and Economics 8 (2006) 206–216212
factors (weakness and threats) relating to CBM.
Furthermore, the line in each quadrant indicates the
total weight of factors of each SWOT group and
points on each line show the weight of each factor
within the group.
4.1. Community representatives’ perceptions
The overall priority scores reported in column 5
of Table 2 provide the perspectives of community
Fig. 4. ORTPN preferences for CBNRM (units in
representatives toward CBM. The scores reveal that
additional source of income (S1) is the dominant
strength of CBM and reduction of poverty (O2) is
the key factor among opportunities. In the face of
widespread poverty within communities around the
Nyungwe Forest, community representatives expect
that CBM provides additional income and improves
the wellbeing of communities. This group, how-
ever, perceives that limited awareness about con-
servation and development activities (W2) will be a
the axis represent ratio scale sum to one).
4 Frequent changes of government structures create uncertainty in
any conservation outcome. The local government agencies and
communities in Rwanda have limited influence in decision-making
processes because of the existing top-down power structure, where
local politics have dominant influence in decision-making. The
ORTPN members strongly feel that if future institutional changes
impact the shared governance of the NFR, the filed staff will have
tough time to face local communities. Limited trust and tainted
relationships between communities and the implementing agency
would hinder the success of the CBC. The ORTPN members’
perceptions are consistent with observations of Fiallo and Jacobson
(1995) that poor relations between community members and the
park staffs in Ecuador were largely due to the top-down manage-
ment structure.
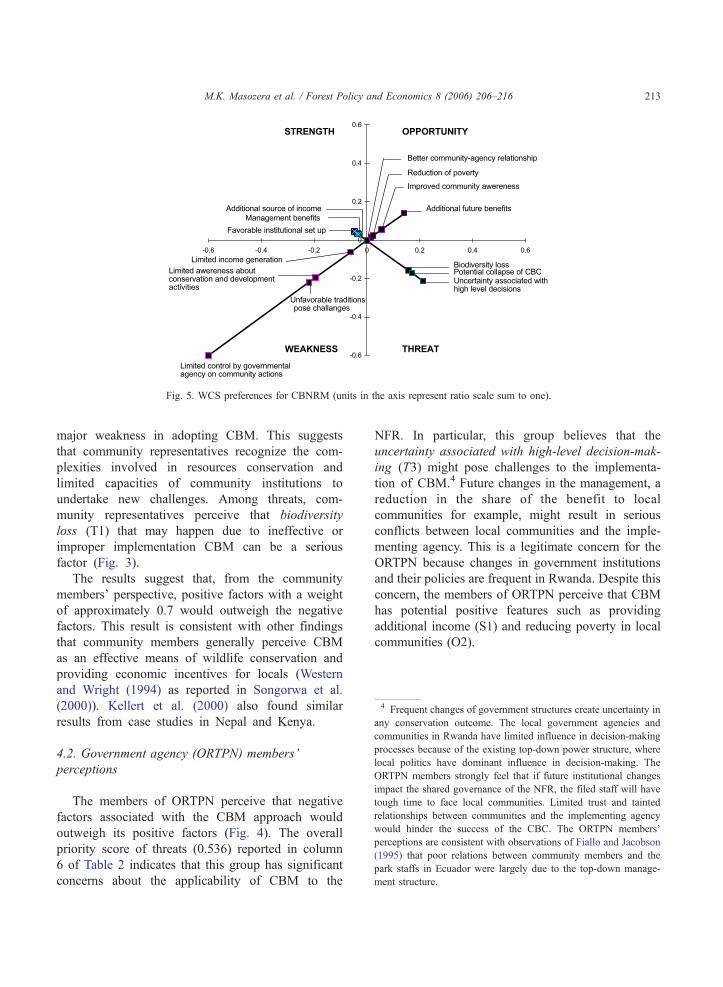
Fig. 5. WCS preferences for CBNRM (units in the axis represent ratio scale sum to one).
M.K. Masozera et al. / Forest Policy and Economics 8 (2006) 206–216 213
major weakness in adopting CBM. This suggests
that community representatives recognize the com-
plexities involved in resources conservation and
limited capacities of community institutions to
undertake new challenges. Among threats, com-
munity representatives perceive that biodiversity
loss (T1) that may happen due to ineffective or
improper implementation CBM can be a serious
factor (Fig. 3).
The results suggest that, from the community
members’ perspective, positive factors with a weight
of approximately 0.7 would outweigh the negative
factors. This result is consistent with other findings
that community members generally perceive CBM
as an effective means of wildlife conservation and
providing economic incentives for locals (Western
and Wright (1994) as reported in Songorwa et al.
(2000)). Kellert et al. (2000) also found similar
results from case studies in Nepal and Kenya.
4.2. Government agency (ORTPN) members’
perceptions
The members of ORTPN perceive that negative
factors associated with the CBM approach would
outweigh its positive factors (Fig. 4). The overall
priority score of threats (0.536) reported in column
6 of Table 2 indicates that this group has significant
concerns about the applicability of CBM to the
NFR. In particular, this group believes that the
uncertainty associated with high-level decision-mak-
ing (T3) might pose challenges to the implementa-
tion of CBM.4 Future changes in the management, a
reduction in the share of the benefit to local
communities for example, might result in serious
conflicts between local communities and the imple-
menting agency. This is a legitimate concern for the
ORTPN because changes in government institutions
and their policies are frequent in Rwanda. Despite this
concern, the members of ORTPN perceive that CBM
has potential positive features such as providing
additional income (S1) and reducing poverty in local
communities (O2).
M.K. Masozera et al. / Forest Policy and Economics 8 (2006) 206–216214
4.3. WCS members’ perceptions
The perceptions of WCS members are similar to
those of ORTPN (Fig. 5). They perceive that
negative factors associated with the CBM approach
are even more serious. The overall priority scores
of weaknesses and threats (0.529 and 0.262)
reported in column 7 of Table 2 indicate that the
negative factors as perceived by this group would
account for about 80%. In particular, this group
believes that the limited control of government
agency (W4) associated with CBM could be a
major problem. Members of WCS think that
decentralization of power to local communities
may weaken the conservation capabilities of the
government agency. Furthermore, this group also
perceives that community access to the NFR and
tourism activities that are likely to be permitted
under CBM might pose serious threats to the
unique biodiversity of NFR.
5. Conclusions
Conservation of the NFR is complex due to
diverse preferences of stakeholder groups. Finding a
management strategy that integrates community’s
preferences with those of other stakeholders is of
paramount importance. There is a growing recog-
nition that CBM approach has such a potential.
However, ground truthing of the potential of CBM
from the perspectives of various stakeholders is
critical for better understanding of the scope of this
approach. Our SWOT-AHP analysis demonstrates
that there is little consensus among local commun-
ities, ORTPN, and WCS about the suitability of
CBM approach to the NFR. By placing a greater
weight on additional income opportunities associ-
ated with CBM, community members perceive that
CBM is an appropriate approach for the NFR.
Members of ORTPN and WCS, on the other hand,
perceive that uncertainty associated with high-level
decisions and that limited control by governmental
agency on community actions poses significant
challenges to the success of CBM. This suggests
that it is important to address major weaknesses and
threats perceived by the ORTPN and the WCS
before embracing CBM.
As a first step, key concerns expressed by
stakeholder groups must be investigated further and
efforts must be made to address them on a priority
basis. For example, the uncertainty associated with
the government policies must be dealt with. This
would not only help resource managers to devise
long-term plans but also ensure community support
for CBM. Furthermore, outreach and awareness
programs relating to CBM and establishment of
monitoring and control mechanisms of community
actions would reduce the concerns raised by the
ORTPN and the WCS. Because the biodiversity in
the NFR is sensitive, one cannot afford to make
mistakes even in the process of learning about a new
management such as CBM. Therefore, a cautious
approach is desirable in that, CBM or programs
based on CBM principles can be tried in a small area
first. Drawing on the experience from such an effort,
changes can be made and the approach can be tried
at a larger scale.
Acknowledgement
Partial funding support from the Compton Foun-
dation and the Wildlife Conservation Society for this
study is greatly appreciated. Authors would like to
acknowledge the participation of the respondents in
this research. Florida Agricultural Experiment Station
Journal Series S-10448.
Appendix A
Information derived from pair-wise comparisons
can be represented as a reciprocal matrix of weights,
where the assigned relative weight enters into the
matrix as an element aij and reciprocal of the entry
1/aji goes to the opposite side of the main diagonal.
A ¼ aij� �
¼
w1=w1 w1=w2: : : w1=wn
w2=w1 w2=w2: : :
v v : : : vwn=w1 wn=w2
: : : wn=wn
3775:
2664 ð1Þ
where rows indicate ratios of weights of each factor
with respect to all others. In the matrix, when i= j,
aij =1, i.e., the main diagonal elements of matrix is A.
M.K. Masozera et al. / Forest Policy and Economics 8 (2006) 206–216 215
When we multiply matrix A by the transpose of the
vector of weights, w, we get the resulting vector nw
(Eq. (2)).
Aw ¼ nw; where w ¼ w1;w2; : : :; wnð ÞT: ð2Þ
Eq. (2) can be rewritten as
A� nIÞw ¼ 0ð ð3Þ
where n is the largest eigenfactor, kmax, or trace of
matrix A. Saaty (1977) demonstrated that kmax = n is a
necessary and sufficient condition for consistency.
Inconsistency may arise when kmax deviates from n
due to inconsistent responses in pair-wise compar-
isons. Therefore, the matrix A should be tested for
consistency using the formula
CI ¼ kmax � nÞ= n� 1ð Þ;ð ð4Þ
CR ¼ CI=RI; ð5Þ
where CI is the consistency index, RI is random index
(RI) generated for a random matrix of order n, and CR
is the consistency ratio (Saaty, 1993; Mawapanga and
Debertin, 1996). The general rule is that CRV 0.1
should be maintained for the matrix to be consistent.
Homogeneity of factors within each group, smaller
number of factors within each group, and better
understanding of the decision problem can improve
the consistency index (Saaty, 1993).
References
Ananda, J., Herath, G., 2003. The use of analytic hierarchy process
to incorporate stakeholder preferences into regional forest
planning. Forest Policy and Economics 5, 13–26.
Barrett, C.B., Arcese, P., 1995. Are integrated conservation
development projects (ICDPs) sustainable? On the conservation
of large mammals in Sub Saharan Africa. World Development
23, 1073–1084.
Expert Choice, 2001. Expert choice. Expert choice. http://www.
expertchoice.com/ (Verified 28 September 2001).
Fiallo, E.A., Jacobson, S.K., 1995. Local communities and
protected areas: Attitudes of rural residents towards conserva-
tion and Machalilla National Park, Ecuador. Environmental
Conservation 22, 241–249.
Gibson, C.C., Marks, S.A., 1995. Transforming rural hunters into
conservationists: an assessment of community based wildlife
management programs in Africa. World Development 23,
941–957.
Hackel, J.D., 1998. Community conservation and the future of
Africa’s wildlife. Conservation Biology 13, 726–734.
Kangas, J., Kuusipalo, J., 1993. A multi attribute preference model
for evaluating the reforestation alternatives of a forest stand.
Forest Ecology and Management 59, 271–288.
Kellert, S.R., Mehta, J.N., Ebbin, S.A., Lichtenfeld, L.L., 2000.
Community natural resource management: promise, rhetoric,
and reality. Society and Natural Resources 13, 705–715.
Kotler, P. (Ed.), Marketing Management: Analysis, Planning,
Implementation and Control, 8th ed. Printice Hall, Englewood
Cliffs, NJ.
Kurttila, M., Pesonen, M., Kangas, J., Kajanus, M., 2000. Utilizing
the analytic hierarchy process (AHP) in SWOT analysis—a
hybrid method and its application to a forest certification case.
Forest Policy and Economics 1, 41–52.
Kuusipalo, J., Kangas, J., 1994. Managing biodiversity in a forestry
environment. Conservation Biology 8, 450–460.
Lewis, D.M., Carter, N. (Eds.), 1993. Voice from Africa: Local
Perspectives on Conservation. WWF, Washington, DC.
Li, W., Wang, Z., Tang, H., 1999. Designing the buffer zone of a
nature reserve: a case study in Yancheng Biosphere Reserve,
China. Biological Conservation 90, 159–165.
Mawapanga, M.N., Debertin, D.L., 1996. Choosing between alter-
native farming systems: an application of the analytic hierarchy
process. Review of Agricultural Economics 18, 385–401.
Mendoza, G.A., Sprouse, W., 1989. Forest planning and decision
making under fuzzy environment: an overview and analysis.
Forest Science 35, 481–502.
MINAGRI, 1984. Plan d’action pour la conservation et l’amenage-
ment des forets naturelles de la crete Zaire-Nil. Direction
Generale des Forets, Kigali.
Murombedzi, J.C., 1998. The evolving context of community based
natural resource management in Sub-Saharan Africa in historical
perspective. A Paper Presented at International Workshop on
Community Based Natural Resource Management, held in
Washington, DC, 10–14 May, 1998.
Peterson, D.V., Silsbee, D., Schmoldt, D.L., 1994. A case study of
resource management with multiple objectives. Environmental
Management 18, 729–742.
Plumptre, A., Masozera, M., Vedder, A., 2001. Impact of Civil War
on the Conservation of Protected Areas in Rwanda. Biodiversity
Support Program, Washington, DC.
Rogers, E., Burdge, R.J., Korsching, P.F., Donnermeyer, J.F., 1988.
Social Change in Rural Communities: An Introduction to Rural
Sociology. Prentice Hall, Englewood Cliffs, NJ.
Saaty, T.L., 1977. A scaling method for priorities in hierarchical
structure. Journal of Mathematical Psychology 15, 234–281.
Saaty, T.L. (Ed.), 1982. Decision Making for Leaders: The
Analytical Hierarchy Process for Decisions in a Complex
World. Lifetime Learning Publications, Belmont, California.
Saaty, T.L., 1993. The analytic hierarchy process: a 1993 overview.
Central European Journal of Operation Research and Economics
2, 119–137.
Salafsky, N., Wollenberg, E., 2000. Linking livelihoods and
conservation: a conceptual framework and scale for assessing
the integration of human needs and biodiversity. World
Development 28, 1421–1438.
M.K. Masozera et al. / Forest Policy and Economics 8 (2006) 206–216216
Sayer, J., 1991. Rainforest Buffer Zones: Guidelines for Protected
Area Managers. IUCN, Gland, Switzerland.
Schmoldt, D.L., Peterson, D.V., Silsbee, D., 1994. Developing
inventory and monitoring programs based on multiples objec-
tives. Environmental Management 18, 707–727.
Smith, J.A., 1999. The behavior and performance of young micro
firms: evidence from businesses in Scotland. Small Business
Economics 13, 185–200.
Songorwa, A.N., Buhrs, T., Hughey, K.F.D., 2000. Community
based wildlife management in Africa: a critical assessment of
the literature. Natural Resources Journal 40, 603–643.
Uphoff, N., 1998. Community based natural resource management:
connecting micro and macro processes, and people with their
environments. A Paper Presented at International Workshop on
Community Based Natural Resource Management, held in
Washington, DC, 10–14 May, 1998.
Van Den Doel, H., Velthoven, B.V., 1993. Democracy and Welfare
Economics. Cambridge University Press, New York.
Weber, W., 1989. Conservation and Development on the Zaire-Nile
Divide. An Analysis of Value Conflicts and Convergence in the
Management of Afromontane Forests in Rwanda. University of
Wisconsin, Madison, PhD thesis.
Weihrich, H., 1982. The TWOS matrix—a tool for situation
analysis. Long Range Planning 15, 54–66.
Wells, M., Brandon, K., Hannah, L., 1992. People and Parks:
Linking Protected Areas Management with Local Communities.
World Bank/World Wildlife Fund/U.S. Agency for International
Development, Washington, DC.
Western, D., Wright, R.M. (Eds.), 1994. Natural Connections:
Perspectives in Community Based Conservation. Island Press,
Washington, D.C.
Wind, Y., 1987. An analytic hierarchy process based approach to the
design and evaluation of a marketing driven business and
corporate strategy. Mathematical Modeling 9, 285–290.
Zahedi, F., 1986. The analytic hierarchy process—a survey of the
method and its applications. Interfaces 16, 96–108.
Related Documents