ASSESSING THE ROLE OF COOPERATION MECHANISMS FOR ACHIEVING THE AUSTRIAN 2020 RENEWABLE ENERGY TARGET (Project ReFlex) WORKING PAPER OCTOBER 2012 Joanneum Research Andreas Türk, Daniel Steiner, Dorian Frieden, Franz Prettenthaler Vienna University of Technology, Energy Economics Group Gustav Resch, Andreas Müller, Lukas Liebmann University of Graz, Wegener Center Karl Steininger, Mark Sommer

Welcome message from author
This document is posted to help you gain knowledge. Please leave a comment to let me know what you think about it! Share it to your friends and learn new things together.
Transcript

ASSESSING THE ROLE OF COOPERATION MECHANISMS
FOR ACHIEVING THE AUSTRIAN 2020 RENEWABLE
ENERGY TARGET (Project ReFlex)
WORKING PAPER
OCTOBER 2012
Joanneum Research Andreas Türk, Daniel Steiner, Dorian Frieden, Franz Prettenthaler
Vienna University of Technology, Energy Economics Group
Gustav Resch, Andreas Müller, Lukas Liebmann
University of Graz, Wegener Center
Karl Steininger, Mark Sommer

This working paper is based on the results of the project “Assessing flexibility mechanisms
for achieving the Austrian 2020 renewable energy target” („ReFlex“) funded by the Austrian
Energy and Climate Fund (Klima-und Energiefonds).
Project Webpage:
http://www.joanneum.at/resources/reflex/
3
Executive Summary
The EU directive on the promotion of the use of energy from renewable sources (“RES
directive”; 2009/28/EC) includes the European target of a 20% renewable energy share (RES)
in gross final energy demand. It sets binding targets for all EU member states. The national
targets under the RES directive however have not been directly based on physical potentials
but on existing renewable energy production and GDP. This has led to an unequal gap
between national targets and (cost-efficient) potentials. The RES directive therefore allows
countries the use of “cooperation mechanisms” for reaching the national 2020 targets for
renewable energy in a cost efficient manner. Countries with relatively expensive RES
potentials can thereby meet their targets by purchasing RES shares from countries with
relatively cheap RES potentials. The cooperation mechanisms provided in the RES directive
are statistical transfer, joint projects, and joint support schemes. Statistical transfer is the
(virtual) transfer of RES shares from a country, which has an excess of RES shares, to a
receiving country. Within joint projects between member states (or with third countries) RES
shares are transferred from projects established in the selling country with financial support
from the receiving country. Finally, joint support schemes allow Member States to agree on a
joint policy framework to offer support for the expansion of renewable energy production.
While the European Commission as recently as in June 2012 in its communication on
renewable energy policy encouraged an increased use of the cooperation mechanisms, so far
there has been limited research on how to include them in a portfolio of measures to meet
national 2020 RES targets. This project aims to contribute to that debate: It offers a first
assessment of the use and impacts of the cooperation mechanisms for achieving the Austrian
34% RES-target by 2020. A comprehensive model-supported analysis has been conducted
that assesses the impacts of increasing domestic energy efficiency and renewable energy
measures and the potential for cooperation with other (EU) countries through the use of the
cooperation mechanisms. In addition to direct impacts related to RES deployment and energy
efficiency measures, macroeconomic and external effects were incorporated into the analysis.
By combining two levels of assumed final energy demand in 2020 with different levels of
assumed capacity extension of RES technologies in Austria, six key cases were defined that
lead to different shares of RES in relation to the gross final energy demand.
For all scenarios, the simulation model Green-X provided a cost-efficient track of RES capacity
extension per technology, the related costs and expenditures (i.e. capital, support) as well as
selected benefits (e.g. fossil-fuel and CO2 emission avoidance). The outcomes of Green-X as
well as costs for energy efficiency measures served as input to the macroeconomic modelling.
In addition external effects of different scenarios, such as reduced air pollution, were quantified
and incorporated into the overall assessment. Impacts were considered both in the short- (up
to 2020) and long-term (up to 2050). Complementary to the quantitative analysis, a qualitative
assessment of the different types of RES cooperation mechanisms was conducted. This
included an assessment of design options and implementation barriers as well as a
comparison of the RES cooperation mechanism to the use of the flexible Kyoto mechanisms
for reaching greenhouse gas emission reduction targets. Experiences with the flexible Kyoto
mechanisms, to which the RES cooperation mechanisms have parallels, have shown that the
high number of factors impacting the success of a mechanism makes it extremely difficult to
predict the mechanisms’ actual use. Anticipated supply-demand balances may provide an

4
indicator of future market dynamics but other factors, such as institutional or administrative
barriers, may significantly influence these in practice.
Based on the results, the report concludes that a domestic underachievement of Austria’s
2020 RES target and, consequently, a purchase of required RES volumes via cooperation
mechanisms, cannot be recommended from an economic viewpoint. To achieve the Austrian
34% RES-target by 2020 the results suggest a mix of a strong domestic energy efficiency
policy package, that reduces final energy demand by 150 PJ by 2020 and a few additional
incentives to increase RES deployment above targeted levels, such as increasing budgetary
caps for RES electricity or enhanced stipulation of RES in the heat sector. An
overachievement of Austria’s RES target (up to 36%) represents the most beneficial option,
among all assessed scenarios from an economic point of view if long-term domestic
macroeconomic and external effects are considered. It is assumed thereby that it is realized
with a moderate increase of current RES support (beyond just increasing current budgetary
caps, providing additional support for rather cost-efficient RES technology options in Austria)
and a strong energy efficiency policy package. Such an overachievement of the RES target
may also be an appropriate strategy for Austria to hedge against unforeseeable changes in the
economic framework (e.g. a higher economic and energy demand growth than projected may
reduce the share of RES) or implementation risks of planned RES or energy efficiency
measures. At the same time, an overachievement of the RES target would give Austria the
opportunity to sell RES volumes to other EU Member States by 2020 via statistical transfer.
This could also potentially be done in the years before 2020 whenever surpluses occur. In
addition to generating income from statistical transfer, Austria might also allow for renewable
energy investments by other countries in the framework of joint projects. This may improve the
point of departure for post-2020 targets by increasing Austria’s total renewable energy
production well in time. However in contrast to statistical transfers, joint projects represent a
long-term commitment to (virtually) export RES which should only be followed if Austria
remains to be well on track to fulfill its domestic target. At the same time, given that Austria
does not depend on the cooperation mechanisms in order to meet its target, joint support
schemes may not have sufficient benefits which would justify their potentially high transaction
costs, in particular for the short timeframe till 2020.
Apart from the focus on Austria, this project also considered the European perspective:
intensified cooperation between Member States in achieving their 2020 RES targets would
allow to reduce the cost burden on the EU level significantly: Annual European support
expenditures for RES-electricity for example can be decreased by several billion € in 2020. For
Austria such a European cost-minimization would imply an overachievement of its target. The
report therefore concludes that an overachievement of Austria’s RES target economically
makes sense from both an Austrian and a European perspective. Moreover, such a strategy
may serve as a safeguard against unpredictable changes and could lay the foundation for
future RES target achievements. Thus, a strategy aiming an overachievement of Austria’s
RES target would contribute to an economically attractive and future-oriented pathway for
Austria’s RES policy while facilitating RES cooperation across the European Union.

5
Table of Contents
1 Introduction ................................................................................................................... 10
2 Scenarios for the Austrian energy demand in 2020 ....................................................... 12
3 Scenarios for RES expansion in the EU with a focus on Austria ................................... 15
3.1 Scenario definition ................................................................................................. 15
3.1.1 The Austrian dimension ................................................................................... 15
3.1.2 The EU dimension ........................................................................................... 18
3.2 Methodology for the assessment- The Green-X model .......................................... 19
3.3 Green-X scenario results ....................................................................................... 21
3.3.1 RES deployment by 2020 – the Austrian dimension ........................................ 21
3.3.2 Indicators on costs and benefits for Austria ..................................................... 25
3.3.3 RES trading between 2011 and 2020 .............................................................. 29
3.3.4 Scenario results – the European dimension .................................................... 31
4 Macroeconomic Evaluation and External Effects .......................................................... 37
4.1 Macroeconomic Effects .......................................................................................... 37
4.1.1 The macroeconomic model ............................................................................. 38
4.1.2 Results of the macroeconomic modeling ......................................................... 42
4.2 External effects of the assessed scenarios ............................................................ 50
4.2.1 Methodology for calculating external effects .................................................... 52
4.2.2 External effects of different scenarios – overall comparison ............................ 54
4.2.3 External effects of sectors and technology options .......................................... 57
4.2.4 Influence of the discount rate .......................................................................... 60
4.2.5 Conclusions on impacts of external effects ...................................................... 62
5 The cooperation mechanisms: design, impacts and barriers ......................................... 64
5.1 Comparing the cooperation mechanisms ............................................................... 64
5.2 The potential use of cooperation mechanisms by Austria ....................................... 71
5.3 Comparison of cooperation mechanisms and Kyoto mechanisms .......................... 72
6 Integrated Assessment of the Scenarios ....................................................................... 80
6.1 Comparison of the welfare effects up to 2050 ........................................................ 80
6.2 Comparison of the activity balance up to 2050 ....................................................... 82
6.3 Comparison of public and total expenditures .......................................................... 84
6.4 Integrating the results ............................................................................................ 87
7 Conclusions .................................................................................................................. 90
8 References ................................................................................................................... 92
9 Annexes ....................................................................................................................... 97
Annex 1: Numerical Green-X model results for Austria .................................................... 97
Annex 2: Details on the macroeconomic evaluation ....................................................... 100
Annex 3: Marginal cost-resource curves for Renewable Energy Technologies in Austria 102

6
List of Figures
Figure 1: REFLEX Reference and Efficiency scenario of the Austrian gross final energy consumption in
2020 compared to the PRIMES Baseline (2009) ............................................................................ 12
Figure 2: ReFlex Reference and Efficiency scenario of the Austrian gross electricity consumption in
2020 compared to the PRIMES Baseline (2009) ............................................................................ 13
Figure 3: REFLEX Reference and Efficiency scenario of Austrian gross heat consumption compared to
PRIMES Baseline (2009) ................................................................................................................ 13
Figure 4: REFLEX Reference and Efficiency scenario of Austrian gross transport consumption
compared to PRIMES Baseline (2009) ........................................................................................... 14
Figure 5: Description of the European dimension of the computed scenarios .................................................. 18
Figure 6: Basic definitions of the cost elements (illustrated for a RES trading system) .................................... 20
Figure 7: Comparison of the resulting RES share in (sector) gross final energy demand by 2020 in
Austria for all assessed cases ........................................................................................................ 22
Figure 8: Comparison of the resulting total deployment of new (2011 to 2020) RES installations in
Austria for all assessed cases ........................................................................................................ 22
Figure 9: per sector comparison of the resulting deployment of new (2011 to 2020) RES installations in
Austria for all assessed cases ........................................................................................................ 23
Figure 10: Comparison of the resulting technology breakdown for new (2011 to 2020) RES installations
in Austria for all assessed cases ..................................................................................................... 24
Figure 11: Comparison of the total required capital expenditures for new (2011 to 2020) RES installations
in Austria for all assessed cases ..................................................................................................... 25
Figure 12: Comparison of the required capital expenditures per sector for new (2011 to 2020) RES
installations in Austria for all assessed cases ................................................................................. 26
Figure 13: Comparison of the required cumulative support expenditures for new (2011 to 2020) RES
installations in Austria for all assessed cases (part 1 – sector breakdown) .................................... 26
Figure 14: Comparison of the required support expenditures for new (2011 to 2020) RES installations in
Austria for all assessed cases (part 2 – impact of cooperation) ...................................................... 27
Figure 15: Comparison of the CO2 avoidance due to new (2011 to 2020) RES installations in Austria for
all assessed cases .......................................................................................................................... 28
Figure 16: Comparison of the resulting avoidance of fossil fuel expenditures due to new (2011 to 2020)
RES installations in Austria for all assessed cases ......................................................................... 28
Figure 17: RES trajectories up to 2020 and income from- or expenditures for RES cooperation for A-
Scenarios ........................................................................................................................................ 29
Figure 18: RES trajectories up to 2020 and income from- or expenditures for RES cooperation for B-
Scenarios ........................................................................................................................................ 30
Figure 19: Comparison of RES deployment up to 2020 at the European level according to different RES-
policy scenarios. ............................................................................................................................. 32
Figure 20: Comparison of the resulting 2020 RES deployment and the corresponding (yearly average)
consumer expenditures due to RES support for new RES (installed 2011 to 2020) in the EU-
27 for selected cases ...................................................................................................................... 35
Figure 21: The need for cooperation – (virtual) exchange of RES volumes by 2020 for selected cases –
i.e. strengthened national support without (national perspective) or with intensified
cooperation (European perspective) between member states ........................................................ 36
Figure 22: Deviation of consumption relative to the reference case ................................................................... 45
Figure 23: Deviation of consumption relative to the reference case (2010-2050) ............................................... 48
Figure 24: Absolute change of employment rate of Austria ................................................................................ 49
Figure 25: Principal steps of the impact-pathway approach for estimating external costs of air pollution
(Source: Bickel & Friedrich et al., 2005) .......................................................................................... 51
Figure 26: External Benefits and Costs of measures implemented between 2011 and 2020 ............................. 55

7
Figure 27: Remaining external benefits after subtraction of external costs (net external benefits) of
measures implemented between 2011 and 2020 .................................................................... 56
Figure 28: External benefits after subtraction of external costs (net external benefits) of measures
implemented between 2011 and 2020 in comparison to the Reference scenario ........................ 57
Figure 29: External benefits and costs of measures implemented between 2011 and 2020 in scenario 3B ..... 57
Figure 30: External costs of different technology options ........................................................................... 59
Figure 31: External benefits and costs of measures implemented between 2011 and 2020 in scenario 3B
(discount rate 1.5 %) ............................................................................................................ 61
Figure 32: External benefits and costs of measures implemented between 2011 and 2020 in scenario 3B
(discount rate 2.5 %) ............................................................................................................ 61
Figure 33: External benefits and costs of measures implemented between 2011 and 2020 in scenario 3B
(discount rate 10 %) ............................................................................................................. 61
Figure 34: Remaining external benefits after subtraction of external costs (net external benefits) of
measures implemented between 2011 and 2020 in comparison to Reference scenario
(discount rate 10 %) ............................................................................................................. 62
Figure 35: Cost advantage and its sharing between actors under a crediting system .................................... 73
Figure 36: Welfare effects both from consumption and external effects compared to the reference
scenario (discount rate 2.5 %, period 2011-2050) ................................................................... 80
Figure 37: Welfare effects both from consumption and external effects compared to the reference scenario
(discount rate 4 % for consumption, 1.5% for external effects, period 2011-2050) ...................... 82
Figure 38: Effects from trade compared to the reference scenario (RES-trading period 2011-2020) ............... 83
Figure 39: Additional public expenditures compared to the reference scenario within the time periods
2011-2020 and 2011-2050 ................................................................................................... 84
Figure 40: Additional Investment- and operating costs for energy efficiency and RES-expansion
measures (short term consideration 2011-2020), compared to the reference scenario ................ 85
Figure 41: Additional Investment- and operating costs for energy efficiency and RES-expansion
measures (long term consideration 2011-2050), compared to the reference scenario ................. 86
Figure 42: Total welfare effects adjusted by total trade effects up to 2050 compared to the reference
scenario (RES trading period 2011-2020) .............................................................................. 87
Figure 43: Total welfare effects adjusted by total trade effects up to 2050 compared to the reference
scenario (RES trading period 2015-2020) .............................................................................. 88
Figure 44: Total cum. welfare effects in detail (2011 – 2020) .................................................................... 100
Figure 45: Change of Trade balance compared to Reference (2011 – 2020) ............................................. 101
Figure 46: Change of Trade balance compared to Refernece (2011 – 2050) ............................................. 101
Figure 47: Methodology to assess the mid-term potential ......................................................................... 103
Figure 48: Achieved (2005) and additional 2020 potentials for RES in terms of final energy demand for all
EU Member States (EU27) – expressed in absolute terms ..................................................... 106
Figure 49: Achieved (2005) and 2020 potentials for RES in terms of final energy for all EU Member
States (EU27) – expressed in relative terms, as share on gross final energy demand ............... 106
Figure 50: The impact of demand growth - 2020 potential for RES as share on current (2005) and
expected future (2020) gross final energy demand. ............................................................... 107
Figure 51: Sectoral breakdown of the achieved (2005) and additional 2020 potential for RES in terms of
final energy at EU 27 level – expressed in relative terms, as share on gross final energy
demand ............................................................................................................................ 108
Figure 52: Bandwidth of long-run marginal generation costs (for the year 2009) for various RES-E
options at EU level ( ........................................................................................................... 112
Figure 53: Bandwidth of long-run marginal generation costs (for the year 2009) for wind onshore by EU
country ............................................................................................................................. 113
Figure 54: Bandwidth of long-run marginal generation costs (for the year 2009) for photovoltaics by EU
country ............................................................................................................................. 113

8
Figure 55: Assumed development of the wholesale electricity prices on average at EU-27 level (based on
Green-X) .......................................................................................................................... 116
Figure 56: Future development of biomass fuel prices (on average at EU-27 level) in case of default
energy price assumptions (low to moderate energy prices) .................................................... 116
Figure 57: Cost reductions of RES-E investment costs as share of initial investment costs (2006) based
on moderate technological learning expectations (default) according to the scenario
”strengthened national support” (in line with 20% RE by 2020) ............................................... 118
Figure 58: Schematic static cost-resource curve illustrating the feasible RES deployment up to 2020
ignoring the impact of dynamic aspects................................................................................ 119
Figure 59: Schematic dynamic cost-resource curve illustrating the feasible RES deployment up to 2020
considering dynamic aspects .............................................................................................. 119
List of tables
Table 1: Overview of the assessed cases ....................................................................................................... 17
Table 2: Overview of the defined parameters for the European dimension ..................................................... 19
Table 3: Key Figures on RES-E deployment by 2020 and corresponding support expenditures for
researched cases (from BAU to strengthened national support, from a national/European
perspective) Source: Green-X, 2011 (RE-Shaping project) ........................................................... 34
Table 4: Sources of energy price data ............................................................................................................. 42
Table 5: Accumulated results of macroeconomic effects until 2020 (2.5% discount rate) ............................... 43
Table 6: Accumulated results of macroeconomic effects until 2050 (2.5% discount rate) ............................... 47
Table 7: Applied marginal damage costs per tonne of air pollutant and CO2................................................... 54
Table 8: Simplified overview of RES and Kyoto mechanism characteristics ................................................... 76
Table 9: AAU deals under International Emissions Trading ............................................................................ 78
Table 10: Number of registered JI projects ........................................................................................................ 78
Table 11: Resulting RES share in (sector) gross final energy demand by 2020 [%].......................................... 97
Table 12: Resulting total deployment of new (2011 to 2020) RES installations [TWh] in Austria ...................... 97
Table 13: Per sector comparison of the resulting deployment of new (2011 to 2020) RES [TWh] in
Austria for all assessed cases ........................................................................................................ 97
Table 14: Technology breakdown of energy production from new (2011 to 2020) RES [TWh] ......................... 98
Table 15: Comparison of cumulative capital expenditure for new (2011 to 2020) RES installations in
Austria for all assessed cases [Billion €] ......................................................................................... 98
Table 16: Comparison of the required cumulative support expenditures for new (2011 to 2020) RES
installations [Billion €] ...................................................................................................................... 98
Table 17: Negotiated exchange price per MWh RES generation [€/MWh] for (virtual) RES trade .................... 99
Table 18: Cumulative additional generation cost for new (2011 to 2020) RES [Billion €] .................................. 99
Table 21: Cumulative savings of fossil fuel expenses due to new (2011 to 2020) RES [Billion €] ..................... 99
Table 22: Cumulative avoidance of CO2 emissions due to new (2011 to 2020) RES [Mt] ................................. 99
Table 23: Overview of studies assessing the potential for renewable energy in Austria in 2020 ..................... 104
Table 24: Overview of economic-& technical-specifications for new RES-electricity plants ............................ 110
Table 25: Primary energy price assumptions .................................................................................................. 114
Table 26: CO2 price assumptions .................................................................................................................... 115
Table 27: Sectoral energy prices ..................................................................................................................... 115
Table 28: Assumed learning rates in case of moderate (default) and pessimistic learning expectations –
exemplarily depicted for selected RES-E technologies ................................................................. 117
9
Glossary:
RES Renewable Energy Sources
RE Renewable Energy
EEM Energy Efficiency measures
ÖNACE Austrian version of the NACE classification of economic activities
NREAP National Renewable Energy Action Plans. NREAPs were submitted to the
European Commission by EU Member States in 2010
RES-E RES-Electricity
RES-T RES-Transport
RES-H RES- Heat
10
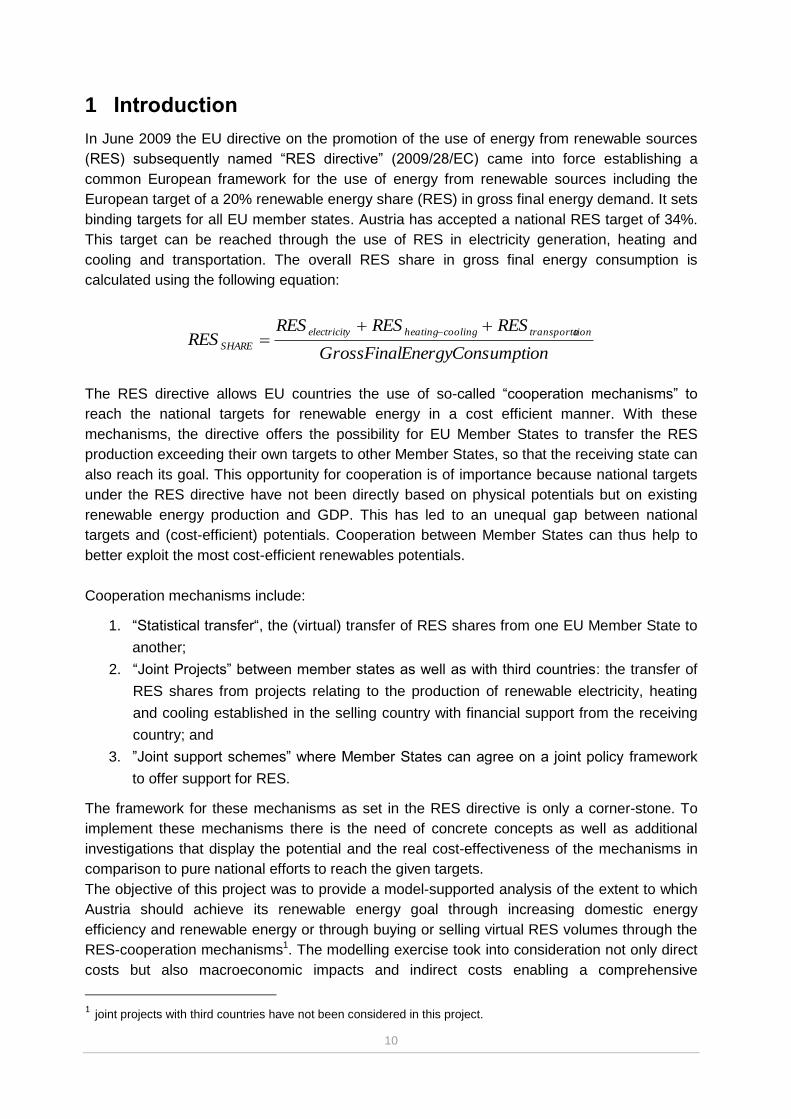
1 Introduction
In June 2009 the EU directive on the promotion of the use of energy from renewable sources
(RES) subsequently named “RES directive” (2009/28/EC) came into force establishing a
common European framework for the use of energy from renewable sources including the
European target of a 20% renewable energy share (RES) in gross final energy demand. It sets
binding targets for all EU member states. Austria has accepted a national RES target of 34%.
This target can be reached through the use of RES in electricity generation, heating and
cooling and transportation. The overall RES share in gross final energy consumption is
calculated using the following equation:
umptionEnergyConsGrossFinal
RESRESRESRES
tiontransportacoolingheatingyelectricit
SHARE
The RES directive allows EU countries the use of so-called “cooperation mechanisms” to
reach the national targets for renewable energy in a cost efficient manner. With these
mechanisms, the directive offers the possibility for EU Member States to transfer the RES
production exceeding their own targets to other Member States, so that the receiving state can
also reach its goal. This opportunity for cooperation is of importance because national targets
under the RES directive have not been directly based on physical potentials but on existing
renewable energy production and GDP. This has led to an unequal gap between national
targets and (cost-efficient) potentials. Cooperation between Member States can thus help to
better exploit the most cost-efficient renewables potentials.
Cooperation mechanisms include:
1. “Statistical transfer“, the (virtual) transfer of RES shares from one EU Member State to
another;
2. “Joint Projects” between member states as well as with third countries: the transfer of
RES shares from projects relating to the production of renewable electricity, heating
and cooling established in the selling country with financial support from the receiving
country; and
3. ”Joint support schemes” where Member States can agree on a joint policy framework
to offer support for RES.
The framework for these mechanisms as set in the RES directive is only a corner-stone. To
implement these mechanisms there is the need of concrete concepts as well as additional
investigations that display the potential and the real cost-effectiveness of the mechanisms in
comparison to pure national efforts to reach the given targets.
The objective of this project was to provide a model-supported analysis of the extent to which
Austria should achieve its renewable energy goal through increasing domestic energy
efficiency and renewable energy or through buying or selling virtual RES volumes through the
RES-cooperation mechanisms1. The modelling exercise took into consideration not only direct
costs but also macroeconomic impacts and indirect costs enabling a comprehensive
1 joint projects with third countries have not been considered in this project.
11
evaluation of the political choices. In addition, the design of the cooperation mechanisms was
examined, thereby contributing to on-going European research in this field.
The project included the following steps:
Scenarios for the final energy demand in 2020: first, the project derived two scenarios for the
Austrian (gross) final energy demand in 2020. In the so-called “reference-scenario” it was
assumed that no additional energy efficiency measures are introduced, whereas in the
“efficiency-scenario” additional energy efficiency measures in the same magnitude as foreseen
in the Austrian National Renewables Action Plan (NREAP2) are implemented.
Costs for renewable energy technologies: in the next step dynamic cost-potential-curves for
Renewable Energy Technologies in Austria were derived and this data was used to update the
database of the Green-X-model. The resulting data was prepared to be sufficiently detailed for
the subsequent macroeconomic modelling.
Green-X modelling: both outcomes described above were included in the Green-X model. By
combining two levels of assumed gross final energy demand with different levels of assumed
capacity expansion of RES-technologies, six key scenarios with respect to Austria’s RES
target fulfilment were developed. A reference case assuming no additional policy measures
served as reference for the calculations. For all six scenarios Green-X provided a cost-efficient
track of RES capacity expansion per technology, its costs as well as avoided fossil based
energy and avoided carbon dioxide (CO2) emissions. Beside the different implementation
intensities of energy efficiency measures and RES deployment, the six scenarios differ with
respect to the resulting RES share in gross final energy demand by 2020 – for each demand
path a case of (exact) RES target compliance was modelled as well as one case for over- and
one for under-fulfilment.
Macroeconomic modelling and external effects: the costs for meeting the six scenarios, the
CO2 emissions saved as well as the cost structure for RES technologies and energy efficiency
measures in Austria served as input for a Computed General Equilibrium (CGE) model. The
CGE model provided information about impacts of the different scenarios on economic
indicators, including welfare and employment. Furthermore, data of the Green-X model
regarding the extent and structure of RES-capacity extension and substituted fossil based
energy was used to calculate external effects (e.g. emissions of increased/decreased harmful
air pollutants). The amount of each type of harmful substances was multiplied by external
damage costs. Finally, the macroeconomic and external effects were part of an integrated
assessment of the scenarios.
RES cooperation mechanisms: in parallel to the modelling work the RES cooperation
mechanisms were assessed regarding their possible design, advantages, disadvantages,
potentials, and barriers and were compared to the flexible mechanisms of the Kyoto Protocol.
Conclusions on a potential use of the RES cooperation mechanisms by Austria were drawn.
The qualitative results were included in the final policy recommendations.
2 (BMWFJ, 2010b).
12
2 Scenarios for the Austrian energy demand in 2020
Scenarios for the Austrian energy demand in 2020 were developed that take into account
existing forecasts and politically agreed measures for Austria. The degree of detail needed
was determined by the requirements of the Green-X model. For the calculation of the overall
future energy demand the projections of the Austrian NREAP served as basis for the REFLEX
reference scenario and the REFLEX efficiency scenario (-150 PJ in 2020 compared to
2010). Sectoral projections we made as shown in Figure 1, Figure 2, Figure 3 and Figure 4
and are compared to their projected demand development of the PRIMES Baseline (2009)
scenario that serves as an input for the Green-X model for modelling other EU Member
States3. Sectoral projections are defined for the gross electricity demand, the gross heat
demand - split in grid-connected and non-grid heat- and the gross energy consumption of the
transport sector, which sum up to the gross final energy consumption. To include the most
recent economic developments in Austria, energy data from the year 2009 (Statistik Austria,
2009) were used.
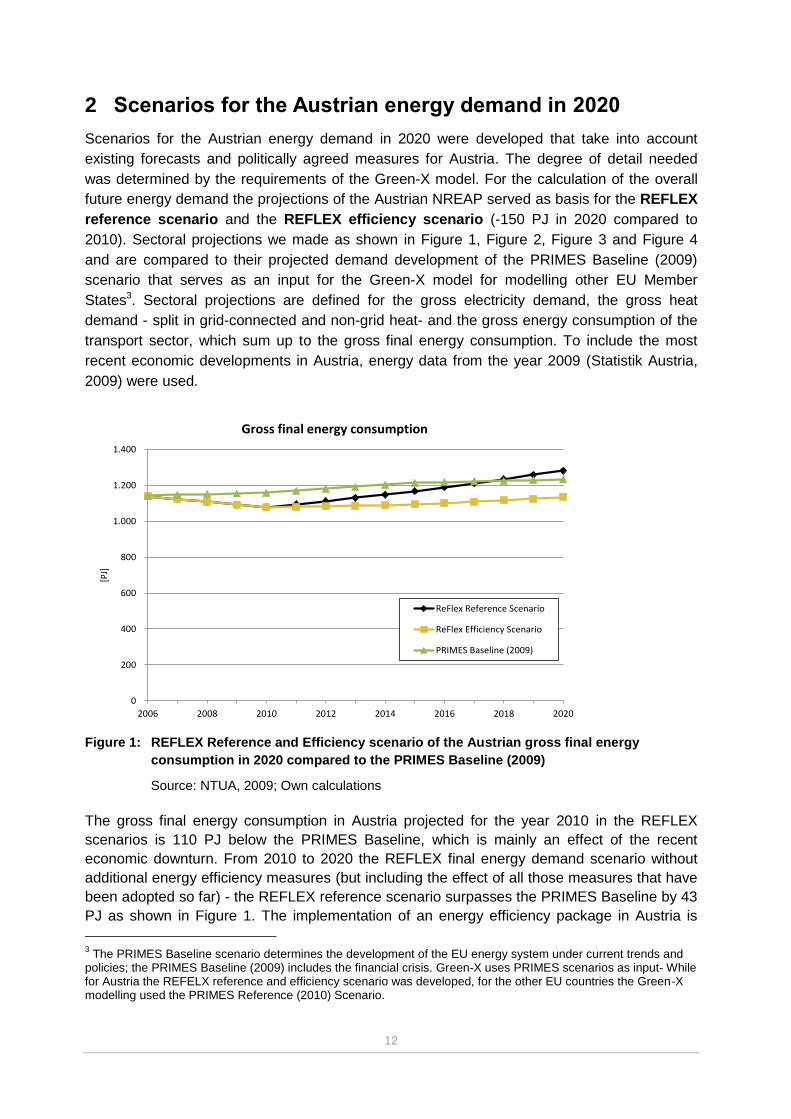
Figure 1: REFLEX Reference and Efficiency scenario of the Austrian gross final energy
consumption in 2020 compared to the PRIMES Baseline (2009)
Source: NTUA, 2009; Own calculations
The gross final energy consumption in Austria projected for the year 2010 in the REFLEX
scenarios is 110 PJ below the PRIMES Baseline, which is mainly an effect of the recent
economic downturn. From 2010 to 2020 the REFLEX final energy demand scenario without
additional energy efficiency measures (but including the effect of all those measures that have
been adopted so far) - the REFLEX reference scenario surpasses the PRIMES Baseline by 43
PJ as shown in Figure 1. The implementation of an energy efficiency package in Austria is
3 The PRIMES Baseline scenario determines the development of the EU energy system under current trends and
policies; the PRIMES Baseline (2009) includes the financial crisis. Green-X uses PRIMES scenarios as input- While for Austria the REFELX reference and efficiency scenario was developed, for the other EU countries the Green-X modelling used the PRIMES Reference (2010) Scenario.
0
200
400
600
800
1.000
1.200
1.400
2006 2008 2010 2012 2014 2016 2018 2020
[PJ]
Gross final energy consumption
ReFlex Reference Scenario
ReFlex Efficiency Scenario
PRIMES Baseline (2009)

13
reflected in the REFLEX efficiency scenario. With a gross final energy demand of 1,135 PJ in
2020, it projects around 150 PJ less energy demand than the REFLEX reference scenario and
100 PJ less than the PRIMES baseline.
Figure 2: ReFlex Reference and Efficiency scenario of the Austrian gross electricity
consumption in 2020 compared to the PRIMES Baseline (2009)
Source: NTUA, 2009; Own calculations
Regarding the development of the Austrian electricity consumption in a REFLEX reference
case there is not much difference to the PRIMES Baseline (see Figure 2). For the year 2020
the REFLEX efficiency case is 12 PJ below the PRIMES Baseline.
Figure 3: REFLEX Reference and Efficiency scenario of Austrian gross heat consumption
compared to PRIMES Baseline (2009)
Source: NTUA, 2009; Own calculations
0
50
100
150
200
250
300
2006 2008 2010 2012 2014 2016 2018 2020
[PJ]
Gross electricity consumption
ReFlex Reference Scenario
ReFlex Efficiency Scenario
PRIMES Baseline (2009)
0
100
200
300
400
500
600
700
2006 2008 2010 2012 2014 2016 2018 2020
[PJ]
Gross heat consumption
ReFlex Reference Scenario
ReFlex Efficiency Scenario
PRIMES Baseline (2009)
14
Figure 3 illustrates that the gross final energy demand scenario (reference as well as
efficiency) developed in the REFLEX project related to heating purposes is substantially below
the PRIMES Baseline scenario in 2010. The difference is 87 PJ. Efficiency measures should
achieve energy savings of 68 PJ in the REFLEX Efficiency scenario up to 2020 compared to
the REFLEX Reference scenario.
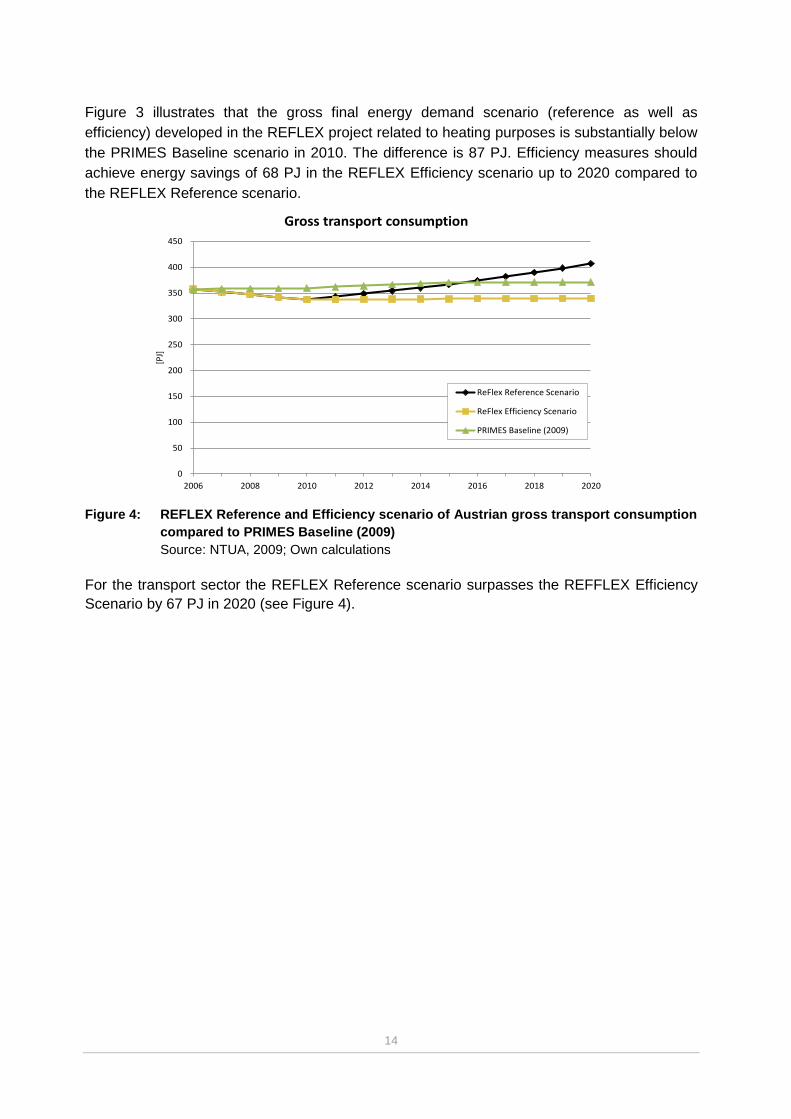
Figure 4: REFLEX Reference and Efficiency scenario of Austrian gross transport consumption
compared to PRIMES Baseline (2009)
Source: NTUA, 2009; Own calculations
For the transport sector the REFLEX Reference scenario surpasses the REFFLEX Efficiency
Scenario by 67 PJ in 2020 (see Figure 4).
0
50
100
150
200
250
300
350
400
450
2006 2008 2010 2012 2014 2016 2018 2020
[PJ]
Gross transport consumption
ReFlex Reference Scenario
ReFlex Efficiency Scenario
PRIMES Baseline (2009)
15
3 Scenarios for RES expansion in the EU with a focus on
Austria
This chapter describes simulated scenarios for meeting the 2020 RES targets for Austria and
for other EU Member States by application of the energy simulation model Green-X4. Aim of
this model-based assessment is to analyse options for Austria to meet the 34% RES-target for
2020 by national expansion of renewable energies, increased energy efficiency, or possible
use of the cooperation mechanisms established by the RES directive. These mechanisms
allow buying or selling RES shares to fulfil the target or to make profit from exceeding the
targets respectively. Assessed scenarios include different assumptions on the energy policy
framework for RES as well as on complementary energy efficiency measures, resulting in
different levels of RES deployment in absolute terms (i.e. generated electricity, heat and
biofuels) as well as in relative terms (i.e. RES share in gross final energy demand) in Austria
and at the European level. The EU-wide analysis is needed specifically to assess the
possibilities for cooperation on RES target fulfilment between Austria and other EU Member
States.
This chapter is structured as follows: in chapter 3.1 the definition of the computed scenarios is
discussed. The methodology for the assessment and a Green-X model description is
presented in chapter 3.2 Methodology for the assessment- The Green-X model An
analysis of the Austrian and European dimension of the scenarios and preliminary policy
conclusions are discussed in chapter 3.3.
3.1 Scenario definition
Six key cases were assessed by application of the Green-X model. The results of the six
cases were input for the subsequent macroeconomic modelling (chapter 4). A “Reference
case” as developed in chapter 2 served as basis for the assessments. It assumed a
continuation of currently implemented RES support measures. In addition, in this Reference
case no complementary additional energy efficiency measures were assumed to be
implemented in forthcoming years. With respect to RES technologies no removal of current
non-cost barriers5 was assumed.
The database of Green-X was adjusted according to the new insights for Austria derived in this
project (see Annex 3). This includes particularly technology-specific RES potentials for Austria
and the related costs as well as assumptions related to the future energy demand. The six
cases of different RES technology extension differ by the overall achievable RES share in the
gross final energy consumption by 2020 (i.e. variants 1, 2 and 3) and by the underlying trend
with respect to the overall future energy demand growth (i.e. demand trends A with no
additional energy efficiency measures and B with additional energy efficiency measures).
3.1.1 The Austrian dimension
With respect to the future development of the overall energy demand in line with chapter 2,
two different energy demand paths serve as a basis for the assessments. On the one hand, a
business-as-usual path assuming a continuation of past trends regarding energy demand was
4 http://www.green-x.at/
5 Currently the diffusion of various RES technologies is limited by several deficiencies of non-cost nature. Such
deficiencies may include complex, time-consuming administrative procedures or problems associated with grid access etc.

16
assumed. (i.e. “path A”, applied in the reference case, case 1A, 2A and 3A). On the other
hand, additional energy efficiency measures were assumed in “path B” (i.e. applied in case 1B,
2B and 3B), whereby the resulting demand development, the REFLEX efficiency case (leading
to a reduction of 150PJ by 2020) is in the same magnitude as the "efficiency case" of the
Austrian NREAP.
The following cases have been assessed with the Green-X model:
Two cases (1A, 1B) where Austria achieves less than its target of 34% by 2020 31.8%
in the 1A case and 32.9% in the 1B case. Consequently, for fulfilling the RES obligation
of 34% (virtual) imports through the use of cooperation mechanisms is a necessity.
Two cases (2A, 2B) where Austria exactly fulfils its RES target of 34% by 2020.
Two cases (3A, 3B) of exceeding the RES target. With the share of 36% in both cases
Austria would then possess a potential for (virtual) exports of RES shares through
cooperation mechanisms.
Consequently, for achieving the above sketched RES shares in dependence of the underlying
energy demand trend a different necessity for strengthening the RES support can be
expected. Besides, at least for all variants aiming for a RES share of 34% or more by 2020 a
mitigation of non-cost RES barriers was assumed. See Table 1 for the complete overview of
the assessed cases and further explanations of the applied policy instruments.
The bandwidth of RES shares by 2020 in the different cases (i.e. ranging from about 32 to
36%) may be considered as narrow since a few proponents of the Austrian RES sector have
called for stronger RES exploitation by 2020 and beyond. Policy realism and experiences from
the achievement of Austrian climate targets on the other hand may ask for a lower RES share
by then. Thus, the pathways assessed within this study represent a pragmatic compromise
between both extremes, indicating expected (BAU cases) and required RES deployment for
2020 as well as more ambitious cases of doing more than required or targeted, considering
the anticipated indicative RES target of 34.2% by 2020 laid down in the Austrian National
Renewable Energy Action Plan (BMWFJ, 2010b).
17
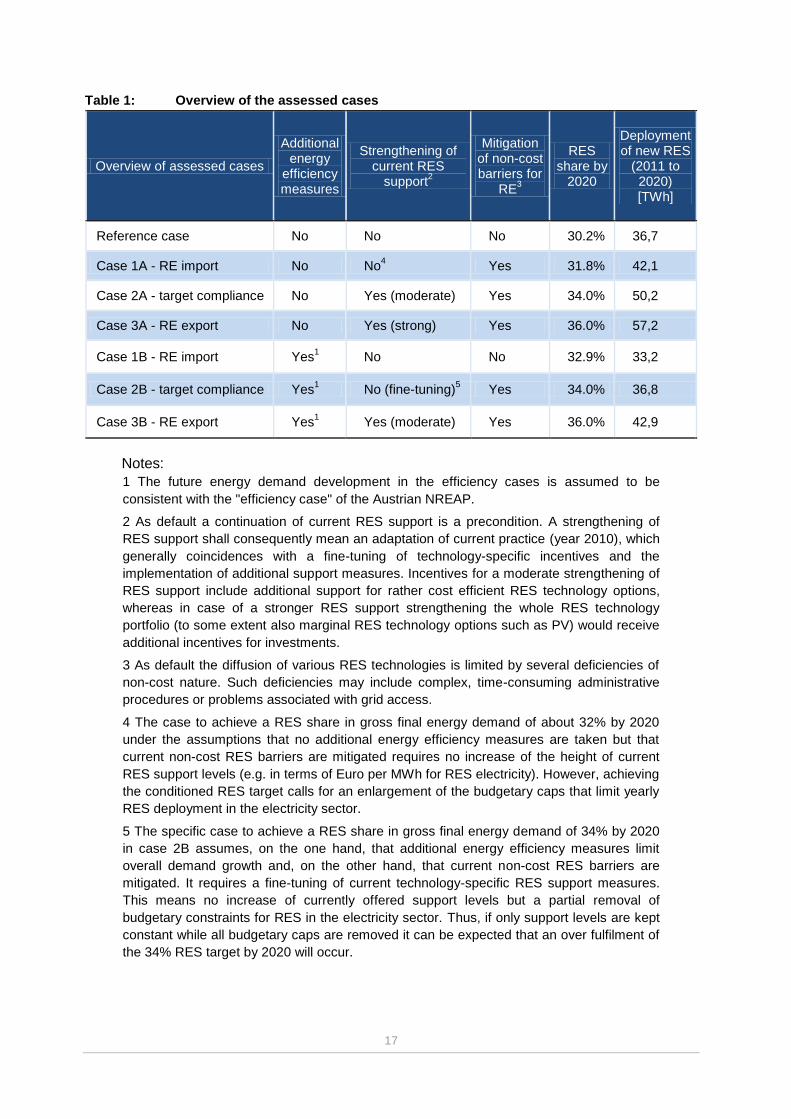
Table 1: Overview of the assessed cases
Overview of assessed cases
Additional energy
efficiency measures
Strengthening of current RES
support2
Mitigation of non-cost barriers for
RE3
RES share by
2020
Deployment of new RES
(2011 to 2020) [TWh]
Reference case No No No 30.2% 36,7
Case 1A - RE import No No4 Yes 31.8% 42,1
Case 2A - target compliance No Yes (moderate) Yes 34.0% 50,2
Case 3A - RE export No Yes (strong) Yes 36.0% 57,2
Case 1B - RE import Yes1 No No 32.9% 33,2
Case 2B - target compliance Yes1 No (fine-tuning)
5 Yes 34.0% 36,8
Case 3B - RE export Yes1 Yes (moderate) Yes 36.0% 42,9
Notes:
1 The future energy demand development in the efficiency cases is assumed to be
consistent with the "efficiency case" of the Austrian NREAP.
2 As default a continuation of current RES support is a precondition. A strengthening of
RES support shall consequently mean an adaptation of current practice (year 2010), which
generally coincidences with a fine-tuning of technology-specific incentives and the
implementation of additional support measures. Incentives for a moderate strengthening of
RES support include additional support for rather cost efficient RES technology options,
whereas in case of a stronger RES support strengthening the whole RES technology
portfolio (to some extent also marginal RES technology options such as PV) would receive
additional incentives for investments.
3 As default the diffusion of various RES technologies is limited by several deficiencies of
non-cost nature. Such deficiencies may include complex, time-consuming administrative
procedures or problems associated with grid access.
4 The case to achieve a RES share in gross final energy demand of about 32% by 2020
under the assumptions that no additional energy efficiency measures are taken but that
current non-cost RES barriers are mitigated requires no increase of the height of current
RES support levels (e.g. in terms of Euro per MWh for RES electricity). However, achieving
the conditioned RES target calls for an enlargement of the budgetary caps that limit yearly
RES deployment in the electricity sector.
5 The specific case to achieve a RES share in gross final energy demand of 34% by 2020
in case 2B assumes, on the one hand, that additional energy efficiency measures limit
overall demand growth and, on the other hand, that current non-cost RES barriers are
mitigated. It requires a fine-tuning of current technology-specific RES support measures.
This means no increase of currently offered support levels but a partial removal of
budgetary constraints for RES in the electricity sector. Thus, if only support levels are kept
constant while all budgetary caps are removed it can be expected that an over fulfilment of
the 34% RES target by 2020 will occur.
18
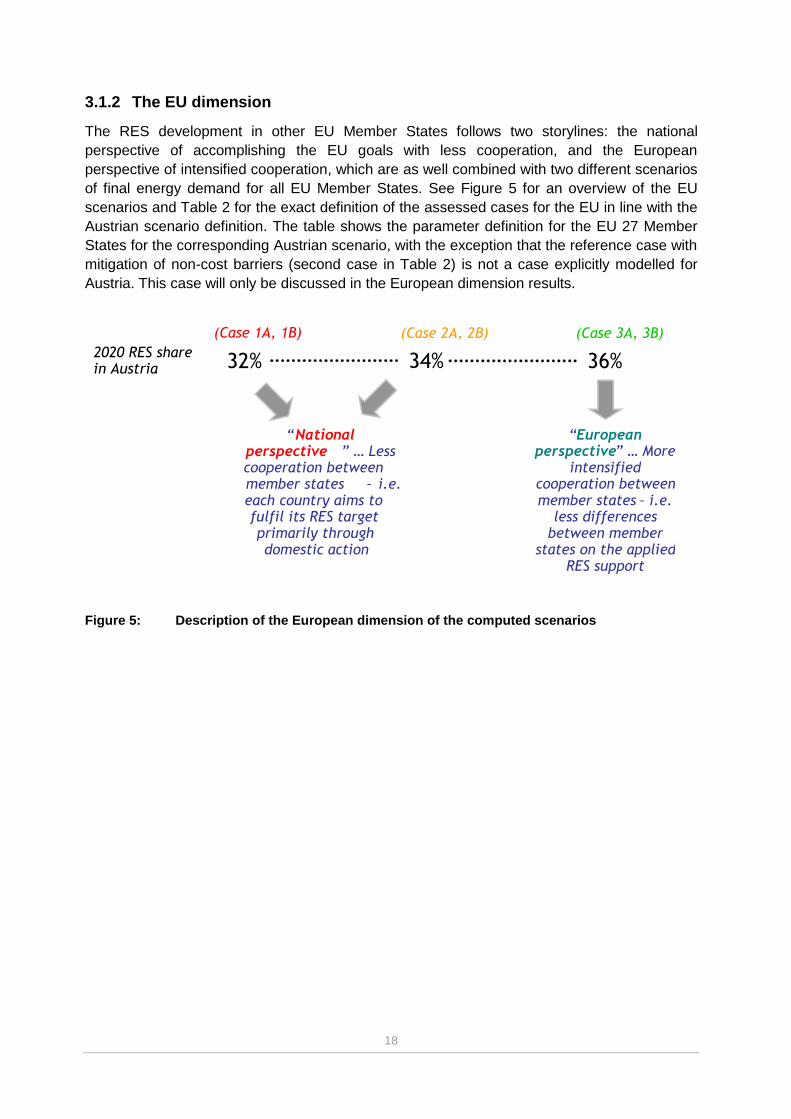
3.1.2 The EU dimension
The RES development in other EU Member States follows two storylines: the national
perspective of accomplishing the EU goals with less cooperation, and the European
perspective of intensified cooperation, which are as well combined with two different scenarios
of final energy demand for all EU Member States. See Figure 5 for an overview of the EU
scenarios and Table 2 for the exact definition of the assessed cases for the EU in line with the
Austrian scenario definition. The table shows the parameter definition for the EU 27 Member
States for the corresponding Austrian scenario, with the exception that the reference case with
mitigation of non-cost barriers (second case in Table 2) is not a case explicitly modelled for
Austria. This case will only be discussed in the European dimension results.
Figure 5: Description of the European dimension of the computed scenarios
32% 2020 RES share in Austria 34% 36%
(Case 1A, 1B) (Case 2A, 2B) (Case 3A, 3B)
“ National perspective ” … Less cooperation between member states – i.e. each country aims to fulfil its RES target primarily through domestic action
“ European perspective ” … More
intensified cooperation between member states – i.e.
less differences between member
states on the applied RES support
19
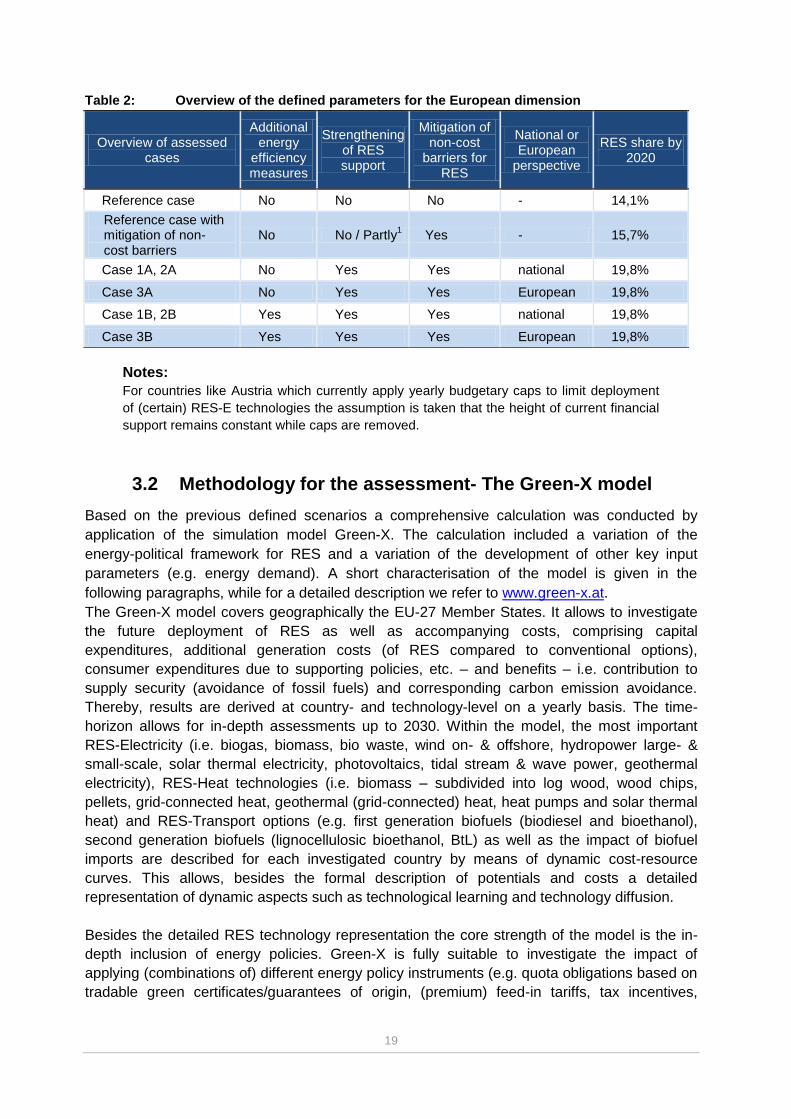
Table 2: Overview of the defined parameters for the European dimension
Overview of assessed cases
Additional energy
efficiency measures
Strengthening of RES support
Mitigation of non-cost
barriers for RES
National or European
perspective
RES share by 2020
Reference case No No No - 14,1%
Reference case with mitigation of non- cost barriers
No No / Partly1 Yes - 15,7%
Case 1A, 2A No Yes Yes national 19,8%
Case 3A No Yes Yes European 19,8%
Case 1B, 2B Yes Yes Yes national 19,8%
Case 3B Yes Yes Yes European 19,8%
Notes:
For countries like Austria which currently apply yearly budgetary caps to limit deployment
of (certain) RES-E technologies the assumption is taken that the height of current financial
support remains constant while caps are removed.
3.2 Methodology for the assessment- The Green-X model
Based on the previous defined scenarios a comprehensive calculation was conducted by
application of the simulation model Green-X. The calculation included a variation of the
energy-political framework for RES and a variation of the development of other key input
parameters (e.g. energy demand). A short characterisation of the model is given in the
following paragraphs, while for a detailed description we refer to www.green-x.at.
The Green-X model covers geographically the EU-27 Member States. It allows to investigate
the future deployment of RES as well as accompanying costs, comprising capital
expenditures, additional generation costs (of RES compared to conventional options),
consumer expenditures due to supporting policies, etc. – and benefits – i.e. contribution to
supply security (avoidance of fossil fuels) and corresponding carbon emission avoidance.
Thereby, results are derived at country- and technology-level on a yearly basis. The time-
horizon allows for in-depth assessments up to 2030. Within the model, the most important
RES-Electricity (i.e. biogas, biomass, bio waste, wind on- & offshore, hydropower large- &
small-scale, solar thermal electricity, photovoltaics, tidal stream & wave power, geothermal
electricity), RES-Heat technologies (i.e. biomass – subdivided into log wood, wood chips,
pellets, grid-connected heat, geothermal (grid-connected) heat, heat pumps and solar thermal
heat) and RES-Transport options (e.g. first generation biofuels (biodiesel and bioethanol),
second generation biofuels (lignocellulosic bioethanol, BtL) as well as the impact of biofuel
imports are described for each investigated country by means of dynamic cost-resource
curves. This allows, besides the formal description of potentials and costs a detailed
representation of dynamic aspects such as technological learning and technology diffusion.
Besides the detailed RES technology representation the core strength of the model is the in-
depth inclusion of energy policies. Green-X is fully suitable to investigate the impact of
applying (combinations of) different energy policy instruments (e.g. quota obligations based on
tradable green certificates/guarantees of origin, (premium) feed-in tariffs, tax incentives,

20
investment incentives, impact of emission trading on reference energy prices) at country- or at
European level in a dynamic framework.
Criteria for the assessment of RES support schemes
Support instruments have to be effective in order to increase the penetration of RES and
efficient with respect to minimising the resulting public costs – i.e. the transfer costs for
consumer (society), subsequently named consumer expenditures – over time. The criteria
used for evaluating the various policy instruments are based on two conditions:
- Minimise generation costs
- Reduce producer profits to an adequate level
Once such cost-efficient systems have been identified, the next step is to evaluate various
implementation options with the aim of minimising the transfer costs for consumers/society6.
This means that feed-in tariffs, investment incentives or RES trading systems should be
designed in a way that public transfer payments are also minimised. This implies lowering
generation costs as well as producer surplus (PS)7.
Figure 6: Basic definitions of the cost elements (illustrated for a RES trading system)
In some cases it may not be possible to reach both objectives simultaneously – minimize
generation costs and producer surplus – so that compromises have to be made. For a better
illustration of the cost definitions used, the various cost elements are illustrated in Figure 6.
6
Consumer expenditures - i.e. the transfer costs for consumers (society) – due to RES support are defined as the
financial transfer payments from the consumer to the RES producer compared to the reference case of consumers purchasing conventional electricity on the power market. This means that these costs do not consider any indirect costs or externalities (environmental benefits, change of employment, etc.). Within this report consumer expenditures (due to RES support) are either expressed in absolute terms (e.g. billion €), related to the stimulated RES generation, or put in relation to the total electricity/energy consumption. In the latter case, the premium costs refer to each MWh of electricity/energy consumed. 7
The producer surplus is defined as the profit of RES-based energy production. If, for example, a RES producer
receives a feed-in tariff of 60 € for each MWh of electricity sold and generation costs are 40 €/MWh, the resulting profit would be 20 € for each MWh. The sum of the profits of all RES producers equals the producer surplus.
quantity[GWh/year]
price, costs [€/MWh]
Market clearing
price = price
for certificate
MC
Quota Q
pC
MC ... marginal
generation costs
pC ... market price for
(conventional)
electricity
pMC ... marginal price for
RES-E (due to
quota obligation)
pMC
Generation Costs (GC)
Producer surplus (PS)
Transfer costs for consumer
(additional costs for society) = PS + GC – pC * Q = ( pMC – pC ) * Q
quantity[GWh/year]
price, costs [€/MWh]
Market clearing
price = price
for certificate
MC
Quota Q
pC
MC ... marginal
generation costs
pC ... market price for
(conventional)
electricity
pMC ... marginal price for
RES-E (due to
quota obligation)
MC ... marginal
generation costs
pC ... market price for
(conventional)
electricity
pMC ... marginal price for
RES-E (due to
quota obligation)
pMC
Generation Costs (GC)
Producer surplus (PS)
Transfer costs for consumer
(additional costs for society) = PS + GC – pC * Q = ( pMC – pC ) * Q

21
3.3 Green-X scenario results
Subsequently we present the results of the model-based assessment of future RES
deployment in Austria and in other EU Member States. Thereby, a first analysis is made
related to following questions:
– How high is the potential RES deployment until 2020 in Austria and its corresponding
support expenditures?
– How significant are possible benefits such as GHG reduction and supply security linked
to RES deployment?
– What policy action is required for achieving the RES targets conditioned within this
assessment from an Austrian and European perspective?
3.3.1 RES deployment by 2020 – the Austrian dimension8
The modelled scenarios for Austria vary in their RES deployment in different sectors of gross
final energy demand, as can be seen in Figure 7. Thereby, biofuels in the transport sector
generally achieve a comparatively constant deployment, ranging from 9.4% to 9.6% in all
cases. This is in line with the mandatory 10% RES share by 2020 in the transport sector as
required by the EU RES-Directive since also electricity from RES used in the transport sector
(besides biofuels) has to be taken into consideration for target calculation. Thus, the sectors
electricity and heat are responsible for the differences in the total RES shares between the
cases. The reference case projects a 65.8% RES share for the electricity sector and a 28.5%
RES share for the heat sector in 2020. In the different A-cases, which follow the reference
energy demand projections to 2020, the RES share in the electricity sector (RES-E share)
varies between 69.2% and 79.2% by 2020. The B-cases, which include additional energy
efficiency measures, project a RES-E share from 66.6% to 72.6% by 2020. The RES share in
the heat sector (RES-H share) of the A-cases ranges from 30.2% to 34.7%. With additional
energy efficiency measures in place (B-cases) the RES-H share varies between 31.7% and
35.3%.
As seen in Figure 7 it becomes apparent, on the one hand, that RES-H achieves a higher
share if energy efficiency plays a key role, and, on the other hand, that RES-E needs to be
increased less to achieve the overall targeted RES deployment. Moreover, the comparatively
strong difference in the RES-E share between case 3A and case 3B is caused by the strong
strengthening of the national RES support in 3A needed to reach a 36% RES target if overall
energy demand grows strong versus the moderate strengthening necessary in 3B where a
package of energy efficiency measures is implemented.
8 See Annex 1 for detailed tables with numbers for all figures of this chapter

22
Figure 7: Comparison of the resulting RES share in (sector) gross final energy demand by
2020 in Austria for all assessed cases
The deployment of new RES systems installed in the period 2011 to 2020 is shown in Figure 8
for all six cases. It can be observed that additional energy efficiency measures anticipated in
the B-cases have a considerable impact. If additional energy efficiency measures are
implemented as conditioned in the B cases, a RES growth as anticipated in the reference case
appears sufficient to fulfil the Austrian 34% RES goal (as modelled in the 2B scenario). This
scenario implies a mitigation of non-cost barriers and only a partly strengthening of financial
RES support.9 If in addition the national support for RES technologies is strengthened
moderately a 36% RES share (case 3B) can be achieved.
Figure 8: Comparison of the resulting total deployment of new (2011 to 2020) RES
installations in Austria for all assessed cases
The resulting RES deployment in the year 2020 is a result of new installations mainly in the
RES-E and RES-H sectors, as can be seen in detail in Figure 9. These sectors bear the
biggest potentials for substituting conventional energy sources by RES in Austria.
9 As discussed previously this means that no increase of currently offered support levels is required. However, a
partly removal of budgetary constraints for certain RES technologies in the electricity sector represents a necessity.
30,2% 31,8%34,0%
36,0%32,9% 34,0%
36,0%
0%
10%
20%
30%
40%
50%
60%
70%
80%
Reference (A) Case 1A Case 2A Case 3A Case 1B Case 2B Case 3B
RE
S s
hare
in
(se
cto
r) g
ross fin
al e
ne
rgy
dem
and
by 2
02
0 [
%]
RES-Electricity RES-Heat Biofuels RES total
36,742,1
50,2
57,2
33,236,8
42,9
0
10
20
30
40
50
60
Reference (A) Case 1A Case 2A Case 3A Case 1B Case 2B Case 3B
En
erg
y p
rod
uctio
n f
rom
n
ew
RE
S b
y 2
02
0 [
TW
h]
23
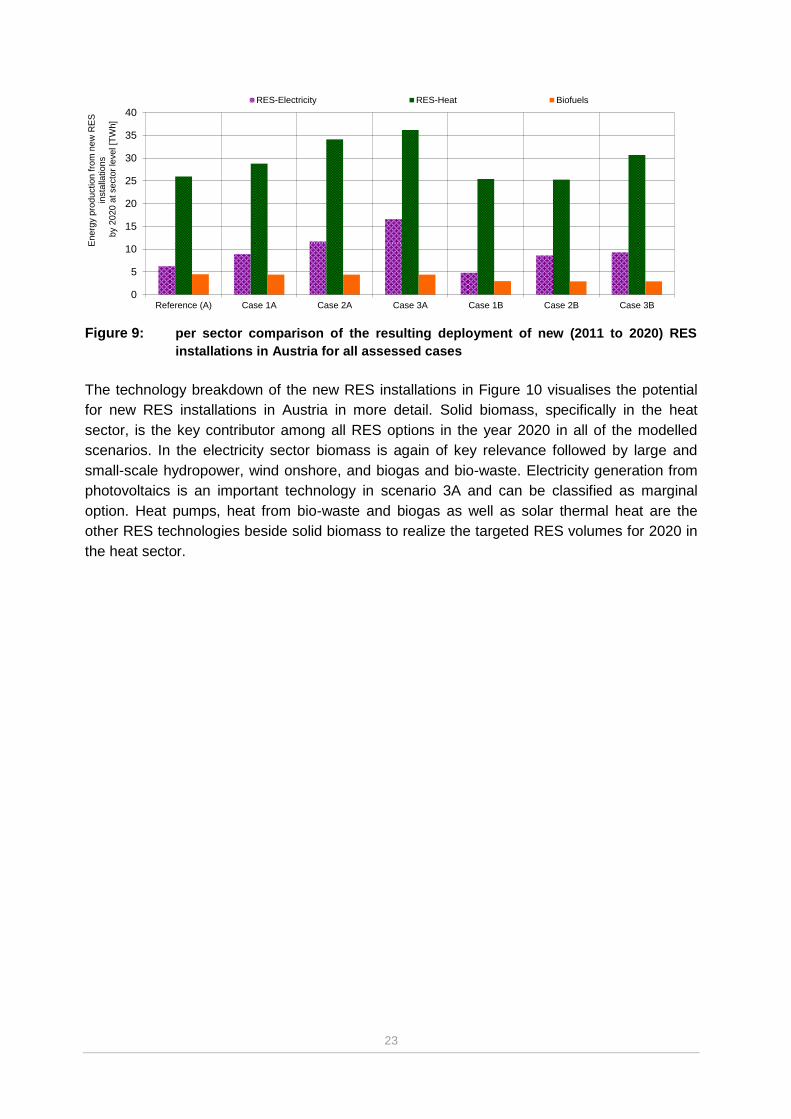
Figure 9: per sector comparison of the resulting deployment of new (2011 to 2020) RES
installations in Austria for all assessed cases
The technology breakdown of the new RES installations in Figure 10 visualises the potential
for new RES installations in Austria in more detail. Solid biomass, specifically in the heat
sector, is the key contributor among all RES options in the year 2020 in all of the modelled
scenarios. In the electricity sector biomass is again of key relevance followed by large and
small-scale hydropower, wind onshore, and biogas and bio-waste. Electricity generation from
photovoltaics is an important technology in scenario 3A and can be classified as marginal
option. Heat pumps, heat from bio-waste and biogas as well as solar thermal heat are the
other RES technologies beside solid biomass to realize the targeted RES volumes for 2020 in
the heat sector.
0
5
10
15
20
25
30
35
40
Reference (A) Case 1A Case 2A Case 3A Case 1B Case 2B Case 3B
En
erg
y p
rod
uction
fro
m n
ew
RE
S
insta
llation
sb
y 2
02
0 a
t se
cto
r le
ve
l [T
Wh
]
RES-Electricity RES-Heat Biofuels

24
Figure 10: Comparison of the resulting technology breakdown for new (2011 to 2020) RES installations in Austria for all assessed cases
The numerical values can be found in Annex 1, Table 14.
0
1
2
3
4
5
6
7
En
erg
y p
rod
uction
fro
m n
ew
RE
S in
sta
llation
s
by 2
02
0 a
t te
chn
olo
gy le
ve
l [T
Wh
] Reference (A) Case 1A Case 2A Case 3A Case 1B Case 2B Case 3B
TWh
25
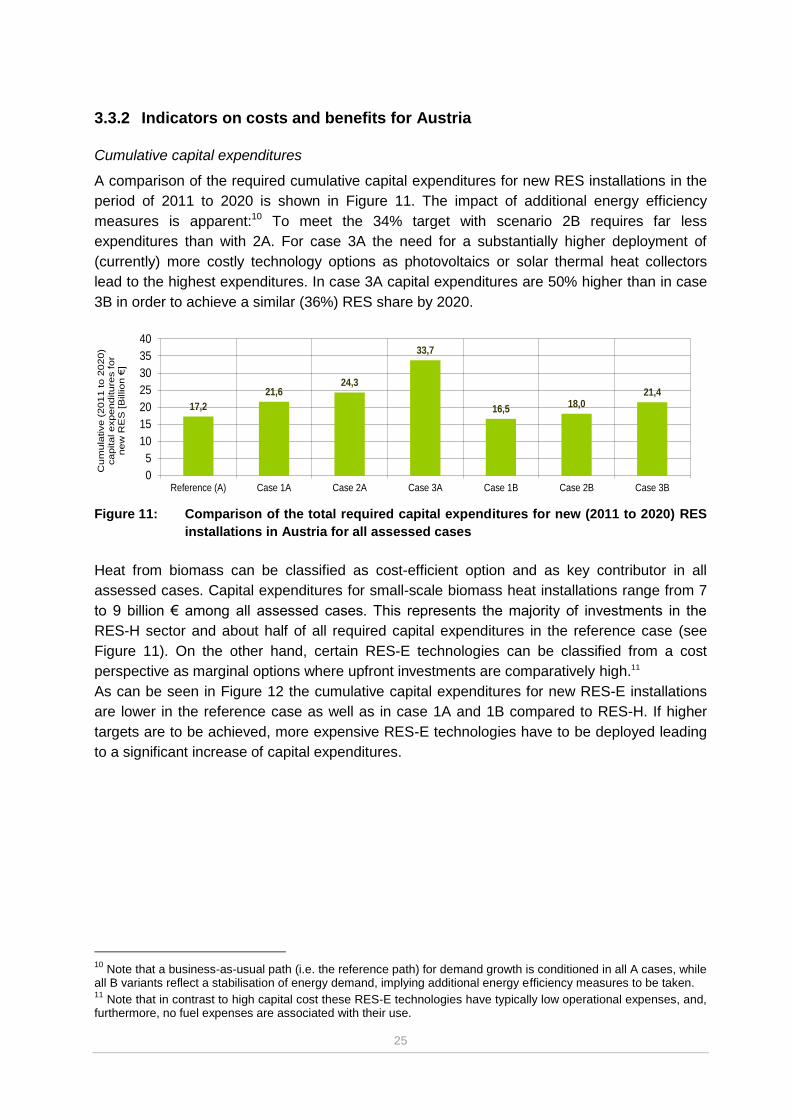
3.3.2 Indicators on costs and benefits for Austria
Cumulative capital expenditures
A comparison of the required cumulative capital expenditures for new RES installations in the
period of 2011 to 2020 is shown in Figure 11. The impact of additional energy efficiency
measures is apparent:10 To meet the 34% target with scenario 2B requires far less
expenditures than with 2A. For case 3A the need for a substantially higher deployment of
(currently) more costly technology options as photovoltaics or solar thermal heat collectors
lead to the highest expenditures. In case 3A capital expenditures are 50% higher than in case
3B in order to achieve a similar (36%) RES share by 2020.
Figure 11: Comparison of the total required capital expenditures for new (2011 to 2020) RES
installations in Austria for all assessed cases
Heat from biomass can be classified as cost-efficient option and as key contributor in all
assessed cases. Capital expenditures for small-scale biomass heat installations range from 7
to 9 billion € among all assessed cases. This represents the majority of investments in the
RES-H sector and about half of all required capital expenditures in the reference case (see
Figure 11). On the other hand, certain RES-E technologies can be classified from a cost
perspective as marginal options where upfront investments are comparatively high.11
As can be seen in Figure 12 the cumulative capital expenditures for new RES-E installations
are lower in the reference case as well as in case 1A and 1B compared to RES-H. If higher
targets are to be achieved, more expensive RES-E technologies have to be deployed leading
to a significant increase of capital expenditures.
10
Note that a business-as-usual path (i.e. the reference path) for demand growth is conditioned in all A cases, while all B variants reflect a stabilisation of energy demand, implying additional energy efficiency measures to be taken. 11
Note that in contrast to high capital cost these RES-E technologies have typically low operational expenses, and, furthermore, no fuel expenses are associated with their use.
17,2
21,624,3
33,7
16,518,0
21,4
0
5
10
15
20
25
30
35
40
Reference (A) Case 1A Case 2A Case 3A Case 1B Case 2B Case 3B
Cu
mu
lative
(2
01
1 to
20
20
) ca
pita
l e
xp
en
ditu
res fo
r n
ew
RE
S [B
illio
n €
]

26
Figure 12: Comparison of the required capital expenditures per sector for new (2011 to 2020)
RES installations in Austria for all assessed cases
Required support expenditures- sectoral level
RES-H requires in general less support than RES-E. This can be seen in Figure 13 where
cumulative (2011 – 2020) support expenditures for new RES installations are illustrated by
sector. More precisely, support expenditures are higher for RES-E compared to RES-H in
cases 1A, 3A, 2B, and 3B, while in case 2A case they are of similar magnitude in both sectors.
Figure 13 below also includes potential earnings (-) or expenditures (+) arising from the use of
RES cooperation mechanisms next to the cumulative (2011 to 2020) support expenditures for
new RES installations at sector level. The prices used in our assessment vary depending on
the scenario and the year in which the trade occurs (see Annex 1, Table 17) for the negotiated
exchange price per MWh RES generation for (virtual) RES trade for each scenario).
Figure 13: Comparison of the required cumulative support expenditures for new (2011 to
2020) RES installations in Austria for all assessed cases (part 1 – sector breakdown)
As can be seen, benefits from selling the surplus of RES to other EU Member States occur as
expected in cases of over fulfilment (cases 3A and 3B), but also in cases 2A and 2B where an
exact RES target fulfilment is conditioned for 2020 or even in case 1B where net RES imports
0
2
4
6
8
10
12
14
16
18
20
Reference (A) Case 1A Case 2A Case 3A Case 1B Case 2B Case 3B
Cu
mu
lative
(2
01
1 to
202
0)
ca
pita
l e
xp
en
ditu
res f
or
new
RE
S a
t se
cto
r le
ve
l [B
illio
n €
]
RES-Electricity RES-Heat Biofuels
-4
-2
0
2
4
6
8
Reference (A) Case 1A Case 2A Case 3A Case 1B Case 2B Case 3B
Cum
ula
tive (
2011 to 2
020)
support
expenditure
s f
or
new
RE
S a
t secto
r le
vel [B
illio
n €
]
RES-Electricity RES-Heat Biofuels Cooperation Mechanisms
27
are required by 2020. In these cases the benefits arise in the timespan prior to 2020 where the
RES deployment is well above the minimum RES trajectory and RES shares can be sold.
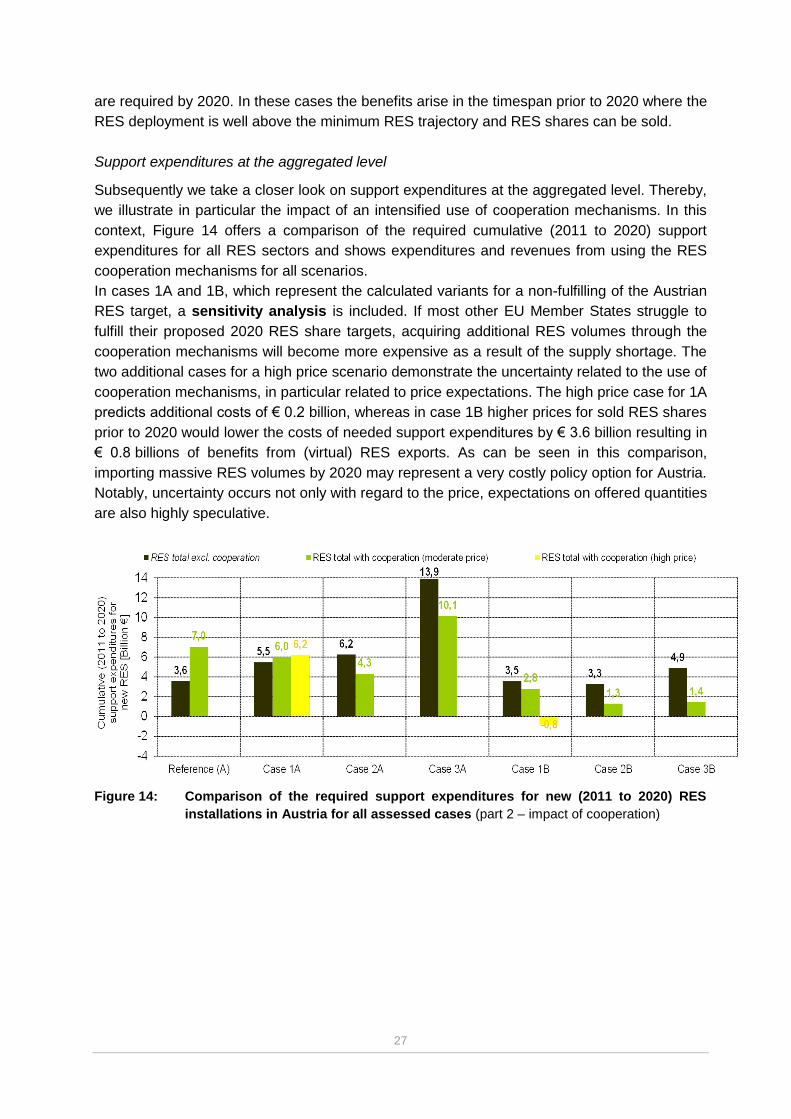
Support expenditures at the aggregated level
Subsequently we take a closer look on support expenditures at the aggregated level. Thereby,
we illustrate in particular the impact of an intensified use of cooperation mechanisms. In this
context, Figure 14 offers a comparison of the required cumulative (2011 to 2020) support
expenditures for all RES sectors and shows expenditures and revenues from using the RES
cooperation mechanisms for all scenarios.
In cases 1A and 1B, which represent the calculated variants for a non-fulfilling of the Austrian
RES target, a sensitivity analysis is included. If most other EU Member States struggle to
fulfill their proposed 2020 RES share targets, acquiring additional RES volumes through the
cooperation mechanisms will become more expensive as a result of the supply shortage. The
two additional cases for a high price scenario demonstrate the uncertainty related to the use of
cooperation mechanisms, in particular related to price expectations. The high price case for 1A
predicts additional costs of € 0.2 billion, whereas in case 1B higher prices for sold RES shares
prior to 2020 would lower the costs of needed support expenditures by € 3.6 billion resulting in
€ 0.8 billions of benefits from (virtual) RES exports. As can be seen in this comparison,
importing massive RES volumes by 2020 may represent a very costly policy option for Austria.
Notably, uncertainty occurs not only with regard to the price, expectations on offered quantities
are also highly speculative.
Figure 14: Comparison of the required support expenditures for new (2011 to 2020) RES
installations in Austria for all assessed cases (part 2 – impact of cooperation)
28
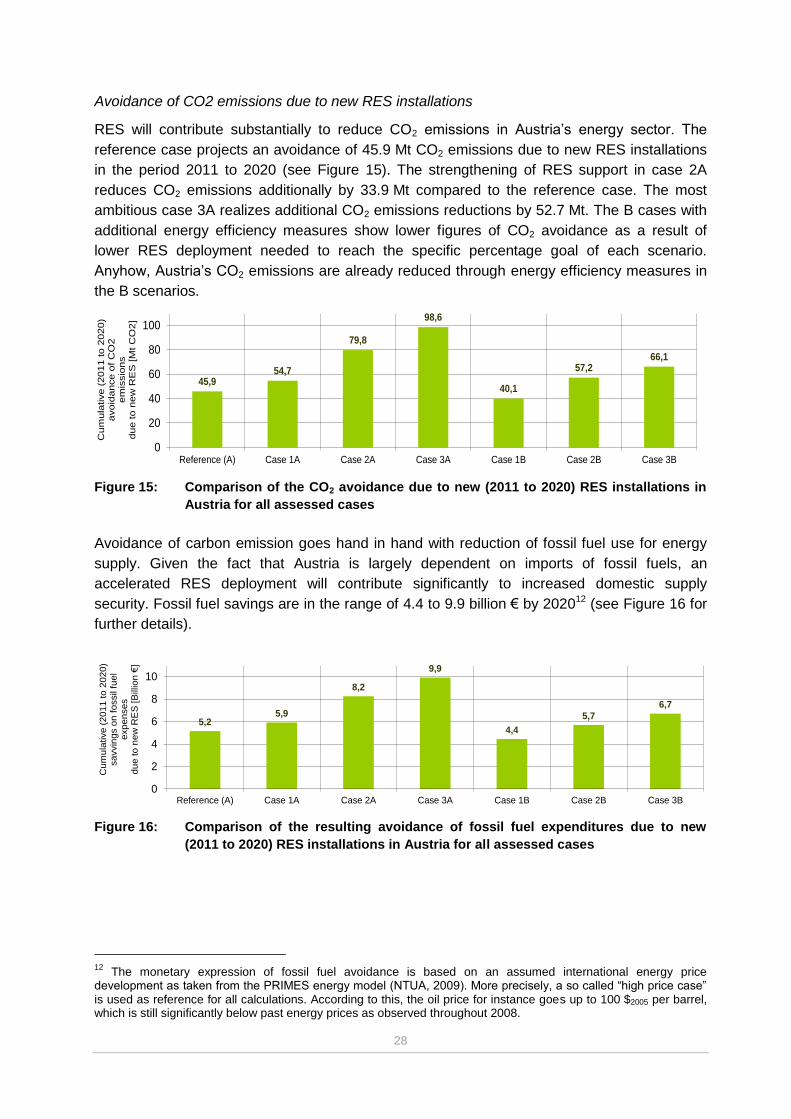
Avoidance of CO2 emissions due to new RES installations
RES will contribute substantially to reduce CO2 emissions in Austria’s energy sector. The
reference case projects an avoidance of 45.9 Mt CO2 emissions due to new RES installations
in the period 2011 to 2020 (see Figure 15). The strengthening of RES support in case 2A
reduces CO2 emissions additionally by 33.9 Mt compared to the reference case. The most
ambitious case 3A realizes additional CO2 emissions reductions by 52.7 Mt. The B cases with
additional energy efficiency measures show lower figures of CO2 avoidance as a result of
lower RES deployment needed to reach the specific percentage goal of each scenario.
Anyhow, Austria’s CO2 emissions are already reduced through energy efficiency measures in
the B scenarios.
Figure 15: Comparison of the CO2 avoidance due to new (2011 to 2020) RES installations in
Austria for all assessed cases
Avoidance of carbon emission goes hand in hand with reduction of fossil fuel use for energy
supply. Given the fact that Austria is largely dependent on imports of fossil fuels, an
accelerated RES deployment will contribute significantly to increased domestic supply
security. Fossil fuel savings are in the range of 4.4 to 9.9 billion € by 202012 (see Figure 16 for
further details).
Figure 16: Comparison of the resulting avoidance of fossil fuel expenditures due to new
(2011 to 2020) RES installations in Austria for all assessed cases
12
The monetary expression of fossil fuel avoidance is based on an assumed international energy price development as taken from the PRIMES energy model (NTUA, 2009). More precisely, a so called “high price case” is used as reference for all calculations. According to this, the oil price for instance goes up to 100 $2005 per barrel, which is still significantly below past energy prices as observed throughout 2008.
45,954,7
79,8
98,6
40,1
57,266,1
0
20
40
60
80
100
Reference (A) Case 1A Case 2A Case 3A Case 1B Case 2B Case 3B
Cum
ula
tive (
20
11 to 2
020
) avoid
ance o
f C
O2
em
issio
ns
due
to n
ew
RE
S [M
t C
O2]
5,25,9
8,2
9,9
4,4
5,7
6,7
0
2
4
6
8
10
Reference (A) Case 1A Case 2A Case 3A Case 1B Case 2B Case 3B
Cu
mu
lative
(2
01
1 to
20
20
) sa
vvin
gs o
n f
ossil
fue
l expenses
du
e to
ne
w R
ES
[B
illio
n €
]
29
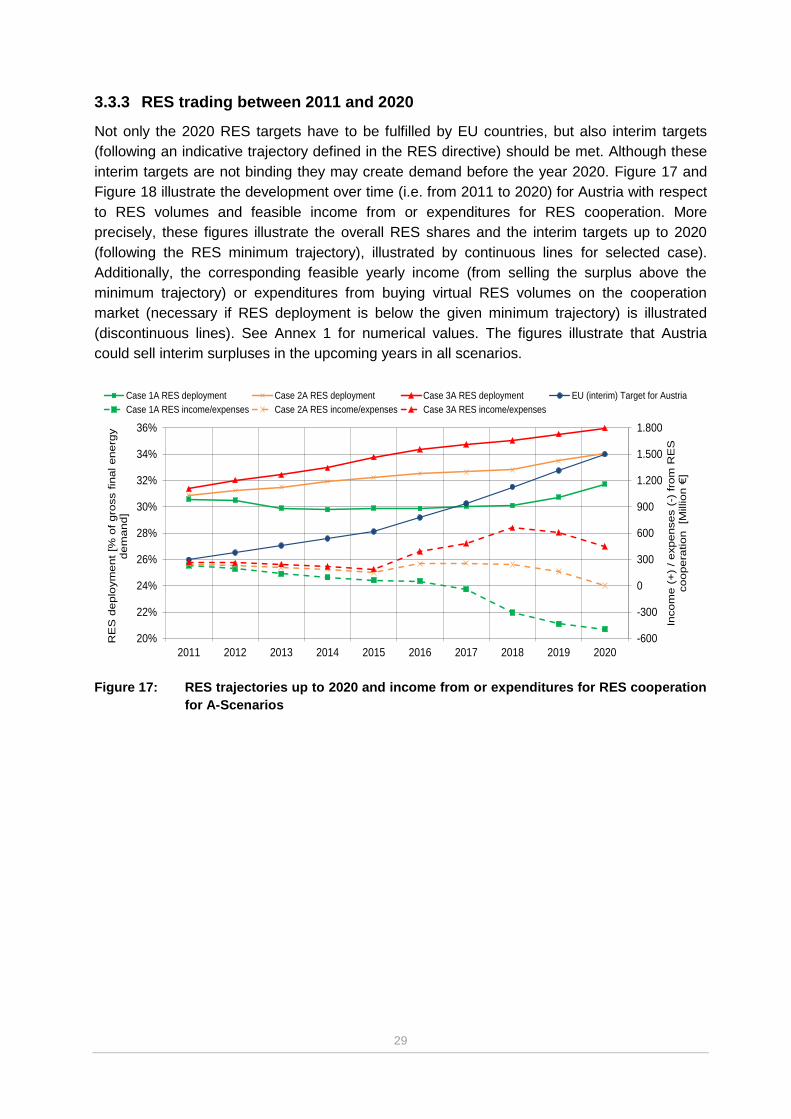
3.3.3 RES trading between 2011 and 2020
Not only the 2020 RES targets have to be fulfilled by EU countries, but also interim targets
(following an indicative trajectory defined in the RES directive) should be met. Although these
interim targets are not binding they may create demand before the year 2020. Figure 17 and
Figure 18 illustrate the development over time (i.e. from 2011 to 2020) for Austria with respect
to RES volumes and feasible income from or expenditures for RES cooperation. More
precisely, these figures illustrate the overall RES shares and the interim targets up to 2020
(following the RES minimum trajectory), illustrated by continuous lines for selected case).
Additionally, the corresponding feasible yearly income (from selling the surplus above the
minimum trajectory) or expenditures from buying virtual RES volumes on the cooperation
market (necessary if RES deployment is below the given minimum trajectory) is illustrated
(discontinuous lines). See Annex 1 for numerical values. The figures illustrate that Austria
could sell interim surpluses in the upcoming years in all scenarios.
Figure 17: RES trajectories up to 2020 and income from or expenditures for RES cooperation
for A-Scenarios
-600
-300
0
300
600
900
1.200
1.500
1.800
20%
22%
24%
26%
28%
30%
32%
34%
36%
2011 2012 2013 2014 2015 2016 2017 2018 2019 2020
Incom
e (
+)
/ expenses (
-) fro
m R
ES
coopera
tion
[Million €
]
RE
S d
ep
loym
ent
[% o
f gro
ss f
inal ene
rgy
dem
and
]
Case 1A RES deployment Case 2A RES deployment Case 3A RES deployment EU (interim) Target for Austria
Case 1A RES income/expenses Case 2A RES income/expenses Case 3A RES income/expenses

30
Figure 18: RES trajectories up to 2020 and income from or expenditures for RES cooperation
for B-Scenarios
-600
-300
0
300
600
900
1.200
1.500
1.800
20%
22%
24%
26%
28%
30%
32%
34%
36%
2011 2012 2013 2014 2015 2016 2017 2018 2019 2020
Incom
e (
+)
/ expenses (
-) fro
m R
ES
co
op
era
tio
n
[Millio
n €
]
RE
S d
ep
loym
en
t [%
of
gro
ss f
ina
l e
ne
rgy
de
ma
nd
]
Case 1B RES deployment Case 2B RES deployment Case 3B RES deployment EU (interim) Target for Austria
Case 1B RES income/expenses Case 2B RES income/expenses Case 3B RES income/expenses
31
3.3.4 Scenario results – the European dimension
All researched policy cases are tailored to achieve the target of 20% RES by 2020 at the EU
level. Moreover, for all cases (except the reference case) a removal of non-economic barriers
(i.e. administrative deficiencies, grid access, etc.) is assumed for the future13. More precisely,
a gradual removal of these deployment constraints, which allows an accelerated RES
technology diffusion, is conditioned on the assumption that this process will begin in 2011.
The policy framework for biofuels in the transport sector is set equal under all assessed policy
variants: an EU-wide trading regime based on physical trade of refined biofuels is assumed to
assure an effective and efficient fulfilment of the country’s requirement to achieve (at least)
10% RES in the transport sector by 2020. Thereby, second generation biofuels receive a sort
of prioritization (i.e. a higher support given via higher weighting factors within the biofuel quota
regime) in line with the rules defined in the RES directive. Other novel options in this respect
such as e-mobility or hydrogen have not been assessed within this analysis as also no direct
impact on the overall RES target fulfilment can be expected.
The characteristics of each assessed policy pathway are discussed subsequently:
Reference case: RES policies are applied as currently implemented (without any
adaptation) – until 2020, i.e. a business as usual (BAU) forecast. Under this scenario a
modest RES deployment can be expected for the future up to 2020.
Reference case with mitigated non-economic barriers: RES policies are in place as
currently implemented including mitigation of non-economic barriers.
Strengthened national RES policies (Case 1A, 2A, 3A, 1B, 2B, 3B): a continuation
of national RES policies until 2020 is conditioned for this policy pathway, whereby the
assumption is made that national RES support schemes will be further optimized in the
future with regard to their effectiveness and efficiency in order to meet the 2020 RES
commitments. In particular, the further fine-tuning of national support schemes involves
in case of both (premium) feed-in tariff and quota systems a technology-specification of
RES support. No change of the in prior chosen policy track is assumed – i.e. all
countries which currently apply a feed-in tariff or quota system are assumed to use this
type of support instrument also in the future.
However in case of fixed feed-in tariffs a switch towards a premium system is
conditioned to assure market compatibility as relevant with increasing shares of RES-E
in the electricity market.14
13
It can be concluded that a removal of non-economic RES barriers represents a necessity for meeting the 2020 RES commitment. Moreover, a mitigation of these constraints would also significantly increase the cost efficiency of RES support. 14
In general, the process of strengthening of national RES policies for increasing their efficiency and effectiveness involves the following aspects: the provision of a stable planning horizon; a continuous RES policy/long-term RES targets; a clear and well defined tariff structure; yearly targets for RES-E deployment; a guaranteed but strictly limited duration of financial support; a fine-tuning of incentives to country-specific needs for the individual RES technologies; a dynamic adaptation/decrease of incentives in line with general market conditions (i.e. to incorporate the impact of changing energy and raw material prices) and specifically to stimulate technological progress and innovation.

32
The following sub-variants have been assessed:
“National perspective” – national target fulfilment (Case 1A, 2A, 1B, 2B): Within
this scenario each Member States tries to fulfil its national RES target by its own. The
use of cooperation mechanisms as agreed in the RES Directive is reduced to a
necessary minimum: For the exceptional case that a Member State would not possess
sufficient RES potentials, cooperation mechanisms would serve as a complementary
option. Additionally, if a Member State possesses barely sufficient RES potentials, but
their exploitation would cause significantly higher consumer expenditures compared to
the EU average, cooperation would serve as complementary tool to ensure target
achievement. As a consequence of above, the required RES support will differ
comparatively strongly among the EU countries.
“European perspective” (3A, 3B): In contrast to the “national perspective” case as
described above, within this scenario the use of cooperation mechanisms does not
represent the exceptional case: If a Member State would not possess sufficient
potentials that can be economically15 exploited, cooperation mechanisms would serve
as a complementary option. Consequently, the main aim of the “EU perspective”
scenario is to fulfil the 20% RES target at the EU level, rather than fulfilling each
national RES target purely domestically. Generally, it reflects a ‘least cost’ strategy in
terms of consumer expenditures due to RES support. In contrast to simple short-term
least cost policy approaches, the applied technology-specification of RES support does
however still allow an EU-wide well balanced RES portfolio.
Figure 19: Comparison of RES deployment up to 2020 at the European level
according to different RES-policy scenarios.
Source: Green-X, 2011 (RE-Shaping project)
15
In the “European perspective” case economic restrictions are applied to limit differences in applied financial RES support among countries to an adequately low level – i.e. differences in country-specific support per MWh RES are limited to a maximum of 8 €/MWh RES while in the “national perspective” variant this feasible bandwidth is set to 20 €/MWh RES. Consequently, if support in a country with low RES potentials and/or an ambitious RES target exceeds the upper boundary, the remaining gap to its RES target would be covered in line with the flexibility regime as defined in the RES Directive via (virtual) imports from other countries. Moreover, in both variants a stronger alignment of support conditions between countries is presumed for wind energy and PV as for these technologies in the case of premium support a stepped tariff design is generally implemented, offering on the contrary a graduate differentiated support in dependence of the efficiency at the plant site (i.e. the site-specific full load hours). Such a system is currently implemented for example in Germany or France for wind onshore in order to trigger investments not only at best sites and to limit over support simultaneously.
10%
12%
14%
16%
18%
20%
20
11
20
12
20
13
20
14
20
15
20
16
20
17
20
18
20
19
20
20
RE
S d
ep
loym
en
t a
s sh
are
in
gro
ss f
ina
l en
erg
y d
em
an
d [
%]
Str. nat. support -European perspective
Strengthened nat.support - nationalperspective
Reference case withmitigated non-economicbarriers
Reference case -continuing current nationalsupport
Design & implementation of
RES support instruments (improvement of efficiency &
effectiveness of RES support)
Mitigation of
non-economic barriers
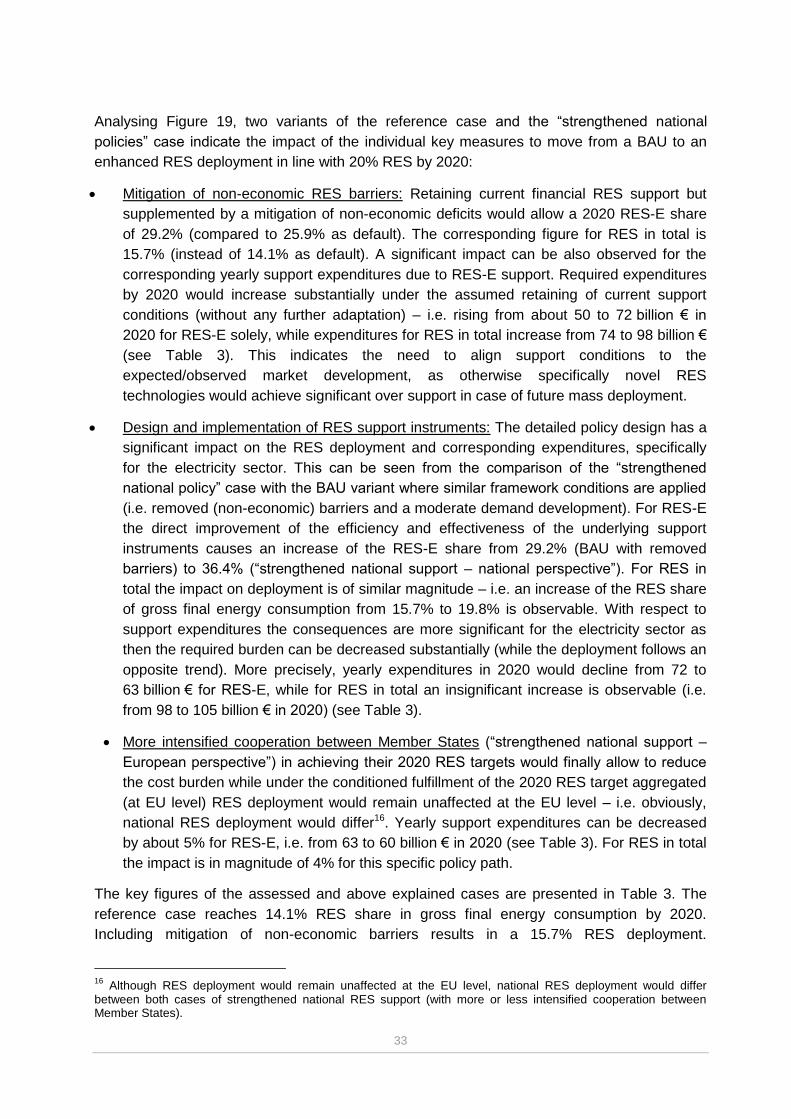
33
Analysing Figure 19, two variants of the reference case and the “strengthened national
policies” case indicate the impact of the individual key measures to move from a BAU to an
enhanced RES deployment in line with 20% RES by 2020:
Mitigation of non-economic RES barriers: Retaining current financial RES support but
supplemented by a mitigation of non-economic deficits would allow a 2020 RES-E share
of 29.2% (compared to 25.9% as default). The corresponding figure for RES in total is
15.7% (instead of 14.1% as default). A significant impact can be also observed for the
corresponding yearly support expenditures due to RES-E support. Required expenditures
by 2020 would increase substantially under the assumed retaining of current support
conditions (without any further adaptation) – i.e. rising from about 50 to 72 billion € in
2020 for RES-E solely, while expenditures for RES in total increase from 74 to 98 billion €
(see Table 3). This indicates the need to align support conditions to the
expected/observed market development, as otherwise specifically novel RES
technologies would achieve significant over support in case of future mass deployment.
Design and implementation of RES support instruments: The detailed policy design has a
significant impact on the RES deployment and corresponding expenditures, specifically
for the electricity sector. This can be seen from the comparison of the “strengthened
national policy” case with the BAU variant where similar framework conditions are applied
(i.e. removed (non-economic) barriers and a moderate demand development). For RES-E
the direct improvement of the efficiency and effectiveness of the underlying support
instruments causes an increase of the RES-E share from 29.2% (BAU with removed
barriers) to 36.4% (“strengthened national support – national perspective”). For RES in
total the impact on deployment is of similar magnitude – i.e. an increase of the RES share
of gross final energy consumption from 15.7% to 19.8% is observable. With respect to
support expenditures the consequences are more significant for the electricity sector as
then the required burden can be decreased substantially (while the deployment follows an
opposite trend). More precisely, yearly expenditures in 2020 would decline from 72 to
63 billion € for RES-E, while for RES in total an insignificant increase is observable (i.e.
from 98 to 105 billion € in 2020) (see Table 3).
More intensified cooperation between Member States (“strengthened national support –
European perspective”) in achieving their 2020 RES targets would finally allow to reduce
the cost burden while under the conditioned fulfillment of the 2020 RES target aggregated
(at EU level) RES deployment would remain unaffected at the EU level – i.e. obviously,
national RES deployment would differ16. Yearly support expenditures can be decreased
by about 5% for RES-E, i.e. from 63 to 60 billion € in 2020 (see Table 3). For RES in total
the impact is in magnitude of 4% for this specific policy path.
The key figures of the assessed and above explained cases are presented in Table 3. The
reference case reaches 14.1% RES share in gross final energy consumption by 2020.
Including mitigation of non-economic barriers results in a 15.7% RES deployment.
16
Although RES deployment would remain unaffected at the EU level, national RES deployment would differ between both cases of strengthened national RES support (with more or less intensified cooperation between Member States).

34
Strengthened national support is needed to reach the EU 2020 target of a 20% RES in the
gross final energy demand. The strengthened national support - national perspective case
projects total support expenditures of € 105 billion by 2020. In the European perspective case
with intensified cooperation to reach the 2020 RES target the total support expenditures by
2020 are reduced to € 101 billion by € 4 billion.
Table 3: Key Figures on RES-E deployment by 2020 and corresponding support
expenditures for researched cases (from BAU to strengthened national support, from
a national/European perspective) Source: Green-X, 2011 (RE-Shaping project)
Key Figures for researched cases - from BAU to strengthened national support
Resulting deployment by 2020
Yearly support expenditures by 2020
Scenario Corresponding measures
RES-E share in gross electricity demand
RES share in gross final energy demand
RES-E support
Support for RES in total
[%] [%] [Bill.€] [Bill.€]
1 Reference case - continuing current national support 24.7% 14.1% 50 74
2
Reference case (moderate final energy demand & mitigated barriers)
(1 --> 2) Mitigation of non-economic RES barriers 29.2% 15.7% 72 98
3 Strengthened national support - national perspective
(2 --> 3) Improvement of design and implementation of RES support instruments 36.6% 19.8% 63 105
4 Strengthened national support - European perspective
(3 --> 4) Intensified cooperation 36.4% 19.8% 60 101
A closer look at the relevant performance indicators shows that improved energy policies
could EU wide lead to:
Additional investments of 462 billion Euros in the overall period 2011 to 2020.
Above indicated investments would trigger about 3,014 PJ additional RES generation
in the year 2020.
An avoidance of 4,773 PJ of fossil primary energy use in 2020.
In last consequence about 341 million tonnes CO2 can be avoided in 2020 by an
enhanced RES generation based on improved energy policies.
RES-E deployment by 2020 and corresponding consumer expenditures for researched cases
The average yearly consumer expenditures (2011-2020) due to RES support for new RES
installations serves as a key indicator for the assessed European cases. The question is how
the cost burden for the consumer of the strengthened national support compares in the
national and European perspective. Figure 20 shows that average yearly consumer
expenditures decrease in the European perspective case compared to the national
perspective case of strengthened national support. This would speak for more cooperation
between EU Member States to fulfill their RES targets compared to national fulfillment only.
35
Figure 20: Comparison of the resulting 2020 RES deployment and the corresponding (yearly
average) consumer expenditures due to RES support for new RES (installed 2011
to 2020) in the EU-27 for selected cases17
Figure 21 depicts the two assessed European cases for strengthened national support on the
national level. The (virtual) exchanges of RES volumes by 2020 due to cooperation
mechanism are plotted for all EU Member States for both cases. The Green-X model
calculates 2.7 TWh of (virtually) exported RES volumes by 2020 in the national perspective
case for Austria, whereas 6.7 TWh are (virtually) exported in the European perspective case.
In other words, this indicates that for achieving the RES target of 20% RES by 2020 from a
European perspective it appears beneficial from an economic viewpoint (i.e. considering
support expenditures as decisive indicator) that Austria does more than required.
Consequently, Austria could then virtually sell the surplus in RES deployment to other
countries facing a deficit.
17
i.e. BAU and strengthened national support without (national perspective) or with intensified cooperation (European perspective) between member states
25,8
36,0
44,241,4
0
5
10
15
20
25
30
35
40
45
50
12,5% 15,0% 17,5% 20,0%
Ave
rag
e (
20
11
to
20
20
)ye
arl
y c
on
su
me
r e
xp
en
ditu
res (
du
e to
RE
S s
up
po
rt)fo
r n
ew
R
ES
in
sta
llatio
ns
(20
11
to
20
20
)
[Bill
.€]
RES deplyoment as share in gross final energy demand [%]
Reference case - continuing currentnational support
Reference case (moderate demand &mitigated barriers)
Strengthened nat. support - nationalperspective
Str. nat. support - Europeanperspective

36
Figure 21: The need for cooperation – (virtual) exchange of RES volumes by 2020 for
selected cases – i.e. strengthened national support without (national perspective) or
with intensified cooperation (European perspective) between member states
Uncertainties regarding prices to which virtual RES volumes will be sold in the future may be a
reason for too little incentives for over fulfillment for some EU Member States at present. From
an EU perspective Austria however would be a country with relatively cheap options for over
fulfilling its RES target and therefore should be encouraged by the RES cooperation
mechanisms to do so.
-50
-40
-30
-20
-10
0
10
20
30
Au
str
ia
Be
lgiu
m
De
nm
ark
Fin
land
Fra
nce
Ge
rma
ny
Gre
ece
Ire
land
Ita
ly
Luxe
mb
ou
rg
Ne
the
rla
nd
s
Po
rtu
ga
l
Sp
ain
Sw
ede
n
Un
ite
d K
ingd
om
Cyp
rus
Cze
ch R
epu
blic
Esto
nia
Hu
ng
ary
Latv
ia
Lith
ua
nia
Ma
lta
Po
land
Slo
vakia
Slo
ven
ia
Bu
lgaria
Ro
ma
nia
(Virtu
al) E
xch
an
ge
of
RE
S v
olu
me
s b
y 2
02
0
due to c
oopera
tion m
echanis
ms [T
Wh] Strengthened nat. support - national perspective Str. nat. support - European perspective
Note: + Export
- Import
Exchange of RES volumes: National perspective: 1.4%
European perspective: 4% … of total RES by 2020

37
4 Macroeconomic Evaluation and External Effects
This chapter describes the two components of economic well-being that are affected by
measures for achieving the Austrian RES-target. These two components are economic effects
displayed on markets (macroeconomic effects) and effects not displayed on markets (“external
effects”). After discussing those two economic components separately in detail, the
combination of both will be considered in the overall assessment of chapter 6.
4.1 Macroeconomic Effects
The scenario results of the Green-X model (chapter 3) provide data on costs of RES-
expansion per technology (depending on the specific scenario). The Green-X model takes into
account the microeconomic view of the investors as well as the macroeconomic view of the
financial transfers (subsidies) needed to enable the investments. Nevertheless, Green-X
doesn’t consider that costs for RES-capacity extension or investments in energy efficiency
measures (EEM) influence the prices of other economic inputs and output commodities, i.e.
economic feedback effects are not taken into account. Energy is an important input factor for
many production sectors and it is unlikely that prices across sectors stay unaffected. An
extension of the RES-capacities is expected to be a significant intervention in Austria’s
economic framework that changes prices, trade flows, tax incomes and employment.
To take into account an adapting economic environment, an existing computable general
equilibrium model (CGE-model) was modified to be used in a comparative static analysis18.
The objective of the CGE-analysis is to gain insights into the total macroeconomic effects
resulting from RES-expansion as well as from additional19 energy efficiency measures, and to
what extent feedback effects are reducing or increasing the first-round costs (investment and
operating cost data gained by Green-X including subsidies, see chapter 3) of achieving a
higher RES-share and thereby influence consumer welfare. Amongst others this CGE-analysis
gives information on the effects in terms of welfare, foreign trade, employment and sectoral
economic activity.
18
Comparative static means that the comparison of the calculated static equilibrium is used for the evaluation of the scenarios. In this context static equilibria are macroeconomic equilibrium states after the process of adjustment. 19 Additional refers to “additional to the reference scenario”
38
4.1.1 The macroeconomic model
As mentioned, the expansion of RES and the implementation of additional energy efficiency
measures (EEM) may have a noticeable effect on the whole economy. To estimate such
effects CGE-models are used since these models consider interconnections and
dependencies of the sectors in an economy, the elasticities of substitution between different
commodities in production and imports as well as the foreign trade and deadweight losses20
caused by subsidies. Thereby they evaluate changes in the entire economic system. In case
of energy consumption welfare is gained by the consumption of energy services21 not by the
physical consumption of energy itself. In this context a reduction of physical energy
consumption due to energy efficiency measures does not reduce welfare. CGE-models are
also able to macroeconomically evaluate technologies in a bottom-up approach by using
information about their detailed cost structure22.
Model description- the EnergClim-model
For this project an existing CGE-model and the underlying database have been adapted and
advanced to be able to process RES-expansion as well as the implementation of EEMs in
Austria. Additionally, data from other projects23 were integrated, if they supplied necessary
external inputs. RES-trade via the cooperation mechanisms was not considered separately,
since it was considered by the Green-X-model already and is therefore already part of the
input data for the economic modeling. The model applied is an extension of a CGE-model that
has been developed by the Wegener Center (University of Graz) within the project
“EnergClim24”. The used computing tool was the program GAMS25 with its specific
programming language MPSGE26. The original purpose was to examine the use of various
biomass based energy technologies in Austria within a global context. To analyze the global
interconnection between states and regions it was necessary to use a global database.
Therefore the GTAP 7 database of the Center for Global Trade Analysis (Purdue University)
was used for the CGE-model27. This fairly advanced data set contains data from 113 regions
and 57 economic sectors (with the base year 2004 in the most recent version). To put the data
in a suitable form it has been remodeled within the EnergClim project to gain so called
consistent "Social Accounting Matrixes" (SAMs), which are typically used as input for CGE-
models. The regions were aggregated to 9 world regions with Austria as separate region.
Additionally the economic sectors were merged into 15 sectors with 5 of them being energy
related sectors (electricity, natural gas, crude oil, coal and petrol & coal products). Furthermore
the consumption of fossil based energy services (e.g. space heat and transport) have been
modeled as additional economic sectors in the SAM of the EnergClim model. This was
20
Deadweight loss or „excess burden“ is the loss of economic efficiency in allocation of goods on a market by taxes or subsidies. 21
Energy services like a cubature kept at a certain temperature level for a particular time, access to people or goods (by transport) 22
Cost structures of the RES-technologies were calculated in WP2 (chapter 2) 23
Project „EnergyTransition“; Project „EISERN “Energieinvestitionsstrategien und langfristige Anforderungen zur Emissionsreduktion“ - project lead: TU Wien. A Project funded by the Austrian Energy and Climate fund. 24
Energ.Clim- Energy supply from agricultural and forestry products
in Austria considering the climate and global change in 2020 and 2040 25
General Algebraic Modelling Systems (GAMS) 26
Mathematical programming system for general equilibrium analysis (MPSGE) 27
GTAP=Global Trade Analysis Project
39
necessary in order to simulate changes in the economy’s demand structure due to increasing
renewable energy services that substitute their fossil counterpart. In the scenarios these fossil
energy service producing sectors compete with the renewable based energy services.
Modification of the EnergClim-model
Since the focus in this project was on the effects of additional RES expansion and additional
EEM on the Austrian economy the amount of regions has been reduced to 4, three European
regions, Austria as an individual region complemented by one Rest-of-World region.
For the purpose of a detailed assessment of macroeconomic effects in the energy sector the
separate analysis of effects on bundles of energy consumption commodities has been
improved compared to the EnergClim model: To be able to process the Green-X data, the
bundle of fossil based heat (on-grid and off-grid) and transport fuel needed to include not only
the demand of private households, but also the demand of the production sectors. Model
improvements carried out within this project allow the total energy demand of the economy to
be represented in the CGE-model (as monetary values). On the production side the RES-
expansion in the CGE-model has been split into investment and operation & maintenance
(O&M) costs to integrate the results of Green-X in more detail. Investments in RES and in
EEM are treated differently in the CGE-model. On one hand the investments in RES are
treated like regular capital investments into energy production, hence this implies just a shift
within the investments in the energy sector towards RES. Investments in EEM on the other
hand are additional investments that go along with a shift from consumption to investments.
EEM therefore lead to a reduction of consumption of the private households and the
government (in the short-run).The actual RES production is represented by costs and cost
structures of Operation and Maintenance (O&M) where the produced RES energy
commodities substitute their respective fossil based counterparts.
Introducing new policies into the model
A common way to simulate a set of political measures in a comparative-static CGE-framework
is to disturb the market equilibrium of the base year by introducing new policy incentives
according to the scenarios defined in chapter 3. The algorithm calculates a new general
equilibrium on all markets28 by adjusting prices and quantities. The result takes into account
direct and feedback effects of these measures relative to the base year equilibrium. In this
project, we implemented additional measures every year over a 10-year period up to 2020.
Therefore the CGE-Model applied in this project has been implemented by means of a
recursive loop where the RES-expansion (investments and O&M costs) and the efficiency
measures (investments and savings) are implemented every year. The levels of expansion of
RES-technologies introduced in the model correspond to the input data from Green-X. The
level of additional energy efficiency is in the same magnitude as the "efficiency case" of the
Austrian NREAP, while the cost structure for additional EEM is taken from the project
EnergyTransition (WIFO, 2011). Within the model runs an annual calculated general
equilibrium is the base equilibrium for the subsequent year. The model has been calibrated to
a reference growth path, i.e. the development until 2050 without additional RES or EEM. This
28
On the factor markets and all sectoral commodity markets
40
means that the growth of the Austrian economy was modeled in a way to achieve an
approximate real growth rate of 2% in GDP per year in the Reference case by adjusting the
development of the capital stock and total factor productivity of the EnergClim-Model.
Application of CGE in the time range 2020-2050
In analogy to the Green-X scenarios and the analysis of Energy Transition (WIFO 2011), all
investments needed to achieve the 2020 RES-target, are taking place in the period until 2020.
As effects from investments in RES-expansion and energy efficiency implemented between
2011 and 2020 mostly last also for the period after 2020 an expansion of the time range for
considering effects until 2050 was necessary. Nevertheless, this project’s main focus is the
evaluation of the investments until 2020. Therefore, follow-up investments of RES and EEM
beyond 2020 are ignored and solely the long-term effects of the investments before and up to
2020 are evaluated. For this expansion of the considered time horizon – how investments
undertaken by 2020 impact up until 2050 – several steps were needed. First, in each scenario,
the number of recursive loops was increased to reach until 2050. Thereby the previous
mentioned baseline growth was continued. Second, the economic lifetime of each RES-
technology and EEM had to be determined. The RES energy production as well as the energy
savings in each scenario and each technology decreased respectively according to their
lifetime until 2050. Thirdly, expiring RES-technology subsidies have been considered in the
model. This means, that additional generation costs are not covered by subsidies over the
whole lifetime of the technology. And finally all external input data29 needed to be extended to
2050. In the CGE-model the mentioned economic baseline growth is simplified and is caused
by a change in available labor force, capital stock and total factor productivity. The last
component covers technical improvements, but nevertheless the model assumes that
economic growth still leads to an increasing energy demand after 2020 in the reference
scenario30. However, the energy production from renewables and the energy savings of these
investments stay active also after 2020 until the end of their economic lifetimes. Intensified
EEM can stabilize energy demand for a certain period, however it is assumed in the model
that after the technical life of EEM implemented in the period 2011-2020 energy demand
converges to the level of the reference scenario once again. Additional RES-expansion shrinks
the energy demand covered by fossil energy sources, but does not reduce the energy demand
by itself.
Input data
To get a comprehensive view of the economy, a range of external input data was used. In the
following a short description of use and source of this data is given.
Energy efficiency measures
The costs of energy efficiency measures (EEM) are based upon the results of the project
EnergyTransition (WIFO, 2011). This report includes detailed descriptions of efficiency
measures for Austria in the sectors transport, production and buildings. A sectoral investment
input structure as well as an approximate monetary value of the energy savings was extracted
thereof. Investments with this cost structure are activated yearly up until 2020 and are enabled
29
Import prices of fossil energy commodities, taxes for CO2 emissions 30 Note: The planned EU Energy Efficiency directive may stabilize or reduce energy consumption in the long-term
41
by a reduction in private and public consumption. The energy savings from the EEM linearly
increase until 2020 and thereafter decrease respectively according to the estimated lifetimes
of the measures.
CO2 Prices
In addition to economic data the GTAP 7 database contains also data on sectoral CO2
emissions. The EnergClim-model used this data to link the used input of fossil fuels in the
economic sectors to CO2 emissions. The CGE-model adopted this method because it makes it
possible to model a imposed tax per ton CO2 input of the energy intense sectors (ETS). The
magnitude of this tax was based upon data from the project EISERN31. The revenues of this
tax are transferred in the model to the regional household32. Climate policy leads to increasing
prices of CO2-intensive commodities and also to a reduction in welfare due to the deadweight
loss of the tax. This negative effect is highest in the Reference case. That means that the
expansion of RES and the installation of EEM decreases this welfare loss when the energy
production (and implied CO2 emissions) from fossil fuels shrinks in all scenarios.
Labor market
An additional important factor for growth and welfare is the labor market. In the EnergClim-
Model unemployment is included (non-clearance of the labor market; according to reality that
unemployment exists). The neoclassical assumption hereby is that minimum wages requested
by the labor force are too high for the market to be in equilibrium clearance. With an increasing
demand for labor – and consequently rising wages – labor employed increases and new factor
incomes are generated. In the Reference case the unemployment rate is fixed to an
approximated 2010 level of 5%. The effect on employment differs across scenarios since the
RES-technologies and EEM investments affect the labor market differently. Therefore the
scenario effects on the labor market depend on the mix of RES-technologies and EEM.
Energy Prices
The third important inputs for the model are price assumptions for fossil fuels and resulting
prices of the energy generated. Rising energy prices influence the modeling of the scenarios in
two ways. Firstly, rising energy prices increase the positive effects of the decreased imports of
fossil fuels. Secondly, they increase the reference price and thereby improve the
competitiveness of RES-installations.
31
Projekt EISERN – „Energieinvestitionsstrategien und langfristige Anforderungen zur Emissionsreduktion“ - project lead: TU Wien. A Project funded by the Austrian Energy and Climate fund. EISERN bases its data on projections by the IEA. 32
Regional household stands for the government and private households

42
Table 4: Sources of energy price data
For the period 2011-
2020
For the period
2020-2050
Energy prices Electricity, Transport fuel,
Heat (on-grid, off-grid)
Green-X PRIMES (2009)
EISERN33
(fossil fuel prices)
Fossil fuel prices Coal, Crude oil,
Natural gas
Green-X EISERN34
(fossil fuel prices)
Table 4 gives an overview of sources for energy price assumptions used in the CGE-model.
For 2011-2020 energy prices as well as fossil fuel prices were used according to Green-X
data. For the period after 2020 data from other projects were combined in two steps. The first
step was to estimate fossil fuel prices. For this purpose the forecasted growth of fossil fuels
from the project EISERN was used to extrapolate the assumed prices of the Green-X model.
The second step was to use these estimated fossil fuel prices and combine them with the
shares of fossil fuels in the future energy production in transport, heat and electricity. These
shares were taken from the PRIMES 2009 forecasts (which include a forecast until 2030). The
shares were kept at the same level for the period after 2030.
4.1.2 Results of the macroeconomic modeling
This section displays and discusses the macroeconomic results of the six scenario simulations
(for scenario definition see chapter 3). These reflect the impact of the scenario assumptions on
the whole economy and are displayed as deviations from the reference case. Future costs and
revenues were discounted at a rate of 2.5% p.a.. A main result of the macroeconomic
modeling is the effect on consumption35. In this model the consumption does not only include
the consumption of goods and services, but also the value of saved energy due to previous
investments in EEM. Using this approach, consumption serves as an index for macroeconomic
welfare36. In other words, using saved energy costs (e.g. due to lower heating demand
resulting from increased insulation) additionally to a constant consumption level represents an
increase in welfare since more commodities as well as the heat can be consumed. The saved
energy is valuated by the energy prices (e.g. €/kWh for space heating) in the model. Therefore
a net increase (decrease) in consumption means a higher (lower) level of welfare.
Subsequently in this chapter results for the short-term and the long-term view are discussed.
The time horizon until 2020 is denominated as short-term view since the economic lifetime of
RES-technologies and especially EEM-investments37 is up to 40 years and thus much longer.
The long-term view considers the developments until 2050 when the economic lifetimes of
most investments have ended.
33
Project EISERN – „Energieinvestitionsstrategien und langfristige Anforderungen zur Emissionsreduktion“ - project lead: TU Wien. A Project funded by the Austrian Energy and Climate fund. EISERN bases its data on projections by the IEA. 34
Ibid 35 Based on a demand function with constant elasticities of substitution 36
Macroeconomic welfare is a level of utility that is gained by consumption of goods and services 37
E.g. hydro power and passive houses

43
Results for the short term perspective until 2020
According to the scenario definitions all capital investments in RES and EEM are made in the
time period until 2020, thereby achieving the respective RES-share levels of each scenario.
The production of energy is based on RES increases according to the results from Green-X.
This increase in the RES-shares for energy generation causes economic effects due to
structural changes of the energy supply structure as well as respective prices, as renewable
energy generation partly demands other inputs (technology specific input structure) than fossil-
based energy production.
The results include three main components:
Consumption. Consumption represents the welfare of the society.
Trade balance. The trade balance expresses the difference between the values of
imported and exported commodities. It is crucial to understand that the level of
consumption is connected to the trade balance as it affects the import of commodities.
If increasing consumption is requiring increasing imports, and this is not accompanied
by a rise in exports, it results in a trade balance deficit which is financed by foreign
depts.
Gross fixed capital investments. The investments lead to changes in the economy’s
capital stock over time.
Table 5 summarizes the effects on central macroeconomic parameters as monetary deviations
from the reference case and accumulated over the 10-year period 2011-2020.
Table 5: Accumulated results of macroeconomic effects until 2020 (2.5% discount rate)
The effects on consumption in the A-scenarios differ in prefix but considering that they
represent accumulated numbers for a 10-year period they are relatively small. Even though
the consumption in 2A and 3A is positive it can be seen that consumption effects are
overcompensated by increased net imports financed by foreign creditors. The reasons for this
are twofold. First, some RES-technologies (especially PV) need commodities (such as
Consumption cum.
2011 - 2020
Gross fixed capital investments
cum. 2011-2020
Foreign Trade Balance cum. 2011-2020
Mio € compared to Reference Scenario – discounted
1 A -975 -740 -1.038
2 A 754 -31 -2.988
3 A 431 2.993 -5.585
1 B -36.640 38.680 1.131
2 B -37.473 37.364 1.571
3 B -36.075 38.383 -381
44
technical components) with high import shares. Therefore an increase in RES-production in
these technologies leads to a higher demand for imports. Second, the installation of
noncompetitive RES-technologies38 leads to increased energy prices. Since energy is an input
in all sectors of the economy the domestic price level rises compared to other regions. This in
turn leads to a reduced demand for domestic exports while increasing the demand for –
relative – cheaper imports from abroad. An opposite effect arises from decreased demand for
the increasingly expensive fossil fuels, but it can’t outweigh the tendencies for negative trade
balance effects in the A-scenarios.
The B-scenarios show a quite different picture. Adjusted data39 from the EnergyTransition
(WIFO 2011) project show, that the needed expenses on EEM are about €46 billion over the
considered 10-year period. The investments in EEM are additional investments to the yearly
economic gross fixed capital formation40. Since funds generally available in the economy are
either used for consumption or investments these additional investments (€46 billion)
consequently lead to a reduction in consumption during the investment period. Taking this into
account it is obvious that EEM have a major influence on the overall consumption (and
welfare) in the short term. As displayed in Table 5 by highly negative consumption in the B-
scenarios within the period 2011-2020, a transfer of funds from consumption towards capital
investment takes place. This of course leads to a higher capital stock (see gross fixed capital
investments in Table 5). These investments in energy efficiency pay off in form of energy
savings. The payoff of the investments (in form of saved energy expenses) occurs over a long
term period along the lifetimes of the technologies/investments. Until 2020 these payoffs do
not prevail, i.e. do not compensate the investment costs.
Unlike in the A-Scenarios, the trade balance is almost balanced or even positive for the B-
Scenarios. This has two reasons. First, due to only moderate RES-capacity expansion in all B-
scenarios only a small impact on imports occurs. The second reason is that EEMs mainly
demand commodities that have a low import rate (e.g. construction services).
Development of consumption over time
For a better understanding of the results it is useful to have a look at the development of
consumption over time. (The trade balance effects over time until 2020 and the
macroeconomic effects of single technologies can be found in Annex 2).
38
The generation of RES-energy is more expensive relative to the reference generation costs of the respective energy form (Heat, Electricity or transport fuel). These additional generation costs were calculated by the Green-X model. 39
The data from the Energy Transition contains packages of energy efficiency projects in Austria. The data was
adjusted to meet a reduction in final energy consumption of 150 PJ by 2020. 40
The macroeconomic expression for the total capital investments of an economy within one year

45
Figure 22: Deviation of consumption relative to the reference case
The results of the A-scenarios in Figure 22 show a (compared to the reference case) relatively
lower consumption level within the first years and an increase towards 2020 in case 2A and
3A. The reasons for this deviation compared to the reference case are twofold: on the one
hand the negative effects are caused by accelerating the expansion of non-competitive and
therefore relatively expensive RES-technologies and by the deadweight loss due to the
necessary subsidies granted for RES-technologies41. On the other hand the positive effects
are caused by increased domestic employment, a higher capital stock of RES-facilities and
therefore higher amounts of return on investment for consumption uses as well as the
reduction of the increasingly expensive imports of fossil fuels.
Along the B-scenarios it is easy to see that the effects of the reduction in consumption due to
investments in EEM dominate up to 2020. Figure 22 shows that the consumption in the B-
scenarios is clearly below the reference consumption. Nevertheless, the consumption growth
in the B-Scenarios is stronger than in the A-scenarios. The reason for that is that funds,
formerly used for energy consumption, due to increased energy efficiency gradually becomes
available to a bigger extent for other consumption purposes. This increases in the long run the
consumption possibilities as beside higher consumption the same energy service (e.g. warm
houses) can still be consumed – but just at smaller costs. This long-term increase in
consumption possibilities increases also the welfare. However, before getting this benefits
energy efficiency investments have to be financed. For that the government and the private
households would need to reduce their total consumption at an average of 1.7% per year in
the time period until 2020 to reach the level of energy savings according to the ReFlex
Efficiency Scenario.
41 Deadweight loss or „excess burden“ is the loss of economic efficiency in allocation of goods on a market by taxes or subsidies.

46
To conclude the view until 2020: The B-scenarios lead to a high reduction in consumption (in
the short run), a higher capital stock and have small negative or positive effects on the trade
balance. In the A-scenarios consumption remains relatively constant while imports increase in
all A-scenario cases.
Scenario results for the time until 2050
The view until 2020 is insufficient to compare the outcomes of the scenarios since the pay-off
of the EEM occurs over a long period of time42. Therefore the period under investigation has
been expanded up to 2050. The view until 2050 includes all the long-term payoffs of the
investments that have taken place until 2020. These payoffs are energy savings, less import of
expensive fossil fuels, higher employment and the capital rent from the RES installations. This
view – including the whole lifetime of most of the installed technologies – allows evaluating the
total long-term effects on welfare of investments, of the production of renewable energy and of
energy savings.
42
Up to 40 years in case of passive houses or thermal rehabilitation

47
Table 6: Accumulated results of macroeconomic effects until 2050 (2.5% discount rate)
The outcome of all A-Scenarios – as shown in Table 6 – is a strong increase in welfare;
however there are strong negative effects on the trade balance. In particular in 2A and 3A
there are strong positive welfare effects compared to the short term view (compare with Table
5).
In contrast, the reduction in consumption in the B-scenarios– due to the EEM investments until
2020 – is far lower than in the short term view. However, the highly negative consumption in
the short-term view is compensated by positive effects (energy cost savings, return on capital)
only in 3B that has positive welfare effects up to 2050 as positive effects and feedback
effects43 prevail. Case 1B and 2B show a negative total deviation in consumption when
applying a discount rate of 2.5% up to 2050. The foreign trade balance in the B-scenarios
shows a similar picture as the results until 2020: a small but positive effect on foreign trade
balance in the cases 1B and 2B, while the moderate expansion of RES-support in 3B leads to
a negative effect.
The results regarding gross fixed capital investments among all scenarios differ from the
results until 2020. The capital investments – and thereby the capital stock – increases
noticeable in the cases of moderate and strong expansion of RES capacities (i.e. 2A, 3A and
3B) as well as in cases of increased energy efficiency (B-scenarios). This sketches the
complex effect of the expansion of RES capacities. The higher domestic energy production
increases the domestic value added. That is partly compensated by imports, but still leads to
higher demand for labor, which leads consequently to more revenues available for
consumption, savings and investments and thereby to an increasing capital stock and – once
again – factor (labor, capital) incomes.
43
i.e. a higher disposable income, a higher demand for labor and thereby a higher employment rate leading to higher economic growth and capital investments what again leads to more factor income, more demand for goods and labor.
Consumption cum.
2011 - 2050
Gross fixed capital investments
cum. 2011-2050
Foreign Trade Balance cum. 2011-2050
M€ compared to Reference Scenario - discounted
1 A 3.053 530 -4.433
2 A 12.434 3.656 -8.612
3 A 18.762 8.776 -15.990
1 B -1.710 39.400 806
2 B -2.611 38.064 1.485
3 B 8.185 42.031 -5.212
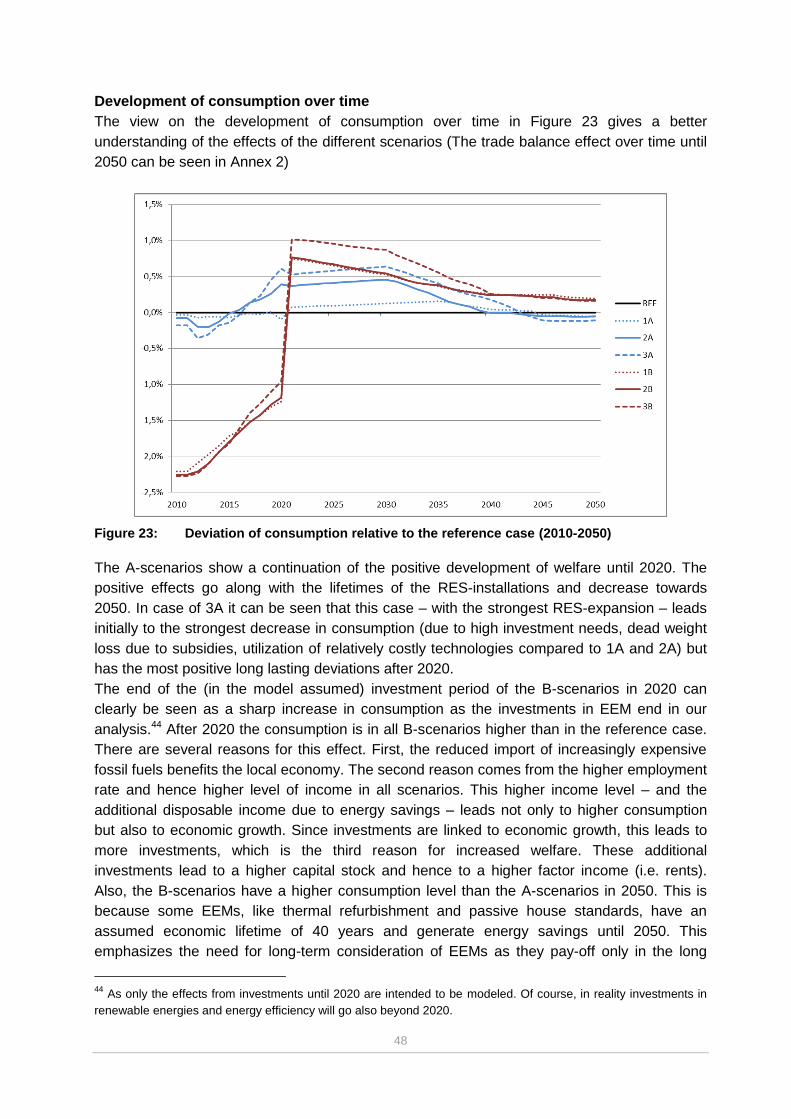
48
Development of consumption over time
The view on the development of consumption over time in Figure 23 gives a better
understanding of the effects of the different scenarios (The trade balance effect over time until
2050 can be seen in Annex 2)
Figure 23: Deviation of consumption relative to the reference case (2010-2050)
The A-scenarios show a continuation of the positive development of welfare until 2020. The
positive effects go along with the lifetimes of the RES-installations and decrease towards
2050. In case of 3A it can be seen that this case – with the strongest RES-expansion – leads
initially to the strongest decrease in consumption (due to high investment needs, dead weight
loss due to subsidies, utilization of relatively costly technologies compared to 1A and 2A) but
has the most positive long lasting deviations after 2020.
The end of the (in the model assumed) investment period of the B-scenarios in 2020 can
clearly be seen as a sharp increase in consumption as the investments in EEM end in our
analysis.44 After 2020 the consumption is in all B-scenarios higher than in the reference case.
There are several reasons for this effect. First, the reduced import of increasingly expensive
fossil fuels benefits the local economy. The second reason comes from the higher employment
rate and hence higher level of income in all scenarios. This higher income level – and the
additional disposable income due to energy savings – leads not only to higher consumption
but also to economic growth. Since investments are linked to economic growth, this leads to
more investments, which is the third reason for increased welfare. These additional
investments lead to a higher capital stock and hence to a higher factor income (i.e. rents).
Also, the B-scenarios have a higher consumption level than the A-scenarios in 2050. This is
because some EEMs, like thermal refurbishment and passive house standards, have an
assumed economic lifetime of 40 years and generate energy savings until 2050. This
emphasizes the need for long-term consideration of EEMs as they pay-off only in the long
44
As only the effects from investments until 2020 are intended to be modeled. Of course, in reality investments in
renewable energies and energy efficiency will go also beyond 2020.

49
term. Nevertheless, due to the applied discount rate of 2.5% this higher level of consumption
in the long-term in the B-scenarios is reduced significantly as Table 6 shows. The accumulated
deviation of consumption from the Reference case along the B-scenarios is only positive for
Scenario 3B. That means that the discounted payoff to cover the investment costs is only
sufficient in the case where the EEMs are implemented in combination with a moderate
expansion of RES support.
Change of employment
A crucial factor regarding the development of welfare is the amount of available labor force. As
mentioned in above a 5%45 level of unemployment was assumed in the reference case. This
approach is based on the neoclassical approach that at an existing wage a certain amount of
the labor force is not willing to supply their manpower.
Figure 24 shows the overall effect of the scenarios over the assessed 40 years period. In this
figure positive effects on employment (i.e. decrease of unemployment rate) are displayed on
the positive axis. I.e. the +1% line in the figure stays for a 1% decrease of the reference
unemployment rate.
Figure 24: Absolute change of employment rate of Austria
In Figure 24 generally the A-scenarios tend to have positive effect on the labor market. The
reason for the positive effect is that the RES-expansion of the A-Scenarios significantly
includes biomass intensive technologies. These technologies demand domestically produced
biomass products as input which triggers a further demand for labor.
It can be seen that focusing only on EEM (case 1B and 2B) has just a moderate positive
impact on the employment whereas a combination with a moderate increase of RES-support
in case 3B leads to highly positive effects on employment. This result is counterintuitive since
the EEM largely consist of investments in construction activities and are thereby labor
45
5% is an approximation of Austria’s average unemployment level in 2010 (4.4%) (Statistik Austria).
50
intensive. As it turns out the increase in the activity of the construction sector (CONT) due to
the investments in EEM decreases the activity of another labor intensive sector which is “other
services” (SERV). The economic sector SERV is a large part of the domestic consumption of
the public and private consumer. This means that as soon as the private and public
consumers invest in EEM (and reduce their other consumptions) the demand for SERV
decreases and so does the demand for labor (as SERV is more labor intensive than CONT).
However, as CONT is more labor intensive than the weighted average of all other economic
sectors, the investments in EEM have a minor but noticeable positive impact on the
employment.
To conclude, this chapter shows that – according to the underlying model – the expansion of
RES capacities and the implementation of EEM have a noticeable effect on welfare and the
economic activities in Austria. However, the results of chapter 4.1 merely display the
macroeconomic view of the scenarios. Other factors like external effects as well as RES and
greenhouse gas certificates trade have to be taken into consideration as discussed in the
following chapters.
4.2 External effects of the assessed scenarios
When implementing measures to convert the energy supply system into a low carbon system
the resulting impacts on society’s welfare are not only caused by the resulting effects on
markets (e.g. labour or goods market). Rather, society’s welfare is also affected by effects not
represented on markets and not fully accounted for by individuals. Literature often refers to
this kind of effects as “externalities” or “external effects”, which can be positive or negative and
usually are not considered sufficiently in economic assessments and decision making
processes. The lack of taking into account externalities in decision making processes leads to
an inefficient allocation of resources from an overall society’s welfare point of view and
therefore to a society’s welfare loss.46 Thus, to maximize the Austrian society’s welfare an
Austrian strategy for increasing the share of renewables in the final energy consumption
should take into account also externalities besides macroeconomic effects. In the following we provide a short introduction on different kinds of externalities as well as
their methods for quantification and constraints. In a subsequent step, energy related external
effects from the six analysed scenarios are discussed in order to compare and analyse
different scenarios as well as to show the impacts of different policy choices. Finally we test
the role of the discount rate for the magnitude of external effects.
Many efforts have been made in the past to understand different types of external effects and
to quantify them. Studies such as ExternE47, CAFE48, NewExt49 or RECaBs50 are only a few
examples.51 Corresponding literature distinguishes between the following types of external
effects from energy use: 52
46
See Friedrich et al. (2004), p. I-1 47
Externalities of Energy; Bickel & Friedrich (2005) 48
“Clean Air for Europe”; Watkiss et al. (2005b) 49
“New Elements for the Assessment of External Costs from Energy Technologies”; Friedrich et al. (2004) 50
Renewable Energy – Costs and Benefits for Society; EA Energy Analyses (2007) 51
For a comprehensive compendium see e.g. Maibach et al. (2007), p. 128 et seq 52
For a comprehensive compendium see e.g. Steiner (2006) or EA Energy Analyses (2007)

51
Damages from climate change caused by greenhouse gas emissions: the anticipated
increase of extreme weather events (floods, draughts, etc.) may not only lead to
damages on infrastructure and environment (e.g. crop yields), but also to impacts on
human health, e.g. caused by extreme and long-lasting heat waves.
Damages from air pollutants on human health, materials and crops: besides particulate
matter (PM10, PM2.5) also SO2, NOx and VOC emissions affect human health through
the formation of secondary pollutants. Furthermore, emissions of NOx and VOC affect
human health through the formation of ozone. Buildings-related damages are mainly
caused by SO2 (acidification), but also by ozone. Emissions from SO2, NOx and VOC
also adversely affect crops and ecosystems through the formation of secondary
pollutants.53
Potential costs from nuclear damages based on historic records. Moreover, this
component includes long-term health costs of radioactive emissions from abandoned
uranium mill tailings.54
Costs of fuel supply security (if not internalized)
Noise
Some other external effects like reduced biodiversity, damages on the overall
appearance of the landscape or usage of exhausting energy sources55are also
mentioned in literature.
However, though there is a wide variety of types of external effects caused by the use of
energy, it can be concluded from literature that the lion’s share of human health and
environmental effects from energy use stem from air emissions. Air emissions typically
account for 85 % or more of total external effects from energy use.56 When adding also
external effects from climate change it can be concluded, that the vast majority of external
effects from energy use described in literature is represented in the subsequent analysis.
For determining external costs of greenhouse gases, quantifiable damages of global warming
are estimated. However, in order to address large uncertainties and possible information gaps,
an “avoidance cost” approach is used.57 Damages from air pollution are estimated with the
help of the “impact-pathway” approach.58 Figure 25 shows in a simplified way the main steps
of this approach:
Figure 25: Principal steps of the impact-pathway approach for estimating external costs of
air pollution (Source: Bickel & Friedrich et al., 2005)
53
Compare with European Environment Agency (EN35) 54
Compare EA Energy Agency (2007), p. 77 55
See Kaltschmitt et al. (2000) 56
Compare Burtraw & Toman, p. 2 57
See Bickel & Friedrich (2005), p. 1 58
See Bickel & Friedrich (2005), p. 1 and p. 35 et seq.
52
In a first step, relevant technologies and pollutants are specified, i.e. the quantity of emissions
per energy output (for instance of a power plant) is surveyed. In a second step, the dispersion
of pollutants is calculated. By applying a dose-response function in a third step the physical
impacts of emissions on human health, materials and crops etc. are estimated. In a final step
effects on human health, materials and crops etc. are monetized.
Although the main principle of this approach is widely used in literature, detailed assumptions
vary considerably. Taking the modelling of air pollutants’ dispersion as an example: whereas
the CAFE study uses the EMEP model, ExternE calculates the dispersion of air pollutants via
the Windrose Trajectory Model.59 Furthermore, literature has varying assumptions about the
harmfulness of air pollutants.60 Also the monetization of damages (mainly on human health) is
rather contentious as there are different methods: Whereas ExternE uses the “Value of Life
Years” (VOLY) approach, CAFE takes the “Value for a Statistical Life” (VSL) approach which
leads to higher estimates.61
Furthermore, environmental externalities are highly site-specific and external costs per air
pollutant “will vary widely even within a given country according to the geographic location”62
CAFE states that generally “the highest damages are found from emissions in central Europe
and the lowest from countries around the edges of Europe. This reflects the variation in
exposure of people and crops to the pollutants of interest – emissions at the edges of Europe
will affect fewer people than emission at the centre of Europe.”63
These uncertainties, different quantification approaches and dependencies on geographical
circumstances complicate the assessment of external costs from energy use. Nevertheless it
is necessary to take external effects into consideration because otherwise this may result in
making wrong decisions as stated by Bickel & Friedrich et al. (2005): “… the uncertainties
should not purely be looked at by themselves; rather one should ask what effect the
uncertainties have on the choice of policy options. The key question to be asked is how large
is the cost penalty if one makes the wrong choice because of errors or uncertainties in the cost
or benefit estimates? “64 The authors came to the conclusion for numbers provided in ExternE
that “the risk of cost penalties is surprisingly small even with a very large range of
uncertainties.” 65
4.2.1 Methodology for calculating external effects
The methodology to quantify the changes of external effects in the six different scenarios of
this project can be split into two components. The first component is the quantification of the
change in emissions caused by the implementation of measures in the considered scenarios.
In the second component these emission changes are multiplied by marginal damage costs of
CO2 and relevant local air pollutants. Certainly, among the great variety of sources for
externalities (beside emissions also noise, biodiversity, etc.) it is clear that changes in
emissions of greenhouse gases and local air pollutants account only for a part of total
changing externalities. However, according to Aunan et al. (2000) health effects – mainly
59
Watkiss et al. (2005a), p. 4 60
See European Environment Agency (EN35), p. 10 61
For a more comprehensive comparison of both approaches see European Environment Agency (EN35), p. 11 62
European Environment Agency (EN35), p. 4 63
Watkiss et al. (2005b), p. 12 64
Bickel & Friedrich et al. (2005), p. 264 65
Ibid

53
caused by emissions of local air pollutants – typically account for 70-90 % of the total value of
externalities. Therefore, by including externalities caused by local air pollutants and a
changing climate, the major part of externalities described in literature is considered in the
analysis.
First component of the methodology:
Aim of this component is to quantify annual occurring domestic effects on greenhouse gas and
local air pollutant emissions, which are caused by fuel switch and energy efficiency measures
in the different scenarios analysed. This quantification is partly based on the results of the
Green-X model, which derives for each scenario data on increased use of RES for transport
as well as for generating electricity and heat. This expanded use of RES substitutes energy
sources for generating electricity, heat and mobility in the previous – i.e. pre 2011 –
composition of the energy mix (before additional measures were implemented). This is similar
for energy efficiency measures, where avoided energy consumption is composed by a mix of
not only fossil sources, but also renewable sources. Calculations of energy savings from
energy efficiency measures are based on the study “Energy Transition” (WIFO 2011), that
provided comprehensive data regarding energy efficiency measures in Austria.
Based on RES expansion as well as energy efficiency in different scenarios emission factors
have been assigned to each energy source (technology). This enabled us to calculate the
change in emissions compared to the reference scenario: a fuel switch from fossil based
energy to RES leads to a lower need for fossil energy, which goes along with reduced
emissions from greenhouse gases and in some cases local air pollutants. On the other hand
an increased use of RES leads also to emissions of local air pollutants (e.g. due to combustion
of biomass). The reduction in energy demand by energy efficiency measures in contrary
reduces emissions and is not accompanied by emission increases from other energy sources.
The used emission factors per unit of energy output of a specific technology are based on
most current information, mainly on data from the GEMIS database (Global Emission Model
for Integrated Systems)66, but also in some cases from literature for specific technologies.
Assigning emission factors to a changing use of energy sources leads to information about
changing emissions of greenhouse gases and local air pollutants (NOx, SO2, NMVOC, NH2,
particulates, CO) for each scenario.
In general, the emission effects of interest in these calculations are those, which would be
achieved over the service life of the measure (for expanding RES-capacities and energy
efficiency). The measures considered in the analysis are those implemented by 2020, the year
by which the agreed RES-targets must be achieved. However, effects of measures are
considered up to 2050 as measures have service lifetimes beyond 2020. That means that
external effects of measures were considered from the time of their implementation until the
end of their lifetime– also beyond 2020 but no longer than 2050.
We decided to set the system boundary in a way that only direct67 emissions from energy use
are considered, since a comprehensive life cycle analysis for each technology would go
beyond the scope of this study. This approach is therefore certainly sufficient for contributing
to the decision on which strategy (1A-3B) should be pursued for achieving Austria’s RES
66
Umweltbundesamt (2009b) (Austrian Environment Agency) 67
Direct emissions are emissions which occur at the same time when running a technology (e.g. emissions in fine particulates due to the combustion of biomass for heating purposes). It does not include emissions occurred for manufacturing a technology or for producing fuels for running a technology
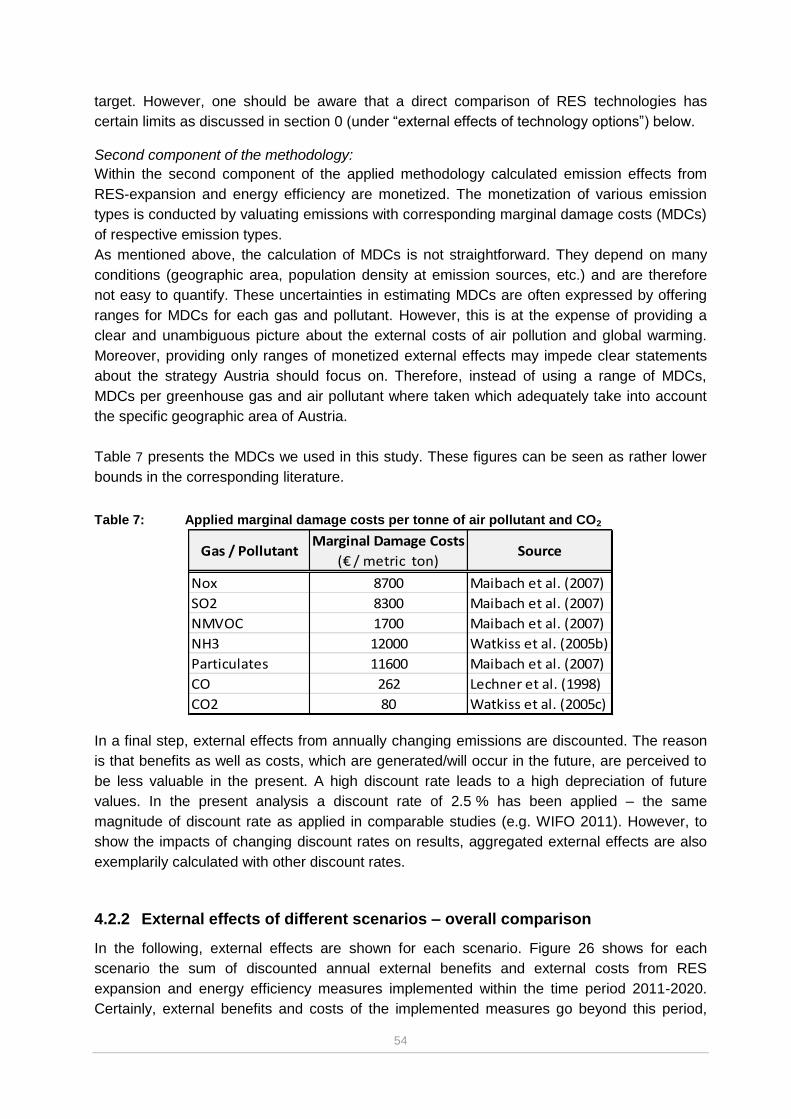
54
target. However, one should be aware that a direct comparison of RES technologies has
certain limits as discussed in section 0 (under “external effects of technology options”) below.
Second component of the methodology:
Within the second component of the applied methodology calculated emission effects from
RES-expansion and energy efficiency are monetized. The monetization of various emission
types is conducted by valuating emissions with corresponding marginal damage costs (MDCs)
of respective emission types.
As mentioned above, the calculation of MDCs is not straightforward. They depend on many
conditions (geographic area, population density at emission sources, etc.) and are therefore
not easy to quantify. These uncertainties in estimating MDCs are often expressed by offering
ranges for MDCs for each gas and pollutant. However, this is at the expense of providing a
clear and unambiguous picture about the external costs of air pollution and global warming.
Moreover, providing only ranges of monetized external effects may impede clear statements
about the strategy Austria should focus on. Therefore, instead of using a range of MDCs,
MDCs per greenhouse gas and air pollutant where taken which adequately take into account
the specific geographic area of Austria.
Table 7 presents the MDCs we used in this study. These figures can be seen as rather lower
bounds in the corresponding literature.
Table 7: Applied marginal damage costs per tonne of air pollutant and CO2
In a final step, external effects from annually changing emissions are discounted. The reason
is that benefits as well as costs, which are generated/will occur in the future, are perceived to
be less valuable in the present. A high discount rate leads to a high depreciation of future
values. In the present analysis a discount rate of 2.5 % has been applied – the same
magnitude of discount rate as applied in comparable studies (e.g. WIFO 2011). However, to
show the impacts of changing discount rates on results, aggregated external effects are also
exemplarily calculated with other discount rates.
4.2.2 External effects of different scenarios – overall comparison
In the following, external effects are shown for each scenario. Figure 26 shows for each
scenario the sum of discounted annual external benefits and external costs from RES
expansion and energy efficiency measures implemented within the time period 2011-2020.
Certainly, external benefits and costs of the implemented measures go beyond this period,
Gas / PollutantMarginal Damage Costs
(€ / metric ton)Source
Nox 8700 Maibach et al. (2007)
SO2 8300 Maibach et al. (2007)
NMVOC 1700 Maibach et al. (2007)
NH3 12000 Watkiss et al. (2005b)
Particulates 11600 Maibach et al. (2007)
CO 262 Lechner et al. (1998)
CO2 80 Watkiss et al. (2005c)

55
until the end of the expected service life of investments made. On the one side, the use of
RES technologies causes external costs due to emissions of local air pollutants (e.g.
biomass). In the analysed scenarios heating with renewable energies (RES-H) causes – in
absolute terms – the highest external costs, whereby the highest share of external costs from
heating is caused by non-grid heating. Comparatively low are external costs caused by
electricity generation from renewables (RES-E) and transport using renewable fuels (RES-T).
However, on the other side, reducing emissions from the reference energy mix by an
intensified RES expansion in the sectors grid-heat (Avoided-Reference-H-grid) and non-grid
heat (Avoided-Reference-H-non-grid) as well as electricity (Avoided-Reference-E) and
transport (Avoided-Reference-T) leads to a compensation of external costs from using RES
Once again, an intensified use of RES in the sector heating achieves the highest external
benefits, whereby especially transforming non-grid heating systems leads to the highest
external benefits. It turned out (illustrated by Figure 26) that external benefits from RES
expansion by far exceed external costs due to emissions of local air pollutants from RES use
(e.g. form biomass). Beside RES expansion also energy efficiency measures leads to external
benefits. In this respect one major advantage of energy efficiency measures is that they do not
only lead to a substitution of energy sources but to a real reduction of energy demand. For the
analysed scenarios, most external benefits can be achieved by energy efficient buildings
(EFF-Buildings). However, also external benefits caused by energy efficiency in the production
sector (EFF-Production) and transport service (EFF-T) are not negligible.
As shown in Figure 26 external benefits as well as external costs of RES expansion steadily
rise from the reference scenario to scenario 3A. In the B-scenarios both external benefits as
well as external costs of RES expansion are comparatively low, as the general demand for
energy decreases and therefore less RES expansion is required. Nevertheless, in the B-
scenarios external benefits are further increased by energy efficiency measures.
Figure 26: External Benefits and Costs of measures implemented between 2011 and 2020

56
To ensure the comparability of the scenarios, balancing external benefits with external costs is
necessary. These net external effects of each scenario are shown in Figure 26. It can be seen
that those scenarios, which include energy efficiency measures
(B-scenarios) gain much more net external benefits than scenarios without energy efficiency.
Moreover, net external benefits of the scenarios become much more significant when
comparing different strategies leading to the same share of RES compared to the gross final
energy consumption. For instance: a RES share of 34% could be achieved either by scenario
2A or 2B – or nearly already by scenario 1B. Comparing net external benefits of these
scenarios reveal that achieving the target of 34% by including energy efficiency measures (1B
or 2B) leads to a rise in external benefits of approximately € 6.7 billion (difference 2B-2A). This
pattern can be seen too, when scenarios resulting in a RES-share of 36% (3A, 3B) are
compared: choosing scenario 3B leads to € 7 billion higher external benefits than achieving a
36% RES share with scenario 3A.
Figure 27: Remaining external benefits after subtraction of external costs (net external
benefits) of measures implemented between 2011 and 2020
The advantage of including energy efficiency in the portfolio of measures becomes even more
evident when we compare all scenarios with the reference scenario (Figure 28). To meet the
34 % RES-target, the gains in external benefits by scenario 2B are 3.7 times higher than
achieving this target by scenario 2A. Also, for meeting the 36 % RES-target, the respective
gains in scenario 3B are more than threefold compared to gains from scenario 3A.
0
2.000
4.000
6.000
8.000
10.000
12.000
14.000
16.000
18.000
20.000
Ne
t Ex
tern
al B
en
efi
ts (
Mio
. €
)
EFF-Production
EFF-Buildings
EFF-Mobility
Transport
Heat
Electricity

57
Figure 28: External benefits after subtraction of external costs (net external benefits) of
measures implemented between 2011 and 2020 in comparison to the Reference
scenario (discount rate 2.5 %)
4.2.3 External effects of sectors and technology options
Impacts of certain technology groups
The section above has provided information about the sum of external benefits and external
costs from RES-expansion and energy efficiency measures. This section now provides
information in a more disaggregated manner, firstly, for analysing the magnitudes of effects
per measure group, and secondly, for showing the distribution of external benefits and costs
over time. Figure 29 shows exemplarily annual amounts of external benefits and costs for
scenario 3B. External effects are illustrated for analysed measure groups until the end of their
expected service life, whereas 2050 was taken as a general limit for considering effects as
their magnitudes become highly marginal at this time.
Figure 29: External benefits and costs of measures implemented between 2011 and 2020 in
scenario 3B
It can be observed from Figure 29 that external benefits (positive external effects) from
investments in RES-expansion and energy efficiency steadily rise as the capital stock for RES
and energy efficiency is extended – in this analysis until 2020. On the contrary, also external
costs from RES expansion rise steadily, but to a lower extent.
0
2.000
4.000
6.000
8.000
10.000
12.000
1A 2A 3A 1B 2B 3B
Ne
t Ex
tern
al B
en
efi
ts (
Mio
. €
)
58
Even if efforts are made for the purpose to achieve (among other reasons) the target for
renewable energy, it can clearly be observed that the bulk of external effects arise after 2020.
Assuming a discount rate of 2.5%, net external benefits in the time period 2011-2020 are only
one fourth to one third of total net external benefits of analysed scenarios. Thus it becomes
evident that considering effects beyond 2020 is absolutely necessary for a comprehensive
evaluation of the scenarios.
Taking the group of measures for RES-expansion together, most external benefits can be
achieved in the non-grid heat sector by replacing old – and also fossil fired – heating systems
(“avoided reference-H-non-grid”) by new, non-grid heating systems using renewables.
Certainly, some non-grid heating technologies (log wood, wood chips, etc.) based on
renewables also cause external costs; however, they cannot overbalance external benefits in
the non-grid heat sector. Compared to the non-grid heat sector, external net benefits of
expanded RES-use in the grid-heat, electricity and transport sector are rather minor, whereas
in sum they significantly contribute to the overall external net benefits of RES-expansion.
However, the relatively low annual contribution from the grid-heat and electricity sector is
partially balanced by their longer expected service life. These sectors lead to external benefits
also beyond 2040, whereas most investments in non-grid heat made between 2011 and 2020
are expected to be already out of operation at that time.
The long service life is a special characteristic of many energy efficiency measures. Many
energy efficiency measures implemented in 2020 have a lifetime of up to 2050 or even beyond
(e.g. thermal insulation of buildings, spatial planning, etc.). Within potential energy efficiency
measures in the production sector most external benefits can be achieved by intensifying
industrial processes and reducing energy demand of industrial buildings. In the transport
sector measures as improved spatial planning, increased use of public transport as well as
stimulating non-motorized transport have a long lasting effect and are therefore in the long run
most effective. In the building sector most external costs can be avoided by stimulating
thermal restoration.
However, it is necessary to mention that also measures with lower potential to avoid external
costs are necessary and advisable in order to maximize avoided external costs and to meet
the country’s environmental targets.
External effects of technology options
When expanding a country’s RES-capacities the composition of RES-technology options
should consider – among other criteria as macroeconomic optimization for instance – that
external costs due to their possible emissions of technology options are minimized. At the
same time external benefits from substituting fossil based technologies should be maximized.
For optimizing the portfolio of RES-expansion and substitution of fossil energy sources from
the viewpoint of external effects, knowledge about the external effects of each technology
option is necessary. However a direct comparison of RES- as well as fossil-based technology
options is not straightforward as such a comparison is likely to be defective to a limited extent
for three reasons: Firstly, specified external cost from single technology options are averages
of different technology specifications among a certain technology option. External effects of
single technology specifications might considerably deviate from the average as specific
emissions per single technology specification will deviate.68 Secondly, uncertainty exists about
68
See for instance Bleyl-Androschin et al. (2011)
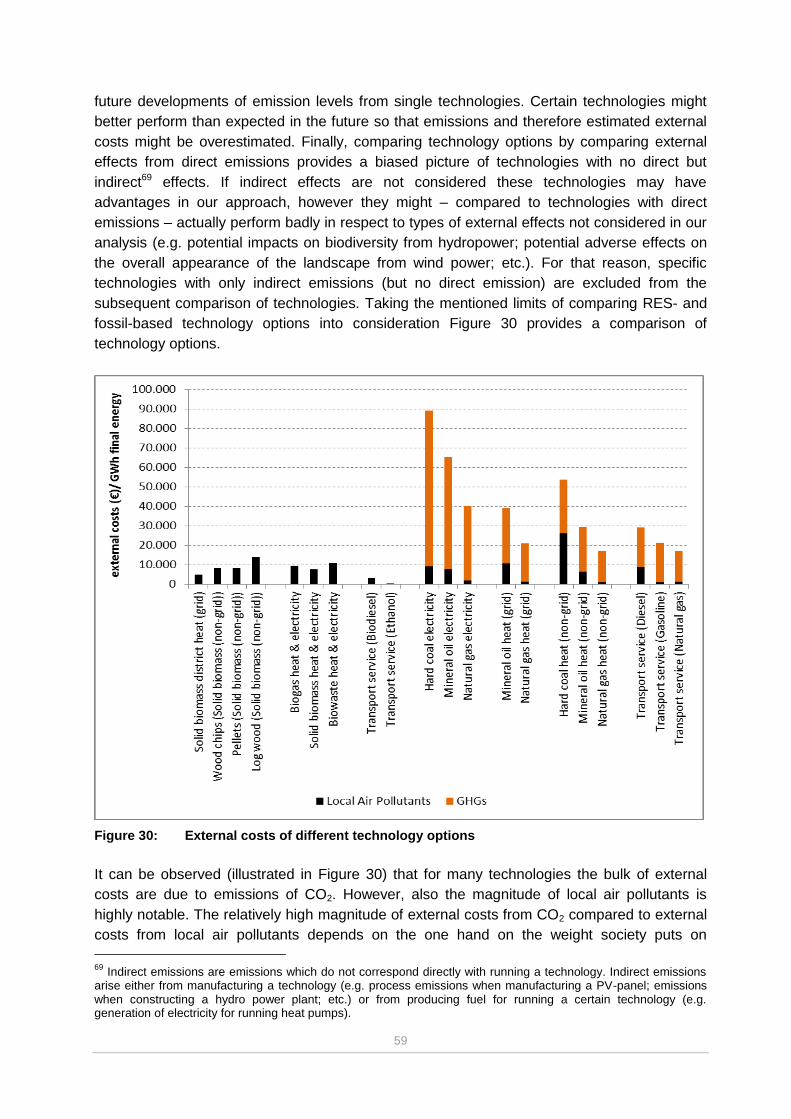
59
future developments of emission levels from single technologies. Certain technologies might
better perform than expected in the future so that emissions and therefore estimated external
costs might be overestimated. Finally, comparing technology options by comparing external
effects from direct emissions provides a biased picture of technologies with no direct but
indirect69 effects. If indirect effects are not considered these technologies may have
advantages in our approach, however they might – compared to technologies with direct
emissions – actually perform badly in respect to types of external effects not considered in our
analysis (e.g. potential impacts on biodiversity from hydropower; potential adverse effects on
the overall appearance of the landscape from wind power; etc.). For that reason, specific
technologies with only indirect emissions (but no direct emission) are excluded from the
subsequent comparison of technologies. Taking the mentioned limits of comparing RES- and
fossil-based technology options into consideration Figure 30 provides a comparison of
technology options.
Figure 30: External costs of different technology options
It can be observed (illustrated in Figure 30) that for many technologies the bulk of external
costs are due to emissions of CO2. However, also the magnitude of local air pollutants is
highly notable. The relatively high magnitude of external costs from CO2 compared to external
costs from local air pollutants depends on the one hand on the weight society puts on
69
Indirect emissions are emissions which do not correspond directly with running a technology. Indirect emissions arise either from manufacturing a technology (e.g. process emissions when manufacturing a PV-panel; emissions when constructing a hydro power plant; etc.) or from producing fuel for running a certain technology (e.g. generation of electricity for running heat pumps).

60
preventing climate change (mostly long-term damages) compared to the weight society puts
on preventing damages caused by local air pollutants (mostly short- and medium-term
damages). On the other hand, technologies have to fulfil certain emission standards, which (in
most cases) avoid high emissions of local air pollutants from new technologies.70
Highest external benefits can be achieved by substituting fossil based electricity with
renewable alternatives. Especially hard coal and mineral oil induce high external costs,
especially caused by GHGs.
Also for heat production, hard coal and mineral oil are those fossil sources which cause the
highest external costs per unit of energy output. Especially strongly polluting are small-scale
non-grid heating systems based on hard coal, which cause highest external costs from local
air pollutants both in relative as well as absolute terms (per unit of energy output). External
costs from local air pollution for this technology are significantly higher than external costs for
electricity generation by hard coal71 (due to different emissions standards for air pollutants)
However, using hard coal for non-grid heating purposes steadily decreased in Austria in the
last decades.72 Within the transport sector, substitution of diesel would lead to the highest
external benefits.
Among all fossil energy sources, natural gas causes the lowest external costs especially due
to its low emission of local air pollutants. However, in absolute terms natural gas based
technologies are less favourable compared to all corresponding renewable energy
technologies due to greenhouse gas emissions of natural gas.
For pure electricity generation with renewables only non-combusting technologies (hydro,
wind, PV) are installed in Austria. Using biomass/ biogas/bio-waste for electricity generation
leads also to the production of waste heat, which should be used in combined heat and power
processes (CHP) to increase the gross efficiency. The analysis shows that external costs from
combined heat and power generation by considered renewables are similar.
At producing purely heat with biomass, grid heat is more advantageous compared to non-grid
alternatives based on biomass. At non-grid heating with biomass, wood chips and pellets
cause lower external costs on average then log wood, which may vary considerably among
single technology specifications (e.g. manual vs. automatic loading, etc.).
4.2.4 Influence of the discount rate
Considering annual flows of external benefits and costs beyond 2020 are necessary to
achieve a comprehensive und unbiased data set for analysing scenarios. However, external
effects evolving in the future are weighted less by the society than current effects. This lower
valuation of future effects is expressed by the choice of the discount rate used to discount
future effects.
The following figures (Figure 31, Figure 32, Figure 33) show the shapes of annual external
benefits and costs from measures in scenario 3B with varying discount rates of 1.5%, 2.5%
and 10% up to 2050. These figures illustrate the significant impact of discount rates on the
magnitude of monetized external effects. The discount rate of 1.5% is similar to a discount rate
70
E.g. standards according to the IPPC directive (2008/1/EG or 2010/75/EU) 71
Especially caused by SO2 und fine particulates 72
Statistic Austria (2010)
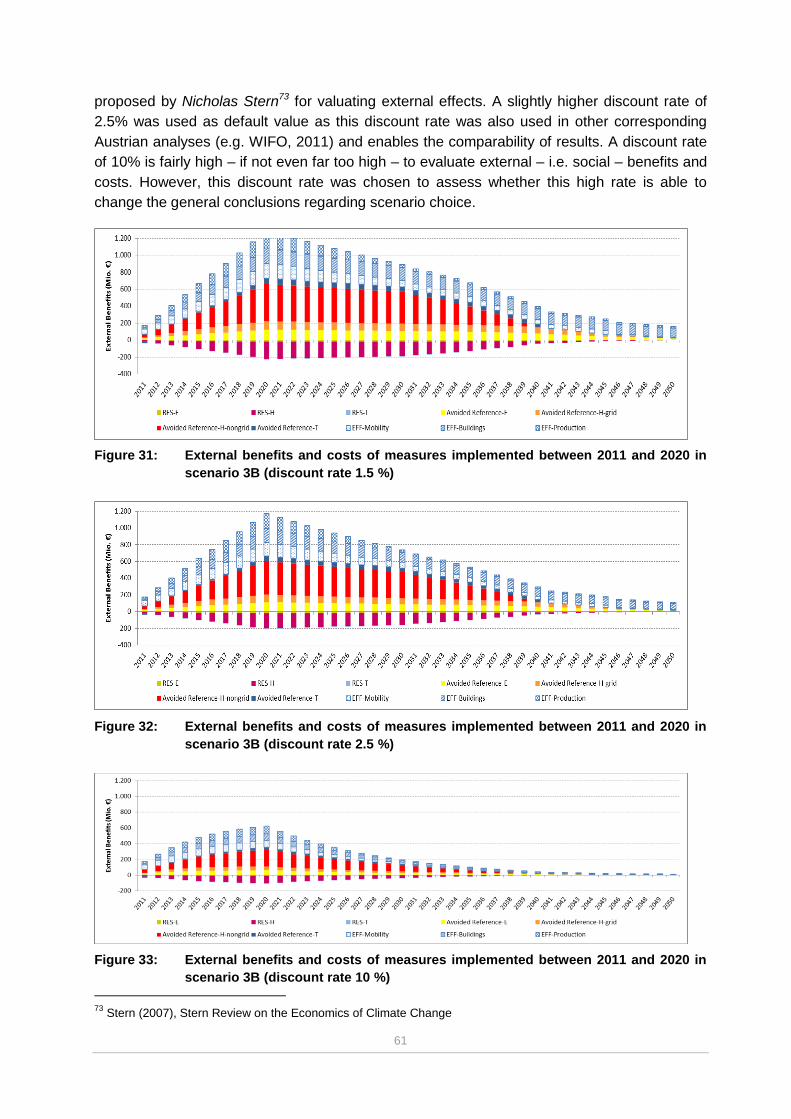
61
proposed by Nicholas Stern73 for valuating external effects. A slightly higher discount rate of
2.5% was used as default value as this discount rate was also used in other corresponding
Austrian analyses (e.g. WIFO, 2011) and enables the comparability of results. A discount rate
of 10% is fairly high – if not even far too high – to evaluate external – i.e. social – benefits and
costs. However, this discount rate was chosen to assess whether this high rate is able to
change the general conclusions regarding scenario choice.
Figure 31: External benefits and costs of measures implemented between 2011 and 2020 in
scenario 3B (discount rate 1.5 %)
Figure 32: External benefits and costs of measures implemented between 2011 and 2020 in
scenario 3B (discount rate 2.5 %)
Figure 33: External benefits and costs of measures implemented between 2011 and 2020 in
scenario 3B (discount rate 10 %)
73
Stern (2007), Stern Review on the Economics of Climate Change

62
Irrespective of the choice of the discount rate, energy efficiency measures count for slightly
more than half of overall net external benefits. However, in the far future the magnitude of
external benefits from energy efficiency measures exceeds by far the one of RES-expansion.
For instance, external benefits from energy efficiency beyond 2040 count for 3/4 of total net
external benefits beyond 2040. A high discount rate therefore implies a disproportionately high
discrimination/marginalisation of external benefits from energy efficiency measures. This in
turn means that higher discount rates relatively worsen the advantages of the B-scenarios
compared to the A-scenarios. However, as shown in Figure 34 the absolute advantage of
scenarios, which include energy efficiency measures, is not eliminated even at high discount
rates.74
Figure 34: Remaining external benefits after subtraction of external costs (net external
benefits) of measures implemented between 2011 and 2020 in comparison to the
Reference scenario (discount rate 10 %)
We would like to point out, that increasing the discount rate for external effects – that are
effects relevant for the society – tends to marginalize the contribution of external effects in the
overall evaluation of scenarios – taking into consideration also macroeconomic effects or
effects from RES and GHG certificates trade (see chapter 6). For illustration: whereas net
external benefits of scenario 3B exceed those of scenario 3A by more than € 7.000 Mio. (both
achieve a RES-share of 36%) when applying a discount rate of 2.5%, this advantage shrinks
to less than € 3.000 Mio. when applying a discount rate of 10%.
4.2.5 Conclusions on impacts of external effects
The analysis has shown the substantial magnitude of external effects from RES-expansion
and energy efficiency. Therefore, considering external effects is essential for an overall and
comprehensive evaluation of different scenarios for increasing the RES-share in Austria.
74 Compare Figure 34 with Figure 28
0
1.000
2.000
3.000
4.000
5.000
6.000
7.000
8.000
9.000
10.000
11.000
12.000
1A 2A 3A 1B 2B 3B
Ne
t Ex
tern
al B
en
efi
ts (
Mio
. €
)

63
Although results depend on the choice of parameters such as the discount rate, the trends and
conclusions stay robust. All analysed scenarios have significant advantages regarding external
benefits compared to the reference scenario. However, scenarios, which include energy
efficiency measures (B-scenarios) are more advantageous – from the external effects point of
view – than scenarios without energy efficiency (A-scenarios). A rising discount rate tends to
discriminate energy efficiency measures compared to RES-expansion. This leads to a relative
disadvantage of B-scenarios compared to the A-scenarios. However, the absolute advantage
of the B-scenarios compared to the A-scenarios remains even at the higher discount rates
considered in this study. At higher discount rates, however, the importance of external effects
becomes smaller compared to other evaluation criteria.
There are some measures within the entire measure portfolio, which provide – over a longer
period – the highest amounts of external benefits (e.g. fuel switch in non-grid heat sector;
thermal insulation of buildings). However, the contribution of other measures is also highly
desirable as at any time external benefits of measures exceed potential external costs (e.g.
local air pollutants at biomass combustion) going along with the measures. This leads to a
maximization of external benefits.
Taking the argumentation above into consideration the most preferred scenario – from the
viewpoint of external effects – is a scenario that maximizes net external benefits. In our case
this is – from the point of view of external effects – scenario 3B.
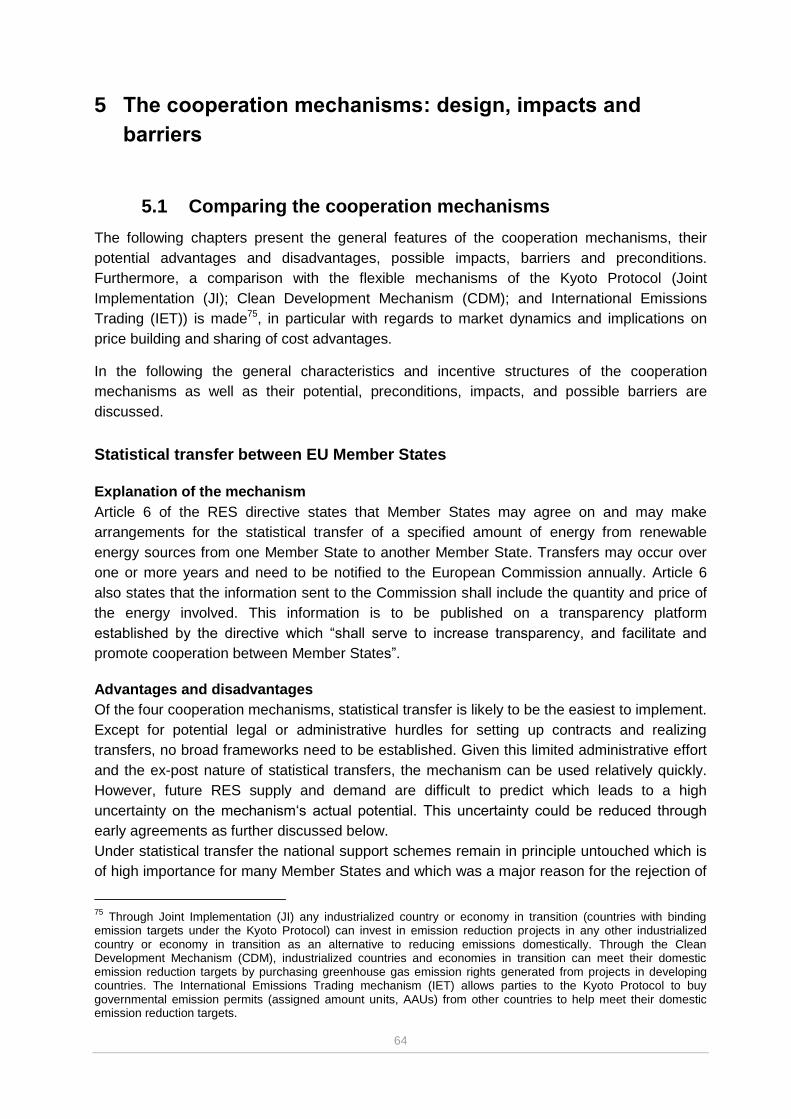
64
5 The cooperation mechanisms: design, impacts and
barriers
5.1 Comparing the cooperation mechanisms
The following chapters present the general features of the cooperation mechanisms, their
potential advantages and disadvantages, possible impacts, barriers and preconditions.
Furthermore, a comparison with the flexible mechanisms of the Kyoto Protocol (Joint
Implementation (JI); Clean Development Mechanism (CDM); and International Emissions
Trading (IET)) is made75, in particular with regards to market dynamics and implications on
price building and sharing of cost advantages.
In the following the general characteristics and incentive structures of the cooperation
mechanisms as well as their potential, preconditions, impacts, and possible barriers are
discussed.
Statistical transfer between EU Member States
Explanation of the mechanism
Article 6 of the RES directive states that Member States may agree on and may make
arrangements for the statistical transfer of a specified amount of energy from renewable
energy sources from one Member State to another Member State. Transfers may occur over
one or more years and need to be notified to the European Commission annually. Article 6
also states that the information sent to the Commission shall include the quantity and price of
the energy involved. This information is to be published on a transparency platform
established by the directive which “shall serve to increase transparency, and facilitate and
promote cooperation between Member States”.
Advantages and disadvantages
Of the four cooperation mechanisms, statistical transfer is likely to be the easiest to implement.
Except for potential legal or administrative hurdles for setting up contracts and realizing
transfers, no broad frameworks need to be established. Given this limited administrative effort
and the ex-post nature of statistical transfers, the mechanism can be used relatively quickly.
However, future RES supply and demand are difficult to predict which leads to a high
uncertainty on the mechanism‘s actual potential. This uncertainty could be reduced through
early agreements as further discussed below.
Under statistical transfer the national support schemes remain in principle untouched which is
of high importance for many Member States and which was a major reason for the rejection of
75
Through Joint Implementation (JI) any industrialized country or economy in transition (countries with binding emission targets under the Kyoto Protocol) can invest in emission reduction projects in any other industrialized country or economy in transition as an alternative to reducing emissions domestically. Through the Clean Development Mechanism (CDM), industrialized countries and economies in transition can meet their domestic emission reduction targets by purchasing greenhouse gas emission rights generated from projects in developing countries. The International Emissions Trading mechanism (IET) allows parties to the Kyoto Protocol to buy governmental emission permits (assigned amount units, AAUs) from other countries to help meet their domestic emission reduction targets.
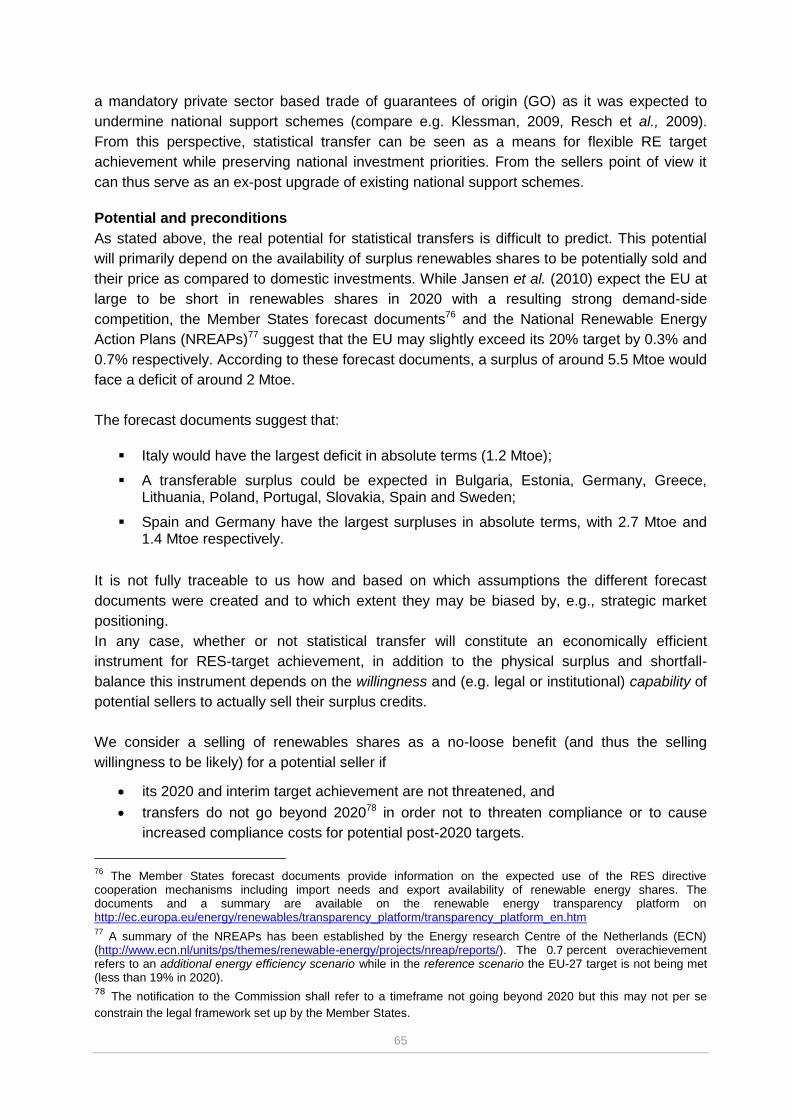
65
a mandatory private sector based trade of guarantees of origin (GO) as it was expected to
undermine national support schemes (compare e.g. Klessman, 2009, Resch et al., 2009).
From this perspective, statistical transfer can be seen as a means for flexible RE target
achievement while preserving national investment priorities. From the sellers point of view it
can thus serve as an ex-post upgrade of existing national support schemes.
Potential and preconditions
As stated above, the real potential for statistical transfers is difficult to predict. This potential
will primarily depend on the availability of surplus renewables shares to be potentially sold and
their price as compared to domestic investments. While Jansen et al. (2010) expect the EU at
large to be short in renewables shares in 2020 with a resulting strong demand-side
competition, the Member States forecast documents76 and the National Renewable Energy
Action Plans (NREAPs)77 suggest that the EU may slightly exceed its 20% target by 0.3% and
0.7% respectively. According to these forecast documents, a surplus of around 5.5 Mtoe would
face a deficit of around 2 Mtoe.
The forecast documents suggest that:
Italy would have the largest deficit in absolute terms (1.2 Mtoe);
A transferable surplus could be expected in Bulgaria, Estonia, Germany, Greece, Lithuania, Poland, Portugal, Slovakia, Spain and Sweden;
Spain and Germany have the largest surpluses in absolute terms, with 2.7 Mtoe and 1.4 Mtoe respectively.
It is not fully traceable to us how and based on which assumptions the different forecast
documents were created and to which extent they may be biased by, e.g., strategic market
positioning.
In any case, whether or not statistical transfer will constitute an economically efficient
instrument for RES-target achievement, in addition to the physical surplus and shortfall-
balance this instrument depends on the willingness and (e.g. legal or institutional) capability of
potential sellers to actually sell their surplus credits.
We consider a selling of renewables shares as a no-loose benefit (and thus the selling
willingness to be likely) for a potential seller if
its 2020 and interim target achievement are not threatened, and
transfers do not go beyond 202078 in order not to threaten compliance or to cause
increased compliance costs for potential post-2020 targets.
76
The Member States forecast documents provide information on the expected use of the RES directive cooperation mechanisms including import needs and export availability of renewable energy shares. The documents and a summary are available on the renewable energy transparency platform on http://ec.europa.eu/energy/renewables/transparency_platform/transparency_platform_en.htm 77
A summary of the NREAPs has been established by the Energy research Centre of the Netherlands (ECN) (http://www.ecn.nl/units/ps/themes/renewable-energy/projects/nreap/reports/). The 0.7 percent overachievement refers to an additional energy efficiency scenario while in the reference scenario the EU-27 target is not being met (less than 19% in 2020). 78 The notification to the Commission shall refer to a timeframe not going beyond 2020 but this may not per se
constrain the legal framework set up by the Member States.

66
Potential barriers and ways to address them
Potential barriers for selling and/or buying of RES-shares are legal and institutional barriers
such as the creation of suitable governmental management bodies or accredited agencies.
Countries may reduce these barriers by building on existing institutional structures and
procedures such as developed for the International Emissions Trading under the Kyoto
Protocol’s article 17. In order to address the market uncertainty, early up-front contracts could
be established in order to guarantee delivery and/or purchase of a certain amount of energy to
be statistically transferred. However, the RES directive states that statistical transfer “shall not
affect the achievement of the national target of the Member State making the transfer”.
Conclusions on statistical transfers
Overall, countries interested in buying RES-shares are in a rather passive and dependent
situation as compared to the other mechanisms under which also the buyer country is actively
involved in expanding RES generation in the seller country. Therefore, it might be best for
potential buyers to try to establish early agreements on future transfers in order to reduce
supply uncertainty. Such early agreements may also be of interest for sellers if additional
support shall be granted for domestic investments. The remaining risk of non-delivery will
strongly depend on the national circumstances, in particular on how certain it is that a seller
country actually exceeds its national renewable target.
Joint projects between Member States
Explanation of the mechanism
According to article 7 of the RES directive, under joint projects between Member States, two or
more Member States (MS) may cooperate on all types of projects relating to the production of
electricity, heating or cooling from renewable energy sources. Projects to be recognized under
the directive have to become operational after 25 June 2009 and the period specified should
not extend beyond 2020. In order for the investing MS to count the renewable energy
produced by joint projects towards its target, the corresponding proportion or amount of
renewable energy must be communicated to the Commission by the participating Member
States, followed by a transfer from the host to the investor country’s renewable energy
statistic. For this transfer, a physical flow of energy between the cooperating MS is not
required.
The directive explicitly states that the cooperation “may involve private operators”. The
possible role of private operators is however not further defined in the directive, which leaves
quite some room for interpretation. It is obvious that private operators will be involved where
physical investments are made. A major role of the private sector in addition to technical
implementation certainly is its capability to identify economically viable renewable energy
potentials. Private investors could initiate joint projects by requesting financial support from
Member States where the domestic support system is not sufficient (Howes, 2010). However,
the private-market involvement will not be comparable to Joint Implementation (JI) or the
Clean Development Mechanisms (CDM) as the private sector will not be directly involved in
statistical renewable energy transfers. As opposed to the Kyoto mechanisms JI and CDM, the
generation of a margin through ownership and trade of “credits” by private firms is not possible
under the RES directive mechanisms. Consequently, from a private investor’s point of view,
joint projects could be perceived as an extension of domestic support schemes.

67
Advantages and disadvantages
An advantage of joint projects, as compared to statistical transfer, is that they do not depend
on an already existing renewable energy surplus of the host country. They require a more
proactive role of the investor country and projects can be developed specifically for a
forecasted shortfall of renewable energy shares. As compared to upfront-agreements under
statistical transfer, the physical investment by the buyer country may to some extent reduce
the risk of non-compliance due to an unexpected shortfall in the host country.
The possibility that private actors may request financial support for renewable energy projects
through a joint project may help identifying specific renewable energy options under this
mechanism. At the same time, joint projects allow for the joint realization of renewable energy
projects in line with the interest of the involved governments regarding particular technologies
or the inclusion of arrangements, e.g., on technology transfer.
Potential and preconditions
Joint projects include export opportunities for the investor country as well as socio-economic
and environmental (co-) effects of additional investments in the host country, as well as co-
costs such as potential efforts to integrate additional renewable energies into the distribution
network. These factors have to be considered when the investor country weighs joint projects
with a potential loss of positive domestic effects of domestic investments, such as job creation,
domestic environmental benefits including emission reductions, energy autonomy and energy
supply security. Joint projects do not necessarily involve the physical transfer of energy.
However, energy purchase agreements might present in its own an incentive for the investor
and/or host country to produce and trade additional renewable energy.
In their forecast documents some Member States identified particular technologies for joint
projects in their countries. Joint projects regarding offshore wind are mentioned by Germany
indicating a potential for two wind parks with 400 MW each; by Estonia stating the potential
capacity being dependent on the integration of wind energy to the grid; and Ireland stating a
“significant” potential for ocean and offshore wind while constraints and costs relating to grid
infrastructure and interconnectors would have to be addressed. Hydropower is mentioned by
Romania and Bulgaria including two potential hydroelectric plants on the Danube with 800 MW
each and initial ideas on the exploration of the Black Sea’s potential. Latvia states biomass
and wind as potential energy sources for joint projects without giving an indication of possible
project sizes.
A major precondition for the implementation of joint projects is the agreement between the
cooperating Member States on the investment made and the resulting share or amount of
renewable energy (statistically) transferred. This appears to be more complex than for
statistical transfer, where “only” a quantity and a price for the transfer of a, generally already
existing energy production need to be defined. In principle, agreements on joint projects can
be designed for one single project or a broader support framework (Klessmann, 2010).
Depending on the specific implementation, broad frameworks could enable private firms to
identify the most cost-efficient options. This may be most efficient if several technologies are
covered within the frameworks of the scheme. However, the broader a framework is, the more
it may interfere with existing national support schemes. Joint projects may evolve towards joint
support schemes when the joint project framework in the host country is similar to the support
scheme in the investor country (see e.g. Klessmann, 2010).

68
Another major aspect to be agreed on by the concerned MS is the timeframe for the transfer.
Even though the notification to the Commission shall refer to a timeframe not going beyond
2020 this does not restrict the legal framework set up by the MS. An extension of the transfer
beyond 2020 could increase compliance costs for post-2020 targets for the “host country” if it
has to invest in more expensive technologies for its own compliance after 2020. Thus, host
countries may want to limit the contract period to 2020. Where longer contract periods are
desired (e.g. for the lifetime of an installation), the host country may agree only to “second-
best” investments in terms of cost-efficiency under joint projects in order to keep a reserve of
lowest-cost options for its own long-term compliance. Vice-versa, where transfer agreements
end in 2020, new installations under joint projects may create benefits to the host country in
terms of post-2020 target achievement.
Potential barriers and ways to address them
Barriers may include the legal framework for agreements between Member States. Public
acceptability may play an important role in the investor country due to the co-benefits which
are passed on to the host country (e.g. job creation, post-2020 target achievement, CO2-
reduction). This may be compensated for by, e.g., agreements on technology exports with the
host country or the rules for sharing the renewable energy. Where more “co-costs” than
benefits are expected due to the investment, public acceptability problems may arise also for
the host country. For the host country it is of particular importance not to threaten future or
even its own 2020-target achievements. In case of the Kyoto Mechanisms the threat that Joint
Implementation project may make it more difficult for the host country to achieve its own Kyoto
target was one of the reasons that several Member States did not accept to act as a host
country under JI. France addressed this issue by discounting credits generated from JI
projects in France in order to compensate the state for losing cheap domestic reduction
opportunities (Steiner, 2011). Such a discounting could equally be applied to joint projects
between Member States.
Conclusions on joint projects between Member States
Interest for joint projects has been stated by some Member States with several giving
indications on potential project types and volumes. A high range of details need to be
considered in agreements given the magnitude of possible transfer-costs and co-benefits such
as grid expansion, technology export opportunities, and environmental and employment
effects as well as implications of the transfer period (e.g. post 2020) of (statistical) energy
transfers. Austria is most likely not in need for using the mechanisms for own 2020 compliance
(see chapter 3) and might therefore act as host-party for joint projects. However potential
negative post-2020 implications may arise in case of post-2020 RES transfer.
Joint projects between EU Member States and third countries
Explanation of the mechanism
Joint projects between Member States and third countries (Article 9 of the RES directive) are
based on the same principle as joint projects within the EU. Differences include a limitation of
the generated energy to electricity (under joint projects with other Member States heating and
cooling are also included) and that the electricity to be counted towards the target compliance
of a Member States has to be imported into the EU. The latter is necessary as otherwise the
69
energy produced would not impact the physical energy mix of the EU. The RES directive
defines further details in order to make sure that a physical import is actually achieved, in
particular in regard to the interconnection capacity. At the same time, the involved Member
States should “facilitate the domestic use by the third country concerned of part of the
production of electricity by the installations covered by the joint project”. A definition of “part of
the production” is not given in the directive and it is not clear whether or to which extent this
share is to be financed by the investing MS. The directive only states that “the amount of
electricity produced and exported” must not receive “support from a support scheme of a third
country other than investment aid granted to the installation”. This leaves it open to which
extent the consumption in the third country might offset benefits from cost-efficiency gains as
compared to a joint project within the EU. Further, only newly constructed installations or
newly increased capacities are eligible for transfer in order to “ensure that the proportion of
energy from renewable sources in the third country’s total energy consumption is not reduced
due to the importation of energy from renewable sources into the Community”. The operation
of the new installation or the refurbishment has to start after 25 June 2005.
Advantages and disadvantages
The general characteristics of joint projects between EU Member States and third countries
are comparable to joint projects between EU Member States. The potential advantage of joint
projects between EU Member States and third countries is to make use of a more cost-
efficient renewable energy generation from outside of the EU. However, additional hurdles will
have to be addressed which may in many cases outweigh theoretical cost-advantages. This
includes more difficult legal frameworks and investment environments, or infrastructural and
grid issues. The obligation to physically import the electricity into the EU may be an important
barrier as compared to EU-internal projects and could increase costs significantly.
Potential and preconditions
Four Member States (France, Greece, Italy, and Spain) note in their forecast documents that
they may use cooperation mechanisms to develop renewable energy in third countries, either
in the context of the Mediterranean Solar Plan79 or in the West Balkan countries.
Potential barriers and ways to address them
Joint projects with third countries face some challenges, which do not apply to projects
between Member States. The investment itself may be hampered by a (more) difficult
investment environment in potential host countries and the fact that the produced electricity,
which is to be counted towards the investor’s renewables statistic, needs to be physically
imported. This can be expected to increase transaction cost, which is why ECN (Jansen et al.,
2010) does “not anticipate that this instrument will be booming”. In addition, this project type
can be considered particularly politically sensitive due to an increasing demand for energy in
host countries, to which new installations would only contribute to a limited extent. New
installations being constructed primarily for electricity exports – possibly in areas with a lack of
energy supply – may cause acceptance problems in host countries.
79
The Mediterranean Solar Plan (MSP) aims to develop 20 GW of new renewable energy production capacities, and achieving significant energy savings around the Mediterranean by 2020. It is one of six key initiatives of the Union for the Mediterranean (UfM), launched in Paris on 13 July, 2008.

70
Conclusions on joint projects between EU Member States and third countries
Some potential for the use of joint projects between EU Member States and third countries has
been identified in particular in the Mediterranean region and the Balkan which is reflected in
the national forecast documents. However, this project type faces particular challenges such
as the need to physically import electricity in the EU and potentially difficult investment
environments, which may, at least up to 2020, significantly reduce the opportunity to actually
contribute cost-efficiently to national target achievement.
Joint support schemes
Explanation of the mechanism
According to article 11 of the RES directive under joint support schemes, two or more Member
States may join or partly coordinate their national support schemes. In such cases, a certain
amount of energy from renewable sources produced in the territory of one participating
Member State may count towards the national overall target of another participating Member
State. This transfer may be done by statistical transfer of specified amounts of energy or by
the setup of a distribution rule that allocates amounts of energy from renewable sources
produced as a result of joint investment between the participating Member States. Where a
distribution rule is chosen, each Member State shall issue an annual notification stating the
total amount of energy, which is subject of the distribution rule.
Advantages and disadvantages
Joint support schemes can create incentives for the use of the most cost-efficient renewable
energy potentials in a group of nations if a harmonized support is established across the
participating Member States. However, the harmonization of support schemes across
countries is complex. Given the different national contexts, factors beyond the mere support
scheme (e.g. tax, grid access and others, see Klessmann, 2009) will have to be taken into
account in order to reach overall comparable frameworks. This, in addition to the high
administrative effort and potential legal and technical hurdles to reach transnational support
frameworks renders the implementation of joint support schemes complex and lead probably
to a lengthy process. Consequently, joint support schemes may be less flexible in the short-
term as compared to the other cooperation mechanisms, which impedes a short-term,
dynamic adaptation to the actual need for additional renewable energy generation in light of
national targets. Additionally, the transnational nature of the mechanism generally complicates
a fine-tuning to specific national needs. Also, in contrary to specific joint projects, (joint)
support schemes create a framework under which the investor behavior, and thus physical
investments, cannot fully be anticipated. This limits their predictability in terms of specific
renewable energy volumes to be generated or targets to be achieved.
Joint support schemes are often discussed as representing a step towards a harmonized
European framework, which is in the interest of the EU. A joint support scheme tailored to a
specific group of nations may be a starting point and provide experiences for a larger,
European-wide scheme. However, it remains to be seen to which extent such a joint support
scheme would actually facilitate integration with support schemes of Member States not being
part of a joint support scheme or being part of another joint support scheme.

71
Potential and preconditions
Given the high technical and legal complexity and the resulting long lead time for joint Support
schemes, it can be expected that this mechanism will only be used to a limited extent for 2020
target achievement. However, a high potential is seen for some Nordic countries with e.g.
Sweden and Norway establishing a joint quota system with tradable green certificates from
2012 onwards which could form the basis for establishing a joint support scheme
(Greenstream, 2010)80. ECN recommends that the Dutch government enter this system with,
at least, Sweden and identifies as the best option a mandatory minimum share of renewable
energy to be imposed on suppliers in combination with a certificate system (Jansen et al.,
2010).
Comparable to joint projects, a fair distribution of the generated renewable energy, costs and
benefits, including the allocation of additional support costs, needs to be found.
Potential barriers and ways to address them
Barriers include the difficulties in harmonizing several support schemes as pointed out above.
While other cooperation mechanisms can be used relatively flexible and short-term, joint
support schemes would ground on long-term strategic considerations. Given that Austria does
not depend on the cooperation mechanisms in order to meet its target (see chapter 3), joint
support schemes may not have sufficient benefits which would justify their potentially high
transaction costs, in particular for the short timeframe till 2020.
Conclusions on joint support schemes
Due to its complexity, the establishment of joint support schemes can be expected to be too
time- and resource-consuming for supporting short-term target achievement of countries with
strongly differing energy policy frameworks. In the long run however, joint support schemes
may be more efficient than joint projects once such a framework is established. Whether joint
support schemes are suitable to support the EUs interest in a European-wide harmonization
remains to be seen.
5.2 The potential use of cooperation mechanisms by Austria
Austria can be expected to reach or even exceed its 2020 renewable target with a moderate
increase of RES support and/or additional energy efficiency measures (see chapter 3). From
that perspective Austria does not depend on using the cooperation mechanisms. However,
due to the potential for overachieving the 2020 target and particular interim targets, statistical
transfer should be considered. Statistical transfer may offer a revenue stream from selling
excess renewable shares without requiring additional investments. Because the future market
for renewable shares is highly uncertain, this potential should be assessed early in discussions
with potential trading partners, which may lead to early agreements. Investments in renewable
energy and energy efficiency aiming an overachievement of the 2020 goal may thereby
indirectly be co-financed through revenues from statistical transfer. An overachievement of
RES targets can also help building a basis for potential post-2020 targets.
80
The RES Directive explicitly highlights that some non-Member States – “third countries” – may also take part in
the use of these mechanisms. These include the European Economic Area (EEA) countries of Norway and Iceland
(The EEA Joint Committee decided in December 2011 to incorporate the Directive into the EEA Agreement).
72
Austria might allow renewable energy investments by other countries in the framework of joint
projects. This may equally lead to improving the point of departure for post-2020 targets in
case no post-2020 transfers of RES share take place. In particular, costs for achieving post-
2020 targets may increase when the most cost-efficient renewable potentials are dedicated to
joint projects that may include (statistical) transfers of renewable energy beyond 2020. This
could be avoided through exclusion of the most cost-efficient renewable energy potentials from
joint projects or through limitation of post-2020-transfers of renewable energy shares.
Generally, the use of joint projects for investments in Austria would lead to substitution of
domestic expenditures with foreign investments while maintaining a similar RES share (e.g.
overachievement). At the same time macroeconomic benefits from foreign RES investments in
Austria may be lower than those from pure domestic investment due to e.g. a potentially
higher import of construction material and labor. The potential benefit of joint projects for
Austria therefore is less obvious than the benefit from statistical transfer of existing surpluses.
Whether Austria will have a net benefit from joint projects will consequently depend on the
degree to which national co-benefits from RES investments are “priced in” in negotiations with
investors. For Austria, which is on good track to reach its 2020 renewable target, joint support
schemes may not have sufficient benefits which would justify their potentially high transaction
costs, in particular for the short timeframe till 2020.
5.3 Comparison of cooperation mechanisms and Kyoto
mechanisms
This section analyses major similarities and differences between the RES cooperation
mechanisms and the flexible Kyoto mechanisms Joint Implementation (JI), Clean
Development Mechanism (CDM), and International Emissions Trading (IET). Experience from
the flexible Kyoto mechanisms may anticipate possible developments of the RES cooperation
mechanisms. The purpose of the comparison is to identify factors that can lead to a successful
use of RES cooperation mechanisms for achieving governmental targets and taking into
account the sharing of cost advantages.
Through Joint Implementation (JI) any industrialized country or economy in transition
(countries with binding emission targets under the Kyoto Protocol) can invest in emission
reduction projects in any other industrialized country or economy in transition as an alternative
to reducing emissions domestically. Through the Clean Development Mechanism (CDM),
industrialized countries and economies in transition can meet their domestic emission
reduction targets by purchasing greenhouse gas emission rights revealing from projects in
developing countries. The International Emissions Trading mechanism (IET) allows countries
with binding targets under the Kyoto Protocol to buy governmental emission permits (Assigned
Amount Units, AAUs) from other countries to help meet their domestic emission reduction
targets. IET is in most cases carried out under Green Investment Schemes (GIS) under which
the revenues from the emission rights trade arte used to finance specific climate protection
programs in the seller country.
Experiences made with the flexible Kyoto mechanisms Joint Implementation; Clean
Development Mechanism; and International Emissions Trading provide some insights in the
practical implications of particular mechanism features that also may apply to the RES
cooperation mechanisms. Comparison of specific mechanism features, such as the
mechanism type (transfer, project-based, support scheme), the way how cost-advantages are

73
transferred or experienced hurdles in the implementation of the mechanisms can to some
extent help anticipating future dynamics of the RES cooperation mechanisms. At the same
time, none of the Kyoto and RES mechanisms are comparable over the entire range of factors
that impact the success of a mechanism. Such factors include, but are not limited to supply
and demand; legal and administrative hurdles; price building mechanisms; transfer costs and
mechanisms that determine how cost-advantages are passed on; costs. Consequently, a one-
by-one transfer of experiences made with any of the Kyoto flexible mechanisms to a RES
cooperation mechanism is not possible.
Cost efficiency and price-building under the cooperation and Kyoto
mechanisms
A prime function of the flexible Kyoto mechanisms and the RES cooperation mechanisms is
the identification and exploitation of comparably cost-efficient investment opportunities for
emissions and renewable energy target achievement respectively. The degree to which
revealing cost-advantages are forwarded to the entity (governmental or private) in need of
target achievement can however differ substantially. The Kyoto mechanisms Joint
Implementation and Clean Development Mechanism under which generated credits are traded
at a global market price were often criticized for the high margins they generate and from
which the end-user does not benefit. The more the costs for generating these credits
(implementation costs, transfer costs) are below the market price, the higher is the margin that
e.g. project developers and implementers obtain.
JI and CDM credits (ERUs, CERs) are compatible with allowances under the European
Emission Trading Scheme (EU-ETS) and can up to a certain amount be used by companies
under the EU-ETS for compliance. The price of EU-ETS allowances (EUAs) serves as a
benchmark for ERUs and CERs as the EU-ETS is the largest buyer of these credits.
The end-user of the credits will benefit from the difference between own target achievement
costs (domestic in case of governments) and target achievement through purchase of credits.
This is illustrated in Figure 35.
Figure 35: Cost advantage and its sharing between actors under a crediting system
Cost advantages in the case of national targets are here understood as the difference between
costs of a domestic investment without use of a mechanism and the cheaper implementation
and transfer costs under one of the mechanisms. This cost-advantage is not fully forwarded to
the end-user but shared with e.g. project developers according to the market price of credits.
74
While JI and, in particular, the CDM are often criticized for the high margin that the private
sector can generate, these margins create a strong incentive for the private sector to identify
and exploit most cost-efficient project potentials which might not be achieved otherwise. The
reason for the potentially high margins is the uniform market price for credits. Under JI and the
CDM the margin primarily stays with the private sector. The private sector’s importance for the
Kyoto flexible mechanisms JI and CDM is linked to the fact that credits are generated, which
can be owned and traded by private firms.
Under the RES cooperation mechanisms, ownership, trade and use of renewable “credits” by
private firms are not foreseen. In order to identify and use the most cost-efficient renewable
potentials, the RES cooperation mechanisms will thus much more rely on governmental
initiatives. At the same time this can potentially allow for a higher cost advantage for
governments. The share of the cost advantage that goes to the state will however strongly
depend on the market dynamics, in particular on the way how prices (statistical transfer) or
sharing of costs and benefits (joint projects, joint support schemes) are determined. For the
determination of prices, two general approaches are thinkable:
1. bilateral negotiations, potentially with prices that are not made public (comparable to
the trade of governmental emission rights – Assigned Amount Units, AAUs – under
International Emissions Trading), and
2. an open market through, e.g., a trading platform (in particular for statistical transfer,
comparable to JI/CDM) potentially leading to a more uniform market price.
Bilateral negotiations may lead to in-transparent prices as witnessed, e.g., in the case of
International Emissions Trading allowing for a relatively large price range. The establishment
of a trading platform for e.g. renewables shares for statistical transfer could lead to a more
unified supply-demand based price development (see e.g. Klessmann et al., 2010). A
comparable effect may be achieved if bilaterally agreed prices are made public, e.g. on the
transparency platform established by the RES directive. While this would lead to more
transparency, a uniform price could in some cases be far above specific additional generation
costs, leading to high margins for the sellers. Under the RES cooperation mechanisms the
upper price limit may be derived from the costs for new installations or capacity increase in the
investing or buying country or even from non-compliance cost (fines). Further, the price
building may consider costs and benefits beyond the direct RES implementation and
generation costs. This may include co-benefits and -costs and their sharing among project
partners, such as energy supply security, environmental benefits (e.g. fine particulates
reduction), job creation, or CO2 emission reductions which will enter the national emissions
Greenhouse Gas accounting in a post-2012 framework. The support system encouraging
investment by the private sector in some of the RES cooperation mechanisms also impacts
the extent to which the cost advantage is passed on to a government. Excessive support may
occur, e.g., through feed-in tariffs that are above the additional marginal costs for renewable
energy generation, or through investment support above the level that renders investments
economically viable. Such cases show some similarity to the margin under a crediting
mechanism discussed above. Due to the high number of factors impacting costs under the
different mechanisms we do not aim anticipating overall comparative cost-efficiency of the
different mechanisms. Instead, the subsequent chapter provides a general classification of the
75
different flexible Kyoto mechanisms and the RES
cooperation mechanisms by mechanism type and
characteristics such as the potential sharing of the
cost advantage.
Overview and classification of RES directive and Kyoto mechanisms This section provides a general overview and
classification of the RES cooperation and Kyoto
flexible mechanisms characteristics. Table 8 below
provides an overview of these mechanisms along the
characteristics Mechanism type and Governmental
cost advantages.
The mechanism type refers to the question whether
the mechanism involves implementation of projects
(e.g. construction of a renewable power plant) or
support schemes or whether it is limited to transfer of
existing surpluses of credits or renewable energy
shares. The mechanisms type has direct implications
for the cost efficiency and price-building discussed
above. Where only transfers of existing renewable
energy surpluses or project-based crediting occur,
potentially high investment margins due to uniform
market prices may go to the seller. Under support
schemes, the support-efficiency plays a crucial role
for the cost-efficiency of the mechanism. These cost-
considerations are shown in the row “Governmental
cost advantages” which refers to the question of
whether a governmental buyer or a government
investing abroad can potentially benefit from the major
share of the cost advantage as discussed in the
previous chapter.
The government/state is chosen here as the end-user because under the RES directive only
the government is responsible for compliance with renewable energy targets. However, the
same considerations would apply to private end-users (i.e. private credit buyers under the
Kyoto flexible mechanisms).
Background Information:
Green Investment Schemes
Green Investment Schemes define the use of revenues from International Emissions Trading (IET) for climate protection investments. Within IET, governmental emission allowances (Assigned Amount Units, AAUs) are traded to assist the buyer country in its emissions target achievement. Because the major amount of surplus AAUs comes from the breakdown of the economy in Central and Eastern Europe in beginning of the 1990s rather than from targeted emission reductions, claims came up to bind revenues from sale of these units to climate protection investments in the selling countries. Because Green Investment Schemes are not, as opposed to IET, backed by clear international standards, bilateral agreements are needed to define revenue spendings. Such agreements include the type and scale of investment, the way how the budget is administered and allocated and how monitoring and verification is carried out. The AAU buyer may be involved to a certain extent in, e.g., selection of project types and monitoring activities. The bilateral agreements are highly heterogeneous in environmental stringency.
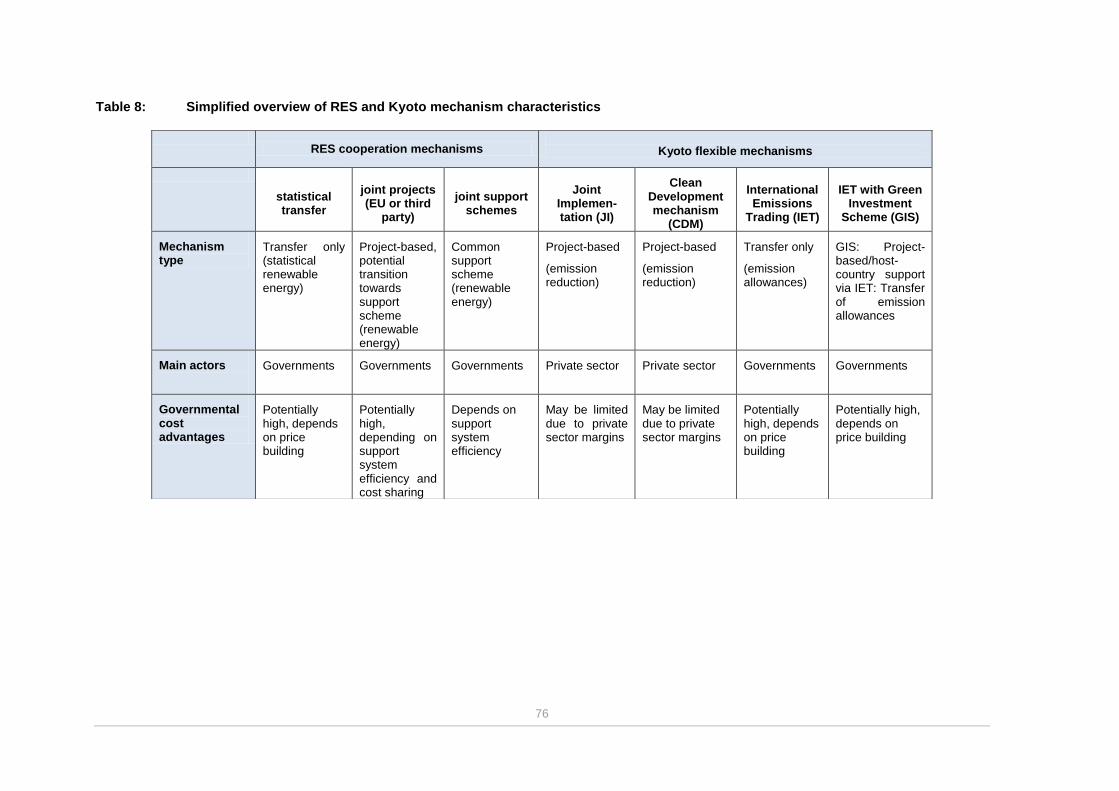
76
Table 8: Simplified overview of RES and Kyoto mechanism characteristics
RES cooperation mechanisms
Kyoto flexible mechanisms
statistical transfer
joint projects (EU or third
party)
joint support schemes
Joint Implemen-tation (JI)
Clean Development mechanism
(CDM)
International Emissions
Trading (IET)
IET with Green Investment
Scheme (GIS)
Mechanism type
Transfer only (statistical renewable energy)
Project-based, potential transition towards support scheme (renewable energy)
Common support scheme (renewable energy)
Project-based
(emission reduction)
Project-based
(emission reduction)
Transfer only
(emission allowances)
GIS: Project-based/host-country support via IET: Transfer of emission allowances
Main actors
Governments Governments Governments Private sector Private sector Governments Governments
Governmental cost advantages
Potentially high, depends on price building
Potentially high, depending on support system efficiency and cost sharing
Depends on support system efficiency
May be limited due to private sector margins
May be limited due to private sector margins
Potentially high, depends on price building
Potentially high, depends on price building
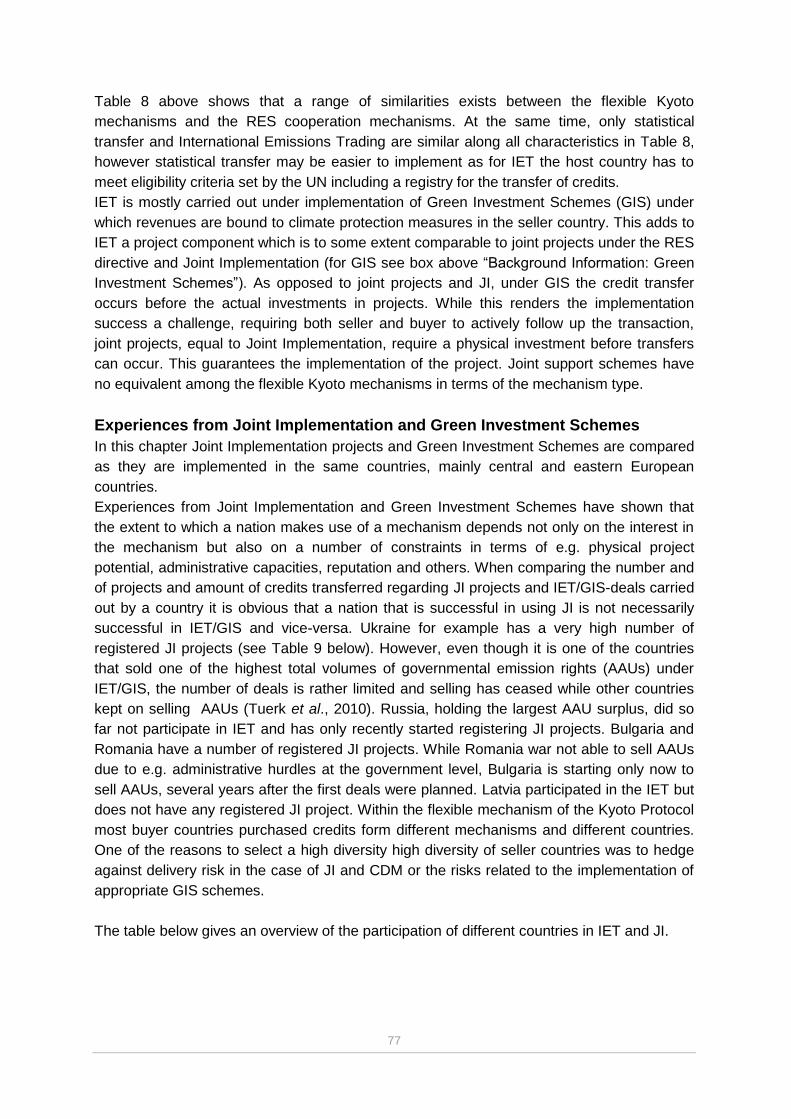
77
Table 8 above shows that a range of similarities exists between the flexible Kyoto
mechanisms and the RES cooperation mechanisms. At the same time, only statistical
transfer and International Emissions Trading are similar along all characteristics in Table 8,
however statistical transfer may be easier to implement as for IET the host country has to
meet eligibility criteria set by the UN including a registry for the transfer of credits.
IET is mostly carried out under implementation of Green Investment Schemes (GIS) under
which revenues are bound to climate protection measures in the seller country. This adds to
IET a project component which is to some extent comparable to joint projects under the RES
directive and Joint Implementation (for GIS see box above “Background Information: Green
Investment Schemes”). As opposed to joint projects and JI, under GIS the credit transfer
occurs before the actual investments in projects. While this renders the implementation
success a challenge, requiring both seller and buyer to actively follow up the transaction,
joint projects, equal to Joint Implementation, require a physical investment before transfers
can occur. This guarantees the implementation of the project. Joint support schemes have
no equivalent among the flexible Kyoto mechanisms in terms of the mechanism type.
Experiences from Joint Implementation and Green Investment Schemes
In this chapter Joint Implementation projects and Green Investment Schemes are compared
as they are implemented in the same countries, mainly central and eastern European
countries.
Experiences from Joint Implementation and Green Investment Schemes have shown that
the extent to which a nation makes use of a mechanism depends not only on the interest in
the mechanism but also on a number of constraints in terms of e.g. physical project
potential, administrative capacities, reputation and others. When comparing the number and
of projects and amount of credits transferred regarding JI projects and IET/GIS-deals carried
out by a country it is obvious that a nation that is successful in using JI is not necessarily
successful in IET/GIS and vice-versa. Ukraine for example has a very high number of
registered JI projects (see Table 9 below). However, even though it is one of the countries
that sold one of the highest total volumes of governmental emission rights (AAUs) under
IET/GIS, the number of deals is rather limited and selling has ceased while other countries
kept on selling AAUs (Tuerk et al., 2010). Russia, holding the largest AAU surplus, did so
far not participate in IET and has only recently started registering JI projects. Bulgaria and
Romania have a number of registered JI projects. While Romania war not able to sell AAUs
due to e.g. administrative hurdles at the government level, Bulgaria is starting only now to
sell AAUs, several years after the first deals were planned. Latvia participated in the IET but
does not have any registered JI project. Within the flexible mechanism of the Kyoto Protocol
most buyer countries purchased credits form different mechanisms and different countries.
One of the reasons to select a high diversity high diversity of seller countries was to hedge
against delivery risk in the case of JI and CDM or the risks related to the implementation of
appropriate GIS schemes.
The table below gives an overview of the participation of different countries in IET and JI.
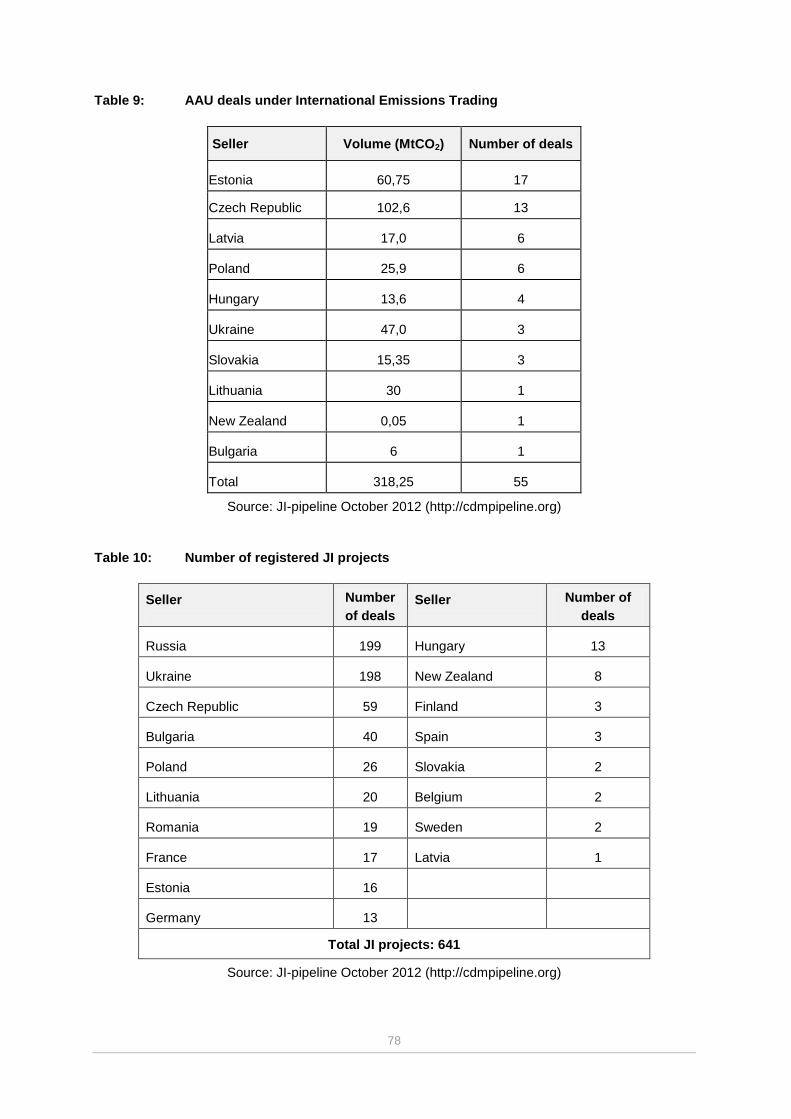
78
Table 9: AAU deals under International Emissions Trading
Seller Volume (MtCO2) Number of deals Estonia 60,75 17
Czech Republic 102,6 13
Latvia 17,0 6
Poland 25,9 6
Hungary 13,6 4
Ukraine 47,0 3
Slovakia 15,35 3
Lithuania 30 1
New Zealand 0,05 1
Bulgaria 6 1
Total 318,25 55
Source: JI-pipeline October 2012 (http://cdmpipeline.org)
Table 10: Number of registered JI projects
Seller
Number
of deals
Seller
Number of
deals
Russia 199 Hungary 13
Ukraine 198 New Zealand 8
Czech Republic 59 Finland 3
Bulgaria 40 Spain 3
Poland 26 Slovakia 2
Lithuania 20 Belgium 2
Romania 19 Sweden 2
France 17 Latvia 1
Estonia 16
Germany 13
Total JI projects: 641
308 Source: JI-pipeline October 2012 (http://cdmpipeline.org)

79
The numbers and specific cases described above do not clearly confirm past assumptions
that IET/Green Investment Schemes would be more successful than JI due to the lower
need to deal with the complex UN procedures (compare e.g. Klessmann, C. et al., 2010,
Ürge-Vorsatz et al., 2007). Country-specific potentials under GIS proved to be misleading:
While a very high AAU surplus did not mean that AAUs would actually be sold, countries
implementing GIS partly had problems spending the AAU revenues due to limited project
potentials or difficulties to agree on project types with buyers (Tuerk et al., 2010). Past
experiences thus show that predictions based on supply-demand analysis were valid only to
a limited extent. Similarly, for the RES cooperation mechanisms anticipated supply-demand
balances may provide an indicator of future market dynamics but practical hurdles may
dominate these in specific cases.
Because of the high diversity of factors influencing the successful use of the Kyoto
mechanisms and the different nature of the RES cooperation mechanisms it is not possible
to directly transfer past experiences with the Kyoto mechanisms to the capability of nations
to make use of the cooperation mechanisms. For instance legal issues relating to transfer of
Kyoto units may not be comparable to renewable energy transfers. Some similarities may
occur where administrative structures did not enable to handle the implementation of a
Green Investment Scheme. This may indicate potential difficulties in particular with the more
complex RES cooperation mechanisms such as joint support schemes.
80
6 Integrated Assessment of the Scenarios
For the six key scenarios of this project an integrated assessment was carried out that
included investment and operating costs, macroeconomic effects, external effects as well as
costs/revenues from RES- and CO2-trade. The assessment focused primarily on the time
horizon 2050, thereby considering the long-term effects of the investments made up to 2020.
A discount rate of 2.5% was used as default value; however, discount rates were varied to
analyze the sensitivity of the results to the discount rate. Beside effects until 2050, also
short-term effects until 2020 were considered. The quantitative comparisons were
complemented by a qualitative analysis of the potential role that the RES cooperation
mechanisms may play for Austria. The integrated assessment was carried out in several
steps. In the first step (section 6.1) welfare effects – both originating from economic and
environmental effects – were analysed. In a second step (section 6.2) effects on the activity
balance (here defined as the sum of trade balance, CO2- and RES-trade) were analysed. In
a third step (section 6.3) required amounts for public as well as total expenditures were
compared. In a fourth step (section 6.4) results from the prior steps were integrated to draw
preliminary conclusions based on quantitative information. In a final step the assessment of
quantitative data was complemented with the analysis on the potential role of RES
cooperation mechanisms in the different scenarios.
6.1 Comparison of the welfare effects up to 2050
In this section the six scenarios are compared regarding their welfare effects that are
composed by the consumption opportunities of the society and the sum of external costs
and benefits. All numbers are relative to the reference scenario in which no additional
policies are implemented.
Figure 36: Welfare effects both from consumption and external effects compared to the
reference scenario (discount rate 2.5 %, period 2011-2050)
3.0
53
12
.43
4
18
.76
2
-1.7
10
-2.6
11
8.1
85
79
8 2.5
19
3.0
76
8.2
48
9.2
17
10
.14
2
3.8
51
14
.95
3
21
.83
8
6.5
38
6.6
06
18
.32
7
-5.000
0
5.000
10.000
15.000
20.000
25.000
1 A 2 A 3 A 1 B 2 B 3 B
We
lfar
e E
ffe
cts
(Mio
. €
)
Consumption External Effects SUM Welfare Effects
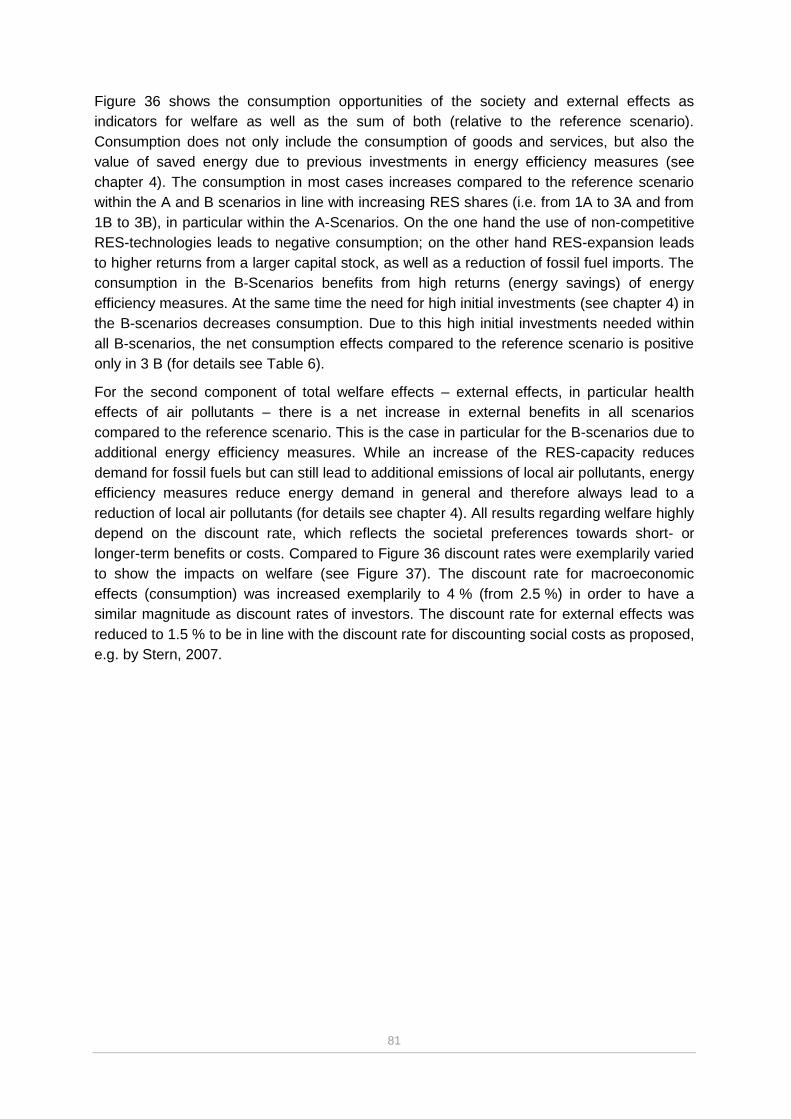
81
Figure 36 shows the consumption opportunities of the society and external effects as
indicators for welfare as well as the sum of both (relative to the reference scenario).
Consumption does not only include the consumption of goods and services, but also the
value of saved energy due to previous investments in energy efficiency measures (see
chapter 4). The consumption in most cases increases compared to the reference scenario
within the A and B scenarios in line with increasing RES shares (i.e. from 1A to 3A and from
1B to 3B), in particular within the A-Scenarios. On the one hand the use of non-competitive
RES-technologies leads to negative consumption; on the other hand RES-expansion leads
to higher returns from a larger capital stock, as well as a reduction of fossil fuel imports. The
consumption in the B-Scenarios benefits from high returns (energy savings) of energy
efficiency measures. At the same time the need for high initial investments (see chapter 4) in
the B-scenarios decreases consumption. Due to this high initial investments needed within
all B-scenarios, the net consumption effects compared to the reference scenario is positive
only in 3 B (for details see Table 6).
For the second component of total welfare effects – external effects, in particular health
effects of air pollutants – there is a net increase in external benefits in all scenarios
compared to the reference scenario. This is the case in particular for the B-scenarios due to
additional energy efficiency measures. While an increase of the RES-capacity reduces
demand for fossil fuels but can still lead to additional emissions of local air pollutants, energy
efficiency measures reduce energy demand in general and therefore always lead to a
reduction of local air pollutants (for details see chapter 4). All results regarding welfare highly
depend on the discount rate, which reflects the societal preferences towards short- or
longer-term benefits or costs. Compared to Figure 36 discount rates were exemplarily varied
to show the impacts on welfare (see Figure 37). The discount rate for macroeconomic
effects (consumption) was increased exemplarily to 4 % (from 2.5 %) in order to have a
similar magnitude as discount rates of investors. The discount rate for external effects was
reduced to 1.5 % to be in line with the discount rate for discounting social costs as proposed,
e.g. by Stern, 2007.

82
Figure 37: Welfare effects both from consumption and external effects compared to the
reference scenario (discount rate 4 % for consumption, 1.5% for external effects,
period 2011-2050)
At a discount rate of 4% for consumption the future consumption opportunities are valuated
less than at a discount rate of 2.5% (default value). This leads to a disadvantage for the
B-Scenarios compared to the A-Scenarios as the consumption is negative in the
B-Scenarios in the short term and becomes positive only in the long-term. Regarding the
external effects, the lower discount rate of 1.5 % leads to an increase of net external benefits
in all scenarios, however over proportionally for the B-Scenarios. In sum, the higher net
external benefits cannot compensate enough the disadvantages by the significantly reduced
consumption for the B-scenarios to achieve the same welfare effects when discounting both
macroeconomic as well as external effects with 2.5 %. However, the welfare effects still stay
positive and show the same pattern even at this deviation in the discount rates.
To sum it up: All scenarios have a higher welfare than the reference scenario, with the A-
scenarios having higher welfare effects than the respective B-scenarios. A particularly high
welfare increase can be achieved when moving from a scenario without additional RES
support (only reducing non-financial barriers and increasing the current RES support caps)
to a scenario with a moderate RES support (compared to current RES support). This is the
case when moving from 1A to 2A and from 2B to 3B. Also the step from moderate to strong
RES support increase (compared to current support), from 2A to 3A is accompanied by a
high welfare increase. Changing the discount rates and therefore the preferences towards
short or longer benefits or costs can significantly change the preference for A or B scenarios.
6.2 Comparison of the activity balance up to 2050
Besides the welfare effects, the change in the activity balance is a second decision criterion
for identifying the most beneficial scenario for achieving Austria’s RES target. The activity
balance as defined in this analysis includes the trade balance effects (up to 2050), CO2
trade, and RES trade and is an indicator of whether and to what extent positive welfare
2.1
79
9.8
33
14
.53
5
-9.4
63
-10
.24
4
-1.7
07
93
5 2.8
72
3.4
66
9.6
22
10
.76
1
11
.80
2
3.1
15
12
.70
4
18
.00
1
15
9
51
7
10
.09
5
-15.000
-10.000
-5.000
0
5.000
10.000
15.000
20.000
1 A 2 A 3 A 1 B 2 B 3 B
We
lfar
e E
ffe
cts
(Mio
. €
)
Consumption External Effects SUM Welfare Effects
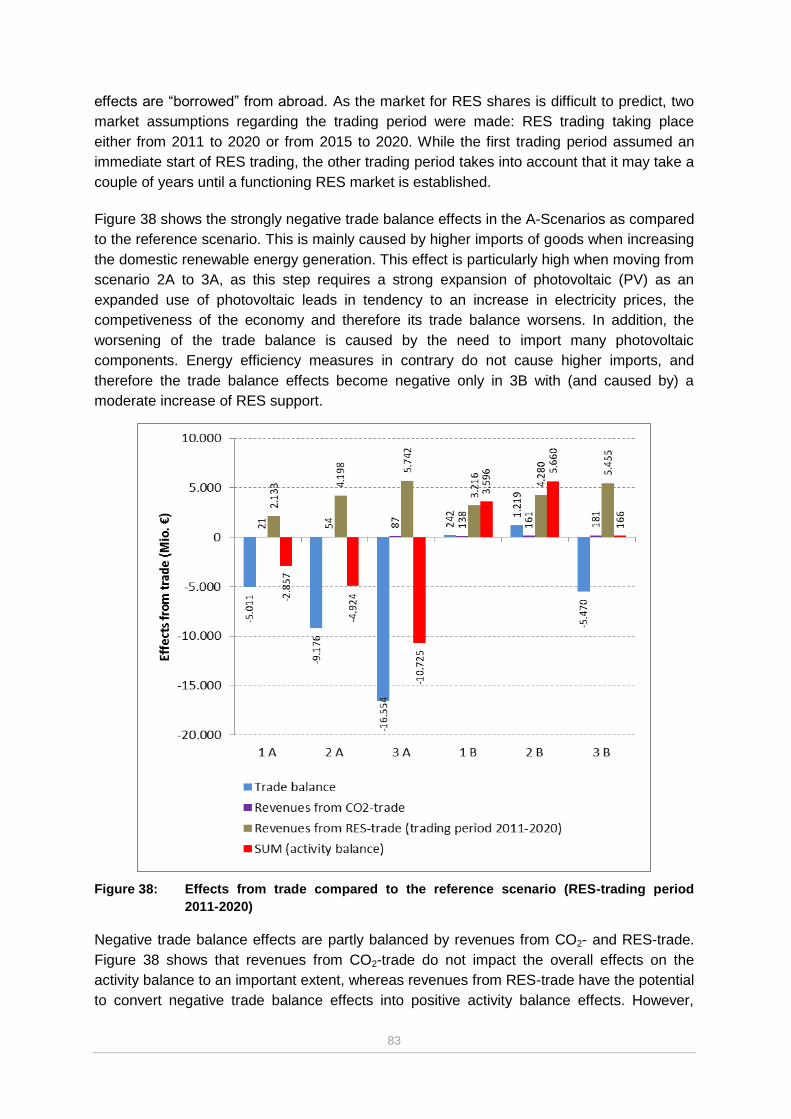
83
effects are “borrowed” from abroad. As the market for RES shares is difficult to predict, two
market assumptions regarding the trading period were made: RES trading taking place
either from 2011 to 2020 or from 2015 to 2020. While the first trading period assumed an
immediate start of RES trading, the other trading period takes into account that it may take a
couple of years until a functioning RES market is established.
Figure 38 shows the strongly negative trade balance effects in the A-Scenarios as compared
to the reference scenario. This is mainly caused by higher imports of goods when increasing
the domestic renewable energy generation. This effect is particularly high when moving from
scenario 2A to 3A, as this step requires a strong expansion of photovoltaic (PV) as an
expanded use of photovoltaic leads in tendency to an increase in electricity prices, the
competiveness of the economy and therefore its trade balance worsens. In addition, the
worsening of the trade balance is caused by the need to import many photovoltaic
components. Energy efficiency measures in contrary do not cause higher imports, and
therefore the trade balance effects become negative only in 3B with (and caused by) a
moderate increase of RES support.
Figure 38: Effects from trade compared to the reference scenario (RES-trading period
2011-2020)
Negative trade balance effects are partly balanced by revenues from CO2- and RES-trade.
Figure 38 shows that revenues from CO2-trade do not impact the overall effects on the
activity balance to an important extent, whereas revenues from RES-trade have the potential
to convert negative trade balance effects into positive activity balance effects. However,

84
revenues from RES-trade (compared to the reference scenario) highly depend on
assumptions like the trading period (2011-2020 versus 2015-2020) or prices for RES-shares.
The prices used in our assessment can be found in Annex 1, Table 17 and vary between 70
and 77 €/MWh (moderate price assumptions) depending on the scenario and the year in
which the trade occurs. Whether or not a trading period for RES-shares from 2015 to 2020
or from 2011 to 2020 is assumed however does not impact the ranking between scenarios.
To sum it up: From the point of view of the activity balance the B-scenarios perform better
than the A-scenarios as in the A-scenarios the trade balance worsens with the RES capacity
extension. The effect of CO2-trade on the overall activity balance is relatively small. In
contrast, RES-trade can, depending on the market assumptions, significantly change the
balance, but does not in our case change the ranking of the scenarios.
6.3 Comparison of public and total expenditures
Public expenditures (investment costs, subsidies, maintenance cost) vary considerably
among the analyzed scenarios. Generally, the B-scenarios require higher public funds.
However, while public expenditures in A-scenarios only include subsidies for RES-expansion
needed by private investors, public expenditures in energy efficiency measures include also
investment costs for instance for thermal insulation in public buildings. Therefore, the high
public expenditures in the B-scenarios also add value to public assets.
Figure 39: Additional public expenditures compared to the reference scenario within the
time periods 2011-2020 and 2011-2050
Figure 39 shows that the needed public expenditures are far higher in the B-scenarios. The
increase in public expenditures in the B-scenarios from 1B to 3B is small, whereas this
increase is significant within the A-scenarios – especially from 2A to 3A. This increase is
mainly caused by intensified PV capacity extension in 3A compared to 2A. It can also be
observed from Figure 39 that only approximately one half of required public funds
(subsidies) in the A-scenarios are needed until 2020 – the rest has to be raised after 2020.
1.6
61
2.3
06
8.9
30
21
.82
5
21
.60
2
22
.96
2
3.6
19
3.6
06
16
.46
4
27
.13
4
27
.33
0
29
.16
6
0
5.000
10.000
15.000
20.000
25.000
30.000
35.000
1 A 2 A 3 A 1 B 2 B 3 B
Ad
dit
ion
al P
ub
lic E
xpe
nd
itu
res
(Mio
.€)
2020 2050
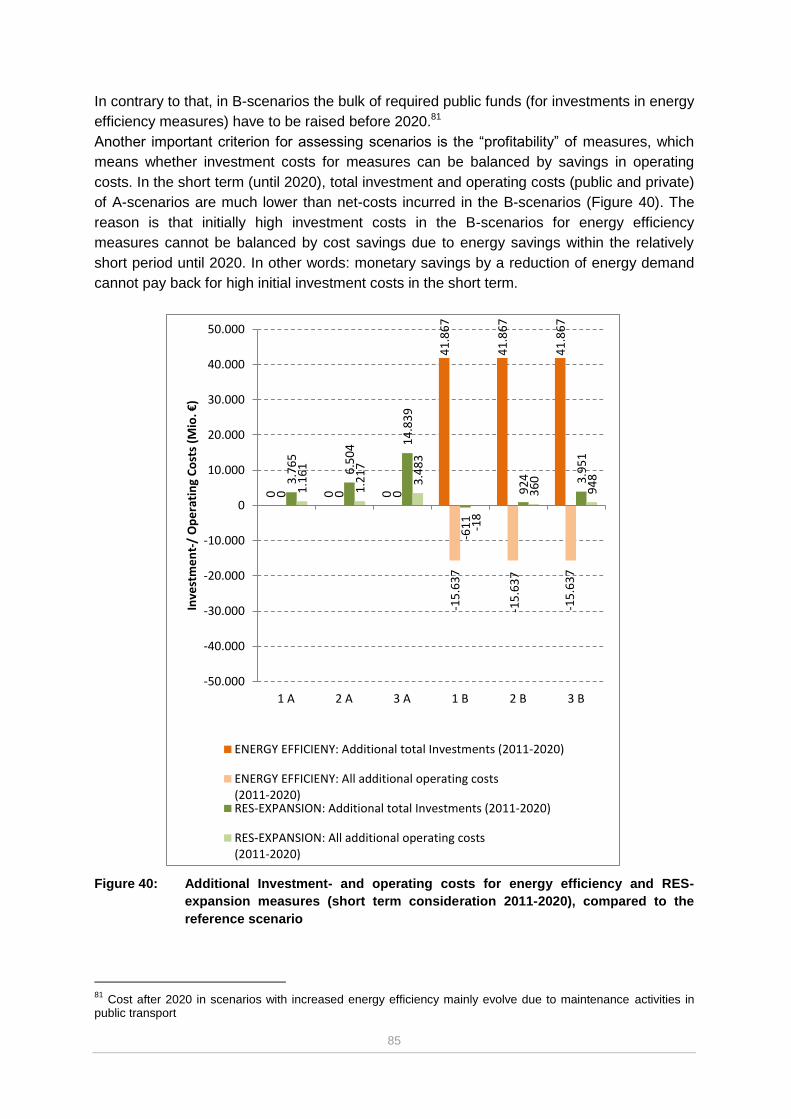
85
In contrary to that, in B-scenarios the bulk of required public funds (for investments in energy
efficiency measures) have to be raised before 2020.81
Another important criterion for assessing scenarios is the “profitability” of measures, which
means whether investment costs for measures can be balanced by savings in operating
costs. In the short term (until 2020), total investment and operating costs (public and private)
of A-scenarios are much lower than net-costs incurred in the B-scenarios (Figure 40). The
reason is that initially high investment costs in the B-scenarios for energy efficiency
measures cannot be balanced by cost savings due to energy savings within the relatively
short period until 2020. In other words: monetary savings by a reduction of energy demand
cannot pay back for high initial investment costs in the short term.
Figure 40: Additional Investment- and operating costs for energy efficiency and RES-
expansion measures (short term consideration 2011-2020), compared to the
reference scenario
81
Cost after 2020 in scenarios with increased energy efficiency mainly evolve due to maintenance activities in public transport
0
0
0
41
.86
7
41
.86
7
41
.86
7
0
0
0
-15
.63
7
-15
.63
7
-15
.63
7
3.7
65
6.5
04
14
.83
9
-61
1
92
4
3.9
51
1.1
61
1.2
17
3.4
83
-18
36
0
94
8
-50.000
-40.000
-30.000
-20.000
-10.000
0
10.000
20.000
30.000
40.000
50.000
1 A 2 A 3 A 1 B 2 B 3 B
Inve
stm
en
t-/
Op
era
tin
g C
ost
s (M
io. €
)
ENERGY EFFICIENY: Additional total Investments (2011-2020)
ENERGY EFFICIENY: All additional operating costs(2011-2020)RES-EXPANSION: Additional total Investments (2011-2020)
RES-EXPANSION: All additional operating costs(2011-2020)
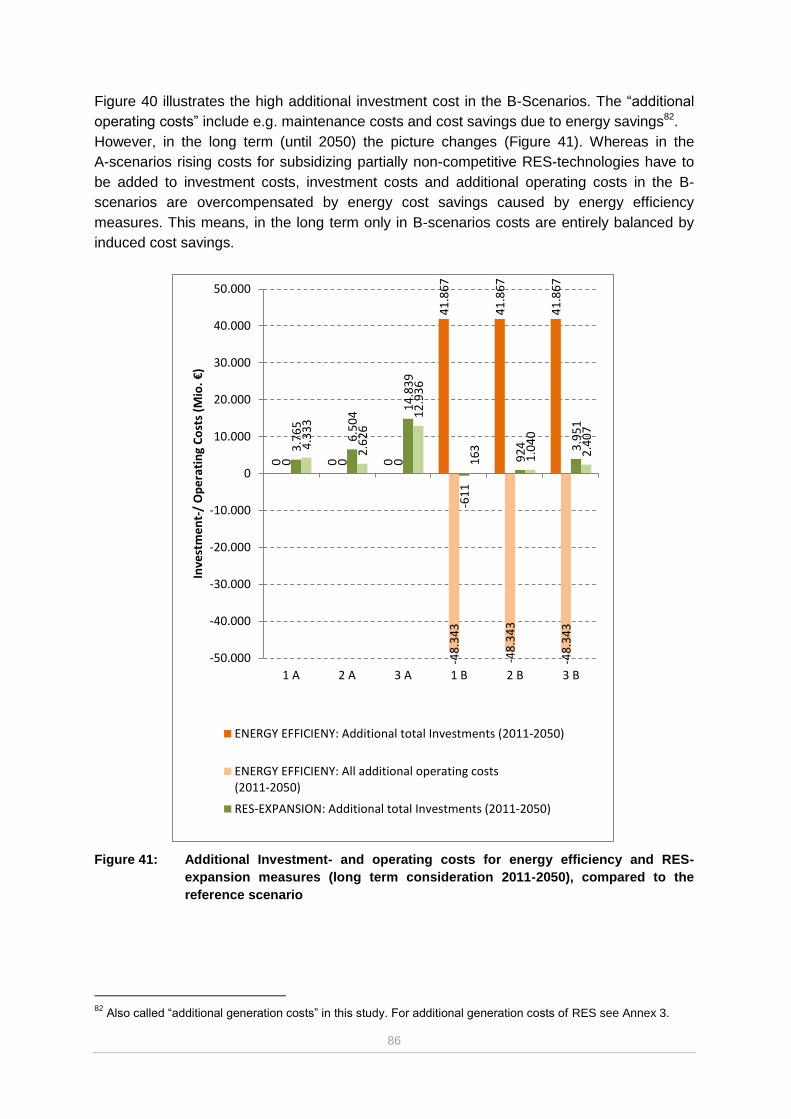
86
Figure 40 illustrates the high additional investment cost in the B-Scenarios. The “additional
operating costs” include e.g. maintenance costs and cost savings due to energy savings82.
However, in the long term (until 2050) the picture changes (Figure 41). Whereas in the
A-scenarios rising costs for subsidizing partially non-competitive RES-technologies have to
be added to investment costs, investment costs and additional operating costs in the B-
scenarios are overcompensated by energy cost savings caused by energy efficiency
measures. This means, in the long term only in B-scenarios costs are entirely balanced by
induced cost savings.
Figure 41: Additional Investment- and operating costs for energy efficiency and RES-
expansion measures (long term consideration 2011-2050), compared to the
reference scenario
82
Also called “additional generation costs” in this study. For additional generation costs of RES see Annex 3.
0
0
0
41
.86
7
41
.86
7
41
.86
7
0
0
0
-48
.34
3
-48
.34
3
-48
.34
3
3.7
65
6.5
04
14
.83
9
-61
1
92
4
3.9
51
4.3
33
2.6
26
12
.93
6
16
3
1.0
40
2.4
07
-50.000
-40.000
-30.000
-20.000
-10.000
0
10.000
20.000
30.000
40.000
50.000
1 A 2 A 3 A 1 B 2 B 3 B
Inve
stm
en
t-/
Op
era
tin
g C
ost
s (M
io. €
)
ENERGY EFFICIENY: Additional total Investments (2011-2050)
ENERGY EFFICIENY: All additional operating costs(2011-2050)
RES-EXPANSION: Additional total Investments (2011-2050)

87
6.4 Integrating the results
The comparisons in the previous chapters reveal that A-scenarios have higher overall
welfare effects (= consumption possibilities) whereas B-Scenarios result in a better activity
balance. Also, A-scenarios require lower funds in the short term, whereas only in B-
scenarios investment and operating costs are entirely paid back by energy costs savings. In
this section, we combine the different results and draw conclusions on the overall strengths
and weaknesses of the assessed scenarios.
The figures below show the total welfare effects as well as the activity balance (compared to
the reference scenario) for all six assessed cases. Figure 42 assumes RES-trade from 2011
to 2020 and Figure 43 from 2015 to 2020. RES-trade from 2015-2020 has been chosen as
default for the conclusions of the integrated assessment in order to take into account that it
may take a couple of years until a functioning RES market is established.
Figure 42: Total welfare effects adjusted by total trade effects up to 2050 compared to the
reference scenario (RES trading period 2011-2020)
3.8
51
14
.95
3
21
.83
8
6.5
38
6.6
06
18
.32
7
-2.8
57
-4.9
24
-10
.72
5
3.5
96
5.6
60
16
6
-15.000
-10.000
-5.000
0
5.000
10.000
15.000
20.000
25.000
1 A 2 A 3 A 1 B 2 B 3 B
Mio
. €
Total Welfare Activity balance (trading period 2011-2020)

88
Figure 43: Total welfare effects adjusted by total trade effects up to 2050 compared to the
reference scenario (RES trading period 2015-2020)
Based on the integrated analyses of welfare and activity balance effects in Figure 43 and the
results of chapter 6 on public and total expenditures we draw the following conclusions:
An underachievement of the Austrian RES target (reference scenario and 1A) is the
least desirable option from an economic point of view.
While a moderate increase of the RES support (from 1A to 2A or from 2B to 3B) has
high welfare gains, the negative effects on the activity balance are comparably low.
Moving from moderate83 RES-support to strong RES support (2A to 3A) leads to a
strong welfare increase, however the welfare increase is accompanied by a
significant negative impact on the activity balance. Because these two effects are in
the same magnitude, we cannot see a clear preference for 2A or 3A based only on
welfare and activity balance effects. However, the need for public subsidies strongly
increases when moving from 2A to 3A.
The effects of purchasing or selling RES shares in case of an under- or
overachievement depend on the market assumptions but do in none of the analyzed
scenarios lead to a change of the overall ranking of the scenarios.
Achieving or over-achieving the Austrian RES-target with the B-scenarios requires
significantly higher public funds than with the A-scenarios. Most of these funds would
have to be provided until 2020 due to the high investment costs of energy efficiency
measures. However in the long-term (2011-2050) – taking long-term savings of
energy efficiency measures into consideration (discount rate 2.5%) – only in
scenarios, which include energy efficiency measures (B-scenarios) investment costs
are paid off whereas in the A-scenarios costs are not paid off by revenues (savings in
operating costs).
83
„Moderate“ increase as compared to current RES support
3.8
51
14
.95
3
21
.83
8
6.5
38
6.6
06
18
.32
7
-92
8
-3.2
04
-9.1
19
5.3
32
7.2
79
1.7
05
-15.000
-10.000
-5.000
0
5.000
10.000
15.000
20.000
25.000
1 A 2 A 3 A 1 B 2 B 3 B
Mio
. €
Total Welfare Activity balance (trading period 2015-2020)

89
The role of the cooperation mechanisms for the different scenarios
The integrated assessment shows that CO2-trade plays a minor role as compared to other
economic parameters. In contrast, the magnitude of revenues from RES trading substantially
contributes to the benefits of reaching or overachieving the national 2020 RES target
domestically. In the analyzed scenarios and under the explained market assumptions, the
magnitude of RES trading partly exceeds or is comparable to the trade balance effects.
While in case of underachieving the RES target RES purchases are necessary, the
scenarios leading to exact achievement or overachievement indicate high forgone revenues
if the mechanisms are not used (even at moderate assumed price levels for RES trades).
This shows the importance of considering participation in the cooperation mechanisms. Of
the different cooperation mechanisms statistical transfer corresponds most to the model
assumptions because a transfer of existing surpluses but not project-based mechanism has
been assumed.
To sum it up: The criteria-based assessment showed that a domestic underachievement of
Austria’s 2020 RES target and purchase of RES shares to meet the targets is not a
beneficial option from an economic point of view. A domestic achievement or
overachievement of Austria’s RES target is more advantageous due to its domestic welfare
effects. For exactly meeting the Austrian RES-target, a priorization of either scenario 2A or
2B is difficult because their specific advantages and disadvantages are not directly
comparable. However, taking the long-term view we see a slight preference for scenario 2B.
The analysis suggests that the economically most beneficial pathway is an over-
achievement of the Austrian RES target. From the analysed scenarios this should be
accomplished with 3B rather than 3A. The main reason is the far better total welfare effects if
adjusted by the activity balance.
Over-achieving the RES-target with 3B however requires relatively high additional amounts
of public and private funds in the short term (2011-2020). However, in the long term (2011-
2050), cost savings due to energy saving induced by the investments over-balance
expenditures in the B-scenarios, whereas in the A-scenarios costs are not paid off by
revenues.
90
7 Conclusions
While Austria has already agreed on a comprehensive set of measures to meet its 2020
RES target, the assessment of the different scenarios conducted within this project reveals
that there may still exist additional opportunities for Austria’s energy policy.
The integrated assessment of the project results demonstrates that the different scenarios
for meeting or over-achieving Austria’s RES target have different economic advantages and
drawbacks that also depend on the discount rate applied and therefore on societal
preferences regarding future costs and revenues. Moderately increasing the current support
for RES (i.e. providing additional support for rather cost-efficient RES technologies) would
yield high macroeconomic benefits in the short and medium term. A strong increase of the
current RES support (providing additional support also to less cost-efficient RES
technologies) would lead to a strong welfare increase, however accompanied by a
significant negative impact on the activity balance. Energy efficiency measures, on the other
hand, would lead to strong cumulated external benefits in the long-term through the
reduction of energy use that leads to a reduction of air pollutants.
Based on the results of this project it can be concluded that a domestic underachievement of
Austria’s 2020 RES target and, consequently, a purchase of required RES volumes via
cooperation mechanisms cannot be recommended from an economic viewpoint. For
achieving the committed 34% RES-target by 2020 in Austria the results suggest a mix of a
strong domestic energy efficiency policy package reducing final energy demand by 150 PJ
by 2020 and a few additional incentives to increase RES deployment above targeted levels,
such as increasing of budgetary caps for RES electricity or enhanced stipulation of RES in
the heat sector. An overachievement of Austria’s RES target (up to 36%) represents the
most beneficial option among all assessed scenarios from an economic point of view if it is
realized with a moderate increase of current RES support (beyond just increasing current
budgetary caps, providing additional support for rather cost-efficient RES technology options
in Austria) and a strong energy efficiency policy package long-term domestic
macroeconomic and external effects are considered. Such an overachievement of the RES
target may also be an appropriate strategy for Austria to hedge against unforeseeable
changes in the economic framework (e.g. a higher economic and energy demand growth
than projected (reducing the share of RES) or implementation risks of planned RES or
energy efficiency measures. At the same time, an overachievement of the RES target would
give Austria the opportunity to sell RES volumes to other EU Member States by 2020 and
potentially also in the years before 2020 whenever surpluses occur via statistical transfer. In
addition to generating income from Statistical Transfer, Austria might also allow for
renewable energy investments by other countries in the framework of joint projects. This
may improve the point of departure for post-2020 targets by increasing Austria’s total
renewable energy production well in time. However in contrast to statistical transfers, joint
projects represent a long-term commitment to (virtually) export RES which should only be
followed if Austria remains to be well on track to fulfill its domestic target. At the same time,
given that Austria does not depend on the cooperation mechanisms in order to meet its
target, joint support schemes may not have sufficient benefits which would justify their
potentially high transaction costs, in particular for the short timeframe till 2020.
91
Overall, the market for virtual RES trade generally still faces significant uncertainties and is
difficult to predict. Experiences with the flexible Kyoto mechanisms to which the cooperation
mechanisms have parallels have shown that the high number of factors impacting the
success of a mechanism makes it extremely difficult to predict the mechanisms’ actual use.
Anticipated as supply-demand balances may provide an indicator of future market dynamics
but other factors, such as institutional or administrative barriers, may significantly influence
these in practice.
Apart from the focus on Austria, this project also considered the European perspective:
intensified cooperation between Member States in achieving their 2020 RES targets would
allow to reduce the cost burden on the EU level significantly: Annual European support
expenditures for RES-electricity for example can be decreased by several billion € in 2020.
For Austria such a European cost-minimization would imply an overachievement of its
target. The report therefore concludes that an overachievement of Austria’s RES target
economically makes sense from both an Austrian and a European perspective. Moreover,
such a strategy may serve as a safeguard against unpredictable changes and could lay the
foundation for future RES target achievements. Thus, a strategy aiming an overachievement
of Austria’s RES target would contribute to an economically attractive and future-oriented
pathway for Austria’s RES policy while facilitating RES cooperation across the European
Union.
92
8 References
Aunan, K., Aaheim, A. H., Seip, H. M., (2000): Ancillary Benefits of Greenhouse Gas
Mitigation - an Overview, in OECD et al, Reduced Damage to Health and Environment
from Energy Saving in Hungary, Proceedings of an IPCC Co-Sponsored Workshop,
Washington D.C. 2000
Bickel, P., Friedrich, R. (editors) (2005): ExternE – Externalities of Energy; Methodology
2005 update; University of Stuttgart; on behalf of the European Commission; Germany;
EUR 21951
Bleyl-Androschin J., Schinnerl D., Jungmeier G., Pucker J., Prettenthaler F., Türk A., Steiner
D., Leonhartsberger C., Eder M., Rohracher H. (2011): Biogas Gesamtbewertung –
Ökologische, ökonomische und sozialwissenschaftliche Gesamtbewertung von Biogas
aus dem Gasnetz als Kraftstoff und in stationären Anwendungen; funded by the Austrian
Climate- and Energy Fund; Vienna, Austria.
BMWFJ (2010a): Energiestrategie Österreich, Wien: Bundesministerium für Wirtschaft,
Forschung und Jugend.
BMWFJ (2010b): Nationaler Aktionsplan 2010 für erneuerbare Energien für Österreich,
Wien: Österreichisches Institut für Wirtschaftsforschung.
Burtraw, D., Toman, M.: Estimating the ancillary benefits of greenhouse gas mitigation
policies in the U.S.; OECD; http://www.oecd.org/dataoecd/32/23/2054700.pdf
Capros, P., Mantzos, L., Papandreou, V., Tasios, N. (2007): European energy and transport
trends to 2030 — update 2007, Luxembourg: Publications Office of the European Union.
Capros, P., Mantzos, L., Tasios, N., De Vita, A., Kouvaritkis, N. (2010): EU energy trends to
2030 — Update 2009, Luxembourg: Publications Office of the European Union.
Capros, Pantelis; L. Mantzos, V. Papandreou, N. Tasios (2008): Model-based Analysis of
the 2008 EU Policy Package on Climate Change and Renewables. Report to the
European Commission, DG Environment – conducted by National Technical University of
Athens, June 2008.
EA Energy Analyses (2007): Renewable Energy – Costs and Benefits to society (RECaBs);
RECaBs main report: Prepared for the IEA’s Implementing Agreement on Renewable
Energy Technology Deployment; Copenhagen, Denmark; www.iea-redt.org .
EC, European Commission, 2010. Summary of the Member State Forecast Documents,
Published on the Renewable Energy Transparency Platform,
http://ec.europa.eu/energy/renewables/transparency_platform/doc/0_forecast_summary.p
df
EISERN–„Energieinvestitionsstrategien und langfristige Anforderungen zur
Emissionsreduktion“ - project lead: TU Wien. A Project funded by the Austrian Energy and
Climate fund. EISERN bases its data on projections by the IEA. Final report forthcoming.
93
Ernst & Young (2009): Cost and financial support for offshore wind, report prepared for the
Department of Energy and Climate Change, London, United Kingdom, 2009.
European Environment Agency: EN35 – External costs of electricity production;
http://www.eea.europa.eu/data-and-maps/indicators/en35-external-costs-of-electricity-
production-1/en35.
European Parliament, 2009. Directive 2009/28/EC of the European Parliament and of the
Council of 23 April 2009 on the promotion of the use of energy from renewable sources
and amending and subsequently repealing Directives 2001/77/EC and 2003/30/EC
Friedrich, R., Rabl, A., Hirschberg, S., Desaigues, B., Markandya, A., de Nocker, L. (2004):
New Elements for the Assessment of External Costs from Energy Technologies (NewExt);
Final Report to the European Commission, DG Research, Technological Development
and Demonstration (RTD); IER (Germany), ARMINES / ENSMP (France), PSI
(Switzerland), Université de Paris I (France), University of Bath (United Kingdom), VITO
(Belgium); 09/2004.
Greenstream, (2010): Analysis of the flexible support mechanisms in the Directive on the
promotion of the use of energy from renewable sources. The Nordic Working Group for
Renewable Energy, Final Report, 8th January 2010.
Hofbauer H., Schönberger C., Jungmeier G., Canella L., Pucker J., Hausberger S. (2008):
FT-Treibstoffe aus Biomasse in Österreich - Biomassepotential, Technologien und
ökonomische und ökologische Relevanz, Chapter 6 - Ökologie, Final Report, Vienna
University of Technology, Joanneum Research; Vienna.
Howes, Tom, (2010): The EU’s New Renewable Energy Directive (2009/28/EC). In:
Oberthür, Sebastian, Pallemarts, Marc (eds.), The New Climate Policies of the European
Union (I.E.S. series nr. 15), VUBPress, 2010, 133
Jansen J.C., A. Uslu, P.Lako, (2010): What is the scope for the Dutch government to use the
flexible mechanisms of the Renewables Directive cost-effectively? – A preliminary
assessment. Energy research Center of the Netherlands, ECN, March 2010.
Kaltschmitt, M., Krewitt, W., Heinz, A., Bachmann, T., Gruber, S., Kappelmann, K.-H.,
Beerbaum, S., Isermeyer, F., Seifert, K. (2000): Gesamtwirtschaftliche Bewertung der
Energiegewinnung aus Biomasse unter Berücksichtigung externer und
makroökonomischer Effekte; Endbericht; Universitaet Stuttgart, Universitaet Hohenheim,
Bundesforschungsanstalt für Landwirtschaft; on behalf of the German Federal Ministry of
Food, Agriculture and Forestry (BMELF); Germany; 10/2000.
Klessmann C., de Jager D., Stricker E., Winkel T., de Visser E., Koper M., Ragwitz M., Held
A., Resch G., Busch S., Panzer C., Gazzo A., Roulleau T., Gousseland P., Henriet M.,
Bouillé A., 2010: Financing Renewable Energy in the European Energy Market. A study
led by Ecofys funded by the European Commission, DG Energy.
Klessmann, C. (2009): The evolution of flexibility mechanisms for achieving European
renewable energy targets 2020 – ex-ante evaluation of the principle mechanisms. Energy
Policy 37, 4966 – 4979
94
Klessmann, C. et al., (2010): Design options for cooperation mechanisms under the new
European renewable energy directive. Energy Policy, Volume 38, Issue 8, August 2010,
4679–4691
Koeppl, A., Kettner, C., Kletzan-Slamanig, D., Schleicher, S., Schnitzer, H., Titz, M., Damm,
A., Steininger, K., Wolkinger, B., Lang, R., Wallner, G., Artner, H., Karner, A. (2011):
Energy Transition 2012/2020/2050 – Strategies for the Transition to Low Energy and Low
Emission Structures; Austrian Institute of Economic Research, Graz University of
Technology, University of Graz, Johannes Kepler University Linz, KWI Consultants;
funded by the Austrian “Klima- und Energiefonds”; 02/2011.
Kranzl, Lukas; G. Kalt, F. Diesenreiter, E. Schmid, B. Stürmer (2009): Does bioenergy
contribute to more stable energy prices? Paper and presentation at the European
Conference of the International Association of Energy Economics in 2009, Vienna,
Austria, 2009.
Krewitt, W., Nienhaus, K., Kleßmann, C., Capone, C., Stricker, E., Graus, W., Hoogwijk, M.,
Supersberger, N., Winterfeld, U., Samadi, S. (2009): Role and Potential of Renewable
Energy and Energy Efficiency for Global Energy Supply, final report on behalf of
Umweltbundesamt, Berlin, Germany, 2009.
Lechner, H., Mayer, J., Pierrard, R. (1998): Vergleich von Energieträgern und Heizsystemen
zur Raumwärmeversorgung; by Austrian Energy Agency; on behalf of the Austrian „Institut
fuer wirtschaftliche Oelheizungen“; Vienna.
Maibach, M., Schreyer, C., Sutter, D., van Essen, H.P., Boon, B.H., Smokers, R., Schroten,
A., Doll, C., Pawlowska, B., Bak, M. (2007): Handbook on estimation of external costs in
the transport sector; produced within the study “Internalisation Measures and Policies for
All external Costs of Transport” (IMPACT); Version 1.0; INFRAS, CE Delft, Fraunhofer
Gesellschaft – ISI; University of Gdansk; Publication number 07.4288.52; commissioned
by the European Commission DG TREN; 12/2007.
Nakicenovic N. and Schleicher S. et al. (2007): Assessment of Austrian contribution toward
EU 2020 Target Sharing - Determining reduction targets for 2020 based on potentials for
energy efficiency and renewables. Synthesis Report within the study “Assessing Austria in
the EU 2020 Target Sharing” done by WIFO, Wegener Zentrum für Klima und Globalen
Wandel and TU Wien on behalf of the Austrian Ministries.
NTUA (2007a): PRIMES Baseline scenario (for the EU27) – conducted by National
Technical University of Athens, 31 July 2007.
NTUA (2007b): PRIMES Efficiency case (for the EU27) – conducted by National Technical
University of Athens, 9 August 2007.
NTUA (2008): PRIMES scenario on meeting both EU targets by 2020 – i.e. on climate
change (20% GHG reduction) and renewable energies (20% RES by 2020)
(“NRVCVnsat”)
– conducted by National Technical University of Athens, 25 January 2008.
ÖNACE (2008): Statistic Austria, Economic activities: Classification Database ÖNACE 2008,
http://www.statistik.at/KDBWeb/kdb_VersionAuswahl.do. Visited on 10th of March, 2010.

95
Ragwitz, Mario; J. Schleich, C. Huber, T. Faber, M. Voogt, W. Ruijgrok, P. Bodo (2005):
FORRES 2020 – Analysis of the renewable energy's evolution up to 2020, Final report of
the research project FORRES 2020 of the European Commission DGTREN (Tender Nr.
TREN/D2/10-2002).
Resch Gustav; C. Panzer, M. Ragwitz, T. Faber, C. Huber, M. Rathmann, G. Reece, A.
Held, R. Haas, P.E. Morthorst, S. Grenna Jensen, L. Jaworski, I. Konstantinaviciute, R.
Pasinetti, K. Vertin (2009): futures-e - Deriving a future European Policy for Renewable
Electricity; Final report of the research project futures-e, with support from the European
Commission, DG TREN, EACI under the Intelligent Energy for Europe –Programme
(Contract No. EIE/06/143/SI2.444285). Vienna, Austria, 2009.
Statistik Austria (2010): Energiebilanzen Österreich 1970-2009, Vienna.
Steiner D. (2006): Evaluation of Efficiency of Greenhouse Gas Mitigation Measures under
Consideration of Environmental, Social and Economic Co-Effects; Master’s thesis in
cooperation with JOANNEUM RESEARCH (Prettenthaler, F., Schlamadinger, B.).
Steiner D. (2011): Domestic Offset Projects in Austria – Possibilities for implementation and
resulting economic impacts; Doctoral thesis; Graz, Austria. Aunan, K., Aaheim, A. H.,
Seip, H. M., (2000): Ancillary Benefits of Greenhouse Gas Mitigation - an Overview, in
OECD et al, Reduced Damage to Health and Environment from Energy Saving in
Hungary, Proceedings of an IPCC Co-Sponsored Workshop, Washington D.C. 2000
Stern, N. (2007): The Economics of Climate Change; Cabinet Office – HM Treasury;
ISBN:9780521700801.
Umweltbundesamt (2003): Wieser M., Kurzweil A., Emissionsfaktoren als Grundlage für die
Österreichische Luftschadstoff-Inventur, Austrian Environmental Agency
(Umweltbundesamt GmbH), BE-254, Vienna.
Umweltbundesamt (2009a): Energiewirtschaftliche Inputdaten und Szenarien als Grundlage
zur Erfüllung der Berichtspflichten des Monitoring Mechanisms, Wien: Umweltbundesamt
Umweltbundesamt (2009b): GEMIS-Österreich - Globales Emissions Modell Integrierter
Systeme für Österreich, Austrian data set; Version 4.5., Austrian Environmental Agency
(Umweltbundesamt GmbH); Vienna.
Umweltbundesamt (2010): Anderl M., Köther T., Muik B., Pazdernik K., Stranner G., Poupa
S., Wieser M., Austria’s informative inventory report (IIR) 2010, Submission under the
UNECE Convention on Long-range Transboundary Air Pollution, Umweltbundesamt
GmbH, REP-0245, Vienna.
Ürge-Vorsatz, D., Aleksandra Novikova, Alan Watt, (2007): Kyoto flexibility mechanisms in
EU accession countries: will they make a difference? Climate Policy, Volume 7, Issue 3,
2007, 179-196
Watkiss, P., Downing, T., Handley, C., Butterfield, R. (2005c): The impacts and costs of
climate change; Final Report; AEA Technology Environment, Stockholm Environment
Institute (Oxford); Commissioned by European Commission DG Environment; 09/2005.
96
Watkiss, P., Holland, M., Hunt, A., Hurley, F., Navrud, S. (2005a): Methodology for the Cost-
Benefit Analysis of CAFE; Volume 1: Overview of Methodology; on behalf of the European
Commission DG Environment; 02/2005.
Watkiss, P., Holland, M., Pye, S., Droste-Franke, B., Bickel, P. (2005b): Damages per tonne
emission of PM2.5, NH3, SO2, NOx and VOCs from each EU25 Member States (excluding
Cyprus) and surrounding seas; Clean Air for Europe (CAFE) Programme; on behalf of the
European Commission DG Environment; 03/2005.
WIFO (2011), EnergyTransition 2012\2020\2050 Strategies for the Transition to Low Energy
and Low Emission Structures, Wien: Österreichisches Institut für Wirtschaftsforschung.
Wiser, R., Barbose, G., Peterman, C., Darghout, N. (2009): Tracking the Sun II: The
Installed Cost of Photovoltaics in the U.S. from 1998-2008, Lawrence Berkeley National
Laboratory, LBNL-2674E.

97
9 Annexes
Annex 1: Numerical Green-X model results for Austria
The following Tables (11 to 20) show the numerical values of result discusses in chapter 3
(as shown in graphs in Figures 7 to 16).
Table 11: Resulting RES share in (sector) gross final energy demand by 2020 [%]
Table 12: Resulting total deployment of new (2011 to 2020) RES installations [TWh] in
Austria
Table 13: Per sector comparison of the resulting deployment of new (2011 to 2020) RES
[TWh] in Austria for all assessed cases
RES share in sectoral gross final
energy demand by 2020 [%]Reference Case 1A Case 2A Case 3A Case 1B Case 2B Case 3B
RES-Electricity 65,8% 69,2% 72,8% 79,2% 66,6% 71,7% 72,6%
RES-Heat 28,5% 30,2% 33,5% 34,7% 31,7% 31,6% 35,3%
Biofuels 9,6% 9,4% 9,4% 9,4% 9,6% 9,5% 9,5%
RES total 30,2% 31,8% 34,0% 36,0% 32,9% 34,0% 36,0%
Deployment by 2020 in absolute
terms [TWh]Reference Case 1A Case 2A Case 3A Case 1B Case 2B Case 3B
RES-Electricity 51,0 53,7 56,5 61,4 49,4 53,2 53,8
RES-Heat 47,3 50,1 55,4 57,5 46,5 46,4 51,8
Biofuels 9,4 9,3 9,3 9,3 7,9 7,8 7,8
RES total 107,7 113,0 121,2 128,1 103,8 107,3 113,4
Deployment of new (2011 to
2020) RES [TWh]Reference Case 1A Case 2A Case 3A Case 1B Case 2B Case 3B
RES-Electricity 6,2 8,9 11,7 16,6 4,8 8,6 9,3
RES-Heat 26,0 28,8 34,1 36,2 25,4 25,3 30,7
Biofuels 4,5 4,4 4,4 4,4 3,0 2,9 2,9
RES total 36,7 42,1 50,2 57,2 33,2 36,8 42,9
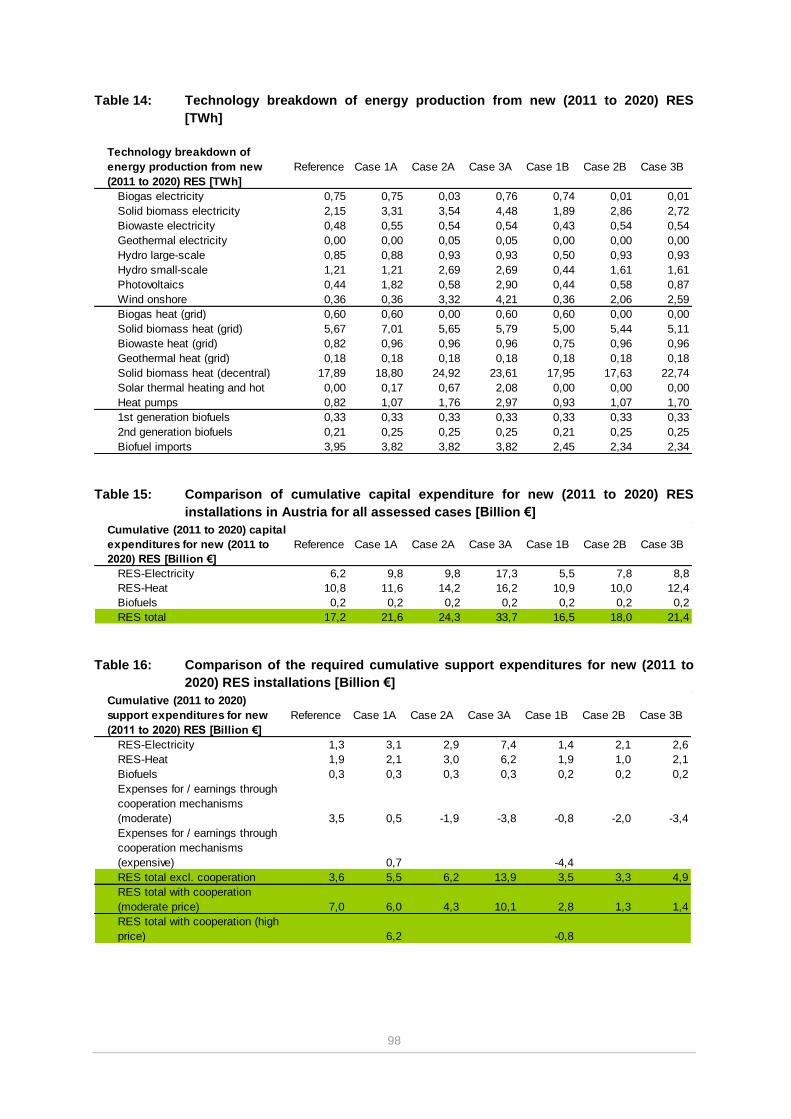
98
Table 14: Technology breakdown of energy production from new (2011 to 2020) RES
[TWh]
Table 15: Comparison of cumulative capital expenditure for new (2011 to 2020) RES
installations in Austria for all assessed cases [Billion €]
Table 16: Comparison of the required cumulative support expenditures for new (2011 to
2020) RES installations [Billion €]
Technology breakdown of
energy production from new
(2011 to 2020) RES [TWh]
Reference Case 1A Case 2A Case 3A Case 1B Case 2B Case 3B
Biogas electricity 0,75 0,75 0,03 0,76 0,74 0,01 0,01
Solid biomass electricity 2,15 3,31 3,54 4,48 1,89 2,86 2,72
Biowaste electricity 0,48 0,55 0,54 0,54 0,43 0,54 0,54
Geothermal electricity 0,00 0,00 0,05 0,05 0,00 0,00 0,00
Hydro large-scale 0,85 0,88 0,93 0,93 0,50 0,93 0,93
Hydro small-scale 1,21 1,21 2,69 2,69 0,44 1,61 1,61
Photovoltaics 0,44 1,82 0,58 2,90 0,44 0,58 0,87
Wind onshore 0,36 0,36 3,32 4,21 0,36 2,06 2,59
Biogas heat (grid) 0,60 0,60 0,00 0,60 0,60 0,00 0,00
Solid biomass heat (grid) 5,67 7,01 5,65 5,79 5,00 5,44 5,11
Biowaste heat (grid) 0,82 0,96 0,96 0,96 0,75 0,96 0,96
Geothermal heat (grid) 0,18 0,18 0,18 0,18 0,18 0,18 0,18
Solid biomass heat (decentral) 17,89 18,80 24,92 23,61 17,95 17,63 22,74
Solar thermal heating and hot 0,00 0,17 0,67 2,08 0,00 0,00 0,00
Heat pumps 0,82 1,07 1,76 2,97 0,93 1,07 1,70
1st generation biofuels 0,33 0,33 0,33 0,33 0,33 0,33 0,33
2nd generation biofuels 0,21 0,25 0,25 0,25 0,21 0,25 0,25
Biofuel imports 3,95 3,82 3,82 3,82 2,45 2,34 2,34
Cumulative (2011 to 2020) capital
expenditures for new (2011 to
2020) RES [Billion €]
Reference Case 1A Case 2A Case 3A Case 1B Case 2B Case 3B
RES-Electricity 6,2 9,8 9,8 17,3 5,5 7,8 8,8
RES-Heat 10,8 11,6 14,2 16,2 10,9 10,0 12,4
Biofuels 0,2 0,2 0,2 0,2 0,2 0,2 0,2
RES total 17,2 21,6 24,3 33,7 16,5 18,0 21,4
Cumulative (2011 to 2020)
support expenditures for new
(2011 to 2020) RES [Billion €]
Reference Case 1A Case 2A Case 3A Case 1B Case 2B Case 3B
RES-Electricity 1,3 3,1 2,9 7,4 1,4 2,1 2,6
RES-Heat 1,9 2,1 3,0 6,2 1,9 1,0 2,1
Biofuels 0,3 0,3 0,3 0,3 0,2 0,2 0,2
Expenses for / earnings through
cooperation mechanisms
(moderate) 3,5 0,5 -1,9 -3,8 -0,8 -2,0 -3,4
Expenses for / earnings through
cooperation mechanisms
(expensive) 0,7 -4,4
RES total excl. cooperation 3,6 5,5 6,2 13,9 3,5 3,3 4,9
RES total with cooperation
(moderate price) 7,0 6,0 4,3 10,1 2,8 1,3 1,4
RES total with cooperation (high
price) 6,2 -0,8
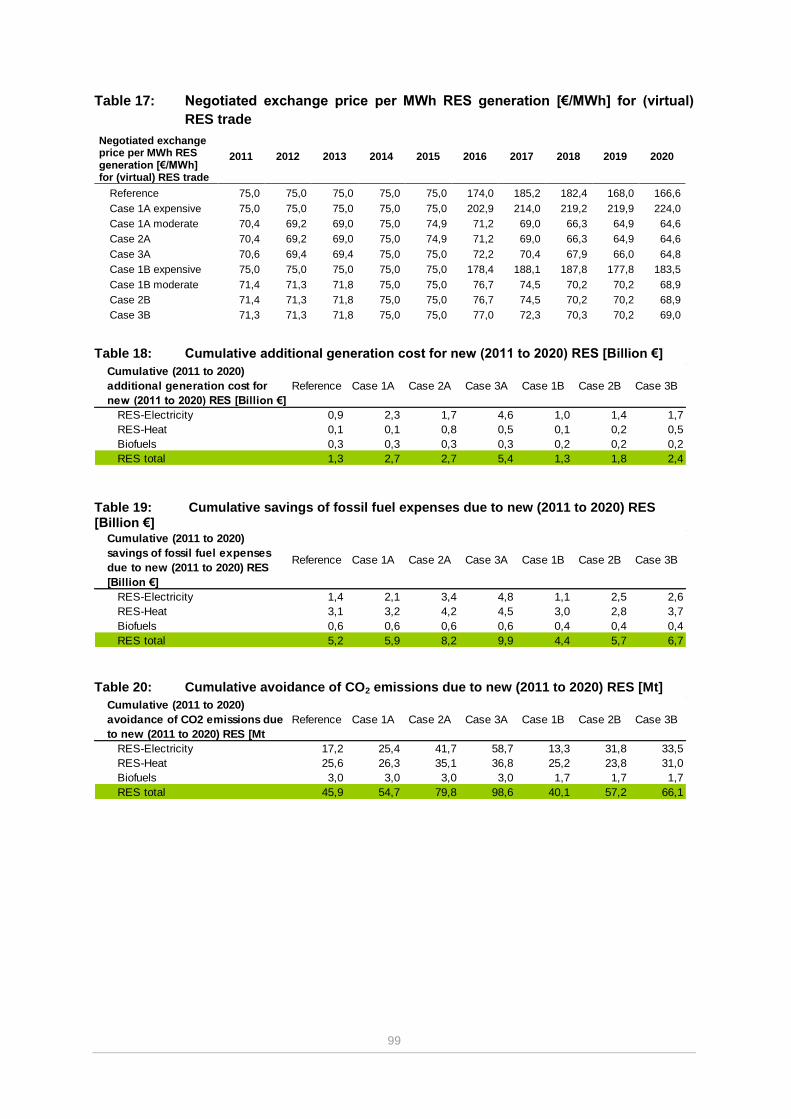
99
Table 17: Negotiated exchange price per MWh RES generation [€/MWh] for (virtual)
RES trade
Negotiated exchange price per MWh RES generation [€/MWh] for (virtual) RES trade
2011 2012 2013 2014 2015 2016 2017 2018 2019 2020
Reference 75,0 75,0 75,0 75,0 75,0 174,0 185,2 182,4 168,0 166,6
Case 1A expensive 75,0 75,0 75,0 75,0 75,0 202,9 214,0 219,2 219,9 224,0
Case 1A moderate 70,4 69,2 69,0 75,0 74,9 71,2 69,0 66,3 64,9 64,6
Case 2A 70,4 69,2 69,0 75,0 74,9 71,2 69,0 66,3 64,9 64,6
Case 3A 70,6 69,4 69,4 75,0 75,0 72,2 70,4 67,9 66,0 64,8
Case 1B expensive 75,0 75,0 75,0 75,0 75,0 178,4 188,1 187,8 177,8 183,5
Case 1B moderate 71,4 71,3 71,8 75,0 75,0 76,7 74,5 70,2 70,2 68,9
Case 2B 71,4 71,3 71,8 75,0 75,0 76,7 74,5 70,2 70,2 68,9
Case 3B 71,3 71,3 71,8 75,0 75,0 77,0 72,3 70,3 70,2 69,0
Table 18: Cumulative additional generation cost for new (2011 to 2020) RES [Billion €]
Table 19: Cumulative savings of fossil fuel expenses due to new (2011 to 2020) RES [Billion €]
Table 20: Cumulative avoidance of CO2 emissions due to new (2011 to 2020) RES [Mt]
Cumulative (2011 to 2020)
additional generation cost for
new (2011 to 2020) RES [Billion €]
Reference Case 1A Case 2A Case 3A Case 1B Case 2B Case 3B
RES-Electricity 0,9 2,3 1,7 4,6 1,0 1,4 1,7
RES-Heat 0,1 0,1 0,8 0,5 0,1 0,2 0,5
Biofuels 0,3 0,3 0,3 0,3 0,2 0,2 0,2
RES total 1,3 2,7 2,7 5,4 1,3 1,8 2,4
Cumulative (2011 to 2020)
savings of fossil fuel expenses
due to new (2011 to 2020) RES
[Billion €]
Reference Case 1A Case 2A Case 3A Case 1B Case 2B Case 3B
RES-Electricity 1,4 2,1 3,4 4,8 1,1 2,5 2,6
RES-Heat 3,1 3,2 4,2 4,5 3,0 2,8 3,7
Biofuels 0,6 0,6 0,6 0,6 0,4 0,4 0,4
RES total 5,2 5,9 8,2 9,9 4,4 5,7 6,7
Cumulative (2011 to 2020)
avoidance of CO2 emissions due
to new (2011 to 2020) RES [Mt
Reference Case 1A Case 2A Case 3A Case 1B Case 2B Case 3B
RES-Electricity 17,2 25,4 41,7 58,7 13,3 31,8 33,5
RES-Heat 25,6 26,3 35,1 36,8 25,2 23,8 31,0
Biofuels 3,0 3,0 3,0 3,0 1,7 1,7 1,7
RES total 45,9 54,7 79,8 98,6 40,1 57,2 66,1
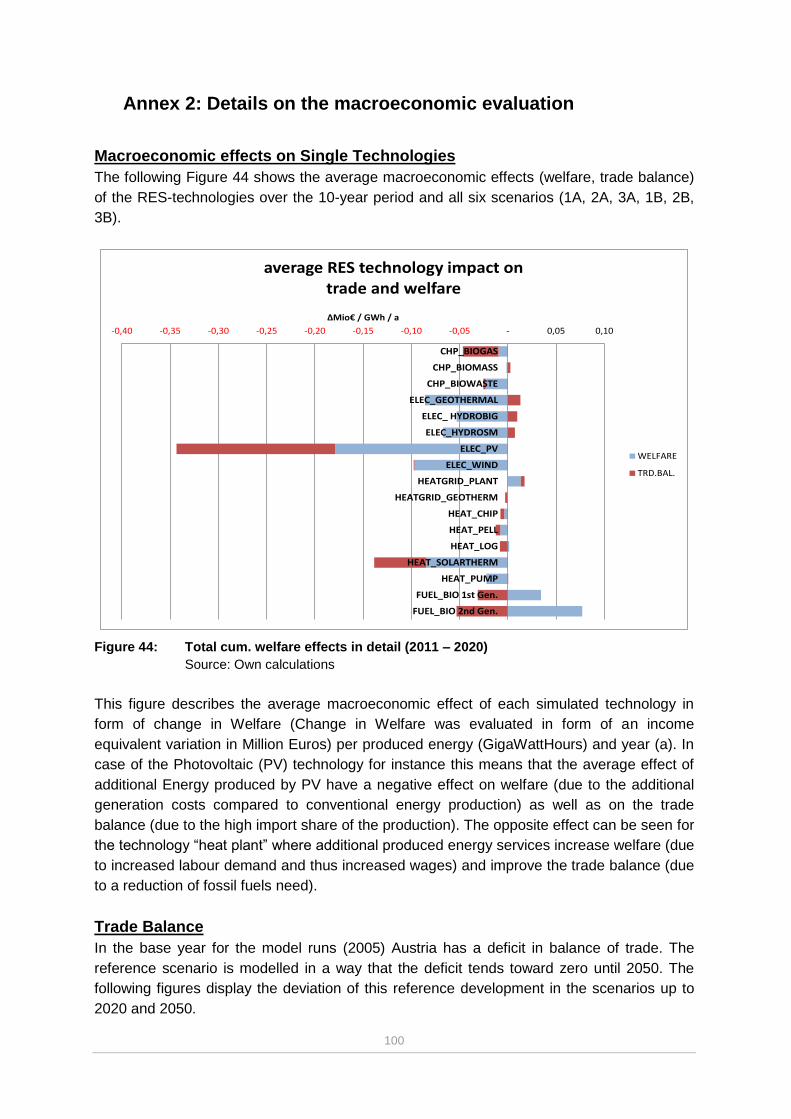
100
Annex 2: Details on the macroeconomic evaluation
Macroeconomic effects on Single Technologies
The following Figure 44 shows the average macroeconomic effects (welfare, trade balance)
of the RES-technologies over the 10-year period and all six scenarios (1A, 2A, 3A, 1B, 2B,
3B).
Figure 44: Total cum. welfare effects in detail (2011 – 2020)
Source: Own calculations
This figure describes the average macroeconomic effect of each simulated technology in
form of change in Welfare (Change in Welfare was evaluated in form of an income
equivalent variation in Million Euros) per produced energy (GigaWattHours) and year (a). In
case of the Photovoltaic (PV) technology for instance this means that the average effect of
additional Energy produced by PV have a negative effect on welfare (due to the additional
generation costs compared to conventional energy production) as well as on the trade
balance (due to the high import share of the production). The opposite effect can be seen for
the technology “heat plant” where additional produced energy services increase welfare (due
to increased labour demand and thus increased wages) and improve the trade balance (due
to a reduction of fossil fuels need).
Trade Balance
In the base year for the model runs (2005) Austria has a deficit in balance of trade. The
reference scenario is modelled in a way that the deficit tends toward zero until 2050. The
following figures display the deviation of this reference development in the scenarios up to
2020 and 2050.
-0,40 -0,35 -0,30 -0,25 -0,20 -0,15 -0,10 -0,05 - 0,05 0,10
CHP_BIOGAS
CHP_BIOMASS
CHP_BIOWASTE
ELEC_GEOTHERMAL
ELEC_ HYDROBIG
ELEC_HYDROSM
ELEC_PV
ELEC_WIND
HEATGRID_PLANT
HEATGRID_GEOTHERM
HEAT_CHIP
HEAT_PELL
HEAT_LOG
HEAT_SOLARTHERM
HEAT_PUMP
FUEL_BIO 1st Gen.
FUEL_BIO 2nd Gen.
ΔMio€ / GWh / a
average RES technology impact on trade and welfare
WELFARE
TRD.BAL.

101
Figure 45: Change of Trade balance compared to Reference (2011 – 2020)
Figure 46: Change of Trade balance compared to Refernece (2011 – 2050)
Source: Own calculations
-1600
-1400
-1200
-1000
-800
-600
-400
-200
0
200
400M
io€
05
REF
1A
2A
3A
1B
2B
3B
-1.600
-1.400
-1.200
-1.000
-800
-600
-400
-200
0
200
400
Mio€
05
REF
1A
2A
3A
1B
2B
3B

102
Annex 3: Marginal cost-resource curves for Renewable Energy
Technologies in Austria
The core objective of this chapter is to provide an overview of costs and potentials for RES
in Austria by means of cost-resource curves. Data on Austria will be contrasted with
information for other EU countries. Finally information on costs and potentials of specific
RES technologies were combined to determine for illustrative purposes a marginal cost
curve for renewable energy production.84
While consolidated literature for RES potentials is available for Austria, the associated costs
are only applicable in fragments. Here the project contributed to research needs by
elaborating consistent cost-resource curves for Austria. The derived database represents a
core input for the subsequent modelling of renewable energy deployment with the Green-X
model in chapter 5. The database of the Green-X model contains already information on
potentials and costs for RES technologies in Europe. Based on a literature survey and on
work-related to the derivation of input-output data for RES, the original Green-X data was
updated specifically for Austria.
Assessment of the potential for renewable energy in Austria using
static marginal cost curves A broad set of different renewable energy (RE) technologies is existing. Obviously, for a
comprehensive assessment of the future development of RE technologies it is of crucial
importance to provide a detailed investigation of the country-specific situation, e.g. the
potential of specific technologies taking a possible regional distribution and corresponding
costs into consideration. This section discusses potentials and costs for RE technologies
building on in-depth assessments of several studies, specifically Nakicenovic and Schleicher
et al. (2007) and Resch et al. (2009) while for costs the study by Klessmann et al. (2010)
was also used. The derived data on realisable mid-term production potential (up to the year
2020) for RE technologies and corresponding costs match with the requirements of the
Green-X model and serve as key input for the subsequent RE policy assessments as well as
the accompanying macroeconomic evaluations.
Concepts to define the RES potential:
The possible use of RES depends in particular on the available resources and the
associated costs. In this context, the term "available resources" or RES potential has to be
clarified. In literature, potentials of various energy resources or technologies are intensely
discussed. However, often no common terminology is applied. We use the following
terminology:
Theoretical potential: For deriving the theoretical potential general physical parameters have
to be taken into account (e.g. based on the determination of the energy flow resulting from a
certain energy resource within the investigated region). It represents the upper limit of what
84
Please note that the derived cost-resource curve offers only a schematic depiction of the feasible future potential for RES in Austria. Within the Green-X model and the conducted scenario work, respectively, a more detailed characterisation and policy-dependent exploitation of RE technologies is conducted in a dynamic context. Thereby, in contrast to the static depiction, the feasible potential and related cost of a specific RE technology in a given year depend on the progress achieved in previous years.

103
can be produced from a certain energy resource from a theoretical point-of-view – of course,
based on current scientific knowledge.
Technical potential: If technical boundary conditions (i.e. efficiencies of conversion
technologies, overall technical limitations e.g. as the available land area to install wind
turbines as well as the availability of raw materials) are considered the technical potential
can be derived. For most resources the technical potential must be considered in a dynamic
context, considering e.g. R&D induced improved conversion technologies, increasing the
technical potential.
Realisable potential: The realisable potential represents the maximal achievable potential
assuming that all existing barriers can be overcome and all driving forces are active.
Thereby, general parameters as e.g. market growth rates and planning constraints are taken
into account. It is important to mention that this type of potential must be seen in a dynamic
context, i.e. the realisable potential has to refer to a certain year.
Mid-term (2020) potential: The mid-term potential is equal to the realisable potential for the
year 2020.
Figure 47: Methodology to assess the mid-term potential
Figure 47 shows the concept to assess the realisable mid-term potential up to 2020
Achieved Achieved
potential potential
(2005)(2005)
Barriers
(non-economic)
AdditionalAdditional
realisablerealisable
midmid--term term
potential potential
(up to 2020)(up to 2020)
2000 2005 2010 2015
Historical
deployment
Theoretical potential
En
erg
y g
en
era
tio
n
Economic Potential
(without additional support)
Technical potential R&D
2020
Policy,
Society
Maximal
time-path for
penetration
(Realisable
Potential)
Long-term
potential
Mid-term potential
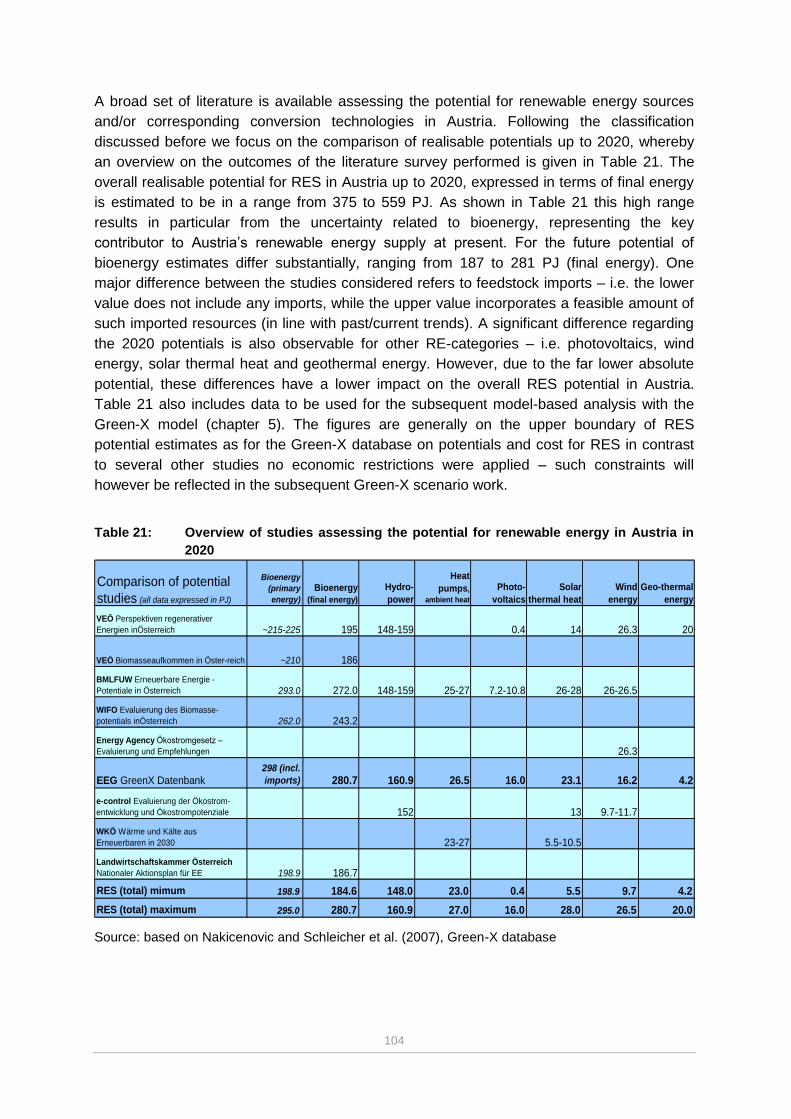
104
A broad set of literature is available assessing the potential for renewable energy sources
and/or corresponding conversion technologies in Austria. Following the classification
discussed before we focus on the comparison of realisable potentials up to 2020, whereby
an overview on the outcomes of the literature survey performed is given in Table 21. The
overall realisable potential for RES in Austria up to 2020, expressed in terms of final energy
is estimated to be in a range from 375 to 559 PJ. As shown in Table 21 this high range
results in particular from the uncertainty related to bioenergy, representing the key
contributor to Austria’s renewable energy supply at present. For the future potential of
bioenergy estimates differ substantially, ranging from 187 to 281 PJ (final energy). One
major difference between the studies considered refers to feedstock imports – i.e. the lower
value does not include any imports, while the upper value incorporates a feasible amount of
such imported resources (in line with past/current trends). A significant difference regarding
the 2020 potentials is also observable for other RE-categories – i.e. photovoltaics, wind
energy, solar thermal heat and geothermal energy. However, due to the far lower absolute
potential, these differences have a lower impact on the overall RES potential in Austria.
Table 21 also includes data to be used for the subsequent model-based analysis with the
Green-X model (chapter 5). The figures are generally on the upper boundary of RES
potential estimates as for the Green-X database on potentials and cost for RES in contrast
to several other studies no economic restrictions were applied – such constraints will
however be reflected in the subsequent Green-X scenario work.
Table 21: Overview of studies assessing the potential for renewable energy in Austria in
2020
Source: based on Nakicenovic and Schleicher et al. (2007), Green-X database
Comparison of potential
studies (all data expressed in PJ)
Bioenergy
(primary
energy)
Bioenergy
(final energy)
Hydro-
power
Heat
pumps,
ambient heat
Photo-
voltaics
Solar
thermal heat
Wind
energy
Geo-thermal
energy
VEÖ Perspektiven regenerativer
Energien inÖsterreich ~215-225 195 148-159 0.4 14 26.3 20
VEÖ Biomasseaufkommen in Öster-reich ~210 186
BMLFUW Erneuerbare Energie -
Potentiale in Österreich 293.0 272.0 148-159 25-27 7.2-10.8 26-28 26-26.5
WIFO Evaluierung des Biomasse-
potentials inÖsterreich 262.0 243.2
Energy Agency Ökostromgesetz –
Evaluierung und Empfehlungen 26.3
EEG GreenX Datenbank
298 (incl.
imports) 280.7 160.9 26.5 16.0 23.1 16.2 4.2
e-control Evaluierung der Ökostrom-
entwicklung und Ökostrompotenziale 152 13 9.7-11.7
WKÖ Wärme und Kälte aus
Erneuerbaren in 2030 23-27 5.5-10.5
Landwirtschaftskammer Österreich
Nationaler Aktionsplan für EE 198.9 186.7
RES (total) mimum 198.9 184.6 148.0 23.0 0.4 5.5 9.7 4.2
RES (total) maximum 295.0 280.7 160.9 27.0 16.0 28.0 26.5 20.0
105
Future potentials for RE - technologies in EU countries
In this section an illustration of future potentials for RE technologies in the European Union
is provided, putting the above assessed RES potentials for Austria in the EU context.
Consolidated outcomes on Europe’s RES potentials are discussed as derived from several
studies in this area.
Assessment of RES potentials in Europe – Methodological approach
From a historical perspective the starting point for the assessment of realisable mid-term potentials
was geographically the European Union as of 2001 (EU-15), where corresponding data was
derived for all Member States initially in 2001 based on a detailed literature survey and a
development of an overall methodology with respect to the assessment of specific resource
conditions of several RES options. In the following, within the framework of the study “Analysis of
the Renewable Energy Sources’ evolution up to 2020 (FORRES 2020)” (see Ragwitz et al., 2005)
comprehensive revisions and updates have been undertaken, taking into account reviews of
national experts etc. Consolidated outcomes of this process were presented in the European
Commission’s Communication “The share of renewable energy” (European Commission, 2004).
Within the scope of the futures-e project (2006 to 2008 (see http://www.futures-e.org) an intensive
feedback process at the national and regional level was established. A series of six regional
workshops was hosted by the futures-e consortium within 2008. The active involvement of key
stakeholders and their direct feedback on data and scenario outcomes helped to reshape, validate
and complement the previously assessed information.
In the following figures (Figure 48, Figure 49, Figure 50, Figure 51) it is illustrated to what
extent RES may contribute to meet the final energy demand within the European Union (EU-
27) up to 2020 by considering the specific resource conditions and current technical
conversion possibilities85 as well as realization constraints in the investigated countries. Only
the domestic resource base was taken into consideration – except for forestry biomass,
where a small proportion of the overall potential refers to imports from abroad.86
Please note that within this illustration the future potential for all biomass feedstock
categories considered is pre-allocated to feasible technologies and sectors based on simple
rules of thumb.87 In contrast to this, within the Green-X model no pre-allocation to the
sectors electricity, heat or transport was undertaken as technology competition within and
across sectors is well reflected in the applied modelling approach.
Furthermore, only a concise overview is given of the overall 2020 potentials in terms of final
energy by country, while for a detailed discussion of the provided data we refer to Resch et
al. (2009).
85
The illustrated mid-term potentials describe the feasible amount of e.g. electricity generation from combusting biomass feedstock considering current conversion technologies. Future improvements of the conversion efficiencies (as typically considered in model-based prospective analyses) would lead to an increase of the overall mid-term potentials. 86
12.5% of the overall forestry potential or approximately 30% of the additional forestry resources that may be tapped in the considered time horizon refer to such imports from abroad. 87
Simplified allocation rules comprise for example that in forestry the energetic potential of complementary fellings is equally pre-allocated to the sectors of heat and electricity.

106
Figure 48: Achieved (2005) and additional 2020 potentials for RES in terms of final energy
demand for all EU Member States (EU27) – expressed in absolute terms
Source: Green-X database
Summing up all RES options applicable at country level Figure 48 shows the achieved
potential (in the year 2005) and the additional mid-term potential for RES in all EU Member
States. Potentials are thereby expressed in absolute terms. Member States possessing
large RES potentials are e.g. France, Germany, Italy, Poland, Spain, Sweden and the UK. In
order to illustrate the situation in a suitable manner for small countries (or countries with a
lack of RES options available), Figure 49 offers a similar illustration in relative terms,
expressing the 2020 potential as share of gross final energy demand.
Figure 49: Achieved (2005) and 2020 potentials for RES in terms of final energy for all EU
Member States (EU27) – expressed in relative terms, as share on gross final
energy demand
Source: Green-X database
The overall 2020 potential for RES in the European Union is 349 Mtoe, corresponding to a
share of 28.5% of the overall current gross final energy demand. This indicates the high
0
5
10
15
20
25
30
35
40
45
50
55
60
AT
BE
BG
CY
CZ
DK
EE FI
FR
DE
GR
HU IE IT LA
LT
LU
MT
NL
PL
PT
RO
SK SI
ES
SE
UK
RE
S in
te
rms o
f fin
al e
ne
rgy [
Mto
e] Additional potential 2020
Achieved potential 2005
0%
10%
20%
30%
40%
50%
60%
70%
80%
AT
BE
BG
CY
CZ
DK
EE FI
FR
DE
GR
HU IE IT LA
LT
LU
MT
NL
PL
PT
RO
SK SI
ES
SE
UK
EU
27
RE
S in
te
rms o
f fin
al e
ne
rgy [
% o
f d
em
an
d]
RES potential 2020 - share on current (2005) demand
RES share 2005

107
level of ambition of the EU target of meeting 20% RES by 202088. In general, large
differences between the individual countries with regard to the realized and the feasible
future potentials for RES are observable. For example, Sweden, Latvia, Finland and Austria
represent countries with a high RES share already at present, while Bulgaria and Lithuania
offer the highest additional potential compared to their current energy demand. However, in
absolute terms both are rather small compared to other countries large in size or, more
precisely, with large 2020 RES potentials.
Figure 50: The impact of demand growth - 2020 potential for RES as share on current
(2005) and expected future (2020) gross final energy demand.
Source: Green-X database
Figure 50 (above) relates derived RES potentials to the expected future energy demand.
More precisely, it shows at country level the total realizable 2020 potentials89 for RES as
share of final energy demand in 2005 and in 2020, considering three different demand
projections – i.e. a recent (as of 2009) and an older (2007) baseline case, both assuming a
continuation of past trends and a reference scenario where a moderate demand reduction
occurs as a side-effect of proactive energy policy measures tailored to meet the 2020 RES
and GHG commitments.90
Both baseline trend projections differ with respect to the incorporation of the financial crisis.
While the recent baseline case (as of 2009) takes into account the lately observable
decrease of energy consumption within all energy sectors as a consequence of the financial
crisis, the older version (as of 2007) obviously ignores it. This affects the feasible RES
88
It is worth to mention that biofuel imports from abroad are not considered in this depiction. Adding such in a size of 5% of the current demand for diesel and gasoline (i.e. half of the minimum target of 10% biofuels by 2020) would increase the overall RES potential by 1.2%. 89
The total realisable mid-term potential comprises the already achieved (as of 2005) as well as the additional realisable potential up to 2020. 90
In order to ensure maximum consistency with existing EU scenarios and projections, data on current (2005) and expected future energy demand was taken from PRIMES. The used PRIMES scenarios are:
- the Baseline Scenario as of December 2009 (NTUA, 2009)
- the Reference Scenario as of April 2010 (NTUA, 2010)
Please note that this data (and also the depiction of corresponding RES shares in demand) may deviate from actual statistics.
0%
10%
20%
30%
40%
50%
60%
70%
80%
AT
BE
BG
CY
CZ
DK
EE FI
FR
DE
GR
HU IE IT LV
LT
LU
MT
NL
PL
PT
RO
SK SI
ES
SE
UK
EU
27
RE
S in
te
rms o
f fin
al e
ne
rgy [
% o
f d
em
an
d]
RES potential 2020 - share on current (2005) demand
RES potential 2020 - share on 2020 demand (reference case)
RES potential 2020 - share on 2020 demand (baseline case)
RES potential 2020 - share on 2020 demand (old baseline case - neglecting financial crisis)
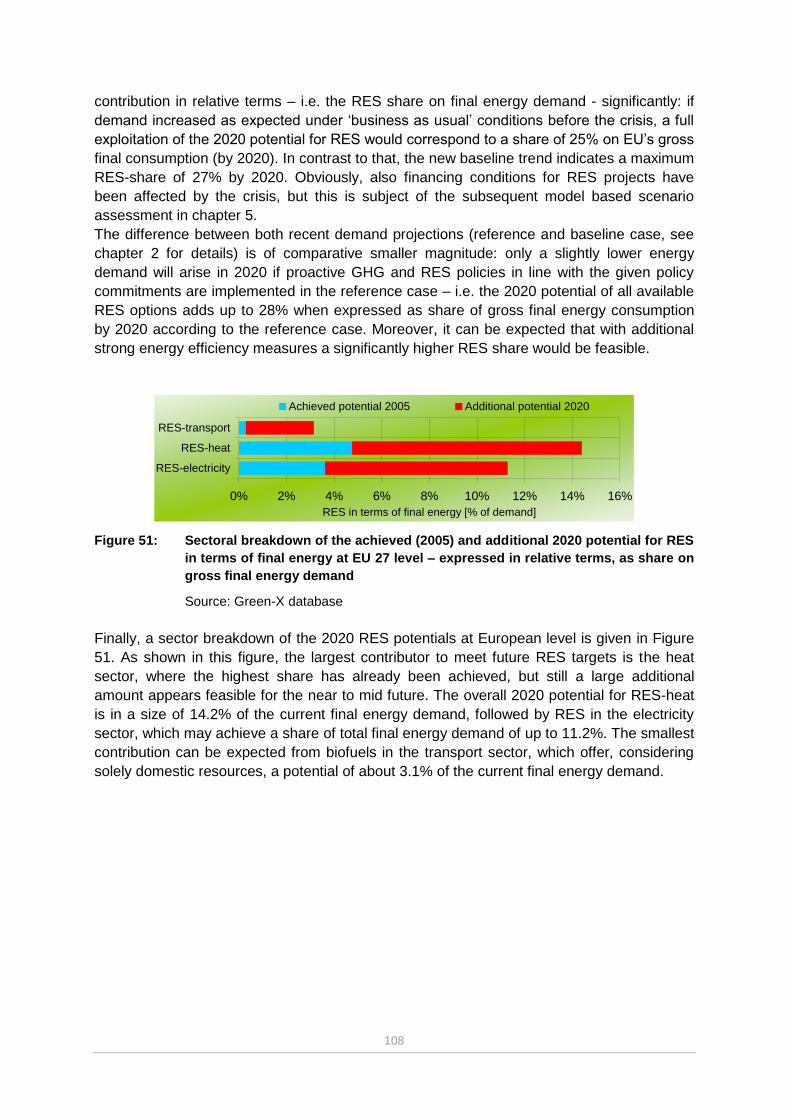
108
contribution in relative terms – i.e. the RES share on final energy demand - significantly: if
demand increased as expected under ‘business as usual’ conditions before the crisis, a full
exploitation of the 2020 potential for RES would correspond to a share of 25% on EU’s gross
final consumption (by 2020). In contrast to that, the new baseline trend indicates a maximum
RES-share of 27% by 2020. Obviously, also financing conditions for RES projects have
been affected by the crisis, but this is subject of the subsequent model based scenario
assessment in chapter 5.
The difference between both recent demand projections (reference and baseline case, see
chapter 2 for details) is of comparative smaller magnitude: only a slightly lower energy
demand will arise in 2020 if proactive GHG and RES policies in line with the given policy
commitments are implemented in the reference case – i.e. the 2020 potential of all available
RES options adds up to 28% when expressed as share of gross final energy consumption
by 2020 according to the reference case. Moreover, it can be expected that with additional
strong energy efficiency measures a significantly higher RES share would be feasible.
Figure 51: Sectoral breakdown of the achieved (2005) and additional 2020 potential for RES
in terms of final energy at EU 27 level – expressed in relative terms, as share on
gross final energy demand
Source: Green-X database
Finally, a sector breakdown of the 2020 RES potentials at European level is given in Figure
51. As shown in this figure, the largest contributor to meet future RES targets is the heat
sector, where the highest share has already been achieved, but still a large additional
amount appears feasible for the near to mid future. The overall 2020 potential for RES-heat
is in a size of 14.2% of the current final energy demand, followed by RES in the electricity
sector, which may achieve a share of total final energy demand of up to 11.2%. The smallest
contribution can be expected from biofuels in the transport sector, which offer, considering
solely domestic resources, a potential of about 3.1% of the current final energy demand.
0% 2% 4% 6% 8% 10% 12% 14% 16%
RES-electricity
RES-heat
RES-transport
RES in terms of final energy [% of demand]
Achieved potential 2005 Additional potential 2020

109
Overview of costs for RE technologies The economic performance of a specific energy technology determines its future market
penetration. In the following, cost assumptions as made in the Green-X database for various
RE technologies are discussed and illustrated. Please note that the presented data refer to
the year 2009 and are expressed in €2009.
The Green-X database on potentials and cost for RE technologies in the
European Union
The Green-X database on potentials and cost for RE technologies in Europe provides detailed
information on current costs (i.e. investment - operation & maintenance - fuel and generation cost)
and potentials for all RE technologies within each EU Member State. The assessment of the
economic parameter and accompanying technical specifications for the various RE technologies
builds on a long track record of European and global studies in this area. From a historical
perspective the (geographically ) starting point for the assessment of realisable mid-term potentials
was the European Union as of 2001 (EU-15), where corresponding data was derived for all
Member States initially in 2001 based on a detailed literature survey and an expert consultation. In
the following, within the framework of the study “Analysis of the Renewable Energy Sources’
evolution up to 2020 (FORRES 2020)” (see Ragwitz et al., 2005) and various follow-up activities
comprehensive revisions and updates have been undertaken, taking into account recent market
developments. In the recently completed EU research project RE-Financing (Klessmann et al.
(2010)) again a comprehensive update of cost parameter was undertaken, incorporating recent
developments – i.e. the past cost increase mainly caused by high oil and raw material prices, and,
later on, the significant cost decline as observed for various energy technologies throughout 2008
and 2009. The process included besides a survey of related studies (e.g. Krewitt et al. (2009),
Wiser (2009) and Ernst & Young (2009)) also data gathering with respect to recent RE projects in
different countries. Within this study a focus was put to incorporate country-specific trends,
specifically for Austria in a correct manner.
Economic conditions for the various RE technologies are based on both, economic and
technical specifications, varying across the EU countries.91 In order to illustrate the economic
figures for each technology Table 22 presents the economic parameters and accompanying
technical specifications for RE technologies. Please note that this illustration is done
exemplarily for the electricity sector. The Green-X database and the corresponding model
use a quite detailed level of specifying costs and potentials. The analysis is not based on
average costs per technology. For each technology a detailed cost-curve is specified for
each year, based on so-called cost-bands. These cost-bands summarize a range of
production sites that can be described by similar cost factors. For each technology a
minimum of 6 to 10 cost bands were specified by country. For biomass due to the broad set
of conversion technology options as well as related feedstock categories at least 50 cost
bands were specified for each year in each country. In the following the current investment
costs for RE technologies are described alongside the data provided in Table 22 discussing
recent trends of some key technologies.
91
Note that in the Green-X model the calculation of generation costs for the various generation options is done by a rather complex mechanism, internalized within the overall set of modelling procedures. Thereby, band-specific data (e.g. investment costs, efficiencies, full load-hours, etc.) is linked to general model parameters such as interest rate and depreciation time.

110
Table 22: Overview of economic-& technical-specifications for new RES-electricity plants
RES-E sub-category
Plant specification Investment costs
O&M costs
Efficiency (electricity)
Efficiency (heat)
Lifetime (average)
Typical plant size
[€/kWel] [€/(kWel* year)]
[years] [MWel]
Biogas
Agricultural biogas plant 2550 - 4290 115 - 140 0.28 - 0.34 - 25 0.1 - 0.5
Agricultural biogas plant - CHP 2765 - 4525 120 - 145 0.27 - 0.33 0.55 - 0.59 25 0.1 - 0.5
Landfill gas plant 1350 - 1950 50 - 80 0.32 - 0.36 - 25 0.75 - 8
Landfill gas plant - CHP 1500 - 2100 55 - 85 0.31 - 0.35 0.5 - 0.54 25 0.75 - 8
Sewage gas plant 2300 - 3400 115 - 165 0.28 - 0.32 - 25 0.1 - 0.6
Sewage gas plant - CHP 2400 - 3550 125 - 175 0.26 - 0.3 0.54 - 0.58 25 0.1 - 0.6
Biomass
Biomass plant 2225 - 2995 84 - 146 0.26 - 0.3 - 30 1 – 25
Co-firing 450 - 650 65 - 95 0.37 - 30 -
Biomass plant - CHP 2600 - 4375 86 - 176 0.22 - 0.27 0.63 - 0.66 30 1 – 25
Co-firing – CHP 450 - 650 85 - 125 0.2 0.6 30 -
Biowaste Waste incineration plant 5500 - 7125 145 - 249 0.18 - 0.22 - 30 2 – 50
Waste incineration plant - CHP 5800 - 7425 172 - 258 0.14 - 0.16 0.64 - 0.66 30 2 – 50
Geothermal Eletricity
Geothermal power plant 2575 - 6750 113 - 185 0.11 - 0.14 - 30 5 – 50
Hydro large-scale
Large-scale unit 850 - 3650 35 - - 50 250
Medium-scale unit 1125 - 4875 35 - - 50 75
Small-scale unit 1450 - 5750 35 - - 50 20
Upgrading 800 - 3600 35 - - 50 -
Hydro small-scale
Large-scale unit 975 - 1600 40 - - 50 9.5
Medium-scale unit 1275 - 5025 40 - - 50 2
Small-scale unit 1550 - 6050 40 - - 50 0.25
Upgrading 900 - 3700 40 - - 50 -
Photovoltaics PV plant 2950 - 4750 30 - 42 - - 25 0.005 - 0.05
Solar thermal electricity
Concentrating solar power plant 3600 - 5025 150 - 200 0.33 - 0.38 - 30 2 – 50
Tidal stream energy
Tidal (stream) power plant – shoreline
5650 145 - - 25 0.5
Tidal (stream) power plant - nearshore
6825 150 - - 25 1
Tidal (stream) power plant - offshore
8000 160 - - 25 2
Wave energy
Wave power plant - shoreline 4750 140 - - 25 0.5
Wave power plant - nearshore 6125 145 - - 25 1
Wave power plant - offshore 7500 155 - - 25 2
Wind onshore
Wind power plant 1125 - 1525 35 - 45 - - 25 2
Wind offshore
Wind power plant - nearshore 2450 - 2850 90 - - 25 5
Wind power plant - offshore: 5…30km
2750 - 3150 100 - - 25 5
Wind power plant - offshore: 30…50km
3100 - 3350 110 - - 25 5
Wind power plant - offshore: 50km…
3350 - 3500 120 - - 25 5
Source: Green-X database, 2011
In 2009 typical PV system costs were in the range of 2,950 €/kW to 4,750 €/kW. These cost
levels were reached after strong cost declines in the years 2008 and 2009. This reduction in
investment costs marks an important departure from the trend of the years 2005 to 2007,
during which costs remained constant, as rapidly expanding global PV markets and a
shortage of silicon feedstock put upward pressure on both, module prices and non-module

111
costs (see e.g. Wiser et al 2009). Before this period of stagnation, PV systems had
experienced a continuous decline in costs since the start of commercial manufacture in the
mid 1970’s following a typical learning curve. The new dynamic began in 2008, as
expansions on the supply-side coupled with the financial crisis led to softness within the PV
market. Consequently, actual cost developments are again in line with (previous) learning
expectations. Furthermore, the cost decrease has been stimulated by the increasing
globalization of the PV market, especially the stronger market appearance of Asian
manufacturers.
The investment costs of wind onshore power plants are currently in the range of 1,125 €/kW
and 1,525 €/kW and thereby slightly higher than in the last year. Two major trends have
been characteristic for the wind turbine development for a long time: while the rated capacity
of new machines has increased steadily, the corresponding investment costs per kW
dropped. Increases of capacity were mainly achieved by up-scaling both, tower height and
rotor size. The largest wind turbines currently available have a capacity of 5 to 6 MW and a
rotor diameter of up to 126 meters. The impact of economies of scale associated with the
turbine up-scaling on turbine costs is evident: the power delivered is proportional to the
diameter squared, but the costs of labour and material for building a larger turbine are
constant or even fall with increasing turbine size, so that turbine capacity increases
disproportionally faster than costs increase. From around 2005 on the investment costs have
started to increase again. This increase of investment cost was largely driven by the
tremendous rise of energy and raw material prices as observed in recent years, but by
manufacturers that improving their profitability, by shortages in certain turbine components
and by improved turbine design.
Generation costs for RE technologies
While the investments costs for RE technologies as described above are suitable for an
analysis at technology level, for the comparison of technologies the generation costs appear
more important. Consequently, the broad range of generation costs for several RE
technologies is discussed below. Impacts as variations in resource- (e.g. for photovoltaics or
wind energy) or demand-specific conditions (e.g. full load hours in case of heating systems)
within and between countries as well as variations in technological options such as plant
sizes and/or conversion technologies were taken into account. Figure 52 shows the typical
current bandwidth of long-run marginal generation costs92 per RE technology for the
electricity sector in Europe. In this context, for the calculation of the capital recovery factor a
default setting is applied with a payback time of 15 years and weighted average cost of
capital of 6.5%. This approach represents an investor’s view rather than considering the full
levelized costs over the lifetime of an installation.
92
Long-run marginal costs are relevant for the economic decision whether to build a new plant or not.
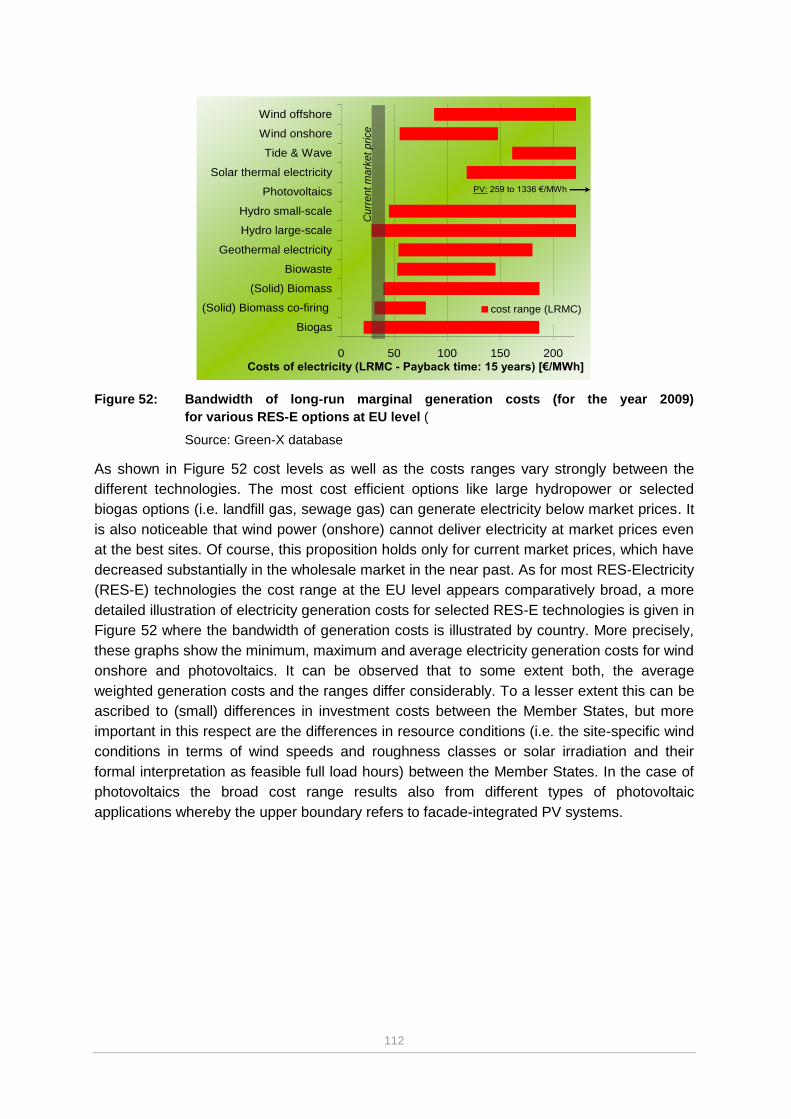
112
Figure 52: Bandwidth of long-run marginal generation costs (for the year 2009)
for various RES-E options at EU level (
Source: Green-X database
As shown in Figure 52 cost levels as well as the costs ranges vary strongly between the
different technologies. The most cost efficient options like large hydropower or selected
biogas options (i.e. landfill gas, sewage gas) can generate electricity below market prices. It
is also noticeable that wind power (onshore) cannot deliver electricity at market prices even
at the best sites. Of course, this proposition holds only for current market prices, which have
decreased substantially in the wholesale market in the near past. As for most RES-Electricity
(RES-E) technologies the cost range at the EU level appears comparatively broad, a more
detailed illustration of electricity generation costs for selected RES-E technologies is given in
Figure 52 where the bandwidth of generation costs is illustrated by country. More precisely,
these graphs show the minimum, maximum and average electricity generation costs for wind
onshore and photovoltaics. It can be observed that to some extent both, the average
weighted generation costs and the ranges differ considerably. To a lesser extent this can be
ascribed to (small) differences in investment costs between the Member States, but more
important in this respect are the differences in resource conditions (i.e. the site-specific wind
conditions in terms of wind speeds and roughness classes or solar irradiation and their
formal interpretation as feasible full load hours) between the Member States. In the case of
photovoltaics the broad cost range results also from different types of photovoltaic
applications whereby the upper boundary refers to facade-integrated PV systems.
0 50 100 150 200
Biogas
(Solid) Biomass co-firing
(Solid) Biomass
Biowaste
Geothermal electricity
Hydro large-scale
Hydro small-scale
Photovoltaics
Solar thermal electricity
Tide & Wave
Wind onshore
Wind offshore
Costs of electricity (LRMC - Payback time: 15 years) [€/MWh]
cost range (LRMC)
PV: 259 to 1336 €/MWh
Curr
ent
mark
et
price
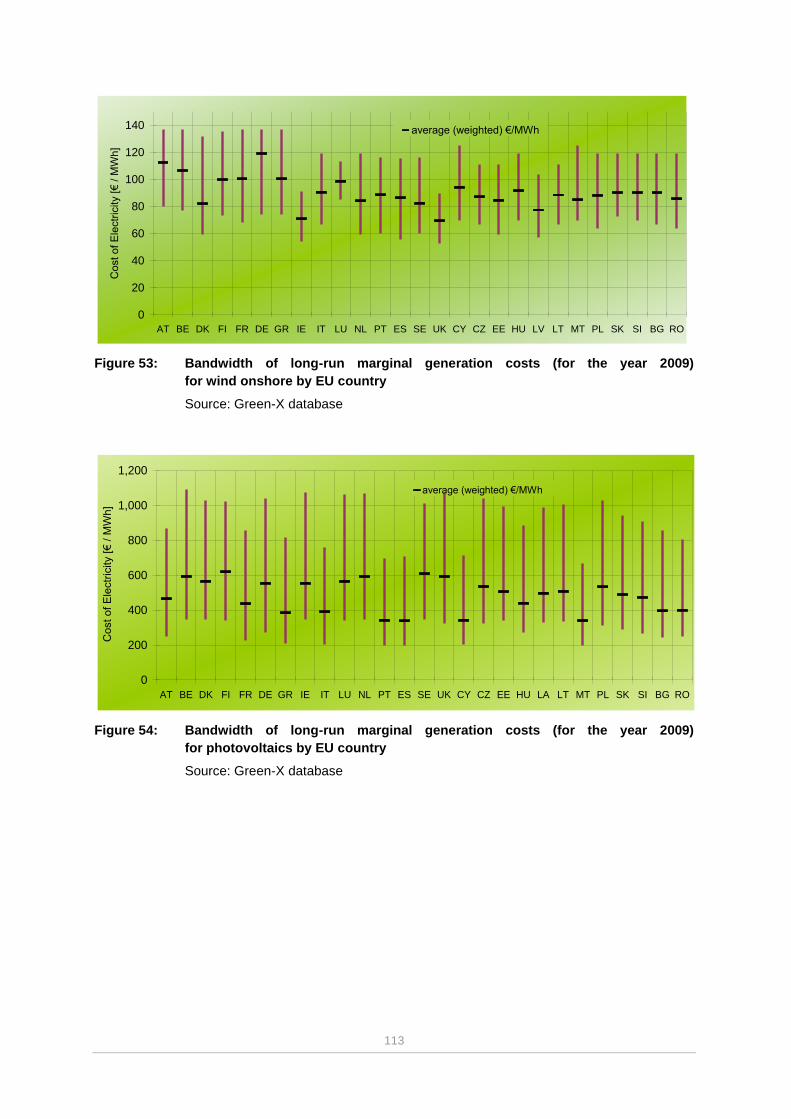
113
Figure 53: Bandwidth of long-run marginal generation costs (for the year 2009)
for wind onshore by EU country
Source: Green-X database
Figure 54: Bandwidth of long-run marginal generation costs (for the year 2009)
for photovoltaics by EU country
Source: Green-X database
0
20
40
60
80
100
120
140
AT BE DK FI FR DE GR IE IT LU NL PT ES SE UK CY CZ EE HU LV LT MT PL SK SI BG RO
Co
st
of E
lectr
icity [€
/ M
Wh
]
average (weighted) €/MWh
0
200
400
600
800
1,000
1,200
AT BE DK FI FR DE GR IE IT LU NL PT ES SE UK CY CZ EE HU LA LT MT PL SK SI BG RO
Co
st
of E
lectr
icity [€
/ M
Wh
]
average (weighted) €/MWh

114
Rendering the cost curves dynamic Aim of this chapter is to analyse the impact of dynamic aspects on the costs and potentials
for RES assessed above. Dynamic factors discussed in this chapter represent important
input parameter to the model based scenario assessment of chapter 5. The impact of energy
policies (which obviously may also change over time) however is neglected here as this is
subject of the scenario assessment of chapter 5. The illustration of these impacts can be
done only in a schematic way, by showing resulting static (i.e. neglecting such impacts) and
dynamic (i.e. incorporating dynamic aspects) cost-resource curves for the realisable RES
potentials in Austria up to 2020. “Schematic” means that for each RES category only
average (generation) costs are taken into consideration as derived from an illustrative
modelling exercise.
Dynamic parameter influencing the economics of RES
Reference energy and carbon prices
National reference energy prices used in this analysis are based on the primary energy price
assumptions as used in the draft PRIMES baseline case (as of December 2009). The
assumptions applied are illustrated in Table 23. Compared to energy prices as observed in
2007 and the first three quarters of 2008 the price assumptions appear comparatively low for
the later years up to 2020.
The CO2-price in the scenarios presented in this report is also based on recent PRIMES
modelling, see Table 24. Actual market prices (for 2006 EU Allowances) have fluctuated
between 7 and 30 €/t, with averages fluctuating roughly between 15 and 20 €/t. In the model,
it is assumed that CO2-prices are directly passed through to electricity prices. This is done
fuel-specific based on the PRIMES CO2-emission factors.
Increased RES-deployment can have a CO2-price reducing effect as it reduces the demand
for CO2-reductions. As RES-deployment should be anticipated in the EU Emission Trading
System and the CO2-price in the Green-X scenarios is exogenously set, this effect is not
included, which represents a rather conservative approach.
Table 23: Primary energy price assumptions
Source: PRIMES baseline (2009) and reference case (2010)
[Unit] 2005 2010 2015 2020
[US$2008/boe] 59.4 71.9 72.6 88.4
[€ 2006 /MWh] 27.3 29.7 32.5 43.1
[US$2008/boe] 39.7 44.2 49.5 62.1
[€ 2006 /MWh] 18.2 18.2 22.1 30.3
[US$2008/boe] 14.0 17.2 21.7 25.8
[€ 2006 /MWh] 6.5 7.1 9.7 12.6
Gas
Coal
International (fossil) reference energy prices
(low reference price development for imports to the EU - based on PRIMES low (default) energy prices)
Oil
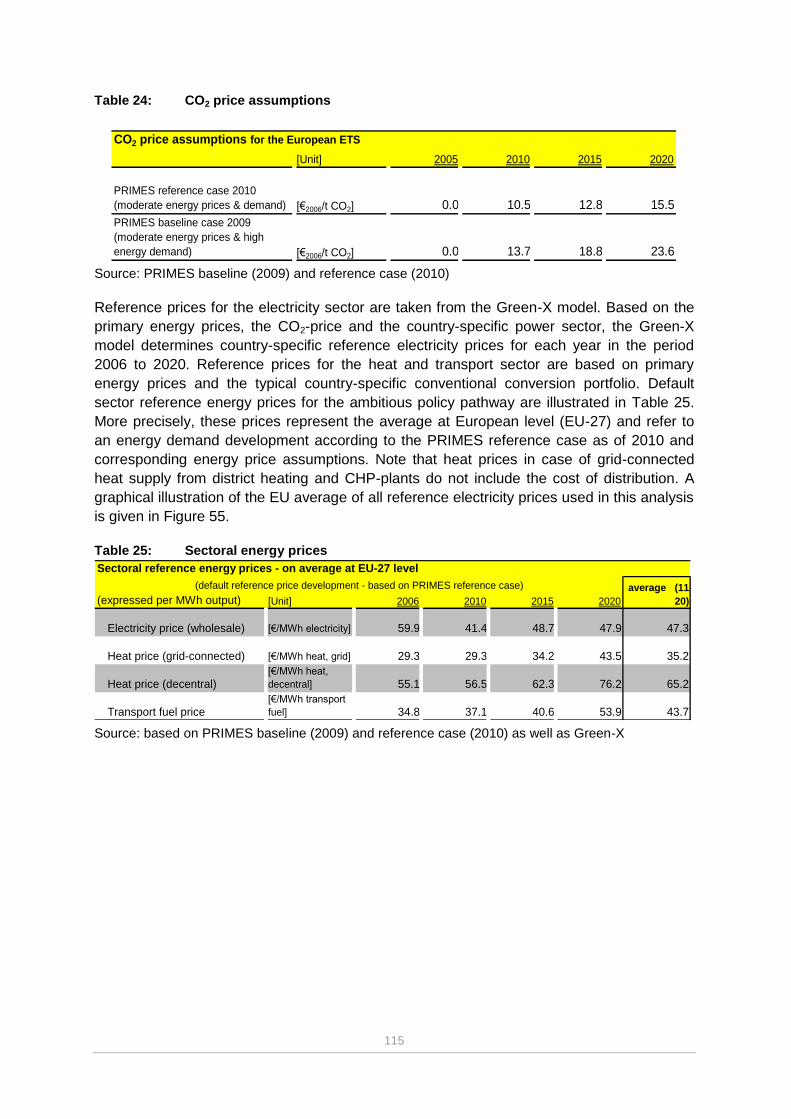
115
Table 24: CO2 price assumptions
Source: PRIMES baseline (2009) and reference case (2010)
Reference prices for the electricity sector are taken from the Green-X model. Based on the
primary energy prices, the CO2-price and the country-specific power sector, the Green-X
model determines country-specific reference electricity prices for each year in the period
2006 to 2020. Reference prices for the heat and transport sector are based on primary
energy prices and the typical country-specific conventional conversion portfolio. Default
sector reference energy prices for the ambitious policy pathway are illustrated in Table 25.
More precisely, these prices represent the average at European level (EU-27) and refer to
an energy demand development according to the PRIMES reference case as of 2010 and
corresponding energy price assumptions. Note that heat prices in case of grid-connected
heat supply from district heating and CHP-plants do not include the cost of distribution. A
graphical illustration of the EU average of all reference electricity prices used in this analysis
is given in Figure 55.
Table 25: Sectoral energy prices
Source: based on PRIMES baseline (2009) and reference case (2010) as well as Green-X
[Unit] 2005 2010 2015 2020
PRIMES reference case 2010
(moderate energy prices & demand) [€2006/t CO2] 0.0 10.5 12.8 15.5
PRIMES baseline case 2009
(moderate energy prices & high
energy demand) [€2006/t CO2] 0.0 13.7 18.8 23.6
CO2 price assumptions for the European ETS
(expressed per MWh output) [Unit] 2006 2010 2015 2020
Electricity price (wholesale) [€/MWh electricity] 59.9 41.4 48.7 47.9 47.3
Heat price (grid-connected) [€/MWh heat, grid] 29.3 29.3 34.2 43.5 35.2
Heat price (decentral)[€/MWh heat,
decentral] 55.1 56.5 62.3 76.2 65.2
Transport fuel price[€/MWh transport
fuel] 34.8 37.1 40.6 53.9 43.7
Sectoral reference energy prices - on average at EU-27 level
(default reference price development - based on PRIMES reference case) average (11-
20)
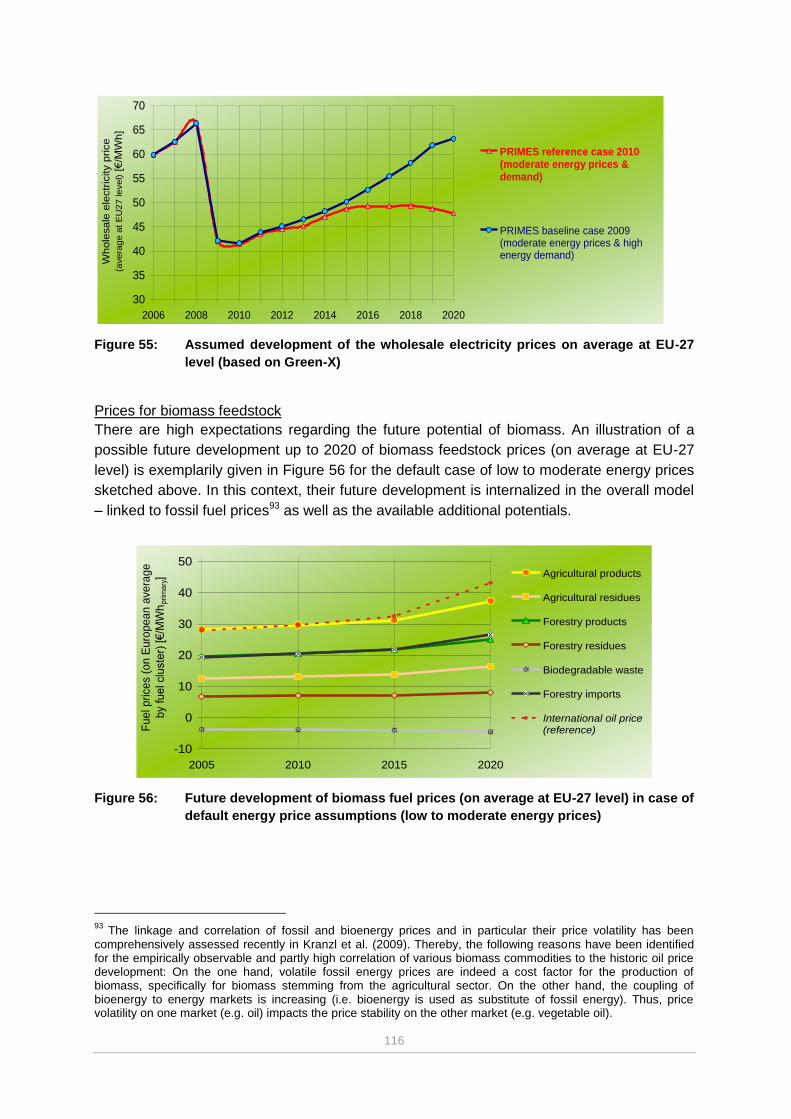
116
Figure 55: Assumed development of the wholesale electricity prices on average at EU-27
level (based on Green-X)
Prices for biomass feedstock
There are high expectations regarding the future potential of biomass. An illustration of a
possible future development up to 2020 of biomass feedstock prices (on average at EU-27
level) is exemplarily given in Figure 56 for the default case of low to moderate energy prices
sketched above. In this context, their future development is internalized in the overall model
– linked to fossil fuel prices93 as well as the available additional potentials.
Figure 56: Future development of biomass fuel prices (on average at EU-27 level) in case of
default energy price assumptions (low to moderate energy prices)
93
The linkage and correlation of fossil and bioenergy prices and in particular their price volatility has been comprehensively assessed recently in Kranzl et al. (2009). Thereby, the following reasons have been identified for the empirically observable and partly high correlation of various biomass commodities to the historic oil price development: On the one hand, volatile fossil energy prices are indeed a cost factor for the production of biomass, specifically for biomass stemming from the agricultural sector. On the other hand, the coupling of bioenergy to energy markets is increasing (i.e. bioenergy is used as substitute of fossil energy). Thus, price volatility on one market (e.g. oil) impacts the price stability on the other market (e.g. vegetable oil).
30
35
40
45
50
55
60
65
70
2006 2008 2010 2012 2014 2016 2018 2020
Wh
ole
sa
le e
lectr
icity p
rice
(avera
ge
at
EU
27 le
vel) [€/M
Wh]
PRIMES reference case 2010(moderate energy prices &demand)
PRIMES baseline case 2009(moderate energy prices & highenergy demand)
-10
0
10
20
30
40
50
2005 2010 2015 2020
Fu
el p
rice
s (
on
Eu
rop
ea
n a
ve
rag
e
by fuel clu
ste
r) [€/M
Wh
prim
ary] Agricultural products
Agricultural residues
Forestry products
Forestry residues
Biodegradable waste
Forestry imports
International oil price(reference)
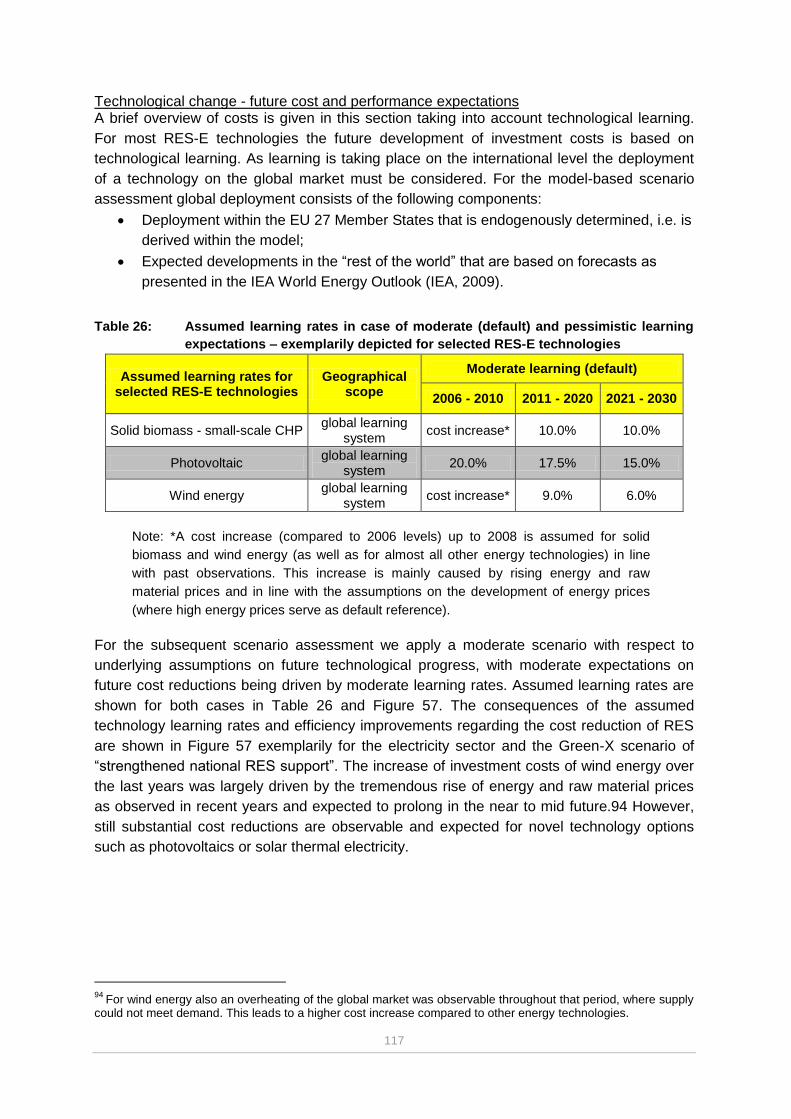
117
Technological change - future cost and performance expectations A brief overview of costs is given in this section taking into account technological learning.
For most RES-E technologies the future development of investment costs is based on
technological learning. As learning is taking place on the international level the deployment
of a technology on the global market must be considered. For the model-based scenario
assessment global deployment consists of the following components:
Deployment within the EU 27 Member States that is endogenously determined, i.e. is
derived within the model;
Expected developments in the “rest of the world” that are based on forecasts as
presented in the IEA World Energy Outlook (IEA, 2009).
Table 26: Assumed learning rates in case of moderate (default) and pessimistic learning
expectations – exemplarily depicted for selected RES-E technologies
Assumed learning rates for selected RES-E technologies
Geographical scope
Moderate learning (default)
2006 - 2010 2011 - 2020 2021 - 2030
Solid biomass - small-scale CHP global learning
system cost increase* 10.0% 10.0%
Photovoltaic global learning
system 20.0% 17.5% 15.0%
Wind energy global learning
system cost increase* 9.0% 6.0%
Note: *A cost increase (compared to 2006 levels) up to 2008 is assumed for solid
biomass and wind energy (as well as for almost all other energy technologies) in line
with past observations. This increase is mainly caused by rising energy and raw
material prices and in line with the assumptions on the development of energy prices
(where high energy prices serve as default reference).
For the subsequent scenario assessment we apply a moderate scenario with respect to
underlying assumptions on future technological progress, with moderate expectations on
future cost reductions being driven by moderate learning rates. Assumed learning rates are
shown for both cases in Table 26 and Figure 57. The consequences of the assumed
technology learning rates and efficiency improvements regarding the cost reduction of RES
are shown in Figure 57 exemplarily for the electricity sector and the Green-X scenario of
“strengthened national RES support”. The increase of investment costs of wind energy over
the last years was largely driven by the tremendous rise of energy and raw material prices
as observed in recent years and expected to prolong in the near to mid future.94 However,
still substantial cost reductions are observable and expected for novel technology options
such as photovoltaics or solar thermal electricity.
94
For wind energy also an overheating of the global market was observable throughout that period, where supply could not meet demand. This leads to a higher cost increase compared to other energy technologies.
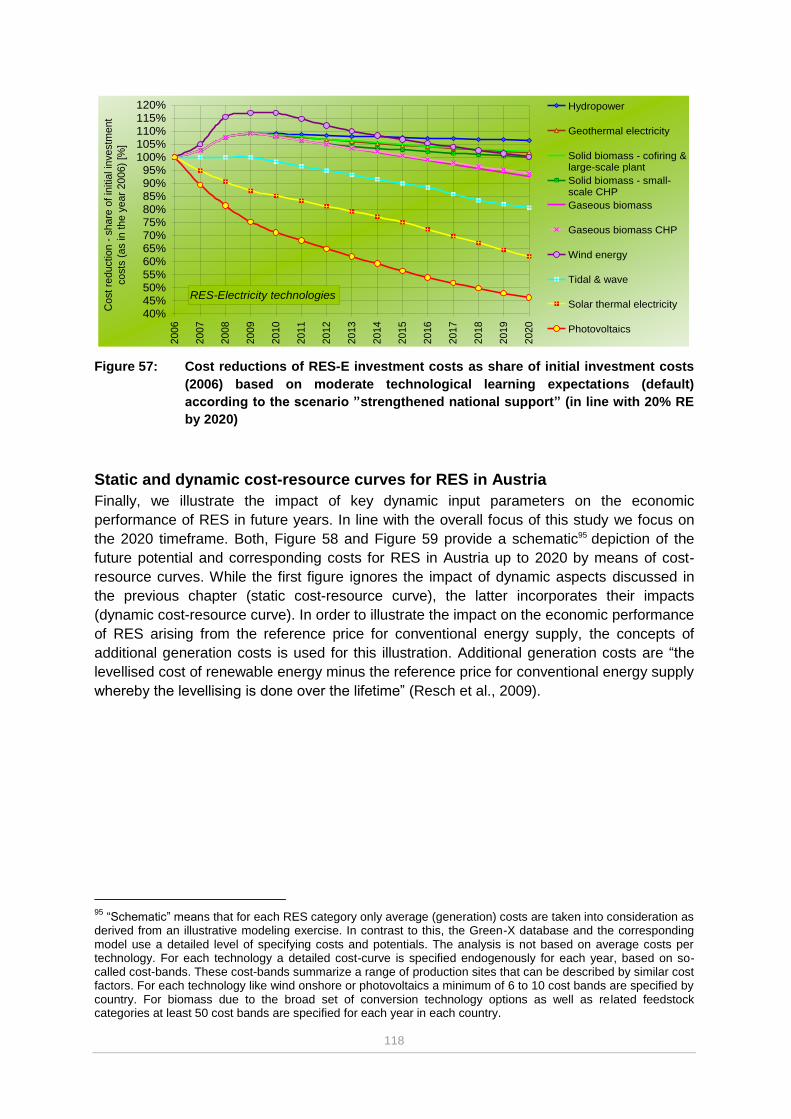
118
Figure 57: Cost reductions of RES-E investment costs as share of initial investment costs
(2006) based on moderate technological learning expectations (default)
according to the scenario ”strengthened national support” (in line with 20% RE
by 2020)
Static and dynamic cost-resource curves for RES in Austria
Finally, we illustrate the impact of key dynamic input parameters on the economic
performance of RES in future years. In line with the overall focus of this study we focus on
the 2020 timeframe. Both, Figure 58 and Figure 59 provide a schematic95 depiction of the
future potential and corresponding costs for RES in Austria up to 2020 by means of cost-
resource curves. While the first figure ignores the impact of dynamic aspects discussed in
the previous chapter (static cost-resource curve), the latter incorporates their impacts
(dynamic cost-resource curve). In order to illustrate the impact on the economic performance
of RES arising from the reference price for conventional energy supply, the concepts of
additional generation costs is used for this illustration. Additional generation costs are “the
levellised cost of renewable energy minus the reference price for conventional energy supply
whereby the levellising is done over the lifetime” (Resch et al., 2009).
95
“Schematic” means that for each RES category only average (generation) costs are taken into consideration as derived from an illustrative modeling exercise. In contrast to this, the Green-X database and the corresponding model use a detailed level of specifying costs and potentials. The analysis is not based on average costs per technology. For each technology a detailed cost-curve is specified endogenously for each year, based on so-called cost-bands. These cost-bands summarize a range of production sites that can be described by similar cost factors. For each technology like wind onshore or photovoltaics a minimum of 6 to 10 cost bands are specified by country. For biomass due to the broad set of conversion technology options as well as related feedstock categories at least 50 cost bands are specified for each year in each country.
RES-Electricity technologies
40%45%50%55%60%65%70%75%80%85%90%95%
100%105%110%115%120%
20
06
20
07
20
08
20
09
20
10
20
11
20
12
20
13
20
14
20
15
20
16
20
17
20
18
20
19
20
20
Co
st
redu
ctio
n -
sh
are
of
initia
l in
ve
stm
ent
costs
(as in the y
ear
2006)
[%]
Hydropower
Geothermal electricity
Solid biomass - cofiring &large-scale plant
Solid biomass - small-scale CHP
Gaseous biomass
Gaseous biomass CHP
Wind energy
Tidal & wave
Solar thermal electricity
Photovoltaics
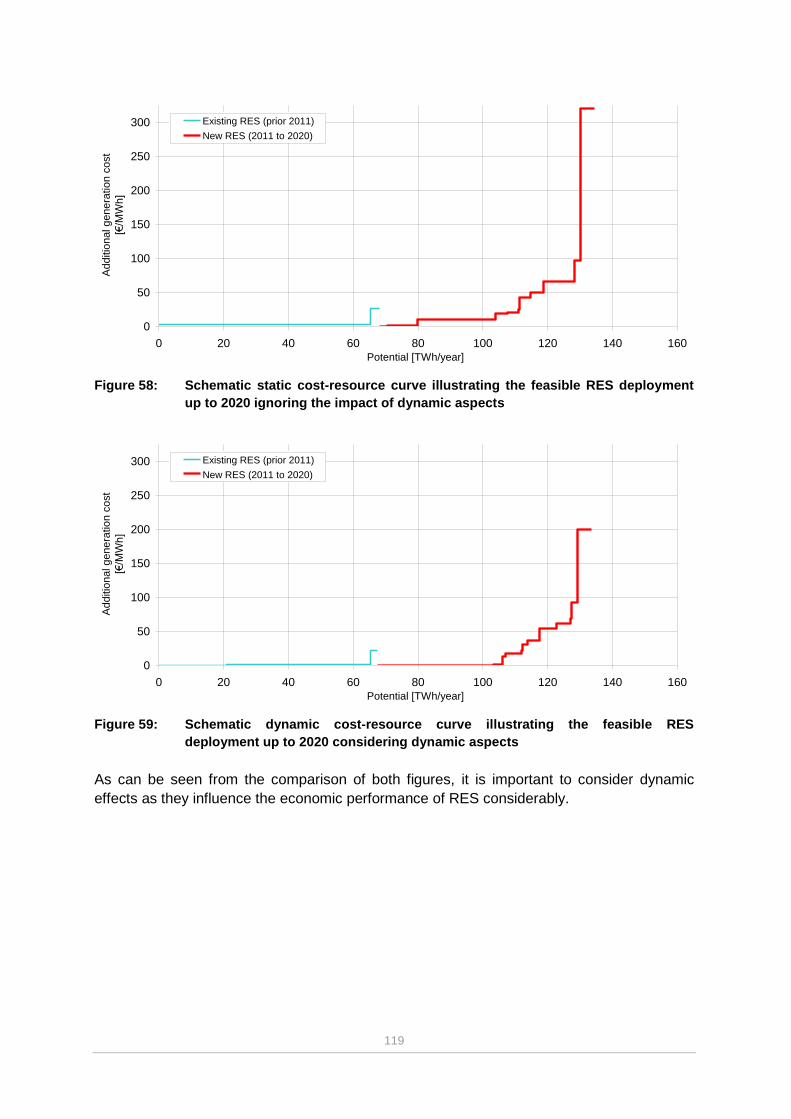
119
Figure 58: Schematic static cost-resource curve illustrating the feasible RES deployment
up to 2020 ignoring the impact of dynamic aspects
Figure 59: Schematic dynamic cost-resource curve illustrating the feasible RES
deployment up to 2020 considering dynamic aspects
As can be seen from the comparison of both figures, it is important to consider dynamic
effects as they influence the economic performance of RES considerably.
0
50
100
150
200
250
300
0 20 40 60 80 100 120 140 160
Potential [TWh/year]
Additio
nal genera
tion c
ost
[€/M
Wh]
Existing RES (prior 2011)
New RES (2011 to 2020)
0
50
100
150
200
250
300
0 20 40 60 80 100 120 140 160
Potential [TWh/year]
Additio
nal genera
tion c
ost
[€/M
Wh]
Existing RES (prior 2011)
New RES (2011 to 2020)
Related Documents