Louisiana State University LSU Digital Commons LSU Historical Dissertations and eses Graduate School 1998 Assessing the Reuse Potential of Objects. Maria Lorna Reyes Louisiana State University and Agricultural & Mechanical College Follow this and additional works at: hps://digitalcommons.lsu.edu/gradschool_disstheses is Dissertation is brought to you for free and open access by the Graduate School at LSU Digital Commons. It has been accepted for inclusion in LSU Historical Dissertations and eses by an authorized administrator of LSU Digital Commons. For more information, please contact [email protected]. Recommended Citation Reyes, Maria Lorna, "Assessing the Reuse Potential of Objects." (1998). LSU Historical Dissertations and eses. 6862. hps://digitalcommons.lsu.edu/gradschool_disstheses/6862

Welcome message from author
This document is posted to help you gain knowledge. Please leave a comment to let me know what you think about it! Share it to your friends and learn new things together.
Transcript

Louisiana State UniversityLSU Digital Commons
LSU Historical Dissertations and Theses Graduate School
1998
Assessing the Reuse Potential of Objects.Maria Lorna ReyesLouisiana State University and Agricultural & Mechanical College
Follow this and additional works at: https://digitalcommons.lsu.edu/gradschool_disstheses
This Dissertation is brought to you for free and open access by the Graduate School at LSU Digital Commons. It has been accepted for inclusion inLSU Historical Dissertations and Theses by an authorized administrator of LSU Digital Commons. For more information, please [email protected].
Recommended CitationReyes, Maria Lorna, "Assessing the Reuse Potential of Objects." (1998). LSU Historical Dissertations and Theses. 6862.https://digitalcommons.lsu.edu/gradschool_disstheses/6862

INFORMATION TO USERS
This manuscript has been reproduced from the microfilm master. UMI
films the text directly from the original or copy submitted. Thus, some
thesis and dissertation copies are in typewriter free, while others may be
from any type o f computer printer.
The quality of th is reproduction is dependent upon the quality of the
copy submitted. Broken or indistinct print, colored or poor quality
illustrations and photographs, print bleedthrough, substandard margins,
and improper alignment can adversely afreet reproduction.
In the unlikely event that the author did not send UMI a complete
manuscript and there are missing pages, these will be noted. Also, if
unauthorized copyright material had to be removed, a note will indicate
the deletion.
Oversize materials (e.g., maps, drawings, charts) are reproduced by
sectioning the original, beginning at the upper left-hand comer and
continuing from left to right in equal sections with small overlaps. Each
original is also photographed in one exposure and is included in reduced
form at the back o f the book.
Photographs included in the original manuscript have been reproduced
xerographically in this copy. Higher quality 6” x 9” black and white
photographic prints are available for any photographs or illustrations
appearing in this copy for an additional charge. Contact UMI directly to
order.
UMIA Bell & Howell Information Company
300 North Zeeb Road, Ann Aibor MI 48106-1346 USA 313/761-4700 800/521-0600
Reproduced with permission of the copyright owner. Further reproduction prohibited without permission.

Reproduced with permission of the copyright owner. Further reproduction prohibited without permission.

ASSESSING THE REUSE POTENTIAL OF OBJECTS
A Dissertation
Submitted to the Graduate Faculty of the Louisiana State University and
Agricultural and Mechanical College in partial fulfillment of the
requirements for the degree of Doctor of Philosophy
in
The Department of Computer Science
byMaria Loma Reyes
B.S., University of the Philippines at Los Banos, 1984 M.S., Bowling Green State University, 1990
December 1998
Reproduced with permission of the copyright owner. Further reproduction prohibited without permission.
UMI Number: 9922111
UMI Microform 9922111 Copyright 1999, by UMI Company. All rights reserved.
This microform edition is protected against unauthorized copying under Title 17, United States Code.
UMI300 North Zeeb Road Ann Arbor, MI 48103
Reproduced with permission of the copyright owner. Further reproduction prohibited without permission.

Acknowledgments
I would like to thank Dr. Doris Carver for her advice, guiding hand, motivation, patience,
careful scrutiny and thoroughness in correcting all my drafts. She is my example on
what it means to strive for excellence.
My academic committee members, Dr. David Blouin, Dr. Donald Kraft, Dr. Sitharama
Iyengar, and Dr. Morteza Naraghi-Pour, for their time, advice, and patience.
Brad Hanks, Cort de Voe and Dr. David Beilin for helping me with the preliminaries and
paperwork so that I can gather my dissertation data. Special thanks to Jim Doherty and
Peter Spung for their provision of time and resources for me to work on the dissertation.
The pastors and members of Grace Reformed Baptist Church in Mebane, NC, and
Trinity Baptist Church in Baton Rouge, LA for their constant prayers, moral and
emotional support during my PhJD. pilgrimage.
My mom, siblings, in-laws, nephews and nieces, for their love, support and fun memories
from the Philippines.
My son Micah, for his patience and good-natured tolerance in putting up with the
eccentricities of a Mom who is in pursuit of a PhD degree, for his proddings and
reminders to be focused in writing my dissertation instead of sleeping or watching the
wild birds in my yard.
My husband Manny, for his constant love, inspiration, enthusiasm, encouragement,
gentle rebukes, exhortations, helping hand even to the wee hours of the morning,
expertise in text formatting and use of MS Word.
Above all, I thank God for seeing me through this academic endeavor.
ii
Reproduced with permission of the copyright owner. Further reproduction prohibited without permission.

Table of Contents
Acknowledgments............................................................................................................ ii
List of Tables ................................................................................................................... v
List of Figures................................................................................................................. vii
Abstract.............................................................................................................................. ix
Chapter 1. Introduction......................................................................................................11.1 Software Measurement .............................................................................. 11.2 Software Reuse .......................................................................................... 61.3. Research Objectives................................................................................. 121.4 Motivation of Research............................................................................ 13
Chapter 2. Review of Literature...................................................................................... 152.1 Survey of Object-Oriented M etrics......................................................... 15
2.1.1 Class Level M etrics..................................................................... 162.1.2 System Level M etrics..................................................................212.1.3 Dependency Metrics Within Groups of Classes........................22
2.2 Related Studies......................................................................................... 262.2.1 Fonash..........................................................................................262.2.2 Karunanithi and Bieman .............................................................272.2.3 Li and Henry ............................................................................... 282.2.4 Basili et al......................................................................................28
Chapter 3. Materials and M ethods..................................................................................313.1 Metrics Extracted..................................................................................... 313.2 Class Metrics Collector............................................................................423.3 Reuse Measures ....................................................................................... 48
3.3.1 Inheritance-based reuse (RInherit)..............................................483.3.2 Inter-application reuse by extension (RExt).............................. 503.3.3 Inter-application reuse as a server (RServ)................................ 53
3.4 Data and Statistical Analyses...................................................................533.4.1 D ata .............................................................................................. 533.4.2 Statistical Analyses ..................................................................... 59
3.4.2.1 Comparison between two groups: classes that were reused vs. classes that were not reused...................... 59
3.4.2.2 Stepwise Regression ................................................... 603.4.2.3 Empirical Validation................................................... 623.4.2.4 Correlation Coefficients..............................................62
3.5 Summary................................................................................................... 63
iii
Reproduced with permission of the copyright owner. Further reproduction prohibited without permission.

Chapter 4 Results and Discussion...................................................................................644.1 Comparison Between Two G roups........................................................ 64
4.1.1 T -te s t........................................................................................... 644.1.1.1 Inheritance-based reu se ............................................... 644.1.1.2 Inter-application reuse by extension.......................... 714.1.1.3 Inter-application reuse as a server.............................. 77
4.1.2 Nonparametric test....................................................................... 834.1.2.1 Inheritance-based reu se ................................................. 834.1.2.2 Inter-application reuse by extension............................. 834.1.2.3 Inter-application reuse as a server................................. 86
4.2 Stepwise Regression ............................................................................... 884.2.1 Inheritance-based reuse............................................................... 884.2.2 Inter-application reuse by extension ..........................................914.2.3 Inter-application reuse as a server..............................................95
4.3 Statistical Validation................................................................................984.4 Other Statistical Analysis.......................................................................105
4.4.1 Correlation among the metrics in group RInheritPlus............1054.4.2 Correlation among the metrics in group RExtPlus ................. 1054.4.3 Correlation among the metrics in group RServPIus................1124.4.4 Correlation among the reuse measures ....................................112
4.5 Summary................................................................................................. 117
Chapter 5 Summary and Conclusions...........................................................................1185.1 Contributions of this research................................................................1205.2 Future work.............................................................................................120
References...................................................................................................................... 122
Appendix A .................................................................................................................... 128
Appendix B .................................................................................................................... 132
V ita ..................................................................................................................................141
iv
Reproduced with permission of the copyright owner. Further reproduction prohibited without permission.
List of Tables
Table 2.1. Comparison of reuse and metric studies.................................................30
Table 3.1. CRC cards used to design a metric analyzer..........................................43
Table 4.1. RInherit: T-test between classes that are reused (+) vs.classes that are not reused (0 and 1 ) .................................................... 66
Table 4.2. RExt: T-test between classes that are reused (+) vs.classes that are not reused (0 and 1 ) .................................................... 72
Table 4.3. RServ: T-test between classes that are reused (+) vs.classes that are not reused (0 and 1)..................................................... 78
Table 4.4. RInherit: nonparametric test between classes that are reused (+)vs. classes that are not reused (0 and 1 ) .............................................. 84
Table 4.5. RExt: nonparametric test between classes that are reused (+)vs. classes that are not reused (0 and 1 ) .............................................. 85
Table 4.6. RServ: nonparametric test between classes that are reused (+)vs. classes that are not reused (0 and 1)............................................... 87
Table 4.7. Last step of stepwise procedure for dependent variableinheritance-based reuse.......................................................................... 89
Table 4.8. Summary of stepwise procedure for dependent variableinheritance-based reuse..........................................................................90
Table 4.9. Summary of 2-variable stepwise procedure for dependent variableinheritance-based reuse.......................................................................... 92
Table 4.10. Last step of stepwise procedure for dependent variableinterapplication reuse by extension........................................................93
Table 4.11. Summary of stepwise procedure for dependent variableinterapplication reuse by extension....................................................... 94
Table 4.12. Summary of 2 variable regression procedure for dependent variableinterapplication reuse by extension....................................................... 96
v
Reproduced with permission of the copyright owner. Further reproduction prohibited without permission.

Table 4.13. Last step of stepwise procedure for dependent variableinterapplication resuse as a server......................................................... 97
Table 4.14. Summary of stepwise procedure for dependent variableinterapplication reuse as a server............................................................97
Table 4.13. Summary of second order multiple regression procedure fordependent variable interapplication reuse as a se rv er.......................... 99
Table 4.16. Empirical validation regression for RInherit........................................ 100
Table 4.17. Empirical validation regression for RExt .............................................102
Table 4.18. Pearson correlation coefficients of metrics in RInheritPlus................106
Table 4.19. Pearson correlation coefficients of metrics in RExtPlus..................... 109
Table 4.20. Pearson correlation coefficients of metrics inRServPlus ..................113
Table 4.21. Pearson correlation coefficient of RInherit, RExt and R S erv ............. 116
Table 4.22. Pearson correlation coefficient of U, Rlherit, RExt, and RServ ....... 116
vi
Reproduced with permission of the copyright owner. Further reproduction prohibited without permission.

List of Figures
Figure 3.1. Object-Oriented metrics............................................................................32
Figure 3.2. Example of NCMC metric va lue ............................................................ 35
Figure 3.3. Example of NIMC metric value.............................................................. 36
Figure 3.4. CMC Classes.............................................................................................. 44
Figure 3.5. A user interface view of our automated class metrics collector............ 46
Figure 3.6. An ASCII comma delimeted saved metrics file that can be importedto MS Excel or SAS 6 .0 7 ....................................................................... 47
Figure 3.7. Example of inheritance-based reuse where no methods areoverridden.................................................................................................49
Figure 3.8. Example of inheritance-based reuse where a method is overridden ....51
Figure 3.9. Example of inter-application reuse by extension.................................. 52
Figure 3.10. Example of inter-application reuse as a se rv er......................................54
H gure3 .ll. Smalltalk scripts used to compute RInherit...........................................55
Hgure 3.12. Smalltalk scripts used to compute RExt................................................ 56
Hgure 3.13. Smalltalk scripts used to compute RServ............................................... 57
Hgure 4.1. Object-Oriented m etrics........................................................................... 65
Figure 4.2. RInherit empirical validation regression graph..................................... 103
Hgure 4.3. RExt empirical validation regression graph..........................................104
Hgure 4.4. Pairs in RInheritPlus with r-values > 0 .8 ...............................................108
Figure 4.5. Pairs in RExtPlus with r-values > 0.8.................................................... I l l
Figure 4.6. Pairs in RServPlus with r-values > 0 .8 ..................................................115
vii
Reproduced with permission of the copyright owner. Further reproduction prohibited without permission.

Hgure B.l. Mean of the RExtPlus Group................................................................ 133
Hgure B.2. Standard deviation of the metrics RExtPlus G roup ............................ 134
Hgure B.3. Variance of the metrics RExtPlus G roup............................................. 135
Hgure B.4. Minimum of the metrics RExtPlus Group ...........................................136
Hgure B.5. Maximum of the metrics RExtPlus Group .......................................... 137
Hgure B.6. Median of the metrics RExtPlus G roup ............................................... 138
Hgure B.7. Mode of the metrics RExtPlus G roup...................................................139
Hgure B.8. Range of the metrics RExtPlus G roup ..................................................140
Reproduced with permission of the copyright owner. Further reproduction prohibited without permission.

Abstract
In this research, we investigate whether reusable classes can be characterized by object-
oriented (OO) software metrics. Three class-level reuse measures for the OO paradigm
are defined: inheritance-based reuse, inter-application reuse by extension, and inter
application reuse as a server. Using data from a software company, we collected metrics
on Smalltalk classes. Among the 20 metrics collected are cyclomatic complexity, Lorenz
complexity, lines of code, class coupling, reuse ratio, specialization ratio and number of
direct subclasses. We used stepwise regression to derive prediction models incorporating
the 20 metrics as the independent variables and the reuse measures, applied separately,
as the dependent variable. Inheritance-based reuse and inter-application reuse by
extension can be predicted using a subset of the 20 metrics. Two prediction models for
inheritance-based reuse and inter-application reuse by extension were validated using a
new set of 310 Smalltalk and VisuaLAge applications and subapplications. Validation
results show that it is possible to predict whether a class from one application can be
reused by extension in another application. We also conducted a t-test to test whether the
mean metric values between reusable and non-reusable classes are the same. Results
suggest that there exists significant differences in the mean metric values between the
reusable and non-reusable classes.
ix
Reproduced with permission of the copyright owner. Further reproduction prohibited without permission.

Chapter 1. Introduction
1.1 Software Measurement
Measurement has a central role in engineering disciplines [Fen91]. Traditional
engineering disciplines are marked by the availability of precise, well understood,
standardized metrics which are based in the physical sciences [Den81]. Gerald
Weinber said that maturity in every engineering and scientific discipline is marked by
the ability to measure [Gil77]. Software engineering is the collection of techniques
concerned with applying an engineering approach to the construction of software
products. It has been seen as a partial solution to poor quality systems, delivered late,
and over-budgeted [Fen91; Ghe91].
In software engineering, measurement has been ignored to a large extent,
detaching it from the normal scientific view of measurement [Fen91]. This lack of
measurement is one of the criticisms found in software literature which merits further
investigation. The progress of metric research has been slow due to complexity of
software development and problems with methodology [She93]. [Jon91] called this
progress an art form or craft rather than an engineering discipline.
Software and computer science may have more in common with economics,
psychology, and political science than with the physical sciences because of the problems
with measurement. The approach to software metrics must be made in a careful,
scientific way marked by the traditional scientific paradigm of hypothesis, evaluation,
criticism, and review [Den81],
1
Reproduced with permission of the copyright owner. Further reproduction prohibited without permission.

Some of the factors that have discouraged or delayed research in and applications
of effective software metrics are:
1. Misconceptions of the goal of software metrics.
2. Practitioners' lack of educational background in numerical thinking for the control of
software productivity.
3. Some design diagrams are insensitive to mathematical reasoning/modeling-
traditional flowcharts, data flow diagrams, finite-state diagrams, action diagrams,
general graph oriented diagrams, decision trees.
4. Complacent attitude of software maintainers with respect to software measurement
5. Complacent attitude of software maintainers with lines of code (LOC) and general
graph thinking which is the basis of some complexity measures.
6. Programmer productivity measures intimidates programmers about possible firing.
7. Private software packages including cost estimation models and computer-aided
software engineering (CASE) tools without known supporting scientific foundations
have the potential to entrench and establish 'certification'. [Eji91].
8. Measurements are intrusive [Jon91].
Software engineers have feared and resisted measurement as they dread
destroying the "beauty" of software. Gerald Weinber claimed that under the artist's
command, measurement becomes the servant of beauty [Gil77].
Formally, measurement is the process by which numbers or symbols are
assigned to attributes of entities in the real world in such a way as to describe them
according to clearly defined rules. Two broad purposes of software measurement are for
tracking a software project and for predicting important characteristics of projects
2
Reproduced with permission of the copyright owner. Further reproduction prohibited without permission.
[Fen91], [Sch93]. Also, its aims are technical and managerial in nature. These
managerial and technical aims include characterization, evaluation, control,
improvement of software quality, increased productivity, comparison, and estimations
[Roc94]. hi software engineering, indirect measurement is usually employed and used in
a predictive capacity. However, there is a need to link the indirect to the direct measure
[She93].
Metric and measure have been used synonymously in software engineering
literature. A metric is a member of the class of mathematical functions called measure
functions. A measure is definable on some definite structure, abstract or concrete, and
discrete or continuous. A metric measure is then meaningful with respect to some well-
defined sets or spaces [Eji91]. Simply stated, a software metric defines a standard way of
measuring some attribute of the software development process [Gra87]. hi mathematics,
metric and measure are defined as follows:
A measure m is a mapping m:A —> B which yields for every empirical object a e A a
formal object (measurement value) m(a) e B.
A metric is a criterion to determine the difference or distance between two entities
[Zus91].
[Zus91] gives a comprehensive survey about software measurement and metrics
from the literature. The IEEE Standard Dictionary of Measures to Produce Reliable
Software defines measure as: a quantitative assessment of the degree to which a
software product or process possesses a given attribute[Zus91]. It is worthwhile to note
that [Zus91] claims that the results of measurement are difficult to interpret if too many
properties of a program are combined in one number. Information is lost if only a single-
3
Reproduced with permission of the copyright owner. Further reproduction prohibited without permission.

valued measure is used. A vector of measures can provide complete information on each
individual property of a program. This research will use metrics to convey a
measurement of a software engineering product
In software engineering, empirically desirable qualities o f a good measure, as
enumerated in [Eji91], are:
1. Empirically and intuitively persuasive. It must satisfy notions of what object or
parameter is being measured.
2. Simple and computable. It should be convenient to teach and use, and require only
simple and well-formed formulas.
3. Consistent and objective. It should always yield unambiguous, reliable, and
consistent results independent of environmental changes of mathematical
transformations. An observer should be able to confirm the same measure using the
same formula or guidelines.
4. Measure rationalism. It must belong to the class of measure functions.
5. Consistency of units and dimensions.
6. Programming language independence or invariance.
7. Feedback effect. It should psychologically reflect the philosophy of its practices
within the context of its goals.
Three classes of entities whose attributes are measured are [Fen91; Zus91]:
1. Processes which are software related activities with a time factor.
2. Products which are any artifacts, deliverables, or documents which arise from the
software life cycle.
3. Resources which are the items which are inputs to process.
4
Reproduced with permission of the copyright owner. Further reproduction prohibited without permission.
Metrics for the traditional non-OO paradigm have been discussed, criticized and
praised in computer literature. Lines of code, Halstead's Software Science, McCabe's
Cyclomatic Complexity, Albrecht's Function Point are among the popular and widely-
used metrics to date. [She93; Ke394; Ke494; Ke594; Ke694; Ke794;Jon91].
[Chi94, Chi91] listed two criticisms about software metrics. First, metrics that
are applied to traditional, non-object oriented software design are criticized for having no
solid theoretical and mathematical basis [Eji93; Fen90; Mel90; Sch93]. Second, as
applied to object oriented (OO) design and development, software metrics developed
with traditional methods do not support key OO concepts such as classes, inheritance,
encapsulation and message passing. [Hen92] pointed out that traditional methods
emphasize function-oriented view that separate data and procedures. Traditional
languages and programming practices have critical data structures defined globally, and
passed from procedure to procedure [Smi90]. The OO philosophy, on the other hand,
brings data and functionality together. [Mey88] stated that an object-oriented
design(OOD) decomposition of a software system is based on the classes of objects the
system manipulates and not on the functions the system performs.
OO methods in software development serve several uses[McG92]:
1. Promote reusability due to support for data abstraction. Reuse can be accomplished
by selection, decomposition, configuration, or evolution.
2. Facilitate maintenance due to information-hiding.
3. Exploit commonality across applications and across system components.
4. Reduce complexity since OO techniques relieves the designer from having a
complete solution before beginning the design process.
5
Reproduced with permission of the copyright owner. Further reproduction prohibited without permission.

1.2 Software Reuse
Reusable software was initially described as off-the-shelf software components
used as building blocks of larger systems [Weg87]. This concept was pioneered by D.
McEroy [McI76]. Software reuse has been around since the 1960s but is rarely practiced
effectively [Coa91]. Software reuse is believed to be a key in higher productivity and
quality in software development [Big87]. Studies were conducted to support this
claim[Fra96]. Agresti and Evanco [Agi92] showed that project characteristics of 16 Ada
subsystems that have a high level of reuse correlate with a low defect density. Browne et
al. [Bro90] showed that a high correlation exists between the measures of reuse rate,
development time, and decreases in number of errors. The system used was called the
reusability-oriented parallel programming environment (ROPE), a software component
reuse system that helps designers find, understand, modify and combine code
components. Card et al. [Car86] studied software design practices in a FORTRAN
computing environment. They showed that for modules reused without modification, 98
percent were fault-free and 82 percent were in the lowest cost per executable statement
category. Chen and Lee [Che93] developed an environment to manufacture C++
components. Their results showed improvements in software productivity of 30 to 90
percent measured in lines of code developed per hour. Gaffney and Durek [Gaf89]
proposed cost/productivity models that specified the effect of reuse on software quality
(number of errors) and software development schedules. They showed that the number
of uses of the reusable software components directly correlates to the development
product productivity.
6
Reproduced with permission of the copyright owner. Further reproduction prohibited without permission.

The importance of reuse stems from the desire to avoid duplication and capture
commonality in undertaking similar tasks [Weg87]. According to [Cai95], reusing code
that already exists speeds development and reduces the cost of writing and maintaining
an application. [Agr88] listed the following benefits of reuse:
1. Productivity through the use of existing components. Productivity can be achieved
since reuse reduces the amount of documentation and testing required [Tra88, Tra95].
2. Reliability through the use of proven components.
3. Consistency through using the same components in many places.
4. Manageability through the use of well-understood components.
5. Standardization through the use of standard components.
6. Software cost reduction [McC92].
Early versions of FORTRAN had a math library that constituted reusable code
[Car95]. [Fre87] pointed out that the traditional mathematical subroutine libraries served
as one of the starting points for an early concept of reusability. Reuse of numerical
computation routines is successful due to the following reasons[Big87]:
1. The domain is very narrow and contains only a small number of datatypes.
2. The domain is well-understood since its mathematical framework has evolved over
hundreds of years. People understand the domain, and readily understand what
function a component performs with little description of that function.
3. The underlying technology is static, hence the library of parts is stable.
However, it is equally true that there exist domains where the underlying technology is
rapidly changing. An example of such a domain is the workstation domain wherein
systems software has a short life, and is therefore not reusable [Big87].
7
Reproduced with permission of the copyright owner. Further reproduction prohibited without permission.

[Fre87] defined the object of reusability as any information which a developer
may need in the process of creating software. Code fragments, logical structures,
functional architectures, external knowledge, environment-level information are
representative types of reusable information [Fre87]. Compilers, operating systems,
linear programming packages, statistics libraries, prototypes, data models, life cycle
processes, are also reusable resources [Weg87 ;Hor87 ;McC92]. (Pri87] classified levels
of reuse as:
1. Reuse of ideas and knowledge.
2. Reuse of particular artifacts and components.
Frakes and Terry [Fra96] categorized reuse models and metrics into:
1. Reuse cost benefit models which include economic cost-benefit models, quality and
productivity analyses.
2. Maturity assessment models which categorize how advanced reuse programs are in
implementing systematic reuse.
3. Amount of reuse metrics which monitors reuse improvement effort by tracking
percentages of reuse for life cycle objects.
4. Failure model analysis which provides an approach to measuring and improving a
reuse process based on a model of the ways a reuse process can fail.
5. Reusability metrics which indicate the likelihood that a component is reusable. The
pertinent question asked is, are there measurable attributes that indicate the potential
reusability of a component?
6. Reuse library metrics which are used to manage and track usage of a reuse repository.
Reproduced with permission of the copyright owner. Further reproduction prohibited without permission.

[McG92] coined the term 'editor inheritance* to describe a form of reuse in the
procedural paradigm which is simply copying and modifying an existing code. This
process, also called ‘scavenging’ or ‘salvaging’ code, has its own problems. [Car95]:
1. Finding the needed code can be difficult
2. There is little assurance that code appearing in another program is correct
3. Separating a piece of code from its containing program is difficult due to
dependencies that piece of code has to its containing program.
4. Scavenged code often needs nontrivial changes to work in a new program.
Other impediments to successful software reuse are [McC92]:
1. Determining what is reusable.
2. Lack of standardization in programs.
3. Programming language dependence.
4. Deciding what goes in the library.
5. Understanding side effects from change.
6. Describing and classifying software components.
7. No management support for reusability.
8. Biggest benefits of reusability are long term.
9. Not practical to retrofit reusability into existing software components.
Essential properties of reusable code are [Car95, Den88, Nie92]:
1. Easy to find and understand.
2. Reasonable assurance that it is correct.
3. Requires no separation from any containing code.
4. Requires no changes, or minor modifications to be used in a new program.
9
Reproduced with permission of the copyright owner. Further reproduction prohibited without permission.
5. Interface is both syntactically and semantically clear.
6. Interface is written at appropriate (abstract) level.
7. Component does not interfere with its environment
8. Component is designed as object-oriented.
9. Separates the information needed to use software, its specification, from the details of
its implementation, the body.
10. Component exhibits high cohesion/low coupling.
11. Component and interface are readable by persons other than the author.
12. Component is written with the right balance between generality and specificity.
13. Component is accompanied by documentation to make it traceable.
14. Component is standardized in the areas of invoking, controlling, terminating its
function, error-handling, communication, and structure.
15. Component should constitute the right abstraction and modularity for the application.
When the overall effort to reuse code is less than the effort to create new code,
then code reuse will be attractive to users [Pri87].
Can reuse be measured? [Hal88] emphasized the need to ascertain what sort of
reuse is meant For example is it:
• The number of times the code is incorporated into other codes?
• The number of times the code is executed?
• The number of times the incorporating code is executed?
• A figure of merit reflecting value or utility or saving?
[Coa91] envisions that OO reuse will become more important than code and dam
reuse as OOA, OOD and OOP gain acceptance in the field. [McG92] gave the following
10
Reproduced with permission of the copyright owner. Further reproduction prohibited without permission.

levels of reuse for OOP: abstract-level, instance-level, customization reuse, and source
code reuse. In abstract level reuse, high-level abstractions are reused for additional
classification dimensions or to understand the problem domain modeled by the
structures. Instance-level reuse creates instances of existing classes. Instance-level reuse
is the quickest and most economical form of reuse. Customization reuse means that a
reuser can inherit information from an existing class, override certain methods, and add
new behaviors. Source code reuse is creating a subclass of an existing class, without any
knowledge of the implementation of the parent classes. [Lor94] classified reuse into:
white box and black box. White box reuse entails examination of the internals of the
code component Black box reuse is reusing functionality through a defined interface,
without examining the internals of the code component.
[Mey88] claimed that the most promising technique in attaining reusability is
OOD, defined as "the construction of software systems as structured collections of
abstract data type implementations." OO classes, called abstract data type
implementations in the OOD definition of [Mey88], have important structured
relationships among each other. Two noteworthy relations are client and inheritance
relations. A class is a client of another class when it makes use of the other class’s
services, as defined in the interface. Inheritance is the process of obtaining or reusing
properties through a relation such as parent-child, or general-specific [Lew95], The
inheritance feature of OOP allows redefinition of children classes based on parent
classes. Inheritance provides a way of building reusable classes from existing ones. Any
changes in the operations in the parent classes are automatically inherited by children
classes. Without the inheritance feature, every class must be developed as an
II
Reproduced with permission of the copyright owner. Further reproduction prohibited without permission.

independent entity. The net effect of inheritance is a reduction of code to be developed
by virtue of existing operations from the parent classes [Nie92]. Moreover, the relations
client and inheritance help achieve reusability. An object encapsulates an entity that has
a set of operations and attributes. Encapsulation means that implementation details of the
data structure and algorithms used in the operations are hidden from the user and the only
visible part is the interface. According to [Nie92], encapsulated objects provide a high
degree of reusability since they can be used in different systems without changing the
interfaces. [Lor94] claimed that one of the key benefits of OO is the additional support
for reuse. Tasks in OO systems can be accomplished by requesting services, i.e. reusing,
from other objects.
This section defined and described the benefits of software reuse. Some benefits
are increased productivity, higher software quality, and reduction in software cost.
Essential properties of reusable code were given. Also, categories of reuse models and
metrics were listed. Moreover, impediments to successful software reuse were given.
Furthermore, this section discussed why OOD and OOP are promising techniques in
attaining reusability.
13 Research Objectives
The goals of this research are:
1. To define class level OO metrics that quantify reuse.
2. To investigate the statistical relationship of reuse metrics with existing OO and non-
0 0 metrics.
3. To derive a prediction model for measuring reusability.
4. To statistically validate the prediction model using empirical data.
12
Reproduced with permission of the copyright owner. Further reproduction prohibited without permission.

1.4 Motivation of Research
Metric research of the OO paradigm is still in its infancy. This work provides
three quantitative measures of reuse and a set of statistically validated OO metrics, which
will aid in reusability. A standard set of quality metrics may be available in the future
[Sch93]. This set of metrics must be anchored in theory and practice.
Metric research is needed because code and design metrics can be used in a way
that is analogous to statistical quality control [Kit90]. OO code can be accepted or
rejected based on a range of metric values. Rejected OO code can be changed until the
metric values fall within the specified acceptable range.
Furthermore, experience reports and metric data from projects are needed.
Project data will help empirically validate product metrics. A position paper in [OOP92]
reports: "We need more experience and data from projects. We want to have a workshop
next year and invite interested participants to focus on the product metrics we have
recommended and help us validate them."
In a group position statement in [OOP93], the following issues were cited as
needing further research:
• The relationship between easily measured quantities and desired results.
• Development of metrics and instrumentation that programmers find informative, not
threatening.
• Collection and evaluation of empirical data of all sorts, especially for metrics
validation, development of norms, and assessment of the impact of reuse on
productivity and quality.
13
Reproduced with permission of the copyright owner. Further reproduction prohibited without permission.

Moreover, measuring software quality may be related to the economic success of an
institution. 'I t is obvious that the need for accurate measurements of software
productivity and quality is directly related to the overall economic importance of
software to industry, business, and government. That means that measurement is now a
mainstream software activity, and it is one that is on the critical path to corporate and
national success [Jon91]."
Lastly, most of the OO metrics have not undergone empirical validation [Bas96],
This research will help further the reuse research agenda by defining three new reuse
metrics and then empirically validating those metrics on data collected from a real-world
software organization.
This research differs from other work in the following ways. First, we defined three
new OO reuse measures. Second, we automatically collected empirical metrics data
from implemented Smalltalk classes using a tool written in Smalltalk. Third, we
performed three statistical analyses to achieve the goals of this research. One of the goals
is to assess whether an OO class has reuse potential based on the metric values of the
class. Fourth, we empirically validated the resulting regression equations.
In this chapter, we give an overview of the dissertation research. Chapter 2 contains a
survey of object-oriented metrics and related research. In Chapter 3 we describe the
metrics used in this study. It also presents the data and discusses the statistical analysis
of the data. Finally, we describe the results in Chapter 4.
14
Reproduced with permission of the copyright owner. Further reproduction prohibited without permission.
Chapter 2. Review of Literature
2.1 Survey of Object-Oriented Metrics
Chidamber and Kemerer [Chi 94] presented six metrics for OOD that are
especially designed to measure aspects peculiar to the OO approach. These metrics arc
weighted methods per class, depth of inheritance tree, number of children, coupling
between objects, response for a class and lack of cohesion of methods. This suite of
metrics, based upon measurement theory, incorporates viewpoints of OO software
developers. It is evaluated against Weyuker’s criteria for validity. The Weyuker
properties are:
1) Noncoarseness: Given a class P and a metric m another class Q can always be found
such that: nip) *m(Q).
2) Nonuniaueness: There can exist distinct classes P and Q such that m(P) = m(Q).
3) Design Details are Important: Given two class designs, P and Q, providing the same
functionality, this does not imply that m(P) = m(Q).
4) Monotonicitv: For all classes P and Q, the following must hold: m(P) <= m(P+Q)
and m(Q) <= m(P+Q) where P+Q is the combination of P and Q, that is, P+Q is the
class whose properties are the union of the properties of the component classes.
5) Noneouivalence of Interaction: HP, HQ, HR, such that m(P) = m(Q) does not imply
that m(P+R) = m(Q+R).
6) Interaction Increases Complexity: HP and HQ such that: m(P) + m(Q) < m(P+Q).
Empirical data for the [Chi94] metrics were collected from two commercial
projects that used C++ and Smalltalk programming languages, respectively. Automated
tools were used to collect the metrics. From two C++ libraries with 634 classes that are
15
Reproduced with permission of the copyright owner. Further reproduction prohibited without permission.
used in the design of graphical user interfaces, metrics data were collected, from the
second organization, which is a semiconductor manufacturer, metrics data were collected
for 1459 classes that are used for developing machine control and manufacturing
systems. Since there are no design artifacts available at both organizations, the metrics
were collected from code.
In section 2.1.1, class-level metrics are described.
2.1.1 Class Level Metrics
In this section, the following class-level metrics are described: weighted methods
per class, depth of inheritance tree, number of children, coupling between objects,
response for a class, lack of cohesion of methods [Chi94], coupling through message
passing, coupling through abstract data types, number of local methods, size metrics
[Li93], fan-in and fan-out [Teg95].
Weighted Methods Per Class (WMC).
The WMC of a class with n methods is the sum of the static complexities of all
methods, that is,
WMC = £ ci= i
where C, = static complexity of method i. WMC = n if C, = 1 for all i = 1,2,..., n.
Static complexity was not specifically defined to allow for generic application of
WMC. Some traditional static complexity metrics such as McCabe’s cyclomatic
complexity, may be appropriate. McCabe’s cyclomatic complexity is based on the
16
Reproduced with permission of the copyright owner. Further reproduction prohibited without permission.

control flow or decision structure of a software module [McC94, Jon91], defined as
V(G) = e - n + 2
where G is a connected, directed acyclic graph,
e = number of edges of G.
n = number of nodes of G.
A node represents a block of code with one entry point and one or more exit points. The
nodes are connected by edges.
Any static complexity metric that has the property of an interval scale can be used.
WMC relates to the definition of complexity of an object and indicates time and effort
needed to develop and maintain an object A large WMC may indicate the impact on
children who inherit all methods defined in the class. Also, a large WMC may be
indicative of application specificity of a class, which limits reuse possibility. WMC
satisfies Weyuker’s properties 1,2,3,4,5 but not property 6.
The empirical data from both organizations showed that most classes have a
small number of methods (0 to 10). It was also noted that examining outliers can give
significant insights on specific classes. A class with 87 methods was observed to have
reuse potential.
Depth of Inheritance Tree (DIT).
D U = depth of the inheritance of the class or height of the class in the inheritance
hierarchy or maximum length from the node to the root of the tree for multiple
inheritance cases.
D U relates to scope of properties, i.e. extent of the influence of a property. It
measures how many ancestor classes can potentially affect the class. A class with a large
17
Reproduced with permission of the copyright owner. Further reproduction prohibited without permission.
D U metric is complex due to a large number of methods it is likely to inherit. Also, a
large D U indicates potential reuse of inherited methods.
D U satisfies Weyuker’s properties 1,2,3,5 but not property 6. Property 4 is
satisfied if P and Q are siblings but is not satisfied if P and Q are neither children nor
siblings of each other.
The empirical data from both organizations showed a low median value for DU.
This shows that classes tend to be close to the root in the inheritance hierarchy. This
characteristic can warn designers about failure to take advantage of reuse through
inheritance.
Number of Children (NOC).
NOC = number of immediate sub-classes subordinate to a class in the class
hierarchy.
NOC, which relates to scope of properties, measures how many sub-classes will
inherit the methods of the parent class. A class with a large NOC may require more
testing and may be harder to maintain. A large NOC may indicate reuse potential
through inheritance and may also indicate improper abstraction of the parent class.
NOC satisfies Weyuker’s properties 1,2,3,4,5 but not property 6.
Findings indicate that reuse through inheritance may not be fully adopted by the
two organizations since empirical data shows low NOC for both of them.
Coupling Between Objects (CBO).
CBO = number of non-inheritance couples with other classes.
CBO relates to the notion of an object being coupled with another when methods
of one use methods or instance variables of another. An object with high CBO may need
18
Reproduced with permission of the copyright owner. Further reproduction prohibited without permission.

more rigorous testing and may be harder to reuse. It is easier to reuse an independent
class. A class with low CBO may be indicative that this class promotes modularity and
encapsulation. CBO satisfies Weyuker’s properties 1,2,3,4,5 but not property 6.
Empirical data showed that CBO values were smaller in the C++ environment
than in the Smalltalk environment Also, the data suggests that coupling between classes
is an increasing function of the number of classes in the application.
Response For a Class (RFC).
RFC = cardinality of the response set (RS) of a class
where RS = number of all methods in the class + number of methods called by methods
in the class.
RFC is a measure of the attributes of an object and communication between
objects. A high RFC may indicate that an object is complex and hence may require more
testing time and may be harder to maintain. RFC satisfies properties 1,2,3,4,5 but not
property 6.
The empirical data from both organizations showed small RFC values. The
median values of RFC for the Smalltalk environment are higher than the C++
environment.
Lack of Cohesion in Methods (LCOM).
Given a class C with methods Mi, M% ..., Mn and {/,} = set of instance variables
used by method M§. Let P = { = 0 } and Q = { * 0 } •
LCOM = |P| - \Q\, if |P| > \Q\
= 0 otherwise.
19
Reproduced with permission of the copyright owner. Further reproduction prohibited without permission.
LCOM is the number of disjoint sets formed by the intersection of the n sets. It
provides a measure for disparate nature of methods in the class and may help identify
flaws of the design process. Few disjoint sets means great similarity of methods. The
larger the number of similar methods, the more cohesive the class. LCOM satisfies
properties 1,23,5 but not properties 4 and 6.
Empirical data shows that at least 50% of classes for both companies have
cohesive methods.
Failure of all Chidamber and Kemerer metrics to satisfy property 6, i.e.
interaction increases complexity) implies that dividing a class into more classes could
increase a complexity metric.
The implementation independence of these metrics was demonstrated through the
empirical data from both C++ and Smalltalk environments.
In addition to Chidamber and Kemerer metrics, Li and Henry, [Li93], proposed
an additional OO metric, namely coupling through inheritance, which uses DIT and
NOC.
Coupling through Message Passing (MPQ.
MPC = number of send statements defined in a class.
MPC measures the complexity of message passing among classes.
Coupling thru abstract data types (DAC).
DAC = number of ADTs defined in the class.
A class is an implementation of an ADT [Hen92]. A larger DAC means the more
complex the coupling of the class with other classes.
20
Reproduced with permission of the copyright owner. Further reproduction prohibited without permission.
Number of Local Methods (NOM).
NOM = number of local methods.
NOM is a measure of the interface of a class. A larger NOM means that the
class's interface is more complex.
Size Metrics (SIZE1 and SIZE2).
SIZE1 = number of semicolons in a class.
SIZE2 = number of attributes + number of local methods.
SIZE1 is the traditional lines of code (LOQ metric while SJZE2 measures the
number of properties defined in a class.
Tegarden [Teg95] slightly modified the definition of MPC and called it fan-in
and fan-out
Fan-In
Fan-In = number of unique messages sent from all other objects to the object
Fan-Out
Fan-Out = number of unique messages that the object sends to all other objects
Chung [Chu92] defined coupling of a method to be the sum of input and output
coupling. Class complexity was defined as the sum of complexity of its component
methods.
In Section 2.1.2, system level metrics are described.
2.1.2 System Level M etrics
Kolowe, [Kol93] classified NOC as a system-level metric. In addition to NOC,
he proposed three system level metrics namely, number of class hierarchies, number of
class cluster, and association complexity.
21
Reproduced with permission of the copyright owner. Further reproduction prohibited without permission.

Number of Class Hierarchies (NCH).
NCH simply counts the number of fundamental clusters of concepts that the
system deals with.
Number of Class Ousters (NCC).
NCC = number of disjoint sets formed by the intersection of the sets of classes
associated with each class.
Association Complexity (AC).
AC - A - C + 2 P where
A = number of associations in the class diagram.
C = number of classes in the class diagram.
P = number of disconnected parts in the class diagram.
Kolewe found that class coupling and response for a class are seemingly useful in
predicting high defect rates. He also claims that AC is analogous to McCabe's metric. He
argued that system level metrics are less useful due to insufficient OO systems with
which to compare the metric values. It will be hard to say whether a system is too
complex.
Section 2.1.3 discusses three dependency metrics: afferent coupling, efferent
coupling, and instability.
2.13 Dependency Metrics Within Groups of Classes
Martin [Mar95] proposed three dependency metrics applicable to a class
category. A class category is a group of highly cohesive classes.
22
Reproduced with permission of the copyright owner. Further reproduction prohibited without permission.
Afferent Coupling (Ca).
Ca = number of classes outside this category that depend upon classes within the
category.
Efferent Coupling (Ce).
Ce = number of classes outside this category that are depended upon by classes
within this category.
Instability (I).
/= C e /(C a + C e )
1 = 0 indicates a maximally stable category while 1 = 1 indicates a maximally
unstable category.
The following design guidelines given by McGregor and Sykes [McG92], relate
to quality of a class design:
1) Information hiding: The only members of the public interface of a class
should be the methods of the class.
2) Limitations on messages: A class should not expose its implementation
details, even through public accessor operations.
3) Narrow interfaces: An operator should be a member of the public class
interface if and only if it is to be available to users of instances of the
class.
4) Strong cohesion: Each operator that belongs to a class either accesses or
modifies some of the data of a class.
5) Weak coupling: A class should be dependent on as few other classes as
possible.
23
Reproduced with permission of the copyright owner. Further reproduction prohibited without permission.

6) Explicit information passing: The interaction between two classes should
involve only explicit information passing.
7) Subclassing as subtyping: Each subclass should be developed as a
specialization of the superclass with the public interface of the superclass
becoming a subset of the public interface of the subclass. Inheritance
should be used for defining subtype relationships. Inheritance should not
be used when client-server relationship between two classes is more
appropriate.
Shepperd and Ince [She93] observed that the evaluation criteria of OOP design
guidelines tend to be qualitative and subjective.
Barnes and Swim [Bai93] believe that existing reusable software components of
high quality can be used to rapidly produce quality software. They proposed a quality
object-oriented language (QOOL) that enables the inheritance of software metrics. The
object-oriented programming (OOP) class concept is extended to include methods to
evaluate, variables to retain, how well classes are designed and implemented and how
well they perform. QOOL includes goal-based, syntax-based and execution-based
metrics. Its major advantage is touted to be as a reduction in the burden of measurement
through inheritance and automation. They developed a QOOL integrated programming
support environment (IPSE) in Actor 3.0, named ActQOOL. This prototype gathers
syntax-based metrics from a class, namely the number of messages to self as opposed to
other objects; number of methods; number of instance variables; average, maximum and
minimum V(G) per method; average, minimum, maximum variables per method;
Halstead vocabulary, program level, intelligent content; number of lines of code; and
24
Reproduced with permission of the copyright owner. Further reproduction prohibited without permission.
number of local variables. They believe that QOOL can be helpful with reuse decisions.
Syntax-based metrics can be used as a first-pass evaluation of candidate classes. QOOL
can also be used throughout the software product lifecycle. It can identify trouble areas
and software failures immediately.
Barnes and Swim claim that more work is needed at the conceptual, empirical
and implementation levels to evaluate QOOL. It is the conceptual work of further
specifying quality metrics that helps to motivate this research.
LaLonde and Pugh, [LaL94], showed that many static OO metrics can be
generated easily from the Smalltalk image including:
1) System queries: total classes without super classes; total classes; total
methods; average (avg) instance variables per class; avg instance
variables per concrete class; avg width of classes with subclasses; avg
class height; avg lines per method; avg comment lines per method; avg
code lines per method; avg methods per class; avg inherited methods per
class; avg inherited methods excluding object methods; avg refined
methods per class; avg new methods per class; avg reused methods per
class.
2) Library queries: avg lines per method; avg code lines per method;avg
comment lines per method.
3) Class queries: avg lines per method; avg code lines per method;avg
comment lines per method.
The research need for statistically and scientifically validated OO metrics can no
longer be ignored. For OOP to reach maturity like traditional engineering disciplines, it
25
Reproduced with permission of the copyright owner. Further reproduction prohibited without permission.
must have a set of standardized, precise and statistically validated metrics. Metrics for
Object Oriented Software Engineering (MOOSE) as proposed in [Chi94] are said to be
the most used suite of measurements for OO software (OOPSLA, 1993). MOOSE
metrics were evaluated using Weyuker's six properties. Empirical data were also
collected but were not validated. Also, MOOSE has never been empirically validated
using reusability as the quality factor, hi this research, we empirically validate a subset
of MOOSE and other OO metrics using reusability as the quality factor. As MOOSE
metrics begin to show strong empirical validity, there is a need to statistically validate
them and to investigate their use to predict reusability.
22 Related Studies
22.1 Fonash
Fonash [Fon93] collected static metrics from 284 Ada software modules using an
Ada Static Source Code Analyzer Program. Among the metrics collected were: McCabe
complexity, Halstead volume, number of source lines, number of Ada statements, type of
module, number of comment lines, ratio of number of comment lines and number of
source lines, maximum nesting, number of formal parameters, number of call statements,
generic type declaration, generic function parameters, and number of data types. Three
categories of code were evaluated: code reused without modification, code reused after
extensive modification (i.e. greater than 25% of the code was modified), and code for
new application. The goal of the log-linear statistical analysis performed was to
determine if there exists significant differences in the collected measures among the three
reuse categories. Number of lines of comments, average program nesting, number of
formal parameters, generic function specification, number of call statements, number of
26
Reproduced with permission of the copyright owner. Further reproduction prohibited without permission.

with statements, ratio of number of with and number of procedures and functions, and
number of data types, differed significantly between the code reused without
modification and reused after extensive modification categories. Fifteen measures (eg.
McCabe complexity, Halstead volume, number of Ada statements, number of data types
and formal parameters per module sub-components) had significant differences between
the code reused without modification and the code new for application categories.
Fonash collected metrics on Ada modules. Ada is an object-based language.
Moreover, reuse was defined in terms of modified code. hi contrast, this research
collects class metrics from Smalltalk. Reuse is defined in terms of OO concepts, such as
inheritance and extensibility.
2J2J2 K arunanithi and Bieman
Karunanithi and Bieman [Kar93] listed reuse measures for object-oriented
systems from three perspectives: client, server, and system. When a module M uses a
program unit P, M is a client and P is a server. The client perspective is the perspective
of a new system or a new component. It focuses on how a new class reuses existing
components. On the other hand, the server perspective is the perspective from the library
component’s point of view. The analysis focuses on how the entity is reused by other
program entities. The system perspective is a view of reuse in the overall system,
including servers and clients. Examples of reuse from a server perspective are: number
of direct clients, number of indirect clients, size of server interface, number of direct
client invocations of server, and number of paths to indirect clients. No statistical
validation of the proposed measures was given.
27
Reproduced with permission of the copyright owner. Further reproduction prohibited without permission.

2 2 3 Li and Henry
Li and Henry, [093] concluded that there is a strong relationship between
metrics and maintenance effort in OO systems. Maintenance effort was defined as the
number of lines changed per class in its maintenance history. They used two commercial
software products, UIMS (User Interface System) and QUES (QUality Evaluation
System). Both were designed and developed using Classic-ADA. They used
multivariate statistical analysis as a tool to arrive at their conclusions. Moreover,
maintenance effort can be predicted from combinations of DIT, NOC, MPC, RFC,
LCOM, DAC, WMC, NOM. These results were successfully cross-validated.
Li and Henry [Li93] used an OO dialect of Ada, least-squares regression and
number of changes in components as dependent variable to study maintainability. We
use VisuaLAge for Smalltalk, least-squares regression, and reusability as dependent
variable.
22.4 Basili et al.
[Bas96] empirically assessed whether the OO design metrics presented in [Chi93]
can be used to predict the probability o f detecting fault-prone classes. Data were
collected from eight management and information systems projects developed in a
university setting using an 0 0 analysis and design method, C++ programming language,
GNU software development environment, and OSF/Motif, Sparc Sun stations. For each
of the 180 classes across the eight systems, OO design metrics were collected using
GEN++, a customizable language independent code analyzer. The response variable is
binary, i.e. was a fault detected in a class during testing phases? A logistic regression
28
Reproduced with permission of the copyright owner. Further reproduction prohibited without permission.

was used to analyze the relationship between metrics and the fault-proneness of classes.
Their findings were:
1. The larger the WMC, the larger the probability of fault detection. For graphical user
interfaces classes, new, and extensively modified classes, the results were more
significant.
2. The larger the DIT, the larger the probability of fault detection. Results were more
significant when new and extensively modified classes were considered.
3. The larger the RFC, the larger the probability of fault detection.
4. The larger the NOC, the lower the probability of fault detection. They explained this
result by the combined facts that most classes do not have more than one child, and
that verbatim reused classes are somewhat associated with a large NOC. hi
[BasB96], the authors observed that reuse has a significant negative factor on fault
density, i.e. the higher the number of times a class has been reused, the lower is the
class’ fault density, explaining why large NOC classes are less fault prone.
5. LCOM was found to be insignificant in all classes.
6. CBO is significant, more particularly so for graphical user interface classes.
[Bas96] performed multivariate logistic regression with classification threshold =
0.5. Classes predicted as faulty contain a large number of faults. Results show that OO
metrics are useful predictors of fault-proneness.
Lastly, Basili et al. stated that the code metrics maximum level nesting in a class,
number of function declarations, and number of function calls appear to be somewhat
poorer predictors of class fault-proneness. Code metrics can only be collected after the
29
Reproduced with permission of the copyright owner. Further reproduction prohibited without permission.

code is written, while design metrics can be collected early in the software development
life cycle.
The preceding study differs with the research described in this dissertation in the
following ways: programming language used to collect metrics (C++ vs. Smalltalk),
dependent variable used (fault-proneness vs. reusability) and statistical analysis
employed Oogistic regression vs. linear regression). Table 2.1 summarizes the studies.
Table 2.1. Comparison of reuse and metrics studies.ProgrammingLanguage
Dependent Variable Statistical Analysis
Fonash[93] Ada Reusability Log-linearKarunanithi and Bieman[Kar93]
Any OO language None None
Li and Henry[Li93] Classic-ADA Maintainability Least squares linear regression
Basili et al.[Bas96] C++ Fault-proneness Logistic regressionReyes and Carver Smalltalk Reusability Least squares linear
regression.
In Chapter 3, we present the metrics used in this research and the tool used to
collect the metrics. We also define the reuse measures, data, and the statistical analysis
used in the research.
30
Reproduced with permission of the copyright owner. Further reproduction prohibited without permission.

Chapter 3. Materials and Methods
The purpose of this work was to assess the value of a set of metrics to measure
reuse potential. We identified a set of twenty metrics, listed in Figure 3.1, to characterize
Smalltalk classes. We identified statistical techniques to measure the goodness of the
metrics to predict reuse. Section 3.1 defines the set of metrics, and Section 3.2 describes
the tool used to extract these metrics. Section 3.3 defines the reuse measures. Finally in
Section 3.4, we present the data and discuss the statatistical analysis of that data.
Appendix A lists the glossary of terms used in this research.
3.1 Metrics Extracted
In order to investigate reuse potential, we computed 20 metrics. These 20 metrics
were chosen because they are representative of metrics found in object-oriented and
metric literature [Bar93], [Chi94], [Hen96], [Ii93], [Lot94], [McC94], [Teg95], they
are potential indicators whether a class is reusable or not, or they were computable using
the metaclass Class of VisuaLAge for Smalltalk, hi each of the following metric
definitions, C represents a class.
• Number of direct subclasses (NDSub)
NDSub(C) = number of immediate children of Cin the Smalltalk image[Chi94] (3.1)
Smalltalk image is defined as:
“ Smalltalk file that provides a development environment on an individual workstation. An image contains object instances, classes, and methods. It must be loaded into the Smalltalk virtual machine in order to run [VAG95]”
A large NDSub may indicate reuse potential through inheritance.
31
Reproduced with permission of the copyright owner. Further reproduction prohibited without permission.

Metric AbbreviationNumber of direct subclasses NDSubNumber of all subclasses NSubNumber of methods NOMNumber of instance methods NIMNumber of class variables NCVNumber of instance variables NIVNumber of class method categories NCMCNumber of instance method categories NIMCNumber of all superclasses NsupCyclomatic complexity CycCNumber of public methods NpubMNumber of private methods NpriMClass coupling CCReuse ratio USpecialization ratio SLines of code LOCNumber of statements NOSLorenz complexity LCNumber of message sends NMSNumber of parameters NPFigure 3.1. Object-oriented metrics.
32
Reproduced with permission of the copyright owner. Further reproduction prohibited without permission.

• Number of all subclasses (NSub)
NSub(C) = number of C s children in the Smalltalk imageup to the leaves (3.2)
A large NSub may indicate reuse potential through inheritance.
• Number of methods (NOM)
NOM(C) - number of instance methods of C + number of class methods of C (33)
In Smalltalk, an instance method provides behavior for a particular instance of a
class and a class method provides behavior for a class. Ways to create instances of a class
are usually defined in class methods [VAR95]. Li and Henry [Li93] categorized NOM as
an interface metric.
• Number of instance methods (NIM)
NIM(C) = number of public and private instance methods of C. (3.4)
NIM is related to the amount of collaboration being used. Large NIM may
indicate that C is complex and hard to maintain. Small NIM may be indicative that C is
reusable since C provides a set of cohesive services instead of a mixed set of capabilities
[Lor94]
• Number of class variables (NCV)
Class variables are data that are shared by the instance and class methods of the
defining class, together with its subclasses. They can be viewed as localized globals that
provide common objects to instances of a class. A low NCV may indicate that much of
the work is done by instances, which is [Lor94]’s recommendation.
NCV(C) = number of class variables of C. (3.5)
33
Reproduced with permission of the copyright owner. Further reproduction prohibited without permission.

• Number of instance variables (NTV)
NIV(C) - number of instance variables of C (3.6)
Instance variables are private data that can be accessed only by instance methods
of the defining class and its subclasses. They provide a mechanism for sharing
information among methods [Smi90]. NIV may be used as a size measure for a class. A
large NIV may indicate that C is coupled with other objects in the system and thus,
reduce reuse [Lor94].
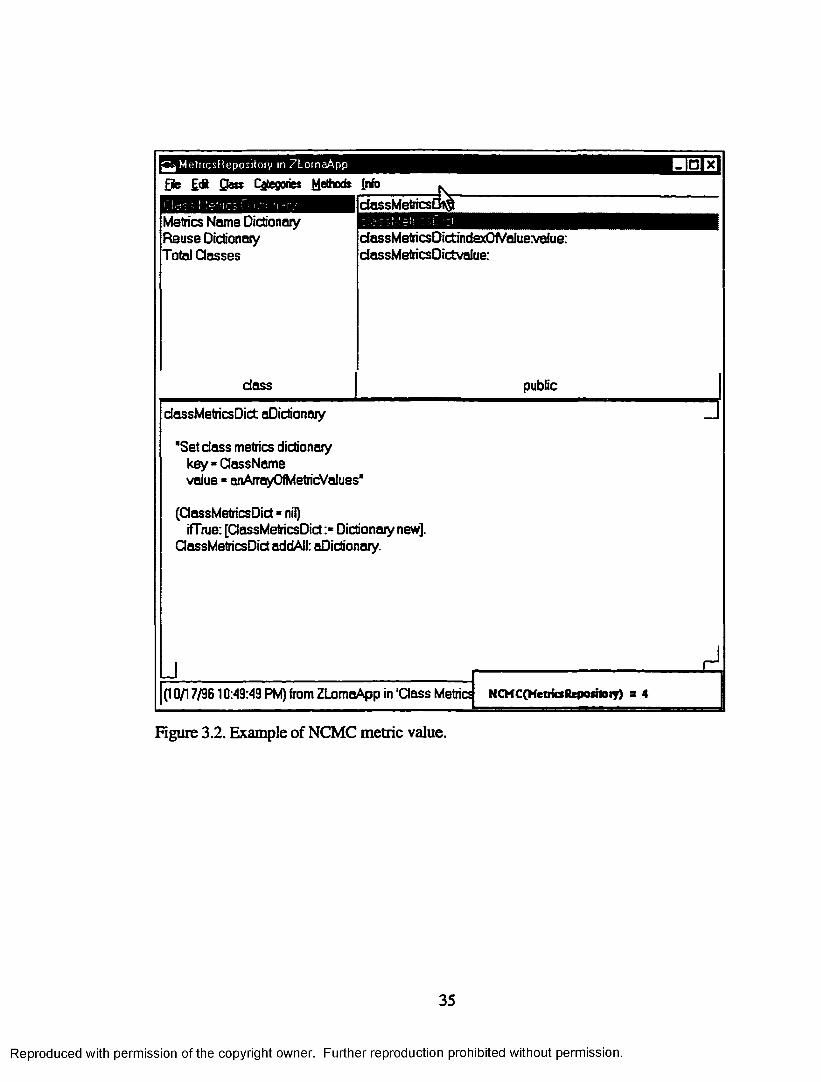
• Number of class method categories (NCMC)
NCMC(C) = number of categories among the class methods of C. (3.7)
In VisualAge for Smalltalk, a category is a logical association of a group of
methods within a class, with a name assigned by the class developer. For example, the
NCMC value of class MetricsRepository in Figure 3.2 is 4.
• Number of instance method categories (NIMQ
NIMC(C) = number of categories among the instance methods of C. (3.8)
For example, the NIMC value of class Metric in Figure 3.3 is 5
• Number of all superclasses (NSup)
NSup(C) = number of superclasses of C up to the Object root class (3.9)
The greater number of superclasses a class has, the greater number of methods it
is likely to inherit The greater the number of inherited methods, the more complex it is
to predict its behavior [Chi94].
34
Reproduced with permission of the copyright owner. Further reproduction prohibited without permission.
, M e t n cs R ep os i t o i y in Z L o m a A p p
£fe £dit £ la » Categories Methods InfoBSD
Metrics Nome Dictionary Reuse Oictionaiy Total Classes
dassMetncs
dassMetricsDictindexOfValuevalue:dassMetricsDictvalue:
dass public
dassMetricsDict aDidionaiy
"Set dass metrics didionaiy key- ClassName value « anArrayOfMetricValues'
(ClassMetricsDid « nil) iff rue: [ClassMetricsDid:* Didionaiy new].
ClassMetricsDid addAII: aDidionaiy.
u(10/17/9610:49:49 PM) from ZLomaApp in ’Class Metrics NCWC(MetriaRepoihonr) = 4
A
Figure 3.2. Example of NCMC metric value.
35
Reproduced with permission of the copyright owner. Further reproduction prohibited without permission.
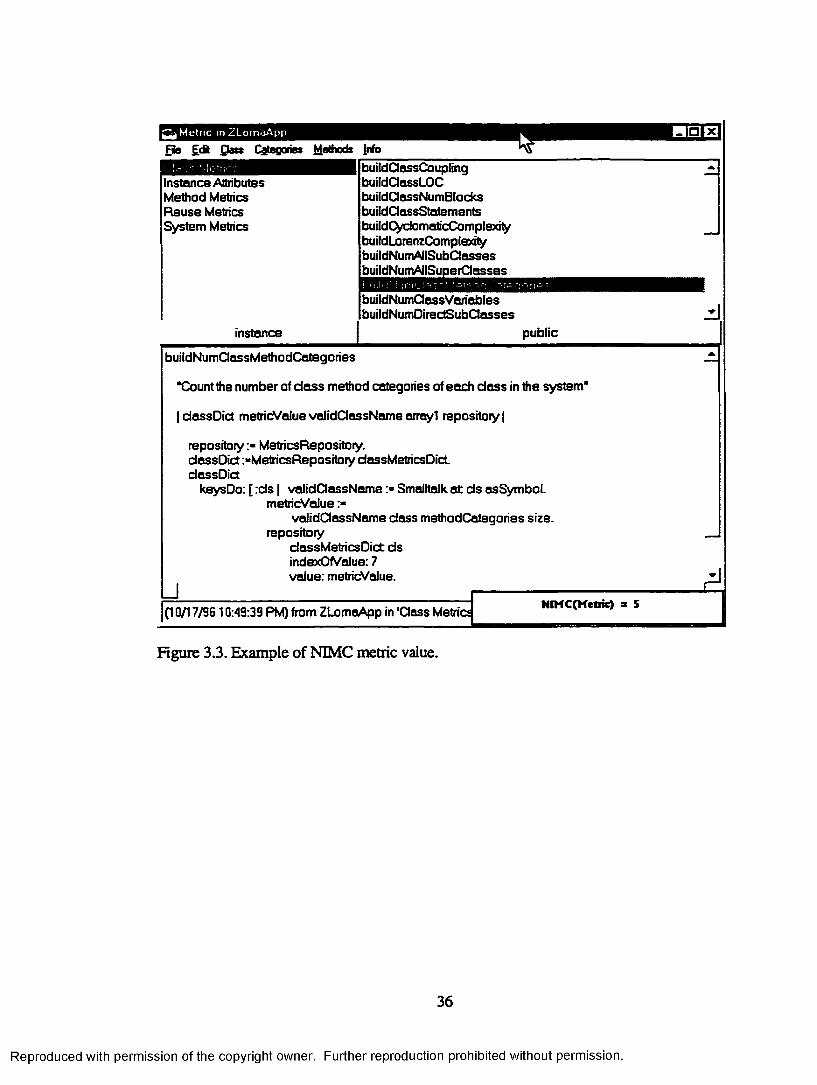
M e tn c in Z L o m a A p p
Fie £ d t £hss Categories Method* [nibH H O
Instance Attributes Method Metrics Reuse Metrics System Metrics
instance
buildClassCouplingbuildClassLOCbuildCJassNumBlocksbuildClassStatementsbuildCydomalicComplewtybuildLorenzComplexilybuildNumAIISubClasses
buildNumClassVariablesbuildNumOirectSubCtasses
public
buildNumClassMethodCategories
"Count the number of d ass method categories of each dass in the system"
IdassDid metricValue validClassName arrayl repositoiy|
repository :■ MetricsRepositoty.dassOict :»Metrics Repository dassMetricsOictdassOict
keysDo: [ :ds | validClassName:« Smalltalk at ds asSymbol. metricValue
validClassName dass methodCalegories size, repository
dassMetricsOict ds indexOf/aiue: 7 value: metricValue.u
(10/17/9610:49:39 PM) from ZLomaApp in 'Class Metric:A
NIMC (Metric) s 5
Figure 3.3. Example of NIMC metric value.
36
Reproduced with permission of the copyright owner. Further reproduction prohibited without permission.

• Cyclomatic complexity (CycQ
Let C be a class with n methods m/, m2, m3,. ..jn n. Let et - number of exit points
in mi.
CycC(Q = £ [ ( a -1 ) + 2] (31°)1=1
CycC, which is related to control flow complexity, was initially used for the
traditional programming paradigm. The difficulty in understanding a program is related
to the number of loops, jumps, and selections a program contains [She93].
CycC is similar to the weighted methods per class (WMC) metric defined in
[Chi91] and [Chi94]. Redundant code in software systems should be eliminated to
facilitate reuse. McCabe states [McC94]:
“It’s definitely to our advantage to locate and eliminate redundant code, so that we can increase the amount of reuse and reduce total complexity of our software.”
An observation exists that independent implementations of the same functionality
tend to have the similar control flow structure [McC94].
• Number of public methods (NPubM)
NPubM(C) = number of public methods of class C. (3.11)
In VisualAge and IBM Smalltalk, declaring a method as public is a designation
that application developers can use to indicate that a method is part of the programming
interface of the application they are developing.
Public methods are services available to other classes. This metric may indicate
the amount of services being used by other classes, and hence is a good measure of the
responsibility of a class [Lor94].
37
Reproduced with permission of the copyright owner. Further reproduction prohibited without permission.
• Number of private methods (NPriM)
NPriMf C) = number of private methods of a class. (3.12)
hi VisualAge and IBM Smalltalk, declaring a method as private is a designation that
application developers can use to indicate that a method is only for internal use within the
application they are developing.
• Class coupIing(CC)
Coupling between classes measures the interrelationships or dependencies that
bind classes together. Message connection between classes is one of the forms of
coupling[Lor94]. A class is coupled to another class if it calls methods of that class.
CC(C) = number of classes called by methods of class C (3.13)
Since Smalltalk is an untyped language, class coupling can only be inferred from
message names. The calculation takes all messages sent by methods of a class. The
following assumptions are made:
- Message names that have local (super/sub/self) implementation are assumed to be sent
to the receiver class and are therefore ignored for coupling calculation.
- Messages that have more than one implementing class:
- If the classes have a parent-child relationship, the coupling is assumed
to be with the parent.
- If the classes do not have a parent-child relationship, the coupling is assumed
to be with both classes.
-If there is any direct reference to a class, include it as a coupled class. [OTI96].
This definition counts inheritance and non-inheritance couples. Li constructing
independent modules, class coupling should be minimized [Hen96]. The class/superclass
38
Reproduced with permission of the copyright owner. Further reproduction prohibited without permission.

relationship on the other hand inherently increases coupling [Boo94]. [Loi94] claimed
that reuse encourages lower level of coupling and inheritance encourages higher levels of
coupling.
• Reuse ratio (U)
U(C) = number of C s superclasses
/total number of classes in C s hierarchy. (3.14)
A value close to 1 is characteristic of linear hierarchy and a value close to 0
indicates a shallow depth and a large number of leaf classes [Hen96], U can be classified
as a measure of potential reuse.
• Specialization ratio (S)
S(C) = number of subclasses / number of superclasses. (3.15)
S measures the extent to which a superclass has captured the abstraction since a
large value of S indicates a high degree of subclassing [Hen96]..
• Lines of Code(LOC)
LOC(C) = number of physical lines of code ignoring comments. (3.16)
LOC is not a new metric. Its basis is program length which has been used as a
predictor of program characteristics such as reliability and ease of maintenance [She93].
Metric studies in the traditional programming paradigm have used LOC as a baseline for
evaluation [Alb83;She93]. As a baseline, it is expected that an effective code metric will
perform better than LOC [She93]. LOC was included in this study in part because
project data is available on this metric [Lor94]. This metric does not take into account
coding style, and hence is a relatively suspect measure [Lor94].
• Number of Statements (NOS)
NOS(C) - number of statements in a class. (3.17)
39
Reproduced with permission of the copyright owner. Further reproduction prohibited without permission.

A statement is defined by:
- Unary, binary or keyword messages
- Assignments.
- Cascade expressions.
- Messages sent (including the return expressions).
NOS is a relatively unbiased method size measure. A large NOS may be
indicative of function-oriented coding style. On the other hand, a small NOS may
indicate that the class is requesting services, i.e. reusing, from other classes[Lor94],
• Lorenz Complexity (LC)
Lorenz complexity is a method measure that finds the complexity of a method
based on weighted attributes of the method [Lor94].
Application Program Interface(API) calls 5.0
Assignments 0.5
Binary expressions 2.0
Keyword messages 3.0
Nested expressions 0.3
[Lor94] proposed this complexity measurement arguing that traditional
complexity measures like McCabe’s cyclomatic complexity are less useful in OO code.
Traditional complexity measures focus on factors like number of decision points in the
code of a function, which are from IF-THEN-ELSE constructs. Well-designed OO code
on the other hand, has fewer IF statements and no case statements. A complexity
measurement is based on the number and types of messages was thus proposed.
40
Reproduced with permission of the copyright owner. Further reproduction prohibited without permission.

The LC method measure was extended to the class level by summing LC method
measure values for each method in the class. Let C be a class with n methods m j, m2 ,
m3 ,.. .jn n. Let lei = Lorenz complexity of m,.
A (3.18)LC(C) = X /c ,
LC is again similar to the weighted methods per class (WftfQmetric in [Chi91] and
[Chi94].
• Number of message sends (NMS)
Let C be a class with n methods mu m2, m3 ,...^n„. Let j, = number of message
sends in m,.
N M S (0 = 2 * (3-19)i-l
This type of coupling through message passing metric was proposed in [Li93]. hi
Smalltalk, a message send is a channel of communication from one object to another that
asks the receiving object to execute a method. Much of the communication among
objects will occur by sending messages, if classes are properly designed [Smi90]. NMS
is a relatively unbiased method size measure [Lor94],
• Number of parameters (NP)
Let C be a class with n methods mu m2, m3 ,...jn n• Let a, = number of
parameters in m,.
N P ( Q = '2 t ai (3-20)1=1
41
Reproduced with permission of the copyright owner. Further reproduction prohibited without permission.
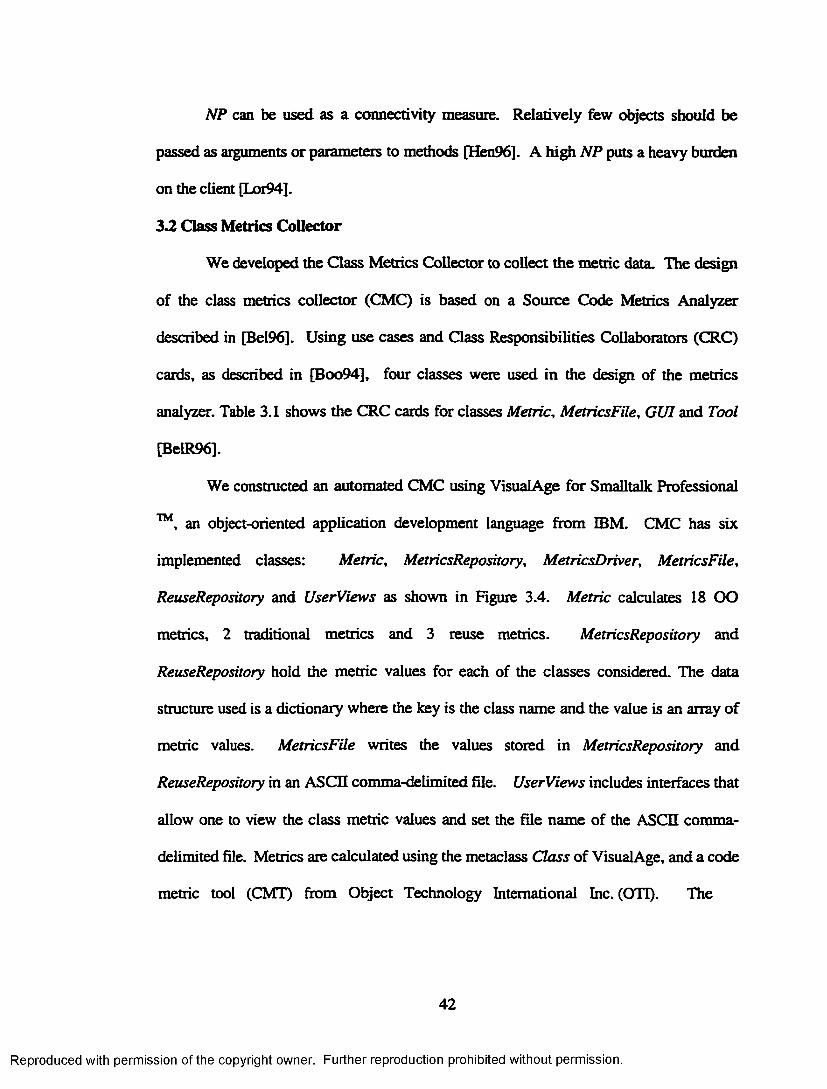
NP can be used as a connectivity measure. Relatively few objects should be
passed as arguments or parameters to methods [Hen96]. A high NP puts a heavy burden
on the client [Lor94],
3.2 Class Metrics Collector
We developed the Class Metrics Collector to collect the metric data The design
of the class metrics collector (CMC) is based on a Source Code Metrics Analyzer
described in [Bel96]. Using use cases and Class Responsibilities Collaborators (CRC)
cards, as described in [Boo94], four classes were used in the design of the metrics
analyzer. Table 3.1 shows the CRC cards for classes M etric, M etricsFile, GUI and Tool
[BelR96].
We constructed an automated CMC using VisualAge for Smalltalk Professional
™, an object-oriented application development language from IBM. CMC has six
implemented classes: M etric, MetricsRepository, M etricsDriver, M etricsFile,
ReuseRepository and UserViews as shown in Figure 3.4. M etric calculates 18 OO
metrics, 2 traditional metrics and 3 reuse metrics. MetricsRepository and
ReuseRepository hold the metric values for each of the classes considered. The data
structure used is a dictionary where the key is the class name and the value is an array of
metric values. M etricsFile writes the values stored in MetricsRepository and
ReuseRepository in an ASCII comma-delimited file. UserViews includes interfaces that
allow one to view the class metric values and set the file name of the ASCII comma-
delimited file. Metrics are calculated using the metaclass Class of VisualAge, and a code
metric tool (CMT) from Object Technology International Inc. (OTI). The
42
Reproduced with permission of the copyright owner. Further reproduction prohibited without permission.

Table 3.1. CRC cards used to design a metric analyzer.
MetricResponsibilities Collaboratorsknows its valueknows its threshold MetricsFileknows its descriptionknows its journal_jefgets value Classknows its kind (system, class, method)sets thresholds MetricsFileMetricsFileResponsibilities Collaboratorsknows filename of Smalltalk code GUIknows filename of metric thresholds GUIretrieves Smalltalk code FilelOretrieves results GUIretrieves metric thresholds FilelOsaves metric thresholds Metric, FilelOsaves metric values Metric, FilelOToolResponsibilities Collaboratorsknows views chosen (exemptions, details, all) GUIknows if counting external methods GUIknows quality indicator type (smiley, traffic light)
GUI
analyzes MetricsFile, Metricmodifies thresholds Metricknows all possible metrics, initialize MetricsFileGUIResponsibilities Collaboratorsstarts tool Toolselects file User, FilelO, MetricsFileTells tool to analyze Tooldisplays results Metric, Tool, MetricsFilesets view User, Toolgets values Usersaves MetricsFileprints FilelOexits
43
Reproduced with permission of the copyright owner. Further reproduction prohibited without permission.
Figure 3.4. CMC classes.
44
Reproduced with permission of the copyright owner. Further reproduction prohibited without permission.

CMT from OTI is linked to CMC to compute cyclomatic complexity, class coupling,
lines of code, number of statements and Lorenz complexity. Fifteen metrics and three
reuse metrics are computed using methods from the metaclass Class. A metaclass is "the
class of a class; or a class whose instances are themselves classes” [Boo94],
Figure 3.5 shows a user interface view of the automated CMC. The list box
labeled Classes holds the 2029 implemented classes. The text box at the top labeled
Application is the application where the highlighted class is defined. For example, the
Collection class is defined in the CLDT (Common Language Data Type) application. The
container with two columns labeled M etric Name and Value holds the metric names and
values of the highlighted class from the Classes list box. For example, the class
Collection has the following metric values: NumAllSuperclasses — 1; NumPublicMethods
- 34; ReuseRatio = 0.02. Moreover, the text box labeled Total # o f Classes is the size of
the classes list box. A dictionary inspector will be shown if the button labeled Show
Class Dictionary is pushed. A dictionary inspector shows the key-value pairs of a given
dictionary. In this case, the dictionary inspector will show the class name - metric value
pairs. The file pull-down menu enables the user to save the metrics to an ASCII comma-
delimited text so that it can be imported to MS Excel and Statistical Analysis System
version 6.07 for regression and data analysis.
Figure 3.6 shows a portion of the saved metrics file where the first column is the class
name, the next 20 columns are the metric values, and the last 3 columns are the values for
the three proposed reuse measures.
45
Reproduced with permission of the copyright owner. Further reproduction prohibited without permission.

• Cl a s se s In T h e I mage
Fie
Application
Classes
CollapseRule A
CommonExtendedWidgetsCommonFiieSystemCommonGraphicsCommonPrintingCammonPrintingEnuilatedPlatforCommonPrintingWinCommonWidgetsCompiledMethodCompilerErrorContextCoreCPMCwAcceleratorryAiwjr^iik^f'irn^ij
> f
Total t of Classes 2.029
CLDT
Metric Name Value ±
CydomaticComplexity 18.00NumPublicMethods 34.00NumPrivateMethods 34.00ClassCoupling 104.00ReuseRatio 0.02SpecializationRab'o 47.00ClassLOC 160.00ClassStatements 267.00LorenzComplexity 515.30 _NumMessageSends 174.00NumParameters<
43.00 Z.2J
Show Method Metrics
Show Class Dictionary
Figure 3.5. A user interface view of our automated class metrics collector.
H0 Q
46
Reproduced with permission of the copyright owner. Further reproduction prohibited without permission.

Reproduced
with perm
ission of the
copyright ow
ner. Further
reproduction prohibited
without
permission.
ClassName, NDSub, NSub, NOM, NIM.NCV, NIV, NCMC, NIMC, NSup, CycC, NPubM, NPriM, CC, U, S, LOC,NOS, LC, NMS, NPArray,2,2,11,9,0,0,2,5,4,17,10,1,57,0.08,0.5,30,51,123,38,14,30,3,1475An-ayedCollection,4,10,34,30,0,0,1,4,3,11,22,12,23,0.06,3.333,129,249,473.7,136,37,325,1,0Association,1,1,20,18,0,2,2,5,2,7,15,5,79,0.125,0.5,52,100,164.4,45,16,21,3,116Bag,0,0,15,11,0,1,4,2,2,3,11,4,0,0.04,0,23,38,67.7,23,9,0,0,2Behavior,1,7,284,282,0,9,2,14,1,47,103,181,227,0.111,7,957,1568,2812.3,836,200,685427,13,13 Block,3,4,29,28,0,0,1,6,1,25,20,9,36,0.167,4,117,211,429.2,127,60,124,3,1Figure 3.6 An ASCII comma delimited saved metrics file that can be imported to MS Excel or SAS 6.07.

33 Raise Measures
In this section, we define three class-level reuse metrics are defined: inheritance-
based reuse (Rlnherit), inter-application reuse by extension (RExt) and inter-application
reuse as a server (RServ). These measures are based on reuse approaches discussed in
object-oriented literature [McG92], [Nie92], [Kar93].
33.1 Inheritance-based reuse (R lnherit)
Proponents of OOP claim that inheritance is a great tool for software reuse.
Subclasses naturally inherit behavior in the form of methods[Lor94]. hi [Smi90]:
“Using inheritance, a programmer can define a system of classes, or user- defined data types, wherein it is convenient to define subsequent classes in terms of their similarities to (and differences from) existing classes. In this manner, existing source code can be reused by deriving new classes that accommodate changes in the application.”
Let C be a class, B be a container for overridden methods of C, and |£| be the
number of elements in B. If method m, of C is overridden in three subclasses of C, m,-
will appear three times in B. Then,
RInheritfC) = NOM(C) * NSub(C) - 15|. (3.21)
This reuse measure is referred to as potential reuse. For example, in Figure 3.7,
Rlnherit(ClassW) = NOM(ClassW) * NSub(ClassW) - 12?|
4 * 3 - 0
12
The rationale behind equation (3.21) is that C s methods are also methods of each
of the subclasses of C by virtue of inheritance, hi the preceding example, the methods
<, >, <=, >= of class ClassW are ‘reused’ 12 times. To illustrate the case
48
Reproduced with permission of the copyright owner. Further reproduction prohibited without permission.

Inheritance-based Reuse (Rlnherit)
OassX
QassZ
QassW
ngure 3.7. Example of inheritance-based reuse where no methods are overridden.
49
Reproduced with permission of the copyright owner. Further reproduction prohibited without permission.
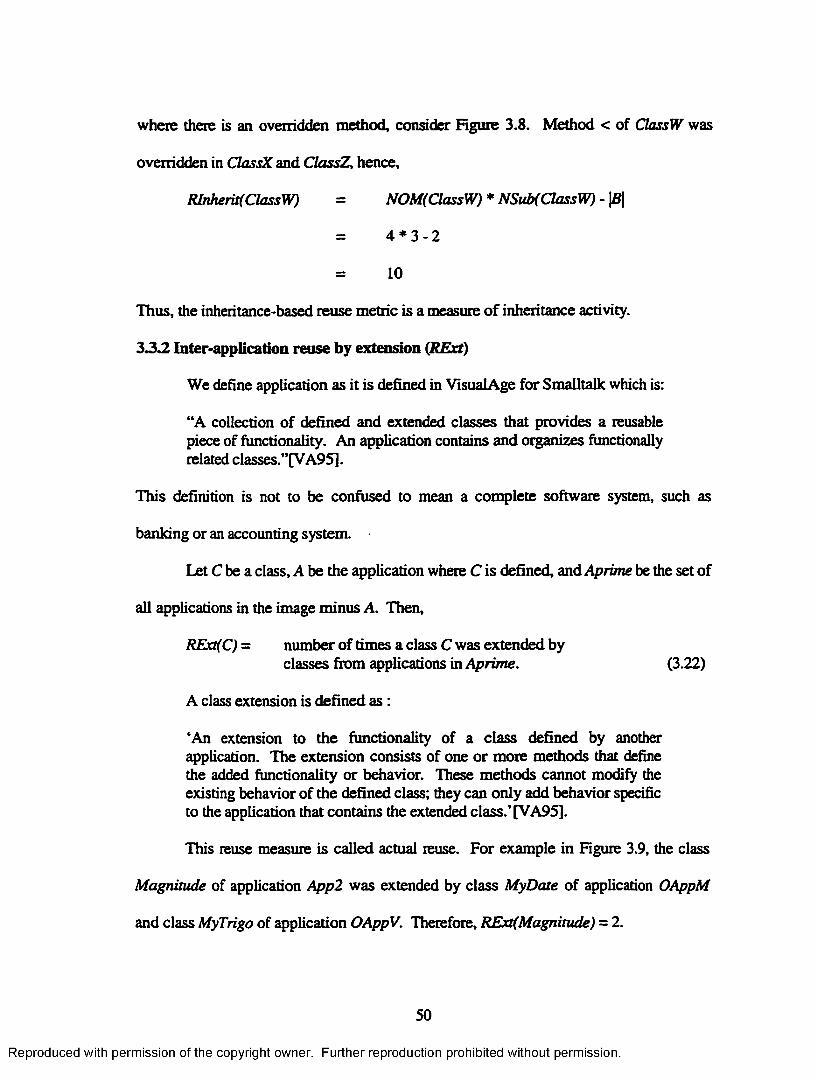
where there is an overridden method, consider Figure 3.8. Method < of ClassW was
overridden in ClassX and ClassZ, hence,
RInheritfClassW) — NOM(ClassW) * NSub(ClassW) - |B|
4 * 3 - 2
10
Thus, the inheritance-based reuse metric is a measure o f inheritance activity.
3.3.2 Inter-application reuse by extension (RExt)
We define application as it is defined in VisualAge for Smalltalk which is:
“A collection of defined and extended classes that provides a reusable piece of functionality. An application contains and organizes functionally related classes.”[VA95].
This definition is not to be confused to mean a complete software system, such as
banking or an accounting system.
Let C be a class, A be the application where C is defined, and Aprime be the set of
all applications in the image minus A. Then,
RExt(C) = number of times a class C was extended byclasses from applications in Aprime. (3.22)
A class extension is defined as :
‘An extension to the functionality of a class defined by another application. The extension consists of one or more methods that define the added functionality or behavior. These methods cannot modify the existing behavior of the defined class; they can only add behavior specific to the application that contains the extended class.’ [VA95].
This reuse measure is called actual reuse. For example in Figure 3.9, the class
Magnitude of application App2 was extended by class MyDate of application OAppM
and class MyTrigo of application OAppV. Therefore, RExt(Magnitude) = 2.
50
Reproduced with permission of the copyright owner. Further reproduction prohibited without permission.

Inheritance-based Reuse (Rlnherit)
QassX
maxmin
timeseconds
QassZ
ClassW
ngure 3.8. Example of inheritance-based reuse where a method is overridden.
51
Reproduced with permission of the copyright owner. Further reproduction prohibited without permission.

Inter-apjiicatioD Reuse by Extensioii(RExt)
O 2029 Classes in VisualAge Apps ° Other VisualAgp^nHffialkApps
Appl
AppKAppN,
AppZ
M giiim fc<>
RExt(IVfegBtude)=2
QAppl ) \QApp2
N P la te MyTHgo
cosshetan:
Figure 3.9. Example of inter-application reuse by extension.
52
Reproduced with permission of the copyright owner. Further reproduction prohibited without permission.

3 3 3 Inter-application reuse as a server (RServ)
Let C be a class, A be the application where C is defined, and Aprime be the set of
all applications in the image minus A.
RServ(C) = number of times C was directly referenced by classesfrom applications in Aprime. (3.23)
Equation (3.23) is classified as instance level reuse [McG92]. It also can be
viewed as a reuse measure from a server perspective, as defined in [Kar93]. RServ
differs from the server perspective definition in [Kar93] in the sense that it is only
counting services C actually gives to classes in other applications in the Smalltalk image.
This research excludes those that are inheritance-based references. One can argue that
RServ is what [Chi93] called non-inheritance coupling, but RServ is a kind of reuse
nonetheless. For example in Figure 3.10, let the class Array be defined in application
App2. Suppose classes A, 5 , C and D defined in applications AppN, O Appl, OAppM and
OappV, respectively, are the only classes in the image to have “Array new” as a
Smalltalk expression in one of their methods. Then, RServ(Array) = 4. This reuse
measure is called actual reuse.
3.4 Data and Statistical Analyses
3.4.1 Data
The data used in this research were 2029 implemented VisualAge for Smalltalk
classes. Metrics for the 2029 classes were automatically collected using CMC. Reuse
data, Rlnherit, RExt, and RServ, were automatically collected on 310 VisualAge for
Smalltalk Professional applications. These applications were written by application
developers in a commercial software company. Figures 3.11,3.12 and 3.13 show the
53
Reproduced with permission of the copyright owner. Further reproduction prohibited without permission.

Uer ifficatimBenseasaSericrOBServ)
^ 2029Gasses in \SaaIAgeApps ^ OteMsuaMgHffhriyk^p
Array
*igure 3.10. Example of inter-application reuse as a server.
54
Reproduced with permission of the copyright owner. Further reproduction prohibited without permission.

Reproduced
with perm
ission of the
copyright ow
ner. Further
reproduction prohibited
without
permission.
LSIUt
buildlnheritanceReusa"Count the number o£ methods that can be inherited in each class in the system"| reuseDict metricValue validClassName arrayl repository |
repository := MetricsRepository. reuseDict :=MetricsRepository reuseDict. reuseDict
keysDo: [ :cls | validClassName : = Smalltalk at: els asSymbol.metricValue := self inheritanceBasedReuseFor: validClassName.
repositoryreuseDict: els indexOfValue: 1 value: metricValue.}.
LnheritancaBasedReuseFori aClass|aClassName inheritanceReuse clslnstMethods clsMethods numOverridenMethods
subMethods sublnstMethods | aClassName := aClass abrAsClass. clsMethods := aClassName class selectors. clslnstMethods : = aClassName selectors. inheritanceReuse := aClassNeune allSubclasses size *
(clsMethods size + (clslnstMethods size)). numOverridenMethods := 0. aClassName allSubclasses do:
[:subCls |subMethods : = subCls class selectors. sublnstMethods : = subCls selectors. numOverridenMethods : = (clsMethods size -
((clsMethods epDifference: subMethods) size)) * (subCls allSubclasses size) + numOverridenMethods.
numOverridenMethods :» (clslnstMethods size - ((clslnstMethods epDifference: sublnstMethods) size))
* (subCls allSubclasses size)+ numOverridenMethods. ].
inheritanceReuse : = inheritanceReuse - numOverridenMethods.______A inheritanceReuse_______________________ ______________ ___________________________________Figure 3.11. Smalltalk scripts used to compute Rlnherit.

Reproduced
with perm
ission of the
copyright ow
ner. Further
reproduction prohibited
without
permission.
UtO n
buildlnterApplicationReuse"Count base classes that were reused by extension in the system"| reuseDict metricValue validClassName arrayl repository extendedClassesBag |
extendedClassesBag := self extendedClasses. repository := MetricsRepository. reuseDict ;=MetricsRepository reuseDict. reuseDict
keysDo: [ :cls | validClassName : = Smalltalk at: els asSymbol.metricValue := extendedClassesBag occurrencesOf: validClassName.
repositoryreuseDict: els indexOfValue: 2 value: metricValue.].
extendedClasses"Return a bag of classes that are extended by applications in the image"
| allAppsList extendedClasses |
extendedClasses := Bag new.allAppsList := System epLoadedApplications asSortedCollection: [:a :b| a name < b name], allAppsList do: [:e| | xtended |
xtended := e extended.(xtended size = 0)
ifFalse: [ xtended do:[:cls | ((els controller printString) - e printString)
ifFalse: [extendedClasses add: els.] .
].] .
] •“extendedClasses
Figure 3.12. Smalltalk scripts used to compute RExt.

Reproduced
with perm
ission of the
copyright ow
ner. Further
reproduction prohibited
without
permission.
Ul
buildlntarAppSarverReuse
"Count the number of all methods from another app referencing each class in the system"
| reuseDict metricValue validClassName arrayl repository |
repository := MetricsRepository. reuseDict :=MetricsRepository reuseDict. reuseDict
keysDo: [ :cls | validClassName : = Smalltalk at: els asSymbol.metricValue : = self
numberOfInterAppMethodsReferencing: validClassName.repository
reuseDict: elsindexOfValue: 3value: metricValue. ].
numberOfZnterAppMethodaRaferencing» anOb jact
"anObject can be a class, a methodReturn the classes from another application that references anObject "
| answer methods |
answer :- OrderedCollection new.Class subclasses do: [:cl |
cl isMetaclass ifTrue: [answer add: cl primarylnstance]]. methods := nil.
answer do: [:cl |methods isNil
ifTrue: [methods : = cl allMethodsReferencingLiteral: anObject] ifPalse: [methods addAll: (cl allMethodsReferencingLiteral: anObject)]].
''(methods select: [: e | (e methodClass controller = anObject controller) not]) size
Figure 3.13. Smalltalk scripts used to compute RServ.

Smalltalk scripts used to compute Rlnherit, RExt and RServ. For each of the three reuse
measures, these 2029 classes were grouped into two categories, those with dependent
variable values greater than one, and those with dependent variable values equal to zero
or one. The data set used to regress Rlnherit with the 20 metrics was derived as follows:
Let A = {2029 implemented classes}.
1) Partition A into two groups RlnheritPlus and RlnheritZeroOne where
RInheritPlus = {classes whose Rlnherit values are greater than 1} and
RlnheritZeroOne = {classes whose Rlnherit values are 0 or 1}.
The data set used to regress RExt with the 20 metrics was derived as follows:
1) Let A = {2029 implemented classes}.
2) Partition A into two groups RExtPlus and RExtZeroOne where
RExtPlus = {classes whose RExt values are greater than 1} and
RExtZeroOne = {classes whose RExt values are 0 or 1}.
The data set used to regress RServ with the 20 metrics was derived as follows:
1) Let A = {2029 implemented classes}.
2) Partition A into two groups RServPlus and RServZeroOne where
RServPlus - {classes whose RServ values are greater than 1} and
RServZeroOne = {classes whose RServ values are 0 or 1}.
For example, in Figure 3.6, the class Array is in RlnheritPlus, RExtPlus,
RServPlus since RInherit{Array) = 30, RExt(Array) = 3 and RServ(Array) = 1475. Bag
on the other hand is in RlnheritZeroOne, RExtZeroOne, RServPlus.
58
Reproduced with permission of the copyright owner. Further reproduction prohibited without permission.

3.4.2 Statistical Analyses
Four statistical analyses were performed to investigate the following questions:
• Are the population means of the reusable and non-reusable groups the same?
• Are there object-oriented metrics that can predict Rlnherit, RExt and RServ0.
• Are the prediction equations for Rlnherit, RExt and RServ empirically valid?
• Are any of the 20 metrics in the reusable groups correlated?
• Are Rlnherit, RExt and RServ correlated?
3.4.2.1 Comparison Between Two Groups: Classes that were reused vs. classes that were not reused
The goal of the first statistical analysis was to test the following hypotheses:
1) Ho: The population means of RlnheritPlus and RlnheritZeroOne are the
same.
Hi: The population means of RlnheritPlus and RlnheritZeroOne are not the
same.
2) Ho: The population means of RExtPlus and RExtZeroOne are the same.
Hi: The population means of RExtPlus and RExtZeroOne are not the same.
3) Ho: The population means of RServPlus and RServZeroOne are the same.
Hi: The population means of RServPlus and RServZeroOne are not
the same.
The PROC TTEST from SAS was performed to test the hypotheses that the
population means of the Rlnherit and RlnheritZeroOne, RExt and RextZeroOne, RServ
and RServZeroOne are the same. A test is significant if the two-tailed probability of Ho
being true is five percent or less, i.e. a = 0.05. If the p-value associated with metrici is
59
Reproduced with permission of the copyright owner. Further reproduction prohibited without permission.
less than 0.05, then the mean metrici values for those classes that were reused and those
classes that were not reused are significantly different
A nonparametric test NPAR1WAY procedure from SAS was also performed
since it does not assume anything about that the underlying distribution of the data set
The test statistic used was the Wilcoxon 2-sample test which performs an analysis of the
ranks of the dara It is a nonparametric procedure for testing that the distribution of a
variable has the same location parameter across different groups [SAS90].
3 .4 ^ 2 Stepwise Regression
The goal of the second statistical analysis was to test the following hypotheses:
1) Ho: The dependent variable Rlnherit is not linearly related to a subset of
the 20 metrics.
Hi: The dependent variable Rlnherit is linearly related to a subset of
the 20 metrics.
2) Ho: The dependent variable RExt is not linearly related to a subset of
the 20 metrics.
Hi: The dependent variable RExt is linearly related to a subset of
the 20 metrics.
3) Ho: The dependent variable RServ is not linearly related to a subset of
the 20 metrics.
H i: The dependent variable RServ is linearly related to a subset of
the 20 metrics.
Stepwise regression was used to test these hypotheses. Using the groups
RlnheritPlus, RExtPlus, RServPlus, three prediction equations were derived for each of
60
Reproduced with permission of the copyright owner. Further reproduction prohibited without permission.
the proposed reuse measures using the 20 metrics as the independent variables and the
reuse measures applied separately, as the dependent variable. SAS was used to perform
stepwise regression analyses on the groups of classes that have positive dependent
variable values, i.e. groups RlnheritPlus, RExtPlus, RServPlus. Only those classes in
these groups were considered since this research is concerned with characterizing
'reusable* classes. Sequential variable selection procedures exist that arrive efficiently at
a reasonable subset of regressor or independent variables from a large number of possible
variables [Mye90]. Stepwise regression adds a variable to the regression model one by
one, depending on whether the F statistic for a variable is significant at a given level
[SAS90]. After a variable is added to the regression model, stepwise regression deletes
any variable already in the model that has an F statistic not significant at a given level.
At each stage, a regressor can be entered in the model while another can be eliminated.
The rationale is that multicollinearity can render a regressor variable of little value
[Mye90]. Multicollinearity involves associations among multiple independent variables.
Significance is defined as when the p-value or two-tailed probability of Ho being true is
five percent or less, hi [Wei85], p-value is defined as
“the conditional probability of observing a value of the computed statistic as extreme or more extreme than the observed value, given that Ho is true."
In this specific case, the p-value is the probability that the regression coefficient is
different from zero by chance [Bas96]. If the p-value is less than five percent, there is
sufficient evidence to reject Ho-
61
permission of the copyright owner. Further reproduction prohibited without permission.

3.4.23. Empirical Validation
The third statistical analysis is for the purpose of empirically validating the
prediction equations derived from the stepwise regression analysis. Validation of a
prediction system is the process of establishing the accuracy of the prediction system by
empirical means, that is, by comparing model performance with known data points in the
given environment [Fen91]. In [Bas96],
“Empirical validation aims at demonstrating the usefulness of a measure in practice and is, therefore, a crucial activity to establish the overall validity of a measure. A measure may be correct from a measurement theory perspective (i.e., be consistent with the agreed upon empirical relational system) but be of no practical relevance to the problem at hand.On the other hand, a measure may not be entirely satisfactory from a theoretical perspective but can be a good enough approximation and work fine in practice.”
From the prediction equations derived in Section 2, predicted Rlnherit, predicted
RExt, and predicted RServ were calculated. A new set of 310 applications and
subapplications were used to validate the prediction equations derived from the previous
section. These applications were not contained in the set of 2029 classes. For each of the
2029 implemented classes, new values for Rlnherit, RExt and RServ were calculated by
CMC with the new set of 310 applications loaded in the VisualAge for Smalltalk image.
These new values are the known data points in the validation definition by [Fen91]. If
the predicted values are highly correlated with actual values from the new set of data,
then the prediction equation gives satisfactory results.
3.4.2.4 Correlation Coefficients
The goal of the fourth statistical analysis is to answer the questions: Are any of
the 20 metrics in the reusable groups correlated? Are Rlnherit, RExt and RServ
62
Reproduced with permission of the copyright owner. Further reproduction prohibited without permission.

correlated? The Pearson product moment correlation coefficient, r, is a dimensionless
index that ranges from -1.0 to 1.0 inclusive and reflects the extent of a linear relationship
between two data sets [MS097]. For example, if the r value associated with M etric! and
M etricl is close to zero, then the metric values of M etric! and M etric2 are not linearly
related. On the other hand, if r is close to 1, then large values o f M etric! are associated
with large values of Metric2. Finally, if r is close to —1, then large values of M etric! are
linearly associated with small values of Metric2. The sign of the correlation coefficient
indicates whether two variables are directly or inversely related. A negative value means
that as M etricl becomes larger, Metric2 tends to be smaller. A positive correlation
means that both M etricl and Metric2 go in the same direction [SAS91].
3.5 Summary
This chapter described the materials and method used to investigate the reuse
potential of objects. A class metric collector was described which automatically extracts
the 20 metrics and the three reuse measures. The data sets used for the study were also
presented. Finally the statistical procedures t-test, stepwise regression, and correlation
coefficients were described. These procedures will answer these questions:
Are the population means of the reusable and non-reusable groups the same?
Are there object-oriented metrics that can predict Rlnherit, RExt and RServl
Are the prediction equations from 2. empirically valid?
Are any of the 20 metrics in the reusable groups correlated?
Are Rlnherit, RExt and RServ correlated?
Chapter 4 gives the results and discussion.
63
permission of the copyright owner. Further reproduction prohibited without permission.

Chapter 4. Results and Discussion
Sections 4.1 through 4.4 describe the results for each of the four statistical
analyses described in Chapter 3.4.2. Section 4.1 discusses results obtained from
performing T-test and a nonparametric test to compare mean metric values between the
reusable and non-reusable groups. Section 4.2 describes the results of stepwise regression
for RInherit, RExt and RServ. Section 4.3 presents results o f validating the models
derived in Section 4.2. Finally, Section 4.4 discusses the results o f testing for correlation
among the metrics. In addition Figure 3.1 is included here as Figure 4.1 for the
convenience of the reader.
4.1 Comparison Between Two Groups
We answer the question: Are the population means o f the reusable and non-
reusable groups the same? Section 4.1.1 gives the results of analyzing the data using T-
test
4.1.1 T-test
Sections 4.1.1.1,4.1.1.2 and 4.1.1.3 describe the results of analyzing the data using t-test.
Section 4.1.1.1 gives the results of comparing the groups RInheritPlus and
RInheritZeroOne. Section 4.1.1.2 describes the results of comparing the groups RExtPlus
and RExtZeroOne. Section 4.1.13 presents the results of comparing the groups
RServPlus and RServZeroOne.
4.1.1.1 Inheritance-based reuse
Table 4.1 presents the t-test results for the groups RInheritPlus and
RInheritZeroOne. A one-sided test gives the direction of the difference in the mean
metric values of classes in RInheritPlus and RInheritZeroOne. The mean metric values
64
Reproduced with permission of the copyright owner. Further reproduction prohibited without permission.

Metric AbbreviationNumber of direct subclasses NDSubNumber of all subclasses NSubNumber of methods NOMNumber of instance methods NIMNumber of class variables NCVNumber of instance variables NIVNumber of class method categories NCMCNumber of instance method categories NIMCNumber of all superclasses NsupCyclomatic complexity CycCNumber of public methods NpubMNumber of private methods NpriMClass coupling CCReuse ratio USpecialization ratio sLines of code LOCNumber of statements NOSLorenz complexity LCNumber of message sends NMSNumber of parameters NPFigure 4.1. Object-oriented metrics.
65
Reproduced with permission of the copyright owner. Further reproduction prohibited without permission.

Table 4.1. RInherit: T-test between classes that are reused (+)vs. c asses that are not reused (0 and 1).
M ean Sid Dev ProtomNDSub
0« 0.0107 01608 00001+• 18822 244030
NSub0 04108 01608 00035+ 17.2378 1246551
NOM0 17J129 26.4832 OOOOI+■ 38-3311 55.3401
NIM0 14.0132 240346 04001
3ZI622 48.1631NCV
0 0-2609 1.1679 0638902911 12132
NIV0 20975 43422 0.0001
3.6289 5.2388NCMC
0 08144 08074 OOOOI+ 1.1000 1.4442
NIM C0 1.2470 U616 OOOOI+• 22733 29515
NSud0 3.5554 1.8553 00029+ 3.2378 20232
CycC0 6-5649 127689 OOOOI+ 120378 207669
NPabM0 3.1989 154800 OOOOI+• 164844 30.8402
NPriM0 9.1140 17.8005 OOOOI+ 222667 342472
CC0 422032 63.1300 04001+ 622133 69.4463u0 01478 02024 04001+ 01139 01239s0 00667 25170 OOOOI+ 7.0384 328230
LOC0 79.9924 207-8276 OOOOI
149.9844 249.6177NOS
0 136.3641 321.0069 04001♦ 233.4311 4172737
1C0 2724148 6672020 OOOOI+ 4800327 7941482
NMS0 602888 1342371 OOOOI+ 1322333 218.6973
NP0 103743 272701 OOOOI+ 25.8422 449183
*0 = RInheritZeroOne, number of samples =1579 *+ = RInheritPlus, number of samples = 450
66
Reproduced with permission of the copyright owner. Further reproduction prohibited without permission.
may be used as a guide to judge whether a class will be reused through inheritance at
least two or more times.
At a = 0.05, the mean NDSub value of classes in RInheritPlus is greater than the
mean NDSub value of classes in RInheritZeroOne. The mean of NDSub in RInheritPlus
is 4.88, and 0.01 in RInheritZeroOne. Classes that are reusable based on their
inheritance-based reuse value have approximately five direct subclasses, while classes
that are not reusable have a value close to zero. Classes that have an NSub value close to
zero means that these classes are at the bottom of the hierarchy. They have no children
who can inherit their behavior, and thus, are not reusable by inheritance.
At a = 0.05, the mean NSub value of classes in RInheritPlus is greater than the
mean NSub value of classes in RInheritZeroOne. The mean of NSub in RInheritPlus is
17.24, and 0.01 in RInheritZeroOne. Classes that are reusable based on their
inheritance-based reuse value have about 17 subclasses, while classes that are not
reusable have close to zero subclass. This result is expected since leaf classes have no
children who can inherit their behavior.
At a = 0.0S, the mean NOM value of classes in RInheritPlus is greater than the
mean NOM value of classes in RInheritZeroOne. The mean of NOM in RInheritPlus is
38.35 and 17.31 in RInheritZeroOne. Classes that are reusable based on their
inheritance-based reuse value have about 38 methods, while classes that are not reusable
have about 17. This result is expected since classes that have a high number of methods
have more inheritance-based reuse potential since these methods will be the behavior that
their subclasses will freely inherit Note that classes in RInheritPlus have almost twice
the number of methods compared with classes in RInheritZeroOne.
67
Reproduced with permission of the copyright owner. Further reproduction prohibited without permission.

At a = 0.05, the mean NIM value of classes in RInheritPlus is greater than the
mean NIM value of classes in RInheritZeroOne. The mean of NIM in RInheritPlus is
32.16 and 14.01 in RInheritZeroOne. Classes that are reusable based on their
inheritance-based reuse value have about 32 instance methods, while classes that are not
reusable have about 14.
At a = 0.05, the mean NIV value of classes in RInheritPlus is greater than the
mean NIV value of classes in RInheritZeroOne. The mean of NIV in RInheritPlus is
3.62 and 2.10 in RInheritZeroOne. Classes that are reusable based on their inheritance-
based reuse value have about four instance variables, while classes that are not reusable
have about two.
At a = 0.05, the mean NCMC value of classes in RInheritPlus is greater than the
mean NCMC value of classes in RInheritZeroOne. The mean of NCMC in RInheritPlus
is 1.1 and 0.81 in RInheritZeroOne. The mean difference is small, so categorizing
whether a class is reusable will be difficult.
At a = 0.05, the mean NIMC value of classes in RInheritPlus is greater than the
mean NIMC value of classes in RInheritZeroOne. The mean of NIMC in RInheritPlus
is 2.27 and 1.25 in RInheritZeroOne. Classes that are reusable based on their
inheritance-based reuse value have about two instance method categories, while classes
that are not reusable have about one.
At a = 0.05, the mean NSup value of classes in RInheritPlus is less than the mean
NSup value of classes in RInheritZeroOne. The mean of NSup in RInheritPlus is 3.24
and 3.56 in RInheritZeroOne. Classes that are reusable based on their inheritance-based
68
Reproduced with permission of the copyright owner. Further reproduction prohibited without permission.

reuse value have about three superclasses, while classes that are not reusable have about
four.
At a = 0.05, the mean CycC value of classes in RInheritPlus is greater than the
mean CycC value o f classes in RInheritZeroOne. The mean of CycC in RInheritPlus is
12.04 and 6.56 in RInheritZeroOne. Classes that are reusable based on their inheritance-
based reuse value have cyclomatic complexity about 12, while classes that are not
reusable have about seven.
At a = 0.05, the mean NPubM value of classes in RInheritPlus is greater than the
mean NPubM value of classes in RInheritZeroOne. The mean of NPubM in
RInheritPlus is 16.08 and 8.2 in RInheritZeroOne. Classes that are reusable based on
their inheritance-based reuse value have about 16 public methods, while classes that are
not reusable have about eight
At a = 0.05, the mean NPriM value of classes in RInheritPlus is greater than the
mean NPriM value of classes in RInheritZeroOne. The mean of NPriM in RInheritPlus
is 22.27 and 9.11 in RInheritZeroOne. Classes that are reusable based on their
inheritance-based reuse value have about 22 private methods, while classes that are not
reusable have about nine.
At a = 0.05, the mean CC value of classes in RInheritPlus is greater than the
mean CC value of classes in RInheritZeroOne. The mean of CC in RInheritPlus is
62.21 and 42.21 in RInheritZeroOne. Classes that are reusable based on their inheritance-
based reuse value have a class coupling value of about 62, while classes that are not
reusable have a value of about 42. This result shows that the higher the CC value of a
69
Reproduced with permission of the copyright owner. Further reproduction prohibited without permission.
class, the more likely this class will be reused by inheritance at least two tunes. As noted
earlier, inheritance increases coupling.
At a = 0.05, the mean U value of classes in RInheritPlus is less than the mean U
value of classes in RInheritZeroOne. The mean of U in RInheritPlus is 0.15 and 0.12 in
RInheritZeroOne. Classes that are reusable based on their inheritance-based reuse value
have reuse ratio about 0.11, while classes that are not reusable have about 0.15.
At a = 0.05, the mean S value of classes in RInheritPlus is greater than the mean
S value of classes in RInheritZeroOne. The mean of 5 in RInheritPlus is 7.04 and 0.07
in RInheritZeroOne. Classes that are reusable based on their inheritance-based reuse
value have specialization value of about seven, while the specialization value of classes
that are not reusable is close to zero.
At a = 0.05, the mean LOC value of classes in RInheritPlus is greater than the
mean LOC value of classes in RInheritZeroOne. The mean of LOC in RInheritPlus is
149.98 and 79.99 in RInheritZeroOne. Classes that are reusable based on their
inheritance-based reuse value have about 150 lines of code, while classes that are not
reusable have about 80.
At cl - 0.05, the mean NOS value of classes in RInheritPlus is greater than the
mean NOS value of classes in RInheritZeroOne. The mean of NOS in RInheritPlus is
253.43 and 136.36 in RInheritZeroOne. Classes that are reusable based on their
inheritance-based reuse value have about 253 statements, while classes that are not
reusable have about 136.
At a = 0.05, the mean LC value of classes in RInheritPlus is greater than the
mean LC value of classes in RInheritZeroOne. The mean of LC in RInheritPlus is
70
Reproduced with permission of the copyright owner. Further reproduction prohibited without permission.

480.03 and 273.41 in RInheritZeroOne. Classes that are reusable based on their
inheritance-based reuse value have LC measure of about 480, while classes that are not
reusable have about 273.
At a = 0.05, the mean NMS value of classes in RInheritPlus is greater than the
mean NMS value of classes in RInheritZeroOne. The mean of NM S in RInheritPlus is
132.23 and 60.29 in RInheritZeroOne. Classes that are reusable based on their
inheritance-based reuse value have about 132 message sends, while classes that are not
reusable have about 60.
At a = 0.05, the mean NP value of classes in RInheritPlus is greater than the
mean NP value of classes in RInheritZeroOne. The mean of NP in RInheritPlus is
25.84 and 10.37 in RInheritZeroOne. Classes that are reusable based on their inheritance-
based reuse value have about 26 parameters, while classes that are not reusable have
about 10.
Section 4.1.1.2 shows that the mean metric values o f the reusable group
RInheritPlus and non-reusable group RInheritZeroOne are generally not the same, hi
summary, at a = 0.05, the mean metric values of { NDSub, NSub, NOM, NIM, NIV,
NCMC, NIMC, NSup, CycC, NPubM. NPriM, CC, U, S, LOC, NOS, LC, NMS and NP }
are significantly different between classes in RInheritPlus and RInheritZeroOne. The
mean metric values of NCV are not significantly different between classes in
RInheritPlus and RInheritZeroOne.
4.1.1.2 Inter-application reuse by extension
Table 4.2 presents the t-test results for the groups RExtPlus and RExtZeroOne. A
one-sided test gives the direction of the difference in the mean metric values of classes in
71
Reproduced with permission of the copyright owner. Further reproduction prohibited without permission.

Table 4.2. RExt: T-test between classes that are reused (+)vs. classes that are not reused (0 and 1).
Mean S td Dev P ro b » |T |NDSub
0 * 0 .S 81 4 5.0468 0 .0 2 8 3♦ » 4 .6 5 3 5 29.3656
Nsub0 1.3 888 2 10.8487 0 .0 5 8 8♦ 20.90SS 163.7928
NOM0 1 6 .954 9 25.1051 0 .0 0 0 1♦ 57 .086 6 67.7375
NIM0 13 .9363 23.3679 0 .0 0 0 1» 46 .716 5 58.3888
NCV0 0 .1 9 5 5 0.9489 0 .0 0 0 1* 0 .7 7 1 7 2.1253
N IV0 2 .2 0 4 5 4.5017 0 .0 0 0 1* 4 .0 6 3 5.9587
NCMC0 0 .7 5 3 8 0.6780 0 .0 0 0 1*■ 1 .7 4 4 1 1.9483
NIMC0 1 .2 1 5 2 1.3917 0 .0 0 0 1
♦ 3 .2 8 7 4 3.3362NSUD
0 3 .5 4 4 2 1.9012 0 .0 0 0 2♦ 3 .0 7 0 9 1.8294
CveC0 5 .9 0 4 2 9.6956 0 .0 0 0 1♦ 2 0 .878 0 31.1078
NbubK0 7 .6 4 9 6 13.6086 0 .0 0 0 1♦ 2 6 .007 9 39.9729
N P riM0 9 .3 0 5 3 18.0840 0 .0 0 0 1*■ 3 1 .0 7 8 7 39.8466
CC0 4 1 .227 6 62.0049 0 .0 0 0 1* 8 4 .484 3 83.4829a
0 0 .1 3 9 8 0.1907 0 .5 5 2 2* 0 .1 4 6 8 0.1730s0 0 .7 1 2 2 5.3884 0 .0 0 6 9* 7 .9 0 7 3 42.0679
LOC0 7 6 .1 9 5 5 188.6428 0 .0 0 0 1* 230 .5276 341.0489
NOS0 129.7245 292.9132 0 .0 0 0 1*■ 390.1653 556.4687
LC0 258 .4444 605.8115 0 .0 0 0 1* 744 .08 58 1083.6628
NMS0 59 .152 7 128.4950 0 .0 0 0 1* 195.6890 268.8709
NP0 10 .0862 26.0351 0 .0 0 0 1
3 9 .791 3 55.2857
*0 = RExtZeroOne, number of samples =1775*+ = RExtPlus, number of samples = 254
72
Reproduced with permission of the copyright owner. Further reproduction prohibited without permission.

RExtPlus and RExtZeroOne. The mean metric values may be used as a guide to judge
whether a class will be reused in another application by extension at least two or more
times.
At a = 0.05, the mean NDSub value of classes in RExtPlus is greater than the
mean NDSub value of classes in RExtZeroOne. The mean of NDSub in RExtPlus is
4.65 and 0.58 in RExtZeroOne. Classes that are reusable based on their inter-application
reuse by extension value have about five direct subclasses, while classes that are not
reusable have about one. The greater the number of direct subclasses of a class are, the
more likely they will be reused by extension.
At a = 0.05, the mean NOM value of classes in RExtPlus is greater than the mean
NOM value of classes in RExtZeroOne. The mean of NOM in RExtPlus is 57.09 and
16.95 in RExtZeroOne. Classes that are reusable based on their inter-application reuse by
extension value have about 57 methods, while classes that are not reusable have about
17.
At a = 0.05, the mean NIM value of classes in RExtPlus is greater than the mean
NIM value of classes in RExtZeroOne. The mean of NIM in RExtPlus is 46.72 and
13.94 in RExtZeroOne. Classes that are reusable based on their inter-application reuse by
extension value have about 46 instance methods, while classes that are not reusable have
about 14.
At a = 0.05, the mean NCV value of classes in RExtPlus is greater than the mean
NCV value of classes in RExtZeroOne. The mean of NCV in RExtPlus is 0.77 and 0.20
in RExtZeroOne. Classes that are reusable based on their inter-application reuse by
73
Reproduced with permission of the copyright owner. Further reproduction prohibited without permission.

extension value have about one class variable, while classes that are not reusable have
about zero.
At a = 0.05, the mean NIV value of classes in RExtPlus is greater than the mean
NIV value of classes in RExtZeroOne. The mean of NIV in RExtPlus is 4.06 and 2.20 in
RExtZeroOne. Classes that are reusable based on their inter-application reuse by
extension value have about four instance variables, while classes that are not reusable
have about two.
At a = 0.05, the mean NCMC value of classes in RExtPlus is greater than the
mean NCMC value of classes in RExtZeroOne. The mean of NCMC in RExtPlus is
1.74 and 0.75 in RExtZeroOne. Classes that are reusable based on their inter-application
reuse by extension value have about two class method categories, while classes that are
not reusable have about one.
At a = 0.05, the mean NIMC value of classes in RExtPlus is greater than the
mean NIMC value of classes in RExtZeroOne. The mean of NIMC in RExtPlus is 3.29
and 1.22 in RExtZeroOne. Classes that are reusable based on their inter-application reuse
by extension value have about three instance method categories, while classes that are
not reusable have about one.
At a = 0.05, the mean NSup value of classes in RExtPlus is less than the mean
NSup value of classes in RExtZeroOne. The mean of NSup in RExtPlus is 3.07 and
3.54 in RExtZeroOne. Classes that are reusable based on their inter-application reuse by
extension value have about three superclasses, while classes that are not reusable have
about four.
74
Reproduced with permission of the copyright owner. Further reproduction prohibited without permission.

At a = O.OS, the mean CycC value of classes in RExtPlus is greater than the mean
CycC value of classes in RExtZeroOne. The mean of CycC in RExtPlus is 20.89 and
5.9 in RExtZeroOne. Classes that are reusable based on their inter-application reuse by
extension value have cyclomatic complexity about 21, while classes that are not reusable
have about 6.
At a = 0.05, the mean NPubM value of classes in RExtPlus is greater than the
mean NPubM value of classes in RExtZeroOne. The mean of NPubM in RExtPlus is
26.01 and 7.65 in RExtZeroOne. Classes that are reusable based on their inter-application
reuse by extension value have about 26 public methods, while classes that are not
reusable have about eight.
At a = 0.05, the mean NPriM value of classes in RExtPlus is greater than the
mean NPriM value of classes in RExtZeroOne. The mean of NPriM in RExtPlus is
31.08 and 9.31 in RExtZeroOne. Classes that are reusable based on their inter-application
reuse by extension value have about 31 private methods, while classes that are not
reusable have about nine.
At a = 0.05, the mean CC value of classes in RExtPlus is greater than the mean
CC value of classes in RExtZeroOne. The mean of CC in RExtPlus is 84.48 and 41.23
in RExtZeroOne. Classes that are reusable based on their inter-application reuse by
extension value have a class coupling value of about 84, while classes that are not
reusable have about 41. This result shows that the higher the CC value of a class, the
more likely this class will be reused by extension two or more times.
At a = 0.05, the mean S value of classes in RExtPlus is greater than the mean S
value of classes in RExtZeroOne. The mean of S in RExtPlus is 7.91 and 0.71 in
75
Reproduced with permission of the copyright owner. Further reproduction prohibited without permission.
RExtZeroOne. Classes that are reusable based on their inter-application reuse by
extension value have specialization value approximately equal to eight, while classes that
are not reusable have about one.
At a = 0.0S, the mean LOC value of classes in RExtPlus is greater than the mean
LOC value of classes in RExtZeroOne. The mean of LOC in RExtPlus is 230.53 and
76.20 in RExtZeroOne. Gasses that are reusable based on their inter-application reuse by
extension value have about 231 lines o f code, while classes that are not reusable have
about 76.
At a = 0.05, the mean NOS value of classes in RExtPlus is greater than the mean
NOS value of classes in RExtZeroOne. The mean of NOS in RExtPlus is 390.17 and
129.72 in RExtZeroOne. Gasses that are reusable based on their inter-application reuse
by extension value have about 290 statements, while classes that are not reusable have
about 130.
At a = 0.05, the mean LC value o f classes in RExtPlus is greater than the mean
LC value of classes in RExtZeroOne. The mean of LC in RExtPlus is 744.09 and
258.44 in RExtZeroOne. Gasses that are reusable based on their inter-application reuse
by extension value have LC measure of about 744, while classes that are not reusable
have about 258.
At a = 0.05, the mean NMS value of classes in RExtPlus is greater than the mean
NMS value of classes in RExtZeroOne. The mean of NMS in RExtPlus is 195.69 and
59.15 in RExtZeroOne. Gasses that are reusable based on their inter-application reuse by
extension value have about 196 message sends, while classes that are not reusable have
about 60.
76
Reproduced with permission of the copyright owner. Further reproduction prohibited without permission.

At a = 0.05, the mean NP value of classes in RExtPlus is greater than the mean
NP value of classes in RExtZeroOne. The mean of NP in RExtPlus is 39.79 and 10.09
in RExtZeroOne. Classes that are reusable based on their inter-application reuse by
extension value have about 40 parameters, while classes that are not reusable have about
10.
Appendix B presents the graphs of mean, median, standard deviation of the 20
metrics using the set RExtPlus.
To summarize Section 4.1.1.2, at a = 0.05, the mean metric values of { NDSub,
NOM, NIM, NCV, NIV, NCMC, NIMC, NSup, CycC, NPubM, NPriM, CC, S, LOC, NOS,
LC, NMS, and NP } are significantly different between classes in RExtPlus and
RExtZeroOne. The mean metric values of { NSub, U } are not significantly different
between classes in RExtPlus and RextZeroOne.
4.1.1.3 Inter-application reuse as a server
Table 43 presents the t-test results for the groups RServPlus and RServZeroOne.
A one-sided test gives the direction of the difference in the mean metric values of classes
in RServPlus and RServZeroOne. The mean metric values may be used as a guide to
judge whether a class will be reused in another application as a server at least two or
more times.
At a = 0.05, the mean NOM value of classes in RServPlus is greater than the
mean NOM value of classes in RServZeroOne. The mean of NOM in RServPlus is
40.92 and 14.94 in RServZeroOne. Classes that are reusable based on their
77
Reproduced with permission of the copyright owner. Further reproduction prohibited without permission.

Table 4.3. RServ: T-test between classes that are reused (+)vs. classes that are no reused (0 and 1).
Neon Scd Dev P ro b > IT INDSub
0 * 0 .6 829 5 .5 0 9 0 0 .0 8 3 22.X891 2 0 .0 7 6 1
Nsub0 1.9675 1 7 .602 7 0 .1 4 3 9♦ 8.8436 109 .67 76
NOM0 14.9351 2 1 .8 7 0 3 0 .0 001*■ 40 .9200 5 4 .974 3
HIM0 12.7052 2 0 .4 4 5 1 0 .0 0 0 1♦ 32.3854 4 8 .6 0 4 0
NCV0 0.0933 0 .5 1 3 1 0 .0 0 0 1♦ 0.7363 2 .0 2 8 4
N IV0 1.8404 4 .1 3 3 3 0 .0 0 0 1*■ 4.0418 5 .8 0 6 2
NCMC0 0.6842 0 .6 1 4 2 0 .0 0 0 1
1.3982 1 .4 9 7 9NIMC
0 1.1582 1 .1 4 0 0 0 .0 0 0 1♦ 2.3255 2 .9 3 8 0
Ns u d0 3.5693 1 .8 1 1 6 0 .0 0 2 2♦ 3.2582 2 .0 9 9 2
CVCC0 5.2109 8 .7 2 7 5 0 .0 0 0 1
14.6836 23 .8 7 2 0NtsibM
0 6.5943 10 .451 9 0 .0 0 0 1*■ 18.9655 3 2 .6 3 9 2
N P riM0 8.3408 16 .746 6 0 .0 0 0 1* 21.9545 3 3 .0 1 4 7
CC0 40 .8837 6 3 .6 0 8 9 0 .0 0 0 1*■ 62 .1291 7 1 .9 0 2 1a0 0.1209 0 .1 7 4 8 0 .0 0 0 1*■ 0.1939 0 .2 1 2 6s0 1.0917 1 4 .036 4 0 .0 379♦ 3.0146 1 9 .9 3 0 1
LOC0 72 .7721 196 .96 38 0 .0 001
156.6745 2 6 2 .01 16NOS
0 124.3874 2 9 7 .47 61 0 .0 0 0 1♦ 264.3527 441 .42 50
LC0 250.3231 629 .62 58 0 .0 0 0 1♦ 504.5616 841 .48 62
NMS0 55 .8661 123 .72 01 0 .0 001+ 131.0454 2 2 1 .08 12
NP0 8.7485 1 7 .364 6 0 .0 0 0 1♦ 27 .4018 5 3 .759 9
*0 = RServeZeroOne, number of samples =1479 *+ = RServePIus, number of samples = 550
78
Reproduced with permission of the copyright owner. Further reproduction prohibited without permission.

inter-application reuse as a server value have about 41 methods, while classes that are not
reusable have about IS.
At a = 0.05, the mean NIM value of classes in RServPlus is greater than the mean
NIM value of classes in RServZeroOne. The mean of NIM in RServPlus is 32.39 and
12.71 in RServZeroOne. Classes that are reusable based on their inter-application reuse
as a server value have about 32 instance methods, while classes that are not reusable have
about 13.
At a = 0.05, the mean NCV value of classes in RServPlus is greater than the mean
NCV value of classes in RServZeroOne. The mean of NCV in RServPlus is 0.73 and
0.09 in RServZeroOne. Classes that are reusable based on their inter-application reuse as
a server value have about one class variable, while classes that are not reusable have
about zero.
At a = 0.05, the mean NIV value of classes in RServPlus is greater than the mean
N IV value of classes in RServZeroOne. The mean of NIV in RServPlus is 4.04 and 1.84
in RServZeroOne. Classes that are reusable based on their inter-application reuse as a
server value have about four instance variables, while classes that are not reusable have
about two.
At a = 0.05, the mean NCMC value of classes in RServPlus is greater than the
mean NCMC value of classes in RServOne. The mean of NCMC in RServPlus is 1.40
and 0.68 in RServZeroOne. Classes that are reusable based on their inter-application
reuse as a server value have about two class method categories, while classes that are not
reusable have about one.
79
Reproduced with permission of the copyright owner. Further reproduction prohibited without permission.

At a = O.OS, the mean NIMC value of classes in RServPlus is greater than the
mean NIMC value of classes in RServZeroOne. The mean of NIMC in RServPlus is
2.32 and 1.15 in RServZeroOne. Classes that are reusable based on their inter
application reuse as a server value have about two instance method categories, while
classes that are not reusable have about one.
At a - 0.05, the mean NSup value of classes in RServPlus is less than the mean
NSup value of classes in RServZeroOne. The mean of NSup in RServPlus is 3.26 and
3.57 in RServZeroOne. Classes that are reusable based on their inter-application reuse as
a server value have about three superclasses, while classes that are not reusable have
about four.
At a = 0.05, the mean CycC value of classes in RServPlus is greater than the
mean CycC value of classes in RServZeroOne. The mean o f CycC in RServPlus is
14.68 and 5.21 in RServZeroOne. Classes that are reusable based on their inter
application reuse as a server value have cyclomatic complexity about 15, while classes
that are not reusable have about five.
At a = 0.05, the mean NPubM value of classes in RServPlus is greater than the
mean NPubM value of classes in RServZeroOne. The mean of NPubM in RServPlus is
18.97 and 6.59 in RServZeroOne. Classes that are reusable based on their inter-
application reuse as a server value have about 19 public methods, while classes that are
not reusable have about seven.
At a = 0.05, the mean NPriM value of classes in RServPlus is greater than the
mean NPriM value of classes in RServZeroOne. The mean of NPriM in RServPlus is
21.95 and 8.34 in RServZeroOne. Classes that are reusable based on their inter-
80
Reproduced with permission of the copyright owner. Further reproduction prohibited without permission.
application reuse as a server value have about 22 private methods, while classes that are
not reusable have about eight
At a = 0.05, the mean CC value of classes in RServPlus is greater than the mean
CC value of classes in RServZeroOne. The mean of CC in RServPlus is 62.13 and
40.88 in RServZeroOne. Classes that are reusable based on their inter-application reuse
as a server value have a class coupling value about 62, while classes that are not reusable
have about 41. This result shows that the higher the CC value of a class, the more likely
this class will be reused as a server two or more times.
At a = 0.05, the mean U value of classes in RServPlus is greater than the mean U
value of classes in RServZeroOne. The mean of U in RServPlus is 0.19 and 0.12 in
RServZeroOne. Classes that are reusable based on their inter-application reuse as a server
value reuse ratio value approximately equal to 0.19, while classes that are not reusable
have about 0.12.
At a = 0.05, the mean 5 value of classes in RServPlus is greater than the mean S
value of classes in RServZeroOne. The mean of S in RServPlus is 3.01 and 1.09 in
RServZeroOne. Classes that are reusable based on their inter-application reuse as a server
value have specialization value approximately equal to three, while classes that are not
reusable have about one.
At a = 0.05, the mean LOC value of classes in RServPlus is greater than the mean
LOC value of classes in RServZeroOne. The mean of LOC in RServPlus is 156.67 and
72.77 in RServZeroOne. Classes that are reusable based on their inter-application reuse
as a server value have about 157 lines of code, while classes that are not reusable have
about 73.
81
Reproduced with permission of the copyright owner. Further reproduction prohibited without permission.

At a = 0.05, the mean NOS value of classes in RServPlus is greater than the mean
NOS value of classes in RServZeroOne. The mean of NOS in RServPlus is 26435 and
124.39 in RServZeroOne. Classes that are reusable based on their inter-application reuse
as a server value have about 264 statements, while classes that are not reusable have
about 124.
At a = 0.05, the mean LC value of classes in RServPlus is greater than the mean
LC value of classes in RServZeroOne. The mean of LC in RServPlus is 504.56 and
250.32 in RServZeroOne. Classes that are reusable based on their inter-application reuse
as a server value have Lorenz complexity approximately equal to 505, while classes that
are not reusable have about 250.
At a = 0.05, the mean NMS value of classes in RServPlus is greater than the
mean NMS value of classes in RServZeroOne. The mean of NMS in RServPlus is
131.04 and 55.87 in RServZeroOne. Classes that are reusable based on their inter
application reuse as a server value have about 131 message sends, while classes that are
not reusable have about 56.
At a = 0.05, the mean NP value of classes in RServPlus is greater than the mean
NP value of classes in RServZeroOne. The mean of NP in RServPlus is 27.40 and 8.75
in RServZeroOne. Classes that are reusable based on their inter-application reuse as a
server value have about 27 parameters, while classes that are not reusable have about 9.
In summary, at a = 0.05, the mean metric values of { NOM, NIM, NCV, NIV,
NCMC, NIMC, NSup, CycC, NPubM, NPriM, CC, U, S, LOC, NOS, LC, NMS, and NP }
are significantly different between classes in RServPlus and RServZeroOne. The mean
82
Reproduced with permission of the copyright owner. Further reproduction prohibited without permission.

metric values of { NDSub, NSub } are not significantly different between classes in
RServPlus and RservZeroOne.
4.1.2 Nonparametric test
This section gives the results o f analyzing the data using nonparametric test
Section 4.1.2.1 gives the results of comparing the groups RInheritPlus and
RInheritZeroOne. Section 4.1.2.2 describes the results of comparing the groups RExtPlus
and RExtZeroOne. Section 4.1.2.3 presents the results of comparing the groups
RServPlus and RServZeroOne.
4.1.2.1 Inheritance-based raise
For inheritance-based reuse, the results of the nonparametric tests were the same
as those from the t-tests, except for U. Table 4.4 presents the nonparametric test results
for the groups RInheritPlus and RInheritZeroOne. At a = 0.05, the mean metric values of
{ NDSub, NSub, NOM, NIM, NIV, NCMC, NIMC, NSup, CycC, NPubM, NPriM, CC, U,
S, LOC, NOS, LC, NMS, NP } are significantly different between classes in RInheritPlus
and RInheritZeroOne.
The mean metric values of {NCV, U] are not significantly different between
classes in RInheritPlus and RInheritZeroOne.
4 .1 ^ 2 Inter-application reuse by extension
For inter-application reuse by extension, results from the t-tests and
nonparametric tests were the same, except for NDSub and U. Table 4.5 presents the
nonparametric test results for the groups RExtPlus and RExtZeroOne.
83
Reproduced with permission of the copyright owner. Further reproduction prohibited without permission.

Table 4.4. RInherit: nonparametric test between classes that ________ are reused (+) vs. classes that are not reused (0 and 1)
Mean P ro t» lz lNDSub
0* 7 9 1 .11 0 .0 0 0 11800.57
NSUb0 7 9 0 .89 0 .0 001♦ 1801.36
NCK0 92 9 .64 0 .0 001♦ 1314.49
N IX0 9 2 9 .67 0 .0 001♦ 1314.41
NCV0 1008.13 0 .0 689♦ 1039.10
N IV0 951 .64 0 .0 001♦ 1237.31
NCMC0 990 .26 0 .0 001♦ 1101.79
NIMC0 94 6 .62 0 .0 001
♦ 1254.92NSud
0 1042.06 0 .0 001♦ 920 .02
CycC0 961 .42 0 .0 001♦ 1202.98
NPubM0 965 .76 0 .0001♦ 1187.77
N P riM0 927 .49 0 .0 001♦ 1322.03
CC0 959 .24 0 .0 001♦ 1210.64a0 1006.61 0 .2 258♦ 1044.43s0 792 .06 0 .0 001♦ 1797.23
LOC0 951 .99 0 .0 001♦ 1236.08
NOS0 951 .56 0 .0 001♦ 1237.58
LC0 955 .79 0 .0 001♦ 1222.75
NMS0 94 0 .94 0 .0 001♦ 1 2 7 4 .8S
NP0 934 .41 0 .0001♦ 1297.75
*0 = RInheritZeroOne, number of samples =1579 *+ = RInheritPlus, number of samples = 450
84
Reproduced with permission of the copyright owner. Further reproduction prohibited without permission.

Table 4.5. RExt: nonparametric test between classes that are reused(+) vs. classes that are not reusedfO and 1)
*0 = RExtZeroOne, number of samples =1775 *+ = RExtPlus, number of samples = 254
85
Reproduced with permission of the copyright owner. Further reproduction prohibited without permission.
^

At a = 0.05, the mean metric values of { NDSub, NSub, NOM, NIM, NCV, NIV, NCMC,
NIMC, NSup, CycC, NPubM, NPriM, CC, U, S, LOC, NOS, LC, NMS, and NP } are
significantly different between classes in RExtPlus and RExtZeroOne.
4.123 Inter-application reuse as a server
Except for 5, results from the t-tests and nonparametric tests were the same for
inter-application reuse as a server. Table 4.6 presents the nonparametric test results for
the groups RServPlus and RServZeroOne. At a = 0.05, the mean metric values of {
NOM, NIM, NCV, NIV. NCMC, NIMC, NSup, CycC, NPubM, NPriM, CC, U, LOC,
NOS, LC, NMS, and NP } are significantly different between classes in RServPlus and
RServZeroOne.
The mean metric values of {NDSub, NSub, and S } are not significantly different
between classes in RServPlus and RServZeroOne.
A summary of the results relative to the question “Are the population means of
the reusable and non-reusable groups the same?” follows:
• Classes in RInheritPlus have significantly neater mean { NDSub, NSub, NOM, NIM,
NIV, NCMC, NIMC, CycC, NPubM, NPriM, CC, U, S, LOC, NOS, LC, NMS and NP
} metric values than those in RInheritZeroOne, at a = 0.05.
• Classes in RInheritPlus have significantly lower mean { NSup } metric values than
those in RInheritZeroOne, at a = 0.05.
• The mean metric values of NCV are not significantly different between classes in
RInheritPlus and RInheritZeroOne.
86
Reproduced with permission of the copyright owner. Further reproduction prohibited without permission.

Table 4.6. RServ: nonparametric test between classes that are reused(+)vs. classes that are not reused(0 and 1)
Mean P ro t» IZ INDSub
0 * 10 06 .5 1 0 .1 4 3 9*• 1037 .82
NSUb0 10 06 .1 0 0 .1 2 5 8♦ 10 38 .9 2era0 8 8 4 .85 0 .0 0 0 1* 13 64 .9 8
NIM0 9 2 0 .2 7 0 .0 0 0 1♦ 1269.73
NCV0 9 5 9 .37 0 .0 0 0 1* 1 1 64 .5 8
N IV0 9 3 1 .43 0 .0 0 0 1♦ 1238 .36
NCMC0 9 1 7 .56 0 .0 0 0 1♦ 12 77 .0 1
NIMC0 9 27 .63 0 .0 0 0 1♦ 1249.93
NSUD0 10 50 .3 9 0 .0 001♦ 9 1 9 .8 0
CvcC0 9 1 3 .2 9 0 .0 001♦ 1288 .49
NPubM0 9 0 6 .81 0 .0 001♦ 1305 .92
N P riM0 90 5 .33 0 .0 001♦ 1309 .90
CC0 9 4 7 .0 0 0 .0 001+ 1197.83u0 9 6 2 .7 0 0 .0 0 0 1* 1155 .62s0 1006.00 0 .1 217. 1039 .18
LOC0 9 3 2 .0 7 0 .0 0 0 1♦ 1237.98
NOS0 9 3 2 .72 0 .0 0 0 1♦ 1236.23
LC0 9 3 5 .24 0 .0 001♦ 1229.46
NMS0 9 3 5 .26 0 .0 0 0 1♦ 1229.42
NP0 9 2 3 .69 0 .0 0 0 1
1260.5236
*0 = RServZeroOne, number of samples =1479 *+ = RServPlus, number of samples = 550
87
Reproduced with permission of the copyright owner. Further reproduction prohibited without permission.
• Classes in RExtPlus have significantly greater mean { NDSub, NOM, NIM, NCV,
NIV, NCMC, NIMC, CycC, NPubM, NPriM, CC, S, LOC, NOS, LC. NMS. and NP }
metric values than those in RExtZeroOne, at a = 0.05.
• Classes in RExtPlus have significantly lower mean { NSup } metric values than those
in RExtZeroOne, at a = 0.05.
• The mean metric values of { NSub, U } are not significantly different between
classes in RExtPlus and RextZeroOne.
• Classes in RServPlus have significantly greater mean { NOM, NIM, NCV, NIV,
NCMC, NIMC, CycC, NPubM, NPriM, CC, U, S, LOC, NOS, LC, NMS, and NP }
metric values than those in RServZeroOne, at a = 0.05.
• Classes in RServPlus have significantly lower mean { NSup } metric values than
those in RServZeroOne, at a = 0.05.
• The mean metric values of { NDSub, NSub } are not significantly different between
classes in RServPlus and RServZeroOne.
4.2 Stepwise Regression
Next we answer the question: Are there object-oriented metrics that can predict
RInherit, RExt and RServl The results of stepwise regression for the dependent variables
RInherit, RExt and RServ are discussed in Sections 4.2.1 through Section 4.2.3.
4.2.1 Inheritance-based reuse
The results of the last step of stepwise multiple linear regression for the
dependent variable RInherit are presented in Table 4.7 and a summary is presented in
Table 4.8. From Table 4.7, the p-value, labeled “Prob>F’ is 0.0001. Since p-value is less
than 0.05, there is sufficient evidence to reject Ho.
88
Reproduced with permission of the copyright owner. Further reproduction prohibited without permission.
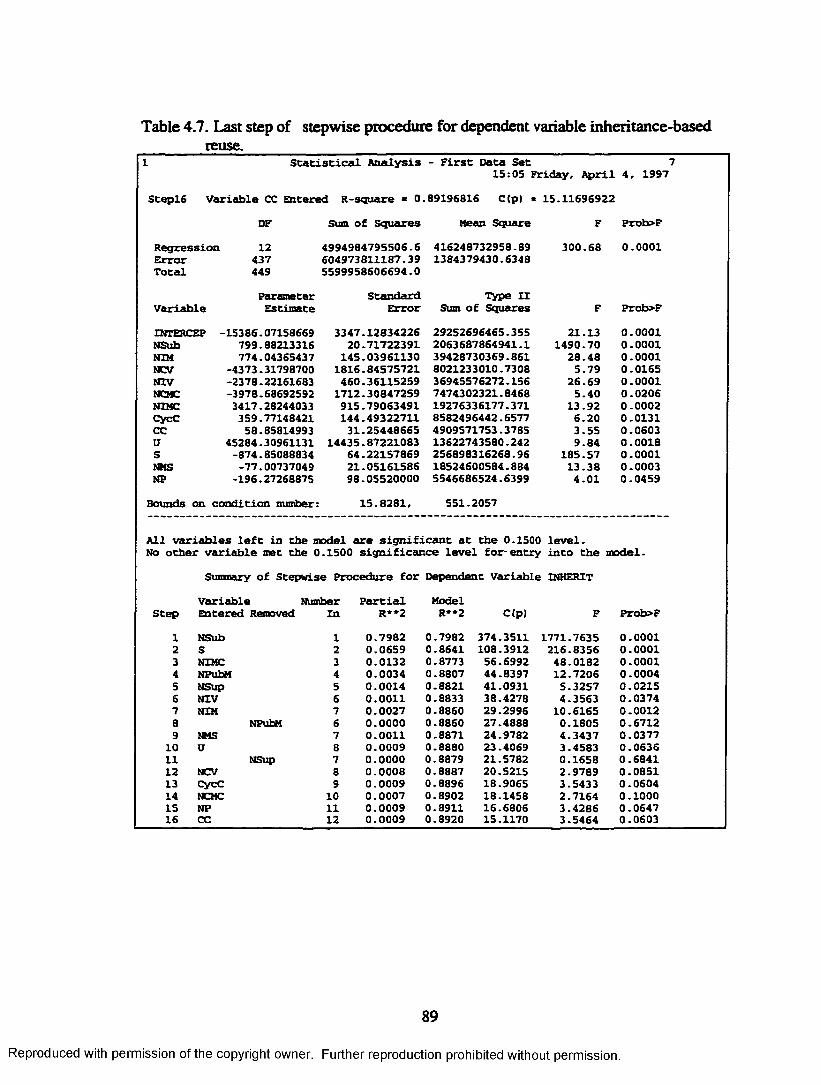
Table 4.7. Last step of stepwise procedure for dependent variable inheritance-basedreuse.
1 Statistical Analysis - First Data Set 715:05 Friday, April 4, 1997
scep!6 Variable CC Entered R-square - 0 .89196816 C(p) = 15.11696922DF Sum of Squares Mean Square F Prob>P
Regression 12 4994984795506.6 416248732958.89 300.68 0.0001Error 437 604973811187.39 1384379430.6348Total 449 5599958606694.0
Parameter Standard Type IIVariable Estimate Error Sum of Squares F Prob»PINTERCEP -15386.07158669 3347.12834226 29252696465.355 21.13 0.0001NSub 799.88213316 20.71722391 2063687864941.1 1490.70 0.0001NZM 774.04365437 145.03961130 39428730369.861 28.48 0.0001MCV -4373.31798700 1816.84575721 8021233010.7308 5.79 0.0165NIV -2378.22161683 460.36115259 36945576272.156 26.69 0.0001NCMC -3978.68692592 1712.30847259 7474302321.8468 5.40 0.0206NIMC 3417.28244033 915.79063491 19276336177.371 13.92 0.0002CycC 359.77148421 144.49322711 8582496442.6577 6.20 0.0131CC 58.85814993 31.25448665 4909571753.3785 3.55 0.0603U 45284.30961131 14435.87221083 13622743580.242 9.84 0.0018s -874.85088834 64.22157869 256898316268.96 185.57 0.0001NMS -77.00737049 21.05161586 18524600584.884 13.38 0.0003NP -196.27268875 98.05520000 5546686524.6399 4.01 0.0459Bounds on condition number: 15.8281, 551.2057
All variables left in the model are significant at the 0.1500 level.NO other variable met the 0.1500 significance level for-entry into the model.
Summary of Stepwise Procedure for Dependent Variable INHERITVariable Number Partial Model
Step Entered Removed In R**2 R**2 C{p) F Prob>F1 NSub 1 0.7982 0.7982 374.3511 L771.7635 0.00012 S 2 0.0659 0.8641 108.3912 216.8356 0.00013 NIMC 3 0.0132 0.8773 56.6992 48.0182 0.00014 NPubM 4 0.0034 0.8807 44.8397 12.7206 0.00045 NSup 5 0.0014 0.8821 41.0931 5.3257 0.02156 NIV 6 0.0011 0.8833 38.4278 4.3563 0.03747 NXM 7 0.0027 0.8860 29.2996 10.6165 0.00128 NPubM 6 0.0000 0.8860 27.4888 0.1805 0.67129 NMS 7 0.0011 0.8871 24.9782 4.3437 0.0377
10 U 8 0.0009 0.8880 23.4069 3.4583 0.063611 NSup 7 0.0000 0.8879 21.5782 0.1658 0.684112 NCV 8 0.0008 0.8887 20.5215 2.9789 0.085113 CycC 9 0.0009 0.8896 18.9065 3.5433 0.060414 NCMC 10 0.0007 0.8902 18.1458 2.7164 0.100015 NP 11 0.0009 0.8911 16.6806 3.4286 0.064716 CC 12 0.0009 0.8920 15.1170 3.5464 0.0603
89
Reproduced with permission of the copyright owner. Further reproduction prohibited without permission.

Table 4.8. Summary of stepwise procedure for dependent variable inheritance-based reuse.
Variable ParameterEstimate
Model R2 Prob > F
Intercept -15386.1NSub 799.9 0.7982 0.0001S -874.8 0.8641 0.0001NIMC 3417.3 0.8773 0.0001NTV -2378.2 0.8833 0.0374NIM 774.0 0.8860 0.0012NMS -77.0 0.8871 0.0377n 45284.3 0.8880 0.0636NCV -4373.3 0.8887 0.0851CycC 359.8 0.8896 0.0604NCMC -3978.7 0.8902 0.1000NP -196.3 0.8911 0.0647CC 58.9 0.8920 0.0603n=449
90
Reproduced with permission of the copyright owner. Further reproduction prohibited without permission.

There is sufficient evidence that the dependent variable Rlnherit is linearly related to a
subset of the 20 metrics. Inheritance-based reuse can be predicted by using the 12
metrics NSub, S, NIMC, NIV, NIM, NMS, U, NCV, CycC, NCMC, NP, and CC. The
prediction equation is
Predicted Rlnherit = -15386.1 + 799.9*NSub - 874.8*5 + 3417.3*MMC -
2378.2*MV + 11 A*NIM - H *NM S + 45284.3*C - 4313.3*NCV+
359.8*CycC - 3978.7*AOfC - 196.3*M> + 58.9*CC. (4.1)
The coefficient of determination R2 represents the variation in the dependent
variable that is explained by the model [Mye90]. From Table 4.7, R2 = 0.8919. This
value means that 89% of the variability of inheritance-based reuse is accounted for by the
independent variables in the multiple regression model. NSub with partial Z?2 = 0.7982,
contributed most heavily to the model Z?2. 5 is the second largest contributor with a
partial Z?2 contribution of 0.0659. This finding suggests that the number of all subclasses
of a class is a good predictor of inheritance-based reuse. A two-variable regression
model using NSub and 5 as independent variables was fitted. From Table 4.9, the model
Z?2 is 86% and the two-variable prediction equation is
Predicted Rlnherit = -267.68 + 911.01 * NSub - 969.49 * 5. (4.2)
4^ 2 Inter-application reuse by extension
The results of the last step of stepwise multiple linear regression for the
dependent variable RExt are presented in Table 4.10 and a summary is presented in Table
4.11. From Table 4.10, the p-value is 0.0001 < 0.05. This implies that there is sufficient
evidence to reject Ho- The dependent variable RExt is linearly related to a subset of the
91
Reproduced with permission of the copyright owner. Further reproduction prohibited without permission.

Reproduced
with perm
ission of the
copyright ow
ner. Further
reproduction prohibited
without
permission.
Table 4.9. Summary of 2-variable stepwise procedure for dependent variable inheritance-based reuse.Rlnherit SUMMARY OUTPUT - 2-Variable Regression (NSub and S)
Regression StatisticsMultiple R 0.929569988R Square 0.864100363Adjusted R Square 0.86349231Standard Error 41261.76449Observations 450
ANOVAdf SS MS F Significance F
Regression 2 4.83893E+12 2.42E+12 1421.096 1.8806E-194Residual 447 7.61032E+11 1.7E+09Total 449 5.59996E+12
Coefficients Standard Error tStat P-value Lower 95% Upper 95% Lower Upper95.0% 95.0%
Intercept -267.6771379 1991.820325 -0.13439 0.8931561 •4182.174083 3646.8198 -4182.1741 3646.81981NSub 911.0980634 17.33586803 52.55566 1.89E-193 877.0281216 945.16801 877.028122 945.168005s -969.4893633 65.83817414 -14.7253 2.696E-40 •1098.880217 -840.0985 -1098.8802 •840.09851
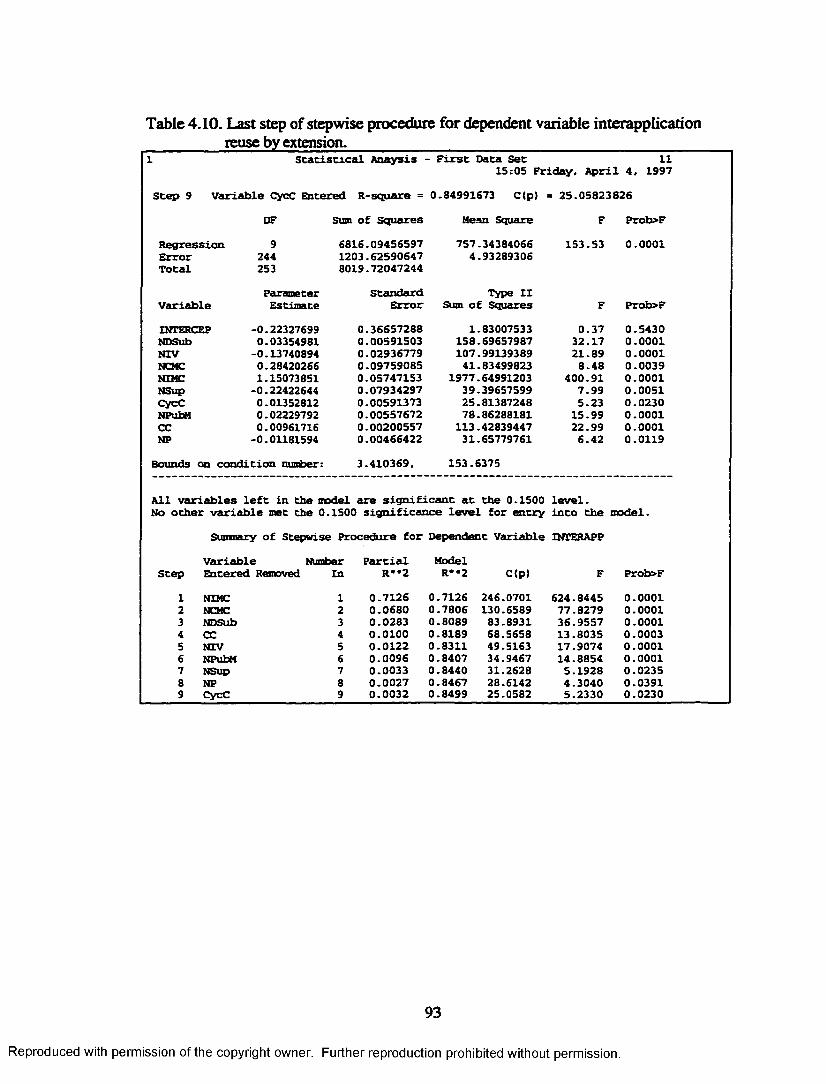
Table 4.10. Last step of stepwise procedure for dependent variable interapplicationreuse by extension.
1 Statistical Anaysis - First Data Set 1115:05 Friday. April 4, 1997
Step 9 Variable CycC filtered R-square - 0.84991673 C(p) = 25.05823826DF Sum of Squares Mean Square F Prob»F
Regression 9 6816.09456597 757.34384066 153.53 0.0001Error 244 1203.62590647 4.93289306Total 253 8019.72047244
Parameter Standard Type IIVariable Estimate Error Sum of Sqiiares F Prob>FIOTERCEP -0.22327699 0.36657288 1.83007533 0.37 0.5430NDSub 0.03354981 0.00591503 158.69657987 32.17 0.0001NIV -0.13740894 0.02936779 107.99139389 21.89 0.0001NCMC 0.28420266 0.09759085 41.83499823 8.48 0.0039NIMC 1.15073851 0.05747153 1977.64991203 400.91 0.0001NSup -0.22422644 0.07934297 39.39657599 7.99 0.0051CycC 0.01352812 0.00591373 25.81387248 5.23 0.0230NPubM 0.02229792 0.00557672 78.86288181 15.99 0.0001CC 0.00961716 0.00200557 113.42839447 22.99 0.0001NP -0.01181594 0.00466422 31.65779761 6.42 0.0119Rounds on condition number: 3.410369. 153.6375
All variables left in the model are significant at the 0.1500 level.NO other variable met the 0.1500 significance level for entry into the model.
Sumnary of Stepwise Procedure for Dependent Variable INTERAPPVariable Number Partial Model
Step Entered Removed In R**2 R**2 C(p) F Prob>F1 NIMC 1 0.7126 0.7126 246.0701 624.8445 0.00012 NCMC 2 0.0680 0.7806 130.6589 77.8279 0.00013 NDSub 3 0.0283 0.8089 83.8931 36.9557 0.00014 CC 4 0.0100 0.8189 68.5658 13.8035 0.00035 NIV 5 0.0122 0.8311 49.5163 17.9074 0.00016 NPubM 6 0.0096 0.8407 34.9467 14.8854 0.00017 NSup 7 0.0033 0.8440 31.2628 5.1928 0.02358 NP 8 0.0027 0.8467 28.6142 4.3040 0.03919 CycC 9 0.0032 0.8499 25.0582 5.2330 0.0230
93
Reproduced with permission of the copyright owner. Further reproduction prohibited without permission.

Table 4.11. Summary o f stepwise procedure for dependent variable interapplication __________ reuse by extension.___________ _________ _________ _____________Variable Parameter
EstimateModel R2 Prob > F
Intercept -0.2233NIMC 1.1507 0.7126 0.0001NCMC 0.2842 0.7806 0.0001NDSub 0.0335 0.8089 0.0001CC 0.0096 0.8189 0.0003NIV -0.1374 0.8311 0.0001NPubM 0.0223 0.8407 0.0001NSup -0.2242 0.8440 0.0235NP -0.0118 0.8467 0.0391CycC 0.0135 0.8499 0.0230n=253
94
Reproduced with permission of the copyright owner. Further reproduction prohibited without permission.

20 metrics. Inter-application reuse by extension can be predicted by using the 9 metrics
NIMC, NCMC, NDSuB, CC, NIV, NPubM, NSup, NP, CycC. The prediction equation is
Predicted RExt = -0.22 + I.15*MMC + Q2Z*NCMC +
0.03*NDSuB + 0.01*CC - 0.14*1VZV> 0.02 *NPubM -
0.22*NSup - 0.0l*NP+ 0.01*CycC. (4.3)
From Table 4.10, fl2 = 0.8499. This value means that 85% of the variability of
inter-application reuse by extension is accounted for by the independent variables in the
multiple regression model. NIMC with partial R2 = 0. 7126, contributed most heavily to
the model R2. It suggests that programmers should logically group instance methods
within a class by categorizing them since NIMC can be used to predict inter-application
reuse by extension. NCMC is next with partial R2 contribution = 0.0680. A two-variable
regression model using NIMC and NCMC as independent variables was fitted. From
Table 4.12, the model R2 is 78% and the two-variable prediction equation is
Predicted RExt = -1.36 + 0.81 * NIMC + 1.25 * NCMC. (4.4)
4.23 Inter-application reuse as a server
The results of the last step of stepwise multiple linear regression for the
dependent variable RServ are presented in Table 4.13 and a summary is presented in
Table 4.14. From Table 4.13, the p-value is 0.0001 < 0.05. This result implies that there
is sufficient evidence to reject Ho. The dependent variable RServ is linearly related to a
subset of the 20 metrics.
Since R2 = 0.059 is small, the variability in the dependent variable RServ cannot
be fully explained by the independent variables. Predicting inter-application reuse as a
95
Reproduced with permission of the copyright owner. Further reproduction prohibited without permission.

Reproduced
with perm
ission of the
copyright ow
ner. Further
reproduction prohibited
without
permission.
Table 4.12. Summary of 2 variable regression procedure for dependent variable interapplication reuse by extension.SUMMARY OUTPUT
Regression StatisticsMultiple R 0,883531R Square 0.780627Adjusted R Square 0.778879Standard Error 2.64749Observations 254
ANOVAdf SS MS F Significance F
Regression 2 6260.410896 3130.205 446.5852 2.08195E-83Residual 251 1759.309576 7.009201Total 253 8019.720472
Coefficient Standard Error tStat P-value Lower 95% Upper 95% Lower Upper 95.0%s 95.0%
Intercept -1.35965 0.252360233 -5.38772 1.64E-07 -1.856660541 -0.86263 -1.856661 -0.8626334NCMC 0.809201 0.091725261 8.822012 1.94E-16 0.62855207 0.989851 0.6285521 0.98985067NIMC 1.252544 0.053566039 23.38317 5.7E-65 1.147047648 1.35804 1.1470476 1.35804007
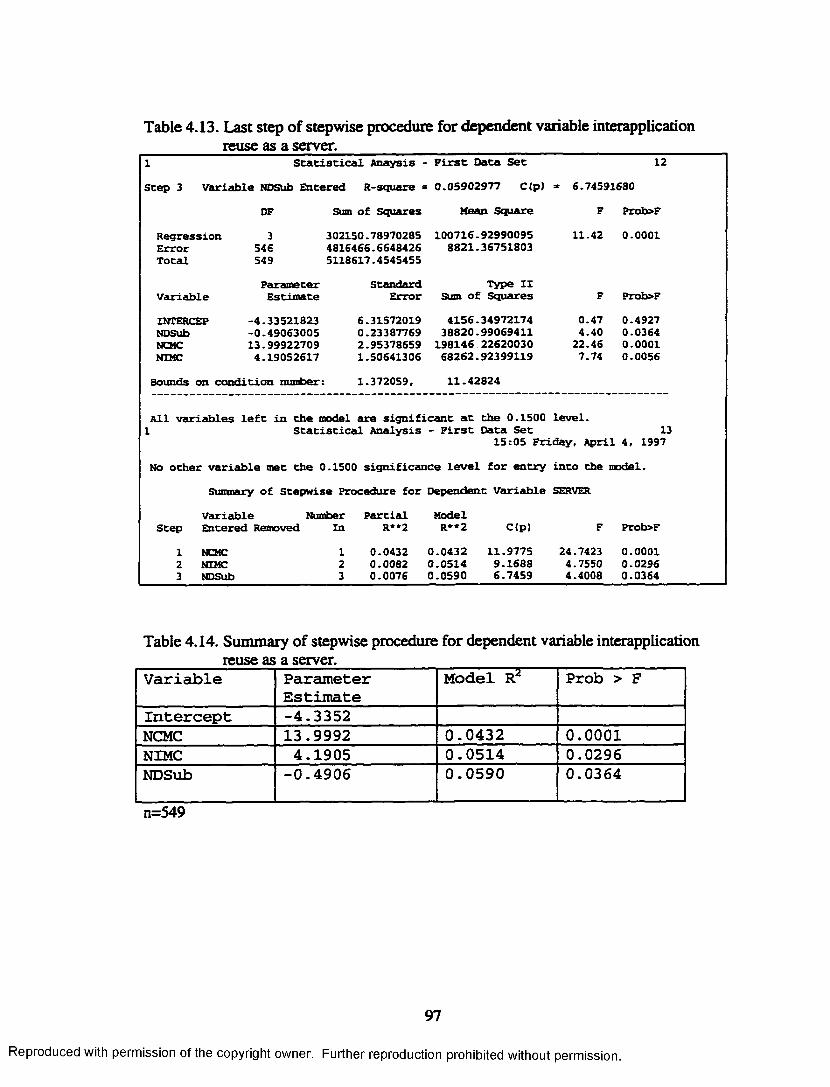
Table 4.13. Last step of stepwise procedure for dependent variable interapplication reuse as a server. _______________ ___
1 Statistical Anaysis First Data Set 12Step 3 Variable NDSub Entered R-square = 0.05902977 C(p) * 6.74591680
DP Sum of Squares Mean Square F Prob>FRegression 3 302150.78970285 Error 546 4816466.6648426 Total 549 5118617.4545455
100716.929900958821.36751803
11.42 0.0001
Parameter Standard Variable Estimate Error
Type II Sum of Squares F Prob>F
INTERCEP -4.33521823 6.31572019 NDSub -0.49063005 0.23387769 NCHC 13.99922709 2.95378659 NIMC 4.19052617 1.50641306
4156.34972174 38820.99069411 198146 22620030 68262.92399119
0.474.4022.467.74
0.49270.03640.00010.0056
Bounds on condition number: 1.372059. 11.42824
All variables left in the model are significant at the 0.1500 level.1 Statistical Analysis - First Data Set 13
15:05 Friday, April 4, 1997NO other variable met the 0.1500 significance level for entry into the model.
Sumnary of Stepwise Procedure for Dependent Variable SERVERVariable Number Partial
Step Entered Removed In R**2Model R**2 C(p) F Prob>F
1 NCMC 1 0.04322 NIMC 2 0.00823 NDSub 3 0.0076
0.0432 11.9775 0.0514 9.1688 0.0590 6.7459
24.74234.75504.4008
0.00010.02960.0364
Table 4.14. Summary of stepwise procedure for dependent variable interapplication reuse as a server.
Variable ParameterEstimate
Model R Prob > F
Intercept -4.3352NCMC 13.9992 0.0432 0.0001NIMC 4.1905 0.0514 0.0296NDSub -0.4906 0.0590 0.0364
n=549
97
Reproduced with permission of the copyright owner. Further reproduction prohibited without permission.

server by using a linear regression model is not meaningful. There is a possibility that
the relationship of RServ with the 20 metrics is not linear. Hence, a second order
regression equation was fitted with the stepwise regression procedure summary in Table
4.15. However F? is still small with a value of 0.1.
To summarize, Ho is rejected for inheritance-based reuse and inter-application
reuse by extension and Ho is not rejected for inter-application reuse as a server. Also, it
was shown that the number of all subclasses of a class is a good predictor of inheritance-
based reuse and that the number of instance method categories is a good predictor of
inter-application reuse by extension. Inter-application reuse as a server, on the other
hand, does not have a significant linear relationship with the 20 metrics.
43 Statistical Validation
We answer the question: Are the prediction equations from Section 4.2.
empirically valid? We list these prediction equations again as follows:
Predicted Rlnherit = -267.68 + 911.01 * NSub - 969.49 * S. (4.2)
Predicted RExt - -1.36 + 0.81 * NIMC +1.25 * NCMC. (4.4)
Table 4.16 shows the results of a simple regression analysis with predicted
RInheritpndicud from the two-variable regression equation (4.2). as the dependent variable,
and RInheritactuai from the new set of data as the independent variable. The resulting
regression equation with R2 = 0.9155 is:
Predicted RInheritpredkud = 1651.3 + 0.3161 * RInheritaauai (4.5)
98
Reproduced with permission of the copyright owner. Further reproduction prohibited without permission.

Table 4. IS. Summary of second order multiple regression procedure for dependent _________ variable interapplication reuse as a server._________________________Seep 8 Variable METRIC16 Entered. R-square = 0.10076030 C(p) = 0.80711921
DF Sum of Squares Mean Square F Prob>FRegression 8 515753.41241198 64469.17655150 7.58 0.0001Error 541 4602864.0421335 8508.06662132Total 549 5118617.4545455
Parameter Standard Type IIVariable Estimate Error Sum of Squares F Prob>FINTERCEP -16.82748626 7.79529110 39646.48553235 4.66 0.0313NSub -0.36643805 0.17886208 35710.46325782 4.20 0.0410NIV -1.54294601 0.86708950 26940.42792553 3.17 0.0757NCMC 12.75529190 3.02993257 150780.70133615 17.72 0.0001NIMC 17.47128154 4.04041491 159084.72282758 18.70 0.0001LOC -0.24090502 0.09289691 57216.33760640 6.72 0.0098LC 0.08386972 0.02825005 74989.88869095 8.81 0.0031NSub'NSub 0.00030570 0.00009216 93617.42737624 11.00 0.0010NIMC«NIMC -1.17784438 0.31166703 121513.62572120 14.28 0.0002
Bounds on condition number: 38.57608, 1421.334
All variables le£e in the model are significant at the 0.1500 level.No other variable met the 0.1500 significance level for entry into the model.1 Statistical Anaysis - First Data Set 36
15:51 Friday, April 4, 1997Sumnary of Stepwise Procedure for Dependent Variable SERVER
Variable Number Partied. ModelStep Entered Removed In R**2 R**2 Ctp) F Prob>F
1 NCMC 1 0.0432 0.0432 20.9122 24.7423 0.00012 NIMC 2 0.0082 0.0514 18.0266 4.7550 0.02963 NIMC*NIMC 3 0.0107 0.0622 13.6596 6.2563 0.01274 NSub*NSub 4 0.0086 0.0708 10.5772 5.0309 0.02535 NSub 5 0.0070 0.0778 8.4235 4.1353 0.04256 NTV 6 0.0052 0.0830 7.3556 3.0659 0.08057 LC 7 0.0066 0.0896 5.4302 3.9441 0.04758 LOC 8 0.0112 0.1008 0.8071 6.7250 0.0098
99
Reproduced with permission of the copyright owner. Further reproduction prohibited without permission.

Reproduced
with perm
ission of the
copyright ow
ner. Further
reproduction prohibited
without
permission.
Table 4.16. Empirical validation regression for Rlnherit.
Regression StatisticsMultiple R 0.956837R Square 0.915536Adjusted R Square
0.915348
Standard Error 30204.45Observations 450
ANOVAdf SS MS F Significance F
Regression 1 4.43E+12 4.43E+12 4856.046 1.5E-242Residual 448 4.09E+11 9.12E+08Total 449 4.84E+12
Coefficients StandardError
tS tat P-value Lower95%
Upper95%
Lower95.0%
Upper95.0%
Intercept 1651.304 1427.353 1.1569 0.24793 -1153.83 4456.44 -1153.83 4456.44Actual 0.316132 0.004537 69.68534 1.5E-242 0.307216 0.325047 0.307216 0.325047

Known data points correlated highly with predicted values. The graph of Figure 4.2
shows that the prediction equation (4.2) performed satisfactorily since the line
corresponding to equation (4.5) is almost similar to the line
Rlnheritpredkud ~ Rlnherit^ ^ i (4.6)
Equation (4.6) is the ideal case when the Rlnherit values obtained from the two-
variable prediction equation (4.2) accurately predicted the new Rlnherit values from the
new set of data.
Table 4.17 shows the results of a simple regression analysis with predicted
RExtpre&ud from the two-variable regression equation (4.4) as the dependent variable,
and RExtacuai from the new set of data as the independent variable. The resulting
regression equation with R1 = 0.7042 is:
Predicted RExtpraiic[ed = 2.436 + 0.937 * RExtaauai (4.7)
Known data points correlated highly with predicted values. The graph of Figure 4.3
shows that the prediction equation (4.4) performed satisfactorily since the line
corresponding to equation (4.7) is almost similar to the line
RExtpntBaed ~ RExtaauat (4.8)
Equation (4.8) is the ideal case when the RExt values obtained from the two-variable
prediction equation (4.4) accurately predicted the new RExt values from the new set of
data.
To summarize, the prediction equations (4.2) and (4.4) were compared
with known data points and were shown to be correlated. Equations (4.2) and (4.4) are
empirically valid.
101
Reproduced with permission of the copyright owner. Further reproduction prohibited without permission.

Reproduced
with perm
ission of the
copyright ow
ner. Further
reproduction prohibited
without
permission.
Table 4.17. Empirical validation regression for RExt.
Regression StatisticsMultiple R 0.839194R Square 0.704247Adjusted R Square
0.703073
Standard Error 2.710604Observations 254
ANOVAdf SS MS F Significance F
Regression 1 4408.873 4408.873 600.061 1.3E-68Residual 252 1851.538 7.347374Total 253 6260.411
Coefficients StandardError
fSfaf P-value Lower95%
Upper95%
Lower95.0%
Upper 95.0%
Intercept 2.435928 0.184211 13.22357 1.13E-30 2.073139 2.798718 2.073139 2.798718Actual 0.936754 0.038241 24.49614 1.3E-68 0.861441 1.012066 0.861441 1.012066

VO
VO
VO
CVJOs
VO VOo o+ +ta taVO
U3
VOoB3
VOO voo vOo 8 ° voo+ + + +03 03 EH U3 123cn cs O
«33• 4 - Ju<
p sp ip aij
103
Reproduced with permission of the copyright owner. Further reproduction prohibited without permission.
Figu
re 4.
2. Rl
nher
it em
piric
al v
alida
tion
regr
essio
n gr
aph.

Reproduced
with perm
ission of the
copyright ow
ner. Further
reproduction prohibited
without
permission.
50 -- I Data Points■— Predicted = 0.94*Actual + 2.44
r 2 = 0.70 Predicted = Actual40 --
20.0 30.0 40.0 50.010.0
-10
Actual
Figure 4.3. RExt empirical validation regression graph.

4.4 Other Statistical Analysis
Section 4.4 answers the following questions:
1. Are any of the 20 metrics in the reusable groups correlated?
2. Are Rlnherit, RExt and RServ correlated?.
4.4.1 Correlation Among the Metrics in Group RInheritPlus
Table 4.18 shows the correlation coefficients r of the 20 metrics and Rlnherit.
The metric pairs listed in Figure 4.4 have r values greater than 0.8.
Rlnherit is positively correlated with NSub. LOC is sufficient to measure size, since it is
highly correlated with NOS and NMS, which are harder to compute, hi the traditional
procedural programming paradigm, studies show that defects correlated with LOC and
Cyclomatic complexity [Wal79, Ram85, Cur79, Kan95]. hi this study, LOC is positively
correlated with LC. As the number of message sends by a class increases, its LC also
increases.
CycC is positively correlated with LC with r = 0.673. CycC is also positively
correlated with LOC with r =0.645.
The results from this section do not support [Lor94] claims that reuse encourages
lower levels of coupling and inheritance encourages higher levels of coupling.
4.4.2 Correlation Among the Metrics in Group RExtPIus
Table 4.19 shows the correlation coefficients r of the 20 metrics and RExt. The
metric pairs listed in Figure 4.5 have r values greater than 0.8. These results are very
similar to results for Rlnherit given in Figure 4.4. NIMC is positively correlated with
RExt, as was also shown in Chapter 4.2.2.
105
Reproduced with permission of the copyright owner. Further reproduction prohibited without permission.

Reproduced
with perm
ission of the
copyright ow
ner. Further
reproduction prohibited
without
permission.
Table 4.18. Pearson correlation coefficients of metrics in RInheritPlus.
NDSub NSub NOM NIM NCV NIV NCMC NIMC NSup CycCNDSub 1NSub 0.836978 1NOM 0.399393 0.416114 1NIM 0.267543 0.361406 0.936277 1NCV 0.059153 0.041233 0.446206 0.395884 1NIV -0.06866 -0.05089 0.518929 0.558221 0.248661 1NCMC 0.44744 0.299907 0.438291 0.185693 0.125715 0.016102 1NIMC 0.404206 0.535285 0.550709 0.596263 -0.00921 0.227529 0.30289 1NSup -0.08872 -0.10836 -0.02424 -0.01967 -0.11072 0.055987 -0.07211 0.013322 1CycC 0.238905 0.16569 0.75289 0.596638 0.483901 0.417314 0.520654 0.343789 0.076042 1NPubM 0.346955 0.324339 0.832242 0.755992 0.34197 0.279061 0.424745 0.400479 -0.10159 0.563787NPriM 0.33294 0.380326 0.866452 0.832147 0.413075 0.587239 0.325744 0.529254 0.052324 0.708895CC 0.099945 0.014473 0.467046 0.376791 0.220545 0.271389 0.330326 0.104603 0.18661 0.464882U -0.11471 -0.10417 •0.08695 -0.05752 0.029478 0.064804 -0.04208 -0.04018 -0.46559 -0.1191S 0.337636 0.433629 0.245367 0.121053 0.056467 -0.06039 0.349517 0.126096 -0.17181 0.215454LOC 0.104897 0.150968 0.815527 0.880212 0.459957 0.542506 0.110621 0.447091 0.133503 0.645058NOS 0.091818 0.140122 0.80484 0.866012 0.448724 0.548681 0.128543 0.470704 0.14785 0.675918LC 0.078238 0.12143 0.784988 0.842926 0.447202 0.518972 0.125937 0.446167 0.172161 0.67305NMS 0.100824 0.149361 0.824293 0.894308 0.397844 0.541612 0.107341 0.464565 0.114706 0.594015NP 0.285013 0.367033 0.850559 0.902832 0.336585 0.397265 0.175233 0.563433 •0.06919 0.547104Rlnherit 0.739348 0.893407 0.442635 0.433225 0.027287 -0.01909 0.222774 0.60457 -0.09509 0.171492
(Table continued)

Rlnh
erit
NP
CDCOoCD
o
NM
S
0.78
5334
I
©CO00o id
LC
0.94
1749
0.76
2581
10.
1870
11
SON
0.99
5708
0.95
2345
0.76
6161 CM
a>oCMo
001
0.98
761
0.98
5534 CM
CMCMinato 0.
7929
031 CO
o>CMCMCMCMO
to
0.04
2996
0.04
0009
0.03
944
0.04
6125
0.17
9153
0.15
6047
I -0
.144
69-0
.066
51-0
.064
79-0
.078
37-0
.036
25 CM
©l -0.0
3336
00
CM1"-COin©oI
I 0.
0605
220.
4740
430.
4742
570.
4864
530.
4469
66 CMCMCDCD3o 0.04
4904
NPr
iM
0.44
0607
-0.1
3972
0.16
3449
0.75
2905
0.76
5691
0.74
2309
0.74
8926 r-o
COoCM
d
0.40
223
! con
tinue
dN
PubM
0.44
4301
0.34
8792
98000 0-
i 0.
2365
750.
6273
130.
5939
370.
5842
80.
6474
60.
7258
17!
0.34
7605
Tabl
e 4.
18
NPu
bMN
PriM OO =3 CO LOC
SON
l 2 NM
SN
PR
lnhe
rit
107
Reproduced with permission of the copyright owner. Further reproduction prohibited without permission.

NSub and NDSub NIM and NOSNSub and Rlnherit NIM and LCNOM and NIM NIM and NMSNOM and NPubM NIM and NPNOM and NPriM LOC and NOSNOM and LOC LOC and LCNOM and NOS LOC and NMSNOM and NMS NOS and LCNOM and NP NOS and NMSNIM and NPriM LC and NMSNIM and LOC
Figure 4.4. Pairs in RInheritPlus with r-values > 0.8.
108
Reproduced with permission of the copyright owner. Further reproduction prohibited without permission.

Reproduced
with perm
ission of the
copyright ow
ner. Further
reproduction prohibited
without
permission.
Table 4.19. Pearson correlation coefficients of metrics in RExtPlusNDSub NSub NOM NIM NCV NIV NCMC NIMC NSup CycC
NDSub 1NSub 0.892212 1NOM 0.442065 0.425385 1NIM 0.291331 0.370706 0.928241 1NCV 0.023427 0.003991 0.4226 0.383162 1NIV -0.07022 •0.05523 0.521739 0.547585 0.246774 1NCMC 0.448255 0.268586 0.377026 0.126283 0.153835 -0.02414 1NIMC 0.502985 0.608676 0.458516 0.50409 -0.01412 -0.03133 0.364049 1NSup •0.12006 -0.13666 -0.09446 •0.09846 •0.20321 0.028234 -0.13573 -0.11215 1CycC 0.207183 0.11802 0.655281 0.50739 0.437204 0.430522 0.365538 0.160067 -0.03617 1NPubM 0.351368 0.303566 0.849154 0.789082 0.324727 0.296525 0.362143 0.394175 -0.13103 0.482931NPriM 0.39901 0.418609 0.84811 0.786387 0.392646 0.589469 0.277636 0.384032 •0.02914 0.629487CC 0.113863 -0.0009 0.479802 0.384215 0.19092 0.369461 0.290894 0.042257 0.006529 0.383289U -0.11786 -0.1022 -0.01869 0.011388 0.202882 0.08449 0.033786 0.04816 -0.46298 0.058487S 0.341135 0.413206 0.227999 0.091145 -0.00473 -0.05998 0.320364 0.121383 -0.1783 0.156394LOC 0.081472 0.123315 0.778139 0.848276 0.453426 0.646262 0.035752 0.259599 -0.0196 0.563974NOS 0.074365 0.116233 0.779992 0.844643 0.452662 0.63442 0.055337 0.273812 -0.02045 0.594639LC 0.054749 0.09379 0.760244 0.822443 0.458454 0.623642 0.051638 0.254917 -0.00637 0.585202NMS 0.092547 0.137818 0.801165 0.873691 0.427942 0.557898 0.029787 0.296497 -0.00254 0.509544NP 0.278793 0.361576 0.82235 0.883588 0.319438 0.435479 0.123569 0.471194 -0.17857 0.476309RExt 0.636014 0.62731 0.521887 0.4432 0.045856 -0.10223 0.550227 0.84416 •0.18959 0.271971
S
(Table continued
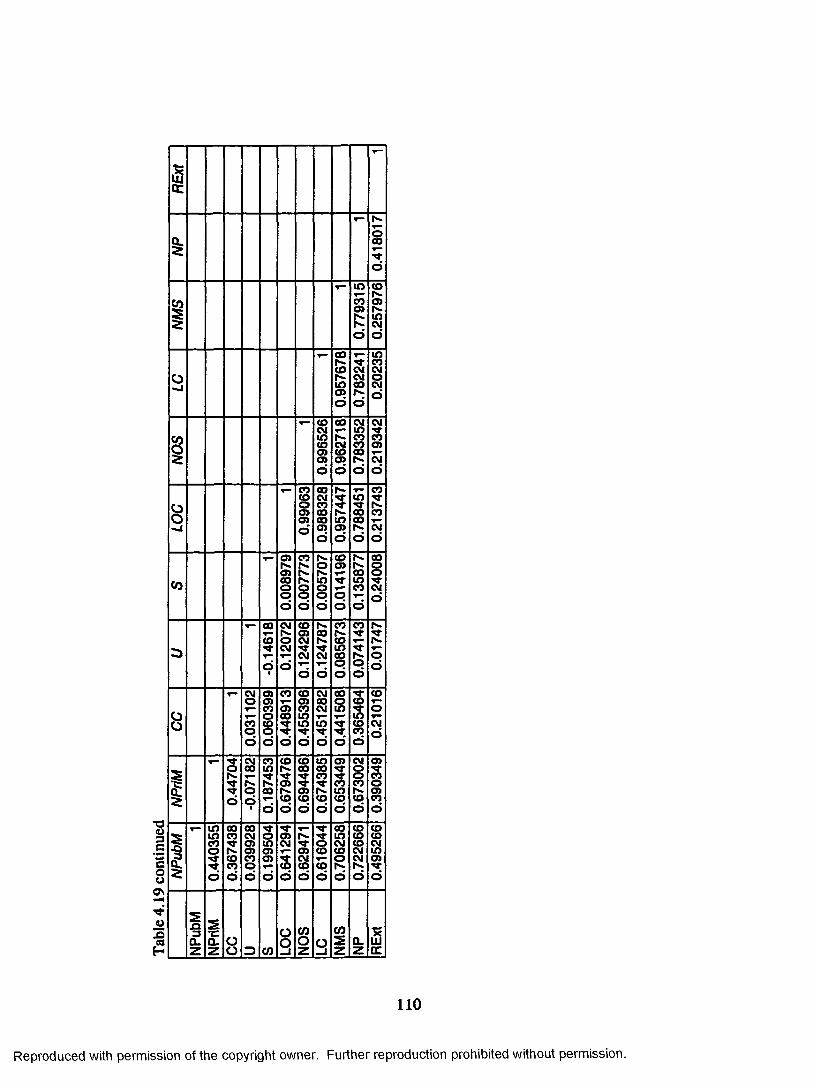
Table
4.1
9 co
ntin
ued
RExt
NP
Is -
©CO5o
NM
S
0.77
9315
0.25
7976
O- j
0.95
7678
I
CMCMCOI-"
o 0.20
235
SON
0.99
6526
0.96
2718
|
CMLT5COCO00o 0.
2193
42
LOC
0.99
063 CO
CMCOCOCO0 5
o 0.95
7447 CO■O"
COCOIs-
o 0.21
3743
CO
0.00
8979
0.00
7773
0.00
5707
0.01
4196
10.
1358
77 CO8CMo
•0.1
4618
0.12
072 CO
0 5CM-M-CM
o 0.12
4787 C O
COt oCOoo 0.
0741
430.
0174
7
00
0.03
1102
0.06
0399
0.44
8913
0.45
5396
0.45
1282
0.44
1508
0.36
5464
0.21
016
NPr
iM
0.44
704 CMCO
£od1 0.
1874
530.
6794
76 COCO-M -
0 5COo 0.
6743
850.
6534
490.
6730
020.
3903
49
NPu
bM
0.44
0355
0.36
7438 0 0CM0 50 5COoo 0.
1995
040.
6412
940.
6294
710.
6160
440.
7062
580.
7226
66 COCOCMin0 5
o
NPu
bMN
PriM
OO 3 CO LO
C
SON 3 (N
MS
|
CLz REx
t
110
Reproduced with permission of the copyright owner. Further reproduction prohibited without permission.
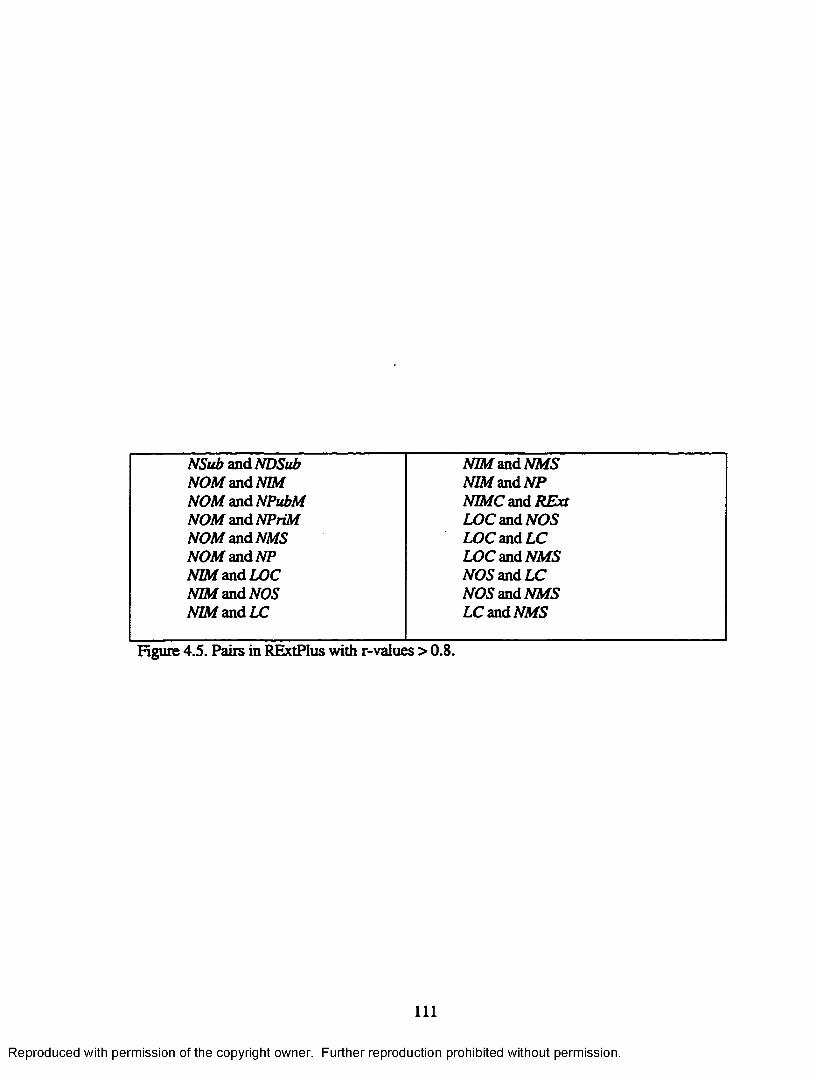
NSub and NDSub NIM and NMSNOM and MM NIM and NPNOM and NPubM NIMC and RExtNOM and NPriM LOC and NOSNOM and NMS LOC and LCNOM and NP LOC and NMSNIM and LOC NOS and LCNIM and NOS NOS and NMSNIM and LC LC and NMS
Figure 4.5. Pairs in RExtPlus with r-values > 0.8.
I l l
Reproduced with permission of the copyright owner. Further reproduction prohibited without permission.

4.43 Correlation Among the M etrics in Group RServPhis
Table 430 shows the correlation coefficients r of the 20 metrics and RExt. The
metric pairs listed in Figure 4.6 have r values greater than 0.8. These results are very
similar to for Rlnherit and RExt as shown in Figures 4.3 and 4.4
4.4.4 Correlation Among the Reuse Measures
Table 4.21 shows the correlation coefficients r of the proposed reuse measures
Rlnherit, RExt and RServ among each other. The computation is based on the
intersection of the sets RInheritPlus, RExtPlus and RServPlus, meaning that the data
points used are those with Rlnherit, RExt and RServ values greater than 1. Rlnherit and
RExt are correlated with r = 0.732158.
Table 4.22 shows the correlation coefficients r of the proposed reuse measures
Rlnherit, RExt, RServ, and Henderson-Sellers’ reuse ratio U, among each other. Data
points used are those with Rlnherit, RExt and RServ values greater than 1 and U values >
0.1. Rlnherit and RExt are slightly positively correlated with r = 0.556036. Rlnherit and
U are slightly negatively correlated with r = -0.36918.
In summary, the following metric pairs are correlated: NSub and NDSub, NSub and
Rlnherit, NOM and NIM, NOM and NPubM, NOM and NPriM, NOM and LOC, NOM
and NOS, NOM and NMS, NOM and NP, NIM and NPriM, NIM and LOC, NIM and
NOS, NIM and LC, NIM and NMS, NIM and NP, LOC and NOS, LOC and LC, LOC and
NMS, NOS and LC, NOS and NMS, LC and NMS, NIMC and RExt, NIMC and RExt.
Finally, RExt and Rlnherit are positively correlated.
112
Reproduced with permission of the copyright owner. Further reproduction prohibited without permission.

Reproduced
with perm
ission of the
copyright ow
ner. Further
reproduction prohibited
without
permission.
Table 4.20. Pearson correlation coefficients of metrics in RServPlus.NDSub NSub NOM NIM NCV NIV NCMC NIMC NSup CycC
NDSub 1NSub 0.90106 1NOM 0.401425 0.391323 1NIM 0.269519 0.336361 0.937761 1NCV 0.020773 0.011007 0.354377 0.263483 1NIV -0.04496 -0.03321 0.531022 0.567912 0.167354 1NCMC 0.412524 0.256341 0.328736 0.103018 0.152117 -0.06433 1NIMC 0.413111 0.49968 0.522096 0.574958 •0.02195 0.236678 0.25692 1NSup -0.07632 -0.08137 -0.04348 -0.03825 -0.20557 0.020931 •0.10169 0.040989 1CycC 0.210431 0.132955 0.635589 0.495458 0.339877 0.365389 0.372382 0.23864 0.021297 1NPubM 0.318625 0.280116 0.835282 0.78335 0.287263 0.280339 0.299901 0.360874 -0.10647 0.444697NPriM 0.353431 0.374681 0.839365 0.78707 0.306094 0.60708 0.250904 0.512597 0.032864 0.61871CC 0.121989 0.032893 0.430053 0.331422 0.159109 0.238861 0.294726 0.145722 0.123171 0.410051U -0.0871 -0.06935 -0.09633 •0.06644 0.089849 0.040745 -0.0507 -0.03499 -0.5745 -0.08162S 0.462782 0.413979 0.350052 0.181629 0.033283 •0.03669 0.416716 0.177834 -0.13754 0.267447LOC 0.107464 0.142512 0.818436 0.882119 0.300227 0.582392 0.028066 0.451541 0.024769 0.551193NOS 0.09644 0.131992 0.788135 0.845798 0.283299 0.586356 0.041922 0.474861 0.041609 0.579313LC 0.082202 0.114482 0.788873 0.845828 0.288563 0.554914 0.041743 0.447302 0.050634 0.571072NMS 0.109572 0.147408 0.816236 0.87745 0.301117 0.574984 0.032738 0.481746 0.029509 0.505816NP 0.227375 0.281147 0.795403 0.850771 0.194605 0.322384 0.087674 0.429691 -0.07437 0.370314RServ 0.040251 0.025738 0.067425 0.044942 0.010768 -0.03238 0.207846 0.141158 0.003072 0.106093
(Table continued

18
dN
0.06
8814
NM
S
0.66
4109
0.05
8785
O- o
0.94
6779
0.68
3702
0.07
6453
SON
0.99
2324
0.95
5394
0.63
414
0.06
8534
001
0.98
0777
0.98
506
0.94
6549
0.71
3732
0.05
1713
CO
0.09
5639
0.09
1175 COmCO00COo
d
COCMOCMov—o 0.
2018
480.
0219
39
5
-0.1
2465
-0.0
7291
-0.0
7483
-0.0
7797
-0.0
6152
•0.0
0891
-0.0
4695
00
•0.1
3223
0.15
5267
0.40
0759
0.41
5984
0.41
9697
0.40
3653
0.22
9229
0.09
1566
NPr
iM
0.42
8389
•0.1
3911
0.29
3951
0.72
9736
0.74
9957
0.72
2686
0.74
5553
0.53
597
0.04
4066
u<u3C
coo N
PubM
CM
Sio©
CMCMO0 5CMo •0.0
2154 CO
Sio >CMo 0.
6403
650.
5688
730.
5977
020.
6206
60.
7975
640.
0689
9
oCN
u3£ N
PubM
NPr
iM
oo Z) CO LO
C
SON
LC NM
SN
PR
Serv
114
Reproduced with permission of the copyright owner. Further reproduction prohibited without permission.

NSub and NDSub MM and NMSNOM and MM NIM and NPNOM and NPubM NIMC and RExtNOM and NPriM LOC and NOSNOM and LOC LOC and LCNOM and NMS LOC and AMS'NOM and NP NOS and LCMM and LOC NOS and NMSNIM and NOS LC and NMS.MM and LC
Figure 4.6 Pairs in RServPlus with r-values > 0.8.
115
Reproduced with permission of the copyright owner. Further reproduction prohibited without permission.

Table 4.21. Pearson correlation coefficient of RInherit, RExt and RServ.
Rinherit RExt RServRinherit 1Rext 0.732158 1Rserv -0.02852 0.024705 1
n=61Rinherit, RExt, RServ > 1
Table 4.22. Pearson correlation coefficient of U, RInherit, RExt and RServ.
U Rinherit RExt RServU 1Rinherit -0.36918 1RExt •0.12006 0.556036 1RServ 0.027779 0.057251 0.278479 1
n = 16Rinherit, RExt, RServ > 2U>.1
116
Reproduced with permission of the copyright owner. Further reproduction prohibited without permission.
4.5 Summary
In sixteen out of twenty OO metrics, there are significant mean differences
between the mean metric values of classes that have reuse values greater than one and
classes that have reuse values equal to zero or one. The only exceptions are: NCV for
inheritance-based reuse; U for inter-application reuse by extension; NDSub and NSub for
inter-application reuse as a server. Results show that the higher the values of { NOM.
NIM. NIV. NCMC. NIMC, CycC. NPubM. NPriM. CC. S. LOC. LC. NMS, NP }, the
class is at least two times more likely to be reused through inheritance, by extension from
another application, and as a server. On the other hand, the lower the values of NSup, the
class is at least two times more likely to be reused through inheritance, by extension from
another application, and as a server.
We found that object-oriented metrics have a statistical relationship with
inheritance-based reuse and inter-application reuse by extension. Two prediction
equations were derived relating these two reuse measures with OO metrics. The
contribution of NSub to the inheritance-based reuse model’s R2 is large, suggesting that
this metric should be calculated for inheritance-based reuse studies. For inter-application
reuse by extension, the major contributor to R2 is NIMC. This result suggests that the
number of logical grouping of methods within a class should be investigated when
studying inter-application reuse by extension. Inter-application reuse as a server does not
have a linear statistical relationship with the OO metrics in this study. Validation results
show that it is possible to predict whether a class from one application can be reused by
extension in another application. Lastly, LOC is positively correlated with LC; CycC is
positively correlated with LC; and Rinherit and RExt are positively correlated.
117
Reproduced with permission of the copyright owner. Further reproduction prohibited without permission.
Chapter 5. Summary and Conclusions
The role of measurement in any engineering discipline is important, hi the
software engineering discipline however, the progress of research in software
measurement has been either slow or lacking in theoretical basis. Added to this scenario
is the recent birth of the OO paradigm which is unlike the traditional procedural
paradigm. Proponents of OOP claim that reusability is an added benefit of the paradigm.
Software metrics for the traditional paradigm are abundant, but are criticized for having
little or no solid theoretical basis. Moreover, these metrics do not support new OO
concepts. The OOD metrics in [Chi94] are one of the most comprehensive and
successful attempts to provide a metrics suite for OOD. The feasibility of gathering and
statistically analyzing empirical data was also shown by recent studies.
This research investigated whether reusable classes can be characterized by OO
software metrics. The investigation was carried out by:
• proposing three quantitative measures of reuse in the object-oriented
paradigm (Rinherit, RExt, RServ)
• collecting metrics data from Smalltalk applications using an automated tool
• investigating the statistical relationship between object-oriented and
traditional metrics with the reuse measures
• deriving prediction models for measuring reusability using the object-oriented
metrics
• validating these prediction models with empirical data
For most of the OO metrics, there are significant mean differences between the
mean metric values of classes that have reuse values greater than one and classes that
118
Reproduced with permission of the copyright owner. Further reproduction prohibited without permission.

reuse values equal to zero or one. The only exceptions are: NCV for inheritance-based
reuse; U for inter-application reuse by extension; NDSub and NSub for inter-application
reuse as a server. It was shown that the higher the values of { NOM, NIM, NIV, NCMC,
NIMC, CycC, NPubM, NPriM, CC, S, LOC, LC, NMS, NP }, the class is at least two
times more likely to be reused through inheritance, by extension from another
application, and as a server. Moreover, it was shown that the lower the values of NSup,
the class is at least two times more likely to be reused through inheritance, by extension
from another application, and as a server.
Object-oriented metrics were shown to have a statistical relationship with
inheritance-based reuse and inter-application reuse by extension. Two prediction
equations were derived relating these two reuse measures with OO metrics. The
contribution of NSub to the inheritance-based reuse model’s F? is large, suggesting that
this metric should be calculated for inheritance-based reuse studies. For inter-application
reuse by extension, the largest contributor to R2 is NIMC. This suggests that the number
of logical grouping of methods within a class should be considered when studying inter-
application reuse by extension. Inter-application reuse as a server does not have a linear
statistical relationship with the OO metrics in this study.
Validation results show that it is possible to predict whether a class from one
application can be reused by extension in another application.
Lastly, the following metric pairs are correlated: NSub and NDSub, NOM and
NIM, NOM and NPubM, NOM and NPriM, NOM and LOC, NOM and NOS, NOM and
NMS, NOM and NP, NIM and NPriM, NIM and LOC, NIM and NOS, NIM and LC, NIM
and NMS, NIM and NP, LOC and NOS, LOC and LC, LOC and NMS, NOS and LC, NOS
119
Reproduced with permission of the copyright owner. Further reproduction prohibited without permission.

and NMS, LC and NMS, CycC and LC, NSub and Rinherit, NIMC and RExt, NIMC and
RExt, Rinherit and RExt.
5.1 Contributions Of This Research
To summarize, the contributions of this research are as follows.
• Three quantitative measures of reuse {Rinherit, RExt, RServ) in the object-
oriented paradigm were defined. These measures are based on OO concepts
such as inheritance and extensibility and hence, are appropriate in measuring
class reuse.
• lin ear regression results show that NSub can be used to predict reuse through
inheritance.
• Linear regression results show that NIMC can be used to predict inter-
application reuse by extension.
• A class metric collector (CMC) tool was implemented that can automatically
collect 20 metrics and Rinherit, RExt, RServ.
• T-test results can be used as guidelines in writing new reusable classes.
53. Future Work
This dissertation research can be extended in the following ways:
• Use other OO metrics and correlate them with Rinherit, RExt, RServ
• Use Java packages instead of Smalltalk applications and define Rinherit as was
defined here, RExt as inter-package reuse by extension, RServ as inter-package
reuse as a server.
120
Reproduced with permission of the copyright owner. Further reproduction prohibited without permission.

• Refine the definition of Rinherit to factor in the number of times a method from a
superclass C is actually used by C s subclasses.
• Replicate this study in other Smalltalk environments.
In summary, this research can be extended by: using other OO metrics to correlate
with Rinherit, RExt, RServ; refining the definition of Rinherit, and replicating this
study in other Smalltalk environments; using Java packages instead of Smalltalk
applications.
121
Reproduced with permission of the copyright owner. Further reproduction prohibited without permission.

References
Agresti, W.W and F. E. McGarry [Agr88]. The Minnowbrook Workshop On Software Reuse: A Summary Report. In Software Reuse: Emerging Technology. W. Tracz, ed. Computer Society Press, pp.33-40,1988.
Agresti, W. and W. Evanco [Agr92]. Projecting Software Defects in Analyzing Ada Designs. IF.HK Transactions on Software Engineering, vol. 18, no. 11, pp. 988-997.
Albrecht, A. and J. Gaffney [Alb83]. Software Function, source lines o f code, and development effort prediction: a software science validation. IEEE Transactions on Software Engineering, vol. 9, no. 6, pp. 639-648.
Bames, G. M. and B. R. Swim [Bar93]. Inheriting Software M etrics. Journal of Object- Oriented Programming. pp.27-34, November 1993.
Basili, V.R. et al. [Bas96]. A Validation o f Object-Oriented Design M etric as Quality Indicators. fRKK Transaction on Software Engineering, vol. 22, no. 10, pp. 751-761, October 1996.
Basili, V.R. et al. [BasB96]. Measuring the Impact o f Reuse on Software Quality and Productivity. Comm. ACM. vol. 39, no. 10, pp. 104-116, October 1996.
Beilin, D. and L. Reyes [BelR96]. An Introduction to the Smalltalk M etrics Analyzer. Department of Computer Science. NC A&T State University, January 1996.
Beilin, D. [Bel96]. A Smalltalk Metrics Tool. Department of Computer Science,NCA&T State University, January 1996.
Biggerstaff, T. and C. Richter [Big87], Reusability Framework, Assessment and Directions. IKHH Software, vol. 4, no.2, pp. 41-49, March 1987.
Booch, G. Object-Oriented Analysis and Design with Applications, 2nd ed.[Boo94] Benjamin Cummings Publishing Co. Inc., 1994.
Browne, J. et al. [Bro90]. Experimental Evaluation o f a Reusability-Oriented Parallel Programming Environment. IEEE Transactions on Software Engineering, vol. 16, no.2, pp. 111-120, June 1994.
Card, D. et al. [Car86]. An Empirical Study of Software Design Practices. IEEE Transactions on Software Engineering, vol. 12, no. 2, pp. 264-270.
Carroll, M D. and M. A. Ellis [Car95]. Designing and Coding Reusable C++. Addison-Wesley Publishing Co., 1995.
122
Reproduced with permission of the copyright owner. Further reproduction prohibited without permission.

Chen, D. and P. Lee. [Che93]. On the study of software reuse: using reusable C++ Components. Journal of Systems and Software, vol. 20, no. 1, pp. 19-36.
Chidamber, S. R. and C. F. Kemerer [Chi91]. Towards a Metrics Suite fo r Object Oriented Design. SIGPLAN Notices, vol.26, n o .ll, pp. 197-211, November 1991.
Chidamber, S. R. and C. F. Kemerer [Chi94]. A M etrics Suite fo r Object Oriented Design. IKKK Transactions on Software Engineering, vol. 20, no.6, pp. 476-493, June1994.
Chung, C M and M.C. Lee [Chu92]. Inheritance-based OO Software Metrics. IEEE Region 10 Conference, Tenson 92. Melbourne, Australia, pp. 628-632, November 1992.
Coad, P. andE. Yourdon [Coa9i]. Object-Oriented Design. Prentice-Hall, Lie., 1991.
Curtis, B. e t al. [Cur79]. Third Time Charm: Stronger Prediction o f Programmer Performance by Software Complexity Metrics. Proceedings of the Fourth International Conference on Software Engineering, pp. 356-360, July 1979.
Dennis, R J . [Den88]. Reusable ADA Software Guidelines. In Software Reuse: Emerging Technology. W. Tracz, ed. Computer Society Press, pp.257-264,1988.
Denicoff, M. and R. Grafton. [Den81]. Software Metrics: A Research Initiative. Li Software Metrics: An Analysis and Evaluation. A. Periis, e t al., editors. MIT Press, pp. 13-18,1981.
Ejiogu, L. O. [Eji91]. Software Engineering with Formal Metrics. QED Technical Publishing Group. Wellesley, MA, 1991.
Ejiogu, L. O. [Eji93]. Five Principles fo r the For the Formal Validation o f M odels o f Software Metrics. SIGPLAN Notices, vol.28, no.8, pp.67-76, August 1,1993.
Fenton, N. [Fen91]. Software Metrics: A Rigorous Approach. Chapman and Hall, 1991.
Fenton, N. and A. Melton [Fen90]. Deriving Structurally Based Software Measures. J. Systems Software, vol. 12, no.3, pp. 177-187, July 1990.
Fonash, P.M. [Fon93]. M etrics fo r Reusable Software Code Components. PhD.Dissertation. George Mason University, 1993.
Frakes, W. and C. Terry [Fra96]. Software Reuse: M etrics and Models. ACMComputing Surveys, vol. 28, no. 2, pp. 415-435, June 1996.
123
Reproduced with permission of the copyright owner. Further reproduction prohibited without permission.

Freeman, P. [Fre87]. Reusable Software Engineering: Concepts and Research Directions. In Tutorial:Software Reusability. P. Freeman, ed Computer Society Press of the IEEE, pp. 10-23,1987.
Gaffney, J.E. and T.A. Durek [Gaf89]. Software Reuse - Key to Enhanced Productivity: Some Quantitative Models. Information Software Technology, vol. 31, no. 5, pp. 258- 267.
Ghezzi, C., M. Jazayeri and D. Mandrioli [Ghe91]. Fundamentals o f Software Engineering. Prentice Hall, Englewood Cliffs, NJ, 1991.
Gilb, T. [Gil77]. Software Metrics. Winthrop Publishers, Inc. Cambridge, MA, 1977.
Grady, RJ3. and DJL. Caswell [Gra77]. Software Metrics: Establishing a Company- Wide Program. Prentice-Hall, Inc. Englewood Cliffs, NJ, 1987.
Hall, P.V. [Hal88]. Software components and reuse — Getting more out o f your code. In Software Reuse: Emerging Technology. W. Tracz, ed. Computer Society Press, pp. 12- 17,1988.
Henderson-Sellers, B. [Hen92], A Book o f Object-Oriented Knowledge: Object-Oriented Analysis, Design and Implementation: A New Approach to Software Engineering. Prentice Hall, 1992.
Henderson-Sellers, B.[Hen96]. Object-Oriented Metrics: Measures o f Complexity. Prentice Hall, 1996.
Horowitz, E. and J. B. Munson [Hor87]. An Expansive View o f Reusable Software. In Tutorial:Sofiware Reusability. P. Freeman, ed. Computer Society Press of the pp. 39-49,1987.
Jones, Capers [Jon91]. Applied Software Measurement: Assuring Productivity and Quality. McGraw-Hill, Inc., 1991.
Kan, STL [Kan95]. M etrics and Models in Software Quality Engineering. Addison- Wesley Publishing Company, 1995.
Karunanithi, J. and J.M. Bieman [Kai93]. Candidate Reuse Metrics fo r Object-Oriented and Ada Software. In Proceedings of IEEE-CS First International Symposium on Software Metrics, pp. 120-128,1993.
Keuffel, W. [Ke394]. The Metrics Minefield. Software Development, vol.2, no.3, pp. 19-25, March 1994.
124
Reproduced with permission of the copyright owner. Further reproduction prohibited without permission.

Keuffel, W. [Ke494]. Getting Started with Software M easurement. Software Development vol.2, no.4, pp. 33-38, April 1994.
Keuffel, W. [Ke594]. Metrics: Establishing a Process. Software Development vol.2, no.5, pp. 31-36, May 1994.
Keuffel, W. [Ke694]. Result M etrics: Use and Abuse. Software Development vol.2, no.6, pp. 27-31, June 1994.
Keuffel, W. [Ke794]. Predicting w ith Function Point Metrics. Software Development vol.2, no.7, pp. 27-35, July 1994.
Kitchenham, B. A., L. M. Pickard, and S. J. Linkman [Kit90]. An Evaluation o f Some Design Metrics. Software Engineering Journal, vol.5, no.l, pp. 50-58, January 1,1990.
Kolewe, R. [Kol93]. Metrics in Object-Oriented Design and Programming. Software Development vol.l, no.4, pp. 53-62, October 1993.
LaLonde, W. and J. Pugh. [LaL94]. Smalltalk: Gathering M etric Information Using Metalevel Facilities. Journal of Object-Oriented Programming, vol.7, no.l, pp. 33-37, March 1994.
Lew, T. et al. [Lew95]. Object Oriented Application Frameworks. Manning Publications Co., 1995.
Li, W., S. Henry [Li93]. Object Oriented Metrics that Predict M aintainability. The Journal of Systems and Software, vol.23, no.2, pp. 111-122. November 1,1993.
Lorenz, M. and J. Kidd. [Lor94]. Object-Oriented Software M etrics. PTR Prentice Hall, Englewood Cliffs, NJ, 1994.
Martin, R. [Mar95]. Object-Oriented Design Quality Metrics: An Analysis of Dependencies. ROAD. pp. 30 -33, Sept - Oct 1995.
McCabe, T J. and A. Watson [McC94-]. Software Complexity. CrossTalk. Dec 1994, pp. 5-9.
McClure, C.L. [McC92]. The Three Rs o f Software Automation: Re-engineering, Repository, Reuse. Prentice-Hall, Inc., 1992.
McGregor, J. D. and D. A. Sykes. [McG92]. Object-Oriented Software Development: Engineering Software fo r Reuse. Van Nostrand Reinhold, 1992.
McDroy, M.D. [McI76]. Mass-produced Software Components. Software Engineering Concepts and Techniques, 1968 NATO Conference in Software Engineering, J.M Buxton, etal. Eds., pp. 88-98,1976
125
Reproduced with permission of the copyright owner. Further reproduction prohibited without permission.
Melton, A. C. eL al. [MeI90]. A Mathematical Perspective fo r Software Measures Research. Software Engineering Journal, vol.5, no.5, pp. 246-254, September 1990.
Meyer, B. [Mey88]. Object-Oriented Software Construction. Series in Computer Science. Prentice Hall, 1988.
MS Office 95 [MS095]. MS Excel Data Analysis Help File. Microsoft Corporation,1995.
Myers, R.H. [Mye90]. Classical and Modem Regression with Applications, second edition. PWS-Kent Publishing Company, 1990.
Nielsen, K. [Nie92]. Object-Oriented Design with Ada: M aximizing Reusability fo r Real- Time Systems. Bantam Books, 1992.
OOPSLA 92. [OOP92] Addendum to the Proceedings. Workshop Report-Metrics fo r Object-Oriented Software Development. OOPS Messenger, vol.4, no.2, pp.97-100, April 1993.
OOPSLA 93.[OOP93] Addendum to the Proceedings. Workshop Report-Processes and M etrics fo r Object-Oriented Software Development. OOPS Messenger, vol.5, no.2, pp.95-98, April 1994.
Object Technology Institute [OTT96]. Code Metric Tool Class Comments. OTT, a subsidiary of IBM, 1996.
Prieto-Diaz, R. [Pri87]. Classifying Software fo r Reusability. In Tutorial:Software Reusability. P. Freeman, ed. Computer Society Press of the IEEE. pp. 106-116,1987.
Rambo, R. e t al. [Ram85]. Establishment and Validation of Software Metric Factors, Proceedings of the International Society of Parametric Analysts Seventh Annual Conference. Germantown, MD. pp. 406-417, May 1985.
Roche, J. M. [Roc94]. Software M etrics and Measurement Principles. ACM SIGSOFT. Software Engineering Notes, vol.19, no.l, pp. 77-85, January 1994.
SAS/Stat User's Guide, Version 6, fourth ed, voL 2[SAS90]. SAS Institute Inc., 1990.
SAS/Stat Language and Procedures, Version 6 first ed , vol. 2[SAS91]. SAS Institute Inc., 1991.
Schneidewind, N. F. [Sch92]. Methodology fo r Validating Software Metrics. IEEE Transactions on Software Engineering, vol.18, no.5, pp. 410-422, May, 1992.
126
Reproduced with permission of the copyright owner. Further reproduction prohibited without permission.

Schneidewind, N. F. [Sch93]. Report on IEEE Standard Software Quality Metrics Methodology. Software Engineering Notes, vol. 18, no.3, pp. A-95 - A-98, July 1,1993.
Shepperd, M. and D. Ince [She93]. Derivation and Validation o f Software Metrics. Oxford University Press, 1993.
Siegel, S. and N. J. Castellan, Jr. [Sie88]. Nonparametric Statistics fo r the Behavioral Sciences, Second Edition. McGraw-Hill Book Company, 1988.
Smith, JD . [Smi90]. Reusability and Software Construction: C and C++. John Wiley & Sons, Inc., 1991.
Tegarden, D P. et al. [Teg95]. A Software Complexity Model of Object-Oriented Systems. Decision Support Systems, vol. 13, pp. 241-262,1995.
Tracz, W.W [Tra88]. Software Reuse: M otivators and Inhibitors. In Software Reuse: Emerging Technology. W. Tracz, ed. Computer Society Press, pp.62-67,1988.
Tracz, W.W [Tra95]. Confessions o f a Used Program Salesman: Institutionalizing Software Reuse. Addison-Wesley Publishing Company, 1995.
VisualAge fo r Smalltalk User’s Guide: Version 3, Release 0 [VAG95]. International Business Machines Corporation, 1995,1996.
VisualAge fo r Smalltalk User’s Reference: Version 3, Release 0 [VAR95]. International Business Machines Corporation, 1995,1996.
Walsh, T J [Wal79]. A Software Reliability Study Using a Complexity Measure. Proceedings of the 1979 Computer Conference. Montville, NJ: AFIPS Press, pp. 761- 768,1979.
Wegner, P. [Weg87]. Varieties o f Reusability. In Tutorial:Software Reusability. Computer Society Press of the IEEE. P. Freeman, ed., pp. 24-38,1987.
Weisberg, S. [Wei85]. Applied Linear Regression. Wiley, NY, 1985.
Zuse, H. [Zus91]. Software Complexity: Measures and Methods. Walter de Gruyter, Berlin, 1991.
127
Reproduced with permission of the copyright owner. Further reproduction prohibited without permission.

Appendix A
128
Reproduced with permission of the copyright owner. Further reproduction prohibited without permission.

Glossary
application. - A collection of defined and extended classes that provides a reusable piece of functionality. An application contains and organizes functionally related classes. It also can contain subapplications and specify prerequisites.
class. The specification of an object, including its attributes and behavior. Once defined, a class can be used as a template for the creation of object instances. "Class," therefore, can also refer to the collection of objects that share those specifications. A class exists within a hierarchy of classes in which it inherits attributes and behavior from its superclasses, which exist closer to the root of the hierarchy. See also inheritance, metaclass, polymorphism, defined class, extended class, private class, public class, visible class.
class extension. An extension to the functionality of a class defined by another application. The extension consists of one or more methods that define the added functionality or behavior. These methods cannot modify the existing behavior of the defined class; they can only add behavior specific to the application that contains the extended class.
class hierarchy. A tree structure that defines the relationships between classes. A class has subclasses down the hierarchy from itself and superclasses up the hierarchy from itself. The methods and variables of a class are inherited by its subclasses.
class instance variable. Private data that belongs to a class. The defining class and each subclass maintain their own copy of the data. Only the class methods of the class can directly reference the data. Changing the data in one class does not change it for the other classes in the hierarchy. Contrast with class variable.
class method. A method that provides behavior for a class. Class methods are usually used to define ways to create instances of the class. Contrast with instance method.
class variable. Data that is shared by the defining class and its subclasses. The instance methods and class methods of the defining class and its subclasses can directly reference this data. Changing the data in one class changes it for all of the other classes. Contrast with class instance variable.
containing application. The application to which a class definition belongs. A class can only be defined in one application in the image. Also referred to as the defining application.
defined class. A new class that a containing application adds to the system. It consists of a textual definition (which defines elements such as instance variables) and zero or more methods (which define behaviors). Contrast with extended class.
129
Reproduced with permission of the copyright owner. Further reproduction prohibited without permission.

defining application. The application to which a class definition belongs. A class can only be defined in one application in the image. Also referred to as the containing application.
expression, hi Smalltalk, the syntactic representation of one or more messages. An expression can consist of subexpressions representing the receiver and arguments of the message. The expression can also cause the assignment of its result to one or more variables.
extended class. An class that uses and extends the functionality of a class defined by another application. It consists of one or more methods that define the added functionality or behavior. These methods cannot modify the existing behavior of the defined class; they can only add behavior specific to the application that contains the extended class. Contrast with defined class.
image. A Smalltalk file that provides a development environment on an individual workstation. An image contains object instances, classes, and methods. It must be loaded into the Smalltalk virtual machine in order to run.
inheritance. A relationship among classes in which one class shares the structure and behavior of another. A subclass inherits from a superclass.
instance. An object that is a single occurrence of a particular class. An instance exists in memory or external media in persistent form.
instance method, hi Smalltalk, a method that provides behavior for particular instances of a class. Messages that invoke instance methods are sent to particular instances, rather than to the class as a whole. Contrast with class method.
instance variable. Private data that belongs to an instance of a class and is hidden from direct access by all other objects. Instance variables can only be accessed by the instance methods of the defining class and its subclasses.
keyword message. A message that takes one or more arguments. A keyword is an identifier followed by a colon (:). Each keyword requires one argument, and the order of the keywords is important. 116110' at: 2 put: $H is an example of a keyword message; at: and put: are keyword selectors, 2 and $H are the arguments. Contrast with binary message, unary message.
l i b r a r y . A shared repository represented by a single file. It stores source code, object (compiled) code, and persistent objects, including editions, versions, and releases of software components.
130
Reproduced with permission of the copyright owner. Further reproduction prohibited without permission.
literal. An object that can be created by the compiler. A literal can be a number, a character string, a single character, a symbol, or an array. All literals are unique: two literals with the same value refer to the same object The object created by a literal is read-only: it cannot be changed.
131
Reproduced with permission of the copyright owner. Further reproduction prohibited without permission.

Appendix B
132
Reproduced with permission of the copyright owner. Further reproduction prohibited without permission.

Reproduced
with perm
ission of the
copyright ow
ner. Further
reproduction prohibited
without
permission.
900
u>W
600
NDSub□ NSub
■NCV
Q N C M C
■NOS
□ NMS
26 31
r n M m
Metrics
Figure B. 1. Mean of the RExtPlus Group.

Reproduced
with perm
ission of the
copyright ow
ner. Further
reproduction prohibited
without
permission.
1200
800§*a•5
&
C/J400
164
NDSubQNSub■NOM■NIM
■N1V□NCMC■NIMCBNSup
□NPriM
■LOC■NOS
□ NMS
31 40 40
Metrics
Figure B.2. Standard deviation of the metrics RExtPlus Group.
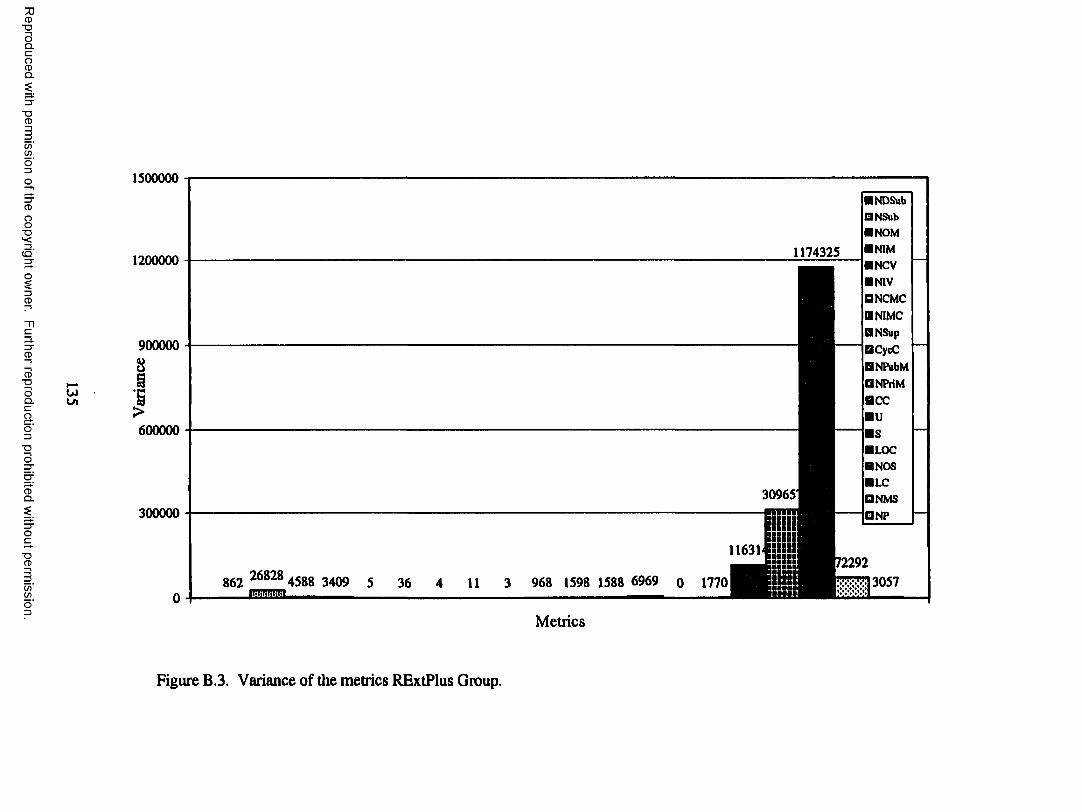
Reproduced
with perm
ission of the
copyright ow
ner. Further
reproduction prohibited
without
permission.
1500000
1200000
u>Ul
9000008u
I600000
300000
862 26828 4588 3409 36 11 3 968 1598 1588 6969 0
NDSub □ NSub
NOM NIM1174325
■NCV
DNCMCII NIMC
□NPriM
BNOS
30965 □NMS
2292 13057
Metrics
Figure B.3. Variance of the metrics RExtPlus Group.

Reproduced
with perm
ission of the
copyright ow
ner. Further
reproduction prohibited
without
permission.
u>o\
H i o o
I NDSub a NSub
I NOM INIM INCV
■NIV ONCMC BN1MC BNSup □CycC B NPubM □NPriM BCC
IU ISI LOC
BNOS ll.C
□ NMS □NP
Metrics
Figure B.4. Minimum of the metrics RExtPlus Group.

Reproduced
with perm
ission of the
copyright ow
ner. Further
reproduction prohibited
without
permission.
7500
u>- j
7018
5000
3358
24942500
395
2105
19 45 19 37 10
400 0AQ 429 501219 269
m
■ NDSub□NSub■NOM■ NIM■ NCV■NIVQNCMC■NIMC 'ONSupDCycC■ NPubM□ NPriMBCC■U■S■LOC■NOS
187:1 BLC1 ONMS; QNP
j 362
i ' H HMetrics
Figure B.5. Maximum of the metrics RExtPlus Group
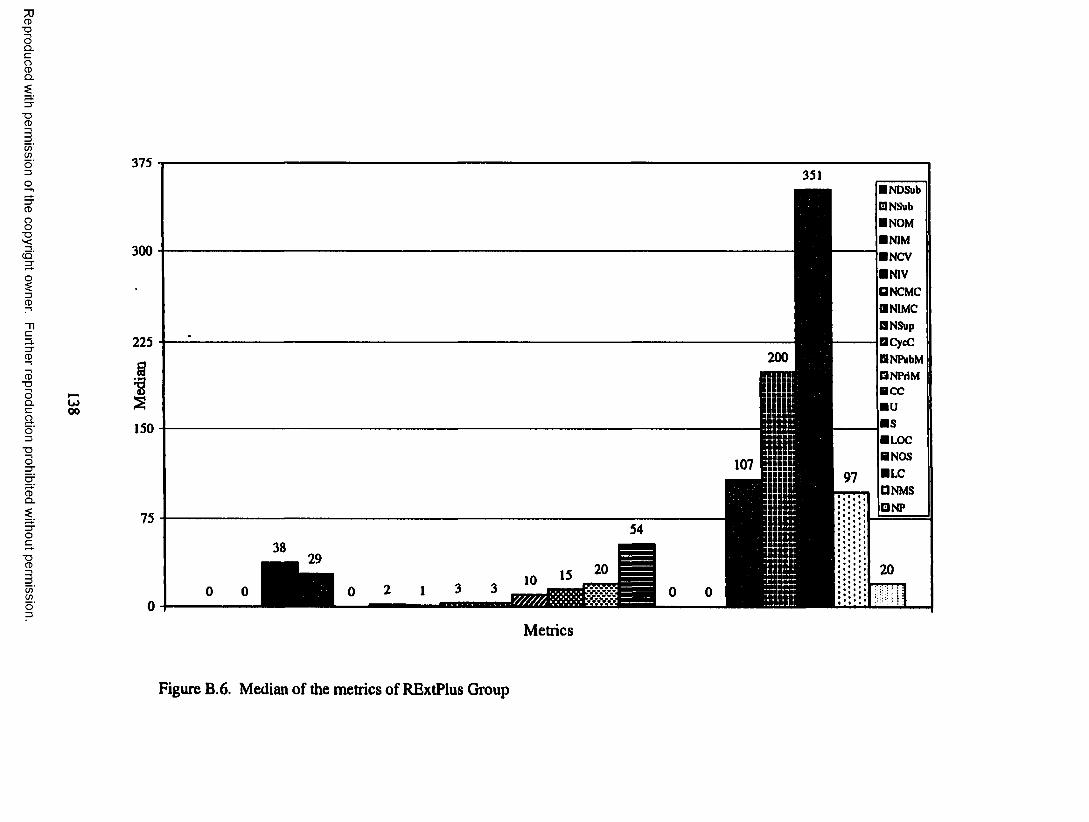
ion of the
copyright ow
ner. Further
reproduction prohibited
without
permission.
375
300
oo
225
uis150
7554
■ NDSub□ NSub■ NOM
ONCMC■NIMC
■NPubM□NPriM
■ NOS
Hi □NMS
Metrics
Figure B.6. Median of the metrics of RExtPlus Group

Reproduced
with perm
ission of the
copyright ow
ner. Further
reproduction prohibited
without
permission.
25
VO
20
15
•Sos
10
■NDSubONSub■ NOM ■N1M■ NCV ■NIV BNCMC ONIMC BNSup BCycC BNPubM QNPriM HCC■ U ■S ■LOC HNOS ■LC QNMS □NP
2 2 2
0 0 0 0
Metrics
Figure B.7. Mode of the metrics RExtPlus Group.

7500
iTsiSKi
cn
140
Reproduced with permission of the copyright owner. Further reproduction prohibited without permission.
Figu
re B.
8. Ra
nge
of the
m
etrics
REx
tPlu
s G
roup

Vita
Maria Loma Bacarisa Reyes was bom in Abra, Philippines. She is the second
of seven children bom to Anatolio Bacarisa, Sr., and Natividad Agaloos Bacarisa.
Loma is married to Manuel Reyes Reyes, and has a teenage son, Manuel Miguel
Reyes, Jr.
In 1980, Loma took her bachelor of science degree in Mathematics from the
University of the Philippines at Los Banos (UPLB), Laguna, Philippines. She taught at
the Institute of Mathematical Sciences and Physics, UPLB, from 1984 - 1986. Loma
then moved to teach at the Department of Mathematics at the University of the
Philippines in Diliman, Quezon City, in 1988, she pursued a master of science degree in
Applied Statistics at the Bowling Green State University, Bowling Green, Ohio, U.S.A.
in the Spring of 1991, Loma started her doctoral in Computer Science at Louisiana State
University, Baton Rouge, Louisiana. Loma is now working at IBM, Research Triangle
Park, North Carolina, as a Staff Software Engineer. She is with the VisualAge for Java
and VisualAge for Smalltalk validation team.
141
Reproduced with permission of the copyright owner. Further reproduction prohibited without permission.

DOCTORAL EXAMINATION AND DISSERTATION REPORT
Candidate: Maria Lorna Reyes
Major Field: Computer Science
Title of Dissertation: Assessing the Reuse Potential of Objects
Approved:
S 'Major Professor and chairman
Deax£ of the Graduate School
EXAMINING COMMITTEE:
^ C . j{±(o*
Date of nation:
11/3/98________
Reproduced with permission of the copyright owner. Further reproduction prohibited without permission.

IMAGE EVALUATION TEST TARGET (Q A -3 )
✓
c
A
150mm
IM /4 G E . In c1653 East Main Street Rochester, NY 14609 USA Phone: 716/482-0300 Fax: 716/288-5969
Reproduced with permission of the copyright owner. Further reproduction prohibited without permission.
Related Documents