Assessing the Quality of Your Lab's Test Results: What We Learned at ARUP and How We Changed the Culture to Pursue Highest Quality Lab Quality Confab; October 21, 2014; New Orleans, LA Medical Director, Toxicology Associate Scientific Director of Mass Spectrometry ARUP Laboratories Assistant Professor Department of Pathology University of Utah SLC, Utah Frederick G. Strathmann, PhD, DABCC (CC, TC)

Welcome message from author
This document is posted to help you gain knowledge. Please leave a comment to let me know what you think about it! Share it to your friends and learn new things together.
Transcript

Assessing the Quality of Your Lab's Test Results: What We Learned at ARUP and How We Changed
the Culture to Pursue Highest Quality
Lab Quality Confab; October 21, 2014; New Orleans, LA
Medical Director, Toxicology
Associate Scientific Director of Mass Spectrometry
ARUP Laboratories
Assistant Professor
Department of Pathology
University of Utah
SLC, Utah
Frederick G. Strathmann, PhD, DABCC (CC, TC)

Learning Objectives
• Identify common quality problems in the clinical
laboratory
• Apply available strategies to obtain a current state
assessment of laboratory quality
• Implement key milestones to keep quality
improvement moving forward
• Identify roadblocks to achieving highest quality

Speaker Financial Disclosure Information
• Grant/Research Support: None
• Salary/Consultant Fees: None
• Board/Committee/Advisory Board Membership:
None
• Stocks/Bonds: None
• Honorarium/Expenses: None
• Intellectual Property/Royalty Income: None

The Illusion of Quality

Eye Opening Experiences for Me – TTE Lab
• Trace and Toxic Element Laboratory
• Inductively-coupled plasma mass spectrometry
• 20 staff members
– 1 x Supervisor, 1 x Lead Technologist, 1 x Technical
Specialist, 17 x Bench technologists
• 20 different assays
• No QC failures for almost 6 months
Eye Opening Experiences for Me – cont.
• PT Failures with no explanations
– QC all passed on the day of PT
• Staff complaints of difficult workload
• Obsession with NY guidelines, PT acceptance criteria
• Apparent disconnect between several bench technologists and patients
• A high quality lab that could be better – but didn’t know it!

Round 1
Rolle
rderb
yje
sus.c
om

Quality Control: Getting back to basics
Frederick G Strathmann, PhD, DABCC (CC, TC) January 2013
TTE Staff Meeting

Topics to cover
What is QC?
What can statistics tell us about our QC process?
How are we currently doing QC?
How is QC reviewed currently?
How could we change QC to enhance lab quality?

Why talk about QC?
As the lab evolves, our quality measures must evolve.
It is easy to disconnect from the true goal of QC.
Change is good, but only if it is the right change.
Reduce rework, increase efficiency, spend time on more appropriate aspects.
Ensure we never forget our responsibility to the “patient in the tube”.

What is QC?
Intended to monitor the analytical performance of a measurement procedure and alert analysts to problems that might limit the usefulness of a test result.
Tells the analyst if the unknown (patient) results are valid
1. Test and method specific (materials, rules, number, frequency)
2. Define an “analytical run” or batch
3. Run QC and have an appropriate response plan

Key Features of Good QC
Prepped at the same time as patient samples and standards Any mistakes made with QC were likely made with patients too!
Represent the only known values and provide a reality anchor Like looking up the answers in the back of the book – VALIDITY!
Must be done consistently with ALL data collected, good or bad Allows a timeline of assay performance – PREDICTIVE and PREVENTATIVE
Rules identify real failures and are investigated to find a root cause Just enough QC with the right rules

Features of Bad QC QC prepped independently of patients QC only validates calibration, can’t find non-cognitive errors
QC repeated over and over until “it’s in” 5% of the time, good QC is out. 5% of the time, bad QC is in.
Reporting in the range of “good QC” and ignoring “bad QC” Might be fine once, but trends, shifts, and future problems are looming.
Running QC before the instrument is ready Introduces unwanted variability (long term monitoring skewed)

A Closer Look: Our Current State
Test N Set Mean Obv. Mean Set SD Obv. SD * Z Score Prev Mont Z Set CV Curr Month
CV
Prev Month
CV
Expected
Range
Lead WB
Venous 375 1.7 1.72 0.3 0.125643 0.08 0.044199
17.64705
9 7.287862 5.89 1.100-2.300
Lead WB
Venous 320 5.2 5.27 0.5 0.553706 0.144375 0.032298 9.615385 10.502404 4.83 4.200-6.200
Lead WB
Venous 292 22.8 22.76 2.2 1.525024 -0.016656 -0.076027 9.649123 6.699468 6.65 18.400-27.200
Lead WB
Venous 253 83.1 85.40 8.3 4.290246 0.276585 0.1562 9.987966 5.023963 4.42 66.500-99.700
Mang,
Serum 20 1 1.01 0.5 0.298946 0.02 0.484211 50 29.598566 30.04 0.000-2.000
Mang,
Serum 16 4.6 5.41 1 0.472537 0.80625 0.953333 21.73913 8.740578 9.84 2.600-6.600
Mang,
Serum 13 14.7 18.14 2.2 1.08285 1.562937 1.710744
14.96598
6 5.969911 6.27 10.300-19.100
Mang,
Serum 15 27.2 32.26 4.1 2.074608 1.234146 1.314634
15.07352
9 6.4309 4.56 19.000-35.400
October, 2012

How do we do this? Find and identify assay or workflow problems inhibiting best practices for QC
Establish “appropriate targets” for all QC
Standardize comments and troubleshooting steps in Master Control
Modify rules to ensure appropriate balance of control
Not too much, not too little
Adhere to good QC practice at all times
QC prepped with patient samples
No repeating of “out” QC
Root cause of failed QC

Rule performance

QC Goals
Total allowable error
Medical decision limits
Assay bias
Assay precision
Operational Process Specifications Chart

Example 1: Lead, WB
TEa = 10%
N = 4
1-3s: 0.01 Pfr 90% Ped
1-3s+: 0.03 Pfr 90% Ped
N = 2
1-3s: 0.00 Pfr 90% Ped
1-3.5s: 0.00 Pfr 90% Ped
Normalized OPSpecs Chart

Example 2: Aluminum, U
TEa = 20%
N = 4
1-3s: 0.01 Pfr 90% Ped
1-3s+: 0.03 Pfr 90% Ped
N = 2
1-3s: 0.00 Pfr 90% Ped
1-3.5s: 0.00 Pfr 90% Ped

Example 2: Aluminum, U cont.
TEa = 50%
N = 4
1-3s: 0.01 Pfr 90% Ped
1-3s+: 0.03 Pfr 90% Ped
N = 2
1-3s: 0.00 Pfr 90% Ped
1-3.5s: 0.00 Pfr 90% Ped

What’s next?
Deeper analysis for all analytes in the lab
Standardization of comments and troubleshooting steps
Identify high yield, low false positive rules for each analyte
Establish more accurate goals for QC ranges (based on performance)
More fun, less work!

Progress Summary: January 2013 to September 2013
qvid
ian.c
om

Why was there no progress?
• Staff didn’t believe there was a problem.
• Management didn’t understand how to change.
• Lots of MY ideas, lots of MY enthusiasm, no
STAFF buy-in.
letg
onow
.typepad.c
om

Round 2
Rolle
rderb
yje
sus.c
om

The Beginning of Buy-in
• A few more failed PTs
• A supervisor and a lead forced to “find the causes”
with a medical director that wouldn’t let up.
• Weekly Quality Assurance & Quality Control
meetings
• Monthly QC review as a group
– **Viewing the lab from my point of view**
• “Is it possible our QC is not as good as we think?”

The Illusion of Quality A Discussion of Outdated QC Approaches and Case
Studies of Progress
Frederick G. Strathmann
ARUP Nuts and Bolts Series
October 15, 2013

Common Mistake #1
• Using a trigger with computer-based QC
> 2sd
> 2.5sd

1-3s Rule
• Precision or Bias?
-4
-3
-2
-1
0
1
2
3
4
0 2 4 6 8
Std
De
v
Run #

41s Rule
• Precision or Bias?
-4
-3
-2
-1
0
1
2
3
4
0 2 4 6 8
Std
De
v
Run #

10x Rule
• Precision or Bias?
-4
-3
-2
-1
0
1
2
3
4
0 2 4 6 8 10 12
Std
De
v
Run #

#1 Using a Trigger Rule Few if any failures equals high quality…
-4
-3
-2
-1
0
1
2
3
4
0 5 10 15 20 25
Std
De
v
Run #

#1 Using a Trigger Rule Few if any failures equals high quality…
-4
-3
-2
-1
0
1
2
3
4
0 5 10 15 20 25
Std
De
v
Run #

Robots need work too…

Common Mistake #2
• Cut and paste QC rules

#2 Cut and Paste QC Rules If it works for them it should work for us…
• Probability of error detection
• Probability of false rejection
• Effectiveness of rule combinations
• How many of you KNOW your QC is working?

#2 Cut and Paste QC Rules The more the merrier…
• Lab 1
– 1-3s
• Lab 2
– 1-3s/4-1s
• Lab 3
– 1-3s/2-2s/4-1s/R-4s/10x

Efficiency & Effectiveness of QC
0% bias; 2% CV 3% bias; 3% CV
Rule Pfr Ped N R
1-3.5s 0 0.066 2 1
1-3s 0 0.86 2 1
1-3s/2-2s/R-4s 0.01 0.94 2 1
1-2.5s 0.04 1 4 1
1-3s/2-2s/R-4s/4-1s/8x 0.03 1 4 2
Rule Pfr Ped N R
1-3.5s 0 0.01 2 1
1-3s 0 0.02 2 1
1-3s/2-2s/R-4s 0.01 0.03 2 1
1-2.5s 0.04 0.13 4 1
1-3s/2-2s/R-4s/4-1s/8x 0.03 0.18 4 2

Common Mistake #3
• Unrealistic QC acceptance criteria
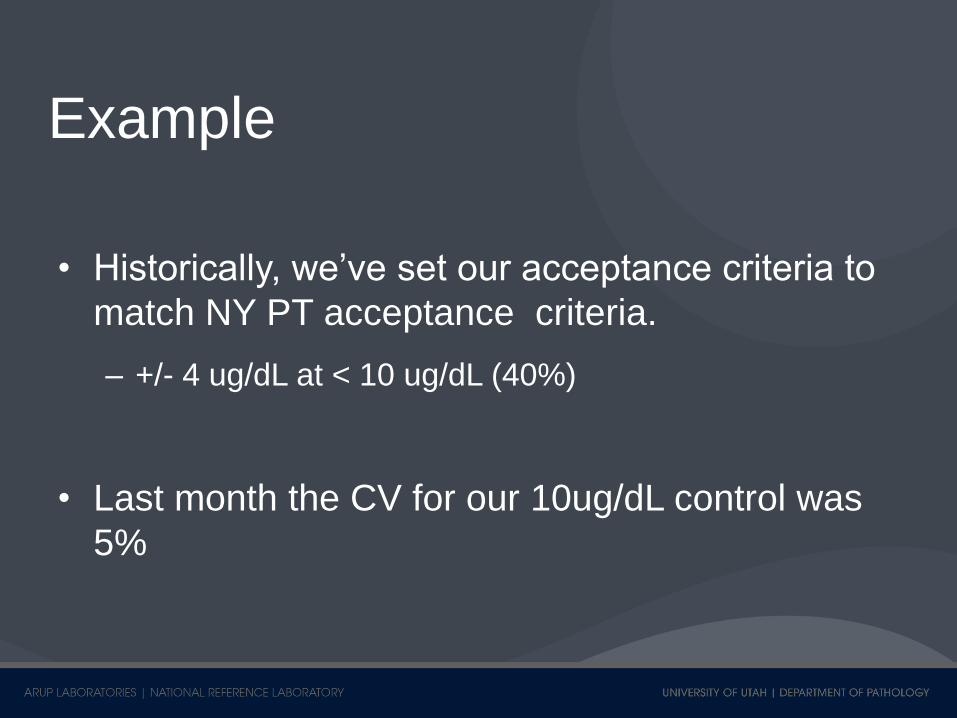
Example
• Historically, we’ve set our acceptance criteria to
match NY PT acceptance criteria.
– +/- 4 ug/dL at < 10 ug/dL (40%)
• Last month the CV for our 10ug/dL control was
5%

#3 Unrealistic QC Targets Wider is better…
Instrument performance
Lab expectations
Outline
• Common Mistakes
• Necessary components of a QC plan
• Areas for continuous improvement
• Strategies for addressing quality weak points

Necessary Component #1
• Appropriate targets and ranges

Identifying Weak Points
Test N Set Mean Obv. Mean Set SD Obv. SD * Z Score Prev Mont Z Set CV
Curr Month
CV
Prev Month
CV
Expected
Range
Lead WB
Venous 375 1.7 1.72 0.3 0.125643 0.08 0.044199 17.647059 7.287862 5.89 1.100-2.300
Lead WB
Venous 320 5.2 5.27 0.5 0.553706 0.144375 0.032298 9.615385 10.502404 4.83 4.200-6.200
Lead WB
Venous 292 22.8 22.76 2.2 1.525024 -0.016656 -0.076027 9.649123 6.699468 6.65 18.400-27.200
Lead WB
Venous 253 83.1 85.40 8.3 4.290246 0.276585 0.1562 9.987966 5.023963 4.42 66.500-99.700

Necessary Component #2
• Rules that fit
the assay

QC Goals
Total allowable error
Medical decision limits
Assay bias
Assay precision
Operational Process Specifications Chart

Necessary Component #2

Almost…Not Quite
nic
kn87.u
mw
blo
gs.o
rg
cry
more
.net

Strategy #1 Current state assessment

Strategy #2 Ask the staff
Poor performing assays
procedural inflexibility
too busy short on time
Instruments not functioning properly
Solving problems individually Lack of staffing
always very rushed
pulling long hours short term solutions
Personal opinion limited amount of automation
Assays not working well
very rushed

Quality Control Overhaul

Improvement Area #1 QC rules evaluated on a continuous basis

Improvement Area #2 QC troubleshooting plan optimization
• Track success
• Track failures
• Evaluate effectiveness
• Enhance technical competency amongst staff

Improvement Area #3 Assay improvements
• Identify the real problems
• Fix the problems you have
• Balance or combine SO
conversions with
improvements

And Then it Happened

Current State Assessment Completed

Troubleshooting Workflow Developed – By Me

Troubleshooting Tools Developed – With Staff

Organizational Support
• QC Subcommittee formed from LIS SuperUsers
• SOP written based upon TTE Lab process
• Presentations to Group Managers
• Presentations to Supervisors
• Workshops organized for interested labs
– Hands on with lab data

Illusion of Quality - Indeed
• It can be painful to be the leader…

Fix it. Keep fixing it.
• Track success
• Track failures
• Evaluate effectiveness
• Enhance technical competency amongst staff

Where are we now?

TTE Lab: Current State Assessment
6 mo. post “go-live”
• Not 1 failed PT
• Monthly QC review < 15 minutes
• Laboratory staff engaged in quality
– Looking at LJ charts “because they’re interesting”
– Amazing ideas about QC failures and what to do
– Appreciation for what and why – “Patient in the tube”
• A nearly complete culture change

Organizational Current State
• Five full workshops with requests for more
– Current State Assessment: Part I and Part II
• Follow-up workshops in preparation
– Designing a QC Troubleshooting Plan: Part I and Part II
– Pulling the trigger on your first change: Part I
– Follow up post go-live: Part II

What I learned from all of this.
• It is not enough to state the obvious.
• It is not enough to provide tools for change.
• Even though staff “should know this stuff” they
don’t always know how to apply it.
• Someone has to drive – preferably someone with a
backbone.
• Everyone has to be involved somehow.
Related Documents


