ORIGINAL PAPER Assessing the quality and usefulness of different taxonomic groups inventories in a semiarid Mediterranean region Daniel Bruno • David Sa ´nchez-Ferna ´ndez • Andre ´s Milla ´n • Rosa M. Ros • Pedro Sa ´nchez-Go ´mez • Josefa Velasco Received: 11 July 2011 / Accepted: 17 February 2012 / Published online: 13 March 2012 Ó Springer Science+Business Media B.V. 2012 Abstract Extensive biological databases are valuables ecological research tools that form the basis of biodiversity studies. However, it is essential to perform an assessment of the inventories’ completeness for their use in ecological and conservational research, and this is especially true for non-emblematic groups. Using four exhaustive databases compiled for four taxonomic groups (aquatic beetles, aquatic bugs, bryophytes and orchids), in a semiarid Mediterranean region, the aim of this study was to estimate the degree of com- pleteness for the inventory of each taxa and to identify those spatial units that could be considered to be sufficiently-surveyed (UTM 10 9 10 km squares). Then, the degree of environmental representativeness of the databases was assessed, as well as those factors that could have caused biased sampling efforts. Lastly, the usefulness of each database for conservational purposes was discussed. The results of the present study highlighted the lack of complete and extensive inventory data; as the best sampled group did not even reach 25% of sufficiently-surveyed squares in the territory (in the case of aquatic bugs) and none of the squares presented reliable inventories in the case of bryophytes. Although these results suggested that recording was skewed by relatively simple climatic variables, the sufficiently-surveyed squares were evenly distributed across physioclimatic subregions, what enables their use in further ecological studies. The authors would like to emphasise the potential of these procedures to locate areas in need of further sampling as well as to aid in the design of more effective regional conservation schemes. Electronic supplementary material The online version of this article (doi:10.1007/s10531-012-0263-9) contains supplementary material, which is available to authorized users. D. Bruno (&) Á D. Sa ´nchez-Ferna ´ndez Á A. Milla ´n Á J. Velasco Departamento de Ecologı ´a e Hidrologı ´a, Facultad de Biologı ´a, Universidad de Murcia, Campus de Espinardo, 30100 Murcia, Spain e-mail: [email protected] R. M. Ros Á P. Sa ´nchez-Go ´mez Departamento de Biologı ´a Vegetal, Facultad de Biologı ´a, Universidad de Murcia, Campus de Espinardo, 30100 Murcia, Spain 123 Biodivers Conserv (2012) 21:1561–1575 DOI 10.1007/s10531-012-0263-9

Welcome message from author
This document is posted to help you gain knowledge. Please leave a comment to let me know what you think about it! Share it to your friends and learn new things together.
Transcript

ORI GIN AL PA PER
Assessing the quality and usefulness of differenttaxonomic groups inventories in a semiaridMediterranean region
Daniel Bruno • David Sanchez-Fernandez • Andres Millan •
Rosa M. Ros • Pedro Sanchez-Gomez • Josefa Velasco
Received: 11 July 2011 / Accepted: 17 February 2012 / Published online: 13 March 2012� Springer Science+Business Media B.V. 2012
Abstract Extensive biological databases are valuables ecological research tools that form
the basis of biodiversity studies. However, it is essential to perform an assessment of the
inventories’ completeness for their use in ecological and conservational research, and this
is especially true for non-emblematic groups. Using four exhaustive databases compiled
for four taxonomic groups (aquatic beetles, aquatic bugs, bryophytes and orchids), in a
semiarid Mediterranean region, the aim of this study was to estimate the degree of com-
pleteness for the inventory of each taxa and to identify those spatial units that could be
considered to be sufficiently-surveyed (UTM 10 9 10 km squares). Then, the degree of
environmental representativeness of the databases was assessed, as well as those factors
that could have caused biased sampling efforts. Lastly, the usefulness of each database for
conservational purposes was discussed. The results of the present study highlighted the
lack of complete and extensive inventory data; as the best sampled group did not even
reach 25% of sufficiently-surveyed squares in the territory (in the case of aquatic bugs) and
none of the squares presented reliable inventories in the case of bryophytes. Although these
results suggested that recording was skewed by relatively simple climatic variables, the
sufficiently-surveyed squares were evenly distributed across physioclimatic subregions,
what enables their use in further ecological studies. The authors would like to emphasise
the potential of these procedures to locate areas in need of further sampling as well as to
aid in the design of more effective regional conservation schemes.
Electronic supplementary material The online version of this article (doi:10.1007/s10531-012-0263-9)contains supplementary material, which is available to authorized users.
D. Bruno (&) � D. Sanchez-Fernandez � A. Millan � J. VelascoDepartamento de Ecologıa e Hidrologıa, Facultad de Biologıa, Universidad de Murcia,Campus de Espinardo, 30100 Murcia, Spaine-mail: [email protected]
R. M. Ros � P. Sanchez-GomezDepartamento de Biologıa Vegetal, Facultad de Biologıa, Universidad de Murcia,Campus de Espinardo, 30100 Murcia, Spain
123
Biodivers Conserv (2012) 21:1561–1575DOI 10.1007/s10531-012-0263-9

Keywords Aquatic beetles � Aquatic bugs � Biological databases � Bryophytes �Cross-taxon congruence � Environmental representativeness � Orchids � Sampling bias �Species richness � Survey effort
Introduction
Compiling taxonomic information and distribution data forms the basis for most biodi-
versity studies. These extensive biological databases are extremely valuable tools in
ecological research (Soberon et al. 2000, 2007) and only high quality inventories are able
to produce more reliable distribution maps based on adequate sampling efforts (Dennis
2001; Kadmon et al. 2004). However, this is not the case in Mediterranean countries where
inventories of many taxa, particularly non-charismatic groups, are incomplete or non-
existent (Ramos et al. 2001). The lack of comprehensive information on survey efforts
makes it difficult to determine which territories have reliable species inventories and which
still need to be surveyed (Santos et al. 2010). These inventories refer to the species richness
in a given geographic scale, and their quality depends on the survey effort carried out. A
number of papers have pointed out that most of the biodiversity data currently available are
scarce and biased, according to spatial, environmental or other variables related to
accessibility or attractiveness (Dennis et al. 1999; Lobo and Martın-Piera 2002, Kadmon
et al. 2004; Sanchez-Fernandez et al. 2008).
In this sense, even when all the available information is exhaustively compiled for a
determined taxonomic group, some caveats can hinder the usefulness of the database in
describing biodiversity patterns accurately. Hortal et al. (2007) highlighted two of these
drawbacks associated with the use of biodiversity databases: (1) lack of survey-effort
assessments (and lack of exhaustiveness in compiling data on survey efforts), and (2)
incomplete coverage of the geographical and environmental diversity that may affect the
distribution of the organisms.
A number of studies have assessed congruency in the distribution of species richness
between different species groups (Kati et al. 2004; Rey-Benayas and De la Montana 2003).
Other studies have assessed the sampling efforts carried out for specific taxa (Romo et al.
2006; Sanchez-Fernandez et al. 2008; Aranda et al. 2010; Santos et al. 2010), in order to
assess how complete or unbiased comprehensive databases are so that more reliable
diversity estimations can be provided. Nevertheless, analyzing both the species richness
and the sampling effort congruence between different taxa for a particular geographical
scale has received less attention (Mora et al. 2008). This procedure enables one to know
whether there are areas where sampling efforts have been focused upon, and if these areas
are characterised by any particular conditions. In this sense, the number of the database-
records can be used as a surrogate of the sampling effort carried out (Lobo 2008). It allows
standardizing the sampling results between different collectors, protocols or field meth-
odologies. All of these questions are key conservational issues, since the analysis of the
records distribution as a surrogate of sampling effort reveals not only sampling gaps, but
also identifies if abundance, richness and diversity data could be reflecting the sampling
effort patterns carried out, rather than actual abundance, richness or diversity.
The rapid and irreversible decline of biodiversity, mainly caused by habitat fragmen-
tation and alteration (Pimm and Raven 2000) makes it imperative to find the most effective
way to gather the information yet to be described regarding species diversity and distri-
bution. This is particularly important in the Mediterranean Basin, which is considered to be
1562 Biodivers Conserv (2012) 21:1561–1575
123
one of the Earth’s biodiversity hotspot (Myers et al. 2000), and where landscapes have
been subject to strong human influences for millennia (Naveh and Lieberman 1984). Using
four exhaustive databases compiled for four taxonomic groups (aquatic beetles, aquatic
bugs, bryophytes and orchids) in a semiarid Mediterranean region, the present study aimed
to assess the congruence in both the intensity and distribution of sampling efforts carried
out in the area. Specifically, the objectives were (1) to estimate the degree of completeness
for the inventory of each group (i.e. observed species/estimated species, Soberon et al.
2000) identifying those spatial units that could be considered to be sufficiently-surveyed;
(2) to assess the degree of environmental representativeness of the databases, checking if
database records and squares that are sufficiently-surveyed are evenly distributed by the
pre-established physioclimatic subregions (climatic and topographic variables); (3) to
identify factors that biased sampling efforts, i.e., to identify what (spatial, topographic,
climatic, land use and attractiveness) variables differed significantly between SSS (suffi-
ciently-surveyed squares) and the remaining squares; and (4) to assess the usefulness of
each database for conservational purposes.
Methodology
Study area
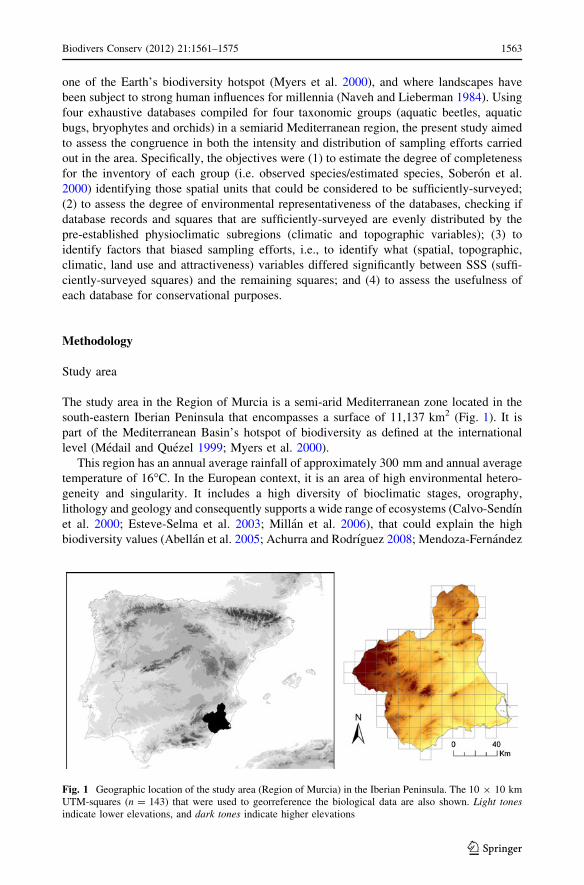
The study area in the Region of Murcia is a semi-arid Mediterranean zone located in the
south-eastern Iberian Peninsula that encompasses a surface of 11,137 km2 (Fig. 1). It is
part of the Mediterranean Basin’s hotspot of biodiversity as defined at the international
level (Medail and Quezel 1999; Myers et al. 2000).
This region has an annual average rainfall of approximately 300 mm and annual average
temperature of 16�C. In the European context, it is an area of high environmental hetero-
geneity and singularity. It includes a high diversity of bioclimatic stages, orography,
lithology and geology and consequently supports a wide range of ecosystems (Calvo-Sendın
et al. 2000; Esteve-Selma et al. 2003; Millan et al. 2006), that could explain the high
biodiversity values (Abellan et al. 2005; Achurra and Rodrıguez 2008; Mendoza-Fernandez
Fig. 1 Geographic location of the study area (Region of Murcia) in the Iberian Peninsula. The 10 9 10 kmUTM-squares (n = 143) that were used to georreference the biological data are also shown. Light tonesindicate lower elevations, and dark tones indicate higher elevations
Biodivers Conserv (2012) 21:1561–1575 1563
123

et al. 2010; Puissant and Sueur 2010). This region is characterised by a climatic and
topographic gradient (NW–SE), from the high (2,000 m), wet (600 mm of mean annual
precipitation) and cold (12�C of mean annual temperature) northwest to the low (0 m), dry
(220 mm) and hot (20�C) southeast.
Source of biological data
Target groups’ selection criteria were based on accessible regional information; only those
taxa with available exhaustive databases (aquatic beetles and bugs, bryophytes and orchids)
were used. These four databases contained all of the available biological spatially referenced
records from literature up to 2009, also including data from museum and private collections,
PhD theses, field surveys carried out in the last years and other unpublished sources. All of this
information was georreferenced at the same spatial resolution (10 9 10 km UTM-squares) to
make the analyses comparable. The study area overlaps with 143 operational spatial units (see
Fig. 1). Although the level of precision may vary between groups of different ecological
preferences, the used resolution seems to be suitable for the size of the study area and the
proposed objectives. We used Spearman rank correlations to assess the concordance between
species richness and number of records for each taxonomic group.
The database of water beetles and bugs was compiled by the ‘Aquatic Ecology’ group at
the University of Murcia. This database contained 3,825 records for 162 water beetle
species (see Figures S1a and S2a in supplementary material) and 1,476 records for 33
water bug species (see Figures S1b and S2b in supplementary material). The Murcian
orchid database (mainly included in Lopez-Espinosa and Sanchez-Gomez 2006) was
compiled by the ‘Biology, Ecology and Evolution of Bryophytes and Spermatophytes’ and
contained 902 records for 31 orchid species in the Region of Murcia (see Figures S1c and
S2c in supplementary material). The Murcian bryophyte database was developed by
the ‘Systematic, Molecular, Phylogeography and Bryophyte conservation’ group at the
University of Murcia. It included 3307 records for 230 bryophyte species (see Figures
S1d and S2d in supplementary material).
Assessing sampling efforts and identifying sufficiently-surveyed squares (SSS)
As a first step to evaluate the sampling effort congruency carried out in the study area, we
correlated the number of database records by square among the four taxonomic groups
using Spearman rank correlations. We also checked if the median number of records per
square differs significantly between taxa. Both analyses give an idea of the congruence in
sampling effort in terms of distribution and intensity. Secondly, the inventory completeness
is analyzed for each group. A variety of statistical techniques (Gotelli and Colwell 2001;
Rosenzweig et al. 2003; Koellner et al. 2004; Hortal et al. 2006) were traditionally used to
estimate the degree to which the biological data obtained from field sampling or biblio-
graphic compilation represented reliable inventories on a given scale (Petersen and Meier
2003). This completeness value can be calculated based on different estimations of the
theoretical maximum richness i.e., an area is usually considered to be adequately sampled
when the ratio between the number of recorded species against those predicted (its com-
pleteness) is above a specific arbitrary threshold (see Nakamura and Soberon 2009).
Collector’s curves have been frequently used to determine the exhaustiveness of the
compiled information (Moreno and Halffter 2000; Willott 2001). These curves assume that
there is a high probability of adding new species during the first stages of a prospection;
however, this likelihood decreases over time as the number of species yet to be discovered
1564 Biodivers Conserv (2012) 21:1561–1575
123

decreases. Different equations based on collector’s curves have been proposed to estimate
the theoretical value of species richness (e.g. Soberon and Llorente 1993; Walther and
Moore 2005; Hortal et al. 2006). One of the most applied equations is currently the Clench
function (Dıaz-Frances and Soberon 2005; Romo et al. 2006; Jimenez-Valverde and Lobo
2007; Picazo et al. 2010). On the other hand, non-parametric estimators have also begun to
be used extensively in the recent years (Hortal et al. 2006; Williams et al. 2007; Codd-
ington et al. 2009; Unterseher et al. 2011) due to their easier applicability and effective-
ness, being less time-consumers. Their estimations are made by focusing on the rare
species (whose that appear in one or two samples) (Colwell and Coddington 1994; Moreno
and Halffter 2001) and they require a less amount of data to make a reliable prediction
(Brose 2002). Thus, in the present study, two different estimators were used to identify
sufficiently surveyed squares (SSS): the previously metioned Clench function (Clench
1979) and Jackknife 1 (see Colwell and Coddington 1994), a non-parametric estimator
recommended for incidence (presence/absence) data in small grains that enables the
comparison of different taxonomic groups inventories (Hortal et al. 2006). As the shape of
these relationships depends on the order in which samples were recorded, the order was
randomized 1000 times to obtain a smoothed accumulation curve (using the EstimateS 8.0
software package; Colwell 2006).
The evident scarcity and paucity of non-charismatic hyperdiverse group data in Med-
iterranean countries (Ramos et al. 2001) and especially in freshwater systems (Leveque
et al. 2005) make difficult to find areas with reliable inventories. In this sense, different
completeness thresholds were initially considered, but taking into account (i) the lack of
general consensus and (ii) the two complementary approaches used that make the selection
more cautious, we consider those squares that display a completeness value above 65% in
both approaches to be sufficiently-surveyed (SSS) to reach the proposed objectives.
Assessing biases in sampling effort distribution
With the objective of discriminating among the different environmental conditions that
could have shaped the distribution of the sampling efforts, we used three pre-established
physioclimatic subregions in the study area (northwest, coastal and interior) that were
defined by multivariate analysis using a set of 28 climatic and topographic variables (see
Bruno et al. in press a for detail). Firstly, the number of database records for each phys-
ioclimatic subregion was calculated. Then, the Kruskal–Wallis test was used with post hoc
paired comparisons to investigate if there were differences among the number of database
records in the three subregions.
Taking into account the importance of identifying SSS for their multiple usages in
biogeography and conservation (e.g. designing effective survey campaigns or to forecast
the distribution of biodiversity attributes or individual species distributions in the
remaining, poorly-surveyed territory), the environmental coverage provided by the SSS
identified for each group was examined. A Chi-square test was performed to assess the
proportion of 10 9 10 km SSS for each one of the different physioclimatic subregions.
As an alternative way to analyze the potential biases using the physioclimatic regions, it
has been additionally studied the influence of other variables related not only to climate.
For this, a Mann–Whitney U test was used to identify variables that differed significantly
between SSS and the remainder. A total of 34 variables divided into five categories were
initially considered: spatial, topographic, climatic, land use and variables related to the
attractiveness of the sites (see Table S1 in supplementary material). Spearman rank cor-
relations were applied to reduce the number of variables, removing those ones that showed
Biodivers Conserv (2012) 21:1561–1575 1565
123

rs C 0.9; p \ 0.01, keeping the variables (18 according to the test) that showed a greater
number of statistically significant correlations. In case of draw the variable with greater
number of rs C 0.9 was kept. The Statistica package 8.0. (StatSoft 2007) was used for all
computations.
Results
Sampling efforts and completeness values
The observed species richness distribution patterns varied considerably among the groups
(see Figure S1 in supplementary material), although in general, it seemed that the north of
the study area was richer than the south, with the exception of a few well preserved coastal
squares. On the one hand, the Spearman correlation showed a high statistically significant
concordance between the richness and record distribution patterns for all of the groups:
aquatic beetles (rs = 0.993; p \ 0.05), aquatic bugs (rs = 0.966; p \ 0.05), orchids
(rs = 0.976; p \ 0.05) and bryophytes (rs = 0.996; p \ 0.05) (see Figures S1 and S2 in
supplementary material). On the other hand, a significant congruence was found between
the distribution of database records for aquatic beetles and bugs (rs = 0.860; p \ 0.05).
The distribution pattern of bryophyte records was also significantly correlated with the
distribution pattern of records for the other three groups: aquatic beetles (rs = 0.421;
p \ 0.05), aquatic bugs (rs = 0.389; p \ 0.05) and orchids (rs = 0.460; p \ 0.05).
Complementarily, we found little variation in the median number of records per square
among the taxa: 2 ± 26.64 (median deviation) for aquatic beetles, 1 ± 10.31 for aquatic
bugs, 2 ± 5.99 for orquids and 6 ± 22.37 for bryophytes. Additionally, the number of
squares with no data varies among aquatic beetles (65 squares), aquatic bugs (74 squares),
orquids (49 squares) and bryophytes (50 squares).
There are sensible differences among the results of inventory completeness given by
both estimators (see Table 1). Although it seems that species accumulation curves tend to
overpredict the real species richness as compared to non-parametric estimators (Walther
and Martin 2001), according to the proposed objectives we have chosen to select as SSS
those squares that reach an inventory completeness value above the 65% (the maximum
completeness value able to provide a minimum number of grid-cells for subsequent
analyses) with both estimators (Figures S3 and S4 in supplementary material). The
application of Clench function was the method that gave the most restrictive estimation,
and in our case, the set of SSS selected using both methods match up with the set using just
the Clench function method. Thus, the degree of inventory completeness varied notably
among groups (see Figure S3 in supplementary material). Concretely, the number of SSS
Table 1 Number of squares that reach the greater degree of inventory completeness according to the resultsof the different estimators
Inventory completeness [65% [80% [90%
Estimator Clench Jackknife 1 Clench Jackknife 1 Clench Jackknife 1
Aquatic beetles 18 34 3 3 0 0
Aquatic bugs 31 52 8 27 0 10
Orchids 25 43 12 21 4 5
Bryophytes 0 8 0 1 0 0
1566 Biodivers Conserv (2012) 21:1561–1575
123

ranged from 31 squares (21.7% of the whole study area) for aquatic bugs, 25 (17.5% of the
study area) for orchids, 18 (13% of the study area) for water beetles, to 0 in the case of
bryophytes. In terms of congruence, if we exclude bryophytes, only four squares can be
considered as SSS for all the groups at the same time. As completeness values given by
Clench function for bryophytes were below the considered threshold in all of the squares,
they were not considered for further analyses.
Distribution and sampling effort biases
The Kruskal–Wallis tests point to the fact that none of the taxonomic groups showed
differences in the number of records among the three physioclimatic subregions (aquatic
beetles: H = 3.322, p = 0.190; aquatic bugs: H = 1.221, p = 0.543; orchids: H = 0.660,
p = 0.719; bryophytes: H = 0.283, p = 0.868). Furthermore, the distribution of the SSS
in these three physioclimatic subregions (Fig. 2) was balanced (Chi-square test; p B 0.05
and 999 permutations) for aquatic beetles (v2 = 5.109; p = 0.078; d.f. = 2), aquatic bugs
(v2 = 5.081; p = 0.079; d.f. = 2) and orchid data (v2 = 4.024; p = 0.134; d.f. = 2).
The Mann–Whitney U-test allowed to select the variables that differed significantly
(p B 0.05) between squares considered to be sufficiently-surveyed and the rest ones (see
Table 2). Thus, it was found that SSS for orchids were characterised by a lower monthly
mean solar radiation than the remaining squares. In the case of aquatic bugs and beetles, a
number of variables were significantly different between SSS and the remaining squares,
but in general, the SSS were warmer and drier than the rest of squares.
Discussion
How complete are target groups inventories?
Assessing the quality of biodiversity databases could bridge the gap between the need for
biodiversity distribution data and limited resources in taxonomic and inventory work. The
results of the present study highlight a lack of complete and extensive inventory data; as
the best-sampled group did not even reach 25% of SSS in the territory (in the case of
aquatic bugs) and none of the squares presented reliable inventories for bryophytes.
Approximately a half of the territory remains characterised by a remarkable shortage of
records (with \50% of the predicted species recorded). This drawback, the so-called
‘‘Wallacean shortfall’’ (Lomolino 2004), is quite frequent (Whittaker et al. 2005; Bini et al.
Fig. 2 Distribution of sufficiently surveyed squares (SSS) (red squares) on the defined physioclimaticsubregions of (a) aquatic beetles (b) aquatic bugs and (c) orchids. (Color figure online)
Biodivers Conserv (2012) 21:1561–1575 1567
123

2006; Kozlowski 2008), and shows that the distribution data of most species are incom-
plete and biased being this limitation even higher in hyperdiverse groups, such as inver-
tebrates and bryophytes. Moreover, the species richness and record distribution patterns
showed high concordance; apparently, the observed richness patterns were a consequence
of the sampling efforts applied in the study area. In general, the median number of records
per square was low and the dispersion of the data was considerable.
The results have shown that although the databases for bryophytes and water beetles
contained more records (and a wider record distribution in the case of bryophytes) than
those for aquatic bugs and orchids (see Table S2 in supplementary material), these databases
were also the least complete. It could be due to the special nature of these groups, which
includes a high number of species and rare species having many of them narrow ecological
niches (Hylander et al. 2002; Millan et al. 2006; Stewart and Mallik 2006; Picazo et al. in
press). So, the degree of inventory completeness depends on both the sampling effort carried
out and the intrinsic nature of the species-abundance distribution: at the same sampling
effort applied in a given geographic scale, the groups that hold a greater richness and higher
number of rare species will show lower completeness values. Another evidence is the fact
that despite bugs had the lowest median number of records per square, they displayed much
higher completeness values than aquatic beetles with a similar sampling effort. It has been
probably caused by the low number of species and their ubiquitous nature (Polhemus and
Polhemus 2008; Carbonell et al. 2011). The orchids, a group with low specific richness in
the study area but a high dependence on the microenvironmental conditions exposed
moderately high completeness rates. Overall, it is also possible that the spatial resolution
(100 km2) could have influenced the general values of the inventory completeness because
there are probably many local rarities for some of the groups not yet discovered. Addi-
tionally, the absence of aquatic environments in some particular areas could have caused an
underestimation in the inventory completeness of the aquatic groups.
Are there biases in sampling efforts?
Several studies of other taxonomic groups and territories (Dennis et al. 1999; Romo et al.
2006; Hortal et al. 2007, 2008; Aranda et al. 2010), found geographical and environmental
Table 2 Variables with significant differences between sufficiently-surveyed squares (SSS) and remainingsquares by using a Mann–Whitney U test
Aquatic beetles Aquatic bugs Orchids
U p SSS U p SSS U p SSS
Monthly mean solar radiation ns ns ns ns ns ns 701 \0.001 -
Max temperature of warmest month 598 0.001 ? 1126.5 0.002 ? ns ns ns
Precipitation of wettest quarter 686 0.007 - 1197 0.005 - ns ns ns
Dryland (%) 751 0.02 - ns ns ns ns ns ns
Irrigated land (%) 751 0.02 ? ns ns ns ns ns ns
Aridity 773 0.03 ? ns ns ns ns ns ns
Distance to the main research centre ns ns ns 1201 0.005 - ns ns ns
Mean altitude 792 0.04 - ns ns ns ns ns ns
SSS column represents if the median score of each one of these variables is higher (?) or lower (-) for thegroup of sufficiently surveyed square (SSS)
1568 Biodivers Conserv (2012) 21:1561–1575
123

biases in the distribution of sampling efforts. Traditionally, biologists have generally been
attracted to mountainous landscapes and protected areas with interesting species (endemics,
rare species, species with conservation interest, etc.), and/or easy accessibility to the
sampling sites (distance from main research centres) (Dennis and Thomas 2000; Romo et al.
2006; Sanchez-Fernandez et al. 2008; Aranda et al. 2010). In this study, some individual
variables differed between SSS and the remaining squares of the study area. This was
especially true for aquatic insect groups whose areas that displayed the greatest sampling
efforts were, in general, mainly characterised by higher temperatures and lower precipita-
tion. Additionally, areas that displayed the greatest sampling efforts were closer to the main
research centre for aquatic bugs and with a higher irrigated land surface for aquatic beetles.
Despite these slight differences, their importance was limited since neither of the taxonomic
groups showed differences in the number of records and SSS among the three physiocli-
matic subregions, what raises the value of the inventories. One possible explanation for this
equilibrium and consequent lack of clear biases could be that mountainous and forested
areas, although likely more interesting from a conservational perspective, are far from the
main research centres. In this sense, the attractiveness of the north western area could be
compensated by easier accessibility in the coastal and interior areas.
Checking the utility of biological databases
There are a number of examples using databases in ecological or conservation studies (e.g.
Flather 1996; Fagan and Kareiva 1997; Medail and Quezel 1999; Myers et al. 2000; Ferrier
2002; Rey-Benayas and de la Montana 2003; Rodrigues et al. 2004; Sanchez-Fernandez
et al. 2004), however the major part of them without a previous assessment of the quality
and completeness of the database. On the other hand, the studies that have incorporated this
kind of assessment have shown certain bias, lack of completeness or absence of envi-
ronmental representativeness (e.g. Soberon et al. 2000; Hortal et al. 2007; Mora et al. 2008;
Sanchez-Fernandez et al. 2008).
In this context, one of the main purposes of the applied methodology was to check
whether a relatively reliable predicted distribution based upon limited information could be
obtained. According to Hortal et al. (2007) and their schematised protocol to obtain reliable
biodiversity maps from biodiversity databases, the applicability of the target group data (at
this grain size) varied significantly. On one hand, additional surveys will be required to fill
the gaps in existing information of bryophytes so that they will be usable in further
ecological studies. On the other hand, although the databases from the rest of the target
groups (aquatic beetles, aquatic bugs and orchids) also showed a generalised lack of
complete and extensive inventory, the inventories for these groups displayed enough
sufficiently-surveyed squares to be used in further ecological studies, although some
analyses might be needed prior to their use. For these groups, extra efforts must be directed
towards two aims. Firstly, in the short term, predictive modelling will be desirable to
provide a picture of the biodiversity distribution that could be closer to reality. Although
these databases displayed a low number of SSS, they were representative of the envi-
ronmental heterogeneity of the study area, they were evenly distributed in the three
physioclimatic subregions and harbour an important fraction of the total number of species,
which substantially increase their usefulness in predictive ecology (Lobo and Martın-Piera
2002; Hortal et al. 2004). Secondly, more survey efforts will be necessary over time to
increase the degree of inventory completeness in general and the number of SSS in par-
ticular. These new samples should be located mainly in areas of high precipitation and low
Biodivers Conserv (2012) 21:1561–1575 1569
123

temperature for aquatic insects in the study area (i.e. the amount of sampling in the
northwest should be slightly higher than in the remaining areas).
Some conservation implications
The discrimination and recognition of poorly surveyed areas as well as the study of the
biases associated with the available information are key tasks necessary for the design of
more efficient survey strategies (Sanchez-Fernandez et al. 2011). In this sense, these results
provide a basis for the design of future sampling efforts by enabling the identification of
under-sampled regions.
The proportion of severely transformed surface (urban and irrigated land use) in the
areas that remain under-sampled is high (24.7% for aquatic beetles, 24.8% for bugs and
26.8% for orchids). In general, the regional southeast (except some well preserved squares
in the coast) and some interior areas (close to the main cities) show a high percentage of
anthropic land use (sometimes above the 75%). This high rate of anthropization
undoubtedly diminishes their interest in order to prioritize the location of further sampling
programs since they correspond to highly modified zones where the inclusion of new
species is unlikely for all the taxonomic groups studied.
On the other hand, the detection of potentially species-rich regions combined with the
results obtained from the sampling effort assessment would also improve efficiency in
gathering the remaining information. Considering that observed richness was strongly
influenced by sampling effort distribution patterns, the use of estimated richness by Clench
function would provide researchers a picture of the richness that could be closer to reality.
The estimated richness values of those squares that showed a completeness value above
50% were calculated. Although we are aware of the fact that their use may overpredict the
theoretical maximum species richness (especially in completeness values near 50%), the
results could be more realistic than those obtained by using the observed richness. Figure 3
shows clear differences regarding the estimated richness among physioclimatic subregions
for two of the three studied groups. Following Kruskal–Wallis with post hoc paired
comparison, the northwest seems to be a regional hotspot for aquatic beetle (H = 11.763,
p = 0.003) and orchid (H = 9.009, p = 0.011), existing a decreasing gradient to the coast
for aquatic beetle (Fig. 3a) whereas no trend is visible in aquatic bug richness distribution
(H = 0.515, p = 0.773) (Fig. 3b), probably due to the ubiquitous behaviour of this last
group (Carbonell et al. 2011).
Finally, the comparison between the distributions of both estimated richness and records
of the three physioclimatic regions indicated that the richest areas (those located in the
northwest) are not rich because they have been surveyed more intensively than the rest of
the region. In fact, the regional northwest has been considered in several studies as the
most diverse area for a wide range of taxonomic groups (Carrion-Vilches et al. 2000; De la
Calle et al. 2000; Sanchez-Gomez et al. 2002; Sanchez-Fernandez et al. 2004; Torralva
et al. 2005; Egea-Serrano et al. 2006, Bruno et al. in press b). Consequently, despite its
unquestionable diversity, the northwest (both observed and estimated richness point to this
area as the more diverse for most groups) requires extra surveys in order to determine to
what extent the estimated species richness may approach the real value of maximum
species richness.
In conclusion, although it should be noted that the databases used here are the most
complete source of information available for non-charismatic groups in the SE of the
Iberian Peninsula, the obtained results highlight the necessity of improving their inven-
tories and demonstrate the importance of incorporating sampling bias estimates in
1570 Biodivers Conserv (2012) 21:1561–1575
123

Fig. 3 Distribution of theestimated richness (onlycalculated for squares with acompleteness value C50%)among the differentphysioclimatic subregions for(a) aquatic beetles (b) aquaticbugs and (c) orchids
Biodivers Conserv (2012) 21:1561–1575 1571
123

biodiversity studies. In particular, this combination of methods should be required as a
preliminary step in biodiversity and ecological studies, in order to evaluate not only the
degree of geographic and environmental coverage of existing faunistic and floristic data,
but also the amount, nature and significance of the field work bias.
Acknowledgments We thank Cayetano Gutierrez, Felix Picazo, Jose Antonio Carbonell, Oscar Belmar,Paula Arribas, Pedro Abellan, Simone Guareschi, Susana Pallares and the rest of the ‘Ecologıa Acuatica’research group (Universidad de Murcia) for their wholehearted support. This work was supported by apredoctoral grant (FPU) from MICINN to D.B., a postdoctoral grant (Fundacion Seneca) to D.S–F., andproject CGL2006-04159, 023/2007 (A.M.).
References
Abellan P, Sanchez-Fernandez D, Velasco J, Millan A (2005) Conservation of freshwater biodiversity: acomparison of different area selection methods. Biodivers Conserv 14:3457–3474
Achurra A, Rodrıguez P (2008) Biodiversity of groundwater oligochaetes from a karst unit in northernIberian Peninsula: ranking subterranean sites for conservation management. Hydrobiologia 605:159–171
Aranda SC, Gabriel R, Borges PAV, Lobo JM (2010) Assessing the completeness of bryophytes inventories:an oceanic island as a case study (Terceira, Azorean archipelago). Biodivers Conserv 19:2469–2484
Bini LM, Diniz-Filho JAF, Rangel TFLVB, Bastos RP, Pinto MP (2006) Challenging Wallacean andLinnean shortfalls: knowledge gradients and conservation planning in a biodiversity hotspot. DiversDistrib 12:475–482
Brose U (2002) Estimating species richness of pitfall catches by non-parametric estimators. Pedobiologia46:101–107
Bruno D, Sanchez-Fernandez D, Carbonell JA, Picazo F, Velasco J, Millan A (in press a) Predicting aquaticinsects richness in a semi-arid Mediterranean region. Limnetica 31(1):23–36
Bruno D, Picazo F, Carbonell JA, Sanchez-Fernandez D, Abellan P, Velasco J, Millan A (in press b) Areasprioritarias para la conservacion de la biodiversidad en la Region de Murcia. In: Esteve MA, Martınez-Paz JM, Soro B (eds) Espacios naturales protegidos en la Region de Murcia: valoracion ecologica,jurıdica y economica. Editum, Servicio de publicaciones de la Universidad de Murcia. Murcia
Calvo-Sendın JF, Esteve-Selma MA, Lopez-Bermudez F (eds) (2000) Biodiversidad: Contribucion a suconocimiento y conservacion en la Region de Murcia. Servicio de publicaciones de la Universidad deMurcia, Murcia
Carbonell JA, Gutierrez-Canovas C, Bruno D, Abellan P, Velasco J, Millan A (2011) Ecological factorsdetermining the distribution and assemblages of the aquatic hemiptera (Gerromorpha and Nepomor-pha) in the Segura river basin (Spain). Limnetica 30:59–70
Carrion-Vilches MA, Sanchez-Gomez P, Guerra-Montes J, Hernandez-Gonzalez A, Carrillo-Lopez AF,Jimenez-Martınez JF, Garcıa-Rodrıguez J, Martınez-Fernandez JF (2000) Helechos de la Region deMurcia. CAM, Asociacion Forestal de la Region de Murcia y el grupo de investigacion de la Uni-versidad de Murcia E005/07. Murcia
Clench HK (1979) How to make regional lists of butterflies: some thoughts. J Lepid Soc 33:216–231Coddington JA, Agnarsson I, Miller JA, Kuntner M, Hormiga G (2009) Undersampling bias: the null
hypothesis for singleton species in tropical arthropod surveys. J Anim Ecol 78:573–584Colwell RK (2006) EstimateS: statistical estimation of species richness and shared species from samples.
Version 8. User’s guide and application published at: http://purl.oclc.org/estimatesColwell RK, Coddington JA (1994) Estimating terrestrial biodiversity through extrapolation. Philos Trans R
Soc Lond B Biol Sci 345:101–118De la Calle JA, Lencina F, Gonzalez F, Ortiz AS (2000) Las mariposas de la Region de Murcia. Macro-
lepidopteros diurnos y nocturnos. Nausıcaa, MurciaDennis RLH (2001) Progressive bias in species status is symptomatic of fine-grained mapping units subject
to repeated sampling. Biodivers Conserv 10:483–494Dennis RLH, Thomas CD (2000) Bias in butterfly distribution maps: the influence of hot spots and
recorder’s home range. J Insect Conserv 4:73–77Dennis RLH, Sparks TH, Hardy PB (1999) Bias in butterfly distribution maps: the effects of sampling effort.
J Insect Conserv 3:33–42
1572 Biodivers Conserv (2012) 21:1561–1575
123

Dıaz-Frances E, Soberon J (2005) Statistical estimation and model selection of species-accumulationfunctions. Conserv Biol 19:569–573
Egea-Serrano A, Oliva-Paterna FJ, Torralva M (2006) Amphibians in the Region of Murcia (SE Iberianpeninsula): conservation status and priority areas. Anim Biodivers Conserv 29:33–41
Esteve-Selma MA, Llorens-Pascual M, Martınez-Gallur C (eds) (2003) Los recursos naturales de la Regionde Murcia. Un analisis interdisciplinar. Servicio de publicaciones de la Universidad de Murcia, Murcia
Fagan WF, Kareiva PM (1997) Using compiled species lists to make biodiversity comparisons amongregions: a test case using Oregon butterflies. Biol Conserv 80:249–259
Ferrier S (2002) Mapping spatial pattern in biodiversity for regional conservation planning: where to fromhere? Syst Biol 51:331–363
Flather CH (1996) Fitting species-accumulation functions and assessing regional land use impacts on aviandiversity. J Biogeogr 23:155–168
Gotelli NJ, Colwell RK (2001) Quantifying biodiversity: procedures and pitfalls in the measurement andcomparison of species richness. Ecol Lett 4:379–391
Hortal J, Lobo JM (2005) An ED-based protocol for the optimal sampling of biodiversity. BiodiversConserv 14:2913–2947
Hortal J, Garcıa-Pereira P, Garcıa-Barros E (2004) Butterfly species richness in mainland Portugal: pre-dictive models of geographic distribution patterns. Ecography 27:68–82
Hortal J, Borges PAV, Gaspar C (2006) Evaluating the performance of species richness estimators: sen-sitivity to sample grain size. J Anim Ecol 75:274–287
Hortal J, Lobo JM, Jimenez-Valverde A (2007) Limitations of biodiversity databases: case study on seed-plant diversity in Tenerife, Canary Islands. Conserv Biol 21:853–863
Hortal J, Jimenez-Valverde A, Gomez JF, Lobo JM, Baselga A (2008) Historical bias in biodiversityinventories affects the observed environmental niche of the species. Oikos 117:847–858
Hylander K, Jonsson BG, Nilson C (2002) Evaluating buffer strips along boreal streams using bryophytes asindicators. Ecol Appl 12:797–806
Jimenez-Valverde A, Lobo JM (2007) Determinants of local spider (Araneidae and Thomisidae) speciesrichness on a regional scale: climate and altitude vs. habitat structure. Ecol Entomol 32:113–122
Kadmon R, Oren F, Avinoam D (2004) Effect of roadside bias on the accuracy of predictive maps producedby bioclimatic models. Ecol Appl 14:401–413
Kati V, Devillers P, Dufrene M, Legakis A, Vokou D, Lebrun PH (2004) Testing the value of six taxonomicgroups as biodiversity indicators at a local scale. Conserv Biol 18:667–675
Koellner T, Hersperger AM, Wohlgemuth T (2004) Rarefaction method for assessing plant species diversityon a regional scale. Ecography 27:532–544
Kozlowski G (2008) Is the global conservation status assessment of a threatened taxon a utopia? BiodiversConserv 17:445–448
Leveque C, Balian EV, Martens K (2005) An assessment of animal species diversity in continental waters.Hydrobiologia 542:39–67
Lobo JM (2008) Database records as a surrogate for sampling effort provide higher species richnessestimations. Biodivers Conserv 17:873–881
Lobo JM, Martın-Piera F (2002) Searching for a predictive model for species richness of Iberian dung beetlebased on spatial and environmental variables. Conserv Biol 16:158–173
Lomolino MV (2004) Conservation biogeography. In: Lomolino MV, Heaney LR (eds) Frontiers of bio-geography: new directions in the geography of nature. Sinauer Associates Inc, Sunderland, pp 293–296
Lopez-Espinosa JA, Sanchez- Gomez P (2006) The orchids of the Region of Murcia, Spain: a contribution tothe OPTIMA project ‘Mapping of Mediterranean orchids’. J Eur Orchid 38:799-865
Medail F, Quezel P (1999) Biodiversity hotspots in the Mediterranean Basin: setting global conservationpriorities. Conserv Biol 13:1510–1513
Mendoza-Fernandez A, Perez-Garcıa FJ, Medina-Cazorla JM, Martınez-Hernandez F, Garrido-Becerra JA,Salmeron-Sanchez E, Mota JF (2010) Gap Analysis and selection of reserves for the threatened flora ofeastern Andalusia, a hot spot in the eastern Mediterranean region. Acta Bot Gallica 157:749–767
Millan A, Abellan P, Ribera I, Sanchez-Fernandez D, Velasco J (2006) The hydradephaga of the Segurabasin (SE Spain): twenty five years studying water beetles. Monograph on hydroadephaga. In mem-oriam of Prof Franciscolo. Memor Soc Entomol Ital 85:137–158
Mora C, Tittensor DP, Myers RA (2008) The completeness of taxonomic inventories for describing theglobal diversity and distribution of marine fishes. Proc R Soc B 275:149–155
Moreno CE, Halffter G (2000) Assessing the completeness of bat biodiversity inventories using speciesaccumulation curves. J Appl Ecol 37:149–158
Moreno CE, Halffter G (2001) On the measure of sampling effort used in species accumulation curves.J Appl Ecol 38:487–490
Biodivers Conserv (2012) 21:1561–1575 1573
123

Myers N, Mittermeier RA, Mittermeier CG, da Fonseca GAB, Kent J (2000) Biodiversity hotspots forconservation priorities. Nature 403:853–858
Nakamura M, Soberon J (2009) Use of approximate inference in an index of completeness of biologicalinventories. Conserv Biol 23:469–474
Naveh Z, Lieberman A (1984) Landscape ecology: theory and applications. Springer, New YorkPetersen FT, Meier R (2003) Testing species-richness estimation methods on single-sample collection data
using the Danish Diptera. Biodivers Conserv 12:667–686Picazo F, Moreno JL, Millan A (2010) The contribution of standing waters to aquatic biodiversity: the case
of water beetles in southeastern Iberia. Aquac Ecol 44:205–216Picazo F, Bilton DT, Moreno JL, Sanchez-Fernandez D, Millan A (in press) Water beetle biodiversity in
Mediterranean standing waters: assemblage composition, environmental drivers and nestedness pat-terns. Insect Conserv Diver. doi:10.1111/j.1752-4598.2011.00144.x
Pimm LP, Raven P (2000) Extinction by numbers. Nature 403:843–845Polhemus JT, Polhemus DA (2008) Global diversity of true bugs (Heteroptera; Insecta) in freshwater.
Hydrobiologia 595:379–391Puissant S, Sueur J (2010) A hotspot for Mediterranean cicadas (Insecta: Hemiptera: Cicadidae): new
genera, species and songs from southern Spain. Syst Biodivers 8:555–574Ramos MA, Lobo JM, Esteban M (2001) Ten years inventorying the Iberian fauna: results and perspectives.
Biodivers Conserv 10:19–28Rey-Benayas JM, De la Montana E (2003) Identifying areas of high-value vertebrate diversity for
strengthening conservation. Biol Conserv 114:357–370Rodrigues ASL, Andelman SJ, Bakarr MI, Boitani L, Brooks TM, Cowling RM, Fishpool LDC, da Fonseca
GAB, Gaston KJ, Hoffmann M, Long JS, Marquet PA, Pilgrim JD, Pressey RL, Schipper J, SechrestW, Stuart SN, Underhill LG, Waller RW, Watts MEJ, Yan X (2004) Effectiveness of the globalprotected area network in representing species diversity. Nature 428:640–643
Romo H, Garcia-Barros E, Lobo JM (2006) Identifying recorder-induced geographic bias in an Iberianbutterfly database. Ecography 29:873–885
Rosenzweig ML, Turner WR, Cox JG, Ricketts TH (2003) Estimating diversity in unsampled habitats of abiogeographical province. Conserv Biol 17:864–874
Sanchez-Fernandez D, Abellan P, Velasco J, Millan A (2004) Selecting areas to protect the biodiversity ofaquatic ecosystems in a semiarid Mediterranean region using water beetles. Aquat Conserv14:465–479
Sanchez-Fernandez D, Lobo JM, Abellan P, Ribera I, Millan A (2008) Bias in freshwater biodiversitysampling: the case of Iberian water beetles. Divers Distrib 14:754–762
Sanchez-Fernandez D, Lobo JM, Abellan P, Millan A (2011) How to identify future sampling areas wheninformation is biased and scarce: An example using predictive models for species richness of Iberianwater beetles. J Nat Conserv 19:54–59
Sanchez-Gomez P, Carrion MA, Hernandez A, Guerra J (2002) Libro rojo de la flora silvestre protegida dela Region de Murcia. DGMN. Comunidad Autonoma de la Region de Murcia, Murcia
Santos AMC, Jones OR, Quicke DLJ, Hortal J (2010) Assessing the reliability of biodiversity databases:identifying evenly inventoried island parasitoid faunas (Hymenoptera: Ichneumonoidea) worldwide.Insect Conserv Diver 3:72–82
Soberon J, Llorente J (1993) The use of species accumulation functions for the prediction of speciesrichness. Conserv Biol 7:480–488
Soberon J, Llorente J, Onate L (2000) The use of specimen-label databases for conservation purposes: anexample using Mexican Papilionid and Pierid butterflies. Biodivers Conserv 9:1441–1466
Soberon J, Jimenez R, Golubov J, Koleff P (2007) Assessing completeness of biodiversity databases atdifferent spatial scales. Ecography 30:152–160
StatSoft (2007) STATISTICA (data analysis software system), Version 8. www.statsoft.com. StatSoft, TulsaStewart KJ, Mallik AU (2006) Bryophyte responses to microclimatic edge effects across riparian buffers.
Ecol Appl 16:1474–1486Torralva M, Oliva-Paterna FJ, Andreu-Soler A, Verdiell-Cubedo D, Minano PA, Egea-Serrano A (2005)
Atlas de Distribucion de los Anfibios de la Region de Murcia. DGMN. Comunidad Autonoma de laRegion de Murcia, Murcia
Unterseher M, Jumpponen A, Opik M, Tedersoo L, Moora M, Dormann CF, Schnittler M (2011) Speciesabundance distributions and richness estimations in fungal metagenomics–lessons learned fromcommunity ecology. Mol Ecol 20:275–285
Walther BA, Martin JL (2001) Species richness estimation of bird communities: how to control for samplingeffort? Ibis 143:413–419
1574 Biodivers Conserv (2012) 21:1561–1575
123

Walther BA, Moore JL (2005) The concepts of bias, precision and accuracy, and their use in testing theperformance of species richness estimators, with a literature review of estimator performance. Eco-graphy 28:815–829
Whittaker RJ, Araujo MB, Jepson P, Ladle RJ, Watson JEM, Willis KJ (2005) Conservation biogeography:assessment and project. Divers Distrib 11:3–23
Williams WL, Witkowski ETF, Balkwill K (2007) The use of incidence-based species richness estimators,species accumulation curves and similarity measures to appraise ethnobotanical inventories from SouthAfrica. Biodivers Conserv 16:2495–2513
Willott SJ (2001) Species accumulation curves and the measure of sampling effort. J Appl Ecol 38:484–486
Biodivers Conserv (2012) 21:1561–1575 1575
123
Related Documents


![Untitled-1 [] · taxonomic characters. Zoological Nomenclature, origin of code, ICZN. UNIT V : Taxonomic Records And Publications Taxonomic keys, Taxonomic characters description,](https://static.cupdf.com/doc/110x72/5e60819b810ee55ab507dd7d/untitled-1-taxonomic-characters-zoological-nomenclature-origin-of-code-iczn.jpg)


