HEALTH TECHNOLOGY ASSESSMENT VOLUME 21 ISSUE 69 NOVEMBER 2017 ISSN 1366-5278 DOI 10.3310/hta21690 Assessing the performance of methodological search filters to improve the efficiency of evidence information retrieval: five literature reviews and a qualitative study Carol Lefebvre, Julie Glanville, Sophie Beale, Charles Boachie, Steven Duffy, Cynthia Fraser, Jenny Harbour, Rachael McCool and Lynne Smith

Welcome message from author
This document is posted to help you gain knowledge. Please leave a comment to let me know what you think about it! Share it to your friends and learn new things together.
Transcript
HEALTH TECHNOLOGY ASSESSMENTVOLUME 21 ISSUE 69 NOVEMBER 2017
ISSN 1366-5278
DOI 10.3310/hta21690
Assessing the performance of methodological search filters to improve the efficiency of evidence information retrieval: five literature reviews and a qualitative study
Carol Lefebvre, Julie Glanville, Sophie Beale, Charles Boachie, Steven Duffy, Cynthia Fraser, Jenny Harbour, Rachael McCool and Lynne Smith

Assessing the performance ofmethodological search filters to improvethe efficiency of evidence informationretrieval: five literature reviews and aqualitative study
Carol Lefebvre,1,2* Julie Glanville,3 Sophie Beale,3
Charles Boachie,4 Steven Duffy,3 Cynthia Fraser,4
Jenny Harbour,5 Rachael McCool3 and Lynne Smith5
1UK Cochrane Centre, Oxford, UK2Lefebvre Associates Ltd, Oxford, UK3York Health Economics Consortium, York, UK4Health Services Research Unit, University of Aberdeen, Aberdeen, UK5Healthcare Improvement Scotland, Glasgow, UK
*Corresponding author
Declared competing interests of authors: none
Note to reader: it is acknowledged that there has been a regrettable delay between carrying out theproject, including the searches, and the publication of this report, because of serious illness of the principalinvestigator. The searches were carried out in 2010/11.
Published November 2017DOI: 10.3310/hta21690
This report should be referenced as follows:
Lefebvre C, Glanville J, Beale S, Boachie C, Duffy S, Fraser C, et al. Assessing the performance of
methodological search filters to improve the efficiency of evidence information retrieval:
five literature reviews and a qualitative study. Health Technol Assess 2017;21(69).
Health Technology Assessment is indexed and abstracted in Index Medicus/MEDLINE, ExcerptaMedica/EMBASE, Science Citation Index Expanded (SciSearch®) and Current Contents®/Clinical Medicine.

Health Technology Assessment HTA MRP–MRC
ISSN 1366-5278 (Print)
ISSN 2046-4924 (Online)
Impact factor: 4.236
Health Technology Assessment is indexed in MEDLINE, CINAHL, EMBASE, The Cochrane Library and the Clarivate Analytics ScienceCitation Index.
This journal is a member of and subscribes to the principles of the Committee on Publication Ethics (COPE) (www.publicationethics.org/).
Editorial contact: [email protected]
The full HTA archive is freely available to view online at www.journalslibrary.nihr.ac.uk/hta. Print-on-demand copies can be purchased from thereport pages of the NIHR Journals Library website: www.journalslibrary.nihr.ac.uk
Criteria for inclusion in the Health Technology Assessment journalReports are published in Health Technology Assessment (HTA) if (1) they have resulted from work for the HTA programme or,commissioned/managed through the Methodology research programme (MRP), and (2) they are of a sufficiently high scientific quality asassessed by the reviewers and editors.
Reviews in Health Technology Assessment are termed ‘systematic’ when the account of the search appraisal and synthesis methods (tominimise biases and random errors) would, in theory, permit the replication of the review by others.
HTA programmeThe HTA programme, part of the National Institute for Health Research (NIHR), was set up in 1993. It produces high-quality researchinformation on the effectiveness, costs and broader impact of health technologies for those who use, manage and provide care in the NHS.‘Health technologies’ are broadly defined as all interventions used to promote health, prevent and treat disease, and improve rehabilitationand long-term care.
The journal is indexed in NHS Evidence via its abstracts included in MEDLINE and its Technology Assessment Reports inform National Institutefor Health and Care Excellence (NICE) guidance. HTA research is also an important source of evidence for National Screening Committee (NSC)policy decisions.
For more information about the HTA programme please visit the website: http://www.nets.nihr.ac.uk/programmes/hta
This reportThis issue of the Health Technology Assessment journal series contains a project commissioned/managed by the Methodology researchprogramme (MRP). The Medical Research Council (MRC) is working with NIHR to deliver the single joint health strategy and the MRP waslaunched in 2008 as part of the delivery model. MRC is lead funding partner for MRP and part of this programme is the joint MRC–NIHRfunding panel ‘The Methodology Research Programme Panel’.
To strengthen the evidence base for health research, the MRP oversees and implements the evolving strategy for high-quality methodologicalresearch. In addition to the MRC and NIHR funding partners, the MRP takes into account the needs of other stakeholders including thedevolved administrations, industry R&D, and regulatory/advisory agencies and other public bodies. The MRP funds investigator-led and needs-led research proposals from across the UK. In addition to the standard MRC and RCUK terms and conditions, projects commissioned/managedby the MRP are expected to provide a detailed report on the research findings and may publish the findings in the HTA journal, if supportedby NIHR funds.
The authors have been wholly responsible for all data collection, analysis and interpretation, and for writing up their work. The HTA editorsand publisher have tried to ensure the accuracy of the authors’ report and would like to thank the reviewers for their constructive commentson the draft document. However, they do not accept liability for damages or losses arising from material published in this report.
This report presents independent research funded under a MRC–NIHR partnership. The views and opinions expressed by authors in thispublication are those of the authors and do not necessarily reflect those of the NHS, the NIHR, the MRC, NETSCC, the HTA programme or theDepartment of Health. If there are verbatim quotations included in this publication the views and opinions expressed by the interviewees arethose of the interviewees and do not necessarily reflect those of the authors, those of the NHS, the NIHR, the MRC, NETSCC, the HTAprogramme or the Department of Health.
© Queen’s Printer and Controller of HMSO 2017. This work was produced by Lefebvre et al. under the terms of a commissioningcontract issued by the Secretary of State for Health. This issue may be freely reproduced for the purposes of private research andstudy and extracts (or indeed, the full report) may be included in professional journals provided that suitable acknowledgementis made and the reproduction is not associated with any form of advertising. Applications for commercial reproduction should beaddressed to: NIHR Journals Library, National Institute for Health Research, Evaluation, Trials and Studies Coordinating Centre,Alpha House, University of Southampton Science Park, Southampton SO16 7NS, UK.
Published by the NIHR Journals Library (www.journalslibrary.nihr.ac.uk), produced by Prepress Projects Ltd, Perth, Scotland(www.prepress-projects.co.uk).

Editor-in-Chief
Health Technology Assessment
NIHR Journals Library
Professor Tom Walley Director, NIHR Evaluation, Trials and Studies and Director of the EME Programme, UK
NIHR Journals Library Editors
Editor-in-Chief
Professor Hywel Williams Director, HTA Programme, UK and Foundation Professor and Co-Director of theCentre of Evidence-Based Dermatology, University of Nottingham, UK
Professor Ken Stein Chair of HTA and EME Editorial Board and Professor of Public Health, University of Exeter Medical School, UK
Professor Andrée Le May Chair of NIHR Journals Library Editorial Group (HS&DR, PGfAR, PHR journals)
Dr Martin Ashton-Key Consultant in Public Health Medicine/Consultant Advisor, NETSCC, UK
Professor Matthias Beck Chair in Public Sector Management and Subject Leader (Management Group), Queen’s University Management School, Queen’s University Belfast, UK
Dr Tessa Crilly Director, Crystal Blue Consulting Ltd, UK
Dr Eugenia Cronin Senior Scientific Advisor, Wessex Institute, UK
Dr Peter Davidson Director of the NIHR Dissemination Centre, University of Southampton, UK
Ms Tara Lamont Scientific Advisor, NETSCC, UK
Dr Catriona McDaid Senior Research Fellow, York Trials Unit, Department of Health Sciences, University of York, UK
Professor William McGuire Professor of Child Health, Hull York Medical School, University of York, UK
Professor Geoffrey Meads Professor of Wellbeing Research, University of Winchester, UK
Professor John Norrie Chair in Medical Statistics, University of Edinburgh, UK
Professor John Powell Consultant Clinical Adviser, National Institute for Health and Care Excellence (NICE), UK
Professor James Raftery Professor of Health Technology Assessment, Wessex Institute, Faculty of Medicine, University of Southampton, UK
Dr Rob Riemsma Reviews Manager, Kleijnen Systematic Reviews Ltd, UK
Professor Helen Roberts Professor of Child Health Research, UCL Institute of Child Health, UK
Professor Jonathan Ross Professor of Sexual Health and HIV, University Hospital Birmingham, UK
Professor Helen Snooks Professor of Health Services Research, Institute of Life Science, College of Medicine, Swansea University, UK
Professor Jim Thornton Professor of Obstetrics and Gynaecology, Faculty of Medicine and Health Sciences, University of Nottingham, UK
Professor Martin Underwood Director, Warwick Clinical Trials Unit, Warwick Medical School,University of Warwick, UK
Please visit the website for a list of members of the NIHR Journals Library Board: www.journalslibrary.nihr.ac.uk/about/editors
Editorial contact: [email protected]
NIHR Journals Library www.journalslibrary.nihr.ac.uk
Abstract
Assessing the performance of methodological search filtersto improve the efficiency of evidence information retrieval:five literature reviews and a qualitative study
Carol Lefebvre,1,2* Julie Glanville,3 Sophie Beale,3 Charles Boachie,4
Steven Duffy,3 Cynthia Fraser,4 Jenny Harbour,5 Rachael McCool3
and Lynne Smith5
1UK Cochrane Centre, Oxford, UK2Lefebvre Associates Ltd, Oxford, UK3York Health Economics Consortium, York, UK4Health Services Research Unit, University of Aberdeen, Aberdeen, UK5Healthcare Improvement Scotland, Glasgow, UK
*Corresponding author [email protected]
Background: Effective study identification is essential for conducting health research, developing clinicalguidance and health policy and supporting health-care decision-making. Methodological search filters(combinations of search terms to capture a specific study design) can assist in searching to achieve this.
Objectives: This project investigated the methods used to assess the performance of methodologicalsearch filters, the information that searchers require when choosing search filters and how thatinformation could be better provided.
Methods: Five literature reviews were undertaken in 2010/11: search filter development and testing;comparison of search filters; decision-making in choosing search filters; diagnostic test accuracy (DTA)study methods; and decision-making in choosing diagnostic tests. We conducted interviews and aquestionnaire with experienced searchers to learn what information assists in the choice of search filtersand how filters are used. These investigations informed the development of various approaches togathering and reporting search filter performance data. We acknowledge that there has been a regrettabledelay between carrying out the project, including the searches, and the publication of this report, becauseof serious illness of the principal investigator.
Results: The development of filters most frequently involved using a reference standard derived fromhand-searching journals. Most filters were validated internally only. Reporting of methods was generallypoor. Sensitivity, precision and specificity were the most commonly reported performance measures andwere presented in tables. Aspects of DTA study methods are applicable to search filters, particularly inthe development of the reference standard. There is limited evidence on how clinicians choose betweendiagnostic tests. No published literature was found on how searchers select filters. Interviewing andquestioning searchers via a questionnaire found that filters were not appropriate for all tasks but werepredominantly used to reduce large numbers of retrieved records and to introduce focus. The InterTechnology Appraisal Support Collaboration (InterTASC) Information Specialists’ Sub-Group (ISSG) SearchFilters Resource was most frequently mentioned by both groups as the resource consulted to select a filter.Randomised controlled trial (RCT) and systematic review filters, in particular the Cochrane RCT and theMcMaster Hedges filters, were most frequently mentioned. The majority indicated that they used differentfilters depending on the requirement for sensitivity or precision. Over half of the respondents used the filters
DOI: 10.3310/hta21690 HEALTH TECHNOLOGY ASSESSMENT 2017 VOL. 21 NO. 69
© Queen’s Printer and Controller of HMSO 2017. This work was produced by Lefebvre et al. under the terms of a commissioning contract issued by the Secretary of State forHealth. This issue may be freely reproduced for the purposes of private research and study and extracts (or indeed, the full report) may be included in professional journalsprovided that suitable acknowledgement is made and the reproduction is not associated with any form of advertising. Applications for commercial reproduction should beaddressed to: NIHR Journals Library, National Institute for Health Research, Evaluation, Trials and Studies Coordinating Centre, Alpha House, University of Southampton SciencePark, Southampton SO16 7NS, UK.
v
available in databases. Interviewees used various approaches when using and adapting search filters.Respondents suggested that the main factors that would make choosing a filter easier were the availability ofcritical appraisals and more detailed performance information. Provenance and having the filter available in acentral storage location were also important.
Limitations: The questionnaire could have been shorter and could have included more multiple choicequestions, and the reviews of filter performance focused on only four study designs.
Conclusions: Search filter studies should use a representative reference standard and explicitly reportmethods and results. Performance measures should be presented systematically and clearly. Searchers findfilters useful in certain circumstances but expressed a need for more user-friendly performance informationto aid filter choice. We suggest approaches to use, adapt and report search filter performance. Futurework could include research around search filters and performance measures for study designs notaddressed here, exploration of alternative methods of displaying performance results and numericalsynthesis of performance comparison results.
Funding: The National Institute for Health Research (NIHR) Health Technology Assessment programme andMedical Research Council–NIHR Methodology Research Programme (grant number G0901496).
ABSTRACT
NIHR Journals Library www.journalslibrary.nihr.ac.uk
vi
Contents
List of tables xi
List of figures xiii
List of boxes xv
Glossary xvii
List of abbreviations xxi
Plain English summary xxiii
Scientific summary xxv
Chapter 1 Introduction 1Background 1Aims and objectives 1
Chapter 2 Methods 3Reviews 3Interviews and questionnaire 4
Phase 1: semistructured interviews 4Phase 2: questionnaire survey 4
Presentation of filter information 4Performance tests, reports and performance resource 4Performance measures for methodological search filters (review A) 5
Introduction 5Methods 5Results 6Discussion 24
Measures for comparing the performance of methodological search filters (review B) 25Introduction 26Objectives 26Methods 26Results 27Discussion 39Recommendations 41
Measuring performance in diagnostic test accuracy studies (review C) 41Introduction 41Objectives 41Methods 42Results for diagnostic test accuracy studies 43Summary 50Applicability to research in search filter performance 50Methods for conducting a search filter performance study 51Search filter performance measures 52Presentation of results 53
DOI: 10.3310/hta21690 HEALTH TECHNOLOGY ASSESSMENT 2017 VOL. 21 NO. 69
© Queen’s Printer and Controller of HMSO 2017. This work was produced by Lefebvre et al. under the terms of a commissioning contract issued by the Secretary of State forHealth. This issue may be freely reproduced for the purposes of private research and study and extracts (or indeed, the full report) may be included in professional journalsprovided that suitable acknowledgement is made and the reproduction is not associated with any form of advertising. Applications for commercial reproduction should beaddressed to: NIHR Journals Library, National Institute for Health Research, Evaluation, Trials and Studies Coordinating Centre, Alpha House, University of Southampton SciencePark, Southampton SO16 7NS, UK.
vii

Comparing the results of search filters 54Conclusions 54
How do searchers choose search filters? (review D) 54Objectives 54Methods 54Results 56Discussion 56
How do clinicians choose between diagnostic tests? (review E) 58Introduction 58Objective 58Methods 58Results 59Discussion 63Conclusion 63
Chapter 3 Interviews 65Aims 65Methods 65Findings 65
Databases used by interviewees 65Interviewees’ use of search filters 65Where would you look for a search filter? 67Developing and amending search filters 67Reporting the use of search filters 68Methods of keeping up to date 68Choosing between filters 68What would help you choose between filters? 69Benefits of filters 70Limitations of filters 70Areas where filters are needed/existing filters need to be improved 70Other comments 71
Discussion 71
Chapter 4 Questionnaire 73Questionnaire methods 73Questionnaire results 73
What is your job title? 73How long have you been searching databases such as MEDLINE? 74How often do you develop new search strategies as part of your work? 74For what purposes do you carry out searches within your organisation? 74Which databases do you search regularly? 75Have you ever used a methodological search filter? 76In what circumstances would you use methodological search filters? 76Do you always use a filter when providing searches for similar types of projects? 77Typical practice when using search filters 77If you had to find a methodological search filter for a specific study design, wherewould you look? 78How do you decide which filter to use? 79Apart from adding a subject search, do you amend methodological search filters? 79Why, typically, do you amend search filters? 79How do you amend search filters? 80Do you test and document the effects of any amendments you make? 80Keeping up to date 81
CONTENTS
NIHR Journals Library www.journalslibrary.nihr.ac.uk
viii
If you have had to choose between methodological search filters, what features orinformation has helped you to do so? 84If you report your search process do you describe the filters that you have used? 84If you report your search process do you justify your choice of filters used? 84What do you think are the benefits of using methodological search filters? 85What do you think are the limitations of using methodological search filters? 85What information would help you to choose which filter to use? 85What methodological search filters would be useful to you? 86Further observations on methodological search filters as a tool for information retrieval 87
Discussion 88When do searchers and researchers use search filters? 89What information would help researchers choose between filters? 89Conclusion 91
Chapter 5 Suggested approach to measuring search filter performance 93Introduction 93Measuring search filter performance 93
Which performance characteristics should be measured? 93How should a performance measure be ascertained? 94How can performance measurement be carried out most efficiently? 98
Reporting search filter performance 100
Chapter 6 Project website 103
Chapter 7 Future research 105Filters for other study designs 105Displaying performance results 105Filter amendments 105Applicability to the wider community 105Synthesis of filter performance 105Filter-only performance 105
Acknowledgements 107
References 109
Appendix 1 Questionnaire 119
Appendix 2 Review C: search strategies and websites consulted that containedpotentially relevant publications 127
Appendix 3 Review C: excluded studies 129
Appendix 4 Review D: search strategies 133
Appendix 5 Review E: search strategies 141
Appendix 6 Review E: excluded studies 145
DOI: 10.3310/hta21690 HEALTH TECHNOLOGY ASSESSMENT 2017 VOL. 21 NO. 69
© Queen’s Printer and Controller of HMSO 2017. This work was produced by Lefebvre et al. under the terms of a commissioning contract issued by the Secretary of State forHealth. This issue may be freely reproduced for the purposes of private research and study and extracts (or indeed, the full report) may be included in professional journalsprovided that suitable acknowledgement is made and the reproduction is not associated with any form of advertising. Applications for commercial reproduction should beaddressed to: NIHR Journals Library, National Institute for Health Research, Evaluation, Trials and Studies Coordinating Centre, Alpha House, University of Southampton SciencePark, Southampton SO16 7NS, UK.
ix

List of tables
TABLE 1 Review A: included studies – economic search filter studies 7
TABLE 2 Review A: included studies – diagnostic search filter studies 8
TABLE 3 Review A: included studies – systematic review search filter studies 11
TABLE 4 Review A: included studies – RCT search filter studies 15
TABLE 5 Review A: excluded studies 21
TABLE 6 Review A: performance measures – internal standards 23
TABLE 7 Review A: performance measures – external standards 24
TABLE 8 Review B: characteristics of the performance comparison studiesincluded in this review 28
TABLE 9 Review B: table of included studies 29
TABLE 10 Review B: excluded studies 34
TABLE 11 Review B: measures reported in filter performance comparisons 36
TABLE 12 Review B: example of a filter performance comparison table ascommonly presented in the literature 37
TABLE 13 Review C: contingency table 44
TABLE 14 Review C: measures of diagnostic accuracy 44
TABLE 15 Review C: calculating sample sizes for search filter design studies.Number of cases (and controls) for expected sensitivities (or specificities)ranging from 0.60 to 0.95 52
TABLE 16 Review C: precision and specificity illustration 53
TABLE 17 Review D: databases and other resources searched 55
TABLE 18 Review D: numbers of records identified from various resources 56
TABLE 19 Review E: included studies 60
TABLE 20 Review E: reports from national screening programmes 62
TABLE 21 Numbers of interviews and interviewees 65
TABLE 22 Health databases used by the interviewees 66
TABLE 23 Length of time that respondents had been searching databases 74
DOI: 10.3310/hta21690 HEALTH TECHNOLOGY ASSESSMENT 2017 VOL. 21 NO. 69
© Queen’s Printer and Controller of HMSO 2017. This work was produced by Lefebvre et al. under the terms of a commissioning contract issued by the Secretary of State forHealth. This issue may be freely reproduced for the purposes of private research and study and extracts (or indeed, the full report) may be included in professional journalsprovided that suitable acknowledgement is made and the reproduction is not associated with any form of advertising. Applications for commercial reproduction should beaddressed to: NIHR Journals Library, National Institute for Health Research, Evaluation, Trials and Studies Coordinating Centre, Alpha House, University of Southampton SciencePark, Southampton SO16 7NS, UK.
xi
TABLE 24 Frequency of developing new search strategies 75
TABLE 25 ‘Other’ searches reported by respondents 75
TABLE 26 Databases that are used regularly by respondents by frequency of citation 76
TABLE 27 Other databases searched by four or more respondents by frequencyof citation 76
TABLE 28 Circumstances in which search filters are used 77
TABLE 29 Typical practice with respect to search filters 78
TABLE 30 How do respondents decide which filter to use? 79
TABLE 31 Frequency with which respondents amend search filters 80
TABLE 32 Number and percentage of respondents who test the effect of searchfilter amendments 80
TABLE 33 Number and percentage of respondents who document theamendments to search filters when they write up their searches 81
TABLE 34 Methods of keeping up-to-date 82
TABLE 35 Number and percentage of respondents who provide a description ofthe search filters used 85
TABLE 36 Number and percentage of respondents who provide a justificationfor the search filters used 85
TABLE 37 Example of an original and translated filter 97
TABLE 38 Pro forma for reporting search filter performance data 100
TABLE 39 Example of a completed pro forma 101
LIST OF TABLES
NIHR Journals Library www.journalslibrary.nihr.ac.uk
xii
List of figures
FIGURE 1 Review B: bar chart displaying the comparative performance of filtersfor DTA studies as published by Leeflang et al. 38
FIGURE 2 Review B: forest plot of overall sensitivity and precision for each filterin the study by Whiting et al. 38
FIGURE 3 Review C: selection of reports for inclusion in the review 42
FIGURE 4 Review C: example ROC curve 45
FIGURE 5 Review C: example graphical displays for primary study data 46
FIGURE 6 Review C: example of a paired forest plot 48
FIGURE 7 Review C: example of a ROC space plot showing summary sensitivityand specificity 49
FIGURE 8 Review C: example of a paired SROC curve, comparing the accuracy oftest 1 with that of test 2 49
FIGURE 9 Review D: numbers of records retrieved and assessed for relevance 57
FIGURE 10 Review E: numbers of records retrieved and assessed for relevance 59
FIGURE 11 Search filter performance measurement using a hand-searchedreference set 98
FIGURE 12 Search filter performance measurement using a RR reference set 99
DOI: 10.3310/hta21690 HEALTH TECHNOLOGY ASSESSMENT 2017 VOL. 21 NO. 69
© Queen’s Printer and Controller of HMSO 2017. This work was produced by Lefebvre et al. under the terms of a commissioning contract issued by the Secretary of State forHealth. This issue may be freely reproduced for the purposes of private research and study and extracts (or indeed, the full report) may be included in professional journalsprovided that suitable acknowledgement is made and the reproduction is not associated with any form of advertising. Applications for commercial reproduction should beaddressed to: NIHR Journals Library, National Institute for Health Research, Evaluation, Trials and Studies Coordinating Centre, Alpha House, University of Southampton SciencePark, Southampton SO16 7NS, UK.
xiii


List of boxes
BOX 1 Example description of a reference set 95
DOI: 10.3310/hta21690 HEALTH TECHNOLOGY ASSESSMENT 2017 VOL. 21 NO. 69
© Queen’s Printer and Controller of HMSO 2017. This work was produced by Lefebvre et al. under the terms of a commissioning contract issued by the Secretary of State forHealth. This issue may be freely reproduced for the purposes of private research and study and extracts (or indeed, the full report) may be included in professional journalsprovided that suitable acknowledgement is made and the reproduction is not associated with any form of advertising. Applications for commercial reproduction should beaddressed to: NIHR Journals Library, National Institute for Health Research, Evaluation, Trials and Studies Coordinating Centre, Alpha House, University of Southampton SciencePark, Southampton SO16 7NS, UK.
xv

Glossary
Accuracy The number of records correctly retrieved (because they are relevant) plus the number correctlynot retrieved (because they are not relevant) as a proportion of all records in the database. Often expressedas a percentage.
Area under the curve Calculation of the area under the receiver operating characteristic curve providesthe overall value of diagnostic test accuracy.
Article read ratio The number of articles (or records) retrieved by a search filter that need to be read toidentify one relevant record. This is calculated as 1/precision and is equivalent to the number neededto read.
Diagnostic odds ratio The odds of being truly relevant among the relevant divided by the odds of beingassessed as relevant among the irrelevant.
External standard A reference standard used to validate a search filter that is different from the onefrom which the filter has been derived.
Fallout 1 – specificity value.
Gold standard A collection of records that meet specific criteria for relevance. The criteria for relevancewill vary. Performance measures for search filters measure how well the filters retrieve records from thegold standard. Also known as a reference set or standard. When a search filter is developed and itsperformance is measured on the same gold standard, this standard is described as an internal standard.When a filter is developed and measured using a different gold standard, this standard is described as anexternal standard.
Hand-searching Assessment of the full texts of publications such as journals to identify relevant recordsmeeting reference set or gold standard inclusion criteria. Hand-searching typically involves the examinationof documents from cover to cover for a specified publication time span (in the case of journals).
Hedges An alternative name for search filters.
Internal standard A reference standard that is used to derive and validate a search filter.
Irrelevant records These records may be retrieved by the search filter but do not meet the criteria forinclusion in the reference set/gold standard.
Methodological search filter A search filter designed to retrieve a specific research method.
Multiple technology appraisal An appraisal of the clinical effectiveness and cost-effectiveness of,typically, more than one technology that is undertaken by an independent academic centre commissionedby the National Institute for Health and Care Excellence.
Number needed to read The number of records retrieved by a search filter that need to be read toidentify one relevant record. This is calculated as 1/precision.
Number of records retrieved The total number of records retrieved by a search filter.
DOI: 10.3310/hta21690 HEALTH TECHNOLOGY ASSESSMENT 2017 VOL. 21 NO. 69
© Queen’s Printer and Controller of HMSO 2017. This work was produced by Lefebvre et al. under the terms of a commissioning contract issued by the Secretary of State forHealth. This issue may be freely reproduced for the purposes of private research and study and extracts (or indeed, the full report) may be included in professional journalsprovided that suitable acknowledgement is made and the reproduction is not associated with any form of advertising. Applications for commercial reproduction should beaddressed to: NIHR Journals Library, National Institute for Health Research, Evaluation, Trials and Studies Coordinating Centre, Alpha House, University of Southampton SciencePark, Southampton SO16 7NS, UK.
xvii
Precision The number of reference set or gold standard (i.e. relevant) records retrieved by a search filteras a proportion of the total number of records (relevant and irrelevant) retrieved. Often expressed asa percentage.
Prevalence The number of relevant records in the reference set retrieved as a proportion of the totalnumber of records in a database. Often expressed as a percentage.
Recall The number of relevant records in the reference set or gold standard that are retrieved by a searchfilter as a proportion of the total number of records in the reference set or gold standard. Often expressedas a percentage and also known as sensitivity.
Receiver operating characteristic A receiver operating characteristic curve represents the relationshipbetween the ‘true-positive fraction’ (sensitivity) and the ‘false-positive fraction’ (1 – specificity).
Reduction in number needed to read/screen The reduction in the number of retrieved records when afilter is applied, expressed as a percentage of the number retrieved before its application.
Reference set/standard See Gold standard.
Reference standard spectrum bias The variation in the sensitivity and/or specificity of a diagnostic testwhen applied to an unrepresentative sample.
Relative recall gold standard Included studies from a specific review (or other source) that can be usedas a test set to test the sensitivity of a search filter.
Relevant records Records from the reference set/gold standard.
Results set The collection of records retrieved by hand-searching or by a search strategy, filter orcombination of both (depending on the context). The results set contains relevant and irrelevant records.
Retrieval gain The absolute or percentage variation in the number of records retrieved by thesearch filter.
Search filter A combination of search terms to identify specific topics (such as breast cancer) or studydesigns (such as randomised controlled trials) or other issues such as age, gender or geographical area.
Search filter performance A measure of how well a search filter performs in identifying relevant studiesor not retrieving irrelevant studies. Measures include accuracy, number needed to read, precision,sensitivity and specificity.
Search question The research topic that the search strategy is seeking to capture. The search questionmay be more or less specific than the search strategy depending on how much of the search question canbe captured by search terms and how many concepts are included in the search strategy.
Sensitivity The number of relevant records in the reference set/gold standard that are retrieved by asearch filter as a proportion of the total number of records in the reference set/gold standard. Oftenexpressed as a percentage and also known as recall.
Single technology appraisal A critical appraisal of a manufacturer’s assessment of the clinicaleffectiveness and cost-effectiveness of a single technology. Undertaken by independent academic centrescommissioned by the National Institute for Health and Care Excellence.
GLOSSARY
NIHR Journals Library www.journalslibrary.nihr.ac.uk
xviii
Specificity The number of irrelevant records correctly not retrieved as a proportion of all irrelevant recordsin the resource. Often expressed as a percentage.
Study design The methods used within a research study, for example a randomised controlledstudy design.
Subject search A search strategy containing terms designed to capture a specific topic such as anintervention, a disease, an outcome or a population group. Subject searches may combineseveral concepts.
Validation (external) See External standard.
Validation (internal) See Internal standard.
DOI: 10.3310/hta21690 HEALTH TECHNOLOGY ASSESSMENT 2017 VOL. 21 NO. 69
© Queen’s Printer and Controller of HMSO 2017. This work was produced by Lefebvre et al. under the terms of a commissioning contract issued by the Secretary of State forHealth. This issue may be freely reproduced for the purposes of private research and study and extracts (or indeed, the full report) may be included in professional journalsprovided that suitable acknowledgement is made and the reproduction is not associated with any form of advertising. Applications for commercial reproduction should beaddressed to: NIHR Journals Library, National Institute for Health Research, Evaluation, Trials and Studies Coordinating Centre, Alpha House, University of Southampton SciencePark, Southampton SO16 7NS, UK.
xix

List of abbreviations
AHRQ Agency for Healthcare Researchand Quality
ASSIA Applied Social Sciences Indexand Abstracts
AUC area under the curve
CADTH Canadian Agency for Drugs andTechnologies in Health
CD-ROM compact disc, read-only memory
CDSR Cochrane Database ofSystematic Reviews
CENTRAL Cochrane Central Register ofControlled Trials
CINAHL Cumulative Index to Nursing andAllied Health Literature
CRD Centre for Reviews andDissemination
DARE Database of Abstracts of Reviewsof Effects
DOR diagnostic odds ratio
DTA diagnostic test accuracy
EAHIL European Association for HealthInformation and Libraries
EBLIP Evidence Based Library andInformation Practice
ERG Evidence Review Group
EUnetHTA European network for HealthTechnology Assessment
FDA Food and Drug Administration
HEED Health Economic EvaluationsDatabase
HTA Health Technology Assessment
HTAi Health Technology Assessmentinternational
InterTASC Inter Technology AppraisalSupport Collaboration
IRMG Information Retrieval MethodsGroup
ISSG Information Specialists’ Sub-Group
LILACS Latin American and CaribbeanHealth Sciences Literature
LR likelihood ratio
LR+ positive likelihood ratio
LR– negative likelihood ratio
MeSH medical subject heading
NCC National Collaborating Centre
NHS EED NHS Economic Evaluation Database
NICE National Institute for Health andCare Excellence
NLM National Library of Medicine
NNR number needed to read
NPV negative predictive value
PPV positive predictive value
QUADAS Quality Assessment of DiagnosticAccuracy Studies
RCT randomised controlled trial
ROC receiver operating characteristic
RR relative recall
RSS really simple syndication
SIGN Scottish Intercollegiate GuidelinesNetwork
SROC summary receiver operatingcharacteristic
STARD Standards for the Reporting ofDiagnostic Accuracy Studies
TSC Trials Search Co-ordinator
YHEC York Health Economics Consortium
DOI: 10.3310/hta21690 HEALTH TECHNOLOGY ASSESSMENT 2017 VOL. 21 NO. 69
© Queen’s Printer and Controller of HMSO 2017. This work was produced by Lefebvre et al. under the terms of a commissioning contract issued by the Secretary of State forHealth. This issue may be freely reproduced for the purposes of private research and study and extracts (or indeed, the full report) may be included in professional journalsprovided that suitable acknowledgement is made and the reproduction is not associated with any form of advertising. Applications for commercial reproduction should beaddressed to: NIHR Journals Library, National Institute for Health Research, Evaluation, Trials and Studies Coordinating Centre, Alpha House, University of Southampton SciencePark, Southampton SO16 7NS, UK.
xxi

Plain English summary
E ffective identification of research studies is essential for developing clinical guidance and health policy,conducting health research and supporting health-care decision-making. Methodological search filters
(combinations of search terms to identify studies of a specific design) can help to find relevant studieswhen searching literature databases. This project investigated issues around the creation and performanceof methodological search filters and how best to assist searchers in choosing search filters. We conductedfive literature reviews in 2010/11, interviewed searchers about their use of search filters and circulated aquestionnaire to a larger group of searchers. The findings were used to suggest how best to collect andreport data on search filter performance.
We found that studies that created search filters reported sensitivity (the proportion of relevant articlesretrieved), precision (the proportion of articles retrieved that are relevant) and specificity (the proportion ofnon-relevant articles not retrieved) most often. However, it was sometimes difficult to judge the quality ofthe study design because the authors did not provide an adequate description of how they had conductedtheir study. In addition, several studies did not use the best methods available; for example, they tested thefilter on database records that had been used to create the filter. More detailed reporting and a clearerpresentation of the results with graphs would make it easier to judge the reliability of the results.
The majority of searchers who were interviewed and who responded to the questionnaire mentionedusing filters most often to identify randomised controlled trials and systematic reviews. The InformationSpecialists’ Sub-Group (ISSG) Search Filters Resource was the most used source to find a filter, and overhalf of respondents relied on the filters available in databases they were searching. Searchers mentionedthat having critical assessments of studies and user-friendly presentations of performance data availablewould help in choosing filters. Having filters available in a central location was also considered valuable.
DOI: 10.3310/hta21690 HEALTH TECHNOLOGY ASSESSMENT 2017 VOL. 21 NO. 69
© Queen’s Printer and Controller of HMSO 2017. This work was produced by Lefebvre et al. under the terms of a commissioning contract issued by the Secretary of State forHealth. This issue may be freely reproduced for the purposes of private research and study and extracts (or indeed, the full report) may be included in professional journalsprovided that suitable acknowledgement is made and the reproduction is not associated with any form of advertising. Applications for commercial reproduction should beaddressed to: NIHR Journals Library, National Institute for Health Research, Evaluation, Trials and Studies Coordinating Centre, Alpha House, University of Southampton SciencePark, Southampton SO16 7NS, UK.
xxiii

Scientific summary
Background
The effective retrieval of relevant evidence is essential in the development of clinical guidance or healthpolicy, the conduct of health research and the support of health-care decision-making. Whether thepurpose of the evidence retrieval is to find a representative set of results to inform the development ofan economic model or to find extensive evidence on the clinical effectiveness or cost-effectiveness of ahealth-care intervention, retrieval methods need to be appropriate, efficient within time and cost restraints,consistent and reliable.
One tool that can be useful for effective retrieval is the search filter. Search filters are a combination ofsearch terms designed to retrieve records about a specific concept, which may be a study design, such asrandomised controlled trials (RCTs), outcomes such as adverse events, a population such as women or adisease or condition such as cardiovascular disease. A methodological search filter is designed to capturethe records of studies that have used a specific study design. Effective search filters may seek to maximisesensitivity (the proportion of relevant records retrieved), maximise precision (the proportion of retrievedrecords that are relevant) or optimise retrieval using a balance between maximising sensitivity andachieving adequate precision. Search filters can offer a standard approach to study retrieval and releasesearcher time to focus on developing other sections of the search strategy such as the disease concept.
Objectives
This project was funded to inform National Institute for Health and Care Excellence (NICE) methodsdevelopment, but has wider application to efficient literature searching in support of evidence-basedmedicine in general. Its aim was to investigate the methods used to assess the performance ofmethodological search filters and explore what searchers require of search filters and what informationsearchers require to help them choose a search filter. We also explored systems and approaches forproviding better access to relevant and useful performance data on methodological search filters, includingdeveloping suggested approaches to search filter performance measurement.
Our objectives were to identify and summarise:
l which performance measures for search filters are reportedl other performance measures reported in diagnostic test accuracy (DTA) studies and reviewsl different ways to present filter/test performance data to assist users in choosing which filters or tests
to usel evidence on how searchers choose search filters and what information they would like to receive to
inform their choicesl evidence on how clinicians choose diagnostic tests.
The project website is at https://sites.google.com/a/york.ac.uk/search-filter-performance/ (accessed22 August 2017).
Methods
We conducted a series of five literature reviews in 2010/11 into various aspects of search filter reportingand use and analogous activity in the field of DTA studies. The reviews informed the development of an
DOI: 10.3310/hta21690 HEALTH TECHNOLOGY ASSESSMENT 2017 VOL. 21 NO. 69
© Queen’s Printer and Controller of HMSO 2017. This work was produced by Lefebvre et al. under the terms of a commissioning contract issued by the Secretary of State forHealth. This issue may be freely reproduced for the purposes of private research and study and extracts (or indeed, the full report) may be included in professional journalsprovided that suitable acknowledgement is made and the reproduction is not associated with any form of advertising. Applications for commercial reproduction should beaddressed to: NIHR Journals Library, National Institute for Health Research, Evaluation, Trials and Studies Coordinating Centre, Alpha House, University of Southampton SciencePark, Southampton SO16 7NS, UK.
xxv
interview schedule, to learn how search filters are used by information professionals working for NICE andorganisations affiliated to NICE, and also the development of a web-based questionnaire aimed at a wideraudience of search experts in the area of search filters.
The literature reviews explored:
l what performance measures are reported for single studies of search filters and how are theypresented (review A)
l what performance measures are reported when comparing a range of search filters and how theperformance measures are synthesised (review B)
l what performance measures are reported in DTA studies and DTA reviews (review C)l how searchers choose search filters (review D)l how filter/test performance data are presented to assist users in choosing which filters or tests to use
(reviews A, B and C)l how clinicians or organisations choose diagnostic tests (review E).
Information professionals working for NICE, the NICE Collaborating Centres and NICE Evidence ReviewGroups were interviewed using a semistructured interview protocol.
A web-based questionnaire survey was developed to obtain information on searchers’ knowledge ofand use of search filters. The questions were based on findings from the reviews and the interviews.The questionnaire was advertised to seven e-mail discussion lists aimed at health librarians.
The reviews, interviews and questionnaire informed the development of suggested approaches togathering and reporting search filter performance.
We acknowledge that there has been a regrettable delay between carrying out the project, including thesearches, and the publication of this report, because of serious illness of the principal investigator.
Results
Review AIn total, 23 studies were identified in review A. In single studies reporting search filters:
l internal gold or reference standards were mostly derived by hand-searching journalsl filter validation was mostly carried out using internal validationl sensitivity, precision and specificity were the most commonly used performance measuresl performance measures were most often presented in tables.
Review BIn total, 18 studies were identified in review B. In filter comparison studies:
l sensitivity, precision and specificity were the most commonly reported performance measuresl the highest sensitivity, highest precision and optimal/balanced filter strategies were most
frequently reportedl methods reporting was limited in papers reporting the development of new search filters and
comparison with existing filtersl the most frequently used method for reporting the results of filter performance comparisons was in
tables, although graphs might be more useful.
SCIENTIFIC SUMMARY
NIHR Journals Library www.journalslibrary.nihr.ac.uk
xxvi
Review CIn total, 47 studies were identified in review C. DTA studies and DTA reviews provided evidence that:
l studies should be carried out on a sample of patients who are representative of the target populationand should use an appropriate reference standard
l sensitivity and specificity were the most commonly reported outcomes and are subject to spectrum biasl predictive values are influenced by disease prevalencel receiver operating characteristic curves present sensitivity and specificity pairs at different
test thresholdsl the area under the curve gives an overall value of DTAl health technology assessment organisations recommend that DTA studies should present 2 × 2
contingency tables, sensitivity and specificity pairs and likelihood ratio pairsl several types of graphical presentation can be used to display DTA data but these had not been used
extensively in the DTA literaturel poor-quality methods and reporting hinder the inferences that can be drawn from DTA studies.
Review DNo studies were identified that reported how searchers chose search filters.
Review ESeven studies were identified that reported on factors that influenced clinicians’ choice between diagnostictests. They provided limited evidence suggesting that test performance is the main factor that informedchoices. As a substantial proportion of clinicians have an inaccurate understanding of test performanceparameters and how they should be applied, it might be the case that choices were being based on falseassumptions.
InterviewsA total of 12 interviews were conducted, capturing the views of 16 information professionals.
The interviews revealed the wide range of searching tasks that are undertaken in the NICE context andthe various points at which search filters can be used. The use of search filters seemed to be linkedpredominantly to reducing the numbers of retrieved records, introducing focus and assisting with searchesthat are focused on a single study type.
The Cochrane RCT and McMaster Hedges team filters were cited most often. Various methods wereused to identify filters, with the most frequently mentioned resource being the Information Specialists’Sub-Group (ISSG) Search Filters Resource [Glanville J, Lefebvre C, Wright K. ISSG Search Filter Resource. York:The InterTASC Information Specialists’ Sub-Group; 2008 (updated 2017). URL: https://sites.google.com/a/york.ac.uk/issg-search-filters-resource/home (accessed 22 August 2017).].
Interviewees’ practices when using, adapting and reporting search filters were not uniform, possiblyindicating an absence of accepted published formal guidance. Interviewees found it difficult to keepinformed about search filter developments. When choosing filters, interviewees tried to make judgementsaround the relative sensitivity, specificity and precision of search filters but were conscious of factors such astime constraints and knowledge gaps that impeded this. Some interviewees requested more guidance onthe best filters to use or chose filters based on the authorship of the filter. Some desire for standardisationor guidance within the NICE family was also expressed.
QuestionnaireIn total, 90 individuals responded to the survey. About three-quarters of respondents said that they usedsearch filters for extensive searches to inform guidelines or systematic reviews, with just over half sayingthat they would use them for rapid searches to answer brief questions and a similar number saying thatthey would use them for scoping searches to estimate the size of the literature on a topic.
DOI: 10.3310/hta21690 HEALTH TECHNOLOGY ASSESSMENT 2017 VOL. 21 NO. 69
© Queen’s Printer and Controller of HMSO 2017. This work was produced by Lefebvre et al. under the terms of a commissioning contract issued by the Secretary of State forHealth. This issue may be freely reproduced for the purposes of private research and study and extracts (or indeed, the full report) may be included in professional journalsprovided that suitable acknowledgement is made and the reproduction is not associated with any form of advertising. Applications for commercial reproduction should beaddressed to: NIHR Journals Library, National Institute for Health Research, Evaluation, Trials and Studies Coordinating Centre, Alpha House, University of Southampton SciencePark, Southampton SO16 7NS, UK.
xxvii
The McMaster Hedges team was the most frequently reported source used to identify study design filters.Currently, respondents most frequently used search filters for RCTs and systematic reviews. The mostfrequently cited filters for a specific topic were the Cochrane RCT filters.
Just over half of the respondents reported that they generally use the in-built filters in database interfacesrather than typing in another filter. Once they had found a search filter, just over half of respondents reportedthat they sometimes amend the filter. Nearly all of those respondents who amended search filters testedthe effect of the amendment by either comparing the results with and without the filter amendment ordetermining whether or not known relevant papers had been identified. Three-quarters of respondentsdocumented their amendments when they wrote up the searches, using diverse approaches.
Information on search filter performance measures such as validation, sensitivity and precision, a descriptionof the filter and the results of their own testing had helped respondents to choose between filters.
The main factors that would make choosing a filter easier were the availability of a critical appraisal orevaluation and more information on the effectiveness of the filter, what it does or what it provides, what itexcludes, its limitations, when it was last updated, its advantages and disadvantages, its sensitivity andprecision and what testing has been completed. Respondents wanted to be confident in the author/developer and the availability of the filter in a central location was important.
Conclusions
Studies of search filter development and comparison studies reached similar conclusions. Internal gold orreference standards were mostly derived by hand-searching journals. Internal rather than more rigorousexternal validation was more usually undertaken. The most commonly reported performance measureswere sensitivity/recall, precision and specificity.
Filter performance comparison studies most commonly reported the highest sensitivity, highest precisionand optimal/balanced filter strategies. These measures were generally presented in tables, with little use ofother graphical options that might be more useful methods of presentation. Limited details about methodswere reported and guidance in this area could be improved.
Guidance available on conducting and analysing the results of DTA studies is applicable to several aspectsof search filter research. The identification of a representative sample of records, of sufficient size andusing a standardised approach, will assist in producing robust and generalisable results. The greater use ofgraphical presentation might facilitate the dissemination and interpretation of results.
We did not identify any published research on how searchers choose search filters and were unable todraw conclusions. Furthermore, limited evidence was identified in the review of clinicians’ decision-making,resulting in few insights into how clinicians or organisations choose diagnostic tests, which might havebeen transferable to the challenges of choosing search filters. Diagnostic test performance was the mostfrequent factor mentioned and is the main factor that is readily applicable to search filter choice. The othermessage that we identified is that providing additional explanatory information when reporting searchfilter performance might be necessary to ensure that searchers make choices based on an accurateunderstanding of test performance parameters.
The interviews and the questionnaire survey indicated that search filters are not appropriate for all searchingtasks but are used mainly for reducing large results sets and assisting with searches that are focused on asingle study type. Searchers use several key resources to identify search filters but may find choosing betweenfilters challenging. Choosing filters might be aided by making information about filters less technical, offeringratings and providing more details about filter validation strategies and filter provenance.
SCIENTIFIC SUMMARY
NIHR Journals Library www.journalslibrary.nihr.ac.uk
xxviii

The responses to the questionnaire provide many messages for search filter designers. Filter performancemeasures need to be signposted more clearly and succinctly to help searchers make better use of theavailable filters. Filter and website designers should present less information and ensure that performanceinformation can be clearly identified. The provenance of filters is clearly important to some searchers butthere are no established parameters to measure this confidence. Clear authorship labelling and theprovision of detailed information to show the robustness of the development methods would not onlyassist users of filters but also help filter designers to achieve recognition for their filters. The convenience ofhaving filters from well-established producers available within database interfaces encourages their use. Aconvenient filter may, however, not always be the best one for the task. Searchers need to know how tochoose between a range of filters and need information on whether filters have been validated and how.
Recommendations for information retrieval practice
We recommend that:
l studies reporting search filter design and/or comparisons of search filter performance should explicitlyreport the methods and results to help searchers identify the most appropriate filter
l one or more gold or reference standards should be used for testing filter performancel relative recall (RR) and hand-searching should be considered for the development of gold or reference
standard(s) for filter development but caution should be exercised regarding the robustness of theoriginal RR search
l search filters should be validated on gold or reference standards that are different from those fromwhich they were developed (i.e. external validation)
l the size of the gold or reference standard(s) should be clearly stated and a sample size calculationpresented to justify the size of the standard(s)
l when a filter has been translated for use in a different database and/or interface from that in which itwas developed, this should be specifically reported
l results should be presented systematically, identifying clearly the best-performing filter for specificpurposes (sensitive strategy, specific strategy, balanced strategy)
l tables of performance results should have a consistent format and order to enable information to beeasily extracted
l additional reporting methods should be considered, including graphical optionsl approaches such as those provided in this report should be considered regarding the use, adaptation
and reporting of search filters.
Recommendations for research
Further research might include:
l the development and testing of filters for a wider range of study designs and other topicsl the development and testing of translations of filters for different databases and interfacesl the development and testing of filters that are independent of indexing languagel a review of the performance measures reported and the methods of presentation used in
methodological filter performance comparisons for study designs not included in this reviewl studies to explore alternative methods of displaying performance results from comparisons of multiple
methodological search filtersl explorations of methods for the numerical synthesis of the results of several filter performance comparisons.
DOI: 10.3310/hta21690 HEALTH TECHNOLOGY ASSESSMENT 2017 VOL. 21 NO. 69
© Queen’s Printer and Controller of HMSO 2017. This work was produced by Lefebvre et al. under the terms of a commissioning contract issued by the Secretary of State forHealth. This issue may be freely reproduced for the purposes of private research and study and extracts (or indeed, the full report) may be included in professional journalsprovided that suitable acknowledgement is made and the reproduction is not associated with any form of advertising. Applications for commercial reproduction should beaddressed to: NIHR Journals Library, National Institute for Health Research, Evaluation, Trials and Studies Coordinating Centre, Alpha House, University of Southampton SciencePark, Southampton SO16 7NS, UK.
xxix

Funding
The National Institute for Health Research (NIHR) Health Technology Assessment programme and MedicalResearch Council–NIHR Methodology Research Programme (grant number G0901496).
SCIENTIFIC SUMMARY
NIHR Journals Library www.journalslibrary.nihr.ac.uk
xxx
Chapter 1 Introduction
Background
The effective retrieval of relevant evidence is essential in the development of clinical guidance or healthpolicy, the conduct of health research and the support of health-care decision-making. Whether thepurpose of the evidence retrieval is to find a representative set of results to inform the development ofan economic model or to find extensive evidence on the clinical effectiveness or cost-effectiveness of ahealth-care intervention, retrieval methods need to be appropriate, efficient within the time and costrestraints that exist, consistent and reliable.
One tool that can be useful for effective retrieval is the search filter. Search filters are a combination ofsearch terms designed to retrieve records about a specific concept, which may be a study design, such asrandomised controlled trials (RCTs), outcomes such as adverse events, a population such as women or adisease or condition such as cardiovascular disease. A methodological search filter is designed to capturethe records of studies that have used a specific study design. Effective search filters may seek to maximisesensitivity (the proportion of relevant records retrieved), maximise precision (the proportion of retrievedrecords that are relevant) or optimise retrieval using a balance between maximising sensitivity andachieving adequate precision. Search filters can offer a standard approach to study retrieval and releasesearcher time to focus on developing other sections of the search strategy such as the disease concept.
Aims and objectives
This project was funded to inform National Institute for Health and Care Excellence (NICE) methodsdevelopment by investigating the methods used to develop and assess the performance of methodologicalsearch filters, exploring what searchers require of search filters during the life of various types of projectsand exploring what information searchers value to help them choose a search filter. We also exploredsystems and approaches for providing better access to relevant and useful performance data onmethodological search filters, including developing suggested approaches to reliable and efficient searchfilter performance measurement.
Our objectives were to:
l identify and summarise the performance measures for search filters (single studies or performancereviews of a range of filters) that are reported
l identify and summarise other performance measures reported in diagnostic test accuracy (DTA) studiesand DTA reviews
l identify and summarise ways to present filter/test performance data (e.g. graphs or tables) to assistusers (searchers or clinicians) in choosing which filters or tests to use
l identify and summarise evidence on how searchers choose search filtersl identify and summarise evidence on how clinicians choose diagnostic testsl understand better how searchers choose search filters and what information they would like to receive
to inform their choicesl explore different ways to present search filter performance data for searchers and provide suggested
approaches to presenting the performance data that searchers requirel develop suggested approaches for reliable and efficient measurement for search filter performance.
We acknowledge that there has been a regrettable delay between carrying out the project, includingthe searches, and the publication of this report, because of serious illness of the principal investigator.The searches were carried out in 2010/11.
DOI: 10.3310/hta21690 HEALTH TECHNOLOGY ASSESSMENT 2017 VOL. 21 NO. 69
© Queen’s Printer and Controller of HMSO 2017. This work was produced by Lefebvre et al. under the terms of a commissioning contract issued by the Secretary of State forHealth. This issue may be freely reproduced for the purposes of private research and study and extracts (or indeed, the full report) may be included in professional journalsprovided that suitable acknowledgement is made and the reproduction is not associated with any form of advertising. Applications for commercial reproduction should beaddressed to: NIHR Journals Library, National Institute for Health Research, Evaluation, Trials and Studies Coordinating Centre, Alpha House, University of Southampton SciencePark, Southampton SO16 7NS, UK.
1

Chapter 2 Methods
The research plan had several stages. It began with a series of five literature reviews into various aspectsof search filter reporting and use. The reviews informed the development of an interview schedule
and a web-based questionnaire (see Appendix 1). The reviews, interviews and questionnaire informed thedevelopment of suggested approaches to gathering and reporting search filter performance and a testwebsite, on which we invite further feedback [see https://sites.google.com/a/york.ac.uk/search-filter-performance/ (accessed 22 August 2017)].
Reviews
The research was grounded in a series of five reviews. We conducted two reviews on how the performanceof methodological search filters has been measured, in single studies and also in studies comparing theperformance of search filters. In a third review we sought to find inspiration and synergies in the DTAliterature by reviewing the literature on diagnostic test reporting and included an exploration of the potentialrelevance of performance measures used in DTA studies. Search filters are analogous to diagnostic tests,being designed to distinguish relevant records from irrelevant records, and the performance of search filtersand diagnostic tests is reported using similar measures, such as sensitivity and specificity. A fourth reviewsought reports on how searchers make choices about filters based on the information presented to themand a fifth review sought to identify any information on how clinicians make choices about diagnostic teststo gain insights into how searchers do or might in the future be encouraged to make choices aboutsearch filters.
The reviews were informed by literature searches conducted in databases in a number of disciplinesincluding information science. Further information about the searches can be found within each of thereviews described later in this chapter and the search strategies are all included in the relevant appendices.The sources searched were:
l The Cochrane Libraryl EMBASEl European network for Health Technology Assessment (EUnetHTA)l health technology assessment (HTA) organisation websitesl Health Technology Assessment international (HTAi) Vortall Inter Technology Appraisal Support Collaboration (InterTASC) Information Specialists’ Sub-Group (ISSG)
Search Filters Resourcel Library and Information Science Abstracts (LISA)l MEDLINEl PsycINFO.
The reviews were conducted to reflect the project objectives, which were to determine:
l what performance measures are reported for single studies of search filters and how they arepresented (review A)
l what performance measures are reported when comparing a range of search filters and how theperformance measures are synthesised (review B)
l what performance measures are reported in DTA studies and DTA reviews (review C)l how searchers choose search filters (review D)l how filter/test performance data are presented (e.g. text, graphs, tables, graphics) to assist users
(searchers or clinicians) in choosing which filters or tests to use (reviews A, B and C)l how clinicians or organisations choose diagnostic tests (review E).
DOI: 10.3310/hta21690 HEALTH TECHNOLOGY ASSESSMENT 2017 VOL. 21 NO. 69
© Queen’s Printer and Controller of HMSO 2017. This work was produced by Lefebvre et al. under the terms of a commissioning contract issued by the Secretary of State forHealth. This issue may be freely reproduced for the purposes of private research and study and extracts (or indeed, the full report) may be included in professional journalsprovided that suitable acknowledgement is made and the reproduction is not associated with any form of advertising. Applications for commercial reproduction should beaddressed to: NIHR Journals Library, National Institute for Health Research, Evaluation, Trials and Studies Coordinating Centre, Alpha House, University of Southampton SciencePark, Southampton SO16 7NS, UK.
3
Interviews and questionnaire
The objective of the reviews was to identify information about:
l performance measures in usel the presentation of performance measuresl how searchers and clinicians choose search filters or diagnostic tests.
The next stage, consisting of two phases (semistructured interviews and a questionnaire survey), was toascertain which search filter performance measures were deemed to be the most important by searchers forinformed decision-making. We sought to gain information on how search filter performance informationcould most usefully be presented to assist decisions and whether or not there is scope for performanceinformation to be obtained as part of routine project work.
Phase 1: semistructured interviewsAs this project was funded to inform NICE methods development, the involvement of NICE staff wascentral to it. We contacted NICE information specialists and project managers and offered them theopportunity to participate in the project. Each interview, which was recorded, lasted for no more than45 minutes. Once the interview time and date were agreed, confirmation details (date, time, length ofinterview and interviewer details), along with a topic guide and assurance of anonymity, were sent toeach interviewee. After each interview, an e-mail containing a summary of the key points raised during theinterview was sent to each interviewee, who was offered the opportunity to check the notes for accuracyand add any additional points that may have occurred to him or her after the interview had ended.
Phase 2: questionnaire surveyInformation from the literature reviews and the interviews was used to inform the design and content of aweb-based questionnaire. NICE information specialists and project managers were invited to complete thequestionnaire but it was also used to collect the views of the wider (national and international) systematicreview, HTA and guidelines information community. This information community is well networked andwas reached via e-mail lists, as described in Chapter 4 (see Questionnaire methods).
Presentation of filter information
Information from the reviews and interview and questionnaire responses was used to develop suggestedapproaches to measuring search filter performance.
We also developed a series of pilot formats for presenting search filter performance information. With theapproval of the authors, some of the data from the Cochrane methodology review of the performance ofsearch filters in identifying DTA studies,1,2 which at the time of the project was not yet published, was usedto populate the pilot formats.
Performance tests, reports and performance resource
We developed a prototype web resource (using content management systems available at the University ofYork) to present performance data and to facilitate feedback and comments from NICE staff and othersfrom within the evidence synthesis information community. Without prejudging users’ requirements or theresults of the research, the performance resource presented a matrix of information showing how wellpublished search filters perform for specific study designs in different clinical specialties and with differentuser preferences for measures such as sensitivity or precision.
METHODS
NIHR Journals Library www.journalslibrary.nihr.ac.uk
4
Based on the suggested approaches, we developed performance tests and performance reports, whichwere uploaded onto the project website. We also developed detailed procedures with the intention ofassisting researchers to conduct and report future performance tests. We considered that if we couldascertain that users valued information in a specific format then we could try to develop suggestedapproaches to promoting these methods. The intention was to develop user-friendly tools for the futureand to explore options to make these tools widely available.
Performance measures for methodological search filters (review A)
IntroductionAlthough there are a large number of search filters in existence, many have been developed pragmaticallyand have not undergone validation. Even for those search filters that have been validated, few have beenvalidated beyond the data in the original publication. This method is described as internal validation and isa less rigorous approach than external validation, in which a filter is tested using a different gold standardfrom the one used to develop the filter. External validation provides an independent assessment of filterperformance and gives a better indication of how a filter is likely to perform in the real world.
Selection of a search filter will depend on the particular searching task and on the performance of thesearch filter. Thus, it is important to report performance measures for search filters. There are a few toolsavailable that can be used to assess or appraise search filters and these can help in the selection of searchfilters for specific tasks.3–5
The aim of this review was to look at the performance measures that are reported for search filters (singlestudies) and how they are presented. Single studies were defined as those in which a new search filter(or series of filters) was developed, or a search filter was revised, and in which performance measures ofthe search filter(s) were also reported.
The objectives of the review were to:
l identify and summarise the methods used to develop and validate search filtersl identify and summarise the performance measures used in single studies of search filtersl describe how these performance measures are presented.
Methods
Identification of studiesStudies were identified from the ISSG Search Filters Resource.6 The ISSG Search Filters Resource is acollaborative venture to identify, assess and test search filters designed to retrieve health-care research bystudy design. It includes published filters and ongoing research on filter design, research evaluating theperformance of filters and articles providing a general overview of search filters. At the time of this project,regular searches were being carried out in a number of databases and websites, and tables of contents ofkey journals and conference proceedings were being scanned to populate the site. Researchers working onsearch filter design are encouraged to submit details of their work. The 2010 update search carried out bythe UK Cochrane Centre to support the ISSG Search Filters Resource website was also scanned to identifyany relevant studies that were not included on the website at that time.
We acknowledge that there has been a regrettable delay between carrying out the project, including thesearches, and the publication of this report, because of serious illness of the principal investigator. Thesearches were carried out in 2010/11.
DOI: 10.3310/hta21690 HEALTH TECHNOLOGY ASSESSMENT 2017 VOL. 21 NO. 69
© Queen’s Printer and Controller of HMSO 2017. This work was produced by Lefebvre et al. under the terms of a commissioning contract issued by the Secretary of State forHealth. This issue may be freely reproduced for the purposes of private research and study and extracts (or indeed, the full report) may be included in professional journalsprovided that suitable acknowledgement is made and the reproduction is not associated with any form of advertising. Applications for commercial reproduction should beaddressed to: NIHR Journals Library, National Institute for Health Research, Evaluation, Trials and Studies Coordinating Centre, Alpha House, University of Southampton SciencePark, Southampton SO16 7NS, UK.
5
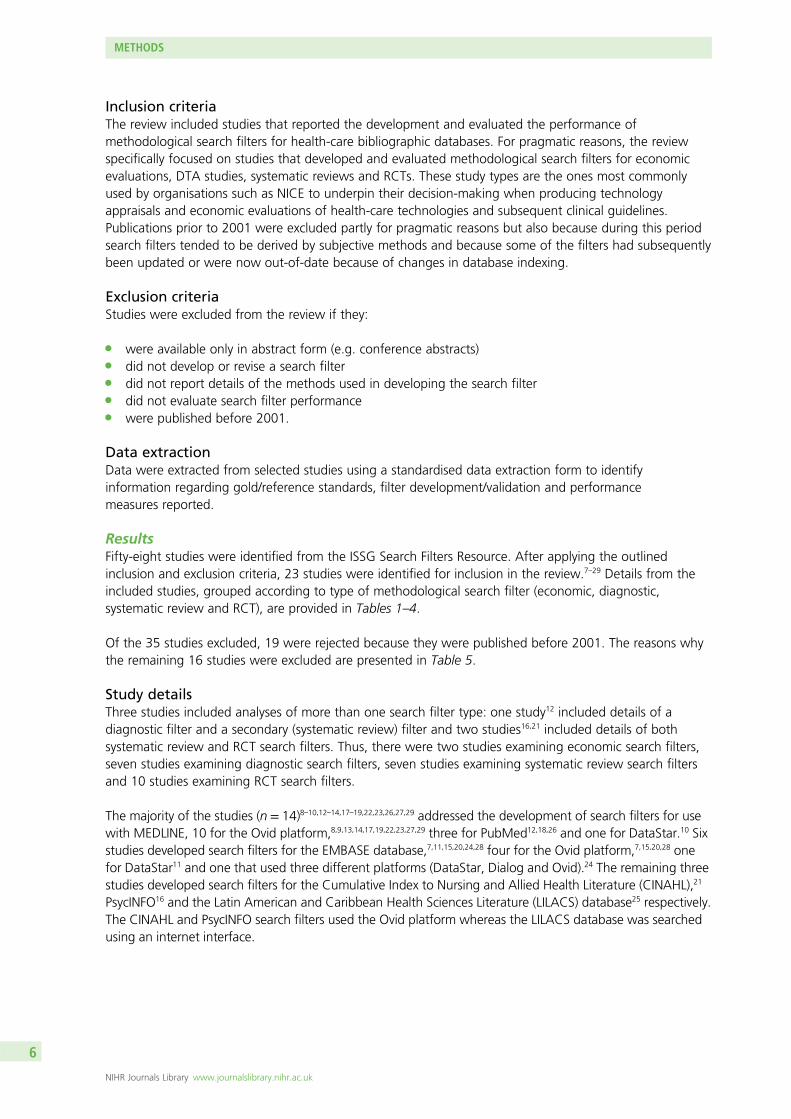
Inclusion criteriaThe review included studies that reported the development and evaluated the performance ofmethodological search filters for health-care bibliographic databases. For pragmatic reasons, the reviewspecifically focused on studies that developed and evaluated methodological search filters for economicevaluations, DTA studies, systematic reviews and RCTs. These study types are the ones most commonlyused by organisations such as NICE to underpin their decision-making when producing technologyappraisals and economic evaluations of health-care technologies and subsequent clinical guidelines.Publications prior to 2001 were excluded partly for pragmatic reasons but also because during this periodsearch filters tended to be derived by subjective methods and because some of the filters had subsequentlybeen updated or were now out-of-date because of changes in database indexing.
Exclusion criteriaStudies were excluded from the review if they:
l were available only in abstract form (e.g. conference abstracts)l did not develop or revise a search filterl did not report details of the methods used in developing the search filterl did not evaluate search filter performancel were published before 2001.
Data extractionData were extracted from selected studies using a standardised data extraction form to identifyinformation regarding gold/reference standards, filter development/validation and performancemeasures reported.
ResultsFifty-eight studies were identified from the ISSG Search Filters Resource. After applying the outlinedinclusion and exclusion criteria, 23 studies were identified for inclusion in the review.7–29 Details from theincluded studies, grouped according to type of methodological search filter (economic, diagnostic,systematic review and RCT), are provided in Tables 1–4.
Of the 35 studies excluded, 19 were rejected because they were published before 2001. The reasons whythe remaining 16 studies were excluded are presented in Table 5.
Study detailsThree studies included analyses of more than one search filter type: one study12 included details of adiagnostic filter and a secondary (systematic review) filter and two studies16,21 included details of bothsystematic review and RCT search filters. Thus, there were two studies examining economic search filters,seven studies examining diagnostic search filters, seven studies examining systematic review search filtersand 10 studies examining RCT search filters.
The majority of the studies (n = 14)8–10,12–14,17–19,22,23,26,27,29 addressed the development of search filters for usewith MEDLINE, 10 for the Ovid platform,8,9,13,14,17,19,22,23,27,29 three for PubMed12,18,26 and one for DataStar.10 Sixstudies developed search filters for the EMBASE database,7,11,15,20,24,28 four for the Ovid platform,7,15,20,28 onefor DataStar11 and one that used three different platforms (DataStar, Dialog and Ovid).24 The remaining threestudies developed search filters for the Cumulative Index to Nursing and Allied Health Literature (CINAHL),21
PsycINFO16 and the Latin American and Caribbean Health Sciences Literature (LILACS) database25 respectively.The CINAHL and PsycINFO search filters used the Ovid platform whereas the LILACS database was searchedusing an internet interface.
METHODS
NIHR Journals Library www.journalslibrary.nihr.ac.uk
6
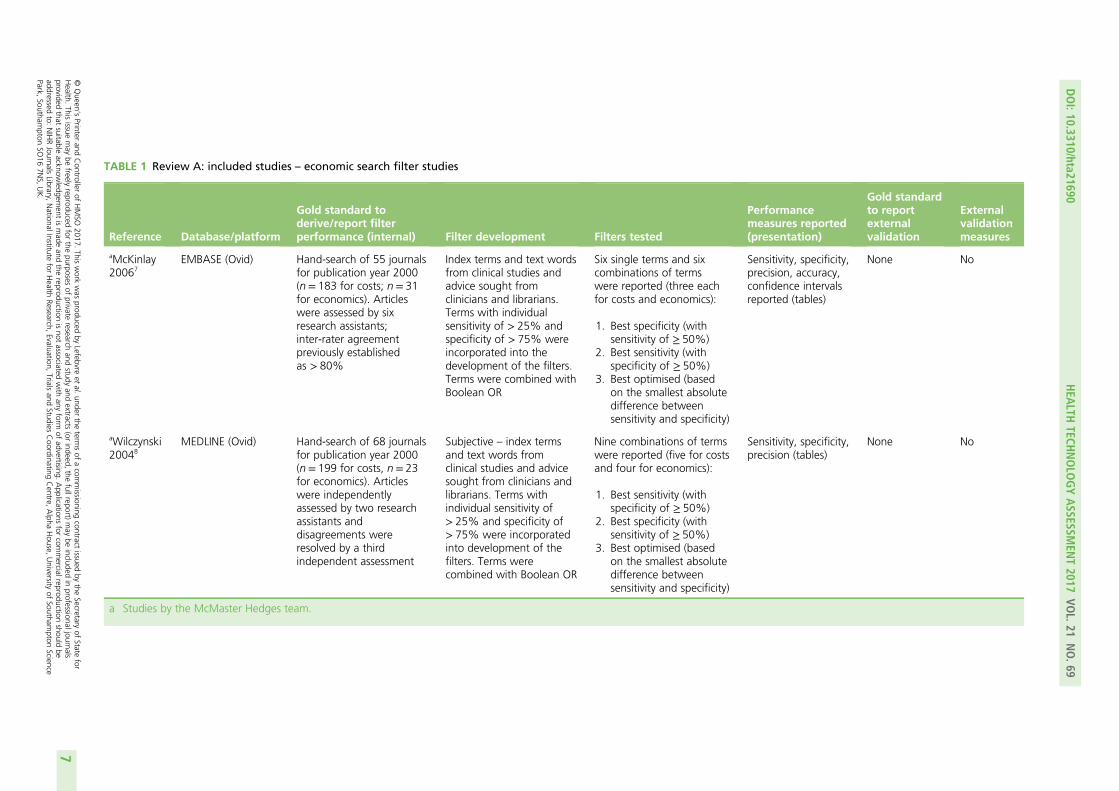
TABLE 1 Review A: included studies – economic search filter studies
Reference Database/platform
Gold standard toderive/report filterperformance (internal) Filter development Filters tested
Performancemeasures reported(presentation)
Gold standardto reportexternalvalidation
Externalvalidationmeasures
aMcKinlay20067
EMBASE (Ovid) Hand-search of 55 journalsfor publication year 2000(n= 183 for costs; n= 31for economics). Articleswere assessed by sixresearch assistants;inter-rater agreementpreviously establishedas > 80%
Index terms and text wordsfrom clinical studies andadvice sought fromclinicians and librarians.Terms with individualsensitivity of > 25% andspecificity of > 75% wereincorporated into thedevelopment of the filters.Terms were combined withBoolean OR
Six single terms and sixcombinations of termswere reported (three eachfor costs and economics):
1. Best specificity (withsensitivity of ≥ 50%)
2. Best sensitivity (withspecificity of ≥ 50%)
3. Best optimised (basedon the smallest absolutedifference betweensensitivity and specificity)
Sensitivity, specificity,precision, accuracy,confidence intervalsreported (tables)
None No
aWilczynski20048
MEDLINE (Ovid) Hand-search of 68 journalsfor publication year 2000(n= 199 for costs, n= 23for economics). Articleswere independentlyassessed by two researchassistants anddisagreements wereresolved by a thirdindependent assessment
Subjective – index termsand text words fromclinical studies and advicesought from clinicians andlibrarians. Terms withindividual sensitivity of> 25% and specificity of> 75% were incorporatedinto development of thefilters. Terms werecombined with Boolean OR
Nine combinations of termswere reported (five for costsand four for economics):
1. Best sensitivity (withspecificity of ≥ 50%)
2. Best specificity (withsensitivity of ≥ 50%)
3. Best optimised (basedon the smallest absolutedifference betweensensitivity and specificity)
Sensitivity, specificity,precision (tables)
None No
a Studies by the McMaster Hedges team.
DOI:10.3310/hta21690
HEA
LTHTECH
NOLO
GYASSESSM
ENT2017
VOL.21
NO.69
©Queen
’sPrinter
andController
ofHMSO
2017.This
work
was
producedby
Lefebvreet
al.under
theterm
sof
acom
missioning
contractissued
bythe
Secretaryof
Statefor
Health.
Thisissue
may
befreely
reproducedfor
thepurposes
ofprivate
researchand
studyand
extracts(or
indeed,the
fullreport)may
beincluded
inprofessionaljournals
providedthat
suitableacknow
ledgement
ismade
andthe
reproductionisnot
associatedwith
anyform
ofadvertising.
Applications
forcom
mercialreproduction
shouldbe
addressedto:
NIHRJournals
Library,NationalInstitute
forHealth
Research,Evaluation,
Trialsand
StudiesCoordinating
Centre,
Alpha
House,
University
ofSoutham
ptonScience
Park,Southam
ptonSO
167N
S,UK.
7
TABLE 2 Review A: included studies – diagnostic search filter studies
Reference Database/platform
Gold standard toderive/report filterperformance (internal) Filter development Filters tested
Performancemeasures reported(presentation)
Gold standardto reportexternalvalidation
Externalvalidationmeasures
Astin 20089 MEDLINE (Ovid) Derivation set: hand-search of six journals forpublication years 1985,1995 and 1988(n= 333). Articles wereassessed independentlyby three researchers anddiscrepancies wereresolved by discussion
Candidate terms frompreviously publishedstrategies and MeSH andtext words from derivationset MEDLINE records.Terms were addedsequentially beginning withterms with the highest PPVand at each step addingthe term that retrieved thelargest proportion ofadditional derivation setrecords. The steps wererepeated until the highestsensitivity was achieved
One filter tested.Separate filter forretrieving imagingstudies developed
Sensitivity, specificity,PPV, confidenceintervals reported(tables)
Validation set:hand-search of sixjournals for thepublication year2000 (n= 186)
Sensitivity,specificity, PPV,confidenceintervals reported(tables)
Bachmann200210
MEDLINE (DataStar) Hand-search of fourjournals for publicationyear 1989 (n= 83).Articles were assessedindependently by tworesearchers
Word frequency analysis ofall words in MEDLINErecords, excluding thosenot semantically associatedwith diagnosis. The 20terms with the highestindividual sensitivity ×precision score plus MeSHexp “sensitivity andspecificity” were combinedwith OR in a stepwisefashion into a series ofstrategies and wereperformance tested
Two filters tested Sensitivity, precision,NNR, confidenceintervals reported(tables)
Hand-search ofsame four journalsfor publicationyear 1994 (n= 53)and four differentjournals forpublication year1999 (n= 61)
Sensitivity,precision, NNR,confidenceintervals reported(for 1994 data)(tables)
METH
ODS
NIHRJournals
Librarywww.journalslibrary.nihr.ac.uk
8
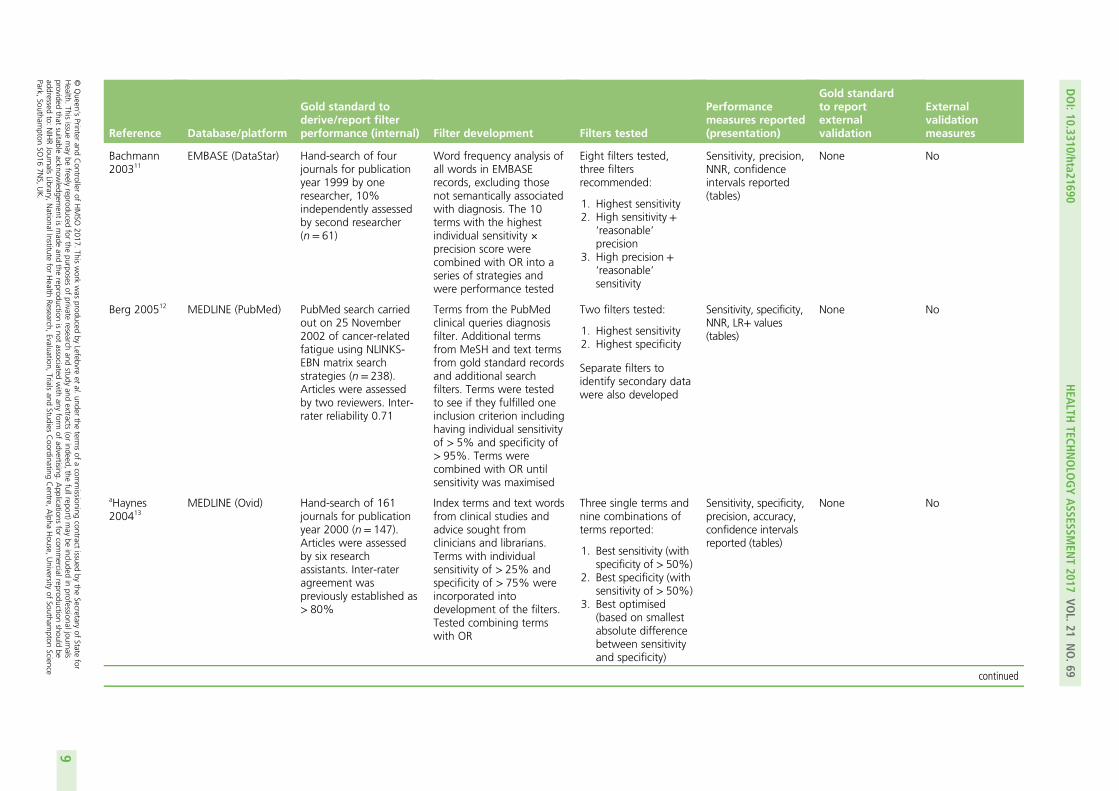
Reference Database/platform
Gold standard toderive/report filterperformance (internal) Filter development Filters tested
Performancemeasures reported(presentation)
Gold standardto reportexternalvalidation
Externalvalidationmeasures
Bachmann200311
EMBASE (DataStar) Hand-search of fourjournals for publicationyear 1999 by oneresearcher, 10%independently assessedby second researcher(n= 61)
Word frequency analysis ofall words in EMBASErecords, excluding thosenot semantically associatedwith diagnosis. The 10terms with the highestindividual sensitivity ×precision score werecombined with OR into aseries of strategies andwere performance tested
Eight filters tested,three filtersrecommended:
1. Highest sensitivity2. High sensitivity +
‘reasonable’precision
3. High precision +‘reasonable’sensitivity
Sensitivity, precision,NNR, confidenceintervals reported(tables)
None No
Berg 200512 MEDLINE (PubMed) PubMed search carriedout on 25 November2002 of cancer-relatedfatigue using NLINKS-EBN matrix searchstrategies (n= 238).Articles were assessedby two reviewers. Inter-rater reliability 0.71
Terms from the PubMedclinical queries diagnosisfilter. Additional termsfrom MeSH and text termsfrom gold standard recordsand additional searchfilters. Terms were testedto see if they fulfilled oneinclusion criterion includinghaving individual sensitivityof > 5% and specificity of> 95%. Terms werecombined with OR untilsensitivity was maximised
Two filters tested:
1. Highest sensitivity2. Highest specificity
Separate filters toidentify secondary datawere also developed
Sensitivity, specificity,NNR, LR+ values(tables)
None No
aHaynes200413
MEDLINE (Ovid) Hand-search of 161journals for publicationyear 2000 (n= 147).Articles were assessedby six researchassistants. Inter-rateragreement waspreviously established as> 80%
Index terms and text wordsfrom clinical studies andadvice sought fromclinicians and librarians.Terms with individualsensitivity of > 25% andspecificity of > 75% wereincorporated intodevelopment of the filters.Tested combining termswith OR
Three single terms andnine combinations ofterms reported:
1. Best sensitivity (withspecificity of > 50%)
2. Best specificity (withsensitivity of > 50%)
3. Best optimised(based on smallestabsolute differencebetween sensitivityand specificity)
Sensitivity, specificity,precision, accuracy,confidence intervalsreported (tables)
None No
continued
DOI:10.3310/hta21690
HEA
LTHTECH
NOLO
GYASSESSM
ENT2017
VOL.21
NO.69
©Queen
’sPrinter
andController
ofHMSO
2017.This
work
was
producedby
Lefebvreet
al.under
theterm
sof
acom
missioning
contractissued
bythe
Secretaryof
Statefor
Health.
Thisissue
may
befreely
reproducedfor
thepurposes
ofprivate
researchand
studyand
extracts(or
indeed,the
fullreport)may
beincluded
inprofessionaljournals
providedthat
suitableacknow
ledgement
ismade
andthe
reproductionisnot
associatedwith
anyform
ofadvertising.
Applications
forcom
mercialreproduction
shouldbe
addressedto:
NIHRJournals
Library,NationalInstitute
forHealth
Research,Evaluation,
Trialsand
StudiesCoordinating
Centre,
Alpha
House,
University
ofSoutham
ptonScience
Park,Southam
ptonSO
167N
S,UK.
9
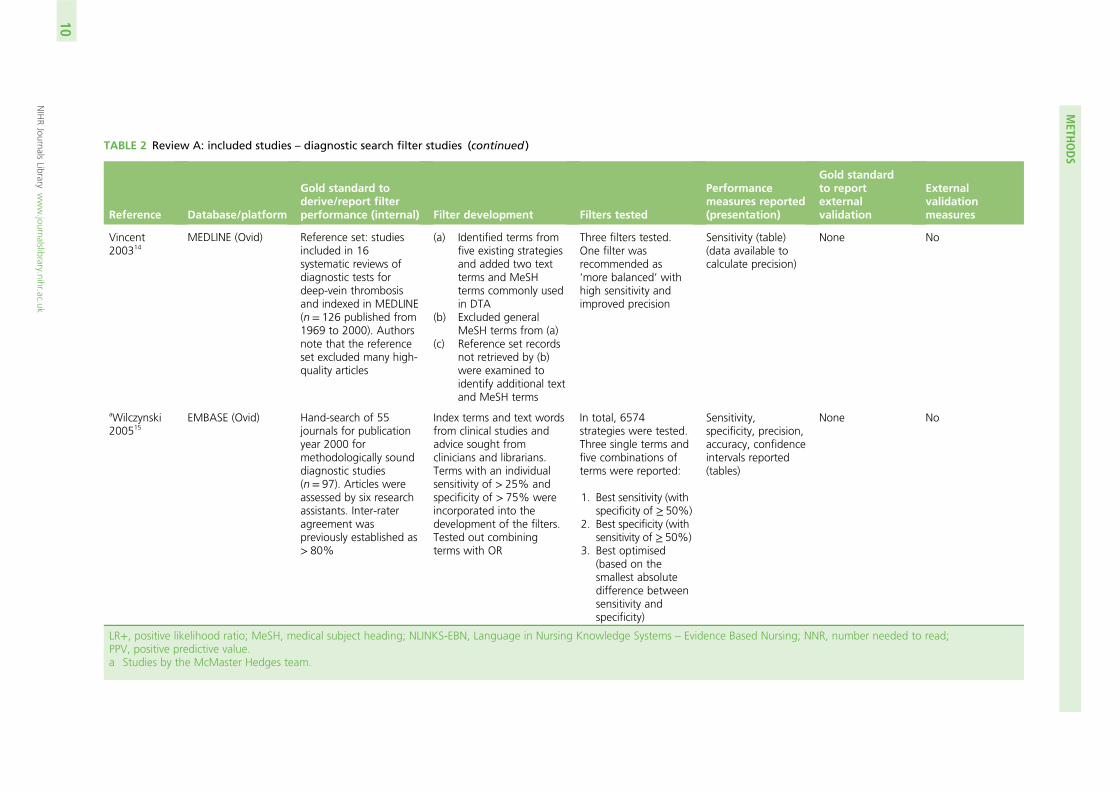
TABLE 2 Review A: included studies – diagnostic search filter studies (continued )
Reference Database/platform
Gold standard toderive/report filterperformance (internal) Filter development Filters tested
Performancemeasures reported(presentation)
Gold standardto reportexternalvalidation
Externalvalidationmeasures
Vincent200314
MEDLINE (Ovid) Reference set: studiesincluded in 16systematic reviews ofdiagnostic tests fordeep-vein thrombosisand indexed in MEDLINE(n= 126 published from1969 to 2000). Authorsnote that the referenceset excluded many high-quality articles
(a) Identified terms fromfive existing strategiesand added two textterms and MeSHterms commonly usedin DTA
(b) Excluded generalMeSH terms from (a)
(c) Reference set recordsnot retrieved by (b)were examined toidentify additional textand MeSH terms
Three filters tested.One filter wasrecommended as‘more balanced’ withhigh sensitivity andimproved precision
Sensitivity (table)(data available tocalculate precision)
None No
aWilczynski200515
EMBASE (Ovid) Hand-search of 55journals for publicationyear 2000 formethodologically sounddiagnostic studies(n= 97). Articles wereassessed by six researchassistants. Inter-rateragreement waspreviously established as> 80%
Index terms and text wordsfrom clinical studies andadvice sought fromclinicians and librarians.Terms with an individualsensitivity of > 25% andspecificity of > 75% wereincorporated into thedevelopment of the filters.Tested out combiningterms with OR
In total, 6574strategies were tested.Three single terms andfive combinations ofterms were reported:
1. Best sensitivity (withspecificity of ≥ 50%)
2. Best specificity (withsensitivity of ≥ 50%)
3. Best optimised(based on thesmallest absolutedifference betweensensitivity andspecificity)
Sensitivity,specificity, precision,accuracy, confidenceintervals reported(tables)
None No
LR+, positive likelihood ratio; MeSH, medical subject heading; NLINKS-EBN, Language in Nursing Knowledge Systems – Evidence Based Nursing; NNR, number needed to read;PPV, positive predictive value.a Studies by the McMaster Hedges team.
METH
ODS
NIHRJournals
Librarywww.journalslibrary.nihr.ac.uk
10
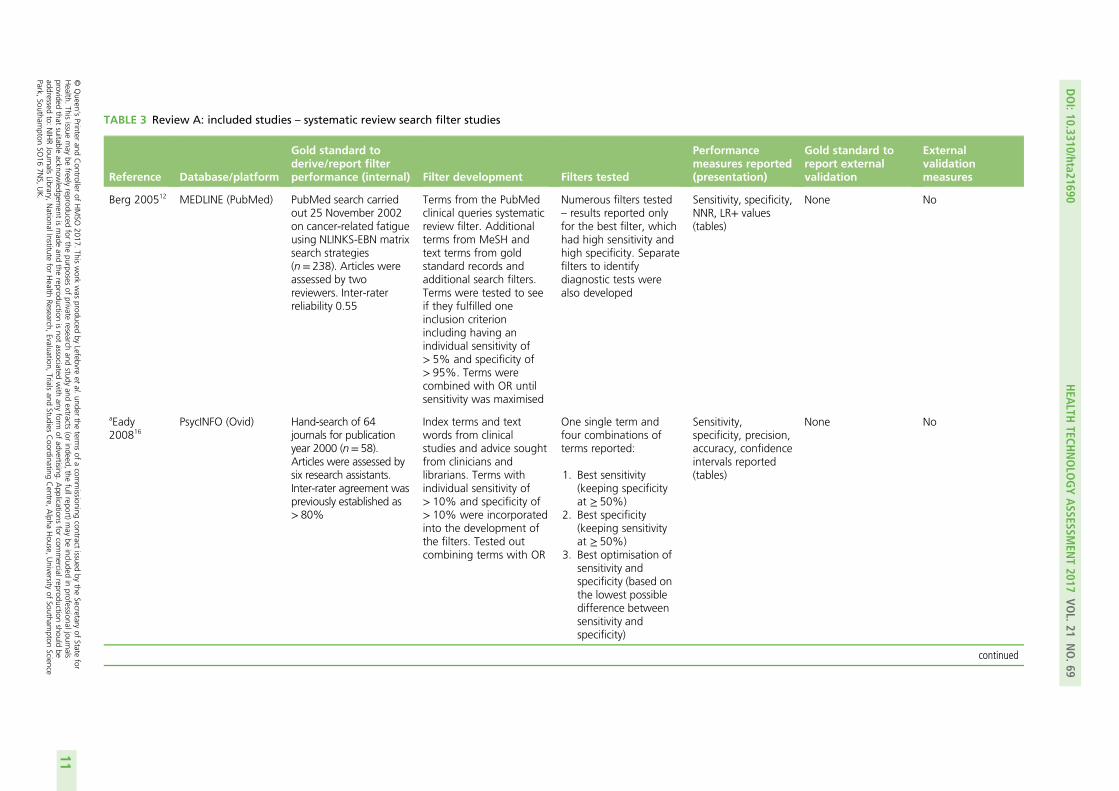
TABLE 3 Review A: included studies – systematic review search filter studies
Reference Database/platform
Gold standard toderive/report filterperformance (internal) Filter development Filters tested
Performancemeasures reported(presentation)
Gold standard toreport externalvalidation
Externalvalidationmeasures
Berg 200512 MEDLINE (PubMed) PubMed search carriedout 25 November 2002on cancer-related fatigueusing NLINKS-EBN matrixsearch strategies(n= 238). Articles wereassessed by tworeviewers. Inter-raterreliability 0.55
Terms from the PubMedclinical queries systematicreview filter. Additionalterms from MeSH andtext terms from goldstandard records andadditional search filters.Terms were tested to seeif they fulfilled oneinclusion criterionincluding having anindividual sensitivity of> 5% and specificity of> 95%. Terms werecombined with OR untilsensitivity was maximised
Numerous filters tested– results reported onlyfor the best filter, whichhad high sensitivity andhigh specificity. Separatefilters to identifydiagnostic tests werealso developed
Sensitivity, specificity,NNR, LR+ values(tables)
None No
aEady200816
PsycINFO (Ovid) Hand-search of 64journals for publicationyear 2000 (n= 58).Articles were assessed bysix research assistants.Inter-rater agreement waspreviously established as> 80%
Index terms and textwords from clinicalstudies and advice soughtfrom clinicians andlibrarians. Terms withindividual sensitivity of> 10% and specificity of> 10% were incorporatedinto the development ofthe filters. Tested outcombining terms with OR
One single term andfour combinations ofterms reported:
1. Best sensitivity(keeping specificityat ≥ 50%)
2. Best specificity(keeping sensitivityat ≥ 50%)
3. Best optimisation ofsensitivity andspecificity (based onthe lowest possibledifference betweensensitivity andspecificity)
Sensitivity,specificity, precision,accuracy, confidenceintervals reported(tables)
None No
continued
DOI:10.3310/hta21690
HEA
LTHTECH
NOLO
GYASSESSM
ENT2017
VOL.21
NO.69
©Queen
’sPrinter
andController
ofHMSO
2017.This
work
was
producedby
Lefebvreet
al.under
theterm
sof
acom
missioning
contractissued
bythe
Secretaryof
Statefor
Health.
Thisissue
may
befreely
reproducedfor
thepurposes
ofprivate
researchand
studyand
extracts(or
indeed,the
fullreport)may
beincluded
inprofessionaljournals
providedthat
suitableacknow
ledgement
ismade
andthe
reproductionisnot
associatedwith
anyform
ofadvertising.
Applications
forcom
mercialreproduction
shouldbe
addressedto:
NIHRJournals
Library,NationalInstitute
forHealth
Research,Evaluation,
Trialsand
StudiesCoordinating
Centre,
Alpha
House,
University
ofSoutham
ptonScience
Park,Southam
ptonSO
167N
S,UK.
11
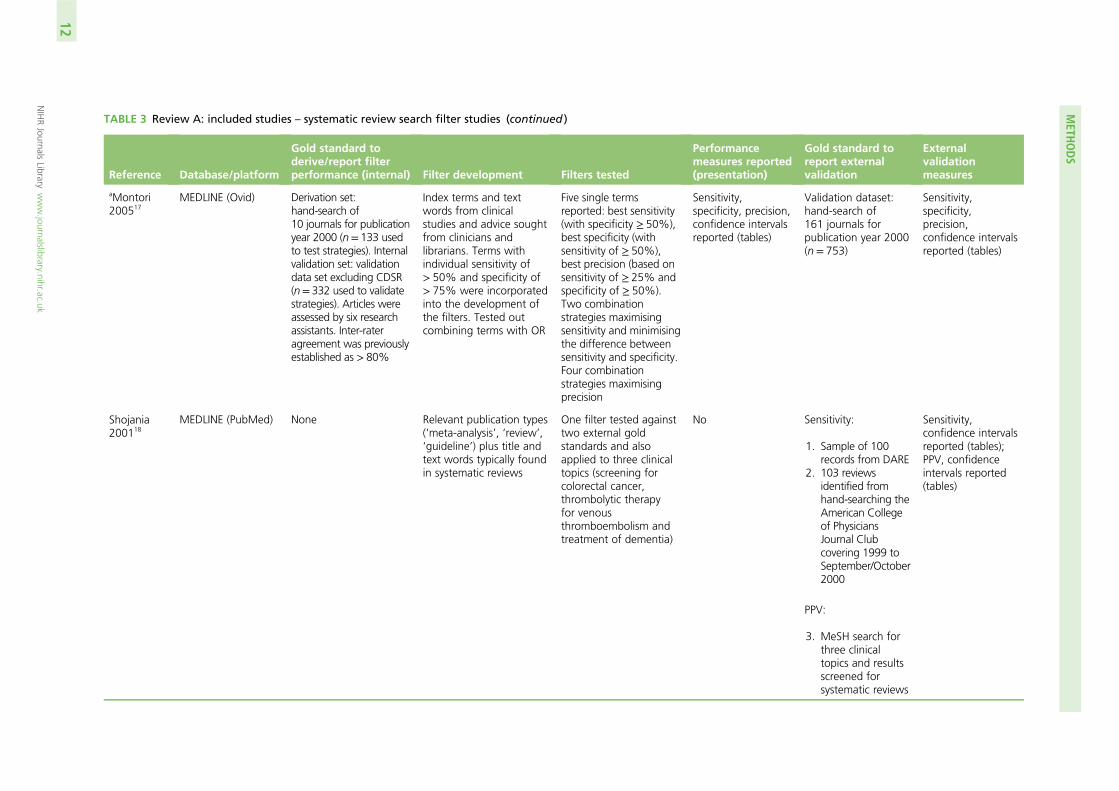
TABLE 3 Review A: included studies – systematic review search filter studies (continued )
Reference Database/platform
Gold standard toderive/report filterperformance (internal) Filter development Filters tested
Performancemeasures reported(presentation)
Gold standard toreport externalvalidation
Externalvalidationmeasures
aMontori200517
MEDLINE (Ovid) Derivation set:hand-search of10 journals for publicationyear 2000 (n= 133 usedto test strategies). Internalvalidation set: validationdata set excluding CDSR(n= 332 used to validatestrategies). Articles wereassessed by six researchassistants. Inter-rateragreement was previouslyestablished as > 80%
Index terms and textwords from clinicalstudies and advice soughtfrom clinicians andlibrarians. Terms withindividual sensitivity of> 50% and specificity of> 75% were incorporatedinto the development ofthe filters. Tested outcombining terms with OR
Five single termsreported: best sensitivity(with specificity ≥ 50%),best specificity (withsensitivity of ≥ 50%),best precision (based onsensitivity of ≥ 25% andspecificity of ≥ 50%).Two combinationstrategies maximisingsensitivity and minimisingthe difference betweensensitivity and specificity.Four combinationstrategies maximisingprecision
Sensitivity,specificity, precision,confidence intervalsreported (tables)
Validation dataset:hand-search of161 journals forpublication year 2000(n= 753)
Sensitivity,specificity,precision,confidence intervalsreported (tables)
Shojania200118
MEDLINE (PubMed) None Relevant publication types(‘meta-analysis’, ‘review’,‘guideline’) plus title andtext words typically foundin systematic reviews
One filter tested againsttwo external goldstandards and alsoapplied to three clinicaltopics (screening forcolorectal cancer,thrombolytic therapyfor venousthromboembolism andtreatment of dementia)
No Sensitivity:
1. Sample of 100records from DARE
2. 103 reviewsidentified fromhand-searching theAmerican Collegeof PhysiciansJournal Clubcovering 1999 toSeptember/October2000
PPV:
3. MeSH search forthree clinicaltopics and resultsscreened forsystematic reviews
Sensitivity,confidence intervalsreported (tables);PPV, confidenceintervals reported(tables)
METH
ODS
NIHRJournals
Librarywww.journalslibrary.nihr.ac.uk
12
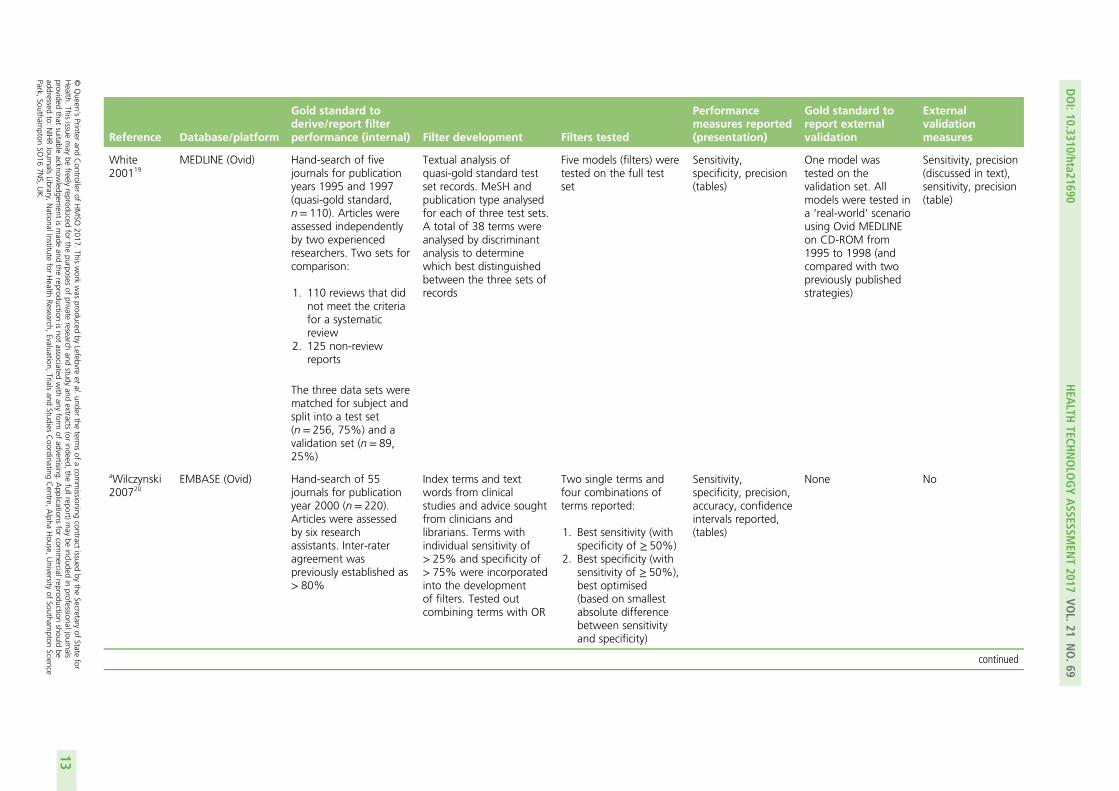
Reference Database/platform
Gold standard toderive/report filterperformance (internal) Filter development Filters tested
Performancemeasures reported(presentation)
Gold standard toreport externalvalidation
Externalvalidationmeasures
White200119
MEDLINE (Ovid) Hand-search of fivejournals for publicationyears 1995 and 1997(quasi-gold standard,n= 110). Articles wereassessed independentlyby two experiencedresearchers. Two sets forcomparison:
1. 110 reviews that didnot meet the criteriafor a systematicreview
2. 125 non-reviewreports
The three data sets werematched for subject andsplit into a test set(n = 256, 75%) and avalidation set (n= 89,25%)
Textual analysis ofquasi-gold standard testset records. MeSH andpublication type analysedfor each of three test sets.A total of 38 terms wereanalysed by discriminantanalysis to determinewhich best distinguishedbetween the three sets ofrecords
Five models (filters) weretested on the full testset
Sensitivity,specificity, precision(tables)
One model wastested on thevalidation set. Allmodels were tested ina ‘real-world’ scenariousing Ovid MEDLINEon CD-ROM from1995 to 1998 (andcompared with twopreviously publishedstrategies)
Sensitivity, precision(discussed in text),sensitivity, precision(table)
aWilczynski200720
EMBASE (Ovid) Hand-search of 55journals for publicationyear 2000 (n = 220).Articles were assessedby six researchassistants. Inter-rateragreement waspreviously established as> 80%
Index terms and textwords from clinicalstudies and advice soughtfrom clinicians andlibrarians. Terms withindividual sensitivity of> 25% and specificity of> 75% were incorporatedinto the developmentof filters. Tested outcombining terms with OR
Two single terms andfour combinations ofterms reported:
1. Best sensitivity (withspecificity of ≥ 50%)
2. Best specificity (withsensitivity of ≥ 50%),best optimised(based on smallestabsolute differencebetween sensitivityand specificity)
Sensitivity,specificity, precision,accuracy, confidenceintervals reported,(tables)
None No
continued
DOI:10.3310/hta21690
HEA
LTHTECH
NOLO
GYASSESSM
ENT2017
VOL.21
NO.69
©Queen
’sPrinter
andController
ofHMSO
2017.This
work
was
producedby
Lefebvreet
al.under
theterm
sof
acom
missioning
contractissued
bythe
Secretaryof
Statefor
Health.
Thisissue
may
befreely
reproducedfor
thepurposes
ofprivate
researchand
studyand
extracts(or
indeed,the
fullreport)may
beincluded
inprofessionaljournals
providedthat
suitableacknow
ledgement
ismade
andthe
reproductionisnot
associatedwith
anyform
ofadvertising.
Applications
forcom
mercialreproduction
shouldbe
addressedto:
NIHRJournals
Library,NationalInstitute
forHealth
Research,Evaluation,
Trialsand
StudiesCoordinating
Centre,
Alpha
House,
University
ofSoutham
ptonScience
Park,Southam
ptonSO
167N
S,UK.
13
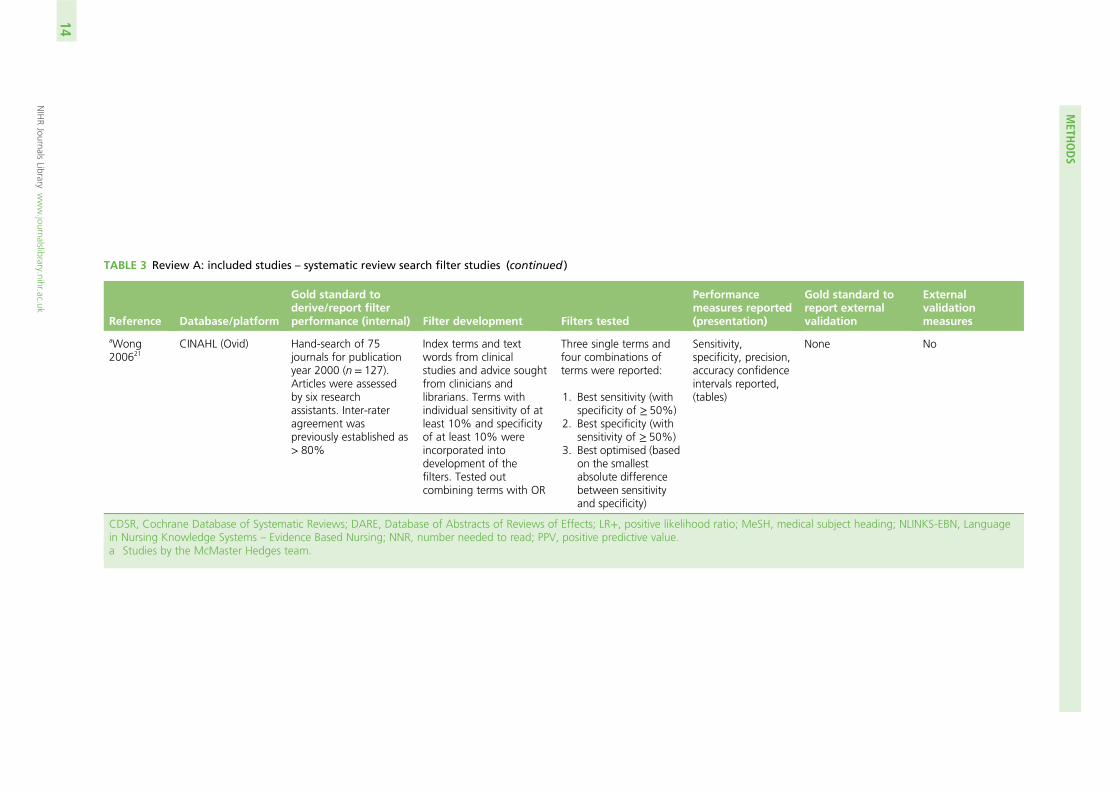
TABLE 3 Review A: included studies – systematic review search filter studies (continued )
Reference Database/platform
Gold standard toderive/report filterperformance (internal) Filter development Filters tested
Performancemeasures reported(presentation)
Gold standard toreport externalvalidation
Externalvalidationmeasures
aWong200621
CINAHL (Ovid) Hand-search of 75journals for publicationyear 2000 (n = 127).Articles were assessedby six researchassistants. Inter-rateragreement waspreviously established as> 80%
Index terms and textwords from clinicalstudies and advice soughtfrom clinicians andlibrarians. Terms withindividual sensitivity of atleast 10% and specificityof at least 10% wereincorporated intodevelopment of thefilters. Tested outcombining terms with OR
Three single terms andfour combinations ofterms were reported:
1. Best sensitivity (withspecificity of ≥ 50%)
2. Best specificity (withsensitivity of ≥ 50%)
3. Best optimised (basedon the smallestabsolute differencebetween sensitivityand specificity)
Sensitivity,specificity, precision,accuracy confidenceintervals reported,(tables)
None No
CDSR, Cochrane Database of Systematic Reviews; DARE, Database of Abstracts of Reviews of Effects; LR+, positive likelihood ratio; MeSH, medical subject heading; NLINKS-EBN, Languagein Nursing Knowledge Systems – Evidence Based Nursing; NNR, number needed to read; PPV, positive predictive value.a Studies by the McMaster Hedges team.
METH
ODS
NIHRJournals
Librarywww.journalslibrary.nihr.ac.uk
14
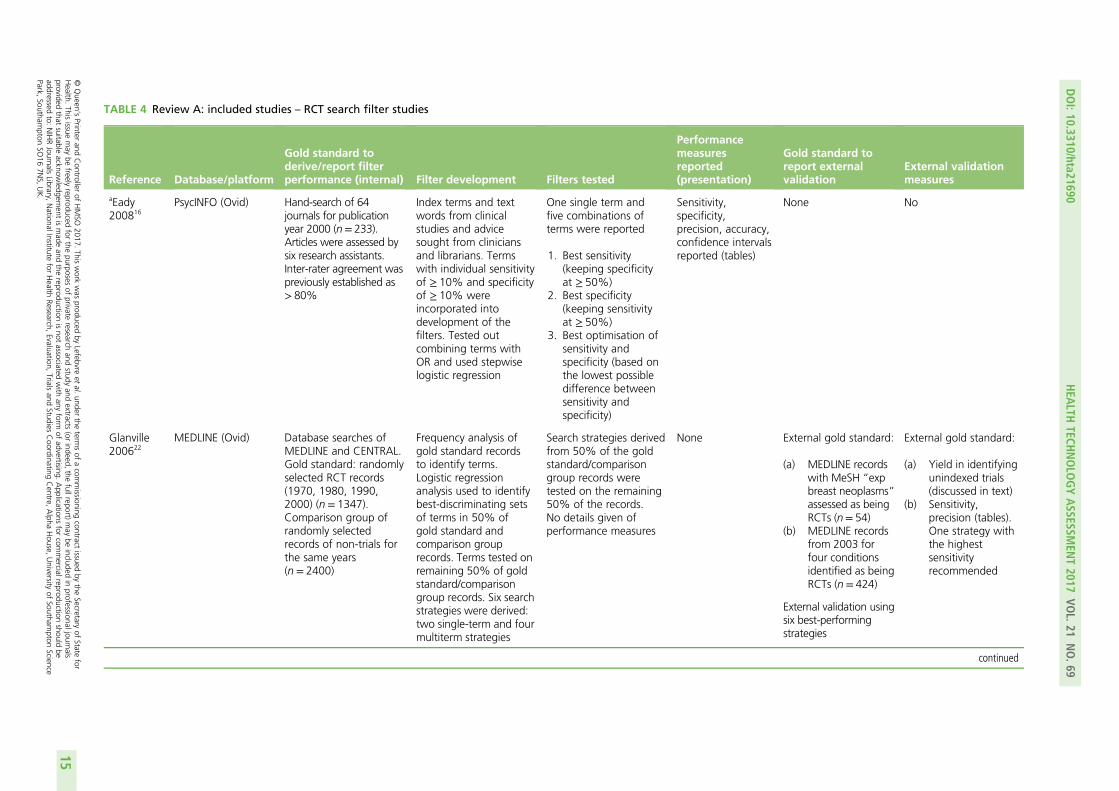
TABLE 4 Review A: included studies – RCT search filter studies
Reference Database/platform
Gold standard toderive/report filterperformance (internal) Filter development Filters tested
Performancemeasuresreported(presentation)
Gold standard toreport externalvalidation
External validationmeasures
aEady200816
PsycINFO (Ovid) Hand-search of 64journals for publicationyear 2000 (n= 233).Articles were assessed bysix research assistants.Inter-rater agreement waspreviously established as> 80%
Index terms and textwords from clinicalstudies and advicesought from cliniciansand librarians. Termswith individual sensitivityof ≥ 10% and specificityof ≥ 10% wereincorporated intodevelopment of thefilters. Tested outcombining terms withOR and used stepwiselogistic regression
One single term andfive combinations ofterms were reported
1. Best sensitivity(keeping specificityat ≥ 50%)
2. Best specificity(keeping sensitivityat ≥ 50%)
3. Best optimisation ofsensitivity andspecificity (based onthe lowest possibledifference betweensensitivity andspecificity)
Sensitivity,specificity,precision, accuracy,confidence intervalsreported (tables)
None No
Glanville200622
MEDLINE (Ovid) Database searches ofMEDLINE and CENTRAL.Gold standard: randomlyselected RCT records(1970, 1980, 1990,2000) (n= 1347).Comparison group ofrandomly selectedrecords of non-trials forthe same years(n = 2400)
Frequency analysis ofgold standard recordsto identify terms.Logistic regressionanalysis used to identifybest-discriminating setsof terms in 50% ofgold standard andcomparison grouprecords. Terms tested onremaining 50% of goldstandard/comparisongroup records. Six searchstrategies were derived:two single-term and fourmultiterm strategies
Search strategies derivedfrom 50% of the goldstandard/comparisongroup records weretested on the remaining50% of the records.No details given ofperformance measures
None External gold standard:
(a) MEDLINE recordswith MeSH “expbreast neoplasms”assessed as beingRCTs (n= 54)
(b) MEDLINE recordsfrom 2003 forfour conditionsidentified as beingRCTs (n= 424)
External validation usingsix best-performingstrategies
External gold standard:
(a) Yield in identifyingunindexed trials(discussed in text)
(b) Sensitivity,precision (tables).One strategy withthe highestsensitivityrecommended
continued
DOI:10.3310/hta21690
HEA
LTHTECH
NOLO
GYASSESSM
ENT2017
VOL.21
NO.69
©Queen
’sPrinter
andController
ofHMSO
2017.This
work
was
producedby
Lefebvreet
al.under
theterm
sof
acom
missioning
contractissued
bythe
Secretaryof
Statefor
Health.
Thisissue
may
befreely
reproducedfor
thepurposes
ofprivate
researchand
studyand
extracts(or
indeed,the
fullreport)may
beincluded
inprofessionaljournals
providedthat
suitableacknow
ledgement
ismade
andthe
reproductionisnot
associatedwith
anyform
ofadvertising.
Applications
forcom
mercialreproduction
shouldbe
addressedto:
NIHRJournals
Library,NationalInstitute
forHealth
Research,Evaluation,
Trialsand
StudiesCoordinating
Centre,
Alpha
House,
University
ofSoutham
ptonScience
Park,Southam
ptonSO
167N
S,UK.
15
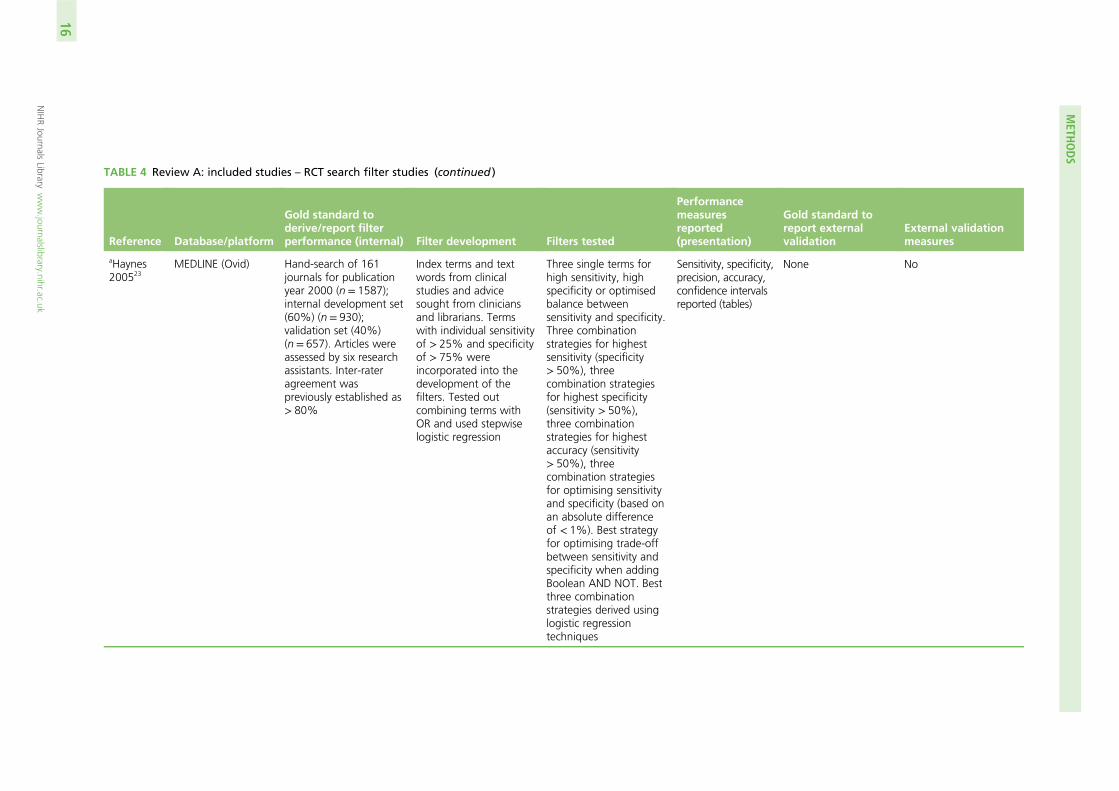
TABLE 4 Review A: included studies – RCT search filter studies (continued )
Reference Database/platform
Gold standard toderive/report filterperformance (internal) Filter development Filters tested
Performancemeasuresreported(presentation)
Gold standard toreport externalvalidation
External validationmeasures
aHaynes200523
MEDLINE (Ovid) Hand-search of 161journals for publicationyear 2000 (n = 1587);internal development set(60%) (n= 930);validation set (40%)(n = 657). Articles wereassessed by six researchassistants. Inter-rateragreement waspreviously established as> 80%
Index terms and textwords from clinicalstudies and advicesought from cliniciansand librarians. Termswith individual sensitivityof > 25% and specificityof > 75% wereincorporated into thedevelopment of thefilters. Tested outcombining terms withOR and used stepwiselogistic regression
Three single terms forhigh sensitivity, highspecificity or optimisedbalance betweensensitivity and specificity.Three combinationstrategies for highestsensitivity (specificity> 50%), threecombination strategiesfor highest specificity(sensitivity > 50%),three combinationstrategies for highestaccuracy (sensitivity> 50%), threecombination strategiesfor optimising sensitivityand specificity (based onan absolute differenceof < 1%). Best strategyfor optimising trade-offbetween sensitivity andspecificity when addingBoolean AND NOT. Bestthree combinationstrategies derived usinglogistic regressiontechniques
Sensitivity, specificity,precision, accuracy,confidence intervalsreported (tables)
None No
METH
ODS
NIHRJournals
Librarywww.journalslibrary.nihr.ac.uk
16
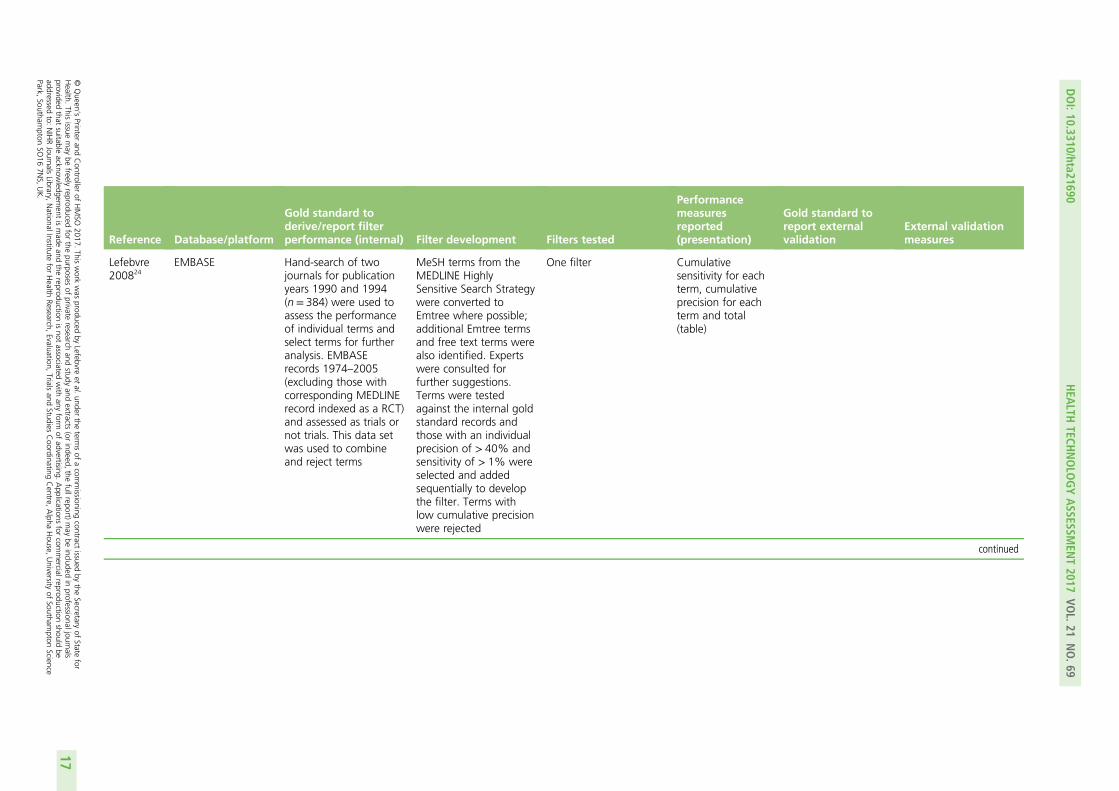
Reference Database/platform
Gold standard toderive/report filterperformance (internal) Filter development Filters tested
Performancemeasuresreported(presentation)
Gold standard toreport externalvalidation
External validationmeasures
Lefebvre200824
EMBASE Hand-search of twojournals for publicationyears 1990 and 1994(n = 384) were used toassess the performanceof individual terms andselect terms for furtheranalysis. EMBASErecords 1974–2005(excluding those withcorresponding MEDLINErecord indexed as a RCT)and assessed as trials ornot trials. This data setwas used to combineand reject terms
MeSH terms from theMEDLINE HighlySensitive Search Strategywere converted toEmtree where possible;additional Emtree termsand free text terms werealso identified. Expertswere consulted forfurther suggestions.Terms were testedagainst the internal goldstandard records andthose with an individualprecision of > 40% andsensitivity of > 1% wereselected and addedsequentially to developthe filter. Terms withlow cumulative precisionwere rejected
One filter Cumulativesensitivity for eachterm, cumulativeprecision for eachterm and total(table)
continued
DOI:10.3310/hta21690
HEA
LTHTECH
NOLO
GYASSESSM
ENT2017
VOL.21
NO.69
©Queen
’sPrinter
andController
ofHMSO
2017.This
work
was
producedby
Lefebvreet
al.under
theterm
sof
acom
missioning
contractissued
bythe
Secretaryof
Statefor
Health.
Thisissue
may
befreely
reproducedfor
thepurposes
ofprivate
researchand
studyand
extracts(or
indeed,the
fullreport)may
beincluded
inprofessionaljournals
providedthat
suitableacknow
ledgement
ismade
andthe
reproductionisnot
associatedwith
anyform
ofadvertising.
Applications
forcom
mercialreproduction
shouldbe
addressedto:
NIHRJournals
Library,NationalInstitute
forHealth
Research,Evaluation,
Trialsand
StudiesCoordinating
Centre,
Alpha
House,
University
ofSoutham
ptonScience
Park,Southam
ptonSO
167N
S,UK.
17
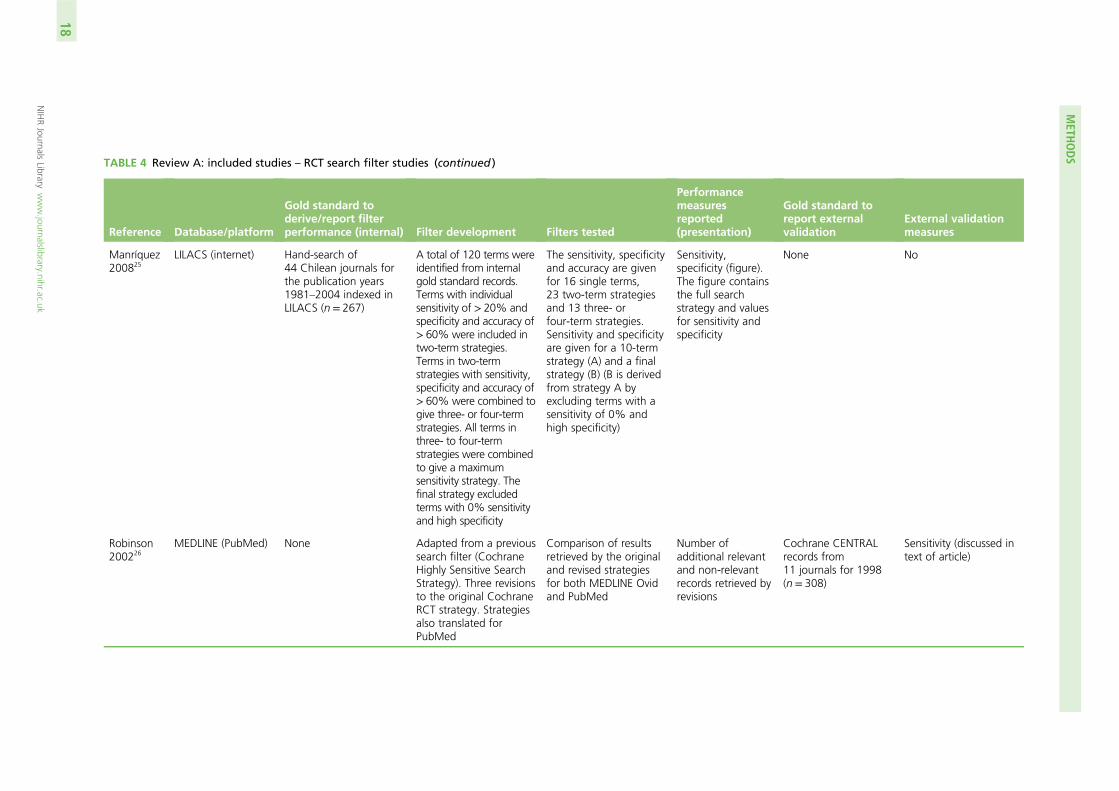
TABLE 4 Review A: included studies – RCT search filter studies (continued )
Reference Database/platform
Gold standard toderive/report filterperformance (internal) Filter development Filters tested
Performancemeasuresreported(presentation)
Gold standard toreport externalvalidation
External validationmeasures
Manríquez200825
LILACS (internet) Hand-search of44 Chilean journals forthe publication years1981–2004 indexed inLILACS (n= 267)
A total of 120 terms wereidentified from internalgold standard records.Terms with individualsensitivity of > 20% andspecificity and accuracy of> 60% were included intwo-term strategies.Terms in two-termstrategies with sensitivity,specificity and accuracy of> 60% were combined togive three- or four-termstrategies. All terms inthree- to four-termstrategies were combinedto give a maximumsensitivity strategy. Thefinal strategy excludedterms with 0% sensitivityand high specificity
The sensitivity, specificityand accuracy are givenfor 16 single terms,23 two-term strategiesand 13 three- orfour-term strategies.Sensitivity and specificityare given for a 10-termstrategy (A) and a finalstrategy (B) (B is derivedfrom strategy A byexcluding terms with asensitivity of 0% andhigh specificity)
Sensitivity,specificity (figure).The figure containsthe full searchstrategy and valuesfor sensitivity andspecificity
None No
Robinson200226
MEDLINE (PubMed) None Adapted from a previoussearch filter (CochraneHighly Sensitive SearchStrategy). Three revisionsto the original CochraneRCT strategy. Strategiesalso translated forPubMed
Comparison of resultsretrieved by the originaland revised strategiesfor both MEDLINE Ovidand PubMed
Number ofadditional relevantand non-relevantrecords retrieved byrevisions
Cochrane CENTRALrecords from11 journals for 1998(n= 308)
Sensitivity (discussed intext of article)
METH
ODS
NIHRJournals
Librarywww.journalslibrary.nihr.ac.uk
18
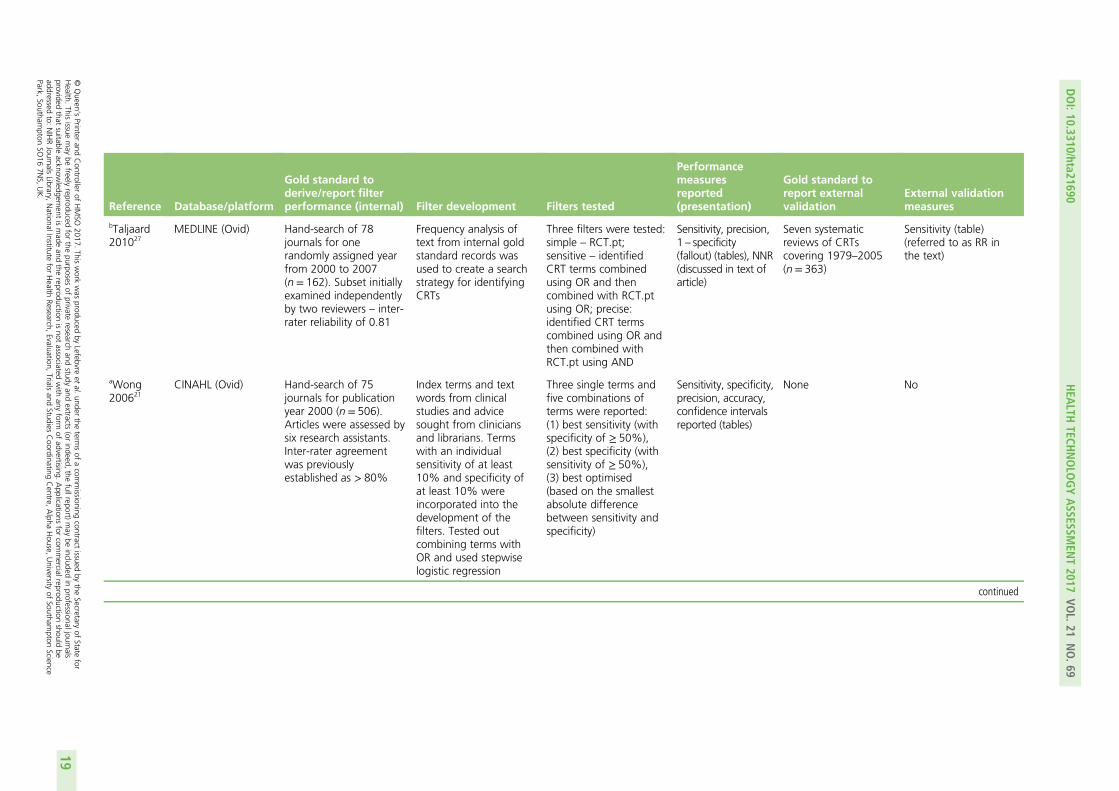
Reference Database/platform
Gold standard toderive/report filterperformance (internal) Filter development Filters tested
Performancemeasuresreported(presentation)
Gold standard toreport externalvalidation
External validationmeasures
bTaljaard201027
MEDLINE (Ovid) Hand-search of 78journals for onerandomly assigned yearfrom 2000 to 2007(n = 162). Subset initiallyexamined independentlyby two reviewers – inter-rater reliability of 0.81
Frequency analysis oftext from internal goldstandard records wasused to create a searchstrategy for identifyingCRTs
Three filters were tested:simple – RCT.pt;sensitive – identifiedCRT terms combinedusing OR and thencombined with RCT.ptusing OR; precise:identified CRT termscombined using OR andthen combined withRCT.pt using AND
Sensitivity, precision,1 – specificity(fallout) (tables), NNR(discussed in text ofarticle)
Seven systematicreviews of CRTscovering 1979–2005(n= 363)
Sensitivity (table)(referred to as RR inthe text)
aWong200621
CINAHL (Ovid) Hand-search of 75journals for publicationyear 2000 (n = 506).Articles were assessed bysix research assistants.Inter-rater agreementwas previouslyestablished as > 80%
Index terms and textwords from clinicalstudies and advicesought from cliniciansand librarians. Termswith an individualsensitivity of at least10% and specificity ofat least 10% wereincorporated into thedevelopment of thefilters. Tested outcombining terms withOR and used stepwiselogistic regression
Three single terms andfive combinations ofterms were reported:(1) best sensitivity (withspecificity of ≥ 50%),(2) best specificity (withsensitivity of ≥ 50%),(3) best optimised(based on the smallestabsolute differencebetween sensitivity andspecificity)
Sensitivity, specificity,precision, accuracy,confidence intervalsreported (tables)
None No
continued
DOI:10.3310/hta21690
HEA
LTHTECH
NOLO
GYASSESSM
ENT2017
VOL.21
NO.69
©Queen
’sPrinter
andController
ofHMSO
2017.This
work
was
producedby
Lefebvreet
al.under
theterm
sof
acom
missioning
contractissued
bythe
Secretaryof
Statefor
Health.
Thisissue
may
befreely
reproducedfor
thepurposes
ofprivate
researchand
studyand
extracts(or
indeed,the
fullreport)may
beincluded
inprofessionaljournals
providedthat
suitableacknow
ledgement
ismade
andthe
reproductionisnot
associatedwith
anyform
ofadvertising.
Applications
forcom
mercialreproduction
shouldbe
addressedto:
NIHRJournals
Library,NationalInstitute
forHealth
Research,Evaluation,
Trialsand
StudiesCoordinating
Centre,
Alpha
House,
University
ofSoutham
ptonScience
Park,Southam
ptonSO
167N
S,UK.
19
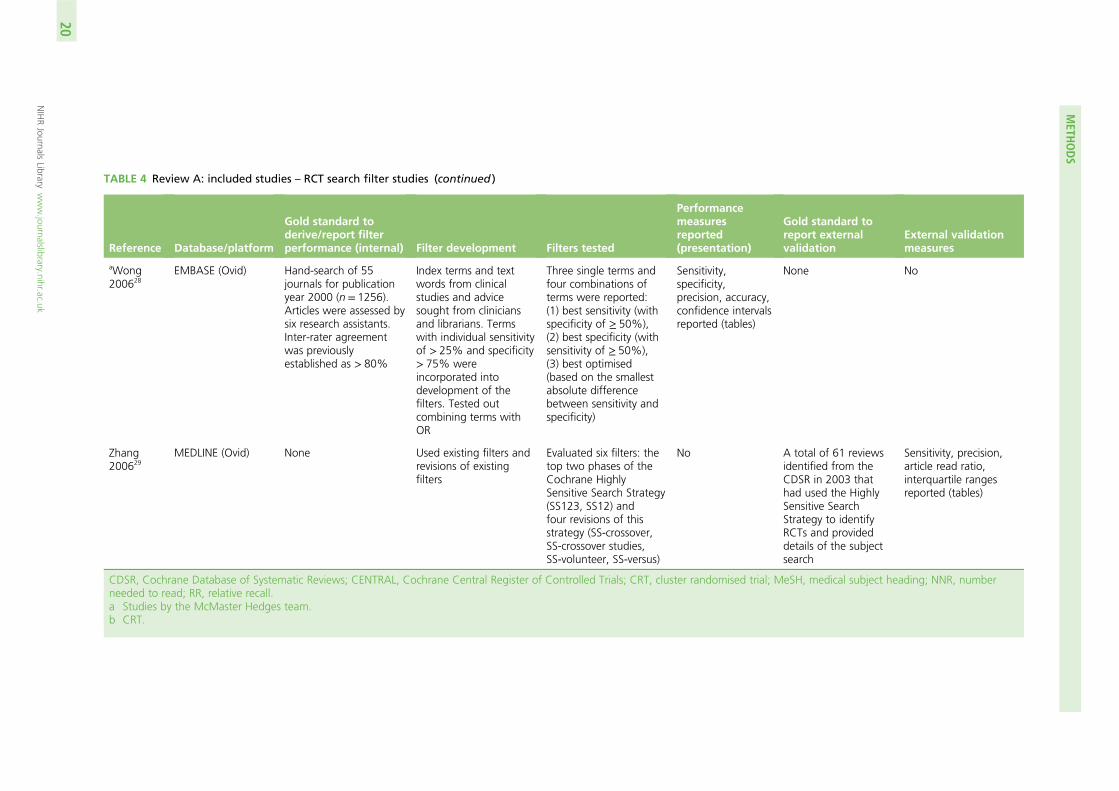
TABLE 4 Review A: included studies – RCT search filter studies (continued )
Reference Database/platform
Gold standard toderive/report filterperformance (internal) Filter development Filters tested
Performancemeasuresreported(presentation)
Gold standard toreport externalvalidation
External validationmeasures
aWong200628
EMBASE (Ovid) Hand-search of 55journals for publicationyear 2000 (n = 1256).Articles were assessed bysix research assistants.Inter-rater agreementwas previouslyestablished as > 80%
Index terms and textwords from clinicalstudies and advicesought from cliniciansand librarians. Termswith individual sensitivityof > 25% and specificity> 75% wereincorporated intodevelopment of thefilters. Tested outcombining terms withOR
Three single terms andfour combinations ofterms were reported:(1) best sensitivity (withspecificity of ≥ 50%),(2) best specificity (withsensitivity of ≥ 50%),(3) best optimised(based on the smallestabsolute differencebetween sensitivity andspecificity)
Sensitivity,specificity,precision, accuracy,confidence intervalsreported (tables)
None No
Zhang200629
MEDLINE (Ovid) None Used existing filters andrevisions of existingfilters
Evaluated six filters: thetop two phases of theCochrane HighlySensitive Search Strategy(SS123, SS12) andfour revisions of thisstrategy (SS-crossover,SS-crossover studies,SS-volunteer, SS-versus)
No A total of 61 reviewsidentified from theCDSR in 2003 thathad used the HighlySensitive SearchStrategy to identifyRCTs and provideddetails of the subjectsearch
Sensitivity, precision,article read ratio,interquartile rangesreported (tables)
CDSR, Cochrane Database of Systematic Reviews; CENTRAL, Cochrane Central Register of Controlled Trials; CRT, cluster randomised trial; MeSH, medical subject heading; NNR, numberneeded to read; RR, relative recall.a Studies by the McMaster Hedges team.b CRT.
METH
ODS
NIHRJournals
Librarywww.journalslibrary.nihr.ac.uk
20
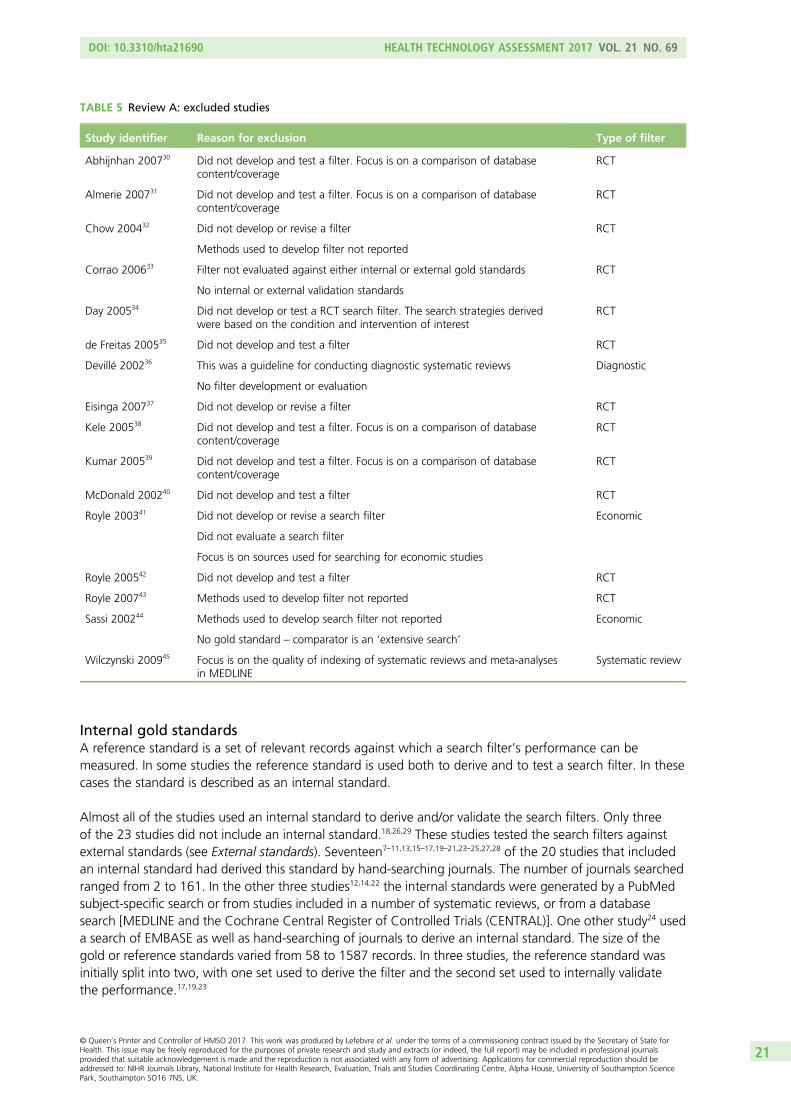
Internal gold standardsA reference standard is a set of relevant records against which a search filter’s performance can bemeasured. In some studies the reference standard is used both to derive and to test a search filter. In thesecases the standard is described as an internal standard.
Almost all of the studies used an internal standard to derive and/or validate the search filters. Only threeof the 23 studies did not include an internal standard.18,26,29 These studies tested the search filters againstexternal standards (see External standards). Seventeen7–11,13,15–17,19–21,23–25,27,28 of the 20 studies that includedan internal standard had derived this standard by hand-searching journals. The number of journals searchedranged from 2 to 161. In the other three studies12,14,22 the internal standards were generated by a PubMedsubject-specific search or from studies included in a number of systematic reviews, or from a databasesearch [MEDLINE and the Cochrane Central Register of Controlled Trials (CENTRAL)]. One other study24 useda search of EMBASE as well as hand-searching of journals to derive an internal standard. The size of thegold or reference standards varied from 58 to 1587 records. In three studies, the reference standard wasinitially split into two, with one set used to derive the filter and the second set used to internally validatethe performance.17,19,23
TABLE 5 Review A: excluded studies
Study identifier Reason for exclusion Type of filter
Abhijnhan 200730 Did not develop and test a filter. Focus is on a comparison of databasecontent/coverage
RCT
Almerie 200731 Did not develop and test a filter. Focus is on a comparison of databasecontent/coverage
RCT
Chow 200432 Did not develop or revise a filter RCT
Methods used to develop filter not reported
Corrao 200633 Filter not evaluated against either internal or external gold standards RCT
No internal or external validation standards
Day 200534 Did not develop or test a RCT search filter. The search strategies derivedwere based on the condition and intervention of interest
RCT
de Freitas 200535 Did not develop and test a filter RCT
Devillé 200236 This was a guideline for conducting diagnostic systematic reviews Diagnostic
No filter development or evaluation
Eisinga 200737 Did not develop or revise a filter RCT
Kele 200538 Did not develop and test a filter. Focus is on a comparison of databasecontent/coverage
RCT
Kumar 200539 Did not develop and test a filter. Focus is on a comparison of databasecontent/coverage
RCT
McDonald 200240 Did not develop and test a filter RCT
Royle 200341 Did not develop or revise a search filter Economic
Did not evaluate a search filter
Focus is on sources used for searching for economic studies
Royle 200542 Did not develop and test a filter RCT
Royle 200743 Methods used to develop filter not reported RCT
Sassi 200244 Methods used to develop search filter not reported Economic
No gold standard – comparator is an ‘extensive search’
Wilczynski 200945 Focus is on the quality of indexing of systematic reviews and meta-analysesin MEDLINE
Systematic review
DOI: 10.3310/hta21690 HEALTH TECHNOLOGY ASSESSMENT 2017 VOL. 21 NO. 69
© Queen’s Printer and Controller of HMSO 2017. This work was produced by Lefebvre et al. under the terms of a commissioning contract issued by the Secretary of State forHealth. This issue may be freely reproduced for the purposes of private research and study and extracts (or indeed, the full report) may be included in professional journalsprovided that suitable acknowledgement is made and the reproduction is not associated with any form of advertising. Applications for commercial reproduction should beaddressed to: NIHR Journals Library, National Institute for Health Research, Evaluation, Trials and Studies Coordinating Centre, Alpha House, University of Southampton SciencePark, Southampton SO16 7NS, UK.
21
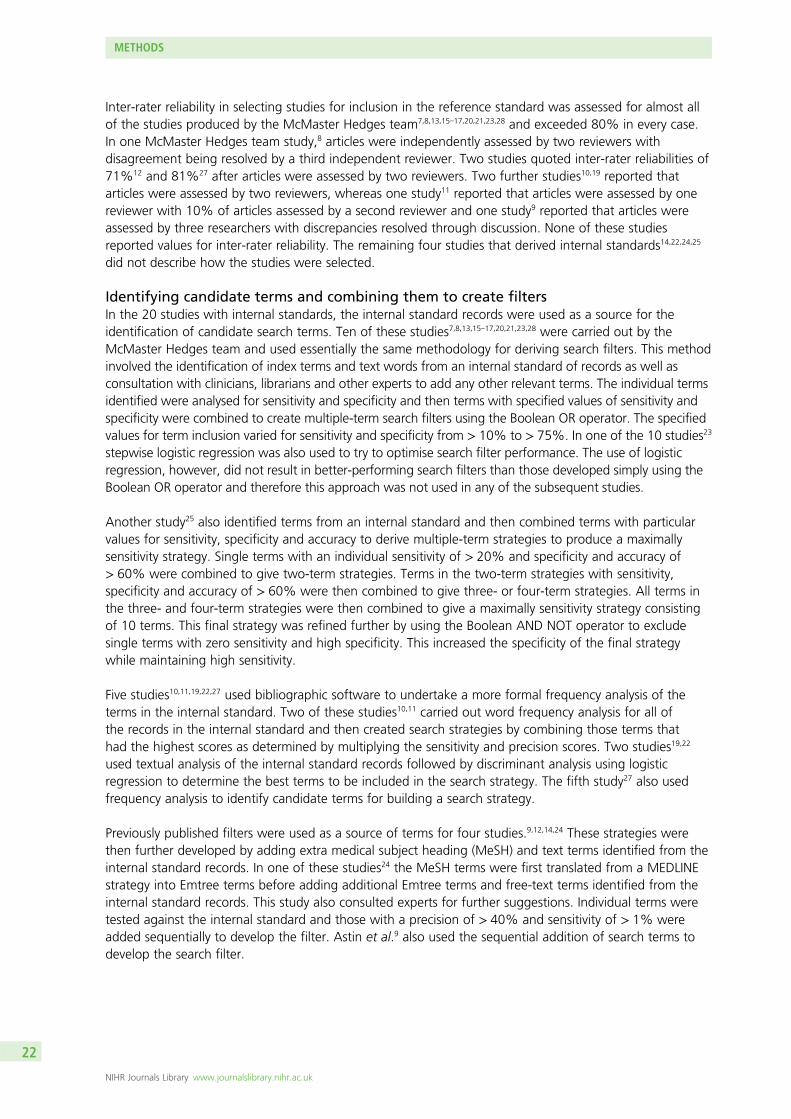
Inter-rater reliability in selecting studies for inclusion in the reference standard was assessed for almost allof the studies produced by the McMaster Hedges team7,8,13,15–17,20,21,23,28 and exceeded 80% in every case.In one McMaster Hedges team study,8 articles were independently assessed by two reviewers withdisagreement being resolved by a third independent reviewer. Two studies quoted inter-rater reliabilities of71%12 and 81%27 after articles were assessed by two reviewers. Two further studies10,19 reported thatarticles were assessed by two reviewers, whereas one study11 reported that articles were assessed by onereviewer with 10% of articles assessed by a second reviewer and one study9 reported that articles wereassessed by three researchers with discrepancies resolved through discussion. None of these studiesreported values for inter-rater reliability. The remaining four studies that derived internal standards14,22,24,25
did not describe how the studies were selected.
Identifying candidate terms and combining them to create filtersIn the 20 studies with internal standards, the internal standard records were used as a source for theidentification of candidate search terms. Ten of these studies7,8,13,15–17,20,21,23,28 were carried out by theMcMaster Hedges team and used essentially the same methodology for deriving search filters. This methodinvolved the identification of index terms and text words from an internal standard of records as well asconsultation with clinicians, librarians and other experts to add any other relevant terms. The individual termsidentified were analysed for sensitivity and specificity and then terms with specified values of sensitivity andspecificity were combined to create multiple-term search filters using the Boolean OR operator. The specifiedvalues for term inclusion varied for sensitivity and specificity from > 10% to > 75%. In one of the 10 studies23
stepwise logistic regression was also used to try to optimise search filter performance. The use of logisticregression, however, did not result in better-performing search filters than those developed simply using theBoolean OR operator and therefore this approach was not used in any of the subsequent studies.
Another study25 also identified terms from an internal standard and then combined terms with particularvalues for sensitivity, specificity and accuracy to derive multiple-term strategies to produce a maximallysensitivity strategy. Single terms with an individual sensitivity of > 20% and specificity and accuracy of> 60% were combined to give two-term strategies. Terms in the two-term strategies with sensitivity,specificity and accuracy of > 60% were then combined to give three- or four-term strategies. All terms inthe three- and four-term strategies were then combined to give a maximally sensitivity strategy consistingof 10 terms. This final strategy was refined further by using the Boolean AND NOT operator to excludesingle terms with zero sensitivity and high specificity. This increased the specificity of the final strategywhile maintaining high sensitivity.
Five studies10,11,19,22,27 used bibliographic software to undertake a more formal frequency analysis of theterms in the internal standard. Two of these studies10,11 carried out word frequency analysis for all ofthe records in the internal standard and then created search strategies by combining those terms thathad the highest scores as determined by multiplying the sensitivity and precision scores. Two studies19,22
used textual analysis of the internal standard records followed by discriminant analysis using logisticregression to determine the best terms to be included in the search strategy. The fifth study27 also usedfrequency analysis to identify candidate terms for building a search strategy.
Previously published filters were used as a source of terms for four studies.9,12,14,24 These strategies werethen further developed by adding extra medical subject heading (MeSH) and text terms identified from theinternal standard records. In one of these studies24 the MeSH terms were first translated from a MEDLINEstrategy into Emtree terms before adding additional Emtree terms and free-text terms identified from theinternal standard records. This study also consulted experts for further suggestions. Individual terms weretested against the internal standard and those with a precision of > 40% and sensitivity of > 1% wereadded sequentially to develop the filter. Astin et al.9 also used the sequential addition of search terms todevelop the search filter.
METHODS
NIHR Journals Library www.journalslibrary.nihr.ac.uk
22
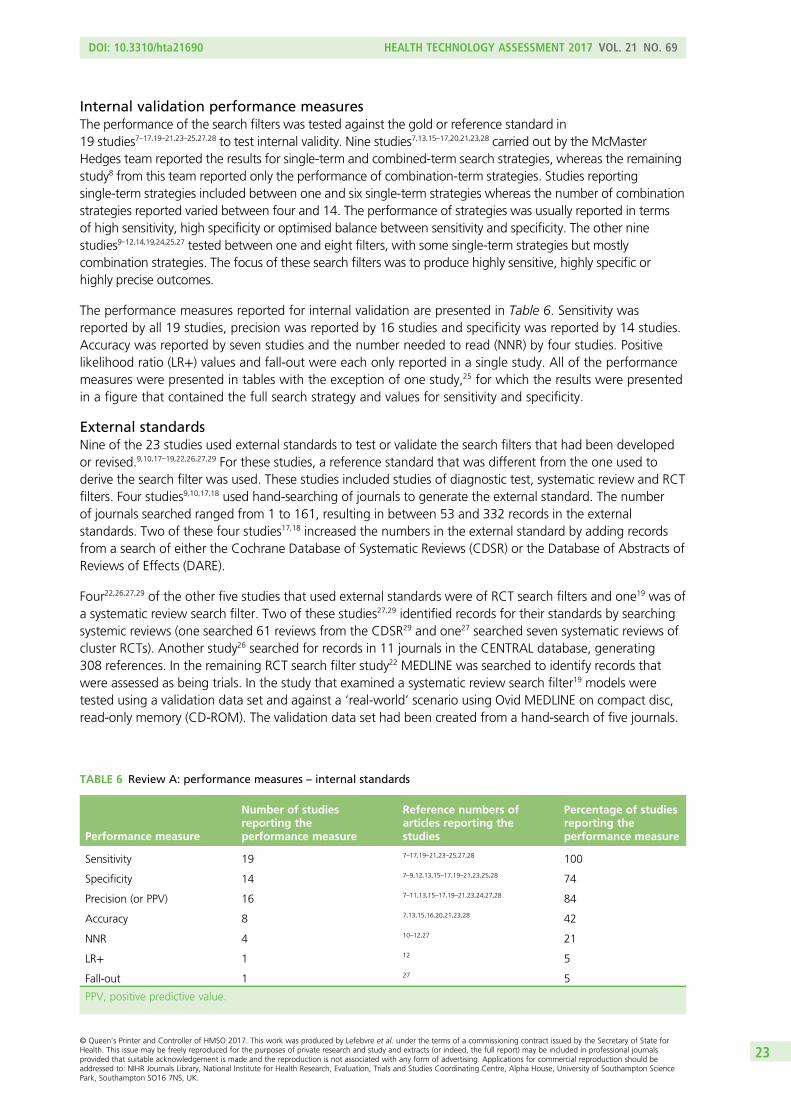
Internal validation performance measuresThe performance of the search filters was tested against the gold or reference standard in19 studies7–17,19–21,23–25,27,28 to test internal validity. Nine studies7,13,15–17,20,21,23,28 carried out by the McMasterHedges team reported the results for single-term and combined-term search strategies, whereas the remainingstudy8 from this team reported only the performance of combination-term strategies. Studies reportingsingle-term strategies included between one and six single-term strategies whereas the number of combinationstrategies reported varied between four and 14. The performance of strategies was usually reported in termsof high sensitivity, high specificity or optimised balance between sensitivity and specificity. The other ninestudies9–12,14,19,24,25,27 tested between one and eight filters, with some single-term strategies but mostlycombination strategies. The focus of these search filters was to produce highly sensitive, highly specific orhighly precise outcomes.
The performance measures reported for internal validation are presented in Table 6. Sensitivity wasreported by all 19 studies, precision was reported by 16 studies and specificity was reported by 14 studies.Accuracy was reported by seven studies and the number needed to read (NNR) by four studies. Positivelikelihood ratio (LR+) values and fall-out were each only reported in a single study. All of the performancemeasures were presented in tables with the exception of one study,25 for which the results were presentedin a figure that contained the full search strategy and values for sensitivity and specificity.
External standardsNine of the 23 studies used external standards to test or validate the search filters that had been developedor revised.9,10,17–19,22,26,27,29 For these studies, a reference standard that was different from the one used toderive the search filter was used. These studies included studies of diagnostic test, systematic review and RCTfilters. Four studies9,10,17,18 used hand-searching of journals to generate the external standard. The numberof journals searched ranged from 1 to 161, resulting in between 53 and 332 records in the externalstandards. Two of these four studies17,18 increased the numbers in the external standard by adding recordsfrom a search of either the Cochrane Database of Systematic Reviews (CDSR) or the Database of Abstracts ofReviews of Effects (DARE).
Four22,26,27,29 of the other five studies that used external standards were of RCT search filters and one19 was ofa systematic review search filter. Two of these studies27,29 identified records for their standards by searchingsystemic reviews (one searched 61 reviews from the CDSR29 and one27 searched seven systematic reviews ofcluster RCTs). Another study26 searched for records in 11 journals in the CENTRAL database, generating308 references. In the remaining RCT search filter study22 MEDLINE was searched to identify records thatwere assessed as being trials. In the study that examined a systematic review search filter19 models weretested using a validation data set and against a ‘real-world’ scenario using Ovid MEDLINE on compact disc,read-only memory (CD-ROM). The validation data set had been created from a hand-search of five journals.
TABLE 6 Review A: performance measures – internal standards
Performance measure
Number of studiesreporting theperformance measure
Reference numbers ofarticles reporting thestudies
Percentage of studiesreporting theperformance measure
Sensitivity 19 7–17,19–21,23–25,27,28 100
Specificity 14 7–9,12,13,15–17,19–21,23,25,28 74
Precision (or PPV) 16 7–11,13,15–17,19–21,23,24,27,28 84
Accuracy 8 7,13,15,16,20,21,23,28 42
NNR 4 10–12,27 21
LR+ 1 12 5
Fall-out 1 27 5
PPV, positive predictive value.
DOI: 10.3310/hta21690 HEALTH TECHNOLOGY ASSESSMENT 2017 VOL. 21 NO. 69
© Queen’s Printer and Controller of HMSO 2017. This work was produced by Lefebvre et al. under the terms of a commissioning contract issued by the Secretary of State forHealth. This issue may be freely reproduced for the purposes of private research and study and extracts (or indeed, the full report) may be included in professional journalsprovided that suitable acknowledgement is made and the reproduction is not associated with any form of advertising. Applications for commercial reproduction should beaddressed to: NIHR Journals Library, National Institute for Health Research, Evaluation, Trials and Studies Coordinating Centre, Alpha House, University of Southampton SciencePark, Southampton SO16 7NS, UK.
23
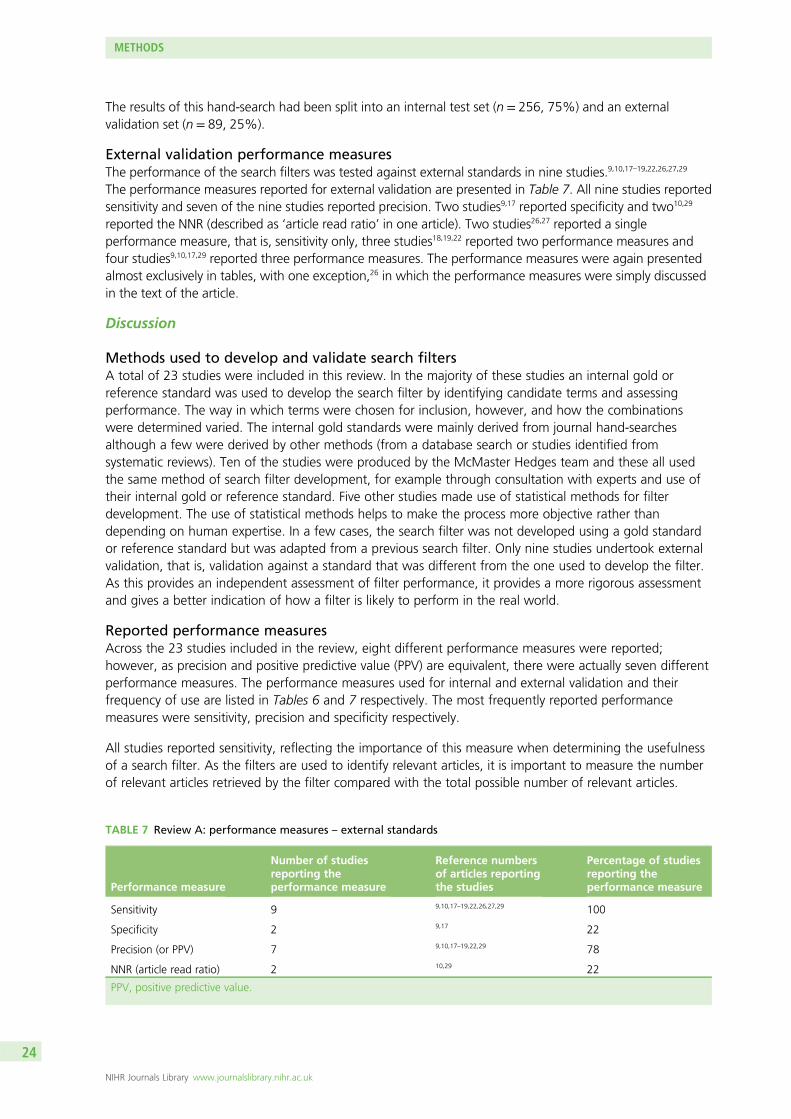
The results of this hand-search had been split into an internal test set (n = 256, 75%) and an externalvalidation set (n = 89, 25%).
External validation performance measuresThe performance of the search filters was tested against external standards in nine studies.9,10,17–19,22,26,27,29
The performance measures reported for external validation are presented in Table 7. All nine studies reportedsensitivity and seven of the nine studies reported precision. Two studies9,17 reported specificity and two10,29
reported the NNR (described as ‘article read ratio’ in one article). Two studies26,27 reported a singleperformance measure, that is, sensitivity only, three studies18,19,22 reported two performance measures andfour studies9,10,17,29 reported three performance measures. The performance measures were again presentedalmost exclusively in tables, with one exception,26 in which the performance measures were simply discussedin the text of the article.
Discussion
Methods used to develop and validate search filtersA total of 23 studies were included in this review. In the majority of these studies an internal gold orreference standard was used to develop the search filter by identifying candidate terms and assessingperformance. The way in which terms were chosen for inclusion, however, and how the combinationswere determined varied. The internal gold standards were mainly derived from journal hand-searchesalthough a few were derived by other methods (from a database search or studies identified fromsystematic reviews). Ten of the studies were produced by the McMaster Hedges team and these all usedthe same method of search filter development, for example through consultation with experts and use oftheir internal gold or reference standard. Five other studies made use of statistical methods for filterdevelopment. The use of statistical methods helps to make the process more objective rather thandepending on human expertise. In a few cases, the search filter was not developed using a gold standardor reference standard but was adapted from a previous search filter. Only nine studies undertook externalvalidation, that is, validation against a standard that was different from the one used to develop the filter.As this provides an independent assessment of filter performance, it provides a more rigorous assessmentand gives a better indication of how a filter is likely to perform in the real world.
Reported performance measuresAcross the 23 studies included in the review, eight different performance measures were reported;however, as precision and positive predictive value (PPV) are equivalent, there were actually seven differentperformance measures. The performance measures used for internal and external validation and theirfrequency of use are listed in Tables 6 and 7 respectively. The most frequently reported performancemeasures were sensitivity, precision and specificity respectively.
All studies reported sensitivity, reflecting the importance of this measure when determining the usefulnessof a search filter. As the filters are used to identify relevant articles, it is important to measure the numberof relevant articles retrieved by the filter compared with the total possible number of relevant articles.
TABLE 7 Review A: performance measures – external standards
Performance measure
Number of studiesreporting theperformance measure
Reference numbersof articles reportingthe studies
Percentage of studiesreporting theperformance measure
Sensitivity 9 9,10,17–19,22,26,27,29 100
Specificity 2 9,17 22
Precision (or PPV) 7 9,10,17–19,22,29 78
NNR (article read ratio) 2 10,29 22
PPV, positive predictive value.
METHODS
NIHR Journals Library www.journalslibrary.nihr.ac.uk
24
When carrying out a systematic review, in which it is important to identify as many relevant studies aspossible, it makes sense to use a search filter with a high sensitivity value.
The performance measures of specificity and precision were the next most reported measures. It isimportant that a search filter rejects non-relevant articles and thus a high specificity is desirable. In awell-performing search filter a high specificity value would be desirable as well as a high sensitivity value,as there would not be much point in using a filter that retrieves lots of non-relevant articles as well as allof the relevant articles. The articles in the review often included search filters that were optimised for thebest balance of sensitivity and specificity.
As precision measures the number of relevant articles as a proportion of all articles retrieved, the aim is tomaximise the precision of a search filter. As sensitivity and precision are, however, inversely related, it isdifficult to achieve both high sensitivity and high precision. The NNR is another way of reporting precisionas it is calculated by dividing 1 by the precision value. This measure gives the number of articles that needto be read to find one relevant article and may, therefore, be more easily understood than precision, whichis usually quoted as a percentage value.
The accuracy performance measure was used only in articles produced by the McMaster Hedges team.It provides a measure of the number of articles that are classified correctly as either relevant or non-relevant.The usefulness of this measure on its own, however, is unclear as a high accuracy value may be obtainedwhen the specificity value is high but the sensitivity value is medium or low. In most cases the accuracyvalue is close to the specificity value and does not give an indication of the sensitivity value.
The other two performance measures that were found (LR+ and fall-out) each appeared in one article.These performance measures were reported in addition to sensitivity and either specificity or precision.
Presentation of performance measuresThe most commonly used format for the presentation of performance measures used for single studies ofsearch filters was tables. Only two studies of RCT filters did not present the performance measures intables. One of these studies presented the search strategy and its performance measures in a figurewhereas the other study simply discussed the performance measures in the text of the article. Thus, tablesseem to be a popular and useful way of presenting performance measures. Often the results are orderedin tables according to one of the performance measures, for example sensitivity, thus making it easy toidentify the most sensitive and the least sensitive search filter. The studies often presented the performancemeasures in a number of tables to allow ordering by different performance measures, for example tablesordered by sensitivity or specificity or precision. This makes it easier to select a search filter for a specificneed, for example researchers involved in performing systematic reviews requiring very sensitive searchfilters could select the most sensitive search filters whereas busy clinicians who are simply looking for somerelevant articles could select a filter with the highest precision.
Key findings
l Internal gold or reference standards were mostly derived by hand-searching of journals.l Validation of filters was mostly carried out using internal validation.l The most commonly used performance measures were sensitivity, precision and specificity.l The majority of the studies presented performance measures in tables.
Measures for comparing the performance of methodological searchfilters (review B)
Reproduced with permission from Harbour et al.46 © 2014 The authors. Health Information and LibrariesJournal © 2014 Health Libraries Journal. Health Information & Libraries Journal, 31, pp. 176–194.
DOI: 10.3310/hta21690 HEALTH TECHNOLOGY ASSESSMENT 2017 VOL. 21 NO. 69
© Queen’s Printer and Controller of HMSO 2017. This work was produced by Lefebvre et al. under the terms of a commissioning contract issued by the Secretary of State forHealth. This issue may be freely reproduced for the purposes of private research and study and extracts (or indeed, the full report) may be included in professional journalsprovided that suitable acknowledgement is made and the reproduction is not associated with any form of advertising. Applications for commercial reproduction should beaddressed to: NIHR Journals Library, National Institute for Health Research, Evaluation, Trials and Studies Coordinating Centre, Alpha House, University of Southampton SciencePark, Southampton SO16 7NS, UK.
25
IntroductionA variety of methodological search filters are already available to find RCTs, economic evaluations,systematic reviews and many other study designs. In principle, these filters can offer efficient, validated andconsistent approaches to study identification within large bibliographic databases. Search filters, however,are an under-researched tool. Although there are many published search filters, few have been extensivelyvalidated beyond the data offered in the original publications.47–49 This means that their performance inthe real-world setting of day-to-day information retrieval across a range of search topics is unknown.50
Furthermore, search filters are seldom assessed against common data sets, which makes a comparison ofperformance across filters problematic. Consequently, the use of search filters as a standard tool withintechnology assessment, guideline development and other evidence syntheses may be pragmatic ratherthan evidence based.50,51
As search filters proliferate, the key question becomes how to choose between them. The most usefulinformation to assist search filter choice is likely to be performance data derived from well-conducted andwell-reported performance tests or comparisons. Methods exist to test search filter performance and tobuild the performance picture, including reviews of search filter performance.48,49,52–54 There is no formalguidance, however, on the best methods for testing filter performance, on which performance measuresare valued by searchers and on which measures should ideally be reported to assist searchers in choosingbetween filters. The performance picture for filters across different disciplines, questions and databases istherefore largely unknown. Different performance measures are reported in studies describing search filtersand the process whereby searchers choose a filter remains unclear.
The purpose of this review was to consider the measures and methods used in reporting the comparativeperformance of multiple methodological search filters.
ObjectivesThis review addressed the following questions:
l What performance measures are reported in studies comparing the performance of one or moremethodological search filters in one or more sets of records?
l How are the results presented in studies comparing the performance of one or more methodologicalsearch filters in one or more sets of records?
l How reliable are the methods used in studies comparing the performance of methodological search filters?l Are there any published methods for synthesising the results of several filter performance studies?l Are there any published methods for reviewing the results of several syntheses?
Methods
Identification of studiesStudies were identified from the ISSG Search Filters Resource.6 The ISSG Search Filters Resource is acollaborative venture to identify, assess and test search filters designed to retrieve health-care research bystudy design. It includes published filters and ongoing research on filter design, research evaluating theperformance of filters and articles providing a general overview of search filters. At the time of this project,regular searches were being carried out in a number of databases and websites, and tables of contentsof key journals and conference proceedings were being scanned to populate the site. Researchers workingon search filter design are encouraged to submit details of their work. The 2010 update search carried outby the UK Cochrane Centre to support the ISSG Search Filters Resource website was also scanned toidentify any relevant studies not at that time included on the website. We acknowledge that there hasbeen a regrettable delay between carrying out the project, including the searches, and the publication ofthis report, due to serious illness of the principal investigator. The searches were carried out in 2010/2011.
METHODS
NIHR Journals Library www.journalslibrary.nihr.ac.uk
26
Inclusion criteriaFor the purpose of this review, methodological search filters were defined as any search filter or strategyused to identify database records of studies that use a particular clinical research method. A pragmaticdecision was taken to include only studies comparing the performance of filters for RCTs, DTA studies,systematic reviews or economic evaluation studies. These study types are the ones most commonly used byorganisations such as NICE to underpin their decision-making when producing technology appraisals andeconomic evaluations of health-care technologies and subsequent clinical guidelines.
Studies were selected for inclusion in the review if they compared the performance of two or moremethodological search filters in one or more sets of records. Studies reporting the development of newmethodological filters whose performance was compared with that of previously published filters werealso included.
Exclusion criteriaStudies were excluded from the review if they:
l reported the development and initial testing of a single search filter that did not include any formalcomparison with the performance of other search filters
l compared methodological search filters that had not been designed to retrieve RCTs, DTA studies,systematic reviews or economic evaluation studies
l compared the performance of a single filter in multiple databases or interfacesl were not available as a full report, for example conference abstractsl were protocols for studies or reviewsl lacked sufficient methodological detail to undertake the data extraction process.
Data extraction and synthesisA data extraction form was developed by two reviewers (JH, CF) to standardise the extraction of data fromthe selected studies and allow cross-comparisons between studies. Details extracted included the methodsused to identify published filters for comparison, the methods used to test filter performance and theperformance measures reported. Data extraction for each study was carried out by one reviewer (JH) andverified by a second reviewer (CF). A narrative synthesis was used to summarise the results from the review.
ResultsTwenty-one studies were identified as potentially meeting the inclusion criteria for this review basedon titles and abstracts2,10,14,15,17,19,22,23,25,33,48,49,55–63 Of these studies, 10 reported the development of oneor more search filters, whose performance was then compared against the performance of existingfilters10,14,15,17,19,22,23,25,56,57 and 11 reported the comparative performance of existing filters.2,33,48,49,55,58–63
On receipt of the full articles, three studies55,60,62 were excluded from the review based on the criteriaoutlined in the methods section. The 18 included studies are listed in Tables 8 and 9 and the excludedstudies are listed in Table 10. No studies were identified that synthesised the results of several performancereports or reviewed the results of several syntheses.
Of the 18 studies included in the review:
l eight reported the performance of DTA search filters2,10,14,15,48,49,57,58
l five reported the performance of RCT filters22,23,25,33,61
l three reported the performance of systematic review filters17,19,56
l one reported the performance of filters for economic evaluations59
l one reported the performance of RCT and systematic review filters.63
The methodological filters evaluated in the included studies had been developed in a variety of interfacesincluding the interfaces to LILACS, Ovid, PubMed and SilverPlatter. Most studies, however, did not specifythe interface used in the development of some or all of the filters being compared.2,15,17,19,22,23,49,56–59,61
DOI: 10.3310/hta21690 HEALTH TECHNOLOGY ASSESSMENT 2017 VOL. 21 NO. 69
© Queen’s Printer and Controller of HMSO 2017. This work was produced by Lefebvre et al. under the terms of a commissioning contract issued by the Secretary of State forHealth. This issue may be freely reproduced for the purposes of private research and study and extracts (or indeed, the full report) may be included in professional journalsprovided that suitable acknowledgement is made and the reproduction is not associated with any form of advertising. Applications for commercial reproduction should beaddressed to: NIHR Journals Library, National Institute for Health Research, Evaluation, Trials and Studies Coordinating Centre, Alpha House, University of Southampton SciencePark, Southampton SO16 7NS, UK.
27
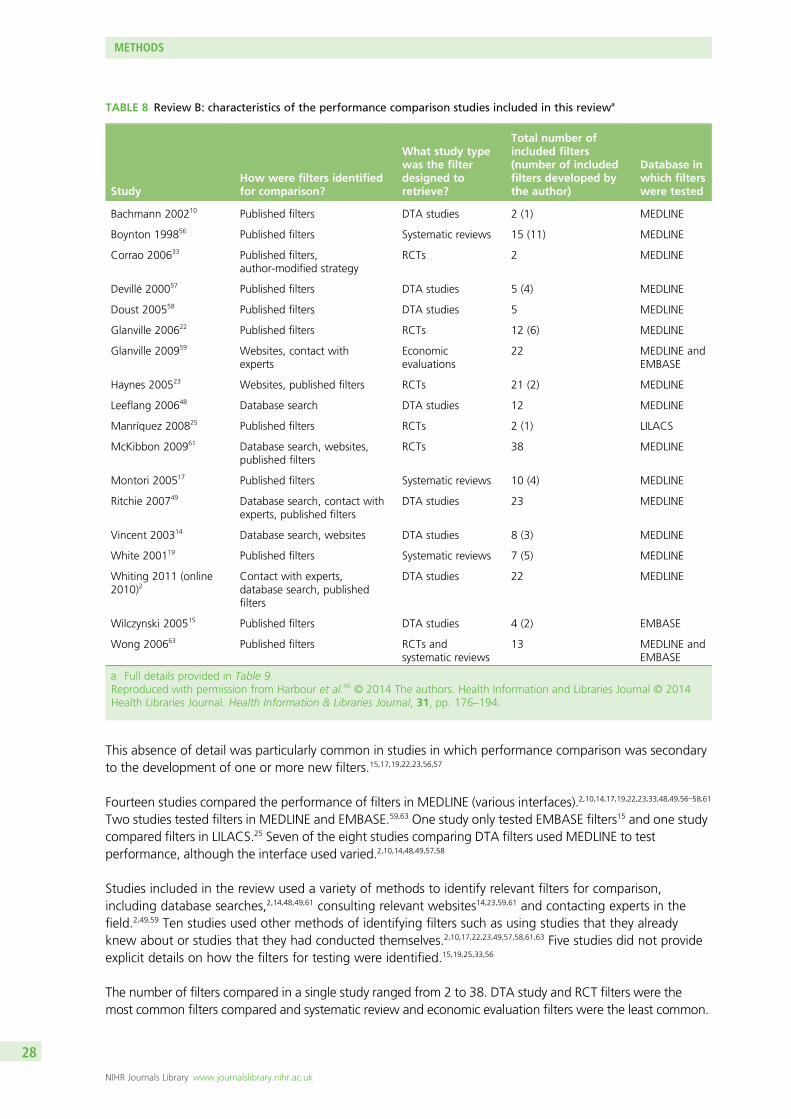
This absence of detail was particularly common in studies in which performance comparison was secondaryto the development of one or more new filters.15,17,19,22,23,56,57
Fourteen studies compared the performance of filters in MEDLINE (various interfaces).2,10,14,17,19,22,23,33,48,49,56–58,61
Two studies tested filters in MEDLINE and EMBASE.59,63 One study only tested EMBASE filters15 and one studycompared filters in LILACS.25 Seven of the eight studies comparing DTA filters used MEDLINE to testperformance, although the interface used varied.2,10,14,48,49,57,58
Studies included in the review used a variety of methods to identify relevant filters for comparison,including database searches,2,14,48,49,61 consulting relevant websites14,23,59,61 and contacting experts in thefield.2,49,59 Ten studies used other methods of identifying filters such as using studies that they alreadyknew about or studies that they had conducted themselves.2,10,17,22,23,49,57,58,61,63 Five studies did not provideexplicit details on how the filters for testing were identified.15,19,25,33,56
The number of filters compared in a single study ranged from 2 to 38. DTA study and RCT filters were themost common filters compared and systematic review and economic evaluation filters were the least common.
TABLE 8 Review B: characteristics of the performance comparison studies included in this reviewa
StudyHow were filters identifiedfor comparison?
What study typewas the filterdesigned toretrieve?
Total number ofincluded filters(number of includedfilters developed bythe author)
Database inwhich filterswere tested
Bachmann 200210 Published filters DTA studies 2 (1) MEDLINE
Boynton 199856 Published filters Systematic reviews 15 (11) MEDLINE
Corrao 200633 Published filters,author-modified strategy
RCTs 2 MEDLINE
Devillé 200057 Published filters DTA studies 5 (4) MEDLINE
Doust 200558 Published filters DTA studies 5 MEDLINE
Glanville 200622 Published filters RCTs 12 (6) MEDLINE
Glanville 200959 Websites, contact withexperts
Economicevaluations
22 MEDLINE andEMBASE
Haynes 200523 Websites, published filters RCTs 21 (2) MEDLINE
Leeflang 200648 Database search DTA studies 12 MEDLINE
Manríquez 200825 Published filters RCTs 2 (1) LILACS
McKibbon 200961 Database search, websites,published filters
RCTs 38 MEDLINE
Montori 200517 Published filters Systematic reviews 10 (4) MEDLINE
Ritchie 200749 Database search, contact withexperts, published filters
DTA studies 23 MEDLINE
Vincent 200314 Database search, websites DTA studies 8 (3) MEDLINE
White 200119 Published filters Systematic reviews 7 (5) MEDLINE
Whiting 2011 (online2010)2
Contact with experts,database search, publishedfilters
DTA studies 22 MEDLINE
Wilczynski 200515 Published filters DTA studies 4 (2) EMBASE
Wong 200663 Published filters RCTs andsystematic reviews
13 MEDLINE andEMBASE
a Full details provided in Table 9.Reproduced with permission from Harbour et al.46 © 2014 The authors. Health Information and Libraries Journal © 2014Health Libraries Journal. Health Information & Libraries Journal, 31, pp. 176–194.
METHODS
NIHR Journals Library www.journalslibrary.nihr.ac.uk
28
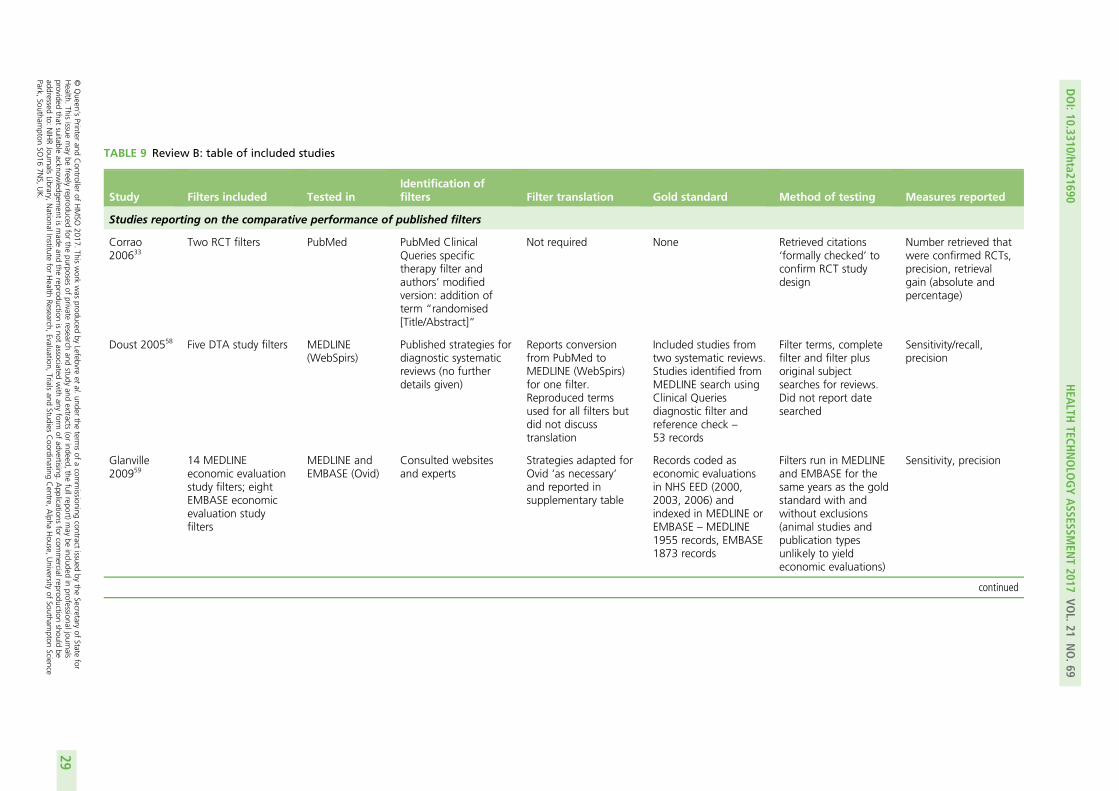
TABLE 9 Review B: table of included studies
Study Filters included Tested inIdentification offilters Filter translation Gold standard Method of testing Measures reported
Studies reporting on the comparative performance of published filters
Corrao200633
Two RCT filters PubMed PubMed ClinicalQueries specifictherapy filter andauthors’ modifiedversion: addition ofterm “randomised[Title/Abstract]”
Not required None Retrieved citations‘formally checked’ toconfirm RCT studydesign
Number retrieved thatwere confirmed RCTs,precision, retrievalgain (absolute andpercentage)
Doust 200558 Five DTA study filters MEDLINE(WebSpirs)
Published strategies fordiagnostic systematicreviews (no furtherdetails given)
Reports conversionfrom PubMed toMEDLINE (WebSpirs)for one filter.Reproduced termsused for all filters butdid not discusstranslation
Included studies fromtwo systematic reviews.Studies identified fromMEDLINE search usingClinical Queriesdiagnostic filter andreference check –
53 records
Filter terms, completefilter and filter plusoriginal subjectsearches for reviews.Did not report datesearched
Sensitivity/recall,precision
Glanville200959
14 MEDLINEeconomic evaluationstudy filters; eightEMBASE economicevaluation studyfilters
MEDLINE andEMBASE (Ovid)
Consulted websitesand experts
Strategies adapted forOvid ‘as necessary’and reported insupplementary table
Records coded aseconomic evaluationsin NHS EED (2000,2003, 2006) andindexed in MEDLINE orEMBASE – MEDLINE1955 records, EMBASE1873 records
Filters run in MEDLINEand EMBASE for thesame years as the goldstandard with andwithout exclusions(animal studies andpublication typesunlikely to yieldeconomic evaluations)
Sensitivity, precision
continued
DOI:10.3310/hta21690
HEA
LTHTECH
NOLO
GYASSESSM
ENT2017
VOL.21
NO.69
©Queen
’sPrinter
andController
ofHMSO
2017.This
work
was
producedby
Lefebvreet
al.under
theterm
sof
acom
missioning
contractissued
bythe
Secretaryof
Statefor
Health.
Thisissue
may
befreely
reproducedfor
thepurposes
ofprivate
researchand
studyand
extracts(or
indeed,the
fullreport)may
beincluded
inprofessionaljournals
providedthat
suitableacknow
ledgement
ismade
andthe
reproductionisnot
associatedwith
anyform
ofadvertising.
Applications
forcom
mercialreproduction
shouldbe
addressedto:
NIHRJournals
Library,NationalInstitute
forHealth
Research,Evaluation,
Trialsand
StudiesCoordinating
Centre,
Alpha
House,
University
ofSoutham
ptonScience
Park,Southam
ptonSO
167N
S,UK.
29
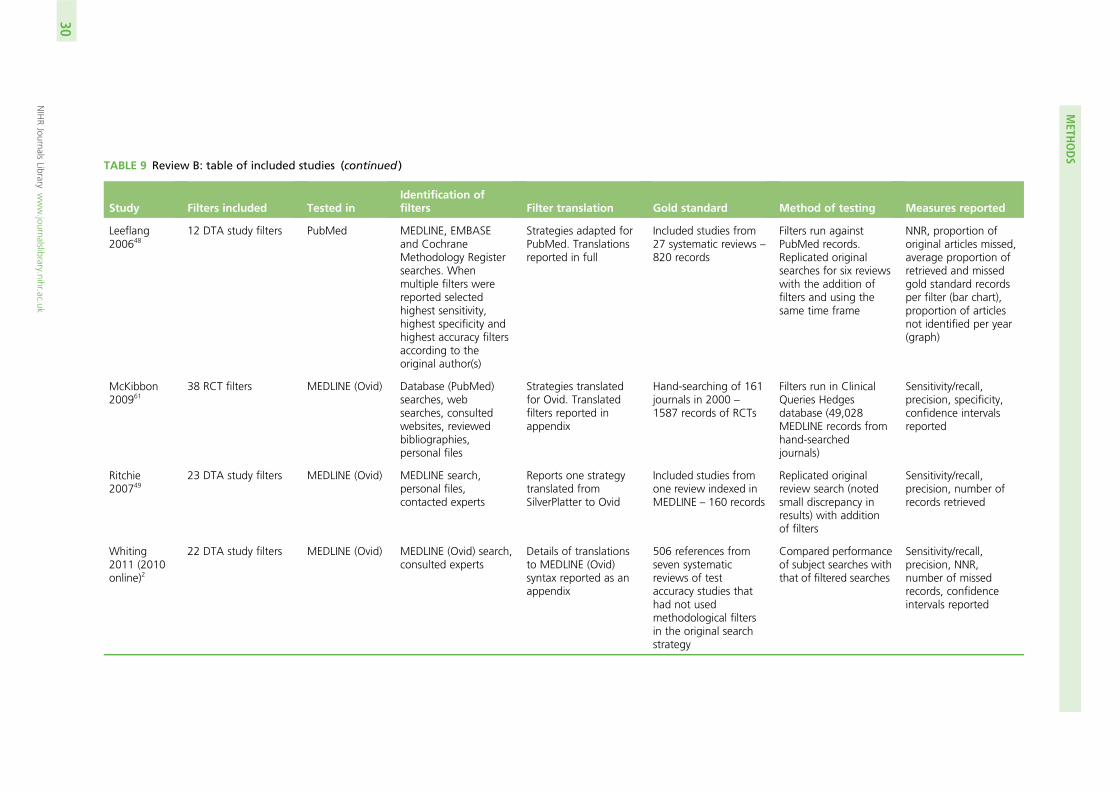
TABLE 9 Review B: table of included studies (continued )
Study Filters included Tested inIdentification offilters Filter translation Gold standard Method of testing Measures reported
Leeflang200648
12 DTA study filters PubMed MEDLINE, EMBASEand CochraneMethodology Registersearches. Whenmultiple filters werereported selectedhighest sensitivity,highest specificity andhighest accuracy filtersaccording to theoriginal author(s)
Strategies adapted forPubMed. Translationsreported in full
Included studies from27 systematic reviews –820 records
Filters run againstPubMed records.Replicated originalsearches for six reviewswith the addition offilters and using thesame time frame
NNR, proportion oforiginal articles missed,average proportion ofretrieved and missedgold standard recordsper filter (bar chart),proportion of articlesnot identified per year(graph)
McKibbon200961
38 RCT filters MEDLINE (Ovid) Database (PubMed)searches, websearches, consultedwebsites, reviewedbibliographies,personal files
Strategies translatedfor Ovid. Translatedfilters reported inappendix
Hand-searching of 161journals in 2000 –
1587 records of RCTs
Filters run in ClinicalQueries Hedgesdatabase (49,028MEDLINE records fromhand-searchedjournals)
Sensitivity/recall,precision, specificity,confidence intervalsreported
Ritchie200749
23 DTA study filters MEDLINE (Ovid) MEDLINE search,personal files,contacted experts
Reports one strategytranslated fromSilverPlatter to Ovid
Included studies fromone review indexed inMEDLINE – 160 records
Replicated originalreview search (notedsmall discrepancy inresults) with additionof filters
Sensitivity/recall,precision, number ofrecords retrieved
Whiting2011 (2010online)2
22 DTA study filters MEDLINE (Ovid) MEDLINE (Ovid) search,consulted experts
Details of translationsto MEDLINE (Ovid)syntax reported as anappendix
506 references fromseven systematicreviews of testaccuracy studies thathad not usedmethodological filtersin the original searchstrategy
Compared performanceof subject searches withthat of filtered searches
Sensitivity/recall,precision, NNR,number of missedrecords, confidenceintervals reported
METH
ODS
NIHRJournals
Librarywww.journalslibrary.nihr.ac.uk
30
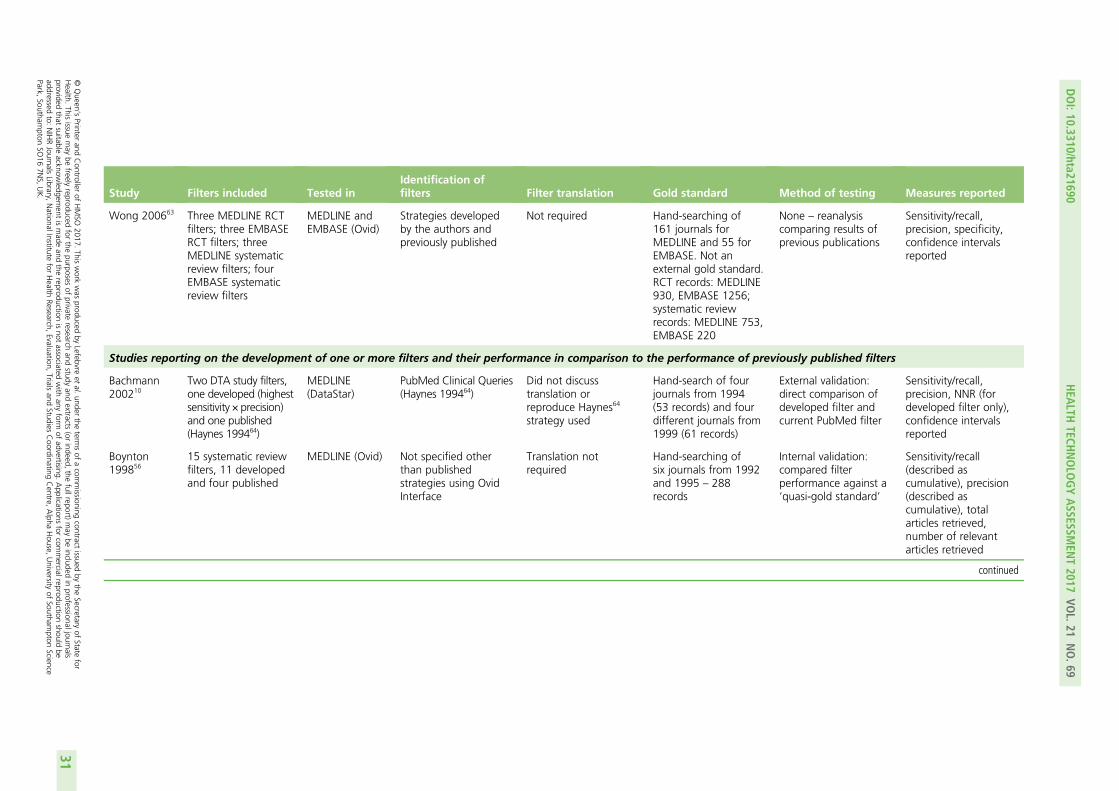
Study Filters included Tested inIdentification offilters Filter translation Gold standard Method of testing Measures reported
Wong 200663 Three MEDLINE RCTfilters; three EMBASERCT filters; threeMEDLINE systematicreview filters; fourEMBASE systematicreview filters
MEDLINE andEMBASE (Ovid)
Strategies developedby the authors andpreviously published
Not required Hand-searching of161 journals forMEDLINE and 55 forEMBASE. Not anexternal gold standard.RCT records: MEDLINE930, EMBASE 1256;systematic reviewrecords: MEDLINE 753,EMBASE 220
None – reanalysiscomparing results ofprevious publications
Sensitivity/recall,precision, specificity,confidence intervalsreported
Studies reporting on the development of one or more filters and their performance in comparison to the performance of previously published filters
Bachmann200210
Two DTA study filters,one developed (highestsensitivity × precision)and one published(Haynes 199464)
MEDLINE(DataStar)
PubMed Clinical Queries(Haynes 199464)
Did not discusstranslation orreproduce Haynes64
strategy used
Hand-search of fourjournals from 1994(53 records) and fourdifferent journals from1999 (61 records)
External validation:direct comparison ofdeveloped filter andcurrent PubMed filter
Sensitivity/recall,precision, NNR (fordeveloped filter only),confidence intervalsreported
Boynton199856
15 systematic reviewfilters, 11 developedand four published
MEDLINE (Ovid) Not specified otherthan publishedstrategies using OvidInterface
Translation notrequired
Hand-searching ofsix journals from 1992and 1995 – 288records
Internal validation:compared filterperformance against a‘quasi-gold standard’
Sensitivity/recall(described ascumulative), precision(described ascumulative), totalarticles retrieved,number of relevantarticles retrieved
continued
DOI:10.3310/hta21690
HEA
LTHTECH
NOLO
GYASSESSM
ENT2017
VOL.21
NO.69
©Queen
’sPrinter
andController
ofHMSO
2017.This
work
was
producedby
Lefebvreet
al.under
theterm
sof
acom
missioning
contractissued
bythe
Secretaryof
Statefor
Health.
Thisissue
may
befreely
reproducedfor
thepurposes
ofprivate
researchand
studyand
extracts(or
indeed,the
fullreport)may
beincluded
inprofessionaljournals
providedthat
suitableacknow
ledgement
ismade
andthe
reproductionisnot
associatedwith
anyform
ofadvertising.
Applications
forcom
mercialreproduction
shouldbe
addressedto:
NIHRJournals
Library,NationalInstitute
forHealth
Research,Evaluation,
Trialsand
StudiesCoordinating
Centre,
Alpha
House,
University
ofSoutham
ptonScience
Park,Southam
ptonSO
167N
S,UK.
31
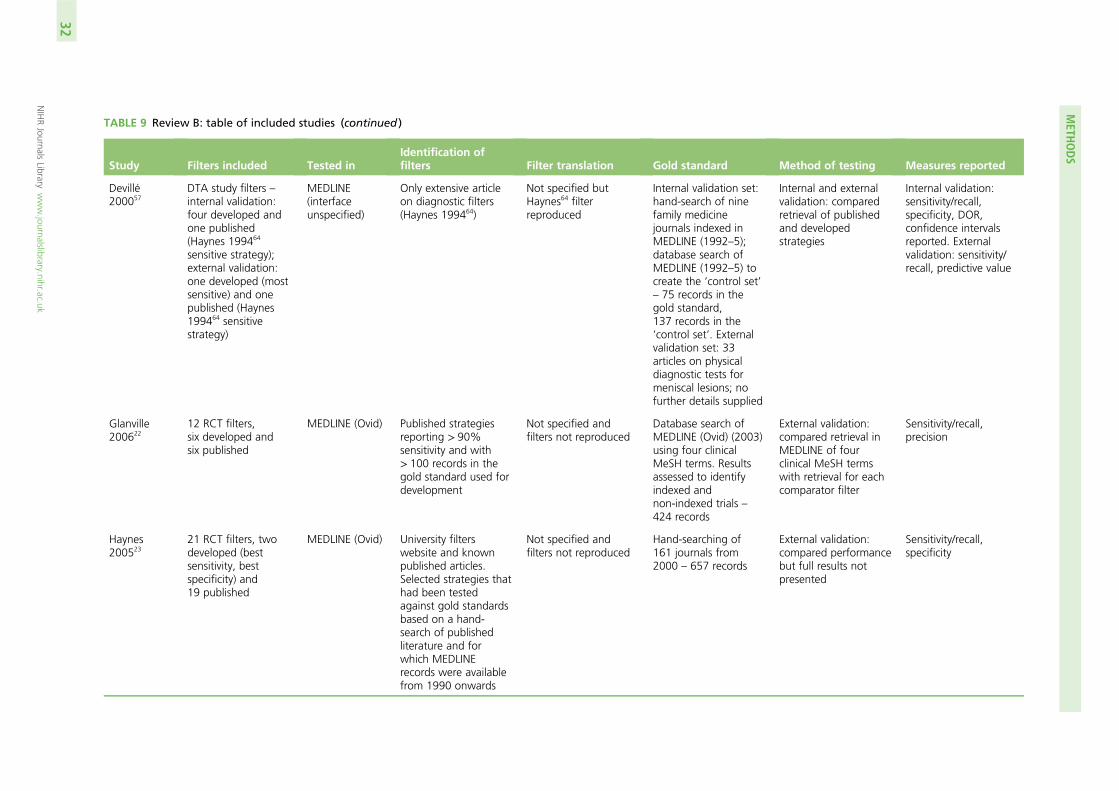
TABLE 9 Review B: table of included studies (continued )
Study Filters included Tested inIdentification offilters Filter translation Gold standard Method of testing Measures reported
Devillé200057
DTA study filters –internal validation:four developed andone published(Haynes 199464
sensitive strategy);external validation:one developed (mostsensitive) and onepublished (Haynes199464 sensitivestrategy)
MEDLINE(interfaceunspecified)
Only extensive articleon diagnostic filters(Haynes 199464)
Not specified butHaynes64 filterreproduced
Internal validation set:hand-search of ninefamily medicinejournals indexed inMEDLINE (1992–5);database search ofMEDLINE (1992–5) tocreate the ‘control set’– 75 records in thegold standard,137 records in the‘control set’. Externalvalidation set: 33articles on physicaldiagnostic tests formeniscal lesions; nofurther details supplied
Internal and externalvalidation: comparedretrieval of publishedand developedstrategies
Internal validation:sensitivity/recall,specificity, DOR,confidence intervalsreported. Externalvalidation: sensitivity/recall, predictive value
Glanville200622
12 RCT filters,six developed andsix published
MEDLINE (Ovid) Published strategiesreporting > 90%sensitivity and with> 100 records in thegold standard used fordevelopment
Not specified andfilters not reproduced
Database search ofMEDLINE (Ovid) (2003)using four clinicalMeSH terms. Resultsassessed to identifyindexed andnon-indexed trials –424 records
External validation:compared retrieval inMEDLINE of fourclinical MeSH termswith retrieval for eachcomparator filter
Sensitivity/recall,precision
Haynes200523
21 RCT filters, twodeveloped (bestsensitivity, bestspecificity) and19 published
MEDLINE (Ovid) University filterswebsite and knownpublished articles.Selected strategies thathad been testedagainst gold standardsbased on a hand-search of publishedliterature and forwhich MEDLINErecords were availablefrom 1990 onwards
Not specified andfilters not reproduced
Hand-searching of161 journals from2000 – 657 records
External validation:compared performancebut full results notpresented
Sensitivity/recall,specificity
METH
ODS
NIHRJournals
Librarywww.journalslibrary.nihr.ac.uk
32
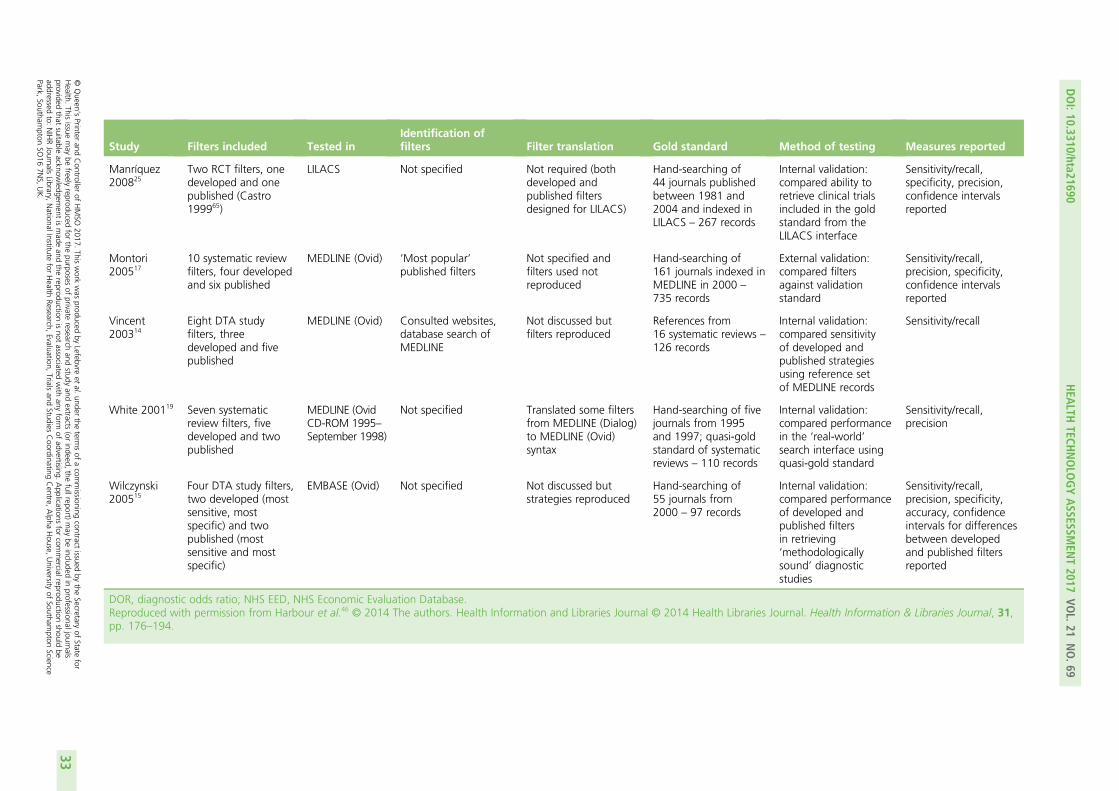
Study Filters included Tested inIdentification offilters Filter translation Gold standard Method of testing Measures reported
Manríquez200825
Two RCT filters, onedeveloped and onepublished (Castro199965)
LILACS Not specified Not required (bothdeveloped andpublished filtersdesigned for LILACS)
Hand-searching of44 journals publishedbetween 1981 and2004 and indexed inLILACS – 267 records
Internal validation:compared ability toretrieve clinical trialsincluded in the goldstandard from theLILACS interface
Sensitivity/recall,specificity, precision,confidence intervalsreported
Montori200517
10 systematic reviewfilters, four developedand six published
MEDLINE (Ovid) ‘Most popular’published filters
Not specified andfilters used notreproduced
Hand-searching of161 journals indexed inMEDLINE in 2000 –
735 records
External validation:compared filtersagainst validationstandard
Sensitivity/recall,precision, specificity,confidence intervalsreported
Vincent200314
Eight DTA studyfilters, threedeveloped and fivepublished
MEDLINE (Ovid) Consulted websites,database search ofMEDLINE
Not discussed butfilters reproduced
References from16 systematic reviews –126 records
Internal validation:compared sensitivityof developed andpublished strategiesusing reference setof MEDLINE records
Sensitivity/recall
White 200119 Seven systematicreview filters, fivedeveloped and twopublished
MEDLINE (OvidCD-ROM 1995–September 1998)
Not specified Translated some filtersfrom MEDLINE (Dialog)to MEDLINE (Ovid)syntax
Hand-searching of fivejournals from 1995and 1997; quasi-goldstandard of systematicreviews – 110 records
Internal validation:compared performancein the ‘real-world’search interface usingquasi-gold standard
Sensitivity/recall,precision
Wilczynski200515
Four DTA study filters,two developed (mostsensitive, mostspecific) and twopublished (mostsensitive and mostspecific)
EMBASE (Ovid) Not specified Not discussed butstrategies reproduced
Hand-searching of55 journals from2000 – 97 records
Internal validation:compared performanceof developed andpublished filtersin retrieving‘methodologicallysound’ diagnosticstudies
Sensitivity/recall,precision, specificity,accuracy, confidenceintervals for differencesbetween developedand published filtersreported
DOR, diagnostic odds ratio; NHS EED, NHS Economic Evaluation Database.Reproduced with permission from Harbour et al.46 © 2014 The authors. Health Information and Libraries Journal © 2014 Health Libraries Journal. Health Information & Libraries Journal, 31,pp. 176–194.
DOI:10.3310/hta21690
HEA
LTHTECH
NOLO
GYASSESSM
ENT2017
VOL.21
NO.69
©Queen
’sPrinter
andController
ofHMSO
2017.This
work
was
producedby
Lefebvreet
al.under
theterm
sof
acom
missioning
contractissued
bythe
Secretaryof
Statefor
Health.
Thisissue
may
befreely
reproducedfor
thepurposes
ofprivate
researchand
studyand
extracts(or
indeed,the
fullreport)may
beincluded
inprofessionaljournals
providedthat
suitableacknow
ledgement
ismade
andthe
reproductionisnot
associatedwith
anyform
ofadvertising.
Applications
forcom
mercialreproduction
shouldbe
addressedto:
NIHRJournals
Library,NationalInstitute
forHealth
Research,Evaluation,
Trialsand
StudiesCoordinating
Centre,
Alpha
House,
University
ofSoutham
ptonScience
Park,Southam
ptonSO
167N
S,UK.
33
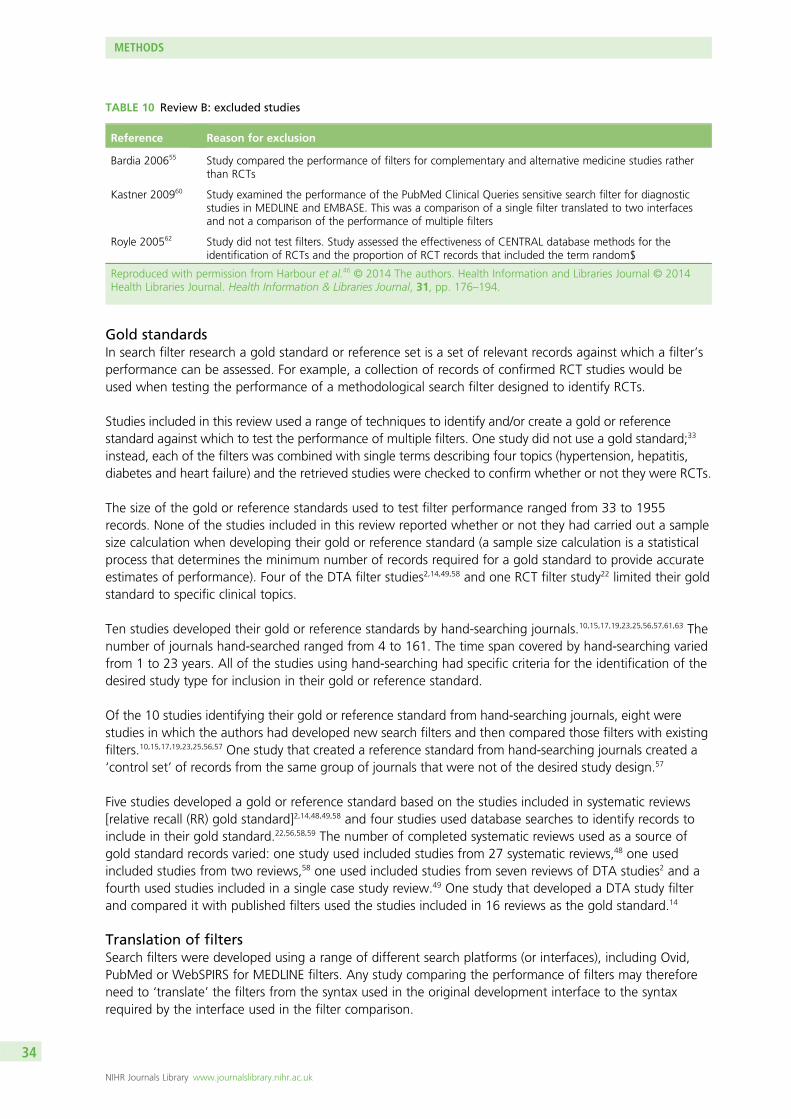
Gold standardsIn search filter research a gold standard or reference set is a set of relevant records against which a filter’sperformance can be assessed. For example, a collection of records of confirmed RCT studies would beused when testing the performance of a methodological search filter designed to identify RCTs.
Studies included in this review used a range of techniques to identify and/or create a gold or referencestandard against which to test the performance of multiple filters. One study did not use a gold standard;33
instead, each of the filters was combined with single terms describing four topics (hypertension, hepatitis,diabetes and heart failure) and the retrieved studies were checked to confirm whether or not they were RCTs.
The size of the gold or reference standards used to test filter performance ranged from 33 to 1955records. None of the studies included in this review reported whether or not they had carried out a samplesize calculation when developing their gold or reference standard (a sample size calculation is a statisticalprocess that determines the minimum number of records required for a gold standard to provide accurateestimates of performance). Four of the DTA filter studies2,14,49,58 and one RCT filter study22 limited their goldstandard to specific clinical topics.
Ten studies developed their gold or reference standards by hand-searching journals.10,15,17,19,23,25,56,57,61,63 Thenumber of journals hand-searched ranged from 4 to 161. The time span covered by hand-searching variedfrom 1 to 23 years. All of the studies using hand-searching had specific criteria for the identification of thedesired study type for inclusion in their gold or reference standard.
Of the 10 studies identifying their gold or reference standard from hand-searching journals, eight werestudies in which the authors had developed new search filters and then compared those filters with existingfilters.10,15,17,19,23,25,56,57 One study that created a reference standard from hand-searching journals created a‘control set’ of records from the same group of journals that were not of the desired study design.57
Five studies developed a gold or reference standard based on the studies included in systematic reviews[relative recall (RR) gold standard]2,14,48,49,58 and four studies used database searches to identify records toinclude in their gold standard.22,56,58,59 The number of completed systematic reviews used as a source ofgold standard records varied: one study used included studies from 27 systematic reviews,48 one usedincluded studies from two reviews,58 one used included studies from seven reviews of DTA studies2 and afourth used studies included in a single case study review.49 One study that developed a DTA study filterand compared it with published filters used the studies included in 16 reviews as the gold standard.14
Translation of filtersSearch filters were developed using a range of different search platforms (or interfaces), including Ovid,PubMed or WebSPIRS for MEDLINE filters. Any study comparing the performance of filters may thereforeneed to ‘translate’ the filters from the syntax used in the original development interface to the syntaxrequired by the interface used in the filter comparison.
TABLE 10 Review B: excluded studies
Reference Reason for exclusion
Bardia 200655 Study compared the performance of filters for complementary and alternative medicine studies ratherthan RCTs
Kastner 200960 Study examined the performance of the PubMed Clinical Queries sensitive search filter for diagnosticstudies in MEDLINE and EMBASE. This was a comparison of a single filter translated to two interfacesand not a comparison of the performance of multiple filters
Royle 200562 Study did not test filters. Study assessed the effectiveness of CENTRAL database methods for theidentification of RCTs and the proportion of RCT records that included the term random$
Reproduced with permission from Harbour et al.46 © 2014 The authors. Health Information and Libraries Journal © 2014Health Libraries Journal. Health Information & Libraries Journal, 31, pp. 176–194.
METHODS
NIHR Journals Library www.journalslibrary.nihr.ac.uk
34

Four of the studies included in this review did not translate or adapt the filters that were beingcompared because the filters had been developed in the same interface as was used in the performancecomparison.25,33,56,63 When one or more filter required translation, most of the studies comparing theperformance of existing filters reported the complete details of the changes made so that the accuracy ofthe translation could be verified.2,48,58,59,61 In contrast, most of the studies reporting the development ofnew filters that included a comparison with existing filters did not mention the requirement to translateany of the filters or provide details of the translation, so it is unclear if valid comparisons were beingmade.10,17,22,23,57 The review of economic evaluation filters applied an exclusion strategy (animal studies andpublication types such as letters and editorials, which are unlikely to be economic evaluations) to filtersbeing tested in MEDLINE and EMBASE.59
Methods of testingFour of the filter studies that used included studies from systematic reviews as their gold or referencestandard replicated the original searches when possible with the addition of the filters being tested.2,48,49,58
None of the original searches incorporated a study method search filter.2,48,49,58 A fifth study usingreferences from systematic reviews as a reference standard combined the filters with ‘terms for deep veinthrombosis’ but did not specify what these terms were or if the original search strategy was used.14
The performance analyses carried out by Leeflang et al.48 and Ritchie et al.49 occurred after the originalreviews (on which the gold or reference standard was based) had been undertaken and thereforeattempted to recreate a ‘historical’ search. Ritchie et al.49 noted a small discrepancy in the number ofrecords retrieved between the original searches and the rerun searches, whereas Leeflang et al.,48 whocould replicate only 6 out of 27 reviews, did not provide details of any differences in the numbers ofretrieved records. Using the complete reference standard from the original reviews, Leeflang et al.48 testedwhether those studies were captured by the filters being compared.
Two studies did not provide any information about whether the performance analysis had beenundertaken concurrently with the reviews or at a later date.14,58 The review by Whiting et al.,2 which waspublished online in 2010 and to which we had prepublication access at the time of our study, recreatedthe original subject search and compared using the subject search alone with using the subject searchcombined with 22 other filters.
Four studies by the McMaster Hedges team at McMaster University used their internally developed databasefor testing filters, with the DTA, RCT and systematic review subsets acting as gold standards.17,23,61,63 One ofthese studies did not undertake any new analysis but collated the results from previous publications thathad used a common gold standard.63
The economic filters study identified a gold standard by searching the NHS Economic Evaluation Database(NHS EED).59 Published MEDLINE and EMBASE economic filters were then tested for their ability to retrievethese gold standard records from MEDLINE and EMBASE. Corrao et al.33 had no gold standard butmanually checked whether the records retrieved after applying the filters were RCT studies.
Studies that compared new search filters with existing filters can be divided into two groups based on thetype of gold standard used to compare filter performance. One group used a reference standard that hadnot been used to develop the new filter strategy so that all of the filters in the comparison underwentexternal validation.10,17,22,23,57 In other words, the performance of all of the filters being compared wastested in a set of records that had not been used to develop any of the included filters. The other group ofstudies used the same reference standard that had been used in the development of the new filters, sothat, although the new filters underwent only internal validation (filter performance was tested only on theone set of records that had also been used to develop the new filters), the comparison filters underwentexternal validation.14,15,19,25,56 The methodology used in the latter group risks introducing bias in favour ofthe new filters.
DOI: 10.3310/hta21690 HEALTH TECHNOLOGY ASSESSMENT 2017 VOL. 21 NO. 69
© Queen’s Printer and Controller of HMSO 2017. This work was produced by Lefebvre et al. under the terms of a commissioning contract issued by the Secretary of State forHealth. This issue may be freely reproduced for the purposes of private research and study and extracts (or indeed, the full report) may be included in professional journalsprovided that suitable acknowledgement is made and the reproduction is not associated with any form of advertising. Applications for commercial reproduction should beaddressed to: NIHR Journals Library, National Institute for Health Research, Evaluation, Trials and Studies Coordinating Centre, Alpha House, University of Southampton SciencePark, Southampton SO16 7NS, UK.
35
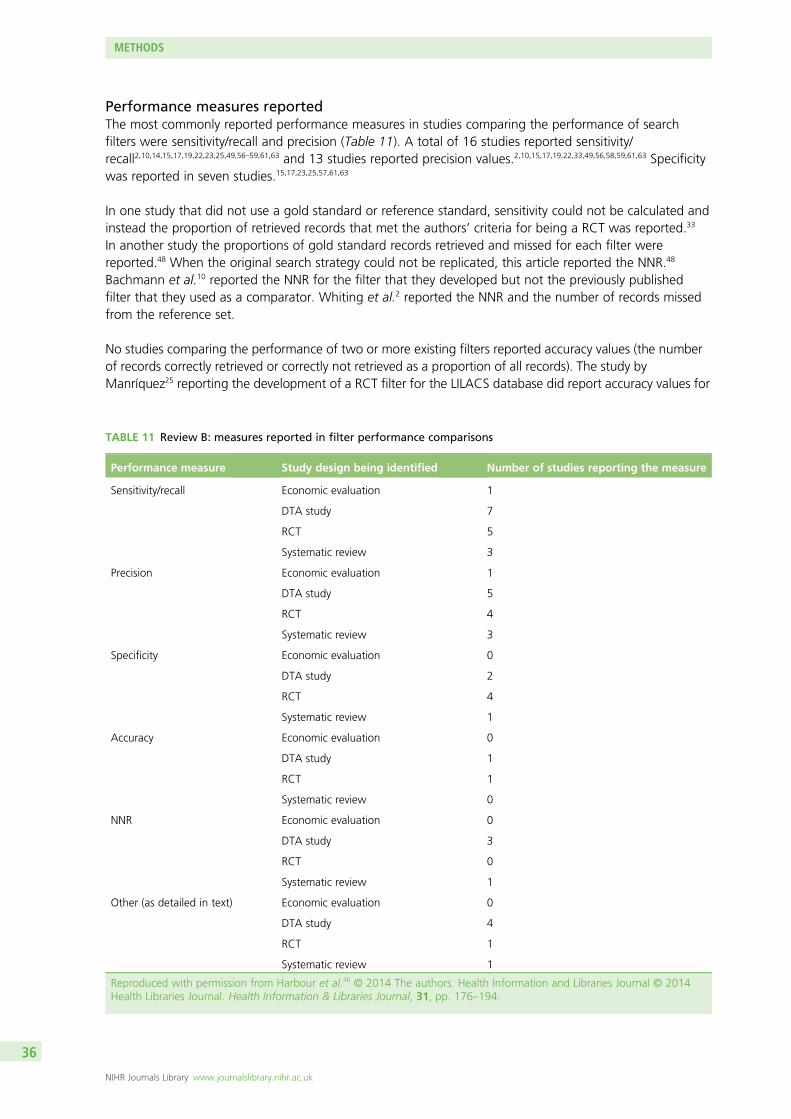
Performance measures reportedThe most commonly reported performance measures in studies comparing the performance of searchfilters were sensitivity/recall and precision (Table 11). A total of 16 studies reported sensitivity/recall2,10,14,15,17,19,22,23,25,49,56–59,61,63 and 13 studies reported precision values.2,10,15,17,19,22,33,49,56,58,59,61,63 Specificitywas reported in seven studies.15,17,23,25,57,61,63
In one study that did not use a gold standard or reference standard, sensitivity could not be calculated andinstead the proportion of retrieved records that met the authors’ criteria for being a RCT was reported.33
In another study the proportions of gold standard records retrieved and missed for each filter werereported.48 When the original search strategy could not be replicated, this article reported the NNR.48
Bachmann et al.10 reported the NNR for the filter that they developed but not the previously publishedfilter that they used as a comparator. Whiting et al.2 reported the NNR and the number of records missedfrom the reference set.
No studies comparing the performance of two or more existing filters reported accuracy values (the numberof records correctly retrieved or correctly not retrieved as a proportion of all records). The study byManríquez25 reporting the development of a RCT filter for the LILACS database did report accuracy values for
TABLE 11 Review B: measures reported in filter performance comparisons
Performance measure Study design being identified Number of studies reporting the measure
Sensitivity/recall Economic evaluation 1
DTA study 7
RCT 5
Systematic review 3
Precision Economic evaluation 1
DTA study 5
RCT 4
Systematic review 3
Specificity Economic evaluation 0
DTA study 2
RCT 4
Systematic review 1
Accuracy Economic evaluation 0
DTA study 1
RCT 1
Systematic review 0
NNR Economic evaluation 0
DTA study 3
RCT 0
Systematic review 1
Other (as detailed in text) Economic evaluation 0
DTA study 4
RCT 1
Systematic review 1
Reproduced with permission from Harbour et al.46 © 2014 The authors. Health Information and Libraries Journal © 2014Health Libraries Journal. Health Information & Libraries Journal, 31, pp. 176–194.
METHODS
NIHR Journals Library www.journalslibrary.nihr.ac.uk
36
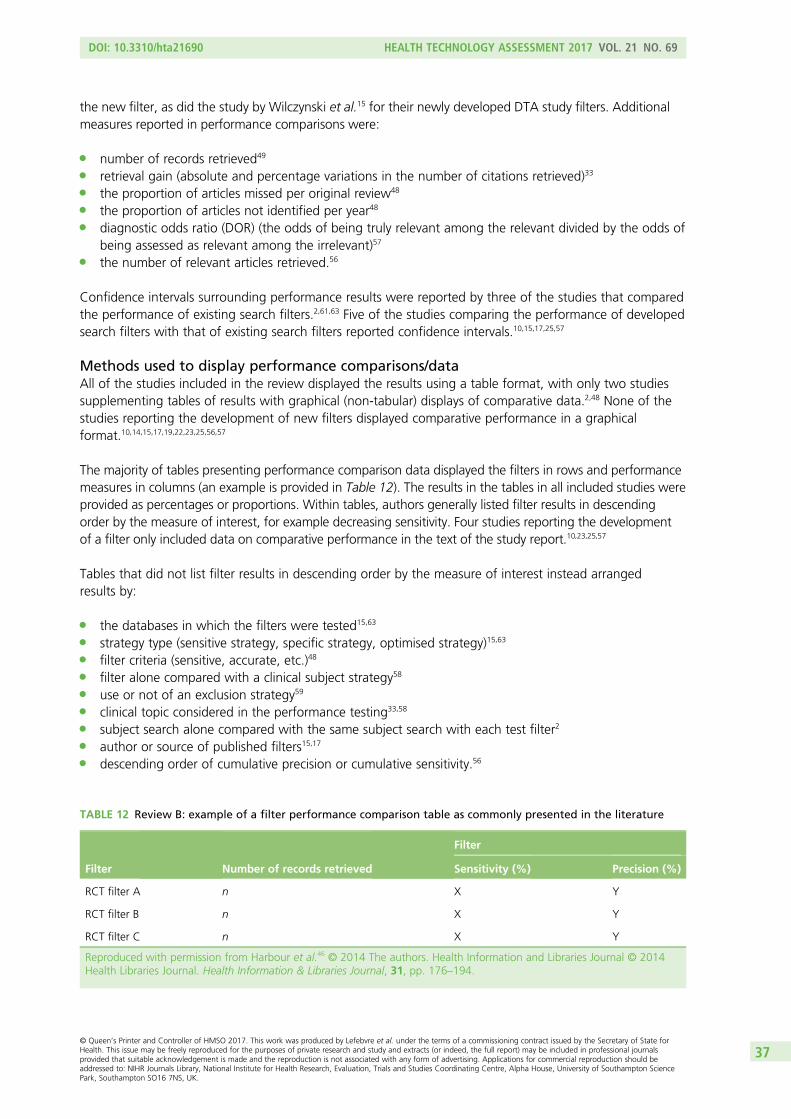
the new filter, as did the study by Wilczynski et al.15 for their newly developed DTA study filters. Additionalmeasures reported in performance comparisons were:
l number of records retrieved49
l retrieval gain (absolute and percentage variations in the number of citations retrieved)33
l the proportion of articles missed per original review48
l the proportion of articles not identified per year48
l diagnostic odds ratio (DOR) (the odds of being truly relevant among the relevant divided by the odds ofbeing assessed as relevant among the irrelevant)57
l the number of relevant articles retrieved.56
Confidence intervals surrounding performance results were reported by three of the studies that comparedthe performance of existing search filters.2,61,63 Five of the studies comparing the performance of developedsearch filters with that of existing search filters reported confidence intervals.10,15,17,25,57
Methods used to display performance comparisons/dataAll of the studies included in the review displayed the results using a table format, with only two studiessupplementing tables of results with graphical (non-tabular) displays of comparative data.2,48 None of thestudies reporting the development of new filters displayed comparative performance in a graphicalformat.10,14,15,17,19,22,23,25,56,57
The majority of tables presenting performance comparison data displayed the filters in rows and performancemeasures in columns (an example is provided in Table 12). The results in the tables in all included studies wereprovided as percentages or proportions. Within tables, authors generally listed filter results in descendingorder by the measure of interest, for example decreasing sensitivity. Four studies reporting the developmentof a filter only included data on comparative performance in the text of the study report.10,23,25,57
Tables that did not list filter results in descending order by the measure of interest instead arrangedresults by:
l the databases in which the filters were tested15,63
l strategy type (sensitive strategy, specific strategy, optimised strategy)15,63
l filter criteria (sensitive, accurate, etc.)48
l filter alone compared with a clinical subject strategy58
l use or not of an exclusion strategy59
l clinical topic considered in the performance testing33,58
l subject search alone compared with the same subject search with each test filter2
l author or source of published filters15,17
l descending order of cumulative precision or cumulative sensitivity.56
TABLE 12 Review B: example of a filter performance comparison table as commonly presented in the literature
Filter Number of records retrieved
Filter
Sensitivity (%) Precision (%)
RCT filter A n X Y
RCT filter B n X Y
RCT filter C n X Y
Reproduced with permission from Harbour et al.46 © 2014 The authors. Health Information and Libraries Journal © 2014Health Libraries Journal. Health Information & Libraries Journal, 31, pp. 176–194.
DOI: 10.3310/hta21690 HEALTH TECHNOLOGY ASSESSMENT 2017 VOL. 21 NO. 69
© Queen’s Printer and Controller of HMSO 2017. This work was produced by Lefebvre et al. under the terms of a commissioning contract issued by the Secretary of State forHealth. This issue may be freely reproduced for the purposes of private research and study and extracts (or indeed, the full report) may be included in professional journalsprovided that suitable acknowledgement is made and the reproduction is not associated with any form of advertising. Applications for commercial reproduction should beaddressed to: NIHR Journals Library, National Institute for Health Research, Evaluation, Trials and Studies Coordinating Centre, Alpha House, University of Southampton SciencePark, Southampton SO16 7NS, UK.
37
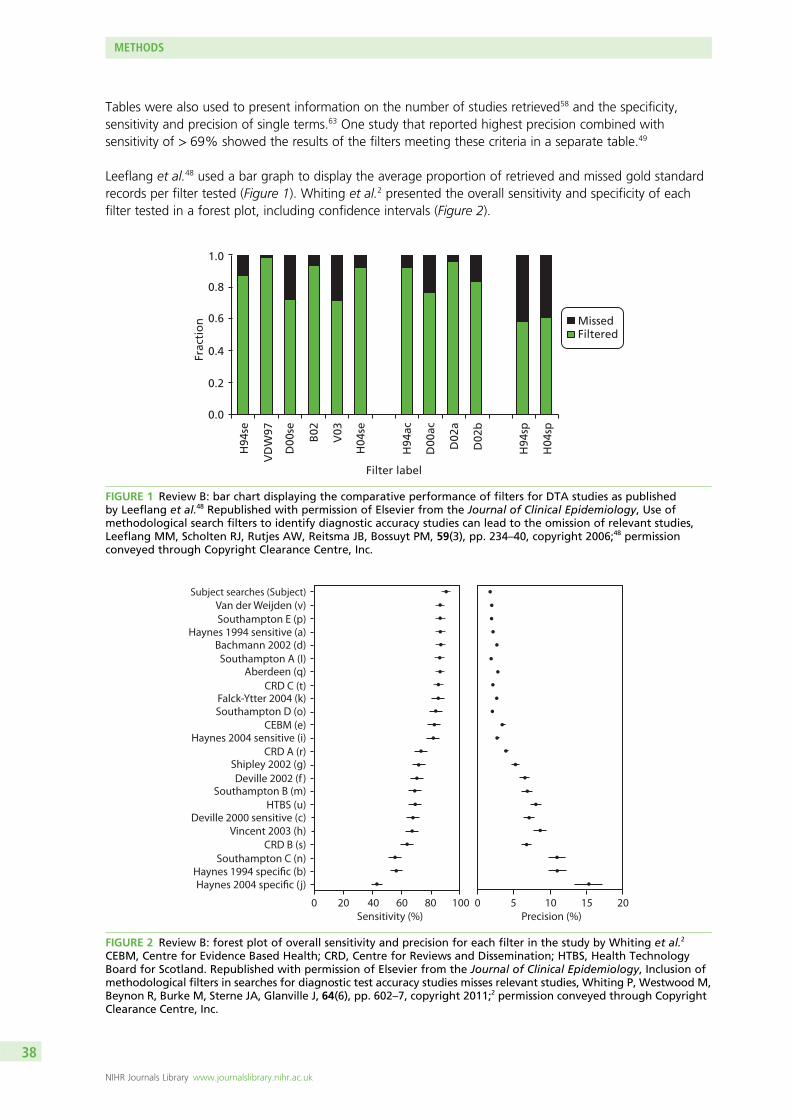
Tables were also used to present information on the number of studies retrieved58 and the specificity,sensitivity and precision of single terms.63 One study that reported highest precision combined withsensitivity of > 69% showed the results of the filters meeting these criteria in a separate table.49
Leeflang et al.48 used a bar graph to display the average proportion of retrieved and missed gold standardrecords per filter tested (Figure 1). Whiting et al.2 presented the overall sensitivity and specificity of eachfilter tested in a forest plot, including confidence intervals (Figure 2).
1.0
0.8
0.6
0.4
0.2
0.0
Frac
tio
n
Filter label
H94
se
VD
W97
D00
se
B02
H04
se
H94
ac
D00
ac
D02
a
D02
b
H94
sp
H04
sp
V03
MissedFiltered
FIGURE 1 Review B: bar chart displaying the comparative performance of filters for DTA studies as publishedby Leeflang et al.48 Republished with permission of Elsevier from the Journal of Clinical Epidemiology, Use ofmethodological search filters to identify diagnostic accuracy studies can lead to the omission of relevant studies,Leeflang MM, Scholten RJ, Rutjes AW, Reitsma JB, Bossuyt PM, 59(3), pp. 234–40, copyright 2006;48 permissionconveyed through Copyright Clearance Centre, Inc.
Subject searches (Subject)
Van der Weijden (v)
Southampton E (p)Haynes 1994 sensitive (a)
Bachmann 2002 (d)
Southampton A (I)Aberdeen (q)
CRD C (t)Falck-Ytter 2004 (k)Southampton D (o)
CEBM (e)Haynes 2004 sensitive (i)
CRD A (r)Shipley 2002 (g)
Deville 2002 (f )Southampton B (m)
HTBS (u)Deville 2000 sensitive (c)
Vincent 2003 (h)
CRD B (s)
Southampton C (n)Haynes 1994 specific (b)Haynes 2004 specific (j)
0 20 40 60 80 100Sensitivity (%)
0 5 10 15 20Precision (%)
FIGURE 2 Review B: forest plot of overall sensitivity and precision for each filter in the study by Whiting et al.2
CEBM, Centre for Evidence Based Health; CRD, Centre for Reviews and Dissemination; HTBS, Health TechnologyBoard for Scotland. Republished with permission of Elsevier from the Journal of Clinical Epidemiology, Inclusion ofmethodological filters in searches for diagnostic test accuracy studies misses relevant studies, Whiting P, Westwood M,Beynon R, Burke M, Sterne JA, Glanville J, 64(6), pp. 602–7, copyright 2011;2 permission conveyed through CopyrightClearance Centre, Inc.
METHODS
NIHR Journals Library www.journalslibrary.nihr.ac.uk
38
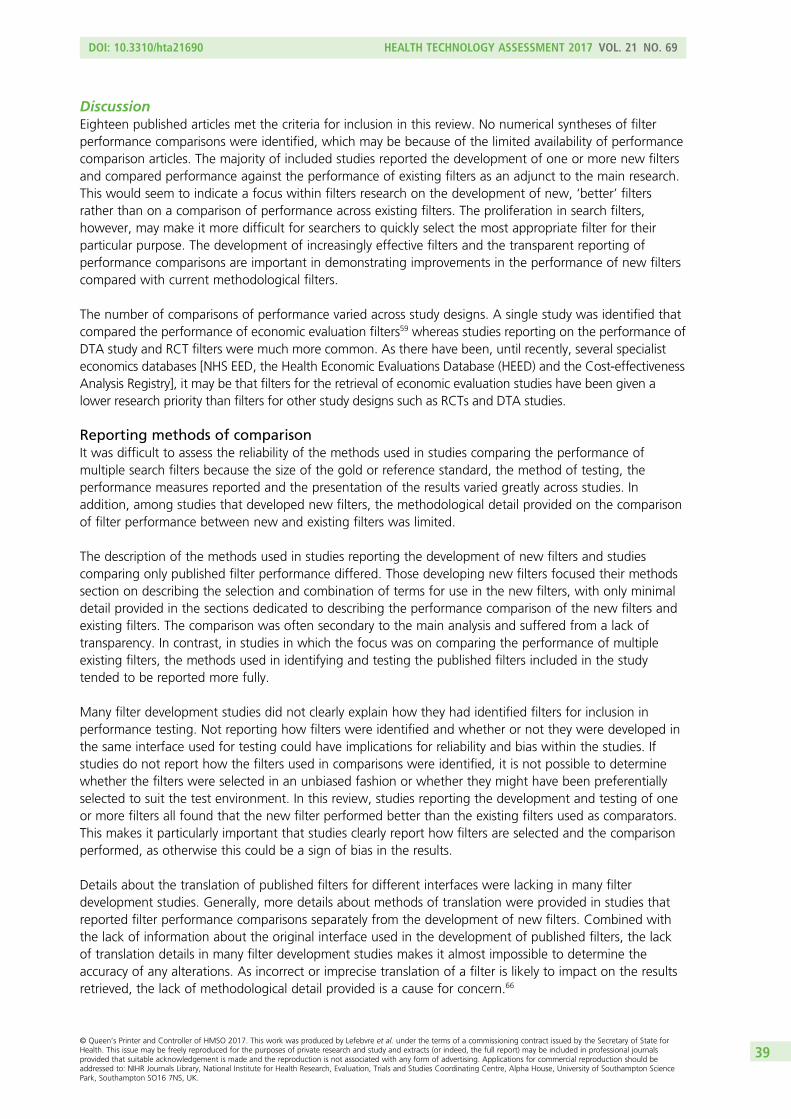
DiscussionEighteen published articles met the criteria for inclusion in this review. No numerical syntheses of filterperformance comparisons were identified, which may be because of the limited availability of performancecomparison articles. The majority of included studies reported the development of one or more new filtersand compared performance against the performance of existing filters as an adjunct to the main research.This would seem to indicate a focus within filters research on the development of new, ‘better’ filtersrather than on a comparison of performance across existing filters. The proliferation in search filters,however, may make it more difficult for searchers to quickly select the most appropriate filter for theirparticular purpose. The development of increasingly effective filters and the transparent reporting ofperformance comparisons are important in demonstrating improvements in the performance of new filterscompared with current methodological filters.
The number of comparisons of performance varied across study designs. A single study was identified thatcompared the performance of economic evaluation filters59 whereas studies reporting on the performance ofDTA study and RCT filters were much more common. As there have been, until recently, several specialisteconomics databases [NHS EED, the Health Economic Evaluations Database (HEED) and the Cost-effectivenessAnalysis Registry], it may be that filters for the retrieval of economic evaluation studies have been given alower research priority than filters for other study designs such as RCTs and DTA studies.
Reporting methods of comparisonIt was difficult to assess the reliability of the methods used in studies comparing the performance ofmultiple search filters because the size of the gold or reference standard, the method of testing, theperformance measures reported and the presentation of the results varied greatly across studies. Inaddition, among studies that developed new filters, the methodological detail provided on the comparisonof filter performance between new and existing filters was limited.
The description of the methods used in studies reporting the development of new filters and studiescomparing only published filter performance differed. Those developing new filters focused their methodssection on describing the selection and combination of terms for use in the new filters, with only minimaldetail provided in the sections dedicated to describing the performance comparison of the new filters andexisting filters. The comparison was often secondary to the main analysis and suffered from a lack oftransparency. In contrast, in studies in which the focus was on comparing the performance of multipleexisting filters, the methods used in identifying and testing the published filters included in the studytended to be reported more fully.
Many filter development studies did not clearly explain how they had identified filters for inclusion inperformance testing. Not reporting how filters were identified and whether or not they were developed inthe same interface used for testing could have implications for reliability and bias within the studies. Ifstudies do not report how the filters used in comparisons were identified, it is not possible to determinewhether the filters were selected in an unbiased fashion or whether they might have been preferentiallyselected to suit the test environment. In this review, studies reporting the development and testing of oneor more filters all found that the new filter performed better than the existing filters used as comparators.This makes it particularly important that studies clearly report how filters are selected and the comparisonperformed, as otherwise this could be a sign of bias in the results.
Details about the translation of published filters for different interfaces were lacking in many filterdevelopment studies. Generally, more details about methods of translation were provided in studies thatreported filter performance comparisons separately from the development of new filters. Combined withthe lack of information about the original interface used in the development of published filters, the lackof translation details in many filter development studies makes it almost impossible to determine theaccuracy of any alterations. As incorrect or imprecise translation of a filter is likely to impact on the resultsretrieved, the lack of methodological detail provided is a cause for concern.66
DOI: 10.3310/hta21690 HEALTH TECHNOLOGY ASSESSMENT 2017 VOL. 21 NO. 69
© Queen’s Printer and Controller of HMSO 2017. This work was produced by Lefebvre et al. under the terms of a commissioning contract issued by the Secretary of State forHealth. This issue may be freely reproduced for the purposes of private research and study and extracts (or indeed, the full report) may be included in professional journalsprovided that suitable acknowledgement is made and the reproduction is not associated with any form of advertising. Applications for commercial reproduction should beaddressed to: NIHR Journals Library, National Institute for Health Research, Evaluation, Trials and Studies Coordinating Centre, Alpha House, University of Southampton SciencePark, Southampton SO16 7NS, UK.
39
Almost all of the included studies used a gold or reference standard to test the comparative performanceof developed and existing filters. This would seem to indicate that using a gold or reference standard totest and compare filter performance is widely accepted in the filter research community. The size of thegold or reference standard used, however, varied widely, from tens to thousands of records. It is possiblethat the size and content of the gold standard may have an impact on the performance measures recordedfor a specific filter, and so it would be helpful if researchers could justify their choice, by, for example,reporting a sample size calculation.
Some of the studies included in the review used a single gold or reference standard for both developing anew filter and comparing the new filter with published filters. This could potentially introduce performancebias in favour of the new filter as the new filter undergoes only internal validation whereas the comparatorfilters undergo external validation. In other words, the new filter is tested only against the set of recordsfrom which it was developed, whereas the comparator filters are tested against a set of records that aredifferent from the gold or reference standards that were used to develop them. When a filter is testedagainst the same set of records from which it was developed, it is likely that the filter will perform betterthan it might in a different sample of records.
Reporting performance measuresSensitivity and precision appear to be considered the most useful measures of filter performance as theyare the most commonly reported measures in the literature. As the same performance measures werereported in studies developing new search filters and studies reporting the comparative performance ofexisting filters, this is one area of methodological consistency between the two types of performancecomparison study included in this review.
There is a suggestion, from the small number of studies included in this review, that there are somemeasures that are preferentially reported for DTA study filters, for example the NNR. Similarly to the metric‘number needed to treat’ (NNT), the NNR reflects the number of retrieved records that need to be assessedto identify a relevant study. By reporting the NNR, studies seek to make it easier for searchers to determinehow effective a filter will be in reducing the number of irrelevant records retrieved and therefore therelative reduction in time needed to identify relevant studies for inclusion or full-text retrieval.
The method used to present the results of filter performance comparisons was limited to tables, with onlytwo studies presenting data graphically, perhaps reflecting the difficulties in presenting filter performancecomparisons visually. Many of these tables were long and complicated, making interpretation of the resultsand the selection of an appropriate filter challenging. In most cases it would not be easy to identify themost suitable filter without reading several studies, including tables, in detail. A lack of time and searchfilter expertise potentially compounds the problem of selecting an appropriate filter based on performancedata as they are currently reported in the literature.
Of the two graphics used in the included studies to present results, a design similar to a forest plot(see Figure 2) may prove attractive to searchers as it is a familiar format used in systematic reviews andmeta-analyses. This design may also make it easier to identify visually the most precise, most sensitiveand best-balanced filter. A further exploration of methods for graphically presenting filter performancecomparisons would be useful for both researchers involved in filter performance research and searchersneeding to identify a suitable filter for their project.
Limitations of this reviewThere are a number of potential limitations to this review. It was not possible to undertake a full systematicreview because of time constraints. It was also not possible to review all filters for all study methods. Thereview was, however, focused on study types that were felt to be the key study designs of current interestin evidence-based health research (namely RCTs, DTA studies, systematic reviews or economic evaluationstudies). Finally, research carried out on the performance of multiple search filters that has not yet beenpublished or has been presented only at conferences was excluded from the review, possibly resulting in
METHODS
NIHR Journals Library www.journalslibrary.nihr.ac.uk
40
some alternative formats for the presentation of results being missed. Conference abstracts, however,would be likely to report even fewer methodological details than full articles included in this review.
Key findings
l The main measures of search filter performance reported in the literature are sensitivity/recall, precisionand specificity.
l Filter performance comparison studies most commonly report highest sensitivity, highest precision andoptimal/balanced filter strategies.
l Articles reporting the development of new search filters and a comparison with existing filters providelimited methodological details.
l Tables are the most frequently used method for reporting the results of filter performance comparisonsbut graphs may be more useful.
RecommendationsThe following recommendations for the presentation of filter performance comparisons are made based onthe results of this review.
l Studies that compare search filter performance should explicitly report the methods and results to helpsearchers identify the most appropriate filter for their particular purpose.
l Studies presenting the development of new search filters that include comparisons with existing filtersshould present detailed methods describing how the performance comparisons were undertaken.
l One or more gold or reference standards should be used for testing filter performance.l Search filters should be validated on gold or reference standards that are different from those from
which they were developed.l The size of the gold or reference standard(s) should be clearly stated and a sample size calculation
presented to justify the size of the standard(s).l Any translation of filters should be specifically reported in all articles in which a filter has been used in a
different interface from that in which it was developed.l Results should be presented systematically, identifying clearly the best-performing filter for specific
purposes (sensitive strategy, specific strategy, balanced strategy).l When tables of performance results are provided, a consistent format and order should be used to
make the information easy to extract.
Measuring performance in diagnostic test accuracy studies (review C)
IntroductionPerformance measurement of search filters can be seen as analogous to DTA in that DTA studies aimto reliably differentiate those with a specific disease (relevant studies for searchers) from those who donot have the disease (irrelevant studies for searchers). They also aim to be as accurate as possible indistinguishing cases of disease from cases of non-disease, by minimising false positives (positive results forthose who do not have the disease) and false negatives (missing cases of people with a disease). Similarly,search filters aim to identify all relevant studies (true positives) while aiming to minimise the retrieval ofirrelevant studies (false positives).
This review explores published guidance and recommendations that inform best practice in themeasurement and reporting of DTA and assesses their applicability to the area of search filter performance.
Objectives
l To identify recommended methods for conducting DTA studies and evaluating test performance.l To identify the diagnostic test performance measurements that have been reported and presented.
DOI: 10.3310/hta21690 HEALTH TECHNOLOGY ASSESSMENT 2017 VOL. 21 NO. 69
© Queen’s Printer and Controller of HMSO 2017. This work was produced by Lefebvre et al. under the terms of a commissioning contract issued by the Secretary of State forHealth. This issue may be freely reproduced for the purposes of private research and study and extracts (or indeed, the full report) may be included in professional journalsprovided that suitable acknowledgement is made and the reproduction is not associated with any form of advertising. Applications for commercial reproduction should beaddressed to: NIHR Journals Library, National Institute for Health Research, Evaluation, Trials and Studies Coordinating Centre, Alpha House, University of Southampton SciencePark, Southampton SO16 7NS, UK.
41
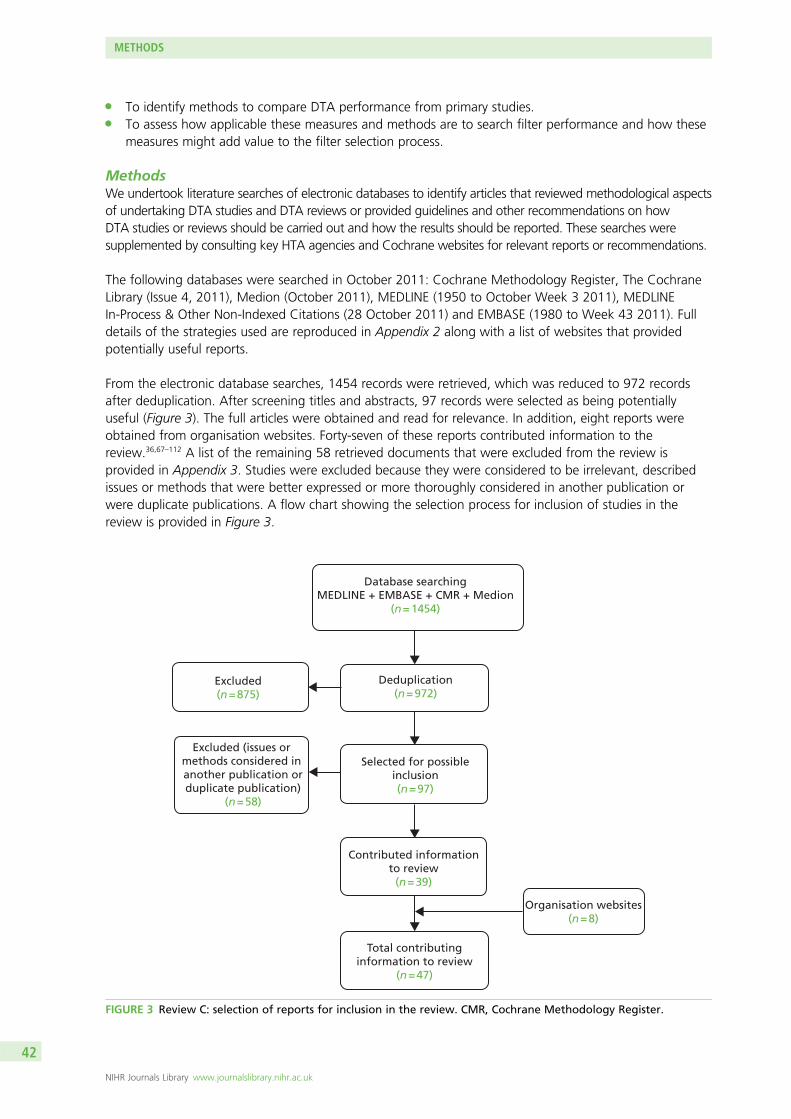
l To identify methods to compare DTA performance from primary studies.l To assess how applicable these measures and methods are to search filter performance and how these
measures might add value to the filter selection process.
MethodsWe undertook literature searches of electronic databases to identify articles that reviewed methodological aspectsof undertaking DTA studies and DTA reviews or provided guidelines and other recommendations on howDTA studies or reviews should be carried out and how the results should be reported. These searches weresupplemented by consulting key HTA agencies and Cochrane websites for relevant reports or recommendations.
The following databases were searched in October 2011: Cochrane Methodology Register, The CochraneLibrary (Issue 4, 2011), Medion (October 2011), MEDLINE (1950 to October Week 3 2011), MEDLINEIn-Process & Other Non-Indexed Citations (28 October 2011) and EMBASE (1980 to Week 43 2011). Fulldetails of the strategies used are reproduced in Appendix 2 along with a list of websites that providedpotentially useful reports.
From the electronic database searches, 1454 records were retrieved, which was reduced to 972 recordsafter deduplication. After screening titles and abstracts, 97 records were selected as being potentiallyuseful (Figure 3). The full articles were obtained and read for relevance. In addition, eight reports wereobtained from organisation websites. Forty-seven of these reports contributed information to thereview.36,67–112 A list of the remaining 58 retrieved documents that were excluded from the review isprovided in Appendix 3. Studies were excluded because they were considered to be irrelevant, describedissues or methods that were better expressed or more thoroughly considered in another publication orwere duplicate publications. A flow chart showing the selection process for inclusion of studies in thereview is provided in Figure 3.
Database searchingMEDLINE + EMBASE + CMR + Medion
(n = 1454)
Excluded(n = 875)
Deduplication(n = 972)
Selected for possibleinclusion(n = 97)
Contributed informationto review
(n = 39)
Organisation websites(n = 8)
Total contributinginformation to review
(n = 47)
Excluded (issues or methods considered in another publication orduplicate publication)
(n = 58)
FIGURE 3 Review C: selection of reports for inclusion in the review. CMR, Cochrane Methodology Register.
METHODS
NIHR Journals Library www.journalslibrary.nihr.ac.uk
42
We acknowledge that there has been a regrettable delay between carrying out the project, including thesearches, and the publication of this report, because of serious illness of the principal investigator. Thesearches were carried out in 2010/11.
Results for diagnostic test accuracy studies
Conducting diagnostic test accuracy studiesDiagnostic test accuracy measures the ability of the diagnostic test being evaluated, the index test, todistinguish between patients with and patients without the targeted disease or condition.67 The results areverified against the results of a reference standard in the same group of patients. The reference standard isindependent of the index test and is usually the best available method to identify patients with the targetcondition.68,69 When a comparator test is also under evaluation, the index and comparator test must beevaluated against the same reference standard and in the same population.69 In the absence of a suitablereference standard a number of alternative methods have been proposed.70–72
Test accuracy is not fixed and can vary between patient subgroups, with disease severity, in differentclinical settings and with different test interpreters.67 Several guidance documents describe how thesevariations in the design and conduct of diagnostic tests can lead to bias, resulting in substantial differencesbeing observed between primary studies.69,73–76 The effects of different types of bias have been estimatedusing empirical data.76–79
As diagnostic tests do perform differently in different populations, the importance of testing in a suitablesample of patients receives much attention in the literature. The patient sample should be representative interms of the disease severity of the target population for whom the test is intended, to avoid spectrumbias (i.e. the variation in the sensitivity and/or specificity of a diagnostic test when applied to people ofdifferent ages, genders, nationalities or specific disease manifestations).69,73,75,80 Ideally, patients should berecruited consecutively or randomly in a single cohort and be unselected by disease state.74 Case–controlstudies are likely to lead to bias because patients with and without the condition are recruited usingdifferent sets of criteria69,73 and because they overestimate diagnostic accuracy.77 Other main sources ofbias relate to the unsuitability of the reference standard, how the reference and index tests have beenundertaken, interpreter blinding and interpretation of the results.79
Uncertainty around estimates of diagnostic accuracy decreases with increasing sample size75 and it isrecommended that sample size calculations should be undertaken during study planning to ensure that areasonably precise estimate of test accuracy can be achieved.81,82 Tables have been published to assist indetermining the minimum sample size required83 for a DTA study once the prevalence of the targetcondition in the population as well as the expected sensitivity have been determined. However, tworeviews of DTA studies found that very few studies gave any consideration to sample size.81,82
The Quality Assessment of Diagnostic Accuracy Studies (QUADAS) tool has been developed to assistresearchers to assess the quality of primary DTA studies84,85 and as such provides a useful guide to theissues that should be addressed when undertaking a DTA study. The questions cover aspects ofmethodology that are thought to make a difference to the reliability of a study, such as the suitability ofthe patient sample and the reproducibility of the reference standard and index test. Poor reporting of DTAstudies, however, can make applying the QUADAS tool difficult.78 Since the searches for this review wereundertaken, a revised version of the QUADAS tool has been published. The QUADAS 2 tool, which isapplied in four phases, will, according to the publishers, allow for a more transparent rating of bias andthe applicability of primary diagnostic accuracy studies than the original QUADAS tool.
DOI: 10.3310/hta21690 HEALTH TECHNOLOGY ASSESSMENT 2017 VOL. 21 NO. 69
© Queen’s Printer and Controller of HMSO 2017. This work was produced by Lefebvre et al. under the terms of a commissioning contract issued by the Secretary of State forHealth. This issue may be freely reproduced for the purposes of private research and study and extracts (or indeed, the full report) may be included in professional journalsprovided that suitable acknowledgement is made and the reproduction is not associated with any form of advertising. Applications for commercial reproduction should beaddressed to: NIHR Journals Library, National Institute for Health Research, Evaluation, Trials and Studies Coordinating Centre, Alpha House, University of Southampton SciencePark, Southampton SO16 7NS, UK.
43
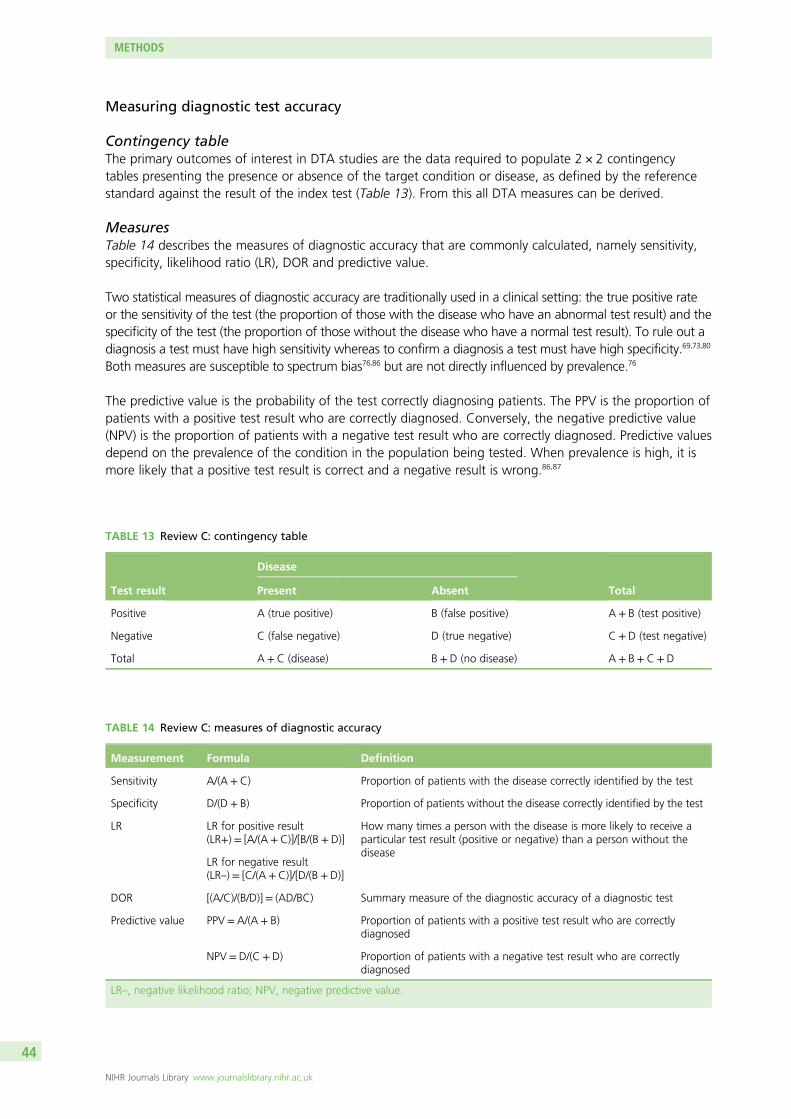
Measuring diagnostic test accuracy
Contingency tableThe primary outcomes of interest in DTA studies are the data required to populate 2 × 2 contingencytables presenting the presence or absence of the target condition or disease, as defined by the referencestandard against the result of the index test (Table 13). From this all DTA measures can be derived.
MeasuresTable 14 describes the measures of diagnostic accuracy that are commonly calculated, namely sensitivity,specificity, likelihood ratio (LR), DOR and predictive value.
Two statistical measures of diagnostic accuracy are traditionally used in a clinical setting: the true positive rateor the sensitivity of the test (the proportion of those with the disease who have an abnormal test result) and thespecificity of the test (the proportion of those without the disease who have a normal test result). To rule out adiagnosis a test must have high sensitivity whereas to confirm a diagnosis a test must have high specificity.69,73,80
Both measures are susceptible to spectrum bias76,86 but are not directly influenced by prevalence.76
The predictive value is the probability of the test correctly diagnosing patients. The PPV is the proportion ofpatients with a positive test result who are correctly diagnosed. Conversely, the negative predictive value(NPV) is the proportion of patients with a negative test result who are correctly diagnosed. Predictive valuesdepend on the prevalence of the condition in the population being tested. When prevalence is high, it ismore likely that a positive test result is correct and a negative result is wrong.86,87
TABLE 13 Review C: contingency table
Test result
Disease
TotalPresent Absent
Positive A (true positive) B (false positive) A + B (test positive)
Negative C (false negative) D (true negative) C + D (test negative)
Total A + C (disease) B+ D (no disease) A + B+ C + D
TABLE 14 Review C: measures of diagnostic accuracy
Measurement Formula Definition
Sensitivity A/(A+ C) Proportion of patients with the disease correctly identified by the test
Specificity D/(D+ B) Proportion of patients without the disease correctly identified by the test
LR LR for positive result(LR+) = [A/(A + C)]/[B/(B + D)]
How many times a person with the disease is more likely to receive aparticular test result (positive or negative) than a person without thedisease
LR for negative result(LR–) = [C/(A + C)]/[D/(B + D)]
DOR [(A/C)/(B/D)] = (AD/BC) Summary measure of the diagnostic accuracy of a diagnostic test
Predictive value PPV= A/(A+ B) Proportion of patients with a positive test result who are correctlydiagnosed
NPV = D/(C+ D) Proportion of patients with a negative test result who are correctlydiagnosed
LR–, negative likelihood ratio; NPV, negative predictive value.
METHODS
NIHR Journals Library www.journalslibrary.nihr.ac.uk
44

Likelihood ratios describe the performance of diagnostic tests and can be useful in a clinical setting. Theratio describes whether or not a test result usefully changes the probability that a condition exists. The LR+is the probability of a person who has the disease testing positive divided by the probability of a personwho does not have the disease testing positive. A LR+ of > 10 and a negative likelihood ratio (LR–) of< 0.1 are judged to provide convincing diagnostic evidence.88 Their interpretation, however, depends onthe clinical context.87
The DOR is a summary measure of the diagnostic accuracy of a diagnostic test. It is calculated as the oddsof positivity among diseased persons divided by the odds of positivity among non-diseased persons. Whena test provides no diagnostic evidence then the DOR is 1.0.89 This measure has a number of limitations. Inparticular, it combines sensitivity and specificity into a single value, hence losing the relative values of thetwo, and is difficult to interpret clinically.87
Sensitivity and specificity are based on binary classification of test results (either positive or negative). Testmeasures, however, are often categorical or continuous and so a cut-off point must be defined to classifyresults as either positive or negative. As the threshold shifts, the sensitivity and specificity of a test willchange, with an increase in one resulting in a decrease in the other. This trade-off at different thresholdscan be presented graphically in a receiver operating characteristic (ROC) curve, describing the relationshipbetween the true-positive value (sensitivity) and the false-positive value (1 – specificity), and can be used toidentify a suitable threshold for clinical practice.69 Figure 4 displays a sample ROC curve of test performanceusing different threshold values from ≥ 5 to > 25.
The Q* value is the point on the ROC curve where sensitivity equals specificity and can be used as a singleindicator of overall test performance when there is no preference for maximising sensitivity (minimisingfalse negatives) or specificity (minimising false positives) but can give misleading results if used to compareperformance between tests.69,90 Overall, diagnostic accuracy is summarised by the area under the curve(AUC) and ranges from 0.5 (very poor test accuracy and equivalent to chance) to 1.0.69,87 The more accuratethe test, the more closely the curve approaches the top left hand corner and has a value close to 1.0.
Whiting et al.87 have undertaken an overview of the various types of graphical presentations that havebeen used in the DTA literature and describe other graphical displays that could be used to present DTAdata. These include dot plots, box-and-whisker plots and flow charts (Figure 5).
≥5>10
>15
>20
>25 Line of symmetry (sensitivity = specificity)
ROC curve for an uninformative test (sensitivity + specificity = 1)
Q*
0.0
0.1
0.2
0.3
0.4
0.5
0.6
0.7
0.8
0.9
1.0
1.00.90.80.70.60.50.40.30.20.10.0Specificity
Sen
siti
vity
FIGURE 4 Review C: example ROC curve.
DOI: 10.3310/hta21690 HEALTH TECHNOLOGY ASSESSMENT 2017 VOL. 21 NO. 69
© Queen’s Printer and Controller of HMSO 2017. This work was produced by Lefebvre et al. under the terms of a commissioning contract issued by the Secretary of State forHealth. This issue may be freely reproduced for the purposes of private research and study and extracts (or indeed, the full report) may be included in professional journalsprovided that suitable acknowledgement is made and the reproduction is not associated with any form of advertising. Applications for commercial reproduction should beaddressed to: NIHR Journals Library, National Institute for Health Research, Evaluation, Trials and Studies Coordinating Centre, Alpha House, University of Southampton SciencePark, Southampton SO16 7NS, UK.
45
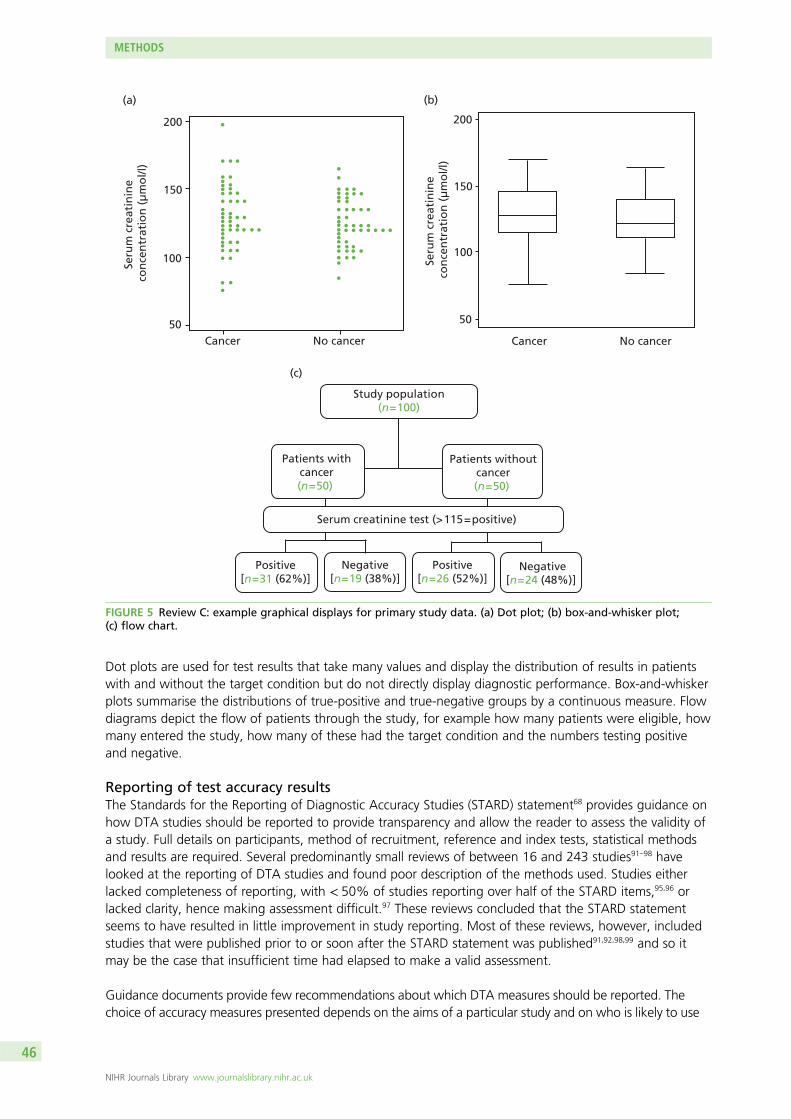
Dot plots are used for test results that take many values and display the distribution of results in patientswith and without the target condition but do not directly display diagnostic performance. Box-and-whiskerplots summarise the distributions of true-positive and true-negative groups by a continuous measure. Flowdiagrams depict the flow of patients through the study, for example how many patients were eligible, howmany entered the study, how many of these had the target condition and the numbers testing positiveand negative.
Reporting of test accuracy resultsThe Standards for the Reporting of Diagnostic Accuracy Studies (STARD) statement68 provides guidance onhow DTA studies should be reported to provide transparency and allow the reader to assess the validity ofa study. Full details on participants, method of recruitment, reference and index tests, statistical methodsand results are required. Several predominantly small reviews of between 16 and 243 studies91–98 havelooked at the reporting of DTA studies and found poor description of the methods used. Studies eitherlacked completeness of reporting, with < 50% of studies reporting over half of the STARD items,95,96 orlacked clarity, hence making assessment difficult.97 These reviews concluded that the STARD statementseems to have resulted in little improvement in study reporting. Most of these reviews, however, includedstudies that were published prior to or soon after the STARD statement was published91,92,98,99 and so itmay be the case that insufficient time had elapsed to make a valid assessment.
Guidance documents provide few recommendations about which DTA measures should be reported. Thechoice of accuracy measures presented depends on the aims of a particular study and on who is likely to use
Cancer No cancer
(a)
Seru
m c
reat
inin
e co
nce
ntr
atio
n (
µm
ol/l
)
200
150
100
50Cancer
(b)
No cancer
200
150
100
50
Seru
m c
reat
inin
e co
nce
ntr
atio
n (
µm
ol/l
)
Study population(n = 100)
Patients withcancer(n = 50)
Patients withoutcancer(n = 50)
Positive[n = 31 (62%)]
Negative[n = 19 (38%)]
Positive[n = 26 (52%)]
Negative[n = 24 (48%)]
Serum creatinine test (>115=positive)
(c)
FIGURE 5 Review C: example graphical displays for primary study data. (a) Dot plot; (b) box-and-whisker plot;(c) flow chart.
METHODS
NIHR Journals Library www.journalslibrary.nihr.ac.uk
46
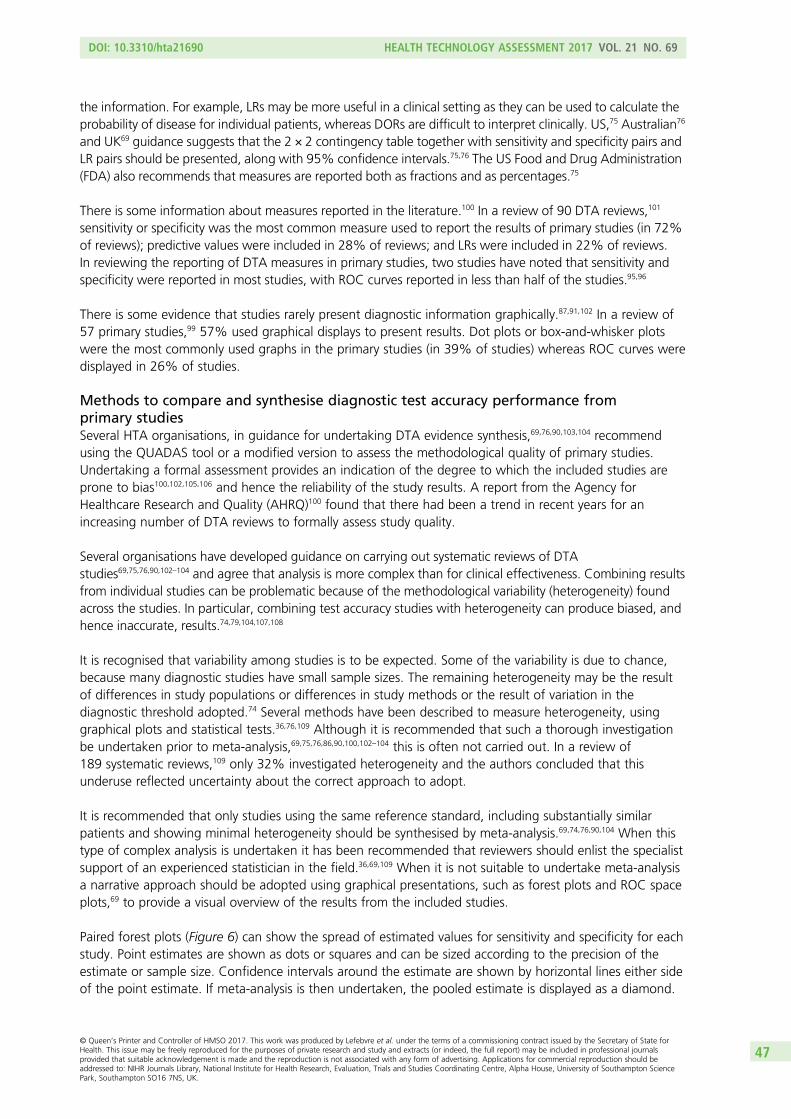
the information. For example, LRs may be more useful in a clinical setting as they can be used to calculate theprobability of disease for individual patients, whereas DORs are difficult to interpret clinically. US,75 Australian76
and UK69 guidance suggests that the 2 × 2 contingency table together with sensitivity and specificity pairs andLR pairs should be presented, along with 95% confidence intervals.75,76 The US Food and Drug Administration(FDA) also recommends that measures are reported both as fractions and as percentages.75
There is some information about measures reported in the literature.100 In a review of 90 DTA reviews,101
sensitivity or specificity was the most common measure used to report the results of primary studies (in 72%of reviews); predictive values were included in 28% of reviews; and LRs were included in 22% of reviews.In reviewing the reporting of DTA measures in primary studies, two studies have noted that sensitivity andspecificity were reported in most studies, with ROC curves reported in less than half of the studies.95,96
There is some evidence that studies rarely present diagnostic information graphically.87,91,102 In a review of57 primary studies,99 57% used graphical displays to present results. Dot plots or box-and-whisker plotswere the most commonly used graphs in the primary studies (in 39% of studies) whereas ROC curves weredisplayed in 26% of studies.
Methods to compare and synthesise diagnostic test accuracy performance fromprimary studiesSeveral HTA organisations, in guidance for undertaking DTA evidence synthesis,69,76,90,103,104 recommendusing the QUADAS tool or a modified version to assess the methodological quality of primary studies.Undertaking a formal assessment provides an indication of the degree to which the included studies areprone to bias100,102,105,106 and hence the reliability of the study results. A report from the Agency forHealthcare Research and Quality (AHRQ)100 found that there had been a trend in recent years for anincreasing number of DTA reviews to formally assess study quality.
Several organisations have developed guidance on carrying out systematic reviews of DTAstudies69,75,76,90,102–104 and agree that analysis is more complex than for clinical effectiveness. Combining resultsfrom individual studies can be problematic because of the methodological variability (heterogeneity) foundacross the studies. In particular, combining test accuracy studies with heterogeneity can produce biased, andhence inaccurate, results.74,79,104,107,108
It is recognised that variability among studies is to be expected. Some of the variability is due to chance,because many diagnostic studies have small sample sizes. The remaining heterogeneity may be the resultof differences in study populations or differences in study methods or the result of variation in thediagnostic threshold adopted.74 Several methods have been described to measure heterogeneity, usinggraphical plots and statistical tests.36,76,109 Although it is recommended that such a thorough investigationbe undertaken prior to meta-analysis,69,75,76,86,90,100,102–104 this is often not carried out. In a review of189 systematic reviews,109 only 32% investigated heterogeneity and the authors concluded that thisunderuse reflected uncertainty about the correct approach to adopt.
It is recommended that only studies using the same reference standard, including substantially similarpatients and showing minimal heterogeneity should be synthesised by meta-analysis.69,74,76,90,104 When thistype of complex analysis is undertaken it has been recommended that reviewers should enlist the specialistsupport of an experienced statistician in the field.36,69,109 When it is not suitable to undertake meta-analysisa narrative approach should be adopted using graphical presentations, such as forest plots and ROC spaceplots,69 to provide a visual overview of the results from the included studies.
Paired forest plots (Figure 6) can show the spread of estimated values for sensitivity and specificity for eachstudy. Point estimates are shown as dots or squares and can be sized according to the precision of theestimate or sample size. Confidence intervals around the estimate are shown by horizontal lines either sideof the point estimate. If meta-analysis is then undertaken, the pooled estimate is displayed as a diamond.
DOI: 10.3310/hta21690 HEALTH TECHNOLOGY ASSESSMENT 2017 VOL. 21 NO. 69
© Queen’s Printer and Controller of HMSO 2017. This work was produced by Lefebvre et al. under the terms of a commissioning contract issued by the Secretary of State forHealth. This issue may be freely reproduced for the purposes of private research and study and extracts (or indeed, the full report) may be included in professional journalsprovided that suitable acknowledgement is made and the reproduction is not associated with any form of advertising. Applications for commercial reproduction should beaddressed to: NIHR Journals Library, National Institute for Health Research, Evaluation, Trials and Studies Coordinating Centre, Alpha House, University of Southampton SciencePark, Southampton SO16 7NS, UK.
47
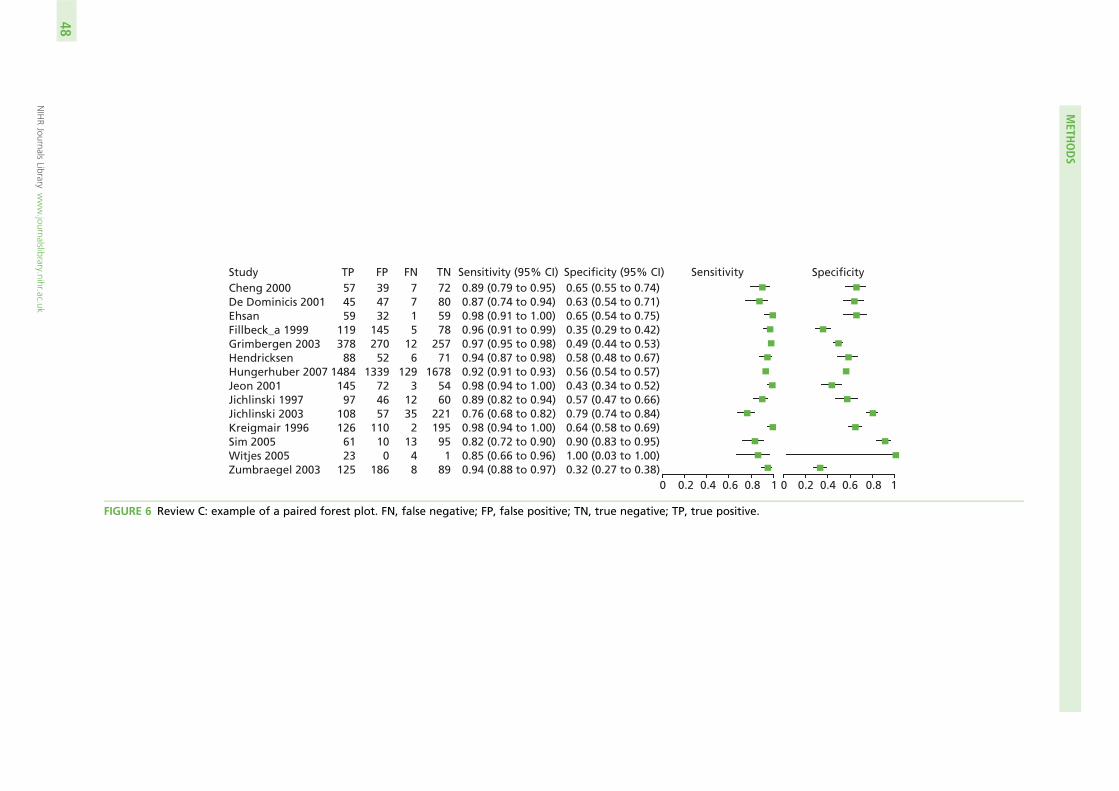
StudyCheng 2000De Dominicis 2001EhsanFillbeck_a 1999Grimbergen 2003HendricksenHungerhuber 2007Jeon 2001Jichlinski 1997Jichlinski 2003Kreigmair 1996Sim 2005Witjes 2005Zumbraegel 2003
TP574559
11937888
148414597
1081266123
125
FP394732
14527052
1339724657
110100
186
FN7715
126
1293
12352
1348
TN72805978
25771
16785460
221195951
89
Sensitivity (95% CI)0.89 (0.79 to 0.95)0.87 (0.74 to 0.94)0.98 (0.91 to 1.00)0.96 (0.91 to 0.99)0.97 (0.95 to 0.98)0.94 (0.87 to 0.98)0.92 (0.91 to 0.93)0.98 (0.94 to 1.00)0.89 (0.82 to 0.94)0.76 (0.68 to 0.82)0.98 (0.94 to 1.00)0.82 (0.72 to 0.90)0.85 (0.66 to 0.96)0.94 (0.88 to 0.97)
Specificity (95% CI)0.65 (0.55 to 0.74)0.63 (0.54 to 0.71)0.65 (0.54 to 0.75)0.35 (0.29 to 0.42)0.49 (0.44 to 0.53)0.58 (0.48 to 0.67)0.56 (0.54 to 0.57)0.43 (0.34 to 0.52)0.57 (0.47 to 0.66)0.79 (0.74 to 0.84)0.64 (0.58 to 0.69)0.90 (0.83 to 0.95)1.00 (0.03 to 1.00)0.32 (0.27 to 0.38)
Sensitivity
0 0.2 0.4 0.6 0.8 1
Specificity
0 0.2 0.4 0.6 0.8 1
FIGURE 6 Review C: example of a paired forest plot. FN, false negative; FP, false positive; TN, true negative; TP, true positive.
METH
ODS
NIHRJournals
Librarywww.journalslibrary.nihr.ac.uk
48
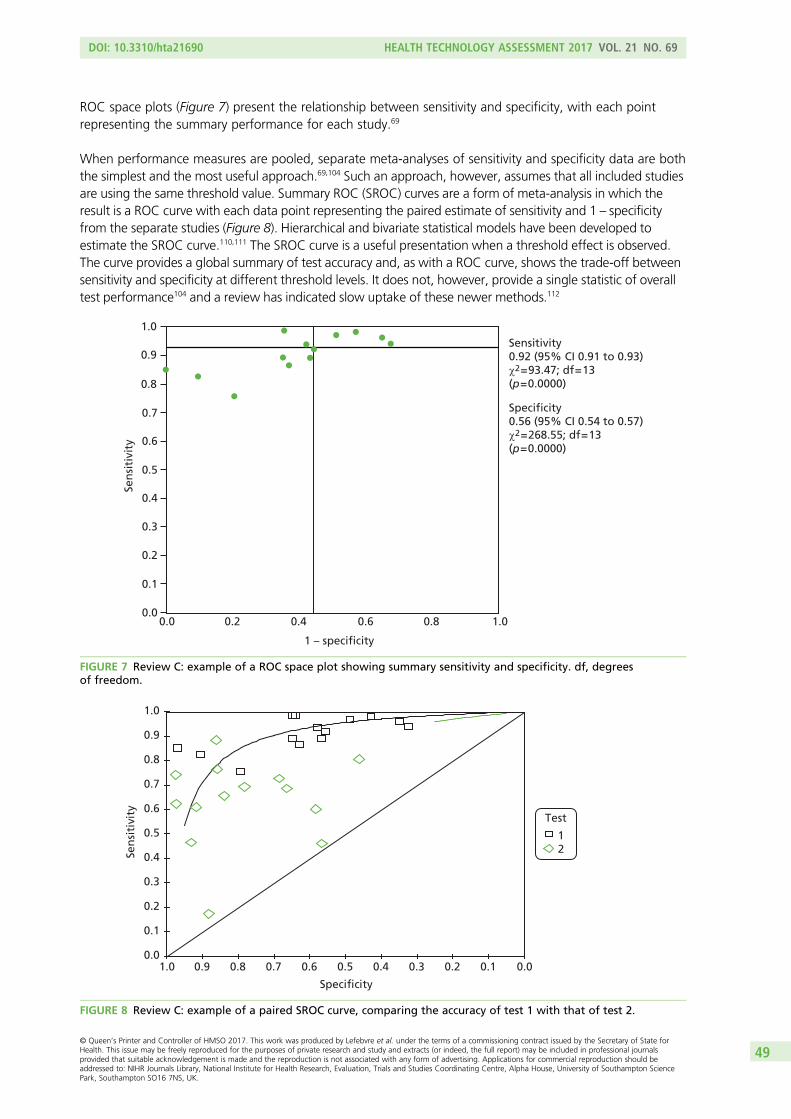
ROC space plots (Figure 7) present the relationship between sensitivity and specificity, with each pointrepresenting the summary performance for each study.69
When performance measures are pooled, separate meta-analyses of sensitivity and specificity data are boththe simplest and the most useful approach.69,104 Such an approach, however, assumes that all included studiesare using the same threshold value. Summary ROC (SROC) curves are a form of meta-analysis in which theresult is a ROC curve with each data point representing the paired estimate of sensitivity and 1 – specificityfrom the separate studies (Figure 8). Hierarchical and bivariate statistical models have been developed toestimate the SROC curve.110,111 The SROC curve is a useful presentation when a threshold effect is observed.The curve provides a global summary of test accuracy and, as with a ROC curve, shows the trade-off betweensensitivity and specificity at different threshold levels. It does not, however, provide a single statistic of overalltest performance104 and a review has indicated slow uptake of these newer methods.112
Sen
siti
vity
1.0
0.9
0.8
0.7
0.6
0.5
0.4
0.3
0.2
0.1
0.00.0 0.2 0.4 0.6 0.8 1.0
1 – specificity
Sensitivity0.92 (95% CI 0.91 to 0.93)χ2 = 93.47; df = 13(p = 0.0000)
Specificity0.56 (95% CI 0.54 to 0.57)χ2 = 268.55; df = 13(p = 0.0000)
FIGURE 7 Review C: example of a ROC space plot showing summary sensitivity and specificity. df, degreesof freedom.
Test
1 2
0.00.10.20.30.40.50.60.70.80.91.00.0
0.1
0.2
0.3
0.4
0.5
0.6
0.7
0.8
0.9
1.0
Specificity
Sen
siti
vity
FIGURE 8 Review C: example of a paired SROC curve, comparing the accuracy of test 1 with that of test 2.
DOI: 10.3310/hta21690 HEALTH TECHNOLOGY ASSESSMENT 2017 VOL. 21 NO. 69
© Queen’s Printer and Controller of HMSO 2017. This work was produced by Lefebvre et al. under the terms of a commissioning contract issued by the Secretary of State forHealth. This issue may be freely reproduced for the purposes of private research and study and extracts (or indeed, the full report) may be included in professional journalsprovided that suitable acknowledgement is made and the reproduction is not associated with any form of advertising. Applications for commercial reproduction should beaddressed to: NIHR Journals Library, National Institute for Health Research, Evaluation, Trials and Studies Coordinating Centre, Alpha House, University of Southampton SciencePark, Southampton SO16 7NS, UK.
49
Other graphical methods that can be used to present data in a way that is useful in a clinical context havebeen suggested.87 The two main methods are LR nomograms and the probability-modifying plot. Thesegraphs enable the clinician to estimate the post-test probability of a patient having the disease, based ontheir pretest probability, when the LRs of tests are known.
Whiting et al.87 reviewed the graphical presentation of diagnostic information in 49 systematic reviews.Just over half (53%) of the reviews used graphical displays to present the results. ROC plots were themost common type of graph and were included in 22 reviews (45%), whereas forest plots were used in10 reviews (20%) to display individual study results. In another review of DTA reviews, Honest and Khan101
found that, when meta-analysis had been undertaken, pooled sensitivity or specificity was reported in35 out of 60 (58%) reviews, pooled predictive values in 11 out of 60 (18%) reviews, pooled LRs in13 out of 60 (22%) reviews and pooled DORs in five out of 60 (8%) reviews. SROC plots were reportedin 44 out of 60 (73%) of the meta-analyses. Dinnes et al.109 noted that, out of 189 systematic reviewsincluded in their review, 30% had involved narrative analysis and, when meta-analysis had been undertaken,52% statistically pooled data, 18% reported SROC plots and a further 30% employed both techniques.
Summary
l Diagnostic test accuracy studies should be carried out on a sample of patients who are representativeof the target population, particularly in terms of disease state, and should use an appropriate referencestandard with interpreter blinding to previous test results.
l Sensitivity (true-positive rate) and specificity (true-negative rate) are the most commonly reportedoutcomes and are subject to spectrum bias.
l Predictive values, used to calculate the probability of a test giving a correct result, are influenced by thedisease prevalence in the population.
l LRs are useful in a clinical setting to determine the probability of a patient having the target disease.l DORs provide a summary measure combining sensitivity and specificity but are difficult to interpret clinically.l ROC curves present sensitivity and specificity pairs at different test thresholds, whereas the AUC gives
an overall value of DTA.l International HTA organisations that have addressed the issue recommend that DTA studies should
present 2 × 2 contingency tables, sensitivity and specificity pairs and LR pairs.l Several types of graphical presentations can be used to display DTA data but these have not been used
extensively in the DTA literature.l In undertaking systematic reviews of DTA studies, heterogeneity between studies is a common feature
and should be investigated before combining data in a meta-analysis.l A narrative approach, presenting forest plots and ROC space plots, is recommended when
heterogeneity exists.l Poor quality in relation to methodology and reporting affects the inferences that can be drawn from
DTA studies.
Applicability to research in search filter performanceDiagnostic test accuracy and search filter studies share similar characteristics in that both evaluate theperformance of an index test (or search filter) against that of a reference standard in the same sample ofpatients (or records). In the clinical literature, the reference standard should be the best available methodto identify the ‘target condition’. In the search filter literature the reference standard usually refers notto the method per se but rather the set of relevant records that the method has been designed toidentify.51,76 Typically, the reference standard is described as the records obtained by hand-searching a setof journals over a specified time period (i.e. the ‘positive’ records in the sample to be tested) rather thandescribing the reference standard as the method used (i.e. ‘hand-searching’). Other reference standardsused, such as the records of included studies from systematic reviews or studies held in a specialisedregister, again conflate the method and the sample. In these cases, the method used is implicit: searchingand screening to identify relevant studies. Although the terminology is different, the principle is the same:the results of applying the index test or filter to a sample are compared with the results of a method that isconsidered to be robust.
METHODS
NIHR Journals Library www.journalslibrary.nihr.ac.uk
50
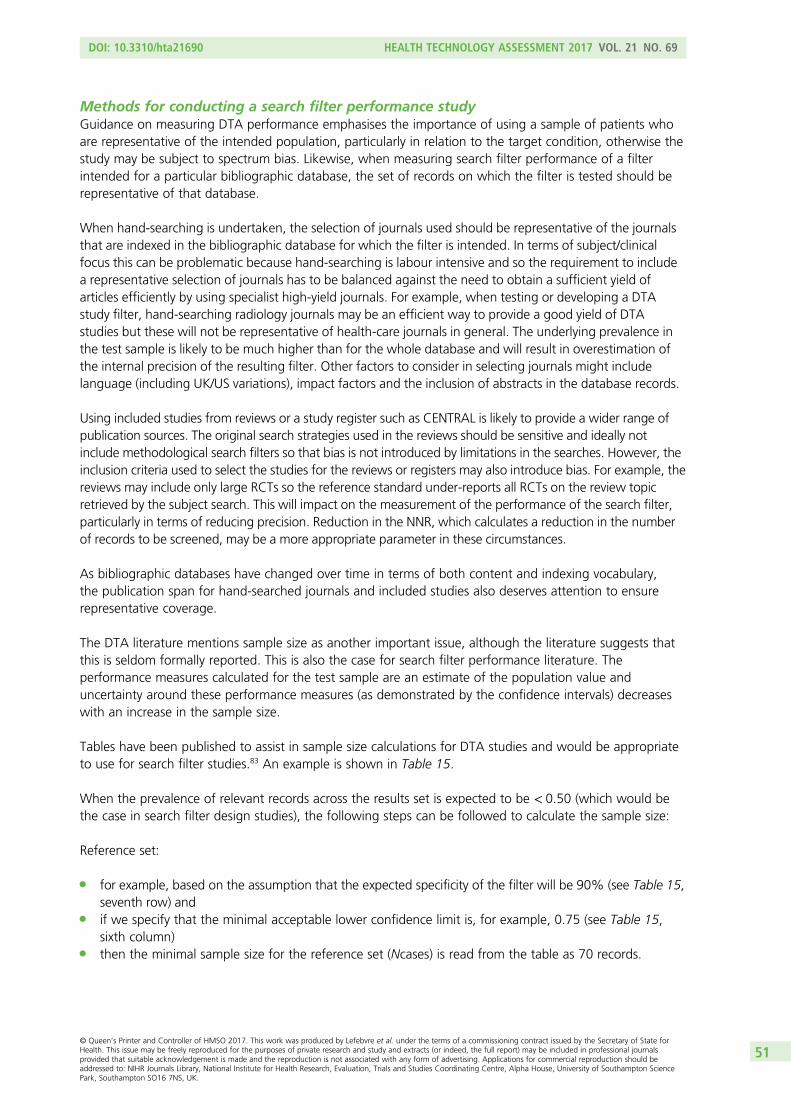
Methods for conducting a search filter performance studyGuidance on measuring DTA performance emphasises the importance of using a sample of patients whoare representative of the intended population, particularly in relation to the target condition, otherwise thestudy may be subject to spectrum bias. Likewise, when measuring search filter performance of a filterintended for a particular bibliographic database, the set of records on which the filter is tested should berepresentative of that database.
When hand-searching is undertaken, the selection of journals used should be representative of the journalsthat are indexed in the bibliographic database for which the filter is intended. In terms of subject/clinicalfocus this can be problematic because hand-searching is labour intensive and so the requirement to includea representative selection of journals has to be balanced against the need to obtain a sufficient yield ofarticles efficiently by using specialist high-yield journals. For example, when testing or developing a DTAstudy filter, hand-searching radiology journals may be an efficient way to provide a good yield of DTAstudies but these will not be representative of health-care journals in general. The underlying prevalence inthe test sample is likely to be much higher than for the whole database and will result in overestimation ofthe internal precision of the resulting filter. Other factors to consider in selecting journals might includelanguage (including UK/US variations), impact factors and the inclusion of abstracts in the database records.
Using included studies from reviews or a study register such as CENTRAL is likely to provide a wider range ofpublication sources. The original search strategies used in the reviews should be sensitive and ideally notinclude methodological search filters so that bias is not introduced by limitations in the searches. However, theinclusion criteria used to select the studies for the reviews or registers may also introduce bias. For example, thereviews may include only large RCTs so the reference standard under-reports all RCTs on the review topicretrieved by the subject search. This will impact on the measurement of the performance of the search filter,particularly in terms of reducing precision. Reduction in the NNR, which calculates a reduction in the numberof records to be screened, may be a more appropriate parameter in these circumstances.
As bibliographic databases have changed over time in terms of both content and indexing vocabulary,the publication span for hand-searched journals and included studies also deserves attention to ensurerepresentative coverage.
The DTA literature mentions sample size as another important issue, although the literature suggests thatthis is seldom formally reported. This is also the case for search filter performance literature. Theperformance measures calculated for the test sample are an estimate of the population value anduncertainty around these performance measures (as demonstrated by the confidence intervals) decreaseswith an increase in the sample size.
Tables have been published to assist in sample size calculations for DTA studies and would be appropriateto use for search filter studies.83 An example is shown in Table 15.
When the prevalence of relevant records across the results set is expected to be < 0.50 (which would bethe case in search filter design studies), the following steps can be followed to calculate the sample size:
Reference set:
l for example, based on the assumption that the expected specificity of the filter will be 90% (see Table 15,seventh row) and
l if we specify that the minimal acceptable lower confidence limit is, for example, 0.75 (see Table 15,sixth column)
l then the minimal sample size for the reference set (Ncases) is read from the table as 70 records.
DOI: 10.3310/hta21690 HEALTH TECHNOLOGY ASSESSMENT 2017 VOL. 21 NO. 69
© Queen’s Printer and Controller of HMSO 2017. This work was produced by Lefebvre et al. under the terms of a commissioning contract issued by the Secretary of State forHealth. This issue may be freely reproduced for the purposes of private research and study and extracts (or indeed, the full report) may be included in professional journalsprovided that suitable acknowledgement is made and the reproduction is not associated with any form of advertising. Applications for commercial reproduction should beaddressed to: NIHR Journals Library, National Institute for Health Research, Evaluation, Trials and Studies Coordinating Centre, Alpha House, University of Southampton SciencePark, Southampton SO16 7NS, UK.
51
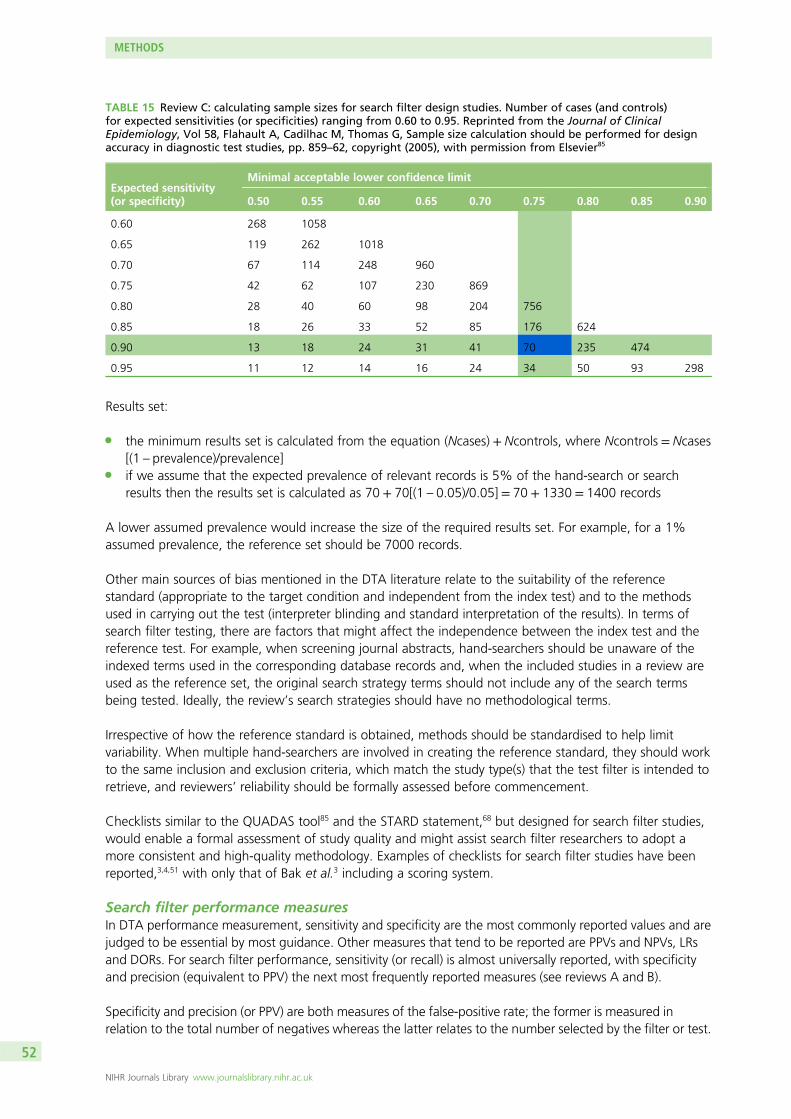
Results set:
l the minimum results set is calculated from the equation (Ncases) + Ncontrols, where Ncontrols = Ncases[(1 – prevalence)/prevalence]
l if we assume that the expected prevalence of relevant records is 5% of the hand-search or searchresults then the results set is calculated as 70 + 70[(1 – 0.05)/0.05] = 70 + 1330 = 1400 records
A lower assumed prevalence would increase the size of the required results set. For example, for a 1%assumed prevalence, the reference set should be 7000 records.
Other main sources of bias mentioned in the DTA literature relate to the suitability of the referencestandard (appropriate to the target condition and independent from the index test) and to the methodsused in carrying out the test (interpreter blinding and standard interpretation of the results). In terms ofsearch filter testing, there are factors that might affect the independence between the index test and thereference test. For example, when screening journal abstracts, hand-searchers should be unaware of theindexed terms used in the corresponding database records and, when the included studies in a review areused as the reference set, the original search strategy terms should not include any of the search termsbeing tested. Ideally, the review’s search strategies should have no methodological terms.
Irrespective of how the reference standard is obtained, methods should be standardised to help limitvariability. When multiple hand-searchers are involved in creating the reference standard, they should workto the same inclusion and exclusion criteria, which match the study type(s) that the test filter is intended toretrieve, and reviewers’ reliability should be formally assessed before commencement.
Checklists similar to the QUADAS tool85 and the STARD statement,68 but designed for search filter studies,would enable a formal assessment of study quality and might assist search filter researchers to adopt amore consistent and high-quality methodology. Examples of checklists for search filter studies have beenreported,3,4,51 with only that of Bak et al.3 including a scoring system.
Search filter performance measuresIn DTA performance measurement, sensitivity and specificity are the most commonly reported values and arejudged to be essential by most guidance. Other measures that tend to be reported are PPVs and NPVs, LRsand DORs. For search filter performance, sensitivity (or recall) is almost universally reported, with specificityand precision (equivalent to PPV) the next most frequently reported measures (see reviews A and B).
Specificity and precision (or PPV) are both measures of the false-positive rate; the former is measured inrelation to the total number of negatives whereas the latter relates to the number selected by the filter or test.
TABLE 15 Review C: calculating sample sizes for search filter design studies. Number of cases (and controls)for expected sensitivities (or specificities) ranging from 0.60 to 0.95. Reprinted from the Journal of ClinicalEpidemiology, Vol 58, Flahault A, Cadilhac M, Thomas G, Sample size calculation should be performed for designaccuracy in diagnostic test studies, pp. 859–62, copyright (2005), with permission from Elsevier85
Expected sensitivity(or specificity)
Minimal acceptable lower confidence limit
0.50 0.55 0.60 0.65 0.70 0.75 0.80 0.85 0.90
0.60 268 1058
0.65 119 262 1018
0.70 67 114 248 960
0.75 42 62 107 230 869
0.80 28 40 60 98 204 756
0.85 18 26 33 52 85 176 624
0.90 13 18 24 31 41 70 235 474
0.95 11 12 14 16 24 34 50 93 298
METHODS
NIHR Journals Library www.journalslibrary.nihr.ac.uk
52
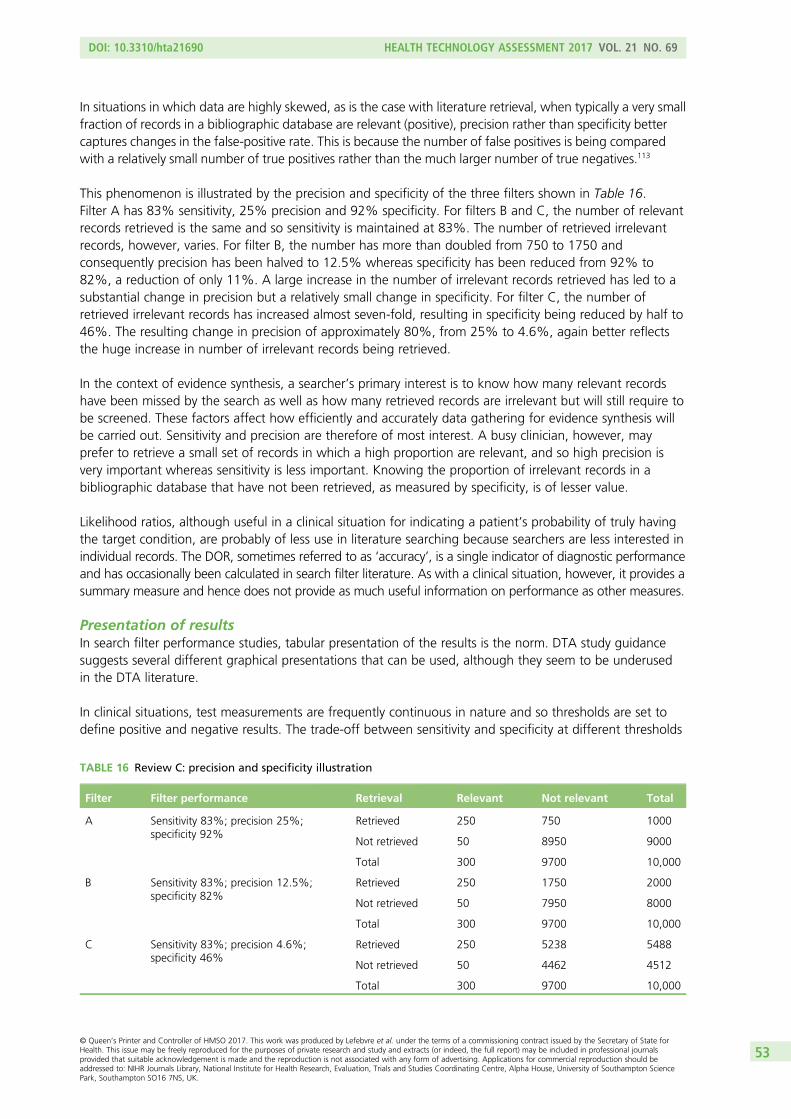
In situations in which data are highly skewed, as is the case with literature retrieval, when typically a very smallfraction of records in a bibliographic database are relevant (positive), precision rather than specificity bettercaptures changes in the false-positive rate. This is because the number of false positives is being comparedwith a relatively small number of true positives rather than the much larger number of true negatives.113
This phenomenon is illustrated by the precision and specificity of the three filters shown in Table 16.Filter A has 83% sensitivity, 25% precision and 92% specificity. For filters B and C, the number of relevantrecords retrieved is the same and so sensitivity is maintained at 83%. The number of retrieved irrelevantrecords, however, varies. For filter B, the number has more than doubled from 750 to 1750 andconsequently precision has been halved to 12.5% whereas specificity has been reduced from 92% to82%, a reduction of only 11%. A large increase in the number of irrelevant records retrieved has led to asubstantial change in precision but a relatively small change in specificity. For filter C, the number ofretrieved irrelevant records has increased almost seven-fold, resulting in specificity being reduced by half to46%. The resulting change in precision of approximately 80%, from 25% to 4.6%, again better reflectsthe huge increase in number of irrelevant records being retrieved.
In the context of evidence synthesis, a searcher’s primary interest is to know how many relevant recordshave been missed by the search as well as how many retrieved records are irrelevant but will still require tobe screened. These factors affect how efficiently and accurately data gathering for evidence synthesis willbe carried out. Sensitivity and precision are therefore of most interest. A busy clinician, however, mayprefer to retrieve a small set of records in which a high proportion are relevant, and so high precision isvery important whereas sensitivity is less important. Knowing the proportion of irrelevant records in abibliographic database that have not been retrieved, as measured by specificity, is of lesser value.
Likelihood ratios, although useful in a clinical situation for indicating a patient’s probability of truly havingthe target condition, are probably of less use in literature searching because searchers are less interested inindividual records. The DOR, sometimes referred to as ‘accuracy’, is a single indicator of diagnostic performanceand has occasionally been calculated in search filter literature. As with a clinical situation, however, it provides asummary measure and hence does not provide as much useful information on performance as other measures.
Presentation of resultsIn search filter performance studies, tabular presentation of the results is the norm. DTA study guidancesuggests several different graphical presentations that can be used, although they seem to be underusedin the DTA literature.
In clinical situations, test measurements are frequently continuous in nature and so thresholds are set todefine positive and negative results. The trade-off between sensitivity and specificity at different thresholds
TABLE 16 Review C: precision and specificity illustration
Filter Filter performance Retrieval Relevant Not relevant Total
A Sensitivity 83%; precision 25%;specificity 92%
Retrieved 250 750 1000
Not retrieved 50 8950 9000
Total 300 9700 10,000
B Sensitivity 83%; precision 12.5%;specificity 82%
Retrieved 250 1750 2000
Not retrieved 50 7950 8000
Total 300 9700 10,000
C Sensitivity 83%; precision 4.6%;specificity 46%
Retrieved 250 5238 5488
Not retrieved 50 4462 4512
Total 300 9700 10,000
DOI: 10.3310/hta21690 HEALTH TECHNOLOGY ASSESSMENT 2017 VOL. 21 NO. 69
© Queen’s Printer and Controller of HMSO 2017. This work was produced by Lefebvre et al. under the terms of a commissioning contract issued by the Secretary of State forHealth. This issue may be freely reproduced for the purposes of private research and study and extracts (or indeed, the full report) may be included in professional journalsprovided that suitable acknowledgement is made and the reproduction is not associated with any form of advertising. Applications for commercial reproduction should beaddressed to: NIHR Journals Library, National Institute for Health Research, Evaluation, Trials and Studies Coordinating Centre, Alpha House, University of Southampton SciencePark, Southampton SO16 7NS, UK.
53
is often graphically presented in a ROC plot. This situation does not occur in standard literature searching:a search filter produces a binary result, either selected or not. At the filter development stage, however, aROC plot could be a useful way to display the performance characteristics of variations in a filter, showingthe change that results from the inclusion or exclusion of particular search terms.
Other graphical presentations that have been used in the DTA literature include dot plots, box-and-whiskerplots and flow diagrams. Plots can be used for tests that can have a range of values so again would not beapplicable to search filter performance. A flow diagram, however, could be considered as a method forpresenting search filter performance.
Comparing the results of search filtersSystematic reviews of the DTA literature are complex, largely because of the variability (heterogeneity)between studies in terms of the reference standards that have been used and the populations that havebeen tested. When heterogeneity exists, meta-analysis is not recommended and a narrative approach isadvised using graphical presentations such as forest plots and ROC space plots.
In the search filter literature, a variety of approaches have been adopted to test search filters usingdifferent search interfaces and so heterogeneity is likely to be present between filters. There have beenfew systematic reviews undertaken in the search filter literature and these have tended to adopt a differentapproach from that taken in the DTA literature. Although DTA reviews frequently compare studies thathave evaluated the performance of one index test against the performance of the same reference standardbut in different samples, search filter reviews published to date compare several search filters using boththe same reference standard and sample (review B). In this situation, synthesising the results is notapplicable; rather, we can directly compare performance between filters. These reviews have tended todisplay the results only in tabular form but ROC space plots or paired forest plots would be highlyappropriate for displaying these comparisons. Displaying the results using graphs may convey them moreeffectively and assist users to choose between filters.
ConclusionsGuidance on conducting and analysing the results of DTA studies is applicable to several aspects of searchfilter research. The identification of a representative sample of records, of sufficient size and using astandardised approach will assist in producing robust and generalisable results. Although appropriateperformance measurements are generally reported, the greater use of some graphical presentations mayfacilitate the dissemination and interpretation of results.
How do searchers choose search filters? (review D)
ObjectivesThe objective of this review was to identify any published research into how searchers (informationspecialists, librarians, researchers and clinicians) choose search filters based on the information presentedto them.
MethodsStudies were eligible for inclusion if they reported criteria or methods that searchers used to choose filters,for example:
l the characteristics of the filter, such as how the filter was designed, what performance measurementswere used and the currency of the filter
l how searchers appraised the filter designs, for example, did they use the ISSG critical appraisal tool,4
the Canadian Agency for Drugs and Technologies in Health (CADTH) tool3 or other methods toappraise search filters to inform their choice
METHODS
NIHR Journals Library www.journalslibrary.nihr.ac.uk
54
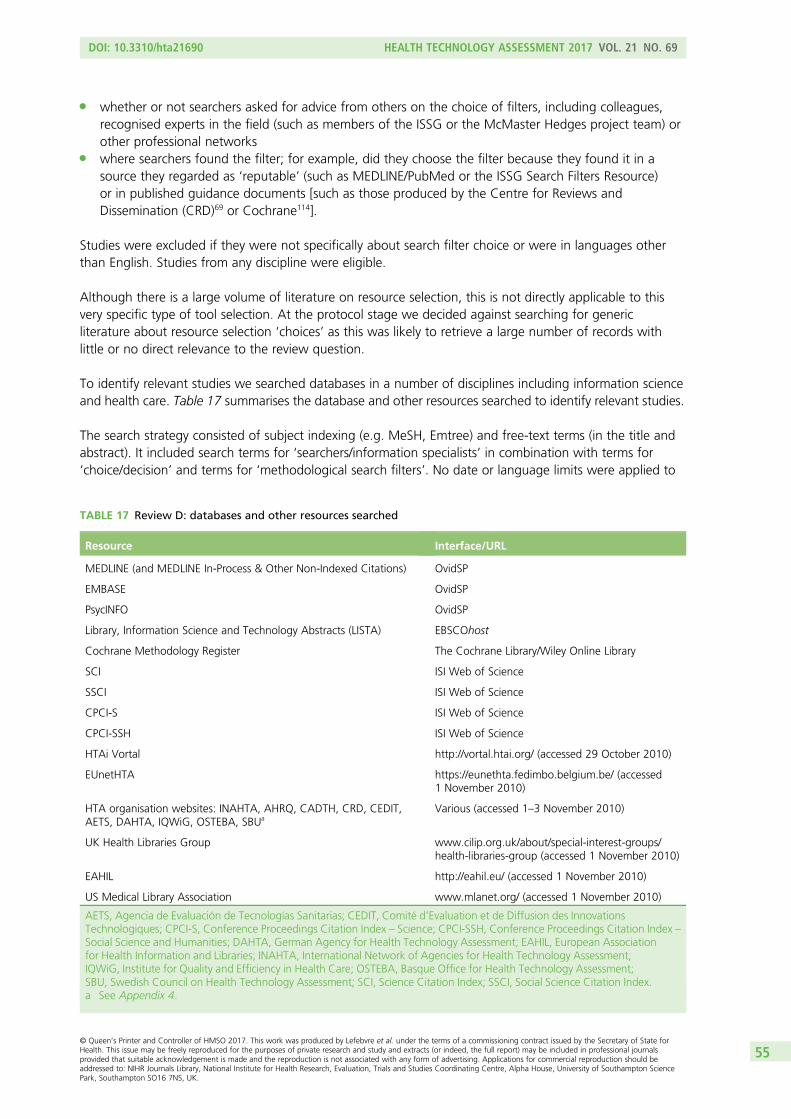
l whether or not searchers asked for advice from others on the choice of filters, including colleagues,recognised experts in the field (such as members of the ISSG or the McMaster Hedges project team) orother professional networks
l where searchers found the filter; for example, did they choose the filter because they found it in asource they regarded as ‘reputable’ (such as MEDLINE/PubMed or the ISSG Search Filters Resource)or in published guidance documents [such as those produced by the Centre for Reviews andDissemination (CRD)69 or Cochrane114].
Studies were excluded if they were not specifically about search filter choice or were in languages otherthan English. Studies from any discipline were eligible.
Although there is a large volume of literature on resource selection, this is not directly applicable to thisvery specific type of tool selection. At the protocol stage we decided against searching for genericliterature about resource selection ‘choices’ as this was likely to retrieve a large number of records withlittle or no direct relevance to the review question.
To identify relevant studies we searched databases in a number of disciplines including information scienceand health care. Table 17 summarises the database and other resources searched to identify relevant studies.
The search strategy consisted of subject indexing (e.g. MeSH, Emtree) and free-text terms (in the title andabstract). It included search terms for ‘searchers/information specialists’ in combination with terms for‘choice/decision’ and terms for ‘methodological search filters’. No date or language limits were applied to
TABLE 17 Review D: databases and other resources searched
Resource Interface/URL
MEDLINE (and MEDLINE In-Process & Other Non-Indexed Citations) OvidSP
EMBASE OvidSP
PsycINFO OvidSP
Library, Information Science and Technology Abstracts (LISTA) EBSCOhost
Cochrane Methodology Register The Cochrane Library/Wiley Online Library
SCI ISI Web of Science
SSCI ISI Web of Science
CPCI-S ISI Web of Science
CPCI-SSH ISI Web of Science
HTAi Vortal http://vortal.htai.org/ (accessed 29 October 2010)
EUnetHTA https://eunethta.fedimbo.belgium.be/ (accessed1 November 2010)
HTA organisation websites: INAHTA, AHRQ, CADTH, CRD, CEDIT,AETS, DAHTA, IQWiG, OSTEBA, SBUa
Various (accessed 1–3 November 2010)
UK Health Libraries Group www.cilip.org.uk/about/special-interest-groups/health-libraries-group (accessed 1 November 2010)
EAHIL http://eahil.eu/ (accessed 1 November 2010)
US Medical Library Association www.mlanet.org/ (accessed 1 November 2010)
AETS, Agencia de Evaluación de Tecnologías Sanitarias; CEDIT, Comité d’Evaluation et de Diffusion des InnovationsTechnologiques; CPCI-S, Conference Proceedings Citation Index – Science; CPCI-SSH, Conference Proceedings Citation Index –Social Science and Humanities; DAHTA, German Agency for Health Technology Assessment; EAHIL, European Associationfor Health Information and Libraries; INAHTA, International Network of Agencies for Health Technology Assessment;IQWiG, Institute for Quality and Efficiency in Health Care; OSTEBA, Basque Office for Health Technology Assessment;SBU, Swedish Council on Health Technology Assessment; SCI, Science Citation Index; SSCI, Social Science Citation Index.a See Appendix 4.
DOI: 10.3310/hta21690 HEALTH TECHNOLOGY ASSESSMENT 2017 VOL. 21 NO. 69
© Queen’s Printer and Controller of HMSO 2017. This work was produced by Lefebvre et al. under the terms of a commissioning contract issued by the Secretary of State forHealth. This issue may be freely reproduced for the purposes of private research and study and extracts (or indeed, the full report) may be included in professional journalsprovided that suitable acknowledgement is made and the reproduction is not associated with any form of advertising. Applications for commercial reproduction should beaddressed to: NIHR Journals Library, National Institute for Health Research, Evaluation, Trials and Studies Coordinating Centre, Alpha House, University of Southampton SciencePark, Southampton SO16 7NS, UK.
55
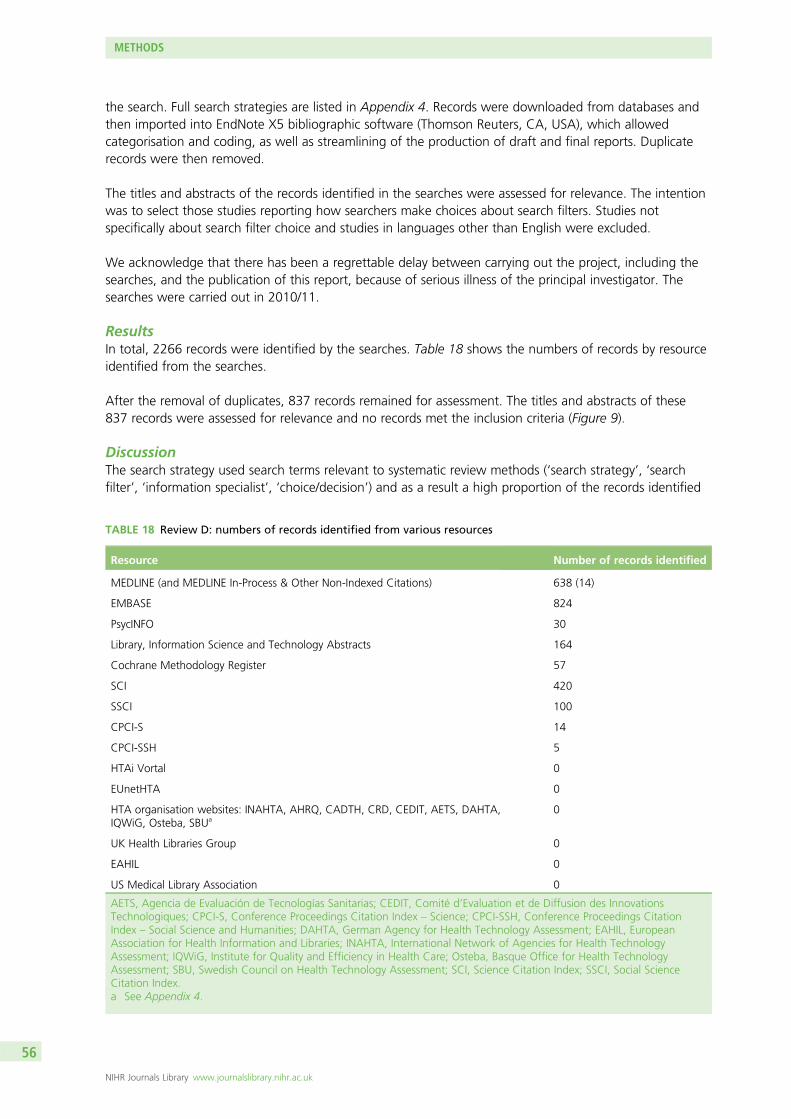
the search. Full search strategies are listed in Appendix 4. Records were downloaded from databases andthen imported into EndNote X5 bibliographic software (Thomson Reuters, CA, USA), which allowedcategorisation and coding, as well as streamlining of the production of draft and final reports. Duplicaterecords were then removed.
The titles and abstracts of the records identified in the searches were assessed for relevance. The intentionwas to select those studies reporting how searchers make choices about search filters. Studies notspecifically about search filter choice and studies in languages other than English were excluded.
We acknowledge that there has been a regrettable delay between carrying out the project, including thesearches, and the publication of this report, because of serious illness of the principal investigator. Thesearches were carried out in 2010/11.
ResultsIn total, 2266 records were identified by the searches. Table 18 shows the numbers of records by resourceidentified from the searches.
After the removal of duplicates, 837 records remained for assessment. The titles and abstracts of these837 records were assessed for relevance and no records met the inclusion criteria (Figure 9).
DiscussionThe search strategy used search terms relevant to systematic review methods (‘search strategy’, ‘searchfilter’, ‘information specialist’, ‘choice/decision’) and as a result a high proportion of the records identified
TABLE 18 Review D: numbers of records identified from various resources
Resource Number of records identified
MEDLINE (and MEDLINE In-Process & Other Non-Indexed Citations) 638 (14)
EMBASE 824
PsycINFO 30
Library, Information Science and Technology Abstracts 164
Cochrane Methodology Register 57
SCI 420
SSCI 100
CPCI-S 14
CPCI-SSH 5
HTAi Vortal 0
EUnetHTA 0
HTA organisation websites: INAHTA, AHRQ, CADTH, CRD, CEDIT, AETS, DAHTA,IQWiG, Osteba, SBUa
0
UK Health Libraries Group 0
EAHIL 0
US Medical Library Association 0
AETS, Agencia de Evaluación de Tecnologías Sanitarias; CEDIT, Comité d’Evaluation et de Diffusion des InnovationsTechnologiques; CPCI-S, Conference Proceedings Citation Index – Science; CPCI-SSH, Conference Proceedings CitationIndex – Social Science and Humanities; DAHTA, German Agency for Health Technology Assessment; EAHIL, EuropeanAssociation for Health Information and Libraries; INAHTA, International Network of Agencies for Health TechnologyAssessment; IQWiG, Institute for Quality and Efficiency in Health Care; Osteba, Basque Office for Health TechnologyAssessment; SBU, Swedish Council on Health Technology Assessment; SCI, Science Citation Index; SSCI, Social ScienceCitation Index.a See Appendix 4.
METHODS
NIHR Journals Library www.journalslibrary.nihr.ac.uk
56
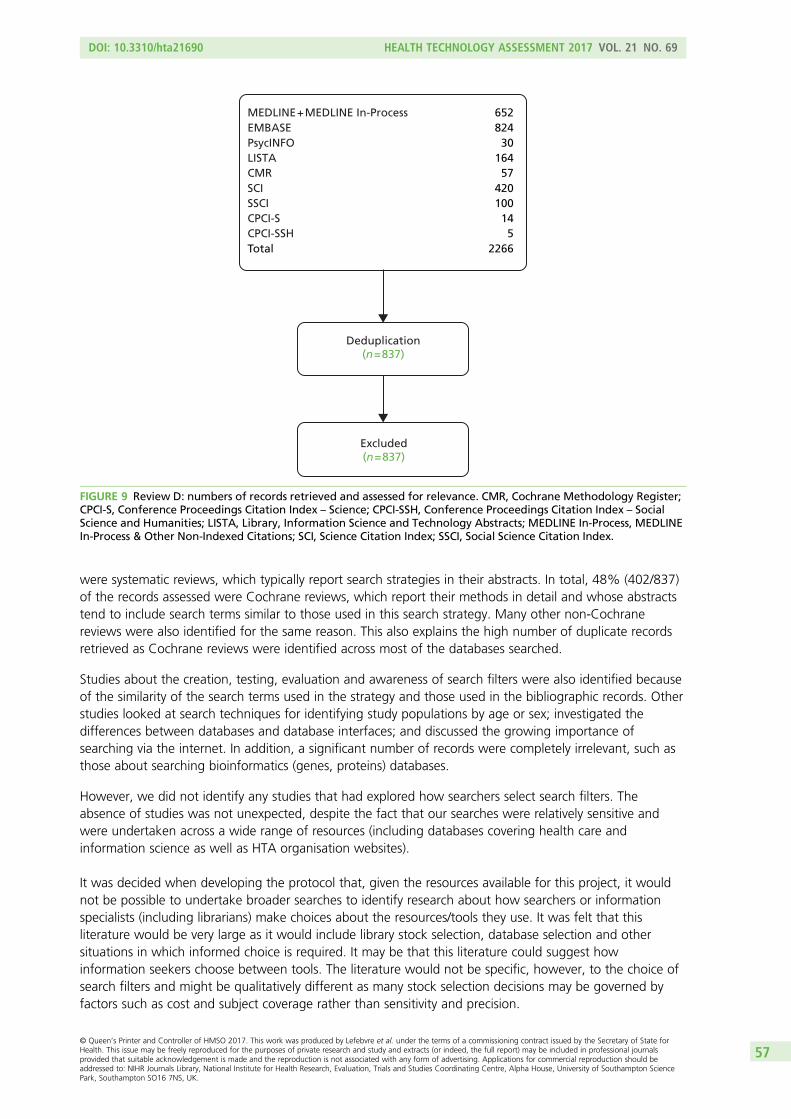
were systematic reviews, which typically report search strategies in their abstracts. In total, 48% (402/837)of the records assessed were Cochrane reviews, which report their methods in detail and whose abstractstend to include search terms similar to those used in this search strategy. Many other non-Cochranereviews were also identified for the same reason. This also explains the high number of duplicate recordsretrieved as Cochrane reviews were identified across most of the databases searched.
Studies about the creation, testing, evaluation and awareness of search filters were also identified becauseof the similarity of the search terms used in the strategy and those used in the bibliographic records. Otherstudies looked at search techniques for identifying study populations by age or sex; investigated thedifferences between databases and database interfaces; and discussed the growing importance ofsearching via the internet. In addition, a significant number of records were completely irrelevant, such asthose about searching bioinformatics (genes, proteins) databases.
However, we did not identify any studies that had explored how searchers select search filters. Theabsence of studies was not unexpected, despite the fact that our searches were relatively sensitive andwere undertaken across a wide range of resources (including databases covering health care andinformation science as well as HTA organisation websites).
It was decided when developing the protocol that, given the resources available for this project, it wouldnot be possible to undertake broader searches to identify research about how searchers or informationspecialists (including librarians) make choices about the resources/tools they use. It was felt that thisliterature would be very large as it would include library stock selection, database selection and othersituations in which informed choice is required. It may be that this literature could suggest howinformation seekers choose between tools. The literature would not be specific, however, to the choice ofsearch filters and might be qualitatively different as many stock selection decisions may be governed byfactors such as cost and subject coverage rather than sensitivity and precision.
MEDLINE+MEDLINE In-ProcessEMBASEPsycINFOLISTACMRSCISSCICPCI-SCPCI-SSHTotal
Excluded(n = 837)
Deduplication(n = 837)
652824
30164
57420100
145
2266
FIGURE 9 Review D: numbers of records retrieved and assessed for relevance. CMR, Cochrane Methodology Register;CPCI-S, Conference Proceedings Citation Index – Science; CPCI-SSH, Conference Proceedings Citation Index – SocialScience and Humanities; LISTA, Library, Information Science and Technology Abstracts; MEDLINE In-Process, MEDLINEIn-Process & Other Non-Indexed Citations; SCI, Science Citation Index; SSCI, Social Science Citation Index.
DOI: 10.3310/hta21690 HEALTH TECHNOLOGY ASSESSMENT 2017 VOL. 21 NO. 69
© Queen’s Printer and Controller of HMSO 2017. This work was produced by Lefebvre et al. under the terms of a commissioning contract issued by the Secretary of State forHealth. This issue may be freely reproduced for the purposes of private research and study and extracts (or indeed, the full report) may be included in professional journalsprovided that suitable acknowledgement is made and the reproduction is not associated with any form of advertising. Applications for commercial reproduction should beaddressed to: NIHR Journals Library, National Institute for Health Research, Evaluation, Trials and Studies Coordinating Centre, Alpha House, University of Southampton SciencePark, Southampton SO16 7NS, UK.
57
There is literature about the development and quality of search filters, as well as research comparingpublished filters, but we did not identify any studies reporting the use and choice of filters by searchers inpractice. A survey about the awareness of search filters among searchers was published in 2004 and, althoughawareness of filters was relatively high at that time, usage was still low.5 Since that questionnaire wasundertaken, the promotion of search filters through the ISSG Search Filters Resource, through training coursesconducted in the UK, the USA and elsewhere and through the increasing numbers of published filters mayhave increased awareness and usage by searchers. We have not identified any current published evidence,however, to support this. Investigations of how searchers are choosing filters seem not to have been published.
How do clinicians choose between diagnostic tests? (review E)
IntroductionDatabase searchers have access to a range of methodological search filters that have been designed toretrieve records relating to studies that employ a particular research design. It is unclear, however, whatfactors influence the choice of an appropriate filter. As search filters can be viewed as analogous todiagnostic tests (as outlined above), it is hypothesised that the factors that lead clinicians to choosebetween diagnostic tests or health-care organisations to choose between screening tests might offerinsights into how searchers do, or might in the future be encouraged to, make choices about search filters.
ObjectiveTo identify and summarise evidence, in a narrative review, on factors that influence clinicians’ choicebetween diagnostic tests.
MethodsEvidence for this review was obtained from literature searches of the major health-care databases andconsultation of national screening programme websites. MEDLINE, MEDLINE In-Process & Other Non-IndexedCitations and EMBASE were searched in March 2011 and CINAHL, PsycINFO and Applied Social Sciences Indexand Abstracts (ASSIA) were searched in June 2011. The search strategies that were used are reproduced inAppendix 5. No date restrictions were applied but a pragmatic decision was taken to search only for English-language publications. Reference lists of relevant studies were scrutinised and citation searching of key articleswas undertaken in Scopus and ISI Web of Knowledge. Results were downloaded into Reference Manager 12(Thomson ResearchSoft, San Francisco, CA, USA). Titles and abstracts were screened and full-text copies of allstudies deemed to be potentially relevant were obtained and assessed for inclusion by one researcher.
We acknowledge that there has been a regrettable delay between carrying out the project, including thesearches, and the publication of this report, because of serious illness of the principal investigator. Thesearches were carried out in 2010/11.
Inclusion criteria
l Studies that report how clinicians choose between diagnostic tests and what factors influence their decisions.l Screening programmes that provide criteria for the selection of screening tests.
Exclusion criteria
l Studies that report on any factors influencing test ordering decision behaviour without reference totest choice.
l Studies that consider the decision whether or not to order one particular test.l Studies that report interventions designed to influence test ordering behaviour.l Studies written in languages other than English.
METHODS
NIHR Journals Library www.journalslibrary.nihr.ac.uk
58
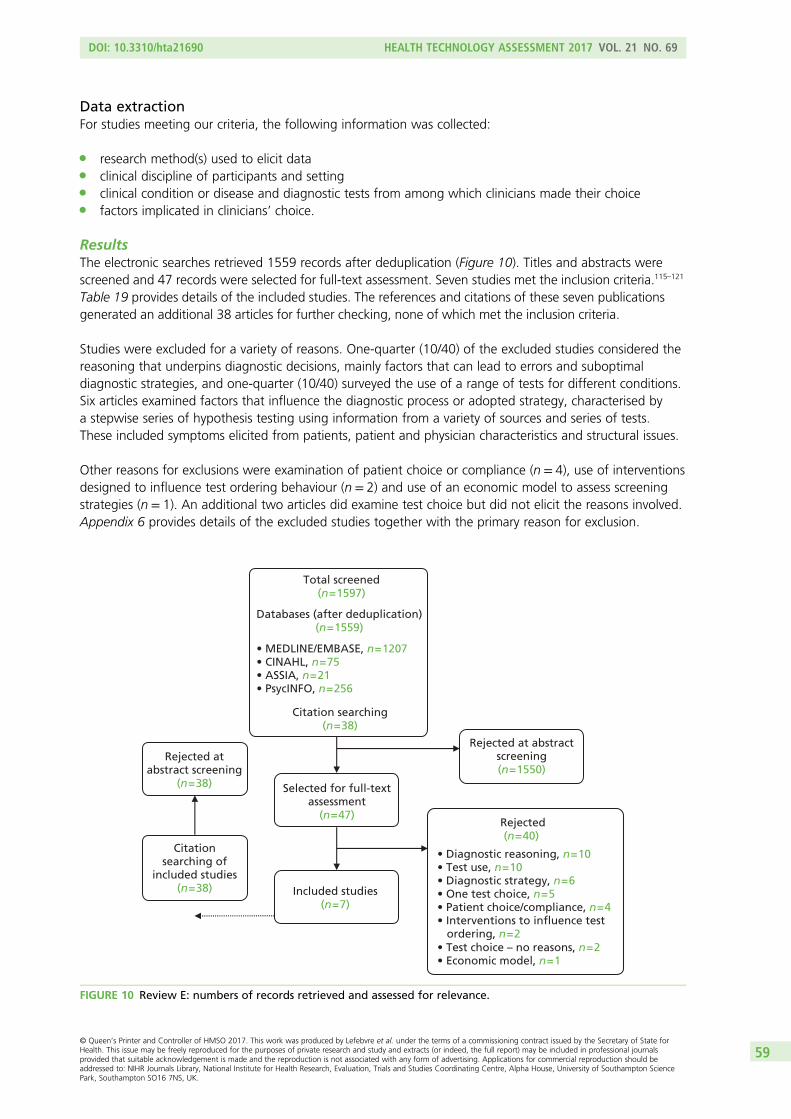
Data extractionFor studies meeting our criteria, the following information was collected:
l research method(s) used to elicit datal clinical discipline of participants and settingl clinical condition or disease and diagnostic tests from among which clinicians made their choicel factors implicated in clinicians’ choice.
ResultsThe electronic searches retrieved 1559 records after deduplication (Figure 10). Titles and abstracts werescreened and 47 records were selected for full-text assessment. Seven studies met the inclusion criteria.115–121
Table 19 provides details of the included studies. The references and citations of these seven publicationsgenerated an additional 38 articles for further checking, none of which met the inclusion criteria.
Studies were excluded for a variety of reasons. One-quarter (10/40) of the excluded studies considered thereasoning that underpins diagnostic decisions, mainly factors that can lead to errors and suboptimaldiagnostic strategies, and one-quarter (10/40) surveyed the use of a range of tests for different conditions.Six articles examined factors that influence the diagnostic process or adopted strategy, characterised bya stepwise series of hypothesis testing using information from a variety of sources and series of tests.These included symptoms elicited from patients, patient and physician characteristics and structural issues.
Other reasons for exclusions were examination of patient choice or compliance (n = 4), use of interventionsdesigned to influence test ordering behaviour (n = 2) and use of an economic model to assess screeningstrategies (n = 1). An additional two articles did examine test choice but did not elicit the reasons involved.Appendix 6 provides details of the excluded studies together with the primary reason for exclusion.
Rejected(n = 40)
• Diagnostic reasoning, n = 10• Test use, n = 10• Diagnostic strategy, n = 6• One test choice, n = 5• Patient choice/compliance, n = 4• Interventions to influence test ordering, n = 2• Test choice – no reasons, n = 2• Economic model, n = 1
Rejected at abstractscreening(n = 1550)
Total screened(n = 1597)
• MEDLINE/EMBASE, n = 1207• CINAHL, n = 75• ASSIA, n = 21• PsycINFO, n = 256
Selected for full-textassessment
(n = 47)
Included studies(n = 7)
Citationsearching of
included studies(n = 38)
Rejected atabstract screening
(n = 38)
Databases (after deduplication)(n = 1559)
Citation searching(n = 38)
FIGURE 10 Review E: numbers of records retrieved and assessed for relevance.
DOI: 10.3310/hta21690 HEALTH TECHNOLOGY ASSESSMENT 2017 VOL. 21 NO. 69
© Queen’s Printer and Controller of HMSO 2017. This work was produced by Lefebvre et al. under the terms of a commissioning contract issued by the Secretary of State forHealth. This issue may be freely reproduced for the purposes of private research and study and extracts (or indeed, the full report) may be included in professional journalsprovided that suitable acknowledgement is made and the reproduction is not associated with any form of advertising. Applications for commercial reproduction should beaddressed to: NIHR Journals Library, National Institute for Health Research, Evaluation, Trials and Studies Coordinating Centre, Alpha House, University of Southampton SciencePark, Southampton SO16 7NS, UK.
59
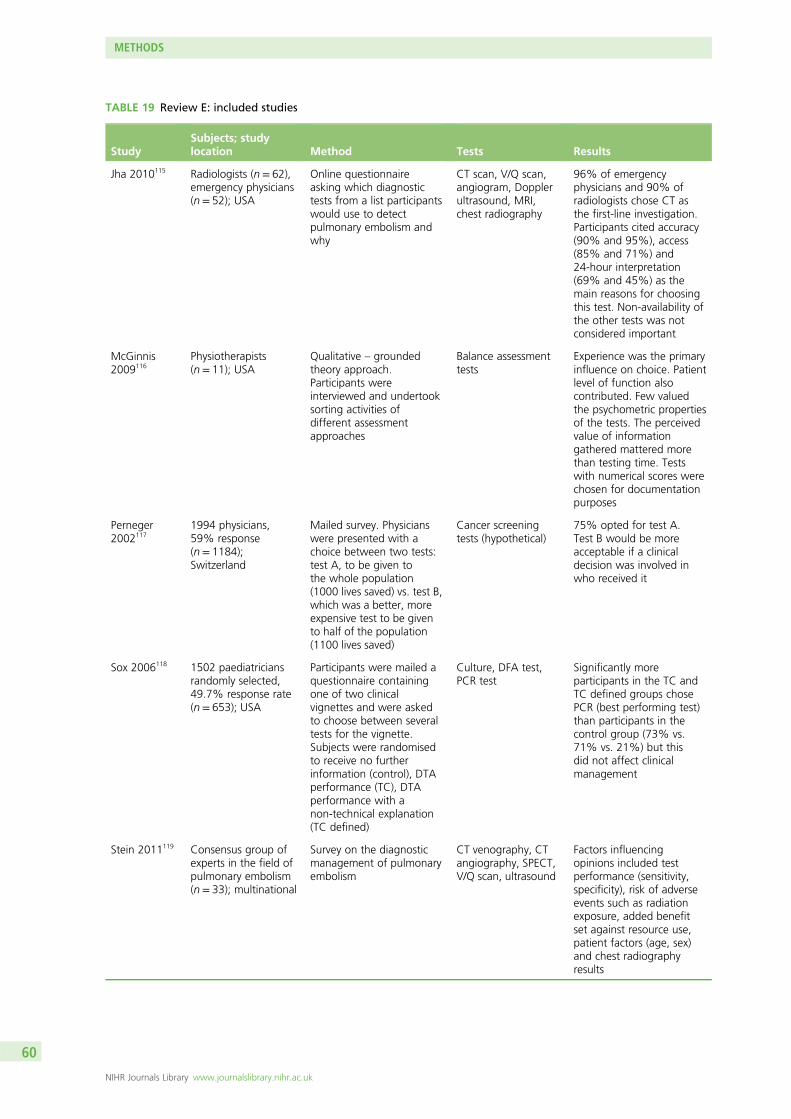
TABLE 19 Review E: included studies
StudySubjects; studylocation Method Tests Results
Jha 2010115 Radiologists (n= 62),emergency physicians(n= 52); USA
Online questionnaireasking which diagnostictests from a list participantswould use to detectpulmonary embolism andwhy
CT scan, V/Q scan,angiogram, Dopplerultrasound, MRI,chest radiography
96% of emergencyphysicians and 90% ofradiologists chose CT asthe first-line investigation.Participants cited accuracy(90% and 95%), access(85% and 71%) and24-hour interpretation(69% and 45%) as themain reasons for choosingthis test. Non-availability ofthe other tests was notconsidered important
McGinnis2009116
Physiotherapists(n= 11); USA
Qualitative – groundedtheory approach.Participants wereinterviewed and undertooksorting activities ofdifferent assessmentapproaches
Balance assessmenttests
Experience was the primaryinfluence on choice. Patientlevel of function alsocontributed. Few valuedthe psychometric propertiesof the tests. The perceivedvalue of informationgathered mattered morethan testing time. Testswith numerical scores werechosen for documentationpurposes
Perneger2002117
1994 physicians,59% response(n= 1184);Switzerland
Mailed survey. Physicianswere presented with achoice between two tests:test A, to be given tothe whole population(1000 lives saved) vs. test B,which was a better, moreexpensive test to be givento half of the population(1100 lives saved)
Cancer screeningtests (hypothetical)
75% opted for test A.Test B would be moreacceptable if a clinicaldecision was involved inwho received it
Sox 2006118 1502 paediatriciansrandomly selected,49.7% response rate(n= 653); USA
Participants were mailed aquestionnaire containingone of two clinicalvignettes and were askedto choose between severaltests for the vignette.Subjects were randomisedto receive no furtherinformation (control), DTAperformance (TC), DTAperformance with anon-technical explanation(TC defined)
Culture, DFA test,PCR test
Significantly moreparticipants in the TC andTC defined groups chosePCR (best performing test)than participants in thecontrol group (73% vs.71% vs. 21%) but thisdid not affect clinicalmanagement
Stein 2011119 Consensus group ofexperts in the field ofpulmonary embolism(n= 33); multinational
Survey on the diagnosticmanagement of pulmonaryembolism
CT venography, CTangiography, SPECT,V/Q scan, ultrasound
Factors influencingopinions included testperformance (sensitivity,specificity), risk of adverseevents such as radiationexposure, added benefitset against resource use,patient factors (age, sex)and chest radiographyresults
METHODS
NIHR Journals Library www.journalslibrary.nihr.ac.uk
60
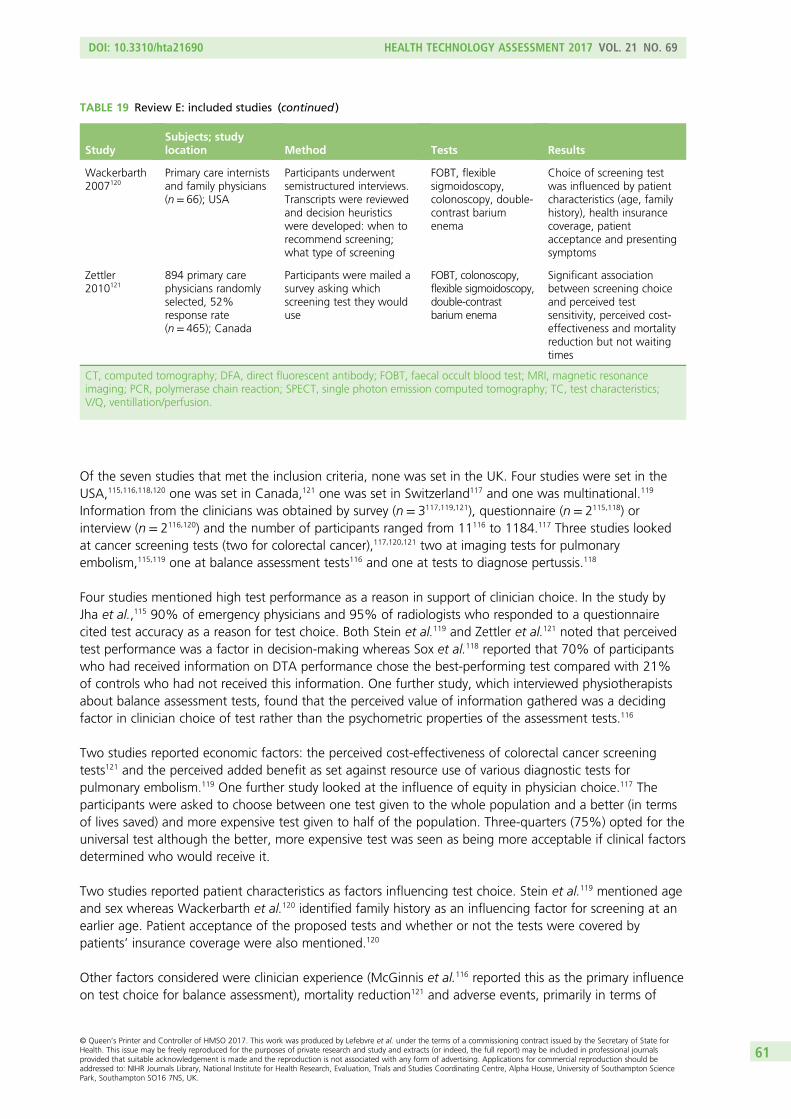
Of the seven studies that met the inclusion criteria, none was set in the UK. Four studies were set in theUSA,115,116,118,120 one was set in Canada,121 one was set in Switzerland117 and one was multinational.119
Information from the clinicians was obtained by survey (n = 3117,119,121), questionnaire (n = 2115,118) orinterview (n = 2116,120) and the number of participants ranged from 11116 to 1184.117 Three studies lookedat cancer screening tests (two for colorectal cancer),117,120,121 two at imaging tests for pulmonaryembolism,115,119 one at balance assessment tests116 and one at tests to diagnose pertussis.118
Four studies mentioned high test performance as a reason in support of clinician choice. In the study byJha et al.,115 90% of emergency physicians and 95% of radiologists who responded to a questionnairecited test accuracy as a reason for test choice. Both Stein et al.119 and Zettler et al.121 noted that perceivedtest performance was a factor in decision-making whereas Sox et al.118 reported that 70% of participantswho had received information on DTA performance chose the best-performing test compared with 21%of controls who had not received this information. One further study, which interviewed physiotherapistsabout balance assessment tests, found that the perceived value of information gathered was a decidingfactor in clinician choice of test rather than the psychometric properties of the assessment tests.116
Two studies reported economic factors: the perceived cost-effectiveness of colorectal cancer screeningtests121 and the perceived added benefit as set against resource use of various diagnostic tests forpulmonary embolism.119 One further study looked at the influence of equity in physician choice.117 Theparticipants were asked to choose between one test given to the whole population and a better (in termsof lives saved) and more expensive test given to half of the population. Three-quarters (75%) opted for theuniversal test although the better, more expensive test was seen as being more acceptable if clinical factorsdetermined who would receive it.
Two studies reported patient characteristics as factors influencing test choice. Stein et al.119 mentioned ageand sex whereas Wackerbarth et al.120 identified family history as an influencing factor for screening at anearlier age. Patient acceptance of the proposed tests and whether or not the tests were covered bypatients’ insurance coverage were also mentioned.120
Other factors considered were clinician experience (McGinnis et al.116 reported this as the primary influenceon test choice for balance assessment), mortality reduction121 and adverse events, primarily in terms of
TABLE 19 Review E: included studies (continued )
StudySubjects; studylocation Method Tests Results
Wackerbarth2007120
Primary care internistsand family physicians(n = 66); USA
Participants underwentsemistructured interviews.Transcripts were reviewedand decision heuristicswere developed: when torecommend screening;what type of screening
FOBT, flexiblesigmoidoscopy,colonoscopy, double-contrast bariumenema
Choice of screening testwas influenced by patientcharacteristics (age, familyhistory), health insurancecoverage, patientacceptance and presentingsymptoms
Zettler2010121
894 primary carephysicians randomlyselected, 52%response rate(n = 465); Canada
Participants were mailed asurvey asking whichscreening test they woulduse
FOBT, colonoscopy,flexible sigmoidoscopy,double-contrastbarium enema
Significant associationbetween screening choiceand perceived testsensitivity, perceived cost-effectiveness and mortalityreduction but not waitingtimes
CT, computed tomography; DFA, direct fluorescent antibody; FOBT, faecal occult blood test; MRI, magnetic resonanceimaging; PCR, polymerase chain reaction; SPECT, single photon emission computed tomography; TC, test characteristics;V/Q, ventillation/perfusion.
DOI: 10.3310/hta21690 HEALTH TECHNOLOGY ASSESSMENT 2017 VOL. 21 NO. 69
© Queen’s Printer and Controller of HMSO 2017. This work was produced by Lefebvre et al. under the terms of a commissioning contract issued by the Secretary of State forHealth. This issue may be freely reproduced for the purposes of private research and study and extracts (or indeed, the full report) may be included in professional journalsprovided that suitable acknowledgement is made and the reproduction is not associated with any form of advertising. Applications for commercial reproduction should beaddressed to: NIHR Journals Library, National Institute for Health Research, Evaluation, Trials and Studies Coordinating Centre, Alpha House, University of Southampton SciencePark, Southampton SO16 7NS, UK.
61
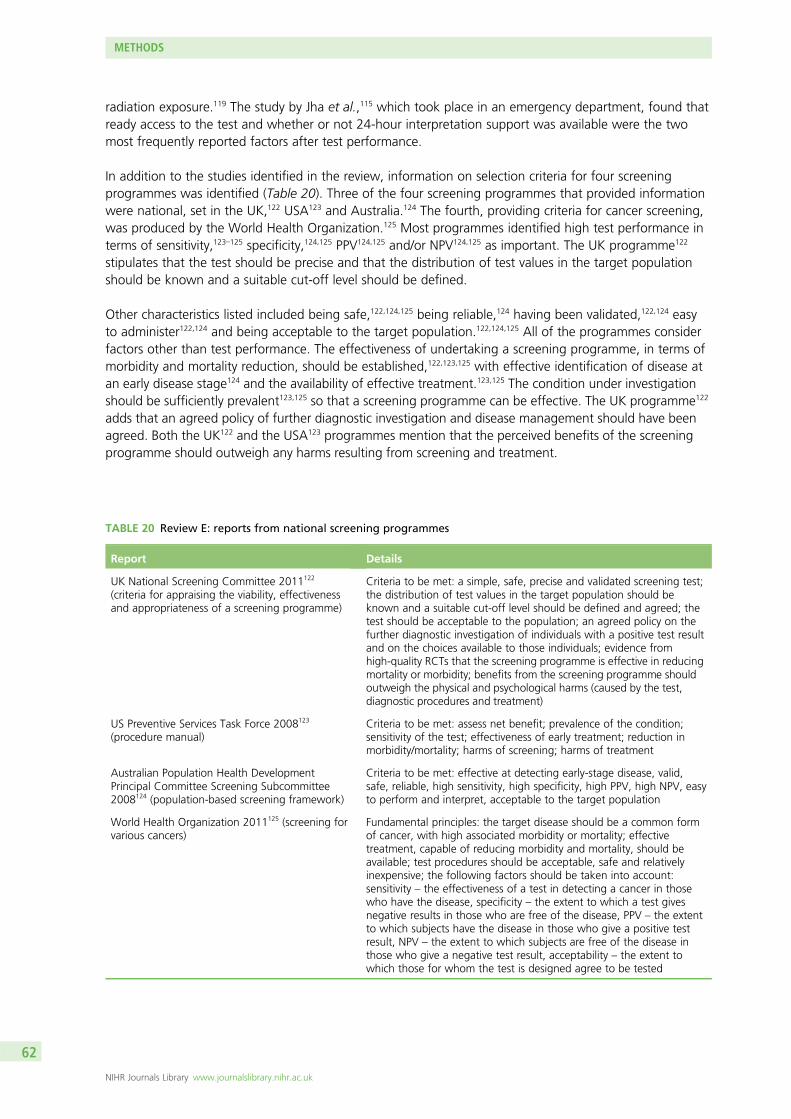
radiation exposure.119 The study by Jha et al.,115 which took place in an emergency department, found thatready access to the test and whether or not 24-hour interpretation support was available were the twomost frequently reported factors after test performance.
In addition to the studies identified in the review, information on selection criteria for four screeningprogrammes was identified (Table 20). Three of the four screening programmes that provided informationwere national, set in the UK,122 USA123 and Australia.124 The fourth, providing criteria for cancer screening,was produced by the World Health Organization.125 Most programmes identified high test performance interms of sensitivity,123–125 specificity,124,125 PPV124,125 and/or NPV124,125 as important. The UK programme122
stipulates that the test should be precise and that the distribution of test values in the target populationshould be known and a suitable cut-off level should be defined.
Other characteristics listed included being safe,122,124,125 being reliable,124 having been validated,122,124 easyto administer122,124 and being acceptable to the target population.122,124,125 All of the programmes considerfactors other than test performance. The effectiveness of undertaking a screening programme, in terms ofmorbidity and mortality reduction, should be established,122,123,125 with effective identification of disease atan early disease stage124 and the availability of effective treatment.123,125 The condition under investigationshould be sufficiently prevalent123,125 so that a screening programme can be effective. The UK programme122
adds that an agreed policy of further diagnostic investigation and disease management should have beenagreed. Both the UK122 and the USA123 programmes mention that the perceived benefits of the screeningprogramme should outweigh any harms resulting from screening and treatment.
TABLE 20 Review E: reports from national screening programmes
Report Details
UK National Screening Committee 2011122
(criteria for appraising the viability, effectivenessand appropriateness of a screening programme)
Criteria to be met: a simple, safe, precise and validated screening test;the distribution of test values in the target population should beknown and a suitable cut-off level should be defined and agreed; thetest should be acceptable to the population; an agreed policy on thefurther diagnostic investigation of individuals with a positive test resultand on the choices available to those individuals; evidence fromhigh-quality RCTs that the screening programme is effective in reducingmortality or morbidity; benefits from the screening programme shouldoutweigh the physical and psychological harms (caused by the test,diagnostic procedures and treatment)
US Preventive Services Task Force 2008123
(procedure manual)Criteria to be met: assess net benefit; prevalence of the condition;sensitivity of the test; effectiveness of early treatment; reduction inmorbidity/mortality; harms of screening; harms of treatment
Australian Population Health DevelopmentPrincipal Committee Screening Subcommittee2008124 (population-based screening framework)
Criteria to be met: effective at detecting early-stage disease, valid,safe, reliable, high sensitivity, high specificity, high PPV, high NPV, easyto perform and interpret, acceptable to the target population
World Health Organization 2011125 (screening forvarious cancers)
Fundamental principles: the target disease should be a common formof cancer, with high associated morbidity or mortality; effectivetreatment, capable of reducing morbidity and mortality, should beavailable; test procedures should be acceptable, safe and relativelyinexpensive; the following factors should be taken into account:sensitivity – the effectiveness of a test in detecting a cancer in thosewho have the disease, specificity – the extent to which a test givesnegative results in those who are free of the disease, PPV – the extentto which subjects have the disease in those who give a positive testresult, NPV – the extent to which subjects are free of the disease inthose who give a negative test result, acceptability – the extent towhich those for whom the test is designed agree to be tested
METHODS
NIHR Journals Library www.journalslibrary.nihr.ac.uk
62
DiscussionFrom this overview it seems that there is limited evidence to clarify how clinicians choose between diagnostictests. What evidence there is suggests that test performance is the main factor that informs their choice. Ithas been reported, however, that a substantial proportion of clinicians have an inaccurate understanding oftest performance parameters and apply them inaccurately126–131 and so it may be the case that choices arebeing based on false assumptions. Other factors mentioned in more than one study were the pretestprobability of having the condition, as defined by patient characteristics, patient acceptance of the test andthe costs involved in carrying out the test, which are factors that are not readily transferable to the searchprocess. Additional attributes reported related to the particular scenario being investigated: the harmfuleffect of radiation when imaging tests were being considered and the need for immediate testing andinterpretation in an emergency department were important criteria in two studies.
The screening programmes also valued high test performance but add that a test should have been provento be valid and reliable. Furthermore, the screening committees set other criteria to ensure the effectivenessof public health programmes: the prevalence of the target disease or condition as well as whether or notthere is effective disease management and treatment available. In a screening setting, where patients areasymptomatic, acceptability was mentioned as crucial by three of the screening programmes and the needto evaluate benefits against harms was also considered to be an important criterion.
ConclusionFrom the very limited evidence available in a clinical setting, it is difficult to gain much insight into howsearchers might make choices about search filters. Diagnostic test performance (perceived or known) wasthe most frequent factor mentioned and is the main factor that is readily applicable to search filter choice.However, it may be beneficial to provide additional explanatory information when reporting search filterperformance to ensure that searchers make choices based on an accurate understanding of testperformance parameters.
DOI: 10.3310/hta21690 HEALTH TECHNOLOGY ASSESSMENT 2017 VOL. 21 NO. 69
© Queen’s Printer and Controller of HMSO 2017. This work was produced by Lefebvre et al. under the terms of a commissioning contract issued by the Secretary of State forHealth. This issue may be freely reproduced for the purposes of private research and study and extracts (or indeed, the full report) may be included in professional journalsprovided that suitable acknowledgement is made and the reproduction is not associated with any form of advertising. Applications for commercial reproduction should beaddressed to: NIHR Journals Library, National Institute for Health Research, Evaluation, Trials and Studies Coordinating Centre, Alpha House, University of Southampton SciencePark, Southampton SO16 7NS, UK.
63

Chapter 3 Interviews
Aims
Interviews were carried out to inform the development of the questionnaire and the subsequent pilotwebsite and guidance sections of this report. The aim of the interviews was to learn how search filters areused by information professionals working in NICE and organisations affiliated to NICE.
Methods
A semistructured interview protocol was developed. Information professionals working for NICE, NICECollaborating Centres and NICE Evidence Review Groups (ERGs) were contacted and asked if they wouldbe willing to be interviewed.
A total of 12 interviews were carried out, capturing the views of 16 information specialists drawn from14 organisations within the NICE family (NICE, four NICE Collaborating Centres and nine NICE ERGs) (Table 21).
None of the senior NICE information staff interviewed had roles that involved operational informationretrieval work. The current roles of NICE staff focused on providing quality assurance and guidance fortheir teams. All of the NICE staff interviewed had considerable searching experience from previous roles.
The interviews lasted for approximately 45 minutes and all but one were conducted by telephone; theinterview not conducted by telephone was conducted face to face. The interviews took place between1 January 2009 and 3 March 2009.
Findings
Databases used by intervieweesThe interviewees use or have used a range of databases, many of which are health related (Table 22).Other databases mentioned were project specific and included databases that focused on social care,transport, criminology and humanitarian aid.
Interviewees’ use of search filtersCircumstances under which NICE searchers did not tend to use search filters included the following:
For short clinical guidelines, the team only use search filters on the rare occasions when the PICO[population, intervention, comparison and outcome] is restricted to study design.
Filters do not work very well when searching for diagnostic studies.
TABLE 21 Numbers of interviews and interviewees
Number
Interviewees per interview Interviews conducted
1 10
2 1
4 1
DOI: 10.3310/hta21690 HEALTH TECHNOLOGY ASSESSMENT 2017 VOL. 21 NO. 69
© Queen’s Printer and Controller of HMSO 2017. This work was produced by Lefebvre et al. under the terms of a commissioning contract issued by the Secretary of State forHealth. This issue may be freely reproduced for the purposes of private research and study and extracts (or indeed, the full report) may be included in professional journalsprovided that suitable acknowledgement is made and the reproduction is not associated with any form of advertising. Applications for commercial reproduction should beaddressed to: NIHR Journals Library, National Institute for Health Research, Evaluation, Trials and Studies Coordinating Centre, Alpha House, University of Southampton SciencePark, Southampton SO16 7NS, UK.
65
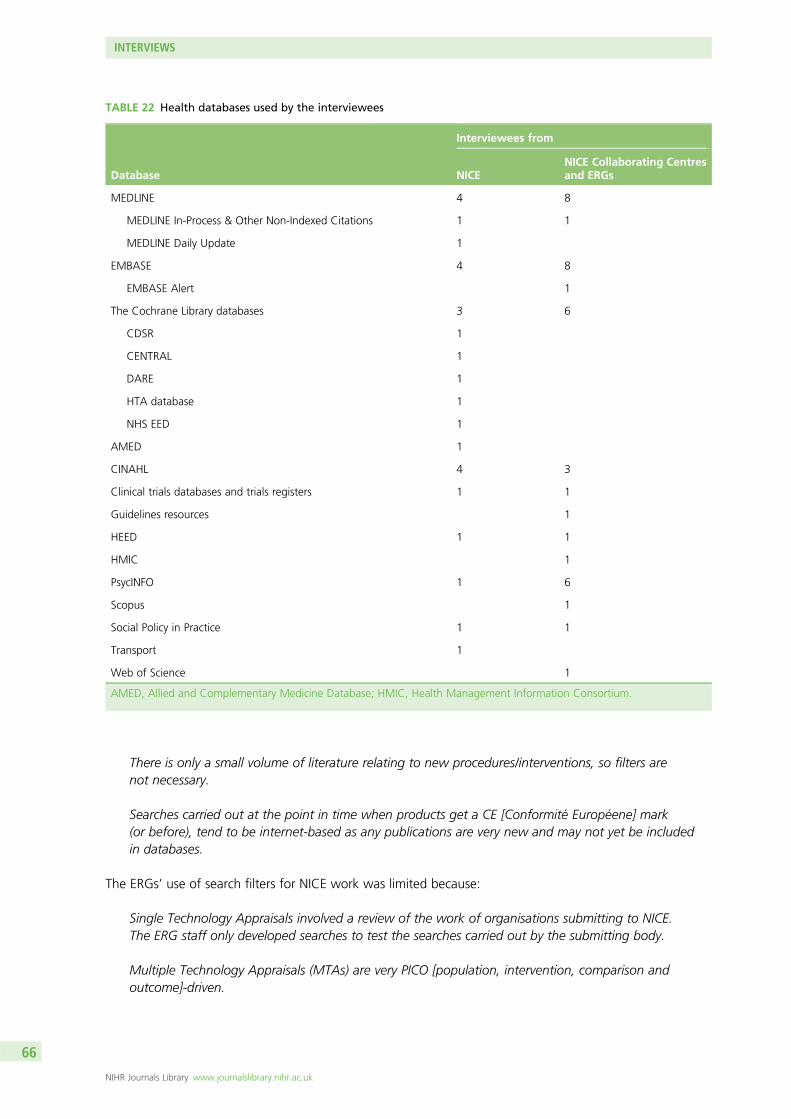
There is only a small volume of literature relating to new procedures/interventions, so filters arenot necessary.
Searches carried out at the point in time when products get a CE [Conformité Européene] mark(or before), tend to be internet-based as any publications are very new and may not yet be includedin databases.
The ERGs’ use of search filters for NICE work was limited because:
Single Technology Appraisals involved a review of the work of organisations submitting to NICE.The ERG staff only developed searches to test the searches carried out by the submitting body.
Multiple Technology Appraisals (MTAs) are very PICO [population, intervention, comparison andoutcome]-driven.
TABLE 22 Health databases used by the interviewees
Database
Interviewees from
NICENICE Collaborating Centresand ERGs
MEDLINE 4 8
MEDLINE In-Process & Other Non-Indexed Citations 1 1
MEDLINE Daily Update 1
EMBASE 4 8
EMBASE Alert 1
The Cochrane Library databases 3 6
CDSR 1
CENTRAL 1
DARE 1
HTA database 1
NHS EED 1
AMED 1
CINAHL 4 3
Clinical trials databases and trials registers 1 1
Guidelines resources 1
HEED 1 1
HMIC 1
PsycINFO 1 6
Scopus 1
Social Policy in Practice 1 1
Transport 1
Web of Science 1
AMED, Allied and Complementary Medicine Database; HMIC, Health Management Information Consortium.
INTERVIEWS
NIHR Journals Library www.journalslibrary.nihr.ac.uk
66
However, the occasions when filters are used by an ERG included:
When carrying out searches for systematic reviews that include RCTs.
To help focus the question further than PICO [population, intervention, comparison and outcome]permits, to make the project manageable in terms of record numbers retrieved.
With projects looking at a single study type which are usually small projects with limited resources.
To build searches to answer guideline questions, except on the occasions where search results weresmall in number.
To identify economic evidence.
To carry out limited focused searches.
The filters that interviewees said that they used were:
Cochrane RCT filters and RCT filters [unspecified].
Diagnostic test accuracy filters.
Qualitative filters [drafted by the interviewee].
Filters produced by HIRU [Health Information Research Unit]/the McMaster Hedges Team.
Where would you look for a search filter?Interviewees provided several responses to this question:
CRD website/blog/ISSG search filters page/InterTASC website [note that the last two sites mentionedhere are the same].
Would post a question to discussion lists.
Look in the Cochrane Handbook.
Speak to colleagues.
Consult an in-house methodology database.
Consult an in-house search manual.
Look at methods used in previous project.
Developing and amending search filtersSome interviewees were comfortable with translating filters for use in different databases and some werenot. Interviewees were comfortable translating MEDLINE search filters for use in other databases but werenot comfortable translating non-MEDLINE filters for use in other databases. In the absence of objectivelyderived filters, however, interviewees said that they would have translated non-MEDLINE filters to runthem in other databases.
Some interviewees said that to identify qualitative research they would tend to write/amend their ownfilters. Some respondents said that they would amend filters for scoping searches. A number of
DOI: 10.3310/hta21690 HEALTH TECHNOLOGY ASSESSMENT 2017 VOL. 21 NO. 69
© Queen’s Printer and Controller of HMSO 2017. This work was produced by Lefebvre et al. under the terms of a commissioning contract issued by the Secretary of State forHealth. This issue may be freely reproduced for the purposes of private research and study and extracts (or indeed, the full report) may be included in professional journalsprovided that suitable acknowledgement is made and the reproduction is not associated with any form of advertising. Applications for commercial reproduction should beaddressed to: NIHR Journals Library, National Institute for Health Research, Evaluation, Trials and Studies Coordinating Centre, Alpha House, University of Southampton SciencePark, Southampton SO16 7NS, UK.
67
respondents noted that filters need to be written (or adapted) on a review-by-review basis depending onwhat was needed from the search. Several respondents indicated that they would adapt filters occasionally,for example if a filter was too sensitive they would take out a few lines to make it more specific.
Reporting the use of search filtersA number of approaches were reported around the documentation of the use of search filters:
Citing the search filters used and reporting if amendments had been made to an existing filter or if thestrategy had been based on an existing filter.
Writing search strategies up fully without explicitly citing the filters used.
Including search filters as part of published strategies but not explicitly identifying them.
Documenting the use of all agreed filters, amendments and the rationale behind the amendments.
Keeping a record of search strategies but not describing them when the strategy is not written upfor publication.
Using a process document which included a section about which filters have been used; document thefilter when there is a need to justify the use of a filter.
Methods of keeping up to dateInterviewees’ attitudes towards keeping up to date ranged from ‘Difficult – something that is always onthe “to do” list’ to ‘As we are such a small community I feel that it is unlikely that important informationabout a new filter will be missed’. Interviewees reported using the following methods to keep up to date:
A NICE internal current awareness bulletin.
E-mail lists and specialist groups (e.g. Cochrane IRMG [Information Retrieval Methods Group], HTAiIRG [Information Resources Group], National Library of Medicine list for MeSH changes and updates).
Meetings {e.g. ISSG, groups in the wider NICE family (e.g. NCC [National Collaborating Centre]Information Specialist Network meetings)}.
Websites (e.g. ISSG and McMaster Hedges team).
Conferences (e.g. Cochrane, HTAi).
Journal publications.
Setting up a citation search.
Choosing between filtersInterviewees reported a wide variety of actions that they might take when choosing between two or morefilters, including:
In cases where two search filters appear similar (in terms of sensitivity and specificity) I tend to take thegood parts from each and test to see that the results still include benchmark papers and then makesure client is happy with the approach.
INTERVIEWS
NIHR Journals Library www.journalslibrary.nihr.ac.uk
68

Sensitivity and specificity figures can give a guide but they are still reporting the results from thatinstance. They may have been combined with a specific topic or used in a specific context and will stillhave to be investigated for appropriateness.
I would test for sensitivity and specificity. The final choice, however, is still arbitrary, relying ongut-feeling and the requirements of the specific project.
Test against a set of target references.
If I had sufficient time would try both and test results against each other; if there was a lack of timeI would use the most current.
I assess the methods used to develop the filter and the extent to which it matched needs of the search(sensitivity, precision, a mixture of the two).
I would back up my decision with academic literature.
I run both filters and compare the results to see where there are gaps/duplications in retrieval betweenthe two and to see which retrieves the more relevant papers.
I try both – I use my gut feeling rather than anything formal.
Provenance – I judge according to who developed the filter.
Look on ISSG website to see if anyone has completed an appraisal.
Search testing is pragmatic/intuitive rather than being a formal scientific process (there is not enoughtime to do this).
I would like someone to be quite directive about which are the best filters to use in different situationsand be able to quickly see how these filters have been evaluated and how decisions have beenreached (e.g. as in the Cochrane Handbook).
As a junior information specialist, the decision on which filter to use is made by senior colleagues.
It would be easier to choose if the Collaborating Centres and NICE were using the same filters andthen informed everyone when changes/updates have occurred.
The YHEC [York Health Economics Consortium] ‘Getting the best out of search filters’ training coursehas been useful information to help critically appraise filters.
What would help you choose between filters?Interviewees provided a range of responses when asked what would help them choose between filters:
The interpretation of the filter in simple terms – such as power calculations, statistical methods etc.that are difficult to understand, particularly for those with limited time – a synopsis would be agreat help.
It is difficult to fully understand all of the complicated technical methods used to devise and testsearch filters. There is an element of trusting the researchers involved – I can critically appraise to acertain level but not entirely.
DOI: 10.3310/hta21690 HEALTH TECHNOLOGY ASSESSMENT 2017 VOL. 21 NO. 69
© Queen’s Printer and Controller of HMSO 2017. This work was produced by Lefebvre et al. under the terms of a commissioning contract issued by the Secretary of State forHealth. This issue may be freely reproduced for the purposes of private research and study and extracts (or indeed, the full report) may be included in professional journalsprovided that suitable acknowledgement is made and the reproduction is not associated with any form of advertising. Applications for commercial reproduction should beaddressed to: NIHR Journals Library, National Institute for Health Research, Evaluation, Trials and Studies Coordinating Centre, Alpha House, University of Southampton SciencePark, Southampton SO16 7NS, UK.
69
A summary documenting sensitivity/specificity would help to choose between filters, although thismight be subjective (e.g. a document would be good for one search but not for another).
Sensitivity and specificity are important.
Some measure of rating would be useful but I would need to have confidence in whoever had carriedout the rating.
Benefits of filtersInterviewees said that the main benefits of filters were that they could target the results of searches andreduce the volume of literature retrieved. It was also mentioned that the use of established filters (e.g. theCochrane RCT filters), which have been evaluated and tested, reflected well on search quality. Additionally,using filters means that the searchers can benefit from someone else’s expertise and time spent developingthe filters.
Limitations of filtersInterviewees expressed a range of concerns about search filters:
There is always a chance something has been missed.
Filters still identify a lot of irrelevant records.
Poor indexing doesn’t help searching.
Few, if any, are used appropriately.
If there is a mistake, it will be replicated through all searches/databases.
Transferability can be a problem, e.g. the Fleming qualitative filter was originally devised for use innursing topics and probably works fine there but it was not appropriate for a diagnostic type study.
Not many filters are reliable, there are only a few databases that you can use them in and databaseskeep changing so it is important to check that the filter is up-to-date.
A filter gets published, people talk about it and it gets known and it starts getting used. But negativeresults/experiences tend not to be talked about or published and therefore there can be bias.
Areas where filters are needed/existing filters need to be improvedInterviewees were asked if there were any topics for which filters are needed or any filters that could beimproved. The responses included the following:
Population age.
HRQoL (including topic-specific instruments).
Tested filters for observational studies.
Epidemiology.
Diagnostics.
Adverse events and safety issues.
INTERVIEWS
NIHR Journals Library www.journalslibrary.nihr.ac.uk
70
Prognostic filters.
Qualitative research filters.
An improvement to the diagnostic accuracy filter.
Other commentsInterviewees were asked for other final comments and responded with both general and specific points:
The methods behind derivation of filters are impenetrable, so there is a certain amount of trustinvolved in using them. But this is an improvement on pragmatically deriving a study design filterfrom scratch.
Databases need some/better coding for SRs [systematic reviews] and DTAs [DTA studies].
PRISMA [Preferred Reporting Items for Systematic Reviews and Meta-Analyses] guidelines aboutreporting search strategies need to be reviewed.
There is a need for academics to recognise the importance of searching in its own right – this mightbe helped if information specialists were to routinely write-up protocols and include academicarguments for the approach they took.
Perhaps developers of similar filters could work collaboratively/liaise with one another to see if there isreally a need for two or more filters which (appear to) carry out the same role.
There are issues with different database interfaces. For example, a filter devised for use in Ovid is likelyto work very differently if translated into another interface, such as EBSCO (or Web of Science orDialog DataStar, etc.).
More education on what filters can and can’t do is important as there are still examples of filters beingused incorrectly, for example, an economic filter being used in NHS EED, an RCT filter used in CENTRAL.
Filters are needed for more databases, rather than more filters for MEDLINE (and EMBASE).
There are problems with EMBASE and the number of Emtree terms attached to the records leading tothe retrieval of more irrelevant records.
It would be useful if the ISSG Search Filter Resource website indicated when something new hadbeen added.
Patient experience/issues filter (SIGN) [Scottish Intercollegiate Guidelines Network] needs to bedisaggregated – it is over 200 lines long.
Discussion
The interviewees were information specialists involved in searching as part of NICE or an organisationproviding support for the development of NICE guidelines and technology appraisals. It seems likely thatthe majority of the interviewees were experienced searchers but fairly senior. This means that some of ourinterviewees were no longer searching currently on a daily basis and using filters but had done so in thepast. Nevertheless, the views of senior staff are valuable as they represent the staff that are setting searchstandards and policies within NICE. It should be noted that some interviews were undertaken in groupsand this could have influenced the responses.
DOI: 10.3310/hta21690 HEALTH TECHNOLOGY ASSESSMENT 2017 VOL. 21 NO. 69
© Queen’s Printer and Controller of HMSO 2017. This work was produced by Lefebvre et al. under the terms of a commissioning contract issued by the Secretary of State forHealth. This issue may be freely reproduced for the purposes of private research and study and extracts (or indeed, the full report) may be included in professional journalsprovided that suitable acknowledgement is made and the reproduction is not associated with any form of advertising. Applications for commercial reproduction should beaddressed to: NIHR Journals Library, National Institute for Health Research, Evaluation, Trials and Studies Coordinating Centre, Alpha House, University of Southampton SciencePark, Southampton SO16 7NS, UK.
71
The interviews revealed the wide range of searching tasks that are undertaken in the NICE context and thevarious points at which search filters can be used. However, there were many tasks for which search filterswere not considered necessary or appropriate. The use of search filters seemed to be linked to reducinglarge numbers of records, introducing focus and assisting with searches that are focused on a singlestudy type.
The Cochrane RCT filter was most often cited as a filter in common use as well as filters produced by theMcMaster Hedges team. The methods used to identify filters were various but the most frequentlymentioned resource was the ISSG Search Filters Resource.6 This is likely to reflect the high profile given tothis resource by the NICE family of information specialists.
Interviewees’ practices when using, adapting and reporting search filters were far from uniform, possiblyindicating an absence of accepted published formal guidance on these issues. In the absence of guidance,variations in practice can occur.
Current awareness methods were varied and extensive. Interviewees were stretched in terms of keepinginformed about search filter developments because of time limitations. This is likely to be because this isonly one of many aspects of the rapidly evolving field of information retrieval methods.
When choosing filters we observed that interviewees were trying to make judgements around the relativesensitivity, specificity and precision of the filters but were conscious of factors impeding this. These factorsincluded time constraints and knowledge gaps. The reference by interviewees to ‘gut feeling’ shows therelatively informal and pragmatic nature of search strategy testing and the absence of formal assessmentor comparison tools to remove the necessity of relying on ‘gut feeling’. Some interviewees expressed adesire for more guidance on the best filters to use or chose filters based on the authorship of the filter.This willingness to rely on the judgements and recommendations of others possibly reflects both a lack oftime and a perception of an absence of the required skills to make informed judgements. Some desire forstandardisation or guidance within the NICE family was also expressed.
Interviewees expressed their opinions on how making decisions about search filters could be assisted.These opinions were focused on making information about filters less technical and more user-friendly andoffering ‘bottom lines’ or ratings. A synopsis of the interpretation of a filter was an additional feature thatwas suggested.
The disparity between the respondents’ perceptions of the benefits and their perceptions of the limitationsof search filters was marked. The respondents identified far more limitations than benefits and thelimitations (poor precision, indexing weaknesses, filters created for a few key databases only) reflected thecomplex nature of searching, which filters alone cannot be expected to resolve.
However, the promotion of search filters as a tool could be improved by providing more guidance on bestpractice, summarising filters in non-technical, user-friendly ways and providing training on search- andfilter-related issues. There appears to be demand for the development of filters for a range of methodsareas and for a range of databases, but the limiting factor seems to be a lack of resources to developsuch filters.
INTERVIEWS
NIHR Journals Library www.journalslibrary.nihr.ac.uk
72
Chapter 4 Questionnaire
Sections of this chapter have been previously published in Health Information and Libraries Journal.Reproduced with permission from Beale et al.132 © 2014 The authors. Health Information and LibrariesJournal © 2014 Health Libraries Journal. Health Information & Libraries Journal, 31, pp. 133–147.
Questionnaire methods
A questionnaire survey was developed to obtain information on searchers’ knowledge of and use of searchfilters. The questions were based on findings from the reviews and the interviews that had already beenundertaken as part of this project. The questionnaire (see Appendix 1) was made available on the YorkHealth Economics Consortium (YHEC) website.
Invitations to participate in the questionnaire survey were sent to seven e-mail lists:
1. LIS-MEDICAL (1523 individuals belonging to an open discussion list for members of the UK medical andhealth-care library community and other interested information workers)
2. [email protected] [204 subscribers belonging to the open discussion list of the Cochrane IRMG(Information Retrieval Methods Group)]
3. [email protected] (subscribers are information specialists who work for the ERGs providing services toNICE and other associated individuals)
4. [email protected] (subscribers are information specialists who are members of the HTAiorganisation and other associated individuals)
5. Campbell IRMG (30 subscribers belonging to the Campbell IRMG and other associated individuals)6. Cochrane Trials Search Co-ordinators (TSCs) (100 members of the Cochrane TSCs e-mail discussion
list – now known as Cochrane Information Specialists)7. [email protected] [1000 members of the discussion list of the European Association for Health
Information and Libraries (EAHIL)].
The invitation e-mail provided some background to the project and a link to the electronic questionnaire.To assist with completion, the e-mail also contained details of how to obtain a Microsoft Word 2010(Microsoft Corporation, Redmond, WA, USA) version of the questionnaire for those who did not wish tocomplete the questionnaire online.
Additionally, short notifications were posted on Twitter (www.twitter.com; Twitter, Inc., San Francisco,CA, USA) and on the YHEC Facebook page (www.facebook.com; Facebook, Inc., Menlo Park, CA, USA),asking interested individuals to contact the YHEC for a link to the questionnaire survey.
The survey was available for completion during a 4-week period (22 July–18 August 2011), with e-mailreminders sent out 1 week before the final deadline.
In total, 90 survey responses were returned. It was not possible to calculate a response rate as it was notknown how many individuals were members of more than one list, nor was it possible to determine thenumber of individuals who were alerted to the survey via the Twitter or Facebook messages.
Questionnaire results
What is your job title?Forty-three different job titles were provided. Seventy of the 88 respondents who answered thisquestion (79.5%) reported a job title that included the word ‘library’, ‘librarian’ or ‘information’.
DOI: 10.3310/hta21690 HEALTH TECHNOLOGY ASSESSMENT 2017 VOL. 21 NO. 69
© Queen’s Printer and Controller of HMSO 2017. This work was produced by Lefebvre et al. under the terms of a commissioning contract issued by the Secretary of State forHealth. This issue may be freely reproduced for the purposes of private research and study and extracts (or indeed, the full report) may be included in professional journalsprovided that suitable acknowledgement is made and the reproduction is not associated with any form of advertising. Applications for commercial reproduction should beaddressed to: NIHR Journals Library, National Institute for Health Research, Evaluation, Trials and Studies Coordinating Centre, Alpha House, University of Southampton SciencePark, Southampton SO16 7NS, UK.
73

The remaining respondents reported one of the following job titles (two respondents did not answerthis question):
l Assistant Professorl Associate Scientistl Consultant Physician and PhD candidatel Director, systematic review research unitl e-resources Co-ordinatorl Health Communication Specialistl Learning Resources Officerl Medical Documentalistl Research Assistantl Research Fellowl Senior Lecturerl TSC.
Over 75% of the respondents worked directly in information or library services, with the remainingrespondents holding positions in which research and information finding would seem to be a key aspect ofthe role and knowledge of search filters could be assumed.
How long have you been searching databases such as MEDLINE?The questionnaire was completed by experienced searchers, all with a minimum of 1 year’s experience ofdatabase searching and with nearly half (48.9%; 44/90) having > 10 years of database searchingexperience (Table 23).
How often do you develop new search strategies as part of your work?Three-quarters of questionnaire respondents (75.6%; 68/90) reported that they developed searches at leastonce a week and half of these said that they developed searches daily (Table 24).
For what purposes do you carry out searches within your organisation?The questionnaire sought information on what types of searches were carried out. Respondents werepresented with the following three options and were asked to tick all that applied:
l rapid searches to answer brief questions (78.9%; 71/90)l scoping searches to estimate the size of the literature on a topic (81.1%; 73/90)l extensive searches to inform evidence synthesis such as guidelines, systematic reviews and technology
assessments (94.4%; 85/90).
TABLE 23 Length of time that respondents had been searching databases
Years of searching experience Number of respondents Percentage of respondents
< 1 0 0.0
1–5 15 16.7
6–10 29 32.2
11–15 15 16.7
16–20 15 16.7
≥ 21 14 15.6
No response 2 2.2
Total 90 100.0
QUESTIONNAIRE
NIHR Journals Library www.journalslibrary.nihr.ac.uk
74
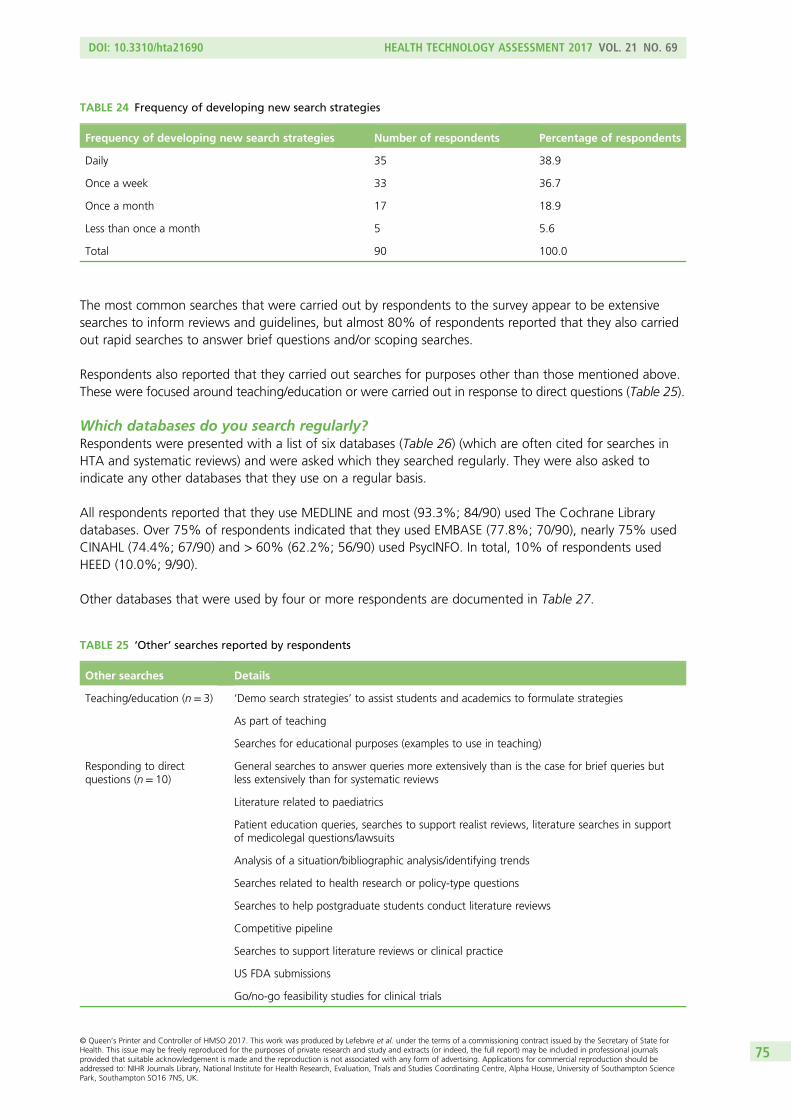
The most common searches that were carried out by respondents to the survey appear to be extensivesearches to inform reviews and guidelines, but almost 80% of respondents reported that they also carriedout rapid searches to answer brief questions and/or scoping searches.
Respondents also reported that they carried out searches for purposes other than those mentioned above.These were focused around teaching/education or were carried out in response to direct questions (Table 25).
Which databases do you search regularly?Respondents were presented with a list of six databases (Table 26) (which are often cited for searches inHTA and systematic reviews) and were asked which they searched regularly. They were also asked toindicate any other databases that they use on a regular basis.
All respondents reported that they use MEDLINE and most (93.3%; 84/90) used The Cochrane Librarydatabases. Over 75% of respondents indicated that they used EMBASE (77.8%; 70/90), nearly 75% usedCINAHL (74.4%; 67/90) and > 60% (62.2%; 56/90) used PsycINFO. In total, 10% of respondents usedHEED (10.0%; 9/90).
Other databases that were used by four or more respondents are documented in Table 27.
TABLE 24 Frequency of developing new search strategies
Frequency of developing new search strategies Number of respondents Percentage of respondents
Daily 35 38.9
Once a week 33 36.7
Once a month 17 18.9
Less than once a month 5 5.6
Total 90 100.0
TABLE 25 ‘Other’ searches reported by respondents
Other searches Details
Teaching/education (n = 3) ‘Demo search strategies’ to assist students and academics to formulate strategies
As part of teaching
Searches for educational purposes (examples to use in teaching)
Responding to directquestions (n= 10)
General searches to answer queries more extensively than is the case for brief queries butless extensively than for systematic reviews
Literature related to paediatrics
Patient education queries, searches to support realist reviews, literature searches in supportof medicolegal questions/lawsuits
Analysis of a situation/bibliographic analysis/identifying trends
Searches related to health research or policy-type questions
Searches to help postgraduate students conduct literature reviews
Competitive pipeline
Searches to support literature reviews or clinical practice
US FDA submissions
Go/no-go feasibility studies for clinical trials
DOI: 10.3310/hta21690 HEALTH TECHNOLOGY ASSESSMENT 2017 VOL. 21 NO. 69
© Queen’s Printer and Controller of HMSO 2017. This work was produced by Lefebvre et al. under the terms of a commissioning contract issued by the Secretary of State forHealth. This issue may be freely reproduced for the purposes of private research and study and extracts (or indeed, the full report) may be included in professional journalsprovided that suitable acknowledgement is made and the reproduction is not associated with any form of advertising. Applications for commercial reproduction should beaddressed to: NIHR Journals Library, National Institute for Health Research, Evaluation, Trials and Studies Coordinating Centre, Alpha House, University of Southampton SciencePark, Southampton SO16 7NS, UK.
75
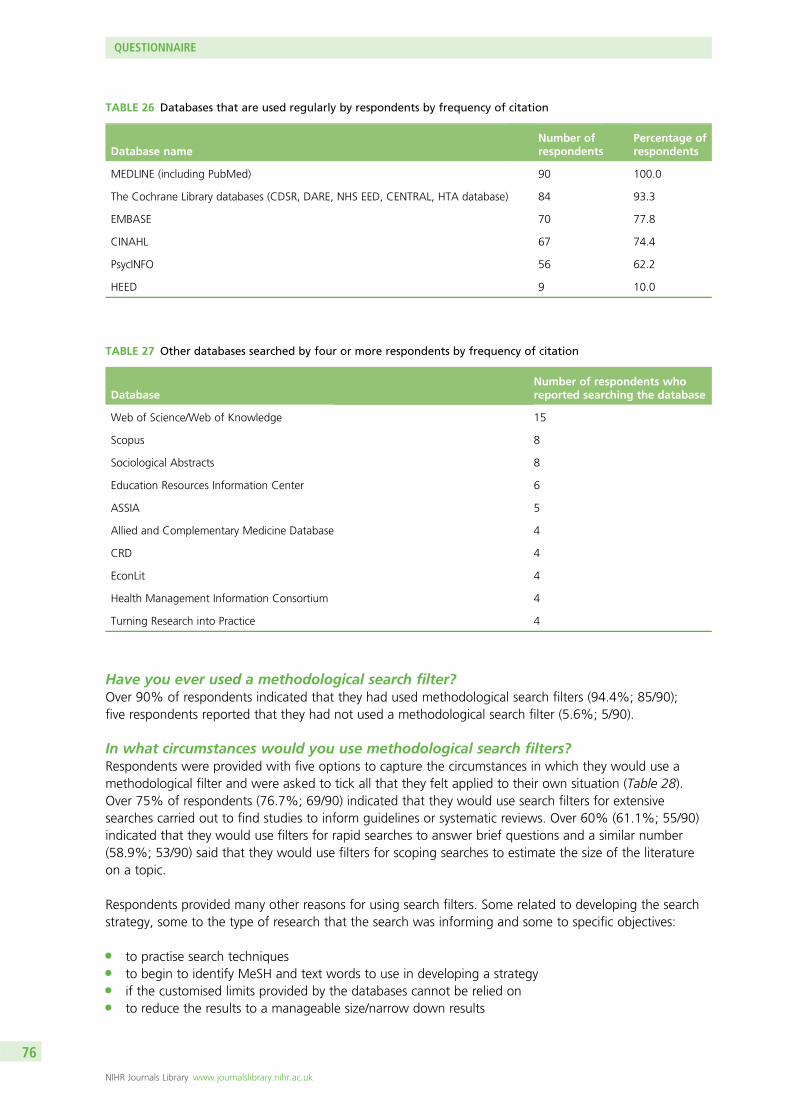
Have you ever used a methodological search filter?Over 90% of respondents indicated that they had used methodological search filters (94.4%; 85/90);five respondents reported that they had not used a methodological search filter (5.6%; 5/90).
In what circumstances would you use methodological search filters?Respondents were provided with five options to capture the circumstances in which they would use amethodological filter and were asked to tick all that they felt applied to their own situation (Table 28).Over 75% of respondents (76.7%; 69/90) indicated that they would use search filters for extensivesearches carried out to find studies to inform guidelines or systematic reviews. Over 60% (61.1%; 55/90)indicated that they would use filters for rapid searches to answer brief questions and a similar number(58.9%; 53/90) said that they would use filters for scoping searches to estimate the size of the literatureon a topic.
Respondents provided many other reasons for using search filters. Some related to developing the searchstrategy, some to the type of research that the search was informing and some to specific objectives:
l to practise search techniquesl to begin to identify MeSH and text words to use in developing a strategyl if the customised limits provided by the databases cannot be relied onl to reduce the results to a manageable size/narrow down results
TABLE 26 Databases that are used regularly by respondents by frequency of citation
Database nameNumber ofrespondents
Percentage ofrespondents
MEDLINE (including PubMed) 90 100.0
The Cochrane Library databases (CDSR, DARE, NHS EED, CENTRAL, HTA database) 84 93.3
EMBASE 70 77.8
CINAHL 67 74.4
PsycINFO 56 62.2
HEED 9 10.0
TABLE 27 Other databases searched by four or more respondents by frequency of citation
DatabaseNumber of respondents whoreported searching the database
Web of Science/Web of Knowledge 15
Scopus 8
Sociological Abstracts 8
Education Resources Information Center 6
ASSIA 5
Allied and Complementary Medicine Database 4
CRD 4
EconLit 4
Health Management Information Consortium 4
Turning Research into Practice 4
QUESTIONNAIRE
NIHR Journals Library www.journalslibrary.nihr.ac.uk
76
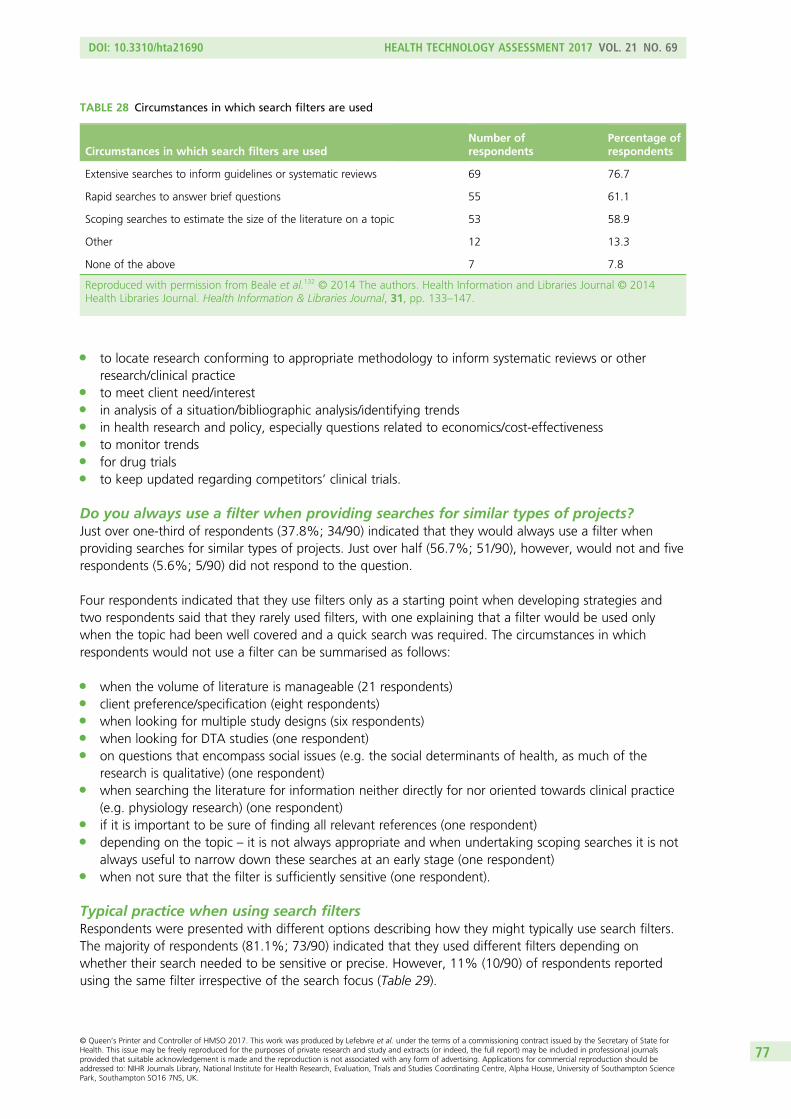
l to locate research conforming to appropriate methodology to inform systematic reviews or otherresearch/clinical practice
l to meet client need/interestl in analysis of a situation/bibliographic analysis/identifying trendsl in health research and policy, especially questions related to economics/cost-effectivenessl to monitor trendsl for drug trialsl to keep updated regarding competitors’ clinical trials.
Do you always use a filter when providing searches for similar types of projects?Just over one-third of respondents (37.8%; 34/90) indicated that they would always use a filter whenproviding searches for similar types of projects. Just over half (56.7%; 51/90), however, would not and fiverespondents (5.6%; 5/90) did not respond to the question.
Four respondents indicated that they use filters only as a starting point when developing strategies andtwo respondents said that they rarely used filters, with one explaining that a filter would be used onlywhen the topic had been well covered and a quick search was required. The circumstances in whichrespondents would not use a filter can be summarised as follows:
l when the volume of literature is manageable (21 respondents)l client preference/specification (eight respondents)l when looking for multiple study designs (six respondents)l when looking for DTA studies (one respondent)l on questions that encompass social issues (e.g. the social determinants of health, as much of the
research is qualitative) (one respondent)l when searching the literature for information neither directly for nor oriented towards clinical practice
(e.g. physiology research) (one respondent)l if it is important to be sure of finding all relevant references (one respondent)l depending on the topic – it is not always appropriate and when undertaking scoping searches it is not
always useful to narrow down these searches at an early stage (one respondent)l when not sure that the filter is sufficiently sensitive (one respondent).
Typical practice when using search filtersRespondents were presented with different options describing how they might typically use search filters.The majority of respondents (81.1%; 73/90) indicated that they used different filters depending onwhether their search needed to be sensitive or precise. However, 11% (10/90) of respondents reportedusing the same filter irrespective of the search focus (Table 29).
TABLE 28 Circumstances in which search filters are used
Circumstances in which search filters are usedNumber ofrespondents
Percentage ofrespondents
Extensive searches to inform guidelines or systematic reviews 69 76.7
Rapid searches to answer brief questions 55 61.1
Scoping searches to estimate the size of the literature on a topic 53 58.9
Other 12 13.3
None of the above 7 7.8
Reproduced with permission from Beale et al.132 © 2014 The authors. Health Information and Libraries Journal © 2014Health Libraries Journal. Health Information & Libraries Journal, 31, pp. 133–147.
DOI: 10.3310/hta21690 HEALTH TECHNOLOGY ASSESSMENT 2017 VOL. 21 NO. 69
© Queen’s Printer and Controller of HMSO 2017. This work was produced by Lefebvre et al. under the terms of a commissioning contract issued by the Secretary of State forHealth. This issue may be freely reproduced for the purposes of private research and study and extracts (or indeed, the full report) may be included in professional journalsprovided that suitable acknowledgement is made and the reproduction is not associated with any form of advertising. Applications for commercial reproduction should beaddressed to: NIHR Journals Library, National Institute for Health Research, Evaluation, Trials and Studies Coordinating Centre, Alpha House, University of Southampton SciencePark, Southampton SO16 7NS, UK.
77
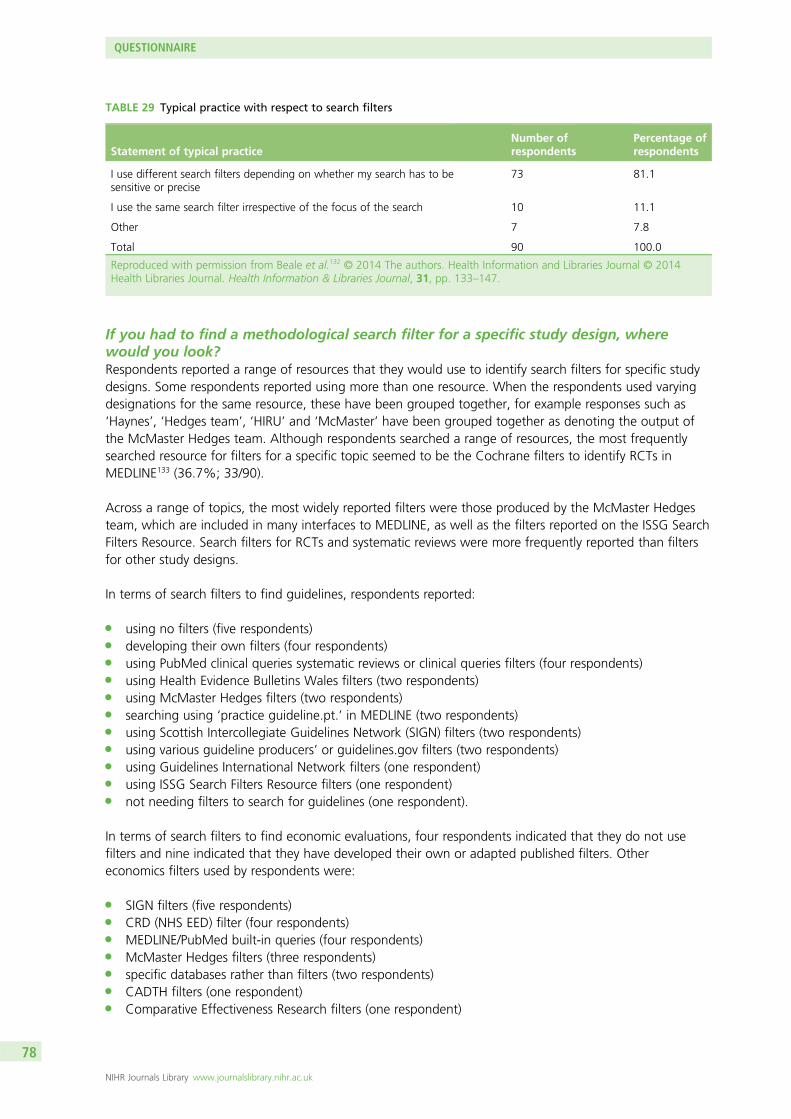
If you had to find a methodological search filter for a specific study design, wherewould you look?Respondents reported a range of resources that they would use to identify search filters for specific studydesigns. Some respondents reported using more than one resource. When the respondents used varyingdesignations for the same resource, these have been grouped together, for example responses such as‘Haynes’, ‘Hedges team’, ‘HIRU’ and ‘McMaster’ have been grouped together as denoting the output ofthe McMaster Hedges team. Although respondents searched a range of resources, the most frequentlysearched resource for filters for a specific topic seemed to be the Cochrane filters to identify RCTs inMEDLINE133 (36.7%; 33/90).
Across a range of topics, the most widely reported filters were those produced by the McMaster Hedgesteam, which are included in many interfaces to MEDLINE, as well as the filters reported on the ISSG SearchFilters Resource. Search filters for RCTs and systematic reviews were more frequently reported than filtersfor other study designs.
In terms of search filters to find guidelines, respondents reported:
l using no filters (five respondents)l developing their own filters (four respondents)l using PubMed clinical queries systematic reviews or clinical queries filters (four respondents)l using Health Evidence Bulletins Wales filters (two respondents)l using McMaster Hedges filters (two respondents)l searching using ‘practice guideline.pt.’ in MEDLINE (two respondents)l using Scottish Intercollegiate Guidelines Network (SIGN) filters (two respondents)l using various guideline producers’ or guidelines.gov filters (two respondents)l using Guidelines International Network filters (one respondent)l using ISSG Search Filters Resource filters (one respondent)l not needing filters to search for guidelines (one respondent).
In terms of search filters to find economic evaluations, four respondents indicated that they do not usefilters and nine indicated that they have developed their own or adapted published filters. Othereconomics filters used by respondents were:
l SIGN filters (five respondents)l CRD (NHS EED) filter (four respondents)l MEDLINE/PubMed built-in queries (four respondents)l McMaster Hedges filters (three respondents)l specific databases rather than filters (two respondents)l CADTH filters (one respondent)l Comparative Effectiveness Research filters (one respondent)
TABLE 29 Typical practice with respect to search filters
Statement of typical practiceNumber ofrespondents
Percentage ofrespondents
I use different search filters depending on whether my search has to besensitive or precise
73 81.1
I use the same search filter irrespective of the focus of the search 10 11.1
Other 7 7.8
Total 90 100.0
Reproduced with permission from Beale et al.132 © 2014 The authors. Health Information and Libraries Journal © 2014Health Libraries Journal. Health Information & Libraries Journal, 31, pp. 133–147.
QUESTIONNAIRE
NIHR Journals Library www.journalslibrary.nihr.ac.uk
78
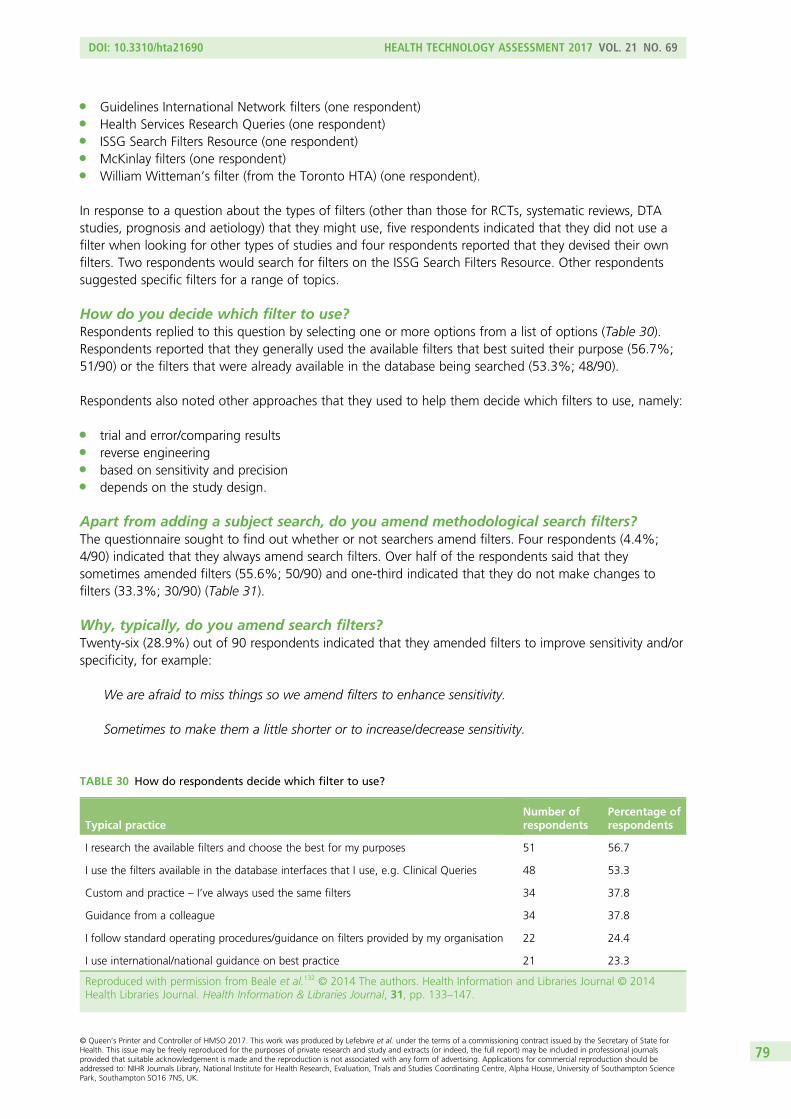
l Guidelines International Network filters (one respondent)l Health Services Research Queries (one respondent)l ISSG Search Filters Resource (one respondent)l McKinlay filters (one respondent)l William Witteman’s filter (from the Toronto HTA) (one respondent).
In response to a question about the types of filters (other than those for RCTs, systematic reviews, DTAstudies, prognosis and aetiology) that they might use, five respondents indicated that they did not use afilter when looking for other types of studies and four respondents reported that they devised their ownfilters. Two respondents would search for filters on the ISSG Search Filters Resource. Other respondentssuggested specific filters for a range of topics.
How do you decide which filter to use?Respondents replied to this question by selecting one or more options from a list of options (Table 30).Respondents reported that they generally used the available filters that best suited their purpose (56.7%;51/90) or the filters that were already available in the database being searched (53.3%; 48/90).
Respondents also noted other approaches that they used to help them decide which filters to use, namely:
l trial and error/comparing resultsl reverse engineeringl based on sensitivity and precisionl depends on the study design.
Apart from adding a subject search, do you amend methodological search filters?The questionnaire sought to find out whether or not searchers amend filters. Four respondents (4.4%;4/90) indicated that they always amend search filters. Over half of the respondents said that theysometimes amended filters (55.6%; 50/90) and one-third indicated that they do not make changes tofilters (33.3%; 30/90) (Table 31).
Why, typically, do you amend search filters?Twenty-six (28.9%) out of 90 respondents indicated that they amended filters to improve sensitivity and/orspecificity, for example:
We are afraid to miss things so we amend filters to enhance sensitivity.
Sometimes to make them a little shorter or to increase/decrease sensitivity.
TABLE 30 How do respondents decide which filter to use?
Typical practiceNumber ofrespondents
Percentage ofrespondents
I research the available filters and choose the best for my purposes 51 56.7
I use the filters available in the database interfaces that I use, e.g. Clinical Queries 48 53.3
Custom and practice – I’ve always used the same filters 34 37.8
Guidance from a colleague 34 37.8
I follow standard operating procedures/guidance on filters provided by my organisation 22 24.4
I use international/national guidance on best practice 21 23.3
Reproduced with permission from Beale et al.132 © 2014 The authors. Health Information and Libraries Journal © 2014Health Libraries Journal. Health Information & Libraries Journal, 31, pp. 133–147.
DOI: 10.3310/hta21690 HEALTH TECHNOLOGY ASSESSMENT 2017 VOL. 21 NO. 69
© Queen’s Printer and Controller of HMSO 2017. This work was produced by Lefebvre et al. under the terms of a commissioning contract issued by the Secretary of State forHealth. This issue may be freely reproduced for the purposes of private research and study and extracts (or indeed, the full report) may be included in professional journalsprovided that suitable acknowledgement is made and the reproduction is not associated with any form of advertising. Applications for commercial reproduction should beaddressed to: NIHR Journals Library, National Institute for Health Research, Evaluation, Trials and Studies Coordinating Centre, Alpha House, University of Southampton SciencePark, Southampton SO16 7NS, UK.
79
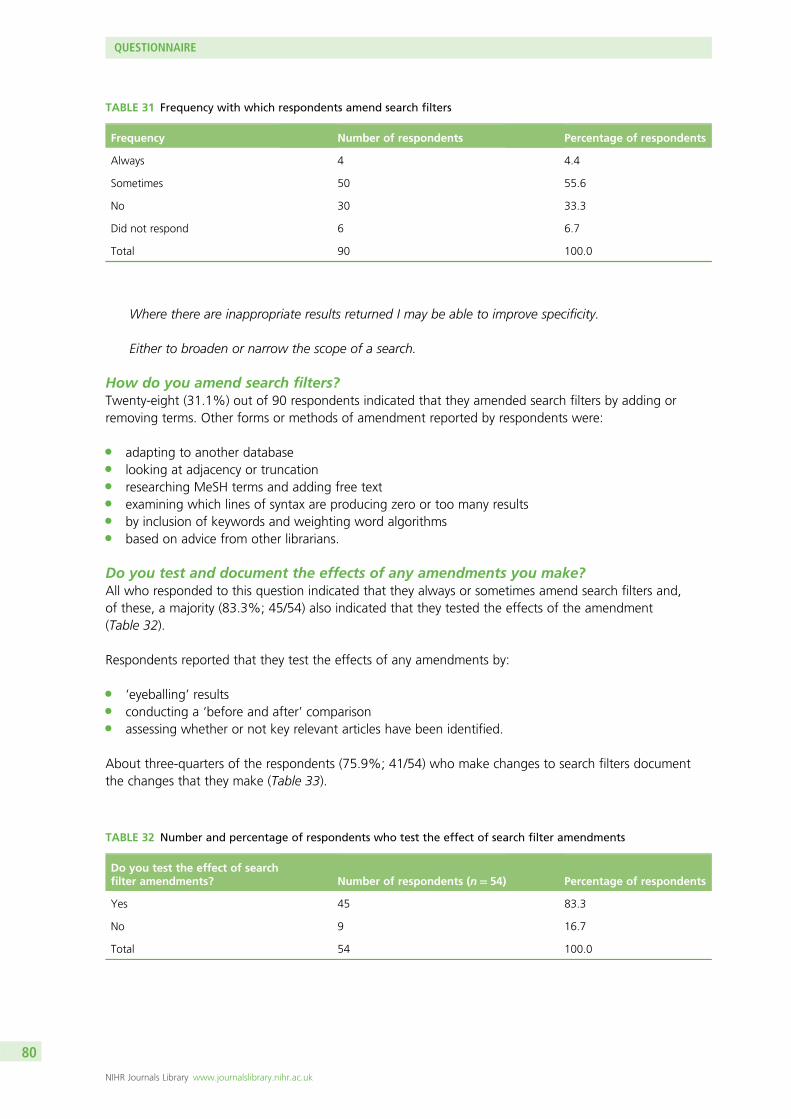
Where there are inappropriate results returned I may be able to improve specificity.
Either to broaden or narrow the scope of a search.
How do you amend search filters?Twenty-eight (31.1%) out of 90 respondents indicated that they amended search filters by adding orremoving terms. Other forms or methods of amendment reported by respondents were:
l adapting to another databasel looking at adjacency or truncationl researching MeSH terms and adding free textl examining which lines of syntax are producing zero or too many resultsl by inclusion of keywords and weighting word algorithmsl based on advice from other librarians.
Do you test and document the effects of any amendments you make?All who responded to this question indicated that they always or sometimes amend search filters and,of these, a majority (83.3%; 45/54) also indicated that they tested the effects of the amendment(Table 32).
Respondents reported that they test the effects of any amendments by:
l ‘eyeballing’ resultsl conducting a ‘before and after’ comparisonl assessing whether or not key relevant articles have been identified.
About three-quarters of the respondents (75.9%; 41/54) who make changes to search filters documentthe changes that they make (Table 33).
TABLE 32 Number and percentage of respondents who test the effect of search filter amendments
Do you test the effect of searchfilter amendments? Number of respondents (n= 54) Percentage of respondents
Yes 45 83.3
No 9 16.7
Total 54 100.0
TABLE 31 Frequency with which respondents amend search filters
Frequency Number of respondents Percentage of respondents
Always 4 4.4
Sometimes 50 55.6
No 30 33.3
Did not respond 6 6.7
Total 90 100.0
QUESTIONNAIRE
NIHR Journals Library www.journalslibrary.nihr.ac.uk
80
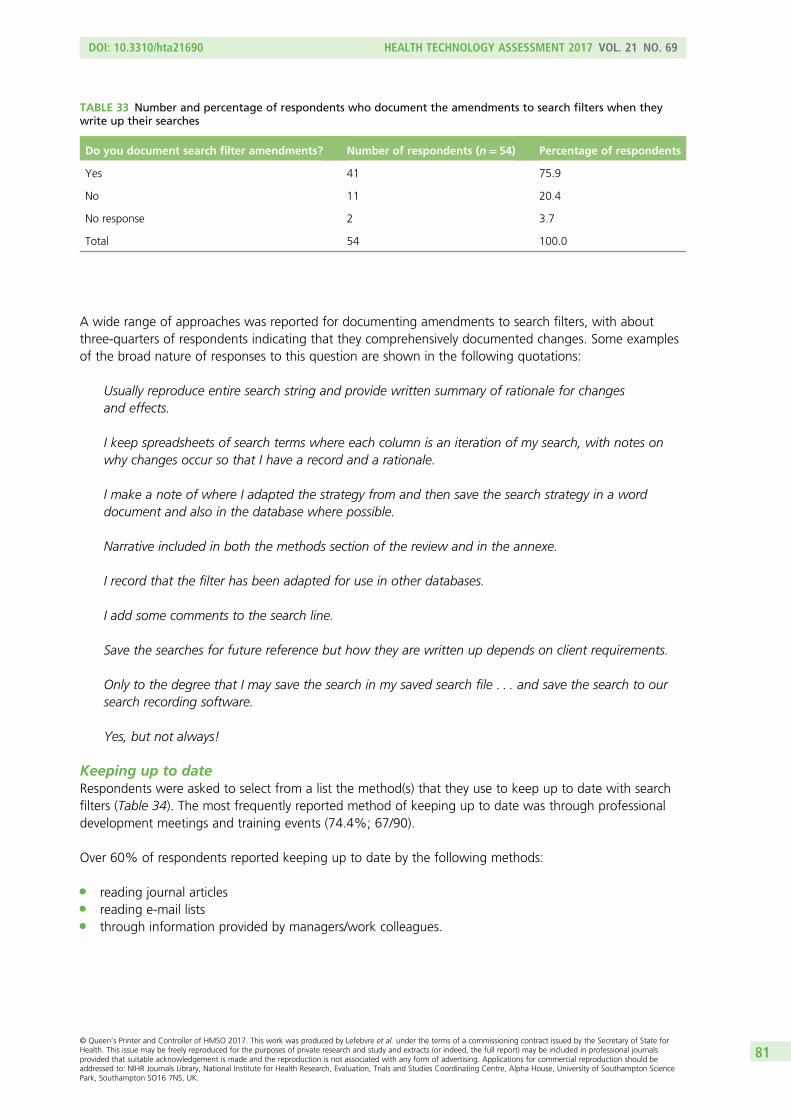
A wide range of approaches was reported for documenting amendments to search filters, with aboutthree-quarters of respondents indicating that they comprehensively documented changes. Some examplesof the broad nature of responses to this question are shown in the following quotations:
Usually reproduce entire search string and provide written summary of rationale for changesand effects.
I keep spreadsheets of search terms where each column is an iteration of my search, with notes onwhy changes occur so that I have a record and a rationale.
I make a note of where I adapted the strategy from and then save the search strategy in a worddocument and also in the database where possible.
Narrative included in both the methods section of the review and in the annexe.
I record that the filter has been adapted for use in other databases.
I add some comments to the search line.
Save the searches for future reference but how they are written up depends on client requirements.
Only to the degree that I may save the search in my saved search file . . . and save the search to oursearch recording software.
Yes, but not always!
Keeping up to dateRespondents were asked to select from a list the method(s) that they use to keep up to date with searchfilters (Table 34). The most frequently reported method of keeping up to date was through professionaldevelopment meetings and training events (74.4%; 67/90).
Over 60% of respondents reported keeping up to date by the following methods:
l reading journal articlesl reading e-mail listsl through information provided by managers/work colleagues.
TABLE 33 Number and percentage of respondents who document the amendments to search filters when theywrite up their searches
Do you document search filter amendments? Number of respondents (n= 54) Percentage of respondents
Yes 41 75.9
No 11 20.4
No response 2 3.7
Total 54 100.0
DOI: 10.3310/hta21690 HEALTH TECHNOLOGY ASSESSMENT 2017 VOL. 21 NO. 69
© Queen’s Printer and Controller of HMSO 2017. This work was produced by Lefebvre et al. under the terms of a commissioning contract issued by the Secretary of State forHealth. This issue may be freely reproduced for the purposes of private research and study and extracts (or indeed, the full report) may be included in professional journalsprovided that suitable acknowledgement is made and the reproduction is not associated with any form of advertising. Applications for commercial reproduction should beaddressed to: NIHR Journals Library, National Institute for Health Research, Evaluation, Trials and Studies Coordinating Centre, Alpha House, University of Southampton SciencePark, Southampton SO16 7NS, UK.
81
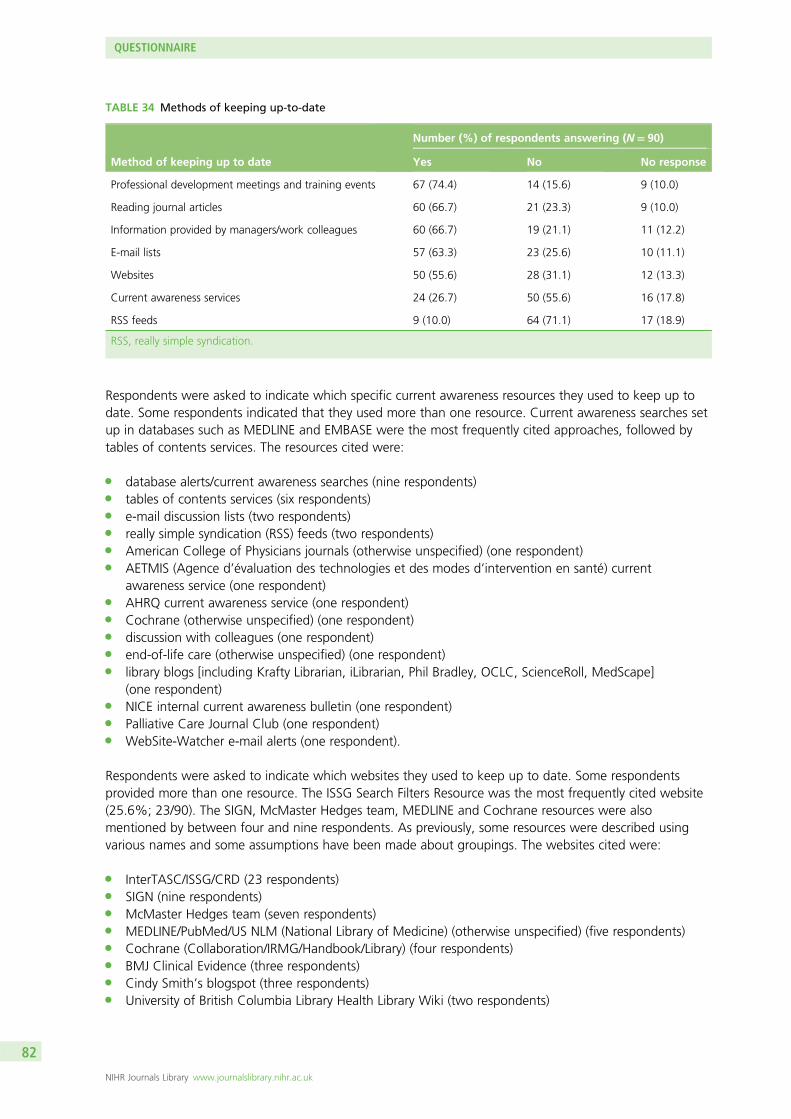
Respondents were asked to indicate which specific current awareness resources they used to keep up todate. Some respondents indicated that they used more than one resource. Current awareness searches setup in databases such as MEDLINE and EMBASE were the most frequently cited approaches, followed bytables of contents services. The resources cited were:
l database alerts/current awareness searches (nine respondents)l tables of contents services (six respondents)l e-mail discussion lists (two respondents)l really simple syndication (RSS) feeds (two respondents)l American College of Physicians journals (otherwise unspecified) (one respondent)l AETMIS (Agence d’évaluation des technologies et des modes d’intervention en santé) current
awareness service (one respondent)l AHRQ current awareness service (one respondent)l Cochrane (otherwise unspecified) (one respondent)l discussion with colleagues (one respondent)l end-of-life care (otherwise unspecified) (one respondent)l library blogs [including Krafty Librarian, iLibrarian, Phil Bradley, OCLC, ScienceRoll, MedScape]
(one respondent)l NICE internal current awareness bulletin (one respondent)l Palliative Care Journal Club (one respondent)l WebSite-Watcher e-mail alerts (one respondent).
Respondents were asked to indicate which websites they used to keep up to date. Some respondentsprovided more than one resource. The ISSG Search Filters Resource was the most frequently cited website(25.6%; 23/90). The SIGN, McMaster Hedges team, MEDLINE and Cochrane resources were alsomentioned by between four and nine respondents. As previously, some resources were described usingvarious names and some assumptions have been made about groupings. The websites cited were:
l InterTASC/ISSG/CRD (23 respondents)l SIGN (nine respondents)l McMaster Hedges team (seven respondents)l MEDLINE/PubMed/US NLM (National Library of Medicine) (otherwise unspecified) (five respondents)l Cochrane (Collaboration/IRMG/Handbook/Library) (four respondents)l BMJ Clinical Evidence (three respondents)l Cindy Smith’s blogspot (three respondents)l University of British Columbia Library Health Library Wiki (two respondents)
TABLE 34 Methods of keeping up-to-date
Method of keeping up to date
Number (%) of respondents answering (N= 90)
Yes No No response
Professional development meetings and training events 67 (74.4) 14 (15.6) 9 (10.0)
Reading journal articles 60 (66.7) 21 (23.3) 9 (10.0)
Information provided by managers/work colleagues 60 (66.7) 19 (21.1) 11 (12.2)
E-mail lists 57 (63.3) 23 (25.6) 10 (11.1)
Websites 50 (55.6) 28 (31.1) 12 (13.3)
Current awareness services 24 (26.7) 50 (55.6) 16 (17.8)
RSS feeds 9 (10.0) 64 (71.1) 17 (18.9)
RSS, really simple syndication.
QUESTIONNAIRE
NIHR Journals Library www.journalslibrary.nihr.ac.uk
82
l BestBETs (one respondent)l Centre for Evidence-Based Medicine (one respondent)l Google (one respondent)l government and non-governmental health organisations (one respondent)l HTAi Vortal (one respondent)l Knowledge Network – shared space for Scottish librarians (one respondent)l national and university websites (otherwise unspecified) (one respondent)l US NLM e-text on HTA (one respondent)l Ovid databases (otherwise unspecified) (one respondent)l World Health Organization (one respondent).
Respondents were asked to indicate which e-mail lists they used to keep up to date. The most frequentlyreported lists were Cochrane e-mail discussion lists (19 respondents) and expertsearching (ninerespondents). National medical librarian discussion lists for the USA, Canada and the UK were frequentlymentioned. The e-mail lists cited were:
l Cochrane information specialist e-mail discussion lists (IRMG/librarians/methods/TSCs) (19 respondents)l expertsearching (nine respondents)l CANMEDLIB (eight respondents)l LIS-MEDICAL (eight respondents)l MEDLIB-L (eight respondents)l HTAi Information Resources Group (seven respondents)l Evidence-Based-Health (five respondents)l InterTASC ISSG (five respondents)l CLIN-LIB (two respondents)l local health libraries network (unspecified) (two respondents)l EAHIL-L (one respondent)l Evidence-Based-Libraries (one respondent)l Health Sciences Libraries Group discussion group for the Health Sciences Libraries Group of Ireland
(one respondent)l LIB-HELIX discussion group for library staff in the NHS South Central area of the UK (one respondent)l LIS-NURSING (one respondent)l medical librarian lists (unspecified) (one respondent)l NCC-information specialists (one respondent)l professional e-mail lists (unspecified) (one respondent)l SYS-REVIEW (one respondent)l WEBENZ e-mail list for medical information specialists in the Netherlands (one respondent).
Respondents were asked to indicate which RSS feeds they subscribed to to help to keep up to date. RSSfeed usage was low, with the most frequently reported feed being Cindy Smith’s (most likely Schmidt’s)blogspot (http://pubmedsearches.blogspot.ca/) and Evidence Based Library and Information Practice(EBLIP).134 The RSS feeds cited were:
l Cindy Smith’s (most likely Schmidt’s) blogspot (three respondents)l EBLIP (three respondents)l PubMed New and Noteworthy/PubMed Technical Bulletin (two respondents)l Health Information and Libraries Journal (one respondent)l journal tables of contents (unspecified) (one respondent)l librarian blogs (unspecified) (one respondent)l LISNews (one respondent)l medical libraries (unspecified) (one respondent)l OvidSP Updates (one respondent)l websites (unspecified) (one respondent).
DOI: 10.3310/hta21690 HEALTH TECHNOLOGY ASSESSMENT 2017 VOL. 21 NO. 69
© Queen’s Printer and Controller of HMSO 2017. This work was produced by Lefebvre et al. under the terms of a commissioning contract issued by the Secretary of State forHealth. This issue may be freely reproduced for the purposes of private research and study and extracts (or indeed, the full report) may be included in professional journalsprovided that suitable acknowledgement is made and the reproduction is not associated with any form of advertising. Applications for commercial reproduction should beaddressed to: NIHR Journals Library, National Institute for Health Research, Evaluation, Trials and Studies Coordinating Centre, Alpha House, University of Southampton SciencePark, Southampton SO16 7NS, UK.
83
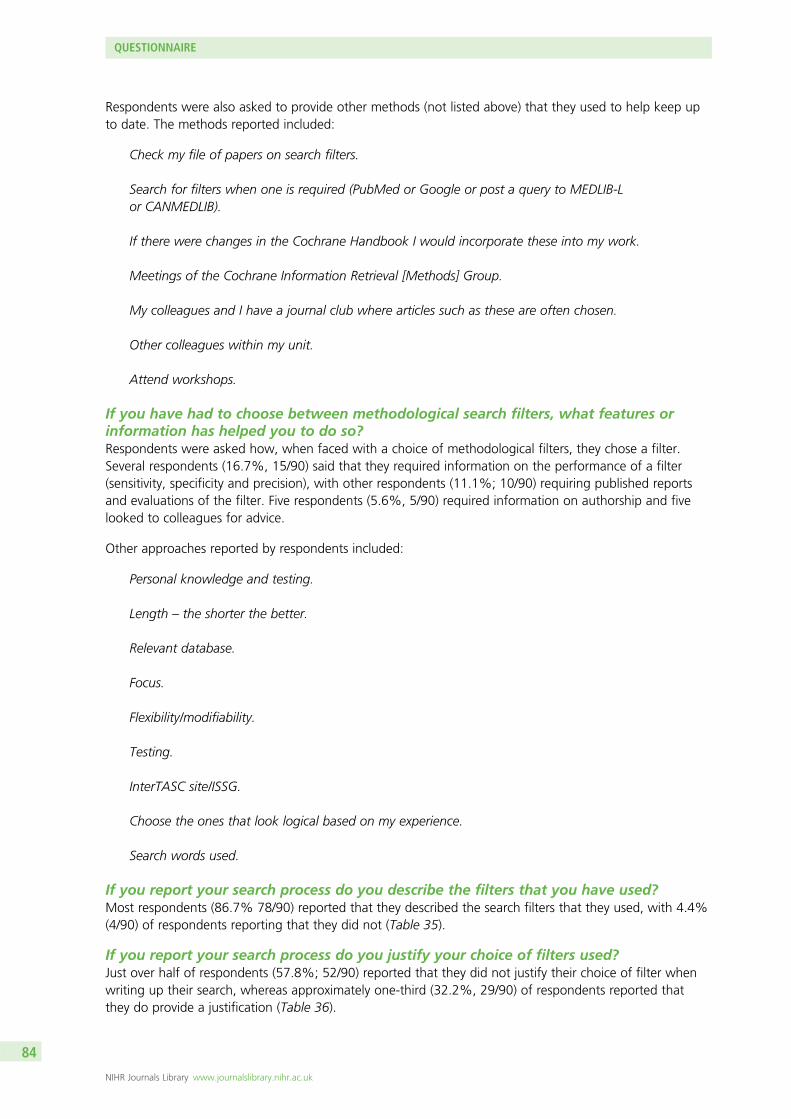
Respondents were also asked to provide other methods (not listed above) that they used to help keep upto date. The methods reported included:
Check my file of papers on search filters.
Search for filters when one is required (PubMed or Google or post a query to MEDLIB-Lor CANMEDLIB).
If there were changes in the Cochrane Handbook I would incorporate these into my work.
Meetings of the Cochrane Information Retrieval [Methods] Group.
My colleagues and I have a journal club where articles such as these are often chosen.
Other colleagues within my unit.
Attend workshops.
If you have had to choose between methodological search filters, what features orinformation has helped you to do so?Respondents were asked how, when faced with a choice of methodological filters, they chose a filter.Several respondents (16.7%, 15/90) said that they required information on the performance of a filter(sensitivity, specificity and precision), with other respondents (11.1%; 10/90) requiring published reportsand evaluations of the filter. Five respondents (5.6%, 5/90) required information on authorship and fivelooked to colleagues for advice.
Other approaches reported by respondents included:
Personal knowledge and testing.
Length – the shorter the better.
Relevant database.
Focus.
Flexibility/modifiability.
Testing.
InterTASC site/ISSG.
Choose the ones that look logical based on my experience.
Search words used.
If you report your search process do you describe the filters that you have used?Most respondents (86.7% 78/90) reported that they described the search filters that they used, with 4.4%(4/90) of respondents reporting that they did not (Table 35).
If you report your search process do you justify your choice of filters used?Just over half of respondents (57.8%; 52/90) reported that they did not justify their choice of filter whenwriting up their search, whereas approximately one-third (32.2%, 29/90) of respondents reported thatthey do provide a justification (Table 36).
QUESTIONNAIRE
NIHR Journals Library www.journalslibrary.nihr.ac.uk
84
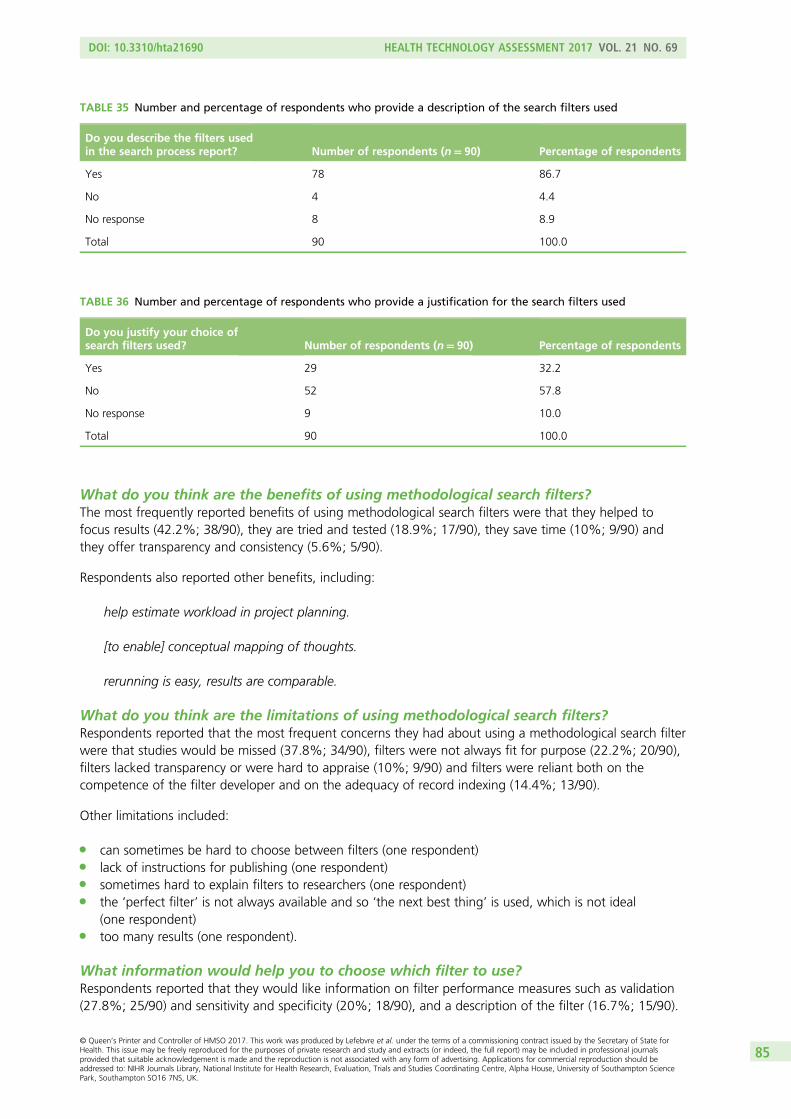
What do you think are the benefits of using methodological search filters?The most frequently reported benefits of using methodological search filters were that they helped tofocus results (42.2%; 38/90), they are tried and tested (18.9%; 17/90), they save time (10%; 9/90) andthey offer transparency and consistency (5.6%; 5/90).
Respondents also reported other benefits, including:
help estimate workload in project planning.
[to enable] conceptual mapping of thoughts.
rerunning is easy, results are comparable.
What do you think are the limitations of using methodological search filters?Respondents reported that the most frequent concerns they had about using a methodological search filterwere that studies would be missed (37.8%; 34/90), filters were not always fit for purpose (22.2%; 20/90),filters lacked transparency or were hard to appraise (10%; 9/90) and filters were reliant both on thecompetence of the filter developer and on the adequacy of record indexing (14.4%; 13/90).
Other limitations included:
l can sometimes be hard to choose between filters (one respondent)l lack of instructions for publishing (one respondent)l sometimes hard to explain filters to researchers (one respondent)l the ‘perfect filter’ is not always available and so ‘the next best thing’ is used, which is not ideal
(one respondent)l too many results (one respondent).
What information would help you to choose which filter to use?Respondents reported that they would like information on filter performance measures such as validation(27.8%; 25/90) and sensitivity and specificity (20%; 18/90), and a description of the filter (16.7%; 15/90).
TABLE 36 Number and percentage of respondents who provide a justification for the search filters used
Do you justify your choice ofsearch filters used? Number of respondents (n= 90) Percentage of respondents
Yes 29 32.2
No 52 57.8
No response 9 10.0
Total 90 100.0
TABLE 35 Number and percentage of respondents who provide a description of the search filters used
Do you describe the filters usedin the search process report? Number of respondents (n= 90) Percentage of respondents
Yes 78 86.7
No 4 4.4
No response 8 8.9
Total 90 100.0
DOI: 10.3310/hta21690 HEALTH TECHNOLOGY ASSESSMENT 2017 VOL. 21 NO. 69
© Queen’s Printer and Controller of HMSO 2017. This work was produced by Lefebvre et al. under the terms of a commissioning contract issued by the Secretary of State forHealth. This issue may be freely reproduced for the purposes of private research and study and extracts (or indeed, the full report) may be included in professional journalsprovided that suitable acknowledgement is made and the reproduction is not associated with any form of advertising. Applications for commercial reproduction should beaddressed to: NIHR Journals Library, National Institute for Health Research, Evaluation, Trials and Studies Coordinating Centre, Alpha House, University of Southampton SciencePark, Southampton SO16 7NS, UK.
85
Other information requirements included:
l results of own testing (11 respondents)l colleague recommendations/discussion (six respondents)l the database (four respondents)l knowledge of the creator/developer (three respondents)l simplicity/understandability (three respondents)l ease of use (including automatic loading) (two respondents).
Respondents reported that the main factors that would make choosing a filter easier were the availabilityof a critical appraisal or evaluation (17.8%; 16/90) and more information (such as the effectiveness of thefilter, what it does/provides, what it excludes, its limitations, when it was last updated; advantages anddisadvantages; sensitivity and specificity; how it has been tested) (16.7%; 15/90). Respondents alsoreported that they wanted to be confident in the author/developer (11.1%; 10/90).
Other factors cited as making it easier to choose which filter to use were:
l the presence of a central storage location (seven respondents)l better expression/presentation of results (four respondents)l greater consistency in the methods used (one respondent)l availability/accessibility in all databases (problem with CINAHL on EBSCOhost) (one respondent)l better labelling/indexing of articles so that they might be more easily retrieved (one respondent)l more up-to-date coverage on the CRD (i.e. ISSG Search Filters Resource) website (one respondent)l more ‘professional noise’ about a new filter (one respondent)l the availability of synopses of filters (one respondent).
What methodological search filters would be useful to you?The respondents had a wide range of requirements for new filters:
l economic/economic evaluation/cost–benefit/cost–utility studies (five respondents)l all research/study designs (in one filter) (two respondents)l controlled trials/controlled studies in the public health field (two respondents)l diagnosis/diagnostic studies (two respondents)l a combination of RCTs and systematic reviews/meta-analysis in one filterl aetiological studiesl burden of illness studiesl case–control studiesl case seriesl clinical auditsl clinical trialsl cross-sectional studiesl epidemiological studiesl full-text searchesl guidelinesl HTAsl interrupted time seriesl meta-analysesl non-RCTsl observational studiesl process evaluationsl qualitative studiesl quasi-experimental studiesl RCTs
QUESTIONNAIRE
NIHR Journals Library www.journalslibrary.nihr.ac.uk
86
l social sciences methodologies (other)l specific methodologiesl systematic reviews.
Respondents also had requirements for filters capturing other issues:
l adverse effects/events/harmsl age groupsl children/paediatricsl demographyl disease specific/technology specificl emergency departmentsl erratal hospital management (non-clinical)l hospital settingl magnetic resonance imagingl older peoplel patient-centred outcomesl patient experiencel prognosis/prognostic studiesl programmes and servicesl public health, especially health protection and infection controll retracted or withdrawn articlesl therapy.
With respect to databases, respondents expressed an interest in the following database-specific filters:
l a more precise RCT filter for EMBASEl a validated/Cochrane-recommended RCT filter for EMBASE and other databases, for example CINAHLl a definitive filter per methodology per databasel Education Resources Information Center (ERIC) filtersl filters validated for more databases than EMBASE and MEDLINE.
Other comments about filters were invited and the following were noted:
Clearer ones.
Please, no further filters – more work on limitations of filters and dissemination work on alternative/better methods is necessary.
UK studies.
Further observations on methodological search filters as a tool for information retrievalRespondents provided additional views on methodological search filters as a tool for information retrieval,which have been grouped in the following sections under limitations and benefits.
Limitations
As an ‘ordinary searcher’ I find the choice in Hedges totally bewildering.
From a clinical point of view the whole business – if well intentioned – seems fraught with difficultyand uncertain relevance.
DOI: 10.3310/hta21690 HEALTH TECHNOLOGY ASSESSMENT 2017 VOL. 21 NO. 69
© Queen’s Printer and Controller of HMSO 2017. This work was produced by Lefebvre et al. under the terms of a commissioning contract issued by the Secretary of State forHealth. This issue may be freely reproduced for the purposes of private research and study and extracts (or indeed, the full report) may be included in professional journalsprovided that suitable acknowledgement is made and the reproduction is not associated with any form of advertising. Applications for commercial reproduction should beaddressed to: NIHR Journals Library, National Institute for Health Research, Evaluation, Trials and Studies Coordinating Centre, Alpha House, University of Southampton SciencePark, Southampton SO16 7NS, UK.
87

Because I haven’t really understood them when I’ve looked, I tend to avoid them. . . . Part of theproblem is I think it varies depending on which interface you use to search a database.
Much effort to produce these but often used alongside other dubious practices, e.g. discarding papersthat have no abstracts (SIGN, in particular, do this) so making their precision rather pointless.
Ultimately, even after long discussions with clients, I have to change them!
There is too much reliance on the present filters: they almost have a golden status which means it isobjectively difficult to manoeuvre away from one or other or make a tweak. Non-IS [informationspecialist] types get nervous believing in the infallibility of written filter.
Even though it is great to have a site such as InterTASC, it is very difficult to locate actual filters on it.
I love the built in hedges to databases that makes it easy to use ‘click a button’ but at the same time,I like to have what’s ‘under the hood’ easily available to look at or in order to report your own searches.
. . . please accept search filters are out-of-date methodology. Please don’t develop more filters! That’snot helpful for high-quality information retrieval in systematic review, HTA and guideline-writing!Information technology development offers better methods in 2011 than in the early 1990s.
Benefits
They are necessary for the work of evidence-based health care – future development should focus onmaximising the precision of filters.
What might be more useful [than methodological filters] are more topical filters as is being startedwith the MedTerm Search Assist Database (http://www.hsls.pitt.edu/terms/).
I am very grateful to the people who have developed validated filters.
When I started to work here, I learned that filters were not used except for ‘quick and dirty’ searches.The majority of our searches are for reviews, so I learned not to use filters and accept rather highnumbers of references. Gradually, I am reconsidering this as time is an important factor too and goodfilters could save much time!
I like to inform researchers, students, research co-ordinators, doctors, nurses etc. about these filters asI think they will be very helpful for them.
Researchers despise going through 20,000 articles so we need to find ways to make precise searcheswithout losing too much sensitivity.
Is there a central repository with features for comparison?
Discussion
In 2004, Jenkins and Johnson5 reported that, although researchers were aware of filters, there was a lowlevel of usage. Since then it appears that more people are using filters to inform their research and filtersare being used for a range of searching tasks.
The questionnaire reported in this chapter has several limitations. Although we do not know whatproportion of search filter users we reached, questionnaire analyses showed that our sample included
QUESTIONNAIRE
NIHR Journals Library www.journalslibrary.nihr.ac.uk
88
librarians and other information specialists and researchers involved in supporting systematic reviews,technology appraisals and guideline development, all of whom represent our target audience. From thee-mail lists that respondents reported being members of, we can tell that many were information specialistssupporting the production of HTAs, guidelines and systematic reviews. We therefore expect the resultsto be broadly generalisable to such librarians and other researchers. The e-mail lists that we sent thequestionnaire to had at least 2857 subscribers, but we do not know how many people, in total, the e-mailsreached because people may have been members of multiple lists. In addition, respondents had otherways to find out about the survey, such as Twitter. Moreover, the survey invitation was sent to generalhealth-care librarian lists as well as specialised lists and many members of the former would not have beencompetent to respond to the survey. The e-mail lists we used, however, ranged from lists with highproportions of information specialists, with roles similar to those of NICE information specialists, to moregeneral lists, whose members might not routinely use search filters.
The questionnaire that we developed was quite lengthy and, in retrospect, might have benefited frombeing shorter. The response rate, however, to early questions was similar to that to later questions,suggesting that the length of the questionnaire did not act as a deterrent to any of the individuals whoactually submitted a response. It might have helped to achieve more standardised results and fewerambiguous answers if we had given respondents more multiple choice questions. Respondents describedresources quite vaguely at times and sometimes the same resource was described using several differentnames. We have made some assumptions about the variant naming of widely used resources to provide amore succinct report and to ensure that the most frequently reported resources are identified as such. Wehave not, however, routinely corrected what may be ‘errors’ in the responses, for example when certainfilters may be incorrectly described or ascribed to the wrong author or organisation.
When do searchers and researchers use search filters?The awareness and use of search filters seems to have developed considerably in the decade since thepublication of the article by Jenkins and Johnson.5 Most respondents seem to know where to look forfilters from well-established producers and collections. The responses, however, demonstrate a widevariation in the confidence with which questionnaire respondents choose filters. There are alsocontradictions between the difficulties that respondents express in terms of selecting between filters(acknowledging the possible complexities of filter design) and the commonplace practice of searchersadapting published strategies to fit their own requirements (ignoring the fact that many filters aredesigned to perform in a quite specific way). Several respondents have developed their own filters for localuse. The responses indicate that search filters are used more frequently for large-scale reviews and slightlyless often for simpler scoping and rapid searches. This may reflect different practices in scoping and rapidsearches because fewer resources will be searched and less sensitive subject searches will be employedbecause of the limited timescale. Adding a filter to an already focused search might be seen as riskingmissing studies. For all types of searches, search filters offer an opportunity to focus the numbers ofrecords retrieved, which can be helpful when time is limited. Search filters are predominantly viewed byrespondents as a tool to maximise sensitivity rather than precision (although this is not the intendedobjective of all filters), but seem to be used to achieve optimal sensitivity and precision.
What information would help researchers choose between filters?The responses to the questionnaire have many messages for search filter designers. Filter performancemeasures need to be signposted more clearly and succinctly to help searchers make better use of theavailable filters. Filter and website designers should present less information (to avoid information overload)and ensure that performance information can be clearly seen. Respondents also reported that they wantedto be confident in the author/developer. While the provenance of filters is clearly important to somesearchers, there are no established parameters to measure this confidence. Clear authorship labelling andthe provision of detailed methods to show the robustness of the development methods would not onlyassist users of filters but also help filter designers achieve recognition for their filters. The convenience ofhaving filters by well-established producers available within database interfaces (such as the PubMedClinical Queries filters) encourages their use. The most convenient search filters, however, may not always
DOI: 10.3310/hta21690 HEALTH TECHNOLOGY ASSESSMENT 2017 VOL. 21 NO. 69
© Queen’s Printer and Controller of HMSO 2017. This work was produced by Lefebvre et al. under the terms of a commissioning contract issued by the Secretary of State forHealth. This issue may be freely reproduced for the purposes of private research and study and extracts (or indeed, the full report) may be included in professional journalsprovided that suitable acknowledgement is made and the reproduction is not associated with any form of advertising. Applications for commercial reproduction should beaddressed to: NIHR Journals Library, National Institute for Health Research, Evaluation, Trials and Studies Coordinating Centre, Alpha House, University of Southampton SciencePark, Southampton SO16 7NS, UK.
89
be the best for particular tasks and searchers and researchers need to know how to choose when a rangeof sensitive, precise or ‘optimal’ strategies is offered. Respondents require more information on thevalidation of search filters. They value and use resources such as the ISSG Search Filters Resource and thefilters of the McMaster Hedges team. The former provides a list of all identified methodological searchfilters in one place, by study design and by database, which has a convenience factor. The latter providessearch filters developed using documented methods within database interfaces, with filters ‘badged’ withthe authority of both the research team and the US NLM. In contrast to the methodological and publisherquality seals of the McMaster filters, the BMJ Clinical Evidence and SIGN websites provide little informationon filter production and/or validation. The filters on these websites, however, seem to be widely used,suggesting that authorship is the seal of quality.
Respondents did not necessarily feel that all of their requirements were currently being met. They wouldlike translations of filters for different databases and interfaces, more strategies independent of indexinglanguage (to facilitate transferral across databases) and filters for a wider range of study designs and othertopics. This provides a research agenda for any search filter authors willing to take up the challenge.
Respondents keep informed about developments in search filters through a wide variety of methods andresources, which suggests that search filter and website designers face a marketing challenge. Highlightingnew filters to key audiences such as information specialists and systematic reviewers by inclusion inresources such as the Cochrane Handbook133 and the ISSG Search Filters Resource6 would help to promotenew filters beyond the simple publication of a journal article. In addition, a large number of e-mail lists areused for current awareness purposes, and the promotion of new filters through these lists would seem tobe an efficient way to reach potential users.
Although the use of search filters seems to be quite widely documented and amendments are noted insearch reports, there seems to be scope for promoting clarity around the use and amendment of searchfilters. This, again, is an issue for filter authors and website producers. There is clearly a large amount ofad hoc filter amendment work being undertaken: searchers take filters and adapt them for their ownpurposes. This would seem to indicate a lack of awareness that the filters may be designed for a purposeor have been arrived at after extensive exploration (increasingly using textual analysis techniques) to justifythe use of specific terms and the absence of others. The performance assessment of amended searchfilters does not seem to be a priority for many searchers. Filter developers should consider how they wanttheir filters to be used and perhaps attach guidance or caveats to the filters. Guidance for filter adaptationmay also be merited so that filter developers are credited for the original work but absolved from theeffects of the adaptations. Many filter developers retain their gold or reference standards and might bewilling to test adaptations.
The original impetus for many search filters was to maximise sensitivity but, increasingly, possibly because oflimited resources, searchers seem to be demanding improvements in precision. Future filter developments(for interfaces that use Boolean searching) need to continue to improve precision while maintaining sensitivity.The advent of full-text searching and semantic analysis of both full-text and bibliographic records may seefilters used in different ways in the future. For example, sensitive filters might be used to identify records fromdatabases and these results might then be processed using semantic analysis software trained to identifyrecords of specific types. The results could then be used to revise the search filter and improve the precisionof the search results. This approach will have search algorithms (filters) that are more like semantic rules thanthe dichotomous (relevant/not relevant) search filters that we see used in bibliographic databases such asMEDLINE. Textual analysis approaches have been used in the design of searches.22,135 The extent to whichtextual analysis alone can be relied on in the future to distinguish relevant records from irrelevant records isunder investigation.59,135 When using semantic analysis approaches the onus will be on the searcher to selectthe performance levels, that is, to choose an acceptable probability of a record being relevant.
QUESTIONNAIRE
NIHR Journals Library www.journalslibrary.nihr.ac.uk
90
ConclusionSearch filters are used mainly for reducing the size of large result sets (introducing focus) and assisting withsearches that are focused on a single study type. Searchers use several key resources to identify searchfilters but may find choosing between filters problematic. Features that would help with filter choiceinclude making information about filters less technical, offering ratings and providing more detail aboutfilter validation strategies and filter provenance.
DOI: 10.3310/hta21690 HEALTH TECHNOLOGY ASSESSMENT 2017 VOL. 21 NO. 69
© Queen’s Printer and Controller of HMSO 2017. This work was produced by Lefebvre et al. under the terms of a commissioning contract issued by the Secretary of State forHealth. This issue may be freely reproduced for the purposes of private research and study and extracts (or indeed, the full report) may be included in professional journalsprovided that suitable acknowledgement is made and the reproduction is not associated with any form of advertising. Applications for commercial reproduction should beaddressed to: NIHR Journals Library, National Institute for Health Research, Evaluation, Trials and Studies Coordinating Centre, Alpha House, University of Southampton SciencePark, Southampton SO16 7NS, UK.
91

Chapter 5 Suggested approach to measuringsearch filter performance
Introduction
This chapter outlines a suggested approach to test the retrieval performance of search filters, with a viewto encouraging searchers to contribute to the larger picture of search filter performance. Once piloted, thisapproach could form the basis of published guidance on how to conduct search filter performance testing.Recommendations are based on the findings of the reviews, interviews and questionnaire, publishedliterature and the cumulative experience in search filter research of the authors.
Search filter studies, to identify studies that use specific research designs (such as RCTs), which are purposefullydeveloped and published in journal articles, typically present two or three measures of performance. Thesemeasures tend to be based on testing filters on one or two sets of relevant records (known as reference sets/goldstandards). Our research has shown that the performance of filters across different disciplines, questions andhealth databases is largely unknown (review B) and that a range of different performance measures is reportedin articles describing search filters (review A). There is a paucity of published data on how searchers select filters(review D) although, when questioned, experienced searchers described informal and pragmatic experimentingwith filters or relying on the provenance or published performance measures to aid selection (interviews). Inaddition, respondents to the questionnaire mentioned using filters that are available in the database interface,consulting colleagues or having filters that they always use.
Both interviewees and questionnaire respondents expressed a desire for the performance measures ofpublished filters to be signposted more clearly and succinctly. Data on the performance of filters in differentreference standards are needed to help searchers to assess whether or not filters perform consistently andalso to detect topics or fields in which the performance of a filter may be better or worse. Collectingperformance data and sharing them through a central resource (such as a website) would mean that thereis greater availability of information for all users of search filters. The approach proposed here offers waysto collect search filter performance data and to report them on the ISSG Search Filters Resource website[see https://sites.google.com/a/york.ac.uk/issg-search-filters-resource/home (accessed 22 August 2017)].
Examples are provided to show that search filter performance measurement can be conducted as part ofsystematic reviews or other projects involving extensive searches.
Measuring search filter performance
There are several aspects to measuring search filter performance:
l Which performance characteristics should be measured (e.g. sensitivity, precision)?l How should a performance measure be ascertained (e.g. how to develop a reference set)?l How can performance measurement be carried out most efficiently?
Which performance characteristics should be measured?When considering the measures that are most useful to users of search filters, the following arerecommended based on the responses to the interviews and the questionnaire survey carried out to informthis research. These measures are also those most frequently reported in the literature (reviews A and B):
l sensitivityl precision or NNR.
DOI: 10.3310/hta21690 HEALTH TECHNOLOGY ASSESSMENT 2017 VOL. 21 NO. 69
© Queen’s Printer and Controller of HMSO 2017. This work was produced by Lefebvre et al. under the terms of a commissioning contract issued by the Secretary of State forHealth. This issue may be freely reproduced for the purposes of private research and study and extracts (or indeed, the full report) may be included in professional journalsprovided that suitable acknowledgement is made and the reproduction is not associated with any form of advertising. Applications for commercial reproduction should beaddressed to: NIHR Journals Library, National Institute for Health Research, Evaluation, Trials and Studies Coordinating Centre, Alpha House, University of Southampton SciencePark, Southampton SO16 7NS, UK.
93
Sensitivity is defined as the number of records in the reference set that are retrieved by a search filter as aproportion of the total number of records in the reference set. It is therefore a crucial performance issuefor many searchers, especially within the context of many systematic reviews and HTAs, in which searchersare usually focused on retrieving as much relevant evidence as possible. This may be less of a concern inreviews of qualitative evidence.136
Precision is defined as the number of reference set records retrieved by a search filter as a proportion of the totalnumber of records (relevant and irrelevant) retrieved. It is also a crucial issue for searchers involved in evidencesynthesis because, in seeking to achieve high sensitivity, retrieval rates are often high and the precision tends tobe low. One study reports that 2–3% precision is typical of searches undertaken in systematic reviews137 butexperience suggests that precision is often much lower than that. Precision is also a concept that is of relativeimportance to searchers as they are likely to be more tolerant of low precision when low numbers of records areretrieved (e.g. in a search topic when there are few research reports) than when high numbers of records areretrieved (e.g. in a search of breast cancer). NNR offers a precision-based metric to indicate the workloadinvolved in identifying relevant records when using a specific filter.
An additional performance measure could be collected that might assist with estimating workload. Wehave called this ‘reduction in number needed to read’ (see Glossary and also review C and Whiting et al.2).This indicates how far adding a filter to a subject search will reduce the workload involved in processingrecords by showing the reduction in the number of records that will need to be screened. A smallreduction in the number needed to screen may indicate that using a filter is not helpful in reducing theworkload involved in assessing retrieved records for relevance, whereas a large reduction in numberneeded to screen may encourage the use of a filter.
How should a performance measure be ascertained?If sensitivity and precision are the focus of performance measurement, the following issues are crucial forrobust measures:
l having a definition of the criteria for building a reference setl having a reference set of relevant records (to measure sensitivity and precision/NNR)l having a results set containing all records retrieved by hand-searching or records retrieved by RR
methods or the total number of records retrieved by a search of a database using a subject searchstrategy (to measure precision/NNR)
l having search filters that are suitable for the database interface being used to search for records or thathave been translated carefully to be used in another database interface.
These issues are discussed in more detail in the following sections.
Reference set criteriaTo build a reference set of relevant records, the inclusion criteria for a record to be assessed as relevant tothe reference set need to be described in adequate detail. The inclusion criteria may include definitions ofa population, an intervention or an outcome or other features against which a record can be assessed forrelevance. An example of a description of a reference set is shown in Box 1. The descriptions are importantto ensure that the reference set includes the same types of studies that the filter being tested is designedto retrieve and should be as detailed as possible.
Identifying a reference set of relevant recordsThe reference set should be representative of all relevant records to minimise bias and increase therobustness of the results and should be large enough to provide reliable results (review C). As reviews Aand B demonstrated, there are two widely used methods of identifying a reference set of relevant records(and probably many variants):
1. hand-searching database records or sets of publications (usually journals) to identify all of the recordsthat meet a set of explicit criteria69,133
2. using the RR technique to create a reference set based on the results of a systematic review.52
SUGGESTED APPROACH TO MEASURING SEARCH FILTER PERFORMANCE
NIHR Journals Library www.journalslibrary.nihr.ac.uk
94
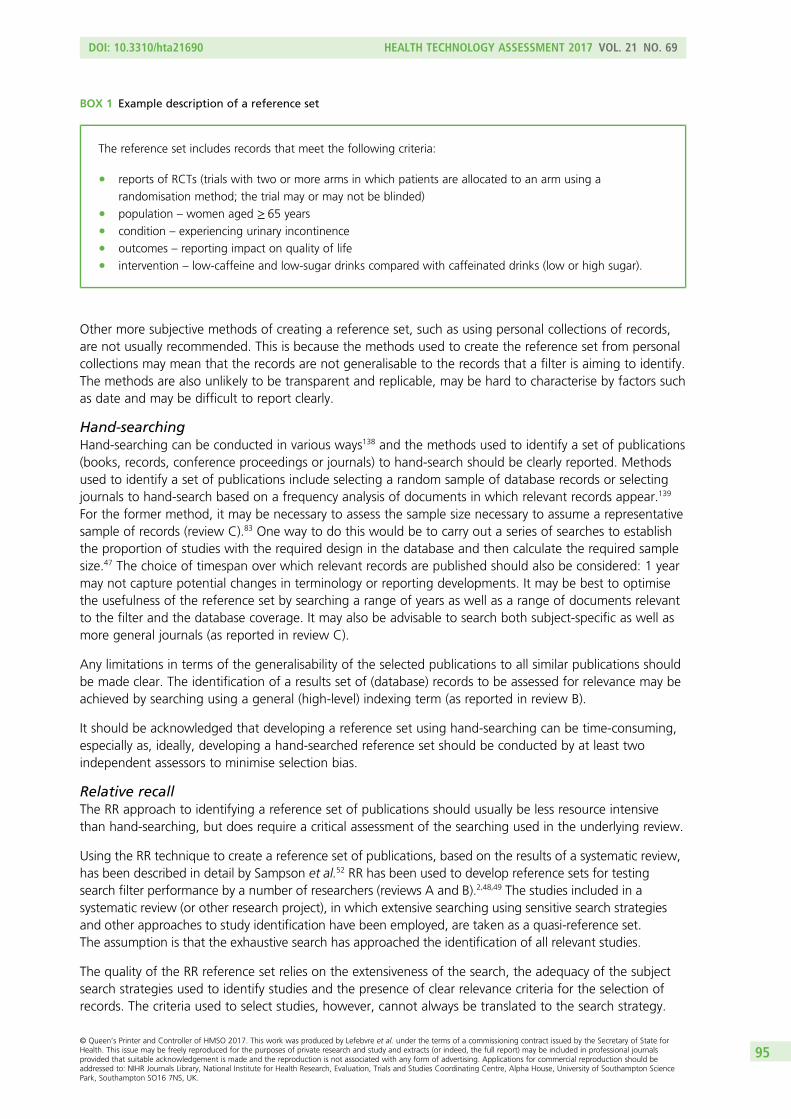
Other more subjective methods of creating a reference set, such as using personal collections of records,are not usually recommended. This is because the methods used to create the reference set from personalcollections may mean that the records are not generalisable to the records that a filter is aiming to identify.The methods are also unlikely to be transparent and replicable, may be hard to characterise by factors suchas date and may be difficult to report clearly.
Hand-searchingHand-searching can be conducted in various ways138 and the methods used to identify a set of publications(books, records, conference proceedings or journals) to hand-search should be clearly reported. Methodsused to identify a set of publications include selecting a random sample of database records or selectingjournals to hand-search based on a frequency analysis of documents in which relevant records appear.139
For the former method, it may be necessary to assess the sample size necessary to assume a representativesample of records (review C).83 One way to do this would be to carry out a series of searches to establishthe proportion of studies with the required design in the database and then calculate the required samplesize.47 The choice of timespan over which relevant records are published should also be considered: 1 yearmay not capture potential changes in terminology or reporting developments. It may be best to optimisethe usefulness of the reference set by searching a range of years as well as a range of documents relevantto the filter and the database coverage. It may also be advisable to search both subject-specific as well asmore general journals (as reported in review C).
Any limitations in terms of the generalisability of the selected publications to all similar publications shouldbe made clear. The identification of a results set of (database) records to be assessed for relevance may beachieved by searching using a general (high-level) indexing term (as reported in review B).
It should be acknowledged that developing a reference set using hand-searching can be time-consuming,especially as, ideally, developing a hand-searched reference set should be conducted by at least twoindependent assessors to minimise selection bias.
Relative recallThe RR approach to identifying a reference set of publications should usually be less resource intensivethan hand-searching, but does require a critical assessment of the searching used in the underlying review.
Using the RR technique to create a reference set of publications, based on the results of a systematic review,has been described in detail by Sampson et al.52 RR has been used to develop reference sets for testingsearch filter performance by a number of researchers (reviews A and B).2,48,49 The studies included in asystematic review (or other research project), in which extensive searching using sensitive search strategiesand other approaches to study identification have been employed, are taken as a quasi-reference set.The assumption is that the exhaustive search has approached the identification of all relevant studies.
The quality of the RR reference set relies on the extensiveness of the search, the adequacy of the subjectsearch strategies used to identify studies and the presence of clear relevance criteria for the selection ofrecords. The criteria used to select studies, however, cannot always be translated to the search strategy.
BOX 1 Example description of a reference set
The reference set includes records that meet the following criteria:
l reports of RCTs (trials with two or more arms in which patients are allocated to an arm using a
randomisation method; the trial may or may not be blinded)l population – women aged ≥ 65 yearsl condition – experiencing urinary incontinencel outcomes – reporting impact on quality of lifel intervention – low-caffeine and low-sugar drinks compared with caffeinated drinks (low or high sugar).
DOI: 10.3310/hta21690 HEALTH TECHNOLOGY ASSESSMENT 2017 VOL. 21 NO. 69
© Queen’s Printer and Controller of HMSO 2017. This work was produced by Lefebvre et al. under the terms of a commissioning contract issued by the Secretary of State forHealth. This issue may be freely reproduced for the purposes of private research and study and extracts (or indeed, the full report) may be included in professional journalsprovided that suitable acknowledgement is made and the reproduction is not associated with any form of advertising. Applications for commercial reproduction should beaddressed to: NIHR Journals Library, National Institute for Health Research, Evaluation, Trials and Studies Coordinating Centre, Alpha House, University of Southampton SciencePark, Southampton SO16 7NS, UK.
95
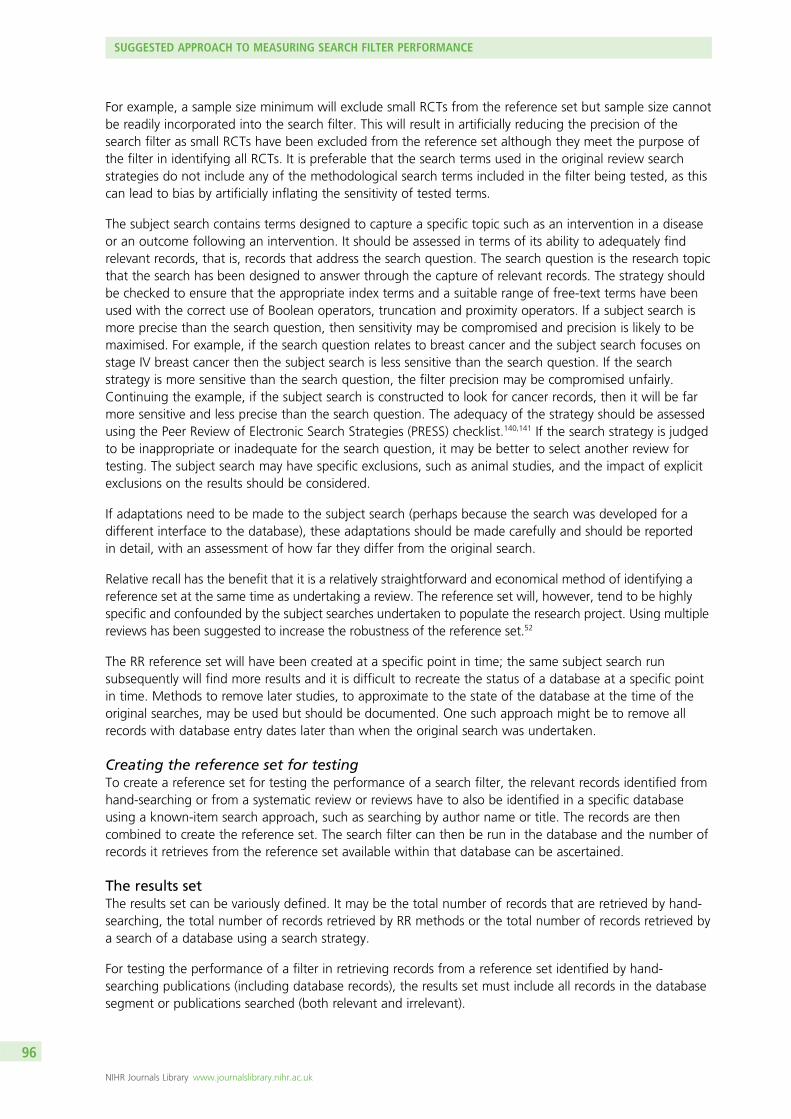
For example, a sample size minimum will exclude small RCTs from the reference set but sample size cannotbe readily incorporated into the search filter. This will result in artificially reducing the precision of thesearch filter as small RCTs have been excluded from the reference set although they meet the purpose ofthe filter in identifying all RCTs. It is preferable that the search terms used in the original review searchstrategies do not include any of the methodological search terms included in the filter being tested, as thiscan lead to bias by artificially inflating the sensitivity of tested terms.
The subject search contains terms designed to capture a specific topic such as an intervention in a diseaseor an outcome following an intervention. It should be assessed in terms of its ability to adequately findrelevant records, that is, records that address the search question. The search question is the research topicthat the search has been designed to answer through the capture of relevant records. The strategy shouldbe checked to ensure that the appropriate index terms and a suitable range of free-text terms have beenused with the correct use of Boolean operators, truncation and proximity operators. If a subject search ismore precise than the search question, then sensitivity may be compromised and precision is likely to bemaximised. For example, if the search question relates to breast cancer and the subject search focuses onstage IV breast cancer then the subject search is less sensitive than the search question. If the searchstrategy is more sensitive than the search question, the filter precision may be compromised unfairly.Continuing the example, if the subject search is constructed to look for cancer records, then it will be farmore sensitive and less precise than the search question. The adequacy of the strategy should be assessedusing the Peer Review of Electronic Search Strategies (PRESS) checklist.140,141 If the search strategy is judgedto be inappropriate or inadequate for the search question, it may be better to select another review fortesting. The subject search may have specific exclusions, such as animal studies, and the impact of explicitexclusions on the results should be considered.
If adaptations need to be made to the subject search (perhaps because the search was developed for adifferent interface to the database), these adaptations should be made carefully and should be reportedin detail, with an assessment of how far they differ from the original search.
Relative recall has the benefit that it is a relatively straightforward and economical method of identifying areference set at the same time as undertaking a review. The reference set will, however, tend to be highlyspecific and confounded by the subject searches undertaken to populate the research project. Using multiplereviews has been suggested to increase the robustness of the reference set.52
The RR reference set will have been created at a specific point in time; the same subject search runsubsequently will find more results and it is difficult to recreate the status of a database at a specific pointin time. Methods to remove later studies, to approximate to the state of the database at the time of theoriginal searches, may be used but should be documented. One such approach might be to remove allrecords with database entry dates later than when the original search was undertaken.
Creating the reference set for testingTo create a reference set for testing the performance of a search filter, the relevant records identified fromhand-searching or from a systematic review or reviews have to also be identified in a specific databaseusing a known-item search approach, such as searching by author name or title. The records are thencombined to create the reference set. The search filter can then be run in the database and the number ofrecords it retrieves from the reference set available within that database can be ascertained.
The results setThe results set can be variously defined. It may be the total number of records that are retrieved by hand-searching, the total number of records retrieved by RR methods or the total number of records retrieved bya search of a database using a search strategy.
For testing the performance of a filter in retrieving records from a reference set identified by hand-searching publications (including database records), the results set must include all records in the databasesegment or publications searched (both relevant and irrelevant).
SUGGESTED APPROACH TO MEASURING SEARCH FILTER PERFORMANCE
NIHR Journals Library www.journalslibrary.nihr.ac.uk
96
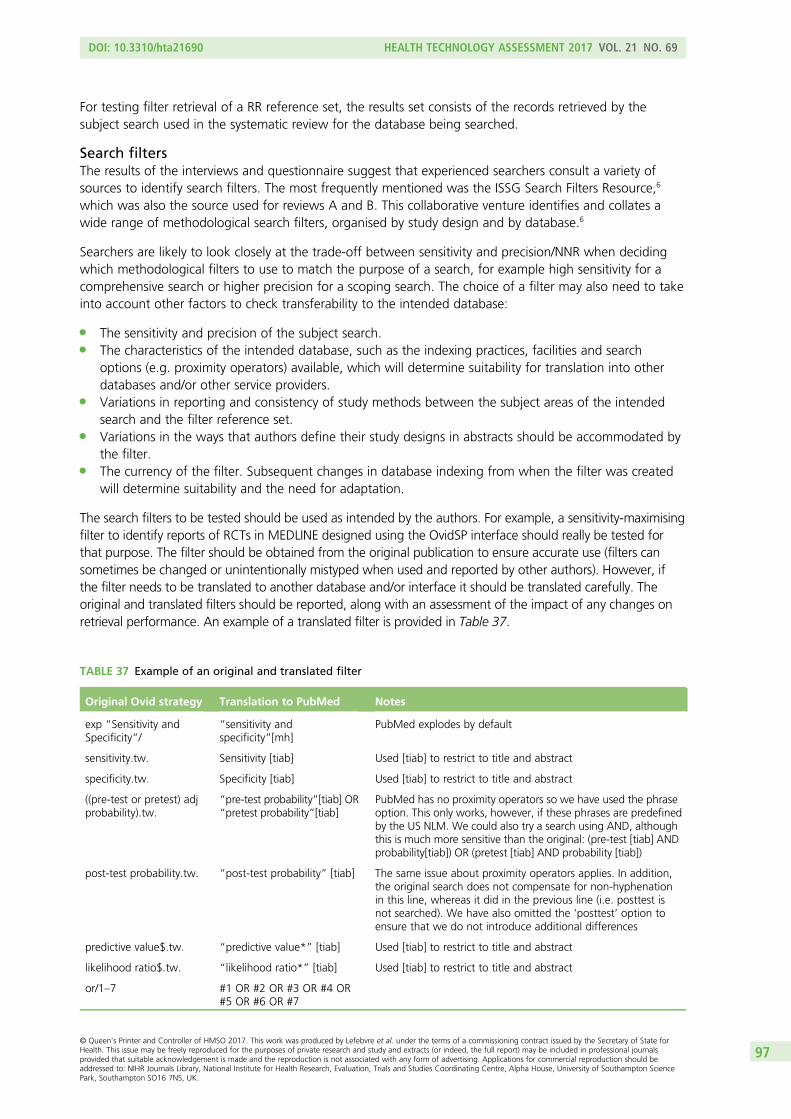
For testing filter retrieval of a RR reference set, the results set consists of the records retrieved by thesubject search used in the systematic review for the database being searched.
Search filtersThe results of the interviews and questionnaire suggest that experienced searchers consult a variety ofsources to identify search filters. The most frequently mentioned was the ISSG Search Filters Resource,6
which was also the source used for reviews A and B. This collaborative venture identifies and collates awide range of methodological search filters, organised by study design and by database.6
Searchers are likely to look closely at the trade-off between sensitivity and precision/NNR when decidingwhich methodological filters to use to match the purpose of a search, for example high sensitivity for acomprehensive search or higher precision for a scoping search. The choice of a filter may also need to takeinto account other factors to check transferability to the intended database:
l The sensitivity and precision of the subject search.l The characteristics of the intended database, such as the indexing practices, facilities and search
options (e.g. proximity operators) available, which will determine suitability for translation into otherdatabases and/or other service providers.
l Variations in reporting and consistency of study methods between the subject areas of the intendedsearch and the filter reference set.
l Variations in the ways that authors define their study designs in abstracts should be accommodated bythe filter.
l The currency of the filter. Subsequent changes in database indexing from when the filter was createdwill determine suitability and the need for adaptation.
The search filters to be tested should be used as intended by the authors. For example, a sensitivity-maximisingfilter to identify reports of RCTs in MEDLINE designed using the OvidSP interface should really be tested forthat purpose. The filter should be obtained from the original publication to ensure accurate use (filters cansometimes be changed or unintentionally mistyped when used and reported by other authors). However, ifthe filter needs to be translated to another database and/or interface it should be translated carefully. Theoriginal and translated filters should be reported, along with an assessment of the impact of any changes onretrieval performance. An example of a translated filter is provided in Table 37.
TABLE 37 Example of an original and translated filter
Original Ovid strategy Translation to PubMed Notes
exp “Sensitivity andSpecificity”/
“sensitivity andspecificity”[mh]
PubMed explodes by default
sensitivity.tw. Sensitivity [tiab] Used [tiab] to restrict to title and abstract
specificity.tw. Specificity [tiab] Used [tiab] to restrict to title and abstract
((pre-test or pretest) adjprobability).tw.
“pre-test probability”[tiab] OR“pretest probability”[tiab]
PubMed has no proximity operators so we have used the phraseoption. This only works, however, if these phrases are predefinedby the US NLM. We could also try a search using AND, althoughthis is much more sensitive than the original: (pre-test [tiab] ANDprobability[tiab]) OR (pretest [tiab] AND probability [tiab])
post-test probability.tw. “post-test probability” [tiab] The same issue about proximity operators applies. In addition,the original search does not compensate for non-hyphenationin this line, whereas it did in the previous line (i.e. posttest isnot searched). We have also omitted the ‘posttest’ option toensure that we do not introduce additional differences
predictive value$.tw. “predictive value*” [tiab] Used [tiab] to restrict to title and abstract
likelihood ratio$.tw. “likelihood ratio*” [tiab] Used [tiab] to restrict to title and abstract
or/1–7 #1 OR #2 OR #3 OR #4 OR#5 OR #6 OR #7
DOI: 10.3310/hta21690 HEALTH TECHNOLOGY ASSESSMENT 2017 VOL. 21 NO. 69
© Queen’s Printer and Controller of HMSO 2017. This work was produced by Lefebvre et al. under the terms of a commissioning contract issued by the Secretary of State forHealth. This issue may be freely reproduced for the purposes of private research and study and extracts (or indeed, the full report) may be included in professional journalsprovided that suitable acknowledgement is made and the reproduction is not associated with any form of advertising. Applications for commercial reproduction should beaddressed to: NIHR Journals Library, National Institute for Health Research, Evaluation, Trials and Studies Coordinating Centre, Alpha House, University of Southampton SciencePark, Southampton SO16 7NS, UK.
97
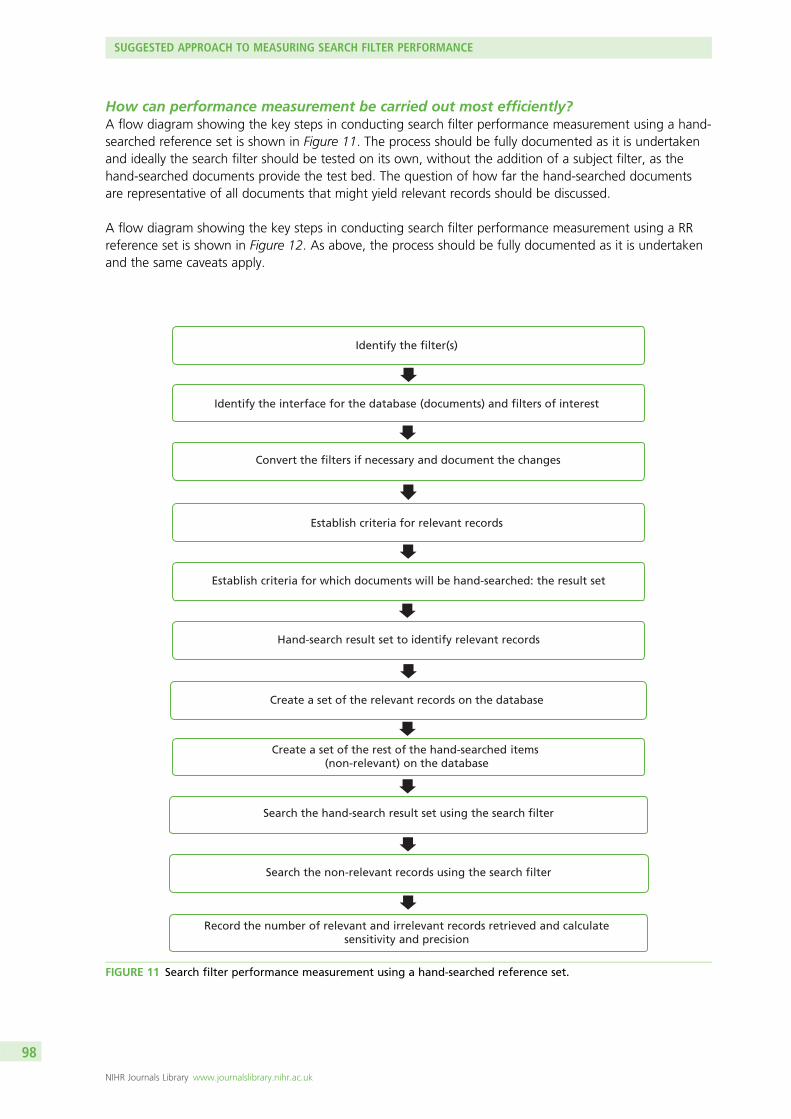
How can performance measurement be carried out most efficiently?A flow diagram showing the key steps in conducting search filter performance measurement using a hand-searched reference set is shown in Figure 11. The process should be fully documented as it is undertakenand ideally the search filter should be tested on its own, without the addition of a subject filter, as thehand-searched documents provide the test bed. The question of how far the hand-searched documentsare representative of all documents that might yield relevant records should be discussed.
A flow diagram showing the key steps in conducting search filter performance measurement using a RRreference set is shown in Figure 12. As above, the process should be fully documented as it is undertakenand the same caveats apply.
Identify the filter(s)
Identify the interface for the database (documents) and filters of interest
Convert the filters if necessary and document the changes
Establish criteria for relevant records
Establish criteria for which documents will be hand-searched: the result set
Hand-search result set to identify relevant records
Create a set of the relevant records on the database
Create a set of the rest of the hand-searched items (non-relevant) on the database
Search the hand-search result set using the search filter
Search the non-relevant records using the search filter
Record the number of relevant and irrelevant records retrieved and calculatesensitivity and precision
FIGURE 11 Search filter performance measurement using a hand-searched reference set.
SUGGESTED APPROACH TO MEASURING SEARCH FILTER PERFORMANCE
NIHR Journals Library www.journalslibrary.nihr.ac.uk
98
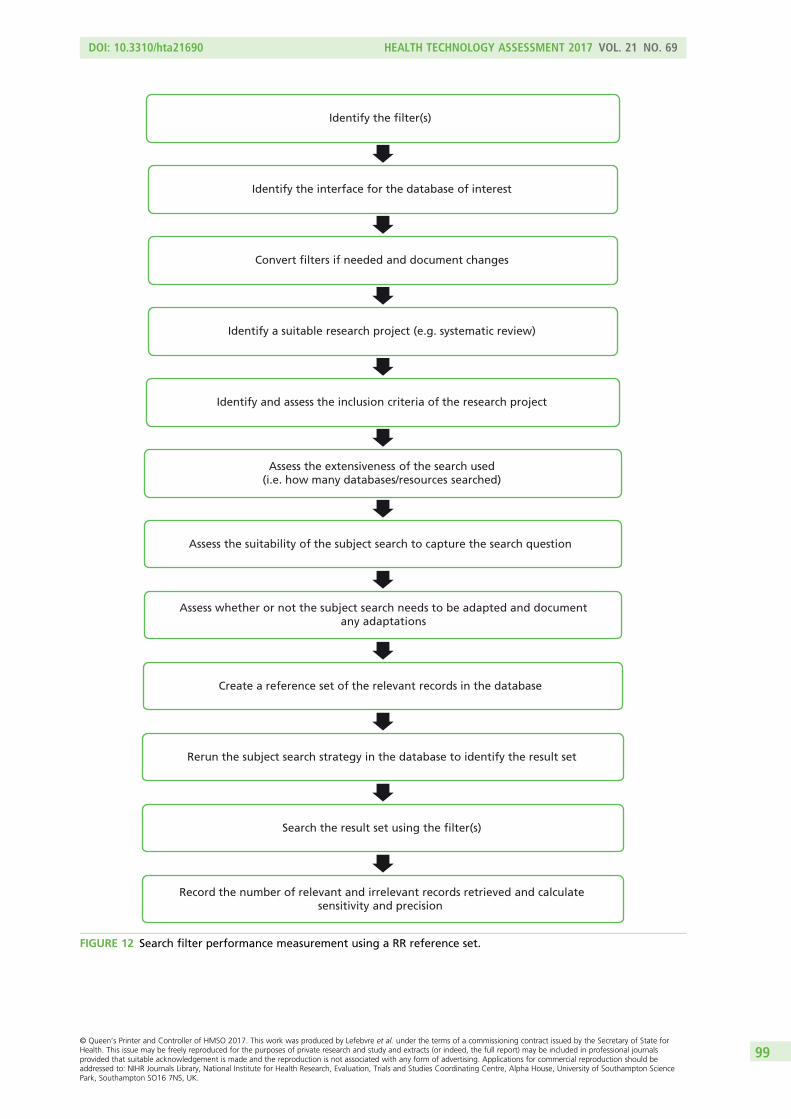
Identify the filter(s)
Identify the interface for the database of interest
Convert filters if needed and document changes
Identify a suitable research project (e.g. systematic review)
Identify and assess the inclusion criteria of the research project
Assess the extensiveness of the search used(i.e. how many databases/resources searched)
Assess the suitability of the subject search to capture the search question
Assess whether or not the subject search needs to be adapted and documentany adaptations
Create a reference set of the relevant records in the database
Rerun the subject search strategy in the database to identify the result set
Search the result set using the filter(s)
Record the number of relevant and irrelevant records retrieved and calculatesensitivity and precision
FIGURE 12 Search filter performance measurement using a RR reference set.
DOI: 10.3310/hta21690 HEALTH TECHNOLOGY ASSESSMENT 2017 VOL. 21 NO. 69
© Queen’s Printer and Controller of HMSO 2017. This work was produced by Lefebvre et al. under the terms of a commissioning contract issued by the Secretary of State forHealth. This issue may be freely reproduced for the purposes of private research and study and extracts (or indeed, the full report) may be included in professional journalsprovided that suitable acknowledgement is made and the reproduction is not associated with any form of advertising. Applications for commercial reproduction should beaddressed to: NIHR Journals Library, National Institute for Health Research, Evaluation, Trials and Studies Coordinating Centre, Alpha House, University of Southampton SciencePark, Southampton SO16 7NS, UK.
99
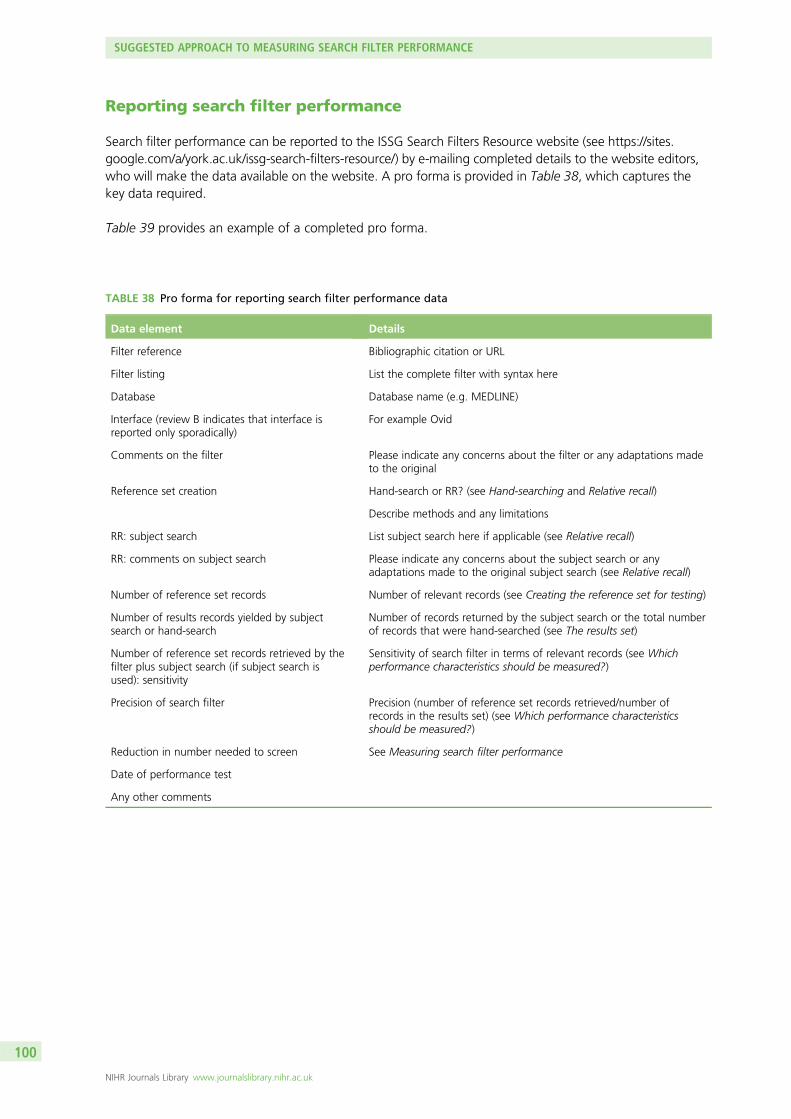
Reporting search filter performance
Search filter performance can be reported to the ISSG Search Filters Resource website (see https://sites.google.com/a/york.ac.uk/issg-search-filters-resource/) by e-mailing completed details to the website editors,who will make the data available on the website. A pro forma is provided in Table 38, which captures thekey data required.
Table 39 provides an example of a completed pro forma.
TABLE 38 Pro forma for reporting search filter performance data
Data element Details
Filter reference Bibliographic citation or URL
Filter listing List the complete filter with syntax here
Database Database name (e.g. MEDLINE)
Interface (review B indicates that interface isreported only sporadically)
For example Ovid
Comments on the filter Please indicate any concerns about the filter or any adaptations madeto the original
Reference set creation Hand-search or RR? (see Hand-searching and Relative recall)
Describe methods and any limitations
RR: subject search List subject search here if applicable (see Relative recall)
RR: comments on subject search Please indicate any concerns about the subject search or anyadaptations made to the original subject search (see Relative recall)
Number of reference set records Number of relevant records (see Creating the reference set for testing)
Number of results records yielded by subjectsearch or hand-search
Number of records returned by the subject search or the total numberof records that were hand-searched (see The results set)
Number of reference set records retrieved by thefilter plus subject search (if subject search isused): sensitivity
Sensitivity of search filter in terms of relevant records (see Whichperformance characteristics should be measured?)
Precision of search filter Precision (number of reference set records retrieved/number ofrecords in the results set) (see Which performance characteristicsshould be measured?)
Reduction in number needed to screen See Measuring search filter performance
Date of performance test
Any other comments
SUGGESTED APPROACH TO MEASURING SEARCH FILTER PERFORMANCE
NIHR Journals Library www.journalslibrary.nihr.ac.uk
100
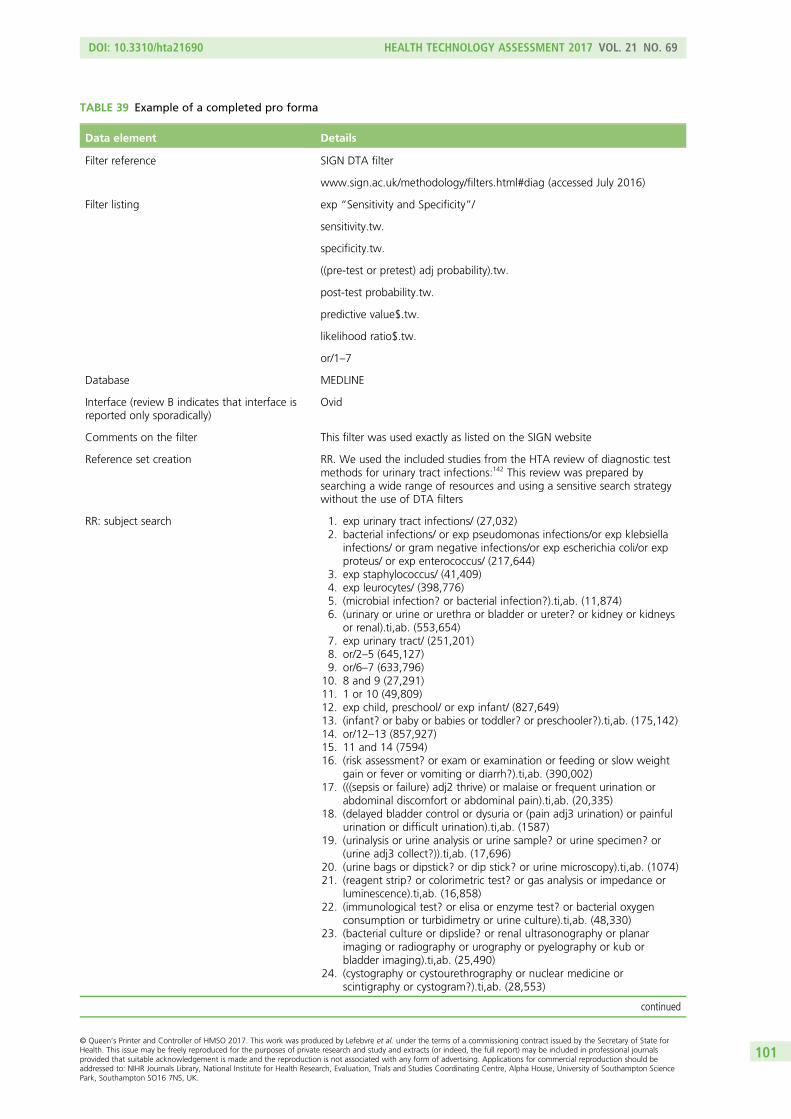
TABLE 39 Example of a completed pro forma
Data element Details
Filter reference SIGN DTA filter
www.sign.ac.uk/methodology/filters.html#diag (accessed July 2016)
Filter listing exp “Sensitivity and Specificity”/
sensitivity.tw.
specificity.tw.
((pre-test or pretest) adj probability).tw.
post-test probability.tw.
predictive value$.tw.
likelihood ratio$.tw.
or/1–7
Database MEDLINE
Interface (review B indicates that interface isreported only sporadically)
Ovid
Comments on the filter This filter was used exactly as listed on the SIGN website
Reference set creation RR. We used the included studies from the HTA review of diagnostic testmethods for urinary tract infections:142 This review was prepared bysearching a wide range of resources and using a sensitive search strategywithout the use of DTA filters
RR: subject search 1. exp urinary tract infections/ (27,032)2. bacterial infections/ or exp pseudomonas infections/or exp klebsiella
infections/ or gram negative infections/or exp escherichia coli/or expproteus/ or exp enterococcus/ (217,644)
3. exp staphylococcus/ (41,409)4. exp leurocytes/ (398,776)5. (microbial infection? or bacterial infection?).ti,ab. (11,874)6. (urinary or urine or urethra or bladder or ureter? or kidney or kidneys
or renal).ti,ab. (553,654)7. exp urinary tract/ (251,201)8. or/2–5 (645,127)9. or/6–7 (633,796)
10. 8 and 9 (27,291)11. 1 or 10 (49,809)12. exp child, preschool/ or exp infant/ (827,649)13. (infant? or baby or babies or toddler? or preschooler?).ti,ab. (175,142)14. or/12–13 (857,927)15. 11 and 14 (7594)16. (risk assessment? or exam or examination or feeding or slow weight
gain or fever or vomiting or diarrh?).ti,ab. (390,002)17. (((sepsis or failure) adj2 thrive) or malaise or frequent urination or
abdominal discomfort or abdominal pain).ti,ab. (20,335)18. (delayed bladder control or dysuria or (pain adj3 urination) or painful
urination or difficult urination).ti,ab. (1587)19. (urinalysis or urine analysis or urine sample? or urine specimen? or
(urine adj3 collect?)).ti,ab. (17,696)20. (urine bags or dipstick? or dip stick? or urine microscopy).ti,ab. (1074)21. (reagent strip? or colorimetric test? or gas analysis or impedance or
luminescence).ti,ab. (16,858)22. (immunological test? or elisa or enzyme test? or bacterial oxygen
consumption or turbidimetry or urine culture).ti,ab. (48,330)23. (bacterial culture or dipslide? or renal ultrasonography or planar
imaging or radiography or urography or pyelography or kub orbladder imaging).ti,ab. (25,490)
24. (cystography or cystourethrography or nuclear medicine orscintigraphy or cystogram?).ti,ab. (28,553)
continued
DOI: 10.3310/hta21690 HEALTH TECHNOLOGY ASSESSMENT 2017 VOL. 21 NO. 69
© Queen’s Printer and Controller of HMSO 2017. This work was produced by Lefebvre et al. under the terms of a commissioning contract issued by the Secretary of State forHealth. This issue may be freely reproduced for the purposes of private research and study and extracts (or indeed, the full report) may be included in professional journalsprovided that suitable acknowledgement is made and the reproduction is not associated with any form of advertising. Applications for commercial reproduction should beaddressed to: NIHR Journals Library, National Institute for Health Research, Evaluation, Trials and Studies Coordinating Centre, Alpha House, University of Southampton SciencePark, Southampton SO16 7NS, UK.
101
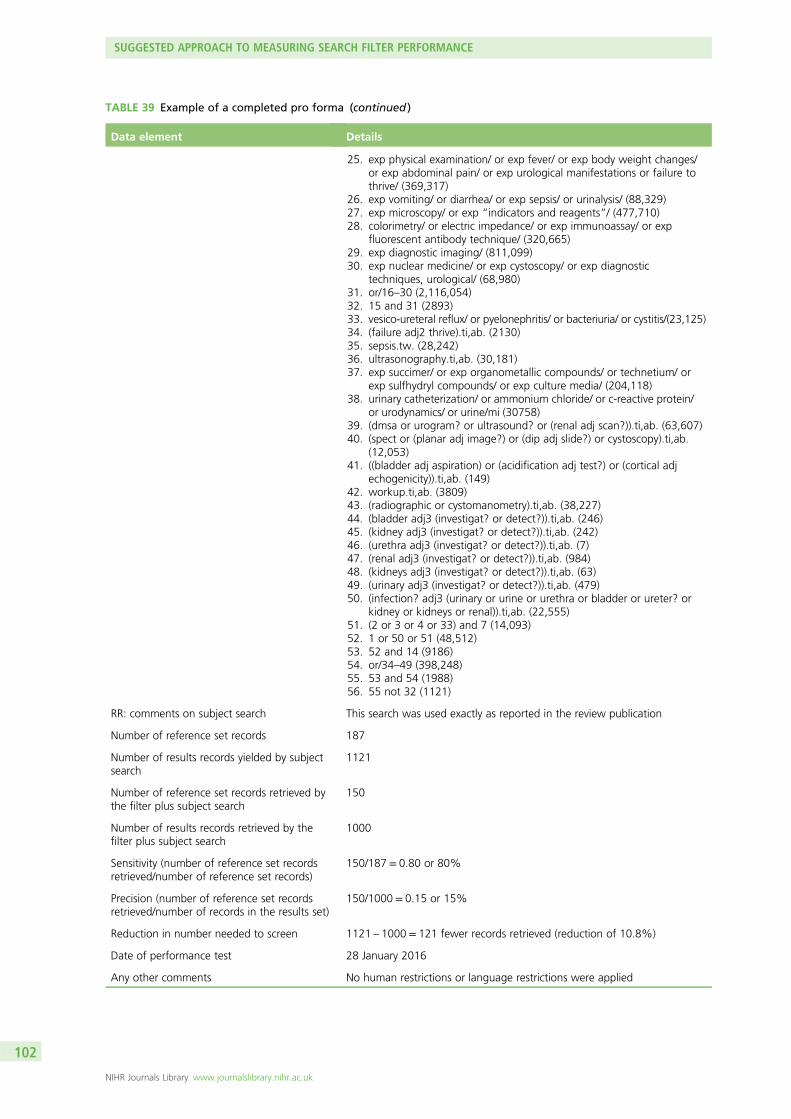
TABLE 39 Example of a completed pro forma (continued )
Data element Details
25. exp physical examination/ or exp fever/ or exp body weight changes/or exp abdominal pain/ or exp urological manifestations or failure tothrive/ (369,317)
26. exp vomiting/ or diarrhea/ or exp sepsis/ or urinalysis/ (88,329)27. exp microscopy/ or exp “indicators and reagents”/ (477,710)28. colorimetry/ or electric impedance/ or exp immunoassay/ or exp
fluorescent antibody technique/ (320,665)29. exp diagnostic imaging/ (811,099)30. exp nuclear medicine/ or exp cystoscopy/ or exp diagnostic
techniques, urological/ (68,980)31. or/16–30 (2,116,054)32. 15 and 31 (2893)33. vesico-ureteral reflux/ or pyelonephritis/ or bacteriuria/ or cystitis/(23,125)34. (failure adj2 thrive).ti,ab. (2130)35. sepsis.tw. (28,242)36. ultrasonography.ti,ab. (30,181)37. exp succimer/ or exp organometallic compounds/ or technetium/ or
exp sulfhydryl compounds/ or exp culture media/ (204,118)38. urinary catheterization/ or ammonium chloride/ or c-reactive protein/
or urodynamics/ or urine/mi (30758)39. (dmsa or urogram? or ultrasound? or (renal adj scan?)).ti,ab. (63,607)40. (spect or (planar adj image?) or (dip adj slide?) or cystoscopy).ti,ab.
(12,053)41. ((bladder adj aspiration) or (acidification adj test?) or (cortical adj
echogenicity)).ti,ab. (149)42. workup.ti,ab. (3809)43. (radiographic or cystomanometry).ti,ab. (38,227)44. (bladder adj3 (investigat? or detect?)).ti,ab. (246)45. (kidney adj3 (investigat? or detect?)).ti,ab. (242)46. (urethra adj3 (investigat? or detect?)).ti,ab. (7)47. (renal adj3 (investigat? or detect?)).ti,ab. (984)48. (kidneys adj3 (investigat? or detect?)).ti,ab. (63)49. (urinary adj3 (investigat? or detect?)).ti,ab. (479)50. (infection? adj3 (urinary or urine or urethra or bladder or ureter? or
kidney or kidneys or renal)).ti,ab. (22,555)51. (2 or 3 or 4 or 33) and 7 (14,093)52. 1 or 50 or 51 (48,512)53. 52 and 14 (9186)54. or/34–49 (398,248)55. 53 and 54 (1988)56. 55 not 32 (1121)
RR: comments on subject search This search was used exactly as reported in the review publication
Number of reference set records 187
Number of results records yielded by subjectsearch
1121
Number of reference set records retrieved bythe filter plus subject search
150
Number of results records retrieved by thefilter plus subject search
1000
Sensitivity (number of reference set recordsretrieved/number of reference set records)
150/187 = 0.80 or 80%
Precision (number of reference set recordsretrieved/number of records in the results set)
150/1000= 0.15 or 15%
Reduction in number needed to screen 1121 – 1000 = 121 fewer records retrieved (reduction of 10.8%)
Date of performance test 28 January 2016
Any other comments No human restrictions or language restrictions were applied
SUGGESTED APPROACH TO MEASURING SEARCH FILTER PERFORMANCE
NIHR Journals Library www.journalslibrary.nihr.ac.uk
102

Chapter 6 Project website
A pilot website relating to the project is available for public access (see https://sites.google.com/a/york.ac.uk/search-filter-performance/).
The website contains extracts from this report (under the headings Abstract, Scientific summary, Aims andobjectives, Definitions, Abbreviations and acronyms, Presentations, Publications and Bibliography), togetherwith a link to this report.
The website also contains a test site offering different graphical representations of search filterperformance, such as sensitivity, precision and NNR. These representations are in the form of bar charts,scatter plots and radar diagrams.
The website also links to the ISSG Search Filters Resource (see https://sites.google.com/a/york.ac.uk/issg-search-filters-resource/).
DOI: 10.3310/hta21690 HEALTH TECHNOLOGY ASSESSMENT 2017 VOL. 21 NO. 69
© Queen’s Printer and Controller of HMSO 2017. This work was produced by Lefebvre et al. under the terms of a commissioning contract issued by the Secretary of State forHealth. This issue may be freely reproduced for the purposes of private research and study and extracts (or indeed, the full report) may be included in professional journalsprovided that suitable acknowledgement is made and the reproduction is not associated with any form of advertising. Applications for commercial reproduction should beaddressed to: NIHR Journals Library, National Institute for Health Research, Evaluation, Trials and Studies Coordinating Centre, Alpha House, University of Southampton SciencePark, Southampton SO16 7NS, UK.
103

Chapter 7 Future research
The following issues have emerged as topics for future research.
Filters for other study designs
l The development and validation of filters for a wider range of study designs, such as epidemiology,quality of life and prognostic studies (questionnaire).
l A review of the performance measures reported for methodological filter performance andperformance comparisons for study designs not included in this review would shed light on topicsbeyond those that we assessed (reviews A and B).
Displaying performance results
l Studies to explore alternative methods of displaying performance results for multiple methodologicalsearch filters (reviews A, B and C) and testing of searchers’ understanding of the filter performancetrade-offs offered (interviews and questionnaire and review E).
Filter amendments
l Translations of filters for different databases and interfaces and the development of more strategiesthat are independent of indexing language (to facilitate transferral across databases) (questionnaire).
l Qualitative research into exactly how search filters are amended in practice, to inform filter design.Filter designers tend to assume that searchers want sensitive filters or precise filters but in fact searchersmay prefer different options or to be able to choose using a sliding scale of sensitivity depending onthe number of records retrieved (questionnaire).
Applicability to the wider community
l Interviews with searchers and researchers from other settings to understand whether the NICEexperience is generalisable (interviews).
Synthesis of filter performance
l Exploration of methods for the numerical synthesis of the results of several filter performancecomparisons (reviews B and C).
Filter-only performance
l Obtain baseline performance for a search filter by running the filter across an entire database (such asMEDLINE) with no subject terms. This removes one of the potential limiting factors of assessing filters incombination with subject searches and also obtains a measure of the prevalence of the study designin the database (see Chapter 5).
DOI: 10.3310/hta21690 HEALTH TECHNOLOGY ASSESSMENT 2017 VOL. 21 NO. 69
© Queen’s Printer and Controller of HMSO 2017. This work was produced by Lefebvre et al. under the terms of a commissioning contract issued by the Secretary of State forHealth. This issue may be freely reproduced for the purposes of private research and study and extracts (or indeed, the full report) may be included in professional journalsprovided that suitable acknowledgement is made and the reproduction is not associated with any form of advertising. Applications for commercial reproduction should beaddressed to: NIHR Journals Library, National Institute for Health Research, Evaluation, Trials and Studies Coordinating Centre, Alpha House, University of Southampton SciencePark, Southampton SO16 7NS, UK.
105

Acknowledgements
We are grateful to the following individuals for their assistance with this project:
l the co-authors of a review of DTA search filters, which was unpublished at the time of this study butwhich has since been published,1,2 for permission to include search filter performance diagrams fromtheir review
l Anne Eisinga (UK Cochrane Centre) for undertaking searches for records for inclusion in the ISSGSearch Filters Resource, including an update search for this project
l Tom Hudson (NICE) for participation in a project meetingl respondents to the interviews and questionnairesl Mary Edwards and Danielle Varley (YHEC) for providing administrative assistancel Dianne Wright (YHEC) for setting up the electronic questionnairel the (anonymous) peer reviewers for their insightful comments.
We acknowledge that there has been a regrettable delay between carrying out the project, including thesearches, and the publication of this report, because of serious illness of the principal investigator.The searches were carried out in 2010/11.
Contributions of authors
Carol Lefebvre (Senior Information Specialist, UK Cochrane Centre) contributed to the drafting of theproject proposal, managed the project as the Principal Investigator, co-drafted the report, responded toeditors’ and peer reviewers’ comments and served as guarantor.
Julie Glanville (Information Specialist and Associate Director, YHEC) conceived the project and led indrafting the project proposal, contributed to the management of the project as the Co-Lead Investigator,assisted in the design of the interview schedule and the survey instrument, carried out some of theinterviews, co-drafted the report and served as guarantor.
Sophie Beale (Senior Consultant, YHEC) designed the interview schedule and the survey instrument,carried out some of the interviews, analysed the interview and survey data and drafted the interview andsurvey sections of the report.
Charles Boachie (Statistician, University of Aberdeen) conducted review C and drafted the relevant sectionof the report.
Steven Duffy (Information Specialist and Research Consultant, YHEC) carried out some of the interviews,conducted review D and drafted the relevant section of the report.
Cynthia Fraser (Information Specialist, University of Aberdeen) conducted reviews C and E, drafted therelevant sections of the report and responded to editors’ and peer reviewers’ comments.
Jenny Harbour (Information Specialist, Healthcare Improvement Scotland) conducted review B anddrafted the relevant section of this report.
Rachael McCool (Research Consultant, YHEC) assisted in the design of the interview schedule and thesurvey instrument and carried out some of the interviews.
DOI: 10.3310/hta21690 HEALTH TECHNOLOGY ASSESSMENT 2017 VOL. 21 NO. 69
© Queen’s Printer and Controller of HMSO 2017. This work was produced by Lefebvre et al. under the terms of a commissioning contract issued by the Secretary of State forHealth. This issue may be freely reproduced for the purposes of private research and study and extracts (or indeed, the full report) may be included in professional journalsprovided that suitable acknowledgement is made and the reproduction is not associated with any form of advertising. Applications for commercial reproduction should beaddressed to: NIHR Journals Library, National Institute for Health Research, Evaluation, Trials and Studies Coordinating Centre, Alpha House, University of Southampton SciencePark, Southampton SO16 7NS, UK.
107
Lynne Smith (Information Specialist, Healthcare Improvement Scotland) conducted review A and draftedthe relevant section of the report.
All authors commented on drafts of the interview schedule, the survey instrument, the results of theinterviews and survey, and the reviews, and approved a prepublication draft of this manuscript.
Publications
Beale S, Duffy S, Glanville J, Lefebvre C, Wright D, McCool R, et al. Choosing and using methodologicalsearch filters: searchers’ views. Health Info Libr J 2014;31:133–47.
Harbour J, Fraser C, Lefebvre C, Glanville J, Beale S, Boachie C, et al. Reporting methodological searchfilter performance comparisons: a literature review. Health Info Libr J 2014;31:176–94.
Presentations
Julie Glanville (YHEC) presented a summary of the project, on behalf of the project team, at the NICE JointInformation Day on 14 November 2011 in London, entitled MRC-Funded Research Project on SearchFilter Performance.
Jenny Harbour (Healthcare Improvement Scotland) presented aspects of the project, on behalf of the projectteam, at the LIS DREaM – Developing Research Excellence and Methods Workshop on 30 January 2012in London. The workshop presentation is available online [see http://lisresearch.org/dream-event-3-unconference-half-hour/ (accessed 28 August 2017)].
Carol Lefebvre (UK Cochrane Centre) presented results from this project, on behalf of the project team,at the HTAi Annual Meeting in Bilbao in June 2012. The poster presentation was entitled MethodologicalSearch Filters Performance Project: What to Measure and How to Present These Measures? [poster 249;see www.htai.org/fileadmin/HTAi_Files/Conferences/2012/2012_HTAi_Bilbao_Poster_Presentations.pdf(accessed July 2016)].
Jenny Harbour (Healthcare Improvement Scotland) presented results from this project, on behalf of theproject team, at the Health Libraries Group conference in Glasgow in July 2012. Her presentation wasentitled ‘Search filters performance project: what to measure and how to present these measures?’.
Data sharing statement
All available data and information have been included within this report or added as appendices. Furtherinformation can be obtained by contacting the corresponding author.
ACKNOWLEDGEMENTS
NIHR Journals Library www.journalslibrary.nihr.ac.uk
108
References
1. Beynon R, Leeflang MM, McDonald S, Eisinga A, Mitchell RL, Whiting P, Glanville JM. Searchstrategies to identify diagnostic accuracy studies in MEDLINE and EMBASE. Cochrane DatabaseSyst Rev 2013;9:MR000022. https://doi.org/10.1002/14651858.MR000022.pub3
2. Whiting P, Westwood M, Beynon R, Burke M, Sterne JA, Glanville J. Inclusion of methodologicalfilters in searches for diagnostic test accuracy studies misses relevant studies. J Clin Epidemiol2011;64:602–7. https://doi.org/10.1016/j.jclinepi.2010.07.006
3. Bak G, Mierzwinski-Urban M, Fitzsimmons H, Morrison A, Maden-Jenkins M. A pragmatic criticalappraisal instrument for search filters: introducing the CADTH CAI. Health Info Libr J2009;26:211–19. https://doi.org/10.1111/j.1471-1842.2008.00830.x
4. Glanville J, Bayliss S, Booth A, Dundar Y, Fernandes H, Fleeman ND, et al. So many filters, so littletime: the development of a search filter appraisal checklist. J Med Libr Assoc 2008;96:356–61.https://doi.org/10.3163/1536-5050.96.4.011
5. Jenkins M, Johnson F. Awareness, use and opinions of methodological search filters used for theretrieval of evidence-based medical literature – a questionnaire survey. Health Info Libr J2004;21:33–43. https://doi.org/10.1111/j.1471-1842.2004.00480.x
6. Glanville J, Lefebvre C, Wright K. ISSG Search Filter Resource. York: The InterTASC InformationSpecialists’ Sub-Group; 2008 [updated 2017]. URL: https://sites.google.com/a/york.ac.uk/issg-search-filters-resource/home (accessed 22 August 2017).
7. McKinlay RJ, Wilczynski NL, Haynes RB, Hedges team. Optimal search strategies for detecting costand economic studies in EMBASE. BMC Health Serv Res 2006;6:67. https://doi.org/10.1186/1472-6963-6-67
8. Wilczynski NL, Haynes RB, Lavis JN, Ramkissoonsingh R, Arnold-Oatley AE, HSR Hedges team.Optimal search strategies for detecting health services research studies in MEDLINE. CMAJ2004;171:1179–85. https://doi.org/10.1503/cmaj.1040512
9. Astin MP, Brazzelli MG, Fraser CM, Counsell CE, Needham G, Grimshaw JM. Developing asensitive search strategy in MEDLINE to retrieve studies on assessment of the diagnosticperformance of imaging techniques. Radiology 2008;247:365–73. https://doi.org/10.1148/radiol.2472070101
10. Bachmann LM, Coray R, Estermann P, Ter Riet G. Identifying diagnostic studies in MEDLINE:reducing the number needed to read. J Am Med Inform Assoc 2002;9:653–8. https://doi.org/10.1197/jamia.M1124
11. Bachmann LM, Estermann P, Kronenberg C, ter Riet G. Identifying diagnostic accuracy studies inEMBASE. J Med Libr Assoc 2003;91:341–6.
12. Berg A, Fleischer S, Behrens J. Development of two search strategies for literature in MEDLINE-PubMed:nursing diagnoses in the context of evidence-based nursing. Int J Nurs Terminol Classif 2005;16:26–32.https://doi.org/10.1111/j.1744-618X.2005.00006.x
13. Haynes RB, McKibbon KA, Wilczynski NL, Walter SD, Werre SR. Optimal search strategies forretrieving scientifically strong studies of treatment from MEDLINE: analytical survey. BMJ2004;328:1040. https://doi.org/10.1136/bmj.38068.557998.EE
14. Vincent S, Greenley S, Beaven O. Clinical evidence diagnosis: developing a sensitive searchstrategy to retrieve diagnostic studies on deep vein thrombosis: a pragmatic approach. Health InfoLibr J 2003;20:150–9. https://doi.org/10.1046/j.1365-2532.2003.00427.x
DOI: 10.3310/hta21690 HEALTH TECHNOLOGY ASSESSMENT 2017 VOL. 21 NO. 69
© Queen’s Printer and Controller of HMSO 2017. This work was produced by Lefebvre et al. under the terms of a commissioning contract issued by the Secretary of State forHealth. This issue may be freely reproduced for the purposes of private research and study and extracts (or indeed, the full report) may be included in professional journalsprovided that suitable acknowledgement is made and the reproduction is not associated with any form of advertising. Applications for commercial reproduction should beaddressed to: NIHR Journals Library, National Institute for Health Research, Evaluation, Trials and Studies Coordinating Centre, Alpha House, University of Southampton SciencePark, Southampton SO16 7NS, UK.
109
15. Wilczynski NL, Haynes RB, Hedges team. EMBASE search strategies for identifying methodologicallysound diagnostic studies for use by clinicians and researchers. BMC Med Res Methodol 2005;3:7.https://doi.org/10.1186/1741-7015-3-7
16. Eady AM, Wilczynski NL, Haynes RB. PsycINFO search strategies identified methodologically soundtherapy studies and review articles for use by clinicians and researchers. J Clin Epidemiol2008;61:34–40. https://doi.org/10.1016/j.jclinepi.2006.09.016
17. Montori VM, Wilczynski NL, Morgan D, Haynes RB, Hedges team. Optimal search strategies forretrieving systematic reviews from MEDLINE: analytical survey. BMJ 2005;330:68. https://doi.org/10.1136/bmj.38336.804167.47
18. Shojania KG, Bero LA. Taking advantage of the explosion of systematic reviews: an efficientMEDLINE search strategy. Eff Clin Pract 2001;4:157–62.
19. White VJ, Glanville JM, Klefebvre C, Sheldon TA. A statistical approach to designing search filters tofind systematic reviews: objectivity enhances accuracy. J Info Sci 2001;27:357–70. https://doi.org/10.1177/016555150102700601
20. Wilczynski NL, Haynes RB, Hedges team. EMBASE search strategies achieved high sensitivity andspecificity for retrieving methodologically sound systematic reviews. J Clin Epidemiol2007;60:29–33. https://doi.org/10.1016/j.jclinepi.2006.04.001
21. Wong SS, Wilczynski NL, Haynes RB. Optimal CINAHL search strategies for identifying therapystudies and review articles. J Nurs Scholarsh 2006;38:194–9. https://doi.org/10.1111/j.1547-5069.2006.00100.x
22. Glanville JM, Lefebvre C, Miles JN, Camosso-Stefinovic J. How to identify randomized controlledtrials in MEDLINE: ten years on. J Med Libr Assoc 2006;94:130–6.
23. Haynes RB, McKibbon KA, Wilczynski NL, Walter SD, Werre SR, Hedges team. Optimal searchstrategies for retrieving scientifically strong studies of treatment from MEDLINE: analytical survey.BMJ 2005;330:21. https://doi.org/10.1136/bmj.38446.498542.8F
24. Lefebvre C, Eisinga A, McDonald S, Paul N. Enhancing access to reports of randomized trialspublished world-wide – the contribution of EMBASE records to the Cochrane Central Register ofControlled Trials (CENTRAL) in The Cochrane Library. Emerg Themes Epidemiol 2008;5:13.https://doi.org/10.1186/1742-7622-5-13
25. Manríquez JJ. A highly sensitive search strategy for clinical trials in Literatura Latino Americana edo Caribe em Ciências da Saúde (LILACS) was developed. J Clin Epidemiol 2008;61:407–11.https://doi.org/10.1016/j.jclinepi.2007.06.009
26. Robinson KA, Dickersin K. Development of a highly sensitive search strategy for the retrieval ofreports of controlled trials using PubMed. Int J Epidemiol 2002;31:150–3. https://doi.org/10.1093/ije/31.1.150
27. Taljaard M, McGowan J, Grimshaw JM, Brehaut JC, McRae A, Eccles MP, Donner A. Electronic searchstrategies to identify reports of cluster randomized trials in MEDLINE: low precision will improve withadherence to reporting standards. BMC Med Res Methodol 2010;10:15. https://doi.org/10.1186/1471-2288-10-15
28. Wong SS, Wilczynski NL, Haynes RB. Developing optimal search strategies for detecting clinicallysound treatment studies in EMBASE. J Med Libr Assoc 2006;94:41–7.
29. Zhang L, Ajiferuke I, Sampson M. Optimizing search strategies to identify randomized controlledtrials in MEDLINE. BMC Med Res Methodol 2006;6:23. https://doi.org/10.1186/1471-2288-6-23
REFERENCES
NIHR Journals Library www.journalslibrary.nihr.ac.uk
110
30. Abhijnhan A, Surcheva Z, Wright J, Adams CE. Searching a biomedical bibliographic databasefrom Bulgaria: the ABS database. Health Info Libr J 2007;24:200–3. https://doi.org/10.1111/j.1471-1842.2007.00723.x
31. Almerie MQ, Matar HE, Jones V, Kumar A, Wright J, Wlostowska E, Adams CE. Searching thePolish Medical Bibliography (Polska Bibliografia Lekarska) for trials. Health Info Libr J2007;24:283–6. https://doi.org/10.1111/j.1471-1842.2007.00716.x
32. Chow TK, To E, Goodchild CS, McNeil JJ. A simple, fast, easy method to identify the evidencebase in pain-relief research: validation of a computer search strategy used alone to identifyquality randomized controlled trials. Anesth Analg 2004;98:1557–65. https://doi.org/10.1213/01.ANE.0000114071.78448.2D
33. Corrao S, Colomba D, Arnone S, Argano C, Di Chiara T, Scaglione R, Licata G. Improving efficacyof PubMed clinical queries for retrieving scientifically strong studies on treatment. J Am MedInform Assoc 2006;13:485–7. https://doi.org/10.1197/jamia.M2084
34. Day D, Furlan A, Irvin E, Bombardier C. Simplified search strategies were effective in identifyingclinical trials of pharmaceuticals and physical modalities. J Clin Epidemiol 2005;58:874–81.https://doi.org/10.1016/j.jclinepi.2005.02.005
35. de Freitas AE, Herbert RD, Latimer J, Ferreira PH. Searching the LILACS database for Portuguese-and Spanish-language randomized trials in physiotherapy was difficult. J Clin Epidemiol2005;58:233–7. https://doi.org/10.1016/j.jclinepi.2004.06.014
36. Devillé WL, Buntinx F, Bouter LM, Montori VM, de Vet HCW, van der Windt D, Bezemer PD.Conducting systematic reviews of diagnostic studies: didactic guidelines. BMC Med Res Methodol2002;2:9. https://doi.org/10.1186/1471-2288-2-9
37. Eisinga A, Siegfried N, Clarke M. The sensitivity and precision of search terms in Phases I, II and IIIof the Cochrane Highly Sensitive Search Strategy for identifying reports of randomized trials inMEDLINE in a specific area of health care – HIV/AIDS prevention and treatment interventions.Health Info Libr J 2007;24:103–9. https://doi.org/10.1111/j.1471-1842.2007.00698.x
38. Kele I, Bereczki D, Furtado V, Wright J, Adams CE. Searching a biomedical bibliographic databasefrom Hungary – the ‘Magyar Orvosi Bibliografia’. Health Info Libr J 2005;22:286–95.https://doi.org/10.1111/j.1471-1842.2005.00577.x
39. Kumar A, Wright J, Adams CE. Searching a biomedical bibliographic database from the Ukraine:the Panteleimon database. Health Info Libr J 2005;22:223–7. https://doi.org/10.1111/j.1471-1842.2005.00578.x
40. McDonald S. Improving access to the international coverage of reports of controlled trials inelectronic databases: a search of the Australasian Medical Index. Health Info Libr J2002;19:14–20. https://doi.org/10.1046/j.0265-6647.2001.00359.x
41. Royle P, Waugh N. Literature searching for clinical and cost-effectiveness studies used in healthtechnology assessment reports carried out for the National Institute for Clinical Excellenceappraisal system. Health Technology Assessment 2003;7(34). https://doi.org/10.3310/hta7340
42. Royle P, Waugh N. A simplified search strategy for identifying randomised controlled trials forsystematic reviews of health care interventions: a comparison with more exhaustive strategies.BMC Med Res Methodol 2005;5:23. https://doi.org/10.1186/1471-2288-5-23
43. Royle P, Waugh N. Making literature searches easier: a rapid and sensitive search filter forretrieving randomized controlled trials from PubMed. Diabet Med 2007;24:308–11.https://doi.org/10.1111/j.1464-5491.2007.02046.x
DOI: 10.3310/hta21690 HEALTH TECHNOLOGY ASSESSMENT 2017 VOL. 21 NO. 69
© Queen’s Printer and Controller of HMSO 2017. This work was produced by Lefebvre et al. under the terms of a commissioning contract issued by the Secretary of State forHealth. This issue may be freely reproduced for the purposes of private research and study and extracts (or indeed, the full report) may be included in professional journalsprovided that suitable acknowledgement is made and the reproduction is not associated with any form of advertising. Applications for commercial reproduction should beaddressed to: NIHR Journals Library, National Institute for Health Research, Evaluation, Trials and Studies Coordinating Centre, Alpha House, University of Southampton SciencePark, Southampton SO16 7NS, UK.
111
44. Sassi F, Archard L, McDaid D. Searching literature databases for health care economic evaluations:how systematic can we afford to be? Med Care 2002;40:387–94. https://doi.org/10.1097/00005650-200205000-00004
45. Wilczynski NL, Haynes RB. Consistency and accuracy of indexing systematic review articles andmeta-analyses in Medline. Health Info Libr J 2009;26:203–10. https://doi.org/10.1111/j.1471-1842.2008.00823.x
46. Harbour J, Fraser C, Lefebvre C, Glanville J, Beale S, Boachie C, et al. Reporting methodologicalsearch filter performance comparisons: a literature review. Health Info Libr J 2014;31:176–94.https://doi.org/10.1111/hir.12070
47. Glanville J, Fleetwood K, Yellowlees A, Kaunelis D, Mensinkai S. Development and Testing ofSearch Filters to Identify Economic Evaluations in MEDLINE and EMBASE. Ottawa, ON: CanadianAgency for Drugs and Technologies in Health (CADTH); 2009.
48. Leeflang MM, Scholten RJ, Rutjes AW, Reitsma JB, Bossuyt PM. Use of methodological searchfilters to identify diagnostic accuracy studies can lead to the omission of relevant studies. J ClinEpidemiol 2006;59:234–40. https://doi.org/10.1016/j.jclinepi.2005.07.014
49. Ritchie G, Glanville J, Lefebvre C. Do published search filters to identify diagnostic test accuracystudies perform adequately? Health Info Libr J 2007;24:188–92. https://doi.org/10.1111/j.1471-1842.2007.00735.x
50. Deurenberg R, Vlayen J, Guillo S, Oliver TK, Fervers B, Burgers J. Standardization of searchmethods for guideline development: an international survey of evidence-based guidelinedevelopment groups. Health Info Libr J 2008;25:23–30. https://doi.org/10.1111/j.1471-1842.2007.00732.x
51. Jenkins M. Evaluation of methodological search filters – a review. Health Info Libr J2004;21:148–63. https://doi.org/10.1111/j.1471-1842.2004.00511.x
52. Sampson M, Zhang L, Morrison A, Barrowman NJ, Clifford TJ, Platt RW, et al. An alternative tothe hand searching gold standard: validating methodological search filters using relative recall.BMC Med Res Methodol 2006;6:33. https://doi.org/10.1186/1471-2288-6-33
53. Boluyt N, Tkosvold L, Lefebvre C, Klassen TP, Offringa M. The usefulness of systematic reviewsearch strategies in finding child health systematic reviews in MEDLINE. Arch Pediatr Adolesc Med2008;162:111–16. https://doi.org/10.1001/archpediatrics.2007.40
54. Royle P, Milne R. Literature searching for randomized controlled trials used in Cochrane reviews:rapid versus exhaustive searches. Int J Technol Assess Health Care 2003;19:591–603. https://doi.org/10.1017/S0266462303000552
55. Bardia A, Wahner-Roedler DL, Erwin PL, Sood A. Search strategies for retrieving complementaryand alternative medicine clinical trials in oncology. Integr Cancer Ther 2006;5:202–5.https://doi.org/10.1177/1534735406292146
56. Boynton J, Glanville J, McDaid D, Lefebvre C. Identifying systematic reviews in MEDLINE:developing an objective approach to search strategy design. J Info Sci 1998;24:137–57.https://doi.org/10.1177/016555159802400301
57. Devillé WL, Bezemer PD, Bouter LM. Publications on diagnostic test evaluation in family medicinejournals: an optimal search strategy. J Clin Epidemiol 2000;53:65–9. https://doi.org/10.1016/S0895-4356(99)00144-4
58. Doust JA, Pietrzak E, Sanders S, Glasziou PP. Identifying studies for systematic reviews ofdiagnostic tests was difficult due to the poor sensitivity and precision of methodologic filters andthe lack of information in the abstract. J Clin Epidemiol 2005;58:444–9. https://doi.org/10.1016/j.jclinepi.2004.09.011
REFERENCES
NIHR Journals Library www.journalslibrary.nihr.ac.uk
112
59. Glanville J, Kaunelis D, Mensinkai S. How well do search filters perform in identifying economicevaluations in MEDLINE and EMBASE. Int J Technol Assess Health Care 2009;25:522–9.https://doi.org/10.1017/S0266462309990523
60. Kastner M, Wilczynski NL, McKibbon AK, Garg AX, Haynes RB. Diagnostic test systematic reviews:bibliographic search filters (‘Clinical Queries’) for diagnostic accuracy studies perform well. J ClinEpidemiol 2009;62:974–81. https://doi.org/10.1016/j.jclinepi.2008.11.006
61. McKibbon KA, Wilczynski NL, Haynes RB, Hedges team. Retrieving randomized controlled trialsfrom MEDLINE: a comparison of 38 published search filters. Health Info Libr J 2009;26:187–202.https://doi.org/10.1111/j.1471-1842.2008.00827.x
62. Royle P, Waugh N. A simplified search strategy for identifying randomised controlled trials forsystematic reviews of health care interventions: a comparison with more exhaustive strategies.BMC Med Res Methodol 2005;5:2–3. https://doi.org/10.1186/1471-2288-5-2
63. Wong SS, Wilczynski NL, Haynes RB. Comparison of top-performing search strategies fordetecting clinically sound treatment studies and systematic reviews in MEDLINE and EMBASE.J Med Libr Assoc 2006;94:451–5.
64. Haynes RB, Wilczynski N, McKibbon KA, Walker CJ, Sinclar JC. Developing optimal searchstrategies for detecting clinically sound studies in MEDLINE. J Am Med Inform Assoc1994;1:447–58.
65. Castro AA, Clark OA, Atallah AN. Optimal search strategy for clinical trials in the Latin Americanand Caribbean Health Science Literature database (LILACS database): update. Sao Paulo Med J1999;117:138e9. http://dx.doi.org/10.1590/S1516-31801997000300004
66. Bradley SM. Examination of the clinical queries and systematic review ‘hedges’ in EMBASE andMEDLINE. J Can Health Libr Assoc 2010;31:27–37. https://doi.org/10.5596/c10-022
67. Leeflang MM, Deeks JJ, Gatsonis C, Bossuyt PM, Cochrane Diagnostic Test Accuracy WorkingGroup. Systematic reviews of diagnostic test accuracy. Ann Intern Med 2008;149:889–97.https://doi.org/10.7326/0003-4819-149-12-200812160-00008
68. Bossuyt PM, Reitsma JB, Bruns DE, Gatsonis CA, Glasziou PP, Irwig LM, et al. Towards completeand accurate reporting of studies of diagnostic accuracy: the STARD initiative. BMJ2003;326:41–4. https://doi.org/10.1136/bmj.326.7379.41
69. Centre for Reviews and Dissemination. Systematic Reviews: CRD’s Guidance for UndertakingReviews in Health Care. York: University of York; 2009.
70. Hui SL, Zhou XH. Evaluation of diagnostic tests without gold standards. Stat Methods Med Res1998;7:354–70. https://doi.org/10.1177/096228029800700404
71. Reitsma JB, Rutjes AW, Khan KS, Coomarasamy A, Bossuyt PM. A review of solutions fordiagnostic accuracy studies with an imperfect or missing reference standard. J Clin Epidemiol2009;62:797–806. https://doi.org/10.1016/j.jclinepi.2009.02.005
72. Rutjes AW, Reitsma JB, Coomarasamy A, Khan KS, Bossuyt PM. Evaluation of diagnostic testswhen there is no gold standard. A review of methods. Health Technol Assess 2007;11(50).https://doi.org/10.3310/hta11500
73. Bossuyt P, Leeflang M. Chapter 6: developing criteria for including studies. In CochraneHandbook of Systematic Reviews of Diagnostic Test Accuracy Version 0.4. The CochraneCollaboration; 2008.
74. Deeks JJ. Systematic reviews in health care: systematic reviews of evaluations of diagnostic andscreening tests. BMJ 2001;323:157–62. https://doi.org/10.1136/bmj.323.7305.157
DOI: 10.3310/hta21690 HEALTH TECHNOLOGY ASSESSMENT 2017 VOL. 21 NO. 69
© Queen’s Printer and Controller of HMSO 2017. This work was produced by Lefebvre et al. under the terms of a commissioning contract issued by the Secretary of State forHealth. This issue may be freely reproduced for the purposes of private research and study and extracts (or indeed, the full report) may be included in professional journalsprovided that suitable acknowledgement is made and the reproduction is not associated with any form of advertising. Applications for commercial reproduction should beaddressed to: NIHR Journals Library, National Institute for Health Research, Evaluation, Trials and Studies Coordinating Centre, Alpha House, University of Southampton SciencePark, Southampton SO16 7NS, UK.
113
75. Food and Drug Administration. Guidance for Industry and Staff: Statistical Guidance on ReportingResults from Studies Evaluating Diagnostic Tests. US Department of Health and Human Services;2007. URL: www.fda.gov/default.htm (accessed 1 June 2011).
76. Medical Services Advisory Committee. Guidelines for the Assessment of Diagnostic Technologies.Canberra, ACT: Australian Government Department of Health and Ageing; 2005.
77. Lijmer JG, Mol BW, Heisterkamp S, Bonsel GJ, Prins MH, van der Meulen JH, Bossuyt PM.Empirical evidence of design-related bias in studies of diagnostic tests. JAMA 1999;282:1061–6.https://doi.org/10.1001/jama.282.11.1061
78. Westwood ME, Whiting PF, Kleijnen J. How does study quality affect the results of a diagnosticmeta-analysis? BMC Med Res Methodol 2005;5:20. https://doi.org/10.1186/1471-2288-5-20
79. Whiting P, Rutjes AW, Reitsma JB, Glas AS, Bossuyt PM, Kleijnen J. Sources of variation and biasin studies of diagnostic accuracy: a systematic review. Ann Intern Med 2004;140:189–202.https://doi.org/10.7326/0003-4819-140-3-200402030-00010
80. Cook C, Cleland J, Huijbregts P. Creation and critique of studies of diagnostic accuracy: use ofthe STARD and QUADAS methodological quality assessment tools. J Man Manip Ther2007;15:93–102. https://doi.org/10.1179/106698107790819945
81. Bachmann LM, Puhan MA, ter Riet G, Bossuyt PM. Sample sizes of studies on diagnostic accuracy:literature survey. BMJ 2006;332:1127–9. https://doi.org/10.1136/bmj.38793.637789.2F
82. Bochmann F, Johnson Z, Azuara-Blanco A. Sample size in studies on diagnostic accuracy inophthalmology: a literature survey. Br J Ophthalmol 2007;91:898–900. https://doi.org/10.1136/bjo.2006.113290
83. Flahault A, Cadilhac M, Thomas G. Sample size calculation should be performed for designaccuracy in diagnostic test studies. J Clin Epidemiol 2005;58:859–62. https://doi.org/10.1016/j.jclinepi.2004.12.009
84. Whiting P, Rutjes AW, Dinnes J, Reitsma J, Bossuyt PM, Kleijnen J. Development and validation ofmethods for assessing the quality of diagnostic accuracy studies. Health Technol Assess 2004;8(25).https://doi.org/10.3310/hta8250
85. Whiting P, Rutjes AW, Reitsma JB, Bossuyt PM, Kleijnen J. The development of QUADAS: a toolfor the quality assessment of studies of diagnostic accuracy included in systematic reviews.BMC Med Res Methodol 2003;3:25. https://doi.org/10.1186/1471-2288-3-25
86. Belgian Health Care Knowledge Centre. HTA: Molecular Diagnostics in Belgium. Report no. 20A.Brussels: Federaal Kenniscentrum voor de Gezondheidszorg; 2005. URL: www.kce.fgov.be/(accessed 1 June 2011).
87. Whiting PF, Sterne JA, Westwood ME, Bachmann LM, Harbord R, Egger M, Deeks JJ. Graphicalpresentation of diagnostic information. BMC Med Res Methodol 2008;8:20. https://doi.org/10.1186/1471-2288-8-20
88. Jaeschke R, Guyatt GH, Sackett DL. Users’ guides to the medical literature. III. How to use anarticle about a diagnostic test. B. What are the results and will they help me in caring for mypatients? The Evidence-Based Medicine Working Group. JAMA 1994;271:703–7. https://doi.org/10.1001/jama.1994.03510330081039
89. Deeks J, Altman DG, Bradburn MJ. Chapter 10: Statistical Methods for Examining Heterogeneityand Combining Results from Several Studies in Meta-analysis. In Egger M, Davey Smith G,Altman DG, editors. Systematic Reviews in Health Care: Meta-analysis in Context. London: BMJPublishing Group; 2001. pp. 285–312. https://doi.org/10.1002/9780470693926.ch15
REFERENCES
NIHR Journals Library www.journalslibrary.nihr.ac.uk
114
90. Deeks J, Bossuyt P, Gatsonis C, Macaskill P, Harbord R, Takwoingi Y. Analysing and PresentingResults. In Cochrane Handbook of Systematic Reviews of Diagnostic Test Accuracy Version 0.9.0.The Cochrane Collaboration; 2010.
91. Bossuyt PM. The quality of reporting in diagnostic test research: getting better, still not optimal.Clin Chem 2004;50:465–6. https://doi.org/10.1373/clinchem.2003.029736
92. Coppus SF, van der Veen F, Bossuyt PM, Mol BW. Quality of reporting of test accuracy studies inreproductive medicine: impact of the Standards for Reporting of Diagnostic Accuracy (STARD)initiative. Fertil Steril 2006;86:1321–9. https://doi.org/10.1016/j.fertnstert.2006.03.050
93. Harper R, Reeves B. Reporting of precision of estimates for diagnostic accuracy: a review. BMJ1999;318:1322–3. https://doi.org/10.1136/bmj.318.7194.1322
94. Rama KR, Poovali S, Apsingi S. Quality of reporting of orthopaedic diagnostic accuracy studies issuboptimal. Clin Orthop Relat Res 2006;447:237–46. https://doi.org/10.1097/01.blo.0000205906.44103.a3
95. Shunmugam M, Azuara-Blanco A. The quality of reporting of diagnostic accuracy studies inglaucoma using the Heidelberg retina tomograph. Invest Ophthalmol Vis Sci 2006;47:2317–23.https://doi.org/10.1167/iovs.05-1250
96. Siddiqui MA, Azuara-Blanco A, Burr J. The quality of reporting of diagnostic accuracy studiespublished in ophthalmic journals. Br J Ophthalmol 2005;89:261–5. https://doi.org/10.1136/bjo.2004.051862
97. Smidt N, Rutjes AW, van der Windt DA, Ostelo RW, Bossuyt PM, Reitsma JB. Reproducibility ofthe STARD checklist: an instrument to assess the quality of reporting of diagnostic accuracystudies. BMC Med Res Method 2006;6:12. https://doi.org/10.1186/1471-2288-6-12
98. Wilczynski NL. Quality of reporting of diagnostic accuracy studies: no change since STARDstatement publication – before-and-after study. Radiology 2008;248:817–23. https://doi.org/10.1148/radiol.2483072067
99. Smidt N, Rutjes AW, van der Windt DA, Ostelo RW, Bossuyt PM, Reitsma JB, et al. The qualityof diagnostic accuracy studies since the STARD statement: has it improved? Neurology2006;67:792–7. https://doi.org/10.1212/01.wnl.0000238386.41398.30
100. Agency for Healthcare Research and Quality. A Comprehensive Overview of the Methods andReporting of Meta-analyses of Test Accuracy. Rockville, MD: Agency for Healthcare Research andQuality; 2011.
101. Honest H, Khan KS. Reporting of measures of accuracy in systematic reviews of diagnosticliterature. BMC Health Serv Res 2002;2:4. https://doi.org/10.1186/1472-6963-2-4
102. Mallett S, Deeks JJ, Halligan S, Hopewell S, Cornelius V, Altman DG. Systematic reviews ofdiagnostic tests in cancer: review of methods and reporting. BMJ 2006;333:413. https://doi.org/10.1136/bmj.38895.467130.55
103. Belgian Health Care Knowledge C. Search for Evidence and Critical Appraisal: Health TechnologyAssessment [Process Notes D200/710.273/40]. Brussels: Belgian Health Care KnowledgeCentre; 2007.
104. National Institute for Health and Care Excellence. Interim Methods Statement: Centre forHealth Technology Evaluation, Diagnostics Assessment Programme. London: NICE; 2010.URL: www.nice.org.uk/ (accessed 1 June 2011).
105. Morris RK, Selman TJ, Zamora J, Khan KS. Methodological quality of test accuracy studiesincluded in systematic reviews in obstetrics and gynaecology: sources of bias. BMC WomensHealth 2011;11:7. https://doi.org/10.1186/1472-6874-11-7
DOI: 10.3310/hta21690 HEALTH TECHNOLOGY ASSESSMENT 2017 VOL. 21 NO. 69
© Queen’s Printer and Controller of HMSO 2017. This work was produced by Lefebvre et al. under the terms of a commissioning contract issued by the Secretary of State forHealth. This issue may be freely reproduced for the purposes of private research and study and extracts (or indeed, the full report) may be included in professional journalsprovided that suitable acknowledgement is made and the reproduction is not associated with any form of advertising. Applications for commercial reproduction should beaddressed to: NIHR Journals Library, National Institute for Health Research, Evaluation, Trials and Studies Coordinating Centre, Alpha House, University of Southampton SciencePark, Southampton SO16 7NS, UK.
115
106. Whiting P, Rutjes AW, Dinnes J, Reitsma JB, Bossuyt PM, Kleijnen J. A systematic review finds thatdiagnostic reviews fail to incorporate quality despite available tools. J Clin Epidemiol 2005;58:1–12.https://doi.org/10.1016/j.jclinepi.2004.04.008
107. Leeflang MM, Bossuyt PM, Irwig L. Diagnostic test accuracy may vary with prevalence:implications for evidence-based diagnosis. J Clin Epidemiol 2009;62:5–12. https://doi.org/10.1016/j.jclinepi.2008.04.007
108. Rutjes AW, Reitsma JB, Di Nisio M, Smidt N, van Rijn JC, Bossuyt PM. Evidence of bias andvariation in diagnostic accuracy studies. CMAJ 2006;174:469–76. https://doi.org/10.1503/cmaj.050090
109. Dinnes J, Deeks J, Kirby J, Roderick P. A methodological review of how heterogeneity has beenexamined in systematic reviews of diagnostic test accuracy. Health Technol Assess 2005;9(12).https://doi.org/10.3310/hta9120
110. Reitsma JB, Glas AS, Rutjes AW, Scholten RJ, Bossuyt PM, Zwinderman AH. Bivariate analysis ofsensitivity and specificity produces informative summary measures in diagnostic reviews. J ClinEpidemiol 2005;58:982–90. https://doi.org/10.1016/j.jclinepi.2005.02.022
111. Rutter CM, Gatsonis CA. A hierarchical regression approach to meta-analysis of diagnostic testaccuracy evaluations. Stat Med 2001;20:2865–84. https://doi.org/10.1002/sim.942
112. Willis BH, Quigley M. Uptake of newer methodological developments and the deployment ofmeta-analysis in diagnostic test research: a systematic review. BMC Med Res Methodol2011;11:27. https://doi.org/10.1186/1471-2288-11-27
113. Davis J, Goadrich M. The Relationship between Precision-Recall and ROC Curves. Proceedings ofthe 23rd Annual Conference on Machine Learning, Pittsburgh, PA, 2006. New York, NY: ACM;2006. pp. 233–40. https://doi.org/10.1145/1143844.1143874
114. Higgins J, Green S, editors. Cochrane Handbook for Systematic Reviews of Interventions Version5.1.0 [updated March 2011]. The Cochrane Collaboration; 2011. URL: www.handbook.cochrane.org(accessed 25 August 2017).
115. Jha S, Ho A, Bhargavan M, Owen JB, Sunshine JH. Imaging evaluation for suspected pulmonaryembolism: what do emergency physicians and radiologists say? AJR Am J Roentgenol2010;194:W38–48. https://doi.org/10.2214/AJR.09.2694
116. McGinnis PQ, Hack LM, Nixon-Cave K, Michlovitz SL. Factors that influence the clinical decisionmaking of physical therapists in choosing a balance assessment approach. Phys Ther2009;89:233–47. https://doi.org/10.2522/ptj.20080131
117. Perneger TV, Martin DP, Bovier PA. Physicians’ attitudes toward health care rationing. Med DecisMaking 2002;22:65–70. https://doi.org/10.1177/0272989X0202200106
118. Sox CM, Koepsell TD, Doctor JN, Christakis DA. Pediatricians’ clinical decision making: results of2 randomized controlled trials of test performance characteristics. Arch Pediatr Adolesc Med2006;160:487–92. https://doi.org/10.1001/archpedi.160.5.487
119. Stein PD, Sostman HD, Dalen JE, Bailey DL, Bajc M, Goldhaber SZ, et al. Controversies in diagnosisof pulmonary embolism. Clin Appl Thromb Hemost 2011;17:140–9. https://doi.org/10.1177/1076029610389027
120. Wackerbarth SB, Tarasenko YN, Curtis LA, Joyce JM, Haist SA. Using decision tree models todepict primary care physicians CRC screening decision heuristics. J Gen Intern Med2007;22:1467–9. https://doi.org/10.1007/s11606-007-0338-6
121. Zettler M, Mollon B, da Silva V, Howe B, Speechley M, Vinden C. Family physicians’ choices ofand opinions on colorectal cancer screening modalities. Can Fam Physician 2010;56:e338–44.
REFERENCES
NIHR Journals Library www.journalslibrary.nihr.ac.uk
116
122. UK National Screening Committee. Criteria for Appraising the Viability, Effectiveness andAppropriateness of a Screening Programme. 2011. URL: www.screening.nhs.uk/criteria(accessed 1 June 2011).
123. US Preventive Services Task Force. Procedure Manual. Publication No. 08-05118-EF. US PreventiveServices Task Force; 2008. URL: www.uspreventiveservicestaskforce.org/uspstf08/methods/procmanual.htm (accessed 1 June 2011).
124. Australian Population Health Development Principal Committee Screening Subcommittee.Population Based Screening Framework. Canberra, ACT, Australian Population HealthDevelopment Principal Committee Screening Subcommittee; 2008. URL: www.health.gov.au(accessed June 2011).
125. World Health Organization. Screening for Various Cancers. Geneva: WHO; 2011.URL: www.who.int/cancer/detection/variouscancer/en/ (accessed 1 June 2011).
126. Agoritsas T, Courvoisier DS, Combescure C, Deom M, Perneger TV. Does prevalence matter tophysicians in estimating post-test probability of disease? A randomized trial. J Gen Intern Med2011;26:373–8. https://doi.org/10.1007/s11606-010-1540-5
127. Bramwell R, West H, Salmon P. Health professionals’ and service users’ interpretation of screeningtest results: experimental study. BMJ 2006;333:284. https://doi.org/10.1136/bmj.38884.663102.AE
128. Cahan A, Gilon D, Manor O, Paltiel O. Probabilistic reasoning and clinical decision-making: dodoctors overestimate diagnostic probabilities? Q J Med 2003;96:763–9. https://doi.org/10.1093/qjmed/hcg122
129. Heller RF, Sandars JE, Patterson L, McElduff P. GPs’ and physicians’ interpretation of risks, benefitsand diagnostic test results. Fam Pract 2004;21:155–9. https://doi.org/10.1093/fampra/cmh209
130. Sox CM, Doctor JN, Koepsell TD, Christakis DA. The influence of types of decision support onphysicians’ decision making. Arch Dis Child 2009;94:185–90. https://doi.org/10.1136/adc.2008.141903
131. Steurer J, Fischer JE, Bachmann LM, Koller M, ter Riet G. Communicating accuracy of tests togeneral practitioners: a controlled study. BMJ 2002;324:824–6. https://doi.org/10.1136/bmj.324.7341.824
132. Beale S, Duffy S, Glanville J, Lefebvre C, Wright D, McCool R, et al. Choosing and usingmethodological search filters: searchers’ views. Health Info Libr J 2014;31:133–47. https://doi.org/10.1111/hir.12062
133. Lefebvre C, Manheimer E, Glanville J. Chapter 6: Searching for Studies. In Higgins JPT, Green S,editors. Cochrane Handbook for Systematic Reviews of Interventions Version 5.1.0 [updatedMarch 2011]. The Cochrane Collaboration; 2011. URL: http://training.cochrane.org/handbook(accessed 22 September 2017).
134. EBLIP Editorial Team. Evidence Based Library and Information Practice. Edmonton, AB: Universityof Alberta; 2014. URL: http://ejournals.library.ualberta.ca/index.php/EBLIP/index (accessed1 September 2014).
135. Hausner E, Waffenschmidt S, Kaiser T, Simon M. Routine development of objectively derivedsearch strategies. Syst Rev 2012;1:19. https://doi.org/10.1186/2046-4053-1-19
136. Noyes P, Popay J, Pearson A, Hannes K, Booth A. Chapter 20: Qualitative Research and CochraneReviews. In Higgins J, Green S, editors. Cochrane Handbook for Systematic Reviews ofInterventions Version 5.1.0 [updated March 2011]. The Cochrane Collaboration; 2011.URL: http://training.cochrane.org/handbook (accessed 22 September 2017).
DOI: 10.3310/hta21690 HEALTH TECHNOLOGY ASSESSMENT 2017 VOL. 21 NO. 69
© Queen’s Printer and Controller of HMSO 2017. This work was produced by Lefebvre et al. under the terms of a commissioning contract issued by the Secretary of State forHealth. This issue may be freely reproduced for the purposes of private research and study and extracts (or indeed, the full report) may be included in professional journalsprovided that suitable acknowledgement is made and the reproduction is not associated with any form of advertising. Applications for commercial reproduction should beaddressed to: NIHR Journals Library, National Institute for Health Research, Evaluation, Trials and Studies Coordinating Centre, Alpha House, University of Southampton SciencePark, Southampton SO16 7NS, UK.
117
137. Sampson M, Tetzlaff J, Urquhart C. Precision of healthcare systematic review searches in across-sectional sample. Res Synth Methods 2011;2:119–25. https://doi.org/10.1002/jrsm.42
138. Hopewell S, Clark M, Lefebvre C, Scherer R. Handsearching still a valuable element of thesystematic review. Evid Based Dent 2008;9:85. https://doi.org/10.1038/sj.ebd.6400602
139. Hopewell S, Clarke M, Lefebvre C, Scherer R. Handsearching versus electronic searching toidentify reports of randomized trials. Cochrane Database Syst Rev 2007;2:MR000001.https://doi.org/10.1002/14651858.MR000001.pub2
140. McGowan J, Sampson M, Salzwedel DM, Cogo E, Foerster V, Lefebvre C. PRESS Peer Review ofElectronic Search Strategies: 2015 guideline statement. J Clin Epidemiol 2016;75:40–6.https://doi.org/10.1016/j.jclinepi.2016.01.021
141. McGowan J, Sampson M, Salzwedel DM, Cogo E, Foerster V, Lefebvre C. PRESS – Peer Review ofElectronic Search Strategies: 2015 Guideline Explanation and Elaboration (PRESS E&E). Ottawa, ON:Canadian Agency for Drugs and Technologies in Health (CADTH); 2016. URL: www.cadth.ca/sites/default/files/pdf/CP0015_PRESS_Update_Report_2016.pdf (accessed 1 January 2017).
142. Whiting P, Westwood M, Bojke L, Palmer S, Richardson G, Cooper J, et al. Clinical effectivenessand cost-effectiveness of tests for the diagnosis and investigation of urinary tract infection inchildren: a systematic review and economic model. Health Technol Assess 2006;10(36).https://doi.org/10.3310/hta10360
REFERENCES
NIHR Journals Library www.journalslibrary.nihr.ac.uk
118
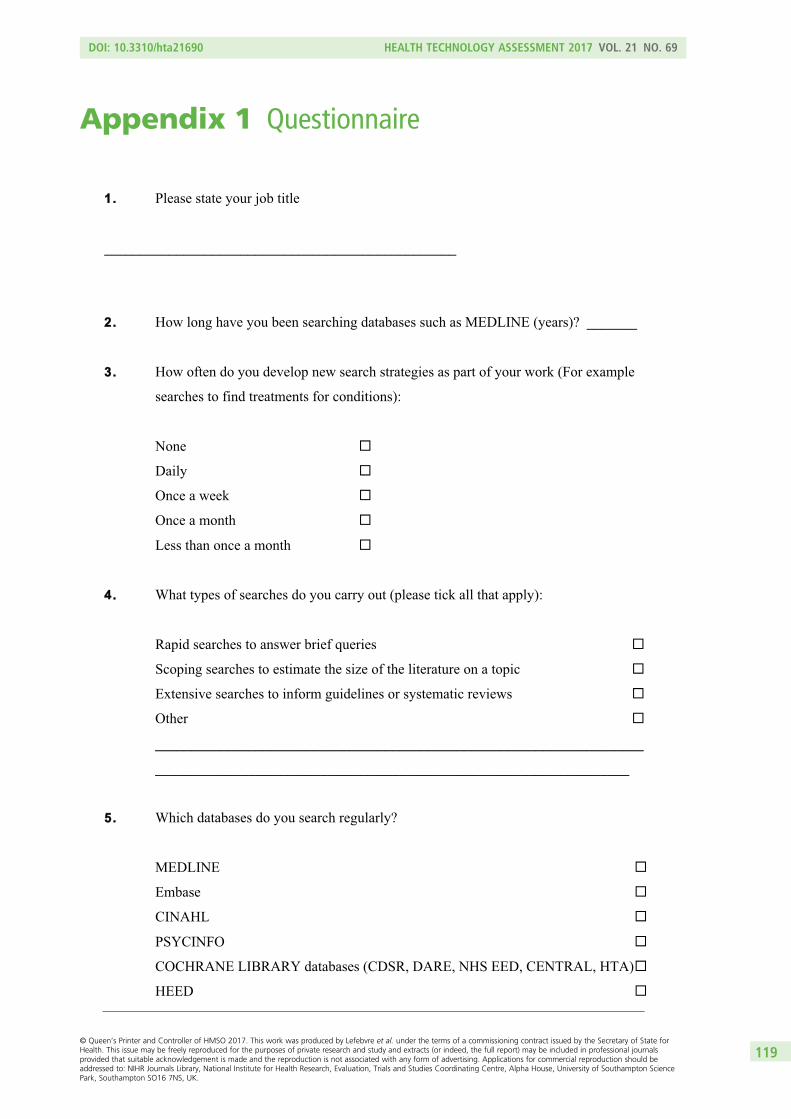
Appendix 1 Questionnaire
11.. Please state your job title
_________________________________________________
22.. How long have you been searching databases such as MEDLINE (years)? _______
33.. How often do you develop new search strategies as part of your work (For example
searches to find treatments for conditions):
None
Daily
Once a week
Once a month
Less than once a month
44.. What types of searches do you carry out (please tick all that apply):
Rapid searches to answer brief queries
Scoping searches to estimate the size of the literature on a topic
Extensive searches to inform guidelines or systematic reviews
Other
____________________________________________________________________
__________________________________________________________________
55.. Which databases do you search regularly?
MEDLINE
Embase
CINAHL
PSYCINFO
COCHRANE LIBRARY databases (CDSR, DARE, NHS EED, CENTRAL, HTA)
HEED
DOI: 10.3310/hta21690 HEALTH TECHNOLOGY ASSESSMENT 2017 VOL. 21 NO. 69
© Queen’s Printer and Controller of HMSO 2017. This work was produced by Lefebvre et al. under the terms of a commissioning contract issued by the Secretary of State forHealth. This issue may be freely reproduced for the purposes of private research and study and extracts (or indeed, the full report) may be included in professional journalsprovided that suitable acknowledgement is made and the reproduction is not associated with any form of advertising. Applications for commercial reproduction should beaddressed to: NIHR Journals Library, National Institute for Health Research, Evaluation, Trials and Studies Coordinating Centre, Alpha House, University of Southampton SciencePark, Southampton SO16 7NS, UK.
119
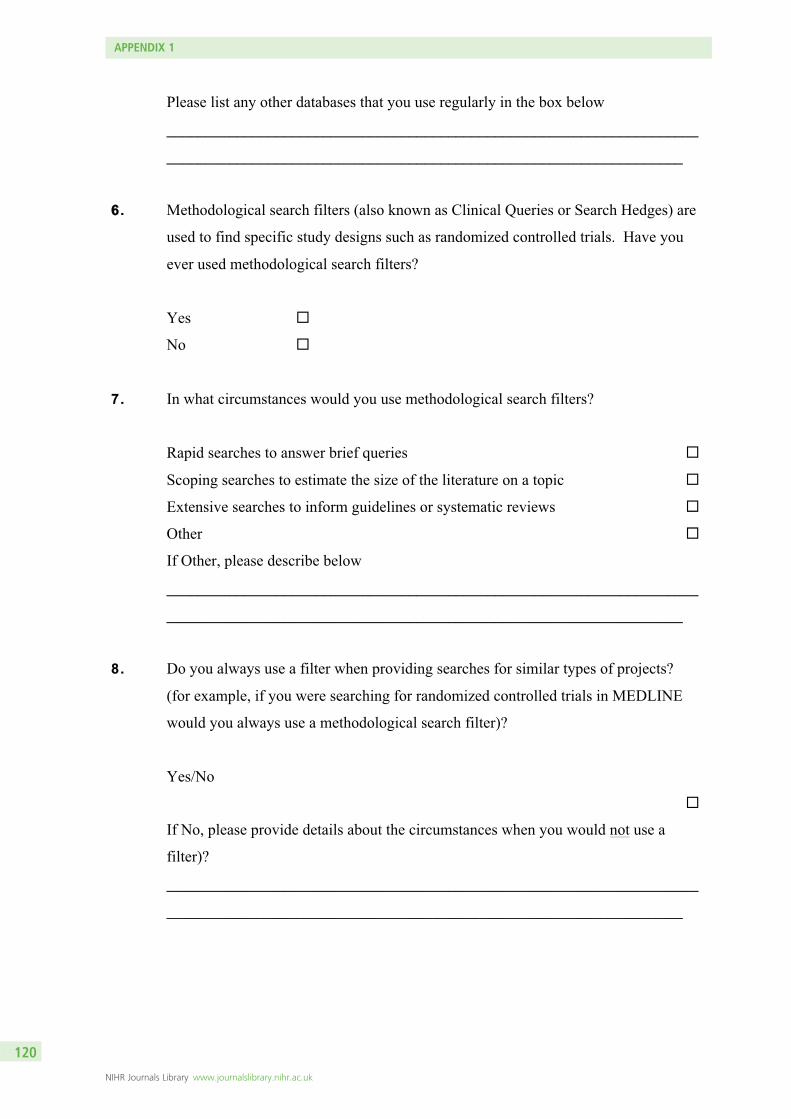
Please list any other databases that you use regularly in the box below
____________________________________________________________________
__________________________________________________________________
66. Methodological search filters (also known as Clinical Queries or Search Hedges) are
used to find specific study designs such as randomized controlled trials. Have you
ever used methodological search filters?
Yes
No
7. In what circumstances would you use methodological search filters?
Rapid searches to answer brief queries
Scoping searches to estimate the size of the literature on a topic
Extensive searches to inform guidelines or systematic reviews
Other
If Other, please describe below
____________________________________________________________________
__________________________________________________________________
8. Do you always use a filter when providing searches for similar types of projects?
(for example, if you were searching for randomized controlled trials in MEDLINE
would you always use a methodological search filter)?
Yes/No
If No, please provide details about the circumstances when you would not use a
filter)?
____________________________________________________________________
__________________________________________________________________
APPENDIX 1
NIHR Journals Library www.journalslibrary.nihr.ac.uk
120
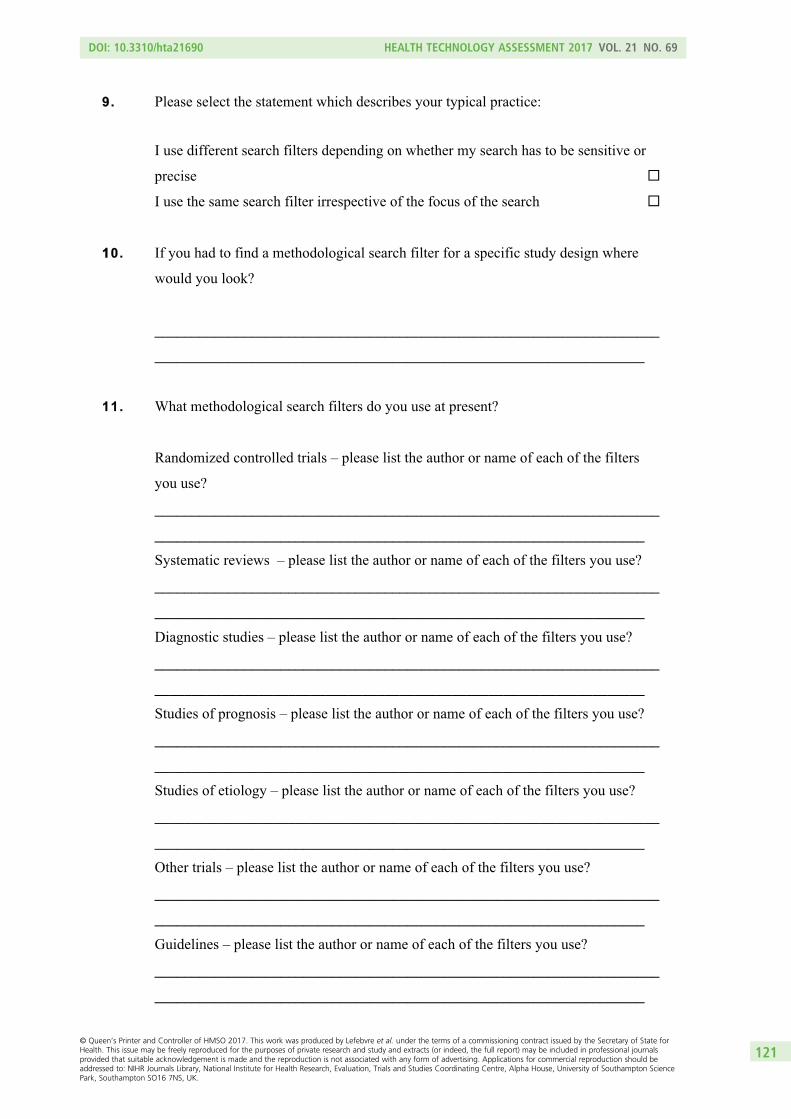
I use different search filters depending on whether my search has to be sensitive or
precise
I use the same search filter irrespective of the focus of the search
110. If you had to find a methodological search filter for a specific study design where
would you look?
____________________________________________________________________
__________________________________________________________________
11. What methodological search filters do you use at present?
Randomized controlled trials – please list the author or name of each of the filters
you use?
____________________________________________________________________
__________________________________________________________________
Systematic reviews – please list the author or name of each of the filters you use?
____________________________________________________________________
__________________________________________________________________
Diagnostic studies – please list the author or name of each of the filters you use?
____________________________________________________________________
__________________________________________________________________
Studies of prognosis – please list the author or name of each of the filters you use?
____________________________________________________________________
__________________________________________________________________
Studies of etiology – please list the author or name of each of the filters you use?
____________________________________________________________________
__________________________________________________________________
Other trials – please list the author or name of each of the filters you use?
____________________________________________________________________
__________________________________________________________________
Guidelines – please list the author or name of each of the filters you use?
____________________________________________________________________
__________________________________________________________________
9. Please select the statement which describes your typical practice:
DOI: 10.3310/hta21690 HEALTH TECHNOLOGY ASSESSMENT 2017 VOL. 21 NO. 69
© Queen’s Printer and Controller of HMSO 2017. This work was produced by Lefebvre et al. under the terms of a commissioning contract issued by the Secretary of State forHealth. This issue may be freely reproduced for the purposes of private research and study and extracts (or indeed, the full report) may be included in professional journalsprovided that suitable acknowledgement is made and the reproduction is not associated with any form of advertising. Applications for commercial reproduction should beaddressed to: NIHR Journals Library, National Institute for Health Research, Evaluation, Trials and Studies Coordinating Centre, Alpha House, University of Southampton SciencePark, Southampton SO16 7NS, UK.
121
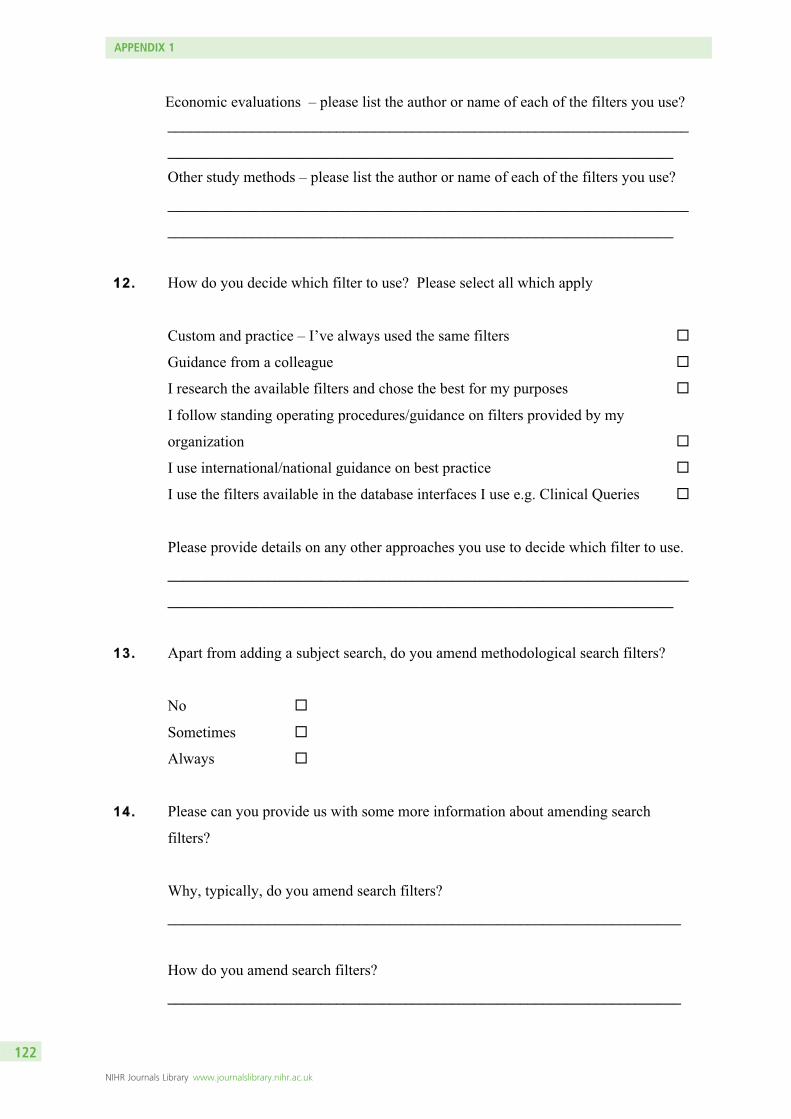
____________________________________________________________________
__________________________________________________________________
Other study methods – please list the author or name of each of the filters you use?
____________________________________________________________________
__________________________________________________________________
112. How do you decide which filter to use? Please select all which apply
Custom and practice – I’ve always used the same filters
Guidance from a colleague
I research the available filters and chose the best for my purposes
I follow standing operating procedures/guidance on filters provided by my
organization
I use international/national guidance on best practice
I use the filters available in the database interfaces I use e.g. Clinical Queries
Please provide details on any other approaches you use to decide which filter to use.
____________________________________________________________________
__________________________________________________________________
13. Apart from adding a subject search, do you amend methodological search filters?
No
Sometimes
Always
14. Please can you provide us with some more information about amending search
filters?
Why, typically, do you amend search filters?
___________________________________________________________________
How do you amend search filters?
___________________________________________________________________
Economic evaluations – please list the author or name of each of the filters you use?
APPENDIX 1
NIHR Journals Library www.journalslibrary.nihr.ac.uk
122
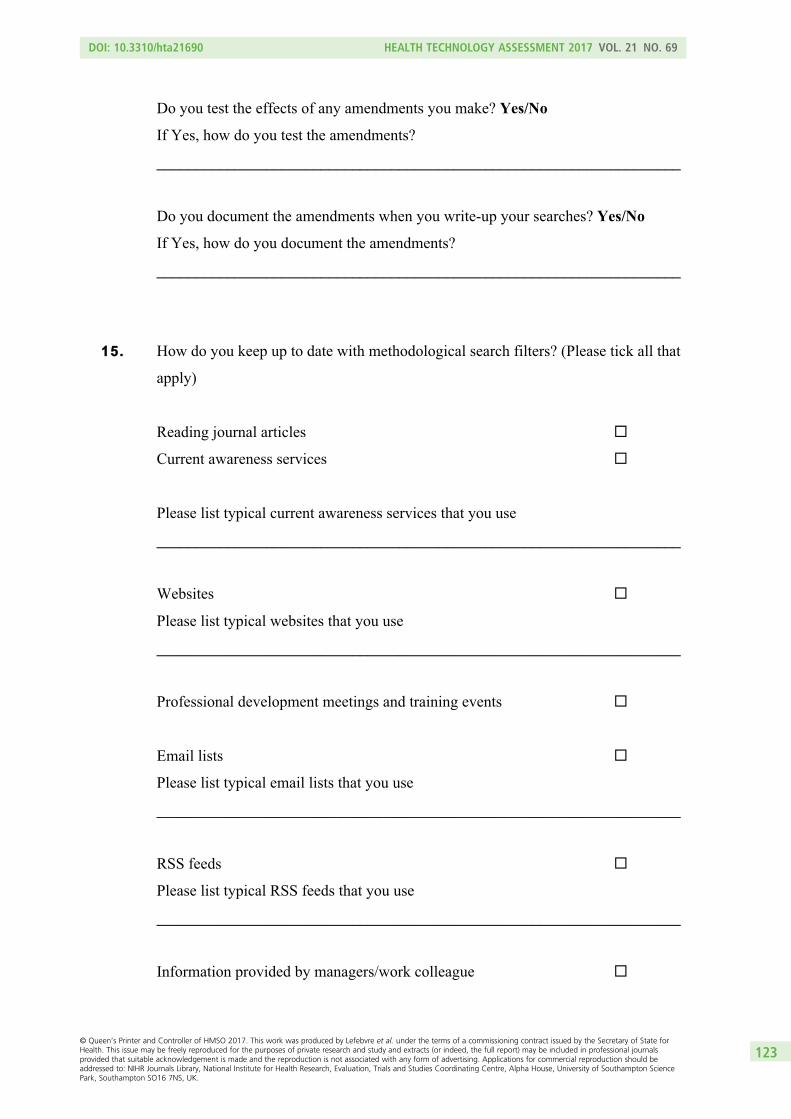
Do you test the effects of any amendments you make? Yes/No
If Yes, how do you test the amendments?
___________________________________________________________________
Do you document the amendments when you write-up your searches? Yes/No
If Yes, how do you document the amendments?
___________________________________________________________________
1155.. How do you keep up to date with methodological search filters? (Please tick all that
apply)
Reading journal articles
Current awareness services
Please list typical current awareness services that you use
___________________________________________________________________
Websites
Please list typical websites that you use
___________________________________________________________________
Professional development meetings and training events
Email lists
Please list typical email lists that you use
___________________________________________________________________
RSS feeds
Please list typical RSS feeds that you use
___________________________________________________________________
Information provided by managers/work colleague
DOI: 10.3310/hta21690 HEALTH TECHNOLOGY ASSESSMENT 2017 VOL. 21 NO. 69
© Queen’s Printer and Controller of HMSO 2017. This work was produced by Lefebvre et al. under the terms of a commissioning contract issued by the Secretary of State forHealth. This issue may be freely reproduced for the purposes of private research and study and extracts (or indeed, the full report) may be included in professional journalsprovided that suitable acknowledgement is made and the reproduction is not associated with any form of advertising. Applications for commercial reproduction should beaddressed to: NIHR Journals Library, National Institute for Health Research, Evaluation, Trials and Studies Coordinating Centre, Alpha House, University of Southampton SciencePark, Southampton SO16 7NS, UK.
123
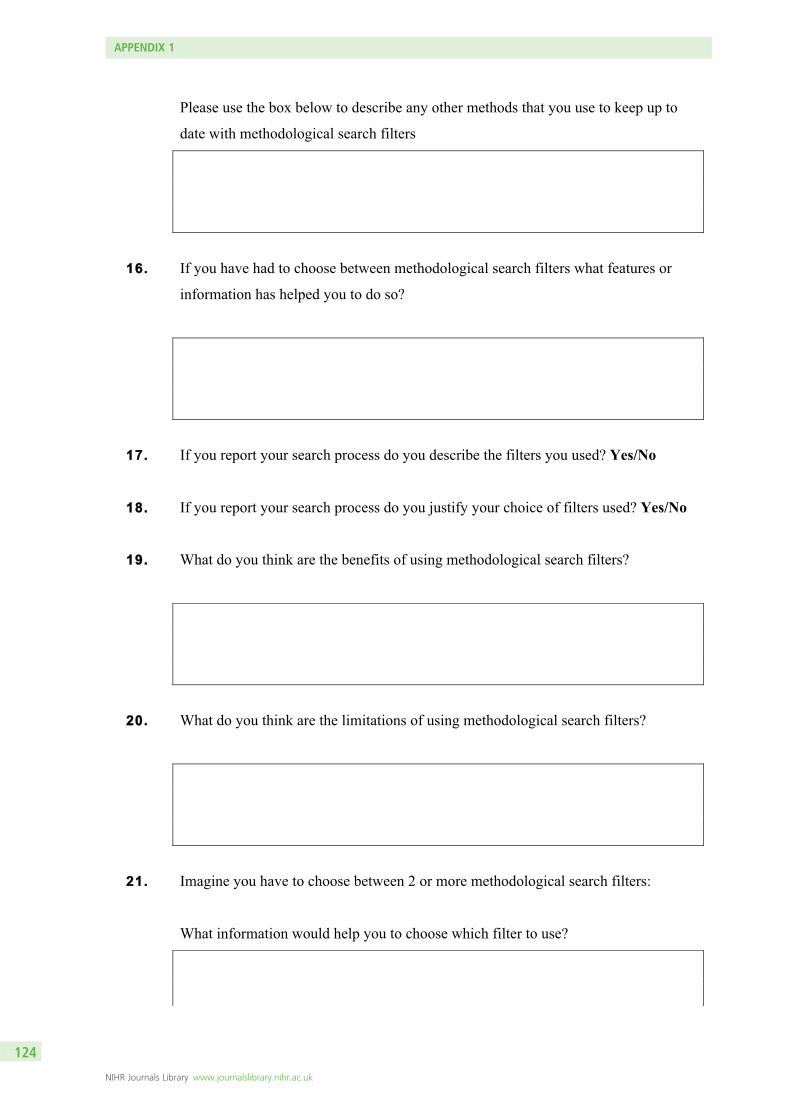
Please use the box below to describe any other methods that you use to keep up to
date with methodological search filters
1166.. If you have had to choose between methodological search filters what features or
information has helped you to do so?
1177.. If you report your search process do you describe the filters you used? Yes/No
1188.. If you report your search process do you justify your choice of filters used? Yes/No
1199.. What do you think are the benefits of using methodological search filters?
2200.. What do you think are the limitations of using methodological search filters?
2211.. Imagine you have to choose between 2 or more methodological search filters:
What information would help you to choose which filter to use?
APPENDIX 1
NIHR Journals Library www.journalslibrary.nihr.ac.uk
124
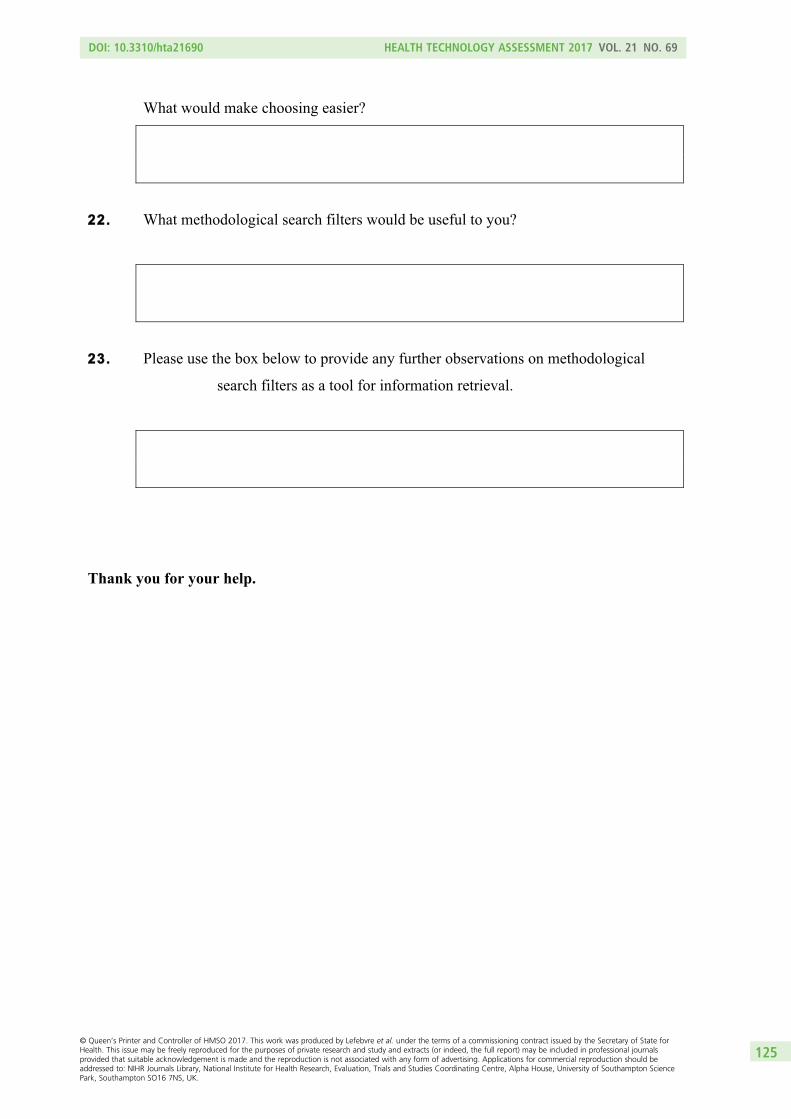
What would make choosing easier?
2222.. What methodological search filters would be useful to you?
2233.. Please use the box below to provide any further observations on methodological
search filters as a tool for information retrieval.
Thank you for your help.
DOI: 10.3310/hta21690 HEALTH TECHNOLOGY ASSESSMENT 2017 VOL. 21 NO. 69
© Queen’s Printer and Controller of HMSO 2017. This work was produced by Lefebvre et al. under the terms of a commissioning contract issued by the Secretary of State forHealth. This issue may be freely reproduced for the purposes of private research and study and extracts (or indeed, the full report) may be included in professional journalsprovided that suitable acknowledgement is made and the reproduction is not associated with any form of advertising. Applications for commercial reproduction should beaddressed to: NIHR Journals Library, National Institute for Health Research, Evaluation, Trials and Studies Coordinating Centre, Alpha House, University of Southampton SciencePark, Southampton SO16 7NS, UK.
125

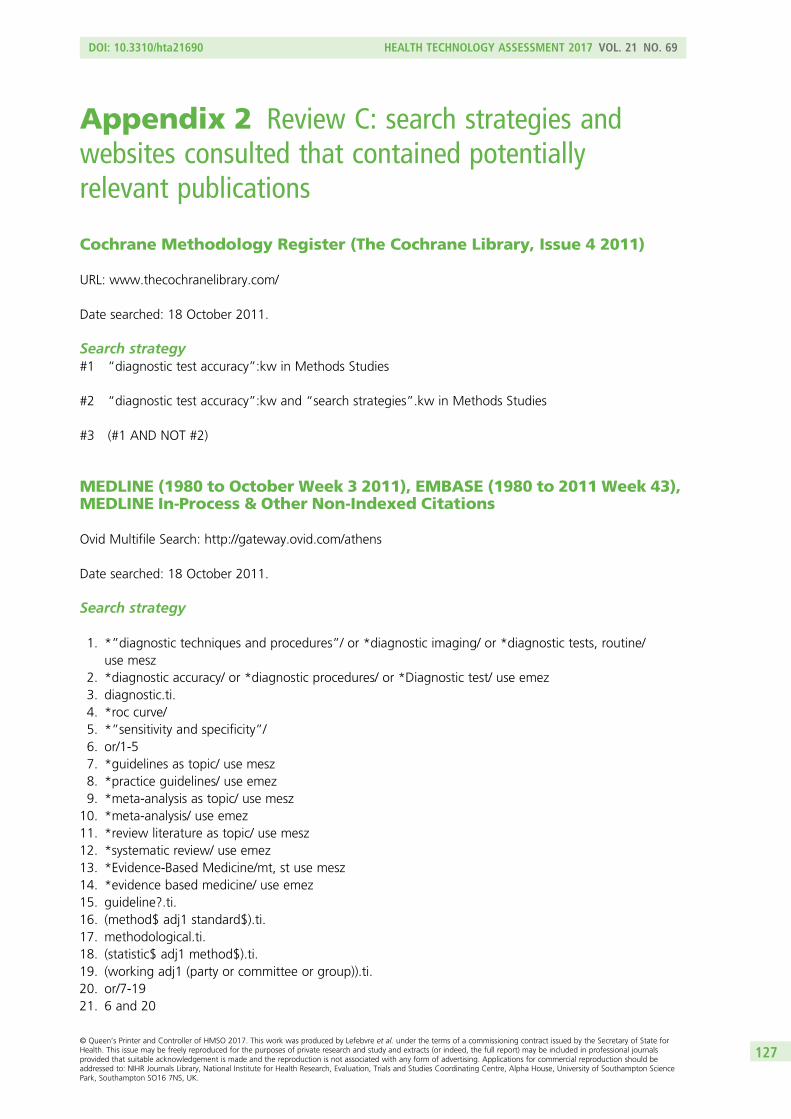
Appendix 2 Review C: search strategies andwebsites consulted that contained potentiallyrelevant publications
Cochrane Methodology Register (The Cochrane Library, Issue 4 2011)
URL: www.thecochranelibrary.com/
Date searched: 18 October 2011.
Search strategy#1 “diagnostic test accuracy”:kw in Methods Studies
#2 “diagnostic test accuracy”:kw and “search strategies”.kw in Methods Studies
#3 (#1 AND NOT #2)
MEDLINE (1980 to October Week 3 2011), EMBASE (1980 to 2011 Week 43),MEDLINE In-Process & Other Non-Indexed Citations
Ovid Multifile Search: http://gateway.ovid.com/athens
Date searched: 18 October 2011.
Search strategy
1. *”diagnostic techniques and procedures”/ or *diagnostic imaging/ or *diagnostic tests, routine/use mesz
2. *diagnostic accuracy/ or *diagnostic procedures/ or *Diagnostic test/ use emez3. diagnostic.ti.4. *roc curve/5. *”sensitivity and specificity”/6. or/1-57. *guidelines as topic/ use mesz8. *practice guidelines/ use emez9. *meta-analysis as topic/ use mesz
10. *meta-analysis/ use emez11. *review literature as topic/ use mesz12. *systematic review/ use emez13. *Evidence-Based Medicine/mt, st use mesz14. *evidence based medicine/ use emez15. guideline?.ti.16. (method$ adj1 standard$).ti.17. methodological.ti.18. (statistic$ adj1 method$).ti.19. (working adj1 (party or committee or group)).ti.20. or/7-1921. 6 and 20
DOI: 10.3310/hta21690 HEALTH TECHNOLOGY ASSESSMENT 2017 VOL. 21 NO. 69
© Queen’s Printer and Controller of HMSO 2017. This work was produced by Lefebvre et al. under the terms of a commissioning contract issued by the Secretary of State forHealth. This issue may be freely reproduced for the purposes of private research and study and extracts (or indeed, the full report) may be included in professional journalsprovided that suitable acknowledgement is made and the reproduction is not associated with any form of advertising. Applications for commercial reproduction should beaddressed to: NIHR Journals Library, National Institute for Health Research, Evaluation, Trials and Studies Coordinating Centre, Alpha House, University of Southampton SciencePark, Southampton SO16 7NS, UK.
127
22. limit 21 to english language23. remove duplicates from 2224. limit 23 to yr=”1980 –Current” (993)
Medion
Department of General Practice, University of Maastricht (www.mediondatabase.nl/)
Date searched: 18 October 2011.
Search: methodological studies on systematic reviews of diagnostic studies (all subheadings).
Websites consulted that contained potentially relevant publications
Date searched: 18 October 2011.
l AHRQ, US Department of Health and Human Services (www.ahrq.gov).l Belgian Health Care Knowledge Centre (KCE) (www.kce.fgov.be/).l CRD, University of York (www.york.ac.uk/inst/crd/).l Diagnostic Test Accuracy Review Group, Cochrane (http://srdta.cochrane.org/welcome).l Medical Services Advisory Committee, Australian Government Department of Health and Ageing
(www.msac.gov.au/).l NICE, Diagnostic Assessment Programme (www.nice.org.uk/aboutnice/whatwedo/
aboutdiagnosticsassessment/diagnosticsassessmentprogramme.jsp).l US FDA, US Department of Health and Human Services (www.fda.gov/).
APPENDIX 2
NIHR Journals Library www.journalslibrary.nihr.ac.uk
128
Appendix 3 Review C: excluded studiesArends LR, Hamza TH, van Houwelingen JC, Heijenbrok-Kal MH, Hunink MG, Stijnen T. Bivariate randomeffects meta-analysis of ROC curves. Med Decis Making 2008;28:621–38.
Begg CB. Methodologic standards for diagnostic test assessment studies. J Gen Intern Med 1988;3:518–20.
Bossuyt PM. Diagnostic accuracy reporting guidelines should prescribe reporting, not modeling. J ClinEpidemiol 2009;62:355–6, 362.
Bossuyt PM, Reitsma JB, Bruns DE, Gatsonis CA, Glasziou PP, Irwig LM, et al. Towards complete andaccurate reporting of studies of diagnostic accuracy: the STARD initiative. Ann Intern Med 2003;138:40–4.
Bossuyt PM, Reitsma JB, Bruns DE, Gatsonis CA, Glasziou PP, Irwig LM, et al. The STARD statement forreporting studies of diagnostic accuracy: explanation and elaboration. Clin Chem 2003;49:7–18.
Bossuyt PM, Reitsma JB, Bruns DE, Gatsonis CA, Glasziou PP, Irwig LM, et al. Towards complete andaccurate reporting of studies of diagnostic accuracy: the STARD initiative. Radiology 2003;226:24–8.
Bossuyt PM, Reitsma JB, Bruns DE, Gatsonis CA, Glasziou PP, Irwig LM, et al. Towards complete andaccurate reporting of studies of diagnostic accuracy: the STARD initiative. Fam Pract 2004;21:4–10.
Bossuyt PM, Reitsma JB, Bruns DE, Gatsonis CA, Glasziou PP, Irwig LM, et al. Towards complete andaccurate reporting of studies of diagnostic accuracy: the STARD initiative. Vet Clin Pathol 2007;36:8–12.
Bruns DE, Huth EJ, Magid.E. Toward a checklist for reporting of studies of diagnostic accuracy of medicaltests. Clin Chem 2000;46:893–5.
Chu H, Cole SR. Bivariate meta-analysis of sensitivity and specificity with sparse data: a generalized linearmixed model approach. J Clin Epidemiol 2006;59:1331–2, 13.
Chu H, Nie L, Cole SR, Poole C. Meta-analysis of diagnostic accuracy studies accounting for diseaseprevalence: alternative parameterizations and model selection. Stat Med 2009;28:2384–99.
Cleophas TJ, Droogendijk J, van Ouwerkerk BM. Validating diagnostic tests, correct and incorrect methods,new developments. Curr Clin Pharmacol 2008;3:70–6.
Elie C, Coste J. A methodological framework to distinguish spectrum effects from spectrum biases and toassess diagnostic and screening test accuracy for patient populations: application to the Papanicolaoucervical cancer smear test. BMC Med Res Methodol 2008;8:7.
Hamza TH, van Houwelingen HC, Heijenbrok-Kal MH, Stijnen T. Associating explanatory variables withsummary receiver operating characteristic curves in diagnostic meta-analysis. J Clin Epidemiol2009;62:1284–91.
Harbord RM, Deeks JJ, Egger M, Whiting P, Sterne JA. A unification of models for meta-analysis ofdiagnostic accuracy studies. Biostatistics 2007;8:239–51.
Harbord RM, Whiting P, Sterne JA, Egger M, Deeks JJ, Shang A et al. An empirical comparison of methodsfor meta-analysis of diagnostic accuracy showed hierarchical models are necessary. J Clin Epidemiol2008;61:1095–103.
DOI: 10.3310/hta21690 HEALTH TECHNOLOGY ASSESSMENT 2017 VOL. 21 NO. 69
© Queen’s Printer and Controller of HMSO 2017. This work was produced by Lefebvre et al. under the terms of a commissioning contract issued by the Secretary of State forHealth. This issue may be freely reproduced for the purposes of private research and study and extracts (or indeed, the full report) may be included in professional journalsprovided that suitable acknowledgement is made and the reproduction is not associated with any form of advertising. Applications for commercial reproduction should beaddressed to: NIHR Journals Library, National Institute for Health Research, Evaluation, Trials and Studies Coordinating Centre, Alpha House, University of Southampton SciencePark, Southampton SO16 7NS, UK.
129
Hilden J. The area under the ROC curve and its competitors. Med Decis Making 1991;11:95–101.
Hollingworth W, Medina LS, Lenkinski RE, Shibata DK, Bernal B, Zurakowski D, et al. Interrater reliability inassessing quality of diagnostic accuracy studies using the QUADAS tool. A preliminary assessment. AcadRadiol 2006;13:803–10.
Irwig L. Modelling result-specific likelihood ratios. J Clin Epidemiol 1992;45:1335–8.
Irwig L, Tosteson AN, Gatsonis C, Lau J, Colditz G, Chalmers TC, et al. Guidelines for meta-analysesevaluating diagnostic tests. Ann Intern Med 1994;120:667–76.
Irwig L, Macaskill P, Glasziou P, Fahey M. Meta-analytic methods for diagnostic test accuracy. J ClinEpidemiol 1995;48:119–30.
Jaeschke R, Guyatt G, Sackett DL. Users’ guides to the medical literature. III. How to use an article about adiagnostic test. A. Are the results of the study valid? Evidence-Based Medicine Working Group. JAMA1994;271:389–91.
Jones CM, Athanasiou T. Diagnostic accuracy meta-analysis: review of an important tool in radiologicalresearch and decision making. Br J Radiol 2009;82:441–6.
Jones CM, Ashrafian H, Skapinakis P, Arora S, Darzi A, Dimopoulos K, et al. Diagnostic accuracy meta-analysis: a review of the basic principles of interpretation and application. Int J Cardiol 2010;140:138–44.
Khan KS. Systematic reviews of diagnostic tests: a guide to methods and application. Best Pract Res ClinObstet Gynaecol 2005;19:37–46.
Knottnerus JA, van Weel C, Muris JWM. Evidence base of clinical diagnosis: evaluation of diagnosticprocedures. BMJ 2002;324:477–80.
Lachs MS, Nachamkin I, Edelstein PH, Goldman J, Feinstein AR, Schwartz JS. Spectrum bias in theevaluation of diagnostic tests: lessons from the rapid dipstick test for urinary tract infection. Ann Intern Med1992;117:135–40.
Leeflang M, Reitsma J, Scholten R, Rutjes A, Di Nisio M, Deeks J, et al. Impact of adjustment for quality onresults of metaanalyses of diagnostic accuracy. Clin Chem 2007;53:164–72.
Lijmer JG, Bossuyt PM, Heisterkamp SH. Exploring sources of heterogeneity in systematic reviews ofdiagnostic tests. Stat Med 2002;21:1525–37.
Littenberg B, Moses LE. Estimating diagnostic accuracy from multiple conflicting reports: a newmeta-analytic method. Med Decis Making 1993;13:313–21.
Lumbreras B, Porta M, Marquez S, Pollan M, Parker LA, Hernandez-Aguado I. QUADOMICS: an adaptationof the Quality Assessment of Diagnostic Accuracy Assessment (QUADAS) for the evaluation of themethodological quality of studies on the diagnostic accuracy of ‘-omics’-based technologies. Clin Biochem2008;41:1316–25.
Lumbreras-Lacarra B, Ramos-Rincon JM, Hernandez-Aguado I. Methodology in diagnostic laboratory testresearch in Clinical Chemistry and Clinical Chemistry and Laboratory Medicine. Clin Chem 2004;50:530–6.
Macaskill P. Empirical Bayes estimates generated in a hierarchical summary ROC analysis agreed closelywith those of a full Bayesian analysis. J Clin Epidemiol 2004;57:925–32.
APPENDIX 3
NIHR Journals Library www.journalslibrary.nihr.ac.uk
130

Meads CA, Davenport CF. Quality assessment of diagnostic before–after studies: development ofmethodology in the context of a systematic review. BMC Med Res Methodol 2009;9:3.
Moher D, Tetzlaff J, Tricco AC, Sampson M, Altman DG. Epidemiology and reporting characteristics ofsystematic reviews. PLOS Med 2007;4:e78.
Mol BW, Lijmer JG, Evers JL, Bossuyt PM. Characteristics of good diagnostic studies. Semin Reprod Med2003;21:17–25.
Mulherin SA, Miller WC. Spectrum bias or spectrum effect? Subgroup variation in diagnostic testevaluation. Ann Intern Med 2002;137:598–602.
Obuchowski NA. Sample size calculations in studies of test accuracy. Stat Methods Med Res 1998;7:371–92.
Oosterhuis WP, Niessen RW, Bossuyt PM. The science of systematic reviewing studies of diagnostic tests.Clin Chem Lab Med 2000;38:577–88.
Parker LA, Saez NG, Lumbreras B, Porta M, Hernandez-Aguado I. Methodological deficits in diagnosticresearch using ‘-omics’ technologies: evaluation of the QUADOMICS tool and quality of recently publishedstudies. PLOS ONE 2010;5:1–8.
Paul M, Riebler A, Bachmann LM, Rue H, Held L. Bayesian bivariate meta-analysis of diagnostic test studiesusing integrated nested Laplace approximations. Stat Med 2010;29:1325–39.
Petticrew MP, Sowden AJ, Lister SD, Wright K. False-negative results in screening programmes: systematicreview of impact and implications. Health Technol Assess 2000;4(5).
Ransohoff D, Feinstein A. Problems of spectrum and bias in evaluating the efficacy of diagnostic tests.N Engl J Med 1978;299:926–9.
Reid MC, Lachs MS, Feinstein AR. Use of methodological standards in diagnostic test research. Gettingbetter but still not good. JAMA 1995;274:645–51.
Reynolds TA, Schriger DL. Annals of Emergency Medicine Journal Club. The conduct and reporting ofmeta-analyses of studies of diagnostic tests and a consideration of ROC curves: answers to the January2010 Journal Club questions. Ann Emerg Med 2010;55:570–7.
Rigby AS, Summerton N. Statistical methods in epidemiology. VIII. On the use of likelihood ratios fordiagnostic testing with an application to general practice. Disabil Rehab 2005;27:475–80.
Rutter CM, Gatsonis CA. Regression methods for meta-analysis of diagnostic test data. Acad Radiol1995;2:S48–56.
Sackett DL, Haynes RB. The architecture of diagnostic research. BMJ 2002;324:539–41.
Schunemann HJ, Oxman AD, Brozek J, Glasziou P, Bossuyt P, Chang S, et al. GRADE: assessing the qualityof evidence for diagnostic recommendations. ACP J Club 2008;149:2.
Schunemann HJ, Oxman AD, Brozek J, Glasziou P, Jaeschke R, Vist GE, et al. Grading quality of evidenceand strength of recommendations for diagnostic tests and strategies. BMJ 2008;336:1106–10.
Schwenke C, Busse R. Analysis of differences in proportions from clustered data with multiplemeasurements in diagnostic studies. Methods Inf Med 2007;46:548–52.
DOI: 10.3310/hta21690 HEALTH TECHNOLOGY ASSESSMENT 2017 VOL. 21 NO. 69
© Queen’s Printer and Controller of HMSO 2017. This work was produced by Lefebvre et al. under the terms of a commissioning contract issued by the Secretary of State forHealth. This issue may be freely reproduced for the purposes of private research and study and extracts (or indeed, the full report) may be included in professional journalsprovided that suitable acknowledgement is made and the reproduction is not associated with any form of advertising. Applications for commercial reproduction should beaddressed to: NIHR Journals Library, National Institute for Health Research, Evaluation, Trials and Studies Coordinating Centre, Alpha House, University of Southampton SciencePark, Southampton SO16 7NS, UK.
131
Sheps SB, Schechter MT. The assessment of diagnostic tests: a survey of current medical research. JAMA1984;252:2418–22.
Siadaty MS, Shu J. Proportional odds ratio model for comparison of diagnostic tests in meta-analysis.BMC Med Res Methodol 2004;4:27.
Smidt N, Overbeke J, De VH, Bossuyt P. Endorsement of the STARD statement by biomedical journals:survey of instructions for authors. Clin Chem 2007;53:1983–5.
Stengel D, Bauwens K, Sehouli J, Ekkernkamp A, Porzsolt F. A likelihood ratio approach to meta-analysisof diagnostic studies. J Med Screen 2003;10:47–51.
Suzuki S. Conditional relative odds ratio and comparison of accuracy of diagnostic tests based on 2 × 2tables. J Epidemiol 2006;16:145–53.
Valenstein PN. Evaluating diagnostic tests with imperfect standards. Am J Clin Pathol 1990;93:252–8.
Walter SD, Irwig l, Glasziou PP. Meta-analysis of diagnostic tests with imperfect reference standards.J Clin Epidemiol 1999;52:943–51.
APPENDIX 3
NIHR Journals Library www.journalslibrary.nihr.ac.uk
132
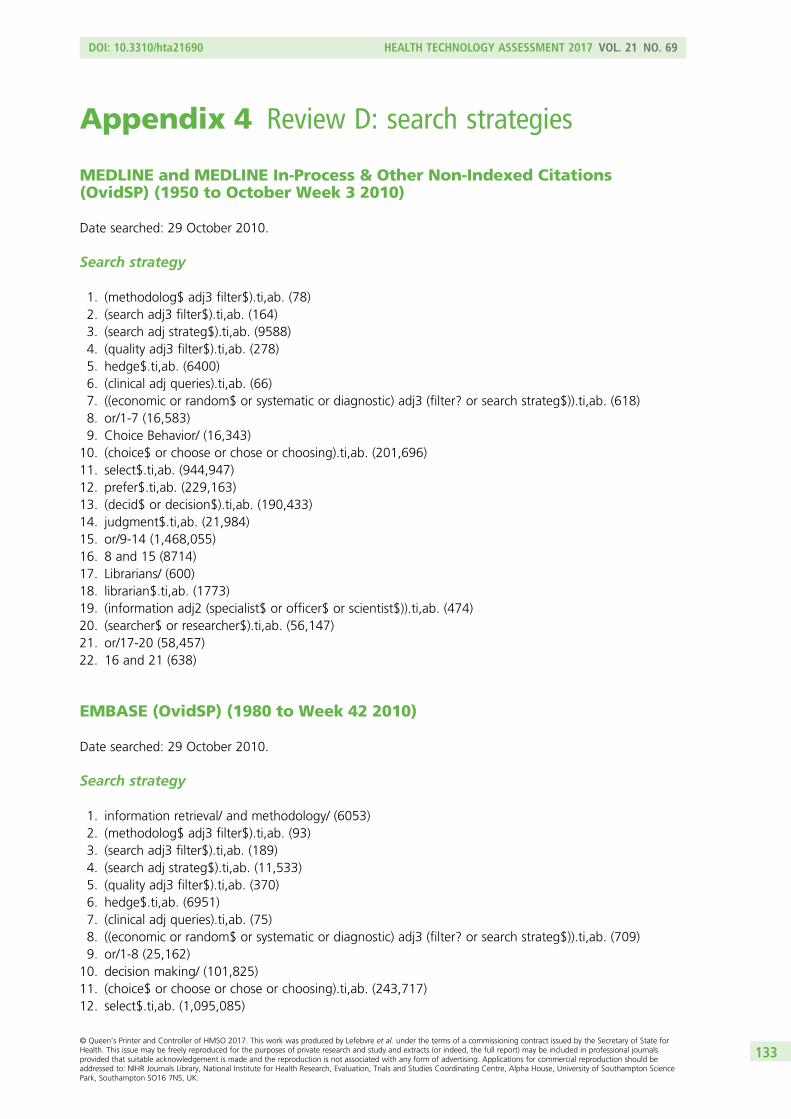
Appendix 4 Review D: search strategies
MEDLINE and MEDLINE In-Process & Other Non-Indexed Citations(OvidSP) (1950 to October Week 3 2010)
Date searched: 29 October 2010.
Search strategy
1. (methodolog$ adj3 filter$).ti,ab. (78)2. (search adj3 filter$).ti,ab. (164)3. (search adj strateg$).ti,ab. (9588)4. (quality adj3 filter$).ti,ab. (278)5. hedge$.ti,ab. (6400)6. (clinical adj queries).ti,ab. (66)7. ((economic or random$ or systematic or diagnostic) adj3 (filter? or search strateg$)).ti,ab. (618)8. or/1-7 (16,583)9. Choice Behavior/ (16,343)
10. (choice$ or choose or chose or choosing).ti,ab. (201,696)11. select$.ti,ab. (944,947)12. prefer$.ti,ab. (229,163)13. (decid$ or decision$).ti,ab. (190,433)14. judgment$.ti,ab. (21,984)15. or/9-14 (1,468,055)16. 8 and 15 (8714)17. Librarians/ (600)18. librarian$.ti,ab. (1773)19. (information adj2 (specialist$ or officer$ or scientist$)).ti,ab. (474)20. (searcher$ or researcher$).ti,ab. (56,147)21. or/17-20 (58,457)22. 16 and 21 (638)
EMBASE (OvidSP) (1980 to Week 42 2010)
Date searched: 29 October 2010.
Search strategy
1. information retrieval/ and methodology/ (6053)2. (methodolog$ adj3 filter$).ti,ab. (93)3. (search adj3 filter$).ti,ab. (189)4. (search adj strateg$).ti,ab. (11,533)5. (quality adj3 filter$).ti,ab. (370)6. hedge$.ti,ab. (6951)7. (clinical adj queries).ti,ab. (75)8. ((economic or random$ or systematic or diagnostic) adj3 (filter? or search strateg$)).ti,ab. (709)9. or/1-8 (25,162)
10. decision making/ (101,825)11. (choice$ or choose or chose or choosing).ti,ab. (243,717)12. select$.ti,ab. (1,095,085)
DOI: 10.3310/hta21690 HEALTH TECHNOLOGY ASSESSMENT 2017 VOL. 21 NO. 69
© Queen’s Printer and Controller of HMSO 2017. This work was produced by Lefebvre et al. under the terms of a commissioning contract issued by the Secretary of State forHealth. This issue may be freely reproduced for the purposes of private research and study and extracts (or indeed, the full report) may be included in professional journalsprovided that suitable acknowledgement is made and the reproduction is not associated with any form of advertising. Applications for commercial reproduction should beaddressed to: NIHR Journals Library, National Institute for Health Research, Evaluation, Trials and Studies Coordinating Centre, Alpha House, University of Southampton SciencePark, Southampton SO16 7NS, UK.
133
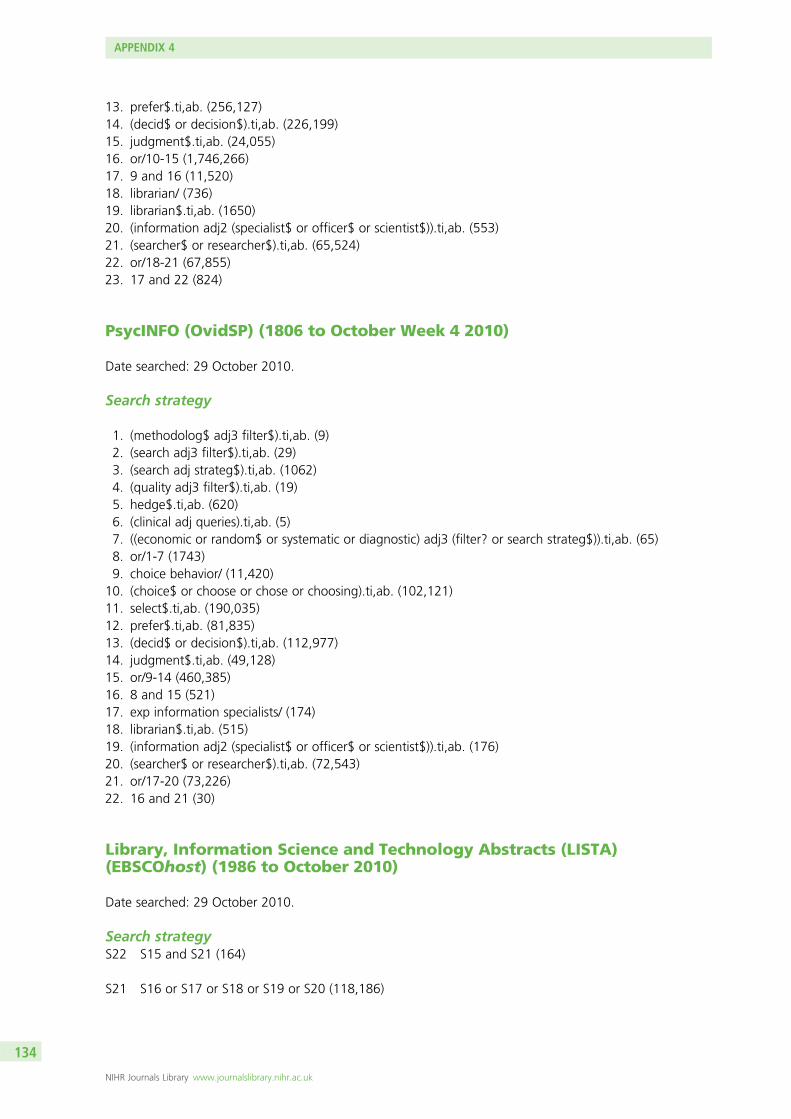
13. prefer$.ti,ab. (256,127)14. (decid$ or decision$).ti,ab. (226,199)15. judgment$.ti,ab. (24,055)16. or/10-15 (1,746,266)17. 9 and 16 (11,520)18. librarian/ (736)19. librarian$.ti,ab. (1650)20. (information adj2 (specialist$ or officer$ or scientist$)).ti,ab. (553)21. (searcher$ or researcher$).ti,ab. (65,524)22. or/18-21 (67,855)23. 17 and 22 (824)
PsycINFO (OvidSP) (1806 to October Week 4 2010)
Date searched: 29 October 2010.
Search strategy
1. (methodolog$ adj3 filter$).ti,ab. (9)2. (search adj3 filter$).ti,ab. (29)3. (search adj strateg$).ti,ab. (1062)4. (quality adj3 filter$).ti,ab. (19)5. hedge$.ti,ab. (620)6. (clinical adj queries).ti,ab. (5)7. ((economic or random$ or systematic or diagnostic) adj3 (filter? or search strateg$)).ti,ab. (65)8. or/1-7 (1743)9. choice behavior/ (11,420)
10. (choice$ or choose or chose or choosing).ti,ab. (102,121)11. select$.ti,ab. (190,035)12. prefer$.ti,ab. (81,835)13. (decid$ or decision$).ti,ab. (112,977)14. judgment$.ti,ab. (49,128)15. or/9-14 (460,385)16. 8 and 15 (521)17. exp information specialists/ (174)18. librarian$.ti,ab. (515)19. (information adj2 (specialist$ or officer$ or scientist$)).ti,ab. (176)20. (searcher$ or researcher$).ti,ab. (72,543)21. or/17-20 (73,226)22. 16 and 21 (30)
Library, Information Science and Technology Abstracts (LISTA)(EBSCOhost) (1986 to October 2010)
Date searched: 29 October 2010.
Search strategyS22 S15 and S21 (164)
S21 S16 or S17 or S18 or S19 or S20 (118,186)
APPENDIX 4
NIHR Journals Library www.journalslibrary.nihr.ac.uk
134
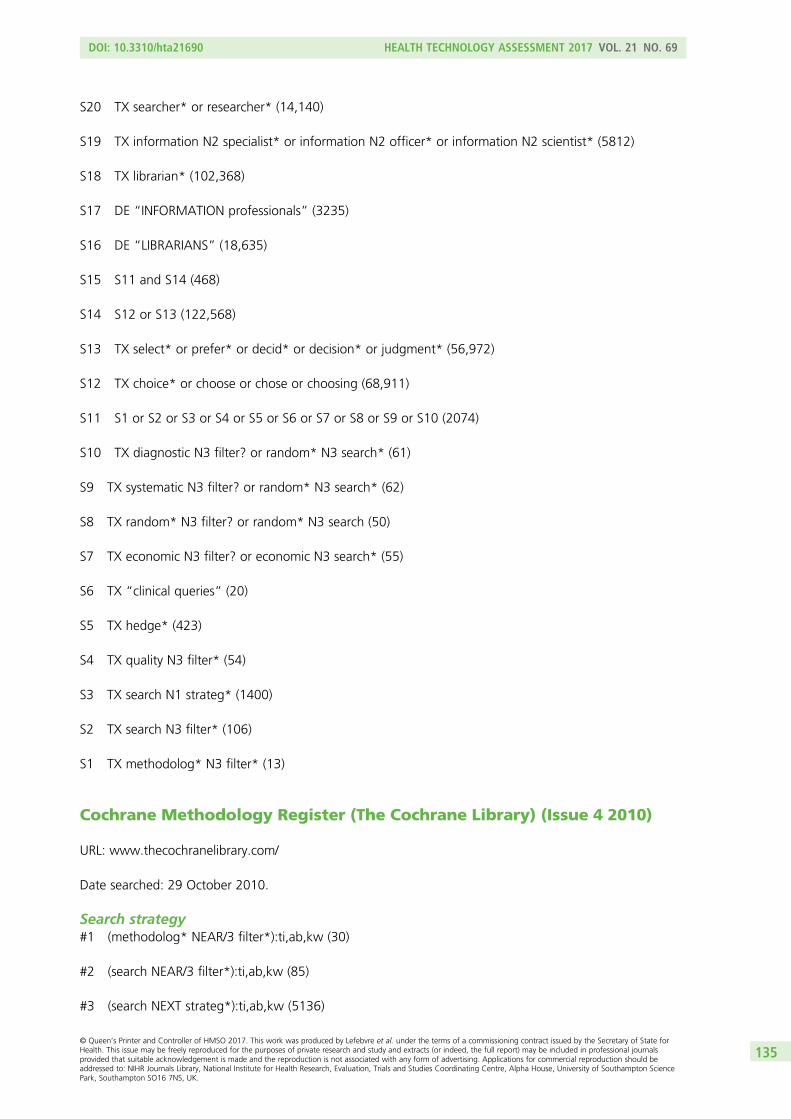
S20 TX searcher* or researcher* (14,140)
S19 TX information N2 specialist* or information N2 officer* or information N2 scientist* (5812)
S18 TX librarian* (102,368)
S17 DE “INFORMATION professionals” (3235)
S16 DE “LIBRARIANS” (18,635)
S15 S11 and S14 (468)
S14 S12 or S13 (122,568)
S13 TX select* or prefer* or decid* or decision* or judgment* (56,972)
S12 TX choice* or choose or chose or choosing (68,911)
S11 S1 or S2 or S3 or S4 or S5 or S6 or S7 or S8 or S9 or S10 (2074)
S10 TX diagnostic N3 filter? or random* N3 search* (61)
S9 TX systematic N3 filter? or random* N3 search* (62)
S8 TX random* N3 filter? or random* N3 search (50)
S7 TX economic N3 filter? or economic N3 search* (55)
S6 TX “clinical queries” (20)
S5 TX hedge* (423)
S4 TX quality N3 filter* (54)
S3 TX search N1 strateg* (1400)
S2 TX search N3 filter* (106)
S1 TX methodolog* N3 filter* (13)
Cochrane Methodology Register (The Cochrane Library) (Issue 4 2010)
URL: www.thecochranelibrary.com/
Date searched: 29 October 2010.
Search strategy#1 (methodolog* NEAR/3 filter*):ti,ab,kw (30)
#2 (search NEAR/3 filter*):ti,ab,kw (85)
#3 (search NEXT strateg*):ti,ab,kw (5136)
DOI: 10.3310/hta21690 HEALTH TECHNOLOGY ASSESSMENT 2017 VOL. 21 NO. 69
© Queen’s Printer and Controller of HMSO 2017. This work was produced by Lefebvre et al. under the terms of a commissioning contract issued by the Secretary of State forHealth. This issue may be freely reproduced for the purposes of private research and study and extracts (or indeed, the full report) may be included in professional journalsprovided that suitable acknowledgement is made and the reproduction is not associated with any form of advertising. Applications for commercial reproduction should beaddressed to: NIHR Journals Library, National Institute for Health Research, Evaluation, Trials and Studies Coordinating Centre, Alpha House, University of Southampton SciencePark, Southampton SO16 7NS, UK.
135
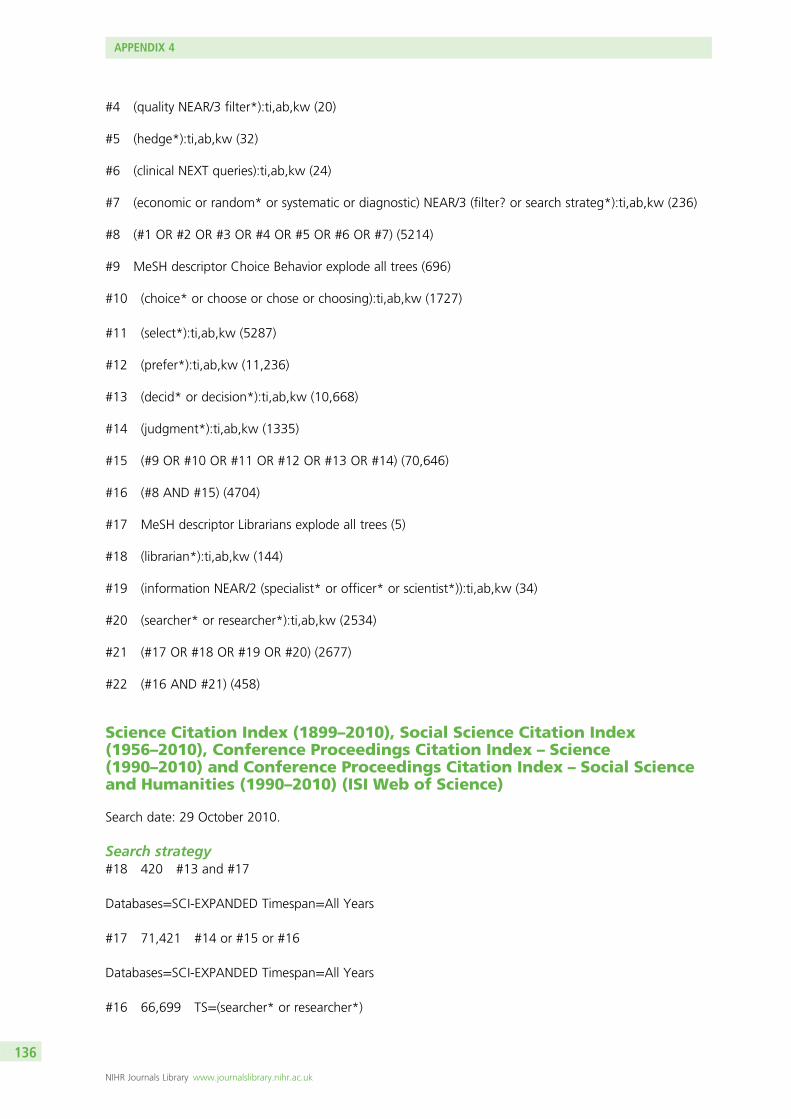
#4 (quality NEAR/3 filter*):ti,ab,kw (20)
#5 (hedge*):ti,ab,kw (32)
#6 (clinical NEXT queries):ti,ab,kw (24)
#7 (economic or random* or systematic or diagnostic) NEAR/3 (filter? or search strateg*):ti,ab,kw (236)
#8 (#1 OR #2 OR #3 OR #4 OR #5 OR #6 OR #7) (5214)
#9 MeSH descriptor Choice Behavior explode all trees (696)
#10 (choice* or choose or chose or choosing):ti,ab,kw (1727)
#11 (select*):ti,ab,kw (5287)
#12 (prefer*):ti,ab,kw (11,236)
#13 (decid* or decision*):ti,ab,kw (10,668)
#14 (judgment*):ti,ab,kw (1335)
#15 (#9 OR #10 OR #11 OR #12 OR #13 OR #14) (70,646)
#16 (#8 AND #15) (4704)
#17 MeSH descriptor Librarians explode all trees (5)
#18 (librarian*):ti,ab,kw (144)
#19 (information NEAR/2 (specialist* or officer* or scientist*)):ti,ab,kw (34)
#20 (searcher* or researcher*):ti,ab,kw (2534)
#21 (#17 OR #18 OR #19 OR #20) (2677)
#22 (#16 AND #21) (458)
Science Citation Index (1899–2010), Social Science Citation Index(1956–2010), Conference Proceedings Citation Index – Science(1990–2010) and Conference Proceedings Citation Index – Social Scienceand Humanities (1990–2010) (ISI Web of Science)
Search date: 29 October 2010.
Search strategy#18 420 #13 and #17
Databases=SCI-EXPANDED Timespan=All Years
#17 71,421 #14 or #15 or #16
Databases=SCI-EXPANDED Timespan=All Years
#16 66,699 TS=(searcher* or researcher*)
APPENDIX 4
NIHR Journals Library www.journalslibrary.nihr.ac.uk
136
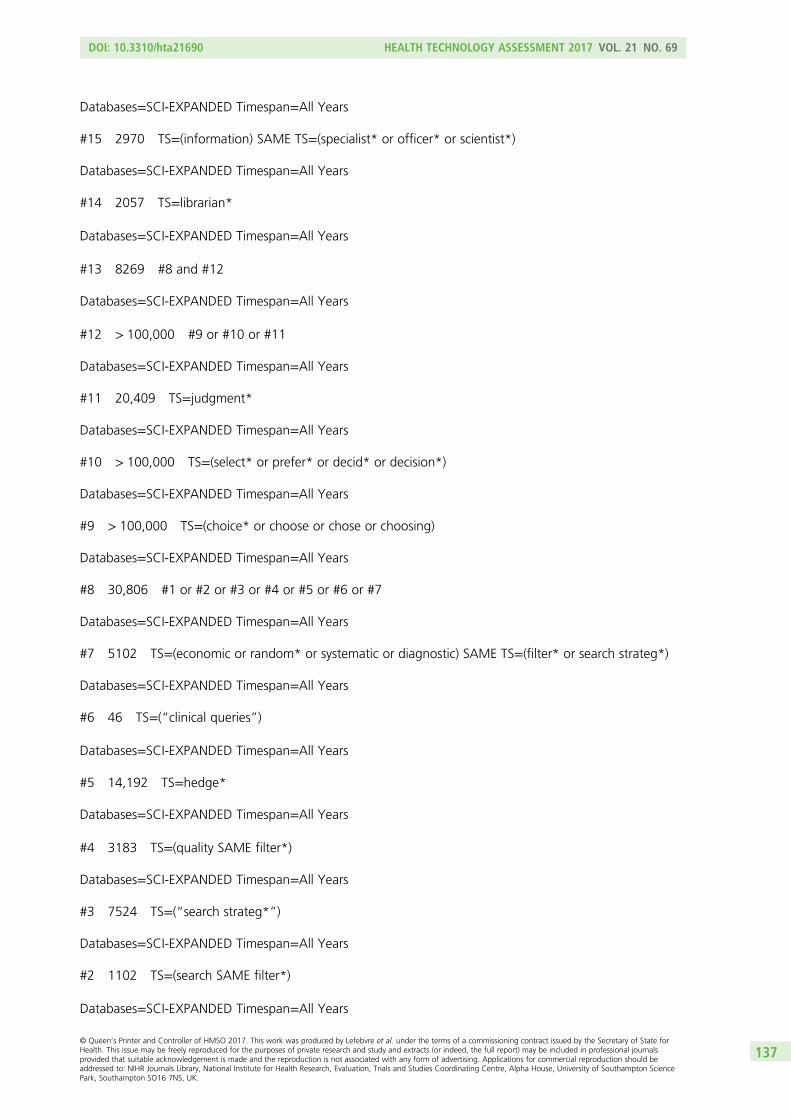
Databases=SCI-EXPANDED Timespan=All Years
#15 2970 TS=(information) SAME TS=(specialist* or officer* or scientist*)
Databases=SCI-EXPANDED Timespan=All Years
#14 2057 TS=librarian*
Databases=SCI-EXPANDED Timespan=All Years
#13 8269 #8 and #12
Databases=SCI-EXPANDED Timespan=All Years
#12 > 100,000 #9 or #10 or #11
Databases=SCI-EXPANDED Timespan=All Years
#11 20,409 TS=judgment*
Databases=SCI-EXPANDED Timespan=All Years
#10 > 100,000 TS=(select* or prefer* or decid* or decision*)
Databases=SCI-EXPANDED Timespan=All Years
#9 > 100,000 TS=(choice* or choose or chose or choosing)
Databases=SCI-EXPANDED Timespan=All Years
#8 30,806 #1 or #2 or #3 or #4 or #5 or #6 or #7
Databases=SCI-EXPANDED Timespan=All Years
#7 5102 TS=(economic or random* or systematic or diagnostic) SAME TS=(filter* or search strateg*)
Databases=SCI-EXPANDED Timespan=All Years
#6 46 TS=(“clinical queries”)
Databases=SCI-EXPANDED Timespan=All Years
#5 14,192 TS=hedge*
Databases=SCI-EXPANDED Timespan=All Years
#4 3183 TS=(quality SAME filter*)
Databases=SCI-EXPANDED Timespan=All Years
#3 7524 TS=(“search strateg*”)
Databases=SCI-EXPANDED Timespan=All Years
#2 1102 TS=(search SAME filter*)
Databases=SCI-EXPANDED Timespan=All Years
DOI: 10.3310/hta21690 HEALTH TECHNOLOGY ASSESSMENT 2017 VOL. 21 NO. 69
© Queen’s Printer and Controller of HMSO 2017. This work was produced by Lefebvre et al. under the terms of a commissioning contract issued by the Secretary of State forHealth. This issue may be freely reproduced for the purposes of private research and study and extracts (or indeed, the full report) may be included in professional journalsprovided that suitable acknowledgement is made and the reproduction is not associated with any form of advertising. Applications for commercial reproduction should beaddressed to: NIHR Journals Library, National Institute for Health Research, Evaluation, Trials and Studies Coordinating Centre, Alpha House, University of Southampton SciencePark, Southampton SO16 7NS, UK.
137
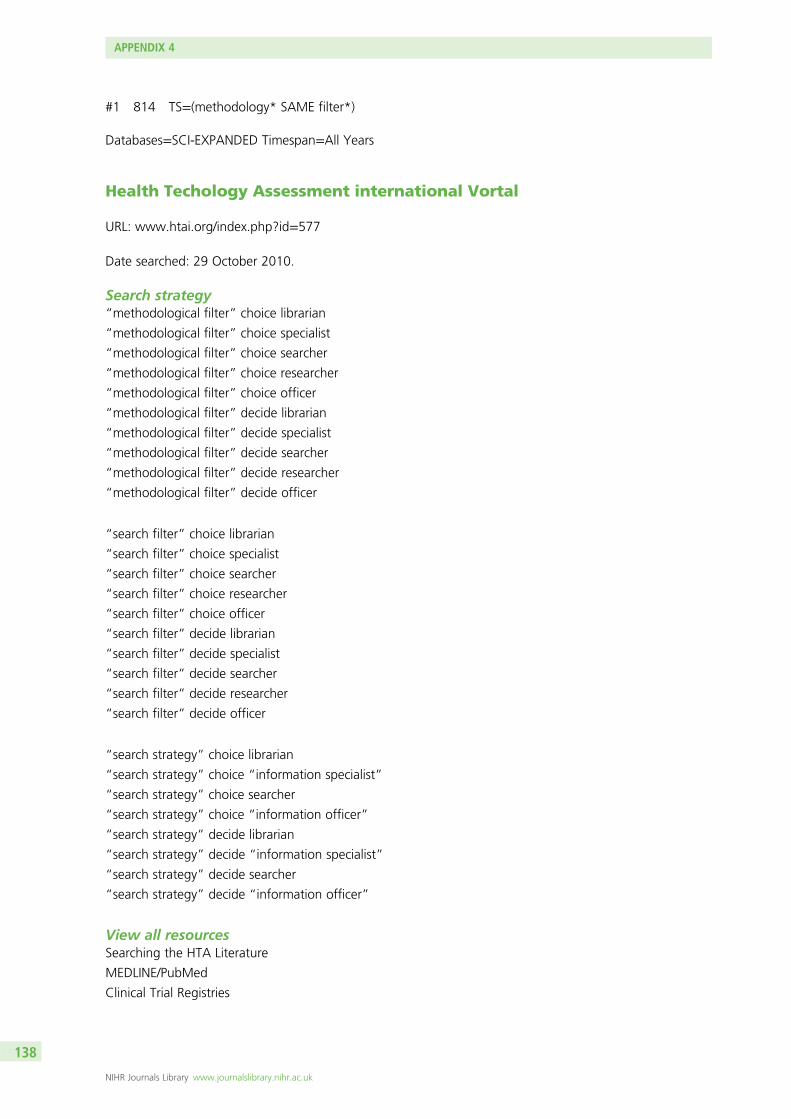
#1 814 TS=(methodology* SAME filter*)
Databases=SCI-EXPANDED Timespan=All Years
Health Techology Assessment international Vortal
URL: www.htai.org/index.php?id=577
Date searched: 29 October 2010.
Search strategy“methodological filter” choice librarian
“methodological filter” choice specialist
“methodological filter” choice searcher
“methodological filter” choice researcher
“methodological filter” choice officer
“methodological filter” decide librarian
“methodological filter” decide specialist
“methodological filter” decide searcher
“methodological filter” decide researcher
“methodological filter” decide officer
“search filter” choice librarian
“search filter” choice specialist
“search filter” choice searcher
“search filter” choice researcher
“search filter” choice officer
“search filter” decide librarian
“search filter” decide specialist
“search filter” decide searcher
“search filter” decide researcher
“search filter” decide officer
“search strategy” choice librarian
“search strategy” choice “information specialist”
“search strategy” choice searcher
“search strategy” choice “information officer”
“search strategy” decide librarian
“search strategy” decide “information specialist”
“search strategy” decide searcher
“search strategy” decide “information officer”
View all resourcesSearching the HTA Literature
MEDLINE/PubMed
Clinical Trial Registries
APPENDIX 4
NIHR Journals Library www.journalslibrary.nihr.ac.uk
138

Evaluated Sources
Grey Literature
Information on Literature Searching
Searching on the Web
Clinical Practice Guidelines
Reference toolsKeeping Up: stuff for Librarians and Information Specialists
European network for Health Technology Assessment
URL: www.eunethta.net/
Date searched: 1 November 2010.
General search+search +filter
+methodological +filter
+search +strategy
+search +strategies
ToolsEUnetHTA Planned and Ongoing Projects (POP) Database
EUnetHTA Database on additional evidence
EUnetHTA News Aggregator
HTA Core Model
All resources require username and password to access – EUnetHTA membership (partners and associates)
Health technology assessment organisation websites
Date searched: 1–3 November 2010.
l Agencia de Evaluación de Tecnologías Sanitarias (AETS) (www.isciii.es/htdocs/en/investigacion/Agencia_quees.jsp).
l AHRQ (www.ahrq.gov/).l Basque Office for Health Technology Assessment (OSTEBA) (www.osanet.euskadi.net/osteba/es).l CADTH (www.cadth.ca/index.php/en/home).l CRD (www.york.ac.uk/inst/crd/).l Comité d’Evaluation et de Diffusion des Innovations Technologiques (CEDIT) (http://cedit.aphp.fr/).l German Agency for HTA at the German Institute for Medical Documentation and Information
(DAHTA@DIMDI) (www.dimdi.de).l Institute for Quality and Efficiency in Health Care (IQWiG) (www.iqwig.de/).l International Network of Agencies for Health Technology Assessment (INAHTA) (www.inahta.org/).l Swedish Council on Health Technology Assessment (SBU) (www.sbu.se/en/).
Health Libraries Group
URL: www.cilip.org.uk/get-involved/special-interest-groups/health/Pages/default.aspx
Date searched: 1 November 2010.
DOI: 10.3310/hta21690 HEALTH TECHNOLOGY ASSESSMENT 2017 VOL. 21 NO. 69
© Queen’s Printer and Controller of HMSO 2017. This work was produced by Lefebvre et al. under the terms of a commissioning contract issued by the Secretary of State forHealth. This issue may be freely reproduced for the purposes of private research and study and extracts (or indeed, the full report) may be included in professional journalsprovided that suitable acknowledgement is made and the reproduction is not associated with any form of advertising. Applications for commercial reproduction should beaddressed to: NIHR Journals Library, National Institute for Health Research, Evaluation, Trials and Studies Coordinating Centre, Alpha House, University of Southampton SciencePark, Southampton SO16 7NS, UK.
139

Search this group“search filter”
“methodological filter”
“search strategy”
“search strategies”
hedges
Search the IFM Healthcare website (www.ifmh.org.uk/)“search filter”
“methodological filter”
“search strategy”
“search strategies”
hedges
European Association for Health Information and Libraries
URL: www.eahil.net/
Date searched: 1 November 2010.
Search“search filter”
“methodological filter”
“search strategy”
“search strategies”
Hedges
US Medical Library Association
URL: www.mlanet.org/
Date searched: 1 November 2010.
Search“search filter”
“methodological filter”
“search strategy”
“search strategies”
Hedges
APPENDIX 4
NIHR Journals Library www.journalslibrary.nihr.ac.uk
140
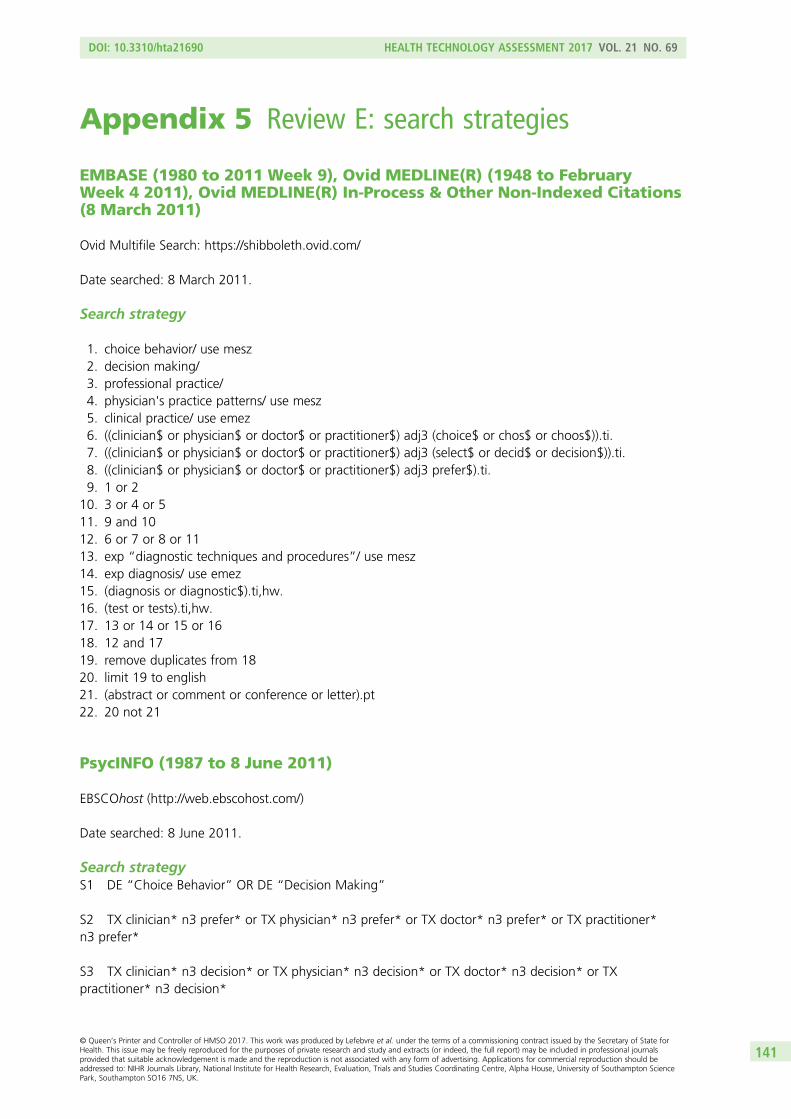
Appendix 5 Review E: search strategies
EMBASE (1980 to 2011 Week 9), Ovid MEDLINE(R) (1948 to FebruaryWeek 4 2011), Ovid MEDLINE(R) In-Process & Other Non-Indexed Citations(8 March 2011)
Ovid Multifile Search: https://shibboleth.ovid.com/
Date searched: 8 March 2011.
Search strategy
1. choice behavior/ use mesz2. decision making/3. professional practice/4. physician's practice patterns/ use mesz5. clinical practice/ use emez6. ((clinician$ or physician$ or doctor$ or practitioner$) adj3 (choice$ or chos$ or choos$)).ti.7. ((clinician$ or physician$ or doctor$ or practitioner$) adj3 (select$ or decid$ or decision$)).ti.8. ((clinician$ or physician$ or doctor$ or practitioner$) adj3 prefer$).ti.9. 1 or 2
10. 3 or 4 or 511. 9 and 1012. 6 or 7 or 8 or 1113. exp “diagnostic techniques and procedures”/ use mesz14. exp diagnosis/ use emez15. (diagnosis or diagnostic$).ti,hw.16. (test or tests).ti,hw.17. 13 or 14 or 15 or 1618. 12 and 1719. remove duplicates from 1820. limit 19 to english21. (abstract or comment or conference or letter).pt22. 20 not 21
PsycINFO (1987 to 8 June 2011)
EBSCOhost (http://web.ebscohost.com/)
Date searched: 8 June 2011.
Search strategyS1 DE “Choice Behavior” OR DE “Decision Making”
S2 TX clinician* n3 prefer* or TX physician* n3 prefer* or TX doctor* n3 prefer* or TX practitioner*n3 prefer*
S3 TX clinician* n3 decision* or TX physician* n3 decision* or TX doctor* n3 decision* or TXpractitioner* n3 decision*
DOI: 10.3310/hta21690 HEALTH TECHNOLOGY ASSESSMENT 2017 VOL. 21 NO. 69
© Queen’s Printer and Controller of HMSO 2017. This work was produced by Lefebvre et al. under the terms of a commissioning contract issued by the Secretary of State forHealth. This issue may be freely reproduced for the purposes of private research and study and extracts (or indeed, the full report) may be included in professional journalsprovided that suitable acknowledgement is made and the reproduction is not associated with any form of advertising. Applications for commercial reproduction should beaddressed to: NIHR Journals Library, National Institute for Health Research, Evaluation, Trials and Studies Coordinating Centre, Alpha House, University of Southampton SciencePark, Southampton SO16 7NS, UK.
141
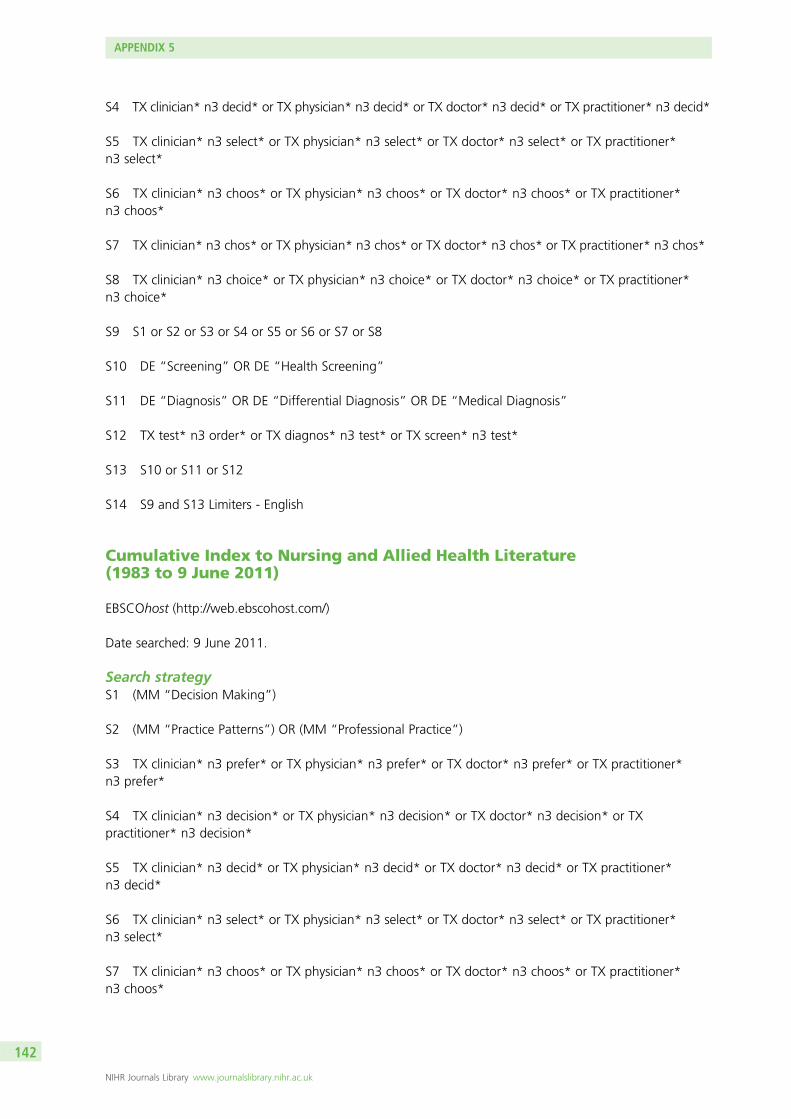
S4 TX clinician* n3 decid* or TX physician* n3 decid* or TX doctor* n3 decid* or TX practitioner* n3 decid*
S5 TX clinician* n3 select* or TX physician* n3 select* or TX doctor* n3 select* or TX practitioner*n3 select*
S6 TX clinician* n3 choos* or TX physician* n3 choos* or TX doctor* n3 choos* or TX practitioner*n3 choos*
S7 TX clinician* n3 chos* or TX physician* n3 chos* or TX doctor* n3 chos* or TX practitioner* n3 chos*
S8 TX clinician* n3 choice* or TX physician* n3 choice* or TX doctor* n3 choice* or TX practitioner*n3 choice*
S9 S1 or S2 or S3 or S4 or S5 or S6 or S7 or S8
S10 DE “Screening” OR DE “Health Screening”
S11 DE “Diagnosis” OR DE “Differential Diagnosis” OR DE “Medical Diagnosis”
S12 TX test* n3 order* or TX diagnos* n3 test* or TX screen* n3 test*
S13 S10 or S11 or S12
S14 S9 and S13 Limiters - English
Cumulative Index to Nursing and Allied Health Literature(1983 to 9 June 2011)
EBSCOhost (http://web.ebscohost.com/)
Date searched: 9 June 2011.
Search strategyS1 (MM “Decision Making”)
S2 (MM “Practice Patterns”) OR (MM “Professional Practice”)
S3 TX clinician* n3 prefer* or TX physician* n3 prefer* or TX doctor* n3 prefer* or TX practitioner*n3 prefer*
S4 TX clinician* n3 decision* or TX physician* n3 decision* or TX doctor* n3 decision* or TXpractitioner* n3 decision*
S5 TX clinician* n3 decid* or TX physician* n3 decid* or TX doctor* n3 decid* or TX practitioner*n3 decid*
S6 TX clinician* n3 select* or TX physician* n3 select* or TX doctor* n3 select* or TX practitioner*n3 select*
S7 TX clinician* n3 choos* or TX physician* n3 choos* or TX doctor* n3 choos* or TX practitioner*n3 choos*
APPENDIX 5
NIHR Journals Library www.journalslibrary.nihr.ac.uk
142
S8 TX clinician* n3 chos* or TX physician* n3 chos* or TX doctor* n3 chos* or TX practitioner* n3 chos*
S9 TX clinician* n3 choice* or TX physician* n3 choice* or TX doctor* n3 choice* or TX practitioner* n3choice* Search modes - Boolean/Phrase
S10 S1 or S2 or S3 or S4 or S5 or S6 or S7 or S8 or S9
S11 TX test* n3 order* or TX diagnos* n3 test* or TX screen* n3 test* -
S12 MW diagnosis
S13 (MH “Diagnosis”)
S14 (MH “Health Screening+”)
S15 S11 or S12 or S13 or S14
S16 S10 and S15 Limiters - English Language
Applied Social Sciences Index and Abstracts (1987 to 13 June 2011)
CSA Illumina (www.csa.com/)
Date searched: 13 June 2011.
Search strategySearch Query #29 (((DE = choice) or(DE = clinical decision making) or(DE = clinical practice) or(TI = ((clinician* or physician* or doctor* or practitioner*) within 3 (choice* or chos* or choos*))) or(AB = ((clinician* or physician* or doctor* or practitioner*) within 3 (choice* or chos* or choos*)))or(TI = ((clinician* or physician* or doctor* or practitioner*) within 3 (select* or decid* or decision*))) or(AB = ((clinician* or physician* or doctor* or practitioner*) within 3 (select* or decid* or decision*)))or(TI = ((clinician* or physician* or doctor* or practitioner*) within 3 (prefer*))) or(AB = ((clinician* orphysician* or doctor* or practitioner*) within 3 (prefer*)))) and((DE = diagnostic testing) or(TI = (diagnosisor diagnostic* or test or tests)))) or(TI = (test* within 3 order* within 3 (choice* or chos* or choos*))) or(AB = (test* within 3 order* within 3 (choice* or chos* or choos*))) or(AB = (test* within 3 order*) AND(choice* or chos* or choice*)) or(TI = (test* within 3 order*) AND (choice* or chos* or choice*)) or(TI =(diagnos* within 3 test*) AND (choice* or chos* or choice*)) or(AB = (diagnos* within 3 test*) AND(choice* or chos* or choice*)) or(AB = (diagnos* within 3 test*) AND (select* or decid* or decision*)) or(TI = (diagnos* within 3 test*) AND (select* or decid* or decision*)) or(TI = (test* within 3 order*) AND(select* or decid* or decision*)) or(AB = (test* within 3 order*) AND (select* or decid* or decision*)) or(AB = (test* within 3 order*) AND (prefer*)) or(TI = (test* within 3 order*) AND (prefer*)) or(TI =(diagnos* within 3 test*) AND (prefer*)) or(AB = (diagnos* within 3 test*) AND (prefer*))
National screening programmes (accessed July 2011)
l Australian Population Health Development Screening Subcommittee (www.health.gov.au/internet/screening/publishing.nsf/Content/home).
l UK National Screening Committee (www.screening.nhs.uk/).l US Preventive Services Task Force (www.ahrq.gov/clinic/uspstfix.htm).l World Health Organization (www.who.int/).
DOI: 10.3310/hta21690 HEALTH TECHNOLOGY ASSESSMENT 2017 VOL. 21 NO. 69
© Queen’s Printer and Controller of HMSO 2017. This work was produced by Lefebvre et al. under the terms of a commissioning contract issued by the Secretary of State forHealth. This issue may be freely reproduced for the purposes of private research and study and extracts (or indeed, the full report) may be included in professional journalsprovided that suitable acknowledgement is made and the reproduction is not associated with any form of advertising. Applications for commercial reproduction should beaddressed to: NIHR Journals Library, National Institute for Health Research, Evaluation, Trials and Studies Coordinating Centre, Alpha House, University of Southampton SciencePark, Southampton SO16 7NS, UK.
143

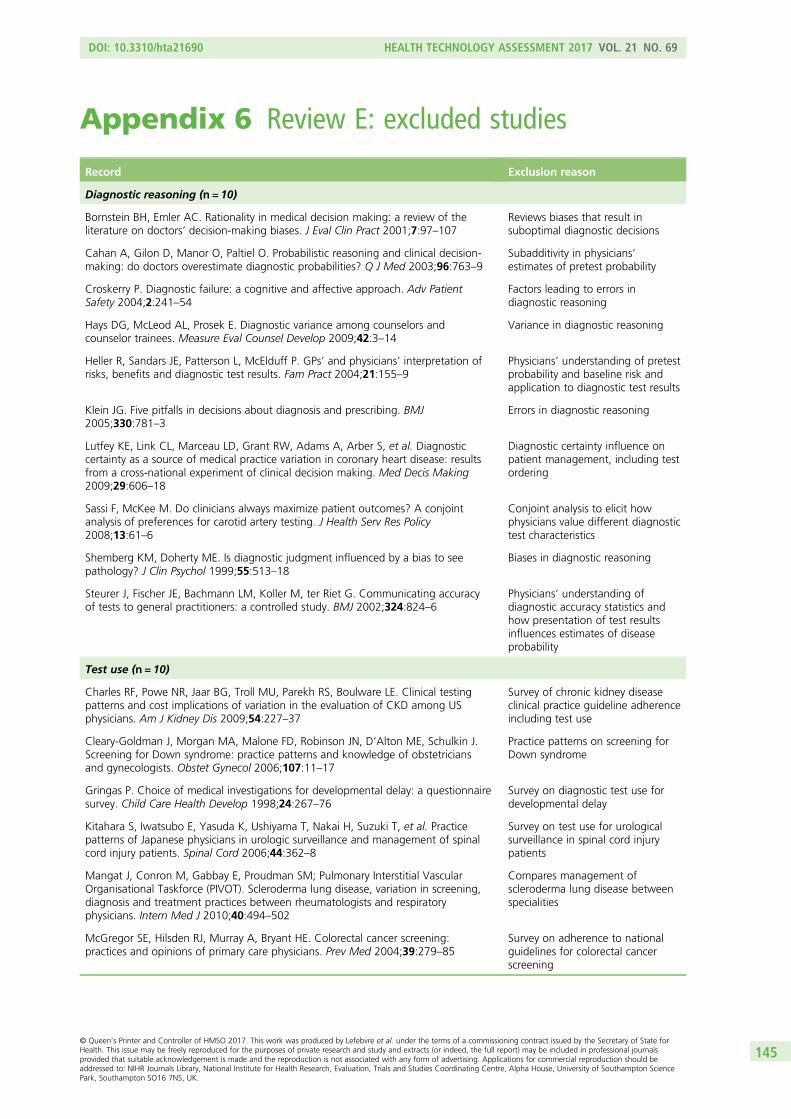
Appendix 6 Review E: excluded studies
Record Exclusion reason
Diagnostic reasoning (n = 10)
Bornstein BH, Emler AC. Rationality in medical decision making: a review of theliterature on doctors’ decision-making biases. J Eval Clin Pract 2001;7:97–107
Reviews biases that result insuboptimal diagnostic decisions
Cahan A, Gilon D, Manor O, Paltiel O. Probabilistic reasoning and clinical decision-making: do doctors overestimate diagnostic probabilities? Q J Med 2003;96:763–9
Subadditivity in physicians’estimates of pretest probability
Croskerry P. Diagnostic failure: a cognitive and affective approach. Adv PatientSafety 2004;2:241–54
Factors leading to errors indiagnostic reasoning
Hays DG, McLeod AL, Prosek E. Diagnostic variance among counselors andcounselor trainees. Measure Eval Counsel Develop 2009;42:3–14
Variance in diagnostic reasoning
Heller R, Sandars JE, Patterson L, McElduff P. GPs’ and physicians’ interpretation ofrisks, benefits and diagnostic test results. Fam Pract 2004;21:155–9
Physicians’ understanding of pretestprobability and baseline risk andapplication to diagnostic test results
Klein JG. Five pitfalls in decisions about diagnosis and prescribing. BMJ2005;330:781–3
Errors in diagnostic reasoning
Lutfey KE, Link CL, Marceau LD, Grant RW, Adams A, Arber S, et al. Diagnosticcertainty as a source of medical practice variation in coronary heart disease: resultsfrom a cross-national experiment of clinical decision making. Med Decis Making2009;29:606–18
Diagnostic certainty influence onpatient management, including testordering
Sassi F, McKee M. Do clinicians always maximize patient outcomes? A conjointanalysis of preferences for carotid artery testing. J Health Serv Res Policy2008;13:61–6
Conjoint analysis to elicit howphysicians value different diagnostictest characteristics
Shemberg KM, Doherty ME. Is diagnostic judgment influenced by a bias to seepathology? J Clin Psychol 1999;55:513–18
Biases in diagnostic reasoning
Steurer J, Fischer JE, Bachmann LM, Koller M, ter Riet G. Communicating accuracyof tests to general practitioners: a controlled study. BMJ 2002;324:824–6
Physicians’ understanding ofdiagnostic accuracy statistics andhow presentation of test resultsinfluences estimates of diseaseprobability
Test use (n = 10)
Charles RF, Powe NR, Jaar BG, Troll MU, Parekh RS, Boulware LE. Clinical testingpatterns and cost implications of variation in the evaluation of CKD among USphysicians. Am J Kidney Dis 2009;54:227–37
Survey of chronic kidney diseaseclinical practice guideline adherenceincluding test use
Cleary-Goldman J, Morgan MA, Malone FD, Robinson JN, D’Alton ME, Schulkin J.Screening for Down syndrome: practice patterns and knowledge of obstetriciansand gynecologists. Obstet Gynecol 2006;107:11–17
Practice patterns on screening forDown syndrome
Gringas P. Choice of medical investigations for developmental delay: a questionnairesurvey. Child Care Health Develop 1998;24:267–76
Survey on diagnostic test use fordevelopmental delay
Kitahara S, Iwatsubo E, Yasuda K, Ushiyama T, Nakai H, Suzuki T, et al. Practicepatterns of Japanese physicians in urologic surveillance and management of spinalcord injury patients. Spinal Cord 2006;44:362–8
Survey on test use for urologicalsurveillance in spinal cord injurypatients
Mangat J, Conron M, Gabbay E, Proudman SM; Pulmonary Interstitial VascularOrganisational Taskforce (PIVOT). Scleroderma lung disease, variation in screening,diagnosis and treatment practices between rheumatologists and respiratoryphysicians. Intern Med J 2010;40:494–502
Compares management ofscleroderma lung disease betweenspecialities
McGregor SE, Hilsden RJ, Murray A, Bryant HE. Colorectal cancer screening:practices and opinions of primary care physicians. Prev Med 2004;39:279–85
Survey on adherence to nationalguidelines for colorectal cancerscreening
DOI: 10.3310/hta21690 HEALTH TECHNOLOGY ASSESSMENT 2017 VOL. 21 NO. 69
© Queen’s Printer and Controller of HMSO 2017. This work was produced by Lefebvre et al. under the terms of a commissioning contract issued by the Secretary of State forHealth. This issue may be freely reproduced for the purposes of private research and study and extracts (or indeed, the full report) may be included in professional journalsprovided that suitable acknowledgement is made and the reproduction is not associated with any form of advertising. Applications for commercial reproduction should beaddressed to: NIHR Journals Library, National Institute for Health Research, Evaluation, Trials and Studies Coordinating Centre, Alpha House, University of Southampton SciencePark, Southampton SO16 7NS, UK.
145
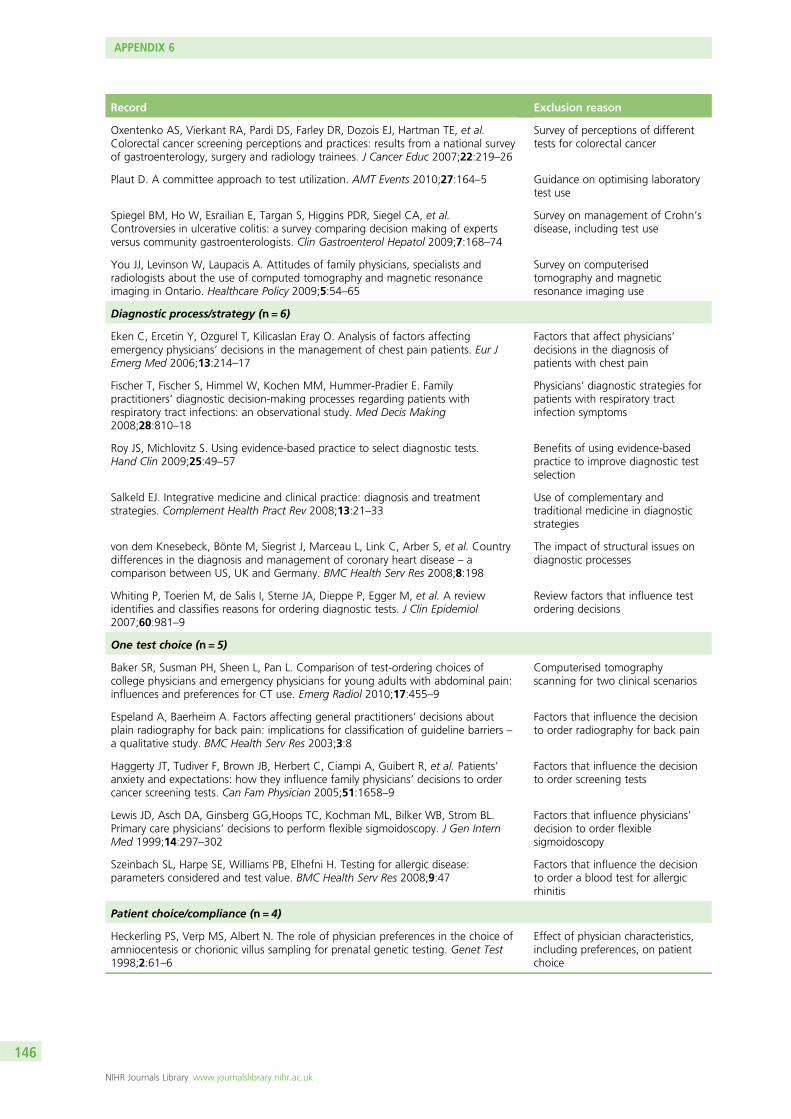
Record Exclusion reason
Oxentenko AS, Vierkant RA, Pardi DS, Farley DR, Dozois EJ, Hartman TE, et al.Colorectal cancer screening perceptions and practices: results from a national surveyof gastroenterology, surgery and radiology trainees. J Cancer Educ 2007;22:219–26
Survey of perceptions of differenttests for colorectal cancer
Plaut D. A committee approach to test utilization. AMT Events 2010;27:164–5 Guidance on optimising laboratorytest use
Spiegel BM, Ho W, Esrailian E, Targan S, Higgins PDR, Siegel CA, et al.Controversies in ulcerative colitis: a survey comparing decision making of expertsversus community gastroenterologists. Clin Gastroenterol Hepatol 2009;7:168–74
Survey on management of Crohn’sdisease, including test use
You JJ, Levinson W, Laupacis A. Attitudes of family physicians, specialists andradiologists about the use of computed tomography and magnetic resonanceimaging in Ontario. Healthcare Policy 2009;5:54–65
Survey on computerisedtomography and magneticresonance imaging use
Diagnostic process/strategy (n = 6)
Eken C, Ercetin Y, Ozgurel T, Kilicaslan Eray O. Analysis of factors affectingemergency physicians’ decisions in the management of chest pain patients. Eur JEmerg Med 2006;13:214–17
Factors that affect physicians’decisions in the diagnosis ofpatients with chest pain
Fischer T, Fischer S, Himmel W, Kochen MM, Hummer-Pradier E. Familypractitioners’ diagnostic decision-making processes regarding patients withrespiratory tract infections: an observational study. Med Decis Making2008;28:810–18
Physicians’ diagnostic strategies forpatients with respiratory tractinfection symptoms
Roy JS, Michlovitz S. Using evidence-based practice to select diagnostic tests.Hand Clin 2009;25:49–57
Benefits of using evidence-basedpractice to improve diagnostic testselection
Salkeld EJ. Integrative medicine and clinical practice: diagnosis and treatmentstrategies. Complement Health Pract Rev 2008;13:21–33
Use of complementary andtraditional medicine in diagnosticstrategies
von dem Knesebeck, Bönte M, Siegrist J, Marceau L, Link C, Arber S, et al. Countrydifferences in the diagnosis and management of coronary heart disease – acomparison between US, UK and Germany. BMC Health Serv Res 2008;8:198
The impact of structural issues ondiagnostic processes
Whiting P, Toerien M, de Salis I, Sterne JA, Dieppe P, Egger M, et al. A reviewidentifies and classifies reasons for ordering diagnostic tests. J Clin Epidemiol2007;60:981–9
Review factors that influence testordering decisions
One test choice (n = 5)
Baker SR, Susman PH, Sheen L, Pan L. Comparison of test-ordering choices ofcollege physicians and emergency physicians for young adults with abdominal pain:influences and preferences for CT use. Emerg Radiol 2010;17:455–9
Computerised tomographyscanning for two clinical scenarios
Espeland A, Baerheim A. Factors affecting general practitioners’ decisions aboutplain radiography for back pain: implications for classification of guideline barriers –a qualitative study. BMC Health Serv Res 2003;3:8
Factors that influence the decisionto order radiography for back pain
Haggerty JT, Tudiver F, Brown JB, Herbert C, Ciampi A, Guibert R, et al. Patients’anxiety and expectations: how they influence family physicians’ decisions to ordercancer screening tests. Can Fam Physician 2005;51:1658–9
Factors that influence the decisionto order screening tests
Lewis JD, Asch DA, Ginsberg GG,Hoops TC, Kochman ML, Bilker WB, Strom BL.Primary care physicians’ decisions to perform flexible sigmoidoscopy. J Gen InternMed 1999;14:297–302
Factors that influence physicians’decision to order flexiblesigmoidoscopy
Szeinbach SL, Harpe SE, Williams PB, Elhefni H. Testing for allergic disease:parameters considered and test value. BMC Health Serv Res 2008;9:47
Factors that influence the decisionto order a blood test for allergicrhinitis
Patient choice/compliance (n = 4)
Heckerling PS, Verp MS, Albert N. The role of physician preferences in the choice ofamniocentesis or chorionic villus sampling for prenatal genetic testing. Genet Test1998;2:61–6
Effect of physician characteristics,including preferences, on patientchoice
APPENDIX 6
NIHR Journals Library www.journalslibrary.nihr.ac.uk
146
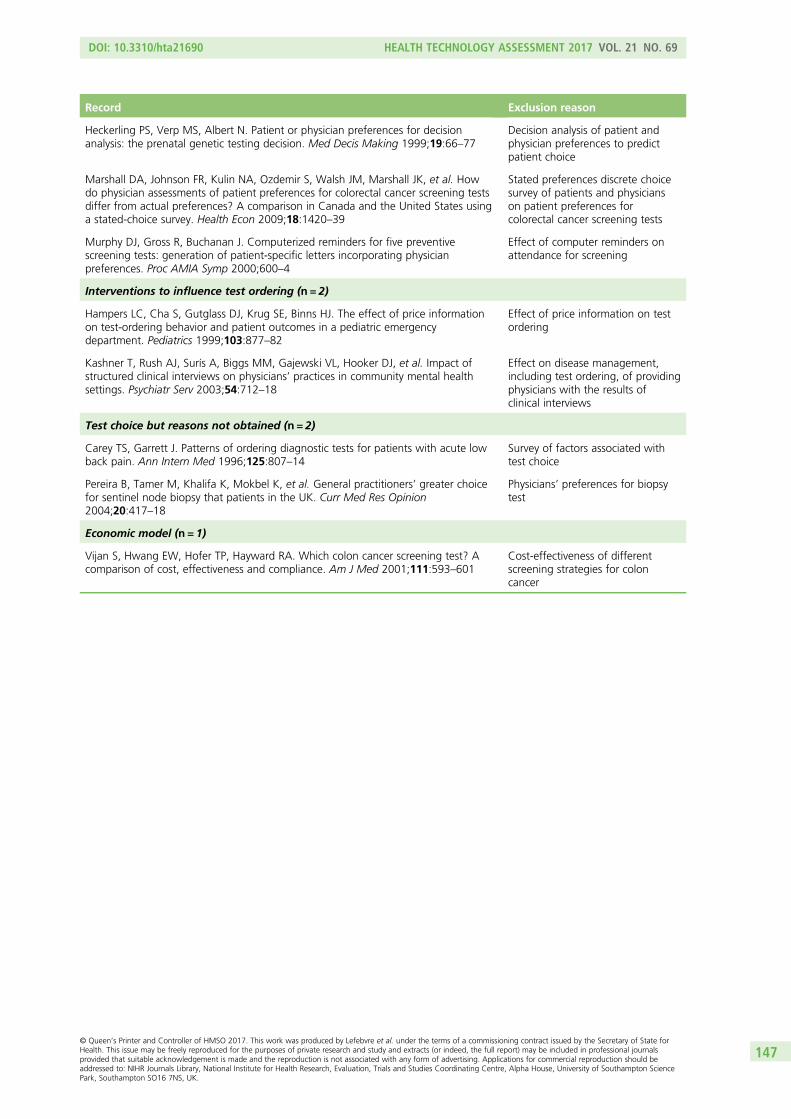
Record Exclusion reason
Heckerling PS, Verp MS, Albert N. Patient or physician preferences for decisionanalysis: the prenatal genetic testing decision. Med Decis Making 1999;19:66–77
Decision analysis of patient andphysician preferences to predictpatient choice
Marshall DA, Johnson FR, Kulin NA, Ozdemir S, Walsh JM, Marshall JK, et al. Howdo physician assessments of patient preferences for colorectal cancer screening testsdiffer from actual preferences? A comparison in Canada and the United States usinga stated-choice survey. Health Econ 2009;18:1420–39
Stated preferences discrete choicesurvey of patients and physicianson patient preferences forcolorectal cancer screening tests
Murphy DJ, Gross R, Buchanan J. Computerized reminders for five preventivescreening tests: generation of patient-specific letters incorporating physicianpreferences. Proc AMIA Symp 2000;600–4
Effect of computer reminders onattendance for screening
Interventions to influence test ordering (n = 2)
Hampers LC, Cha S, Gutglass DJ, Krug SE, Binns HJ. The effect of price informationon test-ordering behavior and patient outcomes in a pediatric emergencydepartment. Pediatrics 1999;103:877–82
Effect of price information on testordering
Kashner T, Rush AJ, Surís A, Biggs MM, Gajewski VL, Hooker DJ, et al. Impact ofstructured clinical interviews on physicians’ practices in community mental healthsettings. Psychiatr Serv 2003;54:712–18
Effect on disease management,including test ordering, of providingphysicians with the results ofclinical interviews
Test choice but reasons not obtained (n = 2)
Carey TS, Garrett J. Patterns of ordering diagnostic tests for patients with acute lowback pain. Ann Intern Med 1996;125:807–14
Survey of factors associated withtest choice
Pereira B, Tamer M, Khalifa K, Mokbel K, et al. General practitioners’ greater choicefor sentinel node biopsy that patients in the UK. Curr Med Res Opinion2004;20:417–18
Physicians’ preferences for biopsytest
Economic model (n = 1)
Vijan S, Hwang EW, Hofer TP, Hayward RA. Which colon cancer screening test? Acomparison of cost, effectiveness and compliance. Am J Med 2001;111:593–601
Cost-effectiveness of differentscreening strategies for coloncancer
DOI: 10.3310/hta21690 HEALTH TECHNOLOGY ASSESSMENT 2017 VOL. 21 NO. 69
© Queen’s Printer and Controller of HMSO 2017. This work was produced by Lefebvre et al. under the terms of a commissioning contract issued by the Secretary of State forHealth. This issue may be freely reproduced for the purposes of private research and study and extracts (or indeed, the full report) may be included in professional journalsprovided that suitable acknowledgement is made and the reproduction is not associated with any form of advertising. Applications for commercial reproduction should beaddressed to: NIHR Journals Library, National Institute for Health Research, Evaluation, Trials and Studies Coordinating Centre, Alpha House, University of Southampton SciencePark, Southampton SO16 7NS, UK.
147


Part of the NIHR Journals Library www.journalslibrary.nihr.ac.uk
Published by the NIHR Journals Library
This report presents independent research funded by the National Institute for Health Research (NIHR). The views expressed are those of the author(s) and not necessarily those of the NHS, the NIHR or the Department of Health
EMEHS&DRHTAPGfARPHR
Related Documents