Int. J. Environ. Res. Public Health 2013, 10, 5830-5843; doi:10.3390/ijerph10115830 International Journal of Environmental Research and Public Health ISSN 1660-4601 www.mdpi.com/journal/ijerph Article Assessing the Mobility of Lead, Copper and Cadmium in a Calcareous Soil of Port-au-Prince, Haiti † Urbain Fifi 1, *, Thierry Winiarski 2 and Evens Emmanuel 1 1 Université Quisqueya—LAQUE, 218, Avenue Jean Paul II, Haut de Turgeau, P.O. Box 796, Port-au-Prince, HT 6113, Haiti; E-Mail: [email protected] 2 Université de Lyon—LEHNA, UMR 5023, ENTPE, Rue Maurice Audin, Vaulx-en-Velin CEDEX FR 69518, France; E-Mail: [email protected] † Based on Fifi, U.; Winiarski, T.; Emmanuel, E. Groundwater Vulnerability towards Pollutants from Urban Stormwater in Developing Countries—Study of Heavy Metals Adsorption on a Representative Soil of Port-au-Prince, Haiti. In Proceedings of Novatech 2010, Lyon, France, 27 June–1 July 2010 (in French). * Author to whom correspondence should be addressed; E-Mail: [email protected]; Tel.: 50-9-3652-2993/50-9-2940-4587. Received: 12 August 2013; in revised form: 28 October 2013 / Accepted: 28 October 2013 / Published: 4 November 2013 Abstract: The presence of heavy metals in the environment constitutes a potential source of both soil and groundwater pollution. This study has focused on the reactivity of lead (Pb), copper (Cu) and Cadmium (Cd) during their transfer in a calcareous soil of Port-au-Prince (Haiti). Kinetic, monometal and competitive batch tests were carried out at pH 6.0. Two simplified models including pseudo-first-order and pseudo-second-order were used to fit the experimental data from kinetics adsorption batch tests. A good fit of these data was found with pseudo-second-order kinetic model which indicates the applicability of this model to describe the adsorption rates of these metals on the soil. Monometal batch tests indicated that both Langmuir and Freundlich models allowed a good fit for experimental data. On the basis of the maximum adsorption capacity (q max ), the order affinity of Pb, Cu and Cd for the studied soil was Pb 2+ > Cu 2+ > Cd 2+ . Competitive sorption has proved that the competition between two or several cations on soils for the same active sites can decrease their q max . These results show that, at high metal concentrations, Cd may pose more threat in soils and groundwater of Port-au-Prince than Pb and Cu. OPEN ACCESS

Welcome message from author
This document is posted to help you gain knowledge. Please leave a comment to let me know what you think about it! Share it to your friends and learn new things together.
Transcript
Int. J. Environ. Res. Public Health 2013, 10, 5830-5843; doi:10.3390/ijerph10115830
International Journal of
Environmental Research and Public Health
ISSN 1660-4601 www.mdpi.com/journal/ijerph
Article
Assessing the Mobility of Lead, Copper and Cadmium in a Calcareous Soil of Port-au-Prince, Haiti †
Urbain Fifi 1,*, Thierry Winiarski 2 and Evens Emmanuel 1
1 Université Quisqueya—LAQUE, 218, Avenue Jean Paul II, Haut de Turgeau, P.O. Box 796,
Port-au-Prince, HT 6113, Haiti; E-Mail: [email protected] 2 Université de Lyon—LEHNA, UMR 5023, ENTPE, Rue Maurice Audin, Vaulx-en-Velin CEDEX
FR 69518, France; E-Mail: [email protected]
† Based on Fifi, U.; Winiarski, T.; Emmanuel, E. Groundwater Vulnerability towards Pollutants from
Urban Stormwater in Developing Countries—Study of Heavy Metals Adsorption on a Representative
Soil of Port-au-Prince, Haiti. In Proceedings of Novatech 2010, Lyon, France, 27 June–1 July 2010
(in French).
* Author to whom correspondence should be addressed; E-Mail: [email protected];
Tel.: 50-9-3652-2993/50-9-2940-4587.
Received: 12 August 2013; in revised form: 28 October 2013 / Accepted: 28 October 2013 /
Published: 4 November 2013
Abstract: The presence of heavy metals in the environment constitutes a potential source of
both soil and groundwater pollution. This study has focused on the reactivity of lead (Pb),
copper (Cu) and Cadmium (Cd) during their transfer in a calcareous soil of Port-au-Prince
(Haiti). Kinetic, monometal and competitive batch tests were carried out at pH 6.0. Two
simplified models including pseudo-first-order and pseudo-second-order were used to fit the
experimental data from kinetics adsorption batch tests. A good fit of these data was found
with pseudo-second-order kinetic model which indicates the applicability of this model to
describe the adsorption rates of these metals on the soil. Monometal batch tests indicated that
both Langmuir and Freundlich models allowed a good fit for experimental data. On the basis
of the maximum adsorption capacity (qmax), the order affinity of Pb, Cu and Cd for the
studied soil was Pb2+ > Cu2+ > Cd2+. Competitive sorption has proved that the competition
between two or several cations on soils for the same active sites can decrease their qmax.
These results show that, at high metal concentrations, Cd may pose more threat in soils and
groundwater of Port-au-Prince than Pb and Cu.
OPEN ACCESS
Int. J. Environ. Res. Public Health 2013, 10 5831
Keywords: lead; copper; cadmium; models; soils; sorption
1. Introduction
Heavy metals ions in soils have been a very useful indicator of environmental quality worldwide.
Heavy metal ions are the most toxic inorganic pollutants which occur in soils and can be of natural or of
anthropogenic origin [1–3]. Lead, copper, and cadmium belong to the group of serious hazardous heavy
metals and are generally considered a threat to human health and ecosystems because of their potentially
high toxicity [4]. Their mobility in soils may be controlled by different chemical mechanisms such as
surface complex formation, ionic exchange, precipitation, and adsorption processes. However, the most
important chemical process that affects heavy metal availability is adsorption onto soil solid phases [5].
Their solubility and bioavailability may also be controlled by soils characteristics [6], such as pH, redox
potential, clay minerals, soil organic matter, Fe and Mn oxides, and calcium carbonate. Therefore,
metals adsorption and hence availability does not only depend on soil constituents (inorganic and
organic), but also on the available metals, and their competition for soil sorption sites [5].
Many authors have investigated metals adsorption on different soils materials and under different
experimental conditions [6–16]. Most trace element adsorption has been derived from studies conducted
using single metal solutions [15,17]. Usually, single metal solutions have limited practical applications [18].
However, multi-metal solutions are extremely important for a better understanding of competitive
sorption of metal ions. In addition, it is well-known that most heavy metal contamination in the surface
environment is associated with a cocktail of contaminants rather than one metal.
Previous research at Port-au-Prince has showed an impact of groundwater quality related to the
contribution of urban contaminants. For example, Pb concentrations ranging from 10 μg·L−1 to 90 μg·L−1
were measured in the drinking water of Port-au-Prince [19–21]. In this study, we have investigated the
potential capacity of Pb, Cu and Cd to sorb on soils of Cul-de-Sac plain. Knowledge about the mobility
of these heavy metals in soils of Port-au-Prince may play a key role in the designing of control strategies
to achieve better groundwater protection.
2. Materials and Methods
2.1. Soil Samples and Characterization
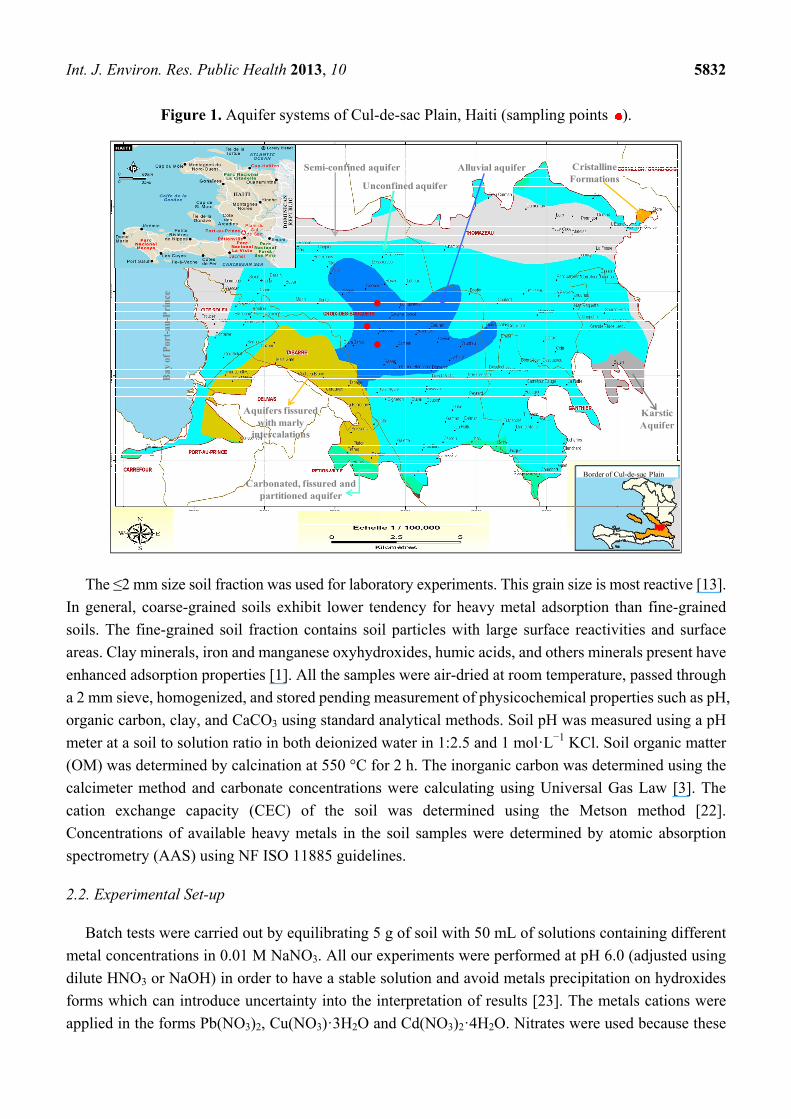
Three approximately 3-kg soil samples from 2 m apart of the same site were collected and combined
prior to the experiments from the alluvial formations of the Cul-de-Sac plain at Port-au-Prince, which is
not subjected to human activities (Figure 1).
Int. J. Environ. Res. Public Health 2013, 10 5832
Figure 1. Aquifer systems of Cul-de-sac Plain, Haiti (sampling points ).
The ≤2 mm size soil fraction was used for laboratory experiments. This grain size is most reactive [13].
In general, coarse-grained soils exhibit lower tendency for heavy metal adsorption than fine-grained
soils. The fine-grained soil fraction contains soil particles with large surface reactivities and surface
areas. Clay minerals, iron and manganese oxyhydroxides, humic acids, and others minerals present have
enhanced adsorption properties [1]. All the samples were air-dried at room temperature, passed through
a 2 mm sieve, homogenized, and stored pending measurement of physicochemical properties such as pH,
organic carbon, clay, and CaCO3 using standard analytical methods. Soil pH was measured using a pH
meter at a soil to solution ratio in both deionized water in 1:2.5 and 1 mol·L−1 KCl. Soil organic matter
(OM) was determined by calcination at 550 °C for 2 h. The inorganic carbon was determined using the
calcimeter method and carbonate concentrations were calculating using Universal Gas Law [3]. The
cation exchange capacity (CEC) of the soil was determined using the Metson method [22].
Concentrations of available heavy metals in the soil samples were determined by atomic absorption
spectrometry (AAS) using NF ISO 11885 guidelines.
2.2. Experimental Set-up
Batch tests were carried out by equilibrating 5 g of soil with 50 mL of solutions containing different
metal concentrations in 0.01 M NaNO3. All our experiments were performed at pH 6.0 (adjusted using
dilute HNO3 or NaOH) in order to have a stable solution and avoid metals precipitation on hydroxides
forms which can introduce uncertainty into the interpretation of results [23]. The metals cations were
applied in the forms Pb(NO3)2, Cu(NO3)·3H2O and Cd(NO3)2·4H2O. Nitrates were used because these
Semi-confined aquifer
Unconfined aquifer
Alluvial aquifer Cristalline Formations
KarsticAquifer
Carbonated, fissured and partitioned aquifer
Aquifers fissured with marly
intercalations
Bay
of P
ort-
au-P
rinc
e
Border of Cul-de-sac Plain
Int. J. Environ. Res. Public Health 2013, 10 5833
ions have no affinity for metals [13,24]. After equilibrium, the suspensions were filtered though a 0.45 µm
membrane, and samples were carefully dispensed to 50 mL polyethylene sample cups, acidified to pH 1.5–2
using strong HNO3 and stored at 4 °C until the heavy metal ion measurements by AAS.
2.2.1. Adsorption Kinetics
Metal adsorption depends on the reaction kinetics and the time of contact between metal ions and soil.
In this study, Kinetics batch tests were carried out at room temperature and samples were taking after 1 min,
3 min, 8 min, 15 min, 30 min, 60 min, 120 min, 360 min, 720 min, 1,440 min, 2,880 min and 4,320 min.
The metal concentrations equilibrated with the soil sample were 250, 80 and 123 mg·L−1 of Pb, Cu and Cd
respectively. The metal suspensions were prepared and analyzed by AAS.
2.2.2. Monometal Adsorption
Monometal batch tests were performed over a 24 h period by shaking range concentrations of Pb
(0186 mg·L−1), Cu (057 mg·L−1) and Cd (0101 mg·L−1) at room temperature. After equilibrium time,
the suspensions were prepared for metal ions measurements by AAS. The amount of the metal ions
sorbed by soil was calculated by:
(1)
where qe is the amount of Pb2+, Cu2+ or Cd2+ adsorbed on the soil (mg·g−1), Ce is the concentration of
Pb2+, Cu2+ or Cd2+ at equilibrium (mg·L−1), C0 is the initial concentration of Pb2+, Cd2+ or Cu2+ in
solution (mg·L−1), V is the solution volume (mL), and W is the weight of air-dried soil (g).
2.2.3. Competitive Adsorption
Bi- and tri- metal batch tests were carried out by solubilizing a combination of either (Pb2+–Cu2+),
(Pb2+–Cd2+), (Cu2+–Cd2+) and (Pb2+–Cu2+–Cd2+). These experiments were conducted with the same
operating conditions as for monometal batch tests in terms of volume (50 mL), soil sample weight (5 g),
heavy metals concentrations ranges, pH (6.0) and agitation time (24 h).
2.3. Theory
To study the adsorption processes, simple mathematical expressions are usually applied to establish
relationships between concentration of the adsorbent in the liquid phase and the solid phase at
equilibrium and at constant temperature. During these experiments, adsorption processes do not always
have time to reach equilibrium, but it is limited instead by reaction kinetics.
2.3.1. Kinetics Models
Kinetics batch tests were performed in order to evaluate the reaction rates of Pb, Cu and Cd on the
selected soil. Two simplified kinetics models including pseudo-first-order and pseudo-second-order
were tested [25–28]. The pseudo-first-order equation is linearly expressed as:
0 ee
C C Vq W
Int. J. Environ. Res. Public Health 2013, 10 5834
(2)
where Qe (mg·g−1) is the adsorption capacity at equilibrium, Qt (mg·g−1) is the amount of the metal
adsorbed at time t, and k1 (min−1) is the rate constant of the pseudo-first-order equation. The values of k1
can be obtained from the slope of the linear plot of ln(Qe − Qt) vs. t at different metal concentration. The
linearised form of pseudo-second-order equation [25] is expressed as:
(3)
where k2 is the rate constant of pseudo-second-order kinetics. The values of k2 (g·mg·min−1) and Qe can
be determined from the slope and intercept of the plot obtained by plotting t/ Qt vs. t respectively.
2.3.2. Isotherms Adsorption Models
Langmuir and Freundlich models were used to study monometal isotherms of Pb2+, Cd2+ and Cu2+ on
the soil [29]. The above two models are given, respectively, as follows:
(4)
(5)
where Ce (mg·L−1) and qe (mg·g−1) are the equilibrium adsorbante concentrations in the aqueous and
solid phases, respectively; Qmax is the maximum adsorption (mg·g−1) and b (L·mg−1) is the adsorption
equilibrium constant; kF (L·mg−1) is the Freundlich distribution coefficient and n is an empirical constant
(unitless).
Jain and Snoeyink (JS) [30] have proposed a modified equation of the Langmuir model Equation (4)
for bi-solute adsorption systems. The extended Langmuir model takes into consideration that the
presence of other metals in solution can affect the apparent affinity of the metal for the adsorption on an
active site [31]. The JS modified model equations is given by:
(6)
(7)
were q1 and q2 are the amount of metals 1 and 2 adsorbed per unit weight of adsorbent at equilibrium
concentrations C1 and C2. The first term of the Equation (6) is the Langmuir expression for the number of
molecules of solute 1 that sorb without competition on the surface area and the term is proportional to
(Qm,1 − Qm,2). The second term of this equation represents the number of molecules of solute 1 sorbed on
the surface area proportional to Qm,2 in competition with solute 2, and is based on the Langmuir model
for competition adsorption. The number of molecules of solute 2 sorbed on the adsorbent surface is
proportional to Qm,2 in competition with solute 1, can be calculated from Equation (7). The JS model was
used in this study to assess the bi-metal competitive adsorption of Pb, Cu and Cd on the studied soil.
Experimental data from tri-metal batch tests was modeled using Langmuir extended model, as
follows:
1ln( ) lne t eQ Q Q k t
22
1t ee
t tQ Qk Q
max1
ee
e
Q bCq bC
1n
e F eq k C
m,1 m,2 1 1 m,2 1 11
1 1 1 1 2 2
( )1 1
Q Q b C Q b Cq b C b C b C
m,2 2 22
1 1 2 21Q b C
q b C b C
Int. J. Environ. Res. Public Health 2013, 10 5835
(8)
where 0,m iq , 0
ib and 0jb are Langmuir extended parameters obtained from Equation (4) in monometal
batch tests and Ce,i and Ce,j are respectively the concentrations of metals i and j from tri-metal batch tests
after equilibrium.
3. Results and Discussion
3.1. Soil Characteristics
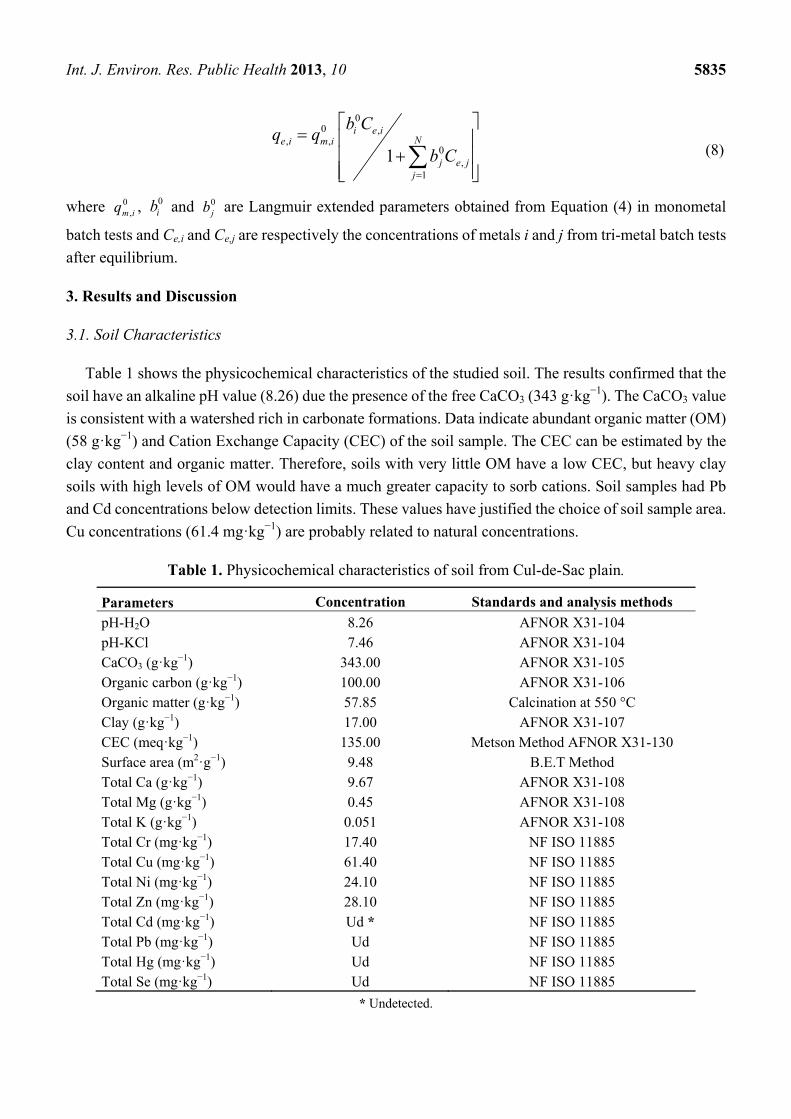
Table 1 shows the physicochemical characteristics of the studied soil. The results confirmed that the
soil have an alkaline pH value (8.26) due the presence of the free CaCO3 (343 g·kg−1). The CaCO3 value
is consistent with a watershed rich in carbonate formations. Data indicate abundant organic matter (OM)
(58 g·kg−1) and Cation Exchange Capacity (CEC) of the soil sample. The CEC can be estimated by the
clay content and organic matter. Therefore, soils with very little OM have a low CEC, but heavy clay
soils with high levels of OM would have a much greater capacity to sorb cations. Soil samples had Pb
and Cd concentrations below detection limits. These values have justified the choice of soil sample area.
Cu concentrations (61.4 mg·kg−1) are probably related to natural concentrations.
Table 1. Physicochemical characteristics of soil from Cul-de-Sac plain.
Parameters Concentration Standards and analysis methods
pH-H2O 8.26 AFNOR X31-104 pH-KCl 7.46 AFNOR X31-104 CaCO3 (g·kg−1) 343.00 AFNOR X31-105 Organic carbon (g·kg−1) 100.00 AFNOR X31-106 Organic matter (g·kg−1) 57.85 Calcination at 550 °C Clay (g·kg−1) 17.00 AFNOR X31-107 CEC (meq·kg−1) 135.00 Metson Method AFNOR X31-130 Surface area (m2·g−1) 9.48 B.E.T Method Total Ca (g·kg−1) 9.67 AFNOR X31-108 Total Mg (g·kg−1) 0.45 AFNOR X31-108 Total K (g·kg−1) 0.051 AFNOR X31-108 Total Cr (mg·kg−1) 17.40 NF ISO 11885 Total Cu (mg·kg−1) 61.40 NF ISO 11885 Total Ni (mg·kg−1) 24.10 NF ISO 11885 Total Zn (mg·kg−1) 28.10 NF ISO 11885 Total Cd (mg·kg−1) Ud * NF ISO 11885 Total Pb (mg·kg−1) Ud NF ISO 11885 Total Hg (mg·kg−1) Ud NF ISO 11885 Total Se (mg·kg−1) Ud NF ISO 11885
* Undetected.
00 ,
, ,0
,1
1
i e iNe i m i
j e jj
b Cq q
b C
Int. J. Environ. Res. Public Health 2013, 10 5836
3.2. Kinetics
The adsorption rates of the three metals have been evaluated using Equations (2) and (3). The
obtained parameters for pseudo-first and second order are given in Table 2. The low values of correlation
coefficients indicate that the pseudo-first order model is inappropriate to describe the adsorption rates
processes.
Table 2. Constants and correlation coefficients obtained by pseudo-first-order and
pseudo-second-order kinetics models.
Metal ions Pseudo-first order Pseudo-second order K1 (min−1) R1
2 Qe (mg·g−1) K2 (g·mg−1·min) R22
Pb2+ 0.00139 0.66 2.50 0.25 1.00Cu2+ 0.00147 0.68 0.79 0.77 1.00Cd2+ 0.00010 0.83 1.24 0.01 0.99
Pb2+ (Pb2+–Cu2+–Cd2+) 0.00047 0.48 2.61 0.075 1.00Cu2+ (Cu2+–Pb2+–Cd2+) 0.0012 0.71 0.86 0.055 0.99Cd2+ (Cd2+–Pb2+–Cu2+) 0.00073 0.91 1.58 0.002 0.94
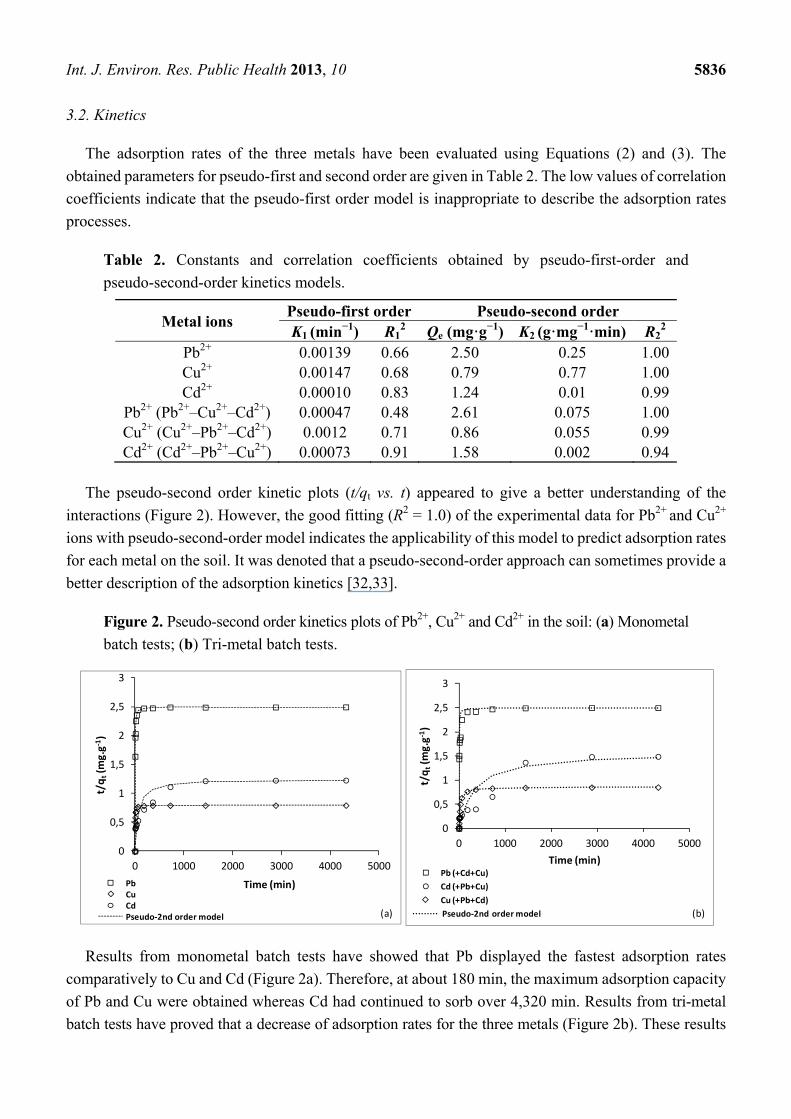
The pseudo-second order kinetic plots (t/qt vs. t) appeared to give a better understanding of the
interactions (Figure 2). However, the good fitting (R2 = 1.0) of the experimental data for Pb2+ and Cu2+
ions with pseudo-second-order model indicates the applicability of this model to predict adsorption rates
for each metal on the soil. It was denoted that a pseudo-second-order approach can sometimes provide a
better description of the adsorption kinetics [32,33].
Figure 2. Pseudo-second order kinetics plots of Pb2+, Cu2+ and Cd2+ in the soil: (a) Monometal
batch tests; (b) Tri-metal batch tests.
Results from monometal batch tests have showed that Pb displayed the fastest adsorption rates
comparatively to Cu and Cd (Figure 2a). Therefore, at about 180 min, the maximum adsorption capacity
of Pb and Cu were obtained whereas Cd had continued to sorb over 4,320 min. Results from tri-metal
batch tests have proved that a decrease of adsorption rates for the three metals (Figure 2b). These results
0
0,5
1
1,5
2
2,5
3
0 1000 2000 3000 4000 5000
t/qt(m
g.g‐1)
Time (min)Pb (+Cd+Cu)
Cd (+Pb+Cu)
Cu (+Pb+Cd)
Pseudo‐2nd order model
0
0,5
1
1,5
2
2,5
3
0 1000 2000 3000 4000 5000
t/qt(m
g.g‐1)
Time (min)PbCuCdPseudo‐2nd order model (a) (b)
Int. J. Environ. Res. Public Health 2013, 10 5837
have showed that the maximum adsorption capacity for Pb, Cu and Cd was obtained respectively at
2,880, 4,320 and over 4,320 min. These results showed that when two or more metal ions are together in
soils, their adsorption rates is decreased each other. Therefore, their mobility in soils can be limited by
competition for the adsorption sites and they don’t represent a potential risk at short-term for
groundwater of Port-au-Prince.
3.3. Monometal Adsorption
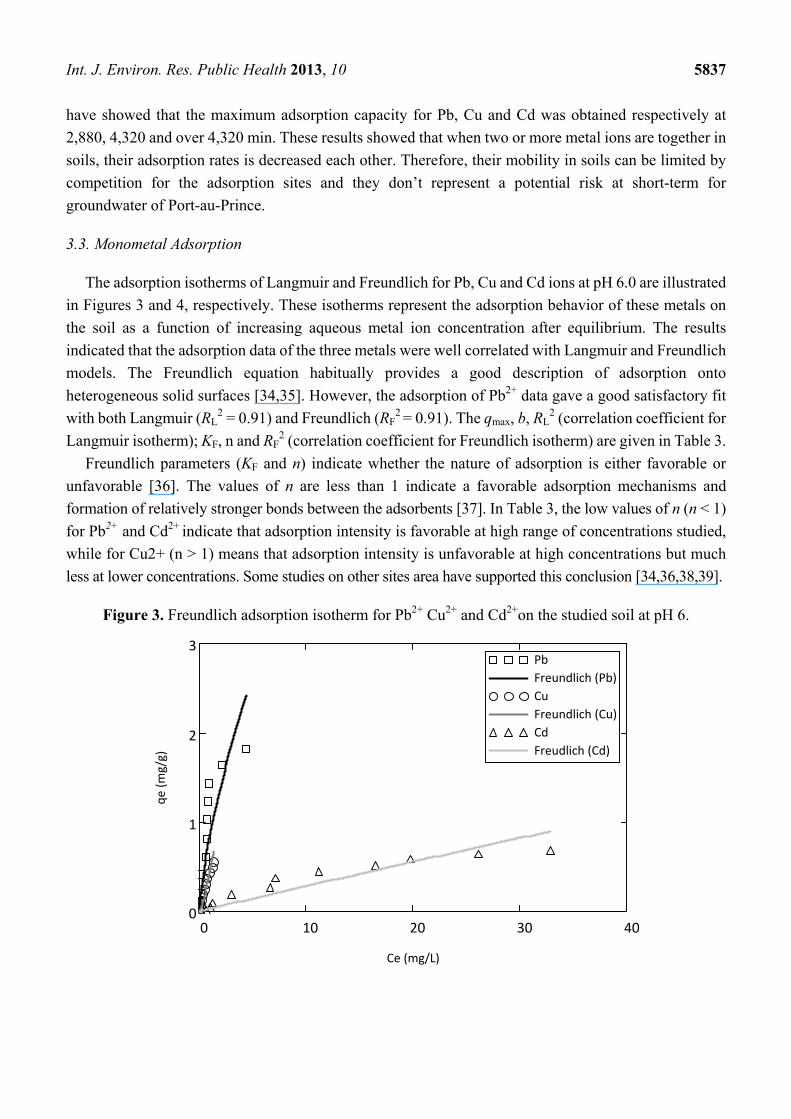
The adsorption isotherms of Langmuir and Freundlich for Pb, Cu and Cd ions at pH 6.0 are illustrated
in Figures 3 and 4, respectively. These isotherms represent the adsorption behavior of these metals on
the soil as a function of increasing aqueous metal ion concentration after equilibrium. The results
indicated that the adsorption data of the three metals were well correlated with Langmuir and Freundlich
models. The Freundlich equation habitually provides a good description of adsorption onto
heterogeneous solid surfaces [34,35]. However, the adsorption of Pb2+ data gave a good satisfactory fit
with both Langmuir (RL2 = 0.91) and Freundlich (RF
2 = 0.91). The qmax, b, RL2 (correlation coefficient for
Langmuir isotherm); KF, n and RF2 (correlation coefficient for Freundlich isotherm) are given in Table 3.
Freundlich parameters (KF and n) indicate whether the nature of adsorption is either favorable or
unfavorable [36]. The values of n are less than 1 indicate a favorable adsorption mechanisms and
formation of relatively stronger bonds between the adsorbents [37]. In Table 3, the low values of n (n < 1)
for Pb2+ and Cd2+ indicate that adsorption intensity is favorable at high range of concentrations studied,
while for Cu2+ (n > 1) means that adsorption intensity is unfavorable at high concentrations but much
less at lower concentrations. Some studies on other sites area have supported this conclusion [34,36,38,39].
Figure 3. Freundlich adsorption isotherm for Pb2+ Cu2+ and Cd2+on the studied soil at pH 6.
0 10 20 30 400
1
2
3Pb
Freundlich (Pb)
Cu
Freundlich (Cu)
Cd
Freudlich (Cd)
Ce (mg/L)
qe (mg/g)
Int. J. Environ. Res. Public Health 2013, 10 5838
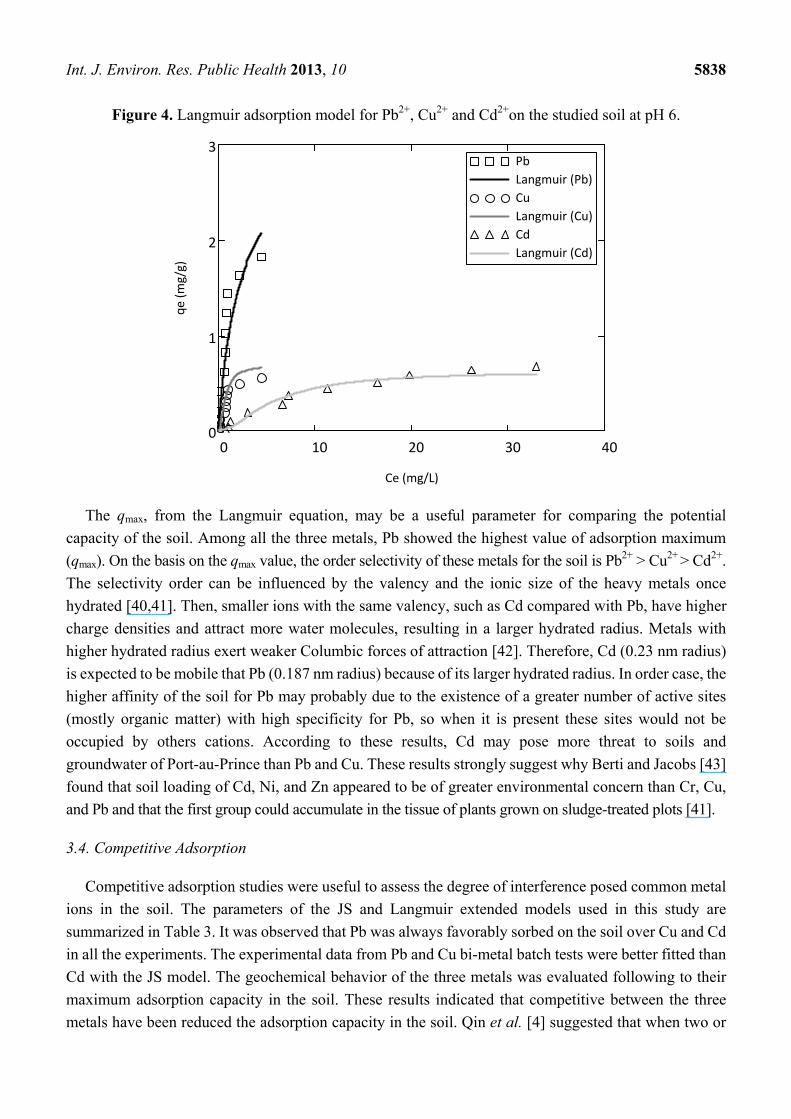
Figure 4. Langmuir adsorption model for Pb2+, Cu2+ and Cd2+on the studied soil at pH 6.
The qmax, from the Langmuir equation, may be a useful parameter for comparing the potential
capacity of the soil. Among all the three metals, Pb showed the highest value of adsorption maximum
(qmax). On the basis on the qmax value, the order selectivity of these metals for the soil is Pb2+ > Cu2+ > Cd2+.
The selectivity order can be influenced by the valency and the ionic size of the heavy metals once
hydrated [40,41]. Then, smaller ions with the same valency, such as Cd compared with Pb, have higher
charge densities and attract more water molecules, resulting in a larger hydrated radius. Metals with
higher hydrated radius exert weaker Columbic forces of attraction [42]. Therefore, Cd (0.23 nm radius)
is expected to be mobile that Pb (0.187 nm radius) because of its larger hydrated radius. In order case, the
higher affinity of the soil for Pb may probably due to the existence of a greater number of active sites
(mostly organic matter) with high specificity for Pb, so when it is present these sites would not be
occupied by others cations. According to these results, Cd may pose more threat to soils and
groundwater of Port-au-Prince than Pb and Cu. These results strongly suggest why Berti and Jacobs [43]
found that soil loading of Cd, Ni, and Zn appeared to be of greater environmental concern than Cr, Cu,
and Pb and that the first group could accumulate in the tissue of plants grown on sludge-treated plots [41].
3.4. Competitive Adsorption
Competitive adsorption studies were useful to assess the degree of interference posed common metal
ions in the soil. The parameters of the JS and Langmuir extended models used in this study are
summarized in Table 3. It was observed that Pb was always favorably sorbed on the soil over Cu and Cd
in all the experiments. The experimental data from Pb and Cu bi-metal batch tests were better fitted than
Cd with the JS model. The geochemical behavior of the three metals was evaluated following to their
maximum adsorption capacity in the soil. These results indicated that competitive between the three
metals have been reduced the adsorption capacity in the soil. Qin et al. [4] suggested that when two or
0 10 20 30 400
1
2
3Pb
Langmuir (Pb)
Cu
Langmuir (Cu)
Cd
Langmuir (Cd)
Ce (mg/L)
qe (m
g/g)
Int. J. Environ. Res. Public Health 2013, 10 5839
more metal ions are present together, they may increase, decrease or not change the metal-ion adsorption
capacity of the adsorbent. The competitive of Cd and Pb in acid soils was studied by Serrano et al. [15]
and they noted that the co-existence of Pb and Cd reduces their tendency to be sorbed on the soil solid
phases, thereby affecting the adsorption capacity of Cd to a greater extent than Pb. The same
phenomenon was observed by Morera et al. [44] using competitive adsorption isotherms to evaluate the
mobility of Cd, Cu, Ni, Pb and Zn in four soils differing in their physicochemical properties.
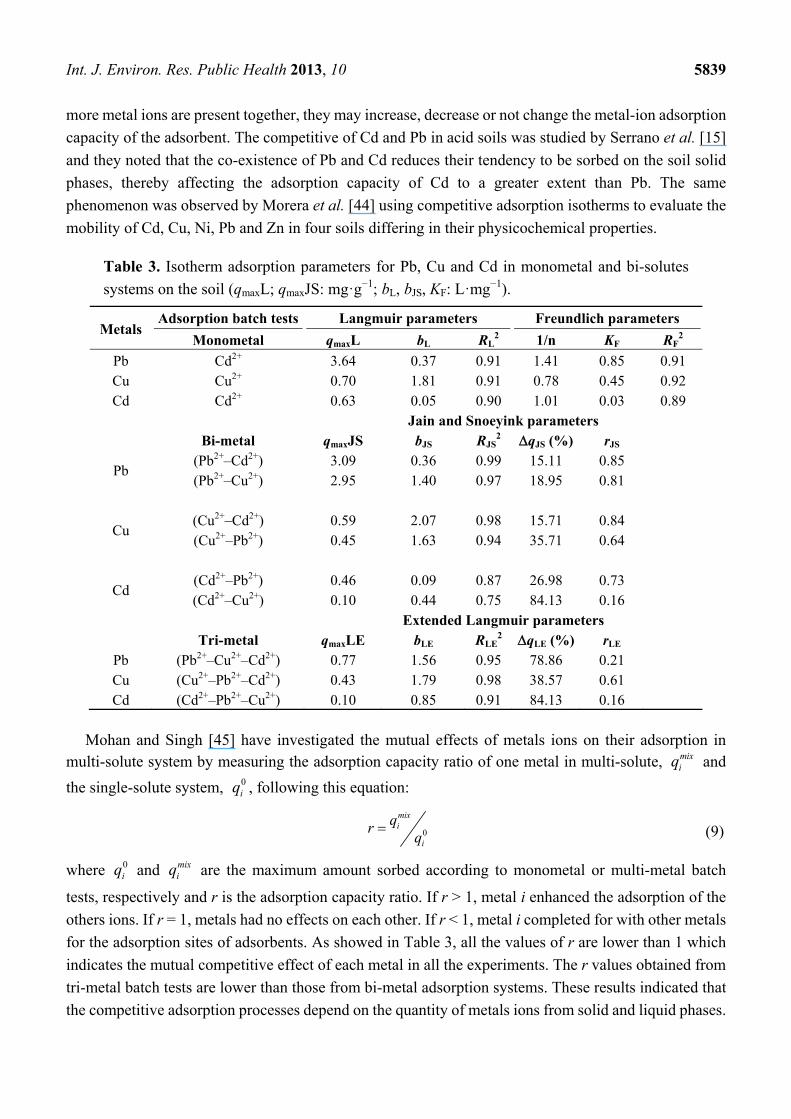
Table 3. Isotherm adsorption parameters for Pb, Cu and Cd in monometal and bi-solutes
systems on the soil (qmaxL; qmaxJS: mg·g−1; bL, bJS, KF: L·mg−1).
Metals Adsorption batch tests Langmuir parameters Freundlich parameters
Monometal qmaxL bL RL2 1/n KF RF
2
Pb Cd2+ 3.64 0.37 0.91 1.41 0.85 0.91 Cu Cu2+ 0.70 1.81 0.91 0.78 0.45 0.92 Cd Cd2+ 0.63 0.05 0.90 1.01 0.03 0.89
Bi-metal
Jain and Snoeyink parameters qmaxJS bJS RJS
2 qJS (%) rJS
Pb (Pb2+–Cd2+) 3.09 0.36 0.99 15.11 0.85 (Pb2+–Cu2+) 2.95 1.40 0.97 18.95 0.81
Cu (Cu2+–Cd2+) 0.59 2.07 0.98 15.71 0.84 (Cu2+–Pb2+) 0.45 1.63 0.94 35.71 0.64
Cd (Cd2+–Pb2+) 0.46 0.09 0.87 26.98 0.73 (Cd2+–Cu2+) 0.10 0.44 0.75 84.13 0.16
Tri-metal Extended Langmuir parameters
qmaxLE bLE RLE2 qLE (%) rLE
Pb (Pb2+–Cu2+–Cd2+) 0.77 1.56 0.95 78.86 0.21 Cu (Cu2+–Pb2+–Cd2+) 0.43 1.79 0.98 38.57 0.61 Cd (Cd2+–Pb2+–Cu2+) 0.10 0.85 0.91 84.13 0.16
Mohan and Singh [45] have investigated the mutual effects of metals ions on their adsorption in multi-solute system by measuring the adsorption capacity ratio of one metal in multi-solute, mix
iq and
the single-solute system, 0iq , following this equation:
(9)
where 0iq and mix
iq are the maximum amount sorbed according to monometal or multi-metal batch
tests, respectively and r is the adsorption capacity ratio. If r > 1, metal i enhanced the adsorption of the
others ions. If r = 1, metals had no effects on each other. If r < 1, metal i completed for with other metals
for the adsorption sites of adsorbents. As showed in Table 3, all the values of r are lower than 1 which
indicates the mutual competitive effect of each metal in all the experiments. The r values obtained from
tri-metal batch tests are lower than those from bi-metal adsorption systems. These results indicated that
the competitive adsorption processes depend on the quantity of metals ions from solid and liquid phases.
0
mixi
i
qrq
Int. J. Environ. Res. Public Health 2013, 10 5840
The rate of adsorption reduction (q) can be calculated following the Equation (10). This rate is the
ratio of the difference between non-competitive and competitive adsorption observed at equilibrium:
0 m 0(%) ( ) / 100ixi i iq q q q (10)
According the q, Pb, Cu and Cd ions had different competitive effect. For Pb, the adsorption
capacity was reduced by 15.11%, 18.95% and 78.86% respectively in (Pb2+–Cd2+), (Pb2+–Cu2+) and
(Pb2+Cu2+Cd2+) systems. Similarly, the rate of adsorption equilibrium reduction of Cu, comparing to
its adsorption in monometal, decreased respectively by 15.71%, 35.71% and 38.57% in (Cu2+–Cd2+),
(Cu2+–Pb2+) and (Pb2+–Cu2+–Cd2+) systems. Finally, for Cd, its adsorption capacity was reduced by
26.98% in (Cu2+–Pb2+), by 84.13% in both (Cd2+–Cu2+) and (Pb2+–Cu2+–Cd2+) systems. Therefore, the
similarity between the q of Cd in (Cd2+–Cu2+) and (Pb2+–Cu2+–Cd2+) systems may indicate that Cu can
suppress Cd adsorption greater than Pb. According to the different rates of adsorption equilibrium
reduction effect, the affinity sequence of the three metals for the soil in tri-metal adsorption systems is
Cu2+ > Pb2+ > Cd2+. That means, when the three metals are in competition for the same sorption sites, Cu
could displace Pb and Pb could displace Cd. Indeed, the affinity order found from monometal adsorption
batch tests, Pb2+ > Cu2+ > Cd2+, remained the same in competitive batch tests. In spite of the maximum
capacity of Pb decreased related to competitive adsorption, it was mostly adsorbed on the soils over Cu
and Cd.
4. Conclusions
This study has shown in general that the soil of Port-au-Prince has a high capacity to sorb metal ions.
Results from kinetics batch tests have shown the applicability of a pseudo-second order model to
describe the adsorption rates of each metal on the soil. The ranked affinity of the selected metals for the
soil was Pb2+ > Cu2+ > Cd2+ according to the maximum adsorption capacity obtained by the Langmuir
model. Results from multimetal batch tests indicated that competition between heavy metals for sorption
sites can reduce their maximum adsorption capacity on the soil. On the basis of results from this study,
Cd may pose more threat to soils and groundwater of Port-au-Prince than Pb and Cu. In short, regular
groundwater samples and analysis may be carried out to assess changes in groundwater quality. It’s
necessary also to complete this study by coupling chemistry with a transport model for a better
understanding of heavy metals transfer mechanisms to groundwater of Port-au-Prince.
Acknowledgments
The authors gratefully acknowledge Rhône-Alpes Region (France), the Prime Minister office of the
Republic of Haiti and the Caribbean office of the “Agence Universitaire de la Francophonie” for their
financial support.
Conflicts of Interest
The authors declare no conflict of interest.
Int. J. Environ. Res. Public Health 2013, 10 5841
References
1. Bradl, H.B. Adsorption of heavy metal ions on soils and soils constituents. J. Colloid Interface Sci.
2004, 277, 1‒18.
2. Siegel, F.R. Environmental Geochemistry of Potentially Toxic Heavy Metals; Springer: Berlin,
Germany, 2002.
3. Usman, A.R.A. The relative adsorption selectivities of Pb, Cu, Zn, Cd and Ni by soils developed on
shale in New Valley, Egypt. Geoderma 2008, 144, 334–343.
4. Qin, F.; Wen, B.; Shan, X.-Q.; Xie, Y.-N.; Liu, T.; Zhang, S.-Z.; Khan, S.U. Mechanisms of
competitive adsorption of Pb, Cu, and Cd on peat. Environ. Pollut. 2006, 144, 669–680.
5. Antoniadis, V.; Tsadilas, C.D.; Ashworth, D.J. Monometal and competitive adsorption of heavy
metals by sewage sludge-amended soil. Chemosphere 2007, 68, 489–494.
6. Krishnamurti, G.S.R.; Naidu, R. Solid-solution equilibria of cadmium in soils. Geoderma 2003, 113,
17–30.
7. Adhikari, T.; Singh, M.V. Sorption characteristics of lead and cadmium in some soils of India.
Geoderma 2003, 114, 81–92.
8. Appel, C.; Ma, L. Concentration, pH, and surface charge effects on cadmium and lead sorption in
three tropical soils. J. Environ. Qual. 2002, 31, 581–589.
9. Hooda, P.S.; Alloway, B.J. Cadmium and lead sorption behavior of selected English and Indian
soils. Geoderma 1998, 84, 121–134.
10. Jalali, M.; Moharrami, S. Competitive adsorption of trace elements in calcareous soils of western
Iran. Geoderma 2007, 140, 156–163.
11. Kuo, S.; Baker, A.S. Sorption of copper, zinc, and cadmium by some acid soils. Soil Sci. Soc. Am. J.
1980, 44, 969–974.
12. Martinez, C.E.; McBride, M.B. Solubility of Cd2+, Cu2+, Pb2+, and Zn2+ in aged coprecipitates with
morphous iron hydroxides. Environ. Sci. Technol. 1998, 32, 743–748.
13. Plassard, F.; Winiarski, T.; Petit-Ramel, M. Retention and distribution of three heavy metals in a
carbonated soil: Comparison between batch and unsaturated column studies. J. Contam. Hydrol.
2000, 42, 99–111.
14. Sauvé, S.; Hendershot, W.; Allen, H.E. Solid-solution partitioning of metals in contaminated soils:
Dependence on pH, total metal burden, and organic matter. Environ. Sci. Technol. 2000, 34,
1125–1131.
15. Serrano, S.; Garrido, F.; Campbell, C.G.; Garcia-Gonzalez, M.T. Competitive sorption of cadmium
and lead in acid soils of Central Spain. Geoderma 2005, 124, 91–104.
16. Trivedi, P.; Dyer, J.A.; Sparks, D.L. Lead sorption onto ferrihydrite. 1. A macroscopic and
spectroscopic assessment. Environ. Sci. Technol. 2003, 37, 908–914.
17. Ponizovsky, A.A.; Allen, H.E.; Ackerman, A.J. Copper activity in soil solutions of calcareous soils.
Environ. Pollut. 2007, 145, 1–6.
18. Fontes, M.P.F.; de Matos, A.T.; da Costa, L.M.; Neves, J.C.L. Compititive adsorption of Zn, Cd, Cu
and Pb in three highly weathered Brazilian soils. Commun. Soil Sci. Plant Anal. 2000, 31,
2939–2958.
Int. J. Environ. Res. Public Health 2013, 10 5842
19. Assessment of Human Exposures to Lead in Drinking Water. Available online:
http://www.bvsde.paho.org/bvsAIDIS/PuertoRico29/ruth.pdf (accessed on 29 October 2013).
20. Emmanuel, E.; Angerville, R.; Joseph, O.; Perrodin, Y. Human health risk assessment of lead in
drinking water : A case study from Port-au-Prince Haiti. Int. J. Environ. Pollut. 2007, 31, 280–291.
21. Emmanuel, E.; Pierre, M.G.; Perrodin, Y. Groundwater contamination by microbiological and
chemical substances released from hospital wastewater: Health risk assessment for drinking water
consumers. Environ. Int. 2009, 35, 718–726.
22. Metson, A.J. Methods of Chemical Analysis for Soil Survey Samples; New Zealand Department of
Scientific and Industrial Research, Soil Bureau Bulletin: New Zealand, Wellington, 1956.
23. Equilibrium Sorption of Pb(II), Cd(II) and Cu(II) into Soil of Port-au-Prince: Single-Element
System Studies. Available online: http://theses.insa-lyon.fr/publication/2010ISAL0122/these.pdf
(accessed on 29 October 2013).
24. Jang, A.; Lee, S.-W.; Seo, Y.; Kim, K.-W.; Kim, I.S.; Bishop, P.L. Application of mulch for treating
metals in urban runoff: Batch and column test. Water Sci. Technol. 2007, 55, 95–103.
25. Ho, Y.-S. Citation review of Lagergreen kinetic rate equation on adsorption reaction.
Scientometrics 2004, 59, 171–177.
26. Achak, M.; Hafidi, A.; Ouazzani, N.; Sayadi, S.; Mandi, L. Low cost biosorbent “banana peel” for
the removal of phenolic compounds from olive mill wastewater: Kinetic and equilibrium studies.
J. Hazard. Mater. 2009, 166 117–125.
27. Banat, F.; Al-Asheh, S.; Al-Makhadmeh, L. Utilization of raw and activated date pits for the
removal of phenol from aqueous solutions. Chem. Eng. Technol. 2004, 27, 80–86.
28. Goud, V.V.; Mohanty, K.; Rao, M.S.; Jayakumar, N.S. Phenol removal fromaqueous solutions
using tamarind nut shell activated carbon: Batch and column study. Chem. Engin. Technol. 2005, 28,
814–821.
29. Fifi, U.; Winiarski, T.; Emmanuel, E. Groundwater Vulnerability towards Pollutants from Urban
Stormwater in Developing Countries—Study of Heavy Metals Adsorption on a Representative Soil
of Port-au-Prince, Haiti (in French); GRAIE: Lyon, France, 2010.
30. Jain, J.S.; Snoeyink, V.L. Adsorption from bisolute systems on active carbon. Water Pollut. Control
Federation 1973, 45, 2463–2479.
31. Papageorgiou, S.K.; Katsaros, F.K.; Kouvelos, E.P.; Kanellopoulos, N.K. Prediction of binary
adsorption isotherms of Cu2+, Cd2+ and Pb2+ on calcium alginate beads from single adsorption data.
J. Hazard. Mater. 2009, 162, 1347–1354.
32. Cheung, C.W.; Porter, C.F.; McKay, G. Sorption kinetics for the removal of copper and zinc from
effluents using bone char. Sep. Purif. Technol. 2000, 19, 55–64.
33. Keskinkan, O.; Goksu, M.Z.L.; Basibuyuk, M.; Forster, C.F. Heavy metal adsorption properties of a
submerged aquatic plant (Ceratophyllum demersum). Bioresour. Technol. 2004, 92, 197–200.
34. Arias, M.; Pérez-Novo, C.; Lopez, E.; Soto, B. Competitive adsorption and desorption of copper
and zinc in acids soils. Geoderma 2006, 133, 151–159.
35. Stumm, W.; Morgan, J.J. Aquatic Chemistry: Chemical Equilibria and Rates in Natural Waters, 3rd
ed.; Wiley-Interscience Publication: Hoboken, NJ, USA, 1981.
36. Frimmel, F.H.; Huber, L. Influence of humic substances on the aquatic sorption of heavy metals on
defined minerals phases. Environ. Int. 1996, 22, 507–517.
Int. J. Environ. Res. Public Health 2013, 10 5843
37. Nagernaik, P.B.; Bhole, A.G.; Natarajan, G.S. Arsenic (II) removal by Adsorption rice husks
carbon. Int. J. Environ. Stud. 2002, 5, 1097–1164.
38. McKay, G.; Otterburn, M.S.; Sweeney, A.G. The removal of color from effluent using various
adsorbents—IV silica: Equilibria and column studies. Water Res. 1980, 14, 21–27.
39. Tellan, A.C.; Owalude, S.O. Some Langmuir and Freundlich parameters of adsorption studies of
chlorpheniramine maleate. Res. J. Appl. Sci. 2007, 2, 875–878.
40. Elliott, H.A.; Liberat, M.R.; Huang, C.P. Competitive adsorption of heavy metals by soils. J. Environ.
Qual. 1986, 15, 214–219.
41. Gomes, P.C.; Fontes, M.P.F.; da Silva, A.G.; de S. Mendonça, E.; Netto, A.R. Selectivity sequence
and competitive adsorption of heavy metals by Brazilian soils. Soil Sci. Soc. Am. J. 2001, 65,
1115–1121.
42. Yong, R.N.; Mohamed, A.M.O.; Warkentin, B.P. Principles of Contaminant Transport in Soils;
Elsevier: Amsterdam, The Netherlands, 1992.
43. Berti, W.R.; Jacobs, L.W. Distribution of trace elements in soil from repeated sewage sludge
application. J. Environ. Qual. 1998, 27, 1280–1286.
44. Morera, M.T.; Echeverría, J.C.; Mazkiarán, C.; Garrido, J.J. Isotherms and sequential extraction
procedures for evaluating sorption and distribution of heavy metals in soils. Environ. Pollut. 2001,
113, 135–144.
45. Mohan, D.; Pittman, C.U., Jr.; Steele, P.H. Single, binary and multi-component adsorption of
copper and cadmium from aqueous solutions on Kraft lignin—a biosorbent. J. Colloid Interface Sci.
2006, 297, 489–504.
© 2013 by the authors; licensee MDPI, Basel, Switzerland. This article is an open access article
distributed under the terms and conditions of the Creative Commons Attribution license
(http://creativecommons.org/licenses/by/3.0/).
Related Documents


