Assessing the major factors affecting the performances of forward osmosis and its implications on the desalination process Sherub Phuntsho, Soleyman Sahebi, Tahir Majeed, Fezeh Lotfi, Jung Eun Kim, Ho Kyong Shon ⇑ Centre for Technology in Water and Wastewater, School of Civil and Environmental Engineering, University of Technology, Sydney (UTS), 15 Broadway, NSW 2007, Australia highlights FO performance can be improved by modifying the membrane support layer properties. But modifying thickness and porosity undermines the membrane mechanical strength. Critical initial draw concentration is vital for optimum plant design. Potential application of FO process for feed water containing high TDS is promising. graphical abstract article info Article history: Received 29 December 2012 Received in revised form 10 July 2013 Accepted 18 July 2013 Available online 26 July 2013 Keywords: Forward osmosis Desalination Thin film composite membrane Draw solution Reverse solute flux abstract This study evaluates the influence of some of the major factors affecting the performances of forward osmosis (FO) desalination and assessed their potential implications on the overall process. The major fac- tors assessed include membrane properties, draw solution (DS) properties, feed solution (FS) properties and the operating conditions. The influence of the membrane properties was evaluated using three types of membranes and in doing so we have also introduced one newly synthesized proprietary thin film com- posite FO (TFC-FO) membrane. The performances of TFC-FO membrane in terms of water flux and reverse solute flux were significantly higher than the commercial cellulose triacetate FO membrane and TFC reverse osmosis membrane in FO process. Although adequate osmotic pressure of DS is desirable for FO process, the influence of DS osmotic pressure was less significant at higher DS osmotic pressure and therefore selecting an optimum initial osmotic pressure is essential for FO process to minimize pumping energy. A critical DS concentration has been hypothesized to minimize the implications of DS concentrations on the capital and operational cost of the FO desalination plant. Total dissolved solids (TDS) of the FS play a significant role in the performance of FO process however the influence of feed TDS was less significant for feed higher than 20,000 mg/L indicating that FO has a promising potential for use with high TDS feed water. Although, water flux decreased, the reverse solute flux (RSF) and spe- cific RSF also decreased slightly at higher feed TDS. For operating parameters, the influence of crossflow velocity and the crossflow direction was also investigated. Ó 2013 Elsevier B.V. All rights reserved. 1. Introduction Osmosis, ubiquitous in all the biological living cells, has recently engineered for modern applications particularly in the separation process [1–3]. Forward osmosis (FO) is now an emerging separa- tion technology that promises low energy consumption and low fouling issues in comparison to the conventional pressure based membrane separation processes particularly reverse osmosis (RO) process for desalination [1,4–8]. The principle of FO desalina- tion lies in transporting water through a semi-permeable mem- brane by natural osmotic process using a highly concentrated solution (called as draw solution or DS) that draws water from 1385-8947/$ - see front matter Ó 2013 Elsevier B.V. All rights reserved. http://dx.doi.org/10.1016/j.cej.2013.07.058 ⇑ Corresponding author. Address: Post Box 129, 15 Broadway, Ultimo, NSW 2007, Australia. Tel.: +61 2 9514 2629; fax: +61 2 9514 2633. E-mail address: [email protected] (H.K. Shon). Chemical Engineering Journal 231 (2013) 484–496 Contents lists available at ScienceDirect Chemical Engineering Journal journal homepage: www.elsevier.com/locate/cej

Welcome message from author
This document is posted to help you gain knowledge. Please leave a comment to let me know what you think about it! Share it to your friends and learn new things together.
Transcript
Assessing the major factors affecting the performances of forwardosmosis and its implications on the desalination process
Sherub Phuntsho, Soleyman Sahebi, Tahir Majeed, Fezeh Lotfi, Jung Eun Kim, Ho Kyong Shon !
Centre for Technology in Water and Wastewater, School of Civil and Environmental Engineering, University of Technology, Sydney (UTS), 15 Broadway, NSW 2007, Australia
h i g h l i g h t s
! FO performance can be improved bymodifying the membrane supportlayer properties.! But modifying thickness and porosity
undermines the membranemechanical strength.! Critical initial draw concentration is
vital for optimum plant design.! Potential application of FO process for
feed water containing high TDS ispromising.
g r a p h i c a l a b s t r a c t
a r t i c l e i n f o
Article history:Received 29 December 2012Received in revised form 10 July 2013Accepted 18 July 2013Available online 26 July 2013
Keywords:Forward osmosisDesalinationThin film composite membraneDraw solutionReverse solute flux
a b s t r a c t
This study evaluates the influence of some of the major factors affecting the performances of forwardosmosis (FO) desalination and assessed their potential implications on the overall process. The major fac-tors assessed include membrane properties, draw solution (DS) properties, feed solution (FS) propertiesand the operating conditions. The influence of the membrane properties was evaluated using three typesof membranes and in doing so we have also introduced one newly synthesized proprietary thin film com-posite FO (TFC-FO) membrane. The performances of TFC-FO membrane in terms of water flux and reversesolute flux were significantly higher than the commercial cellulose triacetate FO membrane and TFCreverse osmosis membrane in FO process. Although adequate osmotic pressure of DS is desirable forFO process, the influence of DS osmotic pressure was less significant at higher DS osmotic pressureand therefore selecting an optimum initial osmotic pressure is essential for FO process to minimizepumping energy. A critical DS concentration has been hypothesized to minimize the implications of DSconcentrations on the capital and operational cost of the FO desalination plant. Total dissolved solids(TDS) of the FS play a significant role in the performance of FO process however the influence of feedTDS was less significant for feed higher than 20,000 mg/L indicating that FO has a promising potentialfor use with high TDS feed water. Although, water flux decreased, the reverse solute flux (RSF) and spe-cific RSF also decreased slightly at higher feed TDS. For operating parameters, the influence of crossflowvelocity and the crossflow direction was also investigated.
! 2013 Elsevier B.V. All rights reserved.
1. Introduction
Osmosis, ubiquitous in all the biological living cells, has recentlyengineered for modern applications particularly in the separation
process [1–3]. Forward osmosis (FO) is now an emerging separa-tion technology that promises low energy consumption and lowfouling issues in comparison to the conventional pressure basedmembrane separation processes particularly reverse osmosis(RO) process for desalination [1,4–8]. The principle of FO desalina-tion lies in transporting water through a semi-permeable mem-brane by natural osmotic process using a highly concentratedsolution (called as draw solution or DS) that draws water from
1385-8947/$ - see front matter ! 2013 Elsevier B.V. All rights reserved.http://dx.doi.org/10.1016/j.cej.2013.07.058
! Corresponding author. Address: Post Box 129, 15 Broadway, Ultimo, NSW 2007,Australia. Tel.: +61 2 9514 2629; fax: +61 2 9514 2633.
E-mail address: [email protected] (H.K. Shon).
Chemical Engineering Journal 231 (2013) 484–496
Contents lists available at ScienceDirect
Chemical Engineering Journal
journal homepage: www.elsevier .com/locate /ce j
the feed solution (FS) such as saline water or seawater. Depending onthe end use of the product water from the FO desalination process,the diluted DS may or may not require post-treatment. The energyrequirement for FO process will therefore depend entirely on the in-tended use of the final product water after FO process [9,10].
The FO process is based on the principles of the natural osmoticphenomena observed first by Nollet [11] and the mathematicalexpression of osmotic pressure later derived by Vant’t Hoff [12].The osmotic pressure (p) of the ideal dilute solution is given byVan’t Hoff’s [12] equation shown below.
p " nCRT #1$
where n is the number of moles of solute in the solution,C is the sol-ute molar concentration, R is the gas constant (R = 0.0821) and T isthe absolute temperature of the solution. The standard water flux inthe FO process is given by the following equation [13].
Jw " Ar%pD & pF ' " ArDp #2$
where A is the pure water permeability (PWP) coefficient of themembrane, r is the reflection coefficient (usually considered tobe unity for calculations assuming a perfect barrier to solutes),pD and pF are the bulk osmotic pressures of the DS and the FSrespectively and Dp is the net osmotic pressure or net osmoticgradient. In the FO process, Dp is the driving force that driveswater across the membrane similar to the hydraulic pressure inthe RO process. Eq. (2) therefore shows that the osmotic pressuresof the DS and the FS are the major factors controlling water flux inthe FO process.
Eq. (2) is however valid only when the semipermeable mem-brane used is symmetric [13]. Most commercially available poly-meric membranes, particular the salt rejecting membranes areasymmetric in design. They are composed of thick support layeron which a thin active layer is placed that is responsible for saltrejection. Other than providing mechanical support, the functionof the support layer in separation process is in fact limited. Whilethe presence of support layer does not affect the performance ofany pressure based membrane processes, it has a significant influ-ence on the FO process [6,13–15].
In the FO process, two independent solutions are present oneach side of the membrane as opposed to only single solution inRO process and because of this process design, the FO process suf-fers from concentration polarization effects some of which are un-ique to FO process [14,16,17]. On the membrane surface facing theconcentrated DS, the incoming water flux dilutes the DS immedi-ately reducing the osmotic pressure at the membrane surface. Onthe other side of the membrane facing the FS, the phenomenon isconcentrative as the solute concentration on the membrane sur-face increases as water permeates towards the DS. Since the mem-brane used in FO process is asymmetric, these two CP phenomenacan occur either on the membrane active layer or on the supportlayer depending on how the asymmetric membrane is orientedin FO process. The CP phenomenon that occurs on the surface ofthe membrane active layer is called as external CP or ECP and whilethe one that occurs within the membrane support layer is called asinternal CP or ICP. These CP effects severely hamper the perfor-mance of the FO process [6,13,18]. Because ICP occurs inside themembrane support layer, CP effect cannot be mitigated simplyby improving hydrodynamic conditions as in ECP [15].
FO desalination is mainly operated with the membrane activelayer facing the FS and the porous support layer facing the DS. Thisleads to dilutive ICP within the membrane support layer facing theDS and concentrative ECP at the active surface of the membranefacing FS. The model for dilutive ICP and concentrative ECP hasbeen extensively discussed elsewhere [13,17,19]. Eq. (2) can bemodified to take into account the dilutive ICP and concentrativeECP for FO process operated with support layer facing DS and ac-tive layer facing FS [19]:
Jw " A pD;bf #&Jwk$ & pF;be#Jw=kF $! "
#3$
where K is the solute resistance to diffusion within the membranesupport layer andkF is the mass transfer coefficient of the FS definedby the following equations:
K " tsDe "
SDD
#4$
kF "ShDF
dh#5$
Nomenclatures
AbbreviationsFO forward osmosisRO reverse osmosisSWRO seawater reverse osmosisPRO pressure retarded osmosisBW brackish waterRSF reverse solute fluxSRSF specific reverse solute fluxDS draw solutionFS feed solutionCP concentration polarizationICP internal concentration polarizationECP external concentration polarizationCTA cellulose triacetateTFC thin film compositePWP pure water permeabilityHTI hydration technology innovationsTDS total dissolved solidsDI water deionized waterPR performance ratio
SymbolsA pure water permeability coefficient (L m&2 h&1 bar&1)B salt permeability coefficient (m s&1)C solute concentration (mg/L or Moles or M)D diffusion coefficient (m2 s&1)dh hydraulic diameter (m)Js solute flux (mmoles m&2 h&1 or g m&2 h&1)Jw water flux (L m&2 h&1)k mass transfer coefficientK resistance of solute diffusion within the membrane sup-
port layer (s/m)L length of the channel (m)n Van’t Hoff factorR universal gas constant (0.0821 L atm mol&1 K&1)S structural parameterSc Schmidt numberSh Sherwood numberT absolute temperature (in K)t membrane thicknessp osmotic pressurer reflection coefficiente porosity of the membranes membrane tortuosity
S. Phuntsho et al. / Chemical Engineering Journal 231 (2013) 484–496 485
where t, s and e are the thickness, tortuosity and porosity of themembrane support layer respectively, DD and DF are the diffusioncoefficients of the draw and feed solutes respectively, S is the struc-tural parameter of the membrane support layer, dh the hydraulicdiameter and Sh the Sherwood number.
The first term in Eq. (3) refers to dilutive ICP as it occurs in themembrane support structure facing the DS and the negative termindicates that the phenomenon is dilutive in nature. The secondterm in Eq. (3) refers to concentrative ECP as it occurs on the mem-brane rejection layer facing FS. Although, osmotic process can oc-cur in any of the membrane orientations, for clarity, the processis usually termed as FO mode if the active layer faces FS and sup-port layer faces DS. However, when the FS faces the support layerand DS faces the active layer, the process is termed as pressure re-tarded osmosis or PRO mode. FO mode is a typical membrane ori-entation for any membrane separation process while the PROmode of operation is usually applied for osmotic power generation[16,19].
The polymeric membranes are not an ideal membrane whichcannot completely reject the solutes and therefore the solute trans-fer can occur on both sides of the membrane [20–22]. The reversediffusion of draw solutes towards the feed is measured in terms ofreverse solute flux (RSF) and specific reverse solute flux (SRSF)while the forward rejection of feed solute is measured in termsof rejection rate similar to RO process. The RSF measures theamount of DS lost per unit area of membrane per unit time, whileSRSF represents the ratio of RSF to the water flux (Jw) indicating theamount of DS lost per unit volume of water extracted by FO pro-cess. The term RSF has been commonly adopted because the diffu-sion of draw solutes occurs in reverse direction to water flux.Assessing RSF is important in FO process, as it not only indicatesthe loss of draw solutes that increases replenishment costs but italso could complicate the management of feed concentrate [20].The solute flux of an individual solute (Js) through any semiperme-able membranes is governed by concentration gradients betweenthe two solutions and is commonly described using Fick’s law [23]:
Js " BDC " B#CD & CF$ #6$
where B is the solute permeability coefficient of the membrane, DCis the concentration gradient between the DS (CD) and FS (CF). Eq.(6) indicates that the DC between the DS and the FS could play a sig-nificant role on the RSF and the feed solute rejection in FO process.
The objective of this study is to assess the major factors that areresponsible for influencing the performances of FO process desali-nation and its potential implications. The study focused on the fourmajor factors: membrane properties, DS properties, FS propertiesand the operating parameters. The performances of FO processare assessed in terms of the water flux and RSF. Water flux has di-rect implications on the energy requirement of the FO processwhile RSF represents economic loss from replenishment cost andconcentrate management. While several studies have already re-ported on the comparative performances of RO and cellulose triac-etate (CTA) FO membranes (CTA-FO), we have introduced onenewly developed polyamide based thin film composite (TFC) FOmembrane, a proprietary membrane of Woongjin Chemicals, Kor-ea. While studying the influence of DS on the FO performance,we also tried to evaluate how the DS concentrations affect thewater flux and RSF and proposed hypothesis for a critical initialDS concentration that could have significant implications on theFO desalination plant’s operational and capital costs. It must bementioned here that the temperature also has a significant influ-ence on the performance of the FO process [24,25] and its influenceis evident from Eq. (1). The influence of temperature on the perfor-mances of FO process is not included in this particular study sincewe have already reported in our earlier publication [26].
2. Materials and methods
2.1. Draw solution and feed solution, and their preparations
Five different types of solutes were used in this study: urea, KCl,CaCl2, MgSO4 and Na2SO4 all supplied as pure reagent grade (Sig-ma–Aldrich, Australia). DS was prepared by dissolving the solutesin pure water or deionized (DI) water. The FS consisted of eitherDI water or NaCl (Sigma–Aldrich, Australia) solution prepared inDI water. NaCl solution of different concentrations was used asmodel brackish water (BW) representing FS of different total dis-solved solids (TDS). Unless otherwise specified, the term BW refersto an NaCl FS of TDS 5000 mg/L. The thermodynamic properties ofthe solutions such as osmotic pressure, viscosity and diffusioncoefficient were analyzed using OLI Stream Analyzer 3.2 (OLI Sys-tems Inc., Morris Plains, NJ, US). This software uses thermodynamicmodeling based on published experimental data to predict proper-ties of solutions over a wide range of concentrations and tempera-tures [27].
2.2. Bench scale forward osmosis experiments
A bench-scale FO unit set up similar to the one used in our ear-lier studies were used in this study. The crossflow FO unit con-sisted of cell with channel dimensions of 2.6 cm width, 7.7 cmlength and 0.3 cm depth on both sides of the membrane. Thesechannels allow two solutions to flow on both sides of the mem-brane (FS on the active side of membrane and DS on the supportside of membrane under FO operation mode). Three different typesof membranes were used in this study. They include commercialCTA-FO membrane (HTI Inc., USA), commercial polyamide basedTFC RO membrane or TFC-RO (SWRO, Woongjin Chemicals, Korea)and newly synthesized TFC-FO membranes (Woongjin Chemicals,Korea). The characteristics of the CTA FO membrane have beenwidely reported [14,18,28] and so are the properties of the TFC-RO membranes [29–31]. Polyamide based TFC-RO membrane wasrecently synthesized membrane by Woongjin Chemicals. Sincethe membrane is a proprietary of Woongjin Chemicals, the detailmethods for the synthesis of the membrane have been excludedfrom publication except some basic properties for its performancedata. This TFC-FO membrane is hand-casted membrane and isstill in the process of optimization and development beforecommercialization.
The crossflow experiment was run mostly in a counter-currentmode, since the water flux was slightly higher in this conditions [5]except during the study that involved the influence of crossflowdirections. Both the DS and FS crossflows were maintained at400 mL/min or (8.5 cm/s with Reynolds number in the laminarflow range) except during the study on the influence of crossflowrates. The temperatures of the DS and FS were maintained at25 "C using temperature water bath controlled by heater/chiller.
Each experiment was carried out for a minimum of 6 h dura-tion. The influences of various parameters in the performance ofthe FO process were evaluated in terms of water flux and RSF.Water flux was directly measured using digital mass scale con-nected to PC for online data logging. Although the FO processwas operated for about 6 h, the initial water flux was selected asthe actual flux which usually happened within the first 1 h of theoperation. FO experiments were carried out in a batch mode andtherefore the flux gradually decreased with time due to the dilu-tion of the DS and the concentration of the FS. Longer operationtime was however considered to allow adequate amount of saltsto diffuse across the membrane for measuring the RSF. The RSFwas monitored by measuring the electrical conductivity (EC) usinga multimeter (CP-500L, ISTEK, Korea) when DI was used as feed.
486 S. Phuntsho et al. / Chemical Engineering Journal 231 (2013) 484–496
However, when NaCl solution was used as feed, RSF and the for-ward feed salt rejection were measured using Perkin Elmer ElanDRC-e Inductively Coupled Plasma Mass Spectrometer.
2.3. Pure water permeability (PWP) and salt rejection test
The basic membrane properties such as PWP and salt rejectionof the three membranes were tested in RO mode using a bench-scale crossflow membrane unit. The crossflow membrane cellconsisted of a rectangular feed channel with dimensions of2.6 cm ( 7.7 cm ( 0.3 cm (membrane effective area of 2.002 (10&3 m2). The crossflow rates were maintained at 400 mL/min or(8.5 cm/s crossflow velocity with Reynolds number in the laminarflow range) similar to FO experiments described earlier but with aninitial feed volume of the 3.0 L. Both the permeate and the reten-tate were recycled back to the feed tank except during the mea-surement of the permeate flux. The water flux was determined atvarious operating pressures ranging from 1.0 bar to 25 bars. Saltrejection test was carried out using a feed water containing5000 mg/L of NaCl at different applied pressures and the rejectionwas determined by measuring the electrical conductivity (lS/cm)of the FS and the permeate.
3. Results and discussion
3.1. Influence of membrane properties on the performance of FOprocess
Any selectively permeable membrane material can be used forthe FO process [14] however, membrane properties play a crucialrole in the efficiency of the FO process [32]. To assess the influenceof membrane properties on the FO desalination process, three dif-ferent membranes were used and their performances compared interms of the type of membrane and membrane orientation. Theperformances of these two membranes in FO process are presentedin Table 1. The influence of membrane orientations in the perfor-mance of FO process and its implications are also discussed.
3.1.1. Basic properties of the membranes tested in RO modeThe PWP of the three membranes determined in RO mode of
operation were 1.015, 2.951 and 5.215 L m&2 h&1 atm&1 for CTA-FO, TFC-RO and TFC-FO membranes, respectively. Although, thewater flux of the TFC-FO membrane was higher than the othertwo membranes, its NaCl rejection was the lowest with only about85%. The very high PWP for TFC-FO membrane is probably because
of damage to the membrane when subjected to hydraulic pressurewhich is also indicated by the lower NaCl rejection. TFC-RO mem-brane showed the highest NaCl rejection of 99.5%. The overallphysical thicknesses of the three virgin membranes were mea-sured using a digital micrometer (Model 293-330 Mitutoyo, Japan)which confirmed that the two TFC (RO and FO) membranes arethicker than the CTA FO membrane (93 ± 3 lm).
3.1.2. Comparative performance of membranes in the FO processAlthough the PWP coefficient of the CTA FO membrane
(1.015 L m&2 h&1 atm&1) is much lower than the RO membrane(2.951 L m&2 h&1 atm&1), the water flux of the CTA FO membranewas consistently more than 20 times higher than the RO mem-brane in the FO process under all the conditions reported in Table 1.These confirm earlier studies [6,13,15] that, the commercial ROmembranes are not suitable for FO process. Earlier studies on theFO process using traditional salt-rejecting RO membranes showedthat there was very low flux, even with a DS containing that con-tained very high osmotic pressure [6,14]. This was later explainedby the asymmetric design of the membranes that caused two dif-ferent types of CP effect as explained under Section 1. The TFC-RO membrane used in this study has asymmetric structure and ishence prone to ICP effects within the support layer in addition tothe ECP that usually occurs on the active layer side of the mem-brane. The TFC-RO membrane is about 1.5 times thicker than thethin CTA-FO membrane due to the thick support layer. The pres-ence of the thick support structure increases the structural param-eters of the membrane (S in Eq. (4)) thereby increasing theresistance to the diffusivity of the draw solutes within the mem-brane support layer (K in Eq. (4)) and increasing the dilutive CPphenomenon. When the FO process was tested using the RO mem-brane with its support layer removed, water flux was found to besignificantly higher, even higher than the CTA FO membrane [33].
Recently many groups have been attempting to synthesize highperformance membranes for the FO applications by modifying thestructural properties of the TFC membrane support layer [34–37].The modification includes decreasing the support layer thicknessand increasing the porosity of the membrane. The performanceof the TFC-FO membrane was compared with the CTA-FO and theTFC-FO membranes. Although the thickness of the TFC-FO mem-brane was comparable to its own TFC-RO membrane, TFC-FOmembrane showed very high water flux both in terms of PWPand FO flux. The water flux using 1 M KCl as DS and DI as FS wasthree times higher than that of the CTA-FO membrane and about64 times higher than TFC-RO membrane although this order of
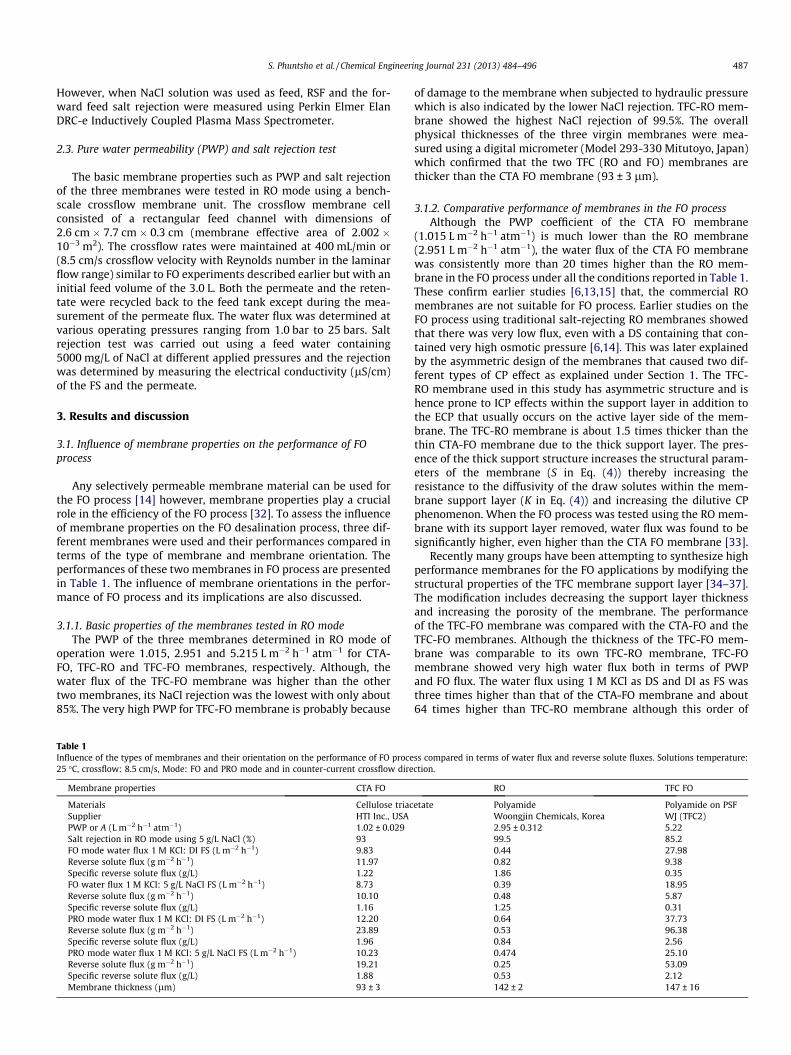
Table 1Influence of the types of membranes and their orientation on the performance of FO process compared in terms of water flux and reverse solute fluxes. Solutions temperature:25 "C, crossflow: 8.5 cm/s, Mode: FO and PRO mode and in counter-current crossflow direction.
Membrane properties CTA FO RO TFC FO
Materials Cellulose triacetate Polyamide Polyamide on PSFSupplier HTI Inc., USA Woongjin Chemicals, Korea WJ (TFC2)PWP or A (L m&2 h&1 atm&1) 1.02 ± 0.029 2.95 ± 0.312 5.22Salt rejection in RO mode using 5 g/L NaCl (%) 93 99.5 85.2FO mode water flux 1 M KCl: DI FS (L m&2 h&1) 9.83 0.44 27.98Reverse solute flux (g m&2 h&1) 11.97 0.82 9.38Specific reverse solute flux (g/L) 1.22 1.86 0.35FO water flux 1 M KCl: 5 g/L NaCl FS (L m&2 h&1) 8.73 0.39 18.95Reverse solute flux (g m&2 h&1) 10.10 0.48 5.87Specific reverse solute flux (g/L) 1.16 1.25 0.31PRO mode water flux 1 M KCl: DI FS (L m&2 h&1) 12.20 0.64 37.73Reverse solute flux (g m&2 h&1) 23.89 0.53 96.38Specific reverse solute flux (g/L) 1.96 0.84 2.56PRO mode water flux 1 M KCl: 5 g/L NaCl FS (L m&2 h&1) 10.23 0.474 25.10Reverse solute flux (g m&2 h&1) 19.21 0.25 53.09Specific reverse solute flux (g/L) 1.88 0.53 2.12Membrane thickness (lm) 93 ± 3 142 ± 2 147 ± 16
S. Phuntsho et al. / Chemical Engineering Journal 231 (2013) 484–496 487
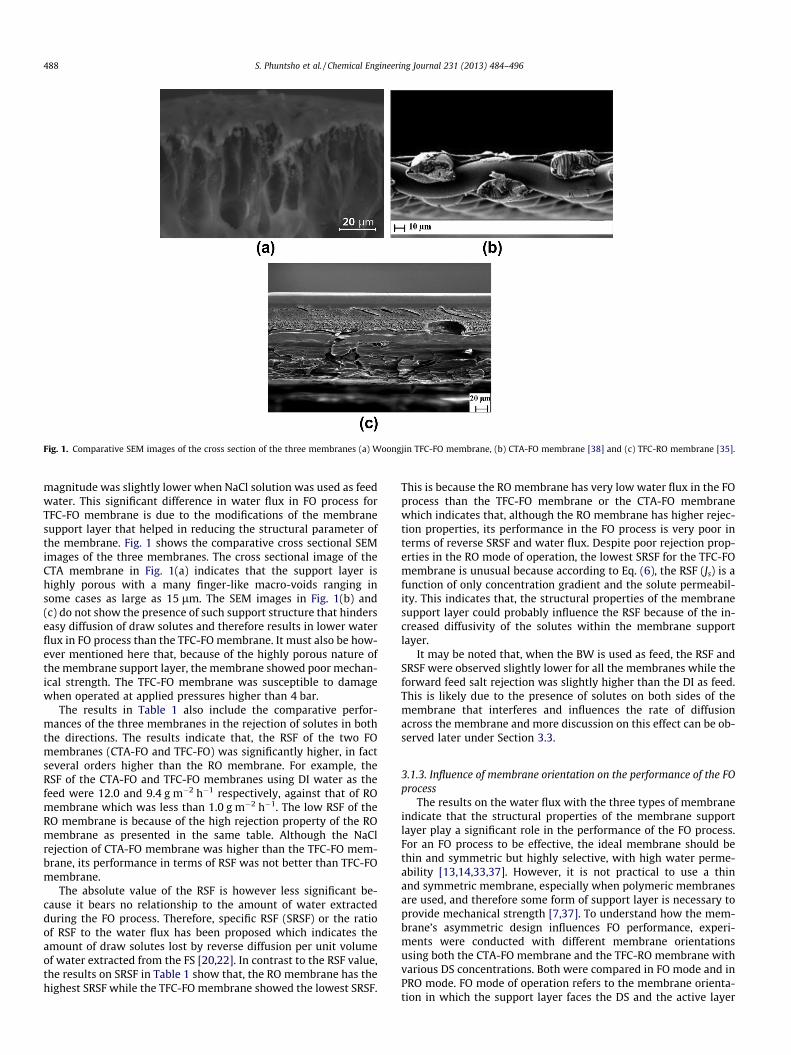
magnitude was slightly lower when NaCl solution was used as feedwater. This significant difference in water flux in FO process forTFC-FO membrane is due to the modifications of the membranesupport layer that helped in reducing the structural parameter ofthe membrane. Fig. 1 shows the comparative cross sectional SEMimages of the three membranes. The cross sectional image of theCTA membrane in Fig. 1(a) indicates that the support layer ishighly porous with a many finger-like macro-voids ranging insome cases as large as 15 lm. The SEM images in Fig. 1(b) and(c) do not show the presence of such support structure that hinderseasy diffusion of draw solutes and therefore results in lower waterflux in FO process than the TFC-FO membrane. It must also be how-ever mentioned here that, because of the highly porous nature ofthe membrane support layer, the membrane showed poor mechan-ical strength. The TFC-FO membrane was susceptible to damagewhen operated at applied pressures higher than 4 bar.
The results in Table 1 also include the comparative perfor-mances of the three membranes in the rejection of solutes in boththe directions. The results indicate that, the RSF of the two FOmembranes (CTA-FO and TFC-FO) was significantly higher, in factseveral orders higher than the RO membrane. For example, theRSF of the CTA-FO and TFC-FO membranes using DI water as thefeed were 12.0 and 9.4 g m&2 h&1 respectively, against that of ROmembrane which was less than 1.0 g m&2 h&1. The low RSF of theRO membrane is because of the high rejection property of the ROmembrane as presented in the same table. Although the NaClrejection of CTA-FO membrane was higher than the TFC-FO mem-brane, its performance in terms of RSF was not better than TFC-FOmembrane.
The absolute value of the RSF is however less significant be-cause it bears no relationship to the amount of water extractedduring the FO process. Therefore, specific RSF (SRSF) or the ratioof RSF to the water flux has been proposed which indicates theamount of draw solutes lost by reverse diffusion per unit volumeof water extracted from the FS [20,22]. In contrast to the RSF value,the results on SRSF in Table 1 show that, the RO membrane has thehighest SRSF while the TFC-FO membrane showed the lowest SRSF.
This is because the RO membrane has very low water flux in the FOprocess than the TFC-FO membrane or the CTA-FO membranewhich indicates that, although the RO membrane has higher rejec-tion properties, its performance in the FO process is very poor interms of reverse SRSF and water flux. Despite poor rejection prop-erties in the RO mode of operation, the lowest SRSF for the TFC-FOmembrane is unusual because according to Eq. (6), the RSF (Js) is afunction of only concentration gradient and the solute permeabil-ity. This indicates that, the structural properties of the membranesupport layer could probably influence the RSF because of the in-creased diffusivity of the solutes within the membrane supportlayer.
It may be noted that, when the BW is used as feed, the RSF andSRSF were observed slightly lower for all the membranes while theforward feed salt rejection was slightly higher than the DI as feed.This is likely due to the presence of solutes on both sides of themembrane that interferes and influences the rate of diffusionacross the membrane and more discussion on this effect can be ob-served later under Section 3.3.
3.1.3. Influence of membrane orientation on the performance of the FOprocess
The results on the water flux with the three types of membraneindicate that the structural properties of the membrane supportlayer play a significant role in the performance of the FO process.For an FO process to be effective, the ideal membrane should bethin and symmetric but highly selective, with high water perme-ability [13,14,33,37]. However, it is not practical to use a thinand symmetric membrane, especially when polymeric membranesare used, and therefore some form of support layer is necessary toprovide mechanical strength [7,37]. To understand how the mem-brane’s asymmetric design influences FO performance, experi-ments were conducted with different membrane orientationsusing both the CTA-FO membrane and the TFC-RO membrane withvarious DS concentrations. Both were compared in FO mode and inPRO mode. FO mode of operation refers to the membrane orienta-tion in which the support layer faces the DS and the active layer
Fig. 1. Comparative SEM images of the cross section of the three membranes (a) Woongjin TFC-FO membrane, (b) CTA-FO membrane [38] and (c) TFC-RO membrane [35].
488 S. Phuntsho et al. / Chemical Engineering Journal 231 (2013) 484–496
faces the FS. The other orientation to FO mode is the PRO mode ofmembrane orientation.
Table 1 also shows the influences of membrane orientation onthe performance of the FO process using the three membranes.The water flux in PRO mode of operation was observed to be com-paratively higher than the FO mode of operation for all three mem-branes both with DI and BW as the FS. Higher water flux is alwaysbeen obtained in PRO mode than in FO mode of operation[15,32,39]. The difference in water fluxes in the FO mode andPRO mode is because of the difference in the membrane structuralresistance depending on which sides of the solutions the supportlayer of the membrane is oriented. In the FO mode of operation,the DS faces the porous support layer of the membrane, whilethe feed faces the active layer. The incoming water flux from thefeed side dilutes the DS at the membrane’s surface and withinthe membrane’s porous support layer, reducing the net osmoticpressure at the membrane’s surface and lowering the water flux.Since the osmotic pressure of the DS at the membrane boundarylayer is crucial to FO process, dilutive ICP severely affects waterflux in the FO process. When BW is used as the feed, a concentra-tive ECP occurs on the active layer side further reducing the effec-tive driving force and therefore the water flux which explains whywater flux with BW as feed is slightly lower than DI water as feed.When DI is used as the FS in FO mode, concentrative ECP is absenton the active layer side of the membrane.
When the process is operated in PRO mode, the CP phenomenonreverses. Since the DS in PRO mode faces the membrane activelayer, the phenomenon is dilutive ECP, which can be mitigatedby the crossflow shear provided on the membrane surface.Although concentrative ICP occurs on the feed side of the mem-brane, its effect is less severe than dilutive ICP and this is the rea-son why water flux in PRO mode is higher than in FO mode.Although the performance of the TFC-RO membrane in PRO modewas higher than in FO mode, its flux is still lower than 1.0 L m&2 -h&1, which is significantly lower than in the CTA-FO and TFC-FOmembranes. Even though PRO mode results in higher water fluxin the laboratory scale studies under controlled conditions, in apractical situation, PRO mode is not suitable for desalination be-cause the membrane is prone to severe membrane fouling as theporous support layer is directly exposed to the feed water contain-ing scaling and fouling species [18,40,41].
In the PRO mode of operation, the draw solute concentration atthe membrane surface is higher than it is in FO mode operation,which generates higher driving force and consequently higherwater flux. However, the presence of higher draw solute concentra-tion at the membrane surface in PRO mode also leads to higher RSFand SRSF as evident from Table 1, with both the CTA-FO mem-branes. The RSF and SRSF for the TFC-RO membrane in PRO modewas, however, lower than in FO mode, probably because the per-centage water flux increase in PRO mode ()45% with DI) for theRO membrane was much higher than the CTA FO membrane(25% with DI).
Comparing the water fluxes in the FO mode and the PRO mode,the water flux in PRO mode for CTA-FO, TFC-RO and TFC-FO mem-branes were about 25%, 45% and 35% higher than the fluxes in FOmode respectively. The lower percentage of water flux in the PROmode than the FO mode for CTA-FO membranes in comparisonto the TFC-RO and TFC-FO membranes is probably an indicationthat, the CTA-FO membrane is more symmetric than the othertwo membranes.
The comparative studies on water and reverse solute flux forthe three membranes indicate that, the performances of the FOmembrane can be enhanced by improving the structural propertiesof the membrane support layer such as by increasing the porosityand reducing the thickness of the membrane support layer. A highflux membrane is the ultimate goal of many researchers as this will
help increase the overall process efficiency and ultimately reducethe capital and operational cost of the FO desalination plant. How-ever, it is also important that the mechanical strength of the mem-brane must also be considered while designing the highperformance membrane. Although, synthesizing high performanceFO membrane is still a trade-off amongst the water flux, salt rejec-tion and the membrane mechanical strength nevertheless, furthereffort must be focused on improving the mechanical strength ofthe support layer such as using alternate support materials.
3.1.4. Comparison of the Woongjin’s new TFC-FO membranes withother recently reported TFC-FO membranes
Recently, several groups have reported the synthesis of highperformance flat-sheet and hollow fiber membranes for FO and os-motic power applications. So far, the best performing polyamidebased flat-sheet TFC FO membrane was reported by Tiraferriet al. [36] with a water flux of 25 L m&2 h&1 (using 1.0 M NaCl asDS and DI water as FS in FO mode) and hollow fiber TFC FO mem-brane with 33 L m&2 h&1 [42] (using 0.5 M NaCl as DS and DI wateras FS in PRO mode). The water flux for TFC-FO membrane used inthis study were 27.98 and 37.73 L m&2 h&1 in FO mode and PROmode respectively using 1 M KCl as DS and DI as FS Table 1). Theseresults indicate that, this TFC-FO membrane performs significantlymuch better than the recently reported TFC-FO membranes in FOprocess. This is probably because of the lower total thickness ofthis TFC-FO membrane compared to other recently reported TFC-FO membranes. Moreover, the support structure of this TFC-FOmembrane appears to have larger finger-like macro-voids andtherefore is comparatively more porous than the recently reportedTFC-FO membranes [34–37]. These larger macro-voids also explainwhy this non-optimized TFC-FO membrane shows weak mechani-cal strength.
It must be therefore mentioned that, the currently synthesizedTFC-FO membrane still needs further optimization to improve themechanical strength of the membrane to withstand a slighthydraulic pressure that may be developed while providing ade-quate crossflow velocity. It is important to note here that, KClwas used as a draw solute for assessing the performance of theTFC-FO membrane in this study whereas NaCl was used in otherstudies. Based on the available literature, the performances ofKCl and NaCl as draw solutes are comparable with KCl performingonly slightly better than the NaCl [43].
3.2. Influence of draw solution properties on the performance of FOprocess
In this section, the influences of the DS properties were investi-gated on the performance of FO desalination process using CTA FOmembrane. The DS properties mainly included different types ofDS and the influence of DS concentration on the FO performance.Five different types of draw solutes were investigated and they in-clude KCl (monovalent ions), CaCl2 (divalent cation and monova-lent anion), Na2SO4 (monovalent cation and divalent anion),MgSO4 (divalent ions) and urea (neutral compound).
3.2.1. Influence of the types of draw solutes on the performance of FOprocess
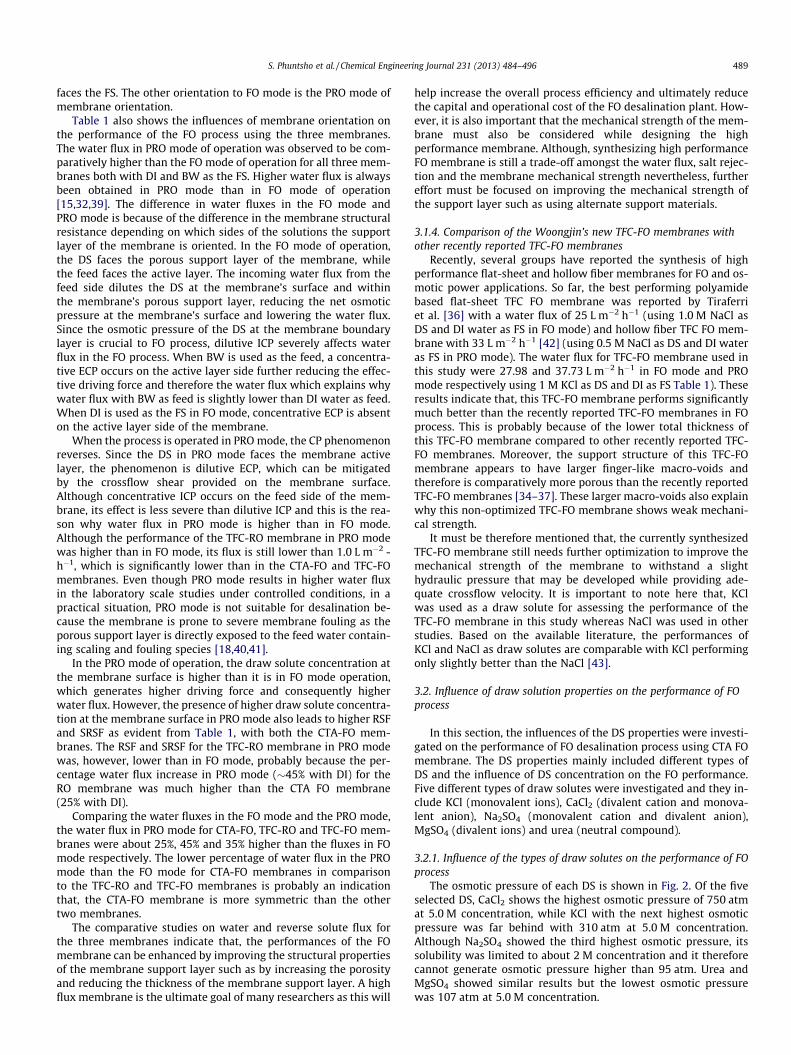
The osmotic pressure of each DS is shown in Fig. 2. Of the fiveselected DS, CaCl2 shows the highest osmotic pressure of 750 atmat 5.0 M concentration, while KCl with the next highest osmoticpressure was far behind with 310 atm at 5.0 M concentration.Although Na2SO4 showed the third highest osmotic pressure, itssolubility was limited to about 2 M concentration and it thereforecannot generate osmotic pressure higher than 95 atm. Urea andMgSO4 showed similar results but the lowest osmotic pressurewas 107 atm at 5.0 M concentration.
S. Phuntsho et al. / Chemical Engineering Journal 231 (2013) 484–496 489
Figs. 3 and 4 show the influence of the types of DS, their osmoticpressure on the water flux and the performance ratio (PR) using DIand BW as the FS. PR is defined as the ratio of the experimental fluxto the theoretical flux (determined based on the net bulk osmoticpressure using Eq. (2)). PR represents the percentage of the bulk os-motic pressure effectively available for generating water flux in the
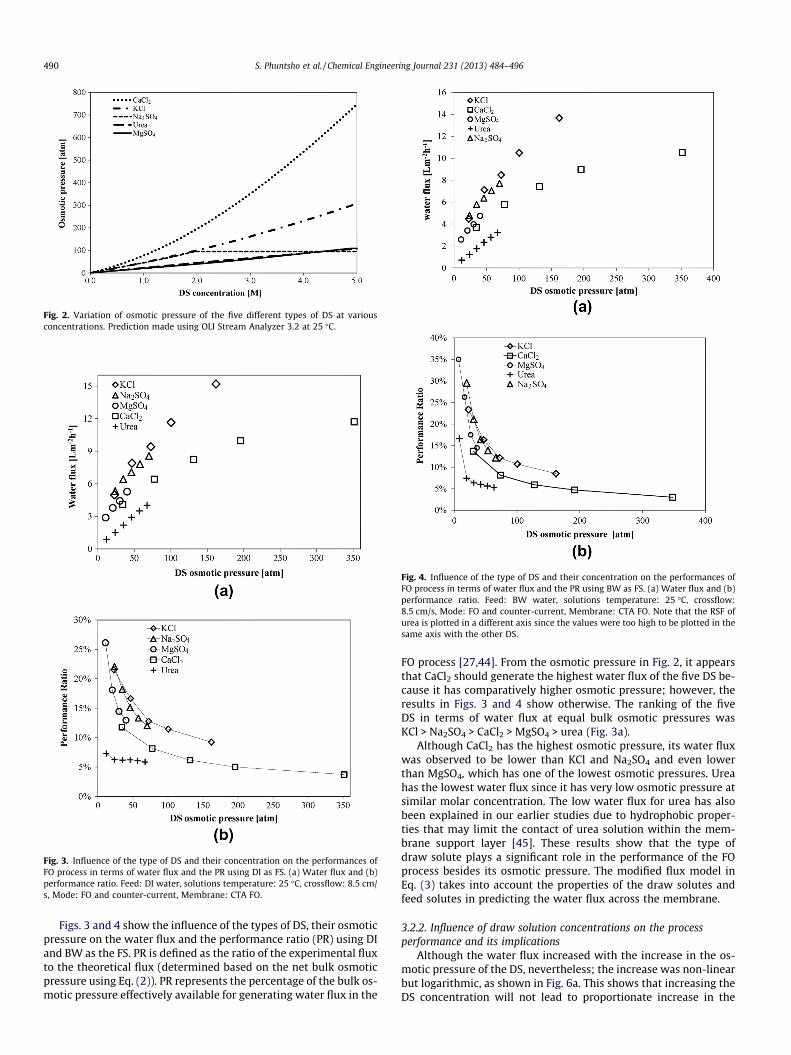
FO process [27,44]. From the osmotic pressure in Fig. 2, it appearsthat CaCl2 should generate the highest water flux of the five DS be-cause it has comparatively higher osmotic pressure; however, theresults in Figs. 3 and 4 show otherwise. The ranking of the fiveDS in terms of water flux at equal bulk osmotic pressures wasKCl > Na2SO4 > CaCl2 > MgSO4 > urea (Fig. 3a).
Although CaCl2 has the highest osmotic pressure, its water fluxwas observed to be lower than KCl and Na2SO4 and even lowerthan MgSO4, which has one of the lowest osmotic pressures. Ureahas the lowest water flux since it has very low osmotic pressure atsimilar molar concentration. The low water flux for urea has alsobeen explained in our earlier studies due to hydrophobic proper-ties that may limit the contact of urea solution within the mem-brane support layer [45]. These results show that the type ofdraw solute plays a significant role in the performance of the FOprocess besides its osmotic pressure. The modified flux model inEq. (3) takes into account the properties of the draw solutes andfeed solutes in predicting the water flux across the membrane.
3.2.2. Influence of draw solution concentrations on the processperformance and its implications
Although the water flux increased with the increase in the os-motic pressure of the DS, nevertheless; the increase was non-linearbut logarithmic, as shown in Fig. 6a. This shows that increasing theDS concentration will not lead to proportionate increase in the
Fig. 2. Variation of osmotic pressure of the five different types of DS at variousconcentrations. Prediction made using OLI Stream Analyzer 3.2 at 25 "C.
Fig. 3. Influence of the type of DS and their concentration on the performances ofFO process in terms of water flux and the PR using DI as FS. (a) Water flux and (b)performance ratio. Feed: DI water, solutions temperature: 25 "C, crossflow: 8.5 cm/s, Mode: FO and counter-current, Membrane: CTA FO.
Fig. 4. Influence of the type of DS and their concentration on the performances ofFO process in terms of water flux and the PR using BW as FS. (a) Water flux and (b)performance ratio. Feed: BW water, solutions temperature: 25 "C, crossflow:8.5 cm/s, Mode: FO and counter-current, Membrane: CTA FO. Note that the RSF ofurea is plotted in a different axis since the values were too high to be plotted in thesame axis with the other DS.
490 S. Phuntsho et al. / Chemical Engineering Journal 231 (2013) 484–496
water flux, as reported in other studies [46]. When the DS concen-tration is increased, the net osmotic pressure increases, generatinghigher water fluxes temporarily but, the increased incoming waterflux causes enhanced dilutive ICP within the membrane supportlayer, thereby keeping the overall gain in water lower. At higherDS concentrations, the water flux itself acts as a limiting factorand reduces the performance of the DS, as shown by the perfor-mance ratio (PR) of the water flux presented in Fig. 3b. The rankingof the PR of the DS was KCl > Na2SO4 > MgSO4 > CaCl2 > urea. Theperformance ratio or PR decreased rapidly with the increase inthe osmotic pressure of the DS before finally reaching flat at higherosmotic pressure. This indicates that no matter how high the os-motic pressure a DS can generate, it will not be able to produceproportionate water flux by the FO process.
To illustrate further, CaCl2 at 350 atm ()3.0 M) has a water fluxof 12 L m&2 h&1; however, if CaCl2 of 750 atm (5.0 M) is used as theDS, the water flux would increase to only 14 L m&2 h&1 (estimatedbased on the logarithmic correlation for CaCl2). This is a meager17% increase in water flux compared to the 114% increase in the os-motic pressure of the CaCl2 DS. In fact the PR of CaCl2 at 350 atmwas only about 4% and may further decrease at higher concentra-tion. These results indicate that, beyond a certain level of concen-tration for a particular DS, further increase in DS concentration willincrease the pumping energy because the viscosity of the DS willincrease. For example, the viscosity of CaCl2 at 5 M (3.748 cP) istwice as high as the viscosity at 3.0 M concentration (1.960 cP)and therefore the pumping energy required at 5.0 M concentrationwill be significantly higher because pumping energy depends onfluid viscosity. There could be also other implications for the mem-brane process when a highly concentrated DS is used, such asmembrane stability due to chemical exposure to increased ionicconcentrations.
Fig. 4 shows the performance of the five DS in terms of waterflux and PR using BW as feed. The ranking of the water flux wassimilar to the results obtained in Fig. 3a with DI as feed; however,the PR varied slightly when BW was used as feed (Fig. 4b). The PRwas higher at lower DS osmotic pressure, while at higher osmoticpressure, the PR was lower than the DI water. This difference in PRis due to the coupled influences of dilutive ICP on the DS and con-centrative ECP on the FS. In addition, the dilutive and concentrativeCP modulus are lower when low DS concentrations are used be-cause of the comparatively lower flux attained [13,45].
The above results indicate that, the selection of suitable drawsolutes is important for several reasons. Draw solutes that generatehigher water flux at lower concentrations are preferable as thiscould contribute to significant cost savings in terms of both capitaland operation costs. However, other important issue that deter-mines the choice of the draw solutes and not mentioned in thisstudy is the end use of the product water after FO desalination.For potable purpose, the water and the draw solutes must be sep-arated which will require post-treatment process and thereforeadditional cost.
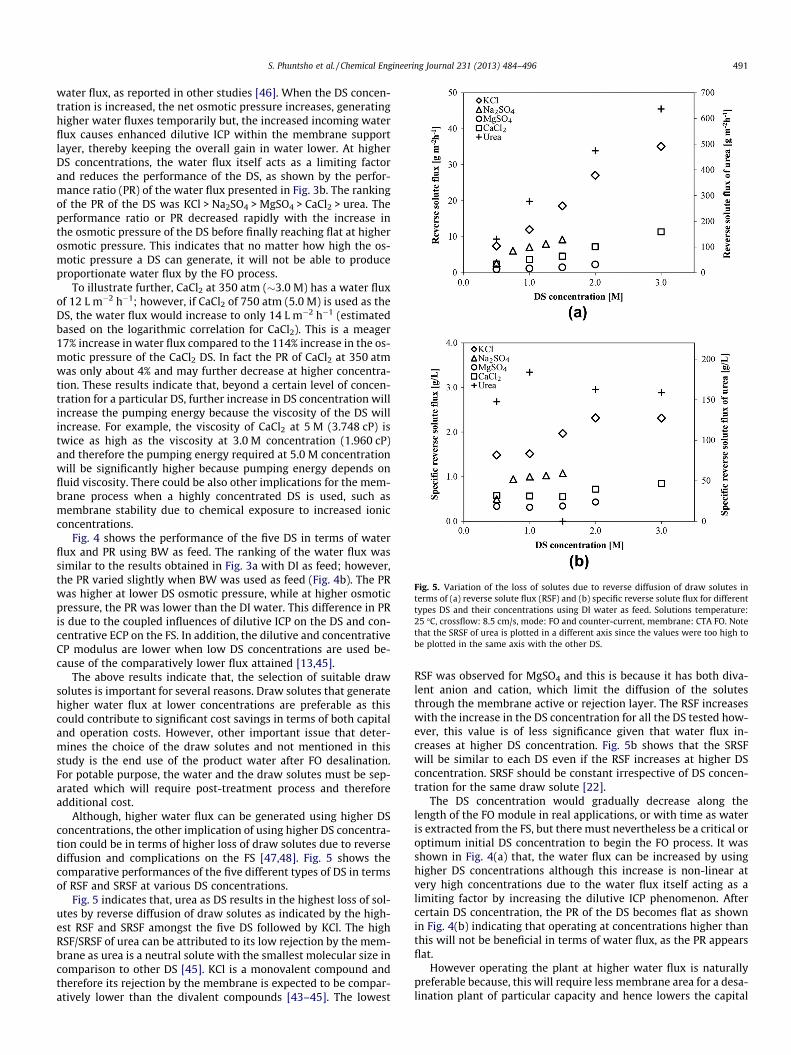
Although, higher water flux can be generated using higher DSconcentrations, the other implication of using higher DS concentra-tion could be in terms of higher loss of draw solutes due to reversediffusion and complications on the FS [47,48]. Fig. 5 shows thecomparative performances of the five different types of DS in termsof RSF and SRSF at various DS concentrations.
Fig. 5 indicates that, urea as DS results in the highest loss of sol-utes by reverse diffusion of draw solutes as indicated by the high-est RSF and SRSF amongst the five DS followed by KCl. The highRSF/SRSF of urea can be attributed to its low rejection by the mem-brane as urea is a neutral solute with the smallest molecular size incomparison to other DS [45]. KCl is a monovalent compound andtherefore its rejection by the membrane is expected to be compar-atively lower than the divalent compounds [43–45]. The lowest
RSF was observed for MgSO4 and this is because it has both diva-lent anion and cation, which limit the diffusion of the solutesthrough the membrane active or rejection layer. The RSF increaseswith the increase in the DS concentration for all the DS tested how-ever, this value is of less significance given that water flux in-creases at higher DS concentration. Fig. 5b shows that the SRSFwill be similar to each DS even if the RSF increases at higher DSconcentration. SRSF should be constant irrespective of DS concen-tration for the same draw solute [22].
The DS concentration would gradually decrease along thelength of the FO module in real applications, or with time as wateris extracted from the FS, but there must nevertheless be a critical oroptimum initial DS concentration to begin the FO process. It wasshown in Fig. 4(a) that, the water flux can be increased by usinghigher DS concentrations although this increase is non-linear atvery high concentrations due to the water flux itself acting as alimiting factor by increasing the dilutive ICP phenomenon. Aftercertain DS concentration, the PR of the DS becomes flat as shownin Fig. 4(b) indicating that operating at concentrations higher thanthis will not be beneficial in terms of water flux, as the PR appearsflat.
However operating the plant at higher water flux is naturallypreferable because, this will require less membrane area for a desa-lination plant of particular capacity and hence lowers the capital
Fig. 5. Variation of the loss of solutes due to reverse diffusion of draw solutes interms of (a) reverse solute flux (RSF) and (b) specific reverse solute flux for differenttypes DS and their concentrations using DI water as feed. Solutions temperature:25 "C, crossflow: 8.5 cm/s, mode: FO and counter-current, membrane: CTA FO. Notethat the SRSF of urea is plotted in a different axis since the values were too high tobe plotted in the same axis with the other DS.
S. Phuntsho et al. / Chemical Engineering Journal 231 (2013) 484–496 491
cost of the plant. Alternatively, if the plant has a fixed membranearea, operating the membrane at higher flux will reduce the amountof time required to desalinate a fixed volume of water. However,using very high DS concentration could have other negative implica-tions on the design and operation of the desalination plant.
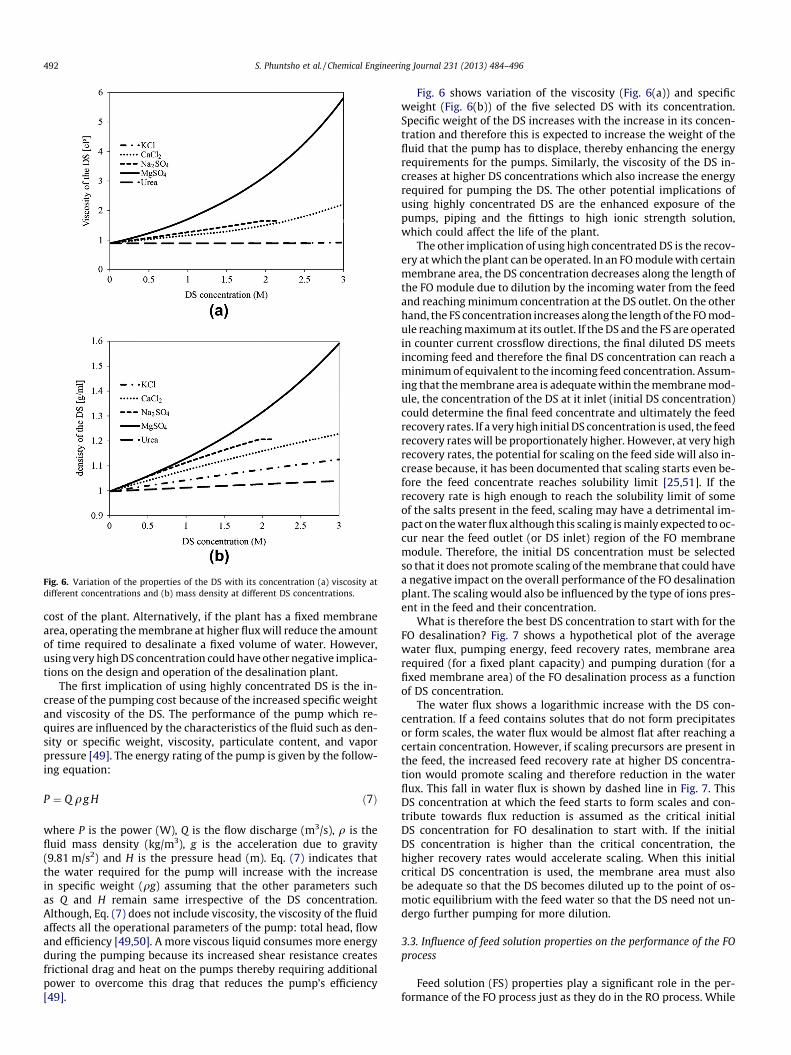
The first implication of using highly concentrated DS is the in-crease of the pumping cost because of the increased specific weightand viscosity of the DS. The performance of the pump which re-quires are influenced by the characteristics of the fluid such as den-sity or specific weight, viscosity, particulate content, and vaporpressure [49]. The energy rating of the pump is given by the follow-ing equation:
P " Q qg H #7$
where P is the power (W), Q is the flow discharge (m3/s), q is thefluid mass density (kg/m3), g is the acceleration due to gravity(9.81 m/s2) and H is the pressure head (m). Eq. (7) indicates thatthe water required for the pump will increase with the increasein specific weight (qg) assuming that the other parameters suchas Q and H remain same irrespective of the DS concentration.Although, Eq. (7) does not include viscosity, the viscosity of the fluidaffects all the operational parameters of the pump: total head, flowand efficiency [49,50]. A more viscous liquid consumes more energyduring the pumping because its increased shear resistance createsfrictional drag and heat on the pumps thereby requiring additionalpower to overcome this drag that reduces the pump’s efficiency[49].
Fig. 6 shows variation of the viscosity (Fig. 6(a)) and specificweight (Fig. 6(b)) of the five selected DS with its concentration.Specific weight of the DS increases with the increase in its concen-tration and therefore this is expected to increase the weight of thefluid that the pump has to displace, thereby enhancing the energyrequirements for the pumps. Similarly, the viscosity of the DS in-creases at higher DS concentrations which also increase the energyrequired for pumping the DS. The other potential implications ofusing highly concentrated DS are the enhanced exposure of thepumps, piping and the fittings to high ionic strength solution,which could affect the life of the plant.
The other implication of using high concentrated DS is the recov-ery at which the plant can be operated. In an FO module with certainmembrane area, the DS concentration decreases along the length ofthe FO module due to dilution by the incoming water from the feedand reaching minimum concentration at the DS outlet. On the otherhand, the FS concentration increases along the length of the FO mod-ule reaching maximum at its outlet. If the DS and the FS are operatedin counter current crossflow directions, the final diluted DS meetsincoming feed and therefore the final DS concentration can reach aminimum of equivalent to the incoming feed concentration. Assum-ing that the membrane area is adequate within the membrane mod-ule, the concentration of the DS at it inlet (initial DS concentration)could determine the final feed concentrate and ultimately the feedrecovery rates. If a very high initial DS concentration is used, the feedrecovery rates will be proportionately higher. However, at very highrecovery rates, the potential for scaling on the feed side will also in-crease because, it has been documented that scaling starts even be-fore the feed concentrate reaches solubility limit [25,51]. If therecovery rate is high enough to reach the solubility limit of someof the salts present in the feed, scaling may have a detrimental im-pact on the water flux although this scaling is mainly expected to oc-cur near the feed outlet (or DS inlet) region of the FO membranemodule. Therefore, the initial DS concentration must be selectedso that it does not promote scaling of the membrane that could havea negative impact on the overall performance of the FO desalinationplant. The scaling would also be influenced by the type of ions pres-ent in the feed and their concentration.
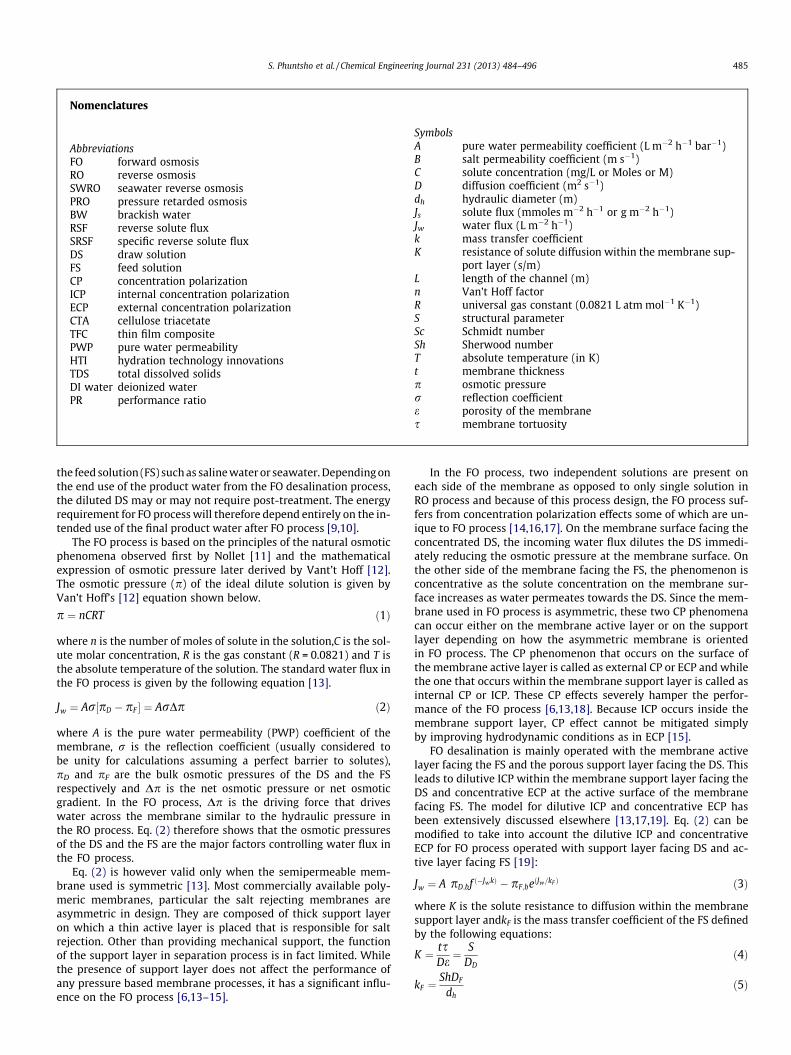
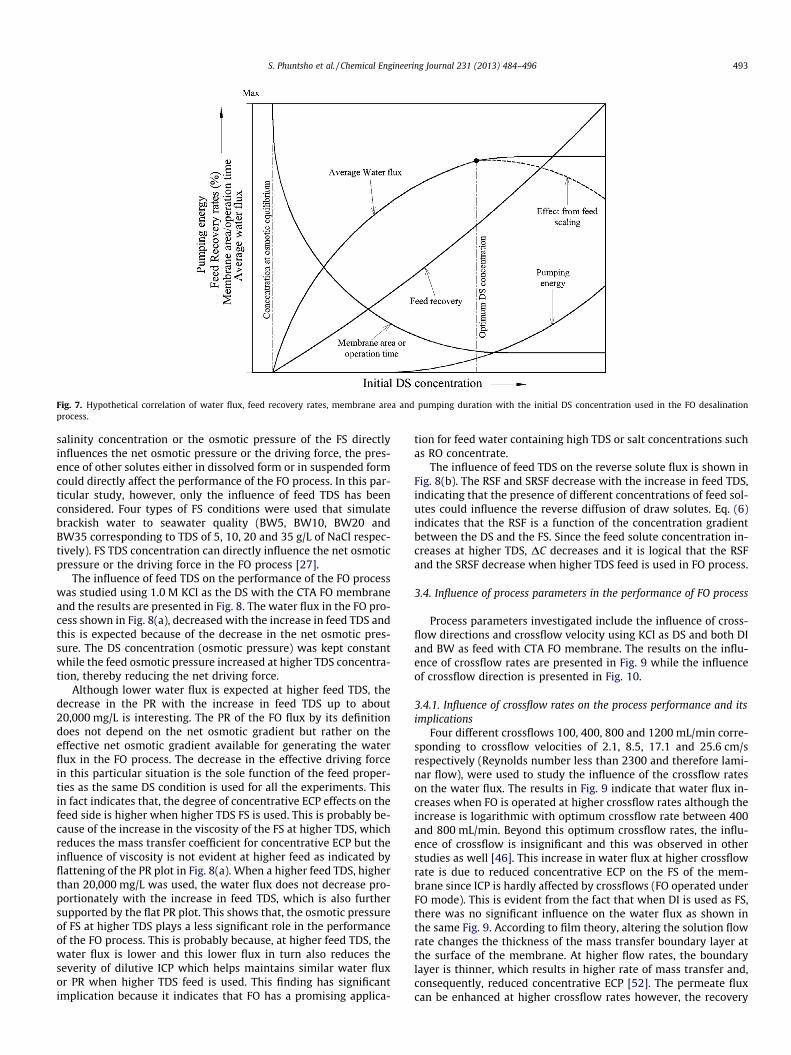
What is therefore the best DS concentration to start with for theFO desalination? Fig. 7 shows a hypothetical plot of the averagewater flux, pumping energy, feed recovery rates, membrane arearequired (for a fixed plant capacity) and pumping duration (for afixed membrane area) of the FO desalination process as a functionof DS concentration.
The water flux shows a logarithmic increase with the DS con-centration. If a feed contains solutes that do not form precipitatesor form scales, the water flux would be almost flat after reaching acertain concentration. However, if scaling precursors are present inthe feed, the increased feed recovery rate at higher DS concentra-tion would promote scaling and therefore reduction in the waterflux. This fall in water flux is shown by dashed line in Fig. 7. ThisDS concentration at which the feed starts to form scales and con-tribute towards flux reduction is assumed as the critical initialDS concentration for FO desalination to start with. If the initialDS concentration is higher than the critical concentration, thehigher recovery rates would accelerate scaling. When this initialcritical DS concentration is used, the membrane area must alsobe adequate so that the DS becomes diluted up to the point of os-motic equilibrium with the feed water so that the DS need not un-dergo further pumping for more dilution.
3.3. Influence of feed solution properties on the performance of the FOprocess
Feed solution (FS) properties play a significant role in the per-formance of the FO process just as they do in the RO process. While
Fig. 6. Variation of the properties of the DS with its concentration (a) viscosity atdifferent concentrations and (b) mass density at different DS concentrations.
492 S. Phuntsho et al. / Chemical Engineering Journal 231 (2013) 484–496
salinity concentration or the osmotic pressure of the FS directlyinfluences the net osmotic pressure or the driving force, the pres-ence of other solutes either in dissolved form or in suspended formcould directly affect the performance of the FO process. In this par-ticular study, however, only the influence of feed TDS has beenconsidered. Four types of FS conditions were used that simulatebrackish water to seawater quality (BW5, BW10, BW20 andBW35 corresponding to TDS of 5, 10, 20 and 35 g/L of NaCl respec-tively). FS TDS concentration can directly influence the net osmoticpressure or the driving force in the FO process [27].
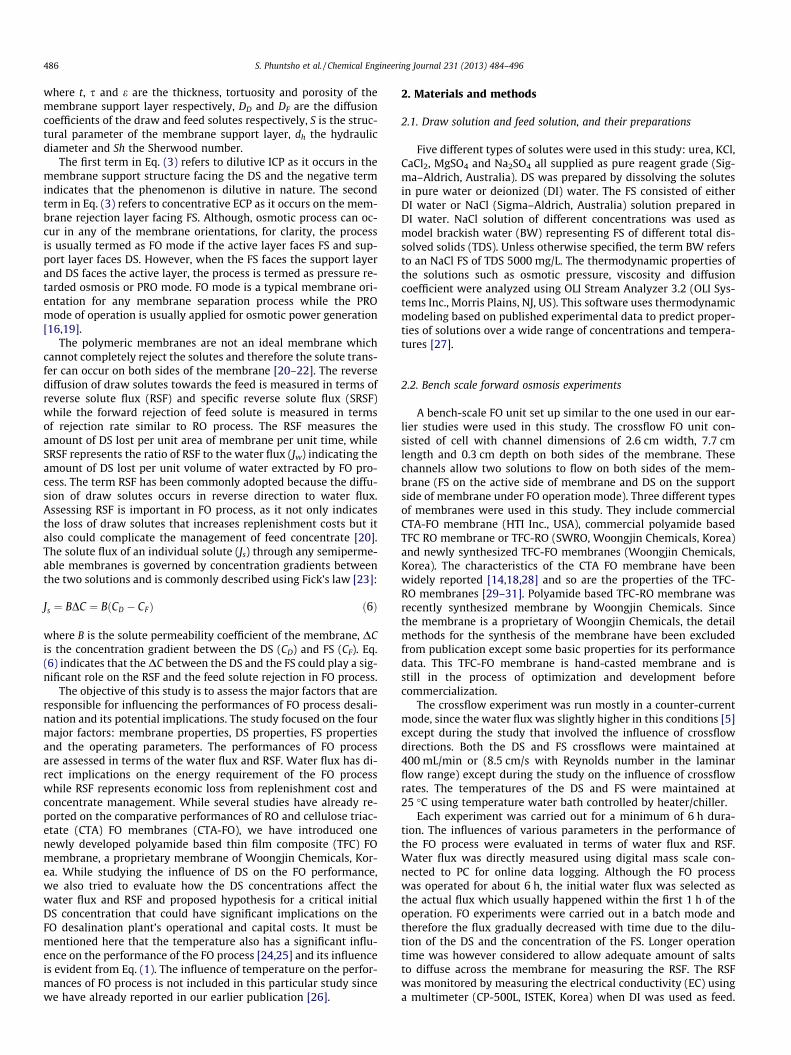
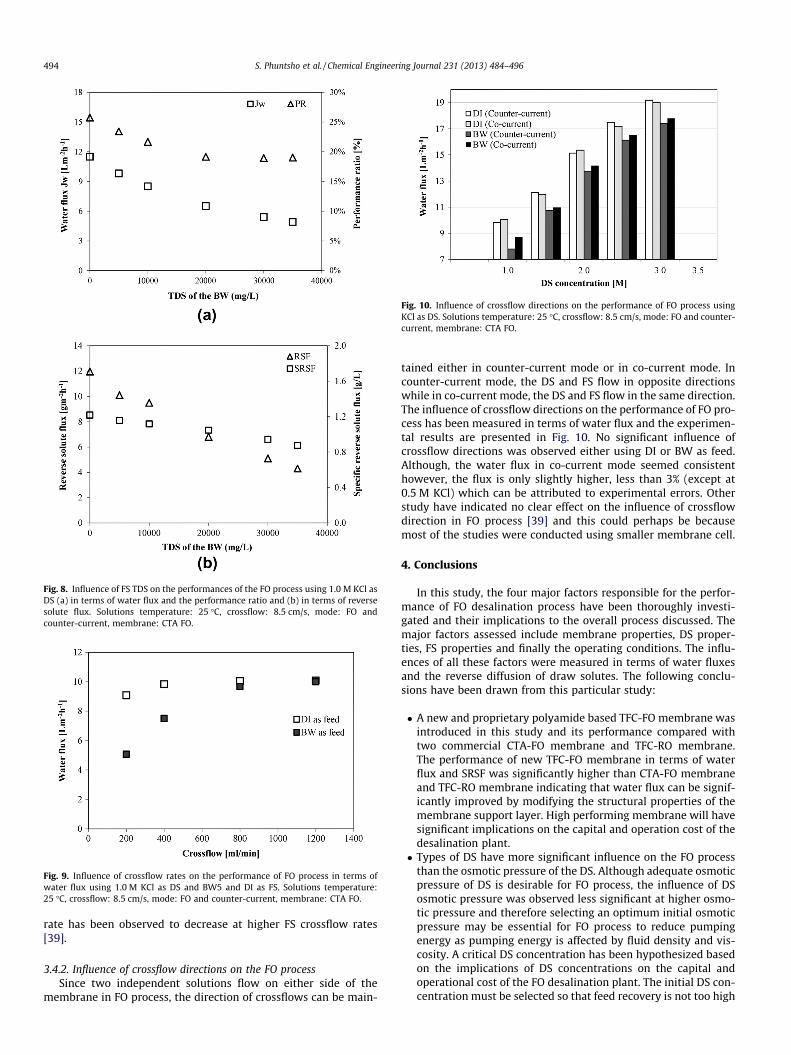
The influence of feed TDS on the performance of the FO processwas studied using 1.0 M KCl as the DS with the CTA FO membraneand the results are presented in Fig. 8. The water flux in the FO pro-cess shown in Fig. 8(a), decreased with the increase in feed TDS andthis is expected because of the decrease in the net osmotic pres-sure. The DS concentration (osmotic pressure) was kept constantwhile the feed osmotic pressure increased at higher TDS concentra-tion, thereby reducing the net driving force.
Although lower water flux is expected at higher feed TDS, thedecrease in the PR with the increase in feed TDS up to about20,000 mg/L is interesting. The PR of the FO flux by its definitiondoes not depend on the net osmotic gradient but rather on theeffective net osmotic gradient available for generating the waterflux in the FO process. The decrease in the effective driving forcein this particular situation is the sole function of the feed proper-ties as the same DS condition is used for all the experiments. Thisin fact indicates that, the degree of concentrative ECP effects on thefeed side is higher when higher TDS FS is used. This is probably be-cause of the increase in the viscosity of the FS at higher TDS, whichreduces the mass transfer coefficient for concentrative ECP but theinfluence of viscosity is not evident at higher feed as indicated byflattening of the PR plot in Fig. 8(a). When a higher feed TDS, higherthan 20,000 mg/L was used, the water flux does not decrease pro-portionately with the increase in feed TDS, which is also furthersupported by the flat PR plot. This shows that, the osmotic pressureof FS at higher TDS plays a less significant role in the performanceof the FO process. This is probably because, at higher feed TDS, thewater flux is lower and this lower flux in turn also reduces theseverity of dilutive ICP which helps maintains similar water fluxor PR when higher TDS feed is used. This finding has significantimplication because it indicates that FO has a promising applica-
tion for feed water containing high TDS or salt concentrations suchas RO concentrate.
The influence of feed TDS on the reverse solute flux is shown inFig. 8(b). The RSF and SRSF decrease with the increase in feed TDS,indicating that the presence of different concentrations of feed sol-utes could influence the reverse diffusion of draw solutes. Eq. (6)indicates that the RSF is a function of the concentration gradientbetween the DS and the FS. Since the feed solute concentration in-creases at higher TDS, DC decreases and it is logical that the RSFand the SRSF decrease when higher TDS feed is used in FO process.
3.4. Influence of process parameters in the performance of FO process
Process parameters investigated include the influence of cross-flow directions and crossflow velocity using KCl as DS and both DIand BW as feed with CTA FO membrane. The results on the influ-ence of crossflow rates are presented in Fig. 9 while the influenceof crossflow direction is presented in Fig. 10.
3.4.1. Influence of crossflow rates on the process performance and itsimplications
Four different crossflows 100, 400, 800 and 1200 mL/min corre-sponding to crossflow velocities of 2.1, 8.5, 17.1 and 25.6 cm/srespectively (Reynolds number less than 2300 and therefore lami-nar flow), were used to study the influence of the crossflow rateson the water flux. The results in Fig. 9 indicate that water flux in-creases when FO is operated at higher crossflow rates although theincrease is logarithmic with optimum crossflow rate between 400and 800 mL/min. Beyond this optimum crossflow rates, the influ-ence of crossflow is insignificant and this was observed in otherstudies as well [46]. This increase in water flux at higher crossflowrate is due to reduced concentrative ECP on the FS of the mem-brane since ICP is hardly affected by crossflows (FO operated underFO mode). This is evident from the fact that when DI is used as FS,there was no significant influence on the water flux as shown inthe same Fig. 9. According to film theory, altering the solution flowrate changes the thickness of the mass transfer boundary layer atthe surface of the membrane. At higher flow rates, the boundarylayer is thinner, which results in higher rate of mass transfer and,consequently, reduced concentrative ECP [52]. The permeate fluxcan be enhanced at higher crossflow rates however, the recovery
Fig. 7. Hypothetical correlation of water flux, feed recovery rates, membrane area and pumping duration with the initial DS concentration used in the FO desalinationprocess.
S. Phuntsho et al. / Chemical Engineering Journal 231 (2013) 484–496 493
rate has been observed to decrease at higher FS crossflow rates[39].
3.4.2. Influence of crossflow directions on the FO processSince two independent solutions flow on either side of the
membrane in FO process, the direction of crossflows can be main-
tained either in counter-current mode or in co-current mode. Incounter-current mode, the DS and FS flow in opposite directionswhile in co-current mode, the DS and FS flow in the same direction.The influence of crossflow directions on the performance of FO pro-cess has been measured in terms of water flux and the experimen-tal results are presented in Fig. 10. No significant influence ofcrossflow directions was observed either using DI or BW as feed.Although, the water flux in co-current mode seemed consistenthowever, the flux is only slightly higher, less than 3% (except at0.5 M KCl) which can be attributed to experimental errors. Otherstudy have indicated no clear effect on the influence of crossflowdirection in FO process [39] and this could perhaps be becausemost of the studies were conducted using smaller membrane cell.
4. Conclusions
In this study, the four major factors responsible for the perfor-mance of FO desalination process have been thoroughly investi-gated and their implications to the overall process discussed. Themajor factors assessed include membrane properties, DS proper-ties, FS properties and finally the operating conditions. The influ-ences of all these factors were measured in terms of water fluxesand the reverse diffusion of draw solutes. The following conclu-sions have been drawn from this particular study:
! A new and proprietary polyamide based TFC-FO membrane wasintroduced in this study and its performance compared withtwo commercial CTA-FO membrane and TFC-RO membrane.The performance of new TFC-FO membrane in terms of waterflux and SRSF was significantly higher than CTA-FO membraneand TFC-RO membrane indicating that water flux can be signif-icantly improved by modifying the structural properties of themembrane support layer. High performing membrane will havesignificant implications on the capital and operation cost of thedesalination plant.! Types of DS have more significant influence on the FO process
than the osmotic pressure of the DS. Although adequate osmoticpressure of DS is desirable for FO process, the influence of DSosmotic pressure was observed less significant at higher osmo-tic pressure and therefore selecting an optimum initial osmoticpressure may be essential for FO process to reduce pumpingenergy as pumping energy is affected by fluid density and vis-cosity. A critical DS concentration has been hypothesized basedon the implications of DS concentrations on the capital andoperational cost of the FO desalination plant. The initial DS con-centration must be selected so that feed recovery is not too high
Fig. 8. Influence of FS TDS on the performances of the FO process using 1.0 M KCl asDS (a) in terms of water flux and the performance ratio and (b) in terms of reversesolute flux. Solutions temperature: 25 "C, crossflow: 8.5 cm/s, mode: FO andcounter-current, membrane: CTA FO.
Fig. 9. Influence of crossflow rates on the performance of FO process in terms ofwater flux using 1.0 M KCl as DS and BW5 and DI as FS. Solutions temperature:25 "C, crossflow: 8.5 cm/s, mode: FO and counter-current, membrane: CTA FO.
Fig. 10. Influence of crossflow directions on the performance of FO process usingKCl as DS. Solutions temperature: 25 "C, crossflow: 8.5 cm/s, mode: FO and counter-current, membrane: CTA FO.
494 S. Phuntsho et al. / Chemical Engineering Journal 231 (2013) 484–496
that can accelerate scaling of membrane. At this point the totalmembrane area in the module must also be adequate so that thefinal diluted DS at the outlet reaches osmotic equilibrium withthe incoming feed concentration.! TDS of the feed plays a significant role in the performance of FO
process however the influence of feed TDS was less significantfor feed TDS higher than 20,000 mg/L indicating that FO has apromising potential for use with high TDS feed water. Although,water flux decreased at higher feed TDS, the RSF and SRSF is alsolower at higher feed TDS. This is significant, as it would helpreduce the loss of draw solutes and replenishment costs whenhigh TDS feed such as seawater is used. However, this studydid not account the influences of other feed properties such asthe presence of fouling and scaling species and other physico-chemical parameters.! For operating parameters, the influence of crossflow velocity
and the crossflow direction on the performance of FO processwas investigated. The influence of crossflow velocity was effec-tive only to certain extent beyond which the influence was notsignificant. The influence of crossflow direction on the FO waterflux could not be clearly established in this study probablybecause of the limitation offered by the small cell dimension.! This study indicates that, by optimizing the various parameters
that relates to the membrane, FS and DS properties and theoperating conditions, it is possible to improve the performanceof FO desalination process.
Acknowledgements
This study was funded by the National Centre for Excellence inDesalination Australia (NCEDA). The authors appreciate HydrationTechnology Inc., USA for supporting with the CTA FO membraneand Woongjin Chemicals, Korea for supporting with the ROmembrane.
References
[1] L.A. Hoover, W.A. Phillip, A. Tiraferri, N.Y. Yip, M. Elimelech, Forward withosmosis: emerging applications for greater sustainability, EnvironmentalScience & Technology 45 (2011) 9824–9830.
[2] M.M. Ling, K.Y. Wang, T.-S. Chung, Highly water-soluble magneticnanoparticles as novel draw solutes in forward osmosis for water reuse,Industrial & Engineering Chemistry Research 49 (2010) 5869–5876.
[3] R.L. McGinnis, M. Elimelech, Global challenges in energy and water supply: thepromise of engineered osmosis, Environmental Science & Technology 42(2008) 8625–8629.
[4] S. Zhao, L. Zou, C.Y. Tang, D. Mulcahy, Recent developments in forwardosmosis: opportunities and challenges, Journal of Membrane Science 396(2012) 1–21.
[5] B. Mi, M. Elimelech, Chemical and physical aspects of organic fouling offorward osmosis membranes, Journal of Membrane Science 320 (2008) 292–302.
[6] H.Y. Ng, W. Tang, W.S. Wong, Performance of forward (direct) osmosis process:membrane structure and transport phenomenon, Environmental Science &Technology 40 (2006) 2408–2413.
[7] S. Zhang, K.Y. Wang, T.-S. Chung, H. Chen, Y.C. Jean, G. Amy, Well-constructedcellulose acetate membranes for forward osmosis: minimized internalconcentration polarization with an ultra-thin selective layer, Journal ofMembrane Science 360 (2010) 522–535.
[8] w.C.L. Lay, T.H. Chong, C.Y. Tang, A.G. Fane, J. Zhang, Y. Liu, Fouling propensityof forward osmosis: investigation of the slower flux decline phenomenon,Water Science and Technology 61 (2010) 927–936.
[9] S. Phuntsho, S. Hong, M. Elimelech, H.K. Shon, Forward osmosis desalination ofbrackish groundwater: meeting water quality requirements for fertigation byintegrating nanofiltration, Journal of Membrane Science 436 (2013) 1–15.
[10] S. Phuntsho, H.K. Shon, S.K. Hong, S.Y. Lee, S. Vigneswaran, J. Kandasamy,Fertiliser drawn forward osmosis desalination: the concept, performance andlimitations for fertigation, Reviews in Environmental Science Biotechnology 11(2012) 147–168.
[11] J.A. Nollet, Lecons de physique experimentale, Hippolyte-Louis Guerin andLouis-Francios Delatour, Paris, 1748.
[12] J.H. Van’t Hoff, Die Rolle der osmotischen Druckes in der Analogie zwischenLösungen und Gasen, Zeitschrift fuer Physikalische Chemie 1 (1887) 481–508.
[13] J.R. McCutcheon, M. Elimelech, Influence of concentrative and dilutive internalconcentration polarization on flux behavior in forward osmosis, Journal ofMembrane Science 284 (2006) 237–247.
[14] T.Y. Cath, A.E. Childress, M. Elimelech, Forward osmosis: principles,applications, and recent developments: review, Journal of Membrane Science281 (2006) 70–87.
[15] G.T. Gray, J.R. McCutcheon, M. Elimelech, Internal concentration polarizationin forward osmosis: role of membrane orientation, Desalination 197 (2006) 1–8.
[16] J.R. McCutcheon, M. Elimelech, Influence of membrane support layerhydrophobicity on water flux in osmotically driven membrane processes,Journal of Membrane Science 318 (2008) 458–466.
[17] C.H. Tan, H.Y. Ng, Modified models to predict flux behavior in forward osmosisin consideration of external and internal concentration polarizations, Journalof Membrane Science 324 (2008) 209–219.
[18] C.Y. Tang, Q. She, W.C.L. Lay, R. Wang, A.G. Fane, Coupled effects of internalconcentration polarization and fouling on flux behavior of forward osmosismembranes during humic acid filtration, Journal of Membrane Science 354(2010) 123–133.
[19] J.R. McCutcheon, M. Elimelech, Modelling water flux in forward osmosis:implications for improved membrane design, AIChE Journal 53 (2007) 1736–1744.
[20] N.T. Hancock, T.Y. Cath, Solute coupled diffusion in osmotically drivenmembrane processes, Environmental Science & Technology 43 (2009) 6769–6775.
[21] N.T. Hancock, W.A. Phillip, M. Elimelech, T.Y. Cath, Bidirectional permeation ofelectrolytes in osmotically driven membrane processes, EnvironmentalScience & Technology 45 (2011) 10642–10651.
[22] W.A. Phillip, J.S. Yong, M. Elimelech, Reverse draw solute permeation inforward osmosis: modeling and experiments, Environmental Science &Technology 44 (2010) 5170–5176.
[23] J. Mallevialle, P.E. Odendaal, M.R. Wiesner, Water Treatment MembraneProcesses, McGraw-Hill, 1996.
[24] S.-J. You, X.-H. Wang, M. Zhong, Y.-J. Zhong, C. Yu, N.-Q. Ren, Temperature as afactor affecting transmembrane water flux in forward osmosis: steady-statemodeling and experimental validation, Chemical Engineering Journal 198–199(2012) 52–60.
[25] S. Zhao, L. Zou, Effects of working temperature on separation performance,membrane scaling and cleaning in forward osmosis desalination, Desalination278 (2011) 157–164.
[26] S. Phuntsho, H.K. Shon, S. Vigneswaran, J. Kandasamy, S.K. Hong, S.Y. Lee,Influence of temperature and temperature difference in the performance offorward osmosis desalination process, Journal of Membrane Science 415–416(2012) 734–744.
[27] J.R. McCutcheon, R.L. McGinnis, M. Elimelech, Desalination by ammonia–carbon dioxide forward osmosis: influence of draw and feed solutionconcentrations on process performance, Journal of Membrane Science 278(2006) 114–123.
[28] J.R. McCutcheon, R.L. McGinnis, M. Elimelech, A novel ammonia–carbondioxide forward (direct) osmosis desalination process, Desalination 174 (2005)1–11.
[29] A. Prakash Rao, N.V. Desai, R. Rangarajan, Interfacially synthesized thin filmcomposite RO membranes for seawater desalination, Journal of MembraneScience 124 (1997) 263–272.
[30] D. Li, H. Wang, Recent developments in reverse osmosis desalinationmembranes, Journal of Materials Chemistry 20 (2010) 4551–4566.
[31] H. Zou, Y. Jin, J. Yang, H. Dai, X. Yu, J. Xu, Synthesis and characterization of thinfilm composite reverse osmosis membranes via novel interfacialpolymerization approach, Separation and Purification Technology 72 (2010)256–262.
[32] W.C.L. Lay, J. Zhang, C. Tang, R. Wang, Y. Liu, A.G. Fane, Factors affecting fluxperformance of forward osmosis systems, Journal of Membrane Science 394–395 (2012) 151–168.
[33] W. Tang, H.Y. Ng, Concentration of brine by forward osmosis: performance andinfluence of membrane structure, Desalination 224 (2008) 143–153.
[34] J. Wei, X. Jian, C. Wu, S. Zhang, C. Yan, Influence of polymer structure onthermal stability of composite membranes, Journal of Membrane Science 256(2005) 116–121.
[35] J. Wei, C. Qiu, C.Y. Tang, R. Wang, A.G. Fane, Synthesis and characterization offlat-sheet thin film composite forward osmosis membranes, Journal ofMembrane Science 372 (2011) 292–302.
[36] A. Tiraferri, N.Y. Yip, W.A. Phillip, J.D. Schiffman, M. Elimelech, Relatingperformance of thin-film composite forward osmosis membranes to supportlayer formation and structure, Journal of Membrane Science 367 (2011) 340–352.
[37] N.Y. Yip, A. Tiraferri, W.A. Phillip, J.D. Schiffman, M. Elimelech, Highperformance thin-film composite forward osmosis membrane,Environmental Science & Technology 44 (2010) 3812–3818.
[38] C. Qiu, L. Setiawan, R. Wang, C.Y. Tang, A.G. Fane, High performance flat sheetforward osmosis membrane with an NF-like selective layer on a woven fabricembedded substrate, Desalination 287 (2012) 266–270.
[39] D.H. Jung, J. Lee, D.Y. Kim, Y.G. Lee, M. Park, S. Lee, D.R. Yang, J.H. Kim,Simulation of forward osmosis membrane process: effect of membraneorientation and flow direction of feed and draw solutions, Desalination 277(2011) 83–91.
[40] S. Zhao, L. Zou, D. Mulcahy, Brackish water desalination by a hybrid forwardosmosis–nanofiltration system using divalent draw solute, Desalination 284(2012) 175–181.
S. Phuntsho et al. / Chemical Engineering Journal 231 (2013) 484–496 495
[41] S. Zou, Y. Gu, D. Xiao, C.Y. Tang, The role of physical and chemical parameterson forward osmosis membrane fouling during algae separation, Journal ofMembrane Science 366 (2011) 356–362.
[42] S. Chou, L. Shi, R. Wang, C.Y. Tang, C. Qiu, A.G. Fane, Characteristics andpotential applications of a novel forward osmosis hollow fiber membrane,Desalination 261 (2010) 365–372.
[43] A. Achilli, T.Y. Cath, A.E. Childress, Selection of inorganic-based draw solutionsfor forward osmosis applications, Journal of Membrane Science 364 (2010)233–241.
[44] S. Phuntsho, H.K. Shon, S.K. Hong, S.Y. Lee, S. Vigneswaran, A novel low energyfertilizer driven forward osmosis desalination for direct fertigation: evaluatingthe performance of fertilizer draw solutions, Journal of Membrane Science 375(2011) 172–181.
[45] S. Phuntsho, H.K. Shon, T. Majeed, I. El Salibya, S. Vigneswarana, J. Kandasamy,S. Hong, S. Leeb, Blended fertilisers as draw solutions for fertiliser drawnforward osmosis desalination, Environmental Science & Technology 46 (2012)4567–4575.
[46] Y. Xu, X. Peng, C.Y. Tang, Q.S. Fu, S. Nie, Effect of draw solution concentrationand operating conditions on forward osmosis and pressure retarded osmosis
performance in a spiral wound module, Journal of Membrane Science 348(2010) 298–309.
[47] Q. Ge, J. Su, G.L. Amy, T.-S. Chung, Exploration of polyelectrolytes as drawsolutes in forward osmosis processes, Water Research 46 (2012) 1318–1326.
[48] D. Xiao, C.Y. Tang, J. Zhang, W.C.L. Lay, R. Wang, A.G. Fane, Modeling saltaccumulation in osmotic membrane bioreactors: implications for FOmembrane selection and system operation, Journal of Membrane Science366 (2011) 314–324.
[49] Hydraulic Institute, Improving Pumping System Performance: A Source Bookfor Industry. Second edition ed. 2006: US Department of Energy, Office ofEnergy Efficiency and Renewable Energy, Industrial Technologies Program.
[50] W.-G. Li, Effects of viscosity of fluids on centrifugal pump performance andflow pattern in the impeller, International Journal of Heat and Fluid Flow 21(2000) 207–212.
[51] J.A.M. Meijer, G.M. Van Rosmalen, Solubilities and supersaturations of calciumsulfate and its hydrates in seawater, Desalination 51 (1984) 255–305.
[52] M.C.Y. Wong, K. Martinez, G.Z. Ramon, E.M.V. Hoek, Impacts of operatingconditions and solution chemistry on osmotic membrane structure andperformance, Desalination 287 (2012) 340–349.
496 S. Phuntsho et al. / Chemical Engineering Journal 231 (2013) 484–496
Related Documents