Assessing the Impact Assessing the Impact of Sea Level Rise on Representative of Sea Level Rise on Representative Military Installations in the Military Installations in the Southwestern US Southwestern US Dr. Bart Chadwick Dr. Bart Chadwick SPAWAR Systems Center Pacific SPAWAR Systems Center Pacific SERDP Symposium SERDP Symposium December, 2010 December, 2010

Assessing the Impact of Sea Level Rise on Representative Military Installations in the Southwestern US Dr. Bart Chadwick SPAWAR Systems Center Pacific.
Dec 30, 2015
Welcome message from author
This document is posted to help you gain knowledge. Please leave a comment to let me know what you think about it! Share it to your friends and learn new things together.
Transcript

Assessing the Impact Assessing the Impact of Sea Level Rise on Representative of Sea Level Rise on Representative
Military Installations in the Southwestern USMilitary Installations in the Southwestern US
Dr. Bart ChadwickDr. Bart Chadwick
SPAWAR Systems Center PacificSPAWAR Systems Center Pacific
SERDP SymposiumSERDP Symposium
December, 2010December, 2010

22
Project TeamProject Team
SPAWAR Systems Center PacificSPAWAR Systems Center Pacific – Dr. Bart Chadwick, Dr. Pei- – Dr. Bart Chadwick, Dr. Pei-Fang Wang, Marissa Brand, William WildFang Wang, Marissa Brand, William Wild
TerraCosta Consulting GroupTerraCosta Consulting Group - Dr. Reinhard Flick, Dr. Robert - Dr. Reinhard Flick, Dr. Robert Guza, Dr. William O'Reilly, Dr. Peter Bromirski, Dr. Adam Guza, Dr. William O'Reilly, Dr. Peter Bromirski, Dr. Adam Young, Walter CramptonYoung, Walter Crampton
UCSD: San Diego Supercomputer CenterUCSD: San Diego Supercomputer Center – Dr. John Helly – Dr. John Helly
SDSU: Global Change Research GroupSDSU: Global Change Research Group – Dr. Walt Oechel – Dr. Walt Oechel
US Geological SurveyUS Geological Survey – Dr. Tracy Nishikawa – Dr. Tracy Nishikawa
Army Corps of EngineersArmy Corps of Engineers - Dr . Kevin Knutti - Dr . Kevin Knutti
Moffat-Nichol/BlaylockMoffat-Nichol/Blaylock - Matthew Martinez, Issac Canner - Matthew Martinez, Issac Canner

33
Technical ObjectiveTechnical Objective
Coastal military installation Coastal military installation vulnerabilitiesvulnerabilities
Region-specific SLR scenariosRegion-specific SLR scenarios Southwest USSouthwest US
Evaluate & apply framework Evaluate & apply framework – Naval Base CoronadoNaval Base Coronado– Marine Corps Base Camp Marine Corps Base Camp
PendletonPendleton

44
InstallationsInstallations
Marine Corps Base Camp PendletonMarine Corps Base Camp Pendleton Nation’s premier amphibious training Nation’s premier amphibious training
basebase Occupies approximately 125,000 acres Occupies approximately 125,000 acres
along 17 miles of the southern along 17 miles of the southern California coast California coast
Supports ~41,000 personnelSupports ~41,000 personnel Current value over $3.6 billion Current value over $3.6 billion
Marine Corps Base Camp Pendleton
Naval Base CoronadoNaval Base Coronado Serves a critical mission to arm, repair, Serves a critical mission to arm, repair,
provision, service, train and support provision, service, train and support the U.S. Pacific Fleetthe U.S. Pacific Fleet
Unique combination of airfields, Unique combination of airfields, airspace, training ranges, and airspace, training ranges, and installationsinstallations
Supports 21 squadrons, >220 aircraft, Supports 21 squadrons, >220 aircraft, 3 carriers, and ~36,000 personnel3 carriers, and ~36,000 personnel
55
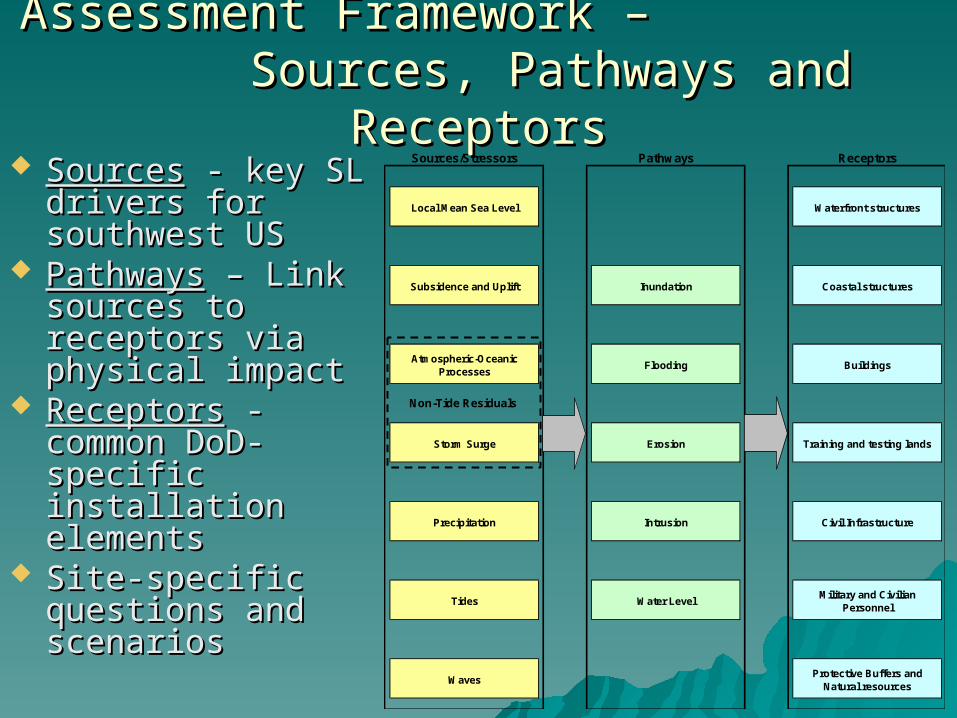
SourcesSources - key SL - key SL drivers for drivers for southwest USsouthwest US
PathwaysPathways – Link – Link sources to sources to receptors via receptors via physical impactphysical impact
ReceptorsReceptors - - common DoD-common DoD-specific installation specific installation elements elements
Site-specific Site-specific questions and questions and scenariosscenarios
Assessment Framework – Assessment Framework – Sources, Pathways and ReceptorsSources, Pathways and Receptors
Sources/Stressors Pathways Receptors
Local Mean Sea Level Waterfront structures
Subsidence and Uplift Inundation Coastal structures
Atmospheric-Oceanic Processes
Flooding Buildings
Storm Surge Erosion Training and testing lands
Precipitation Intrusion Civil Infrastructure
Tides Water LevelMilitary and Civilian
Personnel
WavesProtective Buffers and
Natural resources
Non-Tide Residuals

66 Southwest SL Today
Southwest SL 2100+
Sea Level Today
2 m
3.5 m
Predictable Extreme Tide
Extreme Storm Wave Runup
Maximum Potential Flooding Elevation 6 m
PDO
ENSO
0 mOcean Warming + Ice Melt
Long-Term Risks
Episodic Risks
1.5 m
4 m
Assessment Framework - Conceptual ModelAssessment Framework - Conceptual Model
Flooding, Beach & Cliff Losses - Combinations ofFlooding, Beach & Cliff Losses - Combinations ofMSLR, Climate Variability, Tides, Waves & RunupMSLR, Climate Variability, Tides, Waves & Runup

77
Sea Level Scenarios - MethodSea Level Scenarios - Method
B1,A2 Future Climate Scenarios
CCSM3 Global Climate Model
Wave Watch III Model
CDIP Model
Local Waves & Runup
Local Non-Tide Residuals
Harmonic Tide Model
Predictions
SERDP Prescribed Sea Level for 2100
ACoE Quadratic
Model
Local Mean Sea Level Curves
Local Tides
Groundwater
Protected Bays and Estuaries
Exposed Shorelines
Sea
Lev
el S
ou
rce
Co
mp
on
ents
To
tal
WL

88
Sea Level Scenarios - CombinedSea Level Scenarios - Combined Combine prescribed future Combine prescribed future
MSL scenarios with SL MSL scenarios with SL variability over a range of variability over a range of return periods return periods
Tide and non-Tide (CCSM3-A2, 2000-2099)
0.001
0.01
0.1
1
10
100
1.3 1.4 1.5 1.6 1.7 1.8 1.9 2.0 2.1 2.2 2.3 2.4
Water Level (m NAVD)
Retu
rn P
erio
d (Y
ears
)
Year
Month
Week
Day
Decade
SS0160 Total Runup
0.001
0.01
0.1
1
10
100
1.0 1.5 2.0 2.5 3.0 3.5 4.0
Water Level (m NAVD)
Retu
rn P
erio
d (Y
ears
)Year
Month
Week
Day
Decade0.5
1.0
1.5
2.0
2.5
3.0
2000 2020 2040 2060 2080 2100
Met
ers
(NA
VD
)
NRC I
SERDP 2.0
NRC III
NRC II
MSL = 0.774 m
Include relevant SL Include relevant SL components based on components based on exposure - groundwater, exposure - groundwater, protected bays, exposed protected bays, exposed beachesbeaches
Tide + NTR
Tide + NTR +Runup
SL Variability vs. Return Period

99
Coastal System DelineationCoastal System Delineation
Compile geophysical system dataCompile geophysical system data Compile installation dataCompile installation data Integrate within a geospatial visualization and analysis Integrate within a geospatial visualization and analysis
systemsystem– Capability for superimposing hydraulically-connected water levelsCapability for superimposing hydraulically-connected water levels

Coastal System DelineationCoastal System Delineation Digital terrain with GIS infrastructure overlaysDigital terrain with GIS infrastructure overlays
Naval Base Coronado
MSL
Beach Training Areas
Beach Training Facilities
Beach Rec Facilities
Near-Shore Buildings/InfraShip-Shore Interface
Stormwater Conveyance
Ammunition Bunkers
Airfields
Inland Buildings/Infra
0%
20%
40%
60%
80%
100%
0 1 2 3 4 5 6 7 8
Cum
mul
ative
Flo
odin
g (%
of i
nsta
llatit
on)
Total Water Level (m NAVD)
““Dose-Response” type Dose-Response” type curves for installation curves for installation sensitivity to sea level sensitivity to sea level riserise

1111
Physical Effects - Exposed ShorelinesPhysical Effects - Exposed Shorelines
Long-term Long-term equilibrium shorelineequilibrium shoreline
Seasonal variability - Seasonal variability - historical datahistorical data
Constrain with sand Constrain with sand budgetbudget
Translate shoreline Translate shoreline change to future change to future terrain modelterrain model
Long-Term Shorelines (Seasonal Variations
and Sand Budget Effects)
Current Mean Shoreline
Current Summer Shoreline
Ocean
Future Beach (Land)
Future Winter Shoreline
Seasonal variations ~ 40 meters between summer and winter
Beach line if sand budget is positive
Future Summer Shoreline
Beach (Land)
Current Winter Shoreline
Current Conditions
Future Conditions (2100)
Future Mean Shoreline
Beach Retreat at 2100 from SLR (Brunn’s Rule)
0
20
40
60
80
100
120
140
160
1940 1960 1980 2000 2020 2040 2060 2080 2100
Bea
ch W
idth
(m
NA
VD
)
Historical Profiles
"Bruun-ish" Model (NRC II) + Seasonal
PN1110

1212
0.5 (>2045)
1.0 (>2070)
1.5 (>2085)
2.0 (>2100)
Week 2.40 2.90 3.40 3.90 4.40Month 2.80 3.30 3.80 4.30 4.80Year 3.39 3.89 4.39 4.89 5.39
Decade 3.63 4.13 4.63 5.13 5.63Century 3.80 4.30 4.80 5.30 5.80Week 1.99 2.49 2.99 3.49 3.99Month 2.36 2.86 3.36 3.86 4.36Year 2.80 3.30 3.80 4.30 4.80
Decade 3.17 3.67 4.17 4.67 5.17Century 3.34 3.84 4.34 4.84 5.34
NB
C
SS
0160
W
ith R
unu
p
MC
BC
P
PN
111
0 W
ith R
unu
p
Location/ Condition
Return PeriodBaseline
(m NAVD)
Future Increase in MSL (m)0.5
(>2045)1.0
(>2070)1.5
(>2085)2.0
(>2100)Week 2.40 2.90 3.40 3.90 4.40Month 2.80 3.30 3.80 4.30 4.80Year 3.39 3.89 4.39 4.89 5.39
Decade 3.63 4.13 4.63 5.13 5.63Century 3.80 4.30 4.80 5.30 5.80Week 1.99 2.49 2.99 3.49 3.99Month 2.36 2.86 3.36 3.86 4.36Year 2.80 3.30 3.80 4.30 4.80
Decade 3.17 3.67 4.17 4.67 5.17Century 3.34 3.84 4.34 4.84 5.34
NB
C
SS
0160
W
ith R
unu
p
MC
BC
P
PN
1110
W
ith R
unu
p
Location/ Condition
Return PeriodBaseline
(m NAVD)
Future Increase in MSL (m)
Assessment of VulnerabilityAssessment of Vulnerability
Defined scenarios and stakeholder identified key Defined scenarios and stakeholder identified key vulnerabilitiesvulnerabilities
Screening-level assessment accounts for MSL+variability - Screening-level assessment accounts for MSL+variability - assumes un-modified shorelineassumes un-modified shoreline
Potential impact to key receptors from problem formulationPotential impact to key receptors from problem formulation Highlight scenarios under which these receptors would be Highlight scenarios under which these receptors would be
impacted impacted

1313
NBC Baseline NBC Baseline MHHWMHHW
NBC MSL+1.0m NBC MSL+1.0m Yearly ReturnYearly Return
NBC MSL+0.5m NBC MSL+0.5m Yearly ReturnYearly Return
NBC MSL+2.0m NBC MSL+2.0m Yearly ReturnYearly Return

1414
SummarySummary DoD is developing methodologies to evaluate vulnerability and DoD is developing methodologies to evaluate vulnerability and
adaptation at coastal installationsadaptation at coastal installations These risk-based methods incorporate quantification of stressors, These risk-based methods incorporate quantification of stressors,
pathways and receptors pathways and receptors Vulnerability to sea level in the southwest is related to the co-Vulnerability to sea level in the southwest is related to the co-
occurrence of high tides, high waves, surge and El Niño conditions occurrence of high tides, high waves, surge and El Niño conditions Sea level rise can dramatically influence the return period of what Sea level rise can dramatically influence the return period of what
today are viewed as “extreme events” today are viewed as “extreme events” Vulnerability to these events can occur via flooding, inundation, Vulnerability to these events can occur via flooding, inundation,
erosion, intrusion or water level itself erosion, intrusion or water level itself Each installation has a unique sensitivity to these conditions Each installation has a unique sensitivity to these conditions
Related Documents