e Florida State University DigiNole Commons Electronic eses, Treatises and Dissertations e Graduate School 7-6-2005 Assessing the Impact of Prison Industries on Post- Release Employment and Recidivism of Florida Inmates Robin Leigh Richardson Florida State University Follow this and additional works at: hp://diginole.lib.fsu.edu/etd is esis - Open Access is brought to you for free and open access by the e Graduate School at DigiNole Commons. It has been accepted for inclusion in Electronic eses, Treatises and Dissertations by an authorized administrator of DigiNole Commons. For more information, please contact [email protected]. Recommended Citation Richardson, Robin Leigh, "Assessing the Impact of Prison Industries on Post-Release Employment and Recidivism of Florida Inmates" (2005). Electronic eses, Treatises and Dissertations. Paper 1864.

Welcome message from author
This document is posted to help you gain knowledge. Please leave a comment to let me know what you think about it! Share it to your friends and learn new things together.
Transcript

The Florida State UniversityDigiNole Commons
Electronic Theses, Treatises and Dissertations The Graduate School
7-6-2005
Assessing the Impact of Prison Industries on Post-Release Employment and Recidivism of FloridaInmatesRobin Leigh RichardsonFlorida State University
Follow this and additional works at: http://diginole.lib.fsu.edu/etd
This Thesis - Open Access is brought to you for free and open access by the The Graduate School at DigiNole Commons. It has been accepted forinclusion in Electronic Theses, Treatises and Dissertations by an authorized administrator of DigiNole Commons. For more information, please [email protected].
Recommended CitationRichardson, Robin Leigh, "Assessing the Impact of Prison Industries on Post-Release Employment and Recidivism of Florida Inmates"(2005). Electronic Theses, Treatises and Dissertations. Paper 1864.

THE FLORIDA STATE UNIVERSITY
COLLEGE OF CRIMINOLOGY AND CRIMINAL JUSTICE
ASSESSING THE IMPACT OF PRISON INDUSTRIES ON POST-RELEASEEMPLOYMENT AND RECIDIVISM OF FLORIDA INMATES
By
ROBIN L. RICHARDSON
A Thesis submitted to theCollege of Criminology and Criminal Justice
in partial fulfillment of therequirements for the degree of
Master of Science
Degree Awarded:Summer Semester, 2005

ii
The members of the Committee approve the Thesis of Robin L. Richardson defended onJuly 6, 2005.
____________________Gordon WaldoProfessor Directing Thesis
____________________William BalesCommittee Member
___________________Marc GertzCommittee Member
Approved:
_________________________________________________Thomas Blomberg, Dean, College of Criminology and Criminal Justice
The Office of Graduate Studies has verified and approved the above named committeemembers.

iii
ACKNOWLEDGEMENTS
Kathy Padgett, thank you for your help during the data analysis and editorial process.
iv
TABLE OF CONTENTS
List of Tables ................................................................................................ Page viAbstract ...................................................................................................... Page vii
1. Introduction and Theoretical Framework........................................................ Page 1
PRIDE’s Vocational Training..................................................................... Page 1OPPAGA Report......................................................................................... Page 2Theoretical Framework: The Life Course and Social Capital .................... Page 3
2. Literature Review............................................................................................ Page 6
Historical Roots of Prison Labor ................................................................ Page 6Prison Labor: Salvation or Slavery............................................................. Page 8Vocational Training and Work Release ...................................................... Page 9
3. Research Methods ........................................................................................... Page 12
Hypotheses ................................................................................................ Page 12Selection Bias.............................................................................................. Page 13Participants ................................................................................................ Page 13Data ………................................................................................................ Page 13Measures….. ............................................................................................... Page 15
PRIDE Cohort………………………………………………………... Page 15In Facility Offering PRIDE…………………………………………... Page 16Education and Employment………………………………………….. Page 16
4. Analysis and Results ....................................................................................... Page 18
Bivariate Analysis....................................................................................... Page 18Multivariate Analysis.................................................................................. Page 19
PRIDE Model 1 & Recidivism ............................................................. Page 19PRIDE Model 2 & Recidivism ............................................................. Page 20PRIDE Model 3 & Recidivism ............................................................. Page 21PRIDE Model 1 & Employment ........................................................... Page 22PRIDE Model 2 & Employment ........................................................... Page 22PRIDE Model 3 & Employment ........................................................... Page 22PRIDE Model 1 & Recidivism with Employment Constant ................ Page 23
v
5. Conclusion & Discussion ............................................................................... Page 24
Summary ................................................................................................ Page 24Conclusion ................................................................................................ Page 25Discussion ................................................................................................ Page 26
APPENDICES ................................................................................................ Page 28
A Tables ................................................................................................ Page 28B Definition of Key Variables .................................................................. Page 40
REFERENCES ................................................................................................ Page 44
BIOGRAPHICAL SKETCH .............................................................................. Page 49

vi
LIST OF TABLES
Table 1: Descriptive Statistics of Study Cohort Divide By Length of Time inPRIDE ................................................................................................ Page 29
Table 2: Logistic Regression for PRIDE Participation and Recidivism .............. Page 30
Table 3: Survival Analysis for PRIDE Participation and Recommitment toPrison within Two Years ...................................................................... Page 31
Table 4: Logistic Regression for PRIDE Participation v. Being in a Facilitywith PRIDE and Recidivism.................................................................. Page 32
Table 5: Survival Analysis for PRIDE Participation v. Being in a Facilitywith PRIDE and Recommitment to Prison within Two Years .............. Page 33
Table 6: Logistic Regression for Being in PRIDE Six Months or More vLess than Six Months and Recidivism................................................... Page 34
Table 7: Survival Analysis for Being in PRIDE Six Months or More vLess than Six Months and Recommitment to Prison withinTwo Years.............................................................................................. Page 35
Table 8: Logistic Regression for PRIDE Participation and Employment............ Page 36
Table 9: Logistic Regression for PRIDE Participation v. Being in a Facilitywith PRIDE and Employment................................................................ Page 37
Table 10: Logistic Regression for Being in PRIDE Six Months or More vLess than Six Months and Employment ............................................... Page 38
Table 11: Logistic Regression Between PRIDE Participation and RecidivismWhen Holding Employment Constant ................................................. Page 39

vii
ABSTRACT
The deskilling of labor and the loss of social networking has accounted for part of the crime problem
in recent decades. Vocational training and other correctional programming is meant to reverse the effects of
these problems by providing inmates with usable, legal, and employable skills. Over the last five to ten
years, the role of rehabilitative services has become highly questionable. The lack of confidence in such
services has led to a decline in the number and type of prison programming available to inmates. In addition,
fiscal concerns on the part of privately owned correctional industries have sharpened this decline. This paper
reports results of an evaluation performed on PRIDE Enterprises, one of the largest providers of privately
operated inmate vocational training in Florida, in regards to its effect on inmates’ post release employment
and recidivism. This study found that working in the vocational program, PRIDE, significantly increases the
likelihood of the participant being employed after release. This study also found that PRIDE has no direct
effect on recidivism.

1
CHAPTER 1
INTRODUCTION AND THEORETICAL FRAMEWORK
Rehabilitative correctional programming holds a tenuous position in criminal
justice policy. Beginning in the 1970s, Martinson’s investigation into the effectiveness of
correctional programming brought a decline to the number and scope of various programs
across the nation (Blomberg & Lucken 2000). The often-quoted “Nothing Works”
became a symbol for decreases in funding and openings in prison programming. The
“Nothing Works” rhetoric was not the whole picture of Martinson’s argument.
Martinson also found that programming ineffectiveness was the result of particular
factors, such as inadequate application of the program, understaffing, and targeting the
wrong prison populations to mention a few (Martinson 1974; Lipman et al. 1975;
Lattimore et al. 1990). Afterward, rehabilitative programs were not cut completely from
corrections but were subject to closer scrutiny than before.
However, the imprisonment binge of the last twenty years begs the corrections
system to find alternatives to aiding the reentry of inmates. This has resulted in the
continuation of counseling, drug therapy, and vocational training within the prison
system but not in the unmitigated fashion prior to the Martinson’s investigation. This
scrutiny has been brought to bear on one of the leading vocational programs in the state
of Florida.
PRIDE’s Vocational Program
An investigation of Prison Rehabilitative Industries and Diversified Enterprises
(PRIDE), a state authorized, non profit manufacturing and service corporation established
in 1981, revealed several problems with the vocational program (OPPAGA 2003).
PRIDE Enterprises had been established to meet several objectives at its inception:
-Provide education, training, and post-release job placement to inmates to helpreduce recommitment;
-Enhance Security by reducing inmate idleness and providing an incentive forgood behavior in prison;
2
-Reduce the cost of state government by operating enterprises primarily withinmate labor while not unreasonably competing with private enterprises; and
-Rehabilitate inmates by duplicating, as nearly as possible, the activities of aprofit-making enterprise (OPPAGA 2003, p.1)
OPPAGA Report
In 2003, OPPAGA released a special report questioning the merits of continuing
business with Prison Rehabilitative Industries and Diversified Enterprises (PRIDE)
because of its declining sale records, questionable corporate restructuring, and decreasing
number of inmates employed by the corporation. The report found that the number of
PRIDE inmates had dropped 33% since 1994, despite an increasing prison population.
OPPAGA had further difficulties confirming PRIDE’s effect on inmate recidivism.
PRIDE claimed that inmates employed by the corporation recidivated less than inmates
not employed by PRIDE (approximately 18% to 38%), but this information appeared to
be anecdotal and difficult to confirm (PRIDE, 2002; OPPAGA 2003).
OPPAGA recommended a separate agency to conduct a more in-depth analysis of
the recidivism data. In 2004, the FSU College of Criminology and Criminal Justice’s
Center for Criminology and Public Policy Research evaluated PRIDE using data
provided by the corporation. Due to certain limitations of that data, a second evaluation
was conducted using data provided by the Florida Department of Corrections. This
current evaluation examines post release employment and recidivism rates of inmates
who were employed by PRIDE and released from prison during 2001 fiscal year. This
evaluation compares inmates who participated in PRIDE industries during their current
incarceration to non-PRIDE inmates released during the same fiscal year. Further, sub-
group comparisons between participants in PRIDE and inmates who are incarcerated in
facilities with PRIDE are performed to reduce environmental factors of the prison, which
could deter or aggravate recommitment. Finally, a second sub group comparison was
performed on PRIDE participants of greater than six months against PRIDE participants
of less than six months to determine if there is a time factor in participation.

3
Theoretical Framework: The Life Course and Social Capital
An individual’s life span is made of several trajectories or “pathway[s] or line[s]
of development…, such as work life, marriage, parenthood, self-esteem, or criminal
behaviors” (Cullen & Agnew 2003, p. 472). According to the life course perspective, it is
the strength and quality of social bonds that influence delinquency across a person’s life
(Sampson & Laub 1993). These changes in a person’s social control are clearly seen
when looking at transitions and turning points in the individual’s life. Transitions, unlike
trajectories, are “changes in state that are more or less abrupt” (Cullen & Agnew 2003, p.
472). Two suggested transitions are obtaining a job and marriage (Cullen & Agnew
2003; Sampson & Laub 1993; Giordano et al. 2002). On the other hand, turning points
are defined as a “change in the life course” (Cullen & Agnew 2003, p. 472). It is
suggested that these short term changes [transitions and turning points] can actually
“redirect” (p. 472) the individual’s trajectory, because it’s “crucial” (p. 472) for the
individual to adapt to life events (Cullen & Agnew 2003).
It is suggested that the training and services provided to offenders who
participated in PRIDE industries and programs are able to produce a turning point for
inmates. Most vocational programs only emphasize skill development for the inmate,
with the intention of providing inmates with viable working skills upon release. The
problem with this perspective is that the skills and training offered are usually out of date
or in a career field with little growth. This makes it difficult for ex-offenders to transition
into similar positions upon release. PRIDE provides skill training to inmates participating
in its programs, but it also provides placement and other job development courses.
Further, the organization of the PRIDE Corporation provides trainees with a skeletal
version of nonprison working habits and systems. Although, inmates may not be able to
directly obtain jobs in the fields they were trained for in prison, their training may benefit
them in alternative ways. Employment itself is not the key in reducing crime, but the
“mutual ties of work” (1993, p. 140) from stable income and trust may reduce crime
(Sampson & Laub 1993; Giordano et al. 2002). In other words, PRIDE may provide
participating offenders with “social investment” (Sampson & Laub 1993, p. 140) or
social capital.
4
In the past, “informal social networks” were the gateway for new generations to
“enter the labor market by providing information and personal contacts for young women
and men to take advantage of job openings” (Baskin & Sommers 1998, p.79).
Unfortunately, most of these networks have been disrupted by inner city violence and the
deterioration of neighborhoods. The violence and disinvestment in these communities
has led to subsequent generations restricted to jobs that are low waged, low skilled, and
limited mobility service careers (Baskin & Sommers 1998 ; Chiricos 2002). Most
vocational training programs focus only on skill development to help inmates find a job
upon release, but this leaves a gap that was once filled by informal networks. Coleman
found that a “lack of social capital” is a primary feature in “weak social bonds” for adults
(Sampson & Laub 1993, p.140).
Social capital is “embodied in the relations among persons” (Sampson & Laub
1993, p. 140) as an “obligation of reciprocity” (Herreros 2004, p. 7). It is an intangible
resource that is unstable but necessary in order to effectively bind the person to the
community and other social institutions (Sampson & Laub 1994; Herreros 2004; Krishna
2002; Allik & Realo 2004; Hooghe & Stolle 2003). Communities with high social
capital are bound by social networks and norms that enable them to produce “superior
outcomes in multiple domains” (Krishna 2002, p. IX; Hooghe & Stolle 2003; Herreros
2004). Further, Sampson and Laub (1993) argued that adult social bonds are more
indirect than juvenile bonds; as such, social ties are more important in establishing
“interdependent systems of obligation and restraint” (p. 140). These ties are fostered by
social capital, and social capital mitigates the effects of delinquent propensities (Sampson
& Laub 1993; Hooghe & Stolle 2003).
Thereby, the life course, as defined as a “sequence of culturally defined age
graded roles and social transitions that are enacted over time” (Cullen & Agnew 2003, p.
476) could be altered or redirected by vocational training programs. As such, PRIDE’s
program helps to provide released offenders with employment and promote skills that
would enable them to maintain and remain committed to a job and turn away from
criminal behaviors after release. If the relationship between the ex-offender and other
social institutions were characterized by “interdependence,” then the ex-offender would
have greater ties to the community to “draw on as they move through life transitions that

5
traverse larger trajectories” (Cullen & Agnew 2003, p. 476). “Voluntary participation”
could effectively “foster instructor and employer contact and a commitment to
conventional aspects of society” (Wilson et al. 2000, p. 349).
6
CHAPTER 2
LITERATURE REVIEW
Historical Roots of Prison Labor
Rehabilitation of offenders was of little consequence for correctional systems in
pre-colonial times. Early prison systems and labor camps were meant to punish the
offender and to deter future criminal offending (Funke et al. 1982; Burger 1985). Prison
administrators were more concerned with controlling the prison population and cared
little if the prisoner returned to society as a reformed citizen. However, the goal of
rehabilitation began to drift into penal policy around the mid nineteenth century,
although, earlier forms of rehabilitative zeal were found in the construction of
workhouses in the sixteenth century.
Workhouses were the first attempt to use labor to “behaviorally transform”
(Blomberg & Lucken 2000, p. 19) the impoverished and transient population in a
community. Workhouses were constructed with the belief that a “regimen of honest
labor, discipline, and moral instruction” could transform offenders into “productive
citizens” (Blomberg & Lucken 2000, p.19). The use of the workhouse quickly expanded,
and these ideas were later included when constructing the innovative prison systems in
Auburn and Pennsylvania.
During the eighteenth and nineteenth centuries, the Auburn and Pennsylvania
prison systems both used a regimen of hard work and silence to rehabilitate offenders by
allowing them to contemplate their transgressions and learn a work ethnic that was
lacking before incarceration (Blomberg & Lucken 2000; Funke et al. 1982). There was a
strong belief that hard work and contemplation could reform the offender’s moral
character. The Auburn system, which emphasized silence, but not solitary work like the
Pennsylvania system, expanded greatly during the early nineteenth century in the
northeast. Unfortunately, Auburn’s reformist intentions were lost as fiscal and
overcrowding concerns grew (Blomberg & Lucken 2000; Funke et al. 1982). Southern
development of a prison system was severely neglected, but alternative punishment
7
flourished primarily in the form of leasing out of prisoners as laborers (Blomberg &
Lucken 2000; Funke et al. 1982). The differences in penal practices between these two
regions became noticeably different after the Civil War, with the rise of progressive
reforms in the North and the exploitation of prison labor through the convict lease system
in the South (Blomberg & Lucken 2000). The dichotomy of the two regions would shape
America’s viewpoint of prison labor and vocational programming in corrections until the
present.
In the post-Civil War era, the Northeast was the beginning of progressive
penological change. The progressive movement ignited several policy changes, including
the creation and administration of reformatories. Reformatories provided rehabilitation
for delinquent and at risk youth, but it also provided “paid work, job training, physical
exercise and well planned diet” (Blomberg & Lucken 2000:72) to persons who had little
experience with any of these dimensions. Reformatories, much like the workhouses,
embraced the idea that inmates could learn new social habits and industriousness through
work (Blomberg & Lucken 2000). The 1870 Transactions of the National Congress on
Penitentiary and Reformatory Discipline “urged prisons to concentrate less on profit and
self-sufficiency and to use the labor of prisoners in a ‘productive’ manner” (Funke et al.
1982: 26). However, deficiency in administration and the money/merit system eventually
caused reformatories to fail. Nevertheless, the progressive philosophy fed into the early
nineteenth century rehabilitative ideal.
The rehabilitative ideal was less about the program and more about fostering of
ideas concerning ways to “correct offenders.” It was during this era that expansion of
correctional treatments such as counseling, drug therapy, and vocational training began to
expand. Policy makers of this era believed that inmates could be successfully
“reintegrated” into society, primarily by “holding a job, paying taxes, and raising a
family” (Blomberg & Lucken 2000: 101). The momentum to rehabilitate offenders and
the ever increasing number of penal services eventually tapered off around the mid
twentieth century. After several crushing evaluations of these rehabilitation programs,
the rehabilitative ideal moved to the background as a harsher correctional policy was
adopted.

8
On the other hand, the antebellum south found little usefulness for the
rehabilitation of offenders, but contracted out inmates for cheap labor. This system was
in affect well before the Civil War, but its rampant expansion and marked abuses were
most apparent after the Civil War (Blomberg & Lucken 2000; Funke et al 1982). Several
scholars have associated the growth of the contract-lease system after the civil war as a
continuation of the slave model found throughout the south before the civil war
(Adamson 1983; Myers & Massey 1991; Ward & Rogers 1987).
The South fostered a system of forced labor and in some cases depravity
(Blomberg & Lucken 2000; Ward & Rogers 1987). It merely acted as a system to obtain
cheap and expendable labor, as seen in cases such as the Banner Mine Explosion. The
Banner Mines, employed the use of convicts, and due to faulty ventilation and general
mismanagement eventually killed 128 workers, mostly black convicts (Ward & Rogers
1987). However, this system remained in full effect for several decades, before being
temporarily abolished in the mid twentieth century.
The cyclical nature of correctional policy has brought into view once again other
rehabilitative programming. However, the use of prison labor continues to bring up the
question of whether it is a salvation or slavery?
Prison Labor: Salvation or Slavery
There are two conflicting views of prison labor in America. The first is of
“sadistic profit-obsessed managers” (Jacobs 1999, p. 269) ensnaring prisoners into a life
of forced labor and driving them “beyond human endurance” (Jacobs 1999, p. 269). The
other is of idle prisoners, lazing their days away on taxpayer’s money (Jacobs 1999).
Although, both viewpoints provide an inaccurate view of most prison labor systems,
examples of both extremes can probably be found. However, it is this duality of the
prison labor system that causes it to promote and restrain vocational training programs at
the same time.
There is also a larger question of how to provide meaningful employment and
skills to inmates, without offending private enterprise. “Everyone has the right to work,”
(Hawkins 1983, p. 87) but this adage does not always seem to apply to offenders. Most
offenders have little “productive work” to do in the prison systems, leaving them with a
lot of time idle. Most blame this on the “inferiority” of the prison laborers but it has been

9
found that with “reasonable incentives” (Hawkins 1983, p. 103) the prison labor system
is just as good as the free labor system. Hawkins (1983) found that “Free Venture prison
industry program lend no support … [to] some intrinsic deficiency in the prison labor
force” (p. 103). Prison laborers had comparable “productive abilities …to similarly
skilled employees in the world outside prison” (p. 103). Further, productive labor
experience for prisoners can also lead to increases in self esteem that would promote
greater employment success upon release and less recidivism (Burger 1985).
However, many believe that prison labor would be an unreasonable competitive
market against free laborers, despite little evidence to support that claim (Jacobs 1999;
Hawkins 1983). Further, prison laborers are made out to be completely “unreliable and
irresponsible” (Jacobs 1999, p.271), and lack motivation, which is not always the case.
Nevertheless, there are still difficulties in establishing an effective prison labor system
without criticizing the labor itself. First, prison industries lack officials with “expertise in
and strong commitment to business” (Jacobs 1999, p. 278) causing “industry a lower
priority than safety and security” (Jacobs 1999, p. 276). Secondly, prisons are unable to
obtain the “substantial capital investment” (Hawkins 1983, p. 104) necessary to operate a
reliable prison industry (Hawkins 1983; Jacobs 1999). Finally, political and legal issues
prevent prison made goods from successfully competing with free trade institutions.
Prison made goods are often banned from interstate commerce and substantial restrictions
are placed on which industries are allowed to compete with free trade institutions (Jacobs
1999). The creation of an effective and productive labor system inside prison will
continue to be a challenge as long as these issues are not handled. Unfortunately, the
most common method to date to remedy this situation has been to favor free trade
institutions by decreasing the number of prisoners effectively employed in prison, which
has decreased from 44% in 1940, to less than 10% in today’s prison (Funke et al. 1982).
Vocational Training and Work Release
A review of vocational training literature finds that while the findings are mixed,
most studies support the idea that vocational training programs can improve the
likelihood of employment upon release and reduce the likelihood of returning to prison
(Johnson 1984; Wilson et al 2000; Gerber & Fritsch 1995; Seiter & Kadela 2003;
Lattimore et al. 1990; Schumacker et al. 1990; Anderson 1982; Witte 1977; Saylor &

10
Gaes 1996; Motiuk & Belcourt 1996; Drake 2003; Anderson 1995a; Anderson 1995b).
Further, participation in these programs often leads to better adjustment in prison, higher
self esteem, and fewer disciplinary reports for the participating inmate (Witte 1972;
Saylor & Gaes 1996; Motiuk & Belcourt 1996; Gerber & Fritsch 1995).
Research has found that the lack of education or a marketable skill often made it
difficult for former inmates to find employment after release (Vernick & Reardon 2001;
Gleason 1986; Simon 1999). Others have suggested that it the criminal label and not the
lack of job training that could produce difficulties with obtaining employment, since most
inmates were employed prior to incarceration (Wilson et al. 2000). However, the
employment record of most inmates is sporadic, and aimed primarily at low mobility
service sector jobs (Gillis et al. 1996).
Those programs that were found to be the most effective are typically multi-
dimensional. They do not focus exclusively on skill development but also use follow up
procedures and make sure that the skills taught are “relevant” to the current job market
(Wilson et al. 2000; Gerber & Fritsch 1995; Kennedy 1997; Harrison & Schehr 2004).
There is little overlap between the skills taught in prison and actual employment (Gerber
& Fritsch 1995; Anderson 1982), but those inmates who did find jobs that matched their
skills were more likely to be successful (Gillis et al. 1996; Johnson 1984). Some
programs found that focusing on inmates with the most disadvantage, in terms of job
skills, provide the best success (Adams et al. 1994), while others found those with the
best skill succeeded (Anderson 1995b). In the meta-analysis performed by Gerber &
Fritsch (1995) they found prison programs that were “separate” from the prison were
more likely to succeed. Also, prison programs that were aimed at certain groups had
better success than those aimed at the general population (Anderson 1995a, 1995b).
Unfortunately, most studies conducted on vocational training programs suffer
from poor research methods, lack statistical controls, failed to eliminate selection bias
and it was difficult to determine the cause of change for the inmate (Wilson et al. 2000).
In some cases, the program was inadequately activated and there was “misconception” of
the programs goals (Craig & Rogers 1993; Simon 1999; Lattimore et al. 1990). In some
cases, the inmates took over the program and used it as a means of intimidation (Craig &
Rogers 1993).
11
Most vocational studies used quasi-experimental designs (Wilson et al. 2000),
because it was often difficult to randomly assign inmates to programs. When
experimental designs were used, there was no statistical support for vocational programs
reducing recidivism (Waldo & Chiricos 1977; Johnson 1984; Johnson & Goldberg 1983).
In several studies, initial support for vocational training effecting recidivism was
found, but when more statistical rigor was applied, the reexamined relationship
disappeared (Maguire et al. 1988; Sung 2001). Finally, Brewster and Sharp (2002) found
a reverse effect, with both male and female participants in vocational training programs
returning to prison sooner than non participants. Possible explanations for these findings
is that the participants self selected themselves into the program, but another possibility is
that the success rate was smaller due to the chronic facility changes occurring in the
correctional system.
In summary, most of the research is supportive of the position that vocational
training is rehabilitative, but this could be the result of weak statistical controls and
selection bias. Further, most research does not provide an adequate causal pathway to
understand how vocational training effects recidivism.

12
CHAPTER 3
RESEARCH METHODS
The PRIDE evaluation analyzed offenders who had been released from the
Florida Department of Corrections during the 2001 fiscal year. The study consisted of
20,441 inmates who were released that year, with 5,328 of the inmates having prior
PRIDE experience. This is a Post-hoc quasi experimental, cross-sectional study using
two comparison groups, inmates released who participated in the PRIDE programs and
inmates released who did not participate in the PRIDE program.
Hypotheses
The study is testing four main hypotheses:
Hypothesis 1: PRIDE participants will be more likely to be employed after
release than non-participants within one year after
prison release?
Hypothesis 2: PRIDE participants will be more likely to be employed after
release than non-participants within two years after
prison release?
Hypothesis 3: PRIDE participants will be less likely to be returned to
prison than non participants within one year after prison
release?
Hypothesis 4: PRIDE participants will be less likely to be returned to
prison than non participants within two years after prison
release?
This study examines recommitment data and employment data on these inmates for up to
two years following his or her release from prison. In order to replicate the
circumstances similar to those used by PRIDE in their evaluation of the program, this
study examines recidivist behavior two years following prison release.
13
Selection Bias
The choice to participate or not to participate in the PRIDE programs is based on
convenience and self-selection. The first limitation to the selection choice is that inmates
can only participate in programs that are offered by his or her correctional facility.
Although PRIDE is found in a large number of the correctional facilities and work camps
throughout Florida, there is not a program in every facility. Secondly, inmate
participation is based partially upon self-selection. Inmates are not randomly assigned to
participate or not participate in this program or other programs offered in the correctional
facility. These biases limit the ability to generalize the findings of this study to inmates
in PRIDE and/or vocational training programs in other states. This also limits the ability
to generalize to inmates in other years, too.
Participants
The study analyzes 5,328 inmates who actively participated in PRIDE during his
or her current incarceration. The members of the PRIDE cohort (see Table 1) for the
2001 fiscal year are more likely to be older, male, white, and to have graduated high
school than those inmates who had not participated in the program. Those participating
in PRIDE are incarcerated 50-100% longer than non participating members. The PRIDE
cohort was more likely to be a violent offender, habitual offender, to have a prior
conviction, and to be under supervision upon release to the community. The PRIDE
cohort was less likely to be a drug offender.
Those inmates participating in PRIDE for less than six months were more likely
to resemble the general prison population than those inmates participating for six months
or more. Those inmates participating in the program for longer than six months appear to
be inmates with longer and possibly more serious offenses.
Data
This study utilizes secondary data from the official records of the Florida’s
Department of Corrections. Florida’s DOC uses an Offender Based Information System
(OBIS) that keeps records of all felonious offenders who are either sent to a correctional
institution or supervised by the state (Bales et al. 2003). OBIS maintains

14
records of all offender characteristics, movements, and sentences since 1980. The fact
that this information is collected by outside parties makes it difficult to understand how
their collection methods and instruments may affects these numbers.
The main independent variable in the first model is whether the inmate
participated in PRIDE or did not participate in PRIDE. The main independent variable in
the second model is whether the inmate participated in PRIDE or did not participate in
PRIDE but was incarcerated in a facility with PRIDE. In the third model, the main
independent variable is whether the inmate participated in a PRIDE for six months or
longer or did they participate for less than six months. The first model has a separate
variable to measure the effect of being housed in a facility with PRIDE. This controls for
the environmental effects of facilities with PRIDE not found in the first model cohort.
Education after release and being employed for two years is found in the first
recommitment model at two years. This model is limited to offenders that have been
rearrested for a new crime, and not returned to prison for technical violations. The model
is also limited to offenders with verifiable employment histories. The second
recommitment model for two years is not limited to inmates with a reoffense in the last
two years or a valid social security number. The recommitment model for one year does
not include education after release, since this is a general variable looking at any
education after release, as such it was only included in one model. Employment in one
year is substituted accordingly in the recommitment within one-year model.
The other independent variables included in this study met “two criteria: 1)
factors for which FDOC has reliable data, and 2) factors found to be significant
recidivism predictors in prior studies” (Bales et al. 2003) 1. The demographic variables
found to predict recidivist behavior including age at release, being male (sex), being
black (race), being hispanic (ethnicity), being married, and level of education (high
school graduate (1=yes, 0=no)). Prior criminal history and institutional variables that are
used to predict recidivist behavior are also included; such as, past criminal convictions
(1=no, 0=yes), habitual offending (1=yes, 0=no), violent habitual offending (1=yes,
0=no), being a violent offender (1=yes, 0=no), prior offense (primary offense), length of
time in prison (continuous, by number of months), most serious prior conviction and past
1 See Appendix B for more information on the variables used in this study.
15
prison behavior (disciplinary report during prison incarceration (1=no, 0=yes)).
Significant findings should be found repeatedly for several of these variables, such as
being a habitual offender or having a prior conviction, since they are high predictors of
future criminal behavior. Gendreau et al. (1996) meta-analysis of offender recidivism
found that certain demographic variables and criminal history are strong predictors of
recidivism. They also found that substance abuse history is a strong predictor but this
variable is not included in this study, because this data is confidential, and is not available
from the DOC. Additional variables are included about residency such as being born in
the US, being a Florida resident, and speaking English, in case these factors limited the
offender’s ability to find employment.
The dependent variable is being recommitted to prison, which is measured as
being recommitted to prison after being released from prison within one year and within
two years. Recommitment was used as the recidivism measure, rather than rearrest,
because it was found to be a better predictor of program effectiveness (Brewster & Sharp
2002). The model was limited to only those inmates who remained in the state and could
be tracked. However, the number of cases lost due to this restriction is negligible. On
the other hand, the use of only verifiable employment data, while increasing accuracy of
reporting, also limits the numbers of case in the study dramatically.
These variables were tested for multi-collinarity to establish if the variables had
any potential interactive effects. If multi-collinarity is found these interactions could
potentially inflate the results. After determining and potentially removing any variables
that may unduly inflate the reported statistics of the study, a logistic regression is
performed for all three main independent variable models and all recommitment
/employment models. Afterward, a Cox’s regression survival analysis is performed on
the three main independent variables and being recommitted within two years. Being
employed within two year is included in this model, so the model is limited to inmates
with verifiable work histories.
Measures
PRIDE cohort. A direct measure of PRIDE participation was needed because
this measure was lacking in the recidivism data. First, the 2001 recidivism cohort was
merged with the DOC work assignment data, which includes each entry and exit date into

16
a PRIDE program. After merging the recidivism file with the work assignment file,
inmates were identified whose release dates were between July 1, 2000 and June 30,
2001. The work assignment data was used to calculate the number of days spent
working for PRIDE. The number of days working for PRIDE was calculated for both the
primary (a.m.) and secondary (p.m.) work assignments of the inmate. The numbers of
days working for PRIDE were calculated by subtracting the end date of the inmate’s
work assignments from the beginning date of the inmate’s work assignments.
Participants in PRIDE are put into three categories, based on the length of time in
PRIDE: Inmates who were not PRIDE participants because they spent no time in PRIDE,
inmates who were PRIDE participants and worked for less than six months, and inmates
who were PRIDE participants and worked for six months or more. Six months is
determined by PRIDE as a necessary length of time to be rehabilitated by the PRIDE
program (PRIDE, 2002).
In facility offering PRIDE. A comparison measure of indirect PRIDE
experience for inmates who did not participate in PRIDE, but were incarcerated in a
facility that offered PRIDE programming was needed since none existed in the data. The
recidivism cohort was merged with the inmate movement data, and retained inmates
whose movement dates were between July 1, 2000 and June 30, 2001. The inmate’s
length of time in a facility was calculated by subtracting the date they moved out of a
facility from date the inmate moved into a correctional facility. Inmates were placed in
two categories: In a PRIDE facility or not in a PRIDE facility.
Education and employment. The Florida Education and Training Placement
Information Program (FETPIP), data is used to measure inmate employment and
education after being released from prison. FETPIP, a division of the Florida Department
of Education, collects data concerning “the educational histories, placement and
employment, military enlistments, and other measures of success of former participants
in Florida’s educational and workforce development programs” (FETPIP 2005).
Employment is determined by using the inmate’s release date to divide the year(s)
following release into work quarters . After, the work quarters was matched to the
offender’s wage earning. If the offender earned a wage during a work quarter, then he or
she was considered employed. Work quarters were calculated for two years. Education

17
is measured by taking the year the offender was enrolled and matching it to any time after
the year released. If the offender was enrolled in school after released, he or she was
considered to be going to school.

18
CHAPTER 4
ANALYSIS AND RESULTS
Bivariate Analysis
The correlation matrix (not shown) performed for PRIDE participation is found to
have a positive and significant association with having employment in one year (r=.06,
p<.0001) and two years (r=.05, p<.0001). PRIDE participation is weakly, but
significantly correlated with being recommitted within two years (r=-.02,p<.004), but not
one year (r=-.01, p<.24) in comparison to all releases. PRIDE participation has a
moderately weak relationship with age (r=.08, p<.0001), months in prison (r=.24,
p<.0001) and being black (r=-.14, p<.0001).
PRIDE participation has a weak positive and significant relationship with having
employment in year one (r=.06, p<.0001) and year two (r=.05, p<.0001) in comparison to
those housed in facilities with PRIDE. PRIDE participation has no relationship with
being recommitted in year two (r=-.02, p<.09) and year one (r= -.01, p<.36). PRIDE
participation has a moderately weak relationship with age (r=.15, p<.0001), and months
in prison (r=.35, p<.0001).
PRIDE participation of more than six months had a weak positive and significant
relationship with employment in year one (r=.05, p<.0005) and year two (r=.05, p<.0003)
in comparison to those with less than six months participation. PRIDE participation of
more than six months had no relationship with being recommitted in year two (r=-.02,
p<.27) and year one (r= -.01, p<.25). PRIDE participation of more than six months had a
moderate weak relationship with age (r=.15, p<.0001), and months in prison (r=.20,
p<.0001). PRIDE participation of more than six months had a moderate negative and
significant relationship with being male (r=-.31, p<.0001). There are no issues with
multi-collinarity in any of the models.

19
Multivariate Analysis
PRIDE Model 1 & Recidivism
Table 2 shows the Maximum Likelihood Estimates between PRIDE participation
and being recommitted to prison. The first recidivism model includes two independent
variables for education after release and being employed in two years. This model only
includes ex-offenders living within Florida, with verifiable work histories, and that have
re-offended. These restrictions reduce the sample from 20,441 inmates to 4,613 inmates.
The variables participating in PRIDE and being in a facility with PRIDE has no
significant effect on the dependent variable, being recommitted within two years. Being
employed within two years had a significant, negative relationship with being returned to
prison (p<.001). Being employed within two years after release has an odds ratio
equaling 0.48. Inmates employed within two years after release were 52% less likely to
recidivate. Pursuing an education after release had no effect on the likelihood of
recidivating.
Being male, a habitual offender, or being supervised after release are all positively
associated with being returned to prison. Males were 95% more likely to recidivate than
females, but habitual offenders were only 38% more likely to recidivate than non habitual
offenders. Having a prior conviction and a disciplinary report were also positively
related to recidivating. Being single had no effect on the likelihood of being returned to
prison.
The second recidivism model measured recommitment to prison within two years
but it does not include the employment or education variables. This model includes all
inmates that recidivated after releases, even for technical violations, unless they move to
another state and could no longer be tracked.
The main independent variable of participation in PRIDE has no significant
relationship with the recommitment of an offender. Being a habitual offender, violent
habitual offender, or violent offender are strongly, and positively associated with the
dependent variable. Being a violent offender makes it 396% more likely that the offender
will recidivate. Several variables associated with recidivating had a significant
relationship, such as age at release, months in prison, and being male. Prior convictions

20
and having more disciplinary misconduct reports were significantly associated with
higher recidivism.
The third model measuring recommitment after one year, finds no significant
relationship between the main independent variable and dependent variable. However,
being employed in the first year is significantly associated (p<.001) with being
recommitted. Employed ex-offenders were 47% less likely to recidivate than ex-
offenders who were not employed. Ex-offenders are more likely to recidivate if under
supervision too (p<.001). Supervision increases the likelihood of recidivating, because
there is a greater chance to observe criminal behavior for supervised ex-offenders than
unsupervised ex-offenders.
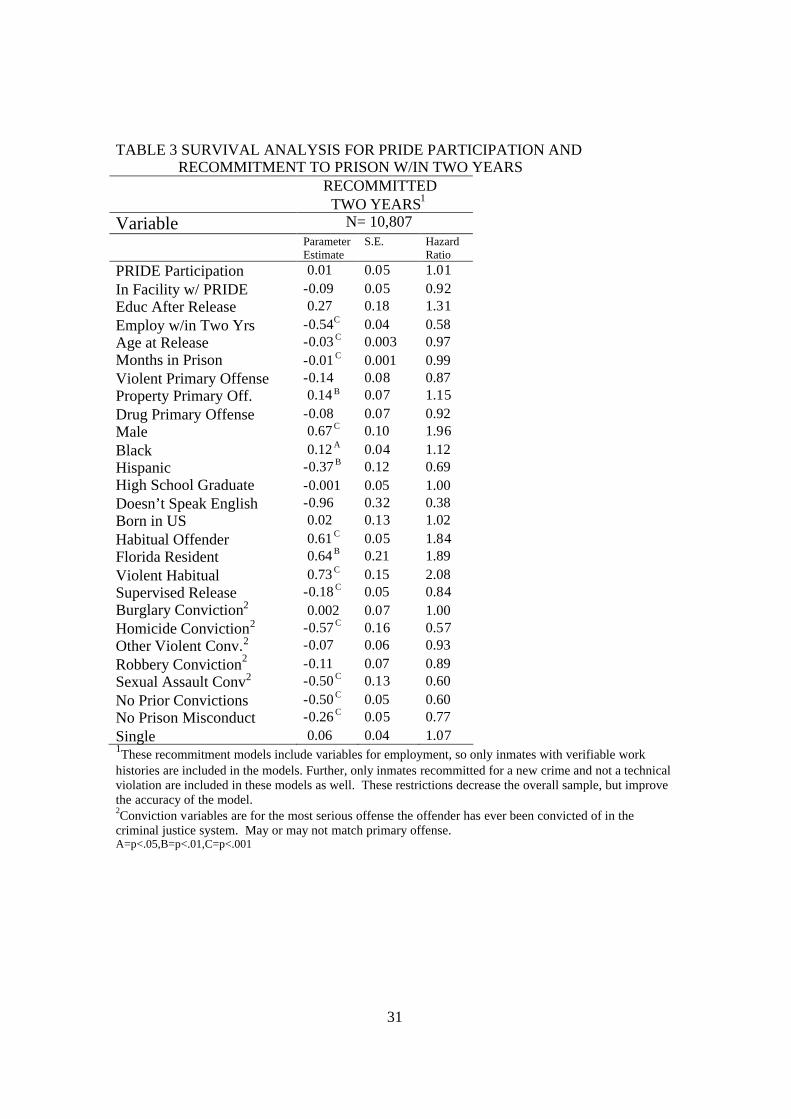
Table 3 shows the results of a Cox’s regression survival analysis conducted on the
first PRIDE cohort and recommitment to prison within two years of release. There is not
a significant association between being recommitted to prison and participating in
PRIDE. There is not a significant association between recommitment and being in a
PRIDE facility.
Being employed has a negative and significant relationship with being
recommitted. Those inmates who were employed within two years after release were
42% less likely to return to prison. Education had no effect on recidivism. Significant
findings for age, months in prison, being male, being black, being hispanic, being a
(violent) habitual offender, prior conviction, disciplinary reports, and being supervised
have been confirmed by the previous models as well.
PRIDE Model 2 & Recidivism
Table 4 shows the Maximum Likelihood Estimates of participating in PRIDE v
being in a facility with PRIDE against recommitment. The relationship between being in
PRIDE and recommitment is non-significant in determining the likelihood of an ex-
offender returning to prison.
However, being employed has a very strong, negative significant (p<.001) effect
on being recommitted to prison within both year one and year two. Employed offenders
are 64-66% less likely to recidivate and return to prison. Education had no effect on being
recommitted to prison within two years.
21
Being male and age at release were significantly related to recommitment within
two years after release, but not within one year after release. Being on supervision was
positively related to being recommitted in model one and three with the employment
variables. However, in model two the relationship was significant in a negative direction.
Prior convictions were positively and significantly related to recommitment in every
model.
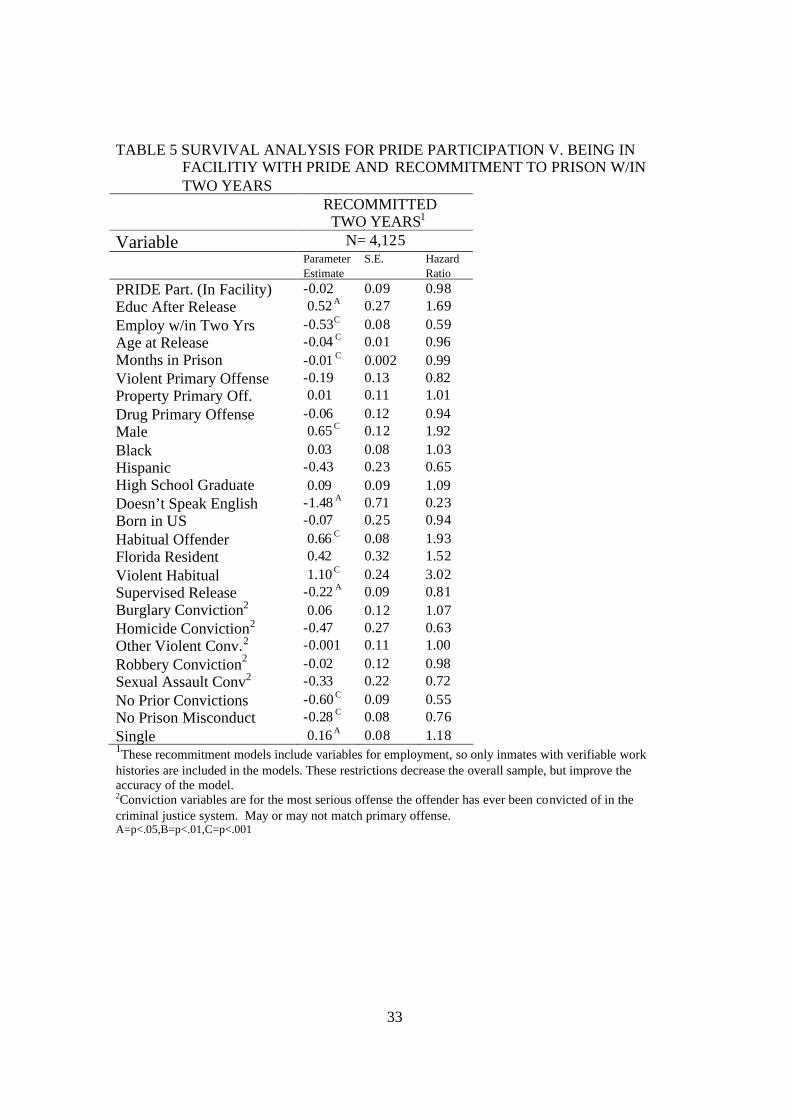
Table 5 shows a Cox’s regression survival analysis conducted on PRIDE
participation compared against inmates incarcerated in a facility with PRIDE, and finds a
similar relationship to PRIDE participants when compared against all releases. Being in
PRIDE had no significant relationship with being recommitted, but being employed was
negatively and significantly associated with being returned to prison. Age, months in
prison, being male, being a (violent) habitual offender, having prior convictions and
having a disciplinary problems in prison were found to be significantly (p<.001)
associated with being recommitted. Surprisingly, returning to school/college after release
is significantly associated (p = .05) with being recommitted, in a positive direction
PRIDE Model 3 & Recidivism
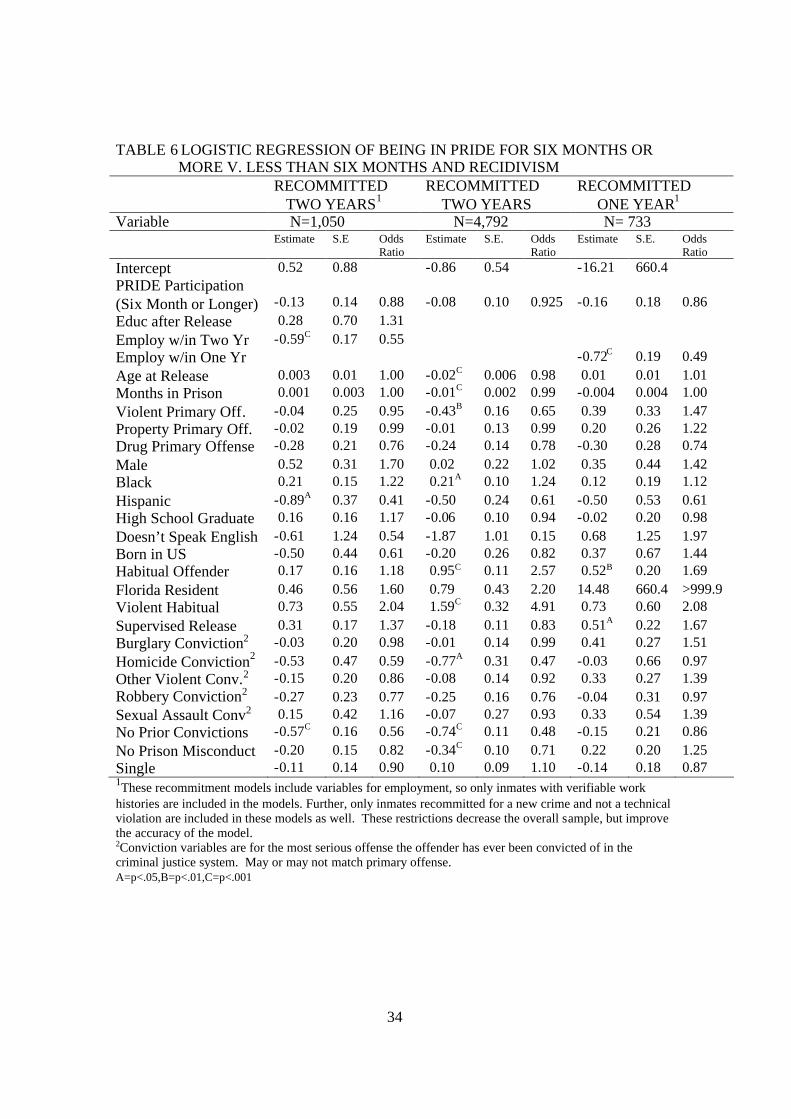
Table 6 shows the Maximum Likelihood Estimates for being employed with
PRIDE for six months or more against being employed for less than six months and
recommitment. Being in PRIDE for more than six months has no significant relationship
with being recommitted in any model. In the models where employment is tested, it is
found to be very significant (p<.001) in a negative direction. Having employment made
it 45-51% less likely that the ex-offender will be recommitted to prison.
Recommitment within two years, with no measure for employment, shows more
varied explanation for being recommitted to the correctional facility. Age, months in
prison, being a habitual offender, being a violent habitual offender, prior conviction, and
disciplinary reports are all related to being recommitted within two years.
Table 7 shows the Cox’s regression survival analysis for being in PRIDE for more
than six months and being recommitted in two years. Being in PRIDE had no significant
relationship effect with being recommitted, but being employed reduced the likelihood
that an ex-offender would return to prison. The relationship between employment and the
dependent variable was very significant (p<.001). Other variables associated with

22
recidivism are found to be significant such as age, months in prison, being a (violent)
habitual offender, prior convictions, and prior disciplinary problems in prison.
PRIDE Model 1 & Employment
Table 8 shows the Maximum Likelihood Estimates for being in PRIDE and
employment. Participants in PRIDE are positively and significantly associated with
being employed in year one (p<.001) and year two (p<.001). PRIDE participant were 54-
42% more likely to be employed than non-pride participants.
Being incarcerated in a PRIDE facility is also significantly associated with
employment in a negative direction. Inmates in facilities with PRIDE were 13-16% less
likely to be employed. Age and months in prison were very significantly associated with
employment in year one (p<.001, p<.001) and year two (p<.001, p<.001). Having no
disciplinary report (p<.001, p<.001) and having a high school degree or better (p<.001,
p<.001) was positively and significantly associated with employment.
PRIDE Model 2 & Employment
Table 9 shows the Maximum Likelihood Estimates for being in PRIDE v PRIDE
facility and employment. Participants in PRIDE are more likely to be employed in year
one (p<.001) and year two (p<.001) than non participants incarcerated in facilities
offering PRIDE. PRIDE participants were 57-66% more likely to be employed than the
non-pride participants. Age and months in prison were very significantly associated with
employment in year one (p<.001, p<.001) and year two (p<.001, p<.001). Having no
disciplinary report (p<.05, p<.01) and having a high school (p<.001, p<.001) degree or
better was positively and significantly associated with employment.
PRIDE Model 3 & Employment
Table 10 shows the Maximum Likelihood Estimates between being in PRIDE for
more than six months and employment. In this model, being in PRIDE for more than six
months has no significant relationship with employment in comparison with being in
PRIDE less than six months. Age is very significantly associated with employment in
year one (p<.001) and year two (p<.001). Months in prison is very significantly
associated with employment in year one (p<.001) and year two (p<.001). Having a high
school degree or better is positively and significantly associated with employment in year
one (p<.05) and year two (p<.01). Having no disciplinary reports is positively and
23
significantly associated with employment in year one (p<.01) and year two (p<.001).
Being single is negatively and significantly related to being employed in year one (p<.05)
and year two (p<.05).
PRIDE Model 1 & Recidivism with Employment Constant
Table 11 shows the Maximum Likelihood Estimates between participation in
PRIDE and recidivism when holding employment constant. Participation in PRIDE did
not have significant relationship with being recommitted to prison after release, when
employment was held constant. However, PRIDE participation increased the likelihood
of returning to prison when the inmate was employed, in comparison to non-participants.
Pride participation decreased the likelihood of returning to prison when the ex-offender
was unemployed. As stated before, neither of these relationships were significant.
Male offenders were more likely to be recommitted to prison, if they were
unemployed (p<.001) or employed (p<.001). However, being employed increased the
likelihood of being recommitted to prison by about 15% (2.04 v. 1.90). Supervision after
release increased the likelihood of the offender returning to prison, if the offender was
employed (p<.001). This relationship was not present for those supervised after release
and unemployed.

24
CHAPTER 5
CONCLUSIONS & DISCUSSION
Summary
The data analysis found no direct relationship between participation in PRIDE,
being in a facility that offered PRIDE, or length of participation in PRIDE and the
likelihood that the participating inmate will return to prison within one to two years of
release. Being employed is found to have a significant relationship (p<.001) with the
inmate’s likelihood of recidivating within one to two years. This relationship was
consistently found in all models and with all statistical methods used. Being employed is
found to decrease the likelihood of recidivating within one and two years of release for
all inmates. Returning to get a college education had no significant relationship with the
recidivism measures in all models, except for the survival analysis comparing PRIDE
participant to inmates in facilities with PRIDE. However, the relationship is barely
significant, and disappears after more controls are integrated into the model.
PRIDE participation in comparison to non-PRIDE participation is found to be
significantly related to being employed within one to two years of release in all models.
There is no significant difference in being employed or being recommitted to prison,
between the PRIDE members who participated in the program for six months and over
and those that participated less than six months. Participating in PRIDE has a significant
relationship, but weak association with being employed in both year one and year two.
Those who participated in PRIDE are 42 to 66% more likely to be employed in
comparison to all inmates that year, and specifically, to inmates who did not participate in
PRIDE but are incarcerated within a facility that offered PRIDE. The analysis found that
being in a facility that offered PRIDE significantly reduced the non-participating
inmate’s chance for employment.
PRIDE participation in comparison to non-PRIDE participation had no
relationship with being recommitted to prison within two years when employment is held
constant. Although a significant relationship is not found between being in PRIDE and
being recommitted to prison, PRIDE participants who are employed after release are
25
more likely to be returned to prison. PRIDE participants who are unemployed after
release are less likely to be returned to prison.
Conclusion
The statistical analysis consistently showed that participation in PRIDE had no
significant relationship with decreasing recidivism, but analysis did find participating in
PRIDE to significantly increase the likelihood of having employment after release.
Being employed is also inversely related to being recommitted to prison.
The findings support hypothesis one and two, which asks if PRIDE participation
increases the likelihood of being employed after release within one year and two years.
PRIDE participation has a weak association, but a significant relationship with being
employed within one year and two years. In the maximum likelihood tests, PRIDE had a
positive relationship with employment and increased PRIDE participants’ likelihood of
being employed by at least 42%. Although PRIDE participants’ likelihood of being
employed is significantly higher than non-PRIDE participants, the relationship as
mentioned before is only weakly associated. Further, participation in other programs,
such drug and alcohol rehabilitation, counseling, and/or other vocational programs,
makes it difficult to determine the exact effect PRIDE has on post-release employment.
There is no statistical support for hypothesis three and four, PRIDE participants
are not less likely to be returned to prison than non participants within one year and two
years. The relationship between participating in PRIDE and being recommitted to prison
is not statistically significant. Further, the relationship between PRIDE participation and
being recommitted within one and two years is found to be a positive, not a negative
relationship as predicted in the hypotheses. PRIDE participation increased the likelihood
of returning to prison against all releases within one to two years, but it is not statistically
significant. Further, PRIDE participants are less likely to be returned to prison than those
inmates released from facilities with PRIDE within one to two years, but this relationship
is not significant. Once again, the relationship is found to be non-significant. Further,
the association between PRIDE and being recommitted to prison within one or two years
is very weak.
Nevertheless, the relationship between being employed and being recommitted to
prison may offer a better explanation about the relationship between PRIDE and being
26
recommitted to prison. Employment within either one year or two years reduced the
likelihood of an ex-offender returning to prison by at least 45%. Employment had a
significant influence on recommitment to prison, and PRIDE had a significant
relationship with having employment. As such, being employed may act as an
intervening variable between participating in PRIDE and returning to prison. When
employment is held constant, no relationship is found between participating in PRIDE
and being recommitted to prison.
There are several data limitations that may have restricted the data and explain, in
part, the results found in this study. First, as mentioned before, there is no means to
randomly assign inmates to different programs, which creates difficulties explaining what
about the program and the inmates promotes or fails to make positive changes. Second,
there is no control for participation in other prison programs, because this data was
unavailable at this time due to confidentiality issues. Without this control, it is unclear if
the PRIDE participants increased likelihood to find employment is the result of this
specific program, another program, or the combination of several programs.
Finally, the FETPIP, employment and education, data caused several limitations
to this study because of incomplete records. The FETPIP database can only track inmate
employment and education records when it has confirmed and valid social security
numbers. Additionally, employment in “cash-only” business such as migrant farming
and day labor cannot be tracked. This severely decreased the number of participants in
several of the models, but at the same time, provided the best model, since the inmate’s
employment and wage earning is verifiable. As such, the full sample could not be
included in the model using FETPIP data. However, FETPIP is virtually the only
database for employment data, so these problems will continue until data collection
methods are improved.
Discussion
Sampson and Laub’s (1993) theory on adult social bonds found that adults were
“inhibited from committing crime to the extent that they have social capital invested in
their work and family lives” (p. 140). As stated earlier, participation in PRIDE promoted
social capital by job training, job placement and giving offenders a simulated real world
work environment. Although the PRIDE participation had no support for influencing

27
recidivism, participation in this program increased the offender’s likelihood of being
employed. Employment promotes social capital, as employers and employees take a
chance that “their investment will pay off’ (Sampson & Laub 1993, p.141). This is
supported in the finding that employed ex-offenders are less likely to return to prison than
unemployed offenders. This finding was supported within one year and two years of
employment.
PRIDE’s questionable effects on offender’s rehabilitation should be considered
when evaluating its need in the correctional setting. PRIDE actively promoted post
release employment, and it also met several of its other stated goals such as reducing
inmate idleness and reducing the state operating costs. However, its exact effect on
recidivism remains nebulous. The data would suggest that employment acts as an
intervening variable, but further study is needed to support this idea.
Corrections should continue to use PRIDE services or similar vocational
programs. Further, PRIDE’s process for selecting inmates to participate in its programs
should be re-evaluated because they have increasingly limited the number of inmates
permitted to participate in the program. If PRIDE is able to increase its inmate work
force, positive outcomes of the program may be more visible.

28
APPENDIX A
TABLES

29
TABLE 1 DESCRIPTIVE STATISTICS OF STUDY COHORT DIVIDE BY LENGTHOF TIME IN PRIDE
PRIDE Experience
CharacteristicsNo Experience
(N=15,113)
Less Than 6Months
(N=2,978)
6 Months orMore
(N=2,350)Total
(N=20,441)
Demographic
Mean Age at Release(Years) 33.0 33.7 36.3 33.5% Male 89.3 93.9 96.0 90.7%Female 11.7 6.1 4.0 9.3% White 33.8 46.1 54.0 37.9% African American 60.0 46.9 40.0 55.8% Hispanic 6.0 7.0 6.0 6.3% Never Married 40.3 39.7 41.7 40.4%Never Grad High Sc 67.7 65.1 62.0 75.5%Florida Resident 93.6 93.5 93.1 93.5
Criminal History
% Prior Convictions 45.3 46.8 53.9 46.5% Violent Offender 23.1 22.2 28.0 23.5% Property Offender 30.8 35.5 35.9 32.0% Drug Offender 32.0 26.7 22.2 30.1% Other Offender 14.1 15.7 13.9 14.3%Habitual Offender 13.5 15.9 21.4 14.8%Violent Habitual Off 1.0 1.0 1.4 1.1
IncarcerationHistory
%DisciplinaryMisconduct in Prison 49.0 55.7 57.0 50.9Mean Time in Prison(Months) 23.6 33.0 47.4 21.7%Supervised AfterRelease 25.8 29.2 40.3 27.9
Post ReleaseHistory%Employed w/in OneYears After Release 38.6 43.7 48.5 40.5%Employed w/in TwoYears After Release 41.7 45.7 50.7 43.3%Recommitted w/inOne Year AfterRelease
5.1 5.0 4.3 5.0
%Recommitted w/inTwo Years AfterRelease
14.7 13.5 12.5 14.3

30
TABLE 2 LOGISTIC REGRESSION FOR PRIDE PARTICIPATION & RECIDIVISMRECOMMITTED
TWO YEARS1RECOMMITTED
TWO YEARSRECOMMITTED
ONE YEAR1
Variable N= 4,613 N= 20,441 N=3,235Estimate S.E Odds
RatioEstimate S.E. Odds
RatioEstimate S.E. Odds
RatioIntercept 0.55 0.45 -1.35C 0.31 -2.39C 0.65PRIDE Participation 0.04 0.08 1.04 -0.06 0.05 0.94 0.10 0.10 1.10In Facility w/ PRIDE -0.12 0.08 0.89 0.01 0.05 1.01 -0.07 0.10 0.94Educ after Release -0.29 0.29 0.75Employ w/in Two Yr -0.74C 0.08 0.48Employ w/in One Yr 0.005 -0.62C 0.09 0.53Age at Release -0.01B 0.002 0.99 -0.04C 0.003 0.97 0.01 0.01 1.01Months in Prison 0.002 0.12 1.00 -0.01C 0.001 0.99 -0.002 0.002 1.00Violent Primary Off. 0.14 0.10 1.15 -0.15 0.08 0.86 0.28 0.16 1.33Property Primary Off. 0.13 0.10 1.14 0.19B 0.07 1.21 0.31A 0.13 1.37Drug Primary Offense -0.12 0.45 0.89 -0.06 0.07 0.95 0.03 0.14 1.03Male 0.67C 0.13 1.95 0.42C 0.10 1.53 0.39A 0.19 1.48Black 0.01 0.08 1.01 0.16B 0.05 1.17 -0.12 0.10 0.89Hispanic -0.53B 0.18 0.59 -0.36B 0.12 0.70 -0.31 0.26 0.74High School Graduate 0.06 0.08 1.06 -0.08 0.05 0.92 -0.07 0.10 0.94Doesn’t Speak English -0.62 0.42 0.54 -1.05C 0.27 0.35 -0.16 0.58 0.85Born in US -0.15 0.23 0.86 0.18 0.14 1.20 0.40 0.34 1.49Habitual Offender 0.33C 0.08 1.38 1.01C 0.06 2.75 0.32A 0.10 1.37Florida Resident 0.22 0.30 1.24 0.73C 0.22 2.07 0.62 0.45 1.87Violent Habitual 0.06 0.26 1.07 1.12C 0.17 3.07 0.15 0.32 1.17Supervised Release 0.39C 0.09 1.47 -0.13A 0.06 0.88 0.39C 0.11 1.48Burglary Conviction2 0.11 0.10 1.12 -0.01 0.07 0.99 0.12 0.13 1.13Homicide Conviction2 -0.33 0.24 0.72 -0.61A 0.16 0.54 -0.38 0.35 0.69Other Violent Conv.2 0.01 0.09 1.01 -0.10 0.07 0.91 0.11 0.13 1.11Robbery Conviction2 -0.11 0.11 0.90 -0.18A 0.07 0.84 -0.05 0.14 0.96Sexual Assault Conv2 -0.19 0.19 0.83 -0.47C 0.13 0.63 -0.23 0.27 0.80No Prior Convictions -0.47C 0.08 0.62 -0.70C 0.05 0.50 -0.23B 0.11 0.79No Prison Misconduct -0.21B 0.07 0.81 -0.38C 0.05 0.68 -0.05 0.10 0.95Single 0.06 0.07 1.06 0.05 0.05 1.06 0.17 0.09 1.181These recommitment models include variables for employment, so only inmates with verifiable workhistories are included in the models. Further, only inmates recommitted for a new crime and not a technicalviolation are included in these models as well. These restrictions decrease the overall sample, but improvethe accuracy of the model.2Conviction variables are for the most serious offense the offender has ever been convicted of in thecriminal justice system. May or may not match primary offense.A=p<.05,B=p<.01,C=p<.001
31
TABLE 3 SURVIVAL ANALYSIS FOR PRIDE PARTICIPATION ANDRECOMMITMENT TO PRISON W/IN TWO YEARS
RECOMMITTEDTWO YEARS1
Variable N= 10,807ParameterEstimate
S.E. HazardRatio
PRIDE Participation 0.01 0.05 1.01In Facility w/ PRIDE -0.09 0.05 0.92Educ After Release 0.27 0.18 1.31Employ w/in Two Yrs -0.54C 0.04 0.58Age at Release -0.03 C 0.003 0.97Months in Prison -0.01 C 0.001 0.99Violent Primary Offense -0.14 0.08 0.87Property Primary Off. 0.14 B 0.07 1.15Drug Primary Offense -0.08 0.07 0.92Male 0.67 C 0.10 1.96Black 0.12 A 0.04 1.12Hispanic -0.37 B 0.12 0.69High School Graduate -0.001 0.05 1.00Doesn’t Speak English -0.96 0.32 0.38Born in US 0.02 0.13 1.02Habitual Offender 0.61 C 0.05 1.84Florida Resident 0.64 B 0.21 1.89Violent Habitual 0.73 C 0.15 2.08Supervised Release -0.18 C 0.05 0.84Burglary Conviction2 0.002 0.07 1.00Homicide Conviction2 -0.57 C 0.16 0.57Other Violent Conv.2 -0.07 0.06 0.93Robbery Conviction2 -0.11 0.07 0.89Sexual Assault Conv2 -0.50 C 0.13 0.60No Prior Convictions -0.50 C 0.05 0.60No Prison Misconduct -0.26 C 0.05 0.77Single 0.06 0.04 1.071These recommitment models include variables for employment, so only inmates with verifiable workhistories are included in the models. Further, only inmates recommitted for a new crime and not a technicalviolation are included in these models as well. These restrictions decrease the overall sample, but improvethe accuracy of the model.2Conviction variables are for the most serious offense the offender has ever been convicted of in thecriminal justice system. May or may not match primary offense.A=p<.05,B=p<.01,C=p<.001

32
TABLE 4 LOGISTIC REGRESSION FOR PRIDE PARTICIPATION V. BEING IN AFACILITY WITH PRIDE AND RECIDIVISM
RECOMMITTEDTWO YEARS1
RECOMMITTEDTWO YEARS
RECOMMITTEDONE YEAR1
Variable N=1,513 N=6,471 N=1,053Estimate S.E Odds
RatioEstimate S.E. Odds
RatioEstimate S.E. Odds
RatioIntercept 1.20 0.73 -0.92 0.48 -0.98 1.02PRIDE Participation(In Facility)
-0.02 0.14 0.98 -0.10 0.09 0.90 0.12 0.18 1.13
Educ after Release -0.05 0.44 0.95Employ w/in Two Yr -0.77C 0.13 0.46Employ w/in One Yr -0.81C 0.15 0.44Age at Release -0.02A 0.008 0.98 -0.04C 0.005 0.96 -0.01 0.01 0.99Months in Prison 0.004 0.003 1.00 -0.01C 0.002 0.99 -0.01 0.004 0.99Violent Primary Off. 0.09 0.21 1.09 -0.14 0.14 0.87 0.17 0.28 1.18Property Primary Off. -0.04 0.17 0.96 0.14 0.12 1.15 0.19 0.23 1.21Drug Primary Offense -0.08 0.18 0.92 -0.01 0.12 0.99 -0.30 0.24 0.74Male 0.59C 0.16 1.81 0.40C 0.12 1.49 0.36 0.23 1.43Black -0.11 0.12 0.90 0.12 0.09 1.12 -0.13 0.16 0.88Hispanic -0.78A 0.32 0.46 -0.40 0.21 0.67 -1.18A 0.55 0.31High School Graduate 0.30A 0.14 1.35 -0.09 0.09 0.92 0.28 0.18 1.32Doesn’t Speak English -0.72 0.87 0.49 -1.13A 0.52 0.32 -13.16 617.7 <0.001Born in US -0.43 0.39 0.65 -0.04 0.23 0.96 -0.04 0.58 0.96Habitual Offender 0.30A 0.13 1.34 0.96C 0.10 2.61 0.11 0.17 1.12Florida Resident -0.03 0.50 0.97 0.63 0.34 1.88 0.51 0.68 1.66Violent Habitual 0.77 0.49 2.16 1.56C 0.28 4.77 0.01 0.56 1.01Supervised Release 0.36A 0.15 1.44 -0.19A 0.10 0.82 0.56B 0.19 1.75Burglary Conviction2 0.13 0.17 1.14 0.10 0.12 1.11 0.27 0.23 1.30Homicide Conviction2 0.06 0.41 1.07 -0.63A 0.278 0.53 0.37 0.60 1.45Other Violent Conv.2 0.16 0.16 1.18 0.01 0.12 1.01 0.02 0.23 1.02Robbery Conviction2 0.001 0.18 1.00 -0.08 0.13 0.92 0.15 0.25 1.17Sexual Assault Conv2 0.31 0.36 1.37 -0.24 0.22 0.79 -0.02 0.50 0.99No Prior Convictions -0.62C 0.14 0.54 -0.77C 0.09 0.47 -0.39A 0.19 0.68No Prison Misconduct -0.30A 0.13 0.74 -0.33C 0.09 0.72 -0.25 0.17 0.78Single 0.20 0.11 1.22 0.17A 0.08 1.18 0.08 0.15 1.091These recommitment models include variables for employment, so only inmates with verifiable workhistories are included in the models. Further, only inmates recommitted for a new crime and not a technicalviolation are included in these models as well. These restrictions decrease the overall sample, but improvethe accuracy of the model.2Conviction variables are for the most serious offense the offender has ever been convicted of in thecriminal justice system. May or may not match primary offense.A=p<.05,B=p<.01,C=p<.001
33
TABLE 5 SURVIVAL ANALYSIS FOR PRIDE PARTICIPATION V. BEING INFACILITIY WITH PRIDE AND RECOMMITMENT TO PRISON W/INTWO YEARS
RECOMMITTEDTWO YEARS1
Variable N= 4,125ParameterEstimate
S.E. HazardRatio
PRIDE Part. (In Facility) -0.02 0.09 0.98Educ After Release 0.52 A 0.27 1.69Employ w/in Two Yrs -0.53C 0.08 0.59Age at Release -0.04 C 0.01 0.96Months in Prison -0.01 C 0.002 0.99Violent Primary Offense -0.19 0.13 0.82Property Primary Off. 0.01 0.11 1.01Drug Primary Offense -0.06 0.12 0.94Male 0.65 C 0.12 1.92Black 0.03 0.08 1.03Hispanic -0.43 0.23 0.65High School Graduate 0.09 0.09 1.09Doesn’t Speak English -1.48 A 0.71 0.23Born in US -0.07 0.25 0.94Habitual Offender 0.66 C 0.08 1.93Florida Resident 0.42 0.32 1.52Violent Habitual 1.10 C 0.24 3.02Supervised Release -0.22 A 0.09 0.81Burglary Conviction2 0.06 0.12 1.07Homicide Conviction2 -0.47 0.27 0.63Other Violent Conv.2 -0.001 0.11 1.00Robbery Conviction2 -0.02 0.12 0.98Sexual Assault Conv2 -0.33 0.22 0.72No Prior Convictions -0.60 C 0.09 0.55No Prison Misconduct -0.28 C 0.08 0.76Single 0.16 A 0.08 1.181These recommitment models include variables for employment, so only inmates with verifiable workhistories are included in the models. These restrictions decrease the overall sample, but improve theaccuracy of the model.2Conviction variables are for the most serious offense the offender has ever been convicted of in thecriminal justice system. May or may not match primary offense.A=p<.05,B=p<.01,C=p<.001
34
TABLE 6 LOGISTIC REGRESSION OF BEING IN PRIDE FOR SIX MONTHS ORMORE V. LESS THAN SIX MONTHS AND RECIDIVISM
RECOMMITTEDTWO YEARS1
RECOMMITTEDTWO YEARS
RECOMMITTEDONE YEAR1
Variable N=1,050 N=4,792 N= 733Estimate S.E Odds
RatioEstimate S.E. Odds
RatioEstimate S.E. Odds
RatioIntercept 0.52 0.88 -0.86 0.54 -16.21 660.4PRIDE Participation(Six Month or Longer) -0.13 0.14 0.88 -0.08 0.10 0.925 -0.16 0.18 0.86Educ after Release 0.28 0.70 1.31Employ w/in Two Yr -0.59C 0.17 0.55Employ w/in One Yr -0.72C 0.19 0.49Age at Release 0.003 0.01 1.00 -0.02C 0.006 0.98 0.01 0.01 1.01Months in Prison 0.001 0.003 1.00 -0.01C 0.002 0.99 -0.004 0.004 1.00Violent Primary Off. -0.04 0.25 0.95 -0.43B 0.16 0.65 0.39 0.33 1.47Property Primary Off. -0.02 0.19 0.99 -0.01 0.13 0.99 0.20 0.26 1.22Drug Primary Offense -0.28 0.21 0.76 -0.24 0.14 0.78 -0.30 0.28 0.74Male 0.52 0.31 1.70 0.02 0.22 1.02 0.35 0.44 1.42Black 0.21 0.15 1.22 0.21A 0.10 1.24 0.12 0.19 1.12Hispanic -0.89A 0.37 0.41 -0.50 0.24 0.61 -0.50 0.53 0.61High School Graduate 0.16 0.16 1.17 -0.06 0.10 0.94 -0.02 0.20 0.98Doesn’t Speak English -0.61 1.24 0.54 -1.87 1.01 0.15 0.68 1.25 1.97Born in US -0.50 0.44 0.61 -0.20 0.26 0.82 0.37 0.67 1.44Habitual Offender 0.17 0.16 1.18 0.95C 0.11 2.57 0.52B 0.20 1.69Florida Resident 0.46 0.56 1.60 0.79 0.43 2.20 14.48 660.4 >999.9Violent Habitual 0.73 0.55 2.04 1.59C 0.32 4.91 0.73 0.60 2.08Supervised Release 0.31 0.17 1.37 -0.18 0.11 0.83 0.51A 0.22 1.67Burglary Conviction2 -0.03 0.20 0.98 -0.01 0.14 0.99 0.41 0.27 1.51Homicide Conviction2 -0.53 0.47 0.59 -0.77A 0.31 0.47 -0.03 0.66 0.97Other Violent Conv.2 -0.15 0.20 0.86 -0.08 0.14 0.92 0.33 0.27 1.39Robbery Conviction2 -0.27 0.23 0.77 -0.25 0.16 0.76 -0.04 0.31 0.97Sexual Assault Conv2 0.15 0.42 1.16 -0.07 0.27 0.93 0.33 0.54 1.39No Prior Convictions -0.57C 0.16 0.56 -0.74C 0.11 0.48 -0.15 0.21 0.86No Prison Misconduct -0.20 0.15 0.82 -0.34C 0.10 0.71 0.22 0.20 1.25Single -0.11 0.14 0.90 0.10 0.09 1.10 -0.14 0.18 0.871These recommitment models include variables for employment, so only inmates with verifiable workhistories are included in the models. Further, only inmates recommitted for a new crime and not a technicalviolation are included in these models as well. These restrictions decrease the overall sample, but improvethe accuracy of the model.2Conviction variables are for the most serious offense the offender has ever been convicted of in thecriminal justice system. May or may not match primary offense.A=p<.05,B=p<.01,C=p<.001

35
TABLE 7 SURVIVAL ANALYSIS FOR BEING IN PRIDE SIX MONTHS OR MOREV. LESS THAN SIX MONTHS AND RECOMMITMENT TO PRISON W/INTWO YEARS
RECOMMITTEDTWO YEARS1
Variable N= 2,848ParameterEstimate
S.E. HazardRatio
PRIDE Participation(Six Month or Longer) -0.12 0.09 0.89Educ After Release 0.64 0.35 1.90Employ w/in Two Yrs -0.38C 0.10 0.69Age at Release -0.02 C 0.01 0.98Months in Prison -0.01 C 0.002 0.99Violent Primary Offense -0.35 B 0.16 0.70Property Primary Off. -0.04 0.12 0.96Drug Primary Offense -0.28 B 0.13 0.76Male 0.33 0.22 1.39Black 0.20 B 0.09 1.22Hispanic -0.54 B 0.25 0.58High School Graduate 0.05 0.10 1.05Doesn’t Speak English -1.33 1.00 0.27Born in US -0.07 0.26 0.93Habitual Offender 0.63 C 0.10 1.87Florida Resident 0.73 0.41 2.07Violent Habitual 1.22 C 0.28 3.40Supervised Release -0.26 A 0.10 0.77Burglary Conviction2 -0.10 0.13 0.91Homicide Conviction2 -0.72 A 0.32 0.49Other Violent Conv.2 -0.13 0.13 0.88Robbery Conviction2 -0.28 0.15 0.76Sexual Assault Conv2 -0.22 0.25 0.80No Prior Convictions -0.55 C 0.11 0.58No Prison Misconduct -0.25 B 0.09 0.78Single -0.01 0.09 0.991These recommitment models include variables for employment, so only inmates with verifiable work
histories are included in the models. These restrictions decrease the overall sample, but improve theaccuracy of the model.2Conviction variables are for the most serious offense the offender has ever been convicted of in thecriminal justice system. May or may not match primary offense.A=p<.05,B=p<.01,C=p<.001
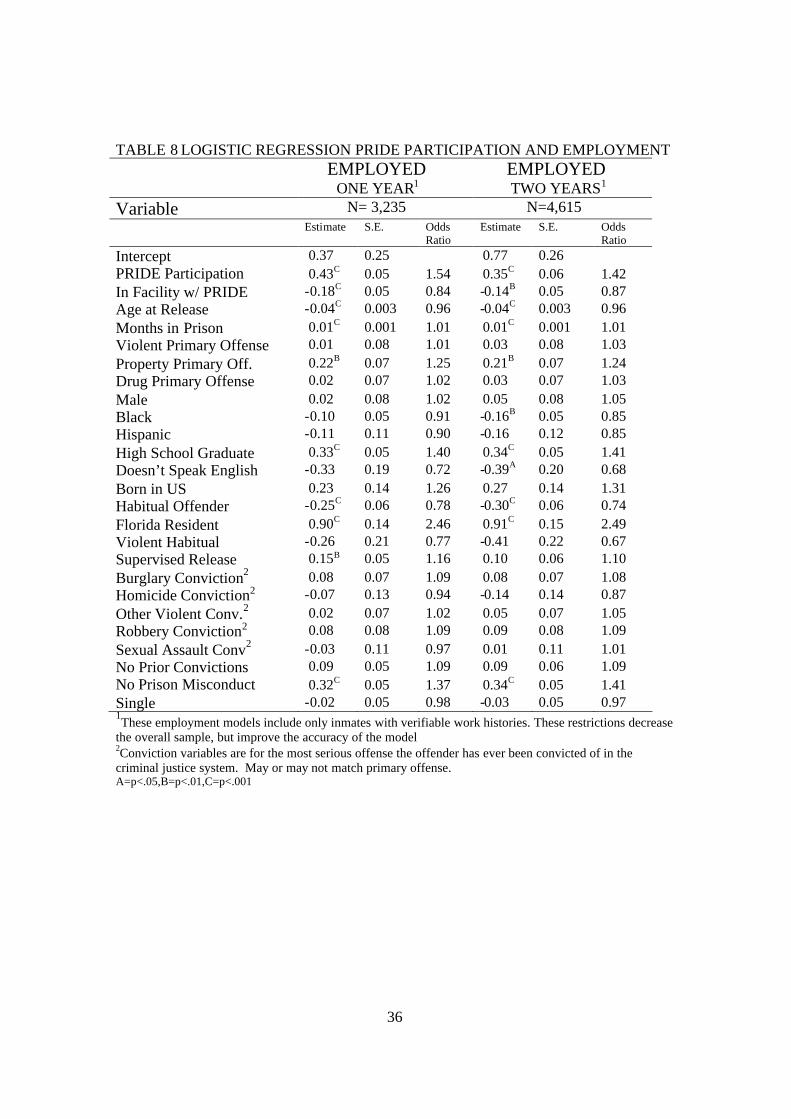
36
TABLE 8 LOGISTIC REGRESSION PRIDE PARTICIPATION AND EMPLOYMENTEMPLOYED
ONE YEAR1EMPLOYEDTWO YEARS1
Variable N= 3,235 N=4,615Estimate S.E. Odds
RatioEstimate S.E. Odds
RatioIntercept 0.37 0.25 0.77 0.26PRIDE Participation 0.43C 0.05 1.54 0.35C 0.06 1.42In Facility w/ PRIDE -0.18C 0.05 0.84 -0.14B 0.05 0.87Age at Release -0.04C 0.003 0.96 -0.04C 0.003 0.96Months in Prison 0.01C 0.001 1.01 0.01C 0.001 1.01Violent Primary Offense 0.01 0.08 1.01 0.03 0.08 1.03Property Primary Off. 0.22B 0.07 1.25 0.21B 0.07 1.24Drug Primary Offense 0.02 0.07 1.02 0.03 0.07 1.03Male 0.02 0.08 1.02 0.05 0.08 1.05Black -0.10 0.05 0.91 -0.16B 0.05 0.85Hispanic -0.11 0.11 0.90 -0.16 0.12 0.85High School Graduate 0.33C 0.05 1.40 0.34C 0.05 1.41Doesn’t Speak English -0.33 0.19 0.72 -0.39A 0.20 0.68Born in US 0.23 0.14 1.26 0.27 0.14 1.31Habitual Offender -0.25C 0.06 0.78 -0.30C 0.06 0.74Florida Resident 0.90C 0.14 2.46 0.91C 0.15 2.49Violent Habitual -0.26 0.21 0.77 -0.41 0.22 0.67Supervised Release 0.15B 0.05 1.16 0.10 0.06 1.10Burglary Conviction2 0.08 0.07 1.09 0.08 0.07 1.08Homicide Conviction2 -0.07 0.13 0.94 -0.14 0.14 0.87Other Violent Conv.2 0.02 0.07 1.02 0.05 0.07 1.05Robbery Conviction2 0.08 0.08 1.09 0.09 0.08 1.09Sexual Assault Conv2 -0.03 0.11 0.97 0.01 0.11 1.01No Prior Convictions 0.09 0.05 1.09 0.09 0.06 1.09No Prison Misconduct 0.32C 0.05 1.37 0.34C 0.05 1.41Single -0.02 0.05 0.98 -0.03 0.05 0.971These employment models include only inmates with verifiable work histories. These restrictions decrease
the overall sample, but improve the accuracy of the model2Conviction variables are for the most serious offense the offender has ever been convicted of in thecriminal justice system. May or may not match primary offense.A=p<.05,B=p<.01,C=p<.001

37
TABLE 9 LOGISTIC REGRESSION OF PRIDE PARTICIPATION V. BEING INFACILITIY WITH PRIDE AND EMPLOYMENT
EMPLOYEDONE YEAR1
EMPLOYEDTWO YEARS1
Variable N=1,053 N=1,513Estimate S.E Odds
RatioEstimate S.E. Odds
RatioIntercept -0.25 0.39 0.25 0.40PRIDE Part. (In Facility) 0.56C 0.090 1.66 0.45C 0.09 1.57Age at Release -0.04C 0.004 0.96 -0.05C 0.005 0.95Months in Prison 0.01C 0.002 1.01 0.01C 0.002 1.01Violent Primary Offense 0.11 0.13 1.12 0.19 0.13 1.21Property Primary Off. 0.31B 0.11 1.37 0.33B 0.12 1.38Drug Primary Offense 0.01 0.12 1.01 0.11 0.12 1.12Male 0.12 0.09 1.13 0.14 0.10 1.14Black -0.06 0.08 0.94 -0.11 0.08 0.89Hispanic -0.12 0.19 0.89 -0.01 0.21 0.99High School Graduate 0.37C 0.08 1.45 0.40C 0.09 1.48Doesn’t Speak English -0.60A 0.30 0.55 -0.67A 0.30 0.51Born in US 0.26 0.22 1.30 0.30 0.23 1.35Habitual Offender -0.07 0.10 0.94 -0.07 0.10 0.93Florida Resident 1.46C 0.24 4.28 1.33C 0.24 3.79Violent Habitual -0.06 0.38 0.94 0.002 0.41 1.00Supervised Release 0.03 0.09 1.04 -0.05 0.09 0.95Burglary Conviction2 -0.004 0.11 1.00 0.04 0.12 1.04Homicide Conviction2 0.09 0.22 1.09 0.06 0.23 1.06Other Violent Conv.2 -0.02 0.11 0.98 0.02 0.11 1.01Robbery Conviction2 0.008 0.12 1.01 -0.003 0.13 1.00Sexual Assault Conv2 -0.10 0.18 0.90 -0.008 0.19 0.99No Prior Convictions 0.13 0.08 1.13 0.16 0.09 1.18No Prison Misconduct 0.19A 0.08 1.21 0.23B 0.08 1.26Single -0.10 0.08 0.91 -0.10 0.08 0.901These employment models include only inmates with verifiable work histories. These restrictions decrease
the overall sample, but improve the accuracy of the model.2Conviction variables are for the most serious offense the offender has ever been convicted of in thecriminal justice system. May or may not match primary offense.A=p<.05,B=p<.01,C=p<.001

38
TABLE 10 LOGISTIC REGRESSION BEING IN PRIDE SIX MONTHS OR MORE V.LESS THAN SIX MONTHS AND EMPLOYMENT
EMPLOYEDONE YEAR1
EMPLOYEDTWO YEARS1
Variable N=733 N=1,050Estimate S.E Odds
RatioEstimate S.E. Odds
RatioIntercept 0.73 0.52 1.03 0.54 1.07PRIDE Participation(Six Month or Longer) 0.06 0.10 1.07 0.07 0.10 0.96Age at Release -0.04C 0.006 0.96 -0.05C 0.006 1.01Months in Prison 0.01C 0.002 1.01 0.01C 0.002 0.96Violent Primary Offense -0.01 0.16 0.99 -0.04 0.17 1.30Property Primary Off. 0.35A 0.14 1.42 0.26 0.15 1.17Drug Primary Offense 0.17 0.15 1.18 0.15 0.16 0.95Male 0.11 0.20 1.12 -0.05 0.22 0.92Black 0.01 0.10 1.01 -0.08 0.11 0.77Hispanic -0.32 0.22 0.73 -0.26 0.24 1.31High School Graduate 0.32B 0.11 1.37 0.27A 0.11 1.03Doesn’t Speak English 0.22 0.53 1.24 0.03 0.53 1.78Born in US 0.35 0.26 1.41 0.57A 0.27 0.85Habitual Offender -0.16 0.12 0.85 -0.16 0.13 2.13Florida Resident 0.69A 0.28 1.99 0.76B 0.28 0.83Violent Habitual -0.29 0.40 0.75 -0.18 0.43 0.31Supervised Release 0.07 0.11 1.07 0.04 0.12 1.23Burglary Conviction2 0.19 0.16 1.21 0.21 0.16 1.06Homicide Conviction2 0.16 0.26 1.17 0.05 0.27 1.07Other Violent Conv.2 -0.03 0.15 0.97 0.06 0.16 1.08Robbery Conviction2 0.05 0.17 1.05 0.07 0.18 0.98Sexual Assault Conv2 -0.14 0.25 0.87 -0.02 0.26 1.25No Prior Convictions 0.28A 0.11 1.33 0.22 0.12 1.46No Prison Misconduct 0.32B 0.10 1.37 0.38C 0.11 0.78Single -0.20A 0.10 0.82 -0.24A 0.11 1.071These employment models include only inmates with verifiable work histories. These restrictions decreasethe overall sample, but improve the accuracy of the model.2Conviction variables are for the most serious offense the offender has ever been convicted of in thecriminal justice system. May or may not match primary offense.A=p<.05,B=p<.01,C=p<.001

39
TABLE 11 LOGISTIC REGRESSION BETWEEN PRIDE PARTICIPATIONAND RECIDIVISM WHEN HOLDING EMPLOYMENT CONSTANT
RECOMMITTEDTWO YEARS 1
RECOMMITTEDTWO YEARS 1
Variable EmployedN=3,269
UnemployedN=1,254
Estimate S.E. OddsRatio
Estimate S.E. OddsRatio
Intercept -0.59 0.52 1.66 0.98PRIDE Participation 0.04 0.09 1.05 -0.03 0.17 0.97In Facility w/ PRIDE -0.10 0.09 0.91 -0.16 0.15 0.85Age at Release -0.01 0.001 1.00 -0.03B 0.01 0.97Months in Prison 0.001 0.002 1.00 0.004 0.004 1.00Violent Primary Off. 0.13 0.14 1.14 0.15 0.25 1.16Property Primary Off. 0.09 0.12 1.10 0.29 0.20 1.33Drug Primary Offense -0.10 0.12 0.91 -0.16 0.20 0.85Male 0.71C 0.16 2.04 0.64 B 0.23 1.90Black 0.08 0.09 1.08 -0.18 0.16 0.84Hispanic -0.54B 0.21 0.58 -0.43 0.39 0.65High School Graduate 0.01 0.09 1.01 0.13 0.16 1.14Doesn’t Speak English -0.77 0.60 0.46 -0.54 0.64 0.58Born in US -0.25 0.27 0.78 0.10 0.48 1.10Habitual Offender 0.27 B 0.10 1.31 0.45 B 0.15 1.57Florida Resident 0.41 0.35 1.50 -0.60 0.76 0.55Violent Habitual 0.20 0.32 1.23 -0.23 0.44 0.80Supervised Release 0.43 C 0.10 1.54 0.24 0.18 1.26Burglary Conviction2 0.18 0.11 1.20 -0.11 0.19 0.90Homicide Conviction2 -0.24 0.28 0.79 -0.53 0.44 0.59Other Violent Conv.2 -0.06 0.11 0.94 0.21 0.18 1.24Robbery Conviction2 -0.22 0.13 0.80 0.22 0.21 1.25Sexual Assault Conv2 -0.15 0.22 0.86 -0.37 0.40 0.69No Prior Convictions -0.45 C 0.09 0.64 -0.53 B 0.16 0.59No Prison Misconduct -0.22 B 0.09 0.80 -0.19 0.15 0.83Single 0.11 0.08 1.12 -0.07 0.13 0.931These recommitment models include variables for employment, so only inmates with verifiable workhistories are included in the models. These restrictions decrease the overall sample, but improve theaccuracy of the model.2Conviction variables are for the most serious offense the offender has ever been convicted of in thecriminal justice system. May or may not match primary offense.A=p<.05,B=p<.01,C=p<.001

40
APPENDIX B
DEFINITION OF KEY VARIABLES

41
PRIDE PARTICIPATION1=Entire PRIDE Cohort/participants in FDOC Recidivism File0=All Inmates in Recidivism File who did not participate in PRIDE program
PRIDE PARTICIPATION (IN FACILITY)1=PRIDE Participants who worked for PRIDE for six months or longer0=Non-PRIDE participants, but released inmates that were incarcerated in facilities that offered PRIDE
PRIDE PARTICIPATION (SIX MONTH OR LONGER)1= PRIDE Participants who worked for PRIDE for 6 months or longer0= PRIDE Participants who worked for PRIDE for less than 6 months
IN FACLITY W/ PRIDE 1=Incarcerated in a facility offering PRIDE0=Not Incarcerated in a facility offering PRIDE
EDUC AFTER RELEASE 1=Not employed, but returned or started college0=Did not return or start college
EMPLOYED TWOYEAR 1=Employed two years after release0=Not employed two years after release
EMPLOYED ONEYEAR 1=Employed one year after release0=Not employed one year after release
AGE AT RELEASE Continuous variable, Age of inmate upon his orher release from prison (in Years)
MONTHS IN PRISON Continuous variable, Length of time the offenderspent incarcerated (Months)
VIOLENT PRIMARY OFF 1=Prior Offense was violent (murder, robbery,assault, sexual assault, other assault)
0=Prior Offense was non-violent
PROPERTY PRIMARY OFF 1=Prior Offense was a property crime (Burglary,theft, other property)
0=Prior Offense was a non-property crime
DRUG PRIMARY OFF DUM 1=Prior Offense was drug related0=Prior Offense was non-drug related
MALE 1=Male0=Female
BLACK1=Black0=Non-Black
HISPANIC 1=Hispanic0=Non Hispanic
HIGH SCHOOL GRAD. 1=High School Graduate or above0=Non High School Graduate

42
DOESN’T SPEAK ENGL. 1=Doesn’t Speak English0=Does Speak English
BORN IN US 1=Born In the US0=Not Born in the US
HABITUAL OFFENDER 1=Defined By DOC as Habitual Offender0=Not Defined as Habitual Offender
FLORIDA RESIDENT 1=Florida Resident0=Non-Florida Resident
VIOLENT HABITUAL 1=Defined by DOC as Violent HabitualOffender
0=Not Defined by DOC as Violent HabitualOffender
SUPERVISE RELEASE 1=Receives supervision while released0=Does not receive any supervision during
release
BURGLARY CONVICTION 1=Most Serious Conviction ever committedBurglary
0=Most Serious Conviction ever committednot Burglary
HOMICIDE CONVICTION 1=Most Serious Conviction ever committedHomicide
0=Most Serious Conviction ever committednot Homicide
OTHER VIOLENT CONVICTION 1=Most Serious Conviction ever committedOther Type of Violent Crime
0=Most Serious Conviction ever committednot Other Types of Violent Crime
ROBBERY CONVICTION 1=Most Serious Conviction ever committedRobbery
0=Most Serious Conviction ever committednot Robbery
SEXUAL ASSUALT CONVICTION 1=Most Serious Conviction ever committedSexual Assault
0=Most Serious Conviction ever committednot Sexual Assault
NO PRIOR CONVICTION 1=No Prior Convictions0=Prior Convictions
NO PRISON MISCONDUCT 1=No Disciplinary Misconduct Report0=Disciplinary Misconduct reports
SINGLE 1=Never Married, Divorced, or Widowed0=Married, Divorced or Widowed

43
RECOMMIT24 1=Recommitted to Prison within two yearsof releases
0=Not Recommitted to Prison within twoyears of release
RECOMMIT12 1=Recommitted to Prison within one year ofreleases
0=Not Recommitted to Prison within oneyear of release

44
REFERENCES
Adams, K., Bennett, K. J., Flanagan, T. J., Marquart, J. W., Cuvelier, S. J., & Fritsch, E.(1994). A large scale multi-dimensional test of the effect of prison educationprograms on offenders; behavior. The Prison Journal, 74: 433-449.
Adamson, C. (1983). Punishment after slavery: Southern state penal systems, 1865-1890.Social Problems 30(5): 555-569.
Allik, J., & Realo, A. (2004). Individualism-collectivism and social capital. Journal ofCross Cultural Psychology 35(1): 29-49.
Anderson, D. B. (1982). The relationship between correctional education and parolesuccess. Journal of Offender Counseling, Services and Rehabilitation, 5: 13-25.
Anderson, S. V. (1995a). Evaluation of the impact of correctional education programs onrecidivism. Ohio Department of Rehabilitation and Correction, Bureau of Planningand Evaluation.
Anderson, S. V. (1995b). Evaluation of the impact of participation in Ohio penalindustries on recidivism. Ohio Department of Rehabilitation and Correction, Bureauof Planning and Evaluation.
Bales, W., Bedard, L.E. & Quinn, S.T. (2003). Recidivism: An analysis of public andprivate state prison release in Florida. Tallahassee, Fl: Florida Department ofCorrections.
Baskin, D.R., & Sommers, I.B. (1998). Causality of community disorder: Women’scareers in violent crimes. Boulder: Westview.
Blomberg, T.G., & Lucken, K. (2000). American penology: A history of control. NewYork: Aldine De Gruyter.
Brewster, D. R., & Sharp, S. F. (2002). Educational programs and recidivism inOklahoma: Another look. The Prison Journal, 82(3), 314-334.
Burger, W.E. (1985). Prison industries: Turning warehouses into fences. PublicAdministration Review 45: 754-757.
Chiricos, T. (2002). The media, moral panics and the politics of crime control. In G.F.Cole, M.G.Gertz, & A. Bunger (Eds), The Criminal Justice System: Politics andPolicies (p. 59-79). Belmont: Wadsworth.

45
Craig, D., & Robert, R. (1993). Vocational Training in Prison: A Case of study ofmaximum feasible misunderstanding. Journal of Offender Rehabilitation 20(1/2): 1-20.
Cullen, F.T. & Agnew, R. (2003). Criminological theory: Past to present. Los Angeles:Roxbury.
Drake, E.K. (2003). Class I impacts: Work during incarceration and its effect on postprison employment patterns and recidivism. Olympia, WA: Washington StateDepartment of Corrections.
FETPIP. (July 5 2005). FETPIP: General overview. [Online]. Available:http://www.firn.edu/doe/fetpip/general.htm.
Funke, G.S.,Wayson, B.L. & N. Miller. (1982). Assets and liabilities of correctionalindustries. Toronto: Lexington.
Gendreau, P., Little, T., & Goggin, C. (1996). A meta-analysis of the predictors of adultoffender recidivism: What works! Criminology 34(4): 575-607.
Gerber, J., & Fritsch, E.J. (1995). Adult academic and vocational correctionaleducation programs: A review of recent research. Journal of OffenderRehabilitation 22(1/2): 119-142.
Gillis, C., Robinson, D., & Porporino, F. (1996). Inmate employment: The increasinglyinfluential role of generic work skills. Forums on Corrections Research 8(1): 18.
Gleason, S. E. Inmates attitudes toward vocational training: A case study ofvocational training students in the state prison of southern michigan. Journalof Offender Counseling, Services, & Rehabilitation 10(4): 49-60 (1986).
Giordano, P.C., Cernkovich, S.A., & Rudolph, J.L. (2002). Gender, crime, anddesistence: Toward a theory of cognitive transformation. American Journal ofSociology 107(4): 990-1064.
Hawkins, G. (1983). Prison labor and prison industries. Crime and Justice 5: 85-127.
Harrison, B., & Schehr, R.C. (2004). Offenders and post-release jobs: Variablesinfluencing success and failure. Journal of Offender Rehabilitation 39(3): 35-68.
Henderson, M.L. (2001). Employment and crime: What is the problem and what can bedone about it from the inmate’s perspective. Corrections ManagementQuarterly 5(4): 46-52.
Herreros, F. (2004). The problem of forming social capital: Why trust? NewYork: Palgrave.
46
Hooghe, M., & D. Stolle. (2003). Generating social capital: civil society andinstitutions in comparative perspective. New York: Palgrave.
Jacobs, J.B. (1999). United states of America; Prisoner labour: A tale of two penologies.In D. van Zyl Smit & F. Dunkel (Eds.), Prisoner Labour: Salvation or Slavery?International Perspectives (p. 281-296). Aldershot: Dartmouth Publishing.
Johnson, B. D., & Goldberg, R. T. (1983). Vocational and social rehabilitation ofdelinquents: A study of experimentals and controls. Journal of OffenderCounseling Services and Rehabilitation, 6(3), 43-60
Johnson, C.M. (1984). The effect of prison labor programs on post-release employmentand recidivism (Doctoral dissertation, Florida State University, Tallahassee,Florida, 1984).
Kennedy, S.M. (1997). Treating responsivity: Reducing recidivism by enhancingtreatment effectiveness. Forum of Corrections Research 9(3): 19-23.
Krienert, J.L., & Fleisher, M.S. (2001).Economic rehabilitation: A reassessment ofthe link between employment and crime. Corrections Management Quarterly5(4): 53-64.
Krishna, A. (2002). Active social capital: tracing roots of development anddemocracy. New York: Columbia University.
Lattimore, P. K., Witte, A.D., & Baker, J.R. (1990). Experimental assessment of theeffect of vocational training on youthful property offenders. EvaluationReview 14(2): 115-133.
Lipman, D, Martinson, R. & Wilkes, J. (1975). The effectiveness of correctionaltreatment: A survey of treatment evaluation studies. New York: Praeger.
Maguire, K., Flanagan, T., & Thornberry, T. (1988). Prison labor and recidivism. Journalof Quantitative Criminology, 4(1), 3-18.
Maguire, K. (1996). Prison industry programs and inmate institutional behavior. Forumon Corrections Research, 8(1): 39.
Martinson, R. (1974). What works? Question and answers about prison reform. ThePublic Interest 35: 22-54.
Myers, M.A., & Massey, J.L. (1991). Race, labor, and punishment in postbellumGeorgia. Social Problems 38(2): 267-286.
47
Motiuk, L., & Belcourt, R. (1996). CORCAN participation and post-release recidivism.Forum on Corrections Research, 8(1), 15.
OPPAGA. (2003). Special report: PRIDE benefits the state but needs to improvetransparency in operations. Tallahassee, FL: Author.
PRIDE. (2002). PRIDE enterprise: 2001 annual report. St. Petersburg, FL: Author.
Robinson, L.N. (1939). Should Prisoners Work? A study of the prison labor problem inthe United States. Philadelphia: Winston Company.
Ryan, T., & Desuta, J. (2000). Comparison of recidivism rates for operation outwardreach (OOR) participants and control groups of non-participants for the years 1990through 1994. Journal of Correctional Education, 51(4), 316.
Sampson, R.J. & Laub, J.H. (1993). Crime in the making: Pathways and turning pointsthrough life. Cambridge: Harvard University.
Saylor, W., & Gaes, G. (1996). Effect of prison employment andvocational/apprenticeship training on long-term recidivism. Forum on CorrectionsResearch, 8(1), 12.
Saylor, W.G.,&. Gaes, G.G. (2001). “The differential effect of industries andvocational training on post-release outcomes for ethnic and racial groups:Research note.” Corrections Management Quarterly 5(4): 17-24.
Seiter, R. P., & Kadela, K.R. (2003). “Prisoner reentry: What works, what Does not, andwhat is promising.” Crime & Delinquency 49(3): 360-388.
Schumacker, R.E., Anderson, D.B., &. Anderson, S.L. (1990). Vocational andacademic indicators of parole success. Journal of Correctional Education, 41(1),8-13.
Simon, F.H. (1999). Prisoners’ work and vocational training. London: Routtledge.
Sung, Hung-En. Rehabilitating Felony Drug Offenders through Job Development: Alook into a Prosecutor-Led Diversion Program. The Prison Journal 81(2): 271-286 (2001).
Uggen, Christopher. (2001).Working as a turning point for criminal offenders.Corrections Management Quarterly 5(4): 1-16.
Visher, Christy A. & Jeremy Travis. (2003). Transitions from prison to community:Understanding individual pathways. Annual Review of Sociology 29: 89-113

48
Waldo, G. P., & Chiricos, T.G. (1977). Work Releases and Recidivism: An EmpiricalEvaluation of a Social Policy. Evaluation Quarterly 1(1): 87-108.
Ward, R.D., & Rogers, W.W. (1987). Convicts, coal and the banner mine tragedy.Tuscaloosa: University of Alabama.
Wilson, D.B., Gallagher, C.A., & MacKenzie, D.L. (2000). A meta-analysis ofcorrections-based education, vocation, and work programs for adult offenders.Journal of Research in Crime and delinquency 37(4): 347-368.
Witte, A. (1977). Work release in north carolina-A program that works. Law andContemporary Problems 41: 230-251.
Vernick, S.H., & Reardon, R.C. (2001), Career development programs in corrections.Journal of Career Development 27(4): 265-277.
49
BIOGRAPHICAL SKETCH
Robin L. Richardson was born in Dothan, Alabama. Her father was in themilitary, so her family moved frequently during her youth. After her father’s retirement,her family settled in Dallas, TX, where she attended high school. As an undergraduate,she attended Texas Christian University in Fort Worth, TX. In 2003, she graduated cumlaude with a Bachelor in Science in Criminal Justice and a Bachelor of Science inPsychology. In 2003, she relocated to Florida to pursue her Masters in Criminology atFSU. Robin plans to stay at FSU to earn her PhD in Criminology. Her research interestsinclude victimology, domestic violence, correctional programming, juvenile justice,attachment, and social psychology.
Related Documents