This article appeared in a journal published by Elsevier. The attached copy is furnished to the author for internal non-commercial research and education use, including for instruction at the authors institution and sharing with colleagues. Other uses, including reproduction and distribution, or selling or licensing copies, or posting to personal, institutional or third party websites are prohibited. In most cases authors are permitted to post their version of the article (e.g. in Word or Tex form) to their personal website or institutional repository. Authors requiring further information regarding Elsevier’s archiving and manuscript policies are encouraged to visit: http://www.elsevier.com/copyright

Welcome message from author
This document is posted to help you gain knowledge. Please leave a comment to let me know what you think about it! Share it to your friends and learn new things together.
Transcript
This article appeared in a journal published by Elsevier. The attachedcopy is furnished to the author for internal non-commercial researchand education use, including for instruction at the authors institution
and sharing with colleagues.
Other uses, including reproduction and distribution, or selling orlicensing copies, or posting to personal, institutional or third party
websites are prohibited.
In most cases authors are permitted to post their version of thearticle (e.g. in Word or Tex form) to their personal website orinstitutional repository. Authors requiring further information
regarding Elsevier’s archiving and manuscript policies areencouraged to visit:
http://www.elsevier.com/copyright
Author's personal copy
Assessing the impact of Cross Compliance measures on nitrogen fluxesfrom European farmlands with DNDC-EUROPE
Marco Follador a,*, Adrian Leip a, Lorenzo Orlandini b
a European Commission, DG Joint Research Centre, Institute for Environment and Sustainability, Climate Change Unit, Via E. Fermi 2749, I-21027 Ispra, Varese, Italyb European Commission, DG Agriculture and Rural Development, L2 Economic Analysis of EU Agriculture, B-1049 Brussels, Belgium
a r t i c l e i n f o
Article history:Received 12 January 2011Accepted 15 January 2011
Keywords:Cross ComplianceEuropean Common Agricultural PolicyNitrogen dynamicsDNDC-EUROPECorn
a b s t r a c t
We investigated the effects of the agricultural Cross Compliance measures for European cultivated lands,focusing on nitrogen (N) fluxes from corn fields. Four scenarios have been designed according to someconservation farming practices, namely no-till, max manure, catch crop and N splitting. Results indicatedthat (1) in the no-till scenario the N2O fluxes are decreased during the first simulated years, with a returnto default fluxes in following years; no-till particularly decreased N2O emission in the dryer and coldersimulation spatial units (HSMUs); (2) the no-till and the N splitting scenarios slightly increased the Nsurplus because of a decrease in plant uptake; (3) introducing a rotation with alfalfa decreased the Nleaching in the corn crops following the catch crops; and (4) the application of fertilizer and manureduring the cold and wet seasons led to an increase of N leaching.
� 2011 Elsevier Ltd. All rights reserved.
1. Introduction
During the last decades the agriculture sector has developedrapidly to feed the growing world population and to guarantee thelife quality of our society. The diffusion of intensive farming prac-tices caused a degradation of other ecosystem services essential forhuman survival and not traded by the market, such as climateregulation, water and air quality and soil erosion (FAO, 2005). Thesecosts are generally unmeasured (Parry et al., 2009) and often do notinfluence the farmer or societal choices about the productionmethods (Tilman et al., 2002). As the agricultural sector representsone of themain driving forces in land use and cover changes, and animportant polluter of aquatic and terrestrial habitats, many coun-tries decided to promote political measures to push the farmers intoreducing the impact of their activity while continuing to meet theneeds of current and future generations (Scherr and Sthapit, 2009).How to guarantee that intensive farming, preservation of environ-ment and public health go hand-in-hand is one policy problemfacing governments and researchers worldwide (Green et al., 2005).Ensuring incentives and subsides for environmental services shouldbe an efficient way to help the farmers to support the additionalcosts of adopting newsustainablemanagement practices (Tollefson,2009; FAO, 2007; Farmer, 2007). Starting from this base, the last2003 reform of the Common Agricultural Policy (CAP) of the
European Union introduced a compulsory Cross Compliance (CC)mechanism to improve the compliancewith 18 environmental, foodsafety, animal welfare, and animal and plant health standards(Statutory Management Requirements, SMRs) as well as withrequirements to keep land in good agricultural and environmentalcondition (Good Agricultural and Environment Condition require-ments, GAECs), as prerequisite for receiving direct payments, whichwere to become decoupled from the volume of production and/orthe area cultivated or animal raised (Elbersen et al., 2010;Dimopoulus et al., 2007; Jongeneel and Elbersen, 2007; EU-Council, 2003). The main goal of this change in policy was topromote a more sustainable and market oriented agriculture(EU-Council, 2003). The SMRs are based on pre-existing EU Direc-tives and Regulations such as Nitrate Directives. The GAECs focus onsoil erosion, soil organic matter, soil structure and a minimum levelof maintenance; for each of these issues a number of standards arelisted (Alliance-Environnement, 2007). Cross Compliance is appliedas a whole farm approach to both used and unused lands, with thepossibility forMember States to reduce or prevent the conversion ofpasture to arable land (CAP2002, 2002). EU-Commission (2004a)laid down detailed rules for the implementation of Cross Compli-ance; these rules have been subsequently adjusted in EU-Council(2009) and EU-Commission (2009). Elbersen et al. (2010)described the progressive implementation of the CC mechanismin Europe with a brief description of the background developmentof related legislation. However, nowadays it still remains quitedifficult to quantify the environmental effects of these agriculturalmeasures bymeans of effective indicators because of an inadequate
* Corresponding author.E-mail address: [email protected] (M. Follador).
Contents lists available at ScienceDirect
Environmental Pollution
journal homepage: www.elsevier .com/locate/envpol
0269-7491/$ e see front matter � 2011 Elsevier Ltd. All rights reserved.doi:10.1016/j.envpol.2011.01.025
Environmental Pollution 159 (2011) 3233e3242

Author's personal copy
knowledge of the key biological, biogeochemical and ecologicalprocesses and often because of lacking data on different spaceetimeresolutions. Farmingmanagement recommendations based only onfield trials alone are too costly and time-consuming given themultitude of managements, soil attributes, weather-related factorsand pathways for carbon (C) and nitrogen (N) transformations,calling for the help of detailed models to correctly represent thecropping systems (Singh, 2006). To address this need the simulationplatform Cross Compliance Assessment Tool (CCAT) has beendeveloped by integrating different models in order to provide anexhaustive costebenefit analysis of the CC measures at Europeanscale (Elbersen et al., 2010; De Vries et al., 2008). Our CAPRI/DNDC-EUROPE modeling approach has been included into the CCAT toestimate some environmental indicators, such as N2O emissions, Nleached and N surplus, according to selected agricultural measures(Follador and Leip, 2009).
2. Materials and methods
2.1. DNDC-EUROPE model and data set
The Denitrification-Decomposition model (DNDC) (Li et al., 1992; Li, 2000),a process-oriented biogeochemistry model for agro-ecosystems, is a mechanisticdetailed model specifically created for using at field level, but subsequently devel-oped to be applied at regional scale. DNDC simulates the carbon trend, the nitrogenbalance and trace gas emissions from agricultural soils. It is comprised of twocomponents which integrate environmental and human drivers (i.e., weather andfarm management) with soil environmental factors (e.g., temperature, topsoil pH,bulk density, soil texture) and soil biogeochemical reactions and crop growth (Liet al., 2006). The first component consists of 3 submodels (soil climate, cropgrowth and decomposition); it calculates the state of soileplant system such as soilphysical and chemical status, vegetation growth and organic carbon mineralization.The second component is comprised of nitrification, denitrification and fermenta-tion submodels; it simulates the production of greenhouse gases (GHG) and othertrace gases. DNDC-Europe integrates the original DNDC model into an Europe-widedata base containing environmental, land use and farm management information athigh spatial resolution (Leip et al., 2008). Runs are carried out for 25 countries of theEuropean Union (EU-27 without Malta and Cyprus), for which a total of 207,439Homogeneous Spatial Mapping Units (HSMUs) are defined. Each HSMU is a multi-part polygon and is derived from the overlay of four different datasets: adminis-trative boundaries ((EUROSTAT, 2003) NUTS2 and NUTS3), land cover (CORINE level3, (ETC-TE, 2000)), soil (SGDB classification EU-Commission, 2004b) and slope data(CCM DEM 250 divided in five classes (CCM, 2004)). Data for land use and farmmanagement have been obtained from results of the agro-economic model CAPRI(Britz and Witzke, 2008) at regional level and dis-aggregated into the HSMUs witha procedure described in detail in Leip et al. (2008), Britz and Leip (2009). We usedthe CAPRI database for the year 2002, which is aligned with statistical information,amongst others, from Eurostat and FAO (FAO/IFA/IFDC/IPI/PPI, 2002). Farmmanagement data include crop yield, application of mineral fertilizer nitrogen andmanure nitrogen, and manure C/N (Carbon to Nitrogen ratio). Data on the cropcalendar (sowing and harvesting dates) are obtained by Bouraoui and Aloe (2007).Crop characteristics are taken from the default crop-library of the DNDC model(Fig. 1). The main environmental information required is soil data and daily mete-orological information. The meteorological data (minimum and maximum dailytemperature, precipitation) were obtained at 1�1 km spatial resolution fromOrlandini and Leip (2008). The data have been calculated for the period 1901e2000
by combining grid weather data at 50� 50 km spatial resolution (Orlandi and Vander Goot, 2003) with monthly climate data at 100 �100 spatial resolution (Mitchellet al., 2004). Data on nitrogen concentrations in precipitations are from EMEP(2001). The soil information comprises initial soil organic carbon (SOC), claycontent, pH and bulk density were obtained from the 1�1 km2 soil raster datasets,processed on the basis of the European Soil Database (Jones et al., 2005). A possiblebias in the soil database due to inconsistent land use information was eliminated byusing only those data for which annual crops were assumed in the original map.Gap-filling was done to obtain soil data also for those spatial unit for which noannual crops are assumed only for current land use.
As described in Britz and Leip (2009) themodel is calibrated for each spatial unitfor the yield as estimated by downscaling regional statistical data to the spatial unit(Leip et al., 2008). This is an important element of the approach, as it avoids bias inenvironmental losses as a consequence of errors in the simulated yields. Withrespect to the environmental indicators, the well-calibrated model is used as such;no validation can be made for this sample set at the European level due to the lack ofobservations.
Agricultural sector is the major source of anthropogenic emissions of N2O, animportant GHG because of its long lifetime and high global warming potential (DelGrosso et al., 2006). N2O is produced in soil through the microbial processes ofnitrification and denitrification (Shaffer and Ma, 2001) and its estimation with theDNDC-EUROPE model is controlled by a large number of environmental, weather,soil and farm management factors in the nitrification-denitrification submodels(Smith et al., 2004). The N leaching from arable land is an important cause ofgroundwaters pollution. DNDC-EUROPE predicts the nitrate leaching below the croproot zone by integrating the detailed submodels of soil N transformations witha one-dimensional flow model that simulates the vertical movement of waterbetween the layers of soil profile (50 cm) (Li et al., 2006). The N surplus has beencalculated as the difference between all the N input sources (i.e., mineral fertilizer,manure, N in precipitations, N from biological fixation and N in crop residue) and theN losses through plant uptake (harvested plant and crop residue).
2.2. Farming management scenarios conceptualization
Even though the SMRs and GAECs are country or even region specific, wegeneralized some of these measures across the EU25. The DNDC-EUROPE model isnot able to implement and calculate the effect of every CCmeasures, whose selectionwas based on DNDC-EUROPE limits and data availability, as described in Jongeneelet al. (2008). Four CC scenarios were defined and compared to a referencescenario as defined below and summarized in Table 1.
To obtain a representative sample of situations for the cultivation of corn inEurope, we selected about 15,000 HSMUs on which at least 10% of the agriculturalland was used for corn. Corn cultivation covers around 4.6% of UAA (utilized agri-cultural area) in EU-27 (EU-Commission (2010), http://epp.eurostat.ec.europa.eu),playing an important role in human and animal food supply. Un-irrigated corn ismore sensitive to climate variation, whilst irrigation provides an overall bufferagainst dry periods. This can be observed through the high variation in the yearlyoverall yield in the EU-12Member States, where the non-irrigated practice is still themost common (JRC, 2003). As most HSMUs in the sample set belong to the EU-12zone and in order to assess the variability of N fluxes in response to climate condi-tions, we opted for un-irrigated corn as case study. The sample set for cornealfalfa
Fig. 1. I/O flow of information in the present study. Data for land use and farmmanagement (in GIS2) have been obtained from results of the agro-economic modelCAPRI at regional level and dis-aggregated into the HSMUs (CAPRI-Spat).
Table 1Definition of agricultural scenarios according to the selected Cross Compliancemeasures.
Scenario CC measures
S1: Baseline Conventional corn cropping systemsS2: No-till GAEC02: reduced or zero tillageS3: Max manure SMR02: limit manure to 170 kgN ha�1 yr�1
S4: Catch crop SMR08, GAEC03: rotation with winter or catch cropsS5: N splitting SMR03: limit N input in wet and cold seasons
Table 2Basic statistics of the main DNDC-EUROPE inputs at HSMU resolution (baselinescenario).
Predictor Mean Std Min Max
Min. fertilizer [kgN ha�1 yr�1] 143 80.65 0 250Manure [kgN ha�1 yr�1] 67 78.9 0 251Soil bulk density [g cm�3] 1.05 0.43 0 4.15Topsoil SOC [mass fraction] 0.024 0.02 0.004 0.23Clay [fraction] 0.28 0.09 0.09 0.94Annual mean rain [mmyr�1] 742 216 231 2019Annual mean T [�C] 11 2.3 �0.4 19N in rain [ppm] 1.11 0.17 0.26 1.5Topsoil PH 7.58 0.98 1.67 8.39
M. Follador et al. / Environmental Pollution 159 (2011) 3233e32423234
Author's personal copy
rotation is slightly different since it has been chosen according to the presence of bothcropping systems on arable lands. The basic statistics of the main predictors drawnfrom the whole DNDC-EUROPE input dataset are summarized in Table 2.
2.2.1. Baseline scenario: S1The baseline scenario includes only a cornmonoculture, with tillage 20 cm depth.
The simulated period is 10 years of un-irrigated corn driven bymeteorological data forthe years 1990e1999, without rotations or fallow, within the previously selectedHSMUs. We apply both mineral fertilizer and animal manure in one application atsowing date. After harvesting, crop residues are incorporated into the soil in thefollowing year before sowing. The mineral fertilizer application during the winter isnull. Other N inputs are atmospheric deposition, biological fixation and crop residue.
2.2.2. No-till scenario: S2The no-tillage scenario differs from the reference scenario only in the absence of
tillage. This practice of turning the soil before planting buries crop residues, animal
manure and troublesome weeds and moreover aerates and warms the soil. But italso increases the soil vulnerability to erosion by wind and water.
2.2.3. Max manure scenario: S3This scenario limits the N in manure spreading to 170 [kgN ha�1 yr�1]. A few
northern countries with large livestock activities enjoy special derogations:Denmark, Germany and Austria can spread manure up to 230 [kgN ha�1 yr�1], whilethe Netherland can reach 250 [kgN ha�1 yr�1]. In our sample set only a few hundredsof those HSMUs pertaining to countries enjoying special derogations exceeded thelimit of 170 [kgN ha�1 yr�1]. Their contribution to the final assessment is not verysignificant. In order to simplify the simulation, we have established an upper limit of170 [kgN ha�1 yr�1] for the entire sample set.
2.2.4. Catch crop scenario: S4This scenario simulates two cycles of corn-alfalfa rotation. One cycle is
comprised of a rotation between a yield crop (corn) for 2 years, and a catch cropwhich lasts 3 years. A catch crop can be leguminous or non-leguminous and it isgrown in the period between two main crops in order to retain nutrients in the rootzone and to reduce the surface erosion and runoff. We selected alfalfa because of itsability to fix N in the soil. Corn receives the same farming management as in S1,while we only apply one manure spreading without tillage on the catch crop.
2.2.5. N splitting: S5The S5 scenario is not a conservation management since the common and more
sustainable practice is to apply mineral fertilizer and manure during the vegetationperiod as in S1. We design an alternative N input strategy by splitting the baselinemineral fertilizer and animal manure amendment into 2 applications, at the time ofcrop planting and at the beginning of winter, to point out the effects of delayed Napplications after crop harvest during wet and cold periods.
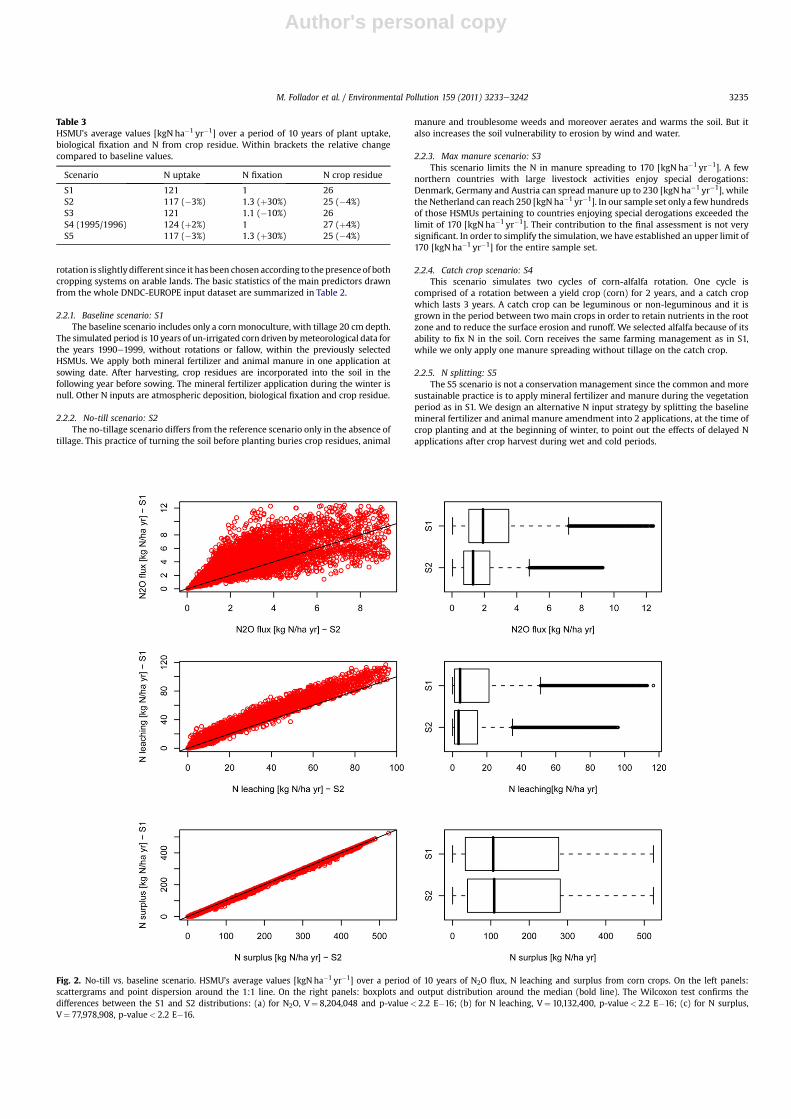
Table 3HSMU’s average values [kgN ha�1 yr�1] over a period of 10 years of plant uptake,biological fixation and N from crop residue. Within brackets the relative changecompared to baseline values.
Scenario N uptake N fixation N crop residue
S1 121 1 26S2 117 (�3%) 1.3 (þ30%) 25 (�4%)S3 121 1.1 (�10%) 26S4 (1995/1996) 124 (þ2%) 1 27 (þ4%)S5 117 (�3%) 1.3 (þ30%) 25 (�4%)
Fig. 2. No-till vs. baseline scenario. HSMU’s average values [kgN ha�1 yr�1] over a period of 10 years of N2O flux, N leaching and surplus from corn crops. On the left panels:scattergrams and point dispersion around the 1:1 line. On the right panels: boxplots and output distribution around the median (bold line). The Wilcoxon test confirms thedifferences between the S1 and S2 distributions: (a) for N2O, V¼ 8,204,048 and p-value< 2.2 E�16; (b) for N leaching, V¼ 10,132,400, p-value< 2.2 E�16; (c) for N surplus,V¼ 77,978,908, p-value< 2.2 E�16.
M. Follador et al. / Environmental Pollution 159 (2011) 3233e3242 3235
Author's personal copy
2.3. Statistical treatment of DNDC-EUROPE output
We compared the average values over a period of 10 years in the baselinescenario vs. the alternativemanagements bymeans of simple graphics and summarystatistics. All the scenarios have the same soil andmeteo input, and they only differ inthe farming strategies suggested by CC measures. The scattergram plots the baselinevalues on vertical axis and the CC scenario values on horizontal axis. All the points onthe diagonal, or close to it, mean very similar output between two scenarios, whilescattered points indicate environmental payoffs or trade-offs of alternative farmingpractices. The parallel Boxplot is a graphical summaryof the output distributions. Thedistance between the hinges (first and third quartiles) is a measure of dispersionaround the median (bold line) and it includes the 50% of all observations. The so-called whiskers show the largest or smallest observation within a distance of 1.5times the box size from the nearest hinge. The points that fall out of these limits areconsidered as extreme values or anomalies, and shown separately. Many statisticaltests deal with comparing continuous data between two groups providing a quan-titative analysis of differences. As our independent variables showa clear asymmetry,we decided to apply the nonparametricWilcoxon test to the paired outputs (baselinevs. alternative scenario). The p-value is the probability of having the observedV indexunder the null hypothesis. A p-value smaller than the customary 5% of significanceindicates high probability that the two samples are different.
3. Results
3.1. No-till S2 vs. baseline S1 scenario
The DNDC-EUROPE output indicated that the conversion fromconventional tillage to no-till resulted in an average reduction of
N2O emission (�29%), even though an increase was observed forsome HSMUs. The N2O fluxes ranged from 0.03 to almost 10[kgN ha�1 yr�1] per year, with an asymmetric distribution aroundthe median (1.3 [kgN ha�1 yr�1]). The N leaching also decreased by22% and ranged from 0 to 96 [kgN ha�1 yr�1] with a clear asym-metrical dispersion and a median of 3.5 [kgN ha�1 yr�1]. The Nsurplus slightly increased in the no-tillage scenario (þ2%) probablydue to a diminution by 3% of plant uptake (Table 3). The N surplusranged from 0 to 523 [kgN ha�1 yr�1] with a median of about 109[kgN ha�1 yr�1] (Fig. 2).
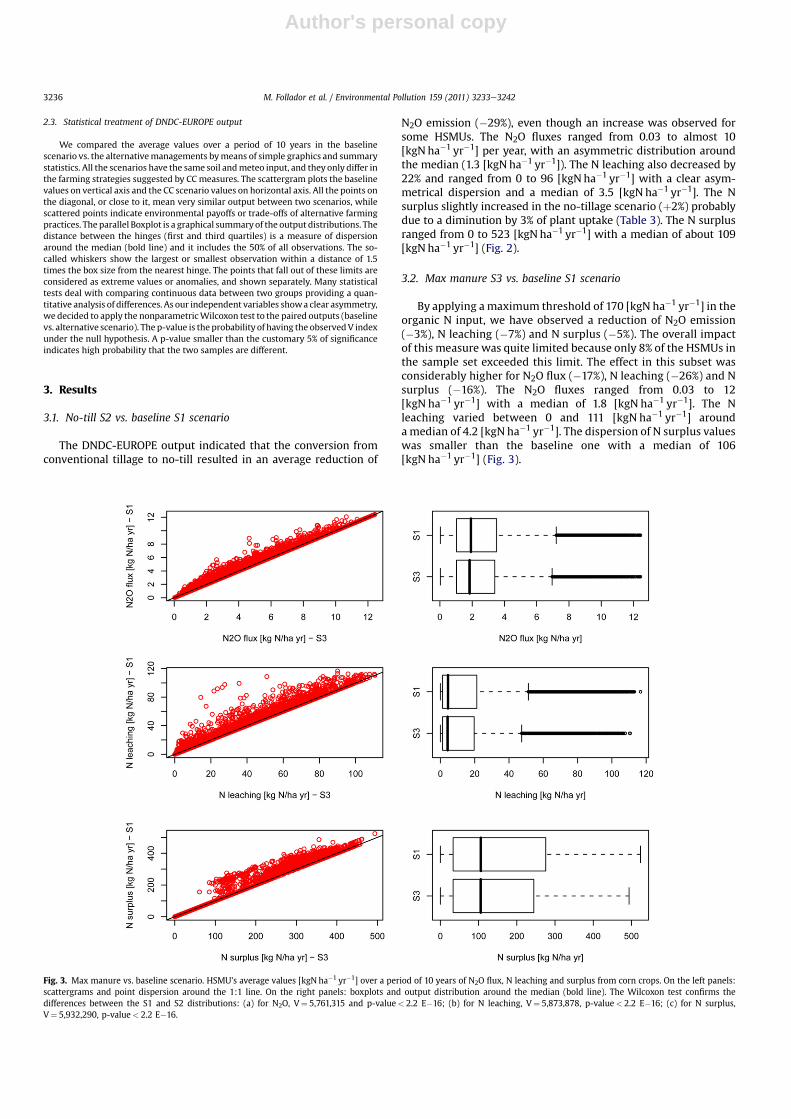
3.2. Max manure S3 vs. baseline S1 scenario
By applying a maximum threshold of 170 [kgN ha�1 yr�1] in theorganic N input, we have observed a reduction of N2O emission(�3%), N leaching (�7%) and N surplus (�5%). The overall impactof this measure was quite limited because only 8% of the HSMUs inthe sample set exceeded this limit. The effect in this subset wasconsiderably higher for N2O flux (�17%), N leaching (�26%) and Nsurplus (�16%). The N2O fluxes ranged from 0.03 to 12[kgN ha�1 yr�1] with a median of 1.8 [kgN ha�1 yr�1]. The Nleaching varied between 0 and 111 [kgN ha�1 yr�1] aroundamedian of 4.2 [kgN ha�1 yr�1]. The dispersion of N surplus valueswas smaller than the baseline one with a median of 106[kgN ha�1 yr�1] (Fig. 3).
Fig. 3. Max manure vs. baseline scenario. HSMU’s average values [kgN ha�1 yr�1] over a period of 10 years of N2O flux, N leaching and surplus from corn crops. On the left panels:scattergrams and point dispersion around the 1:1 line. On the right panels: boxplots and output distribution around the median (bold line). The Wilcoxon test confirms thedifferences between the S1 and S2 distributions: (a) for N2O, V¼ 5,761,315 and p-value< 2.2 E�16; (b) for N leaching, V¼ 5,873,878, p-value< 2.2 E�16; (c) for N surplus,V¼ 5,932,290, p-value< 2.2 E�16.
M. Follador et al. / Environmental Pollution 159 (2011) 3233e32423236
Author's personal copy
3.3. Catch crop S4 vs. baseline S1 scenario
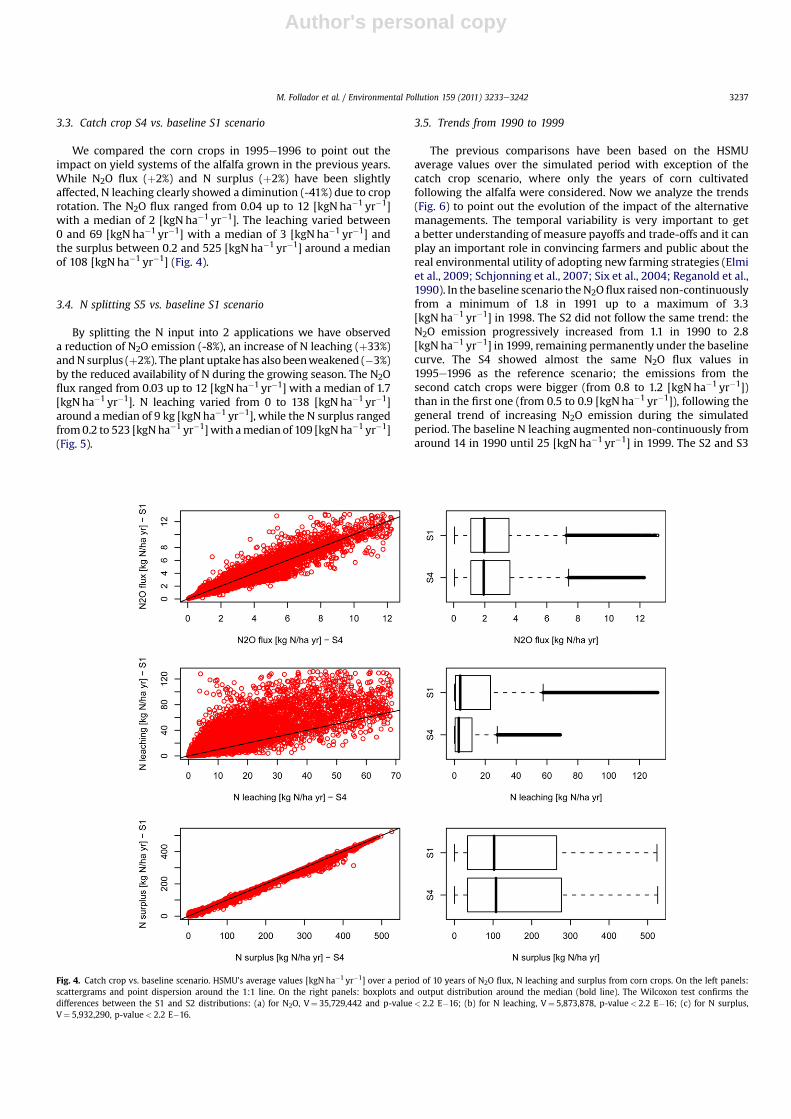
We compared the corn crops in 1995e1996 to point out theimpact on yield systems of the alfalfa grown in the previous years.While N2O flux (þ2%) and N surplus (þ2%) have been slightlyaffected, N leaching clearly showed a diminution (-41%) due to croprotation. The N2O flux ranged from 0.04 up to 12 [kgN ha�1 yr�1]with a median of 2 [kgN ha�1 yr�1]. The leaching varied between0 and 69 [kgN ha�1 yr�1] with a median of 3 [kgN ha�1 yr�1] andthe surplus between 0.2 and 525 [kgN ha�1 yr�1] around a medianof 108 [kgN ha�1 yr�1] (Fig. 4).
3.4. N splitting S5 vs. baseline S1 scenario
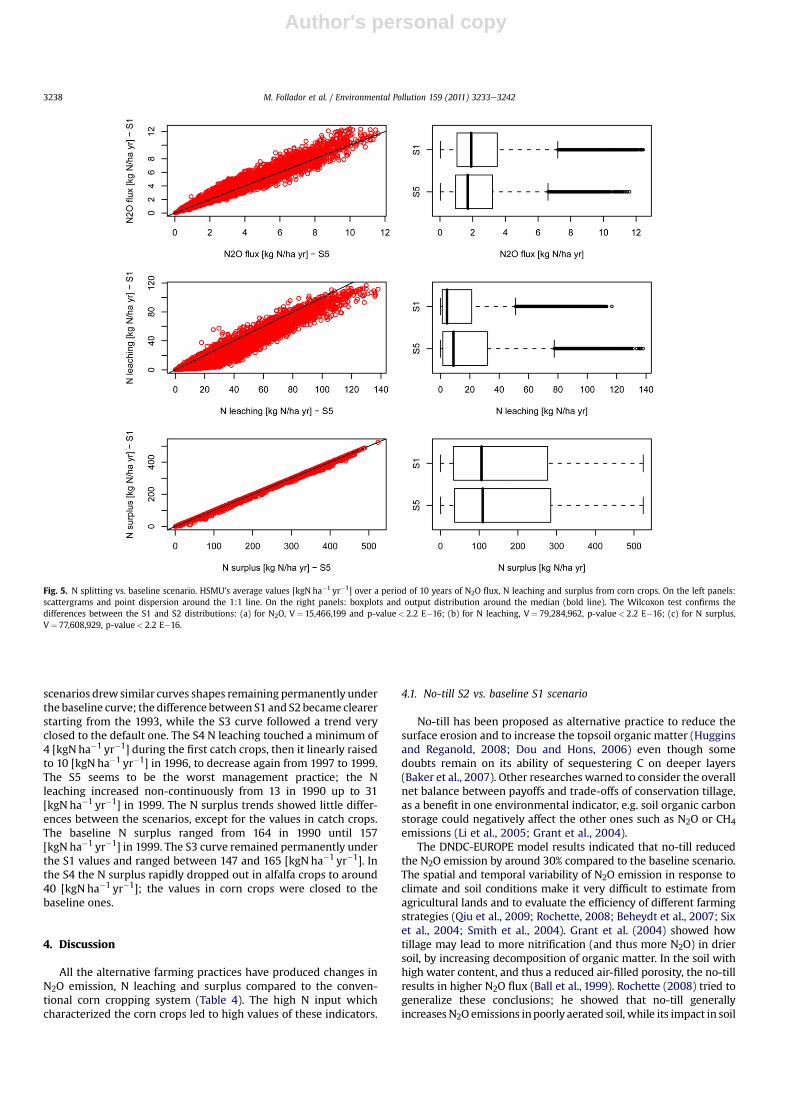
By splitting the N input into 2 applications we have observeda reduction of N2O emission (-8%), an increase of N leaching (þ33%)andN surplus (þ2%). The plant uptakehas also beenweakened (�3%)by the reduced availability of N during the growing season. The N2Oflux ranged from 0.03 up to 12 [kgNha�1 yr�1] with a median of 1.7[kgNha�1 yr�1]. N leaching varied from 0 to 138 [kgN ha�1 yr�1]around a median of 9 kg [kgNha�1 yr�1], while the N surplus rangedfrom0.2 to 523 [kgNha�1 yr�1] with amedian of 109 [kgNha�1 yr�1](Fig. 5).
3.5. Trends from 1990 to 1999
The previous comparisons have been based on the HSMUaverage values over the simulated period with exception of thecatch crop scenario, where only the years of corn cultivatedfollowing the alfalfa were considered. Now we analyze the trends(Fig. 6) to point out the evolution of the impact of the alternativemanagements. The temporal variability is very important to geta better understanding of measure payoffs and trade-offs and it canplay an important role in convincing farmers and public about thereal environmental utility of adopting new farming strategies (Elmiet al., 2009; Schjonning et al., 2007; Six et al., 2004; Reganold et al.,1990). In the baseline scenario theN2Oflux raised non-continuouslyfrom a minimum of 1.8 in 1991 up to a maximum of 3.3[kgN ha�1 yr�1] in 1998. The S2 did not follow the same trend: theN2O emission progressively increased from 1.1 in 1990 to 2.8[kgN ha�1 yr�1] in 1999, remaining permanently under the baselinecurve. The S4 showed almost the same N2O flux values in1995e1996 as the reference scenario; the emissions from thesecond catch crops were bigger (from 0.8 to 1.2 [kgN ha�1 yr�1])than in the first one (from 0.5 to 0.9 [kgN ha�1 yr�1]), following thegeneral trend of increasing N2O emission during the simulatedperiod. The baseline N leaching augmented non-continuously fromaround 14 in 1990 until 25 [kgN ha�1 yr�1] in 1999. The S2 and S3
Fig. 4. Catch crop vs. baseline scenario. HSMU’s average values [kgN ha�1 yr�1] over a period of 10 years of N2O flux, N leaching and surplus from corn crops. On the left panels:scattergrams and point dispersion around the 1:1 line. On the right panels: boxplots and output distribution around the median (bold line). The Wilcoxon test confirms thedifferences between the S1 and S2 distributions: (a) for N2O, V¼ 35,729,442 and p-value< 2.2 E�16; (b) for N leaching, V¼ 5,873,878, p-value< 2.2 E�16; (c) for N surplus,V¼ 5,932,290, p-value< 2.2 E�16.
M. Follador et al. / Environmental Pollution 159 (2011) 3233e3242 3237
Author's personal copy
scenarios drewsimilar curves shapes remaining permanently underthe baseline curve; the difference between S1 and S2became clearerstarting from the 1993, while the S3 curve followed a trend veryclosed to the default one. The S4 N leaching touched a minimum of4 [kgN ha�1 yr�1] during the first catch crops, then it linearly raisedto 10 [kgN ha�1 yr�1] in 1996, to decrease again from 1997 to 1999.The S5 seems to be the worst management practice; the Nleaching increased non-continuously from 13 in 1990 up to 31[kgN ha�1 yr�1] in 1999. The N surplus trends showed little differ-ences between the scenarios, except for the values in catch crops.The baseline N surplus ranged from 164 in 1990 until 157[kgN ha�1 yr�1] in 1999. The S3 curve remained permanently underthe S1 values and ranged between 147 and 165 [kgN ha�1 yr�1]. Inthe S4 the N surplus rapidly dropped out in alfalfa crops to around40 [kgN ha�1 yr�1]; the values in corn crops were closed to thebaseline ones.
4. Discussion
All the alternative farming practices have produced changes inN2O emission, N leaching and surplus compared to the conven-tional corn cropping system (Table 4). The high N input whichcharacterized the corn crops led to high values of these indicators.
4.1. No-till S2 vs. baseline S1 scenario
No-till has been proposed as alternative practice to reduce thesurface erosion and to increase the topsoil organic matter (Hugginsand Reganold, 2008; Dou and Hons, 2006) even though somedoubts remain on its ability of sequestering C on deeper layers(Baker et al., 2007). Other researches warned to consider the overallnet balance between payoffs and trade-offs of conservation tillage,as a benefit in one environmental indicator, e.g. soil organic carbonstorage could negatively affect the other ones such as N2O or CH4emissions (Li et al., 2005; Grant et al., 2004).
The DNDC-EUROPE model results indicated that no-till reducedthe N2O emission by around 30% compared to the baseline scenario.The spatial and temporal variability of N2O emission in response toclimate and soil conditions make it very difficult to estimate fromagricultural lands and to evaluate the efficiency of different farmingstrategies (Qiu et al., 2009; Rochette, 2008; Beheydt et al., 2007; Sixet al., 2004; Smith et al., 2004). Grant et al. (2004) showed howtillage may lead to more nitrification (and thus more N2O) in driersoil, by increasing decomposition of organic matter. In the soil withhigh water content, and thus a reduced air-filled porosity, the no-tillresults in higher N2O flux (Ball et al., 1999). Rochette (2008) tried togeneralize these conclusions; he showed that no-till generallyincreasesN2O emissions inpoorly aerated soil, while its impact in soil
Fig. 5. N splitting vs. baseline scenario. HSMU’s average values [kgN ha�1 yr�1] over a period of 10 years of N2O flux, N leaching and surplus from corn crops. On the left panels:scattergrams and point dispersion around the 1:1 line. On the right panels: boxplots and output distribution around the median (bold line). The Wilcoxon test confirms thedifferences between the S1 and S2 distributions: (a) for N2O, V¼ 15,466,199 and p-value< 2.2 E�16; (b) for N leaching, V¼ 79,284,962, p-value< 2.2 E�16; (c) for N surplus,V¼ 77,608,929, p-value< 2.2 E�16.
M. Follador et al. / Environmental Pollution 159 (2011) 3233e32423238

Author's personal copy
with good and medium aeration is neutral or positive. From ourdataset we found a higher average temperature (12.8 �C) and rainfallevents (738mmyr�1) in thoseHSMUswith increasedN2O flux in no-till, compared to the HSMUs on which no-till had positive impact(10.1 �C and 677 mmyr�1). The clay fraction was quite similar inthese subsets and it does not seem to play an important role inexplaining the different N2O values between S1 and S2. The N2Oreduction was more clear during the first years of no-till while itgradually diminished up to the default values, soaring from1 in 1990to almost 3 [kgN ha�1 yr�1] in 1999. In the field studies it has beenobserved that no-till practice causes a compaction of soil and anincrease of N2O fluxes; after few years of no-till the soil structurebuild up and the bulk density decreases leading tomore aeration andtherefore less N2O emissions. This effect is not simulated by DNDC-EUROPE. Furthermore the progressive accumulation of available C inno-till contributes to denitrifying processes and increasing trends ofN2O fluxes from 1990 to 1999 (Shaffer and Ma, 2001).
The N (NO3�) leaching from fields is directly controlled byhydrogeological and plantesoil processes, both influenced bynumerous factors such as climate conditions, soil properties andfarming management (Li et al., 2006; Dinnes et al., 2002) The Nleaching decreased in no-till scenario (�22%) can be explainedby a reduction of N mineralization (�7%), resulting in increasedorganic carbon (by about 9%) and less inorganic N available forleaching (Farahbakhshazad et al., 2008). The difference betweenS1 and S2 became more evident from 1992; in the same yearthe rain started to intensify until 1995, subsequently it toucheda local minimum in 1997 to grow up again during the last yearsuntil its extremum in 1999 (Fig. 6). The N leaching curves fol-lowed the same trend reaching a relative maximum in 1995and a global extremum in 1999 with a relative minimum in1997.
The N surplus remained nearly constant (þ2%) by moving fromconventional to no-till; over the 10 years period the N surplus of S2ranged from around 157 up to 172 [kgN ha�1 yr�1] often overlyingthe baseline scenario curve. We have observed a reduction in plantuptake (�3%), due to the lower mineralization rate and greaternutrients immobilization by organic matter at the surface (Hugginsand Reganold, 2008; Melaj et al., 2003). The N fixed in the soilincreased by 30% compared to conventional tillage practice(Table 2). Soil layers and soil biota in no-tilled fields are conservedin their natural state, with highermicrobial content and soil organicmatter, making them enriched in carbon and nitrogen (Wrightet al., 2004). Any mechanical soil disturbance in conventionaltillage fields leads to high aggregate disruption and low nitrogenstorage (Six et al., 2004, 2000a,b).
Fig. 6. Trends of (a) N2O flux, (b) N leaching and (c) N surplus from 1990 to 1999 according to different farming strategies. Average values of all the HSMUs per year [kgN ha�1 yr�1].In the last panel (d) trends of annual mean precipitations [mmyr�1] and annual mean temperature [�C].
Table 4Summary table of the comparison between baseline and CC scenarios. HSMU’saverage values [kgN ha�1 yr�1] over a period of 10 years of N2O flux, N leaching andsurplus from corn crops according to farming strategies. Within brackets the relativechanges compared to baseline values.
Scenario N2O N leaching N surplus
S1 2.6 15.5 148.8S2 1.9 (�29%) 12.1 (�22%) 152.3 (þ2%)S3 2.5 (�3%) 14.4 (�7%) 141.0 (�5%)S4 (1995/1996) 2.7 (þ2%) 9.1 (�41%) 151.1 (þ2%)S5 2.4 (�8%) 20.6 (þ33%) 152.4 (þ2%)
M. Follador et al. / Environmental Pollution 159 (2011) 3233e3242 3239
Author's personal copy
4.2. Max manure S3 vs. baseline S1 scenario
Themaxmanure scenario had a positive impact for all indicators,whose estimation is obviously very sensitive to nutrient availability(Grant et al., 2004). The N2O flux decreased by 3%, the N leaching by7% and the N surplus by 5%. The measures effect was not so evidentas the number of HSMUs with a manure input bigger than 170[kgN ha�1 yr�1] represented just the 8% of the entire dataset. Byconsidering only this subset we observed clearer differencesbetween max manure and baseline scenarios: the N2O emissiondiminished by 17%, the N leaching by 27% and the N surplus by 16%.During the simulated period all the S3 curves remained perma-nently under the baseline values with a parallel trends. Thismeasure could introduce new additional costs linked to increasingstorage capacities or other treatment solutions (Milklink, 2009).
4.3. Catch crop S4 vs. baseline S1 scenario
The Health Check of the CAP (CAP2008, 2008) abolished the setaside in 2008, even though it remarked the need of retaining theenvironmental benefits derived from this measure by adopting newcompulsory instruments such as, for example, a reduction of theamount of pesticides and N application to rotation crops. The CCregulations do not pay great attention to the definition of differentrotation crop types and often they do not clearly distinguish theterms catch, winter and cover crop (see for example the SMR08-growing winter crops and the GAEC03-minimum coverage arableland). The rotation between yield crops and catch crops is a tradi-tional practice to maintain soil quality and to return to the level ofcarbon achieved prior to cultivation (FAO, 2005). Catch crops areproved to be one of the best practices of conservation agriculture toreduce nitrate leaching and annual averaged nitrate concentrationto meet the drinking water quality standards by fixing more soilmineral N (Askegaard et al., 2005) and an effective cover to protectthe surface against wind and water erosion after harvest byanchoring soil and lessening the impact of raindrops. Otherresearches warned that this practice may also have negative effectsin dryer lands because of the water consumption of catch crops andsubsequent reduced water availability (Olesen, 2009).
We considered only the impact of this measure on the yield cropsfollowing the catch crops in 1995e1996; the rotation with alfalfaclearly reduced the N leaching (�41%) on corn crops, while no cleareffects on the other indicators were observed (þ2% for N2O flux andN surplus). We did not analyze the entire 1990e1999 period as theabsence of fertilization on catch crops obviously caused a drastic fallof the environmental indicators not comparable with a conventionalfarming activity. The S4 leaching in 1995e1996 showed a soaringtrend in contrast with the other scenarios which curves weredownward and followed the trend of precipitations. S4 leaching hasbeen probably affected by the progressive release of N from theincreased soil organic nitrogen (þ41%), due to the incorporation intothe soil of alfalfa residues through tilling before the corn sowing(Muller et al., 2006). The subsequent release of N plant-availablefrom this organic source depends on the soil environment and onmineralizationeimmobilization processes and their interactionwithseasonal temperature and moisture (Wu et al., 2009; Martens et al.,2006; Agehara and Warncke, 2005). The enrichment in soil organicmatter through residue also represents an ideal condition for deni-trification process and it may explain the increase of N2O flux in S4(þ2%).
4.4. N splitting S5 vs. baseline S1 scenario
An improved N input management is needed to optimize thefarmer incomes and minimize environmental drawbacks associated
with intensive crop production. The timing of N application mayinfluence the grain yield and N losses by ensuring nutrients whenthe crops need them or when the weather conditions are moresuitable for enhancing plant uptake (Alva et al., 2006; Bundy andAndraski, 2005; Melaj et al., 2003). Generally farmers apply fertil-izer and manure on corn crops at sowing date to reduce the risk ofyield loss due to N stress (Scharf et al., 2002); later N inputs are oftenadded to match the plant needs or simply to spread manure as litterreducing the storage costs.
In the N splitting scenario the NO3 leaching increased by þ33%due to the added N input after harvest, when the plant uptake wasnull and the wet and cold seasons fostered the losses of availablenitrogen. During the simulated period the leaching increased non-continuously from 13 in 1990 to 31 [kgN ha�1 yr�1], remainingconstantly above the baseline curve. The N2O emission diminishedby around 8% compared to baseline values; by splitting the N inputinto two applications we had reduced the N available during thespring and summer seasons which are more suitable for denitrifi-cation (warm temperatures) (Shaffer and Ma, 2001).
5. Conclusion
Conservation agriculture is a multi-goal management systemsince it has to feed the growing world population while respectingenvironmental criteria to guarantee the land productivity on longterm. Farming activities, which are some of the main driving forcesin land use and cover change, are leading sources of GHG emissions.The intensive agriculture poses a threat not only for the globalclimate but also for a number of ecosystem services upon whichlong-term crops production depends. Policy actions are needed toguarantee sustainable food production in the face of climate changeand rapid environmental degradation.
The last reform of the European Common Agricultural Policy in2003 introduced a Cross Compliance mechanism to promote a moresustainable agriculture, making the direct payments conditional onmeeting several environmental standards. To quantify the impact ofa few selected Cross Compliance measures we estimated the N2Oflux, N leaching and N surplus from four alternative managementpractices and we compared themwith a conventional corn croppingsystem. The no-till practice had significant positive impact on bothN2O and N leaching; its easy implementability should foster itsdiffusion across farmlands. The manure limit amendment stilldecreased all the indicators despite the fact that a small number ofHSMUs exceeded the threshold. The rotation cornealfalfa notablyreduced the leaching from the yield crops that followed the catchcrops; the incorporation of alfalfa residue before corn planting led tohigh increase of soil organic nitrogen. The application of fertilizer andmanure after the harvest and during the winter significantlyaugmented the N leaching due to the absence of plant uptake andadverse weather conditions.
The spreading of subsides must go hand-in-hand with the defi-nition of clear rights and duties, as well as of compliance indicatorsand effective control mechanisms. The integration between groundtruth data and simulated output represents a helpful support toforward-looking assessment of agro-environmental policies andmanagement strategies aiming to mitigate climate change andgenerate ecosystem and livelihood benefits.
References
Agehara, S., Warncke, D., 2005. Soil moisture and temperature effects on nitrogenrelease from organic nitrogen sources. Soil Science Society of America Journal69, 1844e1855.
Alliance-Environnement, 2007. Evaluation of the Application of Cross Complianceas Foreseen under Regulation 1782/2003. Part I: Descriptive Report. TechnicalReport. DG. Agriculture, IEEP and Oreade-Breche.
M. Follador et al. / Environmental Pollution 159 (2011) 3233e32423240
Author's personal copy
Alva, A., Paramasivam, S., Fares, A., Delgado, J., Mattos, J.D., Sajwan, K., 2006.Nitrogen and irrigation management practices to improve nitrogen uptakeefficiency and minimize leaching losses. Journal of Crop Improvement 15,369e420.
Askegaard, M., Olesen, J., Kristensen, K., 2005. Nitrate leaching from organic arablecrop rotations: effects of location, manure and catch crop. Soil Use andManagement 21, 181e188.
Baker, J., Ochsner, T., Venterea, R., Griffis, T., 2007. Tillage and soil carbon seques-tration-what do we really know? Agriculture, Ecosystems and Environment118, 1e5.
Ball, B., Scott, A., Parker, J., 1999. Field N2O, Co2 and CH4 fluxes in relation to tillage,compaction and soil quality in Scotland. Soil and Tillage Research 53, 29e39.
Beheydt, D., Boeckx, P., Sleutel, S., Li, C., Van Cleemput, O., 2007. Validation of dndcfor 22 long-term N2O field emission measurements. Atmospheric Environment41, 6196e6211.
Bouraoui, F., Aloe, A., 2007. European Agrochemicals Geospatial Loss Estimator:Model Development and Applications. Technical Report. European Commission,Joint Research Centre, Institute for Environment and Sustainability.
Britz, W., Leip, A., 2009. Development of marginal emission factors for n losses fromagricultural soils with the dndc-capri meta-model. Agriculture, Ecosystems andEnvironment 133, 267e279.
Britz, W., Witzke, P., 2008. CAPRI Model Documentation 2008. CAPRI Project,Institute for Food and Resource Economics, Bonn.
Bundy, L., Andraski, T., 2005. Recovery of fertilizer nitrogen in crop residues andcover crops on an irrigated sandy soil. Soil Science Society of America Journal69, 640e648.
CAP2002, 2002. Communication from the Commission to the Council and theEuropean Parliament. Mid-term Review of the Common Agriculture Policy,COM 2002. Technical Report. European Commission.
CAP2008, 2008. Health Check of the CAP: Current Situation, Commission Proposaland Council Outcome. Technical Report. European Commission.
CCM, 2004. Catchment Characterisation and Modelling DEM 250 2004. TechnicalReport. Land Management Unit, Institute for Environment and Sustainability,DG. Joint Research Centre, European Commission. 250 Meter DEM, Compiled onthe Basis of Data Acquired from Data Providers and National Mapping Agenciesover Europe (For Internal Use). EuroLandscape/Agri-Environment CatchmentCharacterisation and Modelling Activity.
De Vries, W., Kros, H., Velthof, G., Oudendag, D., Leip, A., van der Velde, M., Kempen,M., 2008. Development and Application Methodology of Environmental ImpactTool to Evaluate Cross Compliance Measures. Technical Report. Deliverable 4.2.1of EU STREP 44423-CCAT Project.
Del Grosso, S., Parton, W., Mosier, A., Walsh, M., Ojima, D.S., Thornton, P., 2006.Daycent national-scale simulation of nitrous oxide emissions from croppedsoils in the United States. Journal of Environment Quality 35, 1451e1460.
Dimopoulus, D., Fermantziz, I., Vlahos, G., 2007. The Responsiveness of CrossCompliance Standards to Environmental Pressure. Technical Report. Deliverable12 of the CC Network Project, SSPE-CT-2005-022727.
Dinnes, D., Karlen, D., Jaynes, D., Kaspar, T., Hatfield, J., Colvin, T., Cambardella, C.,2002. Nitrogen management strategies to reduce nitrate leaching in tile-drained midwestern soils. Agronomy Journal 94, 153e171.
Dou, F., Hons, F., 2006. Tillage and nitrogen effects on soil organic matter fractionsin wheat-based systems. Soil Science Society of America Journal 70, 1896e1905.
Elbersen, B., Jongeneel, R., Kempen, M., Klein-Lankhorst, R., De Vries, W., Lesschen,J., Onate, J., Alonso, M., Kasperczyk, N., Schramek, J., Mik, M., Peepson, A.,Bouma, F., Staritsky, I., Kros, H., 2010. Final Report of CCAT Project Results.Deliverable 2.8 of EU STREP 44423-CCAT. Technical Report.
Elmi, A., Mehdi, B., Madramootoo, C., Dam, R., Smith, D., 2009. Long-term effect ofconventional and no-tillage production systems on nitrous oxide fluxes fromcorn (Zea mays l.) field in southwestern quebec. American Journal of Environ-mental Sciences 5, 238e246. Cited By (Since 1996).
EMEP, 2001. EMEP Measurement Database. Technical Report. The Co-operativeProgramme for the Monitoring and Evaluation of the Long-Range Transmissionof Air Pollutants in Europe.
ETC-TE, 2000. Corine Land Cover Database (Version 12/2000). Technical Report.European Environmental Agency, European Topic Centre on TerrestrialEnvironment.
EU-Commission, 2004a. Commission Regulation No 796/2004. Technical Report.European Commission.
EU-Commission, 2004b. European Soil Database (Version V2.0). Technical Report.European Commission, DG. Joint Research Centre, Institute for Environmentand Sustainability.
EU-Commission, 2009. Commission Regulation No. 1122/2009. Technical Report.European Commission.
EU-Commission, 2010. Agriculture in the EU e Statistical and Economic Informatione Report 2009. Technical Report. European Commission.
EU-Council, 2003. Council Regulation (EC) No 1782/2003. Technical Report. Euro-pean Council.
EU-Council, 2009. Council Regulation (EC) No 73/2009. Technical Report. EuropeanCouncil.
EUROSTAT, 2003. The Geographic Information System of the European Commission(GISCO) Reference Database: Version: 07/2003. Technical Report. StatisticalOffice of the European Communities.
FAO, 2005. Key to Drought-Resistant Soil and Sustained Food Production. TheImportance of Soil Organic Matter. Soils Bulletin 80. Technical Report. FoodAgricultural Organization.
FAO, 2007. Payer les agriculteurs pour les services environnmentaux. La situationmondiale de l’alimentation et de l’agriculture 2007. Technical Report. FoodAgricultural Organization.
FAO/IFA/IFDC/IPI/PPI, 2002. Fertilizer use by crop, fifth ed. Technical Report. FAO eFood and Agriculture Organization of the United Nations, Rome.
Farahbakhshazad, N., Dinnes, D., Li, C., Jaynes, D., Salas, W., 2008. Modelingbiogeochemical impacts of alternative management practices for a row-cropfield in Iowa. Agriculture, Ecosystems and Environment 123, 30e48. Cited By(Since 1996) 3.
Farmer, M., 2007. The Possible Impacts of Cross Compliance on Farm Costs andCompetitiveness. Technical Report. Deliverable 21 of the CC Network Project,SSPE-CT-2005-022727.
Follador, M., Leip, A., 2009. Derivation of DNDC meta-models to evaluate the impactof Cross Compliance measures on nitrogen N surplus, N leaching, N2O emis-sions at European scaleT Project. Deliverable 4.2.3 of EU STREP 44423-CCAT.Technical Report. European Commission, D.G Joint Research Centre, Institute forEnvironment and Sustainability, Climate Change Unit.
Grant, B., Smith, W., Desjardins, R., Lemke, R., Li, C., 2004. Estimated N2O and Co2emissions as influenced by agricultural practices in Canada. Climatic Change 65,315e332. Cited By (Since 1996) 34.
Green, R., Cornell, S., Scharlemann, J., Balmford, A., 2005. Farming and the fate ofwild nature. Science 307, 550e555. Cited By (Since 1996) 165.
Huggins, D., Reganold, J., 2008. No-till: the quiet revolution. Scientific American299, 70e77. Cited By (Since 1996) 1.
Jones, R., Hiederer, R., Rusco, E., Montanarella, L., 2005. Estimating organic carbon inthe soils of Europe for policy support. European Journal of Soil Science 56,655e671. Cited By (Since 1996) 26.
Jongeneel, R., Elbersen, B., 2007. General approach to the assessment of the impactsof CC in the EU and the list of indicators. Technical Report. Deliverables 2.1 and2.2 of EU STREP 44423-CCAT Project.
Jongeneel, R., Elbersen, B., Klein-Lankhorst, R., De Vries, W., Kros, H., Velthof, G.,Kempen, M., Annen, D., Onate, J., van der Velde, M., Leip, A., 2008. Reportdescribing the operationalisation of the first selection of indicators into impactsof Cross Compliance for the implementation in the first prototype of theanalytical tool. Deliverable 2.3 of EU STREP 44423-CCAT. Technical Report.
JRC, 2003. Crop Monographies on Candidate Countries (MOCA Study). TechnicalReport. European Commission, Joint Research Centre.
Leip, A., Marchi, G., Koeble, R., Kempen, M., Britz, W., Li, C., 2008. Linking aneconomic model for European agriculture with a mechanistic model to estimatenitrogen and carbon losses from arable soils in Europe. Biogeosciences 5,73e94.
Li, C., 2000. Modeling trace gas emissions from agricultural ecosystems. NutrientCycling in Agroecosystems 58, 259e273. Cited By (Since 1996) 107.
Li, C., Farahbakhshazad, N., Jaynes, D., Dinnes, D., Salas, W., McLaughlin, D., 2006.Modeling nitrate leaching with a biogeochemical model modified based onobservations in a row-crop field in Iowa. Ecological Modelling 196, 116e130.Cited By (Since 1996) 15.
Li, C., Frolking, S., Butterbach-Bahl, K., 2005. Carbon sequestration in arable soils islikely to increase nitrous oxide emissions, offsetting reductions in climateradiative forcing. Climatic Change 72, 321e338. Cited By (Since 1996) 53.
Li, C., Frolking, S., Frolking, T., 1992. Model of nitrous oxide evolution from soildriven by rainfall events: 1, model structure and sensitivity. Journal ofGeophysical Research 97, 9759e9776.
Martens, D., Jaynes, D., Colvin, T., Kaspar, T., Karlen, D., 2006. Soil organic nitrogenenrichment following soybean in an Iowa cornesoybean rotation. Soil ScienceSociety of America Journal 70, 382e392. Cited By (Since 1996) 6.
Melaj, M., Echeverria, H., Lopez, S., Studdert, G., Andrade, F., Barbaro, N., 2003.Timing of nitrogen fertilization in wheat under conventional and no-tillagesystem. Agronomy Journal 95, 1525e1531. Cited By (Since 1996) 15.
Milklink, 2009. NVZ update e keep it practical. Technical Supplement for Milk LinkMembers. Technical Report. Milk Link Ltd, Devon.
Mitchell, T., Carter, T., Jones, P., Hulme, M., New, M., 2004. A comprehensive set ofhigh-resolution grids of monthly climate for Europe and the globe: theobserved record (1901e2000) and 16 scenarios (2001e2100). Working Paper55. Technical Report. Tyndall Centre for Climate Change Research.
Muller, T., Thorup-Kristesen, K., Magid, K., Stoumann Jensen, L., Hansen, S., 2006.Catch crops affect nitrogen dynamics in organic farming systems withoutlivestock husbandry e simulation with the daisy model. Ecological Modelling191, 538e544.
Olesen, J., 2009. Measure to promote both mitigation and adaptation to climatechange in agriculture. In: Climate Change: Global Risks, Challeges and Deci-sions. IOP Conference Series: Earth and Environmental Science, 6, 242005.
Orlandi, S., Van der Goot, E., 2003. Technical description of interpolation and pro-cessing of meteorological data in CGMS. Technical Report. European Commis-sion, DG Joint Research Centre, Agrifish Unit.
Orlandini, L., Leip, A., 2008. A high-resolution dataset of European daily weatherfrom 1901e2000 for applications with ecosystem models. In: Proceedings ofNitroEurope IP Open Science Conference.
Parry, M., Arnell, N., Berry, P., Dodman, D., Fankhauser, S., Hope, C., Kovats, S.,Nicholls, R., Satterthwaite, D., Tiffin, R., Wheeler, T., Lowe, J., Hanson, C., 2009.Adaptation to climate change: assessing the costs. Environment 51, 29e36.Cited By (Since 1996).
Qiu, J., Li, C., Wang, L., Tang, H., Li, H., Van Ranst, E., 2009. Modeling impacts ofcarbon sequestration on net greenhouse gas emissions from agricultural soils inchina. Global Biogeochemical Cycles 23 Cited By (Since 1996) 5.
M. Follador et al. / Environmental Pollution 159 (2011) 3233e3242 3241

Author's personal copy
Reganold, J., Papendick, R., Parr, J., 1990. Sustainable agriculture. Scientific American262, 112e120. Cited By (Since 1996) 27.
Rochette, P., 2008. No-till only increases N2O emissions in poorly aerated soils. Soiland Tillage Research 101, 97e100. Cited By (Since 1996) 5.
Scharf, P., Wiebold, W., Lory, J., 2002. Corn yield response to nitrogen fertilizertiming and deficiency level. Agronomy Journal 94, 435e441.
Scherr, S., Sthapit, S., 2009. Farming and land use to cool the Planet. In: State ofWorld 2009. W.W. Norton & Co, pp. 30e49 (Chapter 3).
Schjonning, P., Munkholm, L., Elmholt, S., Olesen, J., 2007. Organic matter andsoil tilth in arable farming: management makes a difference within 5e6years. Agriculture, Ecosystems and Environment 122, 157e172. Cited By(Since 1996) 16.
Shaffer, M., Ma, L., 2001. Carbon and nitrogen dynamics in upland soils. ModelingCarbon and Nitrogen Dynamics for Soil Management. CRC Press LLC, pp. 11e27(Chapter 2).
Singh, U., 2006. Integrated nitrogen fertilization for intensive and sustainableagriculture. Journal of Crop Improvement 15, 259e288. Cited By (Since 1996) 0.
Six, J., Bossuyt, H., Degryze, S., Denef, K., 2004. A history of research on the linkbetween (micro)aggregates, soil biota, and soil organic matter dynamics. Soiland Tillage Research 79, 7e31.
Six, J., Elliott, E.T., Paustian, K., 2000a. Soil macroaggregate turnover and micro-aggregate formation: a mechanism for c sequestration under no-tillage agri-culture. Soil Biology and Biochemistry 32, 2099e2103.
Six, J., Paustian, K., Elliott, E.T., Combrink, C., 2000b. Soil structure and organicmatter: I. distribution of aggregate-size classes and aggregate-associatedcarbon. Soil Science Society of America Journal 64, 681e689.
Smith, W., Grant, B., Desjardins, R., Lemke, R., Li, C., 2004. Estimates of the inter-annual variations of N2O emissions from agricultural soils in Canada. NutrientCycling in Agroecosystems 68, 37e45. Cited By (Since 1996) 22.
Tilman, D., Cassman, K., Matson, P., Naylor, R., Polasky, S., 2002. Agriculturalsustainability and intensive production practices. Nature 418, 671e677. Cited By(Since 1996) 343.
Tollefson, J., 2009. Paying to save the rainforests. Nature 460, 936e937. Cited By(Since 1996) 1.
Wright, A.L., Hons, F.M., Rouquette, F.M., 2004. Long-term management impacts onsoil carbon and nitrogen dynamics of grazed bermudagrass pastures. SoilBiology and Biochemistry 36, 1809e1816.
Wu, C., Wu, J., Luo, Y., Zhang, L., DeGloria, S., 2009. Spatial estimation of soil totalnitrogen using cokriging with predicted soil organic matter content. SoilScience Society of America Journal 73, 1676e1681. Cited By (Since 1996) 0.
M. Follador et al. / Environmental Pollution 159 (2011) 3233e32423242
Related Documents