1 Assessing the extent of agriculture/pasture and secondary succession forest in the Brazilian Legal Amazon using SPOT VEGETATION data João M. B. Carreiras a, *, José M. C. Pereira a , Manuel L. Campagnolo b , and Yosio E. Shimabukuro c a Department of Forestry, Instituto Superior de Agronomia, Tapada da Ajuda, 1349-017 Lisboa, Portugal. b Department of Mathematics, Instituto Superior de Agronomia, Tapada da Ajuda, 1349-017 Lisboa, Portugal, and Center for Logic and Computation, Instituto Superior Técnico, Lisboa, Portugal. c Remote Sensing Department, Instituto Nacional de Pesquisas Espaciais, Av. dos Astronautas, 1758, CEP 12227-010, São José dos Campos, SP, Brazil. *Corresponding author. Tel.: +351-213653387. E-mail address: [email protected] (J.M.B. Carreiras). Manuscript

Welcome message from author
This document is posted to help you gain knowledge. Please leave a comment to let me know what you think about it! Share it to your friends and learn new things together.
Transcript
1
Assessing the extent of agriculture/pasture and secondary succession forest in the
Brazilian Legal Amazon using SPOT VEGETATION data
João M. B. Carreiras a,*, José M. C. Pereira a, Manuel L. Campagnolo b, and Yosio E. Shimabukuro c
a Department of Forestry, Instituto Superior de Agronomia, Tapada da Ajuda, 1349-017 Lisboa,
Portugal.
b Department of Mathematics, Instituto Superior de Agronomia, Tapada da Ajuda, 1349-017 Lisboa,
Portugal, and Center for Logic and Computation, Instituto Superior Técnico, Lisboa, Portugal.
c Remote Sensing Department, Instituto Nacional de Pesquisas Espaciais, Av. dos Astronautas, 1758,
CEP 12227-010, São José dos Campos, SP, Brazil.
*Corresponding author. Tel.: +351-213653387.
E-mail address: [email protected] (J.M.B. Carreiras).
Manuscript
2
Abstract
There has been growing concern about land use/land cover change in tropical regions, as there is
evidence of its influence on the observed increase in atmospheric carbon dioxide concentration and
consequent climatic changes. Mapping of deforestation by the Brazilian Institute for Space Research
(INPE) in areas of primary tropical forest using satellite data indicates a value of 587,727 km2 up to the
year 2000. Although most of the efforts have been concentrated in mapping primary tropical forest
deforestation, there is also evidence of large-scale deforestation in the cerrado savanna, the second
most important biome in the region.
The main purpose of this work was to assess the extent of agriculture/pasture and secondary
succession forest in the Brazilian Legal Amazon (BLA) in 2000, using a set of multitemporal images
from the 1-km SPOT-4 VEGETATION (VGT) sensor. Additionally, we discriminated primary tropical
forest, cerrado savanna, and natural/artificial waterbodies. Four classification algorithms were tested:
quadratic discriminant analysis (QDA), simple classification trees (SCT), probability-bagging
classification trees (PBCT), and k-nearest neighbors (K-NN). The agriculture/pasture class is a
surrogate for those areas cleared of its original vegetation cover in the past, acting as a source of
carbon. On the contrary, the secondary succession forest class behaves as a sink of carbon.
We used a time series of 12 monthly composite images of the year 2000, derived from the
SPOT-4 VGT sensor. A set of 19 Landsat scenes was used to select training and testing data. A 10-
fold cross validation procedure rated PBCT as the best classification algorithm, with an overall sample
accuracy of 0.92. High omission and commission errors occurred in the secondary succession forest
class, due to confusion with agriculture/pasture and primary tropical forest classes. However, the
PBCT algorithm generated the lower misclassification error in this class. Besides, this algorithm yields
information about class membership probability, with ~ 80% of the pixels with class membership
probability greater or equal than 0.8. The estimated total area of agriculture/pasture and secondary
succession forest in 2000 in the BLA was 966 x 103 km2 and 140 x 103 km2, respectively. Comparison
with an existing land cover map indicates that agriculture/pasture occurred primarily in areas
previously occupied by primary tropical forest (46%) and cerrado savanna (33%), and also in transition
3
forest (19%), and other vegetation types (2%). This further confirms the existing evidence of extensive
cerrado savanna conversion.
This study also concludes that SPOT-4 VGT data are adequate for discriminating several
major land cover types in tropical regions. Agriculture/pasture was mapped with errors of about 5%.
Very high classification errors were associated with secondary succession forest, suggesting that a
different methodology/sensor has to be used to address this difficult land cover class (namely with the
inclusion of ancillary data). For the other classes, we consider that accurate maps can be derived from
SPOT-4 VGT data with errors lower than 20% for the cerrado savanna, and errors lower than 10% for
the other land cover classes. These estimates may be useful to evaluate impacts of land use/land
cover change on the carbon and water cycles, biotic diversity, and soil degradation.
Keywords: Brazilian Legal Amazon (BLA); agriculture/pasture; secondary succession forest; SPOT-4
VEGETATION (VGT); supervised classification
1. Introduction
There is clear evidence of increased carbon dioxide (CO2) concentration in the atmosphere, as careful
and systematic measurements since 1950s at the reference station in Hawaii (Mauna Loa) indicated a
steadily increase from ~315 ppm to ~380 ppm of CO2 (Keeling & Whorf, 2005), an increase of
approximately 20% in less than 50 years. Other studies, namely from air bubble analysis of ice caps
(e.g. Petit et al., 1999), showed that the CO2 concentration has been more or less stable around 280
ppm for thousands of years until 1800. Fossil fuel burning and forest depletion are quoted as the main
activities responsible for the observed increase in atmospheric CO2 concentration (Korner, 2000;
Vitousek et al., 1997). This increase has lead to an enhanced concern with land use/ land cover
change in tropical regions (Cochrane et al., 1999; Gedney & Valdes, 2000; Houghton et al., 2000;
Lambin et al., 2003). There has been growing concern with deforestation and its influence on the
carbon cycle, in particular in the Brazilian Legal Amazon (BLA), home of the major tropical forest
4
ecosystem in the world, (Achard et al., 2002; Cardille & Foley, 2003; Houghton et al., 2000, 2001;
Skole & Tucker, 1993; Souza Jr. et al., 2003). According to the Brazilian Institute of Geography and
Statistic (IBGE), the major biomes in the BLA are primary tropical forest (ombrophyllous and seasonal
forest) (~ 65%) and cerrado savanna (~ 15%), the remainder being transition forest and other
vegetation types (IBGE, 1988). The potential distribution area of primary tropical forest is in central,
northern, and western BLA, whilst cerrado savanna is mostly concentrated in the states of Mato
Grosso and Tocantins, the southern and eastern rims of the BLA (IBGE, 1988). Therefore, it is
important to know the main land use land cover changes in these two main biomes, particularly in the
less studied cerrado savanna. Myers et al. (2000) have identified the South America cerrado as one of
the 25 most important terrestrial biodiversity hotspots in the world, with thousands of plant species and
hundreds of mammal, bird, reptile, and amphibian species. Identification of areas undergoing forest
regeneration is also important, as they play an important role as carbon sink (Brown & Lugo, 1990;
Curran & Foody, 1994). Recent international and Brazilian led studies focused on the Amazon Basin:
the Tropical Ecosystem Environment observation by Satellite (TREES) project of the Joint Research
Centre (JRC) aimed at mapping and monitoring the pan-tropical humid forest belt using National
Oceanic and Atmospheric Administration (NOAA) Advanced Very High Resolution Radiometer
(AVHRR) data (e.g. Achard et al., 2001); the JRC’s Global Land Cover 2000 (GLC2000) project is
providing a harmonized land cover database over the whole globe for the year 2000, with some
emphasis in areas considered as deforestation hotspots (e.g. Bartholomé & Belward, 2005); the Large
Scale Biosphere Atmosphere Experiment in Amazonia (LBA), an international research program led
by Brazil, aims at studying the role of the Amazon region as part of the Earth system, and at
evaluating the influence of land-use and climate change in biological, chemical, and physical
processes (e.g. Roberts et al., 2003). Due to the extent of the BLA, approximately 5 x 10⁶ km2, as well
as restricted accessibility throughout most of the area, remote sensing data have an important role in
characterizing land use/land cover changes. Several studies have addressed the problem of land
use/land cover change, deforestation, and forest regeneration mapping in the BLA using high
resolution (Achard et al., 2002; Adams et al., 1995; Foody et al., 1996; Kimes et al., 1999; Lucas et al.,
2002; Skole & Tucker, 1993) and coarse resolution (Achard et al., 2001; Carreiras et al., 2002; Lucas
et al., 2000; Rodriguez-Yi et al., 2000) optical remote sensing data.
5
The spatial and temporal patterns of deforestation in the BLA closely follow the construction of
highways (Fearnside, 1993; Lambin et al., 2003; Moran et al., 1994; Nepstad et al., 1997). Large-scale
deforestation in the BLA began with the construction of the Belém-Brasilia Highway (BR-010) in 1958
(Moran et al., 1994). Subsequently, the BR-364 in Mato Grosso, Rondônia and Acre, the
Transamazon highway in central Pará and Amazonas, and the PA-150 in east-central Pará, promoted
human settlement and forest conversion (Nepstad et al., 1997). Most of the deforested areas were
occupied by agricultural crops and cattle pasture, but also by mining and logging activities (Asner et
al., 2005; Moran et al., 1994; Nepstad et al., 1997). Although most of the effort in mapping
deforestation has been concentrated in areas of primary tropical forest (e.g. INPE, 2002; Skole &
Tucker, 1993), large-scale deforestation in the cerrado savanna biome has received some attention
(Fearnside, 1993; Cardille & Foley, 2003; Ferreira et al., 2003; Kaimowitz & Smith, 2001; Nepstad et
al., 1997; Sano et al., 2001). The Brazilian Institute for Space Research (INPE) performs nearly
annual mapping of BLA deforestation since the end of the 1980’s using data from the Landsat
Thematic Mapper (TM) sensor. INPE (2002) has reported that BLA deforestation in areas of primary
tropical forest reached a value of 587,727 km2 by the end of 2000, including 97,000 km2 of old
deforestation (prior to 1960) in Pará and Maranhão. Native vegetation clearing in regions dominated
by cerrado savanna is not well documented, mainly because spectral differences between natural
vegetation and agricultural crops are more subtle than those observed when primary tropical forest is
converted to agriculture (Nepstad et al., 1997). Nonetheless, there is evidence from integrated satellite
and census data that extensive conversion has occurred in regions of cerrado savanna between the
early 1980s and the mid 1990s (Cardille & Foley, 2003).
Land abandonment is common in the BLA, resulting in a mosaic of regenerating vegetation of
different ages (Brown & Lugo, 1990; Perz & Skole, 2003). Several studies have shown that secondary
succession forest establishes rapidly in abandoned areas (Buschbacher et al., 1988; Mesquita et al.,
2001; Uhl, 1987; Uhl et al., 1988), mainly as the result of the high cost of re-clearance for most
farmers (Moran et al., 1994). Mapping and quantification of the area under forest regeneration in the
BLA, using remote sensing data, has been carried out by several authors (Foody et al., 1996; Kimes
et al., 1999; Lu et al., 2003; Lucas et al., 2000, 2002; Mausel et al., 1993; Skole et al., 1994;
Steininger, 2000; Vieira et al., 2003). However, most of the forest regeneration mapping in the entire
BLA was carried out in the late 1980s-early 1990s. Lucas et al. (2000), used data from the NOAA
6
AVHRR sensor, and estimated that 157,973 km2 supported forest regeneration during 1991-1994, with
approximately 50% being less than five years old. Therefore, a large amount of the mapped
secondary forest could possibly be temporary fallows, and not regenerating forest. Schroeder &
Winjum (1995), used a land cover map of South America, obtained from 1-km NOAA AVHRR data for
the period 1988-1991 (Stone et al., 1994), and estimated the extent of forest regeneration in the BLA
at 151,000 km2. Fearnside (1996), using a Markov matrix of annual transition probabilities, estimated
that approximately 48% (195,170 km2) of the deforested landscape in 1990 supported forest
regeneration. Recently, Cardille & Foley (2003), also using a Markov matrix of annual transition
probabilities, estimated that 36% (90,600 km2) of the deforested area between 1980 and 1995 in the
entire Amazon river drainage basin were in some stage of secondary succession forest. The work of
Lucas et al. (2000) was the only one to map several stages of secondary succession forest directly
from remote sensing data in the entire BLA (adding up to 157,973 km2), using an unsupervised
classification algorithm. Other studies (Cardille & Foley, 2003; Fearnside, 1996) estimated the total
area of forest regeneration through Markov modeling of existing land cover maps.
The main objective of this study was to map agriculture/pasture and secondary succession
forest in the BLA, using a time series of monthly composite images of the 1-km SPOT-4
VEGETATION (VGT) sensor, for the year 2000. A special emphasis was placed on agriculture/pasture
and secondary succession forest classes due to their influence on the carbon cycle. The
agriculture/pasture class included all the areas that were cleared of its original vegetation cover (i.e.
primary tropical forest and cerrado savanna) in the past, and that in the year 2000 still supported some
kind of agricultural or pasture use. Secondary succession forest refers to areas that were deforested in
the past, and that in 2000 exhibited some kind of regenerated vegetation. Additionally, we were
interested in discriminating primary tropical forest, cerrado savanna, and natural/artificial waterbodies.
We tested four supervised classification algorithms for land cover mapping: (i) quadratic discriminant
analysis, (ii) simple classification trees, (iii) probability-bagging classification trees, and (iv) k-nearest
neighbors. The dataset used in this study, the first daily 1-km annual coverage of the BLA spanning a
full year, has the potential for detecting cerrado savanna conversion, as phenological differences may
be more evident on a seasonal basis. Accuracy assessment of the resulting land cover map was
performed both quantitatively (i.e. with an error matrix and information about class membership
probability) and qualitatively (i.e. via comparison of class extent with land cover maps available from
7
the literature). Estimates of total areas were obtained through the application of the inverse method
calibration technique (e.g. Gallego, 2004; Tenenbein, 1972; Walsh & Burk, 1993).
2. Study area
The BLA is a politically defined region of Brazil and encompasses the states of Acre, Amapá,
Amazonas, Mato Grosso, Pará, Rondônia, Roraima, Tocantins, and a part of Maranhão (west of 44º
W) (Fig. 1). Most of the BLA is included in the Amazon River basin, with the exception of southern
Mato Grosso and western Maranhão, included in the Paraguai and Parnaíba river basins, respectively.
This region covers an area of approximately 5 x 10⁶ km2, consisting primarily of closed primary tropical
forest (ombrophyllous and seasonal forest), but also including large areas of flooded forest and
cerrado savanna (Alves, 2002). Mean temperature within the region varies from 25.8 ºC during the wet
season (October to April) to 27.9 ºC during the dry season (May to September) (Junk & Firch, 1985).
Mean annual rainfall is approximately 2250 mm, but varies considerably, ranging from 1500 mm in the
north and south to over 3000 mm in the northwest. (Goulding et al., 2003).
[Insert Fig. 1 about here]
3. Data
The original dataset used in this study was a set of daily 1-km SPOT-4 VGT images spanning the
entire year 2000, and covering the BLA (3360 x 2800 pixels) (images from Julian days 39, 45, 58, 77,
134, 178, 213, 220, 230, 252, 280, 292, and 294 were not available or had unrecoverable errors). The
dataset over the BLA ranged from 45º W to 75º W and from 5º N to 20º S, thus missing the portion of
the state of Maranhão between 44º and 45º W (~ 64 x 103 km2), and a small area of Roraima above 5º
N (~ 2 x 10³ km2). We used the S1 product, consisting of 1-km georeferenced, calibrated,
8
atmospherically corrected surface reflectance data (Passot, 2000). Among other characteristics, the
VGT sensor onboard the SPOT 4 and 5 satellites provides a better imagery acquisition geometry and
additional reflective bands [blue 0.43 – 0.47 µm, red 0.61 – 0.68 µm, near infrared (NIR) 0.78 – 0.89
µm, and short wave infrared (SWIR) 1.58 – 1.75 µm], when compared with the commonly used NOAA
AVHRR, which only has the red band (0.58 – 0.68 µm) and the NIR band (0.72 – 1.10 µm) in the
reflective part of the electromagnetic spectrum.
We have further combined SPOT-4 VGT S1 daily images into 12-monthly composite images,
from January to December 2000. The compositing algorithm is described in Carreiras & Pereira
(2005). Basically, each monthly composite image was produced by combining a monthly compositing
criterion and a transformation of the principal components analysis, with the objective of minimizing
cloud cover, while preserving as much as possible the original spatial structure of the data. The
monthly compositing criterion uses different conditions according to the nature of the land cover,
defined by a given vegetation index (VI), in this case the Soil Adjusted Vegetation Index (Huete,
1988). If a pixel is considered to represent a vegetated surface (VI greater than a given threshold)
then the date of the third lowest value of the SWIR band is selected. Otherwise, (VI lower than a given
threshold), it indicates a bare ground/sparsely vegetated pixel, and the third lowest value of the red
band is selected. This algorithm assumes that a pixel is unlikely to be covered by cloud shadows more
than two times per month. Furthermore, the Maximum Noise Fraction (MNF) (Green et al., 1988), a
principal components transformation that rescales the noise in the image, was applied to the
multitemporal dataset of monthly composite images and tested as a method of additional signal-to-
noise ratio improvement. The back-transformed dataset using the first few MNF eigenimages yielded
an accurate reconstruction of monthly composite images from the dry season (May-September) and
enhanced spatial coherence from wet season images (October-April).
Our main focus was on the correct evaluation of the spatial distribution of agriculture/pasture
and secondary succession forest. Wall-to-wall mapping was obtained by considering areas of primary
tropical forest, cerrado savanna, and natural/artificial waterbodies. Landsat TM and Enhanced TM+
(ETM+) data from the years 2000 and 2001 were used to collect training data for the SPOT-4 VGT
imagery (Fig. 1 and Table 2). We first defined a set of scenes through a stratified sampling procedure.
Then, in each scene, training polygons were chosen through a quasi-systematic sampling design.
Each polygon corresponds to two to four pixels of the VGT imagery. The number of polygons per class
9
exceeds the minimum recommended by Congalton & Green (1999), for a significance level of 95%
and an error of 5%.
More specifically, a total of 19 scenes were selected to represent the various
agriculture/pasture hotspots, existing secondary succession forest areas, and remaining land cover
types (Table 2). The selection of scenes representing agriculture/pasture hotspots was made through
the inspection of deforestation maps produced by INPE in the scope of the Prodes Digital Project (e.g.
INPE, 2002). Since INPE does not account for cerrado savanna conversion, we selected scenes in
areas where there is evidence of that process (e.g. Mato Grosso, Tocantins). Areas that were
deforested and currently support agriculture or pasture were easily identified in Landsat data, due to
their spectral characteristics and regular field geometry. The choice of scenes with secondary
succession forest was accomplished essentially by looking at the aforementioned literature, which list
several areas of the states of Pará, Maranhão, Amazonas, and Mato Grosso as having progressed to
forest regeneration. Areas of secondary succession forest were selected using two dates per scene;
an area was considered to support secondary succession forest if in the first date it had been
subjected to deforestation, and in the second date (2000/2001) it no longer supported agriculture or
pasture. Stratification of the remaining land cover classes was done according to an original 59-class
vegetation map of the BLA, which was further generalized into a 13-class map (IBGE, 1988). Landsat
data were obtained from INPE, in the scope of the Prodes Digital Project
(http://www.obt.inpe.br/prodes), and from the Global Land Cover Facility (GLCF), University of
Maryland (USA) (http://glcf.umiacs.umd.edu).
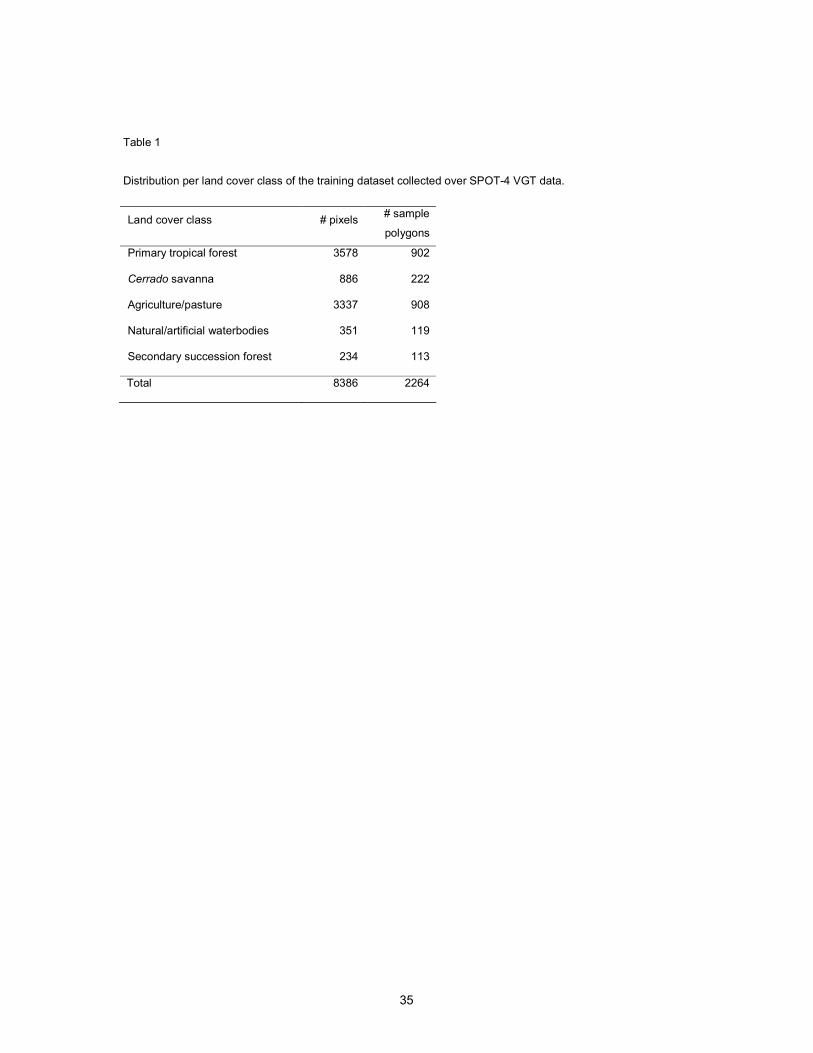
[Insert Table 1 and Table 2 about here]
In the late 1980s IBGE produced a map of potential vegetation types of Brazil, with 59 classes
(Mapa de Vegetação do Brasil (IBGE, 1988)). Later, it was generalized into a 13-class map. We
further aggregated it into four major classes: primary tropical forest, cerrado savanna, transition forest,
and other vegetation types. The latest is mostly composed of alluvial riparian vegetation (IBGE, 1988).
We used this last map to assess the extent of agriculture/pasture and secondary succession forest.
10
4. Methods
4.1. Classification algorithms
Several classification techniques and algorithms have been used to characterize land use/land cover
change in the BLA, using optical remote sensing data. Skole & Tucker (1993) used visual
interpretation of Landsat TM band 5 black and white photographic images of the entire BLA, to map
deforestation over closed tropical forests in 1988. Lucas et al. (2000) used NOAA AVHRR data for the
period 1991-1994, to map the extent of secondary succession forest stages in the entire BLA, relying
on an unsupervised classification algorithm (isodata). Other studies focused in particular regions of the
BLA. Adams et al. (1995) mapped land-cover change near Manaus (Amazonas), between 1988 and
1991, based on fractions of spectral endmembers over Landsat TM data. Foody et al. (1996) mapped
different forest regeneration stages, using a maximum likelihood classifier with Landsat TM data from
1991 in an area corresponding approximately to that of Adams et al. (1995). Kimes et al. (1999)
mapped primary forest, forest regeneration age classes, and deforested areas, using SPOT High
Resolution Visible (HRV) 1994 data for Rondônia, with neural networks and linear discriminant
functions. Rodríguez-Yi et al. (2000) used supervised classification by regions (Bhattacharya distance)
followed by image segmentation of 1993 NOAA AVHRR data, to map eight vegetation classes in the
state of Mato Grosso. Achard et al. (2001), in the scope of the TREES project, mapped several land
cover classes in the pan-tropical humid forest belt, using unsupervised classification algorithms and
NOAA AVHRR data from the early 1990s. Lu et al. (2003) used Landsat TM data of 1998, over
Rondônia, to classify secondary succession forest stages and primary forest, with a maximum
likelihood classifier and threshold in image fractions derived from a linear mixture model. Vieira et al.
(2003) relied on Landsat ETM+ data of 1999 from northeast Pará, to classify forest regeneration, with
a supervised classification algorithm. Souza Jr. et al. (2003) using a decision tree classifier, mapped
intact forest, logged forest, degraded forest, and secondary succession forest, with 20-m SPOT 4
multispectral data of 1999 in northeast Pará. Carreiras et al. (2004) mapped nine land cover classes in
the state of Mato Grosso, using a probability bagging classification tree and SPOT-4 VGT data from
2000.
11
Next, we describe briefly the four supervised classification algorithms used in this study.
Quadratic discriminant analysis (QDA), usually known as the maximum likelihood classifier in remote
sensing literature, is a parametric supervised classification method. Assuming that spectral signatures
in each class are Gaussian, and that the (maximum likelihood) estimates of the mean vectors (µi) and
the variance-covariance matrices (Σi) in each class are accurate, the quadratic discriminant rule is an
optimum classification rule. The training sample has to be large enough to yield good estimates of µi
and Σi for each class (Richards, 1986).
Classification trees are a non-parametric method. A classification tree partitions the space of
all possible spectral signatures x, starting with the whole spectral space (at the root of the tree) and
successively splitting that space in subsets, such that each subset is more likely to be assigned to one
of the land cover classes than the subset from which it is split (Breiman et al., 1984; Safavian &
Landgrebe, 1991). All subsets of the spectral space are represented by nodes in a tree, and each split
corresponding to the descendents of a node. Since each node of the tree represents an element Pj of
a partition of the space of all possible x, one can estimate P(classi /x∈ Pj) for all terminal nodes and all
classes, and assign the node to the class with the highest probability. The estimate of P(classi /x∈ Pj)
is simply the proportion of pixels that belong to classi among all the training sample pixels that are in
Pj. The aim of the procedure is to find a tree that better approximates the actual conditional
probabilities P(classi /x). In the Classification and Regression Trees (CART) algorithm of Breiman et al.
(1984) heuristic techniques are used to find a tree structure that discriminates the classes (i.e. which
terminal nodes have a high proportion of sample individuals of some class) but is not overfitted to the
training sample (i.e. the tree should not be “too large”). Hereafter, this type of classification algorithm
will be referred as simple classification tree (SCT). However, classification trees are sensitive to small
perturbations in the training set, which may originate large changes in the resulting classifiers
(Breiman, 1996). Therefore, these unstable methods can have their accuracy improved with a
perturbing and combining technique, that is, by generating multiple perturbed versions of the classifier
(a.k.a. ensemble, or committee) and combining those into a single predictor (Breiman, 1998). Methods
that use ensemble of classifiers have demonstrated to be very successful at improving the accuracy of
classification trees (Bauer & Kohavi, 1998; Maclin & Opitz, 1997). These methods can be divided in
two types: those that adaptively change the distribution of the training set based on the performance of
previous classifiers (e.g. boosting) and those that do not (e.g. bagging) (Bauer & Kohavi, 1998). In this
12
study we will only focus on the bagging algorithm applied to classification trees. In bagging, each sub-
classifier ci (i=1…n)(in this case a SCT) is run on n different bi bootstrap samples of the original m
training set observations. Each bi is generated by uniformly sampling m observations from the training
set with replacement. The final classifier C is built from ci, whose output is the class most frequently
predicted by its sub-classifiers, with ties broken arbitrarily (Bauer & Kohavi, 1998; Breiman, 1996).
Although the main purpose of bagging was to build a strong classifier by means of variance reduction
(Breiman, 1996), some variants of bagging have also proven adequate for the estimation of class
membership probability (Bauer & Kohavi, 1998; Breiman, 1996; Perlich et al., 2003; Provost &
Domingos, 2003). Probability-bagging classification trees (PBCT) is one of such variants, so that
instead of returning a classification, each sub-classifier returns a probability distribution for the classes
in each terminal node (Bauer & Kohavi, 1998; Provost & Domingos, 2003). Subsequently, the PBCT
algorithm averages the probability for each class over all sub-classifiers, and predicts the class with
the highest probability. However, Provost & Domingos (2003) note that these probability estimators of
class membership are not unbiased. Nevertheless, those estimates can be useful in land cover
mapping, by assigning to each pixel a relative degree of classification confidence. In this study we
used 25 bootstrap replicates to build a PBCT, evaluated with a 10-fold cross validation approach.
Breiman (1996) suggests that a higher number of replicates tend not to produce a significant test set
error reduction.
The k-nearest neighbors (K-NN) is a non-parametric classification method. In the machine
learning terminology it is called an instance-based method (Mitchell, 1997). The K-NN classifier
estimates, for each single x in the image, the probability P(classi /x) from the training sample. Let
{x1,...,xk} be the k elements of the training sample which are closest to x in the spectral space with
respect to the Euclidean distance. Those are called the nearest neighbors of x. The estimate of
P(classi /x) is simply the proportion of pixels that belong to classi among the k nearest neighbors of x. If
k=1, then the method is named the nearest neighbor classifier and it simply assigns each pixel in the
image to the class of its training sample nearest neighbor. This can lead to overfitting the classification
to the training data. Choosing a larger k can overcome that problem. So, one crucial parameter of the
K-NN classifier is the number of neighbors, k. In this work, we looked for the optimum k by minimizing
the overall (for all classes) test set error. To estimate k we ran the method for k=1,2,…,10, plotted the
corresponding cross-validation estimate of the overall test set error, and chose the best k.
13
4.2. Accuracy assessment
Accuracy assessment of the land cover map obtained with each classifier was evaluated both
quantitatively and qualitatively. The accuracy of each classifier was assessed by a 10-fold cross
validation procedure, with associated error matrices and measures of overall and class-specific
accuracy (Congalton & Green, 1999; Foody, 2002; Smits et al., 1999). Accuracy assessment was
performed on spatial independent testing subsets, to avoid overestimation of classification accuracy
results (Friedl et al., 2000, 2002). The error matrix of each classifier is used as an approximation for
the accuracy of the land cover map. The difficulty in obtaining up-to-date independent information of
spatial distribution of land cover classes in the BLA led us to choose a complementary approach. As
mentioned before, the application of the PBCT algorithm can provide information of class membership
probability. Therefore, application of this classifier to the entire BLA can provide a map of class
membership probability, that is, in each pixel, the highest averaged probability over the sub-classifiers
derived from the 25 replicates of the training samples. Friedl et al. (2002) and McIver & Friedl (2001)
and used a similar approach to build maps of classification confidence, based on recent results
explaining boosting as a form of additive logistic regression (Friedman et al., 2000).
The most straightforward way of estimating total areas for each class is to count the number of
pixels in each one after classification. This is called “naïve estimation” in the remote sensing literature
(Gallego, 2004). As a matter of fact, areal estimates obtained this way are biased (e.g. Gallego, 2004;
Walsh & Burk, 1993). Some post-classification methods have been used to improve these estimates,
namely the so called calibration techniques (e.g. Krutchkoff, 1967). They are basically divided into
classical and inverse methods, and they utilize the information contained in the error matrix to correct
for misclassification bias (Walsh & Burk, 1993). Walsh & Burk (1993) carried out a simulation study
and concluded that the inverse method consistently performed better than the classical method. The
idea behind that calibration technique is to use the misclassification probabilities among classes to
revise the proportions given by pixel counting (pi). In particular, the error matrix allows us to estimate
the probabilities of classification of a pixel of class i in class j, as nij/n.j (where i represents the
observed class, j the predicted class, and n.j the sum of all training observations predicted as class j).
14
Then, the revised proportion for class i is given by ∑j
jijj nnp ./ . It has been shown that the inverse
method leads to unbiased estimates for total areas (Tenenbein, 1972, Walsh & Burk, 1993).
A more qualitative comparison with existing land cover maps was also performed, by
assessing overall class extent in the BLA. The comparison was made with three known available
global land cover datasets (Eva et al., 2004; Friedl et al., 2002; Hansen et al., 2000). Hansen et al.
(2000) produced a 1-km 12-class global land cover map (a.k.a. University of Maryland global land
cover map), using AVHRR data from 1992-1993. Friedl et al. (2002) produced a 1-km 17-class global
land cover map (a.k.a. Boston University global land cover map), using Terra/Aqua Moderate
Resolution Imaging Spectroradiometer (MODIS) data from 2001, and updated at quarterly (96 days)
intervals. Eva et al. (2004) produced a 1-km 42-class vegetation map of South America for the year
2000, as part of the GLC2000 project, using four sets of satellite data: Along Track Scanning
Radiometer (ATSR-2) onboard the ERS-2 satellite, SPOT-4 VGT, JERS-1 radar data, and Defense
Meteorological Satellite Program (DMSP) Operational Linescan System (OLS) data. To establish a
comparison we had to aggregate primary tropical forest and secondary succession forest classes, as
the abovementioned studies do not discriminate between those two classes.
5. Results
5.1. Image classification
A total of 8386 pixels of known land cover, corresponding to 2264 sampling polygons, were identified
in the Landsat imagery and overlaid on the SPOT-4 VGT monthly composites. The distribution per
land cover class is shown in Table 1. The precision of each classification algorithm was evaluated
using 10-fold cross validation. The criterion used for the K-NN algorithm resulted in the selection of
k=7. Comparison with this relatively large number of neighbors reduces the danger of overfitting. The
15
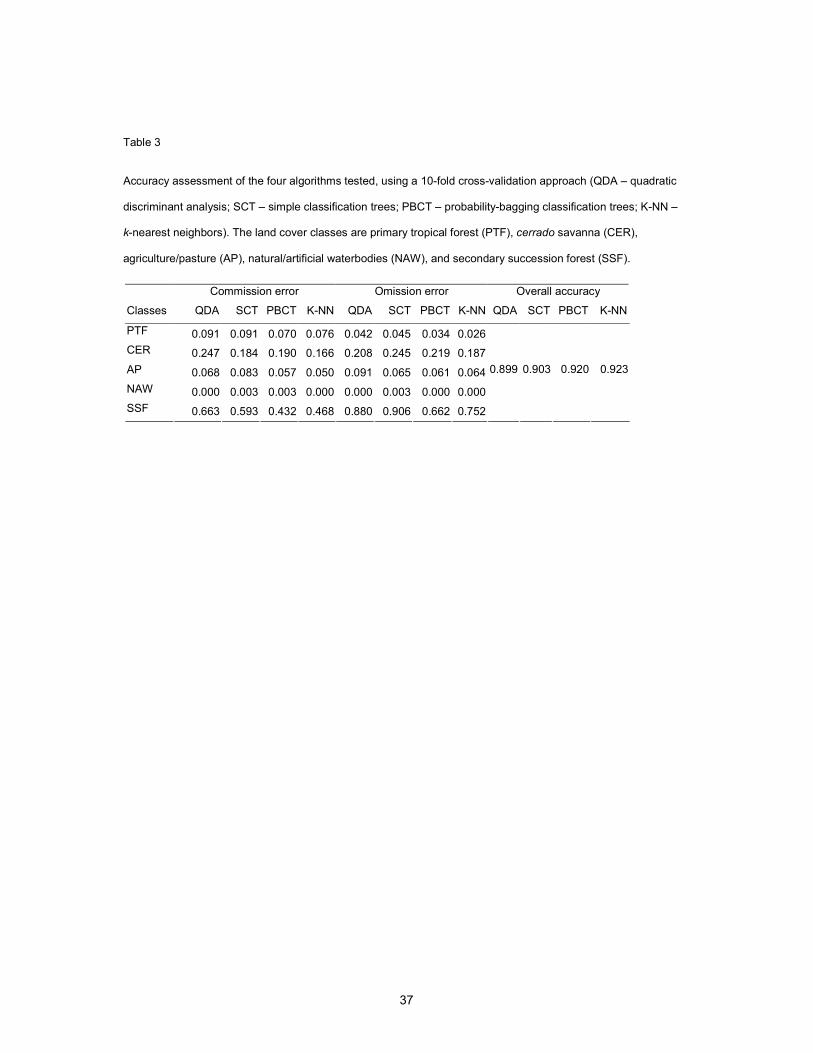
comparison of the four algorithms, using overall and class-specific accuracy is shown in Table 3. All
algorithms yielded similar results for the natural/artificial waterbodies, agriculture/pasture, and primary
tropical forest classes, displaying commission and omission errors always below 0.10, but lower for
the K-NN and PBCT classifiers. The cerrado savanna class had commission and omission errors
between 0.166-0.247 in all algorithms, but lower in the K-NN algorithm. The secondary succession
forest class was the most problematic, with high commission and omission errors. Nevertheless, the
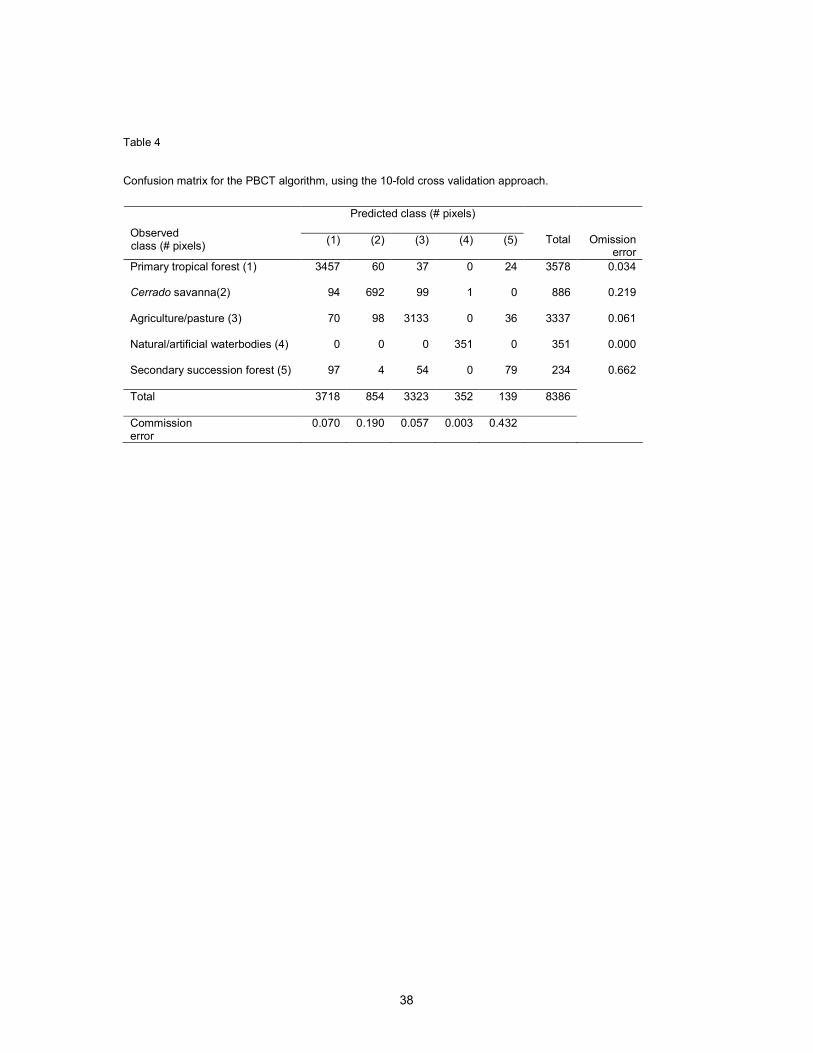
PBCT classifier produced the lower commission (0.432) and omission (0.662) errors for this class. In
this algorithm, the major confusion occurred between the secondary succession forest class and the
primary tropical forest and agriculture/pasture classes (Table 4). The cerrado savanna class had also
considerable commission (0.190) and omission (0.219) errors, resulting from confusion with primary
tropical forest and agriculture/pasture classes.
[Insert Table 3 and Table 4 about here]
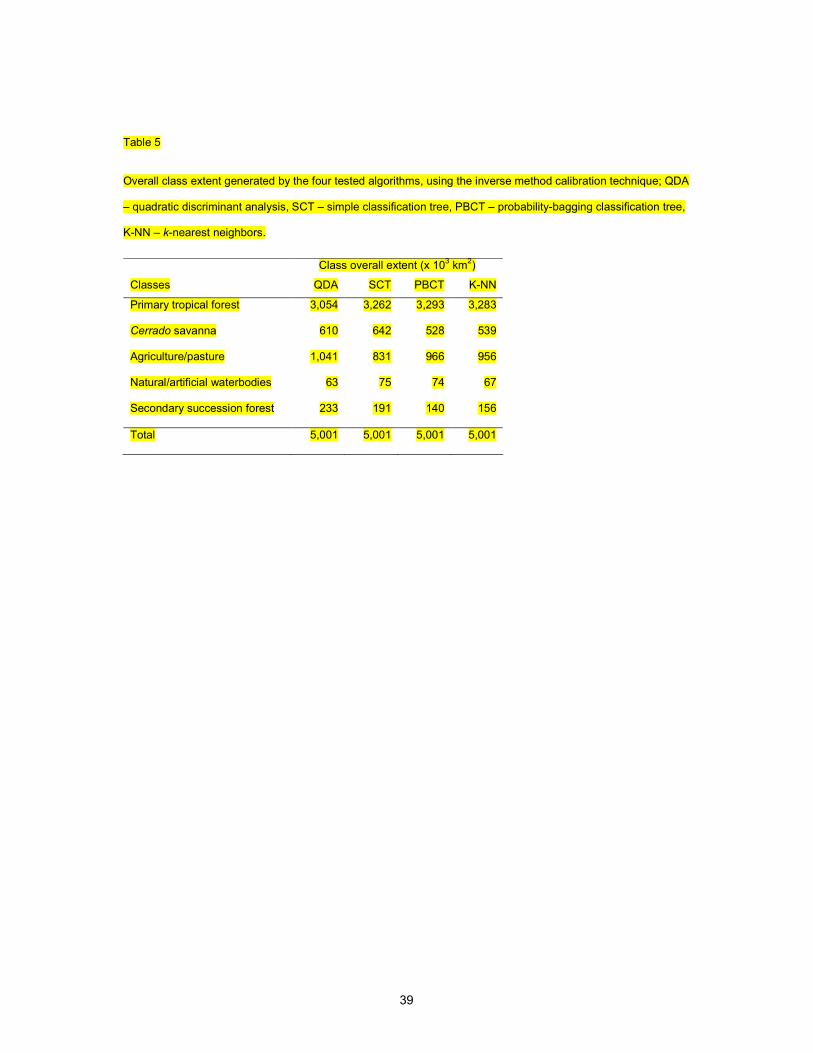
Comparison of the overall class extent in the BLA produced by the four tested algorithms,
using the inverse method calibration technique, is shown in Table 5. Although there are considerable
variations in some of the classes, the main discrepancy was in the secondary succession forest class.
The difference from the lowest extent, generated by the PBCT classifier (140 x 103 km2) to the highest,
produced by the QDA (233 x 103 km2) is quite large. However, the most accurate algorithms, namely
PBCT and K-NN, produced a very similar overall extent of the mapped land cover classes (e.g. 140 x
103 km2 and 156 x 103 km2 in secondary succession forest, respectively). Of the four algorithms, the
PBCT yielded the greatest areal estimate of primary tropical forest and the lowest estimate of cerrado
savanna and secondary succession forest.
[Insert Table 5 about here]
16
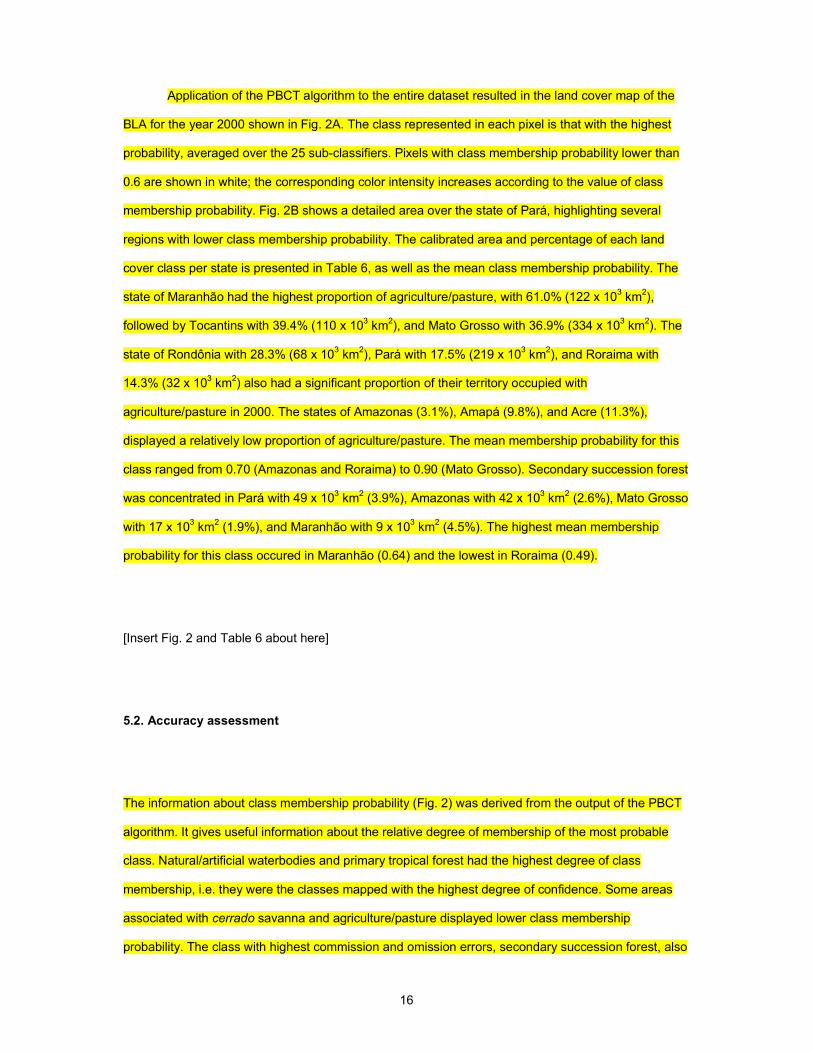
Application of the PBCT algorithm to the entire dataset resulted in the land cover map of the
BLA for the year 2000 shown in Fig. 2A. The class represented in each pixel is that with the highest
probability, averaged over the 25 sub-classifiers. Pixels with class membership probability lower than
0.6 are shown in white; the corresponding color intensity increases according to the value of class
membership probability. Fig. 2B shows a detailed area over the state of Pará, highlighting several
regions with lower class membership probability. The calibrated area and percentage of each land
cover class per state is presented in Table 6, as well as the mean class membership probability. The
state of Maranhão had the highest proportion of agriculture/pasture, with 61.0% (122 x 103 km2),
followed by Tocantins with 39.4% (110 x 103 km2), and Mato Grosso with 36.9% (334 x 103 km2). The
state of Rondônia with 28.3% (68 x 103 km2), Pará with 17.5% (219 x 103 km2), and Roraima with
14.3% (32 x 103 km2) also had a significant proportion of their territory occupied with
agriculture/pasture in 2000. The states of Amazonas (3.1%), Amapá (9.8%), and Acre (11.3%),
displayed a relatively low proportion of agriculture/pasture. The mean membership probability for this
class ranged from 0.70 (Amazonas and Roraima) to 0.90 (Mato Grosso). Secondary succession forest
was concentrated in Pará with 49 x 103 km2 (3.9%), Amazonas with 42 x 103 km2 (2.6%), Mato Grosso
with 17 x 103 km2 (1.9%), and Maranhão with 9 x 10³ km2 (4.5%). The highest mean membership
probability for this class occured in Maranhão (0.64) and the lowest in Roraima (0.49).
[Insert Fig. 2 and Table 6 about here]
5.2. Accuracy assessment
The information about class membership probability (Fig. 2) was derived from the output of the PBCT
algorithm. It gives useful information about the relative degree of membership of the most probable
class. Natural/artificial waterbodies and primary tropical forest had the highest degree of class
membership, i.e. they were the classes mapped with the highest degree of confidence. Some areas
associated with cerrado savanna and agriculture/pasture displayed lower class membership
probability. The class with highest commission and omission errors, secondary succession forest, also
17
had low class membership probability, meaning that allocation of a pixel to this class was done with a
relatively low degree of confidence.
6. Discussion
6.1. Image classification
The misclassification among secondary succession forest, primary tropical forest, and
agriculture/pasture (Table 4) is understandable, since from a spectral standpoint, secondary
succession forest is a transitional class between agriculture/pasture and primary tropical forest. After
deforestation, and following land abandonment, the initial stages of forest regeneration are spectrally
similar to agriculture/pasture; conversely, final stages of forest regeneration are more related to
primary tropical forest. Lucas et al. (2000), using NOAA AVHRR data to map secondary succession
forest in the BLA during early 1990s, reported a similar error pattern, with omission and commission
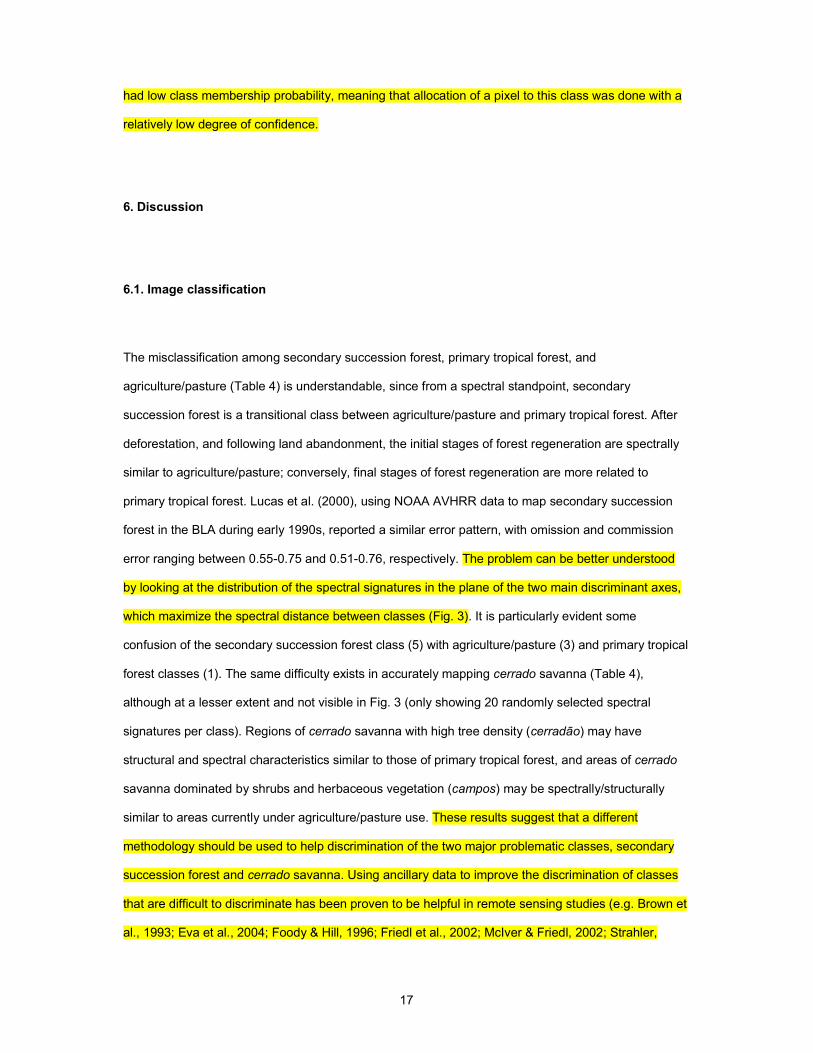
error ranging between 0.55-0.75 and 0.51-0.76, respectively. The problem can be better understood
by looking at the distribution of the spectral signatures in the plane of the two main discriminant axes,
which maximize the spectral distance between classes (Fig. 3). It is particularly evident some
confusion of the secondary succession forest class (5) with agriculture/pasture (3) and primary tropical
forest classes (1). The same difficulty exists in accurately mapping cerrado savanna (Table 4),
although at a lesser extent and not visible in Fig. 3 (only showing 20 randomly selected spectral
signatures per class). Regions of cerrado savanna with high tree density (cerradão) may have
structural and spectral characteristics similar to those of primary tropical forest, and areas of cerrado
savanna dominated by shrubs and herbaceous vegetation (campos) may be spectrally/structurally
similar to areas currently under agriculture/pasture use. These results suggest that a different
methodology should be used to help discrimination of the two major problematic classes, secondary
succession forest and cerrado savanna. Using ancillary data to improve the discrimination of classes
that are difficult to discriminate has been proven to be helpful in remote sensing studies (e.g. Brown et
al., 1993; Eva et al., 2004; Foody & Hill, 1996; Friedl et al., 2002; McIver & Friedl, 2002; Strahler,
18
1980). This information could be particularly useful in large scale land cover mapping (i.e. continental
or global), characterized by high within-class variability (McIver & Friedl, 2002). Some methods use
ancillary data to help labeling cluster classes resulting from unsupervised classification algorithms
(Brown et al., 1993; Eva et al., 2004); these can include elevation, soil, and land use/land cover data.
Other methods rely on ancillary data to improve the ability of supervised classification algorithms to
discriminate land cover classes (Friedl et al., 2002; McIver & Friedl, 2002; Strahler, 1980). McIver &
Friedl (2002) showed that the incorporation of prior probabilities of class membership in a supervised
non-parametric classification algorithm successfully improved land cover classification results; these
are being used by the MODIS land cover classification algorithm (MLCCA) to produce the Boston
University land cover map (Friedl et al., 2002).
[Insert Fig. 3 about here]
QDA, SCT, and PBCT/K-NN yielded a distinct overall class extent using the same training set,
especially for the secondary succession forest class. The QDA and SCT algorithms seem to behave
consistently worse than K-NN or PBCT (Table 3). Both PBCT and K-NN produce a very similar class
extent, and they are also the two algorithms with higher overall accuracy. Furthermore, the PBCT
classifier proved to be the one with lower commission and omission errors for the secondary
succession forest class, as well as producing the lower omission error and the second lower
commission error for the agriculture/pasture class. Therefore, this algorithm is the one that better
discriminated these two classes.
Deforestation started long ago in the states of Maranhão and Pará (Nepstad et al., 1997) and
a part of this area appears to have been abandoned, allowing for the regrowth of secondary
succession forest. If the combined area of agriculture/pasture and secondary succession forest in
2000 (1106 x 103 km2), mapped with the PBCT algorithm, can be viewed as a proxy for the total
deforested area in the BLA by 2000, then this number is almost double the cumulative deforestation
value of 587,727 km2 reported by INPE (2002) up to the year 2000. Discrepancies between this study
and INPE’s estimate are more evident in those states where the proportion of cerrado savanna is
19
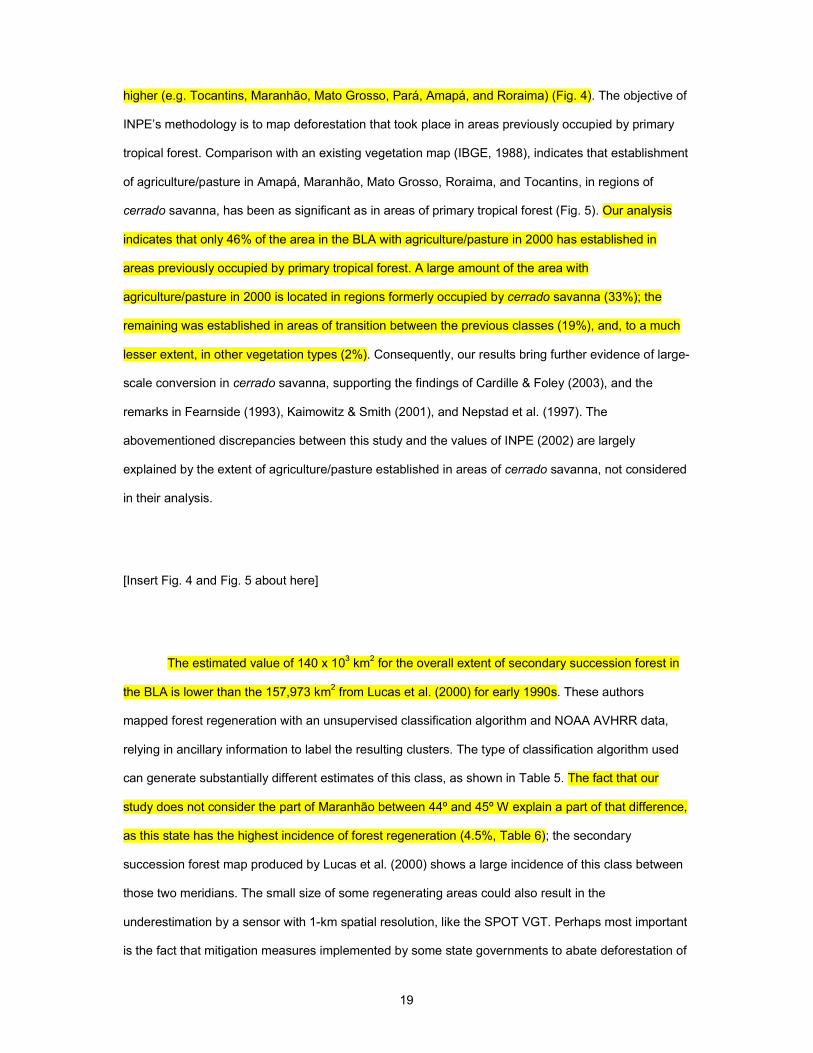
higher (e.g. Tocantins, Maranhão, Mato Grosso, Pará, Amapá, and Roraima) (Fig. 4). The objective of
INPE’s methodology is to map deforestation that took place in areas previously occupied by primary
tropical forest. Comparison with an existing vegetation map (IBGE, 1988), indicates that establishment
of agriculture/pasture in Amapá, Maranhão, Mato Grosso, Roraima, and Tocantins, in regions of
cerrado savanna, has been as significant as in areas of primary tropical forest (Fig. 5). Our analysis
indicates that only 46% of the area in the BLA with agriculture/pasture in 2000 has established in
areas previously occupied by primary tropical forest. A large amount of the area with
agriculture/pasture in 2000 is located in regions formerly occupied by cerrado savanna (33%); the
remaining was established in areas of transition between the previous classes (19%), and, to a much
lesser extent, in other vegetation types (2%). Consequently, our results bring further evidence of large-
scale conversion in cerrado savanna, supporting the findings of Cardille & Foley (2003), and the
remarks in Fearnside (1993), Kaimowitz & Smith (2001), and Nepstad et al. (1997). The
abovementioned discrepancies between this study and the values of INPE (2002) are largely
explained by the extent of agriculture/pasture established in areas of cerrado savanna, not considered
in their analysis.
[Insert Fig. 4 and Fig. 5 about here]
The estimated value of 140 x 103 km2 for the overall extent of secondary succession forest in
the BLA is lower than the 157,973 km2 from Lucas et al. (2000) for early 1990s. These authors
mapped forest regeneration with an unsupervised classification algorithm and NOAA AVHRR data,
relying in ancillary information to label the resulting clusters. The type of classification algorithm used
can generate substantially different estimates of this class, as shown in Table 5. The fact that our
study does not consider the part of Maranhão between 44º and 45º W explain a part of that difference,
as this state has the highest incidence of forest regeneration (4.5%, Table 6); the secondary
succession forest map produced by Lucas et al. (2000) shows a large incidence of this class between
those two meridians. The small size of some regenerating areas could also result in the
underestimation by a sensor with 1-km spatial resolution, like the SPOT VGT. Perhaps most important
is the fact that mitigation measures implemented by some state governments to abate deforestation of
20
primary tropical forest and cerrado savanna (e.g. Fearnside, 2003; Fearnside & Barbosa, 2003) could
result in the re-deforestation of secondary succession forest, thus reducing its extent. The distribution
of the areas of secondary succession forest in the BLA in 2000 indicates that the majority of this class
occurred in deforested areas previously occupied by primary tropical forest (88%); the exceptions are
the states of Mato Grosso, Tocantins, and Amapá, where forest regeneration appears in areas
originally covered by transition forest, cerrado savanna, and other vegetation types, respectively (Fig.
6). This is not surprising, as some farmers often abandon deforested areas due to intense vegetation
regrowth in areas of primary tropical forest (Fearnside, 1993; Moran et al., 1994; Nepstad et al., 1997;
Skole et al., 1994).
[Insert Fig. 6 about here]
Our combined areal estimates of agriculture/pasture and secondary succession forest for the
entire BLA in 2000 (comparable with INPE’s deforestation data by 2000) added up to 1106 x 103 km2,
and occurred mainly in primary tropical forest (531 x 103 km2), cerrado savanna (343 x 103 km2),
transition forest (199 x 103 km2), and other vegetation types (33 x 103 km2).
6.2. Accuracy assessment
The lower probability of class membership in the state of Roraima may be due to residual cloud
contamination in the monthly composite images. These class membership probability estimates were
compared with class-specific accuracy (i.e. commission error) and used to extend and complete
conventional accuracy assessment (Fig. 7). It can be seen that the class-specific mean membership
probability is highly inversely correlated with classification errors, i.e. higher classification errors tend
to have lower class membership probability. The lower class membership probability is associated with
the secondary succession forest class, which is in agreement with the higher omission and
commission errors. The agriculture/pasture class is the only one with a larger deviance from a linear
21
relation, represented by the y=1-x line. This class represents different types of landscape structures,
ranging from bare soil to fully developed agricultural crops, originating a higher dispersion of class
membership probability, as indicated by the highest standard deviation. A higher standard deviation is
also associated with cerrado savanna, a heterogeneous class as well, ranging from herbaceous
vegetation to closed-canopy forest. Also, the overall mean probability of class membership for the
entire BLA was 0.90 (0.15 standard deviation). This outcome corroborates the results of McIver &
Friedl (2001), who used a similar approach to derive estimates of classification confidence, and
showed that incorrectly classified areas (pixels) tend to have low classification confidence.
Consequently, the estimates of class membership probability add supplementary information
regarding map quality, mainly by defining the degree of classification confidence on a pixel-by-pixel
basis.
[Insert Fig. 7 about here]
A more qualitative analysis was performed by comparing overall estimates of class extent with
those from other studies, namely Eva et al. (2004), Friedl et al. (2002), and Hansen et al. (2000) (Fig.
8). In these studies, secondary succession forest class was not mapped separately, but was included
in various forest classes. Thus, for results to be comparable, we aggregated our estimates of primary
tropical forest and secondary succession forest. The main discrepancies between our study and
Hansen et al. (2000) are the extent of cerrado savanna and agriculture/pasture; the images used by
Hansen et al. (2000) are from the early 1990s, which may contribute to explain the low amount of
agriculture/pasture mapped; another explanation could be that they did not accurately mapped
agriculture/pasture in areas previously occupied by cerrado savanna; the poor spectral and geometric
characteristics of the NOAA AVHRR sensor compared to SPOT VGT may also explain that difference.
Friedl et al. (2002) used MODIS imagery from 2001 and a boosted decision tree, with an overall
classifier confidence of 0.90 (0.29 standard deviation), comparable to our estimated overall class
membership probability. The main difference with our results is in the agriculture/pasture class. They
mapped a substantially lower extent of agriculture/pasture, with a corresponding increase in cerrado
savanna, and aggregated primary tropical forest with secondary succession forest. The extent of
22
cropland, derived from their work (comparable to our agriculture/pasture class), reached a value
equivalent to the cumulative deforestation up to 1988 (377,500 km2), estimated by INPE (INPE, 2002).
Eva et al. (2004) utilized the same original SPOT VGT dataset used in this study, but used a different
image compositing procedure and an unsupervised classification algorithm (isodata). The overall
estimates of land cover classes between these two studies are very similar, the major differences
occurring in the aggregated primary tropical forest with secondary succession forest class, where our
analysis points to a smaller area, and in the agriculture/pasture class, which we mapped to a larger
extent. The type of classification algorithm used can explain that difference, as we have shown that
different classification algorithms produce different estimates of class extent.
[Insert Fig. 8 about here]
7. Conclusions
The higher amount of aggregated agriculture/pasture and secondary succession forest classes in
2000 obtained in this study (1106 x 103 km2), when compared with deforestation estimates up to 2000
from INPE (2002) (587,727 km2), is mostly due to agriculture/pasture occurring in areas previously
occupied by cerrado savanna, not considered in INPE’s estimates. It appears therefore that
agriculture/pasture establishment in areas previously occupied by cerrado savanna was almost as
important as in areas of primary tropical forest. The comparison of four classification algorithms
showed that the PBCT and the K-NN classifiers tend to perform better than the QDA and SCT. The
PBCT performs better especially over the secondary succession forest class, with lower commission
and omission errors. However, this class is problematical as it is extensively confused with primary
tropical forest and agriculture/pasture. The possibility of obtaining maps of class membership
probability derived from PBCT further improved the spatial characterization of agriculture/pasture and
secondary succession forest classes. We have shown that higher class membership probability is
associated with lower classification errors. This approach adds supplementary information for
accuracy assessment of land cover maps, useful, for instance, by assigning a given uncertainty to
23
each pixel. This study demonstrated the utility of the SPOT-4 VGT sensor in predicting the extent of
agriculture/pasture in the BLA with a reasonable degree of accuracy, as well as for the primary tropical
forest, cerrado savanna, and natural/artificial waterbodies classes. The lower accuracy in the
secondary succession forest class indicates that a different sensor/methodology should be used to
assess that land cover class (e.g. multi-year analysis, hyperspectral data, ancillary data). Overall class
areal estimates derived from the land cover map may be useful for analysis of regional carbon and
water fluxes, and for evaluating impacts of land use/land cover change on biotic diversity and soil
degradation.
Acknowledgments
The authors gratefully acknowledge the three anonymous reviewers for their helpful comments and
suggestions. J.M.B. Carreiras’s work was partially developed at Instituto Nacional de Pesquisas
Espaciais (INPE, Brazil), as a contribution to the GLC2000 and LBA projects (doctoral grant Ref.
PRAXIS XXI/BD/21507/99). J.M.C. Pereira’s participated in this study under the scope of research
project “Fire in the Brazilian Amazon: multi-year mapping of area burned and estimation of pyrogenic
emissions using remotely sensed data” (Ref. POCTI/CTA/45126/2002). M.L. Campagnolo’s
contribution was partly done while visiting the Department of Geography at the University of Maryland
(post-doctoral grant Ref. SFRH/BPD/21012/2004). Funding was obtained from the Ministério da
Ciência e Tecnologia, Fundação para a Ciência e a Tecnologia, Portugal. VEGETATION images were
made available in the framework of the GLC 2000 and GBA 2000 projects of the Joint Research
Centre (JRC) of the European Commission. We acknowledge Instituto Brasileiro de Geografia e
Estatística (IBGE) for the Mapa de Vegetação do Brasil (Vegetation Map of Brazil), distributed by the
University of New Hampshire, EOS-WEBSTER Earth Science Information Partner (ESIP). We
acknowledge INPE and the GLCF (University of Maryland) for the Landsat data used in this study.
24
References
Achard, F., Eva, H.D., & Mayaux, P. (2001). Tropical forest mapping from coarse spatial resolution
satellite data: production and accuracy assessment issues. International Journal of Remote Sensing,
22(14), 2741-2762.
Achard, F., Eva, H.D., Stibig, H.-J., Mayaux, P., Gallego, J., Richards, T., & Malingreau, J.-P. (2002).
Determination of deforestation rates of the world’s humid tropical forests. Science, 297, 999-1002.
Adams, J.B., Sabol, D.E., Kapos, V., Almeida Filho, R., Roberts, D.A., Smith, M.O., & Gillespie, A.R.
(1995). Classification of multispectral images based on fractions of endmembers: application to land-
cover change in the Brazilian Amazon. Remote Sensing of Environment, 52(2), 137-154.
Alves, D.S. (2002). An analysis of the geographical patterns of deforestation in the Brazilian Amazon
in the period 1991-1996. In C.H. Wood, & R. Porro (Eds.), Deforestation and Land Use in the Amazon
(pp. 95-106). Gainsville, Florida: University Press of Florida.
Asner, G.P., Knapp, D.E., Broadbent, E.N., Oliveira, P.J.C., Keller, M., & Silva, J.N. (2005). Selective
logging in the Brazilian Amazon. Science, 310, 480-482.
Bartholomé, E., & Belward, A.S. (2005). GLC2000: a new approach to global land cover mapping from
Earth observation data. International Journal of Remote Sensing, 26(9), 1959-1977.
Bauer, E., & Kohavi, R. (1998). An empirical comparison of voting classification algorithms: bagging,
boosting, and variants. Machine Learning, 36, 105-142.
Breiman, L., Friedman, J., Olshen, R., & Stone, C. (1984). Classification and Regression Trees.
Pacific Grove, California: Wadsworth.
25
Breiman, L. (1996). Bagging predictors. Machine Learning, 24(2), 123-140.
Breiman, L. (1998). Arcing classifiers. The Annals of Statistics, 26(3), 801-849.
Brown, J.F., Loveland, T.R., Merchant, J.W., Reed, B.C., & Ohlen, D.O. (1993). Using multisource
data in global land-cover characterization: concepts, requirements, and methods. Photogrammetric
Engineering & Remote Sensing, 59(6), 977-987.
Brown, S., & Lugo, A.E. (1990). Tropical secondary forests. Journal of Tropical Ecology, 6(1), 1-32.
Buschbacher, R., Uhl, C., & Serrão, E.A.S. (1988). Abandoned pastures in eastern Amazonia. II.
Nutrient stocks in the soil and vegetation. Journal of Ecology, 76(3), 682-699.
Cardille, J.A., & Foley, J.A. (2003). Agricultural land-use change in Brazilian Amazônia between 1980
and 1995: evidence from integrated satellite and census data. Remote Sensing of Environment, 87,
551-562.
Carreiras, J.M.B., Shimabukuro, Y.E., & Pereira, J.M.C. (2002). Fraction images derived from SPOT-4
VEGETATION data to assess land-cover change over the state of Mato Grosso, Brazil. International
Journal of Remote Sensing, 23(23), 4979-4983.
Carreiras, J.M.B., Pereira, J.M.C., & Shimabukuro, Y.E. (2004). Land cover mapping in the Brazilian
Amazon using SPOT-4 VEGETATION data and machine learning classification methods.
Photogrammetric Engineering & Remote Sensing (accepted).
Carreiras, J.M.B., & Pereira, J.M.C. (2005). SPOT-4 VEGETATION multitemporal compositing for land
cover change studies over tropical regions. International Journal of Remote Sensing, 26(7), 1323-
1346.
26
Cochrane, M.A., Alencar, A., Schulze, M.D., Souza Jr., C.M., Nepstad, D.C., Lefebvre, P., & Davidson,
E.A. (1999). Positive Feedbacks on the fire dynamic of closed canopy tropical forests. Science, 284,
1832-1835.
Congalton, R.G., & Green, K. (1999). Assessing the Accuracy of Remotely Sensed Data: Principles
and Practices. Boca Raton, FL: Lewis Publishers.
Curran, P.J., & Foody, G.M. (1994). The use of remote sensing to characterise the regenerative states
of tropical forests. In G.M. Foody, & P.J. Curran (Eds.), Environmental Remote Sensing from Regional
to Global Scales (pp. 44-83). Chichester, UK: John Wiley & Sons.
Eva, H.D., Belward, A.S., De Miranda, E.E., Di Bella, C.M., Gonds, V., Huber, O., Jones, S.,
Sgrenzaroli, M., & Fritz, S. (2004). A land cover map of South America. Global Change Biology, 10,
731-744.
Fearnside, P.M. (1993). Deforestation in Brazilian Amazonia: the effect of population and land tenure.
Ambio, 22(8), 537-545.
Fearnside, P.M. (1996). Amazonian deforestation and global warming: carbon stocks in vegetation
replacing Brazil’s Amazon forest. Forest Ecology and Management, 80, 21-34.
Fearnside, P.M. (2003). Deforestation control in Mato Grosso: a new model for slowing the loss of
Brazil’s Amazon forest. Ambio, 32(5), 343-345.
Fearnside, P.M., & Barbosa, R.I. (2003). Avoided deforestation in Amazonia as a global warming
mitigation measure: the case of Mato Grosso. World Resource Review, 15(3), 352-361.
27
Ferreira, L.G., Yoshioka, H., Huete, A., & Sano, E.E. (2003). Seasonal landscape and spectral
vegetation índex dynamics in the Brazilian Cerrado: An analysis within the Large-Scale Biosphere-
Atmosphere Experiment in Amazonia (LBA). Remote Sensing of Environment, 87, 534-550.
Foody, G.M., & Hill, R.A. (1996). Classification of tropical forest classes from Landsat TM data.
International Journal of Remote Sensing, 17(12), 2353-2367.
Foody, G.M., Palubinskas, G., Lucas, R.M., Curran, P.J., & Honzák, M. (1996). Identifying terrestrial
carbon sinks: classification of successional stages in regenerating tropical forest from Landsat TM
data. Remote Sensing of Environment, 55, 205-216.
Foody, G.M. (2002). Status of land cover classification accuracy assessment. Remote Sensing of
Environment, 80, 185-201.
Friedl, M.A., Woodcock, C., Gopal, S., Muchoney, D., Strahler, A.H., & Barker-Schaaf, C. (2000). A
note on procedures used for accuracy assessment in land cover maps derived from AVHRR data.
International Journal of Remote Sensing, 21(5), 1073-1077.
Friedl, M.A., McIver, D.K., Hodges, J.C.F., Zhang, X.Y., Muchoney, D., Strahler, A.H., Woodcock,
C.E., Gopal, S., Schneider, A., Cooper, A., Baccini, A., Gao, F., & Schaaf, C. (2002). Global land
cover mapping from MODIS: algorithms and early results. Remote Sensing of Environment, 83(1/2),
287-302.
Friedman, J., Hastie, T., & Tibshirani, R. (2000). Additive logistic regression: a statistical view of
boosting. The Annals of Statistics, 28(2), 337-407.
Gallego, F.J. (2004). Remote sensing and land cover area estimation. International Journal of Remote
Sensing, 25(15), 3019-1047.
28
Gedney, N., & Valdes, P.J. (2000). The effect of Amazonian deforestation on the northern hemisphere
circulation and climate. Geophysical Research Letters, 27(19), 3053-3056.
Goulding, M., Barthem, R., & Ferreira, E. (2003). The Smithsonian Atlas of the Amazon. Washington:
Smithsonian Books.
Green, A.A., Berman, M., Switzer, P., & Craig, M.D. (1988). A transformation for ordering multispectral
data in terms of image quality with implications for noise removal. IEEE Transactions on Geoscience
and Remote Sensing, 26(1), 65-74.
Hansen, M., DeFries, R., Townshend, J.R.G., & Sohlberg, R. (2000). Global land cover classification
at 1km resolution using a decision tree classifier. International Journal of Remote Sensing, 21(6/7),
1331-1364.
Houghton, R.A., Skole, D.L., Nobre, C.A., Hackler, J.L., Lawrence, K.T., & Chomentowski, W.H.
(2000). Annual fluxes of carbon from deforestation and regrowth in the Brazilian Amazon. Nature, 403,
301-304.
Houghton, R.A., Lawrence, K.T., Hackler, J.L., & Brown, S. (2001). The spatial distribution of forest
biomass in the Brazilian Amazon: a comparison of estimates. Global Change Biology, 7, 731-746.
Huete, A.R. (1988). A soil-adjusted vegetation index (SAVI). Remote Sensing of Environment, 25,
295-309.
IBGE (1988). Mapa de Vegetação do Brasil, escala 1:5000000. Brasília, DF, Brazil: Ministério da
Agricultura, Instituto Brasileiro de Desenvolvimento Florestal, Secretária de Planejamento e
Coordenação da Presidência da Republica, Fundação Instituto Brasileiro de Geografia e Estatística.
29
INPE (2002). Monitoring of the Brazilian Amazonian forest by satellite, 2000-2001. São José dos
Campos, SP, Brazil: Instituto Nacional de Pesquisas Espaciais.
Junk, W.J., & Firch, K. (1985). The physical and chemical properties of Amazonian waters and their
relationship with the biota. In G.T. Prance, & T.E. Lovejoy (Eds.), Amazonia (pp. 3-17). New York:
Pergamon.
Kaimowitz, D., & Smith, J. (2001). Soybean technology and the loss of natural vegetation in Brazil and
Bolivia. In A. Angelsen, & D. Kaimowitz (Eds.), Agricultural Technologies and Tropical Deforestation
(pp. 195-211). Oxon, UK: CAB International Publishing.
Keeling, C.D., & Whorf, T.P. (2005). Atmospheric CO2 records from sites in the SIO air sampling
network. In Trends: A Compendium of Data on Global Change. Oak Ridge, Tennessee, USA: Carbon
Dioxide Information Analysis Center, Oak Ridge National Laboratory, U.S. Department of Energy.
Kimes, D.S., Nelson, R.F., Salas, W.A., & Skole, D.L. (1999). Mapping secondary tropical forest and
forest age from SPOT HRV data. International Journal of Remote Sensing, 20(18), 3625-3640.
Korner, C. (2000). Biosphere responses to CO2 enrichment. Ecological Applications, 10(6), 1590-
1619.
Krutchkoff, R.G. (1967). Classical and inverse regression methods of calibration. Technometrics, 9,
425-440.
Lambin, E.F., Geist, H.J., & Lepers, E. (2003). Dynamics of land-use and land-cover change in tropical
regions. Annual Review of Environment and Resources, 28, 205-241.
30
Lu, D., Moran, E., & Batistella, M. (2003). Linear mixture model applied to Amazonian vegetation
classification. Remote Sensing of Environment, 87, 456-469.
Lucas, R.M., Honzák, M., Curran, P.J., Foody, G.M., Milne, R., Brown, T., & Amaral, S. (2000).
Mapping the regional extent of tropical forest regeneration stages in the Brazilian legal Amazon using
NOAA AVHRR data. International Journal of Remote Sensing, 21(15), 2855-2881.
Lucas, R.M., Honzák, M., Do Amaral, I., Curran, P.J., & Foody, G.M. (2002). Forest regeneration on
abandoned clearances in central Amazonia. International Journal of Remote Sensing, 23(5), 965-988.
Maclin, R., & Opitz, D. (1997). An empirical evaluation of bagging and boosting. Proceedings of the
Fourteenth National Conference on Artificial Intelligence (pp. 546-551). 27-31 July 1997, Providence,
Rhode Island: American Association for Artificial Intelligence Press.
Mausel, P., Wu, Y., Li, Y., Moran, E.F., & Brondizio, E.S. (1993). Spectral identification of successional
stages following deforestation in the Amazon. Geocarto International, 4, 61-71.
McIver, D.K., & Friedl, M.A. (2001). Estimating pixel-scale land cover classification confidence using
nonparametric machine learning methods. IEEE Transactions on Geoscience and Remote Sensing,
39(9), 1959-1968.
McIver, D.K., & Friedl, M.A. (2002). Using prior probabilities in decision-tree classification of remotely
sensed data. Remote Sensing of Environment, 81, 253-261.
Mesquita, R.C.G., Ickes, K., Ganade, G., & Williamson, G.B. (2001). Alternative successional
pathways in the Amazon Basin. Journal of Ecology, 89, 528-537.
31
Mitchell, T.M. (1997). Machine Learning. Singapore: McGraw-Hill.
Moran, E.F., Brondizio, E., Mausel, P., & Wu, Y. (1994). Integrating Amazonian vegetation, land-use,
and satellite data. Bioscience, 44(5), 329-338.
Nepstad, D.C., Klink, C.A., Uhl, C., Vieira, I.C., Lefebvre, P., Pedlowski, M., Matricardi, E., Negreiros,
G., Brown, I.F., Amaral, E., Homma, A., & Walker, R. (1997). Land-use in Amazonia and the Cerrado
of Brazil. Ciência e Cultura Journal of the Brazilian Association for the Advancement of Science,
49(1/2), 73-86.
Passot, X. (2000). VEGETATION image processing methods in the CTIV. Proceedings of
VEGETATION 2000 - 2 years of operation to prepare the future (pp. 15-21). 3-6 April 2000, Ispra,
Italy: SAI/JRC.
Perlich, C., Provost, F., & Simonoff, J.S. (2003). Tree induction vs. logistic regression: a learning-curve
analysis. Journal of Machine Learning Research, 4, 211-255.
Perz, S.G., & Skole, D.L. (2003). Social determinants of secondary forests in the Brazilian Amazon.
Social Science Research, 32, 25-60.
Petit, J.R., Jouzel, J., Raynaud, D., Barkov, N.I., Barnola, J.-M., Basile, I., Bender, M., Chappellaz, J.,
Davis, M., Delaygue, G., Delmotte, M., Kotlyakov, V.M., Legrand, M., Lipenkov, V.Y., Lorius, C.,
Pépin, L., Ritz, C., Saltzman, E., & Stievenard, M. (1999). Climate and atmospheric history of the past
420,000 years from the Vostok ice core, Antarctica. Nature, 399, 429-436.
Provost, F., & Domingos, P. (2003). Tree induction for probability-based ranking. Machine Learning,
52(3), 199-215.
32
Richards, J.A. (1986). Remote Sensing Digital Image Analysis. Berlin: Springer-Verlag.
Roberts, D.A., Keller, M., & Soares, J.V. (2003). Studies of land-cover, land-use, and biophysical
properties of vegetation in the large Scale Biosphere Atmosphere experiment in Amazônia. Remote
Sensing of Environment, 87, 377-388.
Rodríguez-Yi, J.L., Shimabukuro, Y.E., & Rudorff, B.F.T. (2000). Image segmentation for classification
of vegetation using NOAA AVHRR data. International Journal of Remote Sensing, 21(1), 167-172.
Safavian, S.R., & Landgrebe, D. (1991). A survey of decision tree classifier methodology. IEEE
Transactions on Systems, Man, and Cybernetics, 21(3), 660-674.
Sano, E.E., Barcellos, A.O., & Bezerra, H.S (2001). Assessing the spatial distribution of cultivated
pastures in the Brazilian savanna. Pasturas Tropicales, 22(3), 2-15.
Schroeder, P.E., & Winjum, J.K. (1995). Assessing Brazil’s carbon budget: II. Biotic fluxes and net
carbon balance. Forest Ecology and Management, 75, 87-99.
Skole, D., & Tucker, C. (1993). Tropical deforestation and habitat fragmentation in the Amazon:
Satellite data from 1978 to 1988. Science, 260, 1905– 1910.
Skole, D.L., Chomentowski, W.H., Salas, W.A., & Nobre, A.D. (1994). Physical and human dimensions
of deforestation in Amazonia. Bioscience, 44(5), 314-322.
Smits, P.C., Dellepiane, S.G., & Schowengerdt, R.A. (1999). Quality assessment of image
classification algorithms for land cover mapping: a review and a proposal for a cost-based approach.
International Journal of Remote Sensing, 20(8), 1461-1486.
33
Steininger, M.K. (2000). Satellite estimation of tropical secondary forest above-ground biomass: data
from Brazil and Bolivia. International Journal of Remote Sensing, 21(6/7), 1139-1157.
Stone, T.A., Schlesinger, P., Houghton, R.A., & Woodwell, G.M. (1994). A map of the vegetation of
South America based on satellite imagery. Photogrammetric Engineering & Remote Sensing, 60, 541-
551.
Strahler, A.H. (1980). The use of prior probabilities in maximum likelihood classification of remotely
sensed data. Remote Sensing of Environment, 10, 135-163.
Souza Jr., C., Firestone, L., Moreira Silva, L., & Roberts, D. (2003). Mapping forest degradation in the
Eastern Amazon from SPOT 4 through spectral mixture models. Remote Sensing of Environment, 87,
494-506.
Tenenbein, A. (1972). A double sampling scheme for estimating from misclassified multinomial data
with applications to sampling inspection. Technometrics, 14(1), 187-202.
Uhl. C. (1987). Factors controlling succession following slash-and-burn agriculture in Amazonia.
Journal of Ecology, 75(2), 377-407.
Uhl, C., Buschbacher, R., & Serrão, E.A.S. (1988). Abandoned pastures in eastern Amazonia. I.
Patterns of plant succession. Journal of Ecology, 76(3), 663-681.
34
Vieira, I.C.G., Almeida, A.S., Davidson, E.A., Stone, T.A., Carvalho, C.J.R., & Guerrero, J.B. (2003).
Classifying successional forests using Landsat spectral properties and ecological characteristics in
eastern Amazônia. Remote Sensing of Environment, 87, 470-481.
Vitousek, P.M., Mooney, H.A., Lubchenco, J., & Melillo, J.M. (1997). Human domination of Earth’s
ecosystems. Science, 277, 494-499.
Walsh, T.A., & Burk, T.E. (1993). Calibration of satellite classifications of land area. Remote Sensing
of Environment, 46, 281-290.
35
Table 1
Distribution per land cover class of the training dataset collected over SPOT-4 VGT data.
Land cover class # pixels # sample
polygons
Primary tropical forest 3578 902
Cerrado savanna 886 222
Agriculture/pasture 3337 908
Natural/artificial waterbodies 351 119
Secondary succession forest 234 113
Total 8386 2264
36
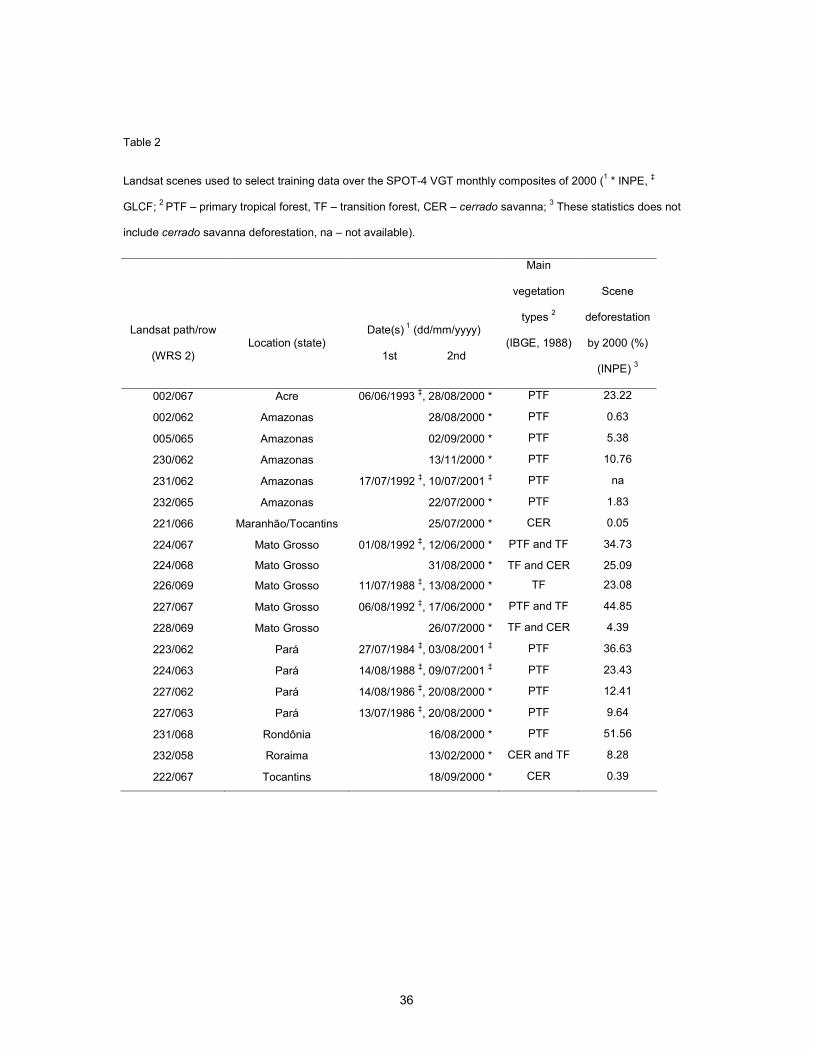
Table 2
Landsat scenes used to select training data over the SPOT-4 VGT monthly composites of 2000 (1 * INPE, ‡
GLCF; 2 PTF – primary tropical forest, TF – transition forest, CER – cerrado savanna; 3 These statistics does not
include cerrado savanna deforestation, na – not available).
Landsat path/row
(WRS 2)
Location (state)
Date(s) 1 (dd/mm/yyyy)
1st 2nd
Main
vegetation
types 2
(IBGE, 1988)
Scene
deforestation
by 2000 (%)
(INPE) 3
002/067 Acre 06/06/1993 ‡, 28/08/2000 * PTF 23.22
002/062 Amazonas 28/08/2000 * PTF 0.63
005/065 Amazonas 02/09/2000 * PTF 5.38
230/062 Amazonas 13/11/2000 * PTF 10.76
231/062 Amazonas 17/07/1992 ‡, 10/07/2001 ‡ PTF na
232/065 Amazonas 22/07/2000 * PTF 1.83
221/066 Maranhão/Tocantins 25/07/2000 * CER 0.05
224/067 Mato Grosso 01/08/1992 ‡, 12/06/2000 * PTF and TF 34.73
224/068 Mato Grosso 31/08/2000 * TF and CER 25.09
226/069 Mato Grosso 11/07/1988 ‡, 13/08/2000 * TF 23.08
227/067 Mato Grosso 06/08/1992 ‡, 17/06/2000 * PTF and TF 44.85
228/069 Mato Grosso 26/07/2000 * TF and CER 4.39
223/062 Pará 27/07/1984 ‡, 03/08/2001 ‡ PTF 36.63
224/063 Pará 14/08/1988 ‡, 09/07/2001 ‡ PTF 23.43
227/062 Pará 14/08/1986 ‡, 20/08/2000 * PTF 12.41
227/063 Pará 13/07/1986 ‡, 20/08/2000 * PTF 9.64
231/068 Rondônia 16/08/2000 * PTF 51.56
232/058 Roraima 13/02/2000 * CER and TF 8.28
222/067 Tocantins 18/09/2000 * CER 0.39
37
Table 3
Accuracy assessment of the four algorithms tested, using a 10-fold cross-validation approach (QDA – quadratic
discriminant analysis; SCT – simple classification trees; PBCT – probability-bagging classification trees; K-NN –
k-nearest neighbors). The land cover classes are primary tropical forest (PTF), cerrado savanna (CER),
agriculture/pasture (AP), natural/artificial waterbodies (NAW), and secondary succession forest (SSF).
Commission error Omission error Overall accuracy
Classes QDA SCT PBCT K-NN QDA SCT PBCT K-NN QDA SCT PBCT K-NN
PTF 0.091 0.091 0.070 0.076 0.042 0.045 0.034 0.026CER 0.247 0.184 0.190 0.166 0.208 0.245 0.219 0.187AP 0.068 0.083 0.057 0.050 0.091 0.065 0.061 0.064NAW 0.000 0.003 0.003 0.000 0.000 0.003 0.000 0.000SSF 0.663 0.593 0.432 0.468 0.880 0.906 0.662 0.752
0.899 0.903 0.920 0.923
38
Table 4
Confusion matrix for the PBCT algorithm, using the 10-fold cross validation approach.
Predicted class (# pixels) Observed class (# pixels) (1) (2) (3) (4) (5)
Total
Omission error
Primary tropical forest (1) 3457 60 37 0 24 3578 0.034
Cerrado savanna(2) 94 692 99 1 0 886 0.219
Agriculture/pasture (3) 70 98 3133 0 36 3337 0.061
Natural/artificial waterbodies (4) 0 0 0 351 0 351 0.000
Secondary succession forest (5) 97 4 54 0 79 234 0.662
Total 3718 854 3323 352 139 8386
Commission error
0.070 0.190 0.057 0.003 0.432
39
Table 5
Overall class extent generated by the four tested algorithms, using the inverse method calibration technique; QDA
– quadratic discriminant analysis, SCT – simple classification tree, PBCT – probability-bagging classification tree,
K-NN – k-nearest neighbors.
Class overall extent (x 103 km2)
Classes QDA SCT PBCT K-NN
Primary tropical forest 3,054 3,262 3,293 3,283
Cerrado savanna 610 642 528 539
Agriculture/pasture 1,041 831 966 956
Natural/artificial waterbodies 63 75 74 67
Secondary succession forest 233 191 140 156
Total 5,001 5,001 5,001 5,001
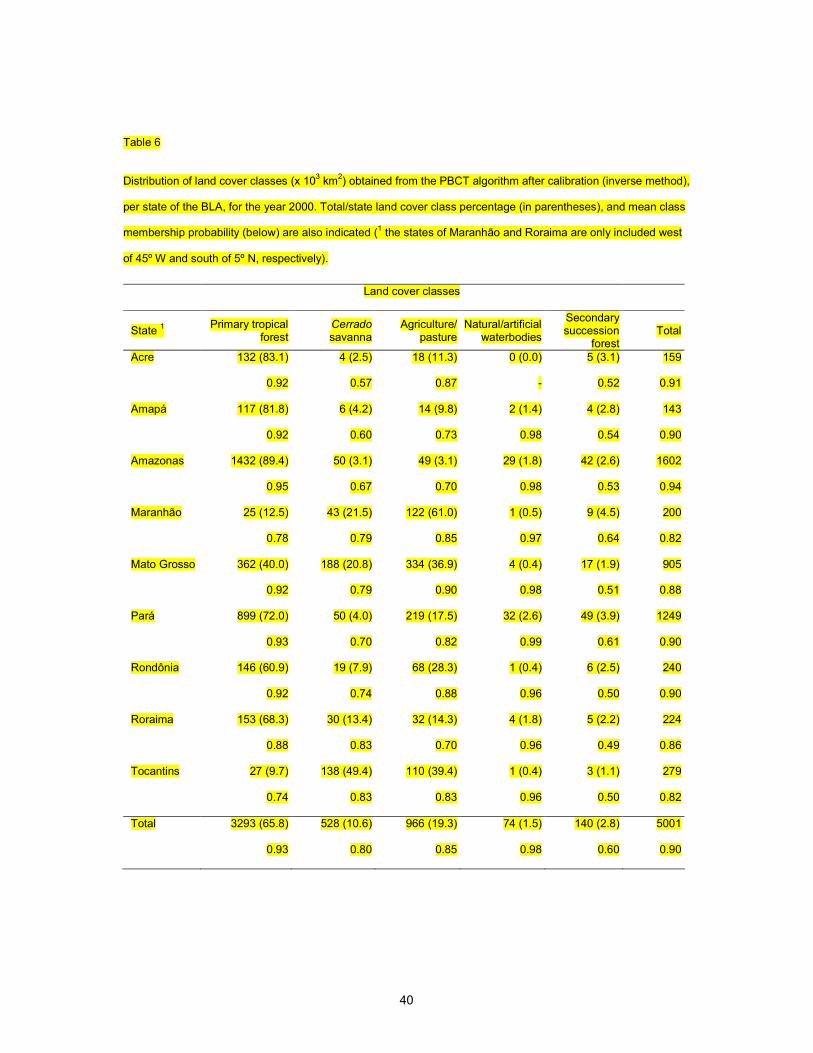
40
Table 6
Distribution of land cover classes (x 103 km2) obtained from the PBCT algorithm after calibration (inverse method),
per state of the BLA, for the year 2000. Total/state land cover class percentage (in parentheses), and mean class
membership probability (below) are also indicated (1 the states of Maranhão and Roraima are only included west
of 45º W and south of 5º N, respectively).
Land cover classes
State 1 Primary tropical forest
Cerrado savanna
Agriculture/pasture
Natural/artificial waterbodies
Secondary succession
forest Total
Acre 132 (83.1)
0.92
4 (2.5)
0.57
18 (11.3)
0.87
0 (0.0)
-
5 (3.1)
0.52
159
0.91
Amapá 117 (81.8)
0.92
6 (4.2)
0.60
14 (9.8)
0.73
2 (1.4)
0.98
4 (2.8)
0.54
143
0.90
Amazonas 1432 (89.4)
0.95
50 (3.1)
0.67
49 (3.1)
0.70
29 (1.8)
0.98
42 (2.6)
0.53
1602
0.94
Maranhão 25 (12.5)
0.78
43 (21.5)
0.79
122 (61.0)
0.85
1 (0.5)
0.97
9 (4.5)
0.64
200
0.82
Mato Grosso 362 (40.0)
0.92
188 (20.8)
0.79
334 (36.9)
0.90
4 (0.4)
0.98
17 (1.9)
0.51
905
0.88
Pará 899 (72.0)
0.93
50 (4.0)
0.70
219 (17.5)
0.82
32 (2.6)
0.99
49 (3.9)
0.61
1249
0.90
Rondônia 146 (60.9)
0.92
19 (7.9)
0.74
68 (28.3)
0.88
1 (0.4)
0.96
6 (2.5)
0.50
240
0.90
Roraima 153 (68.3)
0.88
30 (13.4)
0.83
32 (14.3)
0.70
4 (1.8)
0.96
5 (2.2)
0.49
224
0.86
Tocantins 27 (9.7)
0.74
138 (49.4)
0.83
110 (39.4)
0.83
1 (0.4)
0.96
3 (1.1)
0.50
279
0.82
Total 3293 (65.8)
0.93
528 (10.6)
0.80
966 (19.3)
0.85
74 (1.5)
0.98
140 (2.8)
0.60
5001
0.90
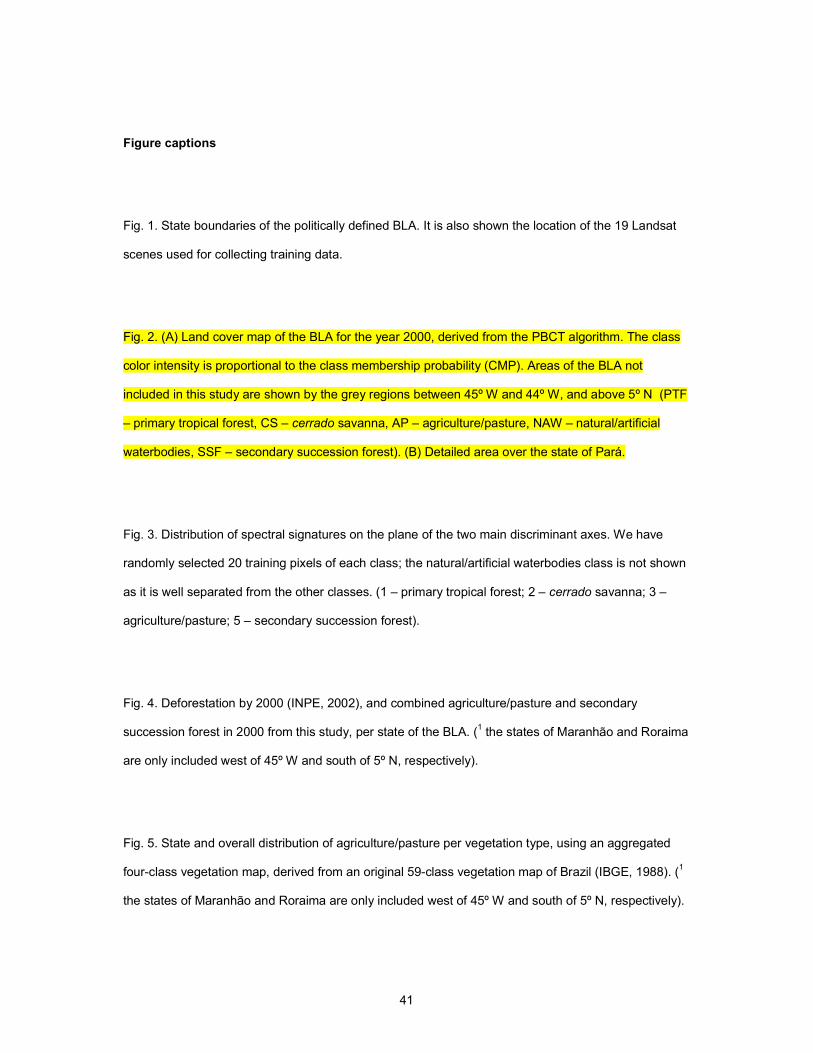
41
Figure captions
Fig. 1. State boundaries of the politically defined BLA. It is also shown the location of the 19 Landsat
scenes used for collecting training data.
Fig. 2. (A) Land cover map of the BLA for the year 2000, derived from the PBCT algorithm. The class
color intensity is proportional to the class membership probability (CMP). Areas of the BLA not
included in this study are shown by the grey regions between 45º W and 44º W, and above 5º N (PTF
– primary tropical forest, CS – cerrado savanna, AP – agriculture/pasture, NAW – natural/artificial
waterbodies, SSF – secondary succession forest). (B) Detailed area over the state of Pará.
Fig. 3. Distribution of spectral signatures on the plane of the two main discriminant axes. We have
randomly selected 20 training pixels of each class; the natural/artificial waterbodies class is not shown
as it is well separated from the other classes. (1 – primary tropical forest; 2 – cerrado savanna; 3 –
agriculture/pasture; 5 – secondary succession forest).
Fig. 4. Deforestation by 2000 (INPE, 2002), and combined agriculture/pasture and secondary
succession forest in 2000 from this study, per state of the BLA. (1 the states of Maranhão and Roraima
are only included west of 45º W and south of 5º N, respectively).
Fig. 5. State and overall distribution of agriculture/pasture per vegetation type, using an aggregated
four-class vegetation map, derived from an original 59-class vegetation map of Brazil (IBGE, 1988). (1
the states of Maranhão and Roraima are only included west of 45º W and south of 5º N, respectively).

42
Fig. 6. State and overall distribution of secondary succession forest per vegetation type, using an
aggregated four-class vegetation map, derived from an original 59-class vegetation map of Brazil
(IBGE, 1988). (1 the states of Maranhão and Roraima are only included west of 45º W and south of 5º
N, respectively).
Fig. 7. Comparison between class-specific mean class membership probability and commission error.
The land cover classes are primary tropical forest (PTF), cerrado savanna (CER), agriculture/pasture
(AP), natural/artificial waterbodies (NAW), and secondary succession forest (SSF). The values in
parentheses represent the mean class membership probability and the respective standard error. It is
also represented the perfect agreement y=1-x line.
Fig. 8. Comparison of overall estimates of class extent in the BLA, derived from Hansen et al. (2000),
Eva et al. (2004), this study, and Friedl et al. (2002).
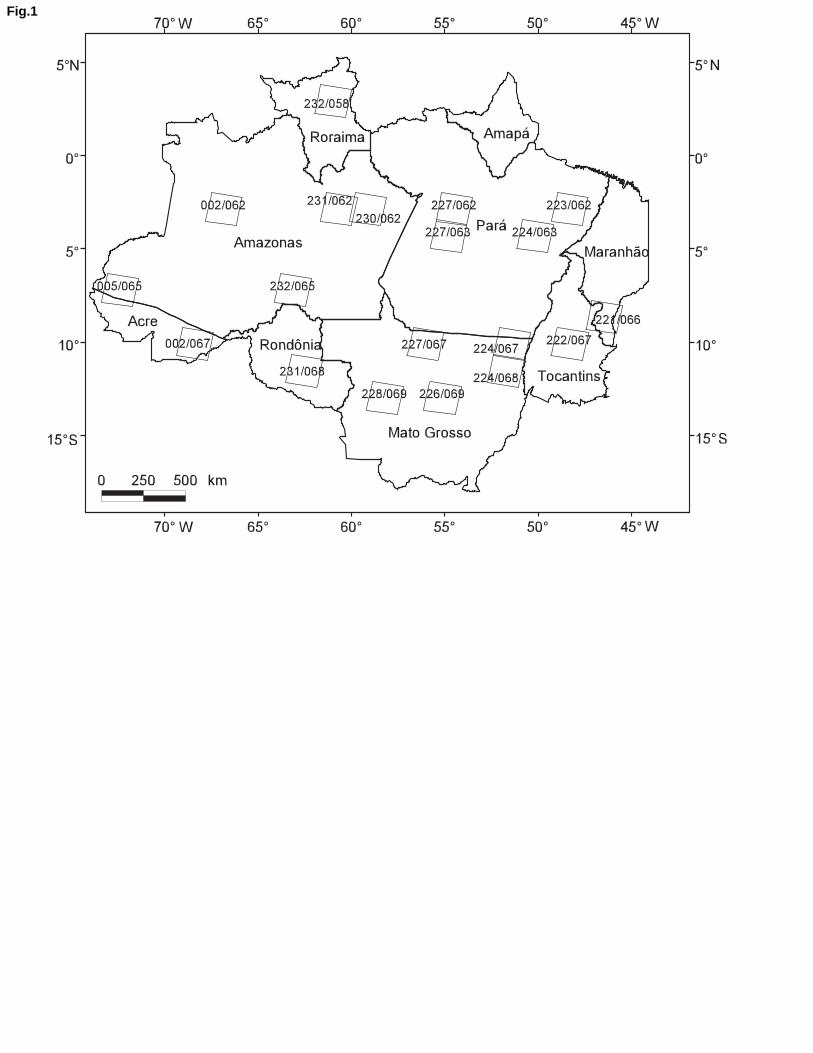
Fig.1
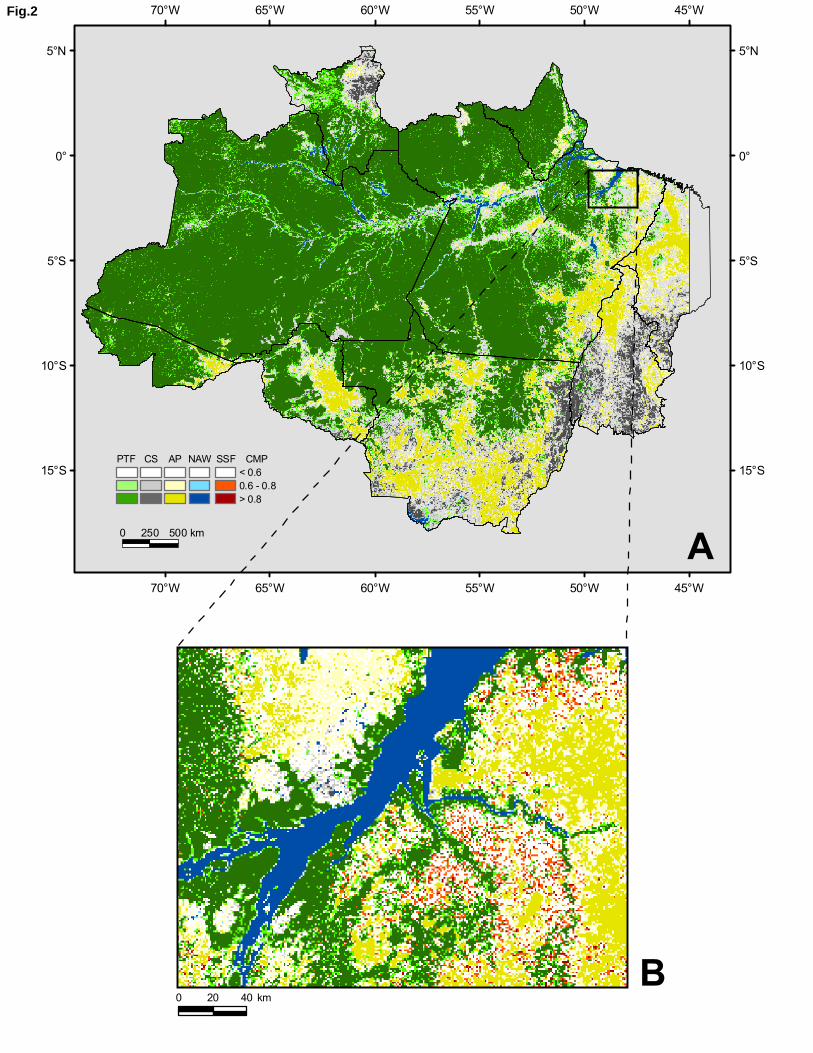
70°W
70°W
65°W
65°W
60°W
60°W
55°W
55°W
50°W
50°W
45°W
45°W
15°S 15°S
10°S 10°S
5°S 5°S
0° 0°
5°N 5°N
km0 250 500
km0 20 40
PTF CS AP NAW SSF< 0.60.6 - 0.8> 0.8
CMP
A
B
Fig.2
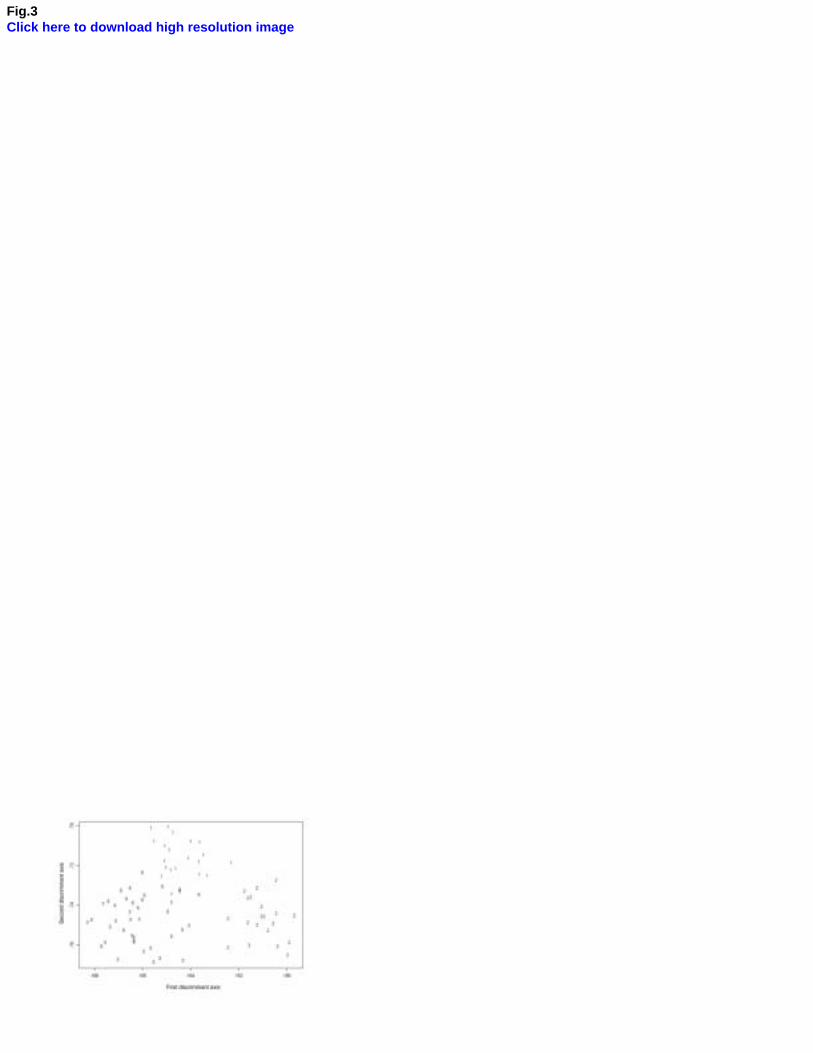
Fig.3Click here to download high resolution image
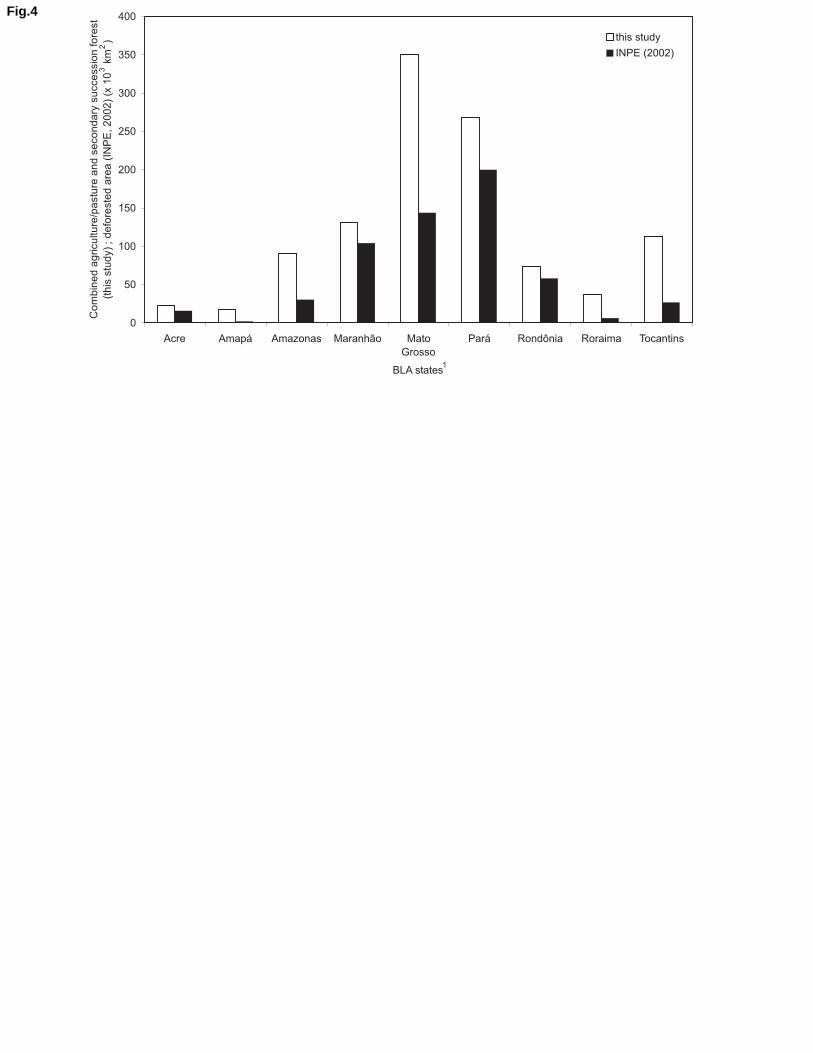
0
50
100
150
200
250
300
350
400
Acre Amapá Amazonas Maranhão Mato
Grosso
Pará Rondônia Roraima Tocantins
BLA states
Co
mb
ine
da
gricu
ltu
re/p
astu
rea
nd
se
co
nd
ary
su
cce
ssio
nfo
rest
(th
isstu
dy)
;d
efo
reste
da
rea
(IN
PE
,2
00
2)
(x1
03
km
2) this study
INPE (2002)
1
Fig.4
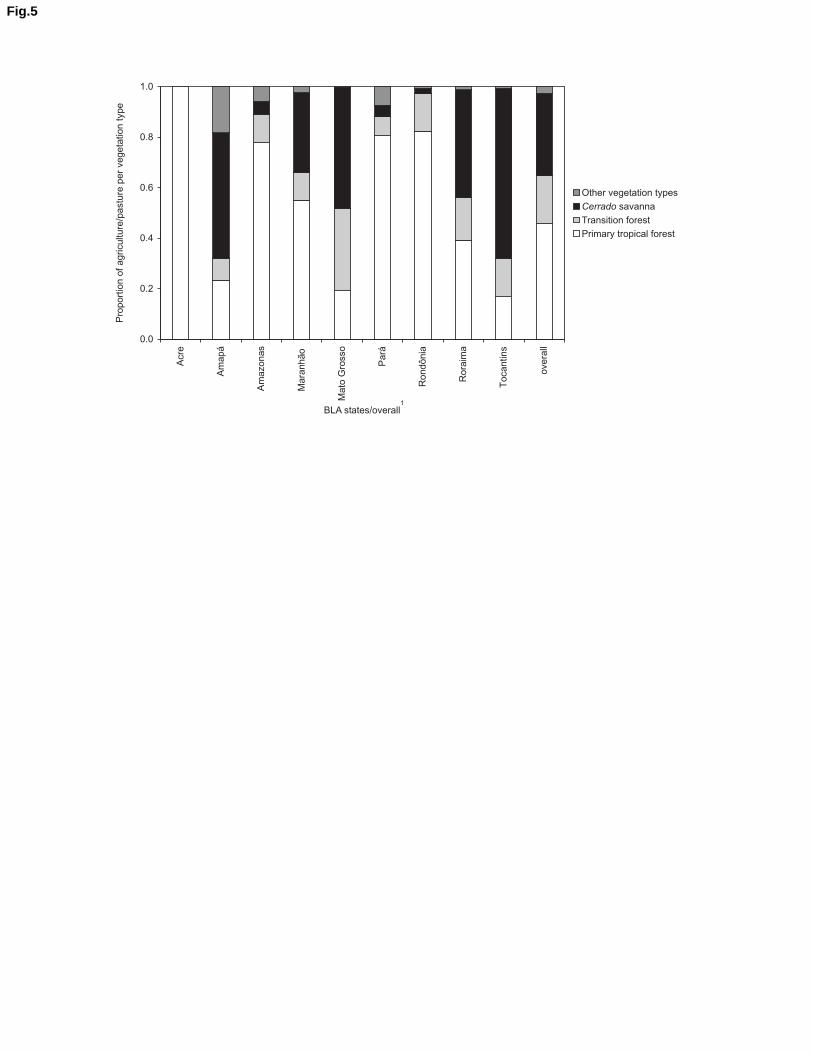
0.0
0.2
0.4
0.6
0.8
1.0
Acre
Am
apá
Am
azonas
Mara
nhão
Ma
toG
rosso
Pará
Rondônia
Rora
ima
Tocantins
overa
ll
BLA states/overall
Pro
port
ion
of
agriculture
/pastu
reper
vegeta
tion
type
Other vegetation types
Cerrado savanna
Transition forest
Primary tropical forest
1
Fig.5
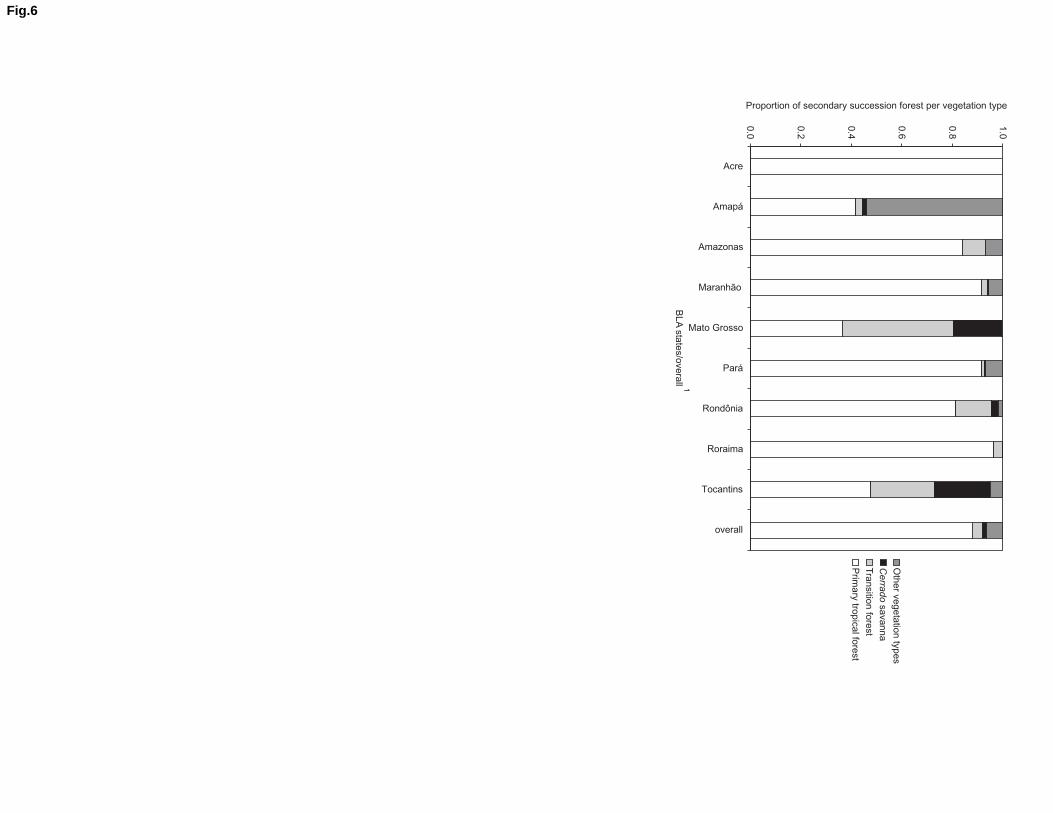
0.0
0.2
0.4
0.6
0.8
1.0
Acre
Amapá
Amazonas
Maranhão
Mato Grosso
Pará
Rondônia
Roraima
Tocantins
overall
BLA
sta
tes/o
vera
ll
Proportion of secondary succession forest per vegetation type
Oth
er
vegeta
tion
types
Cerra
do
savanna
Tra
nsitio
nfo
rest
Prim
ary
tropic
alfo
rest
1
Fig.6
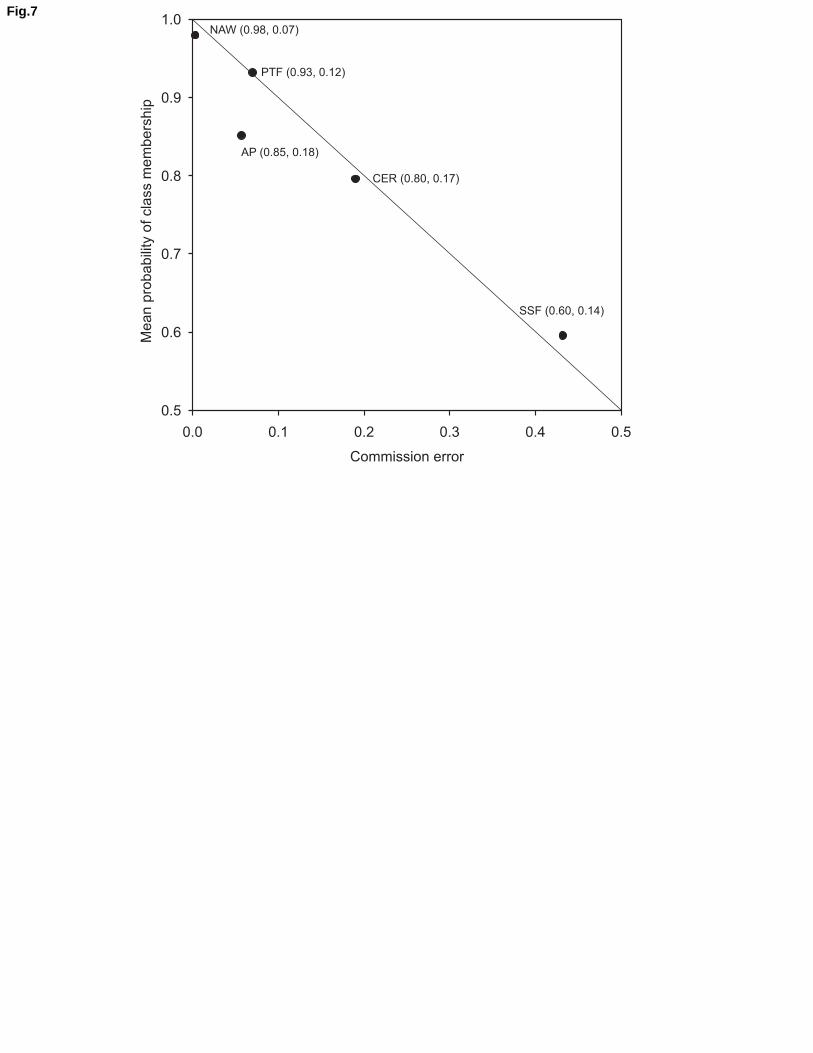
PTF (0.93, 0.12)
CER (0.80, 0.17)
AP (0.85, 0.18)
NAW (0.98, 0.07)
SSF (0.60, 0.14)
0.5
0.6
0.7
0.8
0.9
1.0
0.0 0.1 0.2 0.3 0.4 0.5
Commission error
Me
an
pro
ba
bili
tyo
fcla
ss
me
mb
ers
hip
Fig.7
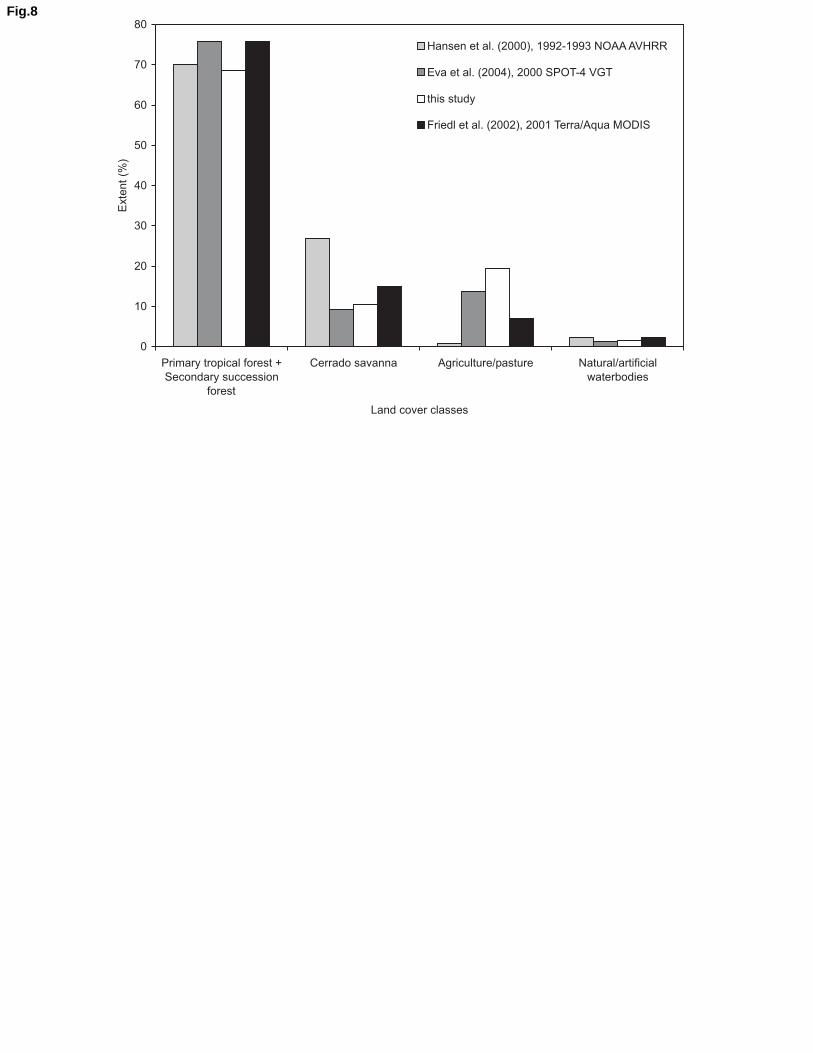
0
10
20
30
40
50
60
70
80
Primary tropical forest +
Secondary succession
forest
Cerrado savanna Agriculture/pasture Natural/artificial
waterbodies
Land cover classes
Exte
nt
(%)
Hansen et al. (2000), 1992-1993 NOAA AVHRR
Eva et al. (2004), 2000 SPOT-4 VGT
this study
Friedl et al. (2002), 2001 Terra/Aqua MODIS
Fig.8
Related Documents