U NITED N ATIONS E NVIRONMENT P ROGRAMME ASSESSING THE ENVIRONMENTAL I MPACTS OF CONSUMPTION AND PRODUCTION Priority Products and Materials

Welcome message from author
This document is posted to help you gain knowledge. Please leave a comment to let me know what you think about it! Share it to your friends and learn new things together.
Transcript
Un
it
ed
n
at
io
ns
e
nv
ir
on
me
nt
P
ro
gr
am
me
Assessing the environmentAl impActs of consumption And production
Priority Products and Materials
Copyright © United Nations Environment Programme, 2010
This publication may be reproduced in whole or in part and in any form for educational or non-profit purposes without special permission from the copyright holder, provided acknowledgement of the source is made. UNEP would appreciate receiving a copy of any publication that uses this publication as a source.
No use of this publication may be made for resale or for any other commercial purpose whatsoever without prior permission in writing from the United Nations Environment Programme.
DisclaimerThe designations employed and the presentation of the material in this publication do not imply the expression of any opinion whatsoever on the part of the United Nations Environment Programme concerning the legal status of any country, territory, city or area or of its authorities, or concerning delimitation of its frontiers or boundaries. Moreover, the views expressed do not necessarily represent the decision or the stated policy of the United Nations Environment Programme, nor does citing of trade names or commercial processes constitute endorsement.
UNEP promotes environ-
mentally sound practices globally and in its own activities.
This publication is being produced in electronic format only. We encourage you to print it only when absolutely necessary.
Our distribution policy aims to reduce UNEP’s carbon footprint.
ISBN: 978-92-807-3084-5
Editor: International Panel for Sustainable Resource Management, Working Group on the Environmental Impacts of Products and Materials: Prioritization and Improvement Options
Lead authors: Edgar G. Hertwich, Norwegian University of Science and Technology, Ester van der Voet, Leiden University, Sangwon Suh, University of California, Santa Barbara, Arnold Tukker, TNO and NTNU
Contributing authors: Mark Huijbregts, Radboud University Nijmegen, Pawel Kazmierczyk, EEA, Manfred Lenzen, University of Sydney, Jeff McNeely, IUCN, Yuichi Moriguchi, National Institute of Environmental Sciences Japan
Janet Salem and Guido Sonnemann, UNEP, together with Frans Vollenbroek, provided valuable input and comments; the Resource Panel’s Secretariat coordinated the preparation of this report.
The full report should be referenced as follows:
UNEP (2010) Assessing the Environmental Impacts of Consumption and Production: Priority Products and Materials, A Report of the Working Group on the Environmental Impacts of Products and Materials to the International Panel for Sustainable Resource Management. Hertwich, E., van der Voet, E., Suh, S., Tukker, A., Huijbregts M., Kazmierczyk, P., Lenzen, M., McNeely, J., Moriguchi, Y.
Design/Layout: Thad Mermer
Photos: Pawel Kazmierczyk (cover background, p.8, p. 10, p.12, p.19, p.21, p.30, p.36, p.44, p.62, p.73, p.79, p.97, p.102, p.107); Frédéric Boyer (p. 76); Thad Mermer (p.13, p.82)
Thanks go to Ernst Ulrich von Weizsäcker and Ashok Khosla as co-chairs of the Resource Panel, the members of the Resource Panel and the Steering Committee for fruitful discussions. Additional comments of a technical nature were received from some governments participating in the Steering Committee.
Helpful comments were received from several anonymous reviewers in a peer review process coordinated in an efficient and constructive way by Patricia Romero Lankao together with the Resource Panel Secretariat. The preparation of this report also benefitted from discussions with many colleagues at various meetings, although the main responsibility for errors will remain with the authors.
Acknowledgements
Assessing the environmentAl impActs of consumption And production
Priority Products and Materials
2
Preface
“What do I do first?” It is a simple question, but for decision-makers trying to determine how they can make a meaningful contribution to sustainable consumption and production the answer is more complex. Today’s environmental debate highlights many priority issues. In the climate change discussions, energy production and mobility are in the spotlight, but when it comes to growing concerns about biodiversity, agriculture and urban development are the focus. Decision-makers could be forgiven for not knowing where to begin.
The solution to this dilemma begins with a scientific assessment of which environmental problems present the biggest challenges at the global level in the 21st century, and a scientific, systematic perspective that weighs up the impacts of various economic activities – not only looking at different industrial sectors, but also thinking in terms of consumer demand. From its inauguration in 2007, the International Panel for Sustainable Resource Management, a group of interna-tionally recognized experts on sustainable resource management convened by UNEP, realized there was a need to help decision-makers identify priorities, and has tried to provide this help from a life-cycle perspective in a systematic and scientific way.
The purpose of this report, the latest from the Resource Panel, is to assess the best-available science from a global perspective to identify priorities among industry sectors, consumption categories and materials. For the first time, this assessment was done at the global level, identifying priorities for developed and developing countries. It supports international, national and sectoral efforts on sustainable consumption and production by highlighting where attention is really needed.
We now know that food, mobility and housing must - as a priority - be made more sustainable if we are serious about tackling biodiversity loss and climate change. In most countries, household consumption, over the life cycle of the products and services, accounts for more than 60% of all impacts of consumption. We know from previous research that a doubling of wealth leads to 80% higher CO2 emissions, so population predictions for 2050 make this even more urgent.
More sustainable consumption and production will have to occur at the global level, not only the country level. Presently, production of in-ternationally traded goods, vital to economic growth, account for approximately 30% of global CO2 emissions. We also need to consider connections between materials and energy. The mining sector accounts for 7% of the world’s energy use, an amount projected to increase with major implications for international policy. Agricultural production accounts for a staggering 70% of the global freshwater consumption, 38% of the total land use, and 14% of the world’s greenhouse gas emissions.
We must start looking into our everyday activities if we truly want a green economy – for developed and developing countries.
There is a clear need for more action to provide the scientific data and to find common ways to gather and process it so that priorities can be assessed and determined at a global level.
I congratulate the Resource Panel for taking on this difficult task and providing us with the scientific insights we all need to help us move towards a Green Economy.
Achim Steiner
UN Under-Secretary General and Executive Director UNEP
3
Environmental impacts are the unwanted byproduct of economic activities. Inadvertently, humans alter environmental conditions such as the acidity of soils, the nutrient content of surface water, the radiation balance of the atmosphere, and the concentrations of trace materials in food chains. Humans convert forest to pastureland and grassland to cropland or parking lots intentionally, but the resulting habitat change and biodiversity loss is still undesired.
The environmental and health sciences have brought important insights into the connection of environmental pressures and ecosystem damages. Well-known assessments show that habitat change, the overexploitation of renewable resources, climate change, and particulate matter emissions are amongst the most important environmental problems. Biodiversity losses and ill health have been estimated and evaluated.
This report focuses not on the effects of environmental pressure, but on its causes. It describes pressures as resulting from economic activities. These activities are pursued for a purpose, to satisfy consumption. Environmental pressures are commonly tied to the extraction and transformation of materials and energy. This report investigates the pro-duction-materials-consumption nexus.
So, what are the most important industries that cause climate change? How much energy do different consumption activities require when the production of the products is taken into account? What are the materials that contribute most to environmental problems? The three perspectives are interrelated, as industries use and process materials and contribute to the production of consumer products.
Maybe not surprisingly, we identify fossil fuels use and agricultural production as major problem areas. We illuminate these from the three perspectives. The relative importance of industries, consumption categories and materials varies across the world, as our assessment shows.
This assessment offers a detailed problem description and analysis of the causation of environmental pressures and hence provides knowledge required for reducing environmental impacts. It tells you where improvements are necessary, but it does not tell you what changes are required and how much they will contribute to improvements. That will be the task of future work, both of the Resource Panel and of the wider scientific community.
Professor Edgar Hertwich
Chair, Working group on the Environmental Impacts of Products and Materials
Preface
4
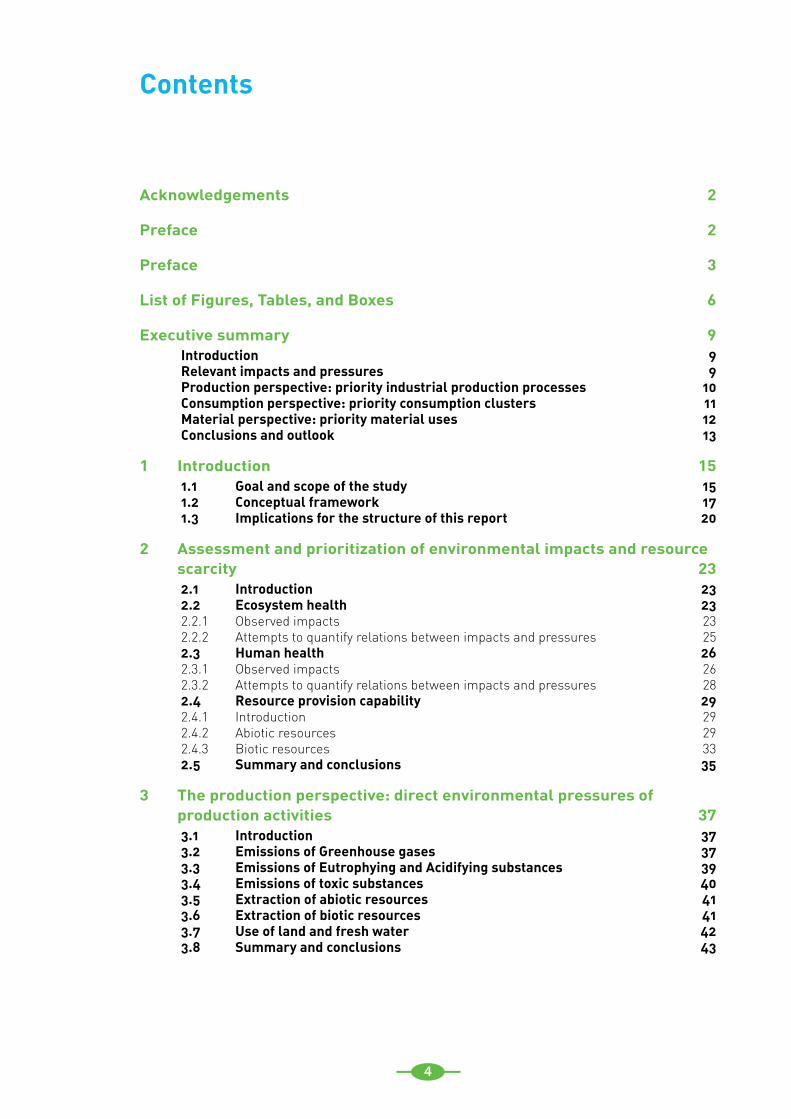
Contents
Acknowledgements 2
Preface 2
Preface 3
List of Figures, Tables, and Boxes 6
Executive summary 9Introduction 9Relevant impacts and pressures 9Production perspective: priority industrial production processes 10Consumption perspective: priority consumption clusters 11Material perspective: priority material uses 12Conclusions and outlook 13
1 Introduction 151.1 Goal and scope of the study 151.2 Conceptual framework 171.3 Implications for the structure of this report 20
2 Assessment and prioritization of environmental impacts and resource scarcity 232.1 Introduction 232.2 Ecosystem health 232.2.1 Observed impacts 232.2.2 Attempts to quantify relations between impacts and pressures 252.3 Human health 262.3.1 Observed impacts 262.3.2 Attempts to quantify relations between impacts and pressures 282.4 Resource provision capability 292.4.1 Introduction 292.4.2 Abiotic resources 292.4.3 Biotic resources 332.5 Summary and conclusions 35
3 The production perspective: direct environmental pressures of production activities 373.1 Introduction 373.2 Emissions of Greenhouse gases 373.3 Emissions of Eutrophying and Acidifying substances 393.4 Emissions of toxic substances 403.5 Extraction of abiotic resources 413.6 Extraction of biotic resources 413.7 Use of land and fresh water 423.8 Summary and conclusions 43
5
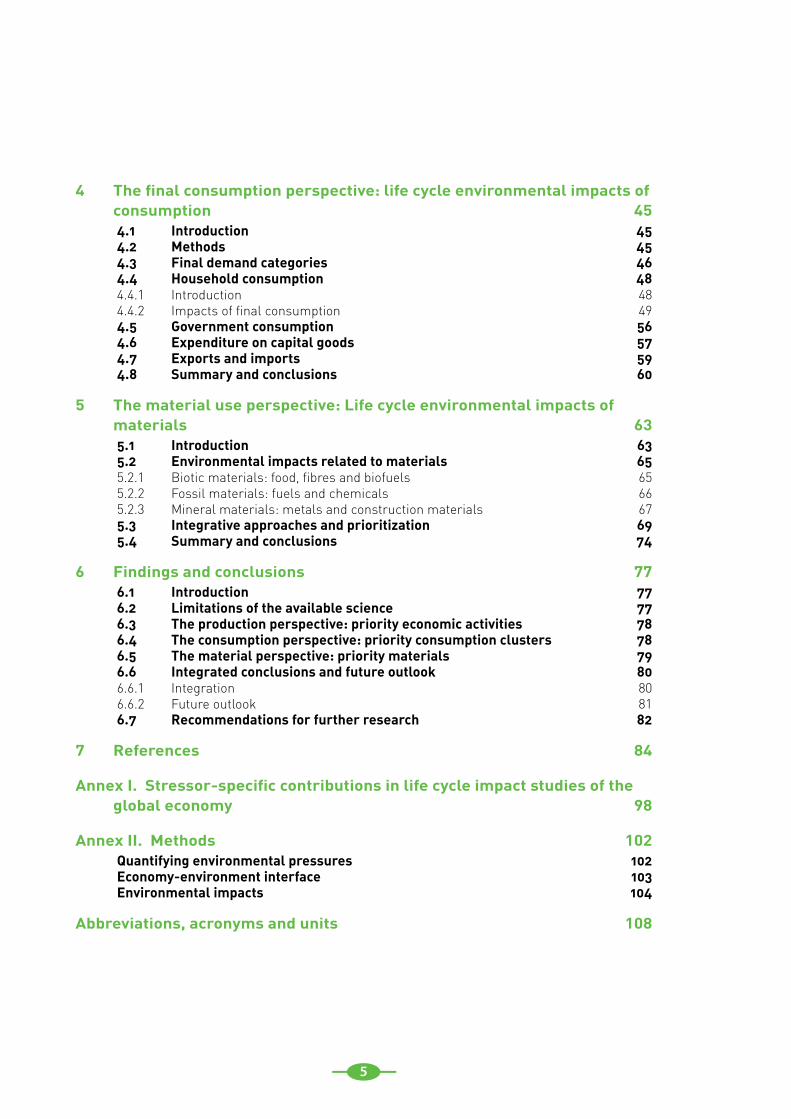
4 The final consumption perspective: life cycle environmental impacts of consumption 454.1 Introduction 454.2 Methods 454.3 Final demand categories 464.4 Household consumption 484.4.1 Introduction 484.4.2 Impacts of final consumption 494.5 Government consumption 564.6 Expenditure on capital goods 574.7 Exports and imports 594.8 Summary and conclusions 60
5 The material use perspective: Life cycle environmental impacts of materials 635.1 Introduction 635.2 Environmental impacts related to materials 655.2.1 Biotic materials: food, fibres and biofuels 655.2.2 Fossil materials: fuels and chemicals 665.2.3 Mineral materials: metals and construction materials 675.3 Integrative approaches and prioritization 695.4 Summary and conclusions 74
6 Findings and conclusions 776.1 Introduction 776.2 Limitations of the available science 776.3 The production perspective: priority economic activities 786.4 The consumption perspective: priority consumption clusters 786.5 The material perspective: priority materials 796.6 Integrated conclusions and future outlook 806.6.1 Integration 806.6.2 Future outlook 816.7 Recommendations for further research 82
7 References 84
Annex I. Stressor-specific contributions in life cycle impact studies of the global economy 98
Annex II. Methods 102Quantifying environmental pressures 102Economy-environment interface 103Environmental impacts 104
Abbreviations, acronyms and units 108
6
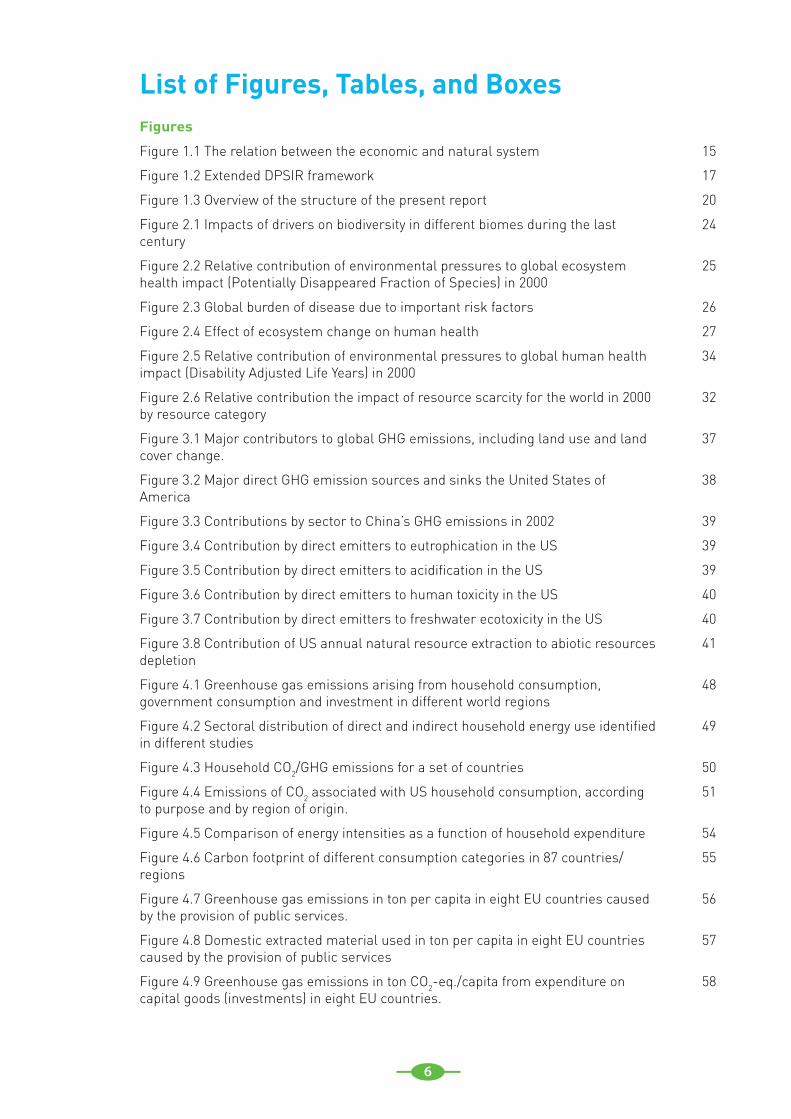
Figures
Figure 1.1 The relation between the economic and natural system
Figure 1.2 Extended DPSIR framework
Figure 1.3 Overview of the structure of the present report
Figure 2.1 Impacts of drivers on biodiversity in different biomes during the last century
Figure 2.2 Relative contribution of environmental pressures to global ecosystem health impact (Potentially Disappeared Fraction of Species) in 2000
Figure 2.3 Global burden of disease due to important risk factors
Figure 2.4 Effect of ecosystem change on human health
Figure 2.5 Relative contribution of environmental pressures to global human health impact (Disability Adjusted Life Years) in 2000
Figure 2.6 Relative contribution the impact of resource scarcity for the world in 2000 by resource category
Figure 3.1 Major contributors to global GHG emissions, including land use and land cover change.
Figure 3.2 Major direct GHG emission sources and sinks the United States of America
Figure 3.3 Contributions by sector to China’s GHG emissions in 2002
Figure 3.4 Contribution by direct emitters to eutrophication in the US
Figure 3.5 Contribution by direct emitters to acidification in the US
Figure 3.6 Contribution by direct emitters to human toxicity in the US
Figure 3.7 Contribution by direct emitters to freshwater ecotoxicity in the US
Figure 3.8 Contribution of US annual natural resource extraction to abiotic resources depletion
Figure 4.1 Greenhouse gas emissions arising from household consumption, government consumption and investment in different world regions
Figure 4.2 Sectoral distribution of direct and indirect household energy use identified in different studies
Figure 4.3 Household CO2/GHG emissions for a set of countries
Figure 4.4 Emissions of CO2 associated with US household consumption, according to purpose and by region of origin.
Figure 4.5 Comparison of energy intensities as a function of household expenditure
Figure 4.6 Carbon footprint of different consumption categories in 87 countries/regions
Figure 4.7 Greenhouse gas emissions in ton per capita in eight EU countries caused by the provision of public services.
Figure 4.8 Domestic extracted material used in ton per capita in eight EU countries caused by the provision of public services
Figure 4.9 Greenhouse gas emissions in ton CO2-eq./capita from expenditure on capital goods (investments) in eight EU countries.
List of Figures, Tables, and Boxes
15
17
20
24
25
26
27
34
32
37
38
39
39
39
40
40
41
48
49
50
51
54
55
56
57
58
7
Figure 4.10 Emissions of acidifying substances in kg SO2-eq./capita from expenditure on capital goods (investments) in eight EU countries.
Figure 4.11 Domestic extracted material used in ton per capita from expenditure on capital goods (investments) in eight EU countries.
Figure 4.12 Increase in the volume of international trade outpaces other macro-variables
Figure 4.13 CO2 emissions associated with internationally traded goods
Figure 5.1 The life cycle of materials
Figure 5.2 Total weighted global average water footprint for bioenergy
Figure 5.3 Contribution to terrestrial eco-toxicity and global warming of 1 kg of primary metal — normalized data
Figure 5.4 Annual Domestic Material Consumption for 28 European countries, by categories of materials.
Figure 5.5 Domestic Material Consumption in industrial and developing countries in the year 2000.
Figure 5.6 Relative contribution of groups of finished materials to total environmental problems (the total of the 10 material groups set at 100%), EU-27+Turkey, 2000
Figure 5.7 Ranked contribution of produced goods to total environmental impacts
Tables
Table 4.1 Relative role (%) of final demand categories in causing different environmental pressures in Finland, 1999
Table 4.2 Distribution of global GHG releases from household consumption categories, including the releases of methane, nitrous oxide, but excluding land use change
Table 4.3 Contribution of different consumption categories to acidification
Table 4.4 Contribution of different consumption categories to environmental impacts
Table 4.5 Global water footprint, by agricultural goods and consumption of other goods
Table 5.1 Priority list of metals based on environmental impacts
Boxes
Box 1-1 Relation between the work of the Working Groups of the Resource Panel
Box 1-2 Some examples of how elements in the DPSIR framework are modeled in practice
Box 2-1 Relation of this section with other work of the Resources Panel
Box 4-1 Investment and trade in input-output analysis
Box 5-1 Resources, materials, land, and water – definition issues revisited
58
59
59
60
65
66
67
70
70
71
74
46
50
52
53
54
68
16
18
29
47
64

8
9
Executive summary
Introduction
The objectives of the UNEP International Panel for Sustainable Resource
Management (Resource Panel) are to:
provide independent, coherent and •authoritative scientific assessments of policy relevance on the sustainable use of natural resources and in particular their environmental impacts over the full life cycle;contribute to a better understanding of •how to decouple economic growth from environmental degradation.
All economic activity occurs in the natural, physical world. It requires resources such as energy, materials and land. In addition, economic activity invariably generates material residuals, which enter the environment as waste or polluting emissions. The Earth, being a finite planet, has a limited capability to supply resources and to absorb pollution. A fundamental question the Resource Panel hence has to answer is how different economic activities influence the use of natural resources and the generation of pollution.
This report answers this fundamental question in two main steps. First, as a preliminary step we need to review work that assesses the importance of observed pressures and impacts on the Earth’s Natural system (usually divided into ecological health, human health, and resources provision capability). Second, the report needs to investigate the causation of these pressures by different economic activities – which can be done via three main perspectives:
An industrial production perspective:1. Which production processes contribute most to pressures and impacts? This perspective is relevant for informing producers and sustainability policies focusing on production.A final consumption perspective:2. Which products and consumption categories have the greatest impacts across their
life cycle? This perspective is relevant for informing consumers and sustainability policies focusing on products and consumption.A material use perspective:3. Which materials have the greatest impacts across their life cycle? This perspective is relevant for material choices and sustainability policies focusing on materials and resources.
The assessment was based on a broad review and comparison of existing studies and literature analyzing impacts of production, consumption, or resource use of countries, country groups, or the world as a whole. For this report no primary research was done.
Relevant impacts and pressuresChapter 2 reviews assessments of environmental impacts in order to identify environmental pressures that should be considered when assessing priority products and materials.
For ecological health, the Millennium Ecosystem Assessment (MA) is considered to be authoritative. Priority environmental pressures identified by the MA are habitat change, pollution with nitrogen and phosphorus, overexploitation of biotic resources such as fisheries and forests, climate change, and invasive species. For human health, the WHO Burden of Disease assessment is considered authoritative. It identifies unsafe drinking water and sanitation, household combustion of solid fuels, lead exposure, climate change, urban air pollution and occupational exposure to particulate matter as important contributions to the burden of disease today.
Chapter 2 also reviews work on scarcity of mineral, fossil and biotic resources. Authoritative assessments in this area are lacking and the academic literature disagrees on whether resource scarcity or competition for scarce resources presents a fundamental problem or is easily solved by the market.
10
Demand projections indicate, however, that the consumption of some metals and oil and gas will outstrip supply and may exhaust available reserves within the current century. For biotic resources, overexploitation has led to the collapse of resource stocks especially in the case of fisheries. In addition, competition over land and availability of fresh water is a serious concern. There is an urgent need for better data and analysis on the availability and quality of resources and the economic effects of scarcity.
These findings suggest strongly that the following pressures and impacts should be considered in the remainder of this report, since they affect one or more of the protection areas ecosystem health, human health and resources:
Impacts caused by emissions:•Climate change (caused by Greenhouse -gas (GHG) emissions);Eutrophication (over-fertilization -caused by pollution with nitrogen and phosphorus);Human and ecotoxic effects caused by -urban and regional air pollution, indoor air pollution and other toxic emissions.
Impacts related to resource use:•Depletion of abiotic resources (fossil -energy carriers and metals);Depletion of biotic resources (most -notably fish and wood);
Habitat change and resource competition -due to water and land use.
Ideally, issues like threats of invasive species should also be addressed, but for such topics there is little quantitative insight in the relation between drivers, pressures and impacts.
Production perspective: priority industrial production processesChapter 3 to 5 deal with the second step, setting priorities from a production, consumption and material use perspective. The production perspective (Chapter 3) identifies the following industrial production processes as important:
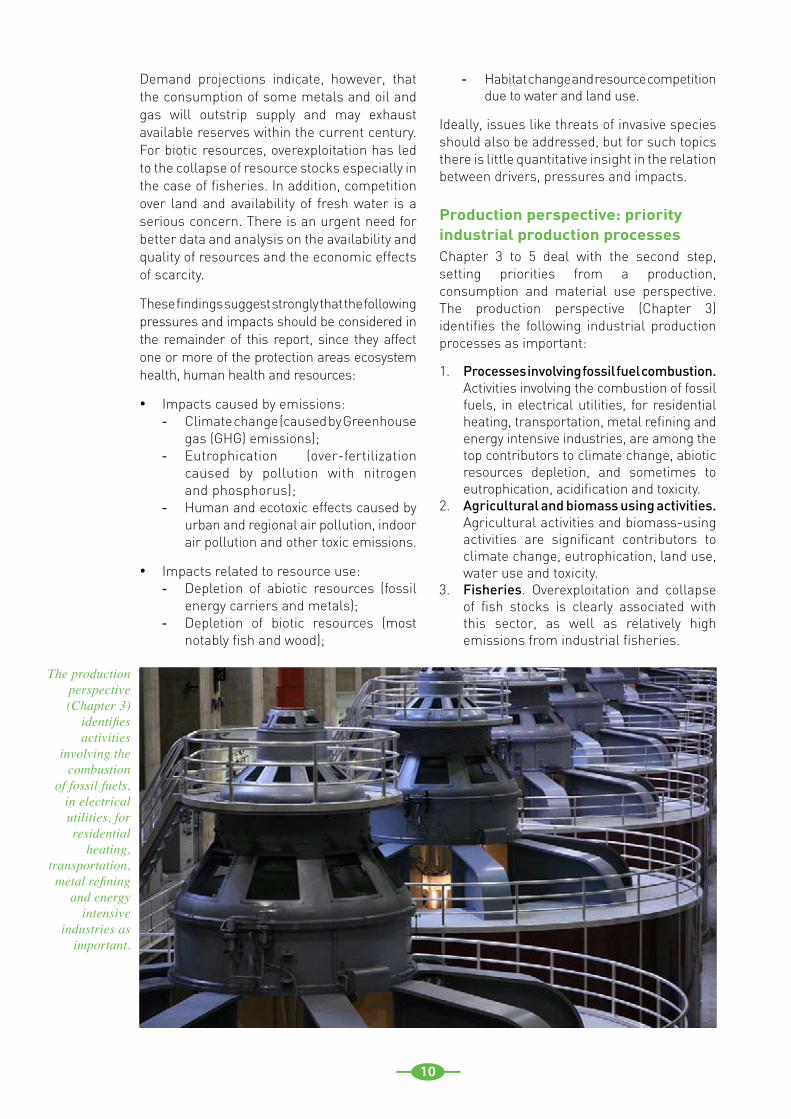
Processes involving fossil fuel combustion. 1. Activities involving the combustion of fossil fuels, in electrical utilities, for residential heating, transportation, metal refining and energy intensive industries, are among the top contributors to climate change, abiotic resources depletion, and sometimes to eutrophication, acidification and toxicity. Agricultural and biomass using activities. 2. Agricultural activities and biomass-using activities are significant contributors to climate change, eutrophication, land use, water use and toxicity. Fisheries3. . Overexploitation and collapse of fish stocks is clearly associated with this sector, as well as relatively high emissions from industrial fisheries.
The production perspective (Chapter 3)
identifies activities
involving the combustion
of fossil fuels, in electrical utilities, for residential
heating, transportation,
metal refining and energy
intensive industries as
important.
11
Consumption perspective: priority consumption clustersThe consumption perspective is central to Chapter 4. It assesses impacts related to final demand for products and services, usually divided into household consumption, government consumption, and expenditure on capital goods. We see that few studies are available for less developed countries and emerging economies. A wider range of studies is available for industri-alized countries. Still, most focus on energy or greenhouse gas emissions. With the exception of a few studies on European countries, very little work exists that includes a wider range of environmental pressures. Despite such limitations, some conclusions can be drawn that are supported by virtually all studies reviewed, and which can be seen as robust.
Priority product groups and final 1. consumption categories:
In most countries, household a. consumption determines 60% or more of the life cycle impacts of final consumption. Within household consumption:
In developing and emerging coun-i. tries, food and housing dominate greenhouse gas emissions. For industrialized countries, all ii. studies indicate that housing, mobility, food and electrical appliances typically determine
over 70% of the impacts of household consumption.
The impacts from government b. consumption and investment in infrastructure and capital goods are usually lower than those from household consumption. Yet, for non-Asian developing countries the public sector is often a relatively large part of the economy and hence also in terms of environmental pressure. Many emerging economies in Asia are currently making large investments in building up their infrastructure, which makes this final expenditure category influential.
The role of imports and exports. Emerging 2. economies (particularly in Asia) have developed themselves as exporters of large amounts of products to developed countries. As a consequence, impacts driven by consumption in developed countries in part are translocated to countries where production takes place.
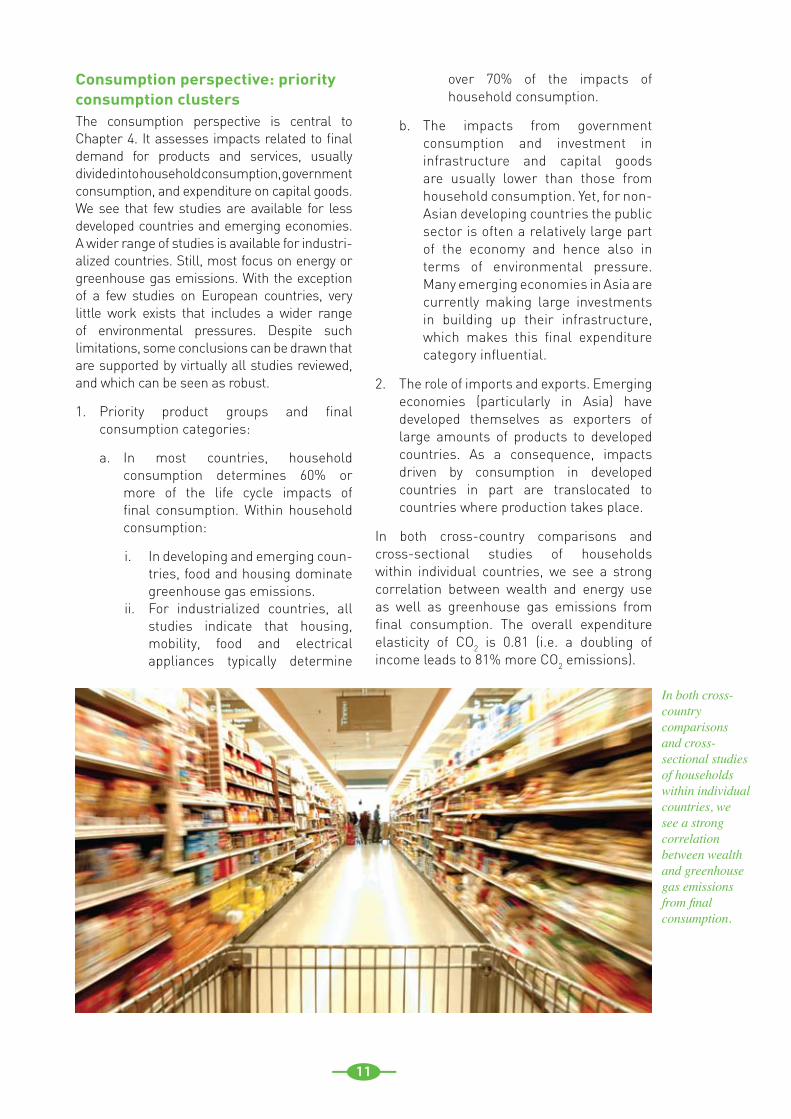
In both cross-country comparisons and cross-sectional studies of households within individual countries, we see a strong correlation between wealth and energy use as well as greenhouse gas emissions from final consumption. The overall expenditure elasticity of CO2 is 0.81 (i.e. a doubling of income leads to 81% more CO2 emissions).
In both cross-country comparisons and cross-sectional studies of households within individual countries, we see a strong correlation between wealth and greenhouse gas emissions from final consumption.
12
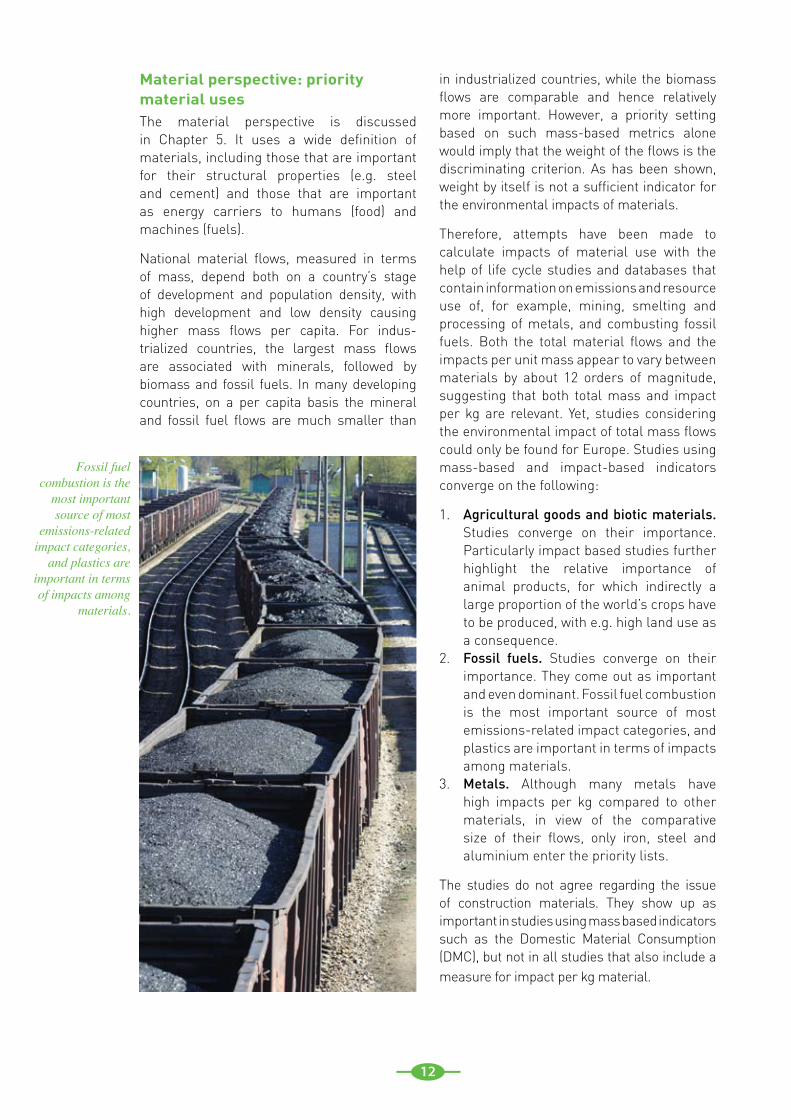
Material perspective: priority material usesThe material perspective is discussed in Chapter 5. It uses a wide definition of materials, including those that are important for their structural properties (e.g. steel and cement) and those that are important as energy carriers to humans (food) and machines (fuels).
National material flows, measured in terms of mass, depend both on a country’s stage of development and population density, with high development and low density causing higher mass flows per capita. For indus-trialized countries, the largest mass flows are associated with minerals, followed by biomass and fossil fuels. In many developing countries, on a per capita basis the mineral and fossil fuel flows are much smaller than
in industrialized countries, while the biomass flows are comparable and hence relatively more important. However, a priority setting based on such mass-based metrics alone would imply that the weight of the flows is the discriminating criterion. As has been shown, weight by itself is not a sufficient indicator for the environmental impacts of materials.
Therefore, attempts have been made to calculate impacts of material use with the help of life cycle studies and databases that contain information on emissions and resource use of, for example, mining, smelting and processing of metals, and combusting fossil fuels. Both the total material flows and the impacts per unit mass appear to vary between materials by about 12 orders of magnitude, suggesting that both total mass and impact per kg are relevant. Yet, studies considering the environmental impact of total mass flows could only be found for Europe. Studies using mass-based and impact-based indicators converge on the following:
Agricultural goods and biotic materials. 1. Studies converge on their importance. Particularly impact based studies further highlight the relative importance of animal products, for which indirectly a large proportion of the world’s crops have to be produced, with e.g. high land use as a consequence.Fossil fuels.2. Studies converge on their importance. They come out as important and even dominant. Fossil fuel combustion is the most important source of most emissions-related impact categories, and plastics are important in terms of impacts among materials.Metals.3. Although many metals have high impacts per kg compared to other materials, in view of the comparative size of their flows, only iron, steel and aluminium enter the priority lists.
The studies do not agree regarding the issue of construction materials. They show up as important in studies using mass based indicators such as the Domestic Material Consumption (DMC), but not in all studies that also include a measure for impact per kg material.
Fossil fuel combustion is the
most important source of most
emissions-related impact categories,
and plastics are important in terms of impacts among
materials.
13
Conclusions and outlookA wealth of studies is available that have helped to assess the most important causes of environmental impacts from a production, consumption and materials perspective. These different studies, and different perspectives points, paint a consistent overall picture.
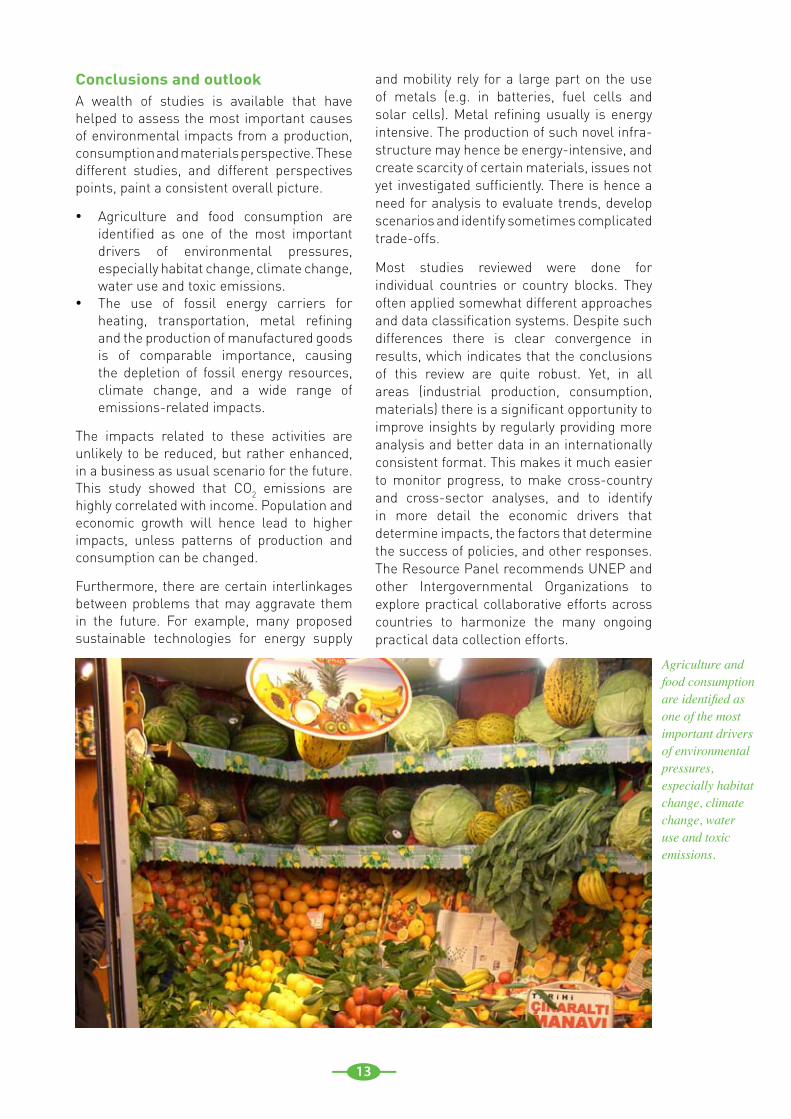
Agriculture and food consumption are •identified as one of the most important drivers of environmental pressures, especially habitat change, climate change, water use and toxic emissions. The use of fossil energy carriers for •heating, transportation, metal refining and the production of manufactured goods is of comparable importance, causing the depletion of fossil energy resources, climate change, and a wide range of emissions-related impacts.
The impacts related to these activities are unlikely to be reduced, but rather enhanced, in a business as usual scenario for the future. This study showed that CO2 emissions are highly correlated with income. Population and economic growth will hence lead to higher impacts, unless patterns of production and consumption can be changed.
Furthermore, there are certain interlinkages between problems that may aggravate them in the future. For example, many proposed sustainable technologies for energy supply
and mobility rely for a large part on the use of metals (e.g. in batteries, fuel cells and solar cells). Metal refining usually is energy intensive. The production of such novel infra-structure may hence be energy-intensive, and create scarcity of certain materials, issues not yet investigated sufficiently. There is hence a need for analysis to evaluate trends, develop scenarios and identify sometimes complicated trade-offs.
Most studies reviewed were done for individual countries or country blocks. They often applied somewhat different approaches and data classification systems. Despite such differences there is clear convergence in results, which indicates that the conclusions of this review are quite robust. Yet, in all areas (industrial production, consumption, materials) there is a significant opportunity to improve insights by regularly providing more analysis and better data in an internationally consistent format. This makes it much easier to monitor progress, to make cross-country and cross-sector analyses, and to identify in more detail the economic drivers that determine impacts, the factors that determine the success of policies, and other responses. The Resource Panel recommends UNEP and other Intergovernmental Organizations to explore practical collaborative efforts across countries to harmonize the many ongoing practical data collection efforts.
Agriculture and food consumption are identified as one of the most important drivers of environmental pressures, especially habitat change, climate change, water use and toxic emissions.
14
15
Society’s Economic
System
Ecosystem quality•Human health quality•Resource provision capability•
Resources (biotic, abiotic, water, land)
Emissions and Waste
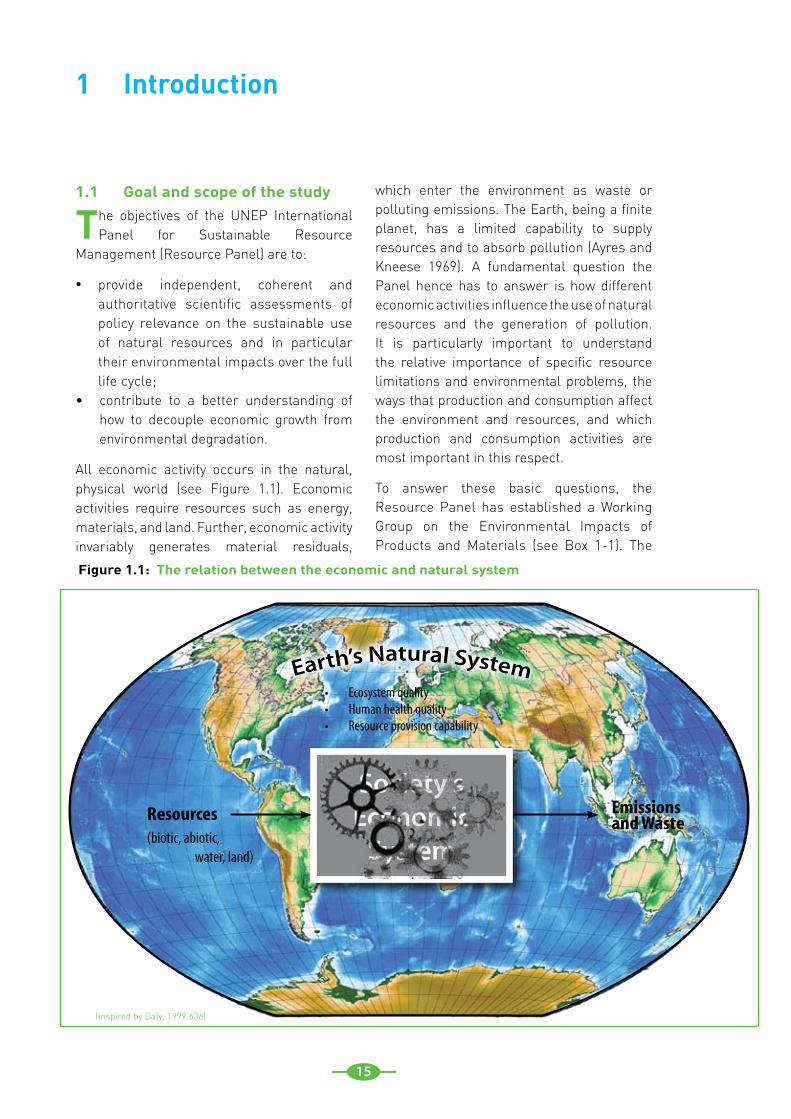
Figure 1.1: The relation between the economic and natural system
Earth’s Natural System
1 Introduction
1.1 Goal and scope of the study
The objectives of the UNEP International Panel for Sustainable Resource
Management (Resource Panel) are to:
provide independent, coherent and •authoritative scientific assessments of policy relevance on the sustainable use of natural resources and in particular their environmental impacts over the full life cycle;contribute to a better understanding of •how to decouple economic growth from environmental degradation.
All economic activity occurs in the natural, physical world (see Figure 1.1). Economic activities require resources such as energy, materials, and land. Further, economic activity invariably generates material residuals,
which enter the environment as waste or polluting emissions. The Earth, being a finite planet, has a limited capability to supply resources and to absorb pollution (Ayres and Kneese 1969). A fundamental question the Panel hence has to answer is how different economic activities influence the use of natural resources and the generation of pollution. It is particularly important to understand the relative importance of specific resource limitations and environmental problems, the ways that production and consumption affect the environment and resources, and which production and consumption activities are most important in this respect.
To answer these basic questions, the Resource Panel has established a Working Group on the Environmental Impacts of Products and Materials (see Box 1-1). The
(inspired by Daly, 1999:636)
16
Box 1-1: Relation between the work of the Working Groups of the Resource Panel
The International Panel for Sustainable Resource Management (Resource Panel) was officially launched by the United Nations Environment Programme (UNEP) in November 2007. For its work program for the period of 2007 to 2010, the Panel established five working groups addressing the issues of decoupling, biofuels, water, metal stocks and flows and environmental impacts. The work of these groups is related as follows:
The1. Working Group on the Environmental Impacts of Products and Materials identifies the economic activities with the greatest resource uses and environmental impacts from a production, consumption and resource use/material perspective. The 2. Working Group on Global Metals Flows focuses on providing for specific resources, i.e. metals, a more detailed understanding of the anthropogenic flows and stocks and their potential scarcity. The 3. Working Group on Biofuels focuses on the specific topic of biofuels, and their specific implications on land use and other pressures, and their contribution to the solution of the problem of climate change. The 4. Working Group on Decoupling provides a rationale and options for decoupling economic activity from resource inputs and environmental impacts. It builds in part on priority assessments of the Working group on the Environmental Impacts of Products and Resources, and addresses from there the question how economic development can decoupled from resource use and the generation of environmental impacts (double decoupling). It includes case studies of decoupling policies in four countries.The 5. Working Group on Water Efficiency provides an assessment of water efficiency in harvesting, use and re-use of water and the analytical basis for decision making on efficient utilisation of water.
task of the Working Group was to review and summarize existing available scientific work, rather than doing primary research or data gathering. The assessment in this report hence was based on a broad review and comparison of existing studies and literature analyzing the resource demands and environmental impacts of production, consumption, or resource use of countries, country groups, or the world as a whole.
The Working Group did its assessment by addressing the following key questions:
Identification of the most critical uses •of natural resources and their impacts: which key environmental and resource pressures need to be considered in the assessment of products and materials?Assessment from an industrial •production perspective: what are the main industries contributing to
environmental and resource pressures?Assessment from a final consumption •perspective: which consumption categories and product groups have the greatest environmental impacts across their life cycle?Assessment from a resource use and •material use perspective: which materials have the greatest environmental impact across their life cycles?Outlook and conclusions: will expected •socio-economic trends and developments make such priorities more relevant and critical or not? What are the overall conclusions with regard to the most relevant economic activities in view of their resource use and impacts?
This introduction chapter will further explain the conceptual approach of the report. After this, the report will discuss the five core questions above in five subsequent chapters.
17
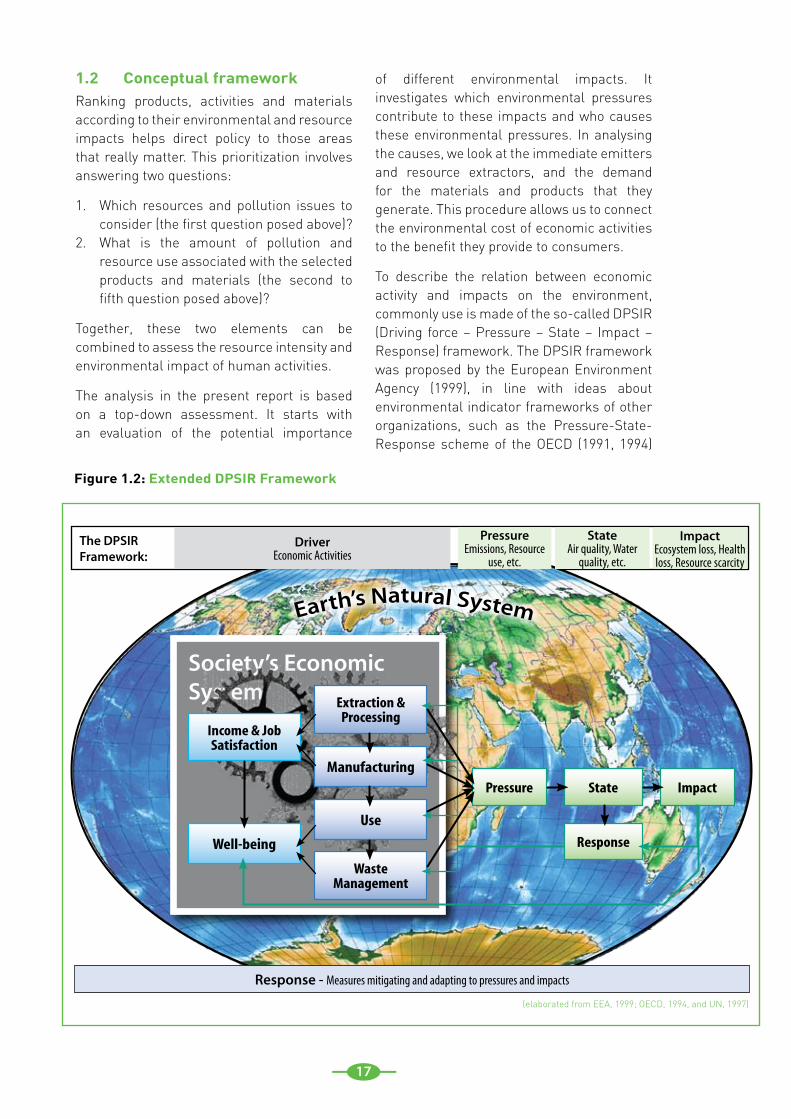
Figure 1.2: Extended DPSIR Framework
1.2 Conceptual frameworkRanking products, activities and materials according to their environmental and resource impacts helps direct policy to those areas that really matter. This prioritization involves answering two questions:
Which resources and pollution issues to 1. consider (the first question posed above)? What is the amount of pollution and 2. resource use associated with the selected products and materials (the second to fifth question posed above)?
Together, these two elements can be combined to assess the resource intensity and environmental impact of human activities.
The analysis in the present report is based on a top-down assessment. It starts with an evaluation of the potential importance
of different environmental impacts. It investigates which environmental pressures contribute to these impacts and who causes these environmental pressures. In analysing the causes, we look at the immediate emitters and resource extractors, and the demand for the materials and products that they generate. This procedure allows us to connect the environmental cost of economic activities to the benefit they provide to consumers.
To describe the relation between economic activity and impacts on the environment, commonly use is made of the so-called DPSIR (Driving force – Pressure – State – Impact – Response) framework. The DPSIR framework was proposed by the European Environment Agency (1999), in line with ideas about environmental indicator frameworks of other organizations, such as the Pressure-State-Response scheme of the OECD (1991, 1994)
Society’s Economic System
Income & Job Satisfaction
Extraction & Processing
State
Response
Impact
Use
Well-being
Manufacturing
Waste Management
Earth’s Natural System
Pressure
The DPSIR Framework:
DriverEconomic Activities
Response - Measures mitigating and adapting to pressures and impacts
Pressure Emissions, Resource
use, etc.
State Air quality, Water
quality, etc.
Impact Ecosystem loss, Health loss, Resource scarcity
(elaborated from EEA, 1999; OECD, 1994, and UN, 1997)
18
Box 1-2 Some examples of how elements in the DPSIR framework are modeled in practice
The aim of the life cycle framework is to provide an understanding of how resources are utilized, how materials become incorporated into products, used and disposed of, and how pollution is produced along the way. At some point in this life cycle, the product provides a useful service to a final user. Life cycle assessment calculates the resource use and emissions along the life cycle from resource extraction to disposal per unit of material, product, or service provided (Rebitzer et al. 2004). This approach allows us to relate resource use and pollution to final consumption.
Final consumption can be described in aggregate either in economic terms, as Gross Domestic Product, describing final expenditure in a national economy, or in physical terms, describing the aggregate material flow of national economies in tonnes. Aggregate measures of economic activity or material turnover, however, are of limited value. A more detailed description of final consumption and of production and disposal processes required to satisfy this consumption are required to provide an insight into the environmental impact of different consumption activities, products, and materials.
The economic system can be modelled in monetary terms, for example using input-output tables (describing flows of goods between productive sectors), in physical terms, using Material Flow Accounts (MFA) or detailed process tree descriptions such as those used in Life Cycle Assessments (LCA), which describes detailed technical production processes in terms of physical inputs and outputs).
The ‘pressure’ (the economy-environment interface) is usually described in physical terms, i.e. resources extracted, emissions to the environment or land used for a certain purpose. In LCA terms this is called ‘environmental interventions’.
The impact assessment (the translation from ’pressures‘ to ’states‘ and ’impacts‘), varies widely. Some indicators describe impacts at the ’endpoint level’, as it is labelled in LCA, such as damage to health, ecosystems, biodiversity or societal structures or values. ’Impacts’ are also described at the midpoint level, meaning established environmental problems (or impact categories) such as global warming, acidification or depletion of resources (Goedkoop et al. 2008).
A major challenge is to integrate all the different types of interventions or impacts into one assessment. Aggregated indicators translate impacts to a common unit. In LCA, the impact assessment proceeds through characterizing environmental pressures with reference to environmental mechanisms (Annex I). In practice, emissions or resource use are multiplied by ’characterization factors‘, expressing, for example, the ability of different greenhouse gases to absorb outgoing infrared radiation (Annex I to the present report deals with further methodological issues). Mass-based indicators take the inputs or outputs measured in tonnes to be an approximation for environmental impacts. An indicator like the Ecological Footprint expresses all impacts in terms of land area and compares it to the limited productive land area available in a region (Wackernagel and Rees 1996). The Human Appropriation of Net Primary Productivity indicator (HANPP) uses the fraction of (naturally occurring) primary production of biomass utilized or modified by humans as its reference, indicating how little of the primary production of biomass remains available for unperturbed nature (Haberl et al. 2007).
19
and the Driver-State-Response concept of the UN Commission for Sustainable Development (UN 1997). The DPSIR framework aims to provide a step-wise description of the causal chain between economic activity (the Driver) and impacts such as loss of nature or biodiversity, and diminished human health, welfare or well-being. For the purpose of this report, we have chosen to describe the Driver block in more detail. Figure 1.2 gives, in relation to Figure 1.1, an overview of the DPSIR framework as applied in this report.
The extended ‘Driver’ block in Figure 1.2 distinguishes the life cycle of economic activities: the extraction of resources, their processing into materials and products and the subsequent use and discarding of the products. The figure emphasizes the coherence of the production consumption chain and illustrates that resource extraction, the production of products and services, and waste management are all part of the same system.
The extended ‘Driver’ block also shows indirect drivers that influence the economic activities in
the production-consumption chain. It concerns lifestyle, demography, and monetary wealth (usually expressed as Gross Domestic Product (GDP)). The GDP is the aggregate value of all goods purchased and used by final consumers. Figure 1.2 emphasizes that production and the associated resource extraction and pollution are motivated by the services obtained from products and hence draws a connection to well-being. At the same time, economic activities provide employment and income which makes final consumption of products and services possible. In essence, the extended ‘Driver’ block describes hence nothing more and nothing less than the (economic) system of satisfying human needs.
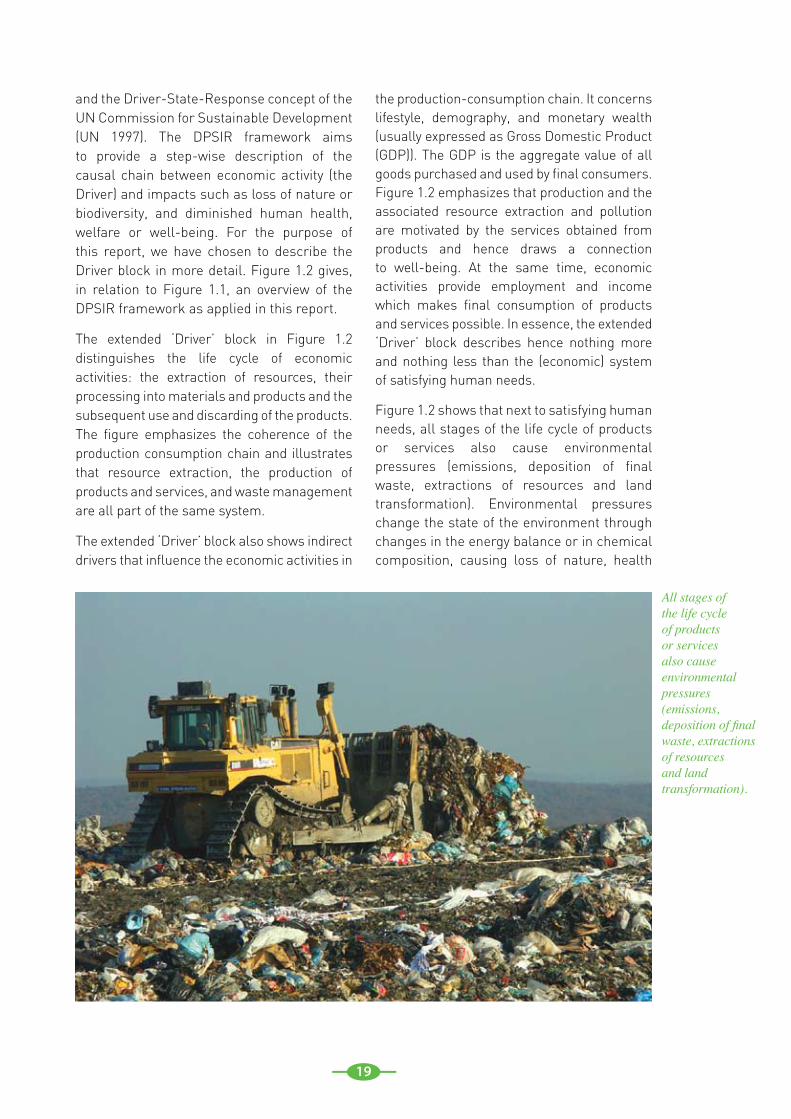
Figure 1.2 shows that next to satisfying human needs, all stages of the life cycle of products or services also cause environmental pressures (emissions, deposition of final waste, extractions of resources and land transformation). Environmental pressures change the state of the environment through changes in the energy balance or in chemical composition, causing loss of nature, health
All stages of the life cycle of products or services also cause environmental pressures (emissions, deposition of final waste, extractions of resources and land transformation).
20
and well-being, either directly or through loss of ecosystem services. Impacts occur at the end of the DPSIR chain and take the form of loss of nature or biodiversity, and diminished human health, welfare or well-being. The figure emphasizes the fact that impacts caused by emissions or by extractions are the result of our economic activities.
If such impacts are seen as problematic, this can lead to a response by policy makers. It goes without saying that an intelligent response depends on an understanding of the entire chain leading from needs to impacts. This requires an integration of knowledge from different science fields, for instance environmental sciences (focusing on providing an understanding of the causal connection of pressures to impacts) and industrial ecology (focusing on understanding how our system of production and consumption causes environmental pressures as a by-product of satisfying needs).
This framework is still quite general and can be operationalized in different ways. Indeed, we see that studies also prefer to use different terminology as used here. Further, studies reviewed in this report sometimes describe drivers in economic terms, and sometimes in physical terms, include different items as pressures, and define final impacts in different ways. However, they all draw from different combinations of a limited number of options. We refer further to the Annexes to this report, and provide some examples in Box 1-2.
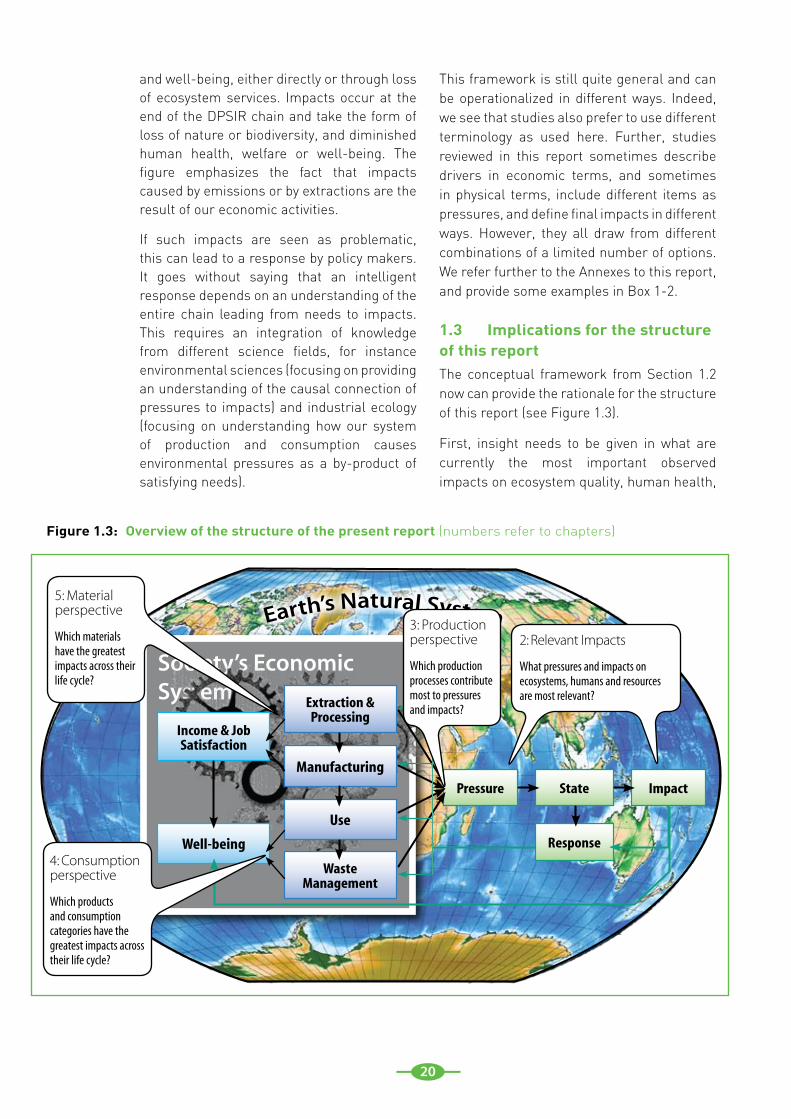
1.3 Implications for the structure of this reportThe conceptual framework from Section 1.2 now can provide the rationale for the structure of this report (see Figure 1.3).
First, insight needs to be given in what are currently the most important observed impacts on ecosystem quality, human health,
Society’s Economic System
Income & Job Satisfaction
Extraction & Processing
Use
Well-being
Manufacturing
Waste Management
Earth’s Natural System5: Material perspective
Which materials have the greatest impacts across their life cycle?
Figure 1.3: Overview of the structure of the present report (numbers refer to chapters)
State
Response
ImpactPressure
3: Production perspective
Which production processes contribute most to pressures and impacts?
2: Relevant Impacts
What pressures and impacts on ecosystems, humans and resources are most relevant?
4: Consumption perspective
Which products and consumption categories have the greatest impacts across their life cycle?
21
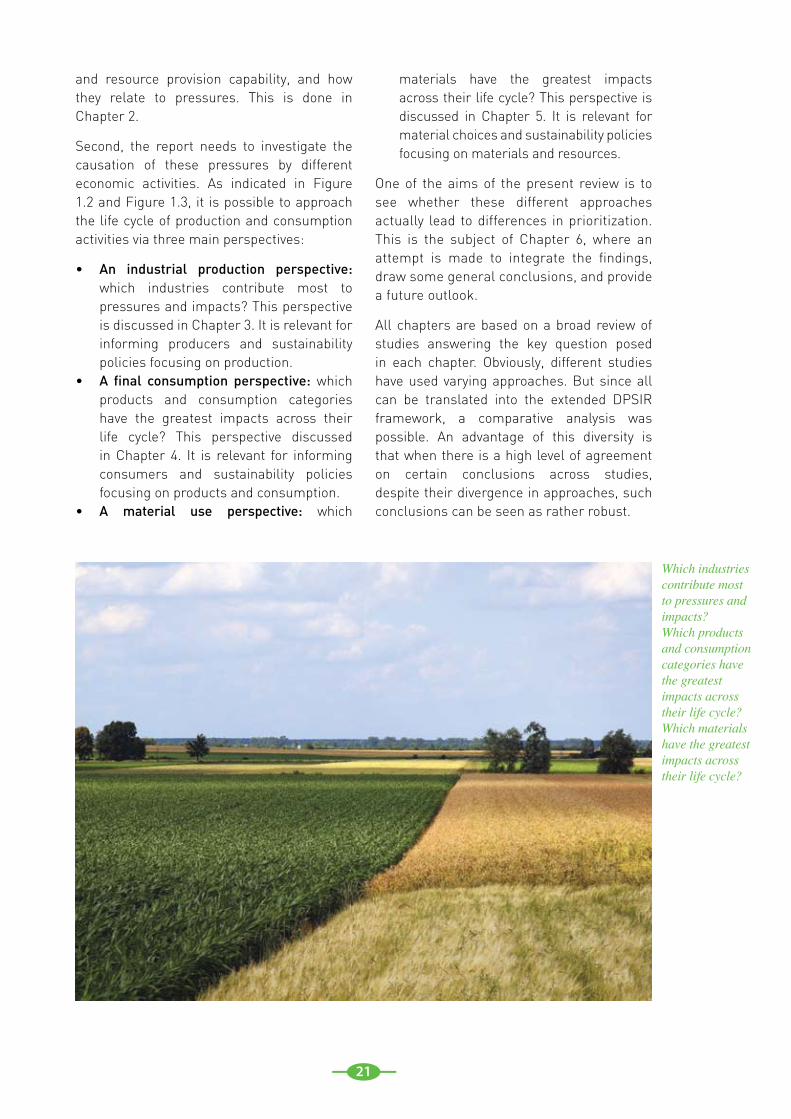
and resource provision capability, and how they relate to pressures. This is done in Chapter 2.
Second, the report needs to investigate the causation of these pressures by different economic activities. As indicated in Figure 1.2 and Figure 1.3, it is possible to approach the life cycle of production and consumption activities via three main perspectives:
An industrial production perspective: •which industries contribute most to pressures and impacts? This perspective is discussed in Chapter 3. It is relevant for informing producers and sustainability policies focusing on production. A final consumption perspective:• which products and consumption categories have the greatest impacts across their life cycle? This perspective discussed in Chapter 4. It is relevant for informing consumers and sustainability policies focusing on products and consumption.A material use perspective: • which
materials have the greatest impacts across their life cycle? This perspective is discussed in Chapter 5. It is relevant for material choices and sustainability policies focusing on materials and resources.
One of the aims of the present review is to see whether these different approaches actually lead to differences in prioritization. This is the subject of Chapter 6, where an attempt is made to integrate the findings, draw some general conclusions, and provide a future outlook.
All chapters are based on a broad review of studies answering the key question posed in each chapter. Obviously, different studies have used varying approaches. But since all can be translated into the extended DPSIR framework, a comparative analysis was possible. An advantage of this diversity is that when there is a high level of agreement on certain conclusions across studies, despite their divergence in approaches, such conclusions can be seen as rather robust.
Which industries contribute most to pressures and impacts? Which products and consumption categories have the greatest impacts across their life cycle? Which materials have the greatest impacts across their life cycle?
22
23
2.1 IntroductionThis chapter focuses on the first question to be answered in this report: which environmental and resource pressures need to be considered in the prioritization of products and materials?
Answering this question requires the consideration of which main functions of the environmental system need to be protected from impacts caused by the economic system. There are various perspectives to identify and categorize such ‘areas of protection’. The ecosystem services approach for instance discerns a number of provisioning, regulating, supporting and cultural services that the natural system provides to humans and the economic system (Mooney et al., 2005). This report follows the tradition of life cycle impact assessment (Udo de Haes et al. 2002) and distinguishes between the following areas of protection:
ecosystem health; •human health; and •resource provision capability for human •welfare.
The advantage of using this division is that it explicitly addresses human health impacts which historically have been an important reason for embarking on environmental response policies, as well as resource provision capability problems, which are of core interest of the International Panel on Sustainable Resource Management. A slight disadvantage is that ecosystem health is closely related to the availability of (particularly biotic) resources, implying that this division may lead to the discussion of the same problem from the perspective of ecosystem quality and resource availability.
The next three sections discuss these topics. In Section 2.2 and 2.3, we review global assessments of (observed) impacts on ecosystem and human health. We compare these global assessments of observed
impacts with studies that indicate which pressures (emissions and resource extraction processes) may contribute most to those impacts. Section 2.4 discusses the topic of resource availability, and Section 2.5 provides summarizing conclusions.
2.2 Ecosystem health2.2.1 Observed impactsThe 2005 Millennium Ecosystem Assessment (MA) is probably the most authoritative analysis with regard to the status of global ecosystems. Over 1,300 scientists from all parts of the world contributed to the MA. The MA identifies factors that threaten ecosystems and contributions of ecosystems to human well-being (Mooney et al. 2005). The MA found that over the past 50 years humans have changed ecosystems more rapidly and extensively than in any comparable time period in human history, largely to meet rapidly growing demand for food, fresh water, timber, fibre and fuel. This has resulted in a substantial and largely irreversible loss in the diversity of life on Earth. The MA investigated the supply of ecosystem services to humans: the provision of food, fibres, genetic resources, biochemicals and fresh water; the regulation of air quality, climate, water, natural hazards, pollination, pests and disease; the support derived from primary production, nutrient cycling, soil formation and water cycling; and cultural services such as spiritual and aesthetic values, and recreation.
One significant driver for ecosystem degradation has been the expansion of the human population and changes in diet. Substantial habitat losses have arisen due to increased demand for land for agriculture and grazing, and significant declines in game and fish populations have resulted from over-harvesting. Furthermore, increased pollution, habitat changes and species distribution changes have impaired the services that ecosystems provide.
2 Assessment and prioritization of environmental impacts and resource scarcity
24
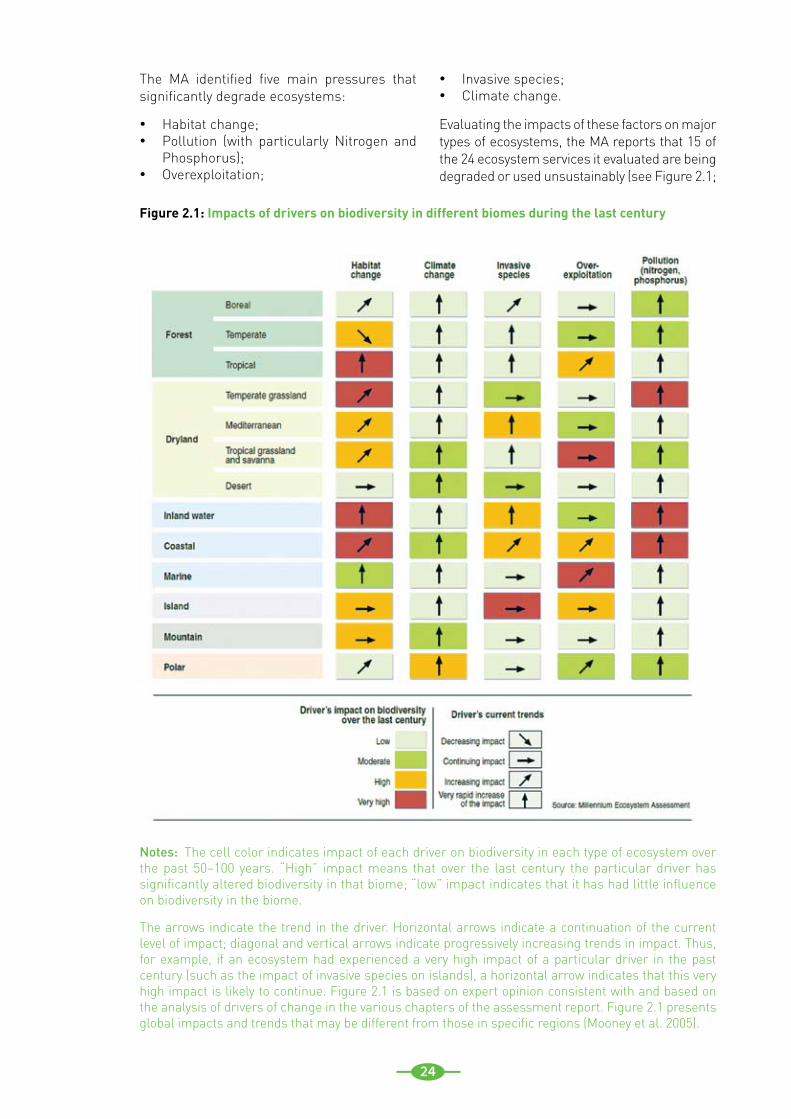
The MA identified five main pressures that significantly degrade ecosystems:
Habitat change; •Pollution (with particularly Nitrogen and •Phosphorus);Overexploitation;•
Invasive species; •Climate change. •
Evaluating the impacts of these factors on major types of ecosystems, the MA reports that 15 of the 24 ecosystem services it evaluated are being degraded or used unsustainably (see Figure 2.1;
Figure 2.1: Impacts of drivers on biodiversity in different biomes during the last century
Notes: The cell color indicates impact of each driver on biodiversity in each type of ecosystem over the past 50–100 years. “High” impact means that over the last century the particular driver has significantly altered biodiversity in that biome; “low” impact indicates that it has had little influence on biodiversity in the biome.
The arrows indicate the trend in the driver. Horizontal arrows indicate a continuation of the current level of impact; diagonal and vertical arrows indicate progressively increasing trends in impact. Thus, for example, if an ecosystem had experienced a very high impact of a particular driver in the past century (such as the impact of invasive species on islands), a horizontal arrow indicates that this very high impact is likely to continue. Figure 2.1 is based on expert opinion consistent with and based on the analysis of drivers of change in the various chapters of the assessment report. Figure 2.1 presents global impacts and trends that may be different from those in specific regions (Mooney et al. 2005).
25
Wegener Sleeswijk et al., 2008, and Goedkoop et al., 2008). Pollution, climate change and habitat changes are the most rapidly increasing drivers of impacts across ecosystem types, with over-exploitation and invasive species also showing an upward trend in some ecosystem types (see Figure 2.1). These impacts are documented in detail over hundreds of pages and the extent and development of drivers is investigated historically and through scenarios for the future. The scenarios demonstrate that it will be challenging to provide basic necessities such as adequate nutrition and water for a growing population while maintaining and improving regulating and cultural ecosystem services.
While the MA does not provide details of threats to all ecosystems, it is important to note that all of the five identified drivers are important for at least some types of ecosystem. For the present assessment, an important issue is whether the degree of impact on ecosystems depends mainly on the magnitude of the driver or whether resource management practices can have an influence. Certainly, the impacts of some drivers, such as habitat change in surrounding lands, are largely a question of magnitude and resource managers may have only modest influence. In other cases, such as pollution with greenhouse gases or phosphorus and nitrogen, it is possible to assess and manage the ways that activities contribute to climate change or eutrophication (due to nitrogen or phosphorus pollution).
The spread of invasive species, while dependent on the volume of trade, can also be managed (through regulation of whether potentially invasive species can be transported, how ballast water in ships is treated, and so forth.). For habitat change and biotic resource extraction, resource management practices determine the degree of impact. In most cases at least some mitigating actions are available. Assessing the impact of specific human activities is more difficult when the impact depends on a combination of management practices, the volume of the drivers, and extraneous factors over which the manager has little or no control.
2.2.2 Attempts to quantify relations between impacts and pressuresIn addition to the insights derived from the MA, studies have been done that assess the contribution of pressures of the global
economy, such as emissions, land use change and resource extraction, to impacts on ecosystem health, human health, and resource availability (Wegener Sleeswijk et al. (2008) and Goedkoop et al. (2008). These studies model the ecosystem health impacts resulting from the total environmental pressures in the year 2000, including both the pressures expected in that year and those expected to occur later, e.g., from the continued presence of pollutants in the environment. The approach is inherently different to MA, which assesses the relative importance of past and present stressors for the current state of the environment. In life cycle impact assessment, the indicator of damage to the area of protection – ’ecosystem health’ – is commonly assessed through the ’Potentially Disappeared Fraction of species’. The potentially disappeared fraction of species can be interpreted as the fraction of species that has a high probability of no occurrence in a region due to unfavourable conditions.
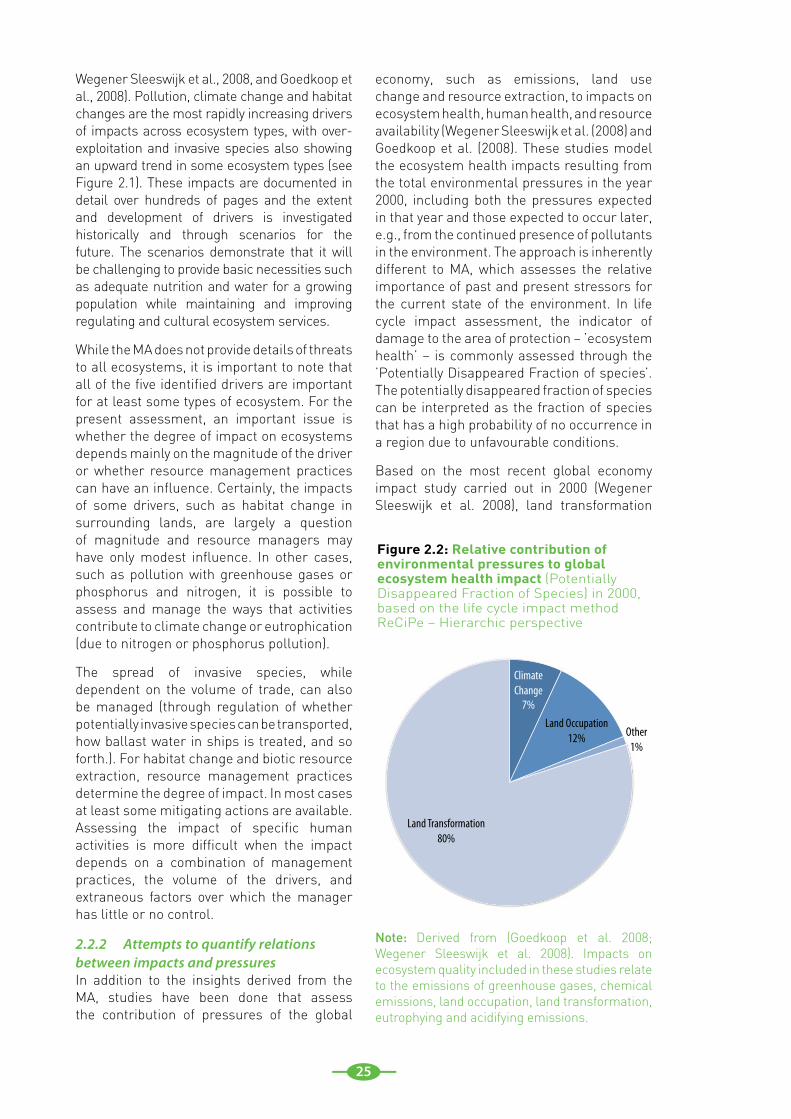
Based on the most recent global economy impact study carried out in 2000 (Wegener Sleeswijk et al. 2008), land transformation
Climate Change
7%
Land Occupation 12% Other
1%
Land Transformation 80%
Figure 2.2: Relative contribution of environmental pressures to global ecosystem health impact (Potentially Disappeared Fraction of Species) in 2000, based on the life cycle impact method ReCiPe – Hierarchic perspective
Note: Derived from (Goedkoop et al. 2008; Wegener Sleeswijk et al. 2008). Impacts on ecosystem quality included in these studies relate to the emissions of greenhouse gases, chemical emissions, land occupation, land transformation, eutrophying and acidifying emissions.
26
and occupation and climate change appear to be the most important determinants of ecosystem health impacts (see Figure 2.2). Land transformation involves a change in land use, e.g. deforestation or paving over agricultural land, while land occupation means keeping land from recovering to its natural state, e.g. through continued agriculture. As shown in Annex I to the present report, trans-formation of tropical forest, occupation by arable land and emissions of the greenhouse gases carbon dioxide, nitrous oxide and methane appear to have the greatest impact at the global scale. Impacts on ecosystem quality considered in the present study relate to emissions of greenhouse gases and chemicals, land occupation, land transforma-tion, eutrophying and acidifying emissions.
2.3 Human health2.3.1 Observed impactsThe impact of emissions, other environmental pressures and resource competition on human health is an important area of concern for individuals in many countries. The connection between environmental issues and human health, however, is complex and sometimes
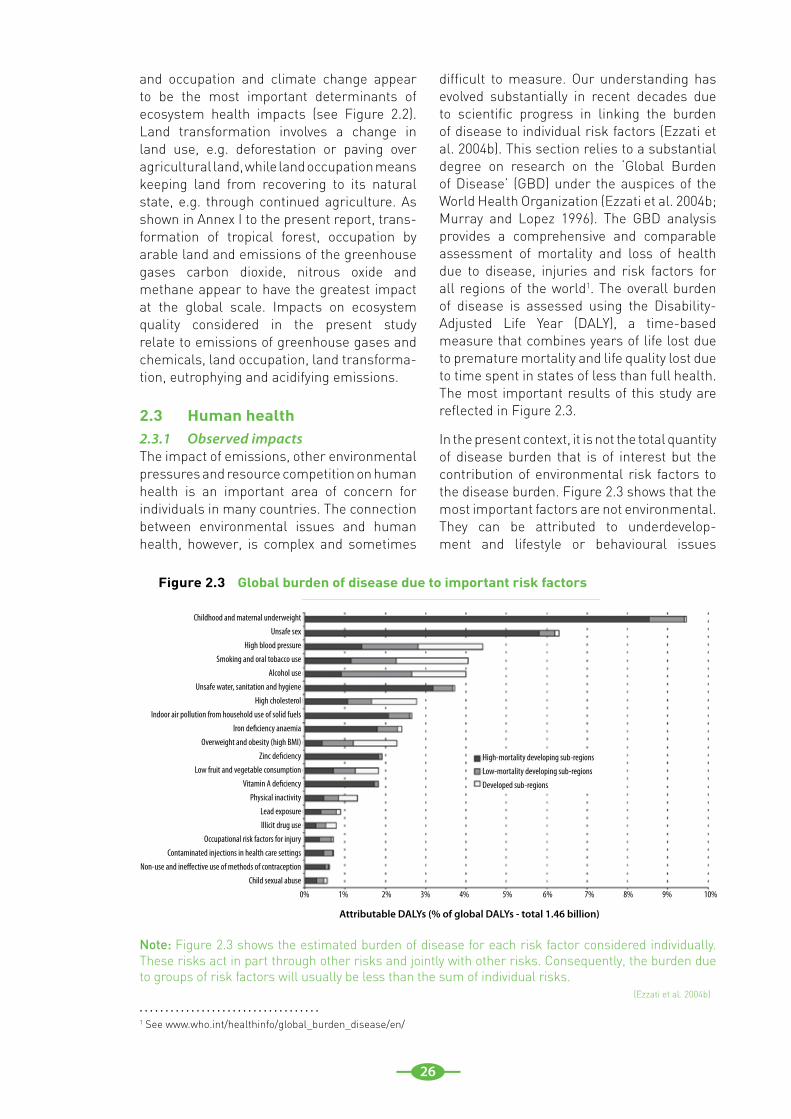
difficult to measure. Our understanding has evolved substantially in recent decades due to scientific progress in linking the burden of disease to individual risk factors (Ezzati et al. 2004b). This section relies to a substantial degree on research on the ‘Global Burden of Disease’ (GBD) under the auspices of the World Health Organization (Ezzati et al. 2004b; Murray and Lopez 1996). The GBD analysis provides a comprehensive and comparable assessment of mortality and loss of health due to disease, injuries and risk factors for all regions of the world1. The overall burden of disease is assessed using the Disability-Adjusted Life Year (DALY), a time-based measure that combines years of life lost due to premature mortality and life quality lost due to time spent in states of less than full health. The most important results of this study are reflected in Figure 2.3.
In the present context, it is not the total quantity of disease burden that is of interest but the contribution of environmental risk factors to the disease burden. Figure 2.3 shows that the most important factors are not environmental. They can be attributed to underdevelop-ment and lifestyle or behavioural issues
Figure 2.3 Global burden of disease due to important risk factors
Note: Figure 2.3 shows the estimated burden of disease for each risk factor considered individually. These risks act in part through other risks and jointly with other risks. Consequently, the burden due to groups of risk factors will usually be less than the sum of individual risks.
Childhood and maternal underweight
Unsafe sex
High blood pressure
Smoking and oral tobacco use
Alcohol use
Unsafe water, sanitation and hygiene
High cholesterol
Indoor air pollution from household use of solid fuels
Iron deficiency anaemia
Overweight and obesity (high BMI)
Zinc deficiency
Low fruit and vegetable consumption
Vitamin A deficiency
Physical inactivity
Lead exposure
Illicit drug use
Occupational risk factors for injury
Contaminated injections in health care settings
Non-use and ineffective use of methods of contraception
Child sexual abuse
High-mortality developing sub-regions
Low-mortality developing sub-regions
Developed sub-regions
0% 1% 2% 3% 4% 5% 6% 7% 8% 9% 10%
Attributable DALYs (% of global DALYs - total 1.46 billion)
1 See www.who.int/healthinfo/global_burden_disease/en/
. . . . . . . . . . . . . . . . . . . . . . . . . . . . . . . . . . .(Ezzati et al. 2004b)
27
(Ezzati et al. 2004a). Childhood and maternal underweight and the deficiency of iron, zinc and vitamin A contribute almost 16% to the global disease burden (Figure 2.3). Unsafe sex is the most important behavioural risk factor – mostly due to AIDS, which contributes 6% to the burden of disease, slightly more than smoking and oral tobacco use (4%), and alcohol use (4%). Excess weight and obesity (2.3%) and lack of physical activity (1.3%) are important behavioural factors that are more prevalent in developed countries, while low fruit and vegetable consumption (1.8%) affects all societies. High blood pressure (4%) and high cholesterol levels (3%) are also listed as factors that are related to nutrition and physical activity.
Having said this, environmental health risk factors still have a significant contribution to the global burden of disease. Unsafe water, sanitation and hygiene contribute 3.7% to the global burden of disease. Mortality from diarrhoea has recently been reduced through successful treatment efforts. Indoor air pollution from household use of solid fuels contributes 2.7%. These fuels, such as wood, dung, charcoal and coal, are used in open fires or poorly designed stoves and produce extremely high particulate matter concentrations, which give rise to respiratory system infections predominantly in women and children.
Other factors are lead exposure (0.9%) and urban air pollution (0.4%). Climate change (0.4%) and occupational exposure to particulates (0.3%) and carcinogens (0.06%) also have quantifiable health impacts (Ezzati et al. 2004a).
The health risks of other environmental factors, from water toxicants to radioactivity, are smaller than those listed above.
The overall conclusion seems that underdevel-opment, followed by lifestyle and behavioural factors have the highest contributions to the global burden of disease. Environmental factors are still significant, but are mainly caused by unsafe water, sanitation and hygiene and indoor air pollution from solid fuels used in households. These environmental factors are mainly relevant in high mortality developing countries. Environmental factors in narrow sense (e.g., exposure to emissions of toxic substances) have relatively limited contribution to the global burden of disease. One should be cautious in neglecting those factors, however, as the WHO assessment understandably includes only risk factors that have been proven to impact human health. For many environmental health risks, the causal connection is contested and difficult to prove because the resulting impacts are too small or too uniformly distributed to be detected in epidemiological studies. The importance of particulate matter in indoor and outdoor air
Climate Change
Stratospheric Ozone Depletion
Forest Clearance and Land Cover Change
Land Degradation and Desertification
Wetlands Loss and Damage
Biodiversity Loss
Freshwater Depletion and Contamination
Urbanisation and its Impacts
Damage to Coastal Reefs and Ecosystems
1. Direct health impactsFloods, heatwaves, water shortage, landslides, increased exposure to ultraviolet radiation, exposure to pollutants
2. ‘Ecosystem-mediated’ health impactsAltered infectious diseases risk, reduced food yields (malnutrition, stunting), depletion of natural medicines, mental health (personal, community), impacts of aesthetic / cultural impoverishment
3. Indirect, deferred, and displaced health impactsDiverse health consequences of livelihood loss, population displacement (including slum dwelling), conflict, inappropriate adaptation and mitigation
Escalating human
pressure on the global environment
Environmental changes and ecosystem impairment
Examples of health impacts
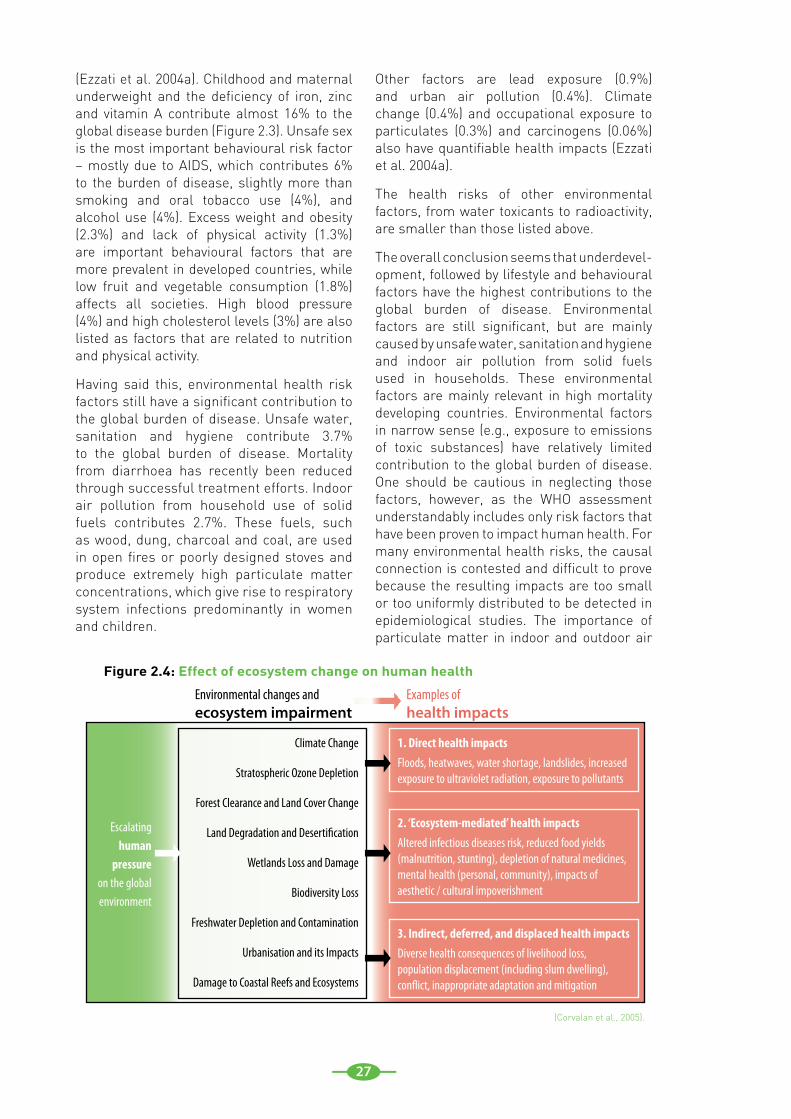
Figure 2.4: Effect of ecosystem change on human health
(Corvalan et al., 2005).
28
has only been recognized as an important risk factor over the last two decades. New causal connections may be proven, changing our picture of the environmental contribution to the burden of disease.
There is some overlap between the environ-mental impacts in the Global Burden of Disease work and the health impacts evaluated under the Millennium Ecosystem Assessment. The MA takes a wider view of the connection between environment and human well-being (Corvalan et al. 2005). Under direct health impacts, it includes pollution and climate change impacts but also floods, heat waves, water shortage and other ‘natural’ disasters. Under ‘ecosystem-mediated’ health impacts, it addresses changes in infectious disease risks, reduced food yields and impacts of aesthetic or cultural impover-ishment. It points out that ecosystem changes lead to the loss of ecosystem services, which again leads to the displacement of people due to losses of livelihoods, conflicts and catastrophes. Some of these issues have been investigated in the climate change section of the GBD work, which indicates a significant expected increase of these disease burdens from climate change until 2030 (McMichael et al. 2004). The MA, on the other hand, also includes impacts due to land degradation, wetland and biodiversity loss and land cover change but does not quantify these impacts. The MA thus serves as an indication of potential human health impacts arising from ecosystem changes, especially due to land use change, climate change and water shortages, which would be quantified as effects of poverty and underdevelopment in the GBD work.
2.3.2 Attempts to quantify relations between impacts and pressuresIn addition to the insights derived from the GBD and MA, studies have been done that rank environmental pressures of the global economy, such as emissions, on their contribution to impacts on human health (Goedkoop et al. 2008; Wegener Sleeswijk et al. 2008). These studies assess the cumulative impact resulting from the total pressure in the year 2000. The results should be interpreted as an indication of the human health impact of global emissions over time. This approach is inherently different to the WHO GBD or the MA which assess the importance of current and past pressures at the current time. The studies also focus on health impacts due to environmental pressures in a narrow sense,
and do not address the health impacts of behaviour, life styles, lack of access to clean water or sanitation, indoor air pollution, etc.
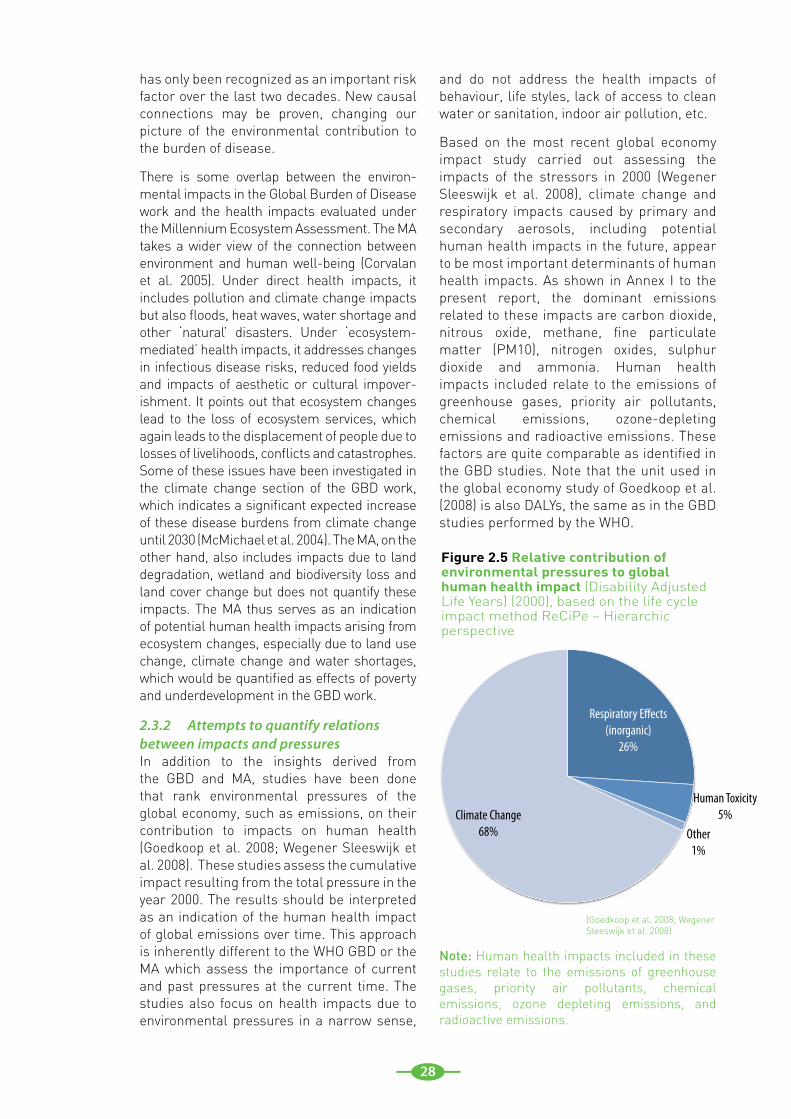
Based on the most recent global economy impact study carried out assessing the impacts of the stressors in 2000 (Wegener Sleeswijk et al. 2008), climate change and respiratory impacts caused by primary and secondary aerosols, including potential human health impacts in the future, appear to be most important determinants of human health impacts. As shown in Annex I to the present report, the dominant emissions related to these impacts are carbon dioxide, nitrous oxide, methane, fine particulate matter (PM10), nitrogen oxides, sulphur dioxide and ammonia. Human health impacts included relate to the emissions of greenhouse gases, priority air pollutants, chemical emissions, ozone-depleting emissions and radioactive emissions. These factors are quite comparable as identified in the GBD studies. Note that the unit used in the global economy study of Goedkoop et al. (2008) is also DALYs, the same as in the GBD studies performed by the WHO.
Respiratory Effects (inorganic)
26%
Human Toxicity 5%
Other 1%
Climate Change 68%
Figure 2.5 Relative contribution of environmental pressures to global human health impact (Disability Adjusted Life Years) (2000), based on the life cycle impact method ReCiPe – Hierarchic perspective
Note: Human health impacts included in these studies relate to the emissions of greenhouse gases, priority air pollutants, chemical emissions, ozone depleting emissions, and radioactive emissions.
(Goedkoop et al. 2008; Wegener Sleeswijk et al. 2008)
29
2.4 Resource provision capability2.4.1 IntroductionOn a finite planet, the supply of food, water, energy, land and materials is limited, which creates competition among uses and users. Environmental resources can be broken up into two broad categories: living (biotic) and non-living (abiotic). Water can be included in the category of abiotic resources, though it is also often seen as a resource class in its own right (e.g. Hoekstra and Chapagan, 2008; Wegener Sleeswijk et al., 2008; Goedkoop et al., 2008; Pfister et al. 2009). The same applies for land use (Wegener Sleeswijk et al., 2008, Goedkoop et al., 2008).
Living resources, such as agricultural crops, timber and fish, are parts of ecosystems: the collections of plants, animals and micro-organisms interacting with each other and with their non-living environment. No species of plant or animal exists independently of the ecosystem within which it is found; hence most approaches to managing living resources are increasingly taking account of the entire ecosystem.
Non-living resources include water, minerals, sunshine, wind, and other systems that can be either renewable when properly managed (for example, water), intrinsically renewable (for example, energy from the sun), recycled (such as some minerals), or non-renewable and non-recyclable (such as fossil fuels that are burned as they are used). Resource scarcity and environmental impacts can affect each of these types of resources somewhat differently.
Resource scarcity and competition is not always seen as a true ‘environmental impact’. Yet, it is obvious that the global economy depends on resource inputs extracted from the environment. Box 2 1 shows the relevance of this topic for the Resource Panel, and how this section in this report on resources relates to other work of the Resource Panel. The following sections will discuss in more detail the relevance of depletion and scarcity of both types of resources, with abiotic resources discussed in Section 2.4.2 and biotic resources discussed in Section 2.4.3. Water use and land use is not further discussed in detail. Many studies have however made it obvious that here resource availability problems are already present (water, see e.g. Hoekstra and Chapagain, 2008) or probable in future (land; see e.g. UNEP, 2009).
2.4.2 Abiotic resourcesAbiotic resources such as fossil energy resources, metals and non-metal minerals cannot regenerate by themselves. Therefore, they are often called non-renewable resources. The potential scarcity of these resources and competition over their use has caused controversy for more than a century. Easy access to these resources is often seen as a precondition for economic development.
The fundamental concern about resource availability is that humankind is dependent on a range of different resources that are in limited supply. This concern is itself based on several factors. First, materials get used up as a result of their consumption by humans. Fossil fuels are oxidized and hence robbed of
Box 2-1 Relation of this section with other work of the Resource Panel
The question of resource scarcity and competition is of fundamental importance for the Resource Panel and was prominently mentioned in the process founding the Resource Panel. It is not the primary task of the Working Group on the Environmental Impacts of Products and Materials to address abiotic resource issues on behalf of the Resource Panel. Rather, the Resource Panel itself needs to address these issues and the Working Group on Metals will look at metal scarcity in more detail. The Working Group on the Environmental Impacts of Products and Materials offers a cautious, preliminary discussion of these issues and reviews published environmental assessments of products and materials that include resource scarcity as a criterion. We do so without endorsing the respective perspectives or methods used to evaluate this scarcity.
30
their energy content. Phosphorous and other materials are dispersed during their use. It is not that the atoms are lost from the face of the planet but they become so dilute (e.g., phosphorus in the ocean) or change their chemical form so they can no longer fulfil a required function.
Second, even if we manage to keep resources in use or in an accessible form, the amount of resources available is limited compared to the potential demand of a growing and increasingly affluent society (Andersson and Råde 2002). This concern relates primarily to ’specialty metals‘ such as platinum group metals used as catalysts and in jewellery, some rare earth metals and also base metals such as copper and zinc.
Third, the geographic distribution of minerals and of fossil fuels is very uneven (Nagasaka et al. 2008). Resource access is therefore politically sensitive and security of supply is a concern.
In general, the availability of physical resources limits the physical scale of human activities, both in terms of the human population itself (Malthus 1798) and in terms of human material possessions and their turnover. The
fact that we are using non-renewable resource deposits such as fossil fuels (Jevons 1965; Deffeyes 2001) or high-grade ores has been a cause for significant concern and scenarios of future collapse of industrial production (Meadows et al. 1974; Turner 2008).
Such concerns are not shared by all. Economists, academic experts in ’the allocation of scarce resources’, have predominantly argued that scarcity does not present a fundamental problem to our society and is not expected to do so for the foreseeable future (Barnett and Morse 1963; Smith 1979; Simpson et al. 2005). On a theoretical basis, economists have argued that scarcity would manifest itself in higher prices, to which the economy would react by using less of the scarce resource and substituting to more abundant resources. Scarcity can be seen as a driver of innovation, leading to the development of technologies (and organizational forms) that use scarce resources more efficiently (Ayres 2002).
Empirically, economists have analysed the real price of resources and argued that its decrease over time implies that there is no scarcity (Barnett and Morse 1963; Krautkraemer 2005). If there were scarcity, it would lead to an increasing price of the resources, because
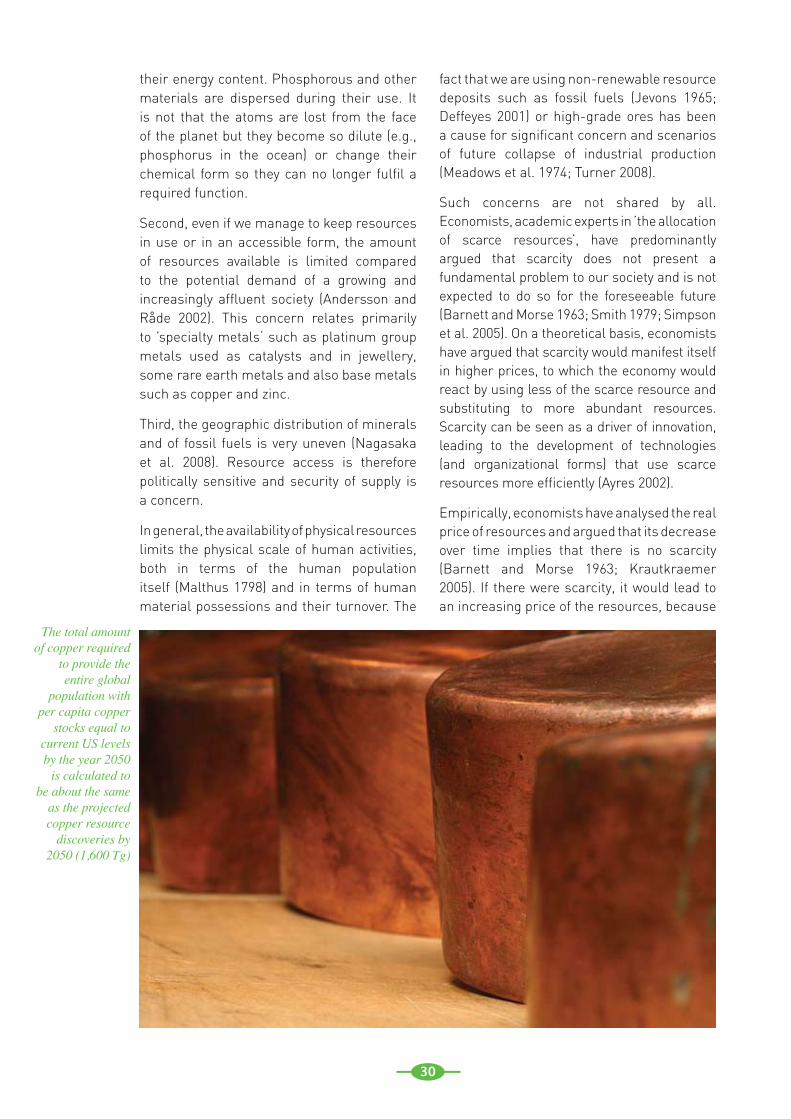
The total amount of copper required
to provide the entire global
population with per capita copper
stocks equal to current US levels by the year 2050
is calculated to be about the same
as the projected copper resource
discoveries by 2050 (1,600 Tg)
31
scarcity rents should increase at the interest rate for resource owners to be indifferent to keeping resources in the ground or extracting them (Hotelling 1931). Some would see the argument of Barnett and Morse as circular, as information on the scarcity of resources is deduced from the behaviour of market actors that would result if these actors knew whether resources were scarce (Norgaard 1995). In addition, for most resources, scarcity rents are small compared to the cost of extraction and processing, so that price developments over time probably reflect production cost more than rents (Norgaard and Leu 1986). Present market prices cannot serve as a proof or disproof of future scarcity.
One example of a relevant, controversial discussion of resource limitations was triggered by the analysis of copper as it resides in ores, current stocks and waste (Gordon et al. 2006). This analysis investigated the current in-use stock of copper in the United States of America. This was used as a basis to calculate the total amount of copper that would be required to provide the entire global population with per capita copper stocks equal to current US levels by the year 2050. The resulting copper requirement, 1,700 Teragram (Tg; equal to million metric tons), was about the same as the projected copper resource discovered by 2050 (1,600 Tg).
Tilton and Lagos (2007) argue that the Earth’s crust contains ‘prodigious amounts of copper’ and that lower quality copper will become more economical to extract as prices increase and improved technology lowers the cost of mining, milling and smelting. Constant adjustments in the estimated reserve size indicate the role of technological progress, which will only accelerate. In their response, Gordon et al. (2007) point to the common acceptance of a hypothesized bimodal distribution of ore grades, with only a small fraction of the total metal available at higher concentrations. It is commonly accepted that the so-called mineralogical barrier separates the smaller amount at higher concentrations in easily accessible mineral form and the larger amount of metal at lower concentrations in more tightly bound mineral form (Skinner 1979). Gordon et
al. (2007) also indicate that the technological efficiency of the copper production equipment is approaching the thermodynamic limit, indicating reduced opportunities for technological advances in copper production. In addition, they point to the costs of production in terms of water use, energy requirements, and pollution which increases in proportion to the amount of ore processed. Using low-grade ore, even if technically possible, would hence hardly be acceptable.
The limited availability of conventional oil and gas reserves is widely accepted but the total amount of fossil energy stored is vast and technological progress makes more of it accessible. Climate concerns will prevent us from utilizing much of this energy or will force us to use expensive technology to capture and store the resulting carbon dioxide underground (IPCC 2005). More expensive energy and competition over land and water limit our ability to mine, process and recycle minerals (Skinner 1979). Simpson et al. (2005) have called this limitation to resource access ’type II’ resource scarcity, reflecting a scarcity of pollution absorption capacity that aggravates ’type I’ resource scarcity – the limited availability of minerals and fossil fuels.
A study published by the National Institute for Materials Science in Japan for UNEP (Nagasaka et al. 2008) summarizes the global flow of metals and a number of other compounds such as phosphorus. The geographic distributions of current supply and demand are contrasted. For a number of minerals, the three largest producing countries mine more than 50% of the global production. Scarcities are predicted based on static resource depletion times by dividing reserve base estimates by current annual extraction rates. Reserves are known amounts of resources in the ground accessible at today’s prices and with today’s technology. The reserve base also includes the accessible amount estimated to exist in yet undiscovered deposits, while the resources and resource base also include material that cannot be extracted profitably given today’s technology. Buchert et al. (2008) review in another UNEP study metals for four specific applications:
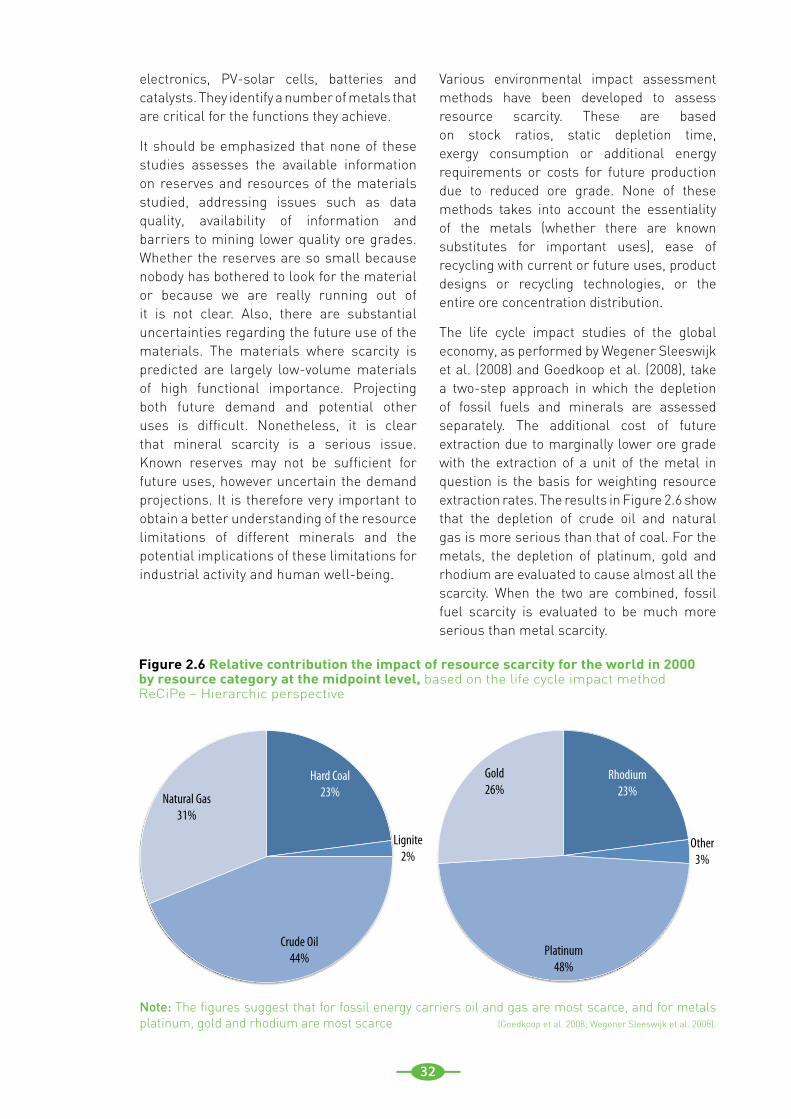
32
electronics, PV-solar cells, batteries and catalysts. They identify a number of metals that are critical for the functions they achieve.
It should be emphasized that none of these studies assesses the available information on reserves and resources of the materials studied, addressing issues such as data quality, availability of information and barriers to mining lower quality ore grades. Whether the reserves are so small because nobody has bothered to look for the material or because we are really running out of it is not clear. Also, there are substantial uncertainties regarding the future use of the materials. The materials where scarcity is predicted are largely low-volume materials of high functional importance. Projecting both future demand and potential other uses is difficult. Nonetheless, it is clear that mineral scarcity is a serious issue. Known reserves may not be sufficient for future uses, however uncertain the demand projections. It is therefore very important to obtain a better understanding of the resource limitations of different minerals and the potential implications of these limitations for industrial activity and human well-being.
Various environmental impact assessment methods have been developed to assess resource scarcity. These are based on stock ratios, static depletion time, exergy consumption or additional energy requirements or costs for future production due to reduced ore grade. None of these methods takes into account the essentiality of the metals (whether there are known substitutes for important uses), ease of recycling with current or future uses, product designs or recycling technologies, or the entire ore concentration distribution.
The life cycle impact studies of the global economy, as performed by Wegener Sleeswijk et al. (2008) and Goedkoop et al. (2008), take a two-step approach in which the depletion of fossil fuels and minerals are assessed separately. The additional cost of future extraction due to marginally lower ore grade with the extraction of a unit of the metal in question is the basis for weighting resource extraction rates. The results in Figure 2.6 show that the depletion of crude oil and natural gas is more serious than that of coal. For the metals, the depletion of platinum, gold and rhodium are evaluated to cause almost all the scarcity. When the two are combined, fossil fuel scarcity is evaluated to be much more serious than metal scarcity.
Hard Coal 23%
Lignite 2%
Crude Oil 44%
Natural Gas 31%
Rhodium 23%
Other 3%
Platinum 48%
Gold 26%
Figure 2.6 Relative contribution the impact of resource scarcity for the world in 2000 by resource category at the midpoint level, based on the life cycle impact method ReCiPe – Hierarchic perspective
Note: The figures suggest that for fossil energy carriers oil and gas are most scarce, and for metals platinum, gold and rhodium are most scarce (Goedkoop et al. 2008; Wegener Sleeswijk et al. 2008).
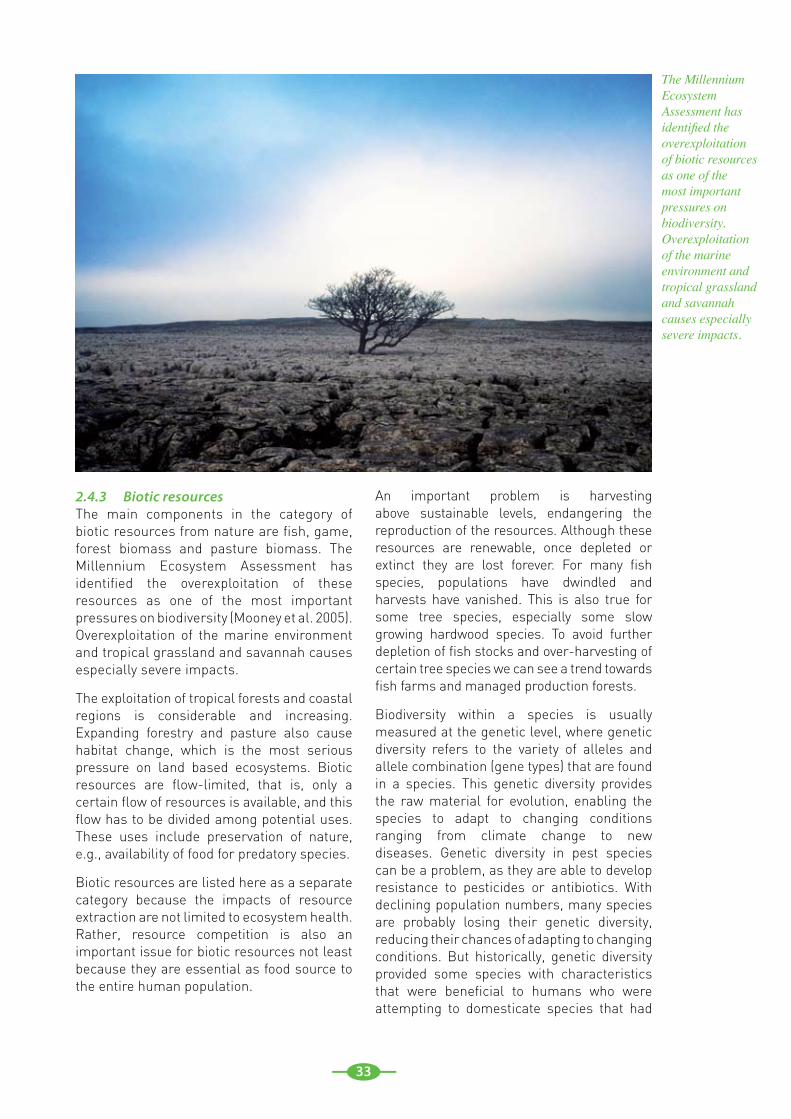
33
2.4.3 Biotic resources The main components in the category of biotic resources from nature are fish, game, forest biomass and pasture biomass. The Millennium Ecosystem Assessment has identified the overexploitation of these resources as one of the most important pressures on biodiversity (Mooney et al. 2005). Overexploitation of the marine environment and tropical grassland and savannah causes especially severe impacts.
The exploitation of tropical forests and coastal regions is considerable and increasing. Expanding forestry and pasture also cause habitat change, which is the most serious pressure on land based ecosystems. Biotic resources are flow-limited, that is, only a certain flow of resources is available, and this flow has to be divided among potential uses. These uses include preservation of nature, e.g., availability of food for predatory species.
Biotic resources are listed here as a separate category because the impacts of resource extraction are not limited to ecosystem health. Rather, resource competition is also an important issue for biotic resources not least because they are essential as food source to the entire human population.
An important problem is harvesting above sustainable levels, endangering the reproduction of the resources. Although these resources are renewable, once depleted or extinct they are lost forever. For many fish species, populations have dwindled and harvests have vanished. This is also true for some tree species, especially some slow growing hardwood species. To avoid further depletion of fish stocks and over-harvesting of certain tree species we can see a trend towards fish farms and managed production forests.
Biodiversity within a species is usually measured at the genetic level, where genetic diversity refers to the variety of alleles and allele combination (gene types) that are found in a species. This genetic diversity provides the raw material for evolution, enabling the species to adapt to changing conditions ranging from climate change to new diseases. Genetic diversity in pest species can be a problem, as they are able to develop resistance to pesticides or antibiotics. With declining population numbers, many species are probably losing their genetic diversity, reducing their chances of adapting to changing conditions. But historically, genetic diversity provided some species with characteristics that were beneficial to humans who were attempting to domesticate species that had
The Millennium Ecosystem Assessment has identified the overexploitation of biotic resources as one of the most important pressures on biodiversity. Overexploitation of the marine environment and tropical grassland and savannah causes especially severe impacts.
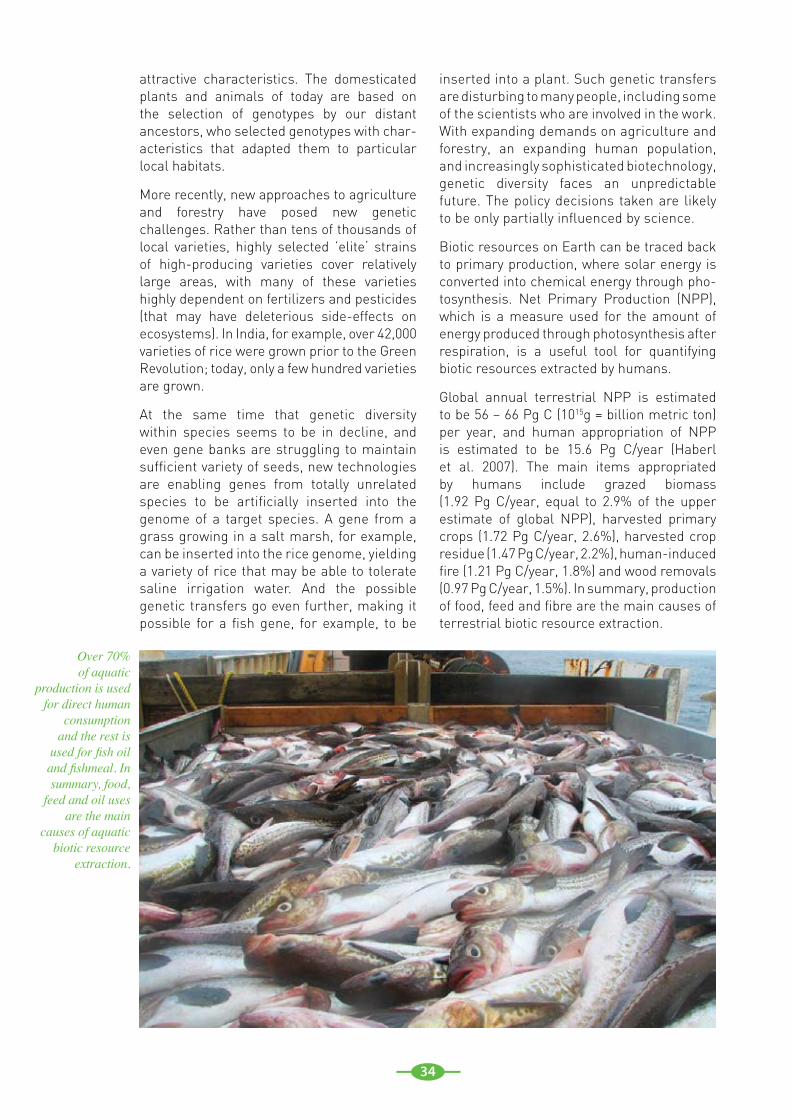
34
attractive characteristics. The domesticated plants and animals of today are based on the selection of genotypes by our distant ancestors, who selected genotypes with char-acteristics that adapted them to particular local habitats.
More recently, new approaches to agriculture and forestry have posed new genetic challenges. Rather than tens of thousands of local varieties, highly selected ’elite‘ strains of high-producing varieties cover relatively large areas, with many of these varieties highly dependent on fertilizers and pesticides (that may have deleterious side-effects on ecosystems). In India, for example, over 42,000 varieties of rice were grown prior to the Green Revolution; today, only a few hundred varieties are grown.
At the same time that genetic diversity within species seems to be in decline, and even gene banks are struggling to maintain sufficient variety of seeds, new technologies are enabling genes from totally unrelated species to be artificially inserted into the genome of a target species. A gene from a grass growing in a salt marsh, for example, can be inserted into the rice genome, yielding a variety of rice that may be able to tolerate saline irrigation water. And the possible genetic transfers go even further, making it possible for a fish gene, for example, to be
inserted into a plant. Such genetic transfers are disturbing to many people, including some of the scientists who are involved in the work. With expanding demands on agriculture and forestry, an expanding human population, and increasingly sophisticated biotechnology, genetic diversity faces an unpredictable future. The policy decisions taken are likely to be only partially influenced by science.
Biotic resources on Earth can be traced back to primary production, where solar energy is converted into chemical energy through pho-tosynthesis. Net Primary Production (NPP), which is a measure used for the amount of energy produced through photosynthesis after respiration, is a useful tool for quantifying biotic resources extracted by humans.
Global annual terrestrial NPP is estimated to be 56 – 66 Pg C (1015g = billion metric ton) per year, and human appropriation of NPP is estimated to be 15.6 Pg C/year (Haberl et al. 2007). The main items appropriated by humans include grazed biomass (1.92 Pg C/year, equal to 2.9% of the upper estimate of global NPP), harvested primary crops (1.72 Pg C/year, 2.6%), harvested crop residue (1.47 Pg C/year, 2.2%), human-induced fire (1.21 Pg C/year, 1.8%) and wood removals (0.97 Pg C/year, 1.5%). In summary, production of food, feed and fibre are the main causes of terrestrial biotic resource extraction.
Over 70% of aquatic
production is used for direct human
consumption and the rest is
used for fish oil and fishmeal. In summary, food,
feed and oil uses are the main
causes of aquatic biotic resource
extraction.
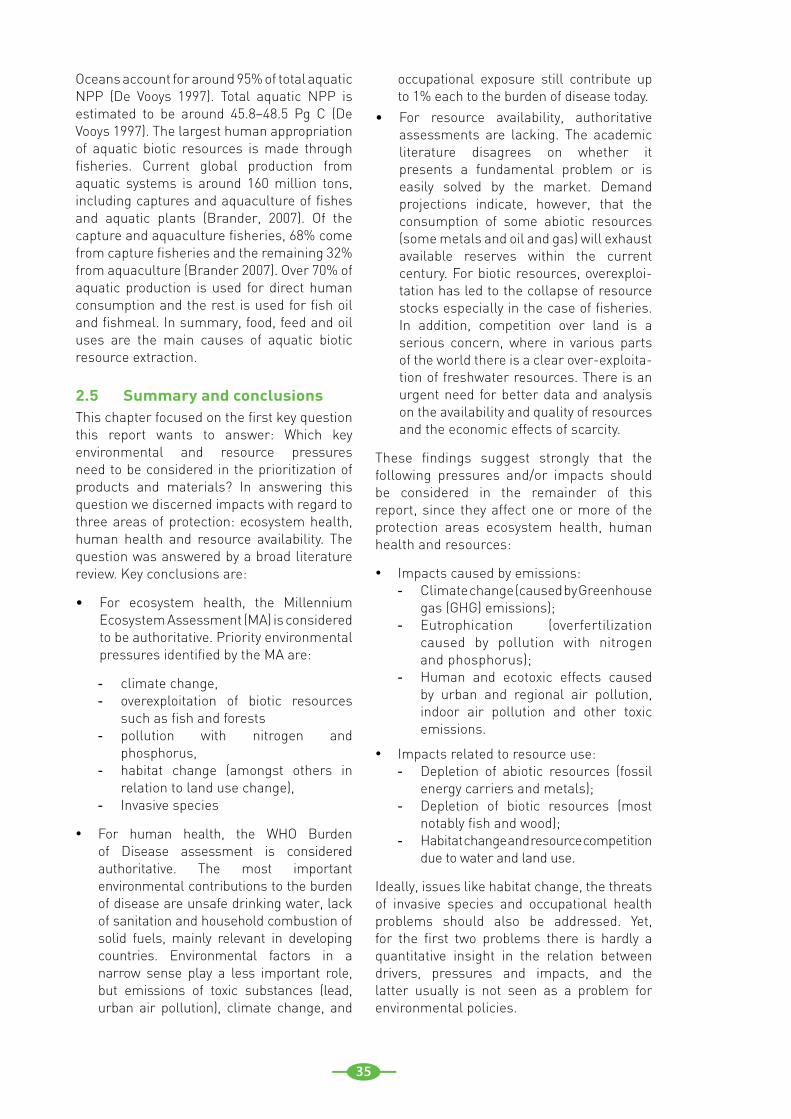
35
Oceans account for around 95% of total aquatic NPP (De Vooys 1997). Total aquatic NPP is estimated to be around 45.8–48.5 Pg C (De Vooys 1997). The largest human appropriation of aquatic biotic resources is made through fisheries. Current global production from aquatic systems is around 160 million tons, including captures and aquaculture of fishes and aquatic plants (Brander, 2007). Of the capture and aquaculture fisheries, 68% come from capture fisheries and the remaining 32% from aquaculture (Brander 2007). Over 70% of aquatic production is used for direct human consumption and the rest is used for fish oil and fishmeal. In summary, food, feed and oil uses are the main causes of aquatic biotic resource extraction.
2.5 Summary and conclusionsThis chapter focused on the first key question this report wants to answer: Which key environmental and resource pressures need to be considered in the prioritization of products and materials? In answering this question we discerned impacts with regard to three areas of protection: ecosystem health, human health and resource availability. The question was answered by a broad literature review. Key conclusions are:
For ecosystem health, the Millennium •Ecosystem Assessment (MA) is considered to be authoritative. Priority environmental pressures identified by the MA are:
climate change, - overexploitation of biotic resources -such as fish and forests pollution with nitrogen and -phosphorus, habitat change (amongst others in -relation to land use change), Invasive species -
For human health, the WHO Burden •of Disease assessment is considered authoritative. The most important environmental contributions to the burden of disease are unsafe drinking water, lack of sanitation and household combustion of solid fuels, mainly relevant in developing countries. Environmental factors in a narrow sense play a less important role, but emissions of toxic substances (lead, urban air pollution), climate change, and
occupational exposure still contribute up to 1% each to the burden of disease today.For resource availability, authoritative •assessments are lacking. The academic literature disagrees on whether it presents a fundamental problem or is easily solved by the market. Demand projections indicate, however, that the consumption of some abiotic resources (some metals and oil and gas) will exhaust available reserves within the current century. For biotic resources, overexploi-tation has led to the collapse of resource stocks especially in the case of fisheries. In addition, competition over land is a serious concern, where in various parts of the world there is a clear over-exploita-tion of freshwater resources. There is an urgent need for better data and analysis on the availability and quality of resources and the economic effects of scarcity.
These findings suggest strongly that the following pressures and/or impacts should be considered in the remainder of this report, since they affect one or more of the protection areas ecosystem health, human health and resources:
Impacts caused by emissions:•Climate change (caused by Greenhouse -gas (GHG) emissions);Eutrophication (overfertilization -caused by pollution with nitrogen and phosphorus);Human and ecotoxic effects caused -by urban and regional air pollution, indoor air pollution and other toxic emissions.
Impacts related to resource use:•Depletion of abiotic resources (fossil -energy carriers and metals);Depletion of biotic resources (most -notably fish and wood);Habitat change and resource competition -due to water and land use.
Ideally, issues like habitat change, the threats of invasive species and occupational health problems should also be addressed. Yet, for the first two problems there is hardly a quantitative insight in the relation between drivers, pressures and impacts, and the latter usually is not seen as a problem for environmental policies.
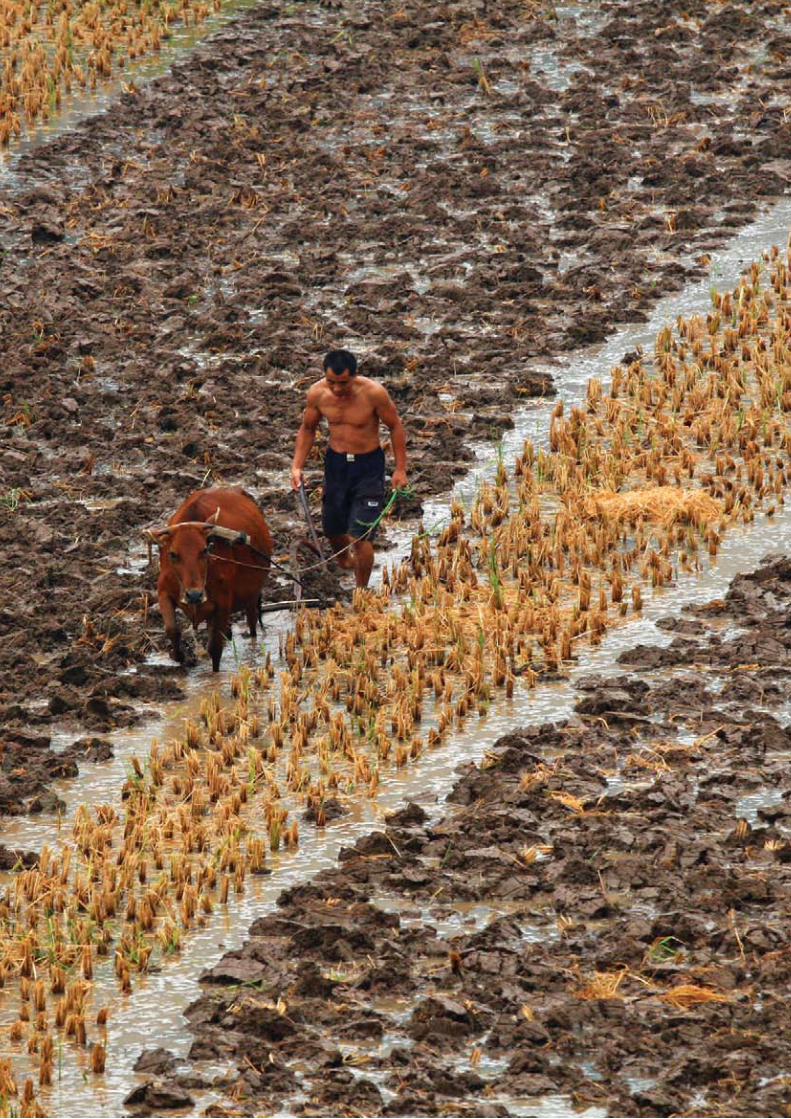
36
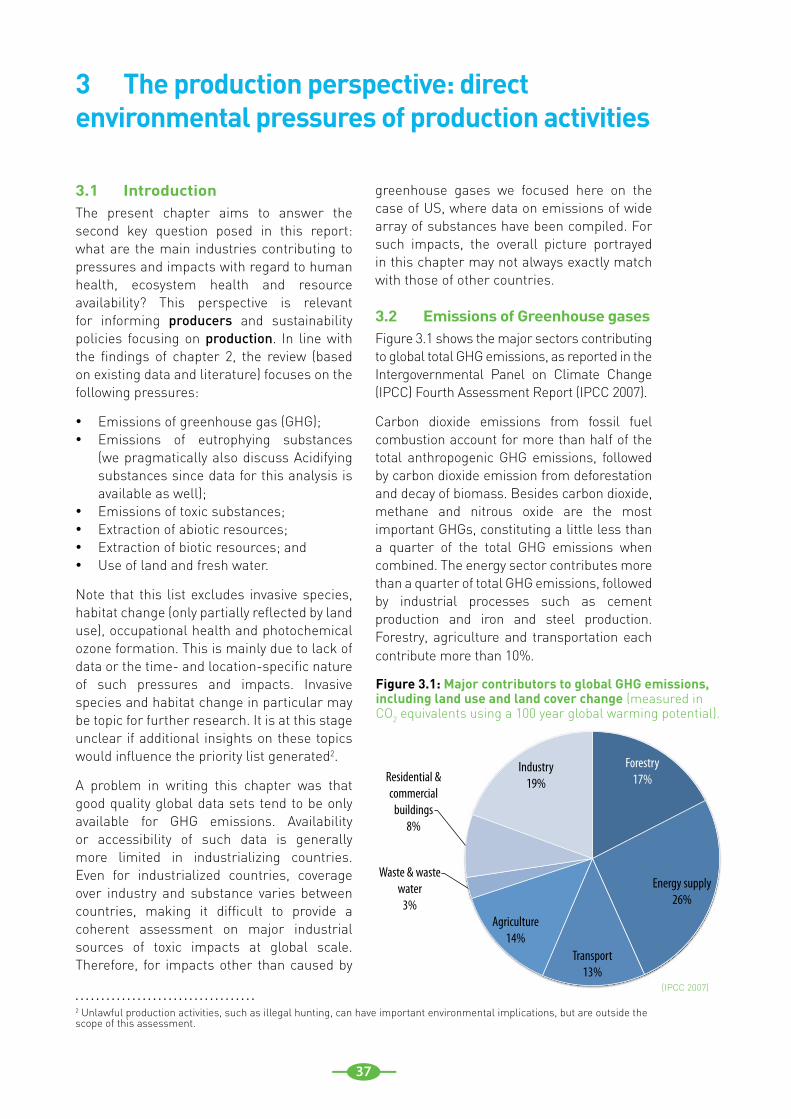
37
3.1 IntroductionThe present chapter aims to answer the second key question posed in this report: what are the main industries contributing to pressures and impacts with regard to human health, ecosystem health and resource availability? This perspective is relevant for informing producers and sustainability policies focusing on production. In line with the findings of chapter 2, the review (based on existing data and literature) focuses on the following pressures:
Emissions of greenhouse gas (GHG); •Emissions of eutrophying substances •(we pragmatically also discuss Acidifying substances since data for this analysis is available as well); Emissions of toxic substances;• Extraction of abiotic resources; • Extraction of biotic resources; and • Use of land and fresh water. •
Note that this list excludes invasive species, habitat change (only partially reflected by land use), occupational health and photochemical ozone formation. This is mainly due to lack of data or the time- and location-specific nature of such pressures and impacts. Invasive species and habitat change in particular may be topic for further research. It is at this stage unclear if additional insights on these topics would influence the priority list generated2.
A problem in writing this chapter was that good quality global data sets tend to be only available for GHG emissions. Availability or accessibility of such data is generally more limited in industrializing countries. Even for industrialized countries, coverage over industry and substance varies between countries, making it difficult to provide a coherent assessment on major industrial sources of toxic impacts at global scale. Therefore, for impacts other than caused by
3 The production perspective: direct environmental pressures of production activities
greenhouse gases we focused here on the case of US, where data on emissions of wide array of substances have been compiled. For such impacts, the overall picture portrayed in this chapter may not always exactly match with those of other countries.
3.2 Emissions of Greenhouse gasesFigure 3.1 shows the major sectors contributing to global total GHG emissions, as reported in the Intergovernmental Panel on Climate Change (IPCC) Fourth Assessment Report (IPCC 2007).
Carbon dioxide emissions from fossil fuel combustion account for more than half of the total anthropogenic GHG emissions, followed by carbon dioxide emission from deforestation and decay of biomass. Besides carbon dioxide, methane and nitrous oxide are the most important GHGs, constituting a little less than a quarter of the total GHG emissions when combined. The energy sector contributes more than a quarter of total GHG emissions, followed by industrial processes such as cement production and iron and steel production. Forestry, agriculture and transportation each contribute more than 10%.
Forestry 17%
Energy supply 26%
Transport 13%
Agriculture 14%
Waste & waste water
3%
Residential & commercial
buildings 8%
Industry 19%
Figure 3.1: Major contributors to global GHG emissions, including land use and land cover change (measured in CO2 equivalents using a 100 year global warming potential).
2 Unlawful production activities, such as illegal hunting, can have important environmental implications, but are outside the scope of this assessment.
. . . . . . . . . . . . . . . . . . . . . . . . . . . . . . . . . . .(IPCC 2007)
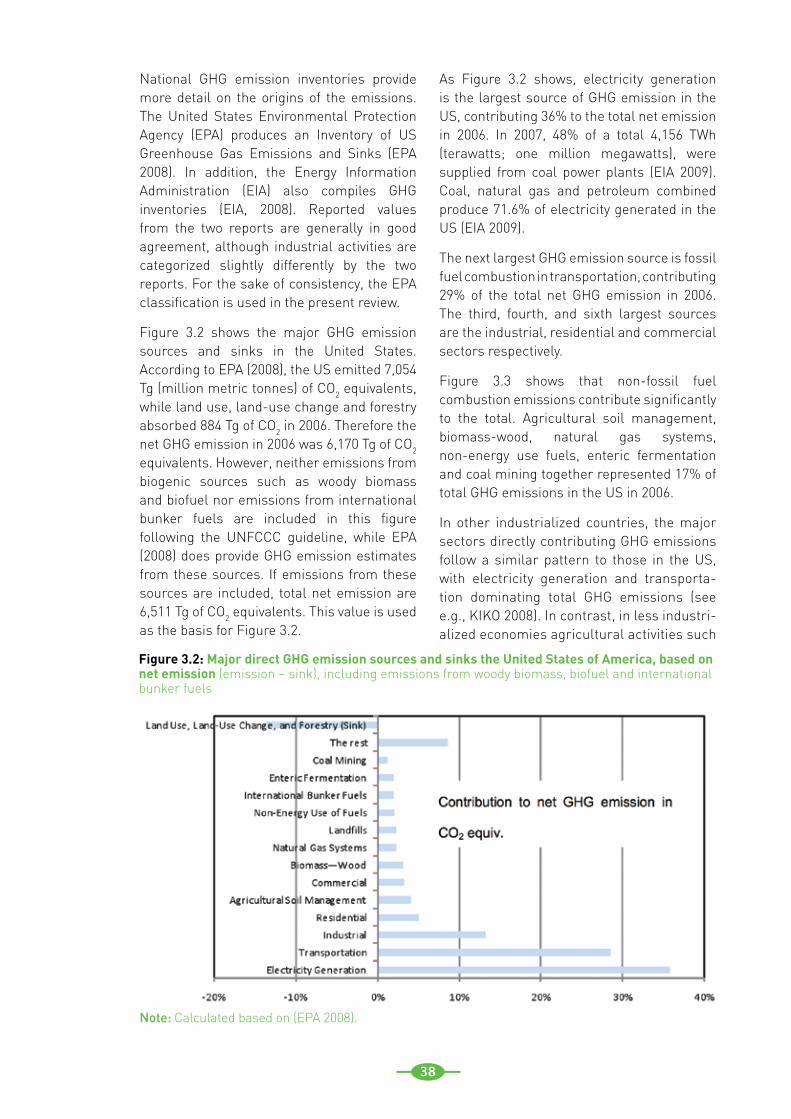
38
National GHG emission inventories provide more detail on the origins of the emissions. The United States Environmental Protection Agency (EPA) produces an Inventory of US Greenhouse Gas Emissions and Sinks (EPA 2008). In addition, the Energy Information Administration (EIA) also compiles GHG inventories (EIA, 2008). Reported values from the two reports are generally in good agreement, although industrial activities are categorized slightly differently by the two reports. For the sake of consistency, the EPA classification is used in the present review.
Figure 3.2 shows the major GHG emission sources and sinks in the United States. According to EPA (2008), the US emitted 7,054 Tg (million metric tonnes) of CO2 equivalents, while land use, land-use change and forestry absorbed 884 Tg of CO2 in 2006. Therefore the net GHG emission in 2006 was 6,170 Tg of CO2 equivalents. However, neither emissions from biogenic sources such as woody biomass and biofuel nor emissions from international bunker fuels are included in this figure following the UNFCCC guideline, while EPA (2008) does provide GHG emission estimates from these sources. If emissions from these sources are included, total net emission are 6,511 Tg of CO2 equivalents. This value is used as the basis for Figure 3.2.
As Figure 3.2 shows, electricity generation is the largest source of GHG emission in the US, contributing 36% to the total net emission in 2006. In 2007, 48% of a total 4,156 TWh (terawatts; one million megawatts), were supplied from coal power plants (EIA 2009). Coal, natural gas and petroleum combined produce 71.6% of electricity generated in the US (EIA 2009).
The next largest GHG emission source is fossil fuel combustion in transportation, contributing 29% of the total net GHG emission in 2006. The third, fourth, and sixth largest sources are the industrial, residential and commercial sectors respectively.
Figure 3.3 shows that non-fossil fuel combustion emissions contribute significantly to the total. Agricultural soil management, biomass-wood, natural gas systems, non-energy use fuels, enteric fermentation and coal mining together represented 17% of total GHG emissions in the US in 2006.
In other industrialized countries, the major sectors directly contributing GHG emissions follow a similar pattern to those in the US, with electricity generation and transporta-tion dominating total GHG emissions (see e.g., KIKO 2008). In contrast, in less industri-alized economies agricultural activities such
Figure 3.2: Major direct GHG emission sources and sinks the United States of America, based on net emission (emission – sink), including emissions from woody biomass, biofuel and international bunker fuels
Note: Calculated based on (EPA 2008).
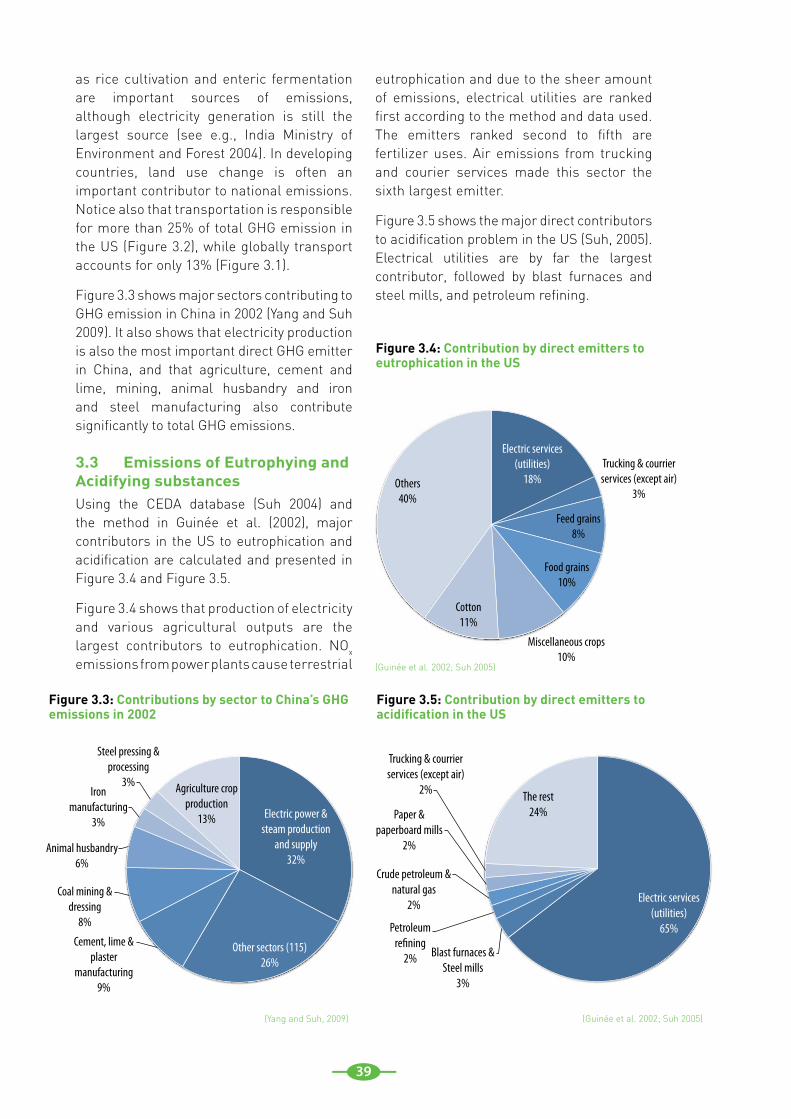
39
as rice cultivation and enteric fermentation are important sources of emissions, although electricity generation is still the largest source (see e.g., India Ministry of Environment and Forest 2004). In developing countries, land use change is often an important contributor to national emissions. Notice also that transportation is responsible for more than 25% of total GHG emission in the US (Figure 3.2), while globally transport accounts for only 13% (Figure 3.1).
Figure 3.3 shows major sectors contributing to GHG emission in China in 2002 (Yang and Suh 2009). It also shows that electricity production is also the most important direct GHG emitter in China, and that agriculture, cement and lime, mining, animal husbandry and iron and steel manufacturing also contribute significantly to total GHG emissions.
3.3 Emissions of Eutrophying and Acidifying substancesUsing the CEDA database (Suh 2004) and the method in Guinée et al. (2002), major contributors in the US to eutrophication and acidification are calculated and presented in Figure 3.4 and Figure 3.5.
Figure 3.4 shows that production of electricity and various agricultural outputs are the largest contributors to eutrophication. NOx emissions from power plants cause terrestrial
eutrophication and due to the sheer amount of emissions, electrical utilities are ranked first according to the method and data used. The emitters ranked second to fifth are fertilizer uses. Air emissions from trucking and courier services made this sector the sixth largest emitter.
Figure 3.5 shows the major direct contributors to acidification problem in the US (Suh, 2005). Electrical utilities are by far the largest contributor, followed by blast furnaces and steel mills, and petroleum refining.
Electric power & steam production
and supply 32%
Other sectors (115) 26%
Cement, lime & plaster
manufacturing 9%
Coal mining & dressing
8%
Animal husbandry 6%
Iron manufacturing
3%
Steel pressing & processing
3% Agriculture crop production
13%
Electric services (utilities)
18% Trucking & courrier services (except air)
3%
Feed grains 8%
Food grains 10%
Miscellaneous crops 10%
Cotton 11%
Others 40%
Electric services (utilities)
65%
Blast furnaces & Steel mills
3%
Petroleum re�ning
2%
Crude petroleum & natural gas
2%
Paper & paperboard mills
2%
Trucking & courrier services (except air)
2% The rest 24%
Figure 3.3: Contributions by sector to China’s GHG emissions in 2002
Figure 3.4: Contribution by direct emitters to eutrophication in the US
Figure 3.5: Contribution by direct emitters to acidification in the US
(Yang and Suh, 2009)
(Guinée et al. 2002; Suh 2005)
(Guinée et al. 2002; Suh 2005)
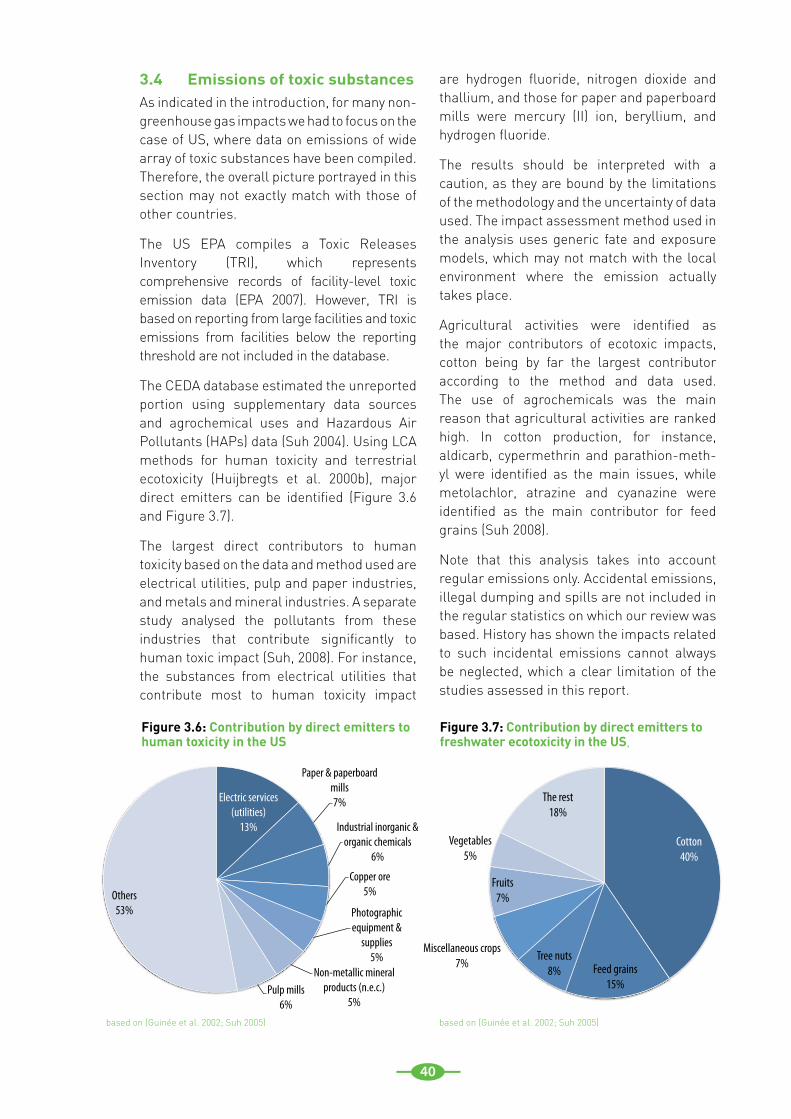
40
3.4 Emissions of toxic substancesAs indicated in the introduction, for many non-greenhouse gas impacts we had to focus on the case of US, where data on emissions of wide array of toxic substances have been compiled. Therefore, the overall picture portrayed in this section may not exactly match with those of other countries.
The US EPA compiles a Toxic Releases Inventory (TRI), which represents comprehensive records of facility-level toxic emission data (EPA 2007). However, TRI is based on reporting from large facilities and toxic emissions from facilities below the reporting threshold are not included in the database.
The CEDA database estimated the unreported portion using supplementary data sources and agrochemical uses and Hazardous Air Pollutants (HAPs) data (Suh 2004). Using LCA methods for human toxicity and terrestrial ecotoxicity (Huijbregts et al. 2000b), major direct emitters can be identified (Figure 3.6 and Figure 3.7).
The largest direct contributors to human toxicity based on the data and method used are electrical utilities, pulp and paper industries, and metals and mineral industries. A separate study analysed the pollutants from these industries that contribute significantly to human toxic impact (Suh, 2008). For instance, the substances from electrical utilities that contribute most to human toxicity impact
are hydrogen fluoride, nitrogen dioxide and thallium, and those for paper and paperboard mills were mercury (II) ion, beryllium, and hydrogen fluoride.
The results should be interpreted with a caution, as they are bound by the limitations of the methodology and the uncertainty of data used. The impact assessment method used in the analysis uses generic fate and exposure models, which may not match with the local environment where the emission actually takes place.
Agricultural activities were identified as the major contributors of ecotoxic impacts, cotton being by far the largest contributor according to the method and data used. The use of agrochemicals was the main reason that agricultural activities are ranked high. In cotton production, for instance, aldicarb, cypermethrin and parathion-meth-yl were identified as the main issues, while metolachlor, atrazine and cyanazine were identified as the main contributor for feed grains (Suh 2008).
Note that this analysis takes into account regular emissions only. Accidental emissions, illegal dumping and spills are not included in the regular statistics on which our review was based. History has shown the impacts related to such incidental emissions cannot always be neglected, which a clear limitation of the studies assessed in this report.
Electric services (utilities)
13%
Paper & paperboard mills 7%
Industrial inorganic & organic chemicals
6%
Copper ore 5%
Photographic equipment &
supplies 5%
Non-metallic mineral products (n.e.c.)
5% Pulp mills
6%
Others 53%
Figure 3.6: Contribution by direct emitters to human toxicity in the US
Figure 3.7: Contribution by direct emitters to freshwater ecotoxicity in the US,
Cotton 40%
Feed grains 15%
Tree nuts 8%
Miscellaneous crops 7%
Fruits 7%
Vegetables 5%
The rest 18%
based on (Guinée et al. 2002; Suh 2005) based on (Guinée et al. 2002; Suh 2005)
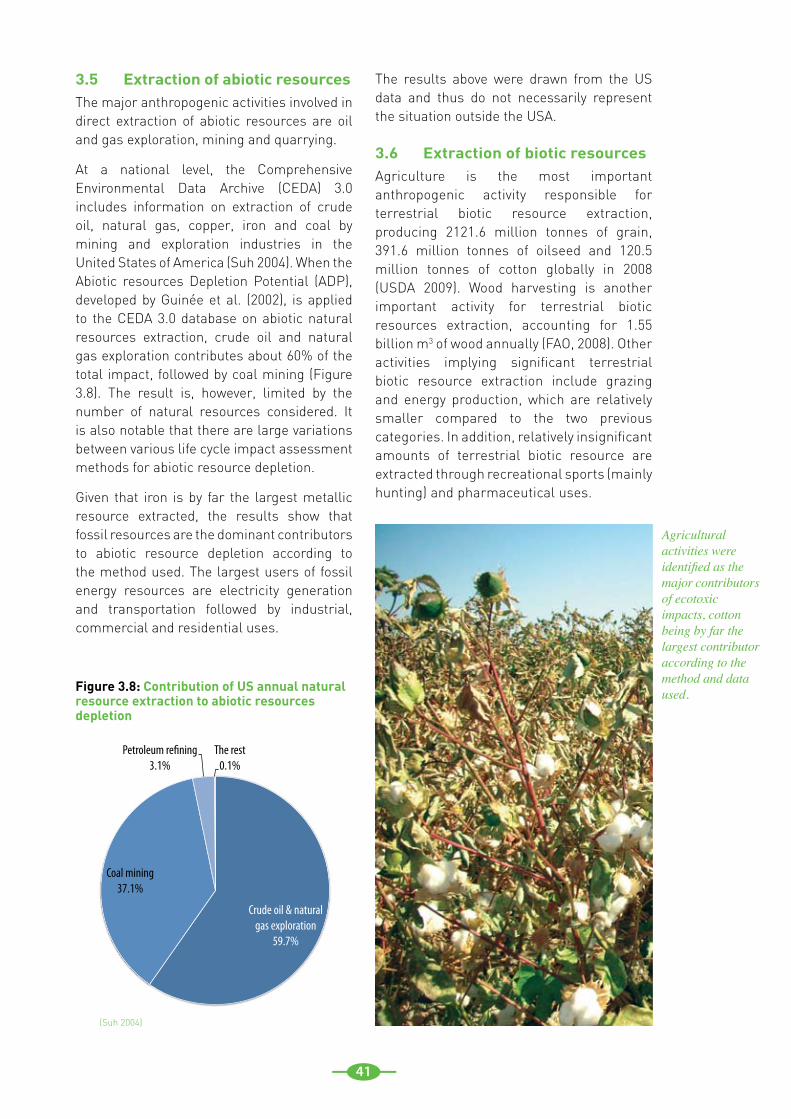
41
3.5 Extraction of abiotic resourcesThe major anthropogenic activities involved in direct extraction of abiotic resources are oil and gas exploration, mining and quarrying.
At a national level, the Comprehensive Environmental Data Archive (CEDA) 3.0 includes information on extraction of crude oil, natural gas, copper, iron and coal by mining and exploration industries in the United States of America (Suh 2004). When the Abiotic resources Depletion Potential (ADP), developed by Guinée et al. (2002), is applied to the CEDA 3.0 database on abiotic natural resources extraction, crude oil and natural gas exploration contributes about 60% of the total impact, followed by coal mining (Figure 3.8). The result is, however, limited by the number of natural resources considered. It is also notable that there are large variations between various life cycle impact assessment methods for abiotic resource depletion.
Given that iron is by far the largest metallic resource extracted, the results show that fossil resources are the dominant contributors to abiotic resource depletion according to the method used. The largest users of fossil energy resources are electricity generation and transportation followed by industrial, commercial and residential uses.
The results above were drawn from the US data and thus do not necessarily represent the situation outside the USA.
3.6 Extraction of biotic resourcesAgriculture is the most important anthropogenic activity responsible for terrestrial biotic resource extraction, producing 2121.6 million tonnes of grain, 391.6 million tonnes of oilseed and 120.5 million tonnes of cotton globally in 2008 (USDA 2009). Wood harvesting is another important activity for terrestrial biotic resources extraction, accounting for 1.55 billion m3 of wood annually (FAO, 2008). Other activities implying significant terrestrial biotic resource extraction include grazing and energy production, which are relatively smaller compared to the two previous categories. In addition, relatively insignificant amounts of terrestrial biotic resource are extracted through recreational sports (mainly hunting) and pharmaceutical uses.
Figure 3.8: Contribution of US annual natural resource extraction to abiotic resources depletion
Crude oil & natural gas exploration
59.7%
Coal mining 37.1%
Petroleum re�ning 3.1%
The rest 0.1%
Agricultural activities were identified as the major contributors of ecotoxic impacts, cotton being by far the largest contributor according to the method and data used.
(Suh 2004)
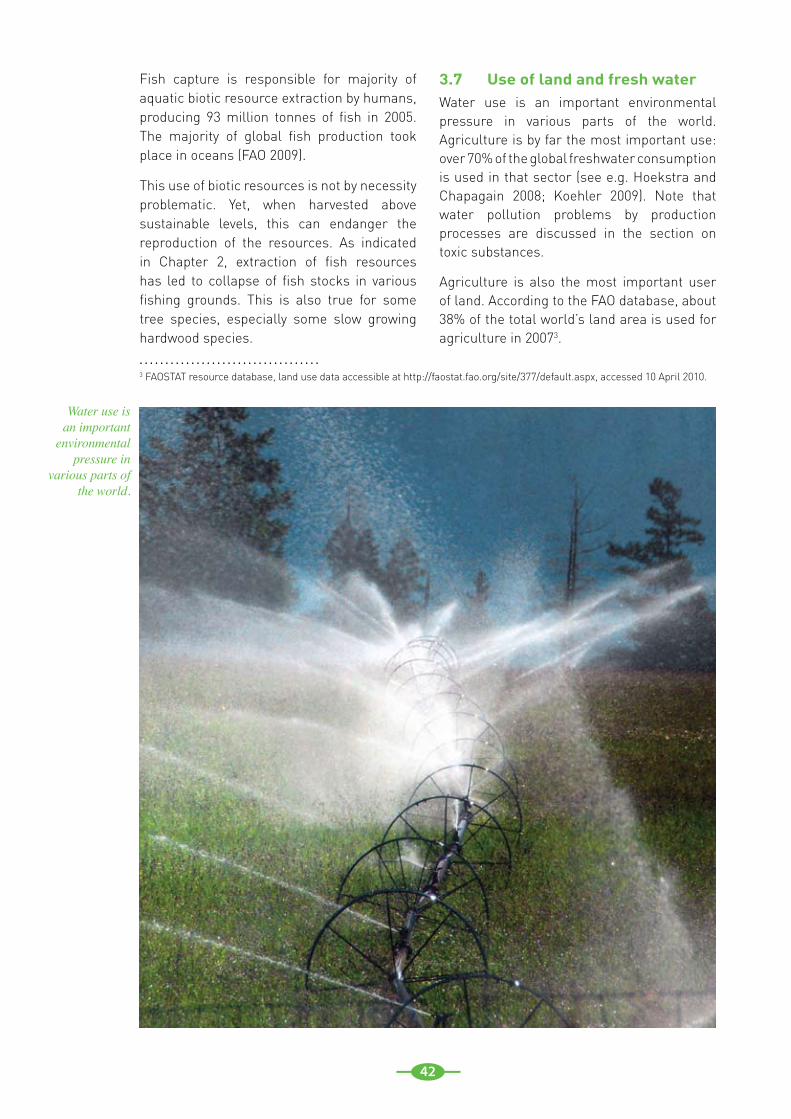
42
Fish capture is responsible for majority of aquatic biotic resource extraction by humans, producing 93 million tonnes of fish in 2005. The majority of global fish production took place in oceans (FAO 2009).
This use of biotic resources is not by necessity problematic. Yet, when harvested above sustainable levels, this can endanger the reproduction of the resources. As indicated in Chapter 2, extraction of fish resources has led to collapse of fish stocks in various fishing grounds. This is also true for some tree species, especially some slow growing hardwood species.
3.7 Use of land and fresh waterWater use is an important environmental pressure in various parts of the world. Agriculture is by far the most important use: over 70% of the global freshwater consumption is used in that sector (see e.g. Hoekstra and Chapagain 2008; Koehler 2009). Note that water pollution problems by production processes are discussed in the section on toxic substances.
Agriculture is also the most important user of land. According to the FAO database, about 38% of the total world’s land area is used for agriculture in 20073.
Water use is an important
environmental pressure in
various parts of the world.
3 FAOSTAT resource database, land use data accessible at http://faostat.fao.org/site/377/default.aspx, accessed 10 April 2010.
. . . . . . . . . . . . . . . . . . . . . . . . . . . . . . . . . . .
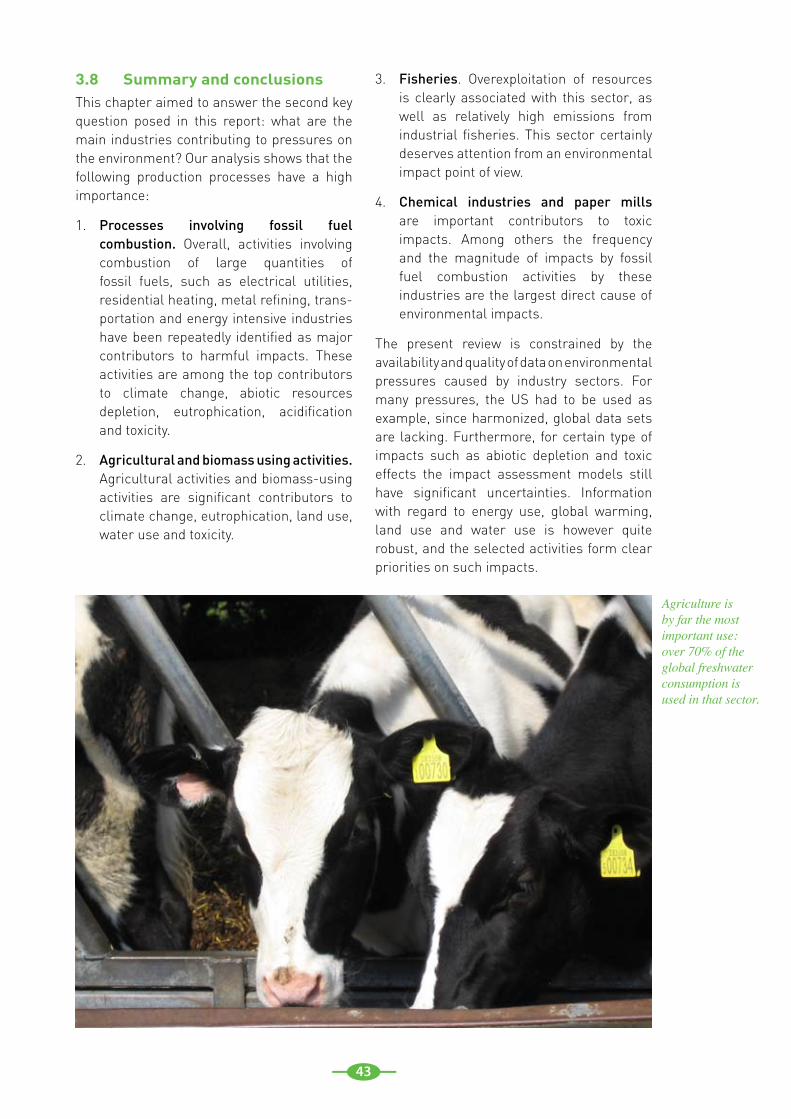
43
3.8 Summary and conclusionsThis chapter aimed to answer the second key question posed in this report: what are the main industries contributing to pressures on the environment? Our analysis shows that the following production processes have a high importance:
Processes involving fossil fuel 1. combustion. Overall, activities involving combustion of large quantities of fossil fuels, such as electrical utilities, residential heating, metal refining, trans-portation and energy intensive industries have been repeatedly identified as major contributors to harmful impacts. These activities are among the top contributors to climate change, abiotic resources depletion, eutrophication, acidification and toxicity.
Agricultural and biomass using activities. 2. Agricultural activities and biomass-using activities are significant contributors to climate change, eutrophication, land use, water use and toxicity.
Fisheries3. . Overexploitation of resources is clearly associated with this sector, as well as relatively high emissions from industrial fisheries. This sector certainly deserves attention from an environmental impact point of view.
Chemical industries and paper mills 4. are important contributors to toxic impacts. Among others the frequency and the magnitude of impacts by fossil fuel combustion activities by these industries are the largest direct cause of environmental impacts.
The present review is constrained by the availability and quality of data on environmental pressures caused by industry sectors. For many pressures, the US had to be used as example, since harmonized, global data sets are lacking. Furthermore, for certain type of impacts such as abiotic depletion and toxic effects the impact assessment models still have significant uncertainties. Information with regard to energy use, global warming, land use and water use is however quite robust, and the selected activities form clear priorities on such impacts.
Agriculture is by far the most important use: over 70% of the global freshwater consumption is used in that sector.
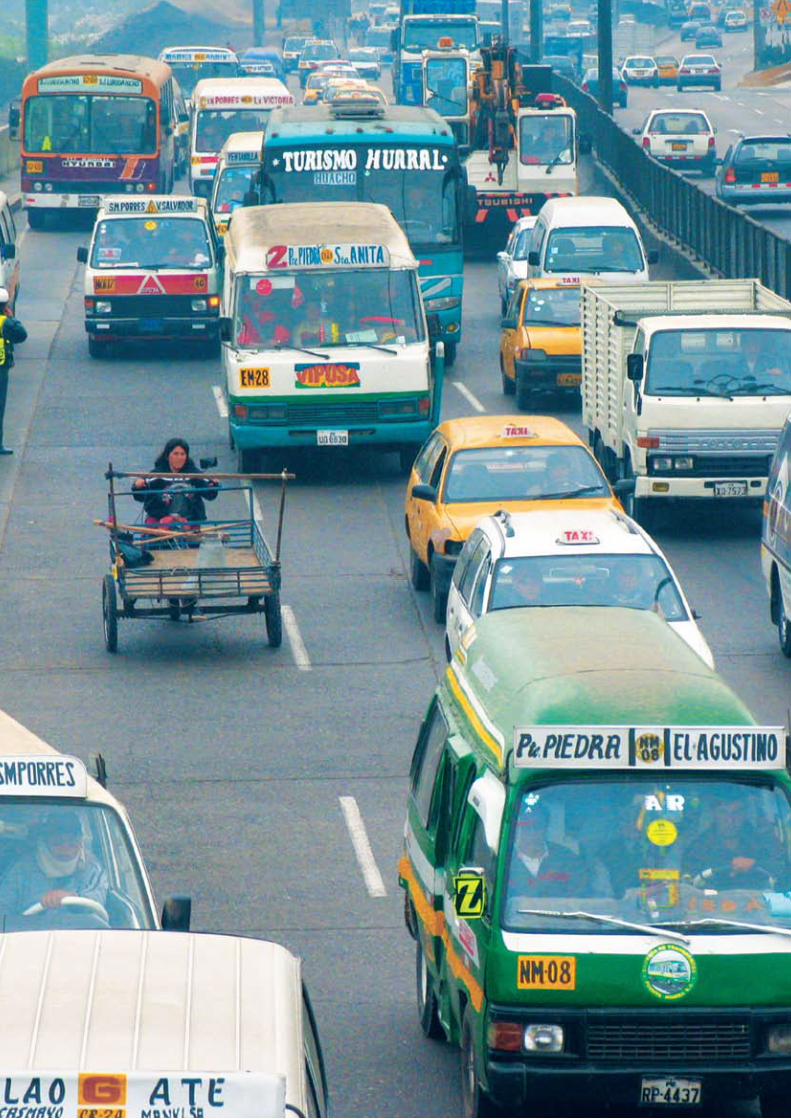
44
45
4.1 IntroductionChapter 3 reviewed direct environmental pressures caused by economic activities. That overview shows that emission and land use change result primarily from energy conversion, agriculture and industrial production and only to a lesser degree directly from household activities. Viewed from a life cycle perspective, however, all production ultimately serves the purpose of consumption. In the final consumption perspective, all emissions and resource use during production are assigned to the final consumption of the products and services consumed. The resource and emission intensity of different consumption activities depends to a large degree on the methods employed to produce the goods and services consumed. This chapter hence addresses the third key question posed in this report: which consumption categories and product groups have the greatest environmental impacts?
This chapter first discusses the methods used in studies assessing the impacts of final consumption (Section 4.2). It then gives an overview of how important different main final consumption categories are, such as consumption by households, governments, and final use as investments (Section 4.3). After this, these final consumption categories are discussed in more detail, as much as possible taking into account the pressures and impacts identified in Chapter 2 (emissions of greenhouse gases, eutrophying and acidifying substances, and toxic substances, as well as extraction/use of biotic resources, abiotic resources, water and land).
4.2 Methods Studies into the life cycle environmental impacts of consumption usually apply one of the following two methodologies: environ-mentally extended input-output analysis, or life cycle assessment (Hertwich 2005).
Input-output tables describe the interde-pendence of all production and consumption activities in an economy. In an input-output model, the economy is represented by industry sectors and final demand categories. Integrating information on emissions and resource use caused by industry sectors and final demand, as contained in the national environmental accounts, allows us to assign environmental pressures to final demand in a similar way as is common for value-added elements, such as labour. All emissions and resource use included in environmental accounts can hence be redistributed to the goods and services used by ’final demand categories‘: households, government, investment, export, civic organizations, and adjustments to stocks (UN 1993). Final demand by households involves everything households purchase. Final demand by government includes both territorial functions (defence, law and order) and government expenditure for services such as education and health care. Investment can be done by households (homes), governments (roads, schools etc.) and industry (factories, equipment). This top-down approach allows for comprehensive coverage of all upstream effects of changes in final demand. Some shortcomings arise, however, because input-output tables are compiled at a national level, for aggregate industries, with substantial time delays and some uncertainty.
Life cycle assessments address individual products much more specifically than input-output tables do. Life cycle inventory analysis involves the data collection and calculation procedure to quantify relevant inputs and outputs of a product system (ISO 14040 2006). Individual processes related to the production, use and disposal in a product system are described in terms of their inputs and outputs. Elemental flows (resources inputs and pollutant/waste outputs) are modelled in physical terms, while intermediate
4 The final consumption perspective: life cycle environmental impacts of consumption
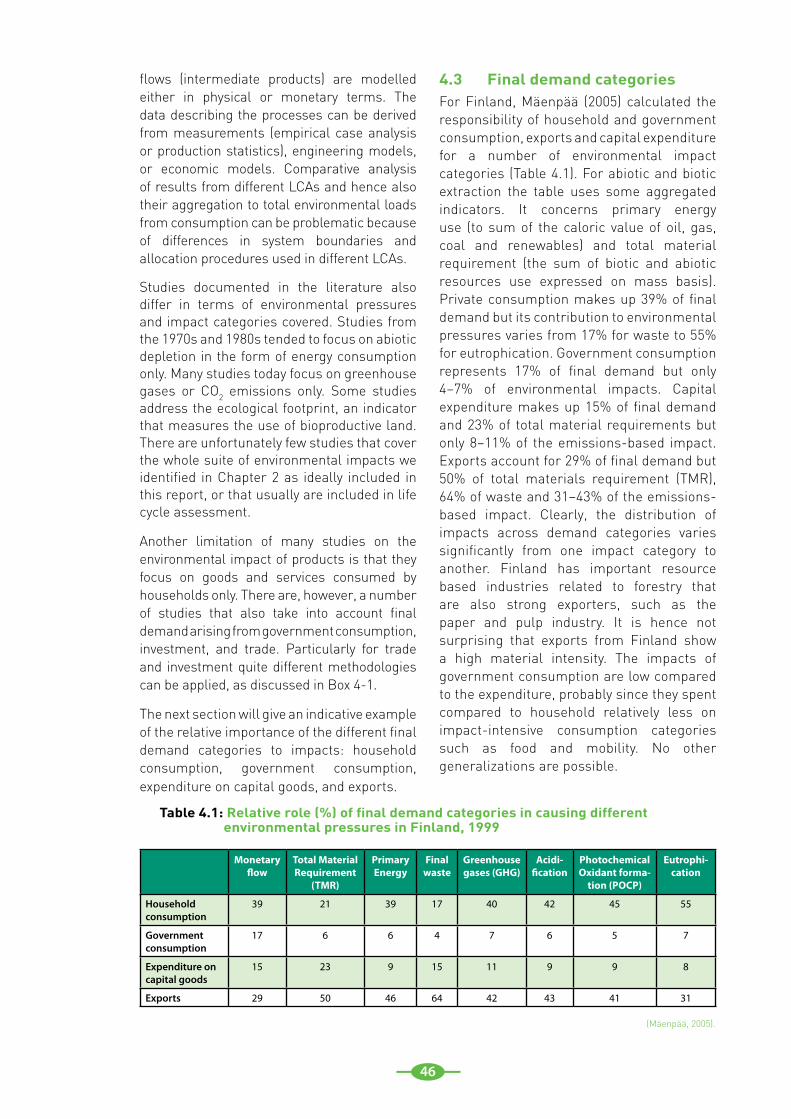
46
flows (intermediate products) are modelled either in physical or monetary terms. The data describing the processes can be derived from measurements (empirical case analysis or production statistics), engineering models, or economic models. Comparative analysis of results from different LCAs and hence also their aggregation to total environmental loads from consumption can be problematic because of differences in system boundaries and allocation procedures used in different LCAs.
Studies documented in the literature also differ in terms of environmental pressures and impact categories covered. Studies from the 1970s and 1980s tended to focus on abiotic depletion in the form of energy consumption only. Many studies today focus on greenhouse gases or CO2 emissions only. Some studies address the ecological footprint, an indicator that measures the use of bioproductive land. There are unfortunately few studies that cover the whole suite of environmental impacts we identified in Chapter 2 as ideally included in this report, or that usually are included in life cycle assessment.
Another limitation of many studies on the environmental impact of products is that they focus on goods and services consumed by households only. There are, however, a number of studies that also take into account final demand arising from government consumption, investment, and trade. Particularly for trade and investment quite different methodologies can be applied, as discussed in Box 4-1.
The next section will give an indicative example of the relative importance of the different final demand categories to impacts: household consumption, government consumption, expenditure on capital goods, and exports.
4.3 Final demand categoriesFor Finland, Mäenpää (2005) calculated the responsibility of household and government consumption, exports and capital expenditure for a number of environmental impact categories (Table 4.1). For abiotic and biotic extraction the table uses some aggregated indicators. It concerns primary energy use (to sum of the caloric value of oil, gas, coal and renewables) and total material requirement (the sum of biotic and abiotic resources use expressed on mass basis). Private consumption makes up 39% of final demand but its contribution to environmental pressures varies from 17% for waste to 55% for eutrophication. Government consumption represents 17% of final demand but only 4–7% of environmental impacts. Capital expenditure makes up 15% of final demand and 23% of total material requirements but only 8–11% of the emissions-based impact. Exports account for 29% of final demand but 50% of total materials requirement (TMR), 64% of waste and 31–43% of the emissions-based impact. Clearly, the distribution of impacts across demand categories varies significantly from one impact category to another. Finland has important resource based industries related to forestry that are also strong exporters, such as the paper and pulp industry. It is hence not surprising that exports from Finland show a high material intensity. The impacts of government consumption are low compared to the expenditure, probably since they spent compared to household relatively less on impact-intensive consumption categories such as food and mobility. No other generalizations are possible.
Table 4.1: Relative role (%) of final demand categories in causing different environmental pressures in Finland, 1999
Monetary flow
Total Material Requirement
(TMR)
Primary Energy
Final waste
Greenhouse gases (GHG)
Acidi-fication
Photochemical Oxidant forma-
tion (POCP)
Eutrophi-cation
Household consumption
39 21 39 17 40 42 45 55
Government consumption
17 6 6 4 7 6 5 7
Expenditure on capital goods
15 23 9 15 11 9 9 8
Exports 29 50 46 64 42 43 41 31
(Mäenpää, 2005).
47
Box 4-1 Investment and trade in input-output analysis
Investment, exports and imports are not treated in the same fashion in all input-output studies. From a life cycle perspective, investments in production equipment (such as machinery) and infrastructure (such as roads) are counted either in the production of final goods (in the case of machinery) or as a final use by consumers (in the case of roads). They should hence be seen as contributing to intermediate or final consumption and the associated impacts should be assigned accordingly. The problem here is that the investments taken in a specific year contribute future production and final demand, not simply current production and final demand. Ideally, we should account for the capital used for current production and final demand. We would hence need to specify the capital, model the environmental impact in the year of its production, and use a depreciation rate to determine the share of the impact that should be assigned to current production. Some countries have national capital accounts that do keep track of the capital stock owned by different sectors, although we usually lack information on whether it was fully utilized in a given year and whether it was used for the production of all goods that the sector delivered. Such an approach is rarely possible, because capital flow accounts are either not constructed at all, not public, or at least not standardized across nations. One option then is to assume that the capital investment in a given year is both necessary and sufficient to maintain the capital stock used for production in the given year and to assign the impact from producing that capital to consumption in this one year.
Every input-output table includes sectoral data of gross fixed capital formation and expenditure and approximation methods exist to construct a full capital flow table from these two vectors (Lenzen and Treloar 2004). Some analysts have adopted a steady state assumption, whereby one year’s investments are necessary and sufficient to sustain the production and consumption in that given year (Lenzen 2001; Peters and Hertwich 2006c). Other authors, however, prefer to keep capital expenditure as a separate final demand category. This can be very sensible in the case of rapidly developing countries where the current rate of capital expenditure is much larger than that required to sustain a steady level of output (Peters et al. 2007).
The treatment of international trade in input-output-based environmental impact studies has been the subject of lively debate. An often mentioned issue is that in analyses using one national table, it is common to assume that imports are produced using domestic technology (Lenzen 2001; Herendeen and Tanaka 1976). One problem with this treatment is non-competitive imports, as some countries do not mine certain metals, produce cars or oil, or grow tropical produce. The other issue is that domestic technologies and hence emission intensities may differ significantly from those of exporting countries. There has therefore been a systematic development of multiregional input-output analysis (Peters and Hertwich 2009) to take into account national differences in technology and specific trade patterns (Wier et al. 2001; Peters and Hertwich 2006c; Weber and Matthews 2007; Munksgaard et al. 2005; Nijdam et al. 2005; Davis and Caldeira). However, multiregional input-output frameworks are mostly available only at high sector aggregation, which potentially introduces aggregation errors into life cycle calculations (Lenzen et al. 2004).
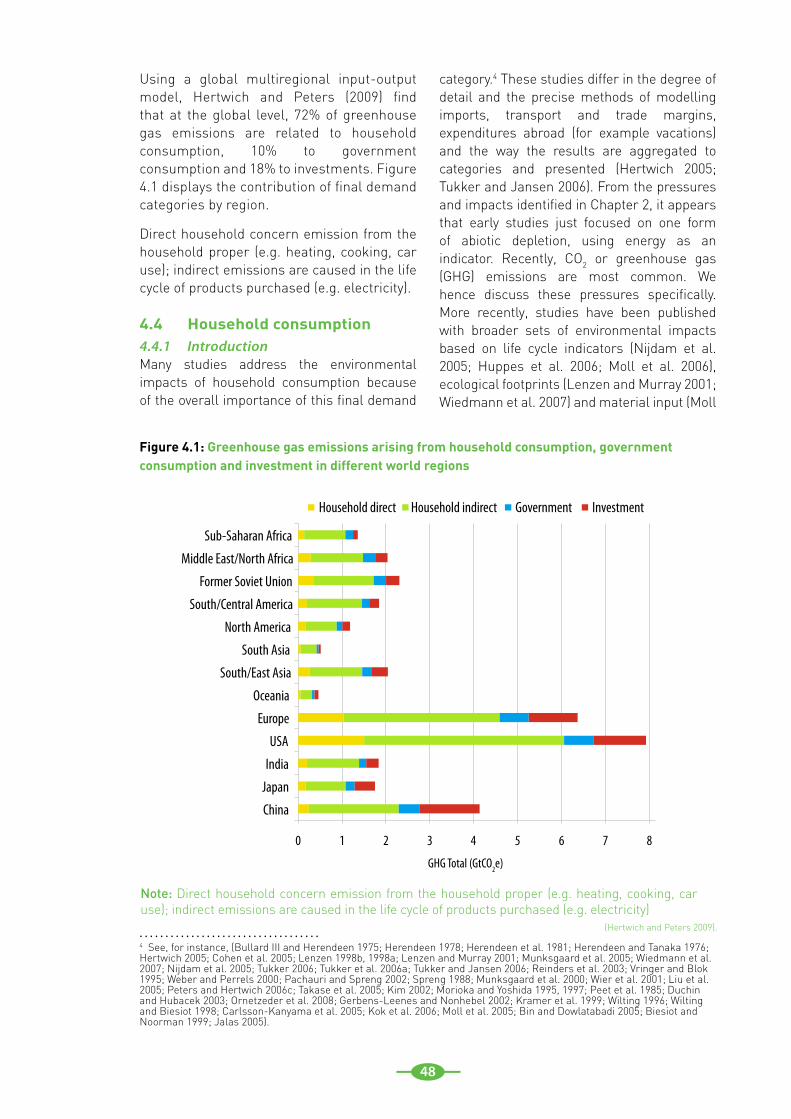
48
Using a global multiregional input-output model, Hertwich and Peters (2009) find that at the global level, 72% of greenhouse gas emissions are related to household consumption, 10% to government consumption and 18% to investments. Figure 4.1 displays the contribution of final demand categories by region.
Direct household concern emission from the household proper (e.g. heating, cooking, car use); indirect emissions are caused in the life cycle of products purchased (e.g. electricity).
4.4 Household consumption4.4.1 IntroductionMany studies address the environmental impacts of household consumption because of the overall importance of this final demand
category.4 These studies differ in the degree of detail and the precise methods of modelling imports, transport and trade margins, expenditures abroad (for example vacations) and the way the results are aggregated to categories and presented (Hertwich 2005; Tukker and Jansen 2006). From the pressures and impacts identified in Chapter 2, it appears that early studies just focused on one form of abiotic depletion, using energy as an indicator. Recently, CO2 or greenhouse gas (GHG) emissions are most common. We hence discuss these pressures specifically. More recently, studies have been published with broader sets of environmental impacts based on life cycle indicators (Nijdam et al. 2005; Huppes et al. 2006; Moll et al. 2006), ecological footprints (Lenzen and Murray 2001; Wiedmann et al. 2007) and material input (Moll
0 1 2 3 4 5 6 7 8
China
Japan
India
USA
Europe
Oceania
South/East Asia
South Asia
North America
South/Central America
Former Soviet Union
Middle East/North Africa
Sub-Saharan Africa
Household direct Household indirect Government Investment
GHG Total (GtCO2e)
Note: Direct household concern emission from the household proper (e.g. heating, cooking, car use); indirect emissions are caused in the life cycle of products purchased (e.g. electricity)
Figure 4.1: Greenhouse gas emissions arising from household consumption, government consumption and investment in different world regions
4 See, for instance, (Bullard III and Herendeen 1975; Herendeen 1978; Herendeen et al. 1981; Herendeen and Tanaka 1976; Hertwich 2005; Cohen et al. 2005; Lenzen 1998b, 1998a; Lenzen and Murray 2001; Munksgaard et al. 2005; Wiedmann et al. 2007; Nijdam et al. 2005; Tukker 2006; Tukker et al. 2006a; Tukker and Jansen 2006; Reinders et al. 2003; Vringer and Blok 1995; Weber and Perrels 2000; Pachauri and Spreng 2002; Spreng 1988; Munksgaard et al. 2000; Wier et al. 2001; Liu et al. 2005; Peters and Hertwich 2006c; Takase et al. 2005; Kim 2002; Morioka and Yoshida 1995, 1997; Peet et al. 1985; Duchin and Hubacek 2003; Ornetzeder et al. 2008; Gerbens-Leenes and Nonhebel 2002; Kramer et al. 1999; Wilting 1996; Wilting and Biesiot 1998; Carlsson-Kanyama et al. 2005; Kok et al. 2006; Moll et al. 2005; Bin and Dowlatabadi 2005; Biesiot and Noorman 1999; Jalas 2005).
. . . . . . . . . . . . . . . . . . . . . . . . . . . . . . . . . . . (Hertwich and Peters 2009).
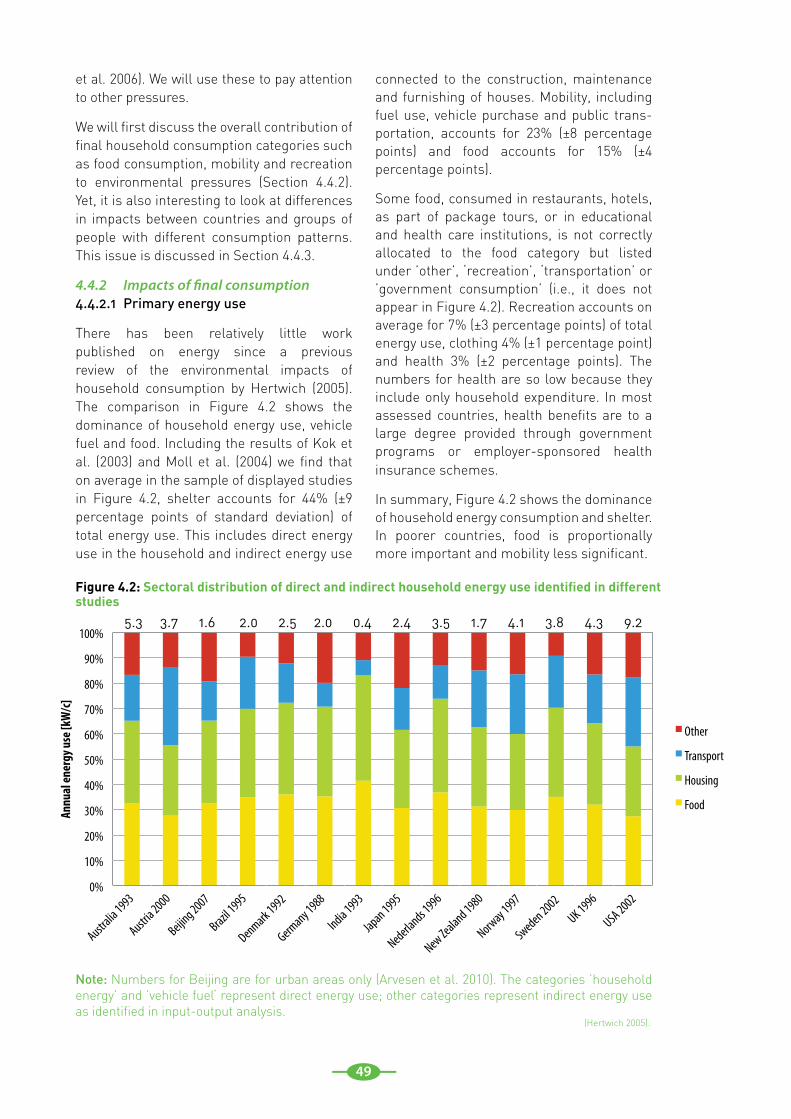
49
et al. 2006). We will use these to pay attention to other pressures.
We will first discuss the overall contribution of final household consumption categories such as food consumption, mobility and recreation to environmental pressures (Section 4.4.2). Yet, it is also interesting to look at differences in impacts between countries and groups of people with different consumption patterns. This issue is discussed in Section 4.4.3.
4.4.2 Impacts of final consumption4.4.2.1 Primary energy use
There has been relatively little work published on energy since a previous review of the environmental impacts of household consumption by Hertwich (2005). The comparison in Figure 4.2 shows the dominance of household energy use, vehicle fuel and food. Including the results of Kok et al. (2003) and Moll et al. (2004) we find that on average in the sample of displayed studies in Figure 4.2, shelter accounts for 44% (±9 percentage points of standard deviation) of total energy use. This includes direct energy use in the household and indirect energy use
connected to the construction, maintenance and furnishing of houses. Mobility, including fuel use, vehicle purchase and public trans-portation, accounts for 23% (±8 percentage points) and food accounts for 15% (±4 percentage points).
Some food, consumed in restaurants, hotels, as part of package tours, or in educational and health care institutions, is not correctly allocated to the food category but listed under ’other’, ‘recreation’, ‘transportation’ or ’government consumption’ (i.e., it does not appear in Figure 4.2). Recreation accounts on average for 7% (±3 percentage points) of total energy use, clothing 4% (±1 percentage point) and health 3% (±2 percentage points). The numbers for health are so low because they include only household expenditure. In most assessed countries, health benefits are to a large degree provided through government programs or employer-sponsored health insurance schemes.
In summary, Figure 4.2 shows the dominance of household energy consumption and shelter. In poorer countries, food is proportionally more important and mobility less significant.
0%
10%
20%
30%
40%
50%
60%
70%
80%
90%
100%
Annu
al en
ergy
use
[kW
/c]
Other
Transport
Housing
Food
Australia 1993
Austria 2000
Beijing 2007
Brazil 1995
Denmark 1992
Germany 1988
India 1993
Japan 1995
Nederlands 1996
New Zealand 1980
Norway 1997
Sweden 2002
UK 1996
USA 2002
Figure 4.2: Sectoral distribution of direct and indirect household energy use identified in different studies
Note: Numbers for Beijing are for urban areas only (Arvesen et al. 2010). The categories ’household energy’ and ’vehicle fuel‘ represent direct energy use; other categories represent indirect energy use as identified in input-output analysis.
(Hertwich 2005).
5.3 3.7 1.6 2.0 2.5 2.0 0.4 2.4 3.5 1.7 4.1 3.8 4.3 9.2
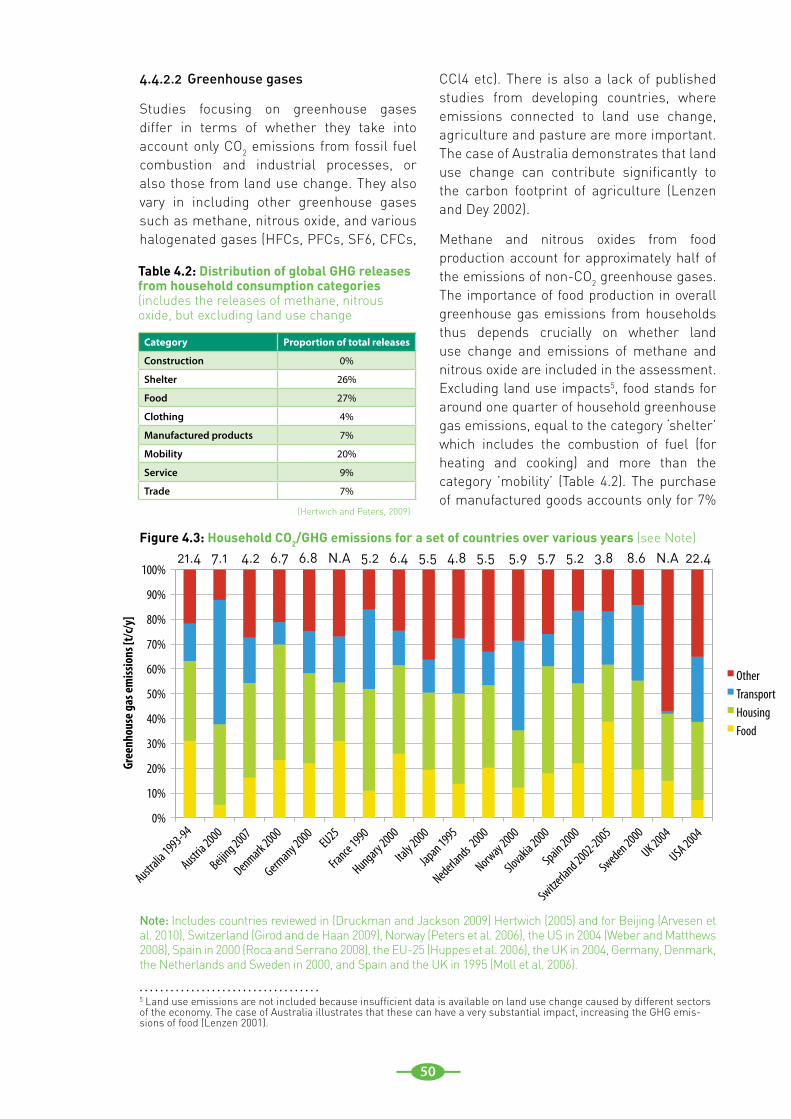
50
Note: Includes countries reviewed in (Druckman and Jackson 2009) Hertwich (2005) and for Beijing (Arvesen et al. 2010), Switzerland (Girod and de Haan 2009), Norway (Peters et al. 2006), the US in 2004 (Weber and Matthews 2008), Spain in 2000 (Roca and Serrano 2008), the EU-25 (Huppes et al. 2006), the UK in 2004, Germany, Denmark, the Netherlands and Sweden in 2000, and Spain and the UK in 1995 (Moll et al. 2006).
4.4.2.2 Greenhouse gases
Studies focusing on greenhouse gases differ in terms of whether they take into account only CO2 emissions from fossil fuel combustion and industrial processes, or also those from land use change. They also vary in including other greenhouse gases such as methane, nitrous oxide, and various halogenated gases (HFCs, PFCs, SF6, CFCs,
CCl4 etc). There is also a lack of published studies from developing countries, where emissions connected to land use change, agriculture and pasture are more important. The case of Australia demonstrates that land use change can contribute significantly to the carbon footprint of agriculture (Lenzen and Dey 2002).
Methane and nitrous oxides from food production account for approximately half of the emissions of non-CO2 greenhouse gases. The importance of food production in overall greenhouse gas emissions from households thus depends crucially on whether land use change and emissions of methane and nitrous oxide are included in the assessment. Excluding land use impacts5, food stands for around one quarter of household greenhouse gas emissions, equal to the category ‘shelter’ which includes the combustion of fuel (for heating and cooking) and more than the category ’mobility’ (Table 4.2). The purchase of manufactured goods accounts only for 7%
Category Proportion of total releases
Construction 0%
Shelter 26%
Food 27%
Clothing 4%
Manufactured products 7%
Mobility 20%
Service 9%
Trade 7%
Table 4.2: Distribution of global GHG releases from household consumption categories (includes the releases of methane, nitrous oxide, but excluding land use change
Figure 4.3: Household CO2/GHG emissions for a set of countries over various years (see Note)
0%
10%
20%
30%
40%
50%
60%
70%
80%
90%
100%
Gree
nhou
se g
as em
issio
ns [t
/c/y]
Other Transport Housing Food
Australia 1993-94
Austria 2000
Beijing 2007
Denmark 2000
Germany 2000
EU25
France 1990
Hungary 2000
Italy 2000
Japan 1995
Nederlands 2000
Norway 2000
Slovakia 2000
Spain 2000
Sweden 2000
Switzerland 2002-2005
UK 2004
USA 2004
5 Land use emissions are not included because insufficient data is available on land use change caused by different sectors of the economy. The case of Australia illustrates that these can have a very substantial impact, increasing the GHG emis-sions of food (Lenzen 2001).
. . . . . . . . . . . . . . . . . . . . . . . . . . . . . . . . . . .
(Hertwich and Peters, 2009)
21.4 7.1 4.2 6.7 6.8 N.A 5.2 6.4 5.5 4.8 5.5 5.9 5.7 5.2 3.8 8.6 N.A 22.4
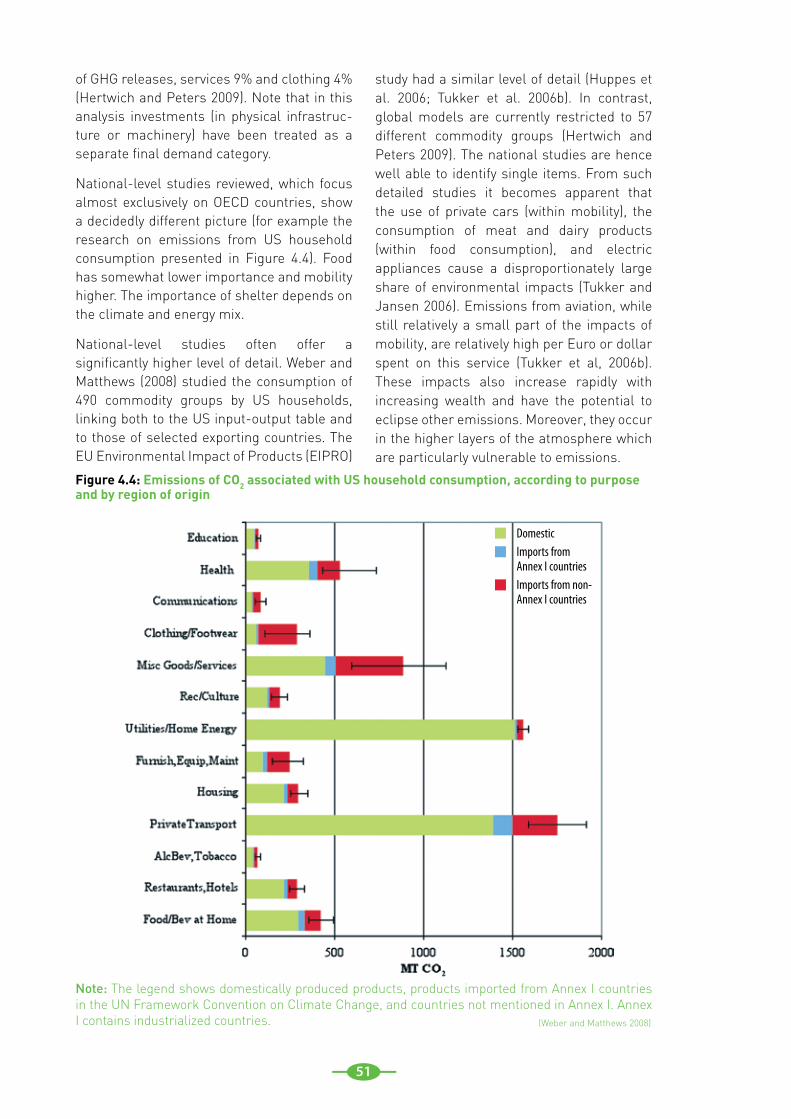
51
of GHG releases, services 9% and clothing 4% (Hertwich and Peters 2009). Note that in this analysis investments (in physical infrastruc-ture or machinery) have been treated as a separate final demand category.
National-level studies reviewed, which focus almost exclusively on OECD countries, show a decidedly different picture (for example the research on emissions from US household consumption presented in Figure 4.4). Food has somewhat lower importance and mobility higher. The importance of shelter depends on the climate and energy mix.
National-level studies often offer a significantly higher level of detail. Weber and Matthews (2008) studied the consumption of 490 commodity groups by US households, linking both to the US input-output table and to those of selected exporting countries. The EU Environmental Impact of Products (EIPRO)
study had a similar level of detail (Huppes et al. 2006; Tukker et al. 2006b). In contrast, global models are currently restricted to 57 different commodity groups (Hertwich and Peters 2009). The national studies are hence well able to identify single items. From such detailed studies it becomes apparent that the use of private cars (within mobility), the consumption of meat and dairy products (within food consumption), and electric appliances cause a disproportionately large share of environmental impacts (Tukker and Jansen 2006). Emissions from aviation, while still relatively a small part of the impacts of mobility, are relatively high per Euro or dollar spent on this service (Tukker et al, 2006b). These impacts also increase rapidly with increasing wealth and have the potential to eclipse other emissions. Moreover, they occur in the higher layers of the atmosphere which are particularly vulnerable to emissions.
Figure 4.4: Emissions of CO2 associated with US household consumption, according to purpose and by region of origin
Note: The legend shows domestically produced products, products imported from Annex I countries in the UN Framework Convention on Climate Change, and countries not mentioned in Annex I. Annex I contains industrialized countries. (Weber and Matthews 2008)
DomesticImports from Annex I countriesImports from non-Annex I countries
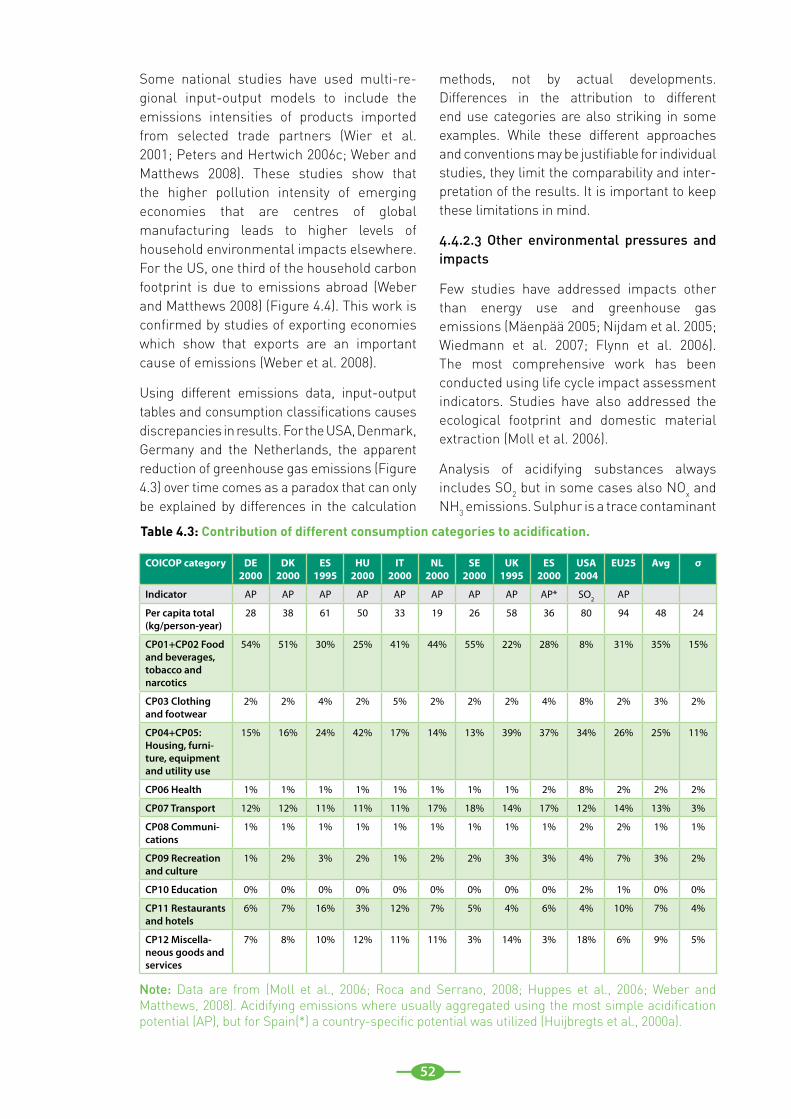
52
Some national studies have used multi-re-gional input-output models to include the emissions intensities of products imported from selected trade partners (Wier et al. 2001; Peters and Hertwich 2006c; Weber and Matthews 2008). These studies show that the higher pollution intensity of emerging economies that are centres of global manufacturing leads to higher levels of household environmental impacts elsewhere. For the US, one third of the household carbon footprint is due to emissions abroad (Weber and Matthews 2008) (Figure 4.4). This work is confirmed by studies of exporting economies which show that exports are an important cause of emissions (Weber et al. 2008).
Using different emissions data, input-output tables and consumption classifications causes discrepancies in results. For the USA, Denmark, Germany and the Netherlands, the apparent reduction of greenhouse gas emissions (Figure 4.3) over time comes as a paradox that can only be explained by differences in the calculation
methods, not by actual developments. Differences in the attribution to different end use categories are also striking in some examples. While these different approaches and conventions may be justifiable for individual studies, they limit the comparability and inter-pretation of the results. It is important to keep these limitations in mind.
4.4.2.3 Other environmental pressures and impacts
Few studies have addressed impacts other than energy use and greenhouse gas emissions (Mäenpää 2005; Nijdam et al. 2005; Wiedmann et al. 2007; Flynn et al. 2006). The most comprehensive work has been conducted using life cycle impact assessment indicators. Studies have also addressed the ecological footprint and domestic material extraction (Moll et al. 2006).
Analysis of acidifying substances always includes SO2 but in some cases also NOx and NH3 emissions. Sulphur is a trace contaminant
COICOP category DE 2000
DK 2000
ES 1995
HU 2000
IT 2000
NL 2000
SE 2000
UK 1995
ES 2000
USA 2004
EU25 Avg σ
Indicator AP AP AP AP AP AP AP AP AP* SO2 AP
Per capita total (kg/person-year)
28 38 61 50 33 19 26 58 36 80 94 48 24
CP01+CP02 Food and beverages, tobacco and narcotics
54% 51% 30% 25% 41% 44% 55% 22% 28% 8% 31% 35% 15%
CP03 Clothing and footwear
2% 2% 4% 2% 5% 2% 2% 2% 4% 8% 2% 3% 2%
CP04+CP05: Housing, furni-ture, equipment and utility use
15% 16% 24% 42% 17% 14% 13% 39% 37% 34% 26% 25% 11%
CP06 Health 1% 1% 1% 1% 1% 1% 1% 1% 2% 8% 2% 2% 2%
CP07 Transport 12% 12% 11% 11% 11% 17% 18% 14% 17% 12% 14% 13% 3%
CP08 Communi-cations
1% 1% 1% 1% 1% 1% 1% 1% 1% 2% 2% 1% 1%
CP09 Recreation and culture
1% 2% 3% 2% 1% 2% 2% 3% 3% 4% 7% 3% 2%
CP10 Education 0% 0% 0% 0% 0% 0% 0% 0% 0% 2% 1% 0% 0%
CP11 Restaurants and hotels
6% 7% 16% 3% 12% 7% 5% 4% 6% 4% 10% 7% 4%
CP12 Miscella-neous goods and services
7% 8% 10% 12% 11% 11% 3% 14% 3% 18% 6% 9% 5%
Table 4.3: Contribution of different consumption categories to acidification.
Note: Data are from (Moll et al., 2006; Roca and Serrano, 2008; Huppes et al., 2006; Weber and Matthews, 2008). Acidifying emissions where usually aggregated using the most simple acidification potential (AP), but for Spain(*) a country-specific potential was utilized (Huijbregts et al., 2000a).
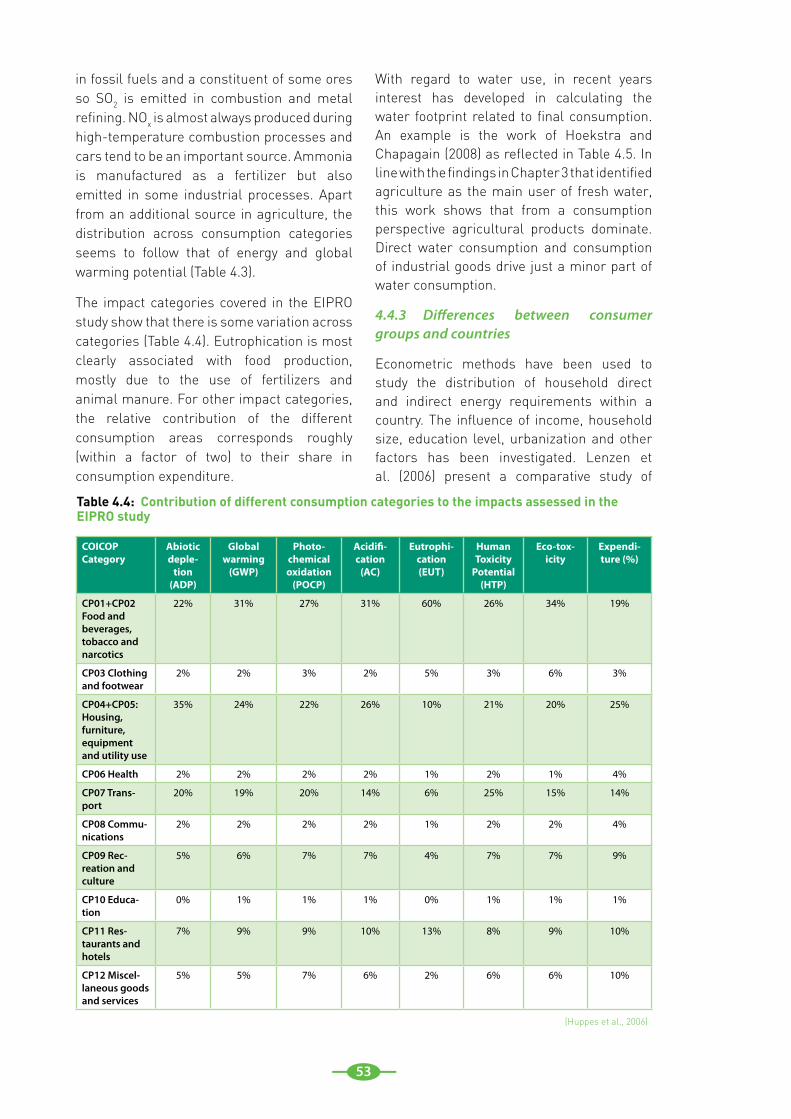
53
in fossil fuels and a constituent of some ores so SO2 is emitted in combustion and metal refining. NOx is almost always produced during high-temperature combustion processes and cars tend to be an important source. Ammonia is manufactured as a fertilizer but also emitted in some industrial processes. Apart from an additional source in agriculture, the distribution across consumption categories seems to follow that of energy and global warming potential (Table 4.3).
The impact categories covered in the EIPRO study show that there is some variation across categories (Table 4.4). Eutrophication is most clearly associated with food production, mostly due to the use of fertilizers and animal manure. For other impact categories, the relative contribution of the different consumption areas corresponds roughly (within a factor of two) to their share in consumption expenditure.
With regard to water use, in recent years interest has developed in calculating the water footprint related to final consumption. An example is the work of Hoekstra and Chapagain (2008) as reflected in Table 4.5. In line with the findings in Chapter 3 that identified agriculture as the main user of fresh water, this work shows that from a consumption perspective agricultural products dominate. Direct water consumption and consumption of industrial goods drive just a minor part of water consumption.
4.4.3 Differences between consumer groups and countries
Econometric methods have been used to study the distribution of household direct and indirect energy requirements within a country. The influence of income, household size, education level, urbanization and other factors has been investigated. Lenzen et al. (2006) present a comparative study of
Table 4.4: Contribution of different consumption categories to the impacts assessed in the EIPRO study
COICOP Category
Abiotic deple-
tion (ADP)
Global warming
(GWP)
Photo-chemical oxidation
(POCP)
Acidifi-cation
(AC)
Eutrophi-cation (EUT)
Human Toxicity
Potential (HTP)
Eco-tox-icity
Expendi-ture (%)
CP01+CP02 Food and beverages, tobacco and narcotics
22% 31% 27% 31% 60% 26% 34% 19%
CP03 Clothing and footwear
2% 2% 3% 2% 5% 3% 6% 3%
CP04+CP05: Housing, furniture, equipment and utility use
35% 24% 22% 26% 10% 21% 20% 25%
CP06 Health 2% 2% 2% 2% 1% 2% 1% 4%
CP07 Trans-port
20% 19% 20% 14% 6% 25% 15% 14%
CP08 Commu-nications
2% 2% 2% 2% 1% 2% 2% 4%
CP09 Rec-reation and culture
5% 6% 7% 7% 4% 7% 7% 9%
CP10 Educa-tion
0% 1% 1% 1% 0% 1% 1% 1%
CP11 Res-taurants and hotels
7% 9% 9% 10% 13% 8% 9% 10%
CP12 Miscel-laneous goods and services
5% 5% 7% 6% 2% 6% 6% 10%
(Huppes et al., 2006)
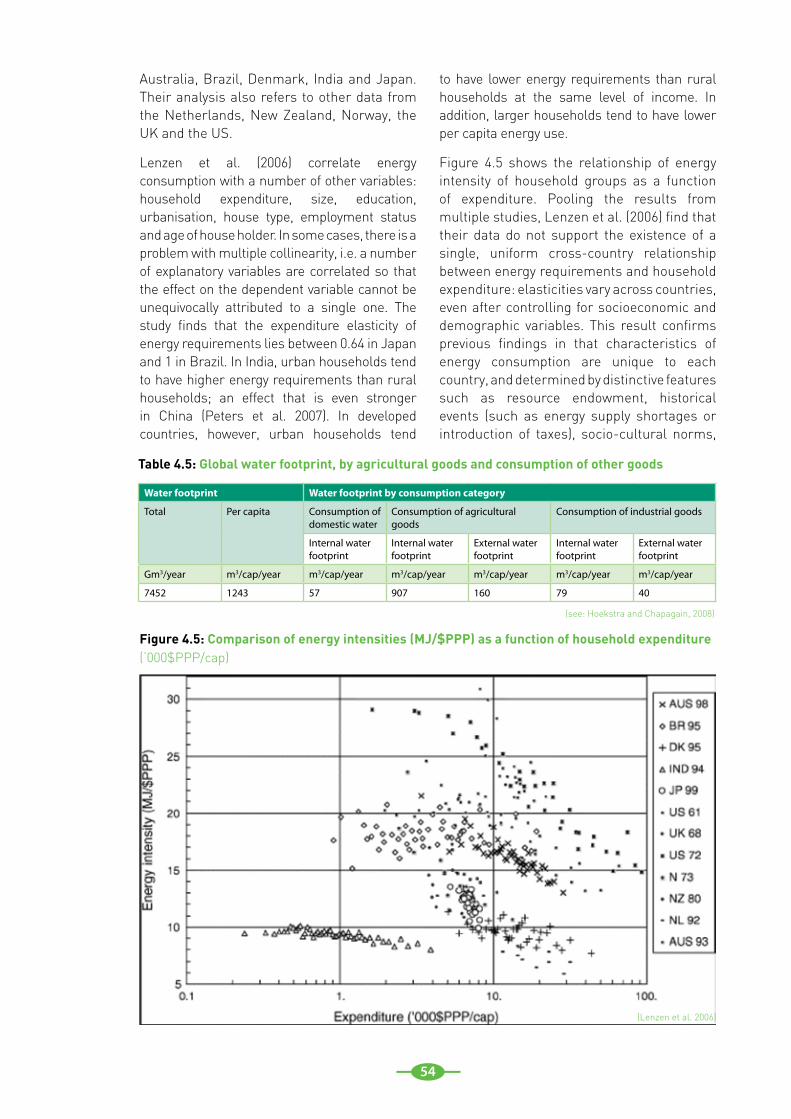
54
Australia, Brazil, Denmark, India and Japan. Their analysis also refers to other data from the Netherlands, New Zealand, Norway, the UK and the US.
Lenzen et al. (2006) correlate energy consumption with a number of other variables: household expenditure, size, education, urbanisation, house type, employment status and age of house holder. In some cases, there is a problem with multiple collinearity, i.e. a number of explanatory variables are correlated so that the effect on the dependent variable cannot be unequivocally attributed to a single one. The study finds that the expenditure elasticity of energy requirements lies between 0.64 in Japan and 1 in Brazil. In India, urban households tend to have higher energy requirements than rural households; an effect that is even stronger in China (Peters et al. 2007). In developed countries, however, urban households tend
to have lower energy requirements than rural households at the same level of income. In addition, larger households tend to have lower per capita energy use.
Figure 4.5 shows the relationship of energy intensity of household groups as a function of expenditure. Pooling the results from multiple studies, Lenzen et al. (2006) find that their data do not support the existence of a single, uniform cross-country relationship between energy requirements and household expenditure: elasticities vary across countries, even after controlling for socioeconomic and demographic variables. This result confirms previous findings in that characteristics of energy consumption are unique to each country, and determined by distinctive features such as resource endowment, historical events (such as energy supply shortages or introduction of taxes), socio-cultural norms,
Water footprint Water footprint by consumption category
Total Per capita Consumption of domestic water
Consumption of agricultural goods
Consumption of industrial goods
Internal water footprint
Internal water footprint
External water footprint
Internal water footprint
External water footprint
Gm3/year m3/cap/year m3/cap/year m3/cap/year m3/cap/year m3/cap/year m3/cap/year
7452 1243 57 907 160 79 40
Table 4.5: Global water footprint, by agricultural goods and consumption of other goods
Figure 4.5: Comparison of energy intensities (MJ/$PPP) as a function of household expenditure (‘000$PPP/cap)
(see: Hoekstra and Chapagain, 2008)
(Lenzen et al. 2006)
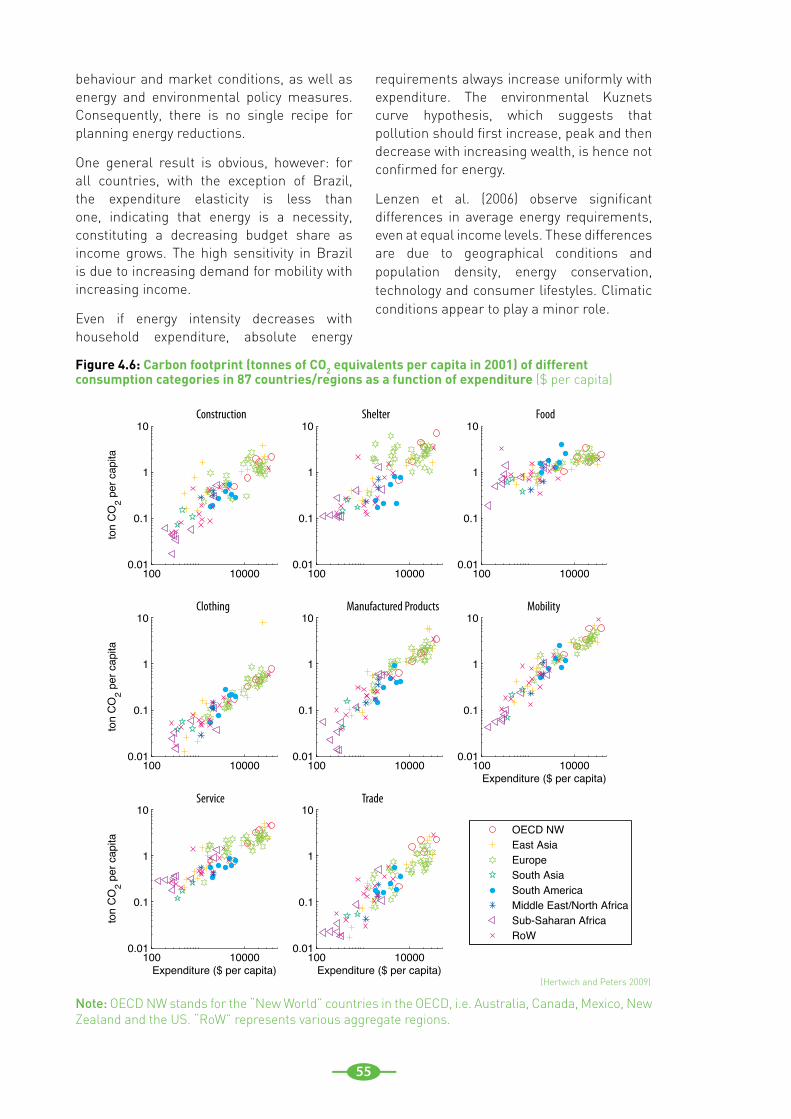
55
behaviour and market conditions, as well as energy and environmental policy measures. Consequently, there is no single recipe for planning energy reductions.
One general result is obvious, however: for all countries, with the exception of Brazil, the expenditure elasticity is less than one, indicating that energy is a necessity, constituting a decreasing budget share as income grows. The high sensitivity in Brazil is due to increasing demand for mobility with increasing income.
Even if energy intensity decreases with household expenditure, absolute energy
requirements always increase uniformly with expenditure. The environmental Kuznets curve hypothesis, which suggests that pollution should first increase, peak and then decrease with increasing wealth, is hence not confirmed for energy.
Lenzen et al. (2006) observe significant differences in average energy requirements, even at equal income levels. These differences are due to geographical conditions and population density, energy conservation, technology and consumer lifestyles. Climatic conditions appear to play a minor role.
100 100000.01
0.1
1
10
ton
CO
2 per
cap
ita
100 100000.01
0.1
1
10
100 100000.01
0.1
1
10
100 100000.01
0.1
1
10
ton
CO
2 per
cap
ita
100 100000.01
0.1
1
10
100 100000.01
0.1
1
10
Expenditure ($ per capita)
100 100000.01
0.1
1
10
Expenditure ($ per capita)
ton
CO
2 per
cap
ita
100 100000.01
0.1
1
10
Expenditure ($ per capita)
OECD NWEast AsiaEuropeSouth AsiaSouth AmericaMiddle East/North AfricaSub-Saharan AfricaRoW
Construction Shelter Food
Clothing Manufactured Products
Service Trade
Mobility
Figure 4.6: Carbon footprint (tonnes of CO2 equivalents per capita in 2001) of different consumption categories in 87 countries/regions as a function of expenditure ($ per capita)
Note: OECD NW stands for the “New World” countries in the OECD, i.e. Australia, Canada, Mexico, New Zealand and the US. “RoW” represents various aggregate regions.
(Hertwich and Peters 2009)
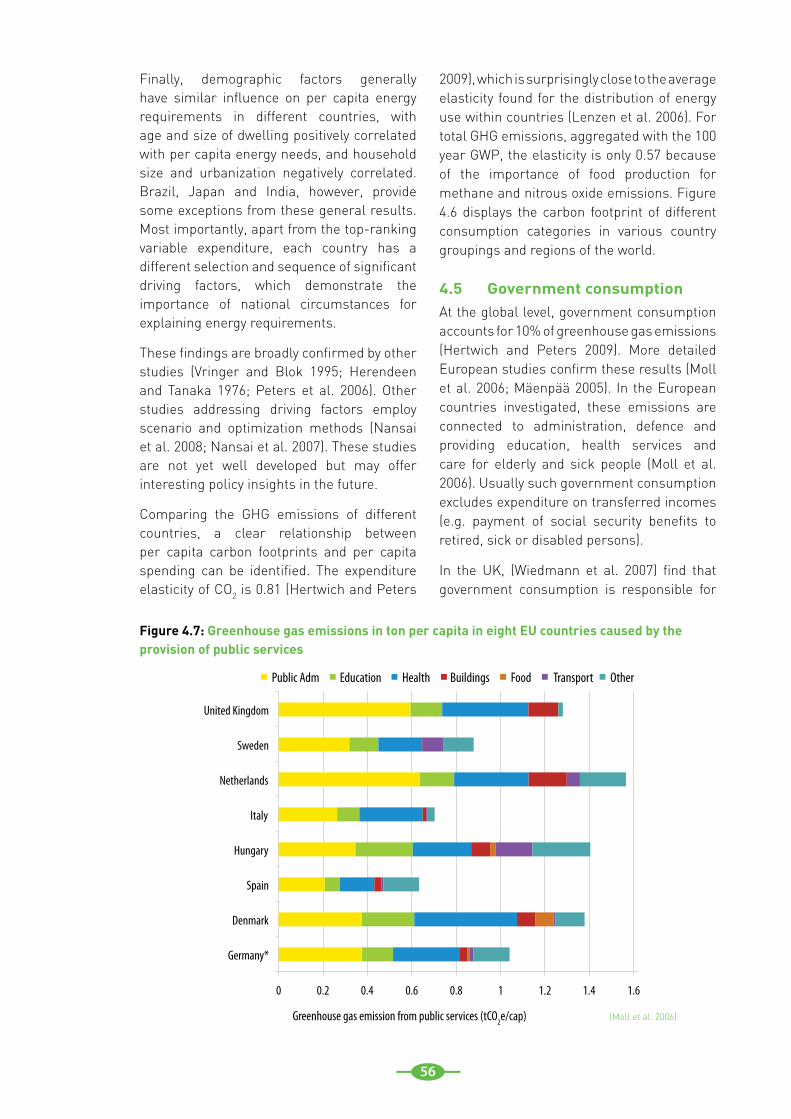
56
Finally, demographic factors generally have similar influence on per capita energy requirements in different countries, with age and size of dwelling positively correlated with per capita energy needs, and household size and urbanization negatively correlated. Brazil, Japan and India, however, provide some exceptions from these general results. Most importantly, apart from the top-ranking variable expenditure, each country has a different selection and sequence of significant driving factors, which demonstrate the importance of national circumstances for explaining energy requirements.
These findings are broadly confirmed by other studies (Vringer and Blok 1995; Herendeen and Tanaka 1976; Peters et al. 2006). Other studies addressing driving factors employ scenario and optimization methods (Nansai et al. 2008; Nansai et al. 2007). These studies are not yet well developed but may offer interesting policy insights in the future.
Comparing the GHG emissions of different countries, a clear relationship between per capita carbon footprints and per capita spending can be identified. The expenditure elasticity of CO2 is 0.81 (Hertwich and Peters
2009), which is surprisingly close to the average elasticity found for the distribution of energy use within countries (Lenzen et al. 2006). For total GHG emissions, aggregated with the 100 year GWP, the elasticity is only 0.57 because of the importance of food production for methane and nitrous oxide emissions. Figure 4.6 displays the carbon footprint of different consumption categories in various country groupings and regions of the world.
4.5 Government consumptionAt the global level, government consumption accounts for 10% of greenhouse gas emissions (Hertwich and Peters 2009). More detailed European studies confirm these results (Moll et al. 2006; Mäenpää 2005). In the European countries investigated, these emissions are connected to administration, defence and providing education, health services and care for elderly and sick people (Moll et al. 2006). Usually such government consumption excludes expenditure on transferred incomes (e.g. payment of social security benefits to retired, sick or disabled persons).
In the UK, (Wiedmann et al. 2007) find that government consumption is responsible for
0 0.2 0.4 0.6 0.8 1 1.2 1.4 1.6
Germany*
Denmark
Spain
Hungary
Italy
Netherlands
Sweden
United Kingdom
Public Adm Education Health Buildings Food Transport Other
Figure 4.7: Greenhouse gas emissions in ton per capita in eight EU countries caused by the provision of public services
Greenhouse gas emission from public services (tCO2e/cap) (Moll et al. 2006)
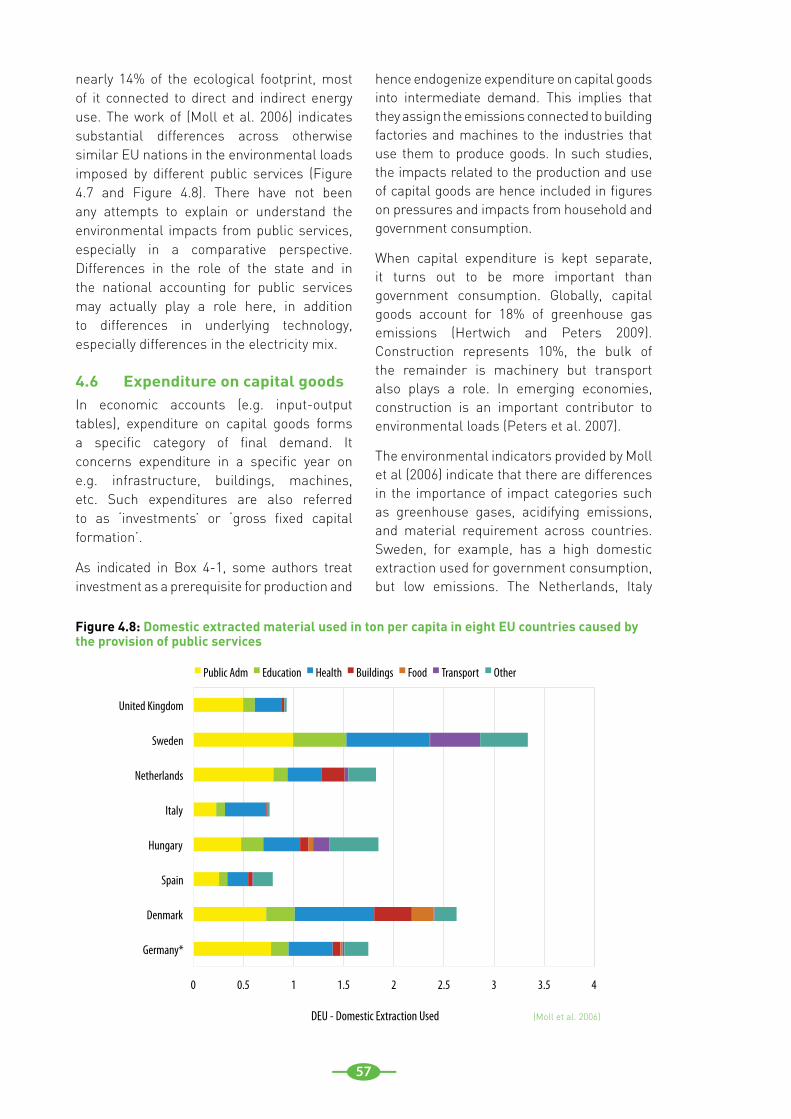
57
nearly 14% of the ecological footprint, most of it connected to direct and indirect energy use. The work of (Moll et al. 2006) indicates substantial differences across otherwise similar EU nations in the environmental loads imposed by different public services (Figure 4.7 and Figure 4.8). There have not been any attempts to explain or understand the environmental impacts from public services, especially in a comparative perspective. Differences in the role of the state and in the national accounting for public services may actually play a role here, in addition to differences in underlying technology, especially differences in the electricity mix.
4.6 Expenditure on capital goodsIn economic accounts (e.g. input-output tables), expenditure on capital goods forms a specific category of final demand. It concerns expenditure in a specific year on e.g. infrastructure, buildings, machines, etc. Such expenditures are also referred to as ‘investments’ or ‘gross fixed capital formation’.
As indicated in Box 4-1, some authors treat investment as a prerequisite for production and
hence endogenize expenditure on capital goods into intermediate demand. This implies that they assign the emissions connected to building factories and machines to the industries that use them to produce goods. In such studies, the impacts related to the production and use of capital goods are hence included in figures on pressures and impacts from household and government consumption.
When capital expenditure is kept separate, it turns out to be more important than government consumption. Globally, capital goods account for 18% of greenhouse gas emissions (Hertwich and Peters 2009). Construction represents 10%, the bulk of the remainder is machinery but transport also plays a role. In emerging economies, construction is an important contributor to environmental loads (Peters et al. 2007).
The environmental indicators provided by Moll et al (2006) indicate that there are differences in the importance of impact categories such as greenhouse gases, acidifying emissions, and material requirement across countries. Sweden, for example, has a high domestic extraction used for government consumption, but low emissions. The Netherlands, Italy
0 0.5 1 1.5 2 2.5 3 3.5 4
Germany*
Denmark
Spain
Hungary
Italy
Netherlands
Sweden
United Kingdom
Public Adm Education Health Buildings Food Transport Other
Figure 4.8: Domestic extracted material used in ton per capita in eight EU countries caused by the provision of public services
DEU - Domestic Extraction Used (Moll et al. 2006)
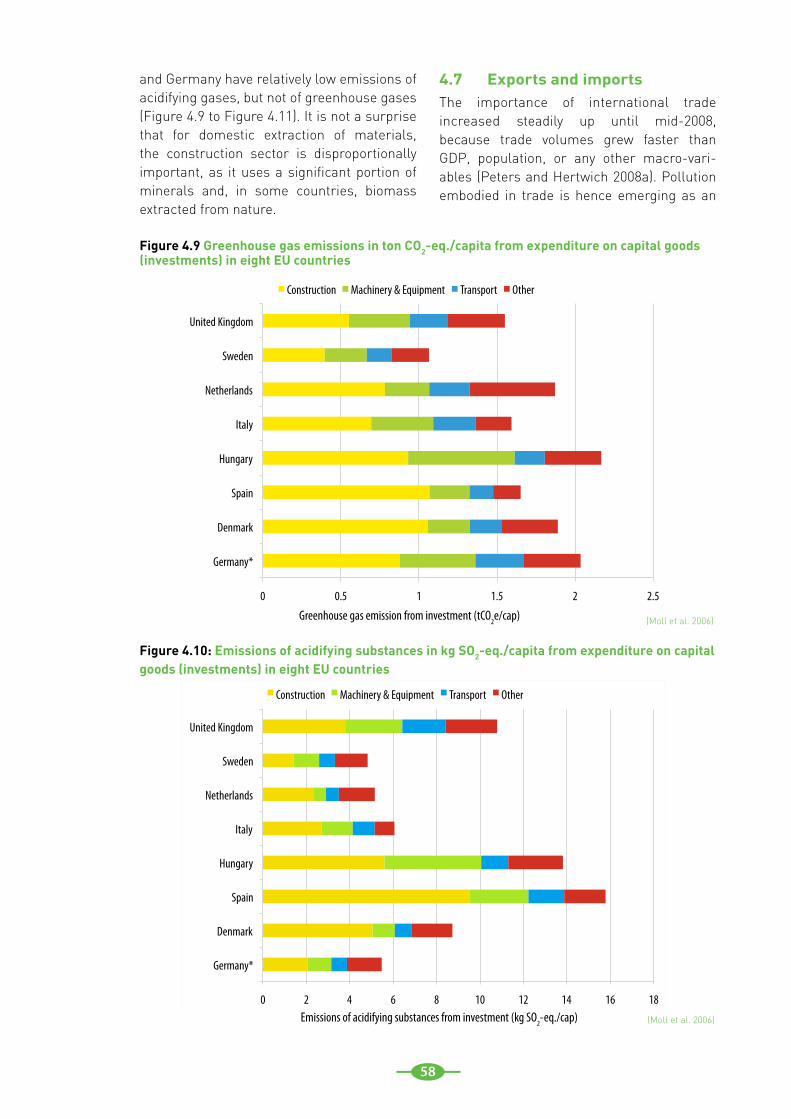
58
and Germany have relatively low emissions of acidifying gases, but not of greenhouse gases (Figure 4.9 to Figure 4.11). It is not a surprise that for domestic extraction of materials, the construction sector is disproportionally important, as it uses a significant portion of minerals and, in some countries, biomass extracted from nature.
4.7 Exports and importsThe importance of international trade increased steadily up until mid-2008, because trade volumes grew faster than GDP, population, or any other macro-vari-ables (Peters and Hertwich 2008a). Pollution embodied in trade is hence emerging as an
0 2 4 6 8 10 12 14 16 18
Germany*
Denmark
Spain
Hungary
Italy
Netherlands
Sweden
United Kingdom
Construction Machinery & Equipment Transport Other
Figure 4.10: Emissions of acidifying substances in kg SO2-eq./capita from expenditure on capital goods (investments) in eight EU countries
Emissions of acidifying substances from investment (kg SO2-eq./cap)
0 0.5 1 1.5 2 2.5
Germany*
Denmark
Spain
Hungary
Italy
Netherlands
Sweden
United Kingdom
Construction Machinery & Equipment Transport Other
Figure 4.9 Greenhouse gas emissions in ton CO2-eq./capita from expenditure on capital goods (investments) in eight EU countries
Greenhouse gas emission from investment (tCO2e/cap)
(Moll et al. 2006)
(Moll et al. 2006)
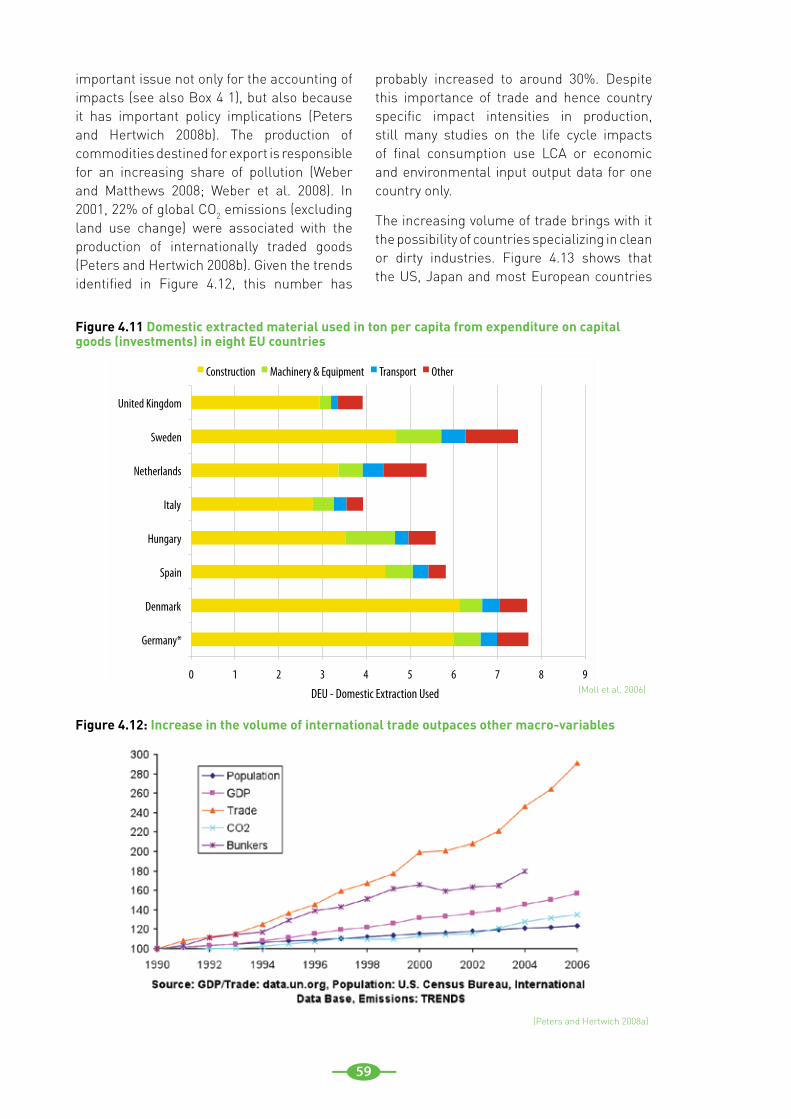
59
important issue not only for the accounting of impacts (see also Box 4 1), but also because it has important policy implications (Peters and Hertwich 2008b). The production of commodities destined for export is responsible for an increasing share of pollution (Weber and Matthews 2008; Weber et al. 2008). In 2001, 22% of global CO2 emissions (excluding land use change) were associated with the production of internationally traded goods (Peters and Hertwich 2008b). Given the trends identified in Figure 4.12, this number has
probably increased to around 30%. Despite this importance of trade and hence country specific impact intensities in production, still many studies on the life cycle impacts of final consumption use LCA or economic and environmental input output data for one country only.
The increasing volume of trade brings with it the possibility of countries specializing in clean or dirty industries. Figure 4.13 shows that the US, Japan and most European countries
Figure 4.12: Increase in the volume of international trade outpaces other macro-variables
0 1 2 3 4 5 6 7 8 9
Germany*
Denmark
Spain
Hungary
Italy
Netherlands
Sweden
United Kingdom
Construction Machinery & Equipment Transport Other
Figure 4.11 Domestic extracted material used in ton per capita from expenditure on capital goods (investments) in eight EU countries
DEU - Domestic Extraction Used (Moll et al. 2006)
(Peters and Hertwich 2008a)
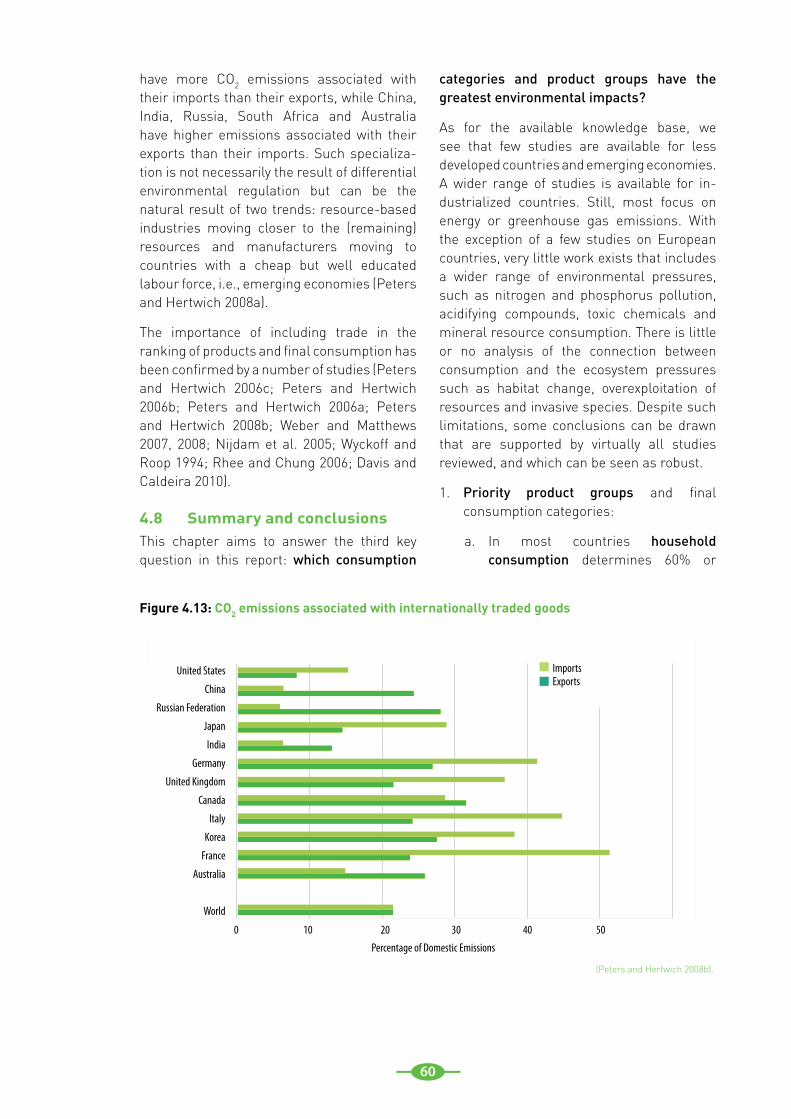
60
have more CO2 emissions associated with their imports than their exports, while China, India, Russia, South Africa and Australia have higher emissions associated with their exports than their imports. Such specializa-tion is not necessarily the result of differential environmental regulation but can be the natural result of two trends: resource-based industries moving closer to the (remaining) resources and manufacturers moving to countries with a cheap but well educated labour force, i.e., emerging economies (Peters and Hertwich 2008a).
The importance of including trade in the ranking of products and final consumption has been confirmed by a number of studies (Peters and Hertwich 2006c; Peters and Hertwich 2006b; Peters and Hertwich 2006a; Peters and Hertwich 2008b; Weber and Matthews 2007, 2008; Nijdam et al. 2005; Wyckoff and Roop 1994; Rhee and Chung 2006; Davis and Caldeira 2010).
4.8 Summary and conclusionsThis chapter aims to answer the third key question in this report: which consumption
categories and product groups have the greatest environmental impacts?
As for the available knowledge base, we see that few studies are available for less developed countries and emerging economies. A wider range of studies is available for in-dustrialized countries. Still, most focus on energy or greenhouse gas emissions. With the exception of a few studies on European countries, very little work exists that includes a wider range of environmental pressures, such as nitrogen and phosphorus pollution, acidifying compounds, toxic chemicals and mineral resource consumption. There is little or no analysis of the connection between consumption and the ecosystem pressures such as habitat change, overexploitation of resources and invasive species. Despite such limitations, some conclusions can be drawn that are supported by virtually all studies reviewed, and which can be seen as robust.
Priority product groups1. and final consumption categories:
In most countries a. household consumption determines 60% or
Figure 4.13: CO2 emissions associated with internationally traded goods
Federation
Percentage of Domestic Emissions
0 10 20 30 40 50
ImportsExports
United States
China
Russian Federation
Japan
India
Germany
United Kingdom
Canada
Italy
Korea
France
Australia
World
(Peters and Hertwich 2008b).
61
more of the life cycle impacts of final consumption. Within household consumption:
In i. developing and emerging countries, food and housing dominate greenhouse gas emissions.
For ii. industrialized countries, all studies indicate that housing, mobility, food and manufactured products typically determine over 70% of the impacts of household consumption.
Together they typically determine over 70% of the impacts of household consumption. Government consumption and investment in infra-structure is less relevant as household consumption.
For developing countries outside b. Asia, the public sector is often a large part of the economy. Hence, in such countries government procurement can be important for the life cycle impacts of final consumption. Many emerging economies in Asia currently make large investments building up their infrastructure, which makes this final expenditure category influential.
The 2. role of imports and exports. Fast developing countries (particularly in Asia) have developed themselves as the ‘workshop of the world’ and export large amounts of products to developed countries. As a consequence, this leads to the translocation of environmental impacts of consumption to countries where production takes place. For most Organisation for Economic Co-operation and Development (OECD) countries, CO2 emissions embodied in imports are (sometimes significantly) larger than those embodied in exports, and conversely, emissions embodied in the export of developing countries tends to be higher than those in their imports.
Wealth and income levels3. as determining factors of environmental pressures from consumption.
Income levels most strongly influence a. environmental pressures resulting from mobility and are most weakly linked to those arising from food.
Income levels also influence pressures b. from purchasing manufactured and internationally traded goods. Such products are often assigned to consumption categories such as leisure (electronic equipment, toys) and housing (furniture, white goods). Collectively, the environmental pressures of manufactured final consumption goods are more important than food in most industri-alized countries.
The last point shows that higher earnings generally imply greater environmental pressure from consumption, both within and across countries. Yet, a clear differentiation has to be made here.
Water pollution and conventional air •pollution are typically caused by relatively small mass flows of pollutants. These can be prevented by improved processes and end-of-pipe pollution control, and the wealthier a country is, the more it tends to implement such improvements. This implies that for these pressures there exists a turning point, beyond which environmental pollution declines with increased wealth – the environmental Kuznets curve.
Yet, for environmental problems related •to high mass flows, such as energy use and greenhouse gas emissions, cleaner production and end-of-pipe have less effect. For such problems, a doubling of wealth leads typically to an increase of environmental pressure by 60–80% and in emerging economies this is sometimes even more.
62
63
5.1 IntroductionAs stated in Chapter 1, ’materials’ represent another entrance into the production-con-sumption system. This chapter aims to answer the fourth central question in this report: which materials have the greatest environmental impact across their life cycles?
Materials are substances or components with certain physical properties. They are used as inputs to production or manufacturing because of these properties. A material can be defined at different stages in the life cycle: unprocessed raw materials, intermediates and finished materials (Nakamura et al. 2007). For example, iron ore is mined and processed into crude iron, which in turn is refined and processed into steel. Each of these can be called materials. Steel is then used as an input in many other industries to make finished products.
Traditionally the policy approach related to materials has focused on substances (chemicals, elements) and their harmful properties. This is still an important part of a substance-oriented policy: a risk-based approach, such as taken for example in the REACH system for the EU6. Taking into account not only the impacts of the materials themselves, but also the upstream and downstream impacts related to mining, production and waste management gives a broader and more complete perspective. Such a life cycle approach needs to be done typically in the context of specific products and in considering their alternatives, which is also foreseen in more recent policies.
Adding a life cycle perspective to a risk-based policy approach has its complications, since materials are often applied in a variety of products and the related impacts are not inherent characteristics of materials, but are
5 The material use perspective: Life cycle environmental impacts of materials
highly dependent on the technological speci-fications of the processes involved. Such an approach also has its advantages, in enabling to include a wider scope of impacts besides the inherent properties of the material itself, and in allowing for the consideration of alternatives.
When assessing their environmental impacts across their full life cycle, the picture at the most aggregate level would ideally not be different from a ’product’ perspective: all products are made of materials, and counting impacts from a product perspective hence should give the same result as counting impacts from a material perspective. There are various reasons why a ’materials‘ perspective is highly relevant in this report. The link with ’natural resources‘ is far clearer: copper as a material has a close connection with copper ore as a resource, while a finished product such as a computer – containing copper in addition to many other materials – has a more tenuous connection. As a consequence, the link with natural resources is easier to establish in a materials-oriented approach. Copper may not even be visible in a comprehensive product-oriented approach in many applications.
Most of the studies described in Chapter 4 are based on input-output analysis: flows of goods are expressed in monetary terms, with emission factors added in for each industry sector. Such an approach facilitates tracing the economic motivations for resource extraction, but does not show the destination of the resource flows. The simpler materi-als-based approach is complimentary to the input-output analysis, providing insights on the fate of materials in the economic system. Therefore, a materials perspective can provide a useful addition to a product-based one. In the future, integrated approaches may become available, linking materials to economy-wide
6 Registration, Evaluation, Authorisation and Restriction of Chemical substances (see http://ec.europa.eu/environment/chemicals/reach/reach_intro.htm, Accessed May 2010).
. . . . . . . . . . . . . . . . . . . . . . . . . . . . . . . . . . .
64
assessments such as Input-Output analysis, (Nakamura et al. 2007), or linking impacts to material flow cycles (Reuter et al. 2005).
The materials perspective usually implies a focus on mining and refining. This is not a necessary restriction: a materials perspective is also quite suitable for focusing on materi-als-related waste management, especially recycling. The use phase is more problematic, since materials usually end up in a wide range of applications and most products are composed of numerous materials. It is therefore difficult to attribute emissions in the use phase to specific materials.
Information on the impacts of materials can be found in different fields. General life cycle inventory (LCI) databases contain a variety of materials, for which at least a cradle-to-gate
assessment can be extracted. Specific studies and databases exist for groups of materials, such as metals (Durucan et al. 2006; Stewart and Petrie 2006; Suppen et al. 2006), plastics (Patel 2003) and construction materials (Nassen et al. 2007; Josa et al. 2007; Ortiz et al. 2009). Also, databases for eco-designers contain information on materials (Matthews et al. 2008). In these practically oriented studies and databases, the environmental profile is often limited to energy and GHG emissions. The more general LCI databases contain a wider array of emission data (e.g., the E-LCD database, compiled at European Union Joint Research Centre (JRC)7).
General materials-oriented LCI databases can also be found but are not intended to be used for prioritization purposes (Rydh and Sun 2005; Zuo et al. 2001). Overall
Box 5-1 Resources, materials, land, and water – definition issues
This chapter focuses on materials and their life cycle impacts in the economic system. Since terms like resources, water and land may have connotations linked to the term ‘materials’, we want to discuss here how we use these terms in the report.
Resources comprise the source of raw materials, whether it is the biosphere (for biotic resources) or the lithosphere (for abiotic resources). Water as a source of drinking water or for use in agriculture is considered a resource, while water as an environmental compartment, hosting aquatic ecosystems, is not. Impacts on the aquatic ecosystem are reflected, however, via the DPSIR chain. Some authors also consider ‘land’ as a resource. In essence, resources are seen as ‘gifts of the natural system’ that can be used in the economic system, but they are not seen as being part of the economic system (compare Figure 1.1-Figure 1.3)
The aim of this chapter is not to discuss resources. It is to discuss the life cycle pressures and impacts related to flows of clearly identifiable materials through the economic system. As indicated in the main text, depending on the stage in the production life cycle one can name this a raw, intermediate or finished material, but we will always call such physical stuff a ‘material’ in the economy. Although materials are, in statistical definitions, products rather than resources, the link with natural (material) resources is easy to establish, more so than in a consumer product or sectoral approach.
Water in principle could be treated as a material, but was pragmatically excluded as this is the common practice in Material Flow Accounting. Since Land does not flow through the economy, we do not directly consider land in this chapter. Yet, since certain materials cause the pressure ‘land use’ in their life cycle, land is indirectly included as pressure.
7 Available at http://lca.jrc.ec.europa.eu/lcainfohub/index.vm accessed 12 April 2010). . . . . . . . . . . . . . . . . . . . . . . . . . . . . . . . . . .
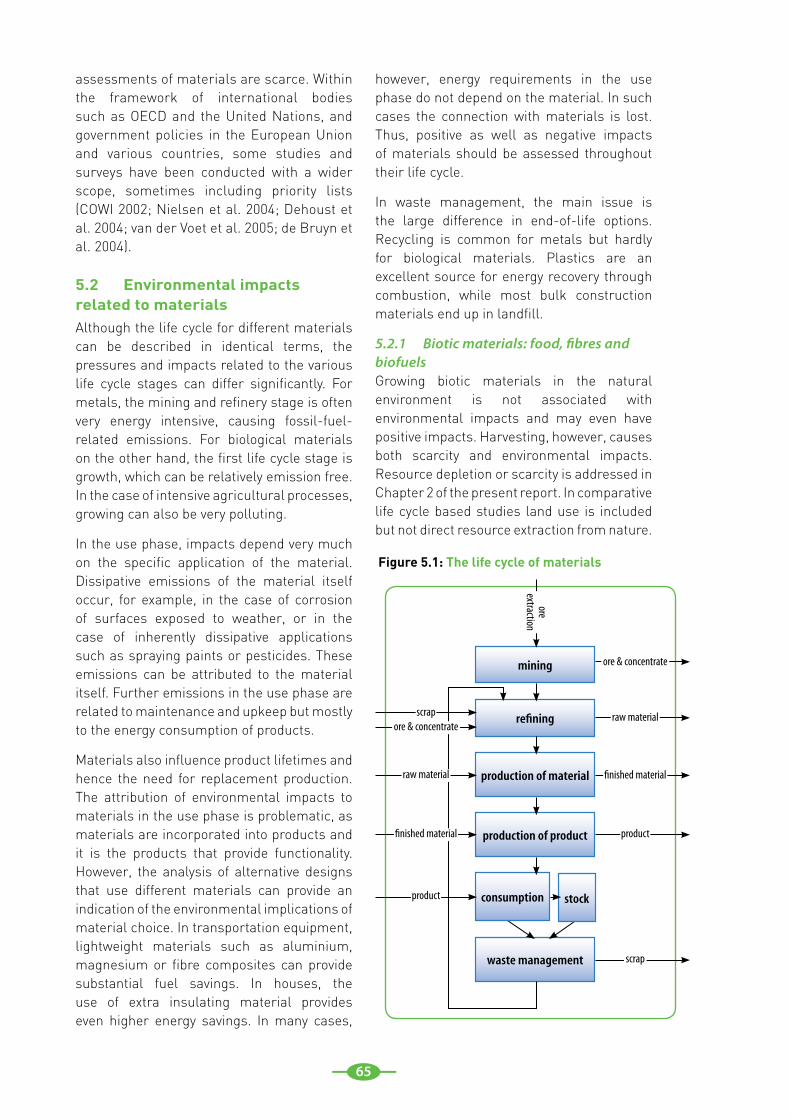
65
assessments of materials are scarce. Within the framework of international bodies such as OECD and the United Nations, and government policies in the European Union and various countries, some studies and surveys have been conducted with a wider scope, sometimes including priority lists (COWI 2002; Nielsen et al. 2004; Dehoust et al. 2004; van der Voet et al. 2005; de Bruyn et al. 2004).
5.2 Environmental impacts related to materialsAlthough the life cycle for different materials can be described in identical terms, the pressures and impacts related to the various life cycle stages can differ significantly. For metals, the mining and refinery stage is often very energy intensive, causing fossil-fuel-related emissions. For biological materials on the other hand, the first life cycle stage is growth, which can be relatively emission free. In the case of intensive agricultural processes, growing can also be very polluting.
In the use phase, impacts depend very much on the specific application of the material. Dissipative emissions of the material itself occur, for example, in the case of corrosion of surfaces exposed to weather, or in the case of inherently dissipative applications such as spraying paints or pesticides. These emissions can be attributed to the material itself. Further emissions in the use phase are related to maintenance and upkeep but mostly to the energy consumption of products.
Materials also influence product lifetimes and hence the need for replacement production. The attribution of environmental impacts to materials in the use phase is problematic, as materials are incorporated into products and it is the products that provide functionality. However, the analysis of alternative designs that use different materials can provide an indication of the environmental implications of material choice. In transportation equipment, lightweight materials such as aluminium, magnesium or fibre composites can provide substantial fuel savings. In houses, the use of extra insulating material provides even higher energy savings. In many cases,
however, energy requirements in the use phase do not depend on the material. In such cases the connection with materials is lost. Thus, positive as well as negative impacts of materials should be assessed throughout their life cycle.
In waste management, the main issue is the large difference in end-of-life options. Recycling is common for metals but hardly for biological materials. Plastics are an excellent source for energy recovery through combustion, while most bulk construction materials end up in landfill.
5.2.1 Biotic materials: food, fibres and biofuelsGrowing biotic materials in the natural environment is not associated with environmental impacts and may even have positive impacts. Harvesting, however, causes both scarcity and environmental impacts. Resource depletion or scarcity is addressed in Chapter 2 of the present report. In comparative life cycle based studies land use is included but not direct resource extraction from nature.
Figure 5.1: The life cycle of materials
mining
production of material
refining
production of product
waste management
consumption stock
scrapore & concentrate
ore & concentrate
ore extraction
raw material
raw material
finished material
finished material
product
product
scrap
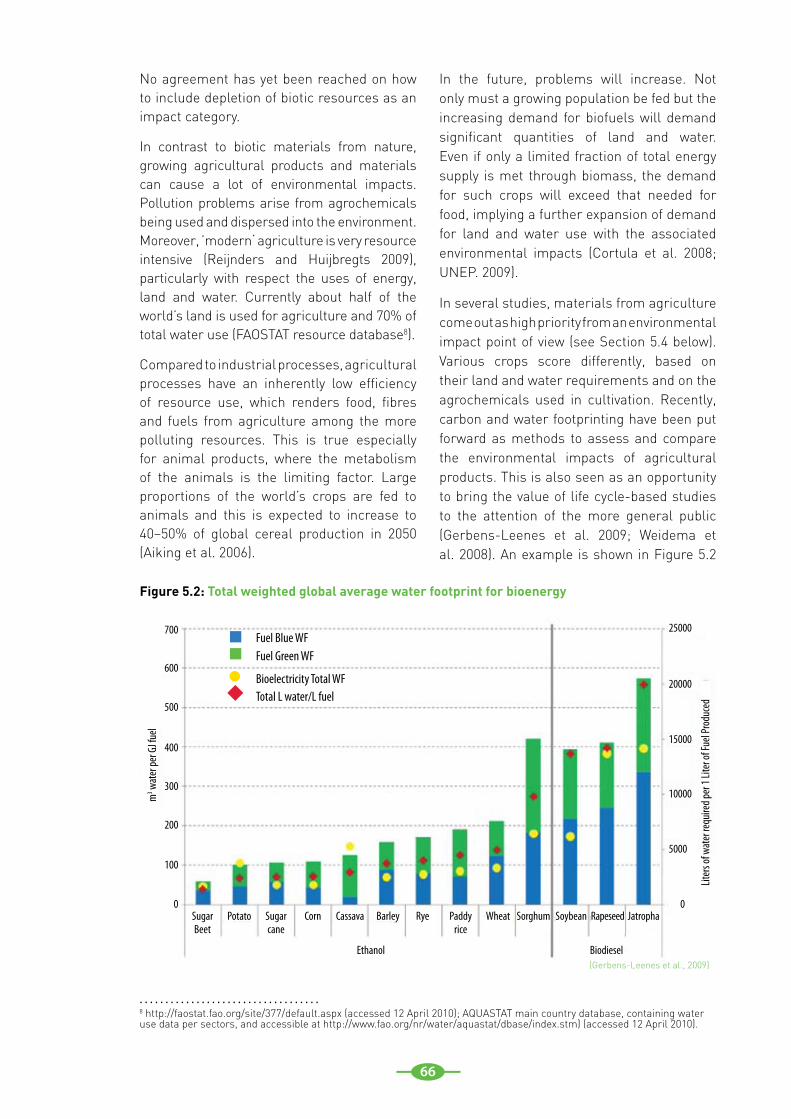
66
Fuel Blue WF
Sugar Beet
700
600
500
400
300
5000
10000
15000
20000
25000
200
100
0 0Potato
m3 w
ater
per G
J fue
l
Sugar cane
Corn Cassava Barley
Ethanol Biodiesel
Rye Paddy rice
Wheat Sorghum Soybean Rapeseed Jatropha
Fuel Green WF
Bioelectricity Total WFTotal L water/L fuel
(Gerbens-Leenes et al., 2009)
Figure 5.2: Total weighted global average water footprint for bioenergy
Liter
s of w
ater
requ
ired p
er 1
Liter
of Fu
el Pr
oduc
ed
No agreement has yet been reached on how to include depletion of biotic resources as an impact category.
In contrast to biotic materials from nature, growing agricultural products and materials can cause a lot of environmental impacts. Pollution problems arise from agrochemicals being used and dispersed into the environment. Moreover, ’modern‘ agriculture is very resource intensive (Reijnders and Huijbregts 2009), particularly with respect the uses of energy, land and water. Currently about half of the world’s land is used for agriculture and 70% of total water use (FAOSTAT resource database8).
Compared to industrial processes, agricultural processes have an inherently low efficiency of resource use, which renders food, fibres and fuels from agriculture among the more polluting resources. This is true especially for animal products, where the metabolism of the animals is the limiting factor. Large proportions of the world’s crops are fed to animals and this is expected to increase to 40–50% of global cereal production in 2050 (Aiking et al. 2006).
In the future, problems will increase. Not only must a growing population be fed but the increasing demand for biofuels will demand significant quantities of land and water. Even if only a limited fraction of total energy supply is met through biomass, the demand for such crops will exceed that needed for food, implying a further expansion of demand for land and water use with the associated environmental impacts (Cortula et al. 2008; UNEP. 2009).
In several studies, materials from agriculture come out as high priority from an environmental impact point of view (see Section 5.4 below). Various crops score differently, based on their land and water requirements and on the agrochemicals used in cultivation. Recently, carbon and water footprinting have been put forward as methods to assess and compare the environmental impacts of agricultural products. This is also seen as an opportunity to bring the value of life cycle-based studies to the attention of the more general public (Gerbens-Leenes et al. 2009; Weidema et al. 2008). An example is shown in Figure 5.2
8 http://faostat.fao.org/site/377/default.aspx (accessed 12 April 2010); AQUASTAT main country database, containing water use data per sectors, and accessible at http://www.fao.org/nr/water/aquastat/dbase/index.stm) (accessed 12 April 2010).
. . . . . . . . . . . . . . . . . . . . . . . . . . . . . . . . . . .
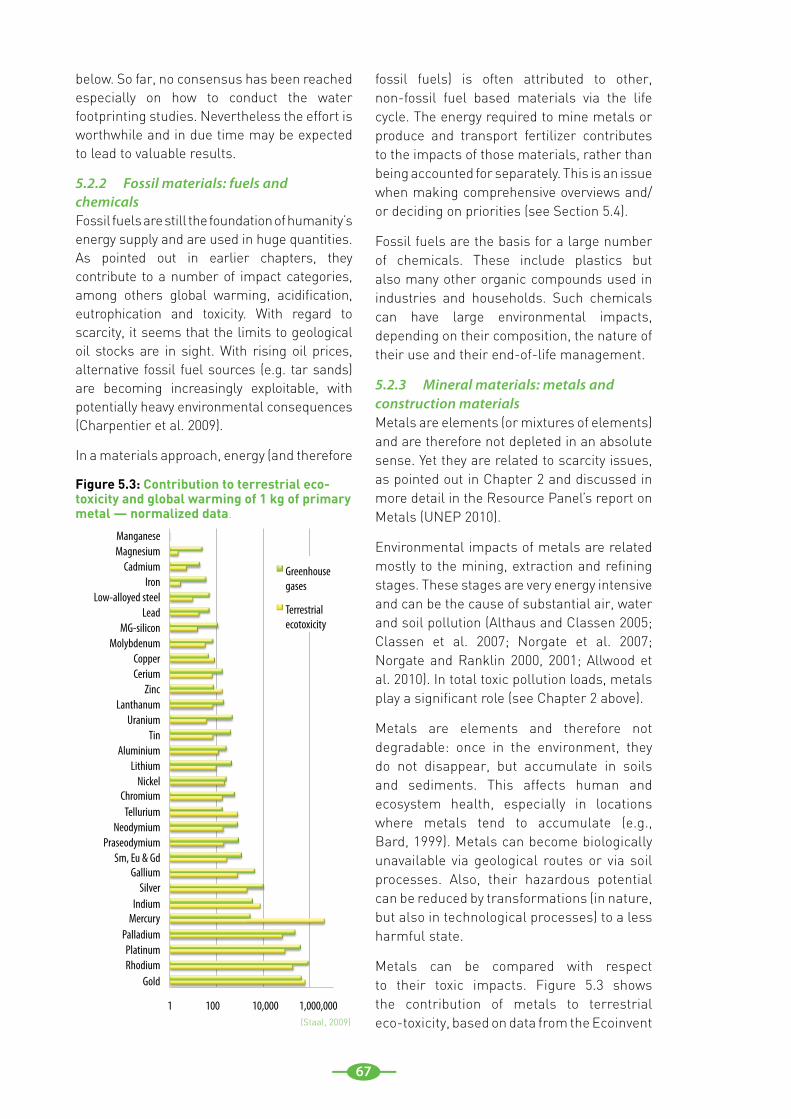
67
below. So far, no consensus has been reached especially on how to conduct the water footprinting studies. Nevertheless the effort is worthwhile and in due time may be expected to lead to valuable results.
5.2.2 Fossil materials: fuels and chemicalsFossil fuels are still the foundation of humanity’s energy supply and are used in huge quantities. As pointed out in earlier chapters, they contribute to a number of impact categories, among others global warming, acidification, eutrophication and toxicity. With regard to scarcity, it seems that the limits to geological oil stocks are in sight. With rising oil prices, alternative fossil fuel sources (e.g. tar sands) are becoming increasingly exploitable, with potentially heavy environmental consequences (Charpentier et al. 2009).
In a materials approach, energy (and therefore
fossil fuels) is often attributed to other, non-fossil fuel based materials via the life cycle. The energy required to mine metals or produce and transport fertilizer contributes to the impacts of those materials, rather than being accounted for separately. This is an issue when making comprehensive overviews and/or deciding on priorities (see Section 5.4).
Fossil fuels are the basis for a large number of chemicals. These include plastics but also many other organic compounds used in industries and households. Such chemicals can have large environmental impacts, depending on their composition, the nature of their use and their end-of-life management.
5.2.3 Mineral materials: metals and construction materialsMetals are elements (or mixtures of elements) and are therefore not depleted in an absolute sense. Yet they are related to scarcity issues, as pointed out in Chapter 2 and discussed in more detail in the Resource Panel’s report on Metals (UNEP 2010).
Environmental impacts of metals are related mostly to the mining, extraction and refining stages. These stages are very energy intensive and can be the cause of substantial air, water and soil pollution (Althaus and Classen 2005; Classen et al. 2007; Norgate et al. 2007; Norgate and Ranklin 2000, 2001; Allwood et al. 2010). In total toxic pollution loads, metals play a significant role (see Chapter 2 above).
Metals are elements and therefore not degradable: once in the environment, they do not disappear, but accumulate in soils and sediments. This affects human and ecosystem health, especially in locations where metals tend to accumulate (e.g., Bard, 1999). Metals can become biologically unavailable via geological routes or via soil processes. Also, their hazardous potential can be reduced by transformations (in nature, but also in technological processes) to a less harmful state.
Metals can be compared with respect to their toxic impacts. Figure 5.3 shows the contribution of metals to terrestrial eco-toxicity, based on data from the Ecoinvent
1 100 10,000 1,000,000
Gold Rhodium Platinum
Palladium Mercury
Indium Silver
Gallium Sm, Eu & Gd
Praseodymium Neodymium
Tellurium Chromium
Nickel Lithium
Aluminium Tin
Uranium Lanthanum
Zinc Cerium Copper
Molybdenum MG-silicon
Lead Low-alloyed steel
Iron Cadmium
Magnesium Manganese
Greenhouse gases
Terrestrial ecotoxicity
Figure 5.3: Contribution to terrestrial eco-toxicity and global warming of 1 kg of primary metal — normalized data.
(Staal, 2009)
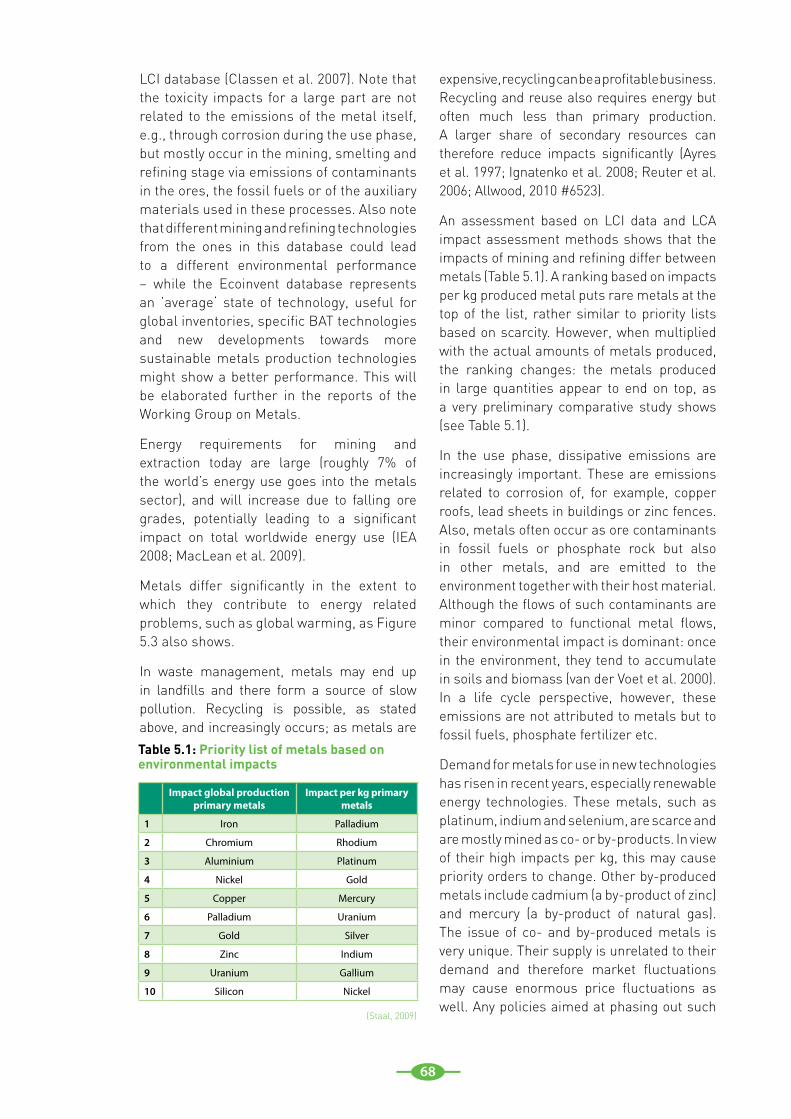
68
LCI database (Classen et al. 2007). Note that the toxicity impacts for a large part are not related to the emissions of the metal itself, e.g., through corrosion during the use phase, but mostly occur in the mining, smelting and refining stage via emissions of contaminants in the ores, the fossil fuels or of the auxiliary materials used in these processes. Also note that different mining and refining technologies from the ones in this database could lead to a different environmental performance – while the Ecoinvent database represents an ’average‘ state of technology, useful for global inventories, specific BAT technologies and new developments towards more sustainable metals production technologies might show a better performance. This will be elaborated further in the reports of the Working Group on Metals.
Energy requirements for mining and extraction today are large (roughly 7% of the world’s energy use goes into the metals sector), and will increase due to falling ore grades, potentially leading to a significant impact on total worldwide energy use (IEA 2008; MacLean et al. 2009).
Metals differ significantly in the extent to which they contribute to energy related problems, such as global warming, as Figure 5.3 also shows.
In waste management, metals may end up in landfills and there form a source of slow pollution. Recycling is possible, as stated above, and increasingly occurs; as metals are
expensive, recycling can be a profitable business. Recycling and reuse also requires energy but often much less than primary production. A larger share of secondary resources can therefore reduce impacts significantly (Ayres et al. 1997; Ignatenko et al. 2008; Reuter et al. 2006; Allwood, 2010 #6523).
An assessment based on LCI data and LCA impact assessment methods shows that the impacts of mining and refining differ between metals (Table 5.1). A ranking based on impacts per kg produced metal puts rare metals at the top of the list, rather similar to priority lists based on scarcity. However, when multiplied with the actual amounts of metals produced, the ranking changes: the metals produced in large quantities appear to end on top, as a very preliminary comparative study shows (see Table 5.1).
In the use phase, dissipative emissions are increasingly important. These are emissions related to corrosion of, for example, copper roofs, lead sheets in buildings or zinc fences. Also, metals often occur as ore contaminants in fossil fuels or phosphate rock but also in other metals, and are emitted to the environment together with their host material. Although the flows of such contaminants are minor compared to functional metal flows, their environmental impact is dominant: once in the environment, they tend to accumulate in soils and biomass (van der Voet et al. 2000). In a life cycle perspective, however, these emissions are not attributed to metals but to fossil fuels, phosphate fertilizer etc.
Demand for metals for use in new technologies has risen in recent years, especially renewable energy technologies. These metals, such as platinum, indium and selenium, are scarce and are mostly mined as co- or by-products. In view of their high impacts per kg, this may cause priority orders to change. Other by-produced metals include cadmium (a by-product of zinc) and mercury (a by-product of natural gas). The issue of co- and by-produced metals is very unique. Their supply is unrelated to their demand and therefore market fluctuations may cause enormous price fluctuations as well. Any policies aimed at phasing out such
Impact global production primary metals
Impact per kg primary metals
1 Iron Palladium
2 Chromium Rhodium
3 Aluminium Platinum
4 Nickel Gold
5 Copper Mercury
6 Palladium Uranium
7 Gold Silver
8 Zinc Indium
9 Uranium Gallium
10 Silicon Nickel
Table 5.1: Priority list of metals based on environmental impacts
(Staal, 2009)
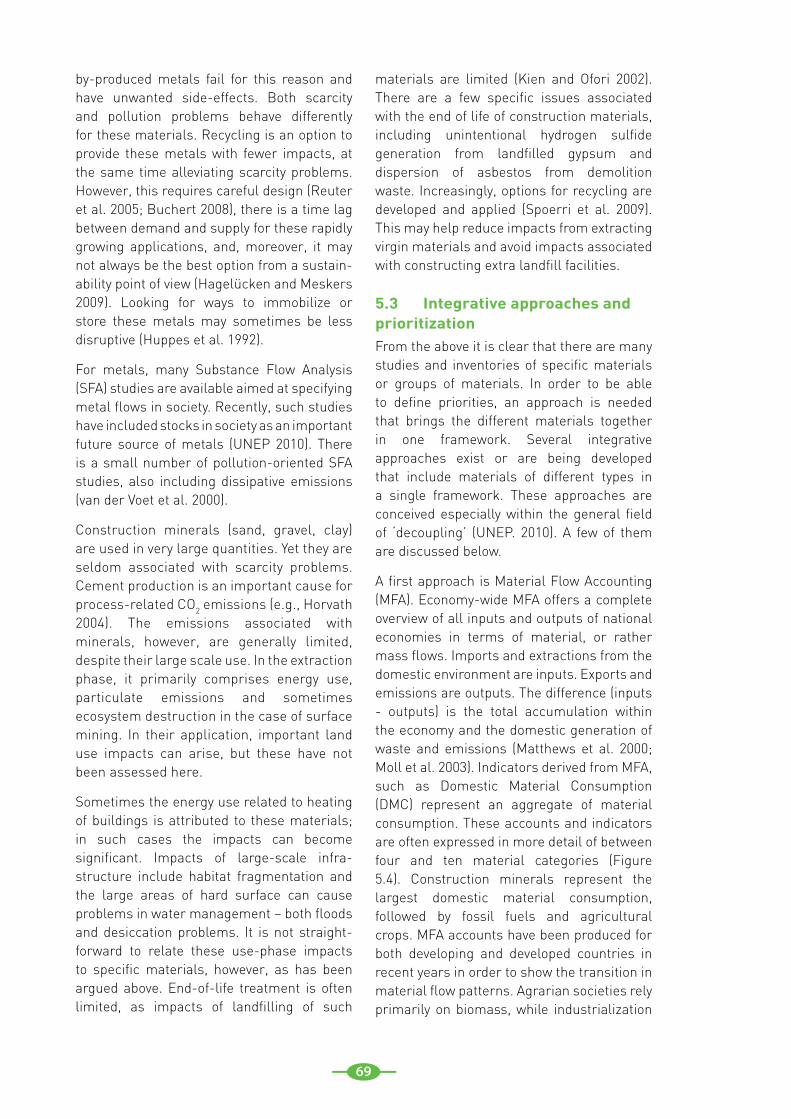
69
by-produced metals fail for this reason and have unwanted side-effects. Both scarcity and pollution problems behave differently for these materials. Recycling is an option to provide these metals with fewer impacts, at the same time alleviating scarcity problems. However, this requires careful design (Reuter et al. 2005; Buchert 2008), there is a time lag between demand and supply for these rapidly growing applications, and, moreover, it may not always be the best option from a sustain-ability point of view (Hagelücken and Meskers 2009). Looking for ways to immobilize or store these metals may sometimes be less disruptive (Huppes et al. 1992).
For metals, many Substance Flow Analysis (SFA) studies are available aimed at specifying metal flows in society. Recently, such studies have included stocks in society as an important future source of metals (UNEP 2010). There is a small number of pollution-oriented SFA studies, also including dissipative emissions (van der Voet et al. 2000).
Construction minerals (sand, gravel, clay) are used in very large quantities. Yet they are seldom associated with scarcity problems. Cement production is an important cause for process-related CO2 emissions (e.g., Horvath 2004). The emissions associated with minerals, however, are generally limited, despite their large scale use. In the extraction phase, it primarily comprises energy use, particulate emissions and sometimes ecosystem destruction in the case of surface mining. In their application, important land use impacts can arise, but these have not been assessed here.
Sometimes the energy use related to heating of buildings is attributed to these materials; in such cases the impacts can become significant. Impacts of large-scale infra-structure include habitat fragmentation and the large areas of hard surface can cause problems in water management – both floods and desiccation problems. It is not straight-forward to relate these use-phase impacts to specific materials, however, as has been argued above. End-of-life treatment is often limited, as impacts of landfilling of such
materials are limited (Kien and Ofori 2002). There are a few specific issues associated with the end of life of construction materials, including unintentional hydrogen sulfide generation from landfilled gypsum and dispersion of asbestos from demolition waste. Increasingly, options for recycling are developed and applied (Spoerri et al. 2009). This may help reduce impacts from extracting virgin materials and avoid impacts associated with constructing extra landfill facilities.
5.3 Integrative approaches and prioritizationFrom the above it is clear that there are many studies and inventories of specific materials or groups of materials. In order to be able to define priorities, an approach is needed that brings the different materials together in one framework. Several integrative approaches exist or are being developed that include materials of different types in a single framework. These approaches are conceived especially within the general field of ‘decoupling’ (UNEP. 2010). A few of them are discussed below.
A first approach is Material Flow Accounting (MFA). Economy-wide MFA offers a complete overview of all inputs and outputs of national economies in terms of material, or rather mass flows. Imports and extractions from the domestic environment are inputs. Exports and emissions are outputs. The difference (inputs - outputs) is the total accumulation within the economy and the domestic generation of waste and emissions (Matthews et al. 2000; Moll et al. 2003). Indicators derived from MFA, such as Domestic Material Consumption (DMC) represent an aggregate of material consumption. These accounts and indicators are often expressed in more detail of between four and ten material categories (Figure 5.4). Construction minerals represent the largest domestic material consumption, followed by fossil fuels and agricultural crops. MFA accounts have been produced for both developing and developed countries in recent years in order to show the transition in material flow patterns. Agrarian societies rely primarily on biomass, while industrialization
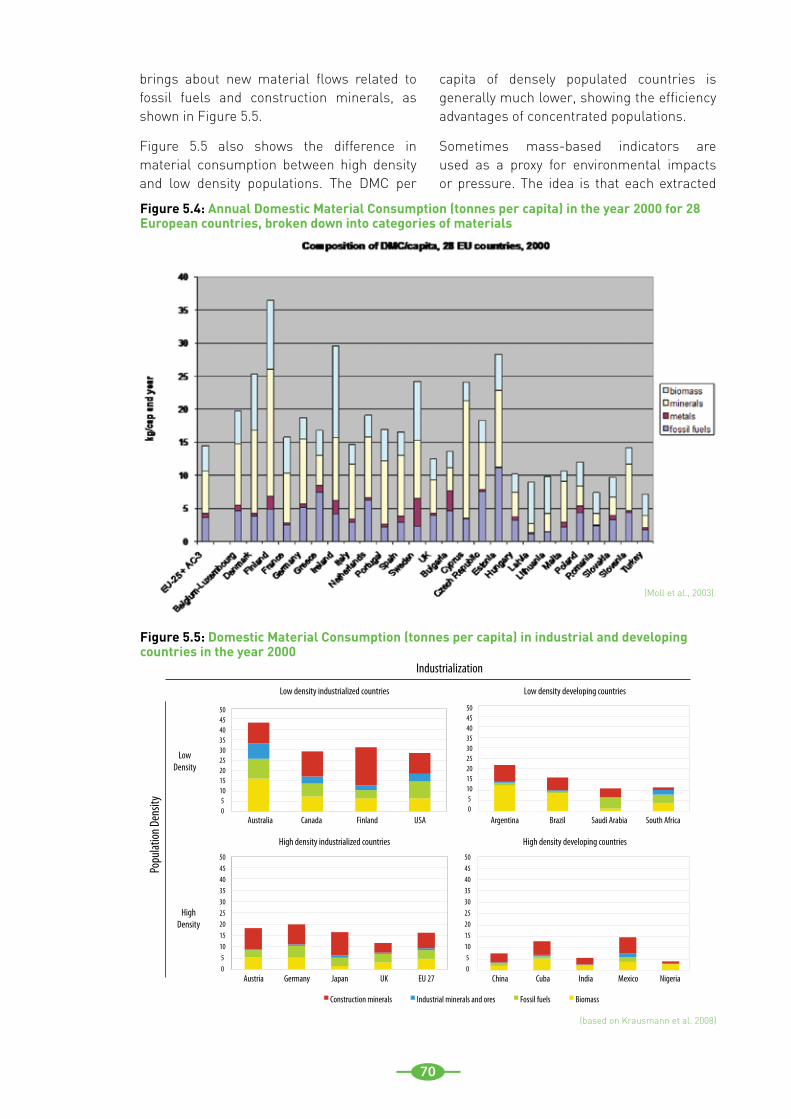
70
brings about new material flows related to fossil fuels and construction minerals, as shown in Figure 5.5.
Figure 5.5 also shows the difference in material consumption between high density and low density populations. The DMC per
capita of densely populated countries is generally much lower, showing the efficiency advantages of concentrated populations.
Sometimes mass-based indicators are used as a proxy for environmental impacts or pressure. The idea is that each extracted
-
5.0
10.0
15.0
20.0
25.0
30.0
35.0
40.0
45.0
50.0
Australia Canada Finland USA
Low density industrialized countries
-
5.0
10.0
15.0
20.0
25.0
30.0
35.0
40.0
45.0
50.0
Argentina Brazil Saudi Arabia South Africa
Low density developing countries
-
5.0
10.0
15.0
20.0
25.0
30.0
35.0
40.0
45.0
50.0
Austria Germany Japan UK EU 27
High density industrialized countries
-
5.0
10.0
15.0
20.0
25.0
30.0
35.0
40.0
45.0
50.0
China Cuba India Mexico Nigeria
High density developing countries
Low Density
Low density industrialized countries
Australia Canada Finland USA Argentina Brazil Saudi Arabia South Africa
NigeriaMexicoIndiaCubaChinaEU 27UKJapanGermanyAustria
50454035302520151050
50454035302520151050
50454035302520151050
50454035302520151050
High density industrialized countries
Low density developing countries
High density developing countries
High Density
Popu
lation
Den
sity
Industrialization
Construction minerals Industrial minerals and ores Fossil fuels Biomass
Figure 5.4: Annual Domestic Material Consumption (tonnes per capita) in the year 2000 for 28 European countries, broken down into categories of materials
(Moll et al., 2003).
Figure 5.5: Domestic Material Consumption (tonnes per capita) in industrial and developing countries in the year 2000
(based on Krausmann et al. 2008)
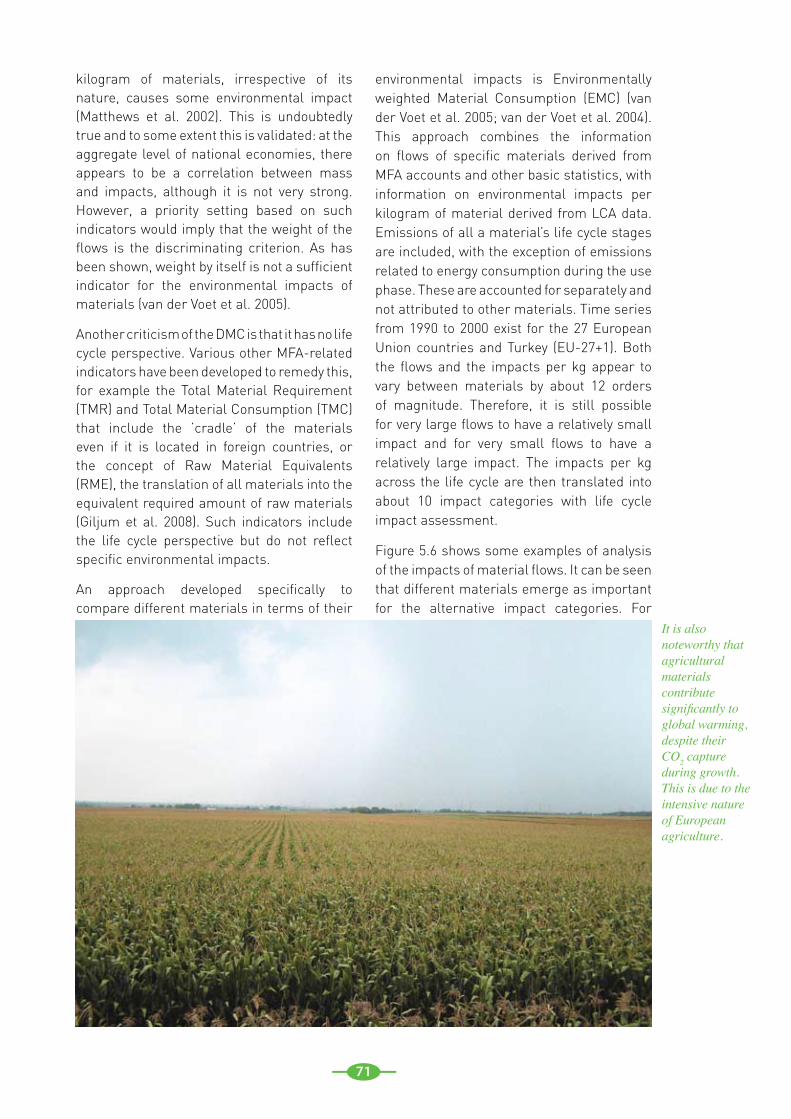
71
kilogram of materials, irrespective of its nature, causes some environmental impact (Matthews et al. 2002). This is undoubtedly true and to some extent this is validated: at the aggregate level of national economies, there appears to be a correlation between mass and impacts, although it is not very strong. However, a priority setting based on such indicators would imply that the weight of the flows is the discriminating criterion. As has been shown, weight by itself is not a sufficient indicator for the environmental impacts of materials (van der Voet et al. 2005).
Another criticism of the DMC is that it has no life cycle perspective. Various other MFA-related indicators have been developed to remedy this, for example the Total Material Requirement (TMR) and Total Material Consumption (TMC) that include the ’cradle’ of the materials even if it is located in foreign countries, or the concept of Raw Material Equivalents (RME), the translation of all materials into the equivalent required amount of raw materials (Giljum et al. 2008). Such indicators include the life cycle perspective but do not reflect specific environmental impacts.
An approach developed specifically to compare different materials in terms of their
environmental impacts is Environmentally weighted Material Consumption (EMC) (van der Voet et al. 2005; van der Voet et al. 2004). This approach combines the information on flows of specific materials derived from MFA accounts and other basic statistics, with information on environmental impacts per kilogram of material derived from LCA data. Emissions of all a material’s life cycle stages are included, with the exception of emissions related to energy consumption during the use phase. These are accounted for separately and not attributed to other materials. Time series from 1990 to 2000 exist for the 27 European Union countries and Turkey (EU-27+1). Both the flows and the impacts per kg appear to vary between materials by about 12 orders of magnitude. Therefore, it is still possible for very large flows to have a relatively small impact and for very small flows to have a relatively large impact. The impacts per kg across the life cycle are then translated into about 10 impact categories with life cycle impact assessment.
Figure 5.6 shows some examples of analysis of the impacts of material flows. It can be seen that different materials emerge as important for the alternative impact categories. For
It is also noteworthy that agricultural materials contribute significantly to global warming, despite their CO2 capture during growth. This is due to the intensive nature of European agriculture.
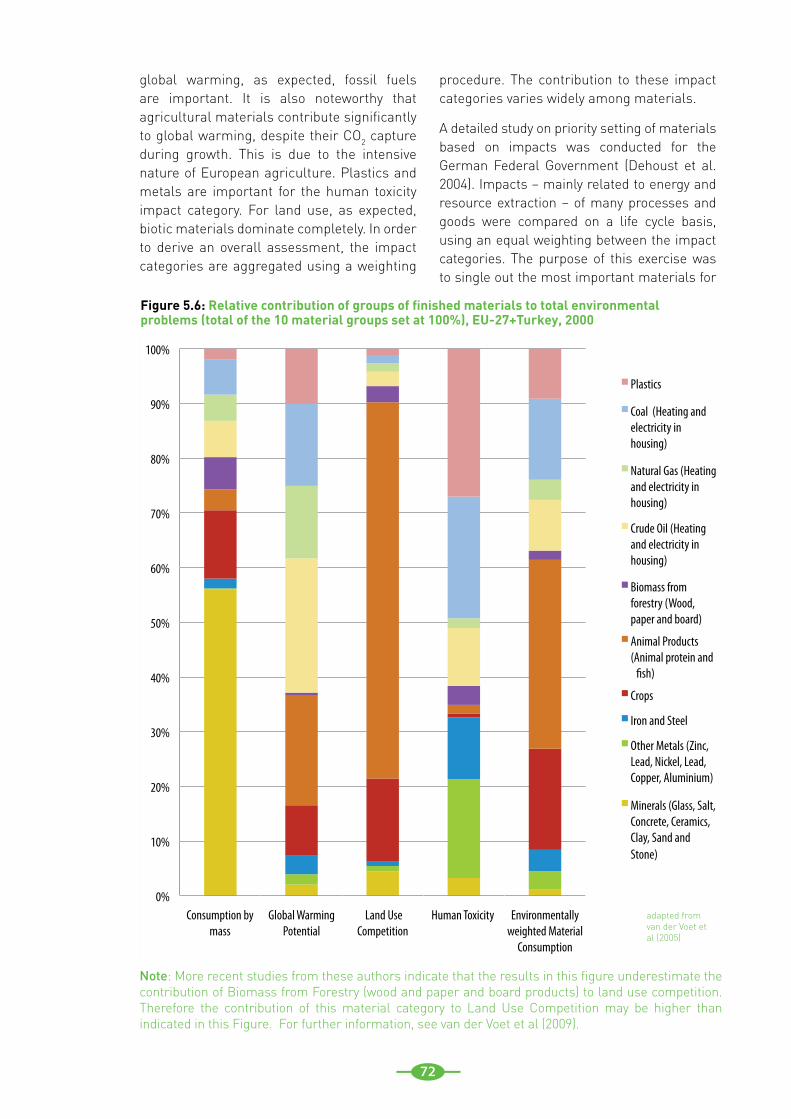
72
0%
10%
20%
30%
40%
50%
60%
70%
80%
90%
100%
Consumption by mass
Global Warming Potential
Land Use Competition
Human Toxicity Environmentally weighted Material
Consumption
Plastics
Coal (Heating and electricity in housing)
Natural Gas (Heating and electricity in housing)
Crude Oil (Heating and electricity in housing)
Biomass from forestry (Wood, paper and board)
Animal Products (Animal protein and
�sh)
Crops
Iron and Steel
Other Metals (Zinc, Lead, Nickel, Lead, Copper, Aluminium)
Minerals (Glass, Salt, Concrete, Ceramics, Clay, Sand and Stone)
Figure 5.6: Relative contribution of groups of finished materials to total environmental problems (total of the 10 material groups set at 100%), EU-27+Turkey, 2000
global warming, as expected, fossil fuels are important. It is also noteworthy that agricultural materials contribute significantly to global warming, despite their CO2 capture during growth. This is due to the intensive nature of European agriculture. Plastics and metals are important for the human toxicity impact category. For land use, as expected, biotic materials dominate completely. In order to derive an overall assessment, the impact categories are aggregated using a weighting
procedure. The contribution to these impact categories varies widely among materials.
A detailed study on priority setting of materials based on impacts was conducted for the German Federal Government (Dehoust et al. 2004). Impacts – mainly related to energy and resource extraction – of many processes and goods were compared on a life cycle basis, using an equal weighting between the impact categories. The purpose of this exercise was to single out the most important materials for
adapted from van der Voet et al (2005)
Note: More recent studies from these authors indicate that the results in this figure underestimate the contribution of Biomass from Forestry (wood and paper and board products) to land use competition. Therefore the contribution of this material category to Land Use Competition may be higher than indicated in this Figure. For further information, see van der Voet et al (2009).
73
further investigation Figure 5.7 originates from Dehoust et al. (2004). It shows the contribution in % (y-axis) of goods produced by certain sectors of industry (coloured lines) that contribute more than 5% to at least one of the environmental impact indicators they distinguish (represented at the x-axis) for Germany. A similar figure has been made for consumer goods, aggregated by type of material. Produced goods are defined as products from certain industries. In most cases, these can be identified as materials. The life cycle of these goods is not included: for example, processed meat is a good but also a product from stockbreeding. Note also that the criteria are a mix of impacts, scarcity issues and indicators from the physical economy.
There are some specific issues that always occur in integrative efforts such as these. To a large extent they are similar to the issues affecting the composition of decoupling indicators (UNEP 2010). They are:
Completeness• . Setting priorities implies the overview should be comprehensive. The various approaches score differently on this. MFA accounts and input-output tables are in principle comprehensive, while others are not. The reason for not being comprehensive is often practical – in view of the required level of detail, information is lacking. In the EMC approach, material balances cannot be drafted for all materials due to lacking statistical data.
Level of detail• . Setting priorities means being able to discriminate and distinguish the various materials in sufficient detail. Here, the MFA and input-output analysis approaches are lacking. MFA does not allow for tracking specific materials, while IO has a sectoral structure, which makes it difficult to identify materials at all.
Consistency of the system• . This refers to issues of double-counting and aligning system boundaries. The EMC approach is especially vulnerable to double-counting (e.g., distinguishing both fertilizer and wheat as materials wheat will lead to dou-ble-counting in a life cycle perspective, since fertiliser is used in the wheat chain and its emissions will be attributed to the wheat chain as well). With regard
to system boundaries, the distinction between a geographical system and a life cycle-based system is relevant. A life cycle-based system differs from a geographical system in that the cradle of imported materials and the grave of the exported wastes are accounted for. The MFA and IO systems are basically geographical, while the EMC is basically life cycle based.
The need for weighting• . All aggregate systems somehow, somewhere, have to put in a subjective step when setting priorities. Sometimes, this step is hidden in the procedure (Hertwich et al. 2000). The MFA indicators implicitly prioritize on weight. Input-output analysis and EMC have to put weights to the emissions or impact categories, based on an understanding or consensus on which emission or impact category is intrinsically more severe than the others. This subjective step is the cause of long-standing debates, still unresolved. It is important to realize that this is an unavoidable step in any comprehensive pri-oritization, because the selection of criteria for prioritization is always value laden.
A last issue that needs to be discussed is the fact that the use of the different materials or resources is interlinked (Graedel and van der Voet 2009). Energy resources are required for the production and waste management of all materials. The same is true, in differing degrees, for land and water. Important linkages need to be identified. A clear example is the link between bioenergy and land: supposing a shift to bioenergy, the land availability becomes the binding constraint. The same applies for bioenergy and water.
Another example is the linkage between energy and metals. Currently, about 7% of the world’s energy use goes to metal mining and refinery (IEA, 2008). With declining ore grades, the energy requirement could become an order of magnitude higher, posing another clear constraint. Identifying, understanding and modelling such links between resources will be a very important research activity, with outcomes very relevant for setting priorities.
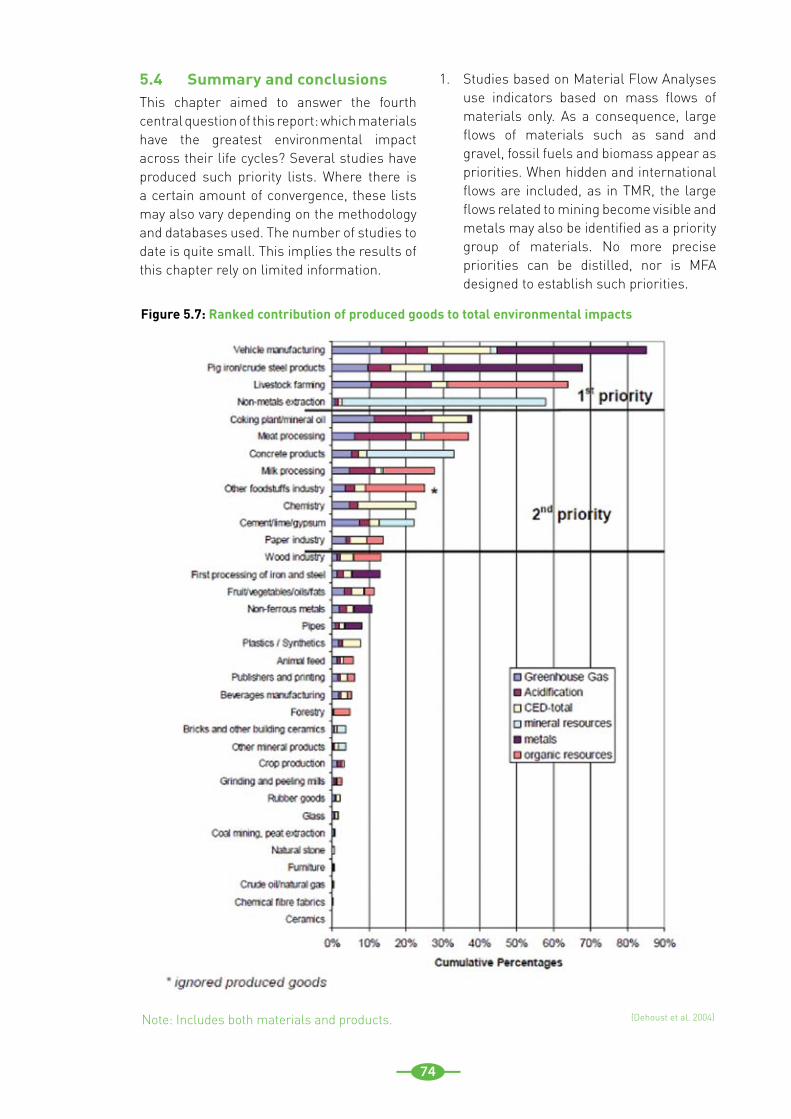
74
5.4 Summary and conclusionsThis chapter aimed to answer the fourth central question of this report: which materials have the greatest environmental impact across their life cycles? Several studies have produced such priority lists. Where there is a certain amount of convergence, these lists may also vary depending on the methodology and databases used. The number of studies to date is quite small. This implies the results of this chapter rely on limited information.
Studies based on Material Flow Analyses 1. use indicators based on mass flows of materials only. As a consequence, large flows of materials such as sand and gravel, fossil fuels and biomass appear as priorities. When hidden and international flows are included, as in TMR, the large flows related to mining become visible and metals may also be identified as a priority group of materials. No more precise priorities can be distilled, nor is MFA designed to establish such priorities.
Figure 5.7: Ranked contribution of produced goods to total environmental impacts
(Dehoust et al. 2004)Note: Includes both materials and products.
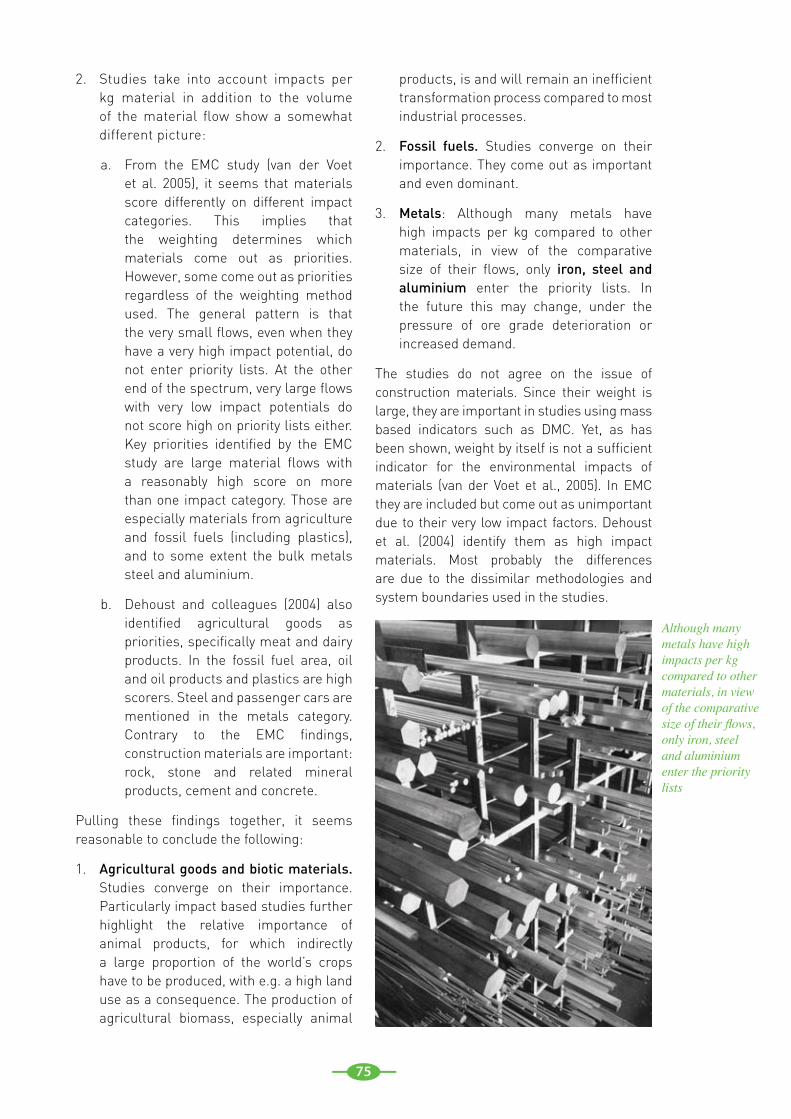
75
Studies take into account impacts per 2. kg material in addition to the volume of the material flow show a somewhat different picture:
From the EMC study (van der Voet a. et al. 2005), it seems that materials score differently on different impact categories. This implies that the weighting determines which materials come out as priorities. However, some come out as priorities regardless of the weighting method used. The general pattern is that the very small flows, even when they have a very high impact potential, do not enter priority lists. At the other end of the spectrum, very large flows with very low impact potentials do not score high on priority lists either. Key priorities identified by the EMC study are large material flows with a reasonably high score on more than one impact category. Those are especially materials from agriculture and fossil fuels (including plastics), and to some extent the bulk metals steel and aluminium.
Dehoust and colleagues (2004) also b. identified agricultural goods as priorities, specifically meat and dairy products. In the fossil fuel area, oil and oil products and plastics are high scorers. Steel and passenger cars are mentioned in the metals category. Contrary to the EMC findings, construction materials are important: rock, stone and related mineral products, cement and concrete.
Pulling these findings together, it seems reasonable to conclude the following:
Agricultural goods and biotic materials. 1. Studies converge on their importance. Particularly impact based studies further highlight the relative importance of animal products, for which indirectly a large proportion of the world’s crops have to be produced, with e.g. a high land use as a consequence. The production of agricultural biomass, especially animal
products, is and will remain an inefficient transformation process compared to most industrial processes.
Fossil fuels.2. Studies converge on their importance. They come out as important and even dominant.
Metals3. : Although many metals have high impacts per kg compared to other materials, in view of the comparative size of their flows, only iron, steel and aluminium enter the priority lists. In the future this may change, under the pressure of ore grade deterioration or increased demand.
The studies do not agree on the issue of construction materials. Since their weight is large, they are important in studies using mass based indicators such as DMC. Yet, as has been shown, weight by itself is not a sufficient indicator for the environmental impacts of materials (van der Voet et al., 2005). In EMC they are included but come out as unimportant due to their very low impact factors. Dehoust et al. (2004) identify them as high impact materials. Most probably the differences are due to the dissimilar methodologies and system boundaries used in the studies.
Although many metals have high impacts per kg compared to other materials, in view of the comparative size of their flows, only iron, steel and aluminium enter the priority lists

76
77
6.1 IntroductionIn the present report, an attempt has been made to find and evaluate studies specifying the environmental and resource impacts of consumption categories and materials at the national, continental or global level. The report did so by reviewing the available authoritative knowledge with regard to the following issues. Chapter 2 first posed the question which pressures and impacts on to ecosystems, human health and resource availability from the current economic system are most relevant. We then went on analyzing which economic drivers contribute most to these pressures and impacts, from an industrial production perspective (Chapter 3), a final consumption perspective (Chapter 4) and a material use perspective (Chapter 5). We first discuss here the limitations of the available science (Section 6.2), followed by the priority lists from the three perspectives (Section 6.3-6.5), and ending with a future outlook, integrated conclusions, and recommendations for further research (Section 6.6 and 6.7).
6.2 Limitations of the available scienceThis report showed that a significant number of studies is available that helped to assess the most important causes of environmental impacts from a production, consumption and materials perspective. As we will show in the next sections, these different studies, and different perspectives points, paint a consistent overall picture, and conclusions presented can hence be regarded as robust. Having said this, certain limitations of the available science apply.
Few studies have been conducted to develop priority lists of products or materials, but information that can be used for this purpose exists in work on household consumption and life cycle assessments of materials.
With regards to priority impacts, we can conclude that pollution-related impacts are
generally better assessed than ecosystem-habitat impacts in studies on environmental impacts of human activities. This is not surprising, since it is very difficult to relate ecosystem impacts to specific resources, economic activities or consumption categories.
The competition for (or depletion of) abiotic resources is poorly understood and remains controversial. There is a shortage of data and scientific analysis addressing technological issues of substitution, resource requirements of new technologies, recycling potential of metals and other materials in complex products, and economic and environmental costs of decreasing ore grades. For impacts on ecosystems, there is a need for better data, analysis and impact assessment methods, especially for habitat change and biotic resource use.
There is also a regional disparity in the availability of information. For consumption categories and products, studies exist in most OECD countries. Most studies focus on fossil fuels, energy and GHG emissions and thus climate change, while a few have expanded their analysis to include other types of pollution (such as acidification, eutrophication, photochemical smog formation, and toxicity).
The available assessments generally do not cover all environmental impacts that were identified as important in Chapter 2. Consumption-oriented studies exist for only a few developing countries, covering only energy and climate impacts. For materials, prioritization studies exist only for Europe.
A general issue in studies that specify a wide range of impacts of national economies is that of aggregation. If an overall judgment must be given, or priorities must be set, it must be possible to aggregate parts of the socio- economic system, as well as all environmental impacts. Aggregating economic activity is often done in terms of money, e.g., GDP. For environmental pressures used in life cycle
6 Findings and conclusions
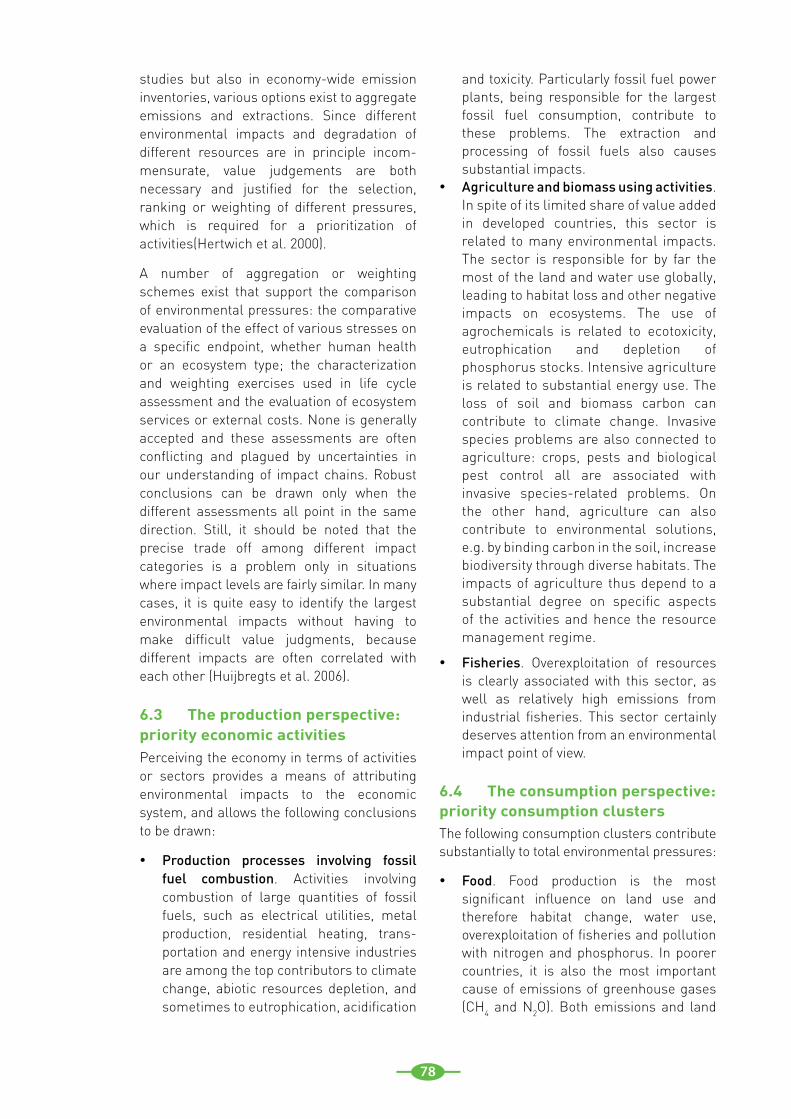
78
studies but also in economy-wide emission inventories, various options exist to aggregate emissions and extractions. Since different environmental impacts and degradation of different resources are in principle incom-mensurate, value judgements are both necessary and justified for the selection, ranking or weighting of different pressures, which is required for a prioritization of activities(Hertwich et al. 2000).
A number of aggregation or weighting schemes exist that support the comparison of environmental pressures: the comparative evaluation of the effect of various stresses on a specific endpoint, whether human health or an ecosystem type; the characterization and weighting exercises used in life cycle assessment and the evaluation of ecosystem services or external costs. None is generally accepted and these assessments are often conflicting and plagued by uncertainties in our understanding of impact chains. Robust conclusions can be drawn only when the different assessments all point in the same direction. Still, it should be noted that the precise trade off among different impact categories is a problem only in situations where impact levels are fairly similar. In many cases, it is quite easy to identify the largest environmental impacts without having to make difficult value judgments, because different impacts are often correlated with each other (Huijbregts et al. 2006).
6.3 The production perspective: priority economic activitiesPerceiving the economy in terms of activities or sectors provides a means of attributing environmental impacts to the economic system, and allows the following conclusions to be drawn:
Production processes involving fossil •fuel combustion. Activities involving combustion of large quantities of fossil fuels, such as electrical utilities, metal production, residential heating, trans-portation and energy intensive industries are among the top contributors to climate change, abiotic resources depletion, and sometimes to eutrophication, acidification
and toxicity. Particularly fossil fuel power plants, being responsible for the largest fossil fuel consumption, contribute to these problems. The extraction and processing of fossil fuels also causes substantial impacts.Agriculture and biomass using activities• . In spite of its limited share of value added in developed countries, this sector is related to many environmental impacts. The sector is responsible for by far the most of the land and water use globally, leading to habitat loss and other negative impacts on ecosystems. The use of agrochemicals is related to ecotoxicity, eutrophication and depletion of phosphorus stocks. Intensive agriculture is related to substantial energy use. The loss of soil and biomass carbon can contribute to climate change. Invasive species problems are also connected to agriculture: crops, pests and biological pest control all are associated with invasive species-related problems. On the other hand, agriculture can also contribute to environmental solutions, e.g. by binding carbon in the soil, increase biodiversity through diverse habitats. The impacts of agriculture thus depend to a substantial degree on specific aspects of the activities and hence the resource management regime.
• Fisheries. Overexploitation of resources is clearly associated with this sector, as well as relatively high emissions from industrial fisheries. This sector certainly deserves attention from an environmental impact point of view.
6.4 The consumption perspective: priority consumption clustersThe following consumption clusters contribute substantially to total environmental pressures:
Food• . Food production is the most significant influence on land use and therefore habitat change, water use, overexploitation of fisheries and pollution with nitrogen and phosphorus. In poorer countries, it is also the most important cause of emissions of greenhouse gases (CH4 and N2O). Both emissions and land
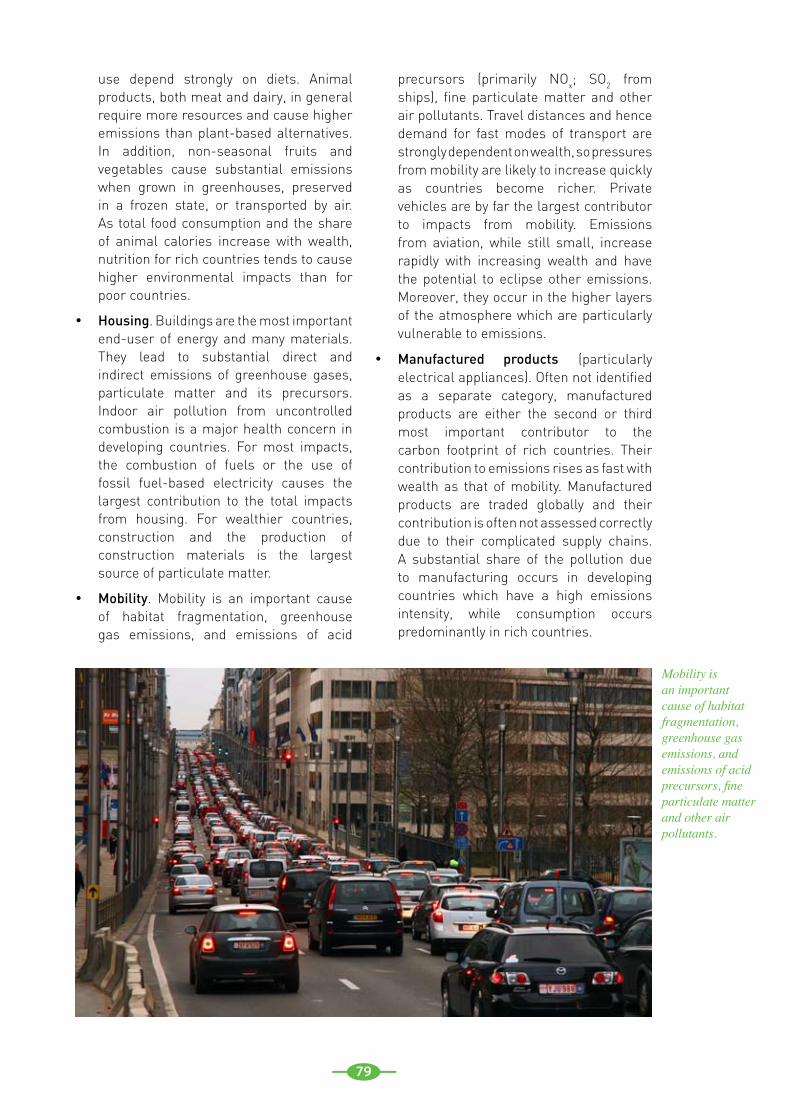
79
use depend strongly on diets. Animal products, both meat and dairy, in general require more resources and cause higher emissions than plant-based alternatives. In addition, non-seasonal fruits and vegetables cause substantial emissions when grown in greenhouses, preserved in a frozen state, or transported by air. As total food consumption and the share of animal calories increase with wealth, nutrition for rich countries tends to cause higher environmental impacts than for poor countries.
Housing• . Buildings are the most important end-user of energy and many materials. They lead to substantial direct and indirect emissions of greenhouse gases, particulate matter and its precursors. Indoor air pollution from uncontrolled combustion is a major health concern in developing countries. For most impacts, the combustion of fuels or the use of fossil fuel-based electricity causes the largest contribution to the total impacts from housing. For wealthier countries, construction and the production of construction materials is the largest source of particulate matter.
Mobility• . Mobility is an important cause of habitat fragmentation, greenhouse gas emissions, and emissions of acid
precursors (primarily NOx; SO2 from ships), fine particulate matter and other air pollutants. Travel distances and hence demand for fast modes of transport are strongly dependent on wealth, so pressures from mobility are likely to increase quickly as countries become richer. Private vehicles are by far the largest contributor to impacts from mobility. Emissions from aviation, while still small, increase rapidly with increasing wealth and have the potential to eclipse other emissions. Moreover, they occur in the higher layers of the atmosphere which are particularly vulnerable to emissions.
Manufactured products• (particularly electrical appliances). Often not identified as a separate category, manufactured products are either the second or third most important contributor to the carbon footprint of rich countries. Their contribution to emissions rises as fast with wealth as that of mobility. Manufactured products are traded globally and their contribution is often not assessed correctly due to their complicated supply chains. A substantial share of the pollution due to manufacturing occurs in developing countries which have a high emissions intensity, while consumption occurs predominantly in rich countries.
Mobility is an important cause of habitat fragmentation, greenhouse gas emissions, and emissions of acid precursors, fine particulate matter and other air pollutants.
80
6.5 The material perspective: priority materialsFrom assessments of resource categories and materials, the following conclusions can be drawn with regard to their environmental impacts:
Fossil fuel extraction• is not only one of the most important material flow in mass terms, it is also one of the most important sources of environmental degradation. It is linked to mining and all its local ecosystem impacts and the combustion of the fuels for electricity, heat or transport causes the largest emissions of GHG, especially CO2. Fossil fuels are also the source of many other air emissions, especially SO2, NOx and particulates, but also polycyclic aromatic hydrocarbons (PAH) and heavy metals.
Agricultural materials, especially animal •products, are also a very important material flow in terms of their contribution to a large number of impact categories. Animal products are important because more than half of the world’s crops are used to feed animals, not people. Land and water use, pollution with nitrogen and phosphorus, and GHG emissions from land use and fossil fuel use cause substantial environmental impacts.
Extracting and refining materials that •are used for their structural or material properties and not as energy source, contributes significantly to a number of pollution- and resource-related impact categories, although it’s overall importance is less than that of fossil fuels or agricultural materials. Plastics, and iron and steel are the most important materials in terms of their contribution to environmental impacts.
6.6 Integrated conclusions and future outlook6.6.1 IntegrationAs shown in Chapter 2, economic activities pose already a significant strain on particularly ecosystem health and resource availability. There is over-exploitation of fisheries and to a lesser extent forests. The risks related to climate change and related fossil energy use have been extensively described in the latest IPCC review (IPCC, 2007) and the Stern report (Stern, 2006). Demand projections indicate that the consumption of some abiotic resources (some metals and oil and gas) will most likely outstrip supply and may exhaust available reserves within the current century. Water is becoming a scarce commodity in many parts of the world.
Animal products, both meat and
dairy, in general require more
resources and cause higher
emissions than plant-based alternatives.
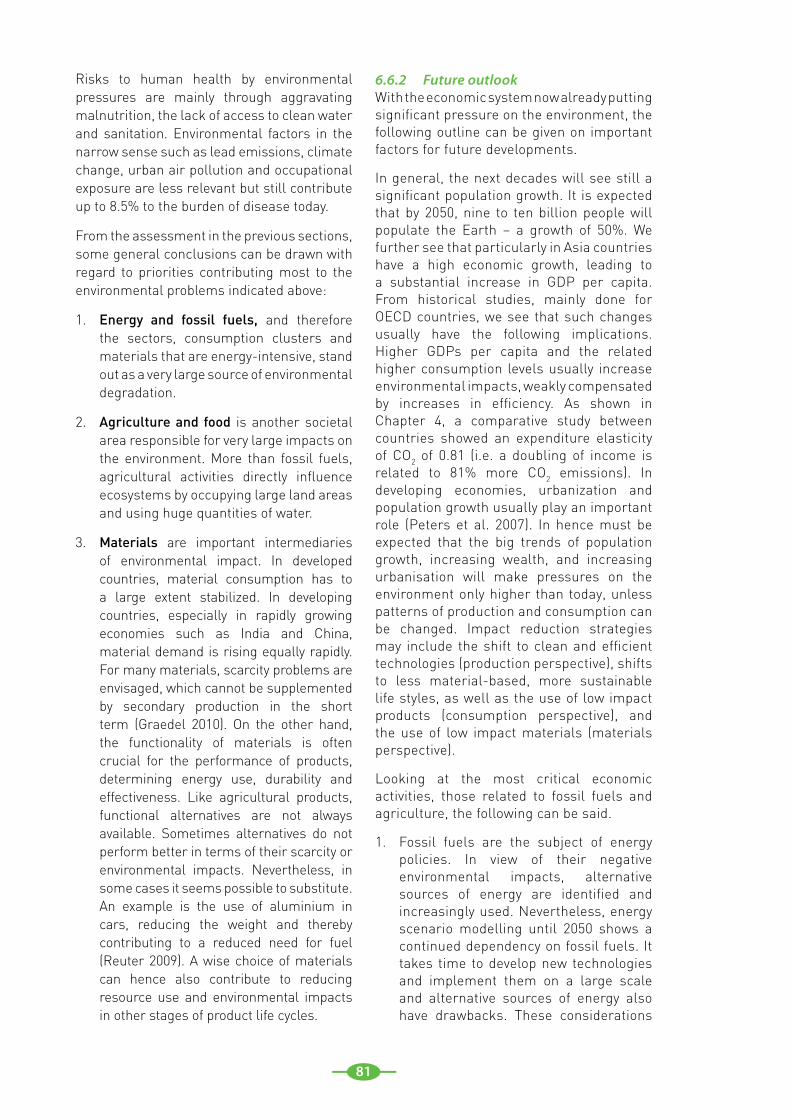
81
Risks to human health by environmental pressures are mainly through aggravating malnutrition, the lack of access to clean water and sanitation. Environmental factors in the narrow sense such as lead emissions, climate change, urban air pollution and occupational exposure are less relevant but still contribute up to 8.5% to the burden of disease today.
From the assessment in the previous sections, some general conclusions can be drawn with regard to priorities contributing most to the environmental problems indicated above:
Energy and fossil fuels,1. and therefore the sectors, consumption clusters and materials that are energy-intensive, stand out as a very large source of environmental degradation.
Agriculture and food2. is another societal area responsible for very large impacts on the environment. More than fossil fuels, agricultural activities directly influence ecosystems by occupying large land areas and using huge quantities of water.
Materials3. are important intermediaries of environmental impact. In developed countries, material consumption has to a large extent stabilized. In developing countries, especially in rapidly growing economies such as India and China, material demand is rising equally rapidly. For many materials, scarcity problems are envisaged, which cannot be supplemented by secondary production in the short term (Graedel 2010). On the other hand, the functionality of materials is often crucial for the performance of products, determining energy use, durability and effectiveness. Like agricultural products, functional alternatives are not always available. Sometimes alternatives do not perform better in terms of their scarcity or environmental impacts. Nevertheless, in some cases it seems possible to substitute. An example is the use of aluminium in cars, reducing the weight and thereby contributing to a reduced need for fuel (Reuter 2009). A wise choice of materials can hence also contribute to reducing resource use and environmental impacts in other stages of product life cycles.
6.6.2 Future outlookWith the economic system now already putting significant pressure on the environment, the following outline can be given on important factors for future developments.
In general, the next decades will see still a significant population growth. It is expected that by 2050, nine to ten billion people will populate the Earth – a growth of 50%. We further see that particularly in Asia countries have a high economic growth, leading to a substantial increase in GDP per capita. From historical studies, mainly done for OECD countries, we see that such changes usually have the following implications. Higher GDPs per capita and the related higher consumption levels usually increase environmental impacts, weakly compensated by increases in efficiency. As shown in Chapter 4, a comparative study between countries showed an expenditure elasticity of CO2 of 0.81 (i.e. a doubling of income is related to 81% more CO2 emissions). In developing economies, urbanization and population growth usually play an important role (Peters et al. 2007). In hence must be expected that the big trends of population growth, increasing wealth, and increasing urbanisation will make pressures on the environment only higher than today, unless patterns of production and consumption can be changed. Impact reduction strategies may include the shift to clean and efficient technologies (production perspective), shifts to less material-based, more sustainable life styles, as well as the use of low impact products (consumption perspective), and the use of low impact materials (materials perspective).
Looking at the most critical economic activities, those related to fossil fuels and agriculture, the following can be said.
Fossil fuels are the subject of energy 1. policies. In view of their negative environmental impacts, alternative sources of energy are identified and increasingly used. Nevertheless, energy scenario modelling until 2050 shows a continued dependency on fossil fuels. It takes time to develop new technologies and implement them on a large scale and alternative sources of energy also have drawbacks. These considerations
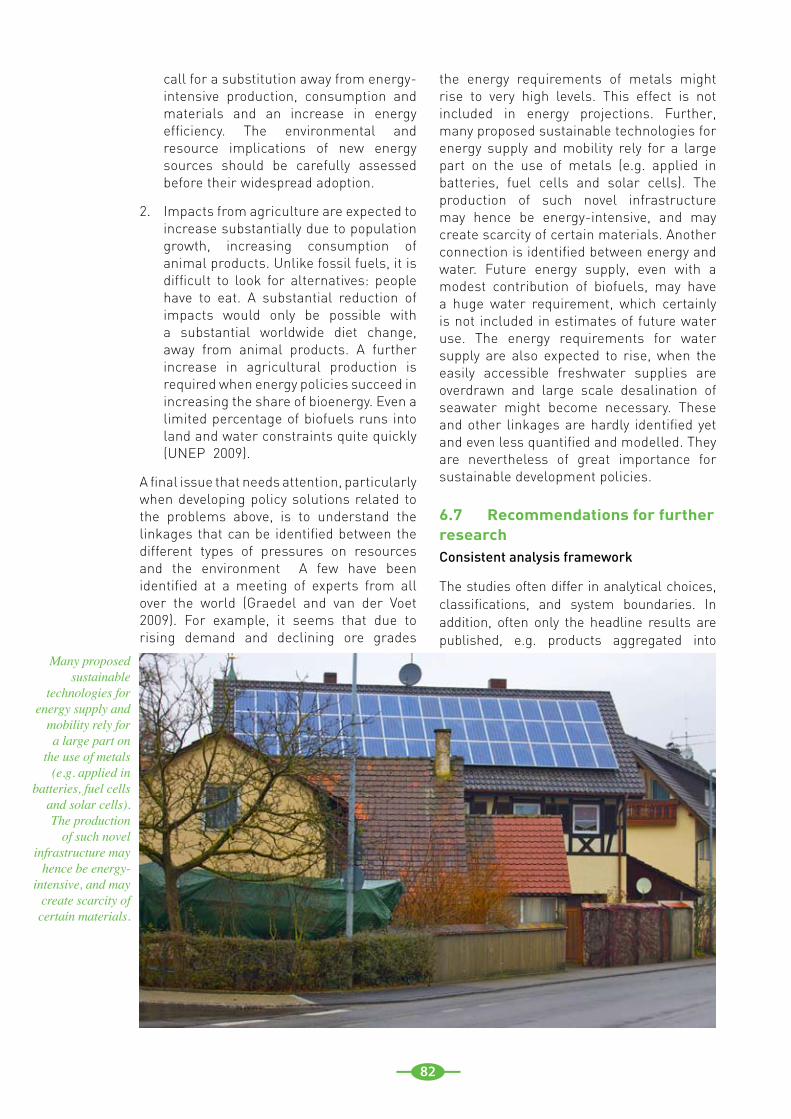
82
call for a substitution away from energy- intensive production, consumption and materials and an increase in energy efficiency. The environmental and resource implications of new energy sources should be carefully assessed before their widespread adoption.
Impacts from agriculture are expected to 2. increase substantially due to population growth, increasing consumption of animal products. Unlike fossil fuels, it is difficult to look for alternatives: people have to eat. A substantial reduction of impacts would only be possible with a substantial worldwide diet change, away from animal products. A further increase in agricultural production is required when energy policies succeed in increasing the share of bioenergy. Even a limited percentage of biofuels runs into land and water constraints quite quickly (UNEP 2009).
A final issue that needs attention, particularly when developing policy solutions related to the problems above, is to understand the linkages that can be identified between the different types of pressures on resources and the environment A few have been identified at a meeting of experts from all over the world (Graedel and van der Voet 2009). For example, it seems that due to rising demand and declining ore grades
the energy requirements of metals might rise to very high levels. This effect is not included in energy projections. Further, many proposed sustainable technologies for energy supply and mobility rely for a large part on the use of metals (e.g. applied in batteries, fuel cells and solar cells). The production of such novel infrastructure may hence be energy-intensive, and may create scarcity of certain materials. Another connection is identified between energy and water. Future energy supply, even with a modest contribution of biofuels, may have a huge water requirement, which certainly is not included in estimates of future water use. The energy requirements for water supply are also expected to rise, when the easily accessible freshwater supplies are overdrawn and large scale desalination of seawater might become necessary. These and other linkages are hardly identified yet and even less quantified and modelled. They are nevertheless of great importance for sustainable development policies.
6.7 Recommendations for further researchConsistent analysis framework
The studies often differ in analytical choices, classifications, and system boundaries. In addition, often only the headline results are published, e.g. products aggregated into
Many proposed sustainable
technologies for energy supply and
mobility rely for a large part on
the use of metals (e.g. applied in
batteries, fuel cells and solar cells). The production
of such novel infrastructure may
hence be energy-intensive, and may
create scarcity of certain materials.
83
consumption categories, materials into material categories and emissions weighted by characterization factors. Comparisons and meta-analyses are therefore not possible. We recommend developing common clas-sifications and basic data reporting and documentation standards.
Input-output and emissions data
Input-output data should be reported regularly using a classification system that disaggregates environmentally important sectors and reports resource use and emissions. In addition, work should focus on developing a satisfactory and sufficient way to collect data on capital and infrastructure in a way that is comparable across countries. More attention should also be paid to uncertainty in environmental data, which needs to be sys-tematically analysed and documented.
Materials data
Better data on material flows and life cycle impacts from materials are needed. FAO and IEA track agricultural and energy data at the global level but comparable international efforts to collect material flow data on metals or other minerals do not exist. Life cycle inventories are collected but often not made public in order to protect the interest of low-performing suppliers. The data situation especially for developing countries should be improved.
Scenarios, models, studies
The focus of consumption-oriented studies has been on average consumption baskets and we lack systematic knowledge of the extent of environmental impacts of similar products due to differences in production paths, technologies, or design (Girod and de Haan 2009). There is also too little attention to scenarios for the future, backcasting, or social determinants of impacts of consumption. In addition, cross-national comparisons can offer new insights. However, the most important application of models of the environmental impact of consumption is in connection with efforts to improve the environmental performance of households at the settlement, city and regional level.
For materials, the following issues are important:
Co- and by-product mining, as well as •recycling and reuse, because it determines the extent to which supply can be met by secondary sources (UNEP 2010).
Scenarios about minerals/metals supply •and use should have a similar level of sophistication as energy scenarios. Detailed scenarios for future demand and supply from primary and secondary materials do not exist for metals or for construction materials. The development and application of dynamic models of material flow will be helpful to generate such scenarios.
Research should also focus on identifying •linkages between different resources. What will the impact be of a growth in demand for a particular resource on other resources? Which constraints will we run into? What are the possibilities for substituion with more abundant resources? The scale of human activity has become so large that these constraints are becoming more and more important.
The above recommendations in essence call for improving and harmonizing data sets on the existing situation and developing future scenarios. The significant amount of country studies reviewed shows there is a clear international interest into the type of analyses presented in this report. Furthermore, there are various international, harmonized databases providing pieces of the overall picture, such as the IEA energy database, the FAO databases on land use, water use and agricultural production, the UNFCCC greenhouse gas emission inventories, and others. Next to this, there are various large research projects ongoing into data harmonization, but these obviously lack a formal status. Many efforts are hence already ongoing, and bringing them together to produce harmonized data sets and scenarios would have significant benefits for policy making. The Resource Panel recommends UNEP and other Intergovernmental Organizations to explore this window of opportunity and stimulate practical collaborative efforts across countries on this matter.
84
Aiking, H., J. d. Boer, and J. Vereijken, eds. 2006. Sustainable protein production and consumption: pigs or peas?, Environment & policy. Heidelberg: Springer.
Allwood, J. M., J. M. Cullen, and R. L. Milford. 2010. Options for achieving a 50% cut in industrial carbon emissions by 2050. Environmental Science and Technology 44(6): 1888-1894.
Althaus, H. J. and M. Classen. 2005. Life cycle inventories of metals and methodological aspects of inventorying material resources in ecoinvent. International Journal of Life Cycle Assessment 10(1): 43-49.
Andersson, B. A. and I. Råde. 2002. Material constraints on technology evolution: the case of scarce metals and emerging energy technologies. In A Handbook of Industrial Ecology, edited by R. U. Ayres and L. W. Ayres. Cheltenham: Edward Elgar.
Arvesen, A., J. Liu, and E. G. Hertwich. 2010. Energy Cost of Living and Associated Pollution for Beijing Residents. Journal of Industrial Ecology 14: forthcoming.
Ayres, R. U. 2002. Resources, Scarcity, Technology and Growth. Fontainebleau: INSEAD.
Ayres, R. U. and A. V. Kneese. 1969. Production, Consumption, and Externalities. American Economic Review 59: 282-297.
Ayres, R. U., G. Ferrer, and T. Van Leynseele. 1997. Eco-efficiency, asset recovery and remanufacturing. Fontainebleau: INSEAD.
Bare, J., T. Gloria, and G. Norris. 2006. Development of the method and U.S. normalization database for Life Cycle Impact Assessment and sustainability metrics. Environmental Science & Technology 40(16): 5108-5115.
Barnett, H. J. and C. Morse. 1963. Scarcity and Growth - The Economics of Natural Resource Availability. Baltimore: The Johns Hopkins University Press.
Bengtsson, M. and B. Steen. 2000. Weighting in LCA - Approaches and applications. Envrionmental Progress, 19(2): 101-109.
Biesiot, W. and K. J. Noorman. 1999. Energy requirements of household consumption: a case study of The Netherlands. Ecological Economics 28(3): 367-383.
Bin, S. and H. Dowlatabadi. 2005. Consumer lifestyle approach to US energy use and the related CO2 emissions. Energy Policy 33(2): 197-208.
Brander, K. M. 2007. Global fish production and climate change. Proceedings of the National Academy of Sciences of the United States of America 104(50): 19709-19714.
Breedveld, L., M. Lafleur, and H. Blonk. 1999. A Framework for Actualising Normalisation Data in LCA: Experiences in the Netherlands. International Journal of Life Cycle Assessment 4(4): 213-220.
Brown, M. T. and R. A. Herendeen. 1996. Embodied energy analysis and EMERGY analysis: A comparative view. Ecological Economics 19(3): 219-235.
Buchert, M. 2008. Critical metals for future sustainable technologies and their recycling potential. Paris: UNEP.
Bullard III, C. W. and R. A. Herendeen. 1975. Energy Impact of Consumption Decisions. Proceedings of the IEEE 63: 484-493.
Canals, L. M. I., C. Bauer, J. Depestele, A. Dubreuil, R. F. Knuchel, G. Gaillard, O. Michelsen, R. Muller-Wenk, and B. Rydgren. 2007. Key elements in a framework for land use impact assessment within LCA. International Journal of Life Cycle Assessment 12(1): 5-15.
7 References
85
Carlsson-Kanyama, A., R. Engström, and R. Kok. 2005. Indirect and direct energy requirements of city households in Sweden - options for reduction, lessons from modeling. Journal of Industrial Ecology 9(1-2): 221-235.
Charpentier, A., J. A. Bergerson, and H. A. MacLeac. 2009. Understanding the Canadian oil sans industry’s greenhouse gas emissions. Environmental Research Letters (014005).
Classen, M., H. Althaus, S. Blaser, W. Scharnhorst, M. Tuchschmid, N. Jungbluth, and M. Faist Emmenegger. 2007. Life Cycle Inventories of Metals. Dübendorf: Swiss Centre for Life-Cycle Inventories.
Cohen, C., M. Lenzen, and R. Schaeffer. 2005. Energy requirements of households in Brazil. Energy Policy 33(4): 555-562
Cortula, L., N. Dyer, and S. Vermeulen. 2008. Fuelling Exclusion? The biofuels boom and the poor people’s access to land. IIED report no. 12551IIED. FAO/IIED.
Corvalan, C., S. Hales, A. McMichael, C. Butler, D. Campbell-Lendrum, U. Confalonieri, K. Leitner, N. Lewis, Jonathan Patz, K. Polson, J. Scheraga, A. Woodward, and M. Younes. 2005. Ecosystems and Human Well-being: Health Synthesis, Millennium Ecosystem Assessment. Geneva: World Health Organization.
COWI. 2002. Analysis of Selected Concepts on Resource Management. A Study to Support the Development of a Thematic Community Strategy on the Sustainable Use of Resources. Brussels: European Commission, DG Environment.
Daly, H. 1999. Steady State Economics: Avoiding Uneconomic Growth. In Handbook of Environmental and Resource Economics, edited by J. van den Bergh. Cheltenham, UK/ Northampton, MA, USA: Edward Elgar.
Davis, S. J. and K. Caldeira. 2010. Consumption-based accounting of CO2 emissions. Proceedings of the National Academy of Sciences 107(12): 5687-5692.
de Bruyn, S., M. Sevenster, G. Warringa, E. van der Voet, and L. van Oers. 2004. Materiaalstromen door de economie en milieubeleid. Een analyse naar indicatoren en beleidstoepassingen van economiebreed materialenbeleid (Material flows through the economy and environmental policy. An analysis of indicators and policy applications of economy wide materials policy). 04.7612.37. Delft: CE Delft.
De Vooys, C. G. N. 1997. Primary Production in Aquatic Environments. In SCOPE 13 - The Global Carbon Cycle, edited by B. Bolin, et al. New York: Wiley.
Deffeyes, K. S. 2001. Hubbert’s Peak: The Impending World Oil Shortage. Princeton: Princeton U.P.
Dehoust, G., M. Buchert, W. Jenseit, F. Schulze, A. Hermann, J. Ferenz, J. Giegrich, H. Fehrenbach, and R. Vogt. 2004. Identification of Relevant Substances and Materials for a Substance Flow-Oriented, Resource-Conserving Waste Management. Bonn: German Federal Ministry for the Environment, Nature Conservation and Nuclear Safety.
Druckman, A. and T. Jackson. 2009. The carbon footprint of UK households 1990-2004: A socio-economically disaggregated, quasi-multi-regional input-output model. Ecological Economics 68(7): 2066-2077.
Duchin, F. 1998. Structural Economics: Measuring Changes in Technology, Lifestyles, and the Environment. Washington DC: Island Press.
Duchin, F. 2005. The sustainable consumption of food: A framework for analyzing scenarios about changes in diets. Journal of Industrial Ecology 9(1-2): 99-114.
Duchin, F. and K. Hubacek. 2003. Linking Social Expenditures to Household Lifestyles: The Social Accounting Matrix. Futures 35(1): 61-74.
Durucan, S., A. Korre, and G. Munoz-Melendez. 2006. Mining life cycle modelling: a cradle-to-gate approach to environmental management in the minerals industry. Journal of Cleaner Production 14(12-13): 1057-1070.
86
EEA. 1999. Environmental Indicators: Typology and Overview. Copenhagen, Denmark
EIA. 2009. Electricity Annual 2007: Energy Information Administration.
EPA. 2007. Toxic Releases Inventory. Washington, D.C.: Environmental Protection Agency.
EPA. 2008. Inventory of U.S. Greenhouse Gas Emissions and Sinks: 1990 – 2006. Washington, D.C., USA: Environmental Protection Agency.
EUROSTAT. 2001a. Economy-wide Material Flow Accounts and Derived Indicators. A Methodological Guide Luxembourg: Statistical Office of the European Union.
Eurostat. 2001b. NAMEAs for air emissions - Results of Pilot Studies. Luxembourg: Office for Official Publications of the European Communities.
Ezzati, M., A. Rodgers, A. D. Lopez, S. Vander Hoorn, and C. J. L. Murray. 2004a. Mortality and Burden of Disease Attributable to Individual Risk Factors. In Comparative Quantification of Health Risks: Global and Regional Burden of Diseases Attributable to Selected Major Risk Factors, edited by M. Ezzati, et al. Geneva: WHO.
Ezzati, M., A. D. Lopez, A. Rodgers, and C. J. L. Murray, eds. 2004b. Comparative Quantification of Health Risks: Global and Regional Burden of Diseases Attributable to Selected Major Risk Factors. Geneva: WHO.
FAO. 2009. Food and Agriculture Organization Statistics. New York: Fisheries and aquaculture section, FAOSTAT, United Nations.
Fischer-Kowalski, M. and H. Haberl, eds. 2007. Socioecological Transitions and Global Change. Trajectories of Social Metabolism and Land Use. Cheltenham, UK: E.Elgar.
Flynn, A., T. Wiedrnann, J. Barrett, and A. Collins. 2006. The environmental impacts of consumption at a subnational level - The ecological footprint of Cardiff. Journal of Industrial Ecology 10(3): 9-24.
Frischknecht, R., N. Jungbluth, H.-J. Althaus, G. Doka, R. Dones, T. Heck, S. Hellweg, R. Hischier, T. Nemecek, G. Rebitzer, and M. Spielmann. 2005. The ecoinvent Database: Overview and Methodological Framework. International Journal of Life Cycle Assessment 10(1): 3-9.
Gerbens-Leenes, P. W. and S. Nonhebel. 2002. Consumption patterns and their effects on land required for food. Ecological Economics 42: 185-199.
Gerbens-Leenes, W., A. Y. Hoekstra, and T. H. van der Meer. 2009. The water footprint of bioenergy. Proceedings of the National Academy of Sciences of the United States of America 106(25): 10219-10223.
Giljum, S., A. Behrens, F. Hinterberger, C. Lutz, and B. Meijer. 2008. Modelling scenarios towards a sustainable use of natural resources in Europe. Environmental Science & Policy 11: 204-216.
Girod, B. and P. de Haan. 2009. GHG reduction potential of changes in consumption patterns and higher quality levels: Evidence from Swiss household consumption survey. Energy Policy 37(12): 5650-5661.
Goedkoop, M. and R. Spriensma. 1999. The Eco-indicator 99. Amersfoort: PRe Consultants.
Goedkoop, M., R. Heijungs, M. Huijbregts, A. De Schryver, J. Struijs, and R. Van Zelm. 2008. ReCiPe 2008: A life cycle impact assessment method which comprises harmonised category indicators at the midpoint and the endpoint level. First edition: Report I: Characterisation. The Hague, The Netherlands: Dutch Ministry of the Environment.
Gordon, R. B., M. Bertram, and T. E. Graedel. 2006. Metal stocks and sustainability. Proceedings of the National Academy of Sciences of the United States of America 103(5): 1209-1214.
Gordon, R. B., M. Bertram, and T. E. Graedel. 2007. On the sustainability of metal supplies: A response to Tilton and Lagos. Resources Policy 32(1-2): 24-28.
87
Graedel, T. E. and E. van der Voet, eds. 2009. Linkages of Sustainability. Ernst Strungmann Forum series. Cambridge (USA): MIT Press.
Guinée, J. B. and R. Heijungs. 1995. A proposal for the definition of resource equivalency factors for use in product life-cycle assessment. Environmental Toxicology and Chemistry. 14: 917-925.
Guinée, J. B., M. Gorree, R. Heijungs, G. Huppes, R. Kleijn, A. de Koning, L. van Oers, A. Wegener Sleeswijk, S. Suh, H. A. Udo de Haes, H. de Brujin, R. van Duin, and M. A. J. Huijbregts. 2002. Handbook on life cycle assessment : operational guide to the ISO standards, Eco-efficiency in industry and science. Dordrecht: Kluwer.
Haberl, H., K. H. Erb, F. Krausmann, V. Gaube, A. Bondeau, C. Plutzar, S. Gingrich, W. Lucht, and M. Fischer-Kowalski. 2007. Quantifying and mapping the human appropriation of net primary production in earth’s terrestrial ecosystems. Proceedings of the National Academy of Sciences of the United States of America 104(31): 12942-12945.
Hagelücken, C. and C. Meskers. 2009. Complex Life-cycles of Precious and Special Metals. In Linkages of Sustainability, edited by T. E. Graedel and E. v. d. Voet. Cambridge: MIT Press.
Hammitt, J. K. 2000. Valuing mortality risk: Theory and practice. Environmental Science & Technology 34(8): 1396-1400.
Hauschild, M. and J. Potting. 2005. Spatial differentiation in life cycle impact assessment: The EDIP2003 methodology. Lyngby: Danish Technical University.
Heijungs, R. 1995. Harmonization of Methods for Impact Assessment. Environmental Science Pollution Research 2(4): 217-224.
Hendrickson, C. T., L. B. Lave, and H. S. Matthews. 2006. Environmental Life Cycle Assessment of Goods and Services: An Input-Output Approach. Washington D.C.: Resources for the Future Press.
Herendeen, R. A. 1978. Total Energy Cost of Household Consumption in Norway, 1973. Energy 3: 615-630.
Herendeen, R. A. and J. Tanaka. 1976. Energy Cost of Living. Energy 1: 165-178.
Herendeen, R. A., C. Ford, and B. Hannon. 1981. Energy cost of living, 1972-1973. Energy 6(12): 1433-1450.
Hertwich, E. G. 2005. Lifecycle Approaches to Sustainable Consumption: A Critical Review. Environmental Science & Technology 39(13): 4673 - 4684.
Hertwich, E. G. and J. K. Hammitt. 2001a. A Decision-Analytic Framework for Impact Assessment, Part I: LCA and Decision Analysis. International Journal of Life Cycle Assessment 6(1): 5-12.
Hertwich, E. G. and J. K. Hammitt. 2001b. A Decision-Analytic Framework for Impact Assessment, Part II: Midpoints, Endpoints, and Criteria for Method Development. International Journal of Life Cycle Assessment 6(5): 265-272.
Hertwich, E. G. and G. P. Peters. 2009. Carbon Footprint of Nations: A Global, Trade-Linked Analysis. Environmental Science & Technology 43(16): 6414-6420.
Hertwich, E. G., T. E. McKone, and W. S. Pease. 1999. Parameter uncertainty and variability in evaluative fate and exposure models. Risk Analysis. 19(6): 1193-1204.
Hertwich, E. G., J. K. Hammitt, and W. S. Pease. 2000. A Theoretical Foundation for Life-Cycle Assessment: Recognizing the Role of Values in Environmental Decision Making. Journal of Industrial Ecology 4(1): 13-28.
Hinterberger, F. and F. Schmidt-Bleek. 1999. Dematerialization, MIPS and Factor 10 - Physical sustainability indicators as a social device. Ecological Economics 29(1): 53-56.
88
Hoekstra, A. Y. and A. K. Chapagain. 2008. Globalization of water: Sharing the planet’s freshwater resources. Oxford, UK: Blackwell Publishing.
Hoekstra, R. and J. van den Bergh. 2006. Constructing physical input-output tables for environmental modeling and accounting: Framework and illustrations. Ecological Economics 59(3): 375-393.
Hofstetter, P. 1998. Perspectives in Life Cycle Impact Assessment: A Structured Approach to Combine Models of the Technosphere, Ecosphere and Valuesphere. Boston: Kluwer.
Horvath, A. 2004. Construction materials and the environment. Annual Review of Environment and Resources 29: 181-204.
Hotelling, H. 1931. The Economics of Exhaustible Resources. Journal of Political Economy 39: 137-175.
Hubacek, K. and L. Sun. 2001. A scenario analysis of China’s land use and land cover change: incorporating biophysical information into input-output modeling. Structural Change and Economic Dynamics 12(4): 367-397.
Huijbregts, M., W. Schöpp, E. Verkuijlen, R. Heijungs, and L. Reijnders. 2000a. Spatially explicity characterization of acidifying and eutrophying air pollution in life-cycle assessment. Journal of Industrial Ecology 4(3): 125-142.
Huijbregts, M. A. J. 1999. Priority Assessment of Toxic Substances in LCA. Amsterdam: University of Amsterdam.
Huijbregts, M. A. J., W. Gilijamse, A. M. J. Ragas, and L. Reijnders. 2003a. Evaluating uncertainty in environmental life-cycle assessment. A case study comparing two insulation options for a Dutch one-family dwelling. Environmental Science & Technology 37(11): 2600-2608.
Huijbregts, M. A. J., L. Breedveld, G. Huppes, A. de Koning, L. van Oers, and S. Suh. 2003b. Normalisation figures for environmental life-cycle assessment: The Netherlands (1997/1998), Western Europe (1995) and the world (1990 and 1995). Journal of Cleaner Production 11(7): 737-748.
Huijbregts, M. A. J., U. Thissen, J. B. Guinee, T. Jager, D. Kalf, D. van de Meent, A. M. J. Ragas, A. Wegener Sleeswijk, and L. Reijnders. 2000b. Priority assessment of toxic substances in life cycle assessment. Part I: Calculation of toxicity potentials for 181 substances with the nested multi-media fate, exposure and effects model USES-LCA. Chemosphere 41(4): 541-573.
Huijbregts, M. A. J., L. J. A. Rombouts, S. Hellweg, R. Frischknecht, A. J. Hendriks, D. Van De Meent, A. M. I. Ragas, L. Reijnders, and J. Struijs. 2006. Is cumulative fossil energy demand a useful indicator for the environmental performance of products? Environmental Science and Technology 40(3): 641-648.
Huppes, G., E. van der Voet, W. G. H. van der Naald, G. Vonkeman, and P. Maxson. 1992. Market-oriented Instruments for European Environmental Policy, European Communities Environmental Policy Series. Richmond, UK: Graham & Trotman
Huppes, G., A. De Koning, S. Suh, R. Heijungs, L. Van Oers, P. Nielsen, and J. B. Guinee. 2006. Environmental impacts of consumption in the European Union: High-resolution input-output tables with detailed environmental extensions. Journal of Industrial Ecology 10(3): 129-146.
IEA. 2008. Worldwide trends in energy use and efficiency. Key insights from IEA indicator analysis. Paris, France:
Ignatenko, O., A. van Schaik, and M. A. Reuter. 2008. Recycling system flexibility: the fundamental solution to achieve high energy and material recovery quotas. Journal of Cleaner Production 16(4): 432-449.
India Ministry of Environment and Forest. 2004. India’s Initial National Communication (NATCOM) to the United Nations Framework Convention on Climate Change (UNFCCC). New Delhi: Ministry of Environment and Forests.
89
IPCC. 2005. Carbon dioxide capture and storage: special report of the Intergovernmental Panel on Climate Change. Cambridge: Cambridge University Press.
IPCC. 2007. Climate Change 2007: Mitigation of Climate Change - Summary for Policy makers. Geneva: International Panel on Climate Change.
ISO 14040. 2006. Environmental management -- Life cycle assessment -- Principles and framework. Geneva: International Standards Organization.
Jalas, M. 2005. The Everyday Life-Context of Increasing Energy Demands: Time Use Survey Data in a Decomposition Analysis. Journal of Industrial Ecology 9(1-2): 129-146.
Jansen, B. and K. Thollier. 2006. Bottom-up life-cycle assessment of product consumption in Belgium. Journal of Industrial Ecology 10(3): 41-55.
Jevons, W. S. 1965. The coal question: an inquiry concerning the progress of the nation, and theprobable exhaustion of our coal mines. New York: Augustus M. Kelley.
Jolliet, O., M. Margini, R. Charles, S. Humbert, J. Payet, and G. Rebitzer. 2003. IMPACT 2002+: A new life cycle impact assessment methodology. International Journal of Life Cycle Assessment 8: 324-330.
Josa, A., A. Aguado, A. Cardim, and E. Byars. 2007. Comparative analysis of the life cycle impact assessment of available cement inventories in the EU. Cement and Concrete Research 37(5): 781-788.
Jungbluth, N., R. Steiner, and F. R. B. 2007. Graue Treibhausgas-Emissionen der Schweiz: 1990 bis 2004. Bern (CH): Bundesamt für Umwelt.
Kien, H. L. and G. Ofori. 2002. Minimising environmental impact of building materials in Singapore: role of architects. International Journal of Environmental Technology and Management 12(1/2/3): 244-266.
KIKO. 2008. Greenhouse Gas Emissions in Japan: Analysis of First Data Reported (FY2006) from Emissions Accounting, Reporting and Disclosure System for Large Emitters under Japan’s “The Law Concerning the Protection of the Measures to Cope with Global Warming”. Kyoto, Japan: KIKO Network.
Kim, J.-H. 2002. Changes in consumption patterns and environmental degradation in Korea. Structural Change and Economic Dynamics 13(1): 1-48.
Klepper, O., J. Bakker, T. P. Traas, and D. vandeMeent. 1998. Mapping the potentially affected fraction (PAF) of species as a basis for comparison of ecotoxicological risks between substances and regions. Journal of Hazardous Materials 61(1-3): 337-344.
Koehler, A. 2009. Water use in LCA: managing the planet’s freshwater resources. International Journal of Life Cycle Assessment(13): 451-455.
Kok, R., R. M. J. Benders, and H. C. Moll. 2006. Measuring the environmental load of household consumption using some methods based on input-output energy analysis: A comparison of methods and a discussion of results. Energy Policy 34(17): 2744-2761.
Kok, R., H. J. Falkena, R. Benders, H. C. Moll, and K. J. Noorman. 2003. Household metabolism in European countries and cities. Comparing and evaluating the results of the cities Fredrikstad (Norway), Groningen (the Netherlands), Guildford (UK), and Stockholm (Sweden). . Groningen, NL: Centre for Energy and Environmental Studies, University of Groningen.
Kramer, K. J., H. C. Moll, S. Nonhebel, and H. C. Wilting. 1999. Greenhouse gas emissions related to Dutch food consumption. Energy Policy 27(4): 203-216.
Krausmann, F., M. Fischer-Kowalski, H. Schandl, and N. Eisenmenger 2008. The global socio-metabolic transition: past and present metabolic profiles and their future trajectories. Journal of Industrial Ecology 12(5/6), 637-656.
90
Krautkraemer, J. A. 2005. Economics of Scarcity: The State of the Debate. In Scarcity and Growth Revisited: Natural Resources and the Environment in the New Millennium, edited by R. D. Simpson, et al. Washington: Resources for the Future.
Krewitt, W. 2002. External costs of energy-do the answers match the questions? Looking back at 10 years of ExternE. Energy Policy 30(10): 839-848.
Krewitt, W., P. Mayerhofer, A. Trukenmüller, and R. Friedrich. 1998. Application of the Impact Pathway Analysis in the Context of LCA - The Long Way from Burden to Impact. International Journal of Life Cycle Assessment 3(2): 86-94.
Lenzen, M. 1998a. Energy and greenhouse gas cost of living for Australia during 1993/94. Energy 23(6): 497-516.
Lenzen, M. 1998b. Primary energy and greenhouse gases embodied in Australian final consumption: an input-output analysis. Energy Policy 26(6): 495-506.
Lenzen, M. 2001. A generalised input-output multiplier calculus for Australia. Economic Systems Research 13(1): 65-92.
Lenzen, M. 2006. Uncertainty in impact and externality assessments - Implications for decision-making. International Journal of Life Cycle Assessment 11(3): 189-199.
Lenzen, M. and S. A. Murray. 2001. A modified ecological footprint method and its application to Australia. Ecological Economics 37(2): 229-255.
Lenzen, M. and C. J. Dey. 2002. Economic, energy and greenhouse emissions impacts of some consumer choice, technology and government outlay options. Energy Economics 24(4): 377-403.
Lenzen, M. and G. Treloar. 2004. Endogenising capital: a comparison of two methods. Journal of Applied Input-Output Analysis 10: 1-11.
Lenzen, M., L.-L. Pade, and J. Munksgaard. 2004. CO2 multipliers in multi-region input-output models. Economic Systems Research 16(4): 391-412.
Lenzen, M., M. Wier, C. Cohen, H. Hayami, S. Pachauri, and R. Schaeffer. 2006. A comparative multivariate analysis of household energy requirements in Australia, Brazil, Denmark, India and Japan. Energy 31(2-3): 181-207.
Liu, J., R. Wang, and J. Yang. 2005. Metabolism and driving forces of Chinese urban household consumption. Population and Environment 26(4): 325-341.
Lundie, S., M. A. J. Huijbregts, H. V. Rowley, N. J. Mohr, and A. J. Feitz. 2007. Australian characterisation factors and normalisation figures for human toxicity and ecotoxicity. Journal of Cleaner Production 15(8-9): 819-832.
MacLean, H. L., F. Duchin, C. Hagelücken, K. Halada, S. E. Kesler, Y. Moriguchi, D. Mueller, T. E. Norgate, M. A. Reuter, and E. van der Voet. 2009. Stocks, Flows, and Prospects of Mineral Resources. In Linkages of Sustainability, edited by T. E. Graedel and E. van der Voet. Cambridge: MIT Press.
Malthus, T. R. 1798. An Essay on the Principle of Population. London: J. Johnson.
Matthews, E., C. Amann, S. Bringezu, M. Fischer-Kowalski, W. Hüttler, R. Kleijn, Y. Moriguchi, C. Ottke, E. Rodenburg, D. Rogich, H. Schandl, H. Schütz, E. van der Voet, and H. Weisz. 2000. The Weight of Nations: Material Outflows from Industrial Economies. Washington DC: World Resources Institute.
Matthews, H. S., F. McMichael, L. Lave, and H. MacLean. 2008. Life Cycle Analysis as a Tool for Product Design. In Encyclopedia of Materials: Science and Technology, edited by K. H. J. Buschow, et al.: Pergamon.
McMichael, A. J., D. Campbell-Lendrum, Sari Kovats, S. Edwards, P. Wilkinson, T. Wilson, R. Nicholls, S. Hales, F. Tanser, D. L. Sueur, M. Schlesinger, and N. Andronova. 2004.
91
Global Climate Change. In Comparative Quantification of Health Risks: Global and Regional Burden of Diseases Attributable to Selected Major Risk Factors, edited by M. Ezzati, et al. Geneva: WHO.
Meadows, D., D. Meadows, J. Randers, and W. Behrens. 1974. The limits to growth: a report for the Club of Rome’s project on the predicament of mankind: Universe Books New York.
Moll, H. C., K. J. Noorman, R. Kok, R. Engström, H. Throne-Holst, and C. Clark. 2005. Bringing about more sustainable consumption patterns: Analyzing and evaluating the household metabolism in European countries and cities. Journal of Industrial Ecology 9(1-2): 259-276.
Moll, S., S. Bringezu, and H. Schuütz. 2003. Resource use in European countries. An estimate of materials and waste streams in the European Community including imports and exports, using the instrument of material flow analysis. Copenhagen: European Topic Centre on Waste and Material flows.
Moll, S., J. Acosta, and A. Villanueva. 2004. Environmental implications of resource use – insights from input-output analyses. Copenhagen: European Topic Centre on Waste and Material flows.
Moll, S., M. Vrgoc, D. Watson, A. Femia, O. G. Pedersen, and A. Villanueva. 2006. Environmental Input-Output Analyses based on NAMEA data: A comparative European study on environmental pressures arising from consumption and production patterns. Copenhagen: European Environment Agency.
Mongelli, I., S. Suh, and G. Huppes. 2005. A structure comparison of two approaches to LCA inventory data, based on the MIET and ETH databases. International Journal of Life Cycle Assessment 10(5): 317-324.
Mooney, H. A., A. Cropper, D. Capistrano, S. R. Carpenter, K. Chopra, P. Dasgupta, R. Leemans, R. M. May, P. Pingali, R. Hassan, C. Samper, R. Scholes, R. T. Watson, A. H. Zakri, and Z. Shidong, eds. 2005. Ecosystems and human well-being: synthesis, Millenium Ecosystem Assessment. Washington, DC: Island Press.
Morioka, T. and N. Yoshida. 1995. Comparison of carbon dioxide emission patterns due to consumers’ expenditure in UK and Japan. Journal of Global Environmental Engineering 1: 59-78.
Morioka, T. and N. Yoshida. 1997. Carbon dioxide emission patterns due to consumers’ expenditure in life stages and life styles. Journal of Environmental Systems Engineering, JSCE 559(VII-2): 91-101.
Munksgaard, J., K. A. Pedersen, and M. Wier. 2000. Impact of household consumption on CO2 emissions. Energy Economics 22(4): 423-440.
Munksgaard, J., M. Wier, M. Lenzen, and C. Dey. 2005. Using input-output analysis to measure the environmental pressure of consumption at different spatial levels. Journal of Industrial Ecology 9(1-2): 169-185.
Murray, C. J. L. and A. D. Lopez, eds. 1996. The Global Burden of Disease. Edited by WHO, Global Burden of Disease and Injury. Boston: Harvard University Press.
Mäenpää, I. 2005. Analysis of environmental impacts of consumption in Finland. In Sustainable Consumption: The Contribution of Research, edited by E. G. Hertwich, et al. Trondheim: Norwegian University of Science and Technology, Industrial Ecology Program.
Nagasaka, T., K. Nakano, Y. Kondo, S. Murakami, K. Yokoyama, K. Nakajima, and I. Daigo. 2008. Study on global flow of metals - An example of material recycling. Tsukuba, Japan: National Institute for Material Science.
Nakamura, S., K. Nakajima, Y. Kondo, and T. Nagasaka. 2007. The waste input-output approach to materials flow analysis - Concepts and application to base metals. Journal of Industrial Ecology 11(4): 50-63.
92
Nansai, K., R. Inaba, S. Kagawa, and Y. Moriguchi. 2008. Identifying common features among household consumption patterns optimized to minimize specific environmental burdens. Journal of Cleaner Production 16(4): 538-548.
Nansai, K., S. Kagawa, S. Suh, R. Inaba, and Y. Moriguchi. 2007. Simple indicator to identify the environmental soundness of growth of consumption and technology: “Eco-velocity of consumption”. Environmental Science & Technology 41(4): 1465-1472.
Nassen, J., J. Holmberg, A. Wadeskog, and M. Nyman. 2007. Direct and indirect energy use and carbon emissions in the production phase of buildings: An input-output analysis. Energy 32(9): 1593-1602.
Nielsen, P., A. Tukker, B. P. Weidema, E. H. Lauridsen, and P. Notten. 2004. Environmental Imact of the Use of Natural Resources. Brussels: European Commission.
Nijdam, D. S., H. C. Wilting, M. J. Goedkoop, and J. Madsen. 2005. Environmental load from Dutch private consumption: How much damage takes place abroad? Journal of Industrial Ecology 9(1-2): 147-168.
Norgate, T. E. and W. J. Ranklin. 2000. Life cycle assessment of copper and nickel production. Paper presented at MINPREX 2000, The Australian Institute of Mining and Metallurgy; Melbourne.
Norgate, T. E. and W. J. Ranklin. 2001. Greenhouse gas emissions from aluminum production - a life cycle approach Paper presented at Greenhouse Gases in the Metallurgical Industries: Policies, Abatement and Treatment, Toronto.
Norgate, T. E., S. Jahanshahi, and W. J. Rankin. 2007. Assessing the environmental impact of metal production processes. Journal of Cleaner Production 15(8-9): 838-848.
Norgaard, R. B. 1995. Intergenerational Commons, Globalization, Economism, and Unsustainable Development. Advances in Human Ecology 4: 141-171.
Norgaard, R. B. and G. J. Leu. 1986. Petroleum Accessibility and Drilling Technology: An Analysis of US Development Costs from 1959 to 1978. Land Economics. 62(1): 14-25.
Norris, G. A. 2001. The requirement for congruence in normalization. International Journal of Life Cycle Assessment 6(2): 85-88.
OECD. 1991. Environmental indicators, a preliminary set. Paris: OECD.
OECD. 1994. Environmental indicators - OECD Core Set. Paris: Organisation for Economic Co-operation and Development.
Ornetzeder, M., E. G. Hertwich, K. Hubacek, K. Korytarova, and W. Haas. 2008. The Environmental Effect of Car-free Housing: A Case in Vienna. Ecological Economics 65: 516-530.
Ortiz, O., F. Castells, and G. Sonnemann. 2009. Sustainability in the construction industry: A review of recent developments based on LCA. Construction and Building Materials 23(1): 28-39.
Owens, J. W. 1997. Life-Cycle Assessment: Constraints on Moving from Inventory to Impact Assessment. Journal of Industrial Ecology 1(1): 37-49.
Pachauri, S. and D. Spreng. 2002. Direct and indirect energy requirements of households in India. Energy Policy 30(6): 511-523.
Palm, V., A. Wadeskog, and G. Finnveden. 2006. Swedish experience using environmental accounts data for integrated product policy issues. Journal of Industrial Ecology 10(3): 57-72.
Patel, M. 2003. Cumulative energy demand (CED) and cumulative CO2 emissions for products of the organic chemical industry. Energy 28(7): 721-740.
Peet, N. J., A. J. Carter, and J. T. Baines. 1985. Energy in the New Zealand household, 1974-1980. Energy 10(11): 1197-1208.
93
Pennington, D. W., J. Potting, G. Finnveden, E. Lindeijer, O. Jolliet, T. Rydberg, and G. Rebitzer. 2004. Life cycle assessment Part 2: Current impact assessment practice. Environment International 30(5): 721-739.
Peters, G. P. and E. G. Hertwich. 2006a. Structural analysis of international trade: Environmental impacts of Norway. Economic Systems Research 18(2): 155-181.
Peters, G. P. and E. G. Hertwich. 2006b. Pollution embodied in trade: The Norwegian case. Global Environmental Change-Human and Policy Dimensions 16(4): 379-387.
Peters, G. P. and E. G. Hertwich. 2008a. Trading Kyoto. Nature Reports Climate Change: doi:10.1038/climate.2008.1025.
Peters, G. P. and E. G. Hertwich. 2008b. CO2 embodied in international trade with implications for global climate policy. Environmental Science & Technology 42(5): 1401-1407.
Peters, G. P. and E. G. Hertwich. 2006c. The importance of import for household environmental impacts. Journal of Industrial Ecology 10(3): 89-110.
Peters, G. P. and E. G. Hertwich. 2009. The application of multi-regional input-output analysis to industrial ecology: Evaluating trans-boundary environmental impacts. In Handbook of Input-Output Analysis for Industrial Ecology, edited by S. Suh. Dordrecht, NL: Springer.
Peters, G. P., C. L. Weber, D. Guan, and K. Hubacek. 2007. China’s Growing CO2 Emissions-A Race between Increasing Consumption and Efficiency Gains. Environmental Science & Technology 41(17): 5939-5944.
Peters, G. P., J. Aasness, N. Holck-Steen, and E. G. Hertwich. 2006. Environmental Impacts and Household Characteristics: An econometric analysis of Norway 1999-2001. Paper presented at Sustainable Consumption Research Exchange, Wuppertal.
Pfister, S., A. Koehler, and S. Hellweg. 2009. Assessing the environmental impacts of freshwater consumption in LCA. Environmental Science and Technology 43(11): 4098-4104.
Rebitzer, G., T. Ekvall, R. Frischknecht, D. Hunkeler, G. Norris, T. Rydberg, W. P. Schmidt, S. Suh, B. P. Weidema, and D. W. Pennington. 2004. Life cycle assessment Part 1: Framework, goal and scope definition, inventory analysis, and applications. Environment International 30(5): 701-720.
Reijnders, L. and M. A. J. Huijbregts. 2009. Biofuels for Road Transport: A Seed to Wheel Perspective. London: Springer.
Reinders, A., K. Vringer, and K. Blok. 2003. The direct and indirect energy requirement of households in the European Union. Energy Policy 31(2): 139-153.
Reuter, M. A. 2009. The Niche of Metallurgy in Design for “Recycling”. World of Metallurgy - ERZMETALL 62(5): 276-287.
Reuter, M. A., A. Van Schaik, O. Ignatenko, and G. J. De Haan. 2006. Fundamental limits for the recycling of end-of-life vehicles. Minerals Engineering 19(5): 433-449.
Reuter, M. A., K. Heiskanen, U. M. J. Boin, A. van Schaik, E. Verhoef, and Y. Yang. 2005. The metrics of material and metal ecology : harmonizing the resource, technology and environmental cycles. Amsterdam: Elsevier BV.
Rhee, H. C. and H. S. Chung. 2006. Change in CO2 emission and its transmissions between Korea and Japan using international input-output analysis. Ecological Economics 58(4): 788-800.
Roca, J. and M. Serrano. 2008. Embodied pollution in Spanish household consumption: a disaggregate analysis. In Working Papers in Economics: University of Barcelona.
Rydh, C. J. and M. B. Sun. 2005. Life cycle inventory data for materials grouped according to environmental and material properties. Journal of Cleaner Production 13(13-14): 1258-1268.
94
Saling, P., A. Kicherer, B. Dittrich-Kramer, R. Wittlinger, W. Zombik, I. Schmidt, W. Schrott, and S. Schmidt. 2002. Eco-efficiency analysis by BASF: The method. International Journal of Life Cycle Assessment 7(4): 203-218.
Simpson, R. D., M. A. Toman, and R. U. Ayres. 2005. Scarcity and growth revisited: Natural resources and the environment in the new millennium. Washington, DC: Resources for the Future.
Skinner, B. J. 1979. Earth Resources. Proceedings of the National Academy of Sciences of the United States of America 76(9): 4212-4217.
Smith, K. V. 1979. Scarcity and Growth: Reconsidered. Baltimore: The Johns Hopkins University Press.
Spoerri, A., D. J. Lang, C. R. Binder, and R. W. Scholz. 2009. Expert-based scenarios for strategic waste and resource management planning-C&D waste recycling in the Canton of Zurich, Switzerland. Resources, Conservation and Recycling 53(10): 592-600.
Spreng, D. T. 1988. Net-energy analysis and the energy requirements of energy systems. New York: Praeger.
Steen, B. 1999. A systematic approach to environmental priority strategies in product development (EPS). Version 2000 - General system characteristics. CPM 1999:4. Gothenburg: Chalmers University.
Steen, B. A. 2006. Abiotic Resource Depletion - Different perceptions of the problem with mineral deposits. International Journal of Life Cycle Assessment 11: 49-54.
Stewart, M. and J. Petrie. 2006. A process systems approach to life cycle inventories for minerals: South African and Australian case studies. Journal of Cleaner Production 14(12-13): 1042-1056.
Stewart, M., Y. Hansen, and J. Petrie. 2004. Critical issues for life cycle impact assessment in minerals processing and metals refining. Green Processing 2004 2004(2): 179-184.
Stranddorf, H. K., L. Hoffmann, and A. Schmidt. 2005. Impact categories, normalisation and weighting in LCA. Updated on selected EDIP97-data. Copenhagen: Danish Ministry of the Environment. Environmental Protection Agency.
Strauss, K., A. C. Brent, and S. Hietkamp. 2006. Characterisation and normalisation factors for life cycle impact assessment mined abiotic resources categories in South Africa - The manufacturing of catalytic converter exhaust systems as a case study. International Journal of Life Cycle Assessment 11(3): 162-171.
Suh, S. 2004. Comprehensive Environmental Data Archive (CEDA) 3.0. Leiden, NL: Institute for Environmental Science (CML), Leiden University.
Suh, S. 2005. Developing a sectoral environmental database for input-output analysis: the comprehensive environmental data archive of the US. Economic Systems Research 17(4): 449 - 469.
Suh, S. 2008. Structural Path Analysis for US Economy, Final Report to US EPA. Washington, D.C.
Suppen, N., M. Carranza, M. Huerta, and M. A. Hernandez. 2006. Environmental management and life cycle approaches in the Mexican mining industry. Journal of Cleaner Production 14(12-13): 1101-1115.
Takase, K., Y. Kondo, and A. Washizu. 2005. An analysis of sustainable consumption by the waste input-output model. Journal of Industrial Ecology 9(1-2): 201-220.
Tilton, J. E. and G. Lagos. 2007. Assessing the long-run availability of copper. Resources Policy 32(1-2): 19-23.
Tukker, A. 2006. Identifying priorities for environmental product policy. Journal of Industrial Ecology 10(3): 1-4.
95
Tukker, A. and B. Jansen. 2006. Environment impacts of products - A detailed review of studies. Journal of Industrial Ecology 10(3): 159-182.
Tukker, A., P. Eder, and S. Suh. 2006a. Environmental impacts of products - Policy relevant information and data challenges. Journal of Industrial Ecology 10(3): 183-198.
Tukker, A., G. Huppes, J. Guniee, R. Heijungs, A. de Koning, L. van Oers, S. Suh, T. Geerken, M. Van Holderbeke, B. Jansen, P. Nielsen, P. Eder, and L. Delgado. 2006b. Environmental Impact of Products (EIPRO). EUR22284EN. Seville: EC Joint Research Centre - IPTS.
Turner, G. 2008. A comparison of The Limits to Growth with 30 years of reality. Global Environmental Change 18(3): 397-411.
Udo de Haes, H. A., O. Jolliet, G. Finnveden, M. Goedkoop, M. Hauschild, E. G. Hertwich, P. Hofstetter, W. Klöpffer, W. Krewitt, E. W. Lindeijer, R. Mueller-Wenk, S. I. Olson, D. W. Pennington, J. Potting, and B. Steen. 2002. Life Cycle Impact Assessment: Striving towards Best Practice. Pensacola: Society of Environmental Toxicology and Chemistry.
Ukidwe, N. U. and B. R. Bakshi. 2004. Thermodynamic accounting of ecosystem contribution to economic sectors with application to 1992 US economy. Environmental Science & Technology 38(18): 4810-4827.
UN. 1993. System of National Accounts 1993. Brussels: Commission of the European Communities, International Monetary Fund, Organisation for Economic Co-operation and Development, United Nations, World Bank.
UN. 1997. From theory to practice: Indicators for sustainable development. New York: United Nations Division for Sustainable Development.
UNEP (Forthcoming) Decoupling and Sustainable Resource Management: Scoping the challenges. A Report of the Working Group on Decoupling to the International Panel for Sustainable Resource Management. Swilling, M., M. Fischer-Kowalski, von Weizsäcker, E.U., Manalang, A. B., Ren, Y., Moriguchi., Y., Crane, W.
UNEP (2010) Anthropogenic Metal Stocks: Scientific Synthesis. A Report of the Working Group on Global Metals Flows to the International Panel for Sustainable Resource Management. Graedel, T. E., Gerst, M. D., Dubreuil, A., Hashimoto, S., Müller, D., Pena, C., Rauch, J., Sinkala, T., Sonnemann, G.
UNEP (2009) Towards sustainable production and use of resources: Assessing Biofuels. A Report of the Working Group on Biofuels to the The International Panel for Sustainable Resource Management. Bringezu, S., H. Schütz, M. O´Brien, L. Kauppi, R. W. Howarth
United Nations, European Commission, International Monetary Fund, and Organisation for Economic Co-operation and Development 2003. Handbook of National Accounting: Integrated Environmental and Economic Accounting 2003. New York: United Nations Statistics Division.
USDA. 2009. World Crop Production summary. Washington D.C., USA: Foreign Agricultural Service, United States Department of Agriculture (USDA).
van der Voet, E., L. van Oers, and I. Nikolic. 2004. Dematerialization, not just a matter of weight. Journal of Industrial Ecology 8(4): 121-137.
Van der Voet, E., L. van Oers, S. de Bruyn, F. de Jong, and A. Tukker. 2009. Environmental Impact of the use of Natural Resources and Products. Leiden, NL: CML, Leiden University.
van der Voet, E., L. van Oers, S. Moll, H. Schütz, S. Bringezu, S. de Bruyn, M. Sevenster, and G. Warringa. 2005. A policy review on decoupling. Development of indicators to assess decoupling of economic development and environmental pressure in the EU-25 and AC-3 countries. Brussels: European Commission, DG Environment.
van der Voet, E., J. B. Guinée, and H. A. Udo de Haes, eds. 2000. Heavy metals, a problem solved?: Kluwer Academic Publishers.
96
Viscusi, W. K. and J. E. Aldy. 2003. The value of a statistical life: A critical review of market estimates throughout the world. Journal of Risk and Uncertainty 27(1): 5-76.
Vringer, K. and K. Blok. 1995. The direct and indirect energy requirements of households in the Netherlands. Energy Policy 23(10): 893-910.
Wackernagel, M. and W. Rees. 1996. Our Ecological Footprint. Philadelphia: New Society Publishers.
Weber, C. and A. Perrels. 2000. Modelling lifestyle effects on energy demand and related emissions. Energy Policy 28(8): 549-566.
Weber, C. L. and H. S. Matthews. 2007. Embodied environmental emissions in US international trade, 1997-2004. Environmental Science & Technology 41(14): 4875-4881.
Weber, C. L. and H. S. Matthews. 2008. Quantifying the global and distributional aspects of American household carbon footprint. Ecological Economics 66(2-3): 379-391.
Weber, C. L., G. P. Peters, D. Guan, and K. Hubacek. 2008. The contribution of Chinese exports to climate change. Energy Policy 36(9): 3572-3577.
Wegener Sleeswijk, A., L. van Oers, J. B. Guinee, J. Struijs, and M. A. J. Huijbregts. 2008. Normalisation in product life cycle assessment: An LCA of the global and European economic systems in the year 2000. Science of the Total Environment 390(1): 227-240.
Weidema, B. P., M. Thrane, P. Christensen, J. Schmidt, and S. Lokke. 2008. Carbon footprint - A catalyst for life cycle assessment? Journal of Industrial Ecology 12(1): 3-6.
Wenzel, H., M. Hauschild, and L. Alting. 1997. Environmental Assessment of Products. Vol. 1: Methodology, Tools and Case Studies in Product Development. London: Chapman & Hall.
Wiedmann, T., M. Lenzen, K. Turner, and J. Barrett. 2007. Examining the global environmental impact of regional consumption activities - Part 2: Review of input-output models for the assessment of environmental impacts embodied in trade. Ecological Economics 61(1): 15-26.
Wier, M., M. Lenzen, J. Munksgaard, and S. Smed. 2001. Effects of household consumption patterns on CO2 requirements. Economic Systems Research 13(3): 259-274.
Wilting, H. C. 1996. An energy perspective on economic activities. Groningen: Groningen University.
Wilting, H. C. and W. Biesiot. 1998. Household energy requirements. In Green Households?, edited by K. J. Noorman and T. S. Uiterkamp. London: Earthscan.
Wyckoff, A. W. and J. M. Roop. 1994. The Embodiment of Carbon in Imports of Manufactured Products - Implications for International Agreements on Greenhouse-Gas Emissions. Energy Policy 22(3): 187-194.
Yang, Y. and S. Suh. 2009. Environmental impacts of economic activities in China. Twin Cities, Minnesota, USA: University of Minnesota.
Zuo, T. Y., T. M. Wang, and Z. R. Nie. 2001. Ecomaterials research in China. Materials & Design 22(2):107-110.

97
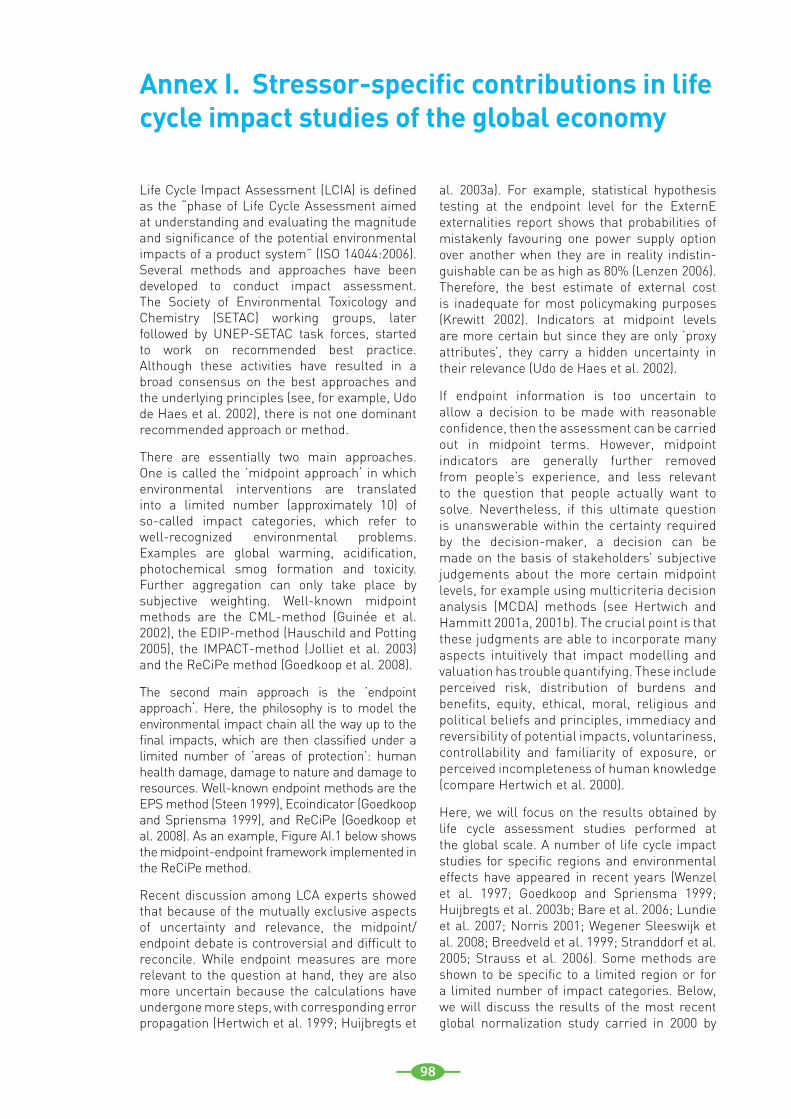
98
Life Cycle Impact Assessment (LCIA) is defined as the “phase of Life Cycle Assessment aimed at understanding and evaluating the magnitude and significance of the potential environmental impacts of a product system” (ISO 14044:2006). Several methods and approaches have been developed to conduct impact assessment. The Society of Environmental Toxicology and Chemistry (SETAC) working groups, later followed by UNEP-SETAC task forces, started to work on recommended best practice. Although these activities have resulted in a broad consensus on the best approaches and the underlying principles (see, for example, Udo de Haes et al. 2002), there is not one dominant recommended approach or method.
There are essentially two main approaches. One is called the ’midpoint approach‘ in which environmental interventions are translated into a limited number (approximately 10) of so-called impact categories, which refer to well-recognized environmental problems. Examples are global warming, acidification, photochemical smog formation and toxicity. Further aggregation can only take place by subjective weighting. Well-known midpoint methods are the CML-method (Guinée et al. 2002), the EDIP-method (Hauschild and Potting 2005), the IMPACT-method (Jolliet et al. 2003) and the ReCiPe method (Goedkoop et al. 2008).
The second main approach is the ’endpoint approach‘. Here, the philosophy is to model the environmental impact chain all the way up to the final impacts, which are then classified under a limited number of ’areas of protection’: human health damage, damage to nature and damage to resources. Well-known endpoint methods are the EPS method (Steen 1999), Ecoindicator (Goedkoop and Spriensma 1999), and ReCiPe (Goedkoop et al. 2008). As an example, Figure AI.1 below shows the midpoint-endpoint framework implemented in the ReCiPe method.
Recent discussion among LCA experts showed that because of the mutually exclusive aspects of uncertainty and relevance, the midpoint/endpoint debate is controversial and difficult to reconcile. While endpoint measures are more relevant to the question at hand, they are also more uncertain because the calculations have undergone more steps, with corresponding error propagation (Hertwich et al. 1999; Huijbregts et
al. 2003a). For example, statistical hypothesis testing at the endpoint level for the ExternE externalities report shows that probabilities of mistakenly favouring one power supply option over another when they are in reality indistin-guishable can be as high as 80% (Lenzen 2006). Therefore, the best estimate of external cost is inadequate for most policymaking purposes (Krewitt 2002). Indicators at midpoint levels are more certain but since they are only ’proxy attributes’, they carry a hidden uncertainty in their relevance (Udo de Haes et al. 2002).
If endpoint information is too uncertain to allow a decision to be made with reasonable confidence, then the assessment can be carried out in midpoint terms. However, midpoint indicators are generally further removed from people’s experience, and less relevant to the question that people actually want to solve. Nevertheless, if this ultimate question is unanswerable within the certainty required by the decision-maker, a decision can be made on the basis of stakeholders’ subjective judgements about the more certain midpoint levels, for example using multicriteria decision analysis (MCDA) methods (see Hertwich and Hammitt 2001a, 2001b). The crucial point is that these judgments are able to incorporate many aspects intuitively that impact modelling and valuation has trouble quantifying. These include perceived risk, distribution of burdens and benefits, equity, ethical, moral, religious and political beliefs and principles, immediacy and reversibility of potential impacts, voluntariness, controllability and familiarity of exposure, or perceived incompleteness of human knowledge (compare Hertwich et al. 2000).
Here, we will focus on the results obtained by life cycle assessment studies performed at the global scale. A number of life cycle impact studies for specific regions and environmental effects have appeared in recent years (Wenzel et al. 1997; Goedkoop and Spriensma 1999; Huijbregts et al. 2003b; Bare et al. 2006; Lundie et al. 2007; Norris 2001; Wegener Sleeswijk et al. 2008; Breedveld et al. 1999; Stranddorf et al. 2005; Strauss et al. 2006). Some methods are shown to be specific to a limited region or for a limited number of impact categories. Below, we will discuss the results of the most recent global normalization study carried in 2000 by
Annex I. Stressor-specific contributions in life cycle impact studies of the global economy
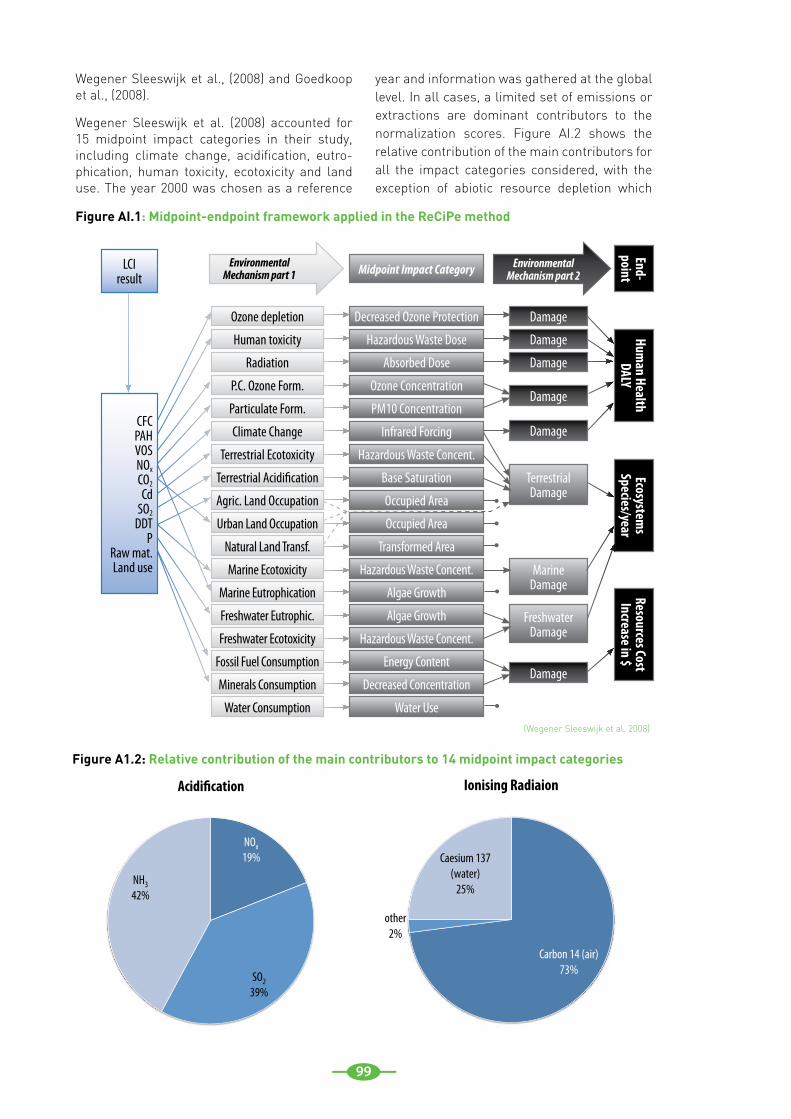
99
Wegener Sleeswijk et al., (2008) and Goedkoop et al., (2008).
Wegener Sleeswijk et al. (2008) accounted for 15 midpoint impact categories in their study, including climate change, acidification, eutro-phication, human toxicity, ecotoxicity and land use. The year 2000 was chosen as a reference
year and information was gathered at the global level. In all cases, a limited set of emissions or extractions are dominant contributors to the normalization scores. Figure AI.2 shows the relative contribution of the main contributors for all the impact categories considered, with the exception of abiotic resource depletion which
LCIresult
Ozone depletion Decreased Ozone Protection
Midpoint Impact Category
Damage
Human HealthDALY
End- point
Human toxicity Hazardous Waste Dose Damage
Radiation Absorbed Dose Damage
P.C. Ozone Form. Ozone ConcentrationDamage
Damage
Particulate Form. PM10 Concentration
Climate Change Infrared Forcing
Terrestrial Ecotoxicity Hazardous Waste Concent.
Terrestrial Acidification Base Saturation Terrestrial DamageAgric. Land Occupation Occupied Area
Urban Land Occupation Occupied Area
Natural Land Transf. Transformed Area
Marine Ecotoxicity Hazardous Waste Concent. Marine DamageMarine Eutrophication Algae Growth
Freshwater Eutrophic. Algae Growth Freshwater DamageFreshwater Ecotoxicity Hazardous Waste Concent.
Fossil Fuel Consumption Energy ContentDamage
Minerals Consumption Decreased Concentration
Water Consumption Water Use
Environmental Mechanism part 1
Environmental Mechanism part 2
CFCPAH VOSNOx CO2Cd
SO2DDT
PRaw mat.Land use
Resources Cost Increase in $
Ecosystems
Species/year
Figure AI.1: Midpoint-endpoint framework applied in the ReCiPe method
(Wegener Sleeswijk et al. 2008)
NOx 19%
SO2 39%
NH3 42%
Acidi�cation
Carbon 14 (air) 73%
other 2%
Caesium 137 (water)
25%
Ionising Radiaion
Figure A1.2: Relative contribution of the main contributors to 14 midpoint impact categories
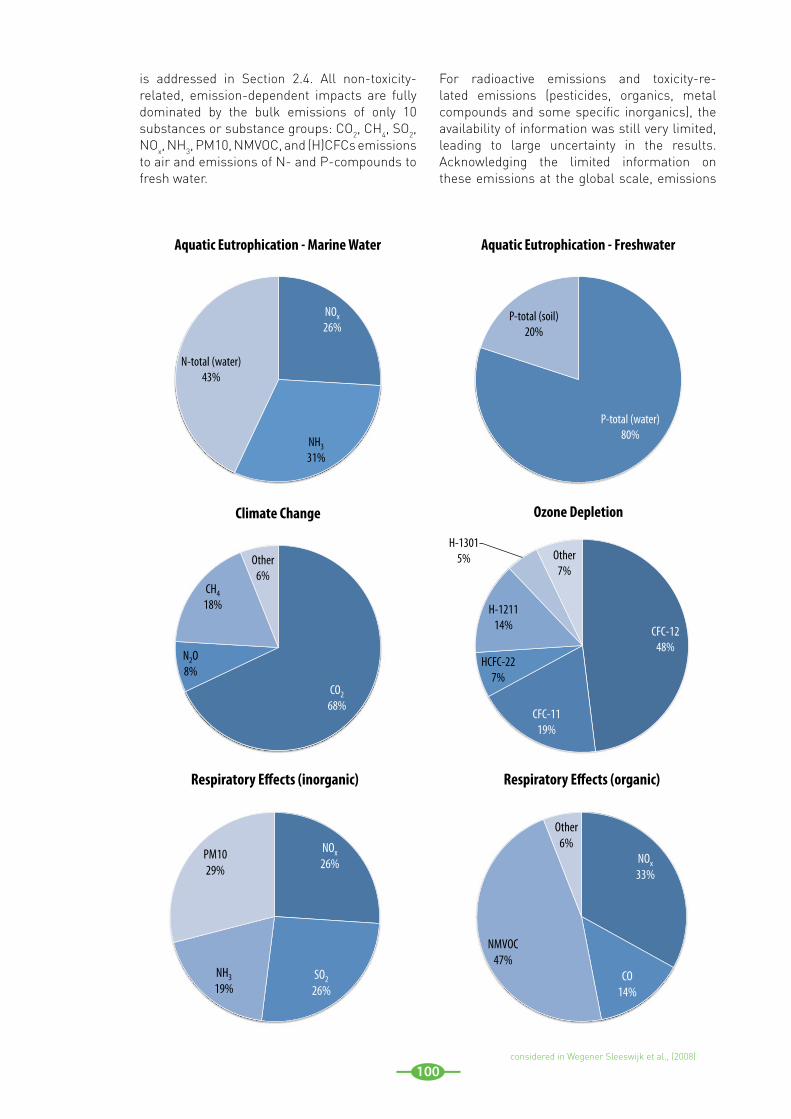
100
NOx 26%
NH3 31%
N-total (water) 43%
Aquatic Eutrophication - Marine Water
NOx 26%
SO2 26%
NH3 19%
PM10 29%
Respiratory Effects (inorganic)
P-total (water) 80%
P-total (soil) 20%
Aquatic Eutrophication - Freshwater
NOx 33%
CO 14%
NMVOC 47%
Other 6%
Respiratory Effects (organic)
CO2 68%
N2O 8%
CH4 18%
Other 6%
Climate Change
CFC-12 48%
CFC-11 19%
HCFC-22 7%
H-1211 14%
H-1301 5% Other
7%
Ozone Depletion
is addressed in Section 2.4. All non-toxicity-related, emission-dependent impacts are fully dominated by the bulk emissions of only 10 substances or substance groups: CO2, CH4, SO2, NOx, NH3, PM10, NMVOC, and (H)CFCs emissions to air and emissions of N- and P-compounds to fresh water.
For radioactive emissions and toxicity-re-lated emissions (pesticides, organics, metal compounds and some specific inorganics), the availability of information was still very limited, leading to large uncertainty in the results. Acknowledging the limited information on these emissions at the global scale, emissions
considered in Wegener Sleeswijk et al., (2008)
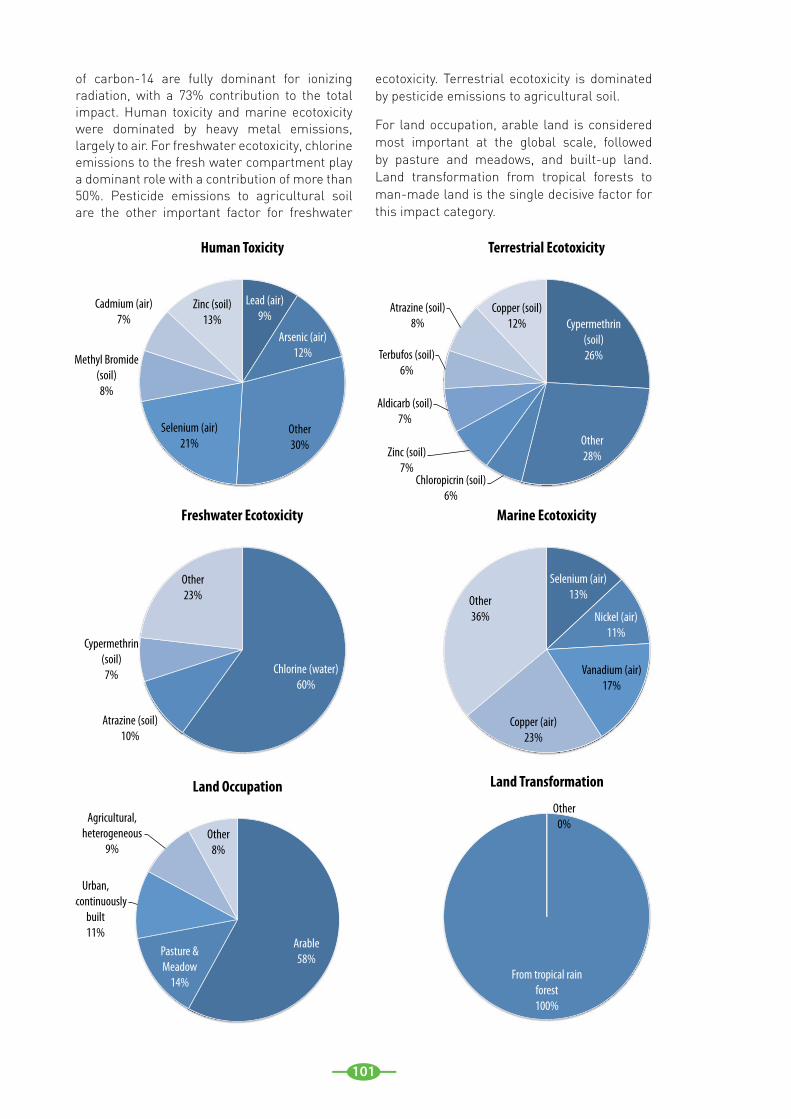
101
of carbon-14 are fully dominant for ionizing radiation, with a 73% contribution to the total impact. Human toxicity and marine ecotoxicity were dominated by heavy metal emissions, largely to air. For freshwater ecotoxicity, chlorine emissions to the fresh water compartment play a dominant role with a contribution of more than 50%. Pesticide emissions to agricultural soil are the other important factor for freshwater
ecotoxicity. Terrestrial ecotoxicity is dominated by pesticide emissions to agricultural soil.
For land occupation, arable land is considered most important at the global scale, followed by pasture and meadows, and built-up land. Land transformation from tropical forests to man-made land is the single decisive factor for this impact category.
Lead (air) 9%
Arsenic (air) 12%
Other 30%
Selenium (air) 21%
Methyl Bromide (soil) 8%
Cadmium (air) 7%
Zinc (soil) 13%
Human Toxicity
Cypermethrin (soil) 26%
Other 28%
Chloropicrin (soil) 6%
Zinc (soil) 7%
Aldicarb (soil) 7%
Terbufos (soil) 6%
Atrazine (soil) 8%
Copper (soil) 12%
Terrestrial Ecotoxicity
Chlorine (water) 60%
Atrazine (soil) 10%
Cypermethrin (soil) 7%
Other 23%
Freshwater Ecotoxicity
Arable 58%
Pasture & Meadow
14%
Urban, discontinuously
built 11%
Agricultural, heterogeneous
9% Other
8%
Land Occupation
Selenium (air) 13%
Nickel (air) 11%
Vanadium (air) 17%
Copper (air) 23%
Other 36%
Marine Ecotoxicity
From tropical rain forest 100%
Other 0%
Land Transformation
102
The present annex briefly introduces methods to assess the environmental pressures resulting from economic activity and methods to assess the impact resulting from environmental pressures. For the impact assessment, important issues have already been discussed in Annex I to the present report and these issues will not be taken up here. Instead, we focus on issues concerning the trade off among different types of impacts and different impact categories. Such a trade off is necessary for a ranking economic activities according to environmental impact.
Quantifying environmental pressuresTo operationalize the extended DPSIR framework, we need a description of the economy linking specific economic activities to the pressures they generate. Different descriptions are possible, depending on the purpose of the analysis of driving forces. We here focus on models that make a connection between economic and material aspects of the economy. Other frameworks exist that go further in describing needs and utility of consumption, and behavioural and social aspects, but they are not focused on when ranking activities or resources according to their impact.
The following models of ‘drivers’ may serve our purpose:
Input-output tables (IOT) • and the underlying framework of national accounting offer a description of the economy in the form of purchases and sales of sectors, including resource extraction, processing, manufacturing and service sectors. The tables also contain purchases for final demand of products produced by different industry sectors. Final demand includes consumption by households, government, and non-governmental institutions; investments; adjustments to inventory; and export. IOTs therefore provide a comprehensive picture of all purchases and value added in an economy and allow the tracing of
value chains for all products purchased to meet final demand. Many countries construct IOTs routinely and their availability generally is good, although there is usually a time delay of several years. However, IOTs are expressed only in monetary terms. Resource extraction and emissions can be traced through satellite accounts, such as the United Nations System of Environmental and Economic Accounts (SEEA) (United Nations et al. 2003) and its national or regional imple-mentations such as National Accounting Matrix with Environmental Accounts (NAMEA) (Eurostat 2001b).
Life cycle assessment (LCA)• is an approach that has been developed to trace the resource requirements and environmental impacts of a product. Products range from a cup of coffee or a litre of biofuel. As a case-based approach, LCA does not aim to assess the entire economy. However, it takes much of the economy to produce a product, so that the cradle-to-gate emissions and resource requirements for energy production, transport, materials and waste treatment need to be included in most life cycle assessments. Some databases, especially the Swiss EcoInvent Life cycle Inventories (Frischknecht et al. 2005) provide a very wide coverage of much of the economy, with the exception of the environmentally less important service sectors (Mongelli et al. 2005). Bottom-up assessments of consumption use LCA databases to provide an overview of consumption in an economy (Jansen and Thollier 2006; Jungbluth et al. 2007).
Material flow accounts (MFA)• describe the imports, extractions and exports of a national economy in terms of kilograms of materials. A limited number of MFA categories can be distinguished, related to types of resources. For MFA accounting, a methodological standard is available (EUROSTAT 2001a). MFA time series are
Annex II. Methods
103
available for many countries in the world. Breaking down economic activities into main categories should also be possible and is also a comprehensive approach. However, any further detail regarding what happens in the national economy is out of sight, so the fate of these inputs into society cannot be traced. Since the link with environmental interventions or impacts is not pursued, MFA accounts do not easily lend themselves to prioritization of resources. Attempts have been made to add an environmental dimension to the MFA accounts, based on LCA inventories, for example in the development of EMC as an aggregate indicator to measure decoupling (van der Voet et al. 2004). These attempts mirror SEEA, adding environmental extensions to material resources instead of to the sectors. The flow of physical resources through economic sectors can also be tracked using physical input-output tables (PIOT) (Hoekstra and van den Bergh 2006). This approach mirrors the economic accounts, even though its conceptual implications are contended. Tracing material flows and impacts is also possible within the framework of waste input-output analysis (Nakamura et al. 2007).
Economy-environment interfaceIn the present report, we have used the expression ‘environmental pressure’ synonymously with ‘environmental intervention’ in life cycle assessment (LCA). Environmental interventions form the interface between the economy and the environment (Udo de Haes et al. 2002). In the LCA methodology, ‘environmental interventions’ refer to any (physical) transgression of the economy-environment border. This transgression works both ways. On one hand, material is taken out of the environment to be used in the economy. This can be raw materials but also land that is converted from nature. On the other hand, residual material is put into the environment. This can be emissions but also waste streams. A central question is where we put the systems boundary between the economy and nature.
Extractions of resources.• In most cases, it is quite clear what is meant by ‘extraction of resources’. We define it, in
accordance with many others, as ‘taking something out of the natural environment to be processed and used in society’. Extraction of metal ores, raw materials for construction such as sand and gravel, fish out of the oceans and rivers, wood from forests, and water for use in agriculture, households and industries are undisputed. Boundary problems occur when considering agriculture. In MFA, for example, the harvesting of crops is considered an extraction, agricultural soil being part of the environment. In some LCA methods, this is not the case. Rather, agricultural production is considered an economic activity with crops as its product, hence only the CO2 fixation by the crops counts as an extraction. When combining methodologies, this needs to be kept in mind in order to keep the system consistent.
Emissions to the environment• are widely defined, including gases, effluents, radioactivity, noise, heat, and light pollution. Here, too, the identification of emissions to the environment in most cases will not be a problem. Emissions from industrial processes and use or consumption are undisputed, although there is continuing debate regarding CO2 emissions from biogenic origins. In some energy analyses, these are not accounted for since they are considered to be ‘carbon neutral’. In normal LCA procedure they are accounted for but so is the extraction of CO2. Globally, this amounts to the same thing. At sub-global levels, however, it may cause differences due to extractions occurring in different areas compared to emissions. Especially when considering burden shifting to other countries, this is something to keep in mind.
Another issue concerns waste streams. •Here, the economy-environment boundary is drawn in different places. While waste incinerators and recyclers are still an undisputed part of the economic system, landfill sites are not. Are landfills part of the environment (i.e. is landfilling waste an emission to the environment), or are landfills still within the economy, meaning that only losses from landfill sites should considered as emissions? Here, too, system consistency needs to be guarded.
104
Land use.• Another type of intervention is the use of land. Land use is commonly not included in MFA, although it can be connected to the use of biomass and analysed in a common framework (Fischer-Kowalski and Haberl 2007). In input-output analysis, land use is sometimes treated as a production factor in a similar fashion to labour and capital (Duchin 1998; Duchin 2005). Land use footprints have been estimated in the face of land scarcity (Hubacek and Sun 2001). In LCA, the land use of unit processes is accounted for as an intervention. While the conversion of land from nature is obviously an extraction, the use of already converted land is assumed to have less impact. Some solve this in the LCA methodology by distinguishing ‘land use change’ from ‘land use competition’ as two different types of interventions. However, some real problems, like the degradation of habitats and the fragmentation of natural areas, cannot always be linked directly to particular economic activities. Another linked pressure concerns the human appropriation of net primary productivity, where appropriation includes both extraction and disturbance (Haberl et al. 2007).
In principle, all these types of interventions need to be included in order to rank resources or products according to their impacts. In practice, studies often take a very limited selection of interventions into account.
Environmental impactsActivities in an economy, such as extractions of material resources, emissions, landfilling of waste, and use and conversion of land, cause environmental pressures. These interventions in turn lead to impacts on the environment, directly or through a chain of environmental processes (state and impact in the DPSIR framework). Emissions to air and water are dispersed and potentially transferred to other compartments, leading to higher environmental concentrations and a potential loss of environmental quality. Emissions to soil may cause local pollution problems and contaminate groundwater and crops. Land use causes loss of habitat for species. All these factors may ultimately cause health problems, ecosystem degradation, or loss of environmental services.
To capture all this in one assessment is a tall order. All attempts to do so must be regarded with caution. At the same time, there is great demand for such an all encompassing exercise: how else can we evaluate developments and attempts to steer society in a more sustainable direction? How else can we define priorities? How else can we arrive at an aggregate indicator to measure decoupling, which is also a task of the International Panel for Sustainable Resource Management? In the aggregation of the different types of impacts, some general routes are summarized below.
Impact categories and areas of protection. •MFA and input-output analysis have not attempted to develop schemes to aggregate over all different types of impacts. In the LCA community, however, this has been a prime concern in the development of the Life Cycle Impact Assessment (Udo de Haes et al. 2002). This has not resulted in one dominant approach, although harmonization is ongoing.
Basically, there are two main approaches. One is sometimes called the ‘midpoint approach’. Here, environmental interventions are translated and added up into a limited number of ‘impact categories’, which refer to well recognized environmental problems. Examples are global warming, acidification, photochemical smog formation and toxicity. The number of different categories is thus reduced from several hundreds to a dozen. Further aggregation can only take place by subjective weighting.
The second is the ‘endpoint approach’. Here, the philosophy is to model the environmental impact chain all the way up to final impacts, which are then classified under ‘areas of protection’: human health damage, damage to nature, and damage to the human environment.
Both approaches are used in the LCA community, each having its advantages and drawbacks. The LCIA scheme is also used outside the LCA community. It can be used in all cases where aggregation of a large number of emissions or extractions is required and a risk assessment therefore is not possible. It has been added to environmentally extended IOTs (Huppes
105
et al. 2006; Hendrickson et al. 2006) and to eco-efficiency methods developed by companies (Saling et al. 2002) and therefore has a broader relevance.
Aggregation methods: adding.• The other way of making the different impacts comparable is by expressing all interventions into one unit. This can be a physical unit, such as kilogram, Joule or square meter. In economics, there are also some approaches to assess environmental impacts or damage and translate this into monetary terms. For example, in the Ecological Footprint (Wackernagel and Rees 1996) all interventions are translated into ‘global hectares’, which then can be added to the total footprint. Material Flow Accounts express everything in kilograms, which can be added up easily to overall material input, output or throughput indicators (Matthews et al. 2002; Hinterberger and Schmidt-Bleek 1999). Aggregate energy, emergy or exergy accounts do something similar in terms of joules (Huijbregts et al. 2006; Brown and Herendeen 1996; Ukidwe and Bakshi 2004). The problems with this approach can be twofold: first, the common expression may not be very relevant as an indicator for environmental impacts – this is signalled for example as a problem for mass based indicators; second, there is always an implicit element of valuation if one decides to treat two things – measured in the same units – as equal, e.g., a joule of hot water and a joule of corn.
Aggregation methods: midpoint modeling. •In LCA, environmental interventions are added up within a limited number of impact categories. This is done by using a reference intervention and equivalency factors (Heijungs 1995; Pennington et al. 2004; Udo de Haes et al. 2002). For example, for the impact category of global warming the reference is CO2, which therefore has an equivalency factor of one. CH4, a stronger greenhouse gas, has an equivalency of 23, which means that the emission of 1 kg CH4 equals the emission of 23 kg of CO2. In other words, 1 kg CH4 can be expressed as 23 kg CO2 equivalent. As all greenhouse gases have an equivalency factor, they can be added
up to a total amount of kg CO2 equivalents. The equivalency factors are calculated by using general environmental models that describe the fate and physical action of an emission. For each impact category, the modelling is different.
While for global warming, acidification, eutrophication, ozone layer depletion and to a lesser extent photochemical smog formation the number of gases is limited and the agreement on how to derive equivalency factors is high, this is less so for other impact categories. In the area of toxicity, for example, the number of substances is huge, their fate and actions are highly diverse and the underlying data on physical properties and toxicity incomplete. Depletion of resources is another impact category where consensus has not yet been achieved. There are some approaches to derive equivalency factors for the depletion of abiotic resources (Steen 2006; Stewart et al. 2004; Guinée and Heijungs 1995).
For biotic resource depletion, there are only some sketchy attempts, not yet applicable in practice. The same is true for land use, where there is no consensus on impact factors to add to the bare information of square meters used (Canals et al. 2007). Despite this, add-ing-by-equivalency-factors is an easily applicable, generally accepted approach, which is widely applied, within and outside the LCA community. From the point of view of defining all-encompassing indicators for decoupling, the advantage is that a huge number of different environmental interventions are reduced to a dozen or so impact categories. Further reduction in this approach is not possible: this can be done only by defining weighting factors for the different impact categories (see below).
A different approach to add up all the environmental interventions is to model them all the way through to the actual impacts they may cause. Rather than GHG or toxicity equivalents, the focus is on mortality, morbidity (diseases), damage to building structures, agricultural crops and fishing stocks, and reduced populations of certain species. Units are, for example,
106
Disability Adjusted Life Years or potentially affected or disappeared fractions of certain organisms (Hofstetter 1998; Klepper et al. 1998; Udo de Haes et al. 2002; Huijbregts 1999). Modelling defines the impacts on the “endpoint” level.
The modelling follows the impact pathway approach in which emissions are translated through dispersion models into physical impacts (Krewitt et al. 1998). The advantage is that the number of categories is even further reduced, to just three or four. These can be further reduced by applying monetary valuation (see below). Another advantage is that these endpoint-categories express the real impacts, which is, after all, the key issue. The major disadvantages are first higher uncertainty compared to the midpoint approach, increasing with each modelling step, and second the incomplete knowledge base, especially with respect to impacts on nature and biodiversity.
While this means of aggregation comes a step closer to a real risk assessment, it must be kept in mind that the approach is still that of potential impacts and generalized or stylized environmental fate models.
Aggregation methods: panel or political •weighting. One solution to the aggregation problem is to make a statement of the relative severity of certain interventions, impact categories or areas of protection (Bengtsson and Steen 2000). Such a statement is by definition subjective. Some feel this is undesirable: the aggregation should be ‘scientifically sound’ and therefore objective (Owens 1997). Others see it as recognition of the fact that there is always a subjective element in sustainability issues and sustainable development. Preferences and political priorities are important as well and can be introduced through prioritization or weighting (Hertwich et al. 2000).
Weighting can be done in various ways:
by a panel of scientists, drawing on -their expert knowledge of the impacts
of certain interventions or impact categories;by a panel of stakeholders, as has -been practiced before for specific case studies;by politicians, based on governments’ -expressed policy priorities; orby revealed preference, for example -based on surveys.
In the ISO standard for LCA (ISO14040), weighting is explicitly restricted to certain situations. In other indicators, weighting is hidden in the aggregation procedure. For example, the translation step in the Ecological Footprint from all kinds of environmental interventions to square meters involves non-objective choices. A seemingly objective indicator therefore can hide subjective elements. It is important to signal and recognize this.
Aggregation methods: monetary. •Monetary aggregation is another way to secure a common denominator. Many economic tools, such as social cost-benefit analysis or green national accounting, environmental impacts are translated into their monetary value. Prices for environmental impacts are derived from implicit prices for environmental quality. As people cannot buy environmental quality on the market, the price for environmental goods must be derived implicitly from either questionnaires (stated preferences) or observed price changes of other goods (such as the price premium for a house in an unpolluted neighbourhood compared to the price of a house in a polluted neighbourhood – these are called revealed preferences).
There are various ways to arrive at a monetary estimation for environmental quality:
The damage cost approach - originates from estimating a monetary value for the physical impacts at endpoint level. For damage to commodities traded on the market (e.g., crops, buildings), actual costs are used. Values for, for example, the risk of premature death due to environmental pollution
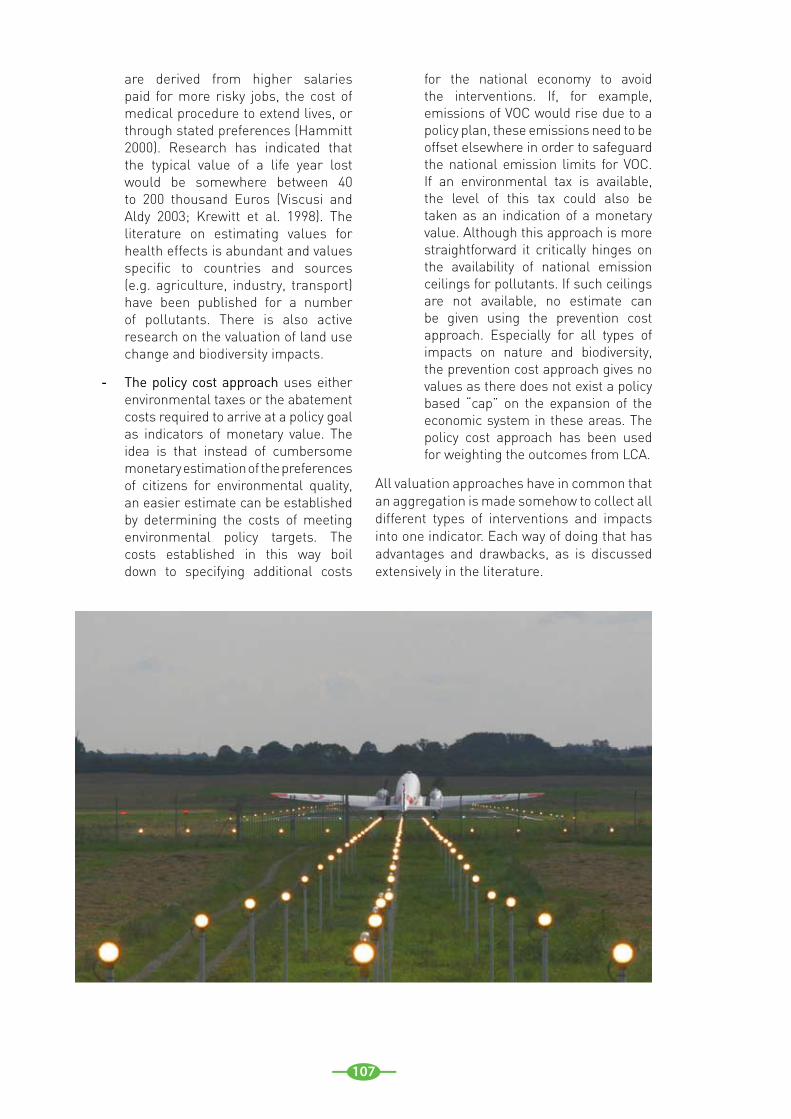
107
are derived from higher salaries paid for more risky jobs, the cost of medical procedure to extend lives, or through stated preferences (Hammitt 2000). Research has indicated that the typical value of a life year lost would be somewhere between 40 to 200 thousand Euros (Viscusi and Aldy 2003; Krewitt et al. 1998). The literature on estimating values for health effects is abundant and values specific to countries and sources (e.g. agriculture, industry, transport) have been published for a number of pollutants. There is also active research on the valuation of land use change and biodiversity impacts.
The policy cost approach - uses either environmental taxes or the abatement costs required to arrive at a policy goal as indicators of monetary value. The idea is that instead of cumbersome monetary estimation of the preferences of citizens for environmental quality, an easier estimate can be established by determining the costs of meeting environmental policy targets. The costs established in this way boil down to specifying additional costs
for the national economy to avoid the interventions. If, for example, emissions of VOC would rise due to a policy plan, these emissions need to be offset elsewhere in order to safeguard the national emission limits for VOC. If an environmental tax is available, the level of this tax could also be taken as an indication of a monetary value. Although this approach is more straightforward it critically hinges on the availability of national emission ceilings for pollutants. If such ceilings are not available, no estimate can be given using the prevention cost approach. Especially for all types of impacts on nature and biodiversity, the prevention cost approach gives no values as there does not exist a policy based “cap” on the expansion of the economic system in these areas. The policy cost approach has been used for weighting the outcomes from LCA.
All valuation approaches have in common that an aggregation is made somehow to collect all different types of interventions and impacts into one indicator. Each way of doing that has advantages and drawbacks, as is discussed extensively in the literature.
108
Abbreviations and acronyms
COICOP Classification of Individual Consumption According to Purpose
DMC Domestic Material Consumption
DPSIR Driving force – Pressure – State – Impact – Response
EE IOA Environmentally Extended Input Output analysis
EEA European Environment Agency
EMC Environmentally weighted Material Consumption
EU European Union
FAO Food and Agriculture Organisation of the United Nations
GDP Gross Domestic Product
GHG Greenhouse Gas
GWP Global Warming Potential
IEA International Energy Agency
IOT input-output tables
IPCC Intergovernmental Panel on Climate Change
LCA Life Cycle Assessment
MA Millennium Ecosystem Assessment
MFA Material Flow Accounting
OECD Organisation for Economic Co-operation and Development
PV cells Photovoltaic cells
UNEP United Nations Environment Programme
Abbreviations, acronyms and units
Units
CO2eq carbon dioxide equivalents
kW kilowatt
m3/cap/year cubic meter per capita per year
p.a. per annum
t tonne
Chemical abbreviations
CO2 carbon dioxide
CH4 methane
N2O nitrous oxide
NOx nitrogen oxide
SO2 sulphur dioxide
About the UNEP Division of Technology,Industry and Economics
The UNEP Division of Technology, Industry and Economics (DTIE) helps
governments, local authorities and decision-makers in business and
industry to develop and implement policies and practices focusing on
sustainable development.
The Division works to promote:
> sustainable consumption and production,
> the efficient use of renewable energy,
> adequate management of chemicals,
> the integration of environmental costs in development policies.
The Office of the Director, located in Paris, coordinates activities
through:
> The International Environmental Technology Centre - IETC (Osaka, Shiga),
which implements integrated waste, water and disaster management programmes,
focusing in particular on Asia.
> Sustainable Consumption and Production (Paris), which promotes sustainable
consumption and production patterns as a contribution to human development
through global markets.
> Chemicals (Geneva), which catalyzes global actions to bring about the sound
management of chemicals and the improvement of chemical safety worldwide.
> Energy (Paris and Nairobi), which fosters energy and transport policies for
sustainable development and encourages investment in renewable energy and
energy efficiency.
> OzonAction (Paris), which supports the phase-out of ozone depleting substances
in developing countries and countries with economies in transition to ensure
implementation of the Montreal Protocol.
> Economics and Trade (Geneva), which helps countries to integrate environmental
considerations into economic and trade policies, and works with the finance sector
to incorporate sustainable development policies.
UNEP DTIE activities focus on raising awareness,
improving the transfer of knowledge and information,
fostering technological cooperation and partnerships, and
implementing international conventions and agreements.
For more information,see www.unep.fr
www.unep.orgUnited Nations Environment Programme
P.O. Box 30552 Nairobi, KenyaTel.: ++254 (0) 20 762 1234Fax: ++254 (0) 20 762 3927Email: [email protected]
For more information, contact:UNEP DTIESustainable Consumption and Production Branch15 Rue de Milan75441 Paris CEDEX 09FranceTel: +33 1 4437 1450Fax: +33 1 4437 1474E-mail: [email protected]
The environmental and health sciences have brought important insights into the connection of environmental pressures and ecosystem damages. Well-known assessments show that habitat change, the overexploitation of renewable resources, climate change, and particulate matter emissions are amongst the most important environmental problems. Biodiversity losses and ill health have been estimated and evaluated.
This report focuses not on the effects of environmental pressure, but on its causes. It describes pressures as resulting from economic activities. These activities are pursued for a purpose, to satisfy consumption. Environmental pressures are commonly tied to the extraction and transformation of materials and energy. This report investigates the production-materials-consumption nexus.
The relative importance of industries, consumption categories and materials varies across the world, as our assessment shows. This assessment offers a detailed problem description and analysis of the causation of environmental pressures and hence provides knowledge required for reducing environmental impacts. It tells you where improvements are necessary, but it does not tell you what changes are required and how much they will contribute to improvements.
ISBN: 978-92-807-3084-5
DTI/1262/PA
Related Documents