Assessing the Economic Impact of Soil Deterioration BRGM RP 53091 1 European Commission DG Environment Assessing the Economic Impacts of Soil Degradation Interim Report Volume 2: Case Studies and Database Research Consolidated Version, March 2004 Study Contract ENV.B.1/ETU/2003/0024 D. Darmendrail, O. Cerdan, A. Gobin, M. Bouzit, F. Blanchard, B. Siegele

Welcome message from author
This document is posted to help you gain knowledge. Please leave a comment to let me know what you think about it! Share it to your friends and learn new things together.
Transcript
Assessing the Economic Impact of Soil Deterioration
BRGM RP 53091 1
European Commission
DG Environment
Assessing the Economic Impacts of Soil Degradation
Interim Report
Volume 2: Case Studies and Database Research
Consolidated Version, March 2004
Study Contract ENV.B.1/ETU/2003/0024
D. Darmendrail, O. Cerdan, A. Gobin, M. Bouzit, F. Blanchard, B. Siegele

Assessing the Economic Impact of Soil Deterioration
Key words: European Level, soil deterioration, impact, economy
In references this report will be as follows: D. Darmendrail, O. Cerdan, A. Gobin, M. Bouzit, F. Blanchard, B. Siegele - Assessing the economic impact of soil deterioration: Case Studies and Database Research.
© BRGM, 2004, this document may not be reproduced without the prior permission of the BRGM.
BRGM RP 53091 2

Assessing the Economic Impact of Soil Deterioration
BRGM RP 53091 3
Contents
ASSESSING THE ECONOMIC IMPACTS OF SOIL DEGRADATION 1
LIST OF FIGURES 6
LIST OF TABLES 6
1 INTRODUCTION 9
1.1 SCOPE AND CONTENT 9
1.2 OUTLINE OF THE PROJECT 9
1.3 GENERAL BOUNDARIES OF THE CASE STUDIES 9
2 CASE STUDIES 10
2.1 TYPES OF SOIL DETERIORATION TAKEN INTO ACCOUNT 10
2.2 METHODOLOGY FOR THE SELECTION OF CASE STUDIES 10
2.3 IDENTIFIED CASE STUDIES 11
2.4 SELECTION OF FIVE CASE STUDIES FOR COMPREHENSIVE RESEARCH 13
2.5 SELECTION OF FIVE CASE STUDIES FOR COMPREHENSIVE RESEARCH 15
2.6 DATA QUANTITY AND QUALITY 15
2.7 ANALYSIS OF THE COLLECTED DATA 16
2.7.1 Types of threat covered by economic data 16
2.7.2 Types of cost 17
2.7.3 Evaluation of the proposed indicators 17
2.7.4 Information at national level 18
3 DETAILED STUDIES 19
3.1 EROSION / UK GENERAL CASE 19
3.1.1 Presentation of the case study 19
3.1.2 Impact of soil erosion 22
3.1.3 Cost estimation 23
3.1.4 Conclusion 27
3.2 CONTAMINATION / FRANCE METALEUROP 28
3.2.1 Case study description 28
3.2.2 Impact of contamination 29
3.2.3 Conservation measures 30
3.2.4 Source of data used in the case study 31
3.2.5 Economic damages and costs 32
3.2.6 Conclusion 37
3.3 SALINISATION / SPAIN CENTRAL EBRO AREA 39
3.3.1 Presentation of the case study 39
3.3.2 Conservation measures: controlling salinity in irrigated soils 44
Assessing the Economic Impact of Soil Deterioration
3.3.3 Soil salinisation impact 45
3.3.4 Economic damages and costs 45
3.3.5 Conclusion 47
3.4 ORGANIC MATTER (OM) LOSS / SWEDEN 49
3.4.1 Local conditions 49
3.4.2 Soils 50
3.4.3 Origin and extent of the threat 50
3.4.4 Description of damages 51
3.4.5 Cost estimation 51
3.4.6 Conclusion 52
3.5 FLOODING / NORTHERN ITALY 110
3.5.1 Case study description - local conditions 110
3.5.2 Conservation measures 112
3.5.3 Economic damages and costs 112
4 INFORMATION FOR EXTRAPOLATION LEVEL 54
4.1 EROSION 54
4.1.1 Information based on estimation / predictive modelling 54
4.1.2 Information based on real data 55
4.1.3 Conclusion 65
4.2 CONTAMINATION 65
4.2.1 Local point sources 65
4.2.2 Diffuse contamination 74
4.2.3 Conclusion 78
4.3 SALINISATION 78
4.3.1 The SOTER database 78
4.3.2 The UNEP Database 79
4.3.3 Personal communication on Salinisation and sodication as main factors inducing desertification in irrigated lands 80
4.3.4 Conclusion 80
4.4 ORGANIC MATTER LOSS 81
4.5 FLOODINGS 84
5 CONCLUSION 85
6 ACKNOWLEDGEMENTS 87
7 BIBLIOGRAPHY 88
8 APPENDICES 91
8.1 APPENDIX 1: SIMPLE CASE STUDIES 92
8.1.1 CASE STUDY / France Erosion in Lauragais 122
8.1.2 CASE STUDY / France Erosion in Pays de Caux 128
8.1.3 CASE STUDY / Belgium Contamination 93
BRGM RP 53091 4
Assessing the Economic Impact of Soil Deterioration
BRGM RP 53091 5
8.1.4 CASE STUDY / Finland Contamination 95
8.1.5 CASE STUDY / Finland Contamination 98
8.1.6 CASE STUDY / Italy Floodings 100
8.1.7 CASE STUDY / Italy Salinisation 103
8.1.8 CASE STUDY / Netherlands Contamination 105
8.1.9 CASE STUDY / Sweden Landslides 107
8.2 APPENDIX 2 FIVE DETAILED CASE STUDIES 115
8.2.1 Case Study 1 / Erosion 116
8.2.2 Case Study 2 / Contamination 134
8.2.3 Case Study 3 / Salinisation 139
8.2.4 Case Study 4 / Sweden Organic Matter Loss 146
8.2.5 Case Study 5 / Italy Floodings Erreur ! Signet non défini.
8.3 APPENDIX 3 INFORMATION AT NATIONAL LEVEL 149
8.3.1 Ireland 150
8.3.2 The Netherlands 152
8.3.3 Norway 154
8.3.4 Finland 156
8.3.5 Other countries 156
8.3.6 Situation in other countries 156
8.3.7 Situation on some specific threats 156
8.4 APPENDIX 4 ENVIRONMENTAL INDICATORS AND SOURCES OF DATA 157
Assessing the Economic Impact of Soil Deterioration
List of figures Figure 1. Location of case studies ............................................................................... 13
Figure 2. Location of sampling areas for the UK Erosion case (source: Evans, 2002) 20
Figure 3. Location of the Metaleurop Nord Site for the French contamination case .... 29
Figure 4. Location of the studied area for the Spanish salinisation case ..................... 40
Figure 5. Main crops and their percentage in the studied area (1994) – source: Noguès et al., 2000. ........................................................................................................... 41
Figure 6. Location of the two areas studied for the Swedish OM loss case................. 50
Figure 7. The Italian provinces, including the areas affected by flooding (source: Mattinali di Protezione Civile, 23.10.2000).......................................................... 111
Figure 8. Extent of the reclassified CORINE land cover classes used in this study..... 63
Figure 9. Soil-polluting activities from localised sources as a percentage of total ....... 68
Figure 10. Estimated main industrial branches causing soil contamination from localised sources in selected European regions (EEA, 2002) .............................. 69
Figure 11. Distribution of industrial branches causing soil contamination in France.. 69
Figure 12. Management of contaminated sites in European Countries ..................... 70
Figure 13. Area affected by Salinisation (EEA, 2001) ................................................ 78
Figure 14. Location of Arabianranta ........................................................................... 95
Figure 15. Future Arabianranta .................................................................................. 97
Figure 16. Location of the Morsa Catchment (southeast Norway) ........................... 155
List of tables Table 1. Types of data sought .................................................................................... 11
Table 2. Synthesis of identified Case Studies............................................................. 11
Table 3. Median volume of erosion (m3/ha) and total surface area of the 17 surveyed localities ................................................................................................................ 21
Table 4. On-site costs of erosion for the individual farmer (source based on Evans, 1995)..................................................................................................................... 23
Table 5. National on-site costs of erosion in England and Wales............................... 24
Table 6. Estimated costs of flooding and windblows in the different sampling areas (Source: Evans, 1995b) ........................................................................................ 24
Table 7. Off-site costs of erosion in England and Wales (source based on Evans, 1995)..................................................................................................................... 26
Table 8. Synthesis – costs of soil erosion for the UK case study ............................... 27
Table 9. On-site restoration and repair costs (RC) for the contamination case .......... 32
Table 10. Off-site social costs (SC) for the contamination case ................................... 34
Table 11. Defensive costs (DC) for the contamination case......................................... 35
Table 12. Type of costs - Synthesis for the contamination case (€/year) ..................... 36
BRGM RP 53091 6
Assessing the Economic Impact of Soil Deterioration
BRGM RP 53091 7
Table 13. Overview table for the contamination case as a basis for extrapolation ....... 38
Table 14. Soil map units with their percent distribution over the studied area (source: Noguès et al., 2000) ............................................................................................. 41
Table 15. Variation in crop yield* by four suitability levels and relationship between the soil salinity and suitability level for the six main crops .......................................... 43
Table 16. Index of Productive Potential (IPP) assigned to the LEU, and NVE for the six main crops ............................................................................................................ 43
Table 17. Estimation of crop yield decrease in relation to increasing salinity ............... 45
Table 18. Unit gross margin for different agricultural productions of the studied area.. 46
Table 19. Gross margin loss for different crop production (€ ) ................................. 46 1988
Table 20. Recent programmes of investment for the mitigation of flooding and landslide risk supported by the Ministry for the Environment............................................. 113
Table 21. Description of the soil erosion plot database ................................................ 57
Table 22. Description of the soil erosion database aggregated according to land use. 58
Table 23. Description of the soil erosion database aggregated according to land use and per countries. ................................................................................................. 60
Table 24. Description of the soil erosion database aggregated according to location and land use. ............................................................................................................... 61
Table 25. Description of the soil erosion database aggregated according to the reclassified CORINE land covers.......................................................................... 62
Table 26. Statistic information on land use ................................................................... 64
Table 27. Mean sheet and rill erosion amounts and rates for the reclassified CORINE land covers (Source: Cerdan et al., 2003) ............................................................ 64
Table 28. Estimation of potentially and known contaminated sites in European countries as of August 1999 (EEA, 2000)............................................................. 66
Table 29. Estimation of contamination surface on contaminated sites ......................... 66
Table 30. Distribution of contamination surfaces (France) ........................................... 67
Table 31. Average annual expenditure for soil remediation in European Countries ..... 70
Table 32. Breakdown of public and private remediation costs 2002 in selected European countries............................................................................................... 71
Table 33. Breakdown of costs of soil reclamation in selected countries (M€)............... 72
Table 34. Estimation of the number of persons exposed to local sources of contamination (France) ......................................................................................... 73
Table 35. Distribution of soil deterioration categories at the European level (SOTER database).............................................................................................................. 75
Table 36. % of country area affected by acidification ................................................... 77
Table 37. % of country area affected by heavy metal pollution .................................... 77
Table 38. % of country area affected by pesticide pollution.......................................... 77
Table 39. % of country area affected by radio-nuclear pollution................................... 77
Table 40. Average salinisation values (UNEP database) ............................................. 79
Table 41. Levels of desertification in relation to salinisation rates ................................ 80
Table 42. Proportion of Europe estimated to fall into the different OC classes ............ 81

Assessing the Economic Impact of Soil Deterioration
Table 43. Estimation of the OC content in topsoils of Southern Europe....................... 83
Table 44. Average net sales and average gross margin for various crops................. 126
Table 45. Average unit cost for the most common operations resulting from erosion damage............................................................................................................... 127
Table 46. Average net sales and average gross margin for various crops................. 132
Table 47. Average unit cost for the most common operations resulting from erosion damage............................................................................................................... 133
Table 48. Estimated costs of threats in the different communities.............................. 118
Table 49. Synthesis of costs for the short- and medium-term effects ......................... 119
Table 50. Decrease in crop yield (in 1988) ................................................................. 140
Table 51. Product prices and production costs in 1988 .............................................. 140
Table 52. Basic values for the 6 main crops ............................................................... 141
Table 53. Economic values from the dynamic model ................................................. 141
Table 54. Soil indicators.............................................................................................. 151
Table 55. Overview of indicators for soil degradation ................................................. 158
BRGM RP 53091 8
Assessing the Economic Impact of Soil Deterioration
BRGM RP 53091 9
1 Introduction
1.1 SCOPE AND CONTENT
The project “Assessing Economic Impacts of Soil Deterioration” (Study Contract ENV.B.1/ETU/2003/0024) is a contribution to the European Community's activities to support the actions of the technical working groups in preparing the “Thematic Strategy for Soil Protection”. This report, containing a review of the case studies (sample areas facing some of the threats identified) and a database research, is part of the project that will assess the economic impact of the main types of soil degradation. The project is carried out by Ecologic, the Institute for International and European Environmental Policy, and by BRGM, the French Geological Survey.
This report forms part of the reporting for the project along with a report on the literature review, and a report presenting empirical estimates of the impacts of soil degradation in Europe. This report has been contributed by BRGM.
1.2 OUTLINE OF THE PROJECT
This report consists of three sections: 1. Presentation of the research done for the selection of the case studies: exemplary
sites / regions that are considered representative for the threats identified in Europe.
2. Presentation of the example sites / regions selected on the basis of the results of the Literature Review, from which five have been selected for a comprehensive case study.
3. Presentation of the databases that are accessible and from which both environmental and economic data are available.
The role of the case studies is to act as an example and test application of the methodology for its economic assessment. They will also serve to highlight certain crucial aspects of the methodology for measuring and assessing economic impacts. They will also be used to provide new data input for the extrapolation.
1.3 GENERAL BOUNDARIES OF THE CASE STUDIES
As discussed and agreed in February 2004, the study considers the costs of soil degradation but did not conduct a cost-benefits analysis. The study assesses the costs that soil users bear if soil quality deteriorates. If these impacts can be avoided (or reduced) in the future this would indeed appear a a benefit.
The Literature survey has shown the data gaps, especially in the fields of compaction, sealing and biodiversity loss, where there is little or no economic data. It was agreed that "the extrapolation will therefore primarily focus on erosion, and contamination. Salinisation and loss of organic matter could be included if a suitable case study arises" (Görlach et al. 2004).
Assessing the Economic Impact of Soil Deterioration
2 Case Studies
2.1 TYPES OF SOIL DETERIORATION TAKEN INTO ACCOUNT
The most endangering threats to soil identified in the European Communication “Towards a Thematic Strategy for Soil Protection” (European Commission, 2002) are:
Soil erosion,
Soil contamination (local and diffuse),
Soil salinisation,
Decline in soil organic matter,
Soil sealing,
Floods and landslides,
Soil compaction, and
Loss of biodiversity.
The structure, types of costs considered and the availability of economic data and relevant explanation are included in the literature review (Görlach et al. 2004). Already then the lack of economic data in the fields of compaction, sealing and biodiversity became evident.
Most of the studies found in the Literature review (Görlach et al. 2004) focus on the cost of erosion (water and wind erosion). Contamination and floods / landslides are not as well represented.
2.2 METHODOLOGY FOR THE SELECTION OF CASE STUDIES
As required by the European Commission, the selection should reflect:
the situation in the Member States and Candidate Countries, if possible,
different types of soils,
different climatic conditions (Northern, Central, Southern Europe),
different economic uses.
The available data must be homogeneous in order to facilitate better combination, interpretation and comparison, and to address the questions posed by this project
At an early stage of the project, the case studies seen as exemplary sites / regions should focus on erosion, soil contamination, and salinisation threats, with, if possible, examples of floods and landslides.
Based on the Literature review (Görlach et al. 2004), an information sheet has been developed and sent to:
European Ministries for Environment (EU, plus some eastern countries such as Czech Republic, Hungary, Poland, Romania),
Experts on specific threats involved in the working groups of the Soil Thematic Strategy,
Scientists working on soil issues related to Soil Protection,
in order to obtain environmental and economic data (see table 1) on specific areas affected by one or several threats.
BRGM RP 53091 10
Assessing the Economic Impact of Soil Deterioration
BRGM RP 53091 11
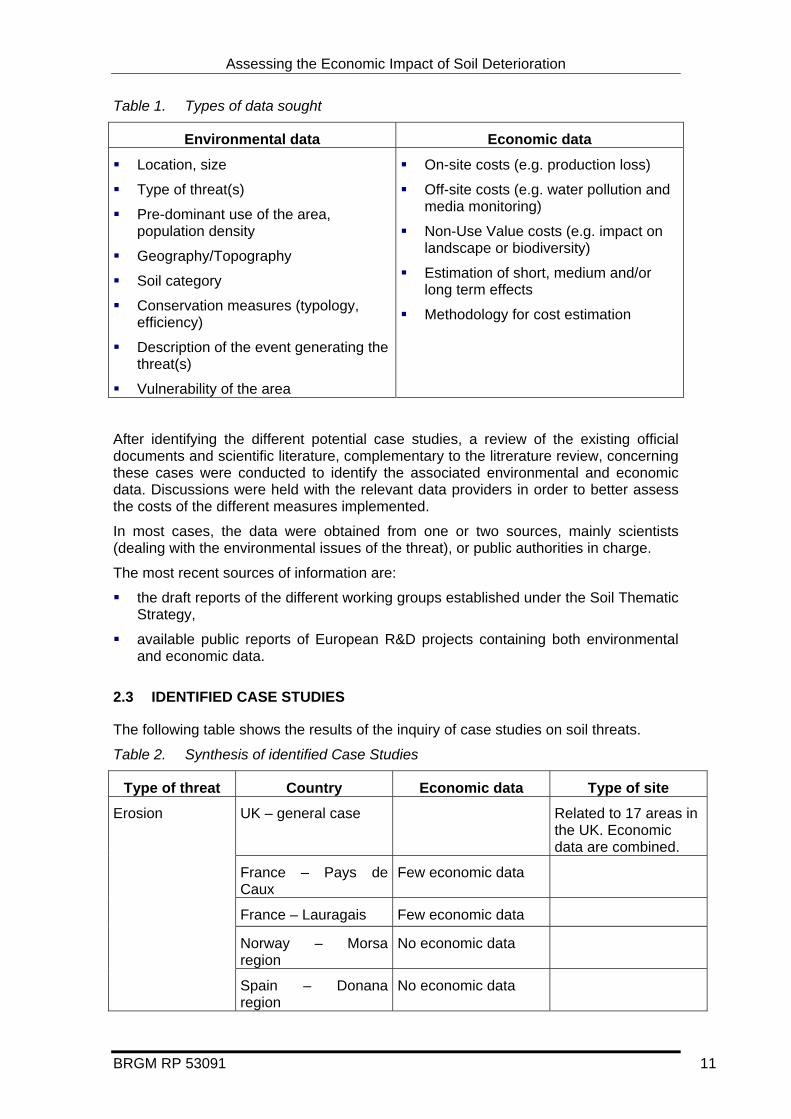
Table 1. Types of data sought
Environmental data Economic data
Location, size
Type of threat(s)
Pre-dominant use of the area, population density
Geography/Topography
Soil category
Conservation measures (typology, efficiency)
Description of the event generating the threat(s)
Vulnerability of the area
On-site costs (e.g. production loss)
Off-site costs (e.g. water pollution and media monitoring)
Non-Use Value costs (e.g. impact on landscape or biodiversity)
Estimation of short, medium and/or long term effects
Methodology for cost estimation
After identifying the different potential case studies, a review of the existing official documents and scientific literature, complementary to the litrerature review, concerning these cases were conducted to identify the associated environmental and economic data. Discussions were held with the relevant data providers in order to better assess the costs of the different measures implemented.
In most cases, the data were obtained from one or two sources, mainly scientists (dealing with the environmental issues of the threat), or public authorities in charge.
The most recent sources of information are:
the draft reports of the different working groups established under the Soil Thematic Strategy,
available public reports of European R&D projects containing both environmental and economic data.
2.3 IDENTIFIED CASE STUDIES
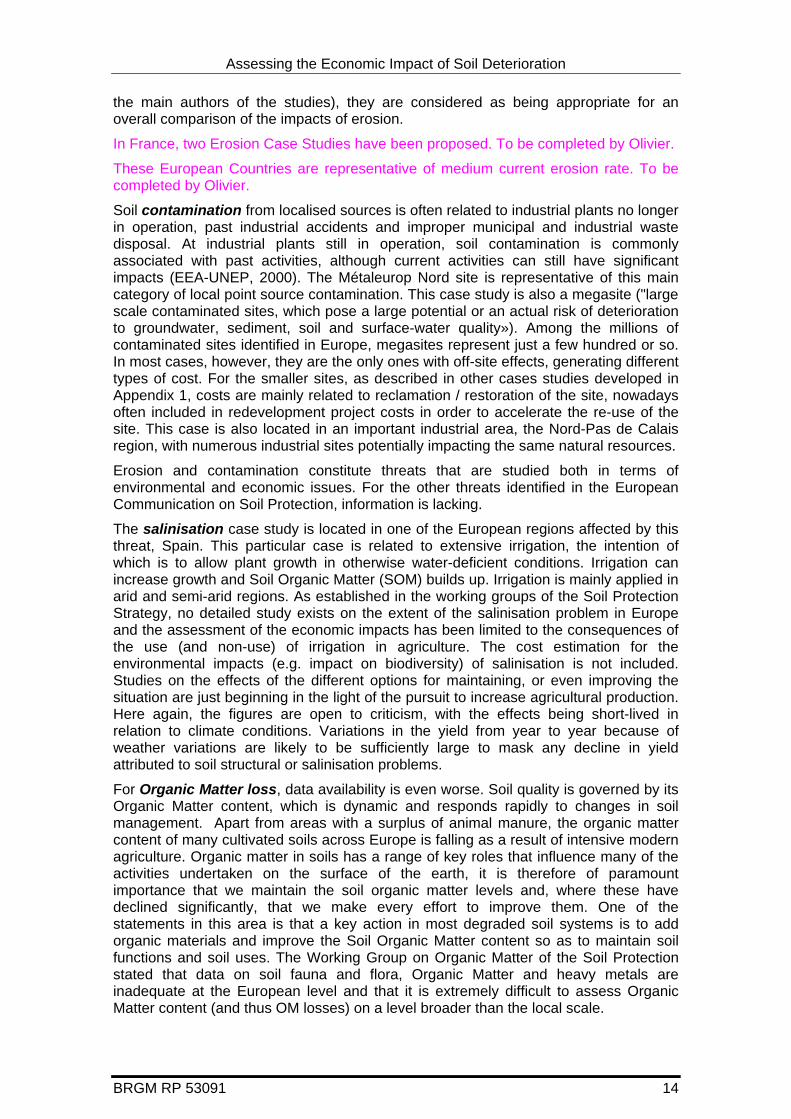
The following table shows the results of the inquiry of case studies on soil threats.
Table 2. Synthesis of identified Case Studies
Type of threat Country Economic data Type of site
UK – general case Related to 17 areas in the UK. Economic data are combined.
France – Pays de Caux
Few economic data
France – Lauragais Few economic data
Norway – Morsa region
No economic data
Erosion
Spain – Donana region
No economic data

Assessing the Economic Impact of Soil Deterioration
BRGM RP 53091 12
Type of threat Country Economic data Type of site
France – Metaleurop Megasite with off-site effects
Belgium – Kempen area
Megasite, spanning two countries, with off-site effects,
Finland – Arabianranta
Small site with mainly on-site effects
Finland – Juankoski case
Small site with mainly on-site effects
Contamination
Netherlands - Maastricht
Urban Brownfield Case
Italy – Delia Nivolelli case
Few data Salinisation
Spain – Central Ebro Related to irrigation
Italy – Northern area Large area affected by important flooding
Flooding
Italy – Central area Limited to the Elba Isle
Organic matter loss
Sweden Two small areas connected with peat extraction
Landslide Sweden - Vagnhärad
During the discussions held in order to select detailed case studies (both on environmental and economic issues), certain countries, via representatives of the national Environment Ministries, confirmed the data gaps that had become apparent during the literature review (Görlach et al. 2004):
Finland: no real problem, or no economic data, concerning erosion, organic matter loss and salinisation.
Ireland: no economic data related to the specific areas available. Existence of environmental data at national level (Irish EPA, 2002).
Netherlands: an additional case on peat soil sinking could be elaborated in the Gouda region.
Some contacts in Germany, Austria and the Czech Republic could not be finalised in time to include the data in this project.

Assessing the Economic Impact of Soil Deterioration
BRGM RP 53091 13
Concerning the contamination threat, most countries have information on local pollution. No case study on diffuse pollution was proposed by the national contacts. An initial selection of countries has been made for the contamination cases, with the majority of them having detailed information on this particular problem available at the local level.
The information sheets for all the case studies identified (except the five detailed ones) are shown in Appendix 1.
Figure 1. Location of case studies
2.4 SELECTION OF FIVE CASE STUDIES FOR COMPREHENSIVE RESEARCH
After discussion with DG Environment, the following five case studies were selected for comprehensive research:
Erosion / UK general case
Erosion / France Lauragais and Pays de Caux
Contamination / France Metaleurop Noyelles-Godault
Salinisation / Spain Central Ebro Area
Organic Matter Loss / Sweden
Detailed descriptions of these five case studies are given in chapter 3 and in Appendix 2.
Erosion has been assessed in England and Wales since the early 1980s, through field-based assessment rather than plot experiments, as is usually done for this particular threat. Therefore, this extensive study, involving 17 communities, gives valuable information on the rate, frequency, and extent of the erosion, as well as off-site effects (such as sediments transported out of the catchments, etc.). The costs have been evaluated mainly so as to estimate on- and off-farm impacts in the short and medium term. Although the figures are imprecise and remain open to criticism (even by
Case Studies Location
Flooding
Erosion
Salinisation
OM LossLandslide
Contamination
Assessing the Economic Impact of Soil Deterioration
the main authors of the studies), they are considered as being appropriate for an overall comparison of the impacts of erosion.
In France, two Erosion Case Studies have been proposed. To be completed by Olivier.
These European Countries are representative of medium current erosion rate. To be completed by Olivier.
Soil contamination from localised sources is often related to industrial plants no longer in operation, past industrial accidents and improper municipal and industrial waste disposal. At industrial plants still in operation, soil contamination is commonly associated with past activities, although current activities can still have significant impacts (EEA-UNEP, 2000). The Métaleurop Nord site is representative of this main category of local point source contamination. This case study is also a megasite ("large scale contaminated sites, which pose a large potential or an actual risk of deterioration to groundwater, sediment, soil and surface-water quality»). Among the millions of contaminated sites identified in Europe, megasites represent just a few hundred or so. In most cases, however, they are the only ones with off-site effects, generating different types of cost. For the smaller sites, as described in other cases studies developed in Appendix 1, costs are mainly related to reclamation / restoration of the site, nowadays often included in redevelopment project costs in order to accelerate the re-use of the site. This case is also located in an important industrial area, the Nord-Pas de Calais region, with numerous industrial sites potentially impacting the same natural resources.
Erosion and contamination constitute threats that are studied both in terms of environmental and economic issues. For the other threats identified in the European Communication on Soil Protection, information is lacking.
The salinisation case study is located in one of the European regions affected by this threat, Spain. This particular case is related to extensive irrigation, the intention of which is to allow plant growth in otherwise water-deficient conditions. Irrigation can increase growth and Soil Organic Matter (SOM) builds up. Irrigation is mainly applied in arid and semi-arid regions. As established in the working groups of the Soil Protection Strategy, no detailed study exists on the extent of the salinisation problem in Europe and the assessment of the economic impacts has been limited to the consequences of the use (and non-use) of irrigation in agriculture. The cost estimation for the environmental impacts (e.g. impact on biodiversity) of salinisation is not included. Studies on the effects of the different options for maintaining, or even improving the situation are just beginning in the light of the pursuit to increase agricultural production. Here again, the figures are open to criticism, with the effects being short-lived in relation to climate conditions. Variations in the yield from year to year because of weather variations are likely to be sufficiently large to mask any decline in yield attributed to soil structural or salinisation problems.
For Organic Matter loss, data availability is even worse. Soil quality is governed by its Organic Matter content, which is dynamic and responds rapidly to changes in soil management. Apart from areas with a surplus of animal manure, the organic matter content of many cultivated soils across Europe is falling as a result of intensive modern agriculture. Organic matter in soils has a range of key roles that influence many of the activities undertaken on the surface of the earth, it is therefore of paramount importance that we maintain the soil organic matter levels and, where these have declined significantly, that we make every effort to improve them. One of the statements in this area is that a key action in most degraded soil systems is to add organic materials and improve the Soil Organic Matter content so as to maintain soil functions and soil uses. The Working Group on Organic Matter of the Soil Protection stated that data on soil fauna and flora, Organic Matter and heavy metals are inadequate at the European level and that it is extremely difficult to assess Organic Matter content (and thus OM losses) on a level broader than the local scale.
BRGM RP 53091 14

Assessing the Economic Impact of Soil Deterioration
BRGM RP 53091 15
At the European scale, three types of configurations for OM losses issues are encountered: i) peat exploitation in Northern Europe (Scandinavia, Ireland), ii) intensive agriculture and progressive depletion of organic matter content under middle latitude (e.g. France, Netherlands, Germany), iii) historic and intensive OM losses due to climat, desertification in the South Europe. The peat extraction can be considered as a voluntary and irreversible soil degradation.
The case studies of Sweden are related to peat cutting and OM extraction, and not really to OM loss as required in this study. Although peat soils only cover a minor part of the total global land area (about 2.3%), they are estimated to represent as much as 23% of the total organic carbon stock in soils. This case could be considered as a hotspot of SOM change.
In a first step, a flooding case study related to to a major climatic event that occurred in 1999 was preselected. Establishing the part that soil played in the flooding was not easy and highly uncertain. The extent, frequency and severity of the damage are closely related to the actual climatic event. Therefore, to work out costs on a regional, national or European basis, it would be necessary to simulate the size of the area affected by specific events, how often the damage will occur in relation to the importance of the event, and how severe the damage will be. This is still a major research issue.
2.5 SELECTION OF FIVE CASE STUDIES FOR COMPREHENSIVE RESEARCH
The selection of the five case studies could not fulfill all preliminary objectives (good geographical balance, representative of the major threats, availability of environmental and economic data). To cover the different forms of each threat at the European scale, several case studies would be needed.
The areas with the available data, in particular economic ones, are not necessarily the ones most severely affected by the soil threats.
The different case studies represent one of the main categories of types of each threat:
• medium erosion rate for the two areas,
• megasites for the contamination,
• salinisation related to extensive irrigation,
• peat extraction as the Organic Matter Loss.
They cover only two economic sectors impacts, agriculture (for erosion and salinisation) and industry (contamination and OML), the most studied in the past.
Due to this data situation, the selected case studies cannot represent the European situation and therefore, for the extrapolation exercice, they will not be the only data source.
2.6 DATA QUANTITY AND QUALITY
It should be noted that:
Data sources, existing at European, national and even regional levels, are dispersed, whatever the threat studied;
The national and regional data are not generally available for use outside the country or the region of origin;

Assessing the Economic Impact of Soil Deterioration
The same data found in the different sources present similarities, but also differences, probably a reflection of the documentation of procedures and resuls of data collection (protocols);
Access to primary data is low, without any interpretation or expert judgement;
Data reliability is difficult to assess, with certain data sources giving either primary or secondary (interpreted) data; the identity of the producer of the primary data is not always known;
Existence of the different technical and economic standards for quantification; the available data must be homogeneous in order to facilitate better combination, interpretation and comparison. There is therefore a need for harmonisation of data and scope;
Certain data are related to changes in the legal framework or to new social expectations (which should be defined and implemented in order to gain a better economic assessment). Therefore, the ‘standard’ is not static.
Some of the overall costs must be considered as conservative because:
estimations of non-use costs are lacking for certain consequences of threats (e.g. loss of life, health impacts for flooding, health and biodiversity for erosion, environmental damages for almost all the threats, etc.);
other costs are covered by the Government budgets (e.g. all expenditure during the actual emergency period of the threat);
some only consider short-term issues.
There are several features relevant to this:
the non-use values are neglected by the main actors involved in the management of each threat;
some of the costs occur with a time lag, not necessarily compatible with the time schedule of certain actors;
the interests of some damaged groups are not represented due to the level of complexity of the threats (interference at individual, local, regional, national, international levels).
Given the lack of scientific basis and the scarcity of information/resources, it was not possible to consider all the effects of soil damage (on-site and off-site effects).
2.7 ANALYSIS OF THE COLLECTED DATA
2.7.1 Types of threat covered by economic data During this case study part of the project, in-depth economic information was obtained for:
several cases on erosion (more specifically water erosion) and local sources of contamination (no information on diffuse pollution costs),
two cases for salinisation, flooding,
one for organic matter loss and landslide.
This is in line with the results of the literature review (Görlach et al. 2004) in which a lot of ‘studies focus on the costs of erosion, whereas other aspects of soil degradation receive less attention’. The information is accessible at a local / national level (via Ministries or scientists) or the European level, via European networks or the European Institutions currently operating on these particular threats.
BRGM RP 53091 16

Assessing the Economic Impact of Soil Deterioration
BRGM RP 53091 17
The situation of data availability varies from country to country (when available at this level), and from threat to threat.
2.7.2 Types of cost
Generally, PC (on-site private damage costs) and RC costs (private restoration costs) were easily collected. As previously seen in the Literature Review, the information on non-use values of soil related to the studied threats is highly deficient.
The situation for erosion and contamination can be rather different:
for erosion, the off-site costs represent a significant part of the overall costs, exceeding the on-site impact (related to yield losses),
for contamination, the situation varies from site to site, depending on the type of emission at the origin of the contamination. At Megasites where off-site effects occur, such as the generation of potential health impacts on the neighbouring population, these costs can be important and often exceed the on-site impact costs and is covered by the public authorities. At small sites, the on-site impact costs are the main part of the overall costs and can be managed within the respective redevelopment project.
For contamination, costs vary from country to country, in relation to the national legal framework, in particular the level of tolerable risk, potentially leading to different remediation objectives for the same type of site.
In almost all the cases, the primary data sources are not identified or known by the data providers (second-hand data), which prevents us from providing a comprehensive and reliable cost estimation.
2.7.3 Evaluation of the proposed indicators
The environmental and economic indicators elaborated on the basis of the results of the Literature Review propose a direct and logical link between the two types of indicators. For erosion, contamination and salinisation, environmental indicators can be partly developed on the basis of the publicly accessible information.
Unfortunately, some of the data necessary to establish the environmental indicators are not yet available as synthesis of data at the European level, e.g. the surface areas affected by contamination.
Some countries inventory:
the surface of contaminated soils, which is necessary for the evaluation of reclamation cost, but requires site investigations; therefore, the information is not necessarily available on all sites depending on the progress level of management.
the site surface, easily accessible information searched at an early stage of the investigation (historical analysis) and that is necessary for the redevelopment of the area. A direct link with the land transaction market exists in some cases.
Depending on the objectives, both types of information are interesting. Recommendations to collect these data could be made in order to fulfil both management requirements.
Therefore, for erosion and contamination, the methodology described in the Literature Review, chapter 4.6, could be derived, in part, on the basis of the theoretical and case study considerations.

Assessing the Economic Impact of Soil Deterioration
2.7.4 Information at national level The entire Member States have been contacted either via the Ministries for Environment, Environment Agencies or Scientific Experts involved in European Networks in the field of soil quality. The data situation is very contrasted and generally bearly satisfactory. However, some European countries have partial information on soil quality and the economic impact of its deterioration. The collected data is given in Appendix 3.
BRGM RP 53091 18
Assessing the Economic Impact of Soil Deterioration
BRGM RP 53091 19
3 Detailed studies
3.1 EROSION / UK GENERAL CASE
In Europe, it is mainly water and wind that cause soil erosion. Repeated erosion causes irreversible soil loss over time, thus reducing the ecological functions of soil: mainly biomass production, crop yield due to the removal of nutrients for plant growth and reduction in soil filtering capacity due to disturbance of the hydrological cycle (from precipitation to runoff). The major reasons are unsustainable agricultural practices and overgrazing in medium- and high-risk areas of land degradation (EEA, 1999a), together with deforestation, urban and industrial activities.
In the early 1980s, the Ministry of Agriculture in England and Wales took the decision to assess whether water erosion was a true problem, deciding to answer the question through field-based assessment rather than plot experiments. Although giving valuable information on the rates, frequency and extent of erosion, as well as the delivery of sediments outside catchments, the results do not allow identification of a relationship to individual parameters, so that erosion rates cannot be predicted.
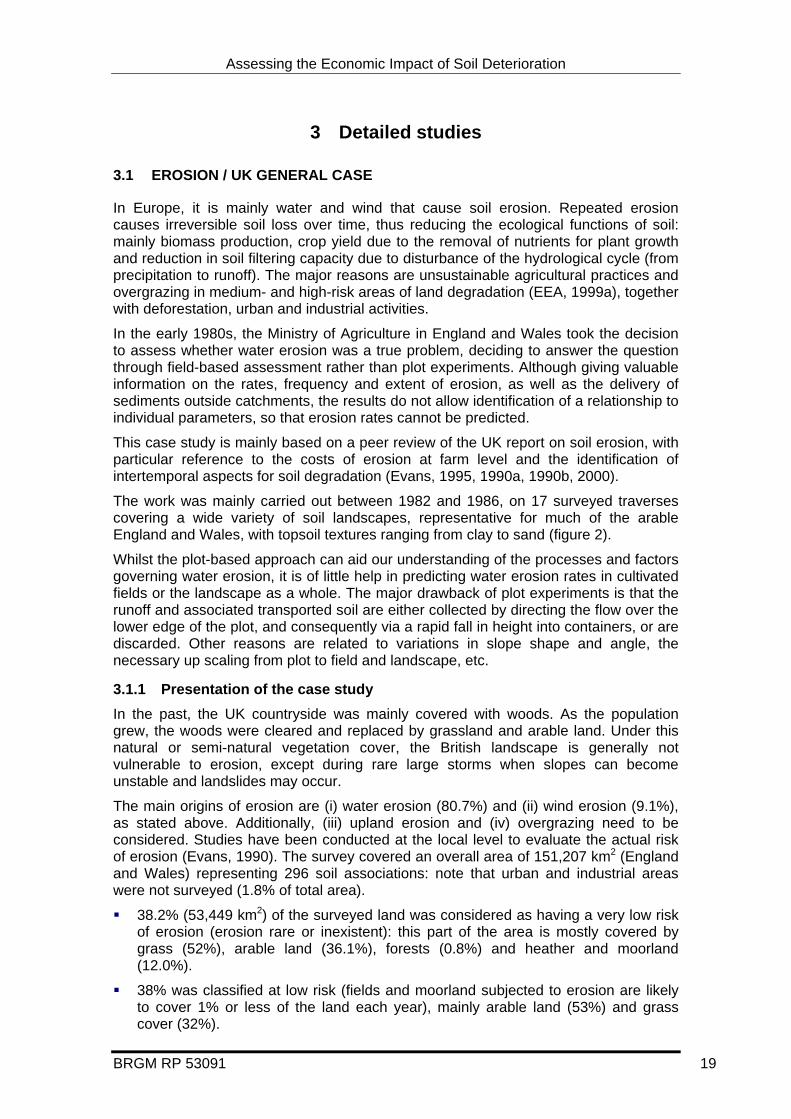
This case study is mainly based on a peer review of the UK report on soil erosion, with particular reference to the costs of erosion at farm level and the identification of intertemporal aspects for soil degradation (Evans, 1995, 1990a, 1990b, 2000).
The work was mainly carried out between 1982 and 1986, on 17 surveyed traverses covering a wide variety of soil landscapes, representative for much of the arable England and Wales, with topsoil textures ranging from clay to sand (figure 2).
Whilst the plot-based approach can aid our understanding of the processes and factors governing water erosion, it is of little help in predicting water erosion rates in cultivated fields or the landscape as a whole. The major drawback of plot experiments is that the runoff and associated transported soil are either collected by directing the flow over the lower edge of the plot, and consequently via a rapid fall in height into containers, or are discarded. Other reasons are related to variations in slope shape and angle, the necessary up scaling from plot to field and landscape, etc.
3.1.1 Presentation of the case study In the past, the UK countryside was mainly covered with woods. As the population grew, the woods were cleared and replaced by grassland and arable land. Under this natural or semi-natural vegetation cover, the British landscape is generally not vulnerable to erosion, except during rare large storms when slopes can become unstable and landslides may occur.
The main origins of erosion are (i) water erosion (80.7%) and (ii) wind erosion (9.1%), as stated above. Additionally, (iii) upland erosion and (iv) overgrazing need to be considered. Studies have been conducted at the local level to evaluate the actual risk of erosion (Evans, 1990). The survey covered an overall area of 151,207 km2 (England and Wales) representing 296 soil associations: note that urban and industrial areas were not surveyed (1.8% of total area).
38.2% (53,449 km2) of the surveyed land was considered as having a very low risk of erosion (erosion rare or inexistent): this part of the area is mostly covered by grass (52%), arable land (36.1%), forests (0.8%) and heather and moorland (12.0%).
38% was classified at low risk (fields and moorland subjected to erosion are likely to cover 1% or less of the land each year), mainly arable land (53%) and grass cover (32%).
Assessing the Economic Impact of Soil Deterioration
18% (25,157 km2) was at moderate risk (for arable land, between 1 and 5% shows a risk of erosion each year), of which 75% is arable land,
4.4% (6,198 km2) was at high risk (more than 5% of fields affected per year)
1.5% was classified at very high risk (more than 10% affected per year and two years in five as much as 20-25% affected).
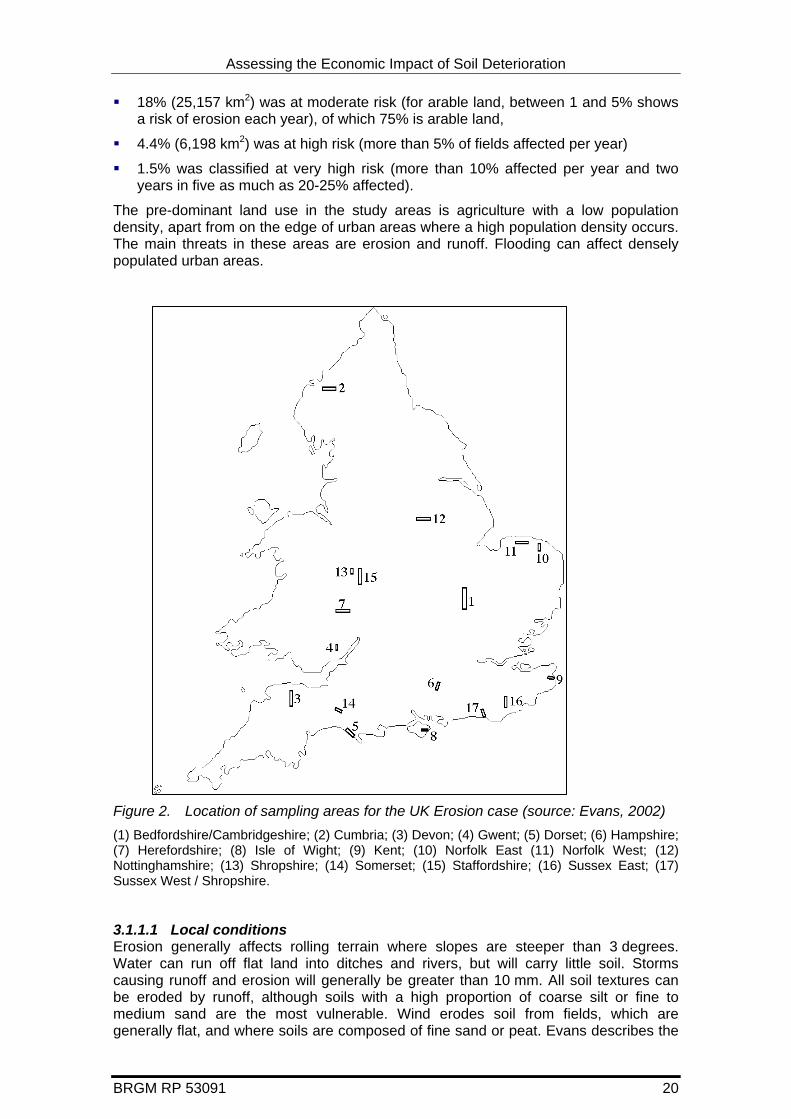
The pre-dominant land use in the study areas is agriculture with a low population density, apart from on the edge of urban areas where a high population density occurs. The main threats in these areas are erosion and runoff. Flooding can affect densely populated urban areas.
Figure 2. Location of sampling areas for the UK Erosion case (source: Evans, 2002) (1) Bedfordshire/Cambridgeshire; (2) Cumbria; (3) Devon; (4) Gwent; (5) Dorset; (6) Hampshire; (7) Herefordshire; (8) Isle of Wight; (9) Kent; (10) Norfolk East (11) Norfolk West; (12) Nottinghamshire; (13) Shropshire; (14) Somerset; (15) Staffordshire; (16) Sussex East; (17) Sussex West / Shropshire.
3.1.1.1 Local conditions Erosion generally affects rolling terrain where slopes are steeper than 3 degrees. Water can run off flat land into ditches and rivers, but will carry little soil. Storms causing runoff and erosion will generally be greater than 10 mm. All soil textures can be eroded by runoff, although soils with a high proportion of coarse silt or fine to medium sand are the most vulnerable. Wind erodes soil from fields, which are generally flat, and where soils are composed of fine sand or peat. Evans describes the
BRGM RP 53091 20

Assessing the Economic Impact of Soil Deterioration
BRGM RP 53091 21
physical characteristics of sites showing a risk of erosion (1990a, 1995), the vulnerability of soil associations to erosion by water, wind and in upland settings (where both weather and animals are important) (1990b) and the risk of erosion occurring in relation to particular crops (2002). 3.1.1.2 Extent of erosion The monitored erosion in the 17 localities covers 70,000 ha/year. Erosion and its impacts are analysed for areas ranging in size from one hectare, to an individual field (average area 7.5 ha), through to soil associations up to hundreds of hectares.
The area most affected by erosion was the sand land of Nottinghamshire in central England where, on average, 14% of the arable landscape was eroded each year, with a range of 1.5 – 24.0%. Erosion was less common on silty (3.9% of fields) and clayey (1.6%) soils. Eight other localities where erosion was widespread (5-10% of fields) also had erodible topsoil with high sand or silt contents, and where a wide range of crops that were vulnerable to erosion, both during winter and spring storms, were commonly present.
3.1.1.3 Rates of erosion The highest erosion rates (4-5 m3/ha) were associated with fields where the topsoil had high contents of silt or fine sand (Kent, Somerset, Isle of Wight, Hampshire). For the sandy soils in Staffordshire and Shropshire, these erosion rates were halved. In many other areas, the erosion rate was about 1.0 m3/ha. The highest rates of erosion by crop type were related to market garden crops such as maize, ley grasses, hops and sugar beet.
Fields in Kent, the Isle of Wight, and Somerset can have their land surfaces lowered by about 0.25 - 0.5 mm/ha*yr for soils eroded every one or two years.
3.1.1.4 Frequency of erosion The frequency of erosion was greatest in Kent (average about once a year) where irrigation is used to grow field vegetables and over half the fields are eroded twice or more per year. In most of the other areas, the fields that suffered erosion were eroded every 2-4 years.
3.1.1.5 Conservation measures Conservation measures are rarely applied to protect the land from water erosion. The set-aside technique is known to be particularly effective in stopping erosion (Evans and Boardman 2003), and at a very reasonable cost for the farmer. Other techniques also deployed are grass buffer strips (funded by EU or the government), small dams, cultivating and drilling roughly along rather than across the contour of valley floors and depressions (being careful not to funnel water into these depressions) as well as planting cover crops. There are various ways to protect land and crops from wind erosion, with most of the costs being borne by the farmer. Farmers thus generally only protect high-value crops, such as sugar beet, carrots, onions, but not cereals. A nurse crop is most commonly used, which is later sprayed off. On sandy soils, rolling the land when slightly damp can produce a protective crust into which the sugar beet seeds are drilled; however, such a crust can exacerbate runoff. The following table shows a synthesis of the soil erosion characteristics in the 17 surveyed localities.
Table 3. Median volume of erosion (m3/ha) and total surface area of the 17 surveyed localities
Localities Total surface area (ha)
Main soil type Median Volume of erosion m3/ha
(1) (Bedfordshire) / Cambridgeshire
222,700 0.2

Assessing the Economic Impact of Soil Deterioration
BRGM RP 53091 22
Localities Total surface area (ha)
Main soil type Median Volume of erosion m3/ha
(2) Cumbria 680,900
(3) Devon 674,700 1.6
(4) Gwent 356,400 0.6
(5) Dorset 252,000 1.5
(6) Hampshire 427,100 High silt or sand content
0.6
(7) Herefordshire 218,300 0.6
(8) Isle of Wight 39,500 High silt or sand content
2.1
(9) Kent 395,000 High silt or sand content
1.2
(10) Norfolk East
(11) Norfolk West
532,200
0.5
(12) Nottinghamshire 218,600 Sand (also silty (3,9%) and clayey (1,6%) soils
1.8
(13) Shropshire 348,900 Sandy soils 1.4
(14) Somerset 418,500 High silt or sand content
2.8
(15) Staffordshire 298,900 Sandy soils 1.3
(16) Sussex East 377,900 0.5
(17) Sussex West 0.4
3.1.2 Impact of soil erosion Soil erosion impacts are generally divided into on-site and off-site impacts. While on-site impacts are direct effects of soil loss (expressed in t/ha*yr) and affect mainly agricultural activities, off site impacts are the consequent damages to natural ecosystems and entire water bodies. In the UK study, the impacts are classified as "on-farm" and "off-farm".
On-site (or on-farm) impacts Loss of soil fertility: fertility and productivity of eroded land are reduced. Farmers
have to apply more fertilisers in order to compensate yield losses.
Changes in crop yields: water erosion typically affects crop production through a decrease in plant rooting depth, as well as a removal of plant nutrients and organic matter.
Water erosion can locally lead to uprooting of plants and/or trees, together with dissection of the terrain by rills and gullies.
Off-site (or off-farm) impacts Damage to roads and property: soil can be carried out of the fields and deposited
on roads and in ditches. Impacts felt by the highway authorities and the water
Assessing the Economic Impact of Soil Deterioration
BRGM RP 53091 23
supply industry can be considerable and much more severe than those at farm level.
Impacts on water pollution: sedimentary deposits can have severe implications for human health - heavy metals, phosphate or pesticides attached to sediments need to be removed to make water supplies drinkable.
The water-holding capacity of the soil can also be lowered through erosion, leading to disturbance of drainage, an increased occurrence of flooding and landslides.
Effects on natural ecosystems: for example, soil material eroded from agricultural land disturbs natural ecosystems. The input of sediments into watercourses can harm fishery activities.
In addition, losses of soil by erosion can be considered irreversible over a period of 100 years, due to the very slow rates of soil formation. In southeast England, wind erosion has been recorded at 21 t/ha*y over a period of 30 years. Therefore Evans (1995) introduced a temporal distinction of impacts: short-term (5-10 years), medium-term (10-50 years) and long-term (>50 years) impacts. On-site impacts occur mainly in the short- to medium-term period, whereas off-site impacts occur in the medium- to long-term period.
3.1.3 Cost estimation The typology of the costs elaborated by Evans has been used as a conceptual framework to describe different costs of soil erosion in these case studies. The UK evaluation made in the mid-1980s and early 1990s for England and Wales for the costs of the impacts of erosion is based on the following three steps:
Estimation of the area of the land affected,
Assessment of how often the damage occurs,
Evaluation of how severe the damage is.
All monetary values that were derived from the UK study are reported in Euro values, using the Consumer Price Indices of 2000 (UK National Statistics).
3.1.3.1 On-site costs This category refers to the direct costs of soil erosion incurred mainly by farmers. The estimated costs of the individual arable farmer are small, both in the short and medium term. On average, about 4% of arable land is concerned by erosion in the 17 localities.
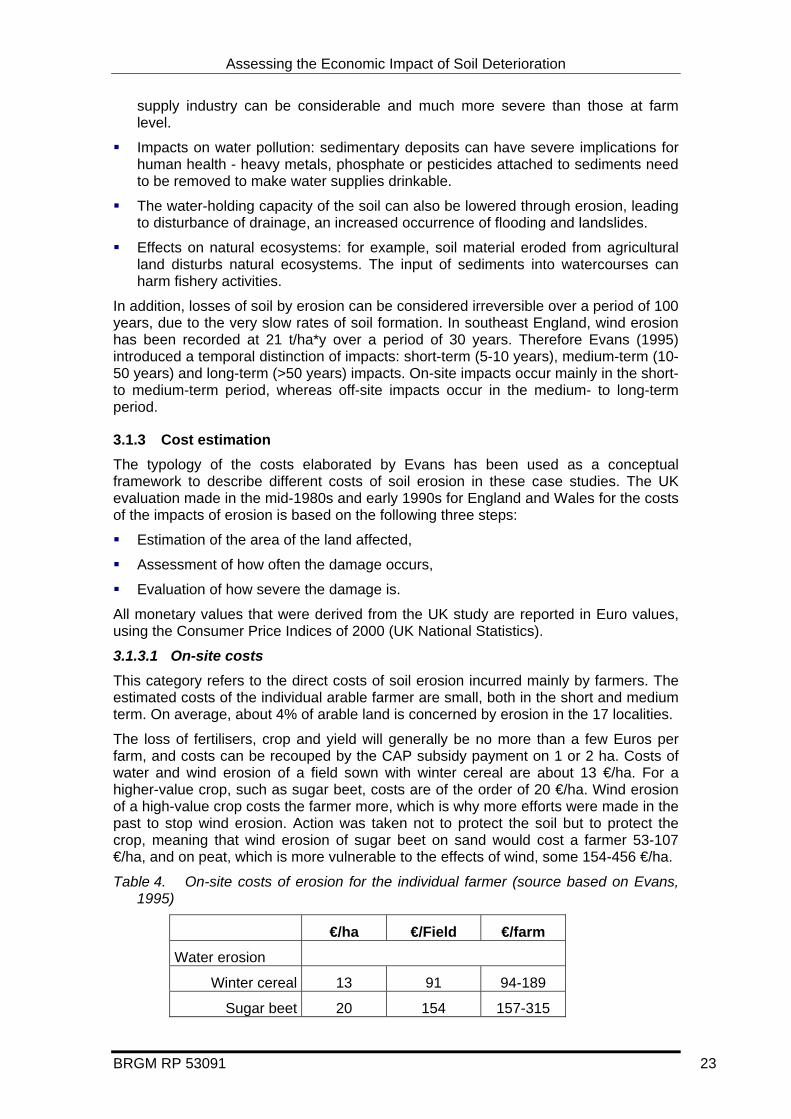
The loss of fertilisers, crop and yield will generally be no more than a few Euros per farm, and costs can be recouped by the CAP subsidy payment on 1 or 2 ha. Costs of water and wind erosion of a field sown with winter cereal are about 13 €/ha. For a higher-value crop, such as sugar beet, costs are of the order of 20 €/ha. Wind erosion of a high-value crop costs the farmer more, which is why more efforts were made in the past to stop wind erosion. Action was taken not to protect the soil but to protect the crop, meaning that wind erosion of sugar beet on sand would cost a farmer 53-107 €/ha, and on peat, which is more vulnerable to the effects of wind, some 154-456 €/ha.
Table 4. On-site costs of erosion for the individual farmer (source based on Evans, 1995)
€/ha €/Field €/farm
Water erosion
Winter cereal 13 91 94-189
Sugar beet 20 154 157-315
Assessing the Economic Impact of Soil Deterioration
BRGM RP 53091 24
€/ha €/Field €/farm
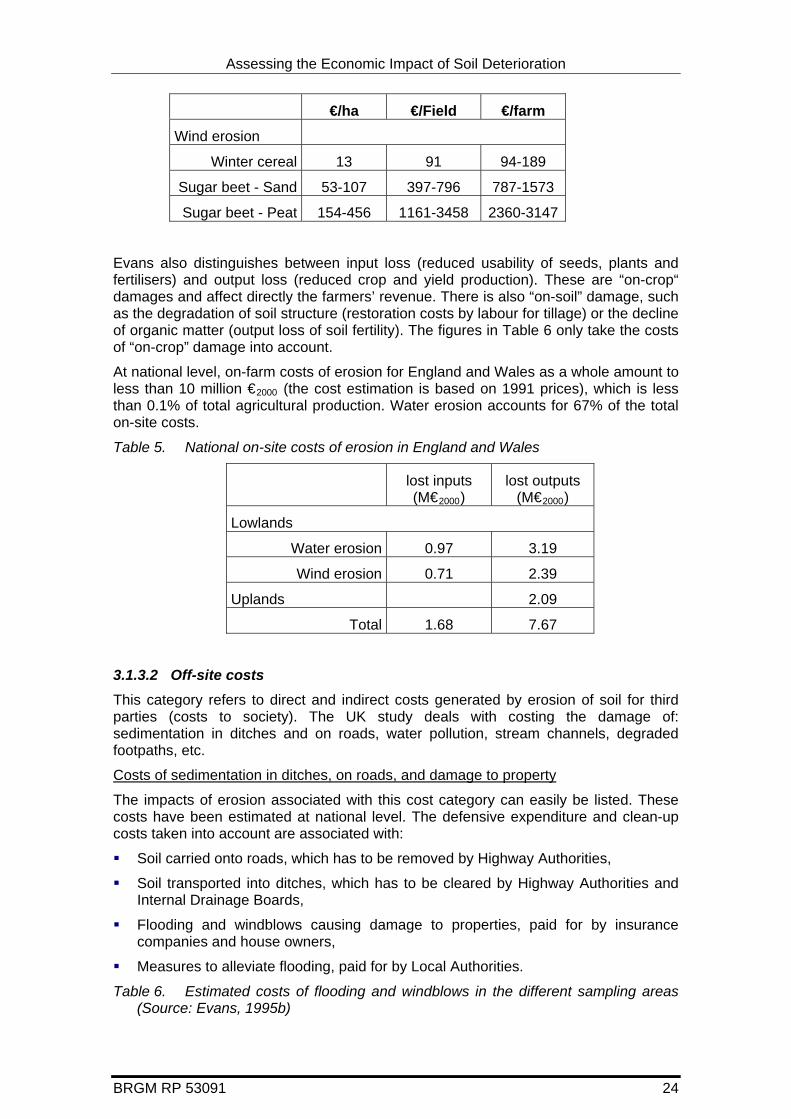
Wind erosion
Winter cereal 13 91 94-189
Sugar beet - Sand 53-107 397-796 787-1573
Sugar beet - Peat 154-456 1161-3458 2360-3147
Evans also distinguishes between input loss (reduced usability of seeds, plants and fertilisers) and output loss (reduced crop and yield production). These are “on-crop“ damages and affect directly the farmers’ revenue. There is also “on-soil” damage, such as the degradation of soil structure (restoration costs by labour for tillage) or the decline of organic matter (output loss of soil fertility). The figures in Table 6 only take the costs of “on-crop” damage into account.
At national level, on-farm costs of erosion for England and Wales as a whole amount to less than 10 million €2000 (the cost estimation is based on 1991 prices), which is less than 0.1% of total agricultural production. Water erosion accounts for 67% of the total on-site costs.
Table 5. National on-site costs of erosion in England and Wales
lost inputs (M€2000)
lost outputs (M€2000)
Lowlands
Water erosion 0.97 3.19
Wind erosion 0.71 2.39
Uplands 2.09
Total 1.68 7.67
3.1.3.2 Off-site costs This category refers to direct and indirect costs generated by erosion of soil for third parties (costs to society). The UK study deals with costing the damage of: sedimentation in ditches and on roads, water pollution, stream channels, degraded footpaths, etc.
Costs of sedimentation in ditches, on roads, and damage to property
The impacts of erosion associated with this cost category can easily be listed. These costs have been estimated at national level. The defensive expenditure and clean-up costs taken into account are associated with:
Soil carried onto roads, which has to be removed by Highway Authorities,
Soil transported into ditches, which has to be cleared by Highway Authorities and Internal Drainage Boards,
Flooding and windblows causing damage to properties, paid for by insurance companies and house owners,
Measures to alleviate flooding, paid for by Local Authorities.
Table 6. Estimated costs of flooding and windblows in the different sampling areas (Source: Evans, 1995b)

Assessing the Economic Impact of Soil Deterioration
BRGM RP 53091 25
Locality and impact Erosion process Costs € / ha
Cambridgeshire fens – roads Wind 0.031
Nottinghamshire sand lands- roads Water 0.134
Lincolnshire sand lands - roads Wind 0.144
Norfolk fens - roads Wind 0.786
Isle of Wight greensand - roads Water 1.020
Somerset - roads Water 1.042
Sussex downland – mostly houses and flood alleviation
Water 1.065
Isle of Wight light loams – houses and roads Water 1.255
Lincolnshire fens - ditches Wind 1.818
Kent chalk and greensand – roads only Water 2.349
Isle of Axholme sand and peat – roads and ditches
Wind 3.601
East Anglian fens - ditches Wind 8.491
Mean for 12 localities 1.87
By applying figures from Table 6 to those areas known to be the most vulnerable to erosion, we can estimate the national costs of the impacts of erosion on ditches, roads and property: 6.9 M€2000 per year. On average, the cost of clearing up and alleviating erosion was 1.9 €/ha.
In addition, flooding of roads can also cause motor accidents. An estimation of the costs, assuming five slight accidents per year, gives a cost of ca. 200,000 €/year.
The estimated costs of casualties due to flooding are not considered. This would significantly increase the off-site costs caused by erosion.
Costs of water pollution
Soil erosion is a major source of phosphates and pesticides, which become bound to sediments and that need to be removed in order to render water supplies drinkable. The sources of pesticides in water are mainly from spraying winter cereals. Only rough estimations can be made as to what extent the pollution is caused by erosion or leaching from farmers’ fields. Most drinking-water reservoirs in eastern and southern England are filled with water pumped from rivers at high-flow periods, especially in the winter when erosion and leaching take place.
The costs of the water industry for making water drinkable by removing nutrients, pesticides, sediment, and colour (from organic colloids, mainly from peat) are estimated at 504.4 M€2000 per year. This cost is paid for directly by the water industry and indirectly by the water consumers.
Costs of stream channels
It has been estimated that erosion and sedimentation of stream channels costs River Authorities 13.6 M€2000 per year.
Costs of maintaining footpaths
Assessing the Economic Impact of Soil Deterioration
Footpath degradation in England and Wales costs an average of 1.9 M€2000 per year. This figure includes restoring national trails but does not cover, for example, the costs of repairing footpaths in local country parks.
Costs related to fisheries and fishing
The input of sediment into water courses has further impacts, especially on fisheries and fishing (disappearance or threat of fish populations). Such impacts are difficult to quantify in terms of cost (a loss in revenues of the fisheries or fewer fishing permits and licences). To give some perspective to the costs of erosion on fishing, the National Rivers Authority (NRA) spent 42.87 M€2000 on fisheries for the financial year 1991/92.
Costs related to monitoring erosion
This category refers to the cost of the measures implemented to limit off-site impacts of erosion. The estimated costs only include erosion monitoring. The NRA spent a further 148.2 M€2000/year monitoring water quality in 1992, of which a certain proportion must be allotted to erosion. If we assume that at least 10% of NRA expenditure is related to erosion monitoring, then associated costs can be approximated at 15 M€2000/year.
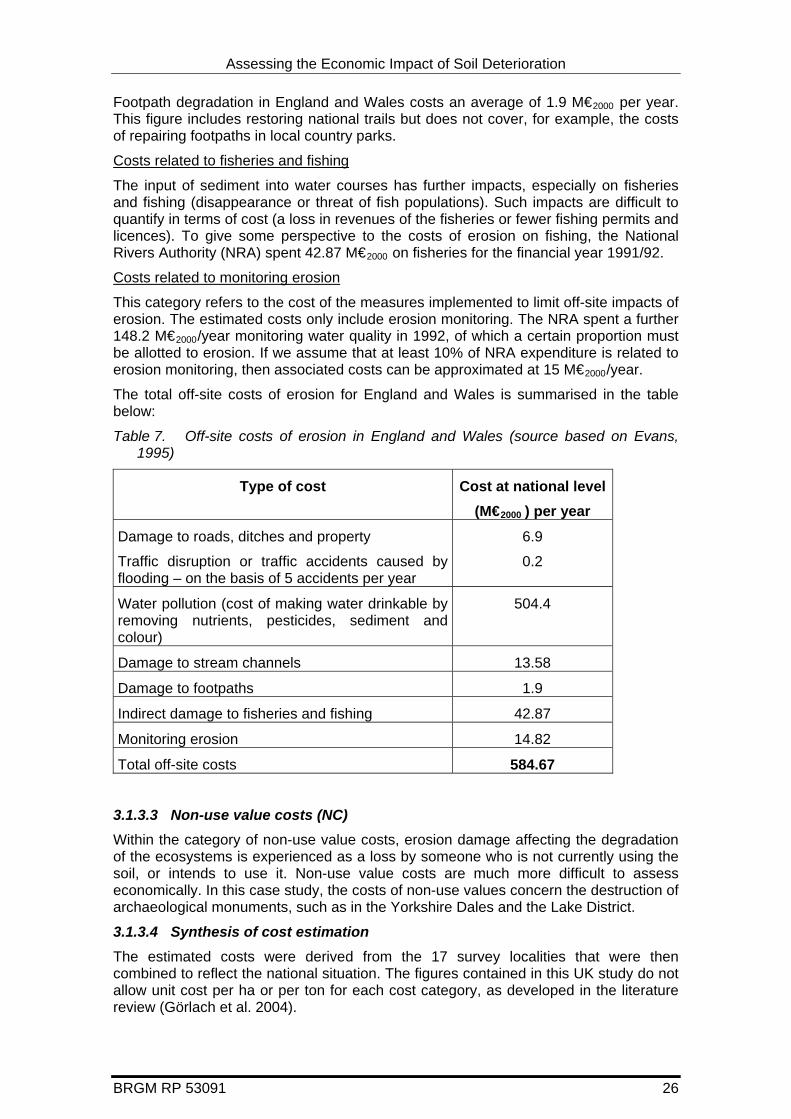
The total off-site costs of erosion for England and Wales is summarised in the table below:
Table 7. Off-site costs of erosion in England and Wales (source based on Evans, 1995)
Type of cost Cost at national level (M€2000 ) per year
Damage to roads, ditches and property
Traffic disruption or traffic accidents caused by flooding – on the basis of 5 accidents per year
6.9
0.2
Water pollution (cost of making water drinkable by removing nutrients, pesticides, sediment and colour)
504.4
Damage to stream channels 13.58
Damage to footpaths 1.9
Indirect damage to fisheries and fishing 42.87
Monitoring erosion 14.82
Total off-site costs 584.67
3.1.3.3 Non-use value costs (NC) Within the category of non-use value costs, erosion damage affecting the degradation of the ecosystems is experienced as a loss by someone who is not currently using the soil, or intends to use it. Non-use value costs are much more difficult to assess economically. In this case study, the costs of non-use values concern the destruction of archaeological monuments, such as in the Yorkshire Dales and the Lake District.
3.1.3.4 Synthesis of cost estimation The estimated costs were derived from the 17 survey localities that were then combined to reflect the national situation. The figures contained in this UK study do not allow unit cost per ha or per ton for each cost category, as developed in the literature review (Görlach et al. 2004).
BRGM RP 53091 26
Assessing the Economic Impact of Soil Deterioration
BRGM RP 53091 27
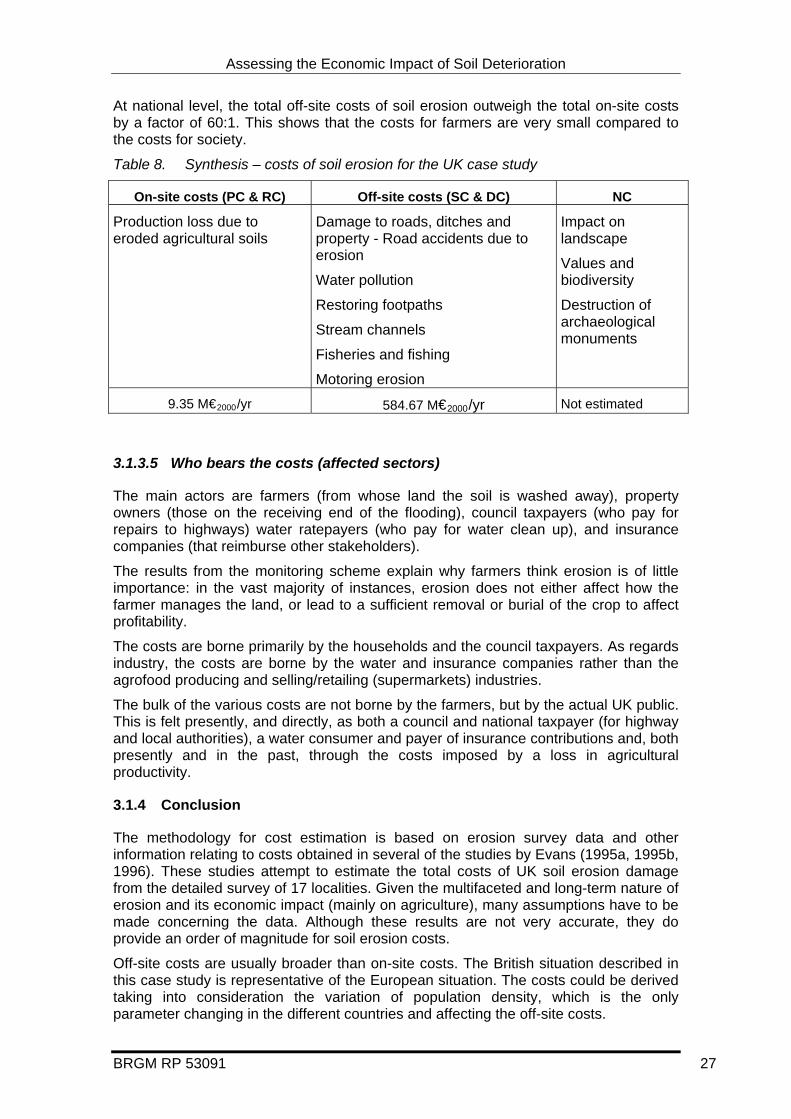
At national level, the total off-site costs of soil erosion outweigh the total on-site costs by a factor of 60:1. This shows that the costs for farmers are very small compared to the costs for society.
Table 8. Synthesis – costs of soil erosion for the UK case study
On-site costs (PC & RC) Off-site costs (SC & DC) NC
Production loss due to eroded agricultural soils
Damage to roads, ditches and property - Road accidents due to erosion
Water pollution
Restoring footpaths
Stream channels
Fisheries and fishing
Motoring erosion
Impact on landscape
Values and biodiversity
Destruction of archaeological monuments
9.35 M€2000/yr 584.67 M€2000/yr Not estimated
3.1.3.5 Who bears the costs (affected sectors)
The main actors are farmers (from whose land the soil is washed away), property owners (those on the receiving end of the flooding), council taxpayers (who pay for repairs to highways) water ratepayers (who pay for water clean up), and insurance companies (that reimburse other stakeholders).
The results from the monitoring scheme explain why farmers think erosion is of little importance: in the vast majority of instances, erosion does not either affect how the farmer manages the land, or lead to a sufficient removal or burial of the crop to affect profitability.
The costs are borne primarily by the households and the council taxpayers. As regards industry, the costs are borne by the water and insurance companies rather than the agrofood producing and selling/retailing (supermarkets) industries.
The bulk of the various costs are not borne by the farmers, but by the actual UK public. This is felt presently, and directly, as both a council and national taxpayer (for highway and local authorities), a water consumer and payer of insurance contributions and, both presently and in the past, through the costs imposed by a loss in agricultural productivity.
3.1.4 Conclusion
The methodology for cost estimation is based on erosion survey data and other information relating to costs obtained in several of the studies by Evans (1995a, 1995b, 1996). These studies attempt to estimate the total costs of UK soil erosion damage from the detailed survey of 17 localities. Given the multifaceted and long-term nature of erosion and its economic impact (mainly on agriculture), many assumptions have to be made concerning the data. Although these results are not very accurate, they do provide an order of magnitude for soil erosion costs.
Off-site costs are usually broader than on-site costs. The British situation described in this case study is representative of the European situation. The costs could be derived taking into consideration the variation of population density, which is the only parameter changing in the different countries and affecting the off-site costs.
Assessing the Economic Impact of Soil Deterioration
In some instances, it is not possible to give monetary values for erosion. For example, the costs of damaged or lost items that, although considered by their owners as irreplaceable (such as landscape historical value), cherished items of great personal/sentimental value, have very little value in concrete terms.
In addition, the fear of being flooded by sediment-laden water can become substantial if a change in the land use leads to more frequent flooding; for example, a change from arable crops to outdoor pig farming. It is impossible to give an economic value to worries, but these can nevertheless have a significant negative effect on health.
The links between soil erosion and its impacts and economic uses are immediate. In a context of intensified land use in England and Wales over the last ca. 50 years and farmers responding to government and European Union economic policies, erosion has become more extensive, frequent and severe; in turn, the impacts have become more widespread and pervasive, especially in the last two decades in the wetter western parts.
The actual erosion risk depends mainly on the present-day land use. It may change over time for economic (e.g. with the introduction of new crops with high added value or an increase in the number of grazing animals) and political reasons, or because of climate change. Changes in soil erosion risk category have been estimated so as to assess the consequences of land-use changes or intensification, although this has not been used in this case study to evaluate the consequences on erosion costs.
3.2 EROSION / FRANCE LAURAGAIS AND PAYS DE CAUX
To be completed by Olivier and Madjit.
3.3 CONTAMINATION / FRANCE METALEUROP
This case study deals with local soil contamination, which represents one of the major threats on soils at the EU level. Local contamination derives from point sources, mainly waste disposal, industrial and military activities or accidental contamination. Existing data on local soil contamination are incomplete due to the various classification systems used in different countries (EEA, 2003b). As a whole, local contamination has been given less attention than diffuse contamination. The major impacts of local soil contamination are groundwater contamination and health problems due to direct contact with contaminated soil, which usually results in the necessity to put restrictions on certain land uses.
3.3.1 Case study description The Region Nord – Pas de Calais is one of the most ancient industrial regions of France. Industrial development was initiated with the discovery of coal in 1726. For more than two hundred years, the local economy has been dependent on heavy industries such as the metallurgical and metal processing industry, basic chemical production, textile manufacture, production of gas and coke, as well as on the transport industry. The region counts thousands of ancient industrial sites, most of which are contaminated. At least 13,000 ancient industrial sites have been identified as part of a census that is not yet completed.
This case study focuses on one large site, occupied until recently by the Métaleurop Nord plant. This plant was, until it was closed down in January 2003, the only site for production of primary lead in France. Covering an area of 38 hectares located along the Deule Canal, in the municipalities of Noyelles – Godault (department of Pas de Calais), this zinc and lead smelter started operations in 1894. This lead and zinc
BRGM RP 53091 28
Assessing the Economic Impact of Soil Deterioration
BRGM RP 53091 29
production plant, based on thermal processes of primary fusion, was classified as an IPPC plant (Integrated Pollution Prevention and Control). In addition, considering the dramatic scale of the pollution, the site was also classified as a megasite (WG on Contamination, 2003) - meaning that the site has an EU dimension and is relevant to existing EU policy.
Metaleurop S.A. announced on 16th January 2003 its decision to withdraw support from its subsidiary Metaleurop Nord. The company was wound up by the commercial court of Béthune on 10th March 2003. In May 2003, the “orphan site” procedure started. ADEME (French National Agency for Environment and Energy), by Ministerial order, has to meet some of the environmental obligations of the defaulting firm.
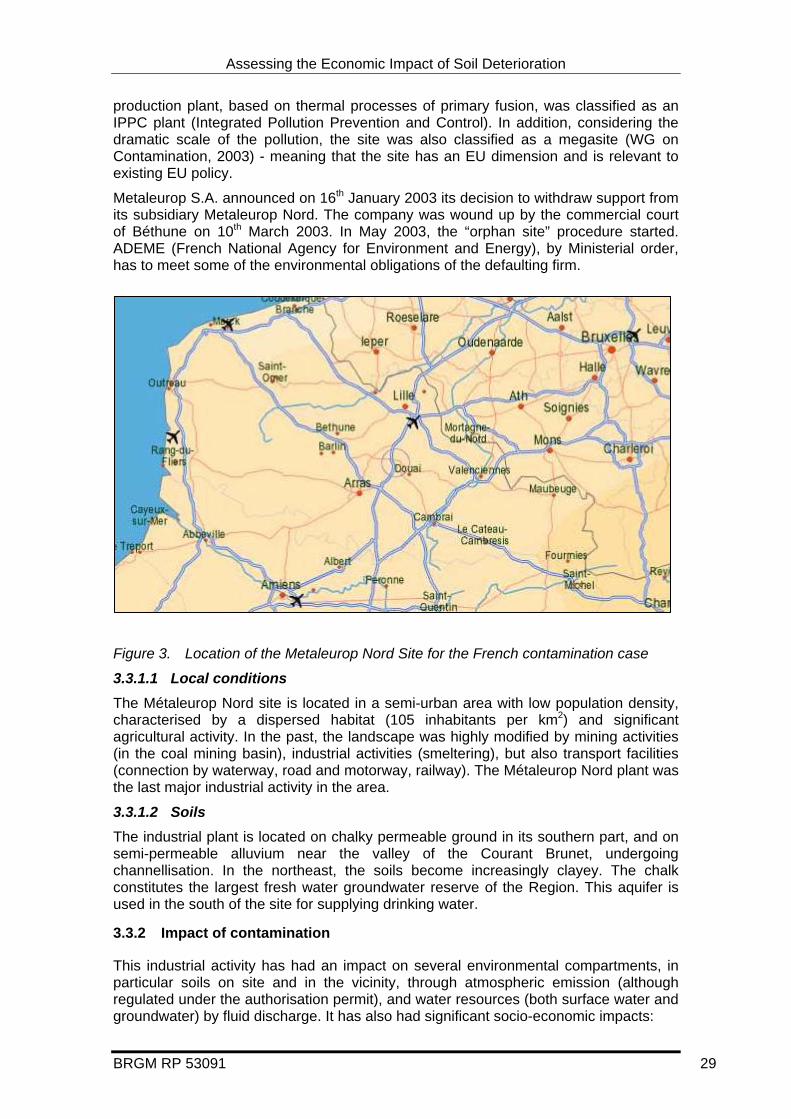
Figure 3. Location of the Metaleurop Nord Site for the French contamination case
3.3.1.1 Local conditions The Métaleurop Nord site is located in a semi-urban area with low population density, characterised by a dispersed habitat (105 inhabitants per km2) and significant agricultural activity. In the past, the landscape was highly modified by mining activities (in the coal mining basin), industrial activities (smeltering), but also transport facilities (connection by waterway, road and motorway, railway). The Métaleurop Nord plant was the last major industrial activity in the area.
3.3.1.2 Soils The industrial plant is located on chalky permeable ground in its southern part, and on semi-permeable alluvium near the valley of the Courant Brunet, undergoing channellisation. In the northeast, the soils become increasingly clayey. The chalk constitutes the largest fresh water groundwater reserve of the Region. This aquifer is used in the south of the site for supplying drinking water.
3.3.2 Impact of contamination
This industrial activity has had an impact on several environmental compartments, in particular soils on site and in the vicinity, through atmospheric emission (although regulated under the authorisation permit), and water resources (both surface water and groundwater) by fluid discharge. It has also had significant socio-economic impacts:

Assessing the Economic Impact of Soil Deterioration
Impact on air: important atmospheric emissions from the Pb smelter operating from 1894 until the beginning of 2003 by thermal processes of primary fusion. In 2001, the site disposed of 18.3 tons of channelled lead, to which can to be added around 10 to 15 tons of diffuse effluent – 0.8 tons of cadmium, 26 tons of zinc and 8,600 tons of sulphur dioxide. Air pollution has, however, decreased over the last 20 years: 350 tons of lead were emitted per year in the 1970s, 146 tons in 1978 and around 12 tons in 2003.
Impact on surface water: the water quality of the Haute-Deule canal (effluent discharge) falls in class 3 (bad quality). The estimated values of contamination of the sediments are: Cd up to 2,000 ppm, Hg up to 80 ppm, Ni up to 500 ppm, Pb up to 10,000 ppm, Zn up to 9,000 ppm, Cu up to 380 ppm, As up to 350 ppm. Surface water discharge was also significantly reduced with the start-up of a sewage station in 1988 (150 tons of lead discharged in 1988, 4 to 5 tons of lead in 2003, 1.9 tons of cadmium, 10 tons of zinc).
Impact on groundwater: contamination of the chalk aquifer by lead and arsenic is limited to the site property boundary by hydraulic trapping. Also, to avoid dispersion of the pollutant plume, 100 m3/h are pumped from former site wells. The variation in water quality is monitored using a network of 15 piezometers in the chalk aquifer and 4 others in the sandy aquifer in the north of the area. The aquifer remains usable for drinking purposes without treatment downstream of the site.
Impact on soil: heavy metals are mainly confined to the upper soil levels (0 – 40 cm), except for zinc, which migrates deeper. A total of 600 ha of urban soils are heavily contaminated (>250 ppm Pb) and 4,000 ha show a lead concentration >200 ppm.
Impact on agriculture: about 400 ha of soils used for agricultural production have been heavily contaminated (>250 ppm Pb). As a result, high levels of contaminants are also found in crops and animal products.
Impact on health: human health has been affected by atmospheric pollution generated by the production units, by the smelter residue deposits (essentially by dust emissions), by the raw materials of the site's “soil” (main contributor, by leaching, to groundwater pollution), and by the ancient industrial waste dumps of certain production units. Increased lead concentrations in the blood were reported with some correlation observed with distance to the Metaleurop plant. The consumption of vegetables grown in gardens and contaminated drinking water was partly responsible for this situation. Children are particularly affected: in 1995, 14% presented lead levels higher than the standard of 100 micrograms per litre of blood; in 2002, 11% of children aged 2 – 3 years living in the five closest municipalities were still affected. The adult population is equally affected, with 29 people declared inapt for work every year (average for 1996-2001). It has to be noted however, that this health problem is not only due to soil contamination but also to air pollution: assessing the relative responsibility of each contamination channel is almost impossible.
Socio-economic impact: the decision to withdraw the plant caused unemployment for 830 workers of the company. The company’s assets are far from adequate to meet the social liabilities. Also, this social crisis caused economic difficulties, which are extending, through a “domino effect”, to subcontracting firms (3,000 indirect jobs are concerned). Although the unemployment is a direct consequence of the needed actions for reducing the contamination (soil and air). The associated impacts have not been considered in this study.
3.3.3 Conservation measures Two types of conservation measures have been implemented:
BRGM RP 53091 30

Assessing the Economic Impact of Soil Deterioration
BRGM RP 53091 31
Restrictions for land use
In January 1999, Governmental agencies issued a set of regulatory measures aiming to reduce the population's exposure to contamination through land-use restrictions (“servitudes – Plan d’Intérêt Général”). Restrictions targeted both urban development and agricultural activities:
Zone with a contamination exceeding 1,000 ppm lead (255 ha): in such areas, the construction of new buildings is not permitted, agricultural production is not allowed, and land cannot even be used for recreational activities (football pitch, playground, etc.).
Zone with a contamination ranging from 500 to 1000 ppm lead (590 ha): land use is permitted given a set of constraints: contaminated soil has to be treated before use; and transport of materials out of the zone is not authorised.
Additional measures Given the fact that the company went bankrupt, a government agency (ADEME) had to substitute the private operator to perform the obligations not fulfilled by Metaleurop. In particular:
Agricultural land with contamination levels higher than 250 ppm of lead were purchased and turned into forest.
Removal and replacement of the upper layer of polluted soil (>500 ppm lead) as well as the demolition of buildings.
Operation and maintenance of the pumping well installed on the site to prevent pollution extending into the aquifer, and monitoring groundwater quality.
Control of the contamination level of agricultural products and the elimination, by incineration, of crops unsuitable for human or animal consumption (in zone >250 ppm lead).
Cleaning up and decontamination of the school playgrounds.
Completion of the detailed risk assessment study, in order to estimate the duration over which the conservation measures must be maintained.
Organisation of public information campaigns: recommendation of precautionary measures to be adopted by the population to prevent health risks.
3.3.4 Source of data used in the case study
Due to the particular situation (closing down of the company in 2003 due to bankruptcy), the economic data had to be collected through numerous providers, mainly the public authorities in charge of the management of the current situation (health impact, ecosystem impact) and the private investor in charge of reclamation and economic redevelopment of the site (plans for a waste treatment plant).
Existing official documents (authorisation permits, environmental diagnosis, detailed risk assessments, draft description of the redevelopment project) were reviewed to identify and describe the different impacts and protection / restoration measures that have been implemented in the area. Interviews of the relevant contacts currently in operation were then conducted to fine tune the information found in the reports.
All the information related to the costs when the site was in operation are considered now as lost due to the disappearance of the previous operator, Metaleurop. In particular, the two main elements of costs of the conservation measures (investments, operation and maintenance costs) are not available.

Assessing the Economic Impact of Soil Deterioration
The estimation of the social costs has been done using generic national data through national databases.
3.3.5 Economic damages and costs The typology of the cost elaborated by Ecologic in the literature review report (Görlach et al. 2004) has been used as a conceptual framework for describing the different costs of soil contamination in this case study (see literature review, section 4.6.1).
In addition to the difficulties of accessing the quantitative economic data, several methodological difficulties were also encountered in differentiating the costs. Firstly, certain damages generated by contamination are due not only to soil contamination, but also to air and water pollution (this is typical, for instance, in the case of the impact on public health). Secondly, certain costs could not be assessed in monetary terms, which makes it impossible to provide a yearly average cost of contamination. Thirdly, since it was not possible to collect time series data, it was not possible to assess the total costs of pollution generated by this industry over the last 110 years of activity.
3.3.5.1 On-site private costs (PC) This category refers to the direct costs of soil contamination incurred by the operator of the industrial plant. The following on-site private costs have been reported:
• Demolition of contaminated buildings and pre-treatment of the site for a new industrial use. This generated a cost of 22.5 M€, which was financed by the private operator in charge of site redevelopment (SITA project) and public subsidies to the private investor.
• In-depth diagnosis and detailed risk assessment on the site to be redeveloped for industrial use, with two specific targets (groundwater resources and human resources) - 200,000 €, financed by the private operator of site redevelopment
• Hydraulic pumping in the aquifer to avoid extension of the pollution plume and treatment of the water before its release into the canal (300,000 €/year).
Due to the existence of specific subsidies from public bodies in order to cover the on-site damage costs, it was difficult to distinguish between private and public costs. To avoid double counting, the on-site private costs are included in the on-site restoration costs category (see below).
3.3.5.2 On-site restoration and repair costs (RC) This category includes all costs of soil removal and treatment, decontamination of buildings, etc. There are two types of activities: measures taken by the previous operator and measures taken by the caretaker. The former type is excluded, but the latter is included in the cost evaluation. The caretaker is considered as a third party obliged to take measures since the site owner failed to meet his environmental and managerial obligations. The information on costs collected is presented in the table below:
Table 9. On-site restoration and repair costs (RC) for the contamination case
Description of cost Type of measure Estimated cost (€ per year - 2003)
Demolition of contaminated buildings, pre-treatment of the site for industrial use, 22.5 M€ (4 years)
7.5 M€ for demolition from public subsidies
6 M€ for re-industrialisation from public subsidies
9 M€ through private costs
6.053 M€2003
Soil decontamination and treatment
Excavation of contaminated soils and replacement with safe soil in residential
195,000 €2003
BRGM RP 53091 32

Assessing the Economic Impact of Soil Deterioration
BRGM RP 53091 33
Description of cost Type of measure Estimated cost (€ per year - 2003)
areas
Acquisition of the farms located around the site (>250 ppm Pb)
Acquisition of 5 ha of contaminated agricultural land (up to now)
70,000 €2003
Refitting of forests in contaminated zone (>250 ppm Pb).
80 ha (in 2003, 1000 €/ha) 80,000 €2003
Monitoring impact (mainly groundwater and workers' exposure)
In-depth diagnosis detailed risk assessment (on-site)
In-depth diagnosis detailed risk assessment (site surroundings)
200,000 €2003
250,000 €2003
Total on-site costs 6.653 M€
The total on-site costs are estimated at approximately 6.7 M€ for the reference year 2003. These costs should increase over the following years. For example, 400 ha land located around the site should be acquired with public funds and turned into forest. Considering the 2003 unit cost for land purchase (14,000 €/ha) and the unit cost for forest redevelopment (1,000 €/ha) the future costs of restoration measures should be increased by about 6 M€ for the land acquisition and forest redevelopment.
In addition, the in-depth diagnostic and detailed risk assessment is only based on the population’s health and groundwater, considered as the main targets in the area. Buildings and natural ecosystems are not taken into consideration as primary targets to be protected. This is due to the common assumption that protecting human health (which integrates ecosystems such as agriculture) up to the national acceptable risk levels should lead to the ecosystems protection. These costs must be considered as minimal, but a wider risk assessment taking into account environmental media (surface water resources and ecosystems) would have been far more expensive.
The overall remediation and excavation costs of all soils (leading to an unacceptable risk for the population and agricultural activities) were assessed by a Ministerial Commission in 2002 at 400 M€. The remediation measures were, however, only partly implemented. This is explained by the limited budget of the caretaker, but also by the fact that the major part of the costs would have to be borne by the public. This may partly explain the large difference between the original estimation of clean-up costs (up to 400 M€) and the total cost evaluation provided afterwards.
3.3.5.3 Off-site social costs (SC) This category refers to all costs generated by soil contamination for third parties. Some of these costs are borne by private actors: farmers whose land cannot be used for agricultural production, urban dwellers whose houses are depreciated due to contamination, etc. The different categories of social costs identified are detailed below. Those costs, often not considered in the site approach are partly estimated through assumptions presented below.
Human health impact
Population in the surroundings has been exposed to Pb contamination. 14 % of children and more than 5% of adults present blood lead levels higher than the standard concentration of 100 µg/l Pb. About 60,000 people living on 4,000 ha surrounding the site are concerned (results of the studies carried out by the regional health inspectorates).

Assessing the Economic Impact of Soil Deterioration
The amount of people declared inapt for work for a potential population of 3836 workers represents a certain cost. Analysis of historical data shows a marked inaptitude with, on average, 29 workers judged inapt for 200 days of work each year. Costs are approximately 140 €/day (coverage for health care and medication, national estimation).
The costs of the medical follow-up (monitoring networks) of the population and retired workers of the industrial site: between 2002 - 2004, three medical monitoring campaigns have been conducted: 1) tracking lead amongst children of five nearby villages (80,400 €); 2) an extension of the zone of the first monitoring (205,000 €); 3) medical follow-up of the former workers (200,000 €). The total costs of medical monitoring are 485,400 €.
Costs of Information campaigns on health and the environment: recommendations aimed at the local population to promote better practices (washing vegetables before cooking, hand washing before eating, etc.).
Note that the human health impact is not only due to soil contamination, but also to air and water pollution: it is difficult to isolate the impact of soil contamination alone.
Agricultural damage costs
The damage costs for agricultural activities are estimated from the subsidies for the compensation for a loss of activity - in relation to the environmental impacts on the crops and animal quality:
10,000 € in 2003 for 1,5 ha of potatoes unsuitable for human and animal consumption;
Approximately 30,000 € for the whole of the downgrading of cultures in animal feeds and withdrawing of some products from the food chain in line with the European regulations in force.
To this must be added associated costs for the monitoring and control of agricultural production:
Survey of agricultural production with elimination of those unsuitable for consumption (in most cases, the products were incinerated) - 150,000 €.
Survey of agricultural production (milk, animal muscles (meat), plants for the animals, etc.) operated by the local authorities to assess agricultural production quality, 16,000 € for plants, but the same situation applies for cattle.
Urban impact
The impact of site contamination on land transactions and house pricing in the area has been assessed using the hedonic method, with information on the real estate values at local level (Letombe, Zuindeau, 2001). 341 land transactions were made between 1995 and 1999 in the area, for an average price of 49,509 €, an average interior liveable surface from 85 to 98 m² and an average land area ranging from 540 to 650 m². The price per m² in the three studied municipalities varied from 518 € to 625 €.
The impact that contamination has on the real estate values causes decreasing values of 12% 500 m from the site, 6.3% 800 m from the site, and 3.5% 1000 m from the site. Considering a normal housing price of 48,000 € and the number of houses (10,000) in the 4,000 ha contaminated area, and then the total loss on housing value is estimated at 34,88 M€.
Table 10. Off-site social costs (SC) for the contamination case
BRGM RP 53091 34
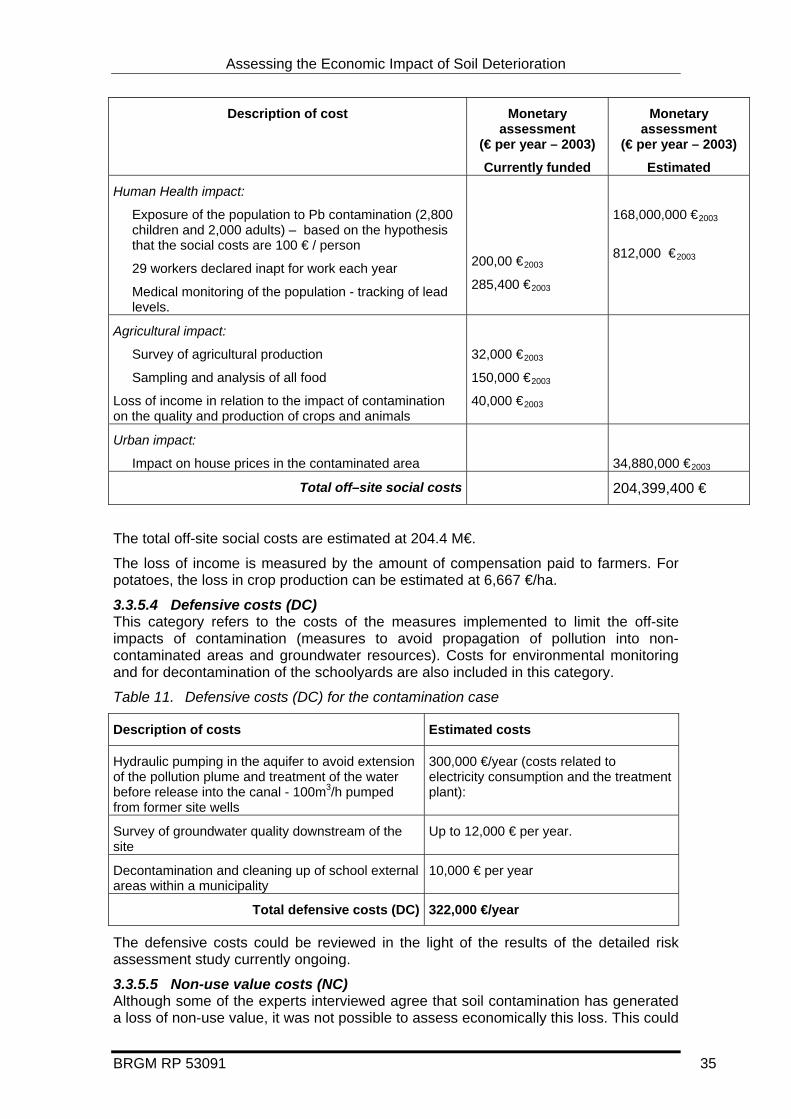
Assessing the Economic Impact of Soil Deterioration
BRGM RP 53091 35
Description of cost Monetary assessment
(€ per year – 2003)
Currently funded
Monetary assessment
(€ per year – 2003)
Estimated
Human Health impact:
Exposure of the population to Pb contamination (2,800 children and 2,000 adults) – based on the hypothesis that the social costs are 100 € / person
29 workers declared inapt for work each year
Medical monitoring of the population - tracking of lead levels.
200,00 €2003
285,400 €2003
168,000,000 €2003
812,000 €2003
Agricultural impact:
Survey of agricultural production
Sampling and analysis of all food
Loss of income in relation to the impact of contamination on the quality and production of crops and animals
32,000 €2003
150,000 €2003
40,000 €2003
Urban impact:
Impact on house prices in the contaminated area
34,880,000 €2003
Total off–site social costs 204,399,400 €
The total off-site social costs are estimated at 204.4 M€.
The loss of income is measured by the amount of compensation paid to farmers. For potatoes, the loss in crop production can be estimated at 6,667 €/ha.
3.3.5.4 Defensive costs (DC) This category refers to the costs of the measures implemented to limit the off-site impacts of contamination (measures to avoid propagation of pollution into non-contaminated areas and groundwater resources). Costs for environmental monitoring and for decontamination of the schoolyards are also included in this category.
Table 11. Defensive costs (DC) for the contamination case
Description of costs Estimated costs
Hydraulic pumping in the aquifer to avoid extension of the pollution plume and treatment of the water before release into the canal - 100m3/h pumped from former site wells
300,000 €/year (costs related to electricity consumption and the treatment plant):
Survey of groundwater quality downstream of the site
Up to 12,000 € per year.
Decontamination and cleaning up of school external areas within a municipality
10,000 € per year
Total defensive costs (DC) 322,000 €/year
The defensive costs could be reviewed in the light of the results of the detailed risk assessment study currently ongoing.
3.3.5.5 Non-use value costs (NC) Although some of the experts interviewed agree that soil contamination has generated a loss of non-use value, it was not possible to assess economically this loss. This could
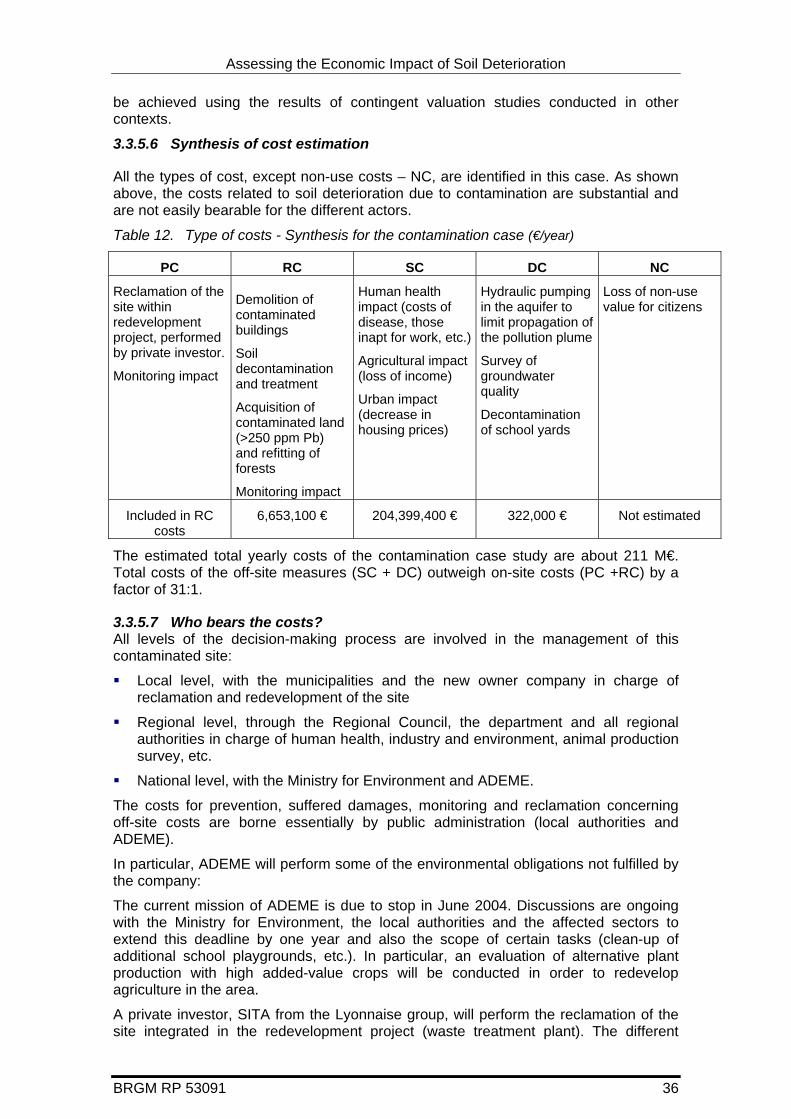
Assessing the Economic Impact of Soil Deterioration
be achieved using the results of contingent valuation studies conducted in other contexts.
3.3.5.6 Synthesis of cost estimation
All the types of cost, except non-use costs – NC, are identified in this case. As shown above, the costs related to soil deterioration due to contamination are substantial and are not easily bearable for the different actors.
Table 12. Type of costs - Synthesis for the contamination case (€/year)
PC RC SC DC NC
Reclamation of the site within redevelopment project, performed by private investor.
Monitoring impact
Demolition of contaminated buildings
Soil decontamination and treatment
Acquisition of contaminated land (>250 ppm Pb) and refitting of forests
Monitoring impact
Human health impact (costs of disease, those inapt for work, etc.)
Agricultural impact (loss of income)
Urban impact (decrease in housing prices)
Hydraulic pumping in the aquifer to limit propagation of the pollution plume
Survey of groundwater quality
Decontamination of school yards
Loss of non-use value for citizens
Included in RC costs
6,653,100 € 204,399,400 € 322,000 € Not estimated
The estimated total yearly costs of the contamination case study are about 211 M€. Total costs of the off-site measures (SC + DC) outweigh on-site costs (PC +RC) by a factor of 31:1.
3.3.5.7 Who bears the costs? All levels of the decision-making process are involved in the management of this contaminated site:
Local level, with the municipalities and the new owner company in charge of reclamation and redevelopment of the site
Regional level, through the Regional Council, the department and all regional authorities in charge of human health, industry and environment, animal production survey, etc.
National level, with the Ministry for Environment and ADEME.
The costs for prevention, suffered damages, monitoring and reclamation concerning off-site costs are borne essentially by public administration (local authorities and ADEME).
In particular, ADEME will perform some of the environmental obligations not fulfilled by the company:
The current mission of ADEME is due to stop in June 2004. Discussions are ongoing with the Ministry for Environment, the local authorities and the affected sectors to extend this deadline by one year and also the scope of certain tasks (clean-up of additional school playgrounds, etc.). In particular, an evaluation of alternative plant production with high added-value crops will be conducted in order to redevelop agriculture in the area.
A private investor, SITA from the Lyonnaise group, will perform the reclamation of the site integrated in the redevelopment project (waste treatment plant). The different
BRGM RP 53091 36
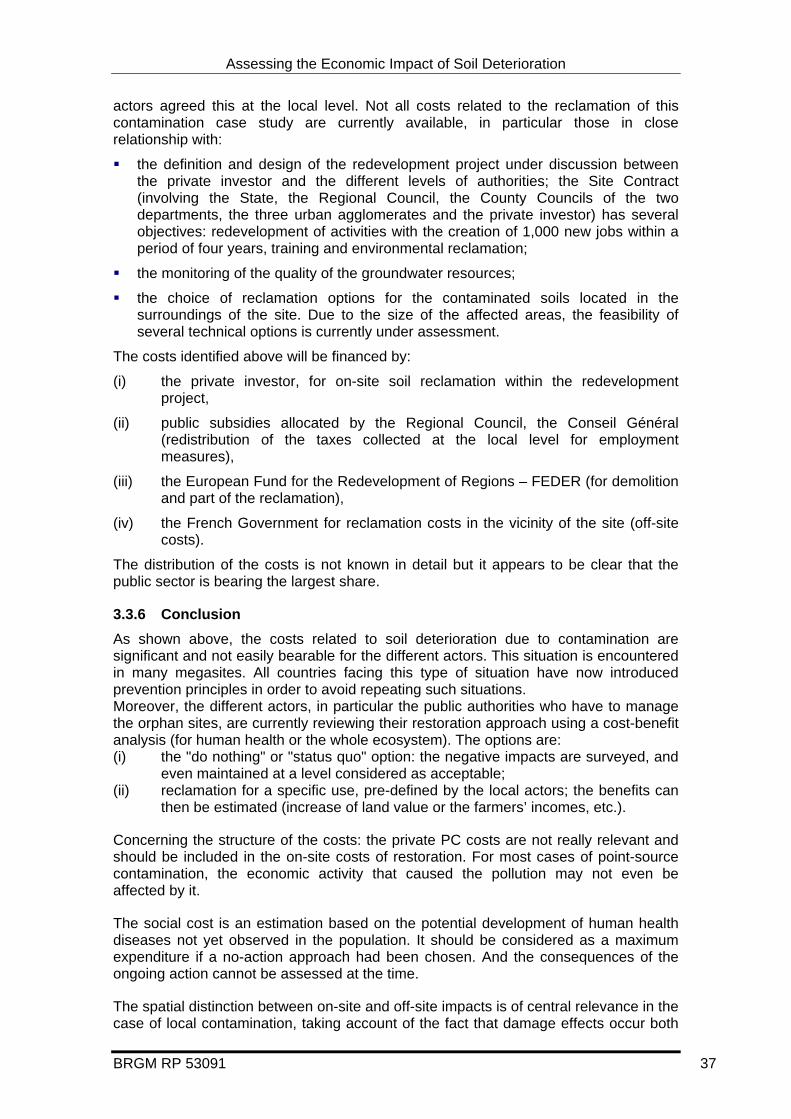
Assessing the Economic Impact of Soil Deterioration
BRGM RP 53091 37
actors agreed this at the local level. Not all costs related to the reclamation of this contamination case study are currently available, in particular those in close relationship with:
the definition and design of the redevelopment project under discussion between the private investor and the different levels of authorities; the Site Contract (involving the State, the Regional Council, the County Councils of the two departments, the three urban agglomerates and the private investor) has several objectives: redevelopment of activities with the creation of 1,000 new jobs within a period of four years, training and environmental reclamation;
the monitoring of the quality of the groundwater resources;
the choice of reclamation options for the contaminated soils located in the surroundings of the site. Due to the size of the affected areas, the feasibility of several technical options is currently under assessment.
The costs identified above will be financed by:
(i) the private investor, for on-site soil reclamation within the redevelopment project,
(ii) public subsidies allocated by the Regional Council, the Conseil Général (redistribution of the taxes collected at the local level for employment measures),
(iii) the European Fund for the Redevelopment of Regions – FEDER (for demolition and part of the reclamation),
(iv) the French Government for reclamation costs in the vicinity of the site (off-site costs).
The distribution of the costs is not known in detail but it appears to be clear that the public sector is bearing the largest share.
3.3.6 Conclusion As shown above, the costs related to soil deterioration due to contamination are significant and not easily bearable for the different actors. This situation is encountered in many megasites. All countries facing this type of situation have now introduced prevention principles in order to avoid repeating such situations. Moreover, the different actors, in particular the public authorities who have to manage the orphan sites, are currently reviewing their restoration approach using a cost-benefit analysis (for human health or the whole ecosystem). The options are: (i) the "do nothing" or "status quo" option: the negative impacts are surveyed, and
even maintained at a level considered as acceptable; (ii) reclamation for a specific use, pre-defined by the local actors; the benefits can
then be estimated (increase of land value or the farmers’ incomes, etc.).
Concerning the structure of the costs: the private PC costs are not really relevant and should be included in the on-site costs of restoration. For most cases of point-source contamination, the economic activity that caused the pollution may not even be affected by it.
The social cost is an estimation based on the potential development of human health diseases not yet observed in the population. It should be considered as a maximum expenditure if a no-action approach had been chosen. And the consequences of the ongoing action cannot be assessed at the time.
The spatial distinction between on-site and off-site impacts is of central relevance in the case of local contamination, taking account of the fact that damage effects occur both
Assessing the Economic Impact of Soil Deterioration
at the polluted site, as well as in spatially remote areas (off-site damage effects). For the soil contamination, the off-site costs of soil contamination tend to be higher than the on-site costs (roughly by a factor 30).
In addition, off-site effects can occur over a long period of time. The on-site effects are more obviously the consequences of soil degradation, as these directly affect the soil use at the site.
The table below is derived from the case study and can be used for extrapolation to other cases (unit cost in € per ha of contaminated area).
Table 13. Overview table for the contamination case as a basis for extrapolation
Contamination level
Surface Decontamination activities
Total costs
(period)
Unit cost
(per year)
Local site (>1000 ppm)
38 ha Demolition and treatment 22,5 M€ (4 years)
605,270 €/ha
Zone >250 ppm
400 ha agricultural soil
600 ha urban soil
Acquisition, turn to forest
Decontamination
6 M€ (8 years)
-
15,000 €/ha
-
200 – 250 ppm 3,000 ha Decontamination - -
Total off-site affected area
4,000 ha All measures 400 M€ (20 years)
27 M€/ha
Although the total costs appear very high, it should be noted that this amount covers a period up to 2023 (year when the lead content in the water is expected to reach 10µg/l). The resulting annual costs would be about 27 M€ (3% of discounting rate).
BRGM RP 53091 38
Assessing the Economic Impact of Soil Deterioration
BRGM RP 53091 39
3.4 SALINISATION / SPAIN CENTRAL EBRO AREA
Salinisation is the accumulation in soils of soluble salts of sodium, magnesium, and calcium to the extent that soil fertility is severely reduced. The process of salinisation can have natural origins (such as particular geological conditions, floods of fluvial waters derived from rich geological strata, or wind) or anthropogenic origins (irrigation using water resources rich in salt, use of fertilizers and additives, etc.). Salinisation is often associated with irrigation, as the water used systematically contains variable amounts of salts in particular in regions where low rainfall, high evapotranspiration rates or soil textural characteristics impede the washing out of the salts, which subsequently build-up in the surficial soil layers.
Sodium excess content and alkalinity nearly always accompany the process of salinisation. Sodication consists of an excessive increase in sodium, with respect to calcium and magnesium, in the exchange complex. Excessive saturation of exchange capacity with sodium provokes clay deflocculation and consequently destruction of the soil structure that, with low permeability conditions, may become irreversible. Alkalinity consists in an excessive increase of pH to exceed the value of 8.6 (buffers pH of carbonate). In this situation, due to degradation of the soil structure, most agricultural and forestry plants cannot survive.
Diffuse pollution by nitrates or pesticides can also be combined with salinisation and sodication due to the intensive agriculture activities in the same area. Salinity (cationic concentration) affects crop productivity and yield and farmers sometimes use excessive quantities of nutriments to fight against this. Salinisation and sodication affect also the structural and hydraulic characteristics of soil, water transport in the vadose zone, water available for crops and evapotranspiration. It can also lead to additional threats such as erosion.
3.4.1 Presentation of the case study Spain is the country with the largest irrigated area (3.4 million ha) in Western Europe (FAO, 1994). Aragón contains the central Ebro Valley, the most arid inland region of Europe. It is a semi-arid bioclimatic zone subject to salinisation and alkalinisation (evapotranspiration of 1,406 mm, annual precipitation of 337 mm, annual mean daily temperature of 14.9°C).
The Aragón area is bound by the Alcanardre and Flumen rivers and by the Flumen Canal. The irrigated land of Aragón has developed over the last 2000 years and comprises 413,100 ha, with an additional 404,600 ha that are likely to be irrigated in the future. Irrigated crops include mainly Alfalfa, winter cereals (barley and wheat), maize, sunflower, deciduous fruit trees, horticultural crops and rice. Agricultural production from these lands is an important component of the regional economy. Winter cereals are the only feasible crops that can be grown on the unirrigated lands, and crop production is often low or nil. Poor production years have an impact on the whole society and successive Spanish authorities have responded by increasing the area of irrigated land (Figure 4).

Assessing the Economic Impact of Soil Deterioration
Figure 4. Location of the studied area for the Spanish salinisation case
3.4.1.1 Local conditions The central Ebro area is an agricultural zone, with a low density of population (rural population with temporary manpower for seasonal production). It is mainly composed of flat areas, with an average rainfall of 400 to 500 mm/year, and a potential evapotranspiration of 1,300 to 1,400 mm/year.
Water for surface irrigation in Aragón is mainly derived from surface water resources. The old irrigation systems tapped the rivers by means of small diversion dams. Since the end of the 19th century, a system of large reservoirs has been built along the Pyrenean rivers. A network of concrete canals, which distribute water to irrigation districts, connects these reservoirs. More recently, pumping stations have been built to raise the water from downstream in the Ebro River to irrigate new areas above the local river level.
Before the 1940s, water was delivered by unlined canals to small, relatively flat fields, meaning that only slight levelling was required. In the following decades, concrete was used extensively to build canals and additional land was cultivated for agricultural production, which mechanically levelled the land for surface gravity flow irrigation.
The origin of the salt in these soils is the 100-m deep Tertiary deposits in the central Ebro Valley, exposed during levelling of irrigated land in the new disctricts for flood irrigation. The thin natural soil surface was destroyed exposing the deeper layers and saline marls.
Major problems with salt-affected soils developed as a result of some of these extensive levelling works. In the 1970s, new technologies such as sprinkler and drip irrigation (in particular for fruit plantations) were introduced, allowing for irrigation without major earth movement. The use of these modern irrigation systems allows the application of small water volumes with higher frequencies than flood irrigation,
BRGM RP 53091 40

Assessing the Economic Impact of Soil Deterioration
BRGM RP 53091 41
resulting in a decrease of the danger of a rise in the water table and evapoconcentration of deep salts in the root zone.
Figure 5. Main crops and their percentage in the studied area (1994) – source: Noguès et al., 2000.
3.4.1.2 Soils The central Ebro Valley is typical for aridisols. The soil moisture regime is arid with a xeric fringe. The old irrigated lands have soils (fluvents, orthents and psamments) that, in general, overlie limestone gravel deposits and are well drained.
Salinity is a common problem for irrigated lands. A wide diversity of sources and differences in the solubility of minerals, soil hydraulic properties, geomorphology, evapotranspiration rates and precipitation lead to large variations in soil salinity throughout space and time. Salinisation occurs when salts accumulate in a soil and desalinisation is the process whereby salts are removed from the soil. Soil salinity is dynamic rather than static; so many measurements are needed to assess the status at any one time (Herrero & Snyder, 1997). Table 14 displays the dominant soils with their percent in the studied area.
Table 14. Soil map units with their percent distribution over the studied area (source: Noguès et al., 2000)
Symbol Land Evaluation Units (LEU) %
A1.1 Soils of the irrigated structural platforms of sandstone and lutite. Association of Typic Xerorthents and Xeric Torriorthents with inclusions of Lithic Torriorthents.
4
A1.2 Same as A.1.1 but non-irrigated. <1
A.2.1 Soils of the irrigated residual platforms with coarse detrital sediments. Consociation of Calcixerollic Xerochepts with inclusions of Petrocalcic Xerochrepts, Xeric Haplocalcids and Xeric Petrocalcids.
20
A2.2 Soils of the non-irrigated residual platforms with coarse detrital sediments. Consociation of Calcixerollic Xerochrepts, Xeric Haplocalcids, Xeric Petrocalcids, and Calcic Petrocalcids.
1
B1 Soils of the glacis slopes on fine detrital sediments. Association of 11
Alfalfa & forage21%
Barley10%
Maize8%
Rice11%
Sunflower7%
Wheat10%
Others33%

Assessing the Economic Impact of Soil Deterioration
BRGM RP 53091 42
Symbol Land Evaluation Units (LEU) %
Xerofluvents and slightly saline typic Xerorthents with inclusions of Typic Natrixeralfs and Fluventic Xerochrepts.
B2.1 Soils of the other irrigated slopes on fine detrital sediments. Association of moderately saline Typic Xerofluvent, and slightly saline Typic Xerorthent with inclusions of Typic Natrixeralfs, calcixerollic Xerochrepts and slightly saline Xeric Torriorthents.
41
C.1 Soil of the Flumen and Alcanadre river terraces on fine detrital sediments. Association of typic Xerofluvents and typic Xerorthents
3
C.2 Soil of the Flumen river terrace, association of typic Xerofluvents and slightly saline typic Xerorthents (of the surface)
2
C.3 Soil of th the Flument terrace on fine detrital sediments. Strongly saline sdic Xeric Torriorthents.
<1
C.4 Soils of the Flumen terrace. Moderately saline sodic Typic Xerofluvents. 1
D1 Soils of the irrigated bottoms on fine detrital sediments. Association of strongly saline, sodic Typic Xerofluvents, strongly saline sodic Oxyaquic Xerofluvents and strongly saline sodic Typic Xerorthents, with inclusions of strongly saline sodic Typic Natrixeralfs, slightly saline sodic Xeric Torriorthents and moderately saline sodic Aquic Xerochrepts.
14
3.4.1.3 Origin and extent of the problem Different events are at the origin of the increased salinisation of soils and groundwater resources:
intensification of agricultural production,
improper irrigation and drainage management,
improper land levelling with soil destruction and burial under geological materials generating salt accumulations underground having a depleting effect on crop yields as its level approaches the crop root zone.
Due to the local climatic and soil quality conditions, the vulnerability of the Central Ebro area to salinisation is considered as very high.
There is a wide diversity of sources and differences in the solubility of minerals, soil hydraulic properties, geomorphology, evapotranspiration rates and precipitation, which lead to large variations in soil salinity throughout space and time.
Spain does not have soil maps at scales useful for agriculture. Therefore, the methods used to detect high soil salinity are on-site salinity monitoring, electromagnetic sensor or remote sensing for indirect detection using crop growth.
Information on soils is fragmentary, at levels that are even problematic for irrigation planning. When available, information is commonly unpublished and apparently difficult to access.
In 1976, the FAO developed a land evaluation system taking into consideration several criteria, such as adequacy of the irrigation water delivery system, chemical fertility, ease of crop establishment, flood risk, growth period, hailstorms and winds, location, mechanisation potential, oxygen availability, pests and diseases, pre- and post-harvest management, rooting depth, salinity, salinisation risk, soil adequacy for trafficability and ploughing, solar radiation, temperature regime, and water availability.
A survey of farmers and local agricultural experts was conducted in the study area to establish the relative importance of the different land qualities considered, as well as
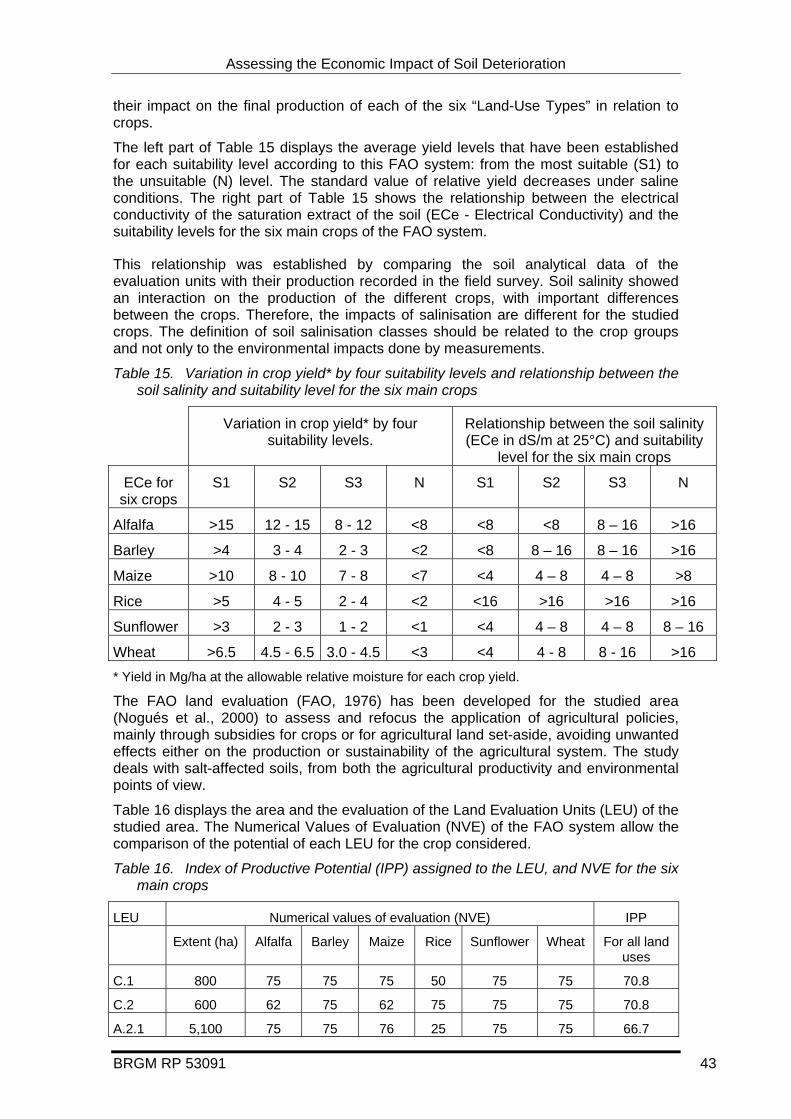
Assessing the Economic Impact of Soil Deterioration
BRGM RP 53091 43
their impact on the final production of each of the six “Land-Use Types” in relation to crops.
The left part of Table 15 displays the average yield levels that have been established for each suitability level according to this FAO system: from the most suitable (S1) to the unsuitable (N) level. The standard value of relative yield decreases under saline conditions. The right part of Table 15 shows the relationship between the electrical conductivity of the saturation extract of the soil (ECe - Electrical Conductivity) and the suitability levels for the six main crops of the FAO system.
This relationship was established by comparing the soil analytical data of the evaluation units with their production recorded in the field survey. Soil salinity showed an interaction on the production of the different crops, with important differences between the crops. Therefore, the impacts of salinisation are different for the studied crops. The definition of soil salinisation classes should be related to the crop groups and not only to the environmental impacts done by measurements.
Table 15. Variation in crop yield* by four suitability levels and relationship between the soil salinity and suitability level for the six main crops
Variation in crop yield* by four suitability levels.
Relationship between the soil salinity (ECe in dS/m at 25°C) and suitability
level for the six main crops
ECe for six crops
S1 S2 S3 N S1 S2 S3 N
Alfalfa >15 12 - 15 8 - 12 <8 <8 <8 8 – 16 >16
Barley >4 3 - 4 2 - 3 <2 <8 8 – 16 8 – 16 >16
Maize >10 8 - 10 7 - 8 <7 <4 4 – 8 4 – 8 >8
Rice >5 4 - 5 2 - 4 <2 <16 >16 >16 >16
Sunflower >3 2 - 3 1 - 2 <1 <4 4 – 8 4 – 8 8 – 16
Wheat >6.5 4.5 - 6.5 3.0 - 4.5 <3 <4 4 - 8 8 - 16 >16 * Yield in Mg/ha at the allowable relative moisture for each crop yield.
The FAO land evaluation (FAO, 1976) has been developed for the studied area (Nogués et al., 2000) to assess and refocus the application of agricultural policies, mainly through subsidies for crops or for agricultural land set-aside, avoiding unwanted effects either on the production or sustainability of the agricultural system. The study deals with salt-affected soils, from both the agricultural productivity and environmental points of view.
Table 16 displays the area and the evaluation of the Land Evaluation Units (LEU) of the studied area. The Numerical Values of Evaluation (NVE) of the FAO system allow the comparison of the potential of each LEU for the crop considered.
Table 16. Index of Productive Potential (IPP) assigned to the LEU, and NVE for the six main crops
LEU Numerical values of evaluation (NVE) IPP
Extent (ha) Alfalfa Barley Maize Rice Sunflower Wheat For all land uses
C.1 800 75 75 75 50 75 75 70.8
C.2 600 62 75 62 75 75 75 70.8
A.2.1 5,100 75 75 76 25 75 75 66.7

Assessing the Economic Impact of Soil Deterioration
BRGM RP 53091 44
LEU Numerical values of evaluation (NVE) IPP
Extent (ha) Alfalfa Barley Maize Rice Sunflower Wheat For all land uses
A.1.1 1,200 75 75 37 25 37 75 54.3
B.1 3,000 50 50 44 62 50 50 51.0
B.2.1 10,700 37 56 37 69 37 56 49.0
D.1 3,700 44 50 25 81 31 50 46.9
C.4 300 25 50 25 75 25 50 41.7
C.3 <100 25 50 25 25 25 25 29.2
A.2.2 200 0 50 0 0 50 25 20.8
A.1.2 200 0 50 0 0 37 25 18.7
In 59% of the study area, the IPP is under 50% (low Productive Potential). The lower indices occur in the non-irrigated enclaves, followed by the salt-affected soils.
One land evaluation unit occupies 41.4% of the study area, and its index of productive potential is moderate. It would require a more detailed soil survey in order to draw smaller units with more distinct indices that may be more suitable for decision-making on land set-asides.
This evaluation will be used for the drawing up of the reconnaissance soil survey (to be developed in the low index regions) and the detailed survey of salinisation. This detailed survey will then allow estimation of the benefits of some corrective actions undertaken.
3.4.2 Conservation measures: controlling salinity in irrigated soils
To ensure the beneficial effects of irrigation, soil salinity should not exceed certain values. In the past, different actions have been undertaken to control salinity in the Aragón area, such as:
Application of low salinity water for soil with good natural or artificial drainage properties;
Drainage of salts by open ditches and subsurface pipes;
Change of crops :
• rice instead of corn or sunflower, needing more water to maintain standing water in the paddies,
• use of salt-tolerant crops (e.g. barley) – but this entails a loss of profitability depending on the species.
Reclamation of degraded soils through:
• soil amendments (adding calcium ions that displace sodium ions from the soil exchange complex and so preventing clays from deflocculating), but this requires a minimum of hydraulic conductivity,
• modification of the irrigation water (for maintaining an electrolyte level of irrigation above the flocculation values of the soils) avoiding clay dispersion and preserving soil permeability,
• breaking up the surface crust induced by surface and sprinkler irrigation,

Assessing the Economic Impact of Soil Deterioration
BRGM RP 53091 45
• using soil reclaiming plants, which create porosity or incorporate organic matter and promote microbial and faunal activity,
• development of technical specifications in drainage projects.
3.4.3 Soil salinisation impact Soil salinisation negatively affects mainly agricultural yields (crop productivity) and irrigation infrastructure and pumping equipment. Salinisation may also have important off-site effects:
Increased salinity in aquifers and downstream rivers: desalinisation for downstream water uses and groundwater treatment;
Impact on landscape values and soil biodiversity: increasing soil salinisation may reduce soil biodiversity
Salinisation is generally reversible; however, above certain thresholds, restoration is very expensive, if not impossible. Most of the severely affected areas are abandoned without any attempt of rehabilitation.
3.4.4 Economic damages and costs The cost evaluation is fragmental and focuses only on loss of crop productivity, and on reclamation costs, by amendments or modifications of the irrigation system. These costs refer to the on-site private costs (PC) category in the cost classification ellaborated in the literature review (section 4.6.1).
Concerning the costs of restoration and repair (RC), no information could be provided on the costs for monitoring the area. Salinisation soil maps are not available at the regional level, except for small areas.
3.4.4.1 On-site costs Salinisation affects directly crop productivity, stating that crop yield decreases with increasing salinity. The crop yield decrease was estimated for the nine leading crops in the study area (Table 17). These crops are also the most suitable for the region under the present climatic, technical, and economical conditions.
Table 17. Estimation of crop yield decrease in relation to increasing salinity
Salinity ECe ECe ECe Maxi ECe Wheat 1.4 9,5 13 20 Barley 10 13 18 28 Maize 2.5 3.8 5.9 10 Lucerne 3.4 5.4 8.8 15.5 Apple 2.3 3.3 4.8 8 Pear 2.3 3.3 4.8 8 Peach 2.2 2.9 4.1 6.5 Apricot 2.0 2.6 3.7 6 Potato 2.5 3.8 5.9 10
Crop yield decrease 10% 25% 50%
ECe: Salinity of the saturated extract of soil, or Electrical Conductivity, in mmho/cm.
On the basis of the results obtained in this area, the loss of crop production is up to 10% in cases of slight salinisation, between 10 and 50% for moderate salinisation, and 50 – 90% for severe salinisation.
The crops have been classified as: sensibles crops (apple, peach, apricot and pear); mid-sensible crops (maize, lucerne and potato) and less-sensible crops (wheat and barley).
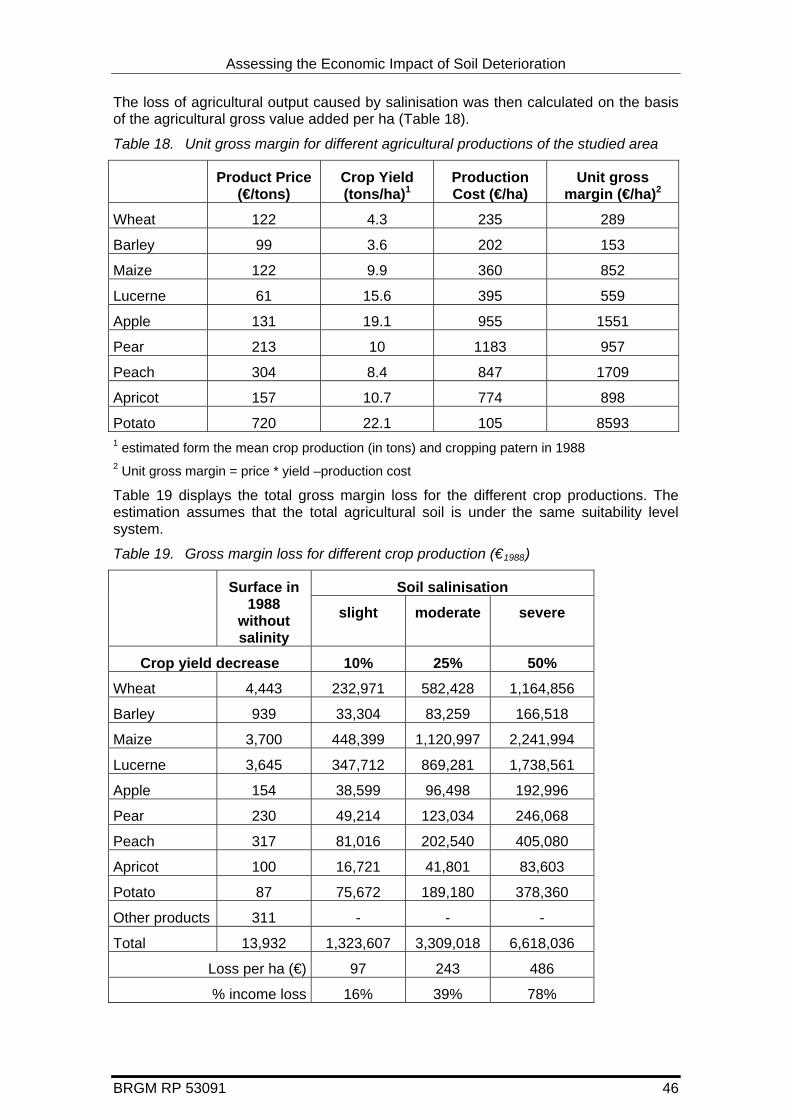
Assessing the Economic Impact of Soil Deterioration
BRGM RP 53091 46
The loss of agricultural output caused by salinisation was then calculated on the basis of the agricultural gross value added per ha (Table 18).
Table 18. Unit gross margin for different agricultural productions of the studied area
Product Price (€/tons)
Crop Yield (tons/ha)1
Production Cost (€/ha)
Unit gross margin (€/ha)2
Wheat 122 4.3 235 289
Barley 99 3.6 202 153
Maize 122 9.9 360 852
Lucerne 61 15.6 395 559
Apple 131 19.1 955 1551
Pear 213 10 1183 957
Peach 304 8.4 847 1709
Apricot 157 10.7 774 898
Potato 720 22.1 105 8593 1 estimated form the mean crop production (in tons) and cropping patern in 1988 2 Unit gross margin = price * yield –production cost
Table 19 displays the total gross margin loss for the different crop productions. The estimation assumes that the total agricultural soil is under the same suitability level system.
Table 19. Gross margin loss for different crop production (€1988)
Soil salinisation Surface in 1988
without salinity
slight moderate severe
Crop yield decrease 10% 25% 50%
Wheat 4,443 232,971 582,428 1,164,856
Barley 939 33,304 83,259 166,518
Maize 3,700 448,399 1,120,997 2,241,994
Lucerne 3,645 347,712 869,281 1,738,561
Apple 154 38,599 96,498 192,996
Pear 230 49,214 123,034 246,068
Peach 317 81,016 202,540 405,080
Apricot 100 16,721 41,801 83,603
Potato 87 75,672 189,180 378,360
Other products 311 - - -
Total 13,932 1,323,607 3,309,018 6,618,036
Loss per ha (€) 97 243 486
% income loss 16% 39% 78%
Assessing the Economic Impact of Soil Deterioration
BRGM RP 53091 47
We derive from this calculation that, on average, 16% of farmers' income is lost in the case of slight salinisation (97 €1988/ha), 39% for moderate salinisation (243 €1988/ha) and about 78% for severe salinisation (243 €1988/ ha).
3.4.4.2 Off-site costs In addition to the on-site costs related to agricultural income, the off-site effects caused by soil salinisation have not been assessed in this case study. This includes costs of remediation / clean up, etc.:
Amendments of sodic soils by adding calcium ions that displace sodium from the soil exchange complex and so prevent clays from deflocculating.
Modifications to the irrigation water system: no economic estimation has been made for this type of cost.
Use of soil reclaimation plants that resist salinity, sodicity (plants used for grazing): This type of cost was not estimated with economic values.
Non-user value costs (NC) have not been estimated.
3.4.4.3 Who bears the costs?
The main actors involved are the farmers, the water users and re-users within and outside the area (irrigation water from the surroundings) and the Water Basin Authority, in this case, the Confederación Hidrográfica del Ebro.
Farmers and water users are essentially those who bear the costs associated with salinisation at the time:
farmers for the costs suffered related to crop yield and, in part, those related to the modification of the irrigation systems,
water users for water re-use, modification of irrigation and monitoring.
3.4.5 Conclusion
This case study on salinisation is related to extensive irrigation in the Ebro basin. The assessment of the cost of salinisation mainly considers the loss on farmers’ income. Based on results of the case study, the loss in farmers' income is estimated at up to:
16% in case of slight salinisation (97 €1988 / ha),
39% in case of moderate salinisation (243 €1988 / ha),
78% in the case of severe salinisation (243 €1988 / ha).
The data avaibility did not enable the different soil types and their vulnerability to salinisation to be taken explicitly into account.
No real evaluation was made of the ecological side effects or long-term revenue losses. As for the erosion case, impacts of salinisation have to be evaluated over the short, medium and long term, for several reasons:
the variation in yield from year to year due to climatic variations,
the accumulated effects of salinity and sodicity on the soil structure,
the effects of remediation / reclamation measures (e.g. new irrigation systems) that need several years to be proved.
Therefore, the costs of soil deterioration for this salinisation case should be considered as partial.

Assessing the Economic Impact of Soil Deterioration
The absence of detailed data on the extent of salinisation in Europe (see chapter 4), and in particular of salinisation related to irrigation, will generate certain difficulties for the extrapolation of costs at the European level.
BRGM RP 53091 48

Assessing the Economic Impact of Soil Deterioration
BRGM RP 53091 49
3.5 ORGANIC MATTER (OM) LOSS / SWEDEN
At the European scale, three types of configurations for OM losses issues are encountered: i) peat exploitation in Northern Europe (Scandinavia - more than 50% of peat soils are located in Finland and Sweden, Ireland), ii) intensive agriculture and progressive depletion of organic matter content under middle latitude (e.g. France, Netherlands, Germany), iii) historic and intensive OM losses due to climat, desertification in the South Europe. The peat extraction can be considered as a voluntary and irreversible soil degradation.
The case studies of Sweden are related to peat cutting and OM extraction, and not really to OM loss as required in this study. Although peat soils only cover a minor part of the total global land area (about 2.3%), they are estimated to represent as much as 23% of the total organic carbon stock in soils. This case could be considered as a hotspot of SOM change.
In Sweden, in some areas, mires have been exploited by peat extraction. This is major economic resource. The organic material is removed and the oldest layers (several thousand years old) thus form the new soil surface. The main consequences of this extraction are a decrease in the water levels, influences on hydrology and water quality, additional organic matter decomposition, modification of the biodiversity, but also a loss of the carbon sink capacity.
The subsequent use of the peat-extraction areas can be, for example, forest or wetland. After restoration by rewetting, new conditions often develop, in particular by the leaching of stored chemicals, which affect water quality. Wetlands are then considered as retention areas for chemical substances.
3.5.1 Local conditions
The two areas studied hereafter, the Porla and the Västkärr areas, are two peatlands relatively adjacent (10 km apart) in the southwestern part of Sweden where peat has been harvested almost down to the mineral soil bottom and converted into wetlands.
A winter period from December to March with snow accumulation, and eventually some snowmelt, influences the climate and hydrology of the region. The main snowmelt occurs in March-April. Snowmelt shapes the hydrological pattern producing high water levels and flows in the spring, which decrease towards the summer when fairly dry conditions may occur. In early autumn, low water is common, although later in the autumn, rainfall produces an excess of water, which freezes again in December. Average annual precipitation is c. 800 mm, runoff c. 300 mm and the annual average temperature is +6 oC.
In the Porla area, there is no population.
The Västkärr area is now rewetted as a bird sanctuary. The landowner lives close by.

Assessing the Economic Impact of Soil Deterioration
Figure 6. Location of the two areas studied for the Swedish OM loss case
3.5.2 Soils
The Porla site, c. 20 ha, was a bog where peat extraction has been going on for some 100 years. The remaining peat layer varies in thickness from 0 to 2 m (average 0.5 m). This old peat (c. 7000 years) is mainly fen peat (carex, scheuzeria mainly, with Sphagum peat in the remaining thick layer). It lies on top of a coarse till soil (moraine). The site is now rewetted and 0.5 to 1.5 m of water covers the peat and mineral soils.
The Västkärr (West fen) zone is an old lagged area close to a large bog, which has since become a nature reserve. At the beginning, the bog was drained and used for agriculture. Later, the area was used for peat extraction for 20 years. Presently, only 0.2 m of fen peat is left on top of marine clay, which renders the bottom firm and flat.
3.5.3 Origin and extent of the threat
Soil degradation is often linked to the use of land for agricultural purposes. However, forest exploitation activities can also have some influence on organic matter (OM) loss and soil fertility:
• In the most northern part with a sometimes-harsh climate, forestry has influenced soils with poor OM cover. Regeneration on these sites most often fails.
• In the southwest of Sweden, the burning of thick organic layers during centuries has degraded the soil, which has been mainly covered by Calluna, and thus reforestation is hampered.
• In some cases, drainage of wet soils has caused decomposition of the organic cover and only small amounts remain on top of the mineral soil.
BRGM RP 53091 50

Assessing the Economic Impact of Soil Deterioration
BRGM RP 53091 51
Another land use is peat cutting, peat excavation and OM exploitation. When peat cutting activities cease, restoration of the site is often required, in particular for determining a suitable after-use. One such use is the formation of new wetlands, a topic that is currently being studied comprehensively in order to understand the environmental consequences of rewetting.
Peat cutting is performed from the south of Sweden to almost the far north. Apart from the high mountains in the northwest, peat-cutting activities are spread over all Sweden.
Originally, the Porla mire was a bog with a peat thickness of over four meters. In the early phase, the targeted product of the peat cutting was Sphagnum peat. Later on, especially after 1980, fen peat was excavated down to the very uneven and sloping till mineral soil bottom. When peat exploitation ceased, the residual thickness of peat varied from a few decimetres of fen peat up to two meters where Sphagnum peat still existed. In several places, stones and boulders could be seen on the peat surface. In 1999, the cutover area was prepared for rewetting by precipitation and water inflow from the catchment uplands, including a poor sedge fen area. Both surface water inflow and groundwater seepage entered into the wetland with a size of ca. 15 ha. The site location in a slightly sloping terrain with low-lying land down slope of the rewetting area constituted a risk for groundwater leaching.
The other area, the Västkärr site, encloses a ca.80 ha peat cutover area forming originally a lagged area to the large Skagerhult bog. The area was used for peat excavation in the new peat-cutting era starting around 1980. In 1997, peat cutting ceased leaving ca. 0.2 m of fen peat on top of marine clay with fairly rich nutrients.
3.5.4 Description of damages
The peatland cutting areas are restored as wetlands for 1 to 10 years, and then turned into overgrown mires. The impacts mainly concern:
biodiversity (changed wetland biodiversity),
groundwater quality,
land values, which in places is higher after peat cutting.
3.5.4.1 Main actors
For this hotspot OM change case study, the main actors are peat companies, landowners, and local authorities.
3.5.5 Cost estimation Information on costs was received from the peat and energy companies, but without the details included.
Due to the specificity of the situation (peat mining is considered as an organic matter loss), there is no cost estimation for prevention or monitoring. Even for the Environment Protection authorities, this is not considered as soil deterioration.
The only costs available for this case study are those related to the restoration of the peat cutting areas to convert them into wetlands and forests. These costs have to be considered as compensatory measure costs, restoration of OM content in the soil not being possible at the human scale.
3.5.5.1 Costs for compensatory measures
Expenditure of the peat companies to convert the two sites into wetlands has been evaluated at up to:
Assessing the Economic Impact of Soil Deterioration
• ca. 25.000 € for Porla
• ca. 35.000 € for Västkärr
As these are on-site costs borne by the private owners of the land affecting the land use values, they have been assimilated to RC costs.
3.5.5.2 Who bears the costs? (affected sectors)
The peat companies bear most of the costs pays, mainly due to the particular situation presented in this case study, considered as a hotspot OM change.
3.5.6 Conclusion
This case study related to peat cutting activity should not be considered as soil deterioration as such: this mining activity deliberately uses the peat as a source of energy. It is definitively not a loss of organic matter as presented in the European Soil Protection Strategy. This will influence the way of using this case in the extrapolation part.
In other respects, the different types of cost should be detailed in order to assess entirely the situation with, in particular:
total economic value of the bog that is lost as a consequence of peat extraction,
restoration costs,
compensatory measures,
rewetting benefits (such as increased biodiversity),
increase of real estate value of the soil,
environmental damage costs (related to water quality, reduction of certain biodiversity).
This information is not available at the present time.
BRGM RP 53091 52
Assessing the Economic Impact of Soil Deterioration
BRGM RP 53091 53

Assessing the Economic Impact of Soil Deterioration
4 INFORMATION FOR EXTRAPOLATION LEVEL
4.1 EROSION
Two kinds of data are available for extraplation, derived from actual measurements or from risk-based modelling where several approaches have been developed. Data from risk-based modelling are highly uncertain at the European level and therefore most of the approaches can only provide a quantitative assessment of the soil erosion risk. Furthermore no real evaluation of the quality of the result can easily be carried out at this scale. Extrapolation based on measured data is therefore more appropriate, even though it still contains significant limitations. For all the presented approaches, care has been taken to highlight the main limitations.
4.1.1 Information based on estimation / predictive modelling
More detailed information about the modelling approaches presented here can be found in Gobin et al., 2003.
4.1.1.1 Qualitative risk-based modelling of soil erosion
The De Ploey map (De Ploey, 1989): this is a soil erosion risk map of Western Europe, produced by various experts who delineated areas where, according to their judgement, erosion processes are important. Therefore it represents areas of potential risk. A limitation of this approach is that the author does not give a clear-cut definition of the criteria according to which areas were delineated (Yassoglou et al., 1998).
The ‘hot-spot’ map (EEA, 2000): the hot spot map aims to present a kind of ‘spatial indicator’ that would enable the identification of priorities of intervention and the visualisation of data gaps. The map produced has been developed from earlier maps (e.g. De Ploey, 1989), based on local empirical data. In the hot-spot approach, broad zones are first identified for which the erosion processes are broadly similar (actual erosion risk). Hot spots are then highlighted within each zone and associated with the best estimates, from the literature, for rates of erosion in these hot-spot areas. Although there are advantages in concentrating on measured empirical data where these are abundant, and interpolation can be meaningful, the sporadic distribution and episodic occurrence of soil erosion makes it very ill suited to this approach. It is also clear that sites of high erosion identified on this map are definitely areas of high impact, but that there is no reliable way to extrapolate these local results, even to their surrounding area.
The GLASOD map: The aim was to provide a world map of soil degradation. It is based on responses to a questionnaire sent to recognised experts in all countries (Oldeman et al., 1991). It thus shares with the hot-spot approach dependence on a set of expert judgements, but can provide very little control or objectivity in comparing the standards applied by different experts for different areas. The Glasod map identifies areas with a subjectively similar severity of erosion, irrespective of the conditions, which produced this erosion. The Glasod map is still widely used and quoted, although its authors and critics alike recognise the need for a more detailed and more quantitative assessment. Given that there are now improved methodologies, based on more quantitative analysis, it is unquestionably timely to abandon this approach, whilst not rejecting the data from local erosion sites to calibrate more quantitative models. A similar project SOVEUR (Mapping of Soil and Terrain Vulnerability in Central and Eastern Europe) uses a slightly modified GLASOD methodology with special focus on diffuse pollution.
The USLE map (Van der Knijff (1999, 2000)): Van der Knijff et al. (1999, 2000) used the universal soil loss equation (USLE, Wischmeier and Smith, 1978) to estimate the
BRGM RP 53091 54
Assessing the Economic Impact of Soil Deterioration
BRGM RP 53091 55
risk of rill and interrill erosion in Europe. The (USLE) is one of the least data demanding erosion models that has been developed. It is a simple empirical model, based on regression analyses of soil loss rates on erosion plots in the USA. The model is designed to estimate long-term annual erosion rates on agricultural fields. In this assessment, soil erosion risk seems to be underestimated for most of Northern Europe and overestimated for mountainous areas and for already eroded areas.
The CORINE map (Corine, 1992): the Corine soil erosion methodology produced soil erosion risk maps for southern Europe, excluding northern Europe. The methodology used was based on a simplification of the universal soil loss equation. The Corine map appears to show too great a dependence on the climatic factors in determining erosion risk, with relatively little weight given to important factors of erodibility and land cover. Both Van der Knijff (1999, 2000) and Corine used the USLE on account of its simple structure, although it lacks a sound physical basis and compatibility with higher resolution models and therefore cannot be recommended as the best basis for estimation of erosion risk.
The INRA map: The aim of this work is to develop pedotransfer rules based on the best available expert knowledge on erosion processes and using soil parameters available in the European Soil Geographical Database for the assessment of erosion parameters (soil erodibility and soil crusting). The resulting map is not suitable for extrapolation of quantitative figures for soil erosion but for relative comparison of different European regions
4.1.1.2 Quantitative risk-based modelling of soil erosion
The PESERA map (Process modelling to assess regional soil erosion): The pan-European soil erosion risk assessment project (Pesera), has developed a physically based and spatially distributed model to quantify soil erosion in a nested strategy of focusing on environmentally sensitive areas relevant on a European scale. The model produces a quantitative forecast of soil erosion and plant growth, and therefore has the potential to respond explicitly and rationally to changes in climate or land use, offering great promise for scenario analysis and impact assessment. Set against this advantage, the model can only incorporate the impact of past erosion where this is measured and thus requires numerous and good data sets needed for testing. The model simplifies the set of processes operating and may therefore not be appropriate under particular local circumstances. The Pesera model is currently being calibrated and validated at different resolutions and across different agro-ecological zones.
The PESERA model is described as the most conceptually appropriate (and the most physically based approach). However, To give reliable quantitative estimation at the European level, it needs a lot of data. These necessary input data are not currently available at the European scale. Therefore, at the moment, it is best to use the model to give relative trends, or discriminate at-risk-areas (see the PESERA final poster map, European Communities, 2004).
4.1.2 Information based on real data
4.1.2.1 The plot database
This database gives information on erosion processes ranging from sheet (or interrill) erosion to rill erosion (Glossary of Soil Science Terms http://www.soils.org/sssagloss ). The former consists of the removal of a fairly uniform layer of soil by raindrop splash and sheet flow. The latter results in the formation of numerous and randomly occurring small channels of only several cm depth under the action of small, intermittent water courses usually also only several cm deep. To measure the rates and extent of sheet and rill erosion, both indirect and direct methods have been used. Indirect methods

Assessing the Economic Impact of Soil Deterioration
generally measure soil profile truncation or sediment accumulation relative to a reference soil horizon, to an exposed or buried reference object (exposed or buried roots, foundations…), or to the loss or accumulation of tracers. These methods are more appropriate for studying historical erosion. To assess current sheet and rill erosion rates, direct methods, mainly plot or catchment monitoring and field-based measurements (e.g. mapping of erosion features) are reported. Field-based methods are most effective to answer questions such as, where does linear erosion occur and, is it a problem? However, they cannot properly monitor sheet erosion and, more important for this study, their applications have been restricted to very few places in Europe. The best available data to compare soil erosion rates in Europe induced by sheet and rill processes come from plot measurements. These represent relatively well-standardized data, which can give reliable information on slope sensitivity to sheet and rill erosion under a given set of conditions, and they are widespread. Based on a large dataset of soil erosion measurements under natural rainfall at the plot scale, the objective of this tool are: i) to quantify the different sheet and rill erosion rates in various agro-environmental settings throughout Western and Central Europe, ii) to identify the more at-risk situations in terms of land use or physiographic conditions and iii) to assess overall sheet and rill erosion rates for Europe.
Methodology
An extensive database of short to medium-term (1-10 years) soil loss measurements at the plot scale was compiled from the literature. This database contains 208 entries (1 entry corresponds to the combination of one land use, slope ... for one experimental site) distributed among 57 experimental sites in 13 countries, standing for a total of 2162 plot-years. Only data from experiments with a direct measurement of soil erosion rates, i.e. with an experimental device to measure erosion during natural rainfall events, were collected (e.g. collecting tanks or tipping buckets with or without automatic samplers). On average, the experiments cover ~10 equivalent (eq.) plot-years with a median of 6 plot-years per entry; the maximum being for cereal plots in Portugal (96 eq. Plot-years, Lopes et al., 2002) and in Germany, where bare plots have been monitored for 60 eq. plot-years (Martin, 1988; Auerswald, 1993). As shown in Table 22 the database is composed of sheet and rill erosion rate measurements from Austria, Belgium, Denmark, France, Germany, Greece, Italy, Lithuania, The Netherlands, Portugal, Spain, Switzerland and United Kingdom. The corresponding annual rainfall in the database range from <200 mm (Spain) to >1300 mm (Germany), with a median annual value of 595 mm. No restriction regarding slope length was made when selecting the experimental sites as long as the land use was uniform. However, the median size of the plots is close to the Wischmeier plots with a median slope length of 20 m, a median area of ca. 60 m² and a median slope of 13.2 % (94% and 75% of the entries have a slope length >5 and 9m respectively, which are two recognised thresholds for rill initiation and development).
To compile the database, data with a similar location, land use, slope, slope length, area and soil texture (5 classes) were aggregated (weighted for plot years of measurements). As a consequence, data were combined even if other parameters, which influence the erosion response, were different. For example, data showing differences in soil types or soil surface properties which are not reflected in the textural classification used; difference in tillage systems or direction (parallel or perpendicular to the contour) or differences in slope aspects. Experimental data where a strong evolution with time (e.g. Francia et al., 2002) was reported were not included in the database, as it was difficult to calculate a relevant mean value.
BRGM RP 53091 56

Assessing the Economic Impact of Soil Deterioration
BRGM RP 53091 57
Table 20. Description of the soil erosion plot database
Country Number
of entries*
Total eq. plot-
year
Mean eq. plot-
year References
Austria 8 43 5 Klik et al., 2001; Klik, 2003
Belgium 3 31 10 Bollinne, 1982
Denmark 6 16 3 Veihe and Hasholt
France 11 59 5 Viguier, 1993; Messer, 1980; Martin et al., 1997; Lecomte et al., in press; Cerdan et al., 2002; Clauzon and Vaudour, 1971
Germany 41 400 10 Martin, 1988; Auerswald, 1993; Goeck, 1989; Goeck and
Geisler, 1989; Dikau, 1986; Voss, 1978; Emde, 1992; Jung and Brechtel, 1980
Greece 8 48 6 Kosmas et al., 1996; Romero-Diaz et al., 1999; Diamantopoulos et al., 1996
Italy 33 433 13 Tropeano, 1983; Zanchi, 1983; 1988; Rivoira et al., 1989;
Porqueddu and Roggero, 1994; Careda et al.,1997; Vaccaet al., 2000; Basso, 2002
Lithuania 11 134 12 Jankauskas and Jankauskiene, 2003
The Netherlands 3 35 12 Kwaad, 1991; 1994; Kwaad et al., 1998
Portugal 16 482 30 Roxo, et al. 1996; Figueiredoet al., 1998; Lopes et al., 2002
Spain 48 367 8
Andreu et al., 1994 cited by Cerdà 2001; Bautista et al., 1996; Bautista, 1999 cited by Cerdà, 2001; Andreu et al., 1998a & b;
Andreu et al., 2001; Sirvent et al., 1997; La Roca, 1984 cited by Cerdà 2001; Castillo et al., 1997; Puigdefabregas et al., 1996;
Padron et al., 1998; Romero-Diaz et al., 1999; Lopez-Bermudez et al., 1991; 1998; Canton et al., 2001; Nicolau et al., 2002
Switzerland 2 9 5 Schmidt, 1979
United Kingdom 18 104 6 Fullen and Reed, 1986; Fullen, 1991; 1992; Quinton, 1994
*1 entry corresponds to the combination of one land use, slope... for one experimental site Discussion
The mean sheet and rill erosion rates are presented in Table 23 and 24. The erosion responses between the different land use classes differ significantly (Kruskal-Wallis test statistics = 79.1 with probability <0.0001). If we rank (in descending order) the land use classes with at least 25 eq. plot-years of measurement according to the observed sheet and rill erosion rates, we obtain: bare soil, vineyard, maize, spring crops, cereal, post fire, forage, shrubs, grassland and forest. Bare soil is the most represented class with 563 eq. plot-years and, with the vineyard class, have the highest mean rates (23.4 and 20 ton/ha/year respectively). Maize and spring crops also show very high rates, i.e. more than 10 ton/ha/year. Interestingly, spring crops have the highest mean yearly rainfall amount (749 mm) and a relatively low mean yearly runoff (~16 mm), which also imply high sediment concentration.

Assessing the Economic Impact of Soil Deterioration
Table 21. Description of the soil erosion database aggregated according to land use.
Land use Numbe
r of entries*
Equivalent plot-year
Mean area (m²)
Mean slope (%)
Mean rainfall
(mm/year)
Mean slope
length (m)
Mean runoff
(mm/year)
Mean erosion (ton
/ha/year)
Bare soil 54 563 60.0 15.9 674 14.4 91.7 23.40
Vineyard 10 113 100.3 19.3 629 52.3 80.8 19.97
Maize 6 27 38.1 9.9 676 12.9 63.7 13.95
Spring crop** 13 62 375.8 11.0 749 43.4 16.1 10.64
Maize + cover 3 21 21.2 8.7 560 10.9 19.9 2.65
Cereal 36 335 1641.2 12.7 629 37.7 19.3 2.10
Post fire 8 112 1859.0 28.7 466 11.3 40.2 1.54
Forage 9 192 500.2 17.3 661 34.7 27.6 1.35
Vineyard + grass 5 12 102.5 24.0 598 62.7 17.1 0.78
Arable crops 6 139 16.0 10.8 862 8.0 42.2 0.53
Shrubs 34 283 65.3 22.1 411 16.2 9.5 0.50
Grassland 16 231 179.5 15.9 623 31.5 15.2 0.29
Barley + cover 1 3 66.3 10.0 665 22.1 - 0.28
Forest 6 51 48.7 19.9 483 11.8 6.0 0.10
Orchard 1 18 30.0 19.0 467 10.0 0.7 0.05
Total/Mean 208 2162 466 16.4 609 25.7 41.0 8.76
*1 entry is the combination of one land use, slope... for one experimental site
**Except maize, maize + cover and barley + cover classesCereal, post fire and forage have moderate rates ~1.5 ton/ha/year. Despite relatively steep slopes, the classes shrubs, grassland and forest have the lowest rates, i.e. <1 ton/ha/year and have relatively high mean yearly runoff volumes, which, inversely to spring crops, imply very low sediment concentration. In fact, land uses with the highest percentage of bare soil, either spatially (wide interrow length and low leaf cover, e.g. vineyard or maize) or temporally (long intercrop duration, e.g. maize or spring crop) have the highest rates. The assemblage of these plot data in a database allows comparison of the impact of very different land uses in a common framework and thus confirm ideas that were commonly assumed about the sensitivity of certain crops (e.g. maize, spring crops…) to sheet and rill erosion. However, as always with results directly deduced from an experimental dataset, the limits concerning the representativity of this database should be questioned. Two types of limits can be highlighted.
4.1.2.2 Limitations Limits related to spatial representativity Even if the database is rather comprehensive, good quality long-term plot data are not available for every agro-ecological zone in Europe. For example values up to 200 ton/ha per rainfall event were observed in Southwest France for high intensity storms on agricultural areas with low vegetation density (Le Bissonnais et al., 2003), but no long-term plot studies have ever been conducted in Southwest France (Some possibly high-risk crops as hop or vegetable are also missing from the plot database). Some plot studies are set up systematically according to predefined large monitoring schemes (e.g. Wischmeier plots with different soil types, tillage systems or crop rotations) independent from the erosion risk. Hence these studies are rather objective.
BRGM RP 53091 58
Assessing the Economic Impact of Soil Deterioration
BRGM RP 53091 59
On the other hand, other plot studies might focus on a high-risk area. In this latter case, extrapolation of results without a careful attention on the specificity of the site can lead to an overestimation of the problem.
Limits related to the representativity of the of sheet and rill erosion processes Erosion is a scale dependent process; hence depending on the size of the monitoring schemes, results differ. One reason being the influence of slope length, relief patterns or the spatial variability in soil surface conditions on the balance between sediment transport and deposition. Plot studies, being limited in space, will therefore not reflect

Assessing the Economic Impact of Soil Deterioration
BRGM RP 53091 60
Table 22. Description of the soil erosion database aggregated according to land use and per countries.
land use Austria Belgium Denmark France Germany Greece Italy lithuania Netherlands Portugal Spain Switzerland United Kingdom
Arable land 516 284 116 30 1818 72 2112 648 315 2737 316 384
Bare 92 36 48 2670 481 102 1740 683 108 792
Forest 60 528 24
Grassland 36 48 816 960 644 192 72
Orchard 216
Postfire 84 636 621
Shrubs 90 72 592 68 2569
Vineyard 432 96 216 7 600
Num
ber o
f plo
t/mon
th
Vineyard + Grass
60 64 21
Arable land 8.93 8.50 0.64 2.03 1.32 0.58 1.33 19.38 6.76 0.59 0.30 2.09
Bare 30.90 0.42 22.22 16.27 34.55 16.67 5.67 45.29 19.33 19.21
Forest 0.00 0.20 0.00
Grassland 0.03 0.01 0.28 0.01 0.04 0.84 0.01
Orchard 0.05
Postfire 5.41 0.04 0.46
Shrubs 0.13 1.17 0.06 0.40 0.52
Vineyard 11.09 33.23 0.41 54.86 0.36
Mea
n Er
osio
n
Vineyard + Grass
0.66 0.00 2.57

Assessing the Economic Impact of Soil Deterioration
BRGM RP 53091 61
everything about what is happening in the landscape in terms of sheet and rill erosion. The results should be understood as a comparison of the sensitivity of given slopes to sheet and rill erosion in a given set of conditions. But whether the observed soil losses will leave the field or catchment where they originate or will be deposited, need to be addressed through further investigations.
4.1.2.3 Geographical distribution of soil losses Numerous observations cover the Mediterranean zone, 1382 eq. plot-years data for 113 entries against 780 plot-years for 95 entries for the rest of Europe (Table 25). Overall, the sheet and rill erosion rates for the Mediterranean zone (MZ) are comparable for those of the rest of Europe.
Table 23. Description of the soil erosion database aggregated according to location and land use.
Zone Land use Number
of entries
Equivalent plot-year
Mean area
(m²)
Mean slope
length (m)
Mean slope
(%)
Mean
rainfall (mm/year)
Mean runoff (mm/year)
Mean erosion
(ton /ha/year)
Bare soil 23 246 113.9 21.0 18.0 559 90.6 31.62
Vineyard 6 101 99.4 32.2 16.4 640 116.4 16.64
Vineyard + grass 2 6 100.0 41.8 23.5 582 33.3 1.92
Post fire 8 112 1859.0 11.3 28.7 466 40.2 1.54
Forage 9 192 500.2 34.7 17.3 661 27.6 1.35
Cereal 18 244 222.6 22.8 13.8 520 24.7 0.66
Shrubs 31 275 70.1 17.0 22.1 375 9.4 0.54
Grassland 11 142 180.8 22.9 15.6 564 16.9 0.42
Forest 4 46 65.0 13.8 19.9 334 8.6 0.15
Orchard 1 18 30.0 10.0 19.0 467 0.7 0.05
Med
iterr
anea
n
Total/Mean 113 1382 281.2 21.7 18.7 500 39.8 7.87
Vineyard 4 12 105.0 82.5 23.8 612 21.4 24.96
Bare soil 31 317 21.7 10.1 14.4 760 93.2 17.30
Maize 6 27 38.1 12.9 9.9 676 63.7 13.95
Spring crop** 13 62 375.8 43.4 11.0 749 16.1 10.64
Cereal 18 91 3059.9 52.6 11.6 739 11.6 3.53
Maize + cover 3 21 21.2 10.9 8.7 560 19.9 2.65
Arable crops 6 139 16.0 8.0 10.8 862 42.2 0.53
Barley + cover 1 3 66.3 22.1 10.0 665 - 0.28
Shrubs 3 8 16.0 8.0 - 780 10.8 0.13
Vineyard + grass 3 6 105.0 76.7 24.3 608 1.0 0.02
Grassland 5 89 176.7 50.4 16.3 751 0.7 0.01
Forest 2 5 16.0 8.0 - 780 0.7 0.003
Oth
er
Total/Mean 95 780 691.8 30.1 13.4 738 43.0 9.83
Grand Total 208 2162 466 25.7 16.4 609 41.0 8.76
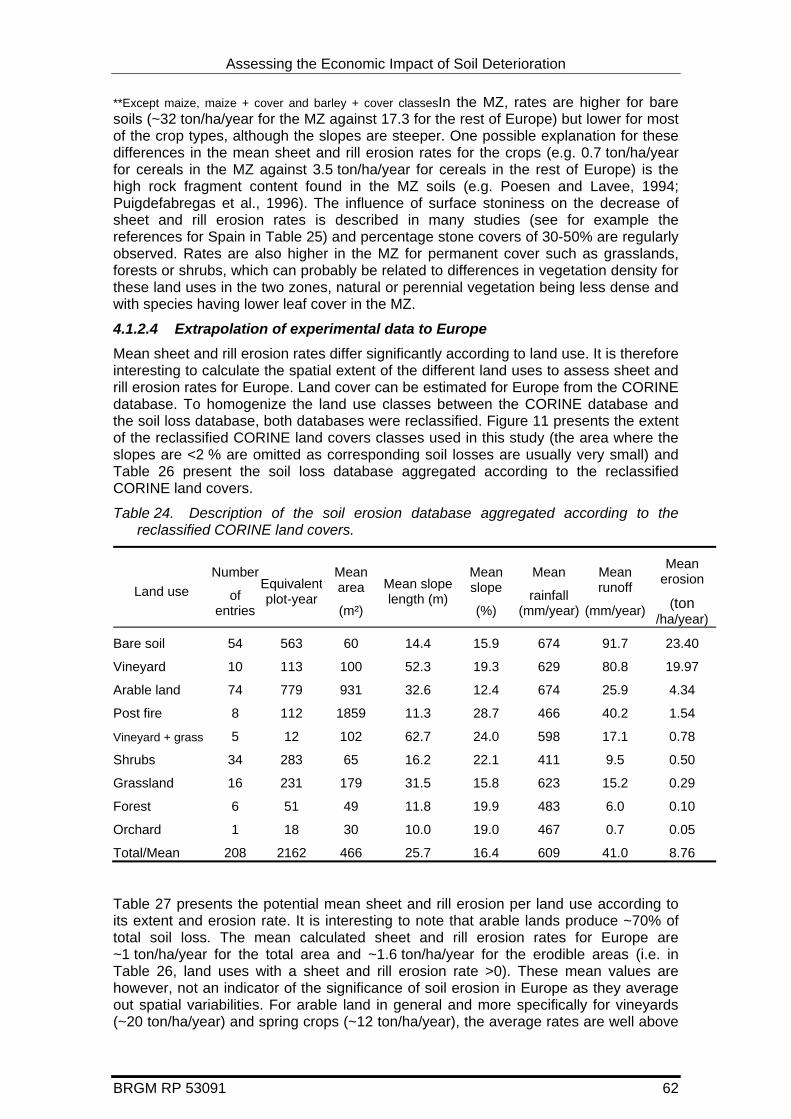
Assessing the Economic Impact of Soil Deterioration
**Except maize, maize + cover and barley + cover classesIn the MZ, rates are higher for bare soils (~32 ton/ha/year for the MZ against 17.3 for the rest of Europe) but lower for most of the crop types, although the slopes are steeper. One possible explanation for these differences in the mean sheet and rill erosion rates for the crops (e.g. 0.7 ton/ha/year for cereals in the MZ against 3.5 ton/ha/year for cereals in the rest of Europe) is the high rock fragment content found in the MZ soils (e.g. Poesen and Lavee, 1994; Puigdefabregas et al., 1996). The influence of surface stoniness on the decrease of sheet and rill erosion rates is described in many studies (see for example the references for Spain in Table 25) and percentage stone covers of 30-50% are regularly observed. Rates are also higher in the MZ for permanent cover such as grasslands, forests or shrubs, which can probably be related to differences in vegetation density for these land uses in the two zones, natural or perennial vegetation being less dense and with species having lower leaf cover in the MZ.
4.1.2.4 Extrapolation of experimental data to Europe Mean sheet and rill erosion rates differ significantly according to land use. It is therefore interesting to calculate the spatial extent of the different land uses to assess sheet and rill erosion rates for Europe. Land cover can be estimated for Europe from the CORINE database. To homogenize the land use classes between the CORINE database and the soil loss database, both databases were reclassified. Figure 11 presents the extent of the reclassified CORINE land covers classes used in this study (the area where the slopes are <2 % are omitted as corresponding soil losses are usually very small) and Table 26 present the soil loss database aggregated according to the reclassified CORINE land covers.
Table 24. Description of the soil erosion database aggregated according to the reclassified CORINE land covers.
Land use Number
of entries
Equivalentplot-year
Mean area
(m²)
Mean slope length (m)
Mean slope
(%)
Mean
rainfall (mm/year)
Mean runoff
(mm/year)
Mean erosion
(ton /ha/year)
Bare soil 54 563 60 14.4 15.9 674 91.7 23.40
Vineyard 10 113 100 52.3 19.3 629 80.8 19.97
Arable land 74 779 931 32.6 12.4 674 25.9 4.34
Post fire 8 112 1859 11.3 28.7 466 40.2 1.54
Vineyard + grass 5 12 102 62.7 24.0 598 17.1 0.78
Shrubs 34 283 65 16.2 22.1 411 9.5 0.50
Grassland 16 231 179 31.5 15.8 623 15.2 0.29
Forest 6 51 49 11.8 19.9 483 6.0 0.10
Orchard 1 18 30 10.0 19.0 467 0.7 0.05
Total/Mean 208 2162 466 25.7 16.4 609 41.0 8.76
Table 27 presents the potential mean sheet and rill erosion per land use according to its extent and erosion rate. It is interesting to note that arable lands produce ~70% of total soil loss. The mean calculated sheet and rill erosion rates for Europe are ~1 ton/ha/year for the total area and ~1.6 ton/ha/year for the erodible areas (i.e. in Table 26, land uses with a sheet and rill erosion rate >0). These mean values are however, not an indicator of the significance of soil erosion in Europe as they average out spatial variabilities. For arable land in general and more specifically for vineyards (~20 ton/ha/year) and spring crops (~12 ton/ha/year), the average rates are well above
BRGM RP 53091 62

Assessing the Economic Impact of Soil Deterioration
BRGM RP 53091 63
acceptable rates of soil erosion (i.e. rates of erosion exceeds rates of soil production). From our calculations, it appears that at least 16.7% of the total area covered by CORINE suffer from significant soil erosion problems. These figures are only indicative and should not be taken as absolute values. Furthermore, in addition of the approximation related to the extrapolation of plot data, the mean sheet and rill erosion rates should be corrected for mean slope, particularly for arable land (12.4% for the plot database against an estimated 6.7% for CORINE).
New data should be release from Romania, Bulgaria, Hungary, Czech Republic and Poland, however, from a first approximation the figures seem to be similar to those presented here.
Figure 7. Extent of the reclassified CORINE land cover classes used in this study
In this figure 10, areas with slopes below 2 % or outside the CORINE extent are represented in white.
The first extrapolation carried out here was undertaken for the countries where we have spatial information on land use (i.e. the countries covered by Corine: Austria, Belgium, Bulgaria, Czech Republic, Denmark, Estonia, France, Germany, Greece,
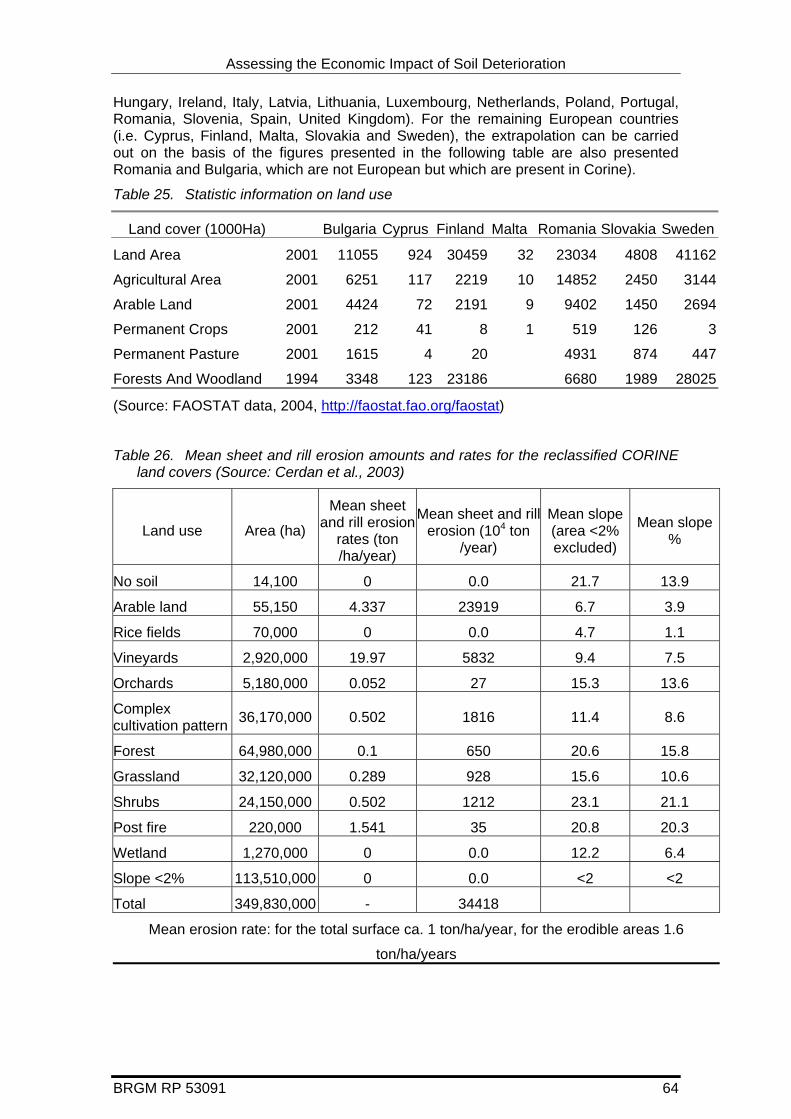
Assessing the Economic Impact of Soil Deterioration
Hungary, Ireland, Italy, Latvia, Lithuania, Luxembourg, Netherlands, Poland, Portugal, Romania, Slovenia, Spain, United Kingdom). For the remaining European countries (i.e. Cyprus, Finland, Malta, Slovakia and Sweden), the extrapolation can be carried out on the basis of the figures presented in the following table are also presented Romania and Bulgaria, which are not European but which are present in Corine).
Table 25. Statistic information on land use
Land cover (1000Ha) Bulgaria Cyprus Finland Malta Romania Slovakia Sweden
Land Area 2001 11055 924 30459 32 23034 4808 41162
Agricultural Area 2001 6251 117 2219 10 14852 2450 3144
Arable Land 2001 4424 72 2191 9 9402 1450 2694
Permanent Crops 2001 212 41 8 1 519 126 3
Permanent Pasture 2001 1615 4 20 4931 874 447
Forests And Woodland 1994 3348 123 23186 6680 1989 28025
(Source: FAOSTAT data, 2004, http://faostat.fao.org/faostat)
Table 26. Mean sheet and rill erosion amounts and rates for the reclassified CORINE land covers (Source: Cerdan et al., 2003)
Land use Area (ha)
Mean sheet and rill erosion
rates (ton /ha/year)
Mean sheet and rill erosion (104 ton
/year)
Mean slope (area <2% excluded)
Mean slope %
No soil 14,100 0 0.0 21.7 13.9
Arable land 55,150 4.337 23919 6.7 3.9
Rice fields 70,000 0 0.0 4.7 1.1
Vineyards 2,920,000 19.97 5832 9.4 7.5
Orchards 5,180,000 0.052 27 15.3 13.6
Complex cultivation pattern 36,170,000 0.502 1816 11.4 8.6
Forest 64,980,000 0.1 650 20.6 15.8
Grassland 32,120,000 0.289 928 15.6 10.6
Shrubs 24,150,000 0.502 1212 23.1 21.1
Post fire 220,000 1.541 35 20.8 20.3
Wetland 1,270,000 0 0.0 12.2 6.4
Slope <2% 113,510,000 0 0.0 <2 <2
Total 349,830,000 - 34418
Mean erosion rate: for the total surface ca. 1 ton/ha/year, for the erodible areas 1.6
ton/ha/years
BRGM RP 53091 64
Assessing the Economic Impact of Soil Deterioration
BRGM RP 53091 65
4.1.3 Conclusion
Two kinds of data are available, from actual measurements or from risk-based modelling where several approaches have been developed. Data from risk-based modelling are highly uncertain at the European level. Soil erosion is a complex phenomenon, which shows very high spatial and temporal variability and a non-linear response to climatic and anthropogenic pressures. It is therefore difficult to design a modelling approach which can describe all the erosion sub-processes occurring in the different agro-ecological zones in Europe. Hence, most of the approaches use simple modelling frameworks that only give qualitative assessment of soil erosion risk, which is not suitable for this extrapolation objective. Another major limitation is the data availability at the European scale. More detailed digital elevation data, better representation of rainfall erosivity (i.e. more detailed rainfall measurements), and satellite data that have better spectral and geometric characteristics than the data (NOAA-AVHRR) that are currently available would be needed. Ideally, multi-temporal satellite images should be used in order to account for the interaction between vegetation growth and senescence over the year, and rainfall. Finally, more detailed soil data are required (especially soil depth, stone volume and surface texture).
Extrapolation based on measured data is therefore more appropriate, even though it still contains significant limitations (very high spatial and temporal variations) that could be assess with a comprehensive monitoring system.
4.2 CONTAMINATION
4.2.1 Local point sources The main source of national data used is the EIONET (European Environmental Information and Observation Network) priority data flow (last updated in December 2003) of the European Environment Agency, or from national ministries for environment. The data background is mainly generated by the EEA on the basis of the indicator fact sheets, regularly updated and developed with the support of the European Topic Centre on Terrestrial Environment and some previous studies on comparison of data from several years. National data were obtained from data update requests for EEA countries. All data are given by the National Ministries of Environment, the National Environmental Protection Agencies or the EIONET National Reference Centres for Contaminated sites, who collect data from various national sources. National information is updated with different periodicity in the Member States: in France, the data is update every three months (the number of known contaminated sites in March 2004 was 3723 sites) in most other Member States such an update is done annually.
The largest and most heavily affected areas in Europe are concentrated around the most industrialised regions in Northern and Western Europe:
Nord-Pas de Calais and Rhône-Alpes regions in France,
Rhein-Ruhr, Saar regions in Germany,
The Po area in Italy,
The so-called black triangle region located at the corner of Poland, the Czech Republic and the Slovak Republic,
Across Belgium and Netherlands.
4.2.1.1 Estimation of number of sites The European Environment Agency has done an estimation of the number of contaminated sites. The European Countries currently conduct different types of
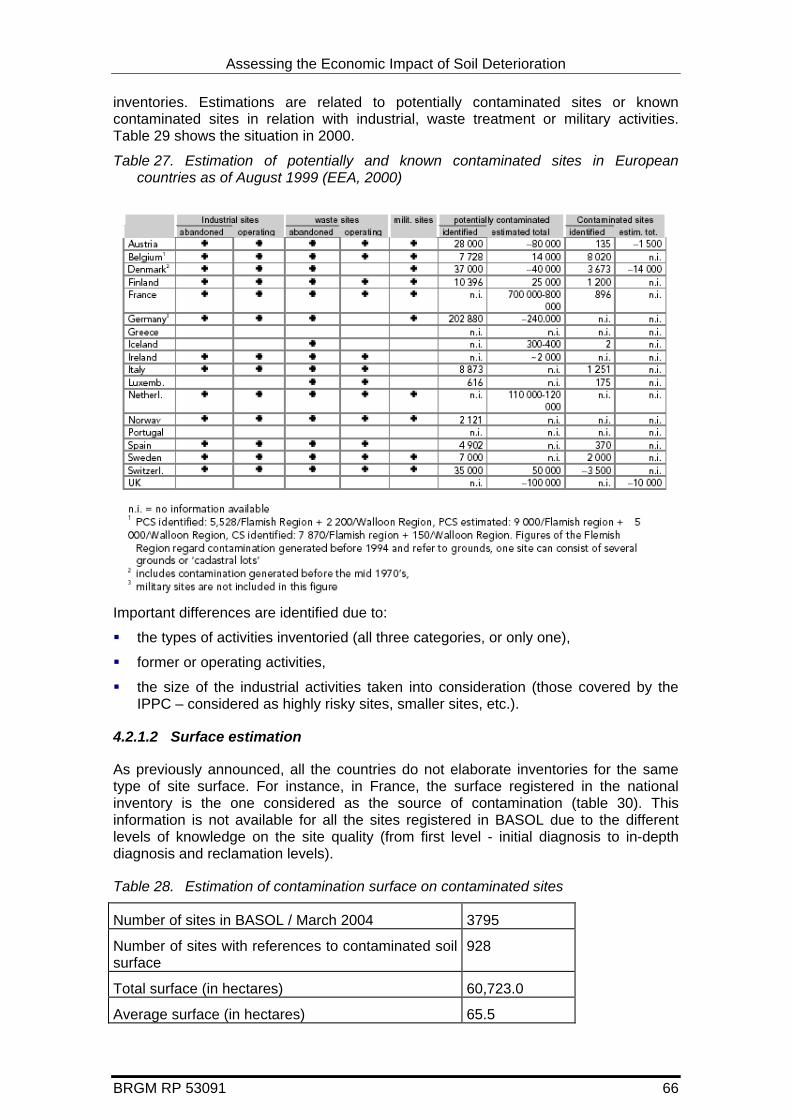
Assessing the Economic Impact of Soil Deterioration
inventories. Estimations are related to potentially contaminated sites or known contaminated sites in relation with industrial, waste treatment or military activities. Table 29 shows the situation in 2000.
Table 27. Estimation of potentially and known contaminated sites in European countries as of August 1999 (EEA, 2000)
Important differences are identified due to:
the types of activities inventoried (all three categories, or only one),
former or operating activities,
the size of the industrial activities taken into consideration (those covered by the IPPC – considered as highly risky sites, smaller sites, etc.).
4.2.1.2 Surface estimation
As previously announced, all the countries do not elaborate inventories for the same type of site surface. For instance, in France, the surface registered in the national inventory is the one considered as the source of contamination (table 30). This information is not available for all the sites registered in BASOL due to the different levels of knowledge on the site quality (from first level - initial diagnosis to in-depth diagnosis and reclamation levels).
Table 28. Estimation of contamination surface on contaminated sites
Number of sites in BASOL / March 2004 3795
Number of sites with references to contaminated soil surface
928
Total surface (in hectares) 60,723.0
Average surface (in hectares) 65.5
BRGM RP 53091 66
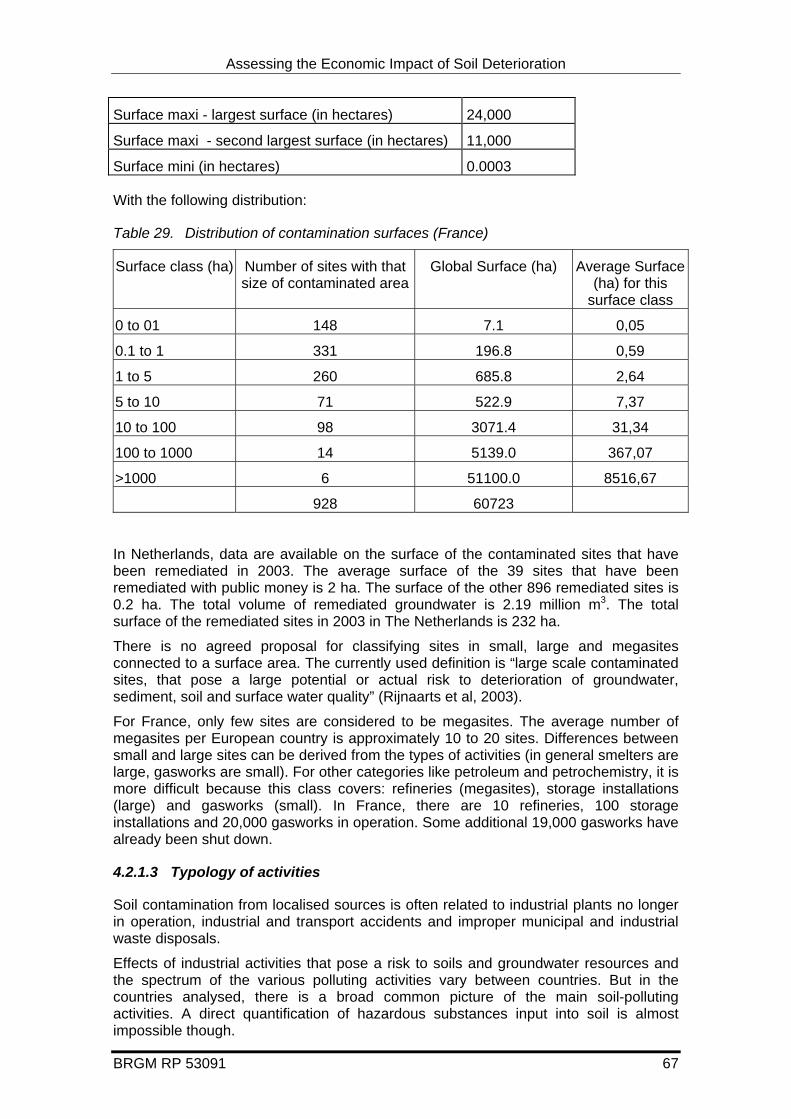
Assessing the Economic Impact of Soil Deterioration
BRGM RP 53091 67
Surface maxi - largest surface (in hectares) 24,000
Surface maxi - second largest surface (in hectares) 11,000
Surface mini (in hectares) 0.0003
With the following distribution:
Table 29. Distribution of contamination surfaces (France)
Surface class (ha) Number of sites with that size of contaminated area
Global Surface (ha) Average Surface (ha) for this
surface class
0 to 01 148 7.1 0,05
0.1 to 1 331 196.8 0,59
1 to 5 260 685.8 2,64
5 to 10 71 522.9 7,37
10 to 100 98 3071.4 31,34
100 to 1000 14 5139.0 367,07
>1000 6 51100.0 8516,67
928 60723
In Netherlands, data are available on the surface of the contaminated sites that have been remediated in 2003. The average surface of the 39 sites that have been remediated with public money is 2 ha. The surface of the other 896 remediated sites is 0.2 ha. The total volume of remediated groundwater is 2.19 million m3. The total surface of the remediated sites in 2003 in The Netherlands is 232 ha. There is no agreed proposal for classifying sites in small, large and megasites connected to a surface area. The currently used definition is “large scale contaminated sites, that pose a large potential or actual risk to deterioration of groundwater, sediment, soil and surface water quality” (Rijnaarts et al, 2003).
For France, only few sites are considered to be megasites. The average number of megasites per European country is approximately 10 to 20 sites. Differences between small and large sites can be derived from the types of activities (in general smelters are large, gasworks are small). For other categories like petroleum and petrochemistry, it is more difficult because this class covers: refineries (megasites), storage installations (large) and gasworks (small). In France, there are 10 refineries, 100 storage installations and 20,000 gasworks in operation. Some additional 19,000 gasworks have already been shut down.
4.2.1.3 Typology of activities
Soil contamination from localised sources is often related to industrial plants no longer in operation, industrial and transport accidents and improper municipal and industrial waste disposals.
Effects of industrial activities that pose a risk to soils and groundwater resources and the spectrum of the various polluting activities vary between countries. But in the countries analysed, there is a broad common picture of the main soil-polluting activities. A direct quantification of hazardous substances input into soil is almost impossible though.
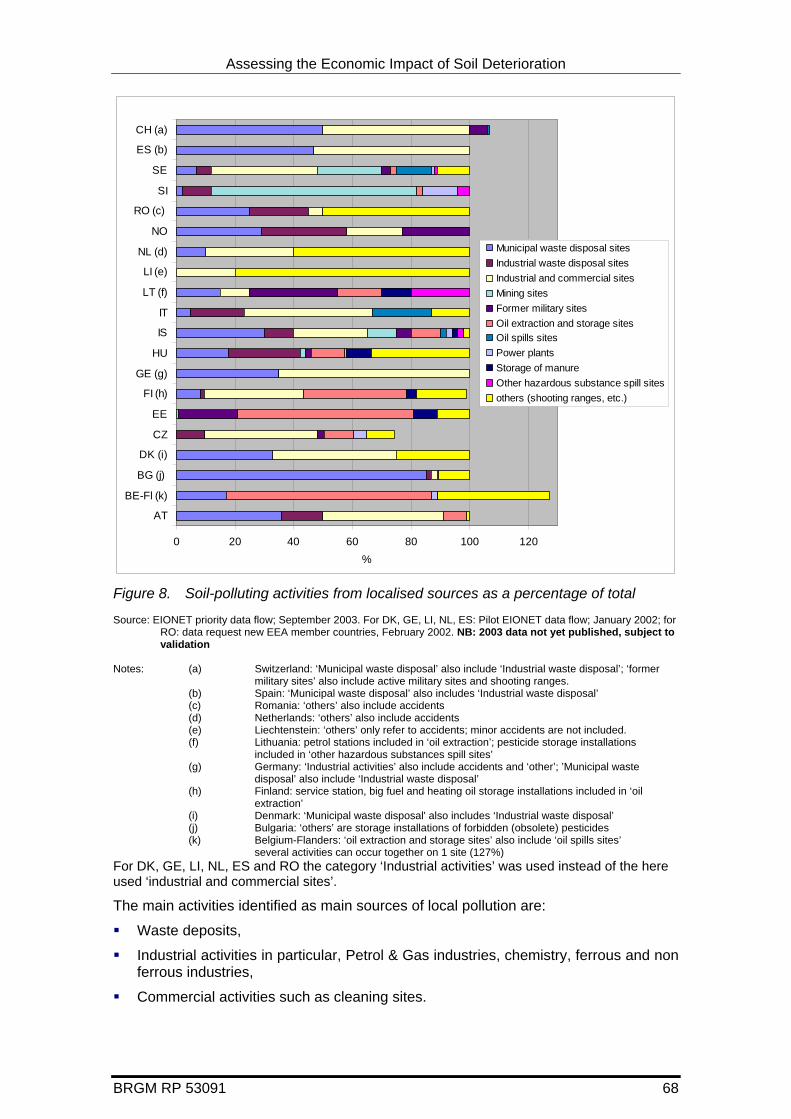
Assessing the Economic Impact of Soil Deterioration
0 20 40 60 80 100 120
AT
BE-Fl (k)
BG (j)
DK (i)
CZ
EE
FI (h)
GE (g)
HU
IS
IT
LT (f)
LI (e)
NL (d)
NO
RO (c)
SI
SE
ES (b)
CH (a)
%
Municipal waste disposal sitesIndustrial waste disposal sitesIndustrial and commercial sitesMining sitesFormer military sitesOil extraction and storage sitesOil spills sitesPower plantsStorage of manureOther hazardous substance spill sitesothers (shooting ranges, etc.)
Figure 8. Soil-polluting activities from localised sources as a percentage of total Source: EIONET priority data flow; September 2003. For DK, GE, LI, NL, ES: Pilot EIONET data flow; January 2002; for
RO: data request new EEA member countries, February 2002. NB: 2003 data not yet published, subject to validation
Notes: (a) Switzerland: ‘Municipal waste disposal’ also include ‘Industrial waste disposal’; ‘former
military sites’ also include active military sites and shooting ranges. (b) Spain: ‘Municipal waste disposal’ also includes ‘Industrial waste disposal’ (c) Romania: ‘others’ also include accidents (d) Netherlands: ‘others’ also include accidents (e) Liechtenstein: ‘others’ only refer to accidents; minor accidents are not included. (f) Lithuania: petrol stations included in ‘oil extraction’; pesticide storage installations
included in ‘other hazardous substances spill sites’ (g) Germany: ‘Industrial activities’ also include accidents and ‘other’; ’Municipal waste
disposal’ also include ‘Industrial waste disposal’ (h) Finland: service station, big fuel and heating oil storage installations included in ‘oil
extraction’ (i) Denmark: ‘Municipal waste disposal' also includes ‘Industrial waste disposal’ (j) Bulgaria: ‘others’ are storage installations of forbidden (obsolete) pesticides (k) Belgium-Flanders: ‘oil extraction and storage sites’ also include ‘oil spills sites’
several activities can occur together on 1 site (127%) For DK, GE, LI, NL, ES and RO the category ‘Industrial activities’ was used instead of the here used ‘industrial and commercial sites’.
The main activities identified as main sources of local pollution are:
Waste deposits,
Industrial activities in particular, Petrol & Gas industries, chemistry, ferrous and non ferrous industries,
Commercial activities such as cleaning sites.
BRGM RP 53091 68
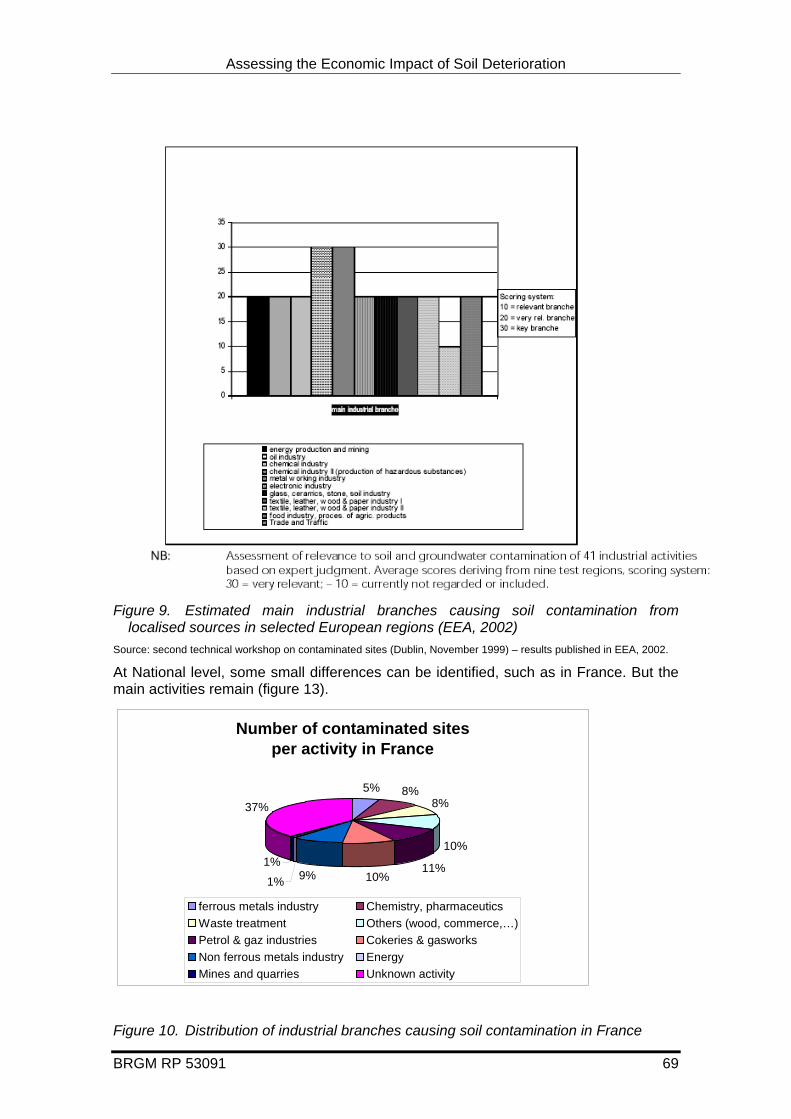
Assessing the Economic Impact of Soil Deterioration
BRGM RP 53091 69
Figure 9. Estimated main industrial branches causing soil contamination from localised sources in selected European regions (EEA, 2002)
Source: second technical workshop on contaminated sites (Dublin, November 1999) – results published in EEA, 2002.
At National level, some small differences can be identified, such as in France. But the main activities remain (figure 13).
Number of contaminated sites per activity in France
5% 8%8%
10%
11%10%9%1%
1%
37%
ferrous metals industry Chemistry, pharmaceuticsWaste treatment Others (wood, commerce,…)Petrol & gaz industries Cokeries & gasworksNon ferrous metals industry EnergyMines and quarries Unknown activity
Figure 10. Distribution of industrial branches causing soil contamination in France
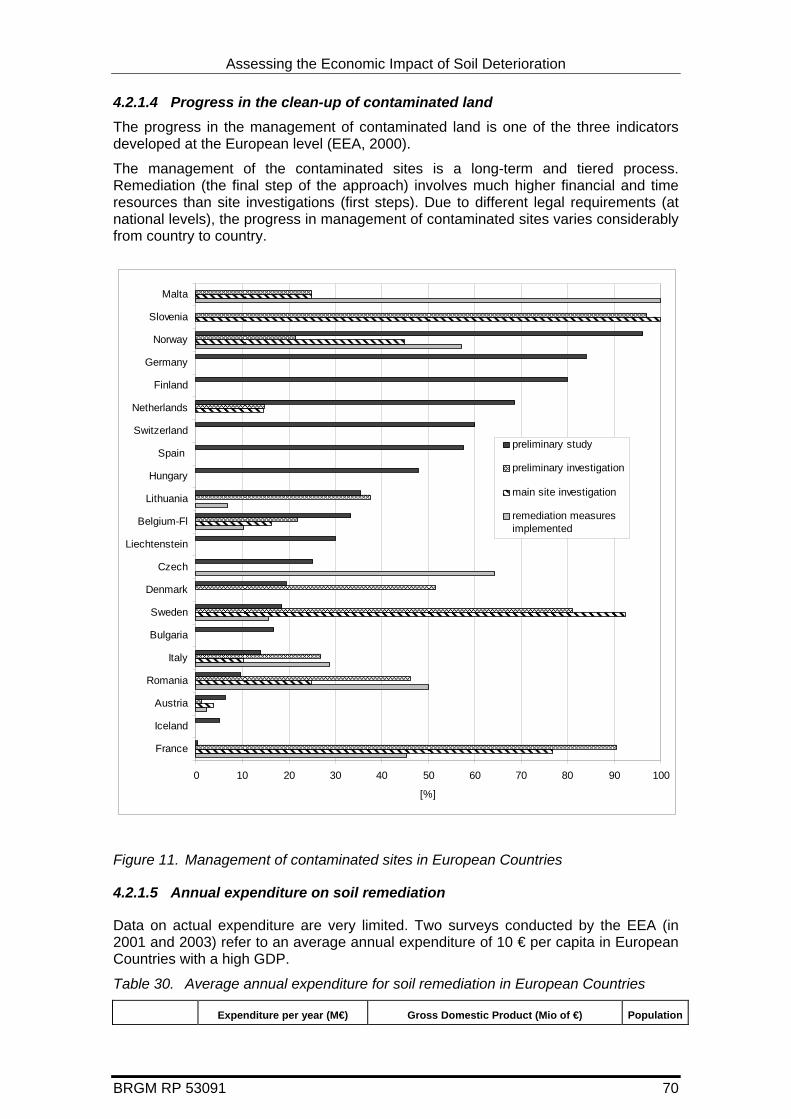
Assessing the Economic Impact of Soil Deterioration
4.2.1.4 Progress in the clean-up of contaminated land The progress in the management of contaminated land is one of the three indicators developed at the European level (EEA, 2000).
The management of the contaminated sites is a long-term and tiered process. Remediation (the final step of the approach) involves much higher financial and time resources than site investigations (first steps). Due to different legal requirements (at national levels), the progress in management of contaminated sites varies considerably from country to country.
0 10 20 30 40 50 60 70 80 90 100
France
Iceland
Austria
Romania
Italy
Bulgaria
Sweden
Denmark
Czech
Liechtenstein
Belgium-Fl
Lithuania
Hungary
Spain
Switzerland
Netherlands
Finland
Germany
Norway
Slovenia
Malta
[%]
preliminary study
preliminary investigation
main site investigation
remediation measuresimplemented
Figure 11. Management of contaminated sites in European Countries
4.2.1.5 Annual expenditure on soil remediation
Data on actual expenditure are very limited. Two surveys conducted by the EEA (in 2001 and 2003) refer to an average annual expenditure of 10 € per capita in European Countries with a high GDP.
Table 30. Average annual expenditure for soil remediation in European Countries
Expenditure per year (M€) Gross Domestic Product (Mio of €) Population
BRGM RP 53091 70
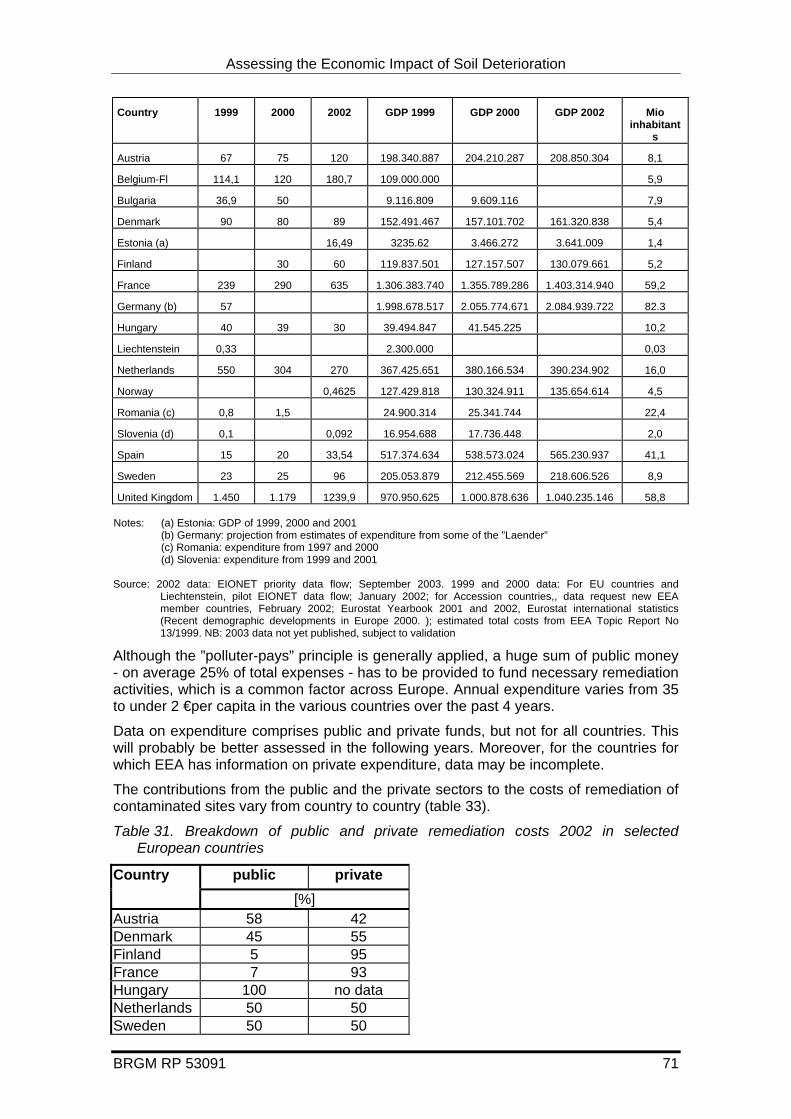
Assessing the Economic Impact of Soil Deterioration
BRGM RP 53091 71
Country 1999 2000 2002 GDP 1999 GDP 2000 GDP 2002 Mio inhabitant
s
Austria 67 75 120 198.340.887 204.210.287 208.850.304 8,1
Belgium-Fl 114,1 120 180,7 109.000.000 5,9
Bulgaria 36,9 50 9.116.809 9.609.116 7,9
Denmark 90 80 89 152.491.467 157.101.702 161.320.838 5,4
Estonia (a) 16,49 3235.62 3.466.272 3.641.009 1,4
Finland 30 60 119.837.501 127.157.507 130.079.661 5,2
France 239 290 635 1.306.383.740 1.355.789.286 1.403.314.940 59,2
Germany (b) 57 1.998.678.517 2.055.774.671 2.084.939.722 82.3
Hungary 40 39 30 39.494.847 41.545.225 10,2
Liechtenstein 0,33 2.300.000 0,03
Netherlands 550 304 270 367.425.651 380.166.534 390.234.902 16,0
Norway 0,4625 127.429.818 130.324.911 135.654.614 4,5
Romania (c) 0,8 1,5 24.900.314 25.341.744 22,4
Slovenia (d) 0,1 0,092 16.954.688 17.736.448 2,0
Spain 15 20 33,54 517.374.634 538.573.024 565.230.937 41,1
Sweden 23 25 96 205.053.879 212.455.569 218.606.526 8,9
United Kingdom 1.450 1.179 1239,9 970.950.625 1.000.878.636 1.040.235.146 58,8 Notes: (a) Estonia: GDP of 1999, 2000 and 2001
(b) Germany: projection from estimates of expenditure from some of the ”Laender” (c) Romania: expenditure from 1997 and 2000 (d) Slovenia: expenditure from 1999 and 2001
Source: 2002 data: EIONET priority data flow; September 2003. 1999 and 2000 data: For EU countries and
Liechtenstein, pilot EIONET data flow; January 2002; for Accession countries,, data request new EEA member countries, February 2002; Eurostat Yearbook 2001 and 2002, Eurostat international statistics (Recent demographic developments in Europe 2000. ); estimated total costs from EEA Topic Report No 13/1999. NB: 2003 data not yet published, subject to validation
Although the ”polluter-pays” principle is generally applied, a huge sum of public money - on average 25% of total expenses - has to be provided to fund necessary remediation activities, which is a common factor across Europe. Annual expenditure varies from 35 to under 2 €per capita in the various countries over the past 4 years.
Data on expenditure comprises public and private funds, but not for all countries. This will probably be better assessed in the following years. Moreover, for the countries for which EEA has information on private expenditure, data may be incomplete.
The contributions from the public and the private sectors to the costs of remediation of contaminated sites vary from country to country (table 33).
Table 31. Breakdown of public and private remediation costs 2002 in selected European countries
Country public private [%]
Austria 58 42 Denmark 45 55 Finland 5 95 France 7 93 Hungary 100 no data Netherlands 50 50 Sweden 50 50
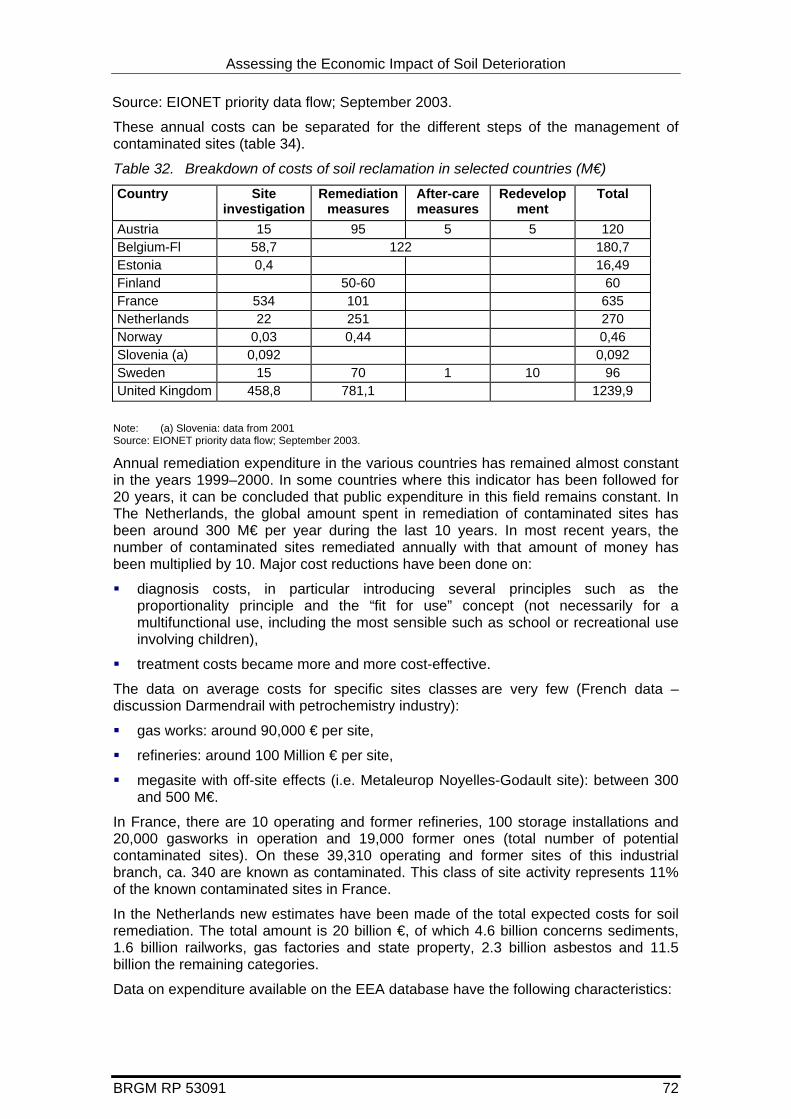
Assessing the Economic Impact of Soil Deterioration
Source: EIONET priority data flow; September 2003.
These annual costs can be separated for the different steps of the management of contaminated sites (table 34).
Table 32. Breakdown of costs of soil reclamation in selected countries (M€)
Country Site investigation
Remediation measures
After-care measures
Redevelopment
Total
Austria 15 95 5 5 120 Belgium-Fl 58,7 122 180,7 Estonia 0,4 16,49 Finland 50-60 60 France 534 101 635 Netherlands 22 251 270 Norway 0,03 0,44 0,46 Slovenia (a) 0,092 0,092 Sweden 15 70 1 10 96 United Kingdom 458,8 781,1 1239,9
Note: (a) Slovenia: data from 2001 Source: EIONET priority data flow; September 2003.
Annual remediation expenditure in the various countries has remained almost constant in the years 1999–2000. In some countries where this indicator has been followed for 20 years, it can be concluded that public expenditure in this field remains constant. In The Netherlands, the global amount spent in remediation of contaminated sites has been around 300 M€ per year during the last 10 years. In most recent years, the number of contaminated sites remediated annually with that amount of money has been multiplied by 10. Major cost reductions have been done on:
diagnosis costs, in particular introducing several principles such as the proportionality principle and the “fit for use” concept (not necessarily for a multifunctional use, including the most sensible such as school or recreational use involving children),
treatment costs became more and more cost-effective.
The data on average costs for specific sites classes are very few (French data – discussion Darmendrail with petrochemistry industry):
gas works: around 90,000 € per site,
refineries: around 100 Million € per site,
megasite with off-site effects (i.e. Metaleurop Noyelles-Godault site): between 300 and 500 M€.
In France, there are 10 operating and former refineries, 100 storage installations and 20,000 gasworks in operation and 19,000 former ones (total number of potential contaminated sites). On these 39,310 operating and former sites of this industrial branch, ca. 340 are known as contaminated. This class of site activity represents 11% of the known contaminated sites in France.
In the Netherlands new estimates have been made of the total expected costs for soil remediation. The total amount is 20 billion €, of which 4.6 billion concerns sediments, 1.6 billion railworks, gas factories and state property, 2.3 billion asbestos and 11.5 billion the remaining categories.
Data on expenditure available on the EEA database have the following characteristics:
BRGM RP 53091 72

Assessing the Economic Impact of Soil Deterioration
BRGM RP 53091 73
Strengths:
Cost estimations are available in numerous European countries;
Extrapolation of representative regional data to national scale possible;
Clearer definitions have been introduced for expenditure, allowing classifying the costs in different categories (investigation costs, remediation costs, redevelopment costs etc.);
It is possible to differentiate between public and private expenditure.
Limitations:
high dependence on cost estimations (no exact data available);
access to real data is often not possible (e.g. regarding private investments.
4.2.1.6 Population Exposures
There is no comprehensive data on the exposure of the population. However, contaminated areas exist around most major cities (due to historical reasons) and there are some contaminated sites in low populated areas (EEA-UNEP, 2000).
There is a French study on this particular point related to an account of the number of potentially exposed persons around active industrial sites (lead smelters and batteries recycling plants) generating off-site effects (mainly due to atmospheric emissions) in the Region Centre in France.
Table 33. Estimation of the number of persons exposed to local sources of contamination (France)
from 0 to 500 meters
from 500 to 1000 meters
From 1000 to 1500 meters
Site Total
number of people
0-6 yearsTotal
number of people
0-6 years Total
number of people
0-6 years
Total Cher 5110 247 13949 695 22773 1192
Total Eure and Loir 6896 480 21423 1546 27585 1898
Total Loir and Cher 2391 107 7461 346 11787 601
Total Loiret 6404 405 16453 1065 24786 1421
Total population 20801 1239 59286 3652 86931 5112
Currently, the scientific discussion is focused on the distance to be taken into account in order to establish the number of people exposed to the soil contamination. Probably for these types of site, generating soil contamination by atmospheric emissions, the number of people considered to be exposed should be the ones present in a distance comprised between at least 500 or 1,000 meters.

Assessing the Economic Impact of Soil Deterioration
4.2.1.7 Consequences
For the contaminated sites to be remediated in urban areas, the main driving force for the remediation is rather the urban development more than the presence of an impact on human health. This is valid all over Europe for urban areas. The remediation costs are now taken into consideration in the overall cost of the urban redevelopment project (see “Ceramique information sheet – NL” in chapter 8.1.8). Some countries such as Netherlands are now promoting private – public partnerships (PPP) in order to enhance the redevelopment of contaminated sites and brownfields, which are derelict sites, which might not be contaminated but are perceived to be contaminated.
4.2.2 Diffuse contamination
The main diffuse sources of soil contamination are atmospheric deposition of acidifying and eutrophying compounds or potentially harmful chemicals, deposition of contaminants from flowing water or eroded soil itself, and the direct application of substances such as pesticides, sewage sludges, fertilisers, and manure, which may contain heavy metals.
Two situations are generally labelled as diffuse contamination: 1) Contamination that may arise from current agricultural practices and related soil uses such as forestry, managed nature reserves, gardens and parks where the user of the land modifies ecological processes in soil with additions of nutrients, exogenic organic matter and pesticides to increase productivity or to protect the current state of the land. 2) Contamination that enters the soil system by natural pathways like atmospheric deposition and sedimentation from surface waters (in the case of sediments).
4.2.2.1 The SOTER database
The International Soil Reference and Information centre (ISRIC), in co-operation with the Food and Agriculture Organisation of the United Nations (FAO), United Nations Environment Programme (UNEP), and International Union for Soil Science (IUSS), has developed an uniform system for handling SOil and TERrain data (SOTER database), initially for use at a global scale. This internationally recognised methodology is now operational in many countries worldwide at different scale levels, from national to continental.
ISRIC has now the obligation to:
collect data and information on the world’ soil sources,
maintain the collected data and information,
improve the accessibility and dissemination of the information,
function as a portal for the soils through the World Wide Web.
The project on the “mapping of soil and terrain vulnerability in Central and Eastern countries” (SOVEUR) was implemented at ISRIC in 1997, under contract with FAO. The project encompassed collaboration with specialists from thirteen countries in Central and Eastern Countries, who collated the primary data using uniform criteria and guidelines developed at ISRIC. The project area covers Belarus, Bulgaria, Czech Republic, Estonia, Hungary, Latvia, Lithuania, Moldavia, Poland, Romania, Russian Federation (west of the Urals), Slovakia, and the Ukraine.
The aims of SOVEUR project are to strengthen regional awareness of the significant role soils play in protecting food and water supplies, and to demonstrate the need for environmental protection, by preparing soil degradation and vulnerability maps that can focus attention upon the areas most at risk (scale 1:2,500,000). This has been
BRGM RP 53091 74

Assessing the Economic Impact of Soil Deterioration
BRGM RP 53091 75
achieved by: (a) developing a soil and terrain (SOTER) digital database; (b) mapping the current status of soil degradation; and (c) assessing the soil’s vulnerability to selected categories of pollutants. The final product has been delivered to FAO in 2000 and published as n°10 in FAO’s Land and Water Digital Media Series.
The type of soil degradation refers to the nature of the degradation process (displacement of soil material by water and wind, in-situ deterioration by physical, chemical and biological processes). Types of soil degradation are represented by a code, the first capital letter indicating the major degradation type, the second lowercase letter referring to the subtype. Most of the codes are the same as those used for the GLASOD map (see Erosion part), but some extra ones have been added or definitions have slightly been changed, in particular for pollution. In the context of the SOVEUR project, pollution has been treated as a separate main degradation type and the assessment criteria for pollution have been modified accordingly. The other types of degradation include various subtypes of water erosion, wind erosion, chemical deterioration (other than pollution), and physical deterioration.
The extent of soil degradation refers to the percentage of the area within a (map) polygon affected by the given type of degradation or by an association of several types. Often several types of degradation will overlap and in some cases even interact.
4.2.2.2 Limitations of the SOTER database
most criteria are not quantitative (based on expert judgement, even using uniform standards and criteria),
The 1: 2,5 M scale of assessment does not allowed detailed conclusions.
Varying data availability and quality may have led to local or regional under-representation of certain degradation types.
Different interpretations of the criteria (e.g. risk versus status of degradation) have been used. It’s clear that the risk rather than the status had been evaluated for some countries.
Area calculations are based on the GIS data. Due to differences in projection, data gaps and some other inaccuracies, total areas shown may deviate somewhat from those in other data sources.
Some records have incomplete or missing data.
4.2.2.3 Distribution of different degradation types
The result of the assessment is shown in the following table. 67% of the total area, about 385 Million hectares, are not being affected by degradation. Soil compaction is the most predominant degradation type (with 62 Mha, 11% of the total area and 21.7% of all degradation). Water erosion is second in importance. In third position comes pollution. But those data are incomplete, partly due to a reported lack of existing data (e.g. for Russia). Some countries also report only local occurrence for certain pollution types, while other countries provide extensive spatial data. This rather disturbs the general picture, which should be taken into consideration when studying the results of the assessment for pollution.
Table 34. Distribution of soil deterioration categories at the European level (SOTER database)
Type Negligible Light Moderate Strong Extreme Total of SOVEUR area
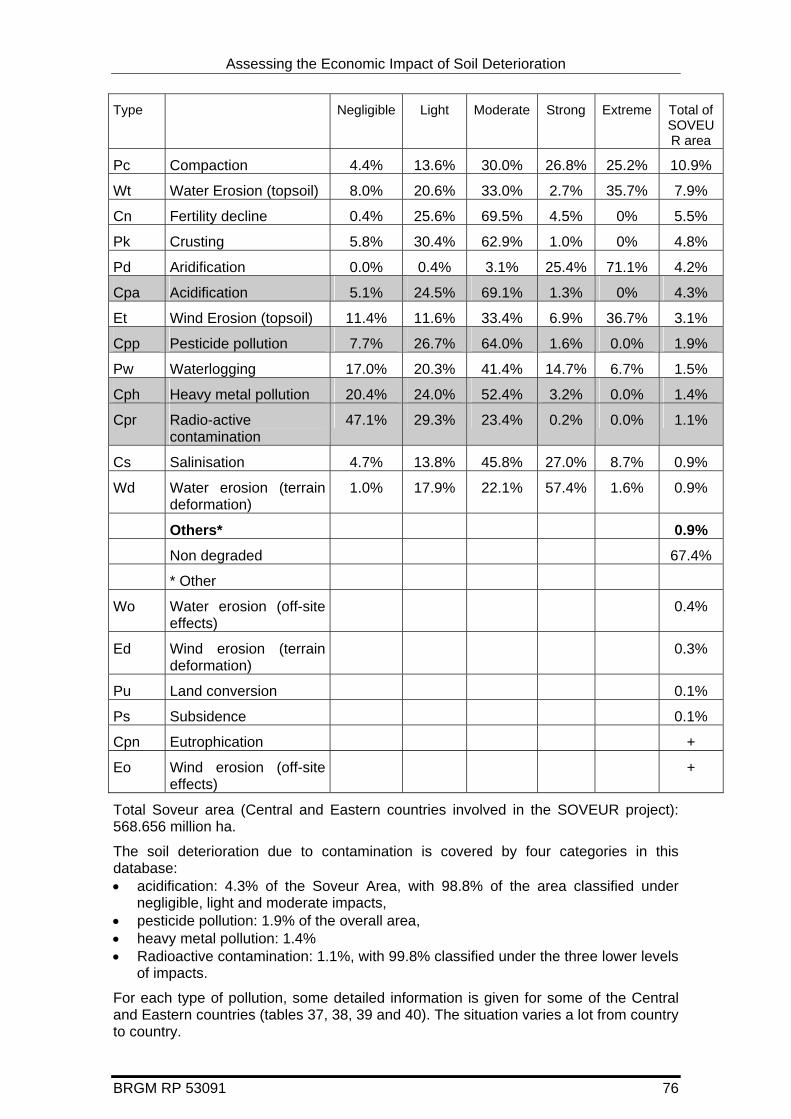
Assessing the Economic Impact of Soil Deterioration
BRGM RP 53091 76
Type Negligible Light Moderate Strong Extreme Total of SOVEUR area
Pc Compaction 4.4% 13.6% 30.0% 26.8% 25.2% 10.9%
Wt Water Erosion (topsoil) 8.0% 20.6% 33.0% 2.7% 35.7% 7.9%
Cn Fertility decline 0.4% 25.6% 69.5% 4.5% 0% 5.5%
Pk Crusting 5.8% 30.4% 62.9% 1.0% 0% 4.8%
Pd Aridification 0.0% 0.4% 3.1% 25.4% 71.1% 4.2%
Cpa Acidification 5.1% 24.5% 69.1% 1.3% 0% 4.3%
Et Wind Erosion (topsoil) 11.4% 11.6% 33.4% 6.9% 36.7% 3.1%
Cpp Pesticide pollution 7.7% 26.7% 64.0% 1.6% 0.0% 1.9%
Pw Waterlogging 17.0% 20.3% 41.4% 14.7% 6.7% 1.5%
Cph Heavy metal pollution 20.4% 24.0% 52.4% 3.2% 0.0% 1.4%
Cpr Radio-active contamination
47.1% 29.3% 23.4% 0.2% 0.0% 1.1%
Cs Salinisation 4.7% 13.8% 45.8% 27.0% 8.7% 0.9%
Wd Water erosion (terrain deformation)
1.0% 17.9% 22.1% 57.4% 1.6% 0.9%
Others* 0.9%
Non degraded 67.4%
* Other
Wo Water erosion (off-site effects)
0.4%
Ed Wind erosion (terrain deformation)
0.3%
Pu Land conversion 0.1%
Ps Subsidence 0.1%
Cpn Eutrophication +
Eo Wind erosion (off-site effects)
+
Total Soveur area (Central and Eastern countries involved in the SOVEUR project): 568.656 million ha.
The soil deterioration due to contamination is covered by four categories in this database: • acidification: 4.3% of the Soveur Area, with 98.8% of the area classified under
negligible, light and moderate impacts, • pesticide pollution: 1.9% of the overall area, • heavy metal pollution: 1.4% • Radioactive contamination: 1.1%, with 99.8% classified under the three lower levels
of impacts.
For each type of pollution, some detailed information is given for some of the Central and Eastern countries (tables 37, 38, 39 and 40). The situation varies a lot from country to country.

Assessing the Economic Impact of Soil Deterioration
BRGM RP 53091 77
Table 35. % of country area affected by acidification
Country Negligible Light Moderate Strong Total
Czech rep. 0.0% 0.0% 0.0% 1.6% 1.6%
Estonia 0.4% 0.2% 0.0% 0.0% 0.6%
Hungary 0.0% 6.0% 11.6% 2.0% 19.6%
Latvia 17.6% 0.0% 0.0% 0.0% 17.6%
Lithuania 1.1% 24.4% 0.3% 0.0% 25.8%
Poland 0.0% 0.1% 34.8% 0.0% 34.9%
Romania 0.0% 3.3% 0.2% 0.0% 3.6%
Slovakia 0.8% 0.2% 0.1% 0.1% 1.2%
Table 36. % of country area affected by heavy metal pollution
Country Negligible Light Moderate Strong Total
Belarus 0.0% 0.0% 0.0% 0.0% 0.0%
Bulgaria 0.0% 0.0% 0.0% 0.0% 0.0%
Czech rep. 2.5% 0.0% 0.0% 0.0% 2.5%
Estonia 0.0% 2.5% 0.3% 0.0% 2.8%
Latvia 0.0% 0.0% 0.0% 0.0% 0.0%
Lithuania 19.5% 22.8% 0.0% 0.0% 42.2%
Poland 0.0% 0.0% 0.6% 0.0% 0.6%
Romania 0.0% 0.0% 0.0% 0.0% 0.0%
Slovakia 0.0% 0.0% 0.1% 0.0% 0.1%
Table 37. % of country area affected by pesticide pollution
Country Negligible Light Moderate Strong Total
Bulgaria 0.0% 0.0% 0.0% 0.0% 0.0%
Czech rep. 1.9% 0.0% 0.0% 0.0% 1.9%
Estonia 0.1% 0.0% 0.0% 0.0% 0.1%
Lithuania 0.0% 0.0% 0.0% 0.0% 0.0%
Poland 2.4% 0.0% 0.0% 0.0% 2.4%
Romania 0.0% 6.6% 12.7% 0.0% 19.3%
Slovakia 0.3% 0.0% 0.0% 0.0% 0.3%
Table 38. % of country area affected by radio-nuclear pollution
Country Negligible Light Moderate Strong Total
Bulgaria 0.0% 0.0% 0.0% 0.0% 0.0%
Estonia 0.0% 0.0% 0.0% 0.0% 0.0%
Ukraine 5.2% 3.2% 2.6% 0.0% 11.0%
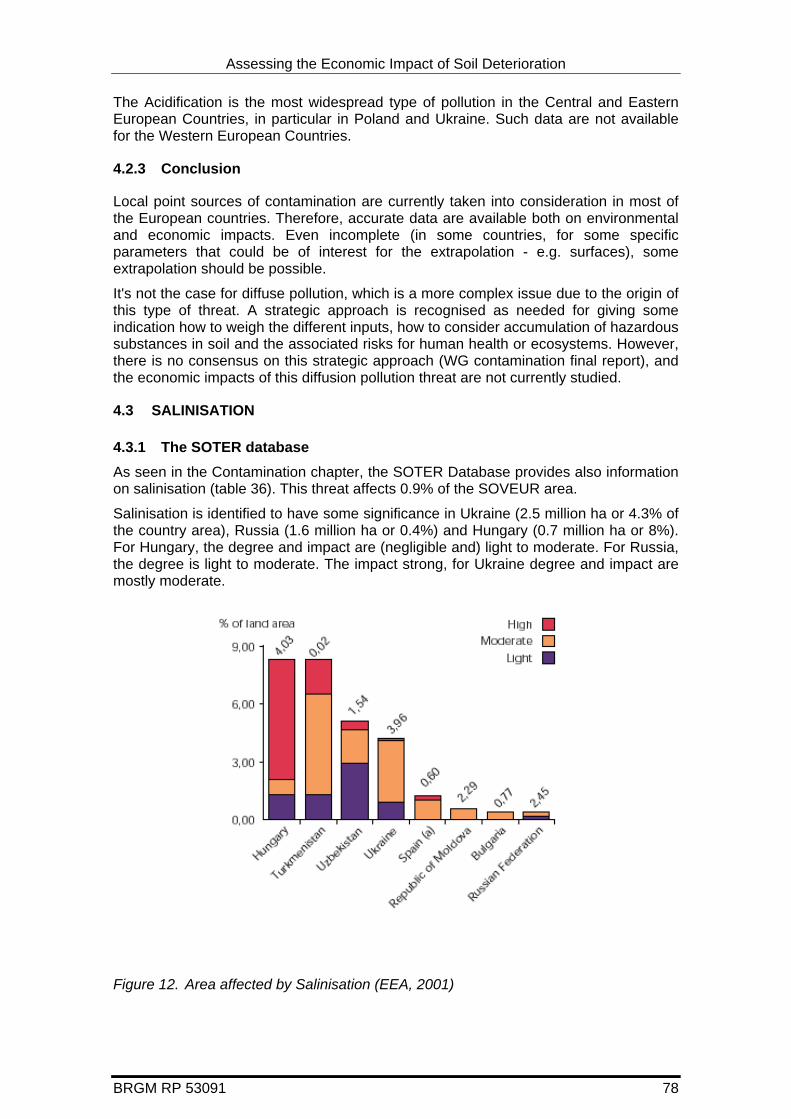
Assessing the Economic Impact of Soil Deterioration
The Acidification is the most widespread type of pollution in the Central and Eastern European Countries, in particular in Poland and Ukraine. Such data are not available for the Western European Countries.
4.2.3 Conclusion
Local point sources of contamination are currently taken into consideration in most of the European countries. Therefore, accurate data are available both on environmental and economic impacts. Even incomplete (in some countries, for some specific parameters that could be of interest for the extrapolation - e.g. surfaces), some extrapolation should be possible.
It's not the case for diffuse pollution, which is a more complex issue due to the origin of this type of threat. A strategic approach is recognised as needed for giving some indication how to weigh the different inputs, how to consider accumulation of hazardous substances in soil and the associated risks for human health or ecosystems. However, there is no consensus on this strategic approach (WG contamination final report), and the economic impacts of this diffusion pollution threat are not currently studied.
4.3 SALINISATION
4.3.1 The SOTER database As seen in the Contamination chapter, the SOTER Database provides also information on salinisation (table 36). This threat affects 0.9% of the SOVEUR area.
Salinisation is identified to have some significance in Ukraine (2.5 million ha or 4.3% of the country area), Russia (1.6 million ha or 0.4%) and Hungary (0.7 million ha or 8%). For Hungary, the degree and impact are (negligible and) light to moderate. For Russia, the degree is light to moderate. The impact strong, for Ukraine degree and impact are mostly moderate.
Figure 12. Area affected by Salinisation (EEA, 2001)
BRGM RP 53091 78
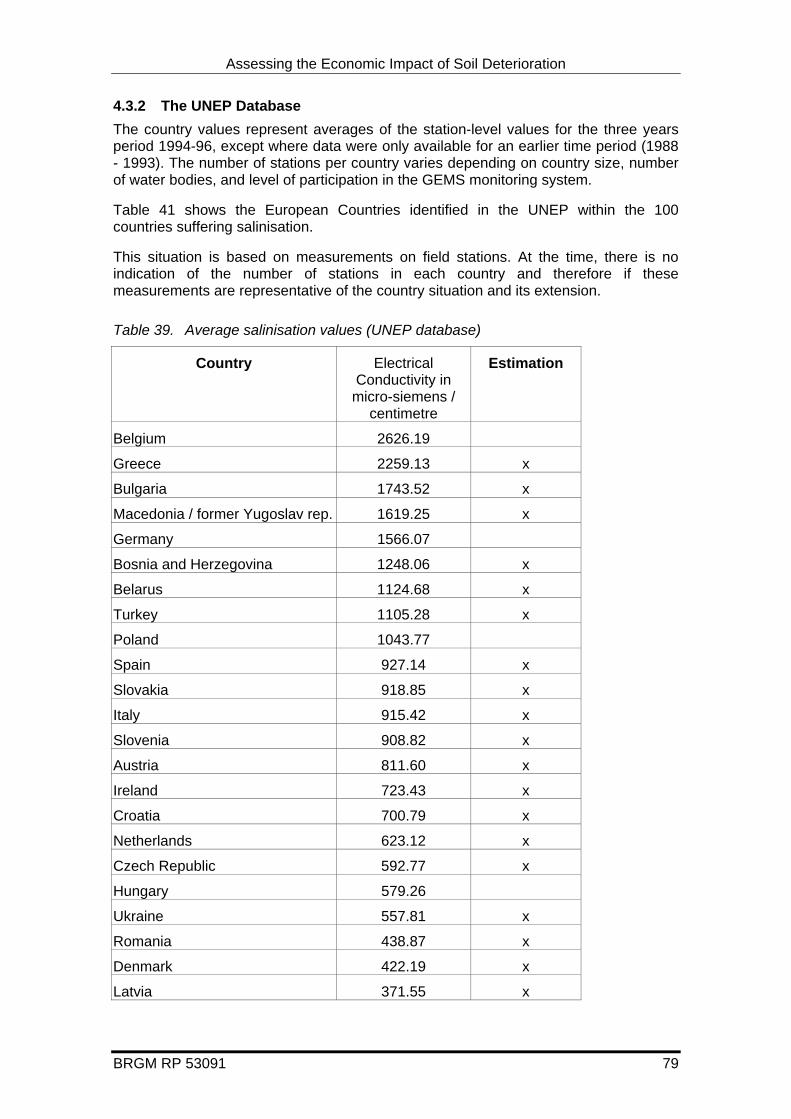
Assessing the Economic Impact of Soil Deterioration
BRGM RP 53091 79
4.3.2 The UNEP Database The country values represent averages of the station-level values for the three years period 1994-96, except where data were only available for an earlier time period (1988 - 1993). The number of stations per country varies depending on country size, number of water bodies, and level of participation in the GEMS monitoring system.
Table 41 shows the European Countries identified in the UNEP within the 100 countries suffering salinisation.
This situation is based on measurements on field stations. At the time, there is no indication of the number of stations in each country and therefore if these measurements are representative of the country situation and its extension.
Table 39. Average salinisation values (UNEP database)
Country Electrical Conductivity in micro-siemens /
centimetre
Estimation
Belgium 2626.19
Greece 2259.13 x
Bulgaria 1743.52 x
Macedonia / former Yugoslav rep. 1619.25 x
Germany 1566.07
Bosnia and Herzegovina 1248.06 x
Belarus 1124.68 x
Turkey 1105.28 x
Poland 1043.77
Spain 927.14 x
Slovakia 918.85 x
Italy 915.42 x
Slovenia 908.82 x
Austria 811.60 x
Ireland 723.43 x
Croatia 700.79 x
Netherlands 623.12 x
Czech Republic 592.77 x
Hungary 579.26
Ukraine 557.81 x
Romania 438.87 x
Denmark 422.19 x
Latvia 371.55 x
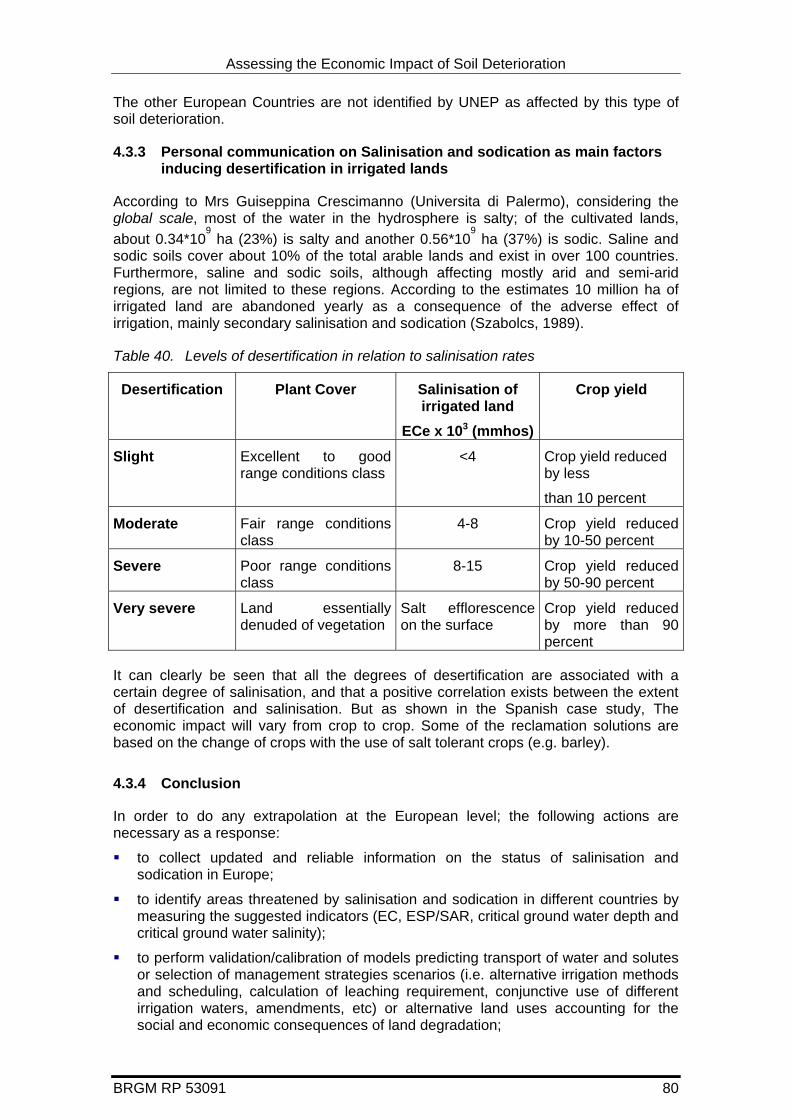
Assessing the Economic Impact of Soil Deterioration
The other European Countries are not identified by UNEP as affected by this type of soil deterioration.
4.3.3 Personal communication on Salinisation and sodication as main factors inducing desertification in irrigated lands
According to Mrs Guiseppina Crescimanno (Universita di Palermo), considering the global scale, most of the water in the hydrosphere is salty; of the cultivated lands, about 0.34*10
9 ha (23%) is salty and another 0.56*109 ha (37%) is sodic. Saline and
sodic soils cover about 10% of the total arable lands and exist in over 100 countries. Furthermore, saline and sodic soils, although affecting mostly arid and semi-arid regions, are not limited to these regions. According to the estimates 10 million ha of irrigated land are abandoned yearly as a consequence of the adverse effect of irrigation, mainly secondary salinisation and sodication (Szabolcs, 1989).
Table 40. Levels of desertification in relation to salinisation rates
Desertification Plant Cover Salinisation of irrigated land
ECe x 103 (mmhos)
Crop yield
Slight Excellent to good range conditions class
<4 Crop yield reduced by less
than 10 percent
Moderate Fair range conditions class
4-8 Crop yield reduced by 10-50 percent
Severe Poor range conditions class
8-15 Crop yield reduced by 50-90 percent
Very severe Land essentially denuded of vegetation
Salt efflorescence on the surface
Crop yield reduced by more than 90 percent
It can clearly be seen that all the degrees of desertification are associated with a certain degree of salinisation, and that a positive correlation exists between the extent of desertification and salinisation. But as shown in the Spanish case study, The economic impact will vary from crop to crop. Some of the reclamation solutions are based on the change of crops with the use of salt tolerant crops (e.g. barley).
4.3.4 Conclusion
In order to do any extrapolation at the European level; the following actions are necessary as a response:
to collect updated and reliable information on the status of salinisation and sodication in Europe;
to identify areas threatened by salinisation and sodication in different countries by measuring the suggested indicators (EC, ESP/SAR, critical ground water depth and critical ground water salinity);
to perform validation/calibration of models predicting transport of water and solutes or selection of management strategies scenarios (i.e. alternative irrigation methods and scheduling, calculation of leaching requirement, conjunctive use of different irrigation waters, amendments, etc) or alternative land uses accounting for the social and economic consequences of land degradation;
BRGM RP 53091 80

Assessing the Economic Impact of Soil Deterioration
BRGM RP 53091 81
to identify all the major agriculture productions in each country that could be affected or not by salinisation.
4.4 ORGANIC MATTER LOSS
The Working Group Soil Organic Matter of the EU Soil Thematic Strategy has done a review of the status and the distribution of soil organic matter in Europe (Jones et al, 2004). Their conclusions are:
the European Soil Database, at scale 1:1,000,000, is the only source of data on the soils of Europe harmonised according to a standard international classification (FAO),
Available as part of this database, is a Soil Profile Database for Europe (SPADE) containing data on organic carbon in the topsoil (0-30 cm) for important soil types.
These data are not comprehensive geographically and have poor replication; consequently an expanded database for Europe (SPADE 2) is currently in the advanced stage of compilation and this will provide (after 2004) many more measure values of Organic Content (OC) for European soils.
OC data for soils in Europe are available from other sources : National Soil Survey archives, the ISRIC – WISE database, the ICP Forest Survey, the FOREGS Geochemical Baseline Mapping and the Baltic Survey,
• With the exception of national soil survey archives, it is not possible to produce distribution maps of soil OC from any of these databases that would be accurate enough for policy support in Europe.
• However, the national data are not generally available for use outside the country of origin; the ICP forest survey is limited to forested land; the Foregs database is based on only 5 samples per 160 km x 160 km, and the Baltic Survey covers only northern countries.
Estimated organic carbon level in the topsoil has been derived from the European Soil Database using four classes:
H(igh): >6%
M(edium): 2.1 – 6.0%
L(ow): 1.1 – 2.0%
V(ery) L(ow): <1%
Table 41 shows the distribution of Soil OC classes in Europe.
Table 41. Proportion of Europe estimated to fall into the different OC classes
Hectares (ha) OC class OC (%) Area (%) 66,558,238 V <1 13
163,967,166 L 1 - 2 32 232,325,106 M 2 – 6 45 22,173;470 H > 6 5
A study of the distribution of peat and peaty topped soils in Europe has recently been conducted by the Joint Research Center (Montanarella L. et al, 2004), using the European Soil Database (v1.0). The results highlight the contrast in topsoil organic carbon content between northern and southern Europe (see table 42).

Assessing the Economic Impact of Soil Deterioration
BRGM RP 53091 82
Table 42. Area of peat and peaty topped soils, within country, estimated from
a) the European Soil Database, and b) the map of Organic Carbon in the Topsoils of Europe using thresholds of 20 and
25% of OC
Area of peat and peaty-topped soils from Map of OC in Topsoils of Europe2
Country Area of Peat1 in SMUs of European Soil
Database OC>20% OC>25% km2
% km2 % km2 %
Albania 44 0.2 41 0.1 0 0.0
Austria 276 0.3 1262 1.5 134 0.2
Bosnia Herzegov 170 0.3 86 0.2 32 0.1
Belgium 240 0.8 96 0.3 95 0.3
Bulgaria 53 0.5 1 0.0 0 0.0
Switzerland 183 0.5 4762 11.9 836 2.1
Czech Republic 687 0.9 1449 1.9 251 0.3
Denmark 1091 2.6 249 0.6 66 0.2
Estonia 9353 21.7 8196 19.0 6889 16.0
Spain 360 0.1 196 0.0 184 0.0
Finland 88908 29.5 100440 33.3 98353 32.6
Faeroe Islands 201 15.0 111 8.3 92 6.9
France 3157 0.6 5417 1.0 775 0.1
Germany 15276 4.3 17846 5.0 6279 1.8
Greece 554 0.4 0 0.0 0 0.0
Croatia 41 0.1 0 0.0 0 0.0
Hungary 2738 3.0 1018 1.1 401 0.4
Ireland 11392 16.5 13014 18.9 12725 18.5
Italy 292 0.1 3 0.0 1 0.0
Lichtenstein 0 0.0 0 0.0 0 0.0
Lithuania 2433 3.8 1850 2.9 1489 2.3
Luxembourg 3 0.1 0 0.0 0 0.0
Latvia 7385 11.7 4017 6.3 3382 5.3
Monaco 0 0.0 0 0.0 0 0.0
FYROM3 0 0.0 18 0.1 0 0.0
Malta 0 0.0 0 0.0 0 0.0
Netherlands 5392 15.6 3209 9.3 2022 5.9
Norway 18685 6.0 28380 9.2 18798 6.1
Poland 29720 9.7 15043 4.9 4677 1.5
Portugal 271 0.3 0 0.0 0 0.0
Romania 95 0.0 585 0.2 39 0.0
Sweden 65859 15.6 105025 24.9 90785 21.5
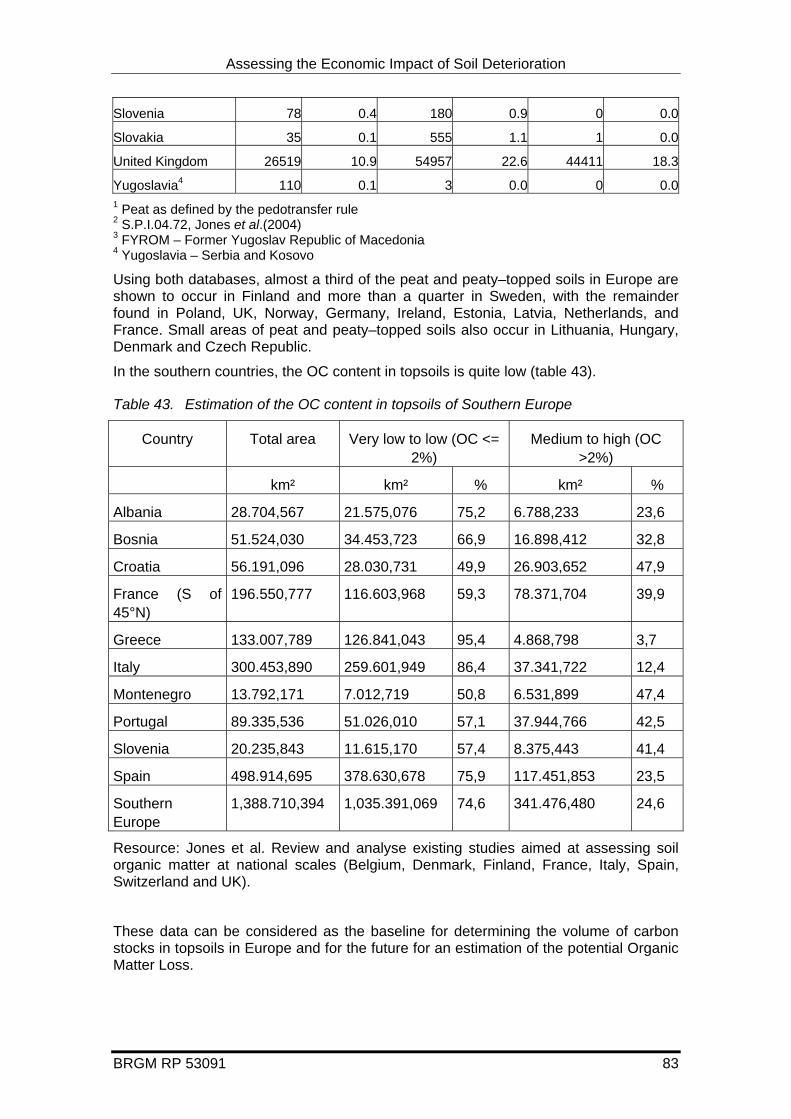
Assessing the Economic Impact of Soil Deterioration
BRGM RP 53091 83
Slovenia 78 0.4 180 0.9 0 0.0
Slovakia 35 0.1 555 1.1 1 0.0
United Kingdom 26519 10.9 54957 22.6 44411 18.3
Yugoslavia4 110 0.1 3 0.0 0 0.0
1 Peat as defined by the pedotransfer rule 2 S.P.I.04.72, Jones et al.(2004) 3 FYROM – Former Yugoslav Republic of Macedonia 4 Yugoslavia – Serbia and Kosovo
Using both databases, almost a third of the peat and peaty–topped soils in Europe are shown to occur in Finland and more than a quarter in Sweden, with the remainder found in Poland, UK, Norway, Germany, Ireland, Estonia, Latvia, Netherlands, and France. Small areas of peat and peaty–topped soils also occur in Lithuania, Hungary, Denmark and Czech Republic.
In the southern countries, the OC content in topsoils is quite low (table 43).
Table 43. Estimation of the OC content in topsoils of Southern Europe
Country Total area Very low to low (OC <= 2%)
Medium to high (OC >2%)
km² km² % km² %
Albania 28.704,567 21.575,076 75,2 6.788,233 23,6
Bosnia 51.524,030 34.453,723 66,9 16.898,412 32,8
Croatia 56.191,096 28.030,731 49,9 26.903,652 47,9
France (S of 45°N)
196.550,777 116.603,968 59,3 78.371,704 39,9
Greece 133.007,789 126.841,043 95,4 4.868,798 3,7
Italy 300.453,890 259.601,949 86,4 37.341,722 12,4
Montenegro 13.792,171 7.012,719 50,8 6.531,899 47,4
Portugal 89.335,536 51.026,010 57,1 37.944,766 42,5
Slovenia 20.235,843 11.615,170 57,4 8.375,443 41,4
Spain 498.914,695 378.630,678 75,9 117.451,853 23,5
Southern Europe
1,388.710,394 1,035.391,069 74,6 341.476,480 24,6
Resource: Jones et al. Review and analyse existing studies aimed at assessing soil organic matter at national scales (Belgium, Denmark, Finland, France, Italy, Spain, Switzerland and UK).
These data can be considered as the baseline for determining the volume of carbon stocks in topsoils in Europe and for the future for an estimation of the potential Organic Matter Loss.

Assessing the Economic Impact of Soil Deterioration
4.5 FLOODINGS The causes of flooding are climatological (rain, snowmelt, icemelt), part climatological (estuarine interactions between streamflow and tidal conditions, coastal storm surges), and other (earthquakes, landslides, failures of dams and other control works). Flood intensifying conditions include basin characteristics (area, slope, altitude, soil types, vegetation cover, etc.), network characteristics (surface storage, channel length, etc.) and channel characteristics (slope, flood control, storage,….).Therefore, it’s really difficult to identify the part of flooding erosion only related to Soil, and find harmonised data allowing comparison and extrapolation.
BRGM RP 53091 84
Assessing the Economic Impact of Soil Deterioration
BRGM RP 53091 85
5 Conclusion
The difficulties encountered in identifying and assessing the impacts of the different soil deterioration causes reflect the late awareness of the actors concerning the true economic issues of the main threats to soil. Existing studies are limited.
All the case studies presented in this report are more or less representative of the European situation summarised below.
The extensive study on erosion spans 17 communities through England and Wales (typical Atlantic climate) since the early 1980s. The cost evaluation was made essentially to estimate on- and off-farm impacts in the short and medium term. Although the figures are given as a combined value, somewhat imprecise, this allows comparisons to be made of the impacts of erosion.
The soil contamination case is representative of this major category of local point source contamination, at a former industrial megasite. Among the millions of contaminated sites identified in Europe, megasites represent just a few hundred or so. In most cases, they are the only ones with off-site effects, generating different types of cost.
Erosion and contamination constitute threats that are studied both in terms of environmental and economic issues. For the other threats identified in the European Communication on Soil Protection, information is lacking.
The salinisation case study is located in one of the European regions affected by this threat, Spain, and is related to extensive irrigation. Unfortunately, there is no detailed study of the extent of the salinisation problem in Europe and the assessment of the economic impacts has been limited to the consequences of the use (and non-use) of irrigation in agriculture.
For Organic Matter loss, the case studies presented from Sweden are related to peat cutting and OM extraction, and not really to OM loss as originally required in this study. The Working Group on Organic Matter of the Soil Protection stated that data on soil fauna and flora, Organic Matter and heavy metals are inadequate at the European level and that it is extremely difficult to assess Organic Matter content (and thus OM losses) at a level broader than the local one. Although peat soils only cover a minor part of the total global land area (about 2.3%), they are estimated to represent as much as 23% of the total organic carbon stock in soils. This case, OM change, could be considered as a hotspot.
The last detailed case study is related to flooding in Italy, in relation to a major climatic event that occurred in 2000. Establishing the part that soil played in the flooding is not easy and highly uncertain. The extent, frequency and severity of the damage are closely related to the actual climatic event. Unfortunately, no figure could be found to evaluate financially the different impacts. Or, no statistics were found to put a cost on the different impacts, and no evaluation of the extent of such threats exists at the European level.
For the cost estimation of each detailed case study, the cost components (on-site private costs of damage – PC, on-site private costs of restoration and repair – RC, off-site social costs – SC, defensive costs – DC and non-user costs – NC) have been highlighted (in blue for each overview). As discussed and agreed in Brussels (11th of February, 2004), the study did not asses the potential benefits that could be made by a direct approach of the costs that soil users would have to bear if the soil quality decreased (in relation to risks) and the damage costs that could be avoided (i.e. human health threats or degradation of ecosystems).
Assessing the Economic Impact of Soil Deterioration
Due to the fact that for certain threats (e.g. erosion, salinisation and, for some aspects, contamination) effects vary from year to year, the impacts of soil degradation have to be evaluated over the short, medium and long term. This is not effectively done in all the cases studied.
Economic study results are also site specific, which implies certain important limitations, hence the precautionary approach suggested.
The environmental and economic indicators elaborated on the basis of the results of the Literature Review (Görlach et al. 2004) proposed a direct and logical link between the two types of indicators. For erosion, contamination and salinisation, environmental indicators can be partly developed with the publicly accessible information. Unfortunately, some of the data necessary to establish the environmental indicators are not yet available on synthetic data sources at the European level.
The current work done under the Soil Protection Strategy will probably lead to proposals of criteria and classes of judgement that could differ from those presented in this report.
Soil quality is commonly seen as all current positive or negative properties (biological, chemical and physical) with regards to soil functions and soil services/potentials/uses (WG Research of the Soil Protection Strategy). Soil quality is commonly viewed as its capacity to perform certain productivity, environmental, and health functions and is closely associated with the notion of resilience, which indicates the ability of a soil to resist adverse changes and to return to its original equilibrium after disturbance. Its assessment is achieved through the identification and measurement of chemical, physical and biological indicators, which are usually connected by simple empirical functions. Soil quality is often seen in relation to the absence or presence of contaminants. However, soil quality is much more significant if we consider salinisation, erosion, organic matter accumulation, sealing, compaction, etc. Therefore, the criteria for defining a good status of the soil will vary depending on the threats and the uses of the soil.
In some cases, such as the hotspot OM case, the benefits generated by the restoration of the area (wetlands) should be considered. Decisions made concerning the reclamation of the area take into account the environmental or societal desire of the restoration of the soil quality.
BRGM RP 53091 86
Assessing the Economic Impact of Soil Deterioration
BRGM RP 53091 87
6 Acknowledgements
The authors would like to thank the different contact points in the different countries for providing all the environmental and economic information, and in particular:
1) the Ministries for Environment / Environment Agencies of:
• Belgium: Victor Dries and Griet Van Gestel,
• Finland: Anna-Maija Pajukallio,
• France: Emmanuel Teys (ADEME Nord-Pas de Calais),
• Germany: Andreas Bieber (Ministry of Environment)
• Ireland: Jane Brogan and Margaret Keegan,
• Italy: Francesca Quercia and Leonello Serva (APAT),
• Netherlands: Onno Van Sannick,
• UK: Peter Redfern,
2) the following experts:
• in France, Yves le Bissonnais, INRA Ardon, Charles Di Luca, DRIRE Nord-Pas de Calais, Emmanuel Teys, ADEME Nord-Pas de Calais, Bertrand Zuindeau, IFRESI,
• in Italy, Luca Guerrieri and Irene Rischia, APAT (Italian Environment Protection Agency), Prof. Guiseppina Crescimanno, University of Palermo,
• in Spain, Juan Herrero-Isern, Agri-research Center of the Goverment of Aragon,
• in Sweden, Lars Lüdin, Swedish University of Agricultural Sciences, and Hjordis Hofroth, Swedish Geotechnical institute,
• in UK, Robert Evans, Anglia Polytechnic University, Mark Kibblewhite, University of Cranfield,
but also:
• at the DG Environment, Claudia Olazabal, Benilde Bujarrabal, for the identification of relevant contacts in some countries and the review of the earlier versions of the report,
• at the European Environment Agency, Ana Rita Gentile, for the updated information on contamination,
• at the Food and Agriculture Organisation of the United Nations, Maryse Finka,
• some of the Soil Protection Strategy Working Groups, in particular: Stephen Northcliff (UK), B. James (France), T. Breure (Netherlands), G. Prokop (Austria), for updating information and providing access to other relevant contacts.
• Members of the Common Forum
Assessing the Economic Impact of Soil Deterioration
7 Bibliography
Albiac, J., and Martínez, Y. 2004. Agricultural pollution control under Spanish and European environmental policies. Paper presented at the Thirteenth EAERE Conference. Budapest. Hungary.
Arnalds, O. and Barkarson B.H., 2003 – Soil erosion and land use policy in Iceland in relation to sheep grazing and government subsidies. Environmental Sciences & Policy, 6, 105 – 113.
CEC, 1985 - Explanatory text and map sheets of the 1: 1.000.000 soil map of the European Communities. Directorate-General for Agriculture. Office for official publications of the European Communities, Luxembourg, Luxembourg.
Cerdan O., Poesen J., Govers G., Saby N., Le Bissonnais Y., Gobin A., Vacca A., Quinton J., Auerswald K., Klik A., Kwaad F.J.P.M., Roxo M.J. 2003. Sheet and rill erosion rates in Europe. In: Boardman, J., Poesen, J. (eds), Soil erosion in Europe. Wiley, Chichester, U.K. in press.
Cerdan O., Poesen J., Govers G., Saby N., Le Bissonnais Y., Vacca A., Quinton J., Auerswald K., Klik A., Kwaad F.J.P.M., Roxo M.J., 2003 - Sheet and rill erosion rates in Europe. GCTE Soil Erosion Network meeting « Soil Erosion under Climate Change: Rates, Implications, and Feedbacks », Tucson, Arizona, USA. November 17-19, 2003. [Oral presentation]
Cerdan O., Gobin A., Govers G., Kirkby M., Le Bissonnais Y., Vacca A., Quinton J., Klik A., Kwaad F.J.P.M., Roxo M.J., Dikau R., 2003 - Long-term soil erosion plot data to evaluate the PESERA (Pan-European Soil Erosion Risk Assessment) approach. EGS-AGU-EUG Joint Assembly Nice, France, 06 - 11 April 2003. [Poster].
Corine (1992). Corine soil erosion risk and important land resources in the southern regions of the European Community, Publication EUR 13233 EN, Luxembourg, 97 pp. + maps.
De Ploey, J., 1989 - A soil erosion map for western Europe. Catena Verlag.
EEA, 1995 - Europe’s environment: The Dobris assessment, European Environment Agency, Copenhagen, Denmark. 676 pp.
EEA, 1998. Europe Environment: the Second Assessment. European Environment Agency. Office for Official Publications of the European Communities; Elsevier Science Ltd.
EEA, 1999. Management of Contaminated Sites in Western Europe. Topic Report n°13/99. European Environment Agency, Copenhagen, Denmark.
EEA, 2001. Europe Environment: the Third Assessment. Environmental Assessment Report n°10. European Environment Agency. Office for Official Publications of the European Communities.
EEA, 2002. Second technical workshop on contaminated sites. Workshop proceedings and follow-up Technical report No 76. European Environment Agency
EEA, 2003 – EIONET questionnaire on contaminated sites. To be published in 2004 on the EIONET website.
EEA-UNEP, 2000. Down to earth: Soil degradation and sustainable development in Europe. A challenge for the 21st century. Environmental issues Series No 6. EEA, UNEP, Luxembourg.
England and Wales Environment Agency, 2002 – Agriculture and natural resources : benefits, costs and potential solutions. May 2002, 85 pages.
BRGM RP 53091 88
Assessing the Economic Impact of Soil Deterioration
BRGM RP 53091 89
European Commission, 2002 – Towards a Thematic Strategy for Soil Protection. Communication from the Commission to the Council, the European Parliament, the Economic and Social Committee and the Committee of the Regions, COM(2002) 179 final, 16.4.2002.
Evans, R., 2002 - An alternative way to assess water erosion of cultivated land - field-based measurements: and analysis of some results. Applied Geography 22, 187-208.
Evans R., 1995a - Assessing costs to farmers, both cumulative and in terms of risk management; downstream costs off-farm. In Oram, T. (ed) Soils, Land Use and Sustainable Development. Proceedings Paper No 2 of the East Anglian Sustainable Agriculture and Rural Development Working Group. Norwich: Farmers' Link, p 19-26.
Evans R., 1990 – Soils at risk of accelerated erosion in England and Wales- Soil use and Management, september 1990, vol.6, n°3, p. 131.
FAO, 1994 – Production yearbook 1993. FAO statistics series n°117, Roma: FAO. 295p.
FAO, 1976 – A framework for land evaluation. FAO Soils Bulletin 32. Rome, 66 pp.
Feijóo, M., Calvo, E. y Albiac, J. 2000. Economic and environmental policy analysis of the Flumen-Monegros irrigation system in Huesca, Spain. Geographical Analysis 32: 5-41.
Ferguson C., Darmendrail D., Freier .K, Jensen B.K., Kasamas H., Urzelai A., Vegter J., 1999 – Risk Assessment for Contaminated Sites in Europe, Vol. 2: Policy Framework – LQM Press, Nottingham, 1999.
Gobin A., Govers G., Jones R., Kirkby M., Kosmas C., 2003 - Assessment and report on soil erosion. Background and workshop report Technical report 94. European Environmental Agency, Copenhagen.
Gorlach B., Landgrebe-Trinkunaite R. Intervies E., 2004 - Assessing Economic Impacts of Soil Deterioration: A Review of the Literature. Study Contract ENV.B.1 / ETU / 2003 / 0024.
Greenland, D. J. and Szabolcs, I., 1994 - Proceedings of the Soil Resilience and Sustainable Land Use Symposium. Greenland, D. J. and Szabolcs, I. (eds), CAB International, 1994.
Herrero, J. y Snyder, R.L. 1997. Aridity and irrigation in Aragon, Spain. Journal of Arid Environments 35: 535-547.
Irish Enviromental Protection Agency – Towards setting environmental quality objectives for soil: developing a soil protection strategy for Ireland; a discussion paper. 2002, ISBN 1-84095-092-7.
Jankauskas B., Jankauskiene G., 2003 – Erosion-preventive crop rotations for landscape ecological stability in upland regions of Lithuania. Agriculture, Ecosystems and Environment 95, 129-142.
Jones R.J.A., Yli-Halla M., Demetriades A., Leifeld J., Robert M., 2004, The status and distribution of soil organic matter in Europe, European Commission, available on the CIRCA website.
Jones, R.J.A., Hiederer, R., Rusco, E., Loveland, P.J. and Montanarella, L. (2004). The map of organic carbon in topsoils in Europe, Version 1 October 2003. Explanation of Special Publication Ispra 2004 No.72 (S.P.I.04.72). European Soil Bureau Research Report No.17.
Le Bissonnais Y. and Daroussin J., 2001 - A pedotransfer rules database to interpret the soil geographical database of Europe for environmental purposes. Proceedings of

Assessing the Economic Impact of Soil Deterioration
the workshop on the use of pedotransfer in soil hydrology research in Europe, Orléans, France, 10–12 October 1996.
Le Bissonnais Y., Cerdan O., Léonard J. 2003. Pan-European soil erodibility assessment. In: Boardman, J., Poesen, J. (eds), Soil erosion in Europe. Wiley, Chichester, U.K. in press.
Le Bissonnais Y, Bruno J-F, Cerdan O, Couturier A, Elyakime B, Fox D, Lebrun P, Martin P, Morschel J, Papy F, Souchère V. 2003. Maîtrise de l’érosion hydrique des sols cultivés : phénomènes physiques et dispositifs d’action. Programme GESSOL, rapport final, Mars 2003.
Ludin L., Lode E. 2004 – Wetland after peat cutting: impacts on water chemistry. Personal communication.
Montanarella L., Jones R.J.A., Heiderer R., 2004 - Distribution of peat and peaty topped soils in Europe. Submitted to International Peat Journal, June 2004.
NL Ministry for Housing, Spatial Planning and Environment – Urban brownfields.
Nogués J., Herrero J., Rodriguez-Ochoa R., Boixadera J. 2000 – Land evaluation in a salt-affected irrigated district using an Index of Productive Potential. Environmental Management, 2000, vol. 25, n°2, p. 143-152.
Oldeman L. R., Hakkeling R. T. A. and Sombroek W. G., 1991 - Glasod world map of the status of human-induced soil degradation (second revised edition), ISRIC, Wageningen, UNEP, Nairobi.
Rijnaarts H., Hoogeveen N., Ter Meer J., Bien J., Wallace S. (2003). Risk Based Management approaches for contaminated Megasites, NICOLE Workshop, Lille, October 2003.
Riksen M.J.M., De Graaff J., 2001 – On-site and off-site effects of wind erosion on European Light soils, Land degradation & development, 12, 1-11.
Van Lynden G. W. J., 1995 - European soil resources, Nature and Environment, No 71. Council of Europe, Strasbourg.
Van Lynden G.W., 2000 - Soil degradation in Central and Eastern Europe: The assessment of the status of human-induced soil degradation. FAO-ISRIC, Rome.
Van der Knijff, J. M., Jones, R. J. A. and Montanarella, L. (1999). Soil erosion risk assessment in Italy, EUR 19044 EN, 52 pp.
Van der Knijff, J. M., Jones, R. J. A. and Montanarella, L. (2000). Soil erosion risk assessment in Europe, EUR 19044 EN, 34 pp.
Veile A., Hasholt B., Schiotz I.G., 2003. Soil Erosion in Denmark: processes and politics. Enviromental Science & Policy, 6, 37 – 50.
Wischmeier W. H. and Smith D. D., 1978 - Predicting rainfall erosion losses — A guide for conservation planning, Agriculture Handbook 537, US Department of Agriculture.
Yassoglou N., Montanarella L., Govers G., Van Lynden G., Jones R. J. A., Zdruli P., Kirkby M., Giordano A., Le Bissonnais Y., Daroussin J. and King D., 1998 - Soil erosion in Europe. European Soil Bureau.
BRGM RP 53091 90

Assessing the Economic Impact of Soil Deterioration
BRGM RP 53091 91
8 APPENDICES

Assessing the Economic Impact of Soil Deterioration
8.1 APPENDIX 1: SIMPLE CASE STUDIES
BRGM RP 53091 92

Assessing the Economic Impact of Soil Deterioration
BRGM RP 53091 93
8.1.1 CASE STUDY / Belgium Contamination 8.1.1.1 Name Kempen, Belgium-Netherlands border
Contamination Case study
8.1.1.2 Contact co-ordinates Wendy Van Dijck ([email protected])
Raf Engels ([email protected])
Griet Van Gestel ([email protected])
Eric Kessels ([email protected])
8.1.1.3 Information 8.1.1.3.1 General Name: Kempen, Belgium-Netherlands border
Location (lat long; map)
Size of the area: 700 km²
Type of threats DPSIR: Contamination/ local pollution affecting a large area
Main actors involved: all possible at local (municipality, industry,…), regional (province of Antwerp and Limburg (FL), Province of Brabant and Limburg (Nl), regional authorities in charge of Human Health, Industry and Environment,….), international (Ministers of Environment Flanders and Nederlands,…)
8.1.1.3.2 Environmental criteria Pre-dominant use(s) of area, population density: agriculture , dispersed habitat - 340 inhabitants per km²
Geographical/Topographical (slope aspect, curvature, orientation; soil category, climate, average rainfall): flat, cold- moderate climate with mild, moist winters, 750 mm/year
Conservation measures (typology, efficiency):
1) restriction of use (information of the populations on the behaviours to be avoided)
2) pilot projects for phytoremediation and immobilisation
Comprehensive description of damages (level of impacts – local, regional, national, time scale):
• contamination impact on soils and on groundwater: soil (Flanders): 280 km² above soil background values, 75 km² above soil standard values (cadmium >3 ppm), 31 km² where cadmium concentration is above 6 ppm and 10 km² above 12 ppm. Several industrial and residential areas are situated in these areas. There are also a huge number of parcels of agricultural land and private gardens.
• For groundwater contamination it can be assumed that at least the same areas are contaminated. Rivers, streams,…have a poor bottom quality in this area.
• Consequences on human health in the population: The maximum permitted load from WHO for Cd is 400-500 µg/person/week. The weekly Cd load in the contaminated area can easily exceed this maximum. Even when the people follow the use restrictions the treshold value of the WHO guideline is easily reached. The EU average of 300 mg is always exceeded. Studies state that the Cd load of the human body of people living in the contaminated area is 30% higher than people of
Assessing the Economic Impact of Soil Deterioration
who are living in reference areas. This can lead to kidney problems, problems with the Cd metabolism and osteoporosis.
Description of event generating the threats:
1) atmospheric emission from the industrial Zn production since the second half of the nineteenth century. Cd, Zn and Pb were spread in huge amounts to the environment.
2) Use of slags for paving roads and drives
Vulnerability of area: medium for the groundwater resources in the area (secondary contamination). Important for soils.
8.1.1.3.3 Economics Costs of preventive measures:
Immobilisation of contamination in the schoolyard with Berengiet,…
Costs of suffered damages:
Impact of the contamination on the real estate values in proximity,…(-10% as an average).
Costs of monitoring:
Medical follow-up of the population (Cadmibel, Pheecad =finished projects)
Survey of the agriculture productions (kidney and muscles of the animals (meat) = project is still going on, vegetables = finished project, …).
Costs of remediation / clean up, etc (protective measures):
Detailed risk assessment on the site (impact on groundwater and human health)
Detailed risk assessment in the surroundings of the site.
Methodology for costs estimation, «non-used values», link between soil impact and economic uses?
Sources of information: see references.
Who bears the costs (affected sectors)
Industry co-operates with the relevant authorities for the prevention, recovery of suffered damages, monitoring and reclamation, off-site costs. Industry also co-finances investigations on contaminated land management options.
In other cases the costs are covered by the owner, e.g. the Zn industry, for the investigations on their sites
8.1.1.3.4 References / Bibliography Lauwerys R., Amery A., Bernard A. Et al (1990) Health effects of environmental exposure to cadmium: objectives, design, and organisation of the Cadmibel Study: a cross-sectional morbidity in workers exposed to cadmium, Environ Health Perspect.
Draye A., Thewys T. Et Al. (2000) Economic benefits of soil remediation, Department Economy and Law, LUC.
BRGM RP 53091 94

Assessing the Economic Impact of Soil Deterioration
BRGM RP 53091 95
8.1.2 CASE STUDY / Finland Contamination 8.1.2.1 Name Arabianranta (Arabia waterfront) -project, Helsinki
8.1.2.2 Contact coordinates Heikki Somervuo, City Council of Helsinki
Eija Kivilaakso, City Planning Department of Helsinki
Anni Bäckman, City of Helsinki, Real Estate Department
Antti Salla, Environment Centre of Helsinki City
Anna-Maija Pajukallio, the Ministry of Environment
8.1.2.3 Information 8.1.2.3.1 General Name: Arabia waterfront
Location (lat long, map): city of Helsinki, Arabianranta (Arabia waterfront), residential development area near the city centre (about 5 km).
Figure 13. Location of Arabianranta
Size of the area: The size of the total project area is about 85 ha. The area where remediation actions have to be considered is about 55 ha. Arabianranta is going to be one of the most important new residential areas of Helsinki. Arabiaranta's construction project started in the year 2000 and the whole area is estimated to be ready by 2010. Geotechnical matters and contaminated soil issues have made this project especially demanding.
Type of threats DPSIR: contamination. Local source.
Main actors involved: The city of Helsinki is the main landowner of the Arabianranta project area. The project was there fore adopted by the City Council of Helsinki in order to develop Arabianranta within a few years as a residential neighbourhood, by co-ordinating the area's planning and building. The inner co-operative organisations are the city leadership and almost all the city offices and institutes, particularly Helsinki City Office, City Planning Department and Public Works Department. Other notable collaborators are residents, future residents, developers with lot reservations, contractors, planners, different governing agencies and media. Arabianranta project also works closely together with Art and Design City Oy, University of Art and Design and some private companies and with community organisations in the area.
8.1.2.3.2 Environmental criteria Pre-dominant use(s) of area, population density: industrial area with ceramic factory, stockholding businesses, timber yard, transport companies etc. The contamination is

Assessing the Economic Impact of Soil Deterioration
however mainly related to the dumping of heterogeneous soil material when the area was reclaimed from the sea by filling.
Geographical/Topographical (slope aspect, curvature, orientation; soil category, climate, average rainfall): flat area at the seashore (land reclaimed some decades ago from the sea), Nordic climate
Conservation measures (typology, efficiency): Part of the project-area is relict area (idle land), part has still industrial land use. Remediation is required before land use is changed. Remediation of the area has partly been already finished; partly it is still under planning. Some of the residential houses have already been built.
Comprehensive description of damages (level of impacts – local, regional, national, time scale), [cf. list of pre-selected indicators]: contamination by heavy metals (mainly Zn and Pb), PAHs and mineral oils. No contamination of the groundwater resources (groundwater is under a clay layer which has prevented the contamination).
Description of event generating the threats: see above
Vulnerability of area: high due to the new residential land-use
8.1.2.3.3 Economics Costs of preventive measures: -
Costs of suffered damages: -
Costs of monitoring: - (mainly only basic surveys)
Costs of remediation / clean up, etc (protective measures):
Overall cost of the redevelopment project (investments) is about 120 M€.
The overall cost of remediation and pre-construction of the area is estimated to be about 42 M€. It’s somewhat difficult to estimate the portion of remediation, because remediation and pre-construction actions are closely linked and there are some overlaps, but it is estimated to be about 20 – 30 %.
Remediation was and will be based on site-specific risk analysis:
Soil contaminated with organic compounds has been/will be excavated.
Soil contaminated with heavy metals is /will be mainly covered with 0,5 - 1 m layer of clean soil or it is isolated with concrete slap. Some hot spot areas are excavated. Concrete slap is not used because of the contamination but because of the geotechnical reasons, but it serves also as an isolation method.
Costs for purchasing the site at the end of the activity: the City of Helsinki is going partly to rent and partly to sell the remediated and geotechnically pre-constructed areas.
Estimated income for the city for renting the real estates is going to be about 3,5 M€ / year (16 €/gross floor m2/year for residential buildings) end for selling the real estates about 25 M€ (550 - 1000 €/gross floor m2)
Methodology for costs estimation, «non used values», link between soil impact and economic uses: A special study about economic assessment (including also the remediation costs) of the Arabianranta was made by the Technical Research Centre of Finland.
Sources of information:
Who bears the costs (affected sectors):
The city of Helsinki will pay most of the redevelopment costs including soil remediation. The sum collected form the former polluters will be in this case minor.
BRGM RP 53091 96

Assessing the Economic Impact of Soil Deterioration
BRGM RP 53091 97
The future gross floor area is almost 500,000 m2 including housing and business buildings. The number of inhabitants is going to be about 7,000.
Figure 14. Future Arabianranta
8.1.2.3.4 References / Bibliography Many reports produced by the city of Helsinki, published only in Finnish. Further information can be gathered from above-mentioned contacts.

Assessing the Economic Impact of Soil Deterioration
8.1.3 CASE STUDY / Finland Contamination 8.1.3.1 Name Old petrol station – Juankoski – County of Eastern Finland - Finland
8.1.3.2 Contact co-ordinates SOILI-programme / Kati Valkama, Oil industry service centre and Merja Huhtala, Oil Pollution Fund
8.1.3.3 Information 8.1.3.3.1 General Name: Old petrol station – Juankoski – County of Eastern Finland - Finland
Location (lat long; map): x = 6 996 680, y = 3 567 500, address is Juankoskentie 14; The town of Juankoski is situated 450 km northeast from Helsinki
Size of the area: 5000 m2
Type of threats (DPSIR): contamination
Main actors involved:
SOILI-programme / Kati Valkama, Oil industry service centre and Merja Huhtala, Oil Pollution Fund
North Savo Regional Environment Centre, Lea Koponen
Town of Juankoski, Hemmo Kauppinen
8.1.3.3.2 Environmental criteria Pre-dominant use(s) of area, population density: There has been a petrol station from 1970's to 1990's and a shop. The petrol station had three under ground storage tanks and one above the ground. Also there has been a place for washing cars and a service pit (I'm not sure what is a correct translation, I mean a hole / excavation in the ground and you can drive your car above it and repair it). As far as is known there have been no oil accidents in the area of this real estate.
Currently the area is a parking place and there is also a collecting place for different kind of re-usable wastes. The area is in the middle of a densely populated area of Juankoski. Juankoski is a town of nearly 6,000 inhabitants. The total area of Juankoski is 580 km2, of which 120 km² is covered by the waterways. In the town of Juankoski there are three densely populated areas: Juankoski, Muuruvesi and Säyneinen.
Geographical/Topographical (slope aspect, curvature, orientation; soil category, climate, average rainfall): flat, soil type is sand, inland, Nordic conditions.
Conservation measures (typology, efficiency): -
Comprehensive description of damages (level of impacts – local, regional, national, time scale):
Soils were excavated in the area of 308 m2 and total amount of soils was 810 m3, it was calculated that the excavated soils contained around 700 kg petroleum hydrocarbons, mainly diesel and lubricating oil, highest concentration that was measured during the remediation was 5600 mg/ kg,
1) Consequences on human health in the population: -
2) Consequences on workers human health / Number marked inaptitutes with work -
Description of event generating the threats: soil was contaminated during the operation of the petrol station
BRGM RP 53091 98
Assessing the Economic Impact of Soil Deterioration
BRGM RP 53091 99
Vulnerability of area: The real estate is situated in middle of densely populated area, the nearest house is only 20 m away from the border line of the real estate, soil type is sand, 150 m East from the estate is small pond, no groundwater was found in the depth of 6,5 meters (ground water monitoring well)
8.1.3.3.3 Economics
Costs of preventive measures: -
Costs of suffered damages: -
Costs of monitoring: -
Costs of remediation / clean up, etc (protective measures): total amount of remediation cost is 53,680 € (44,000 € + value-added tax 22%). This amount doesn't contain administrative costs. There has been sometimes used a calculated estimate that is 8% of the total amount of remediation costs.
Methodology for costs estimation, «non-used values», link between soil impact and economic uses: -
Sources of information: -
Who bears the costs (affected sectors): Oil Pollution Fund pays all the costs.
SOILI-programme is a remediation programme that aims to remediate soil and groundwater in the estates of the former petrol stations.
The programme takes care of the whole remediation project. The programme is constituted on the agreement that is made between Oil Industry Service Centre, oil companies, Ministry of the Environment and Association of Finnish Local and Regional Authorities. Period for applying in to the programme continues until the end of year 2005. This programme remediates two kinds of sites:
The real estates that belong to the companies that are involved in SOILI-programme. The action has ended or will end within a year after the estate has been accepted in the programme.
Ownerless estates are those where it is not possible to say who is the polluter or otherwise liable to remediate the site or if the liable one is unable to pay the remediation or the remediation cost are unjust / unfair to present owner. Ownerless estate remediation is paid by the Oil Pollution Fund. This fund is taken care be the Ministry of the Environment and it is not included in the state budget. The funds are gathered by collecting a fee / charge from all the oil transportation that are imported or transported trough Finland. The fee is 60 €cent per ton of oil.
So far SOILI-programme has received 498 remediation applications and 233 of them are ownerless sites. Remediation measures have been completed on around 200 sites.
8.1.3.3.4 References / Bibliography Many reports produced by the city of Helsinki, published only in Finnish. If you like to have more information, please make contact to above-mentioned persons.

Assessing the Economic Impact of Soil Deterioration
8.1.4 CASE STUDY / Central Italy Floodings 8.1.4.1 Name Elba Island, September 2002 Flood
8.1.4.2 Contact co-ordinates Irene RISCHIA, APAT
e-mail: [email protected] 8.1.4.3 Information 8.1.4.3.1 General Location (lat long; map)
UTM 32: X between 590,200 and 617,770; Y: between 4,730,000 and 4,750,000
Co-ordinates are projected in the UTM system.
Size of the area: about 265 km2
Type of threats DPSIR
Driving Forces and Pressures:
Intense rainfall, intense linear erosion, high value of rivers discharges, increased urbanisation and high density of tourist structures in high-risk areas
State: floods, landslides (blocks flow, slides, soil slip), intense linear erosion, soil erosion
Impacts: destruction of buildings, infrastructures, and agricultural areas;
Responses: Emergency measures aimed at a first aid affected population and a fast reconstruction of primary infrastructures; Planning measures to prevent future catastrophic events.
Main actors involved:
Civil Protection Department of Italy; Regional Authorities of Toscana; Firemen; Local Authorities (Municipalities); Comunità Montana dell’Isola d’Elba (Elba Island authority for the management of mountain/forest areas and environmental resources); Italian Agency for the Environmental Protection and Technical Services and Regional Environmental Agencies
8.1.4.3.2 Environmental criteria Pre-dominant use(s) of area: Tourist structures and buildings, agriculture, breeding, forests, urban areas Population density: 111 per km2 This value is the average population density over the Communes affected by the flood
Geographical/Topographical Slope aspect: A large part of the island is a hilly area, excepted Capanne mountain (1,019 m). Generally, morphology is characterised by alternation of low slope areas and rough mountain ridges increases of slopes and deep and narrow valleys. In correspondence of the two main river basins, Fosso della Madonnina and Fosso della Galea-Pila, there are flat areas. Along the cost subvertical cliff and sandy shores are alternated. Orientation: River drainage networks has not a specific orientation
Soil category:
BRGM RP 53091 100
Assessing the Economic Impact of Soil Deterioration
BRGM RP 53091 101
All soils are typical of humid Mediterranean climates. In particular, there is a large amount of granular and silty debris on the lithic substratum.
Climate: Mediterranean humid
Average rainfall:
Average annual rainfall is about 1,000 mm/year. Rainfall that triggered the flooding event is about 215-230 mm (over 20 mm/hour)
Conservation measures (typology, efficiency):
Structural measures (engineering works): rather dams along some main rivers.
Comprehensive description of damages (level of impacts – local, regional, national, time scale):
High impact on tourist structure and main roads that have been destroyed. A large part of the stream rivers overflowed. The level of impact is regional.
Description of event generating the threats:
On 4th and 10th September 2002 intense rainfall hit the northwestern Tyrrenian Basin, and in particular the Elba Island (up to 200 mm in 10 hours). As a result, in the mountainous and hilly areas gravitational phenomena occurred (debris flows, mud flows, traslational slide, soils slips), related to increase of linear erosion along the stream rivers. In the alluvial plains the major rivers overflowed and inundated wide areas where tourist buildings (camping, hotel, etc.) and beaches are located.
Vulnerability of area:
Vulnerability of the area is mainly related to the presence of a great number of tourist structures and buildings, especially along the coast. High vulnerability is also related to the roads and to the agricultural and pastoral activities.
8.1.4.3.3 Economics Costs of preventive measures:
After the alluvial flood of September 2002, the Ministry for the Environment, on the basis of laws 183/89 and 198/98, financed structural works in order to realise preventive measures and ordinary maintenance at the scale of the river basins of the Elba Island. In particular, works regard hydraulic and forest works, adaptation of hydraulic sections of the rivers and stabilisation of riversides. These works will be realised in the localities of Rio dell’Elba, Marciana, Porto Azzurro and Porto Ferraio for a total amount of 14.3 M€.
Costs of suffered damages:
Following the alluvial flood of September 2002, the Ministry for the Environment emanated the decrees DEC/DT/2002/0242 and D.M. 23/12/2002, in order to support costs for reconstruction works: for a total amount of over 10 M€. These works consist of hydraulic and forestall engineering structures adaptation of hydraulic sections of rivers and stabilisation of riversides and slides and interested a large part of the localities and of the territory of the island.
Costs of monitoring: Not available data
Costs of remediation/clean up, etc (protective measures): Not available data in detail. This is an institutional task of Civil Protection Department of Italy
Methodology for costs estimation, «non used values», link between soil impact and economic uses: Not available data
Sources of information:
Assessing the Economic Impact of Soil Deterioration
Department of Soil Defense, Ministry for the Environment and Territory, Department of Civil Protection
Who bears the costs (affected sectors):
Emergency measures: Civil Protection Department of Italy, under Emergency Government Provision, supplies Regions with needed funds.
Preventive measures: Civil Protection Department of Italy, under specific Dispositions; Ministry for the Environment and Territory, which co-ordinates the planning for the reduction of flood phenomena in agreement with River Basin Authorities and supports specific programs for structural works.
8.1.4.3.4 References / Bibliography Le attività emergenziali APAT in seguito ad eventi alluvionali e sismici, rapporti APAT 35/2003
BRGM RP 53091 102

Assessing the Economic Impact of Soil Deterioration
BRGM RP 53091 103
8.1.5 CASE STUDY / Italy Salinisation 8.1.5.1 Name Delia Nivolelli Salinisation Case
8.1.5.2 Contact coordinates Prof. dr Giuseppina Crescimanno
Università di Palermo
Dipartimento ITAF-Sezione Idraulica
Viale delle Scienze 13- 90128 Palermo, Italy
e-mail: [email protected]
8.1.5.3 Information 8.1.5.3.1 General Name : Delia Nivolelli Irrigated Area in Delia-Nivolelli Catchment
Location (lat long; map): Mazara del Vallo (Sicily) about 37° 40’ 00’’ N – 12° 40’ 00’’ E
Size of the area: about 6000 ha (60 Km2)
Type of threats DPSIR: Soil salinisation due to irrigation with saline waters
Main actors involved: farmers, association of farmers; Consorzio irriguo Trapani 1
8.1.5.3.2 Environmental criteria Pre-dominant use(s) of area, population density: Agriculture, resident population: less than 15 persons per km2, working people: more than 100 persons per km2
Geographical/Topographical (slope aspect, curvature, orientation; soil category, climate, average rainfall): average slope: less than 10%; hilly; soil (USDA 1999): Lithic Xerothens, Typic Chromoxerert, Vertic Xerichrept, Vertic Xerofluvent; climate: xeric-Mediterranean: average rainfall: less than 600 mm/year
Conservation measures (typology, efficiency): No conservation or remediation measures are adopted
Comprehensive description of damages (level of impacts – local, regional, national, time scale):
Reduction in crop yields with considerable economic lost and social impact on local communities.
Description of event generating the threats: geological characteristics of soil, high salinity of irrigation water, mismanagement of irrigation and lack of drainage systems in clay soils
Vulnerability of area: high (during three-year monitoring desertification of some lands and abandonment of many cultivated fields was observed in the study area)
8.1.5.3.3 Economics Costs of preventive measures: proper irrigation systems and drainage systems: 6,000 €/ha;
Costs of suffered damages: reduction of crop production ranging between 10% and 30%
Costs of monitoring: 75 €/ha year
Costs of remediation / clean up, etc (protective measures): drainage systems and strategies for salt-leaching: 4,500 €/ha

Assessing the Economic Impact of Soil Deterioration
Methodology for costs estimation, «non used values», link between soil impact and economic uses?
Sources of information?
Who bears the costs (affected sectors):
The farmers should bear the costs, sometimes with subsidies from Assessorato Agricoltura e Foreste (Regione Siciliana)
8.1.5.3.4 References / Bibliography Crescimanno, G. - An integrated approach for sustainable management of irrigated lands susceptible to degradation/desertification. Final Report ENV7-CT97-0681. April 2001.
BRGM RP 53091 104
Assessing the Economic Impact of Soil Deterioration
BRGM RP 53091 105
8.1.6 CASE STUDY / Netherlands Contamination 8.1.6.1 Name Ceramique Maastricht
8.1.6.2 Contact co-ordinates Onno Von Sannick, NL Ministry for Housing, Spatial Planning and Environment
J. Notten, Project Bureau at the Maastricht Municipality
8.1.6.3 Information 8.1.6.3.1 General Name: Ceramique Maastricht
Location (lat long; map): city of Maastricht, at the edge of the downtown Maastricht (between the historic quarter of Wyck and the new Randwyck commercial centre).
Size of the area: 23 ha
Type of threats DPSIR: contamination
Main actors involved: NL Ministry for Housing, Spatial Planning and Environment, Municipality, Province of South Lindburg, Ministry for Interior.
8.1.6.3.2 Environmental criteria Pre-dominant use(s) of area, population density: Urban area,
Geographical/Topographical (slope aspect, curvature, orientation; soil category, climate, average rainfall): flat area.
Conservation measures (typology, efficiency): /
Comprehensive description of damages (level of impacts – local, regional, national, time scale), [cf. list of pre-selected indicators]: contamination by heavy metals bounded to the glazing of the fragments of ceramic mixed to soil (constituting the surface of the Ceramique Site). No contamination of the groundwater resources (not leaching of the heavy metals from the ceramic fragments).
Description of event generating the threats: mixture of ceramic fragments and soil. Industrial activity since the middle of the last century, up to 1990.
Vulnerability of area: high due to the urban planning projects in the area.
8.1.6.3.3 Economics Costs of preventive measures:
Costs of suffered damages:
Costs of monitoring:
After care plan still needs to be detailed?
Costs of remediation / clean up, etc (protective measures):
Overall cost of the redevelopment project: 900 MNLG = 408.4 M€.
Costs for purchasing the site at the end of the activity:
Costs for clean-up using a function-oriented approach: 6.8 M€
presence of a buffer layer between the contaminated soil and human activity – 1,40 m in depth laid on public spaces:
remediation of soil to an acceptable level which safeguards public health for the soil under buildings and car parks.

Assessing the Economic Impact of Soil Deterioration
Methodology for costs estimation, «non used values», link between soil impact and economic uses:
Sources of information:
See references.
Existence of Government grants for urban regeneration:
BELSTATO urban renewal fund = approximatively 363 M€ per year available over the period 1990 – 2005
Intrafonds of the Ministry of Transport, Public Works and Water Management, and the VINEX covenants = approximatively 408.4 M€ budgeted for 1995 – 2005 for contaminated land.
Soil Protection Act including provisions relating to the costs of the cleaning up contaminated land, around 227 M€ / year.
Who bears the costs (affected sectors):
Public (grants, landfilling support, construction of buildings) and private in relation with the project of redevelopment of the site including:
1,600 homes,
70,000 m2 (gross floor area) office and other establishments,
20,000 m2 hotel accommodation,
20,000 m2 for cultural and other non-commercial purposes,
5,000 m2 for catering and retail,
4,400 parking spaces (the majority underground/covered),
supra-local facilities, such as a bridge over the river Maas for pedestrians and cyclists, a market hall and various traffic access schemes.
Using the ABP pension fund, in consultation with the municipality of Maastricht, with three property developers.
A public-private-partnership (PPP), sharing financial risks associated with the project, has been set. Its main features are as follows:
acquisition of the necessary land and premises,
agreements relating to the legal aspects of the project,
establishment of the financial framework for the exploitation of the site,
laying the necessary building site infrastructure,
execution of the construction work,
agreements on the apportionment of risks and responsibilities.
Distribution of fundings:
Central government: 9 M€ for subsiding large-scale construction projects,
Province: 6.8 M€ for restructuring / redevelopment,
Ministry of the Interior: 5 M€ in the framework of the 1994 employment initiative.
Municipality of Maastricht: 9.4 M€ + 22.7 M€ for the construction of the library and municipal buildings.
8.1.6.3.4 References / Bibliography
NL Ministry for Housing, Spatial Planning and Environment – Department for Urban brownfields;
BRGM RP 53091 106

Assessing the Economic Impact of Soil Deterioration
BRGM RP 53091 107
8.1.7 CASE STUDY / Sweden Landslides 8.1.7.1 Name Landslide in Vagnhärad, Sweden
8.1.7.2 Contact Hjördis Löfroth
Swedish Geotechnical Institute
SE-581 93 Linköping, Sweden
Phone: +46 13 20 18 00
E-mail: [email protected]
8.1.7.3 Information 8.1.7.3.1 General Name: Landslide in soft clay at Vagnhärad, Sweden.
Location: In the community of Vagnhärad (Trosa), province of Sörmland, about 70 km southwest of Stockholm.
Size of the area: The slide covered a 200 m stretch along the river and reached 60 m up the bank.
Type of threats DPSIR: Landslide. The need for development of new residential areas led to use of land not fully suitable for this purpose. After the slide, 29 properties in the risk zone were demolished, the slide area was reinforced and to four of the properties in the risk zone families could return.
Main actors involved: The community of Trosa (incl. Vagnhärad), The Fire and Rescue Services Agency, The Swedish Geotechnical Institute, and others as insurance companies, consulting companies, construction companies etc.
8.1.7.3.2 Environmental criteria Pre-dominant use(s) of area, population density, Geographical/Topographical (slope aspect, curvature, orientation; soil category, climate, average rainfall), Conservation measures (typology, efficiency), Comprehensive description of damages (level of impacts – local, regional, national, time scale), [cf. list of pre-selected indicators], Description of event generating the threats, Vulnerability of area. See description below:
The residential area of Vagnhärad known as Ödesby was developed in the mid-70s. The plan for building for Ödesby, recommended that the area should be built by one-family houses. In the plan for building it was suggested that the area should be built with 45 one-family houses and that the houses should only be built as one-storey houses.
During the night of 22/23 May 1997, a landslide occurred in this area. The landslide was the largest in a populated area in Sweden since the mid-70s. The landslide took place in a clay slope and covered a 200 m stretch along the river and reached 60 m up the bank. It displaced the course of the river by 15 m, raised the ground surface at the original position of the river by two metres and lowered the surface along the upper edge of the slide by five metres. The slide followed a smaller movement within a limited area along the river. No one was severely injured, but three houses were destroyed and several others damaged or undermined. A total of 33 properties were judged to be in the risk zone for further slides and the railway on the other side of the Trosa river was temporarily closed. Nearly 100 persons were evacuated after the slide.
Assessing the Economic Impact of Soil Deterioration
The slide area consisted of a long slope with soft clay leading down to the river. The total difference in height between the top of the slope and the ground surface at the toe of the slope was approximately 15 m. The depth of the river increased the difference by a further two metres. Within the populated part of the area, the natural ground surface prior to development had had an inclination of 1:12. On the steepest sections between the houses on the road closest to the river and the river, the inclination was, however, 1:5. The thickness of the clay varied from about 1 m in the upper part of the slope to 10-14 m on the lowest parts. The clay lay on top of a layer of friction soil. Higher areas of rock and sandy gravel in the surroundings act as infiltration zones, i.e. areas where rainwater can penetrate beneath the clay. In the slide area and adjacent areas, the clay formed an impervious lid over the friction soil.
The period before the slide, there was unusually heavy rain for the season. A comparison with a normal year show that the accumulated precipitation during the period 1st January to 31st May 1997 was 180 mm compared to 159 mm a normal year. Measurements indicate that the water pressure in the lower parts of the slope was artesian. The groundwater levels were also higher than normal for the particular period. The pressure level in the friction soil was about two metres above the ground surface by the river.
A study (Andersson et al., 1998) concludes that the main cause of the slide was that the slope was so stressed that even very small changes in the conditions could result in a slide. The factors that triggered the slide at just that point in time may have been:
Heavy rain for the season, which increased pore pressures
Erosion and small, local slides along the river
Large and repeated ground movements, which reduced strength
Low water level in the river over a period of time
Increased pore pressures due to heavy rain in combination with water leakage
The most probable cause is a combination of two or more factors.
8.1.7.3.3 Economics Costs of preventive measures. Costs of suffered damages. Costs of monitoring. Costs of remediation / clean up, etc (protective measures). Methodology for costs estimation, «non used values», link between soil impact and economic uses.
It has not been possible to receive the costs for the whole landslide incident exactly in the way presented above. The presentation is made the way the information has been obtained.
Costs during the ”Rescue service phase”: 3.3 MSEK (approximately 0.36 M€).
Costs of remediation / clean up, etc (protective measures): 26.0 MSEK (approx. 2.83 M€).
Costs of redemption of properties: About 46.8 MSEK for a total of 29 properties (approx. 5.08 M€)
Sources of information: The Community of Trosa (incl. Vagnhärad), The Swedish Rescue Services Agency, Trygg Hansa (Insurance Company)
Who bears the costs (affected sectors): The Swedish Rescue Services Agency, The Community of Trosa (incl. Vagnhärad) and Insurance companies.
8.1.7.3.4 References / Bibliography Andersson H, Bengtsson P-E, Berglund C, Larsson R, Sällfors G and Öberg-Högsta A-L (1998). The landslide at Vagnhärad. (Skredet i Vagnhärad, Teknisk/vetenskaplig
BRGM RP 53091 108

Assessing the Economic Impact of Soil Deterioration
BRGM RP 53091 109
utredning om skredets orsaker) Report No. 56, Swedish Geotechnical Institute, Linköping, Sweden (125 p) (in Swedish).
Andersson, H, Bengtsson, PE, Berglund, C, Larsson, R, Sällfors, G, Öberg-Högsta, AL (2000). Landslide at Vagnhärad in Sweden, International symposium on landslides, 8, Cardiff, Proceedings, vol. 1 (6 p).
Löfroth, H and Kjellberg, U. (2003). The May 1997 landslide in soft clay at Vagnhärad, Sweden. NEDIES Project - Lessons Learnt from Landslide Disasters in Europe. Report € 20558 EN. Ispra, Italy. (8 p)
Swedish Rescue Services Agency. (1998). Large accidents – The Landslide at Vagnhärad 23 May 1997, observation report (Stora olyckor – Skredet i Vagnhärad 23 maj 1997). Karlstad, Sweden (31 p) (in Swedish).

Assessing the Economic Impact of Soil Deterioration
8.2 FLOODING / NORTHERN ITALY
This case study deals with the flooding of large areas of northern Italy in October 2000.
8.2.1 Case study description - local conditions
In October 2000, a serious climatic event hit the northwestern part of Italy. Numerous landslides from the Alps generated floods in the valleys, in particular in the sector bounded by the Ticino River, the first part of the Po River and the whole of the Valle d’Aosta (basins of Toce, Sesia, Orco, Stura di Lanzo, Dora Baltea, Dora Riparia and Pellice).
The rainfall event that triggered the flood was of the order of 400 - 700 mm in 80 hours (average annual rainfall range between 1,000 mm/year in the lower areas and 1,600 mm/year in the mountainous areas). This was coupled with an increase in temperature leading to substantial snow melting.
The effects on this area, used essentially for human activities, have been totally devastating, recalling the necessity of reviewing the relationship between human activities and its environment, in particular the urban area management plans and emergency intervention plans.
In Italy, this type of event is well known. The country has regularly faced events of similar magnitude:
in 1994 in Piemonte,
in 1996 in Versilia,
in 1998 in Sarno,
in 1999 in Cervinara and Calabria.
8.2.1.1 Soils The October 2000 flood affected a huge area of northern Italy (see Figure 8) that is characterised by a wide variety of geological and geomorhpological types and, as a consequence, by a great number of different soil types.
In order to describe roughly the main types of soil affected by the flood it is necessary to distinguish two major environments:
Alluvial plains of the Po River and tributaries (primarily in Piemonte, Lombardia): flat areas widely inundated, with peak discharges lasting for a number of days, but relatively slow rising water levels. Topsoils, generally very young (Entisoils), are developed on unconsolidated gravels, sands, silts and clays in fluvial and subordinately lacustrine facies. On the contrary, more developed soils (for example Cambic soils) located on terraced surfaces have not been affected by the flood.
Upstream sectors of the Po River and tributary drainage networks (primarily in Valle d’Aosta and Piemonte, locally in Liguria and Lombardia): in this mountainous environment, characterised by narrow valleys and steep slopes, numerous landslides were reactivated and new gravitational phenomena occurred. Landslides occurred along steep slopes in the surface weathered portion of metamorphic bedrock, breccias and conglomerates in morenic and colluvial facies. Along lateral stream networks this instable material has been in part remobilised by debris flows and mud flows, which became mixed with unconsolidated gravelly and fine-grained fluvial sediments. These phenomena have killed 26 people due to their extreme rapidity, which limits the efficiency of warning procedures and emergency actions. It is important to outline the presence of ancient deposits relating to previous debris
BRGM RP 53091 110
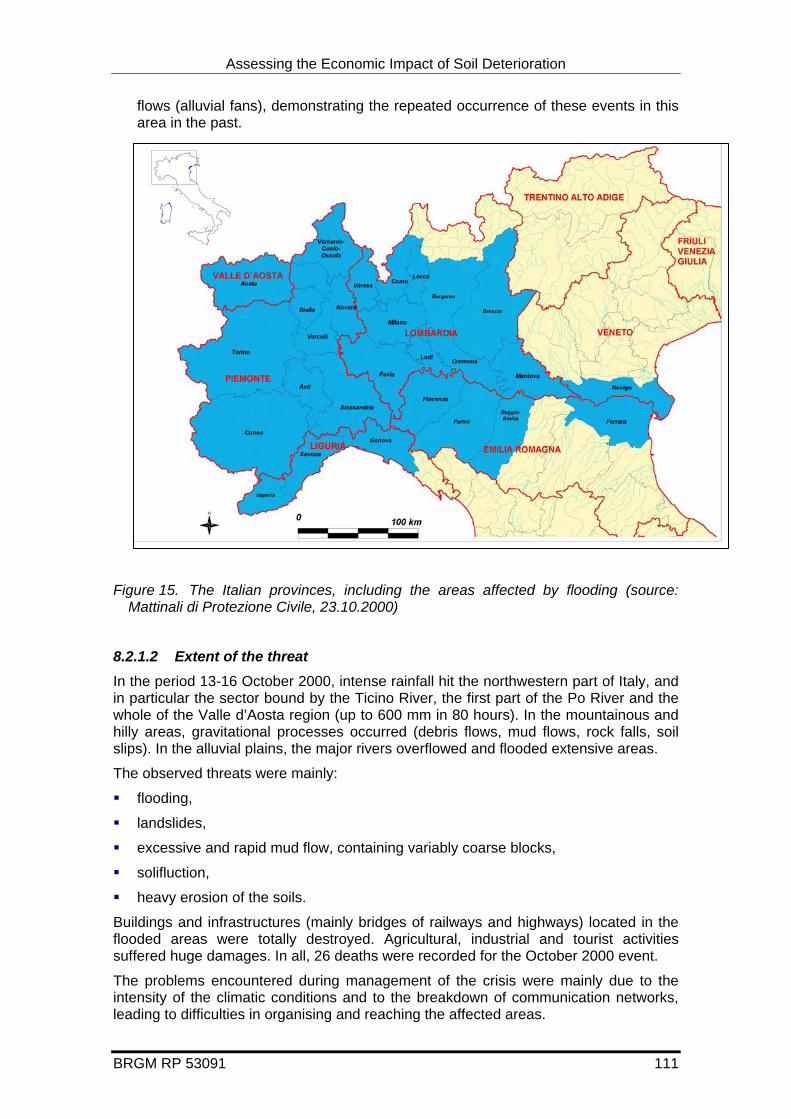
Assessing the Economic Impact of Soil Deterioration
BRGM RP 53091 111
flows (alluvial fans), demonstrating the repeated occurrence of these events in this area in the past.
Figure 15. The Italian provinces, including the areas affected by flooding (source: Mattinali di Protezione Civile, 23.10.2000)
8.2.1.2 Extent of the threat In the period 13-16 October 2000, intense rainfall hit the northwestern part of Italy, and in particular the sector bound by the Ticino River, the first part of the Po River and the whole of the Valle d’Aosta region (up to 600 mm in 80 hours). In the mountainous and hilly areas, gravitational processes occurred (debris flows, mud flows, rock falls, soil slips). In the alluvial plains, the major rivers overflowed and flooded extensive areas.
The observed threats were mainly:
flooding,
landslides,
excessive and rapid mud flow, containing variably coarse blocks,
solifluction,
heavy erosion of the soils.
Buildings and infrastructures (mainly bridges of railways and highways) located in the flooded areas were totally destroyed. Agricultural, industrial and tourist activities suffered huge damages. In all, 26 deaths were recorded for the October 2000 event.
The problems encountered during management of the crisis were mainly due to the intensity of the climatic conditions and to the breakdown of communication networks, leading to difficulties in organising and reaching the affected areas.
Assessing the Economic Impact of Soil Deterioration
The main impacts were:
loss of human life (26 casualties);
damage to buildings and infrastructures (bridges, railways, roads), some being totally destroyed;
loss of soil and yield for the agricultural sector;
loss of industrial production;
reduced tourist activity;
8.2.2 Conservation measures
There are two types of conservation measures:
Structural measures (engineering works): dams, reservoir and retarding basins, channel and catchment modifications, levee-banks, flood proofing. Where these measures are widely applied, the impact of flooding can be significantly reduced. However, structural measures can be very costly and have a significant impact on the environment.
Non-structural measures are any procedure altering the exposure of lives and properties to flooding, such as flood forecasting and warning, flooding insurance, planning controls, public information and education, etc.
Most of the funding necessary for the structural measures are covered by the national budget, mainly by the Civil Protection Department of Italy.
8.2.2.1 Committed actions by ANPA (now APAT) During the crisis, the Italian Agency for Environmental Protection (ANPA) intervened within the framework of its institutional competencies, in co-operation with the local Civil Safety Operational centres in the Valle d’Aosta and Piemonte regions to support technically and scientifically the Civil Protection Authorities with:
prioritisation of the most affected areas;
identification of the areas presenting high technological risks;
mapping of the landslide zones, with identication of the causes, mechanisms and assessment of the results, by individualising the situation at the residual risks.
8.2.3 Economic damages and costs
Again, this was a specific situation due to the severe climatic conditions leading to landslides and flooding. It was not possible to separate the costs related to individual threats.
Most of the costs for prevention measures, monitoring and interventions during the critical phase were covered by the Civil Protection Department of Italy (institutional task funded by the national budget).
Some of the costs have been identified but not quantified during the study, due to the huge number of actors (industries, municipalities, population, insurance companies). For this particular type of threat, all types of cost have to be accounted for, but are not available in a separate calculation.
8.2.3.1 Costs of preventive measures
The main part of the annual government investment to prevent flooding is provided by the Civil Protection Department (these data are not available).
BRGM RP 53091 112

Assessing the Economic Impact of Soil Deterioration
BRGM RP 53091 113
Moreover, the Ministry for the Environment supports structural works coupled with preventive measures at the scale of the river basin (River Basin Plans (law 183/89 and 267/98). The amount of these investments changes every year. Recent national programmes of investments for the mitigation of flooding and landslide risk are reported in the following table 21:
Table 44. Recent programmes of investment for the mitigation of flooding and landslide risk supported by the Ministry for the Environment
Programme of Investments Year Amount of investment
Emergency programme a) 1998 57 M€
Emergency programme a) 1999-2000 420 M€
Integration programmes b) 1999-2000 131 M€
Provisoric programmesc) 2002-2003 349 M€
a) Programma Interventi Urgenti (legal basis/reference DPCM 12/01/1999 and DPCM 30/09/1999)
b) Programmi integrativi (legal basis/reference DL 279/2000)
c) Programmi stralcio (legal basis/reference various DM)
The elaboration of land planning now allows the introduction of additional preventive measures, such as changes in the land use (authorised categories of land use).
8.2.3.2 Costs of suffered damages
Several types of cost have been identified: 26 casualties, destruction of buildings, …, borne by numerous actors, both private and public.
The monitoring costs for flooding are included in the preventive measures.
8.2.3.3 Costs of remediation / clean-up, etc. (protective measures)
The data are not available in detail. This is an institutional task of the Civil Protection Department of Italy. The Ordinance of Civil Protection no. 3090/00 (about 100 M€) approaches the costs of emergency measures. The complete reconstruction is funded by annual investments (the amount changes yearly).
8.2.3.4 Who bears the costs? (affected sectors)
All the emergency and preventive measures are borne by the public sector.
Emergency measures: the Civil Protection Department of Italy, under Emergency Government Provision, supplies the Regions with the necessary funds.
Preventive measures: the Civil Protection Department of Italy, under specific Dispositions; Ministry of the Environment and Territory, which coordinates the planning for the reduction of flood phenomena in agreement with River Basin Authorities and supports specific programmes of structural works.
Depending on the damages suffered, the other costs related to restoration / reclamation are born by the owners of the different buildings.
8.2.3.5 Types of cost - synthesis
All the costs have been identified for this type of threat, but in this particular case study, the actual costs were not communicated.

Assessing the Economic Impact of Soil Deterioration
It was impossible to find out how much of the costs of flooding are actually due to soil degradation processes, and how much due to clomate change or other factors such as regulation of rivers.
8.2.3.5.1 References / Bibliography Emergenza Alluvione Ottobre 2000, rapporti ANPA 7/2001
L’alluvione in Piemonte del 13-16 Ottobre 2000. Gli effetti su alcuni siti a significativo impatto ambientale, rapporti ANPA 14/2002
BRGM RP 53091 114

Assessing the Economic Impact of Soil Deterioration
BRGM RP 53091 115
8.3 APPENDIX 2 FIVE DETAILED CASE STUDIES

Assessing the Economic Impact of Soil Deterioration
8.3.1 Case Study UK / Erosion 8.3.1.1 Name UK erosion case - estimates made in the mid-1990s for England and Wales of the costs of the impacts of erosion
(i) for a hypothetical farm on soils vulnerable to erosion;
(ii) for a number of soil associations vulnerable to erosion;
(iii) for the national costs of making water drinkable; and
(iv) the impacts of runoff from farmland flooding and damaging property. Relevant references are listed.
8.3.1.2 Contact co-ordinates Robert EVANS, APU
8.3.1.3 Information 8.3.1.3.1 General Name: UK General case
Location (lat long; map) Various localities scattered throughout England and Wales. 17 localities were monitored for erosion. The costs were assessed for impacts of runoff and erosion from arable farms as well as for soil associations in Cambridgeshire, East Anglian Fens, Isle of Wight, Kent, Lincolnshire, Nottinghamshire, and Somerset, Sussex. For erosion in uplands - estimate for the northern moorland parishes of the Peak District National Park, central England. See Evans (1996) for further details.
Size of the area: Monitored erosion in 17 localities covering 700 km2/yr. Erosion and its impacts were evaluated financially for areas from one hectare in size, to an individual field (average area 7.5 ha), to soil associations up to hundreds of km2 in area, to 151,207 km2 the area of England and Wales.
Type of threats DPSIR: Erosion and runoff
Main actors involved: Farmers (from whose land soil is washed), property owners (those on the receiving end of the floods), council tax payers (who pay for repairs to highways) water rate payers (who pay for cleaning up water), insurance companies (who reimburse other stakeholders).
8.3.1.3.2 Environmental criteria Pre-dominant use(s) of area, population density:
Agricultural, low population densities, but can be on edge of urban areas with high population densities. Flooding can affect densely populated urban areas.
Geographical/Topographical (slope aspect, curvature, orientation; soil category, climate, average rainfall): Erosion generally affects rolling terrain where slopes are steeper than 3o. Water can run off flat land into ditches and rivers but will carry little soil. Storms causing runoff and erosion will generally be greater than 10 mm. All soil textures can be eroded by runoff but soils with high coarse silt or (fine and medium) sand are most vulnerable. Wind erodes soil from fields, which are generally flat, and soils are fine sands or pets. Evans (1990a, 1995) describes the physical characteristics of sites at risk of erosion and (1990b) the vulnerability of soil associations to water, wind and upland (both weather and animals are important) erosion and (2002) the risk of erosion occurring in particular crops.
BRGM RP 53091 116

Assessing the Economic Impact of Soil Deterioration
BRGM RP 53091 117
Conservation measures (typology, efficiency): Rarely used to protect the land from water erosion. Set-aside is known to be particularly effective in stopping erosion (see Evans and Boardman 2003), at very little cost to the farmer, the cost is bore by the taxpayer who contributes to the European Union Common Agriculture Policy. Other techniques also known to be deployed are grass buffer strips (also paid for out of EU or government funds), small dams, cultivating and drilling roughly along the contour and not across valley floors and depressions (so not funnelling water into these depressions) and planting cover crops. There are various ways to protect the land and crops from wind erosion, and most of the costs of these are bore by the farmer. He only protects high value crops, e.g. sugar beet, carrots, onions, not cereals. Most commonly a nurse crop is used which is then sprayed off. On sandy soils rolling the land when it is slightly damp, but such a crust can exacerbate runoff can produce a protective crust into which sugar beet seeds are drilled
Comprehensive description of damages (level of impacts – local, regional, national, time scale):
On site: Loss of fertiliser, crop and yield (both over short and long term), loss of land by erosion of river channel banks.
Off site: Impacts on property due to floodwater or wind carrying soil particles, and on water quality (need of additional treatment to make water drinkable).
Description of event generating the threats:
Storms of 10mm will generate runoff. Such storms are not uncommon. Storms of >25mm on bare soil can cause severe erosion. Wind erosion can occur most years, but the area of land affected is much less than that affected by runoff, though rates of erosion can be higher.
Vulnerability of area:
Evans (1990b and 1995) describes the land in England and Wales most vulnerable to erosion.
8.3.1.3.3 Economics Costs of preventive measures:
Farmers bear little of the cost for alleviating water erosion. EU money subsidises set-aside, which is most effective measure for stopping erosion in lowland England. The farmer pays the full cost for stopping wind erosion, e.g. cost of nurse crop (spring barley) and herbicide to spray off crop. Subsidies to reduce sheep grazing pressures in the uplands (the Environmentally Sensitive Area scheme) are effective in stopping erosion on all except peat soils. There will be some income foregone, but as many schemes have been taken up, presumably the loss is not too great.
Costs of suffered damages:
Loss of fertiliser, crop and yield at a farm level, will generally be no more than a few hundred pounds per farm, and cost will be recouped by the CAP subsidy payment on 1 or 2 ha. Costs of water and wind erosion of a field sown to a winter cereal are very similar - £4/ha, £29 per average size field and £30-60/farm (mid 1980s prices). However, the last figure probably needs updating, because the average size of farm is now larger than that used for the earlier calculation and that figure applied to all farms including pastoral holdings. It is now considered that in England and Wales an arable farmer needs about 400ha to make a living. In a vulnerable area erosion may cost the farmer £160. For a higher value crop such as sugar beet, the costs are of the order of £6.5/ha, £49/field £50-100/average farm or £260 for the larger farm. Wind erosion of a high value crop costs the farmer more, that is why more was done in the past to stop wind erosion - action was taken not to protect

Assessing the Economic Impact of Soil Deterioration
BRGM RP 53091 118
the soil but to protect the crop - thus wind erosion of sugar beet on sandland will cost the farmer £17-34/ha, £126-253/field, £250-500/farm and £680-1,360/larger farm; and for peat which is more susceptible to windblows £49-146/ha, £369-1,099/field, £750-2,000/farm and £1,960-5,840/larger farm. Remember, though, not many farms suffer erosion, on average about 4% of arable land each year, so these figures apply to only a small number of farms. If the estimated national cost to farmers (see below) is divided by the aprroximate number of holdings, the cost is £50-60 per farm.
The national costs of erosion to farmers in England and Wales were estimated for the mid-1990s to be for water erosion in the lowlands: lost inputs - £0.50 million, lost outputs - £1.65 million; for wind erosion in the lowlands: lost inputs - £0.37 million, lost outputs £1.23 million; and in the uplands: lost outputs (sheep) - £1.08 million and lost land by river bank erosion - £3.47-4.22 million; a total national on-farm cost of £8.29-9.05million.
Loss of soil due to past erosion (by thinning of the soil): loss of about 10% of the annual agricultural productivity over the last 4 years, estimated to be worth about £700 million per year.
It should be noted that these are conservative estimates of the costs of erosion and its impacts and exclude, for instance, the clearing of sediments from harbours and reservoirs. Both of these operations can be costly, for example the clearance of ponds and small reservoirs in the grounds of agricultural estates owned by the National Trust (Rob Jarman, personal communication). Also, there is no costing of the impacts of sedimentation on river fisheries. Nor, for long-term impacts on clay lands, the loss of more fertile and easily cultivated topsoils that incorporated windblown silt.
Costs of monitoring: No information on this issue is available. However, monitoring erosion can be done quickly and cheaply. And much other information could be gained on the impacts of erosion without involving too much bureaucracy and time. It should be possible to obtain the information in a cost effective way. A very crude estimate would put the figure at a few hundreds of thousands of pounds a year for England and Wales.
The National Rivers Authority (NRA) spend a further £76.4 million per year monitoring water quality (1992), of which a proportion must also be attributed to erosion. It is likely, therefore, that the impacts of erosion on water quality are costing the British water consumer tens of millions of pounds a year, possibly even hundreds of millions of pounds
Costs of remediation / clean up, etc (protective measures)
1) Estimated costs of floods and windblows in causing damage to property lying within 12 soil associations range from £1.6-473.7 /km2, an average of £96.4 /km2. See table below (1991 prices).
Table 45. Estimated costs of threats in the different communities
Locality and impact Erosion process Cost £ / km2 Cost € / km²
Cambridgeshire fens – roads Wind 1.6 2.38
Nottinghamshire sand lands- roads Water 6.9 10.28
Lincolnshire sand lands - roads Wind 7.4 11.03
Norkfolk fens - roads Wind 40.5 60.35
Isle of Wight greensand - roads Water 52.6 78.37
Somerset - roads Water 53.7 80.01

Assessing the Economic Impact of Soil Deterioration
BRGM RP 53091 119
Locality and impact Erosion process Cost £ / km2 Cost € / km²
Sussex downland – mostly houses and flood alleviation
Water 54.9 81.80
Isle of Wight light loams – houses and roads
Water 64.7 96.40
Lincolnshire fens - ditches Wind 93.7 139.61
Kent chalk and greensand – roads only
Water 121.1 180.44
Isle of Axholme sand and peat – roads and ditches
Wind 185.6 276.54
East Anglian fens - ditches Wind 437.7 652.17
Mean for 12 localities 96.4 143.64
Source: Evans, 1995b
2) National costs of damage to property by flooding and windblows is estimated to be £3.4m/yr with a further £1.0millionand £7.0millionspent on repairing footpaths and river channels, i.e. a total of £11.4million
3) The costs to the water industry of making water drinkable by removing nutrients, pesticides, sediment and colour (from organic colloids mainly from peat) is estimated to be £260.0 million/yr. Per household this is not a large cost, of the order of £10.
The costing of the pollution of drinking water is fraught with difficulty. The partitioning of sources, sewage works and farmers fields, from which the pollution comes, is not known, but it varies from place to place. So guesses have to be made as to how much of the pollution erodes or leaches from the farmers’ fields.
4) Costs of disruption of traffic or traffic accidents:
Slight accident in 1989 may have cost an average £2,200 and a severe one £23,690. A fatal accident was estimated to cost £677,750. The average for all accidents was £19,320.
5) off farm effects on fisheries and fishing:
The enrichment and sedimentation of water courses has other impacts, especially on fisheries and fishing (disappearance or threat of fish populations) which presently are difficult to quantify and cannot be easily costed (loss in revenues of fisheries or due to fewer fishing permits and licences). To give some perspective to the costs of erosion on fishing, the NRA spent £22.1 million in the financial year 1991/92 on fisheries.
6) Medium term effects have also been identified:
repairing of footpaths and tracks initiated by walkers, horses, vehicles and bikes,
stream channel erosion and deposition, for which estimation of reclamation costs has been done on the basis of small areas cases.
Table 46. Synthesis of costs for the short- and medium-term effects
£ million per year € million per year* Short term effects :

Assessing the Economic Impact of Soil Deterioration
BRGM RP 53091 120
£ million per year € million per year* On farm
lowlands :
Water erosion /lost inputs 0.499 0.335
Water erosion /lost outputs 1.644 1.103
Wind erosion /lost inputs 0.368 0.247
Wind erosion /lost outputs 1.232 0.827
Uplands :
Lost inputs 0.076 0.051
Off farm :
roads and property 3.303 2.217
accidents (5 per year) 0.100 0.067
Water pollution :
Uplands 2.000 1.342
Lowlands 3.600 – 30.000 2.416 - 20.134
Total for short term 12.822 – 39.222 8.605 - 36.323 Medium term On farm Lost of riparian land in Wales 3.468 – 4.224 2.327 - 2.835 Off farm : Footpaths 0.500 0.335 Stream Channels 7.000 4.698 Total for Medium term 10.968 – 11.724 7.361 - 7.868 Grand total 23.790 – 50.946 15.966 - 34.192
* 1 £ = 1.49 €
Methodology for costs estimation, «non used values», link between soil impact and economic uses:
The methodology for estimating costs is based on erosion survey data and other information relating to costs obtained in the mid 1980s and early 1990s (Evans 1995a, 1995b, 1996).
In some instances it is not possible to cost erosion, for example the cost of damaged or lost items which are considered by their owners to be irreplaceable, for instance letters, or cherished items which have little value in themselves but are of great personal/sentimental value. Also, the fear of being flooded by sediment-laden water can become very great if a change of land use leads to the event happening more frequently, for example a change from arable crops to outdoor pigs. Worry cannot be costed but its effects on health can be great.
The link between soil erosion and its impacts and economic uses is a close one. As land use has intensified in England and Wales over the last approximately 50 years and farmers have responded to government and European Union economic policies, so erosion has become more extensive, frequent and severe and its impacts more widespread and pervasive, especially in the last two decades in the wetter west of the country.

Assessing the Economic Impact of Soil Deterioration
BRGM RP 53091 121
Sources of information:
Robert Evans
Who bears the costs (affected sectors)?
Primarily the householder and council taxpayer, not the farmer. With regard to industry, the Water and Insurance industries not the Agricultural and Food producing and selling (supermarkets) industries.
8.3.1.3.4 References / Bibliography
Environment Agency (for England and Wales) - 'Agriculture and natural resources: benefits, costs and potential solutions’, May 2002, Bristol.
Evans, R. 1990a - Water erosion in British farmers' fields - some causes, impacts, predictions. Progress in Physical Geography 14, 199-219.
Evans, R., 1990b - Soils at risk of accelerated erosion in England and Wales, Soil Use and Management 6, 125-131.
Evans R., 1995a - Assessing costs to farmers, both cumulative and in terms of risk management; downstream costs off-farm. In Oram, T. (ed) Soils, Land Use and Sustainable Development. Proceedings Paper No 2 of the East Anglian Sustainable Agriculture and Rural Development Working Group. Norwich: Farmers' Link, p 19-26.
Evans R., 1995b - Soil Erosion and Land Use: Towards a Sustainable Policy. University of Cambridge, Cambridge Environmental Initiative/Cambridge Committee for Interdisciplinary Environmental Studies, Proceedings of the Seventh Professional Environmental Seminar, published by the White Horse Press, 10 High Street, Knapwell, Cambridge, CB3 8NR, pp 14-26.
Evans, R., 1996 - Soil Erosion and Its Impacts in England and Wales. Friends of the Earth Trust, London.
Evans, R., 2002 - An alternative way to assess water erosion of cultivated land - field-based measurements: and analysis of some results. Applied Geography 22, 187-208.
Evans, R., Boardman, J., 2003 - Curtailment of muddy floods in the Sompting catchment, South Downs, West Sussex, southern England. Soil Use and Management 19, 223-231.
Pretty, J.N., Brett, C., Gee, D., Hine, R.E., Mason,, C.F., Morison, J.I.L., Raven, H., Rayment, M.D., van der Bijl, G., 2000 - An assessment of the total external costs of UK agriculture. Agricultural Systems 65, 113-136.
Pretty, J., Brett, C., Gee, D., Hine, R., Mason, C., Morison, J., Rayment, M., van der Bijl, G., Dobbs, T., 2001. Policy challenges and priorities for internalising the externalities of modern agriculture. Journal of Environmental Planning and Management 44 (2), 263-283.
There are papers describing the costs of the impacts of individual erosion events. Most of these are listed are listed in Evans 1996 or in Boardman, J., 1995 - Damage to property by runoff from agricultural land, South Downs, southern England, 1976-1993. Geographical Journal 161 (2), 177-191, and updated in Boardman, J. 2003 - Soil erosion and flooding on the eastern South Downs, southern England, 1976-2001. Transactions of the Institute of British Geographers 28 (2), 176-196.

Assessing the Economic Impact of Soil Deterioration
8.3.2 CASE STUDY / France Erosion in Lauragais 8.3.2.1 Name Aigrefeuille, Lauragais, France
8.3.2.2 Contact co-ordinates Yves Le Bissonnais
INRA, Science du Sol,
Avenue de la Pomme de Pin,
B.P. 20 619, Ardon, 45 166 OLIVET cedex. – France
tel : 33 (0)2 38 41 78 82
fax : 33 (0)2 38 41 78 69
Email : [email protected]
Olivier Cerdan, BRGM Orléans
8.3.2.3 Information 8.3.2.3.1 General Name: Aigrefeuille; This study mainly focus on the agricultural losses due to water erosion
Location (lat long; map): 43.57N 1.6W
Size of the area: 24 ha
Type of threats DPSIR: soil erosion, muddy flood
Main actors involved: all possible at local (municipality, …), regional (Préfet, Conseil Régional, Département, regional authorities in charge of land use planning, Environment, agricultural practices…), Farmers.
8.3.2.3.2 Environmental criteria Pre-dominant use(s) of area, population density: intensive agriculture, rural area, dispersed habitats, Lauragais = 44 inhabitants/km²
Geographical/Topographical (slope aspect, curvature, orientation ; soil category, climate, average rainfall): molassic hillslopes, Moderate to steep slopes, oceanic climate with some Mediterranean influence, 650-700 mm/year
Conservation measures (typology, efficiency): reduction of field size, vegetative filter strips, hedges; minimum tillage. Good efficiency of the conservation measures for small to medium events (no big events occurred during the period of study after the conservation measures were implemented).
Comprehensive description of damages (level of impacts – local, regional, national, time scale):
Local impacts/short time scale: Gullies, Rills (every 15-20m) and sheet erosion; soil deposits on roads and ditches
Description of event generating the threats
Intense rainfall events (30 mm/h for 20 min to 65 mm for 15 min) from statistically 0.5 to 3 big storms a year.
Vulnerability of area: soil (high), habitats (medium, potentially in case of extreme events), agricultural productivity (medium to high).
8.3.2.3.3 Economics
BRGM RP 53091 122

Assessing the Economic Impact of Soil Deterioration
BRGM RP 53091 123
Costs of preventive measures
vegetative filter: strips no costs (used for cattle).
Hedges: 261 € + cost of the trees
Reduction of field size: 123 €
Costs of suffered damages
Deposits on road: 1,150 €/year
Cost related to the losses of agricultural productivity: 860 €/year for the farmer.
The cost of the loss of soils which can lead to the abandonment of the land (see in particular in Portugal and Spain) is very difficult to quantify and is not taken into account in this study.
Costs of monitoring
Experimental catchments follow up of water quality: No data on costs
Costs of remediation / clean up, etc (protective measures):
39 €/year
Methodology for costs estimation, « non used values », link between soil impact and economic uses:
The formula used to calculate the costs is (see details in Annex 1):
Total Cost = Cost on-site + Offsite erosion + Cost induced by the installation of the conservation measures + losses (agricultural production) induced by the presence of the conservation measures
Sources of information: Farmers interviews, prices of crops… come from economic studies.
Who bears the costs (affected sectors): Farmers + public area (subsidies + remediation)
8.3.2.3.4 References / Bibliography
Le Bissonnais Y., Bruno J-F., Cerdan O., Couturier A., Elyakime B., Fox D., Lebrun P., Martin P., Morschel J., Papy F., Souchère V. 2003. Maîtrise de l’érosion hydrique des sols cultivés: phénomènes physiques et dispositifs d’action. Programme GESSOL, rapport final, Mars 2003.
Assessing the Economic Impact of Soil Deterioration
8.3.2.4 Annex 1 of Study on soil erosion in France It is important to determine at what point the benefits drawn from erosion control measures outweigh the cost of erosion damage. For example, on one of the catchments studied, a farmer cannot grow carrots (high gross margin crop) because of the vulnerability of his soil to erosion. We might therefore consider the possibility of growing carrots on this plot to be a gain enabled by erosion control measures. However, growing carrots on this plot might entail additional costs for the farmer that are in some cases difficult to estimate (need to enlarge storage buildings, possibly change equipment). We have, therefore, chosen to use a simple model in which neither the cropping system nor the crop sequences are modified.
A major consequence of this methodological choice is that a grass strip at the bottom of a talweg will be considered to be a control measure having a cost linked to its creation and to the fact that it takes up land, thereby generating the loss of a crop. The cost of maintaining a prairie crossed by a talweg is considered to be nil for the farmer. This last point is debatable because the farmer could have chosen to plough his prairie to plant annual crops that, even with an eroded talweg, might have been more profitable.
We attempt to determine the cost of erosion for all of the actors in a catchment. It is, therefore, necessary to determine an annual cost of erosion for each actor, a cost that varies depending on the cost of the measures and their effect on the erosion damage. We can then calculate a total cost for the catchment and compare the relative cost-effectiveness of various erosion control measures. To do this, the economic effects of erosion must be converted into parameters that can be used in our economic model.
The equation for the total annual cost for a private actor is:
Total cost = Erosion damage + Cost of implementing measures + Losses caused by measures - Government subsidy for erosion control measures - Margin increase due to measures
Because erosion control measures are often expensive to implement, their economic advantage must be measured over the long term. This equation must therefore include several years and all of the actors in the catchment. It notably enables us to calculate the number of years needed to recuperate the cost of implementation. To do this, we calculate the annual gain enabled by the measures and compare it to the initial investment.
For a given year, we have the following items:
The cost of erosion damage
This can be broken down into several distinct items:
The cost of restoring property and other non-agricultural damage
Expenses or losses that are not directly related to crops, but rather to property. These include work to fill gullies, repair dirt roads or clean mud off of paved roads.
Profit loss and crop loss
The loss in sales due to the destruction of crops is estimated from the surface area of destroyed crops and the total sales figure (not including farm subsidies, which are granted even if a crop is lost).
Time loss
Erosion damage can lead to a loss of time during harvesting, the cost of which depends on the crop.
BRGM RP 53091 124

Assessing the Economic Impact of Soil Deterioration
BRGM RP 53091 125
Cost of erosion control measures
The cost of implementing and maintaining control measures must be taken into consideration.
Cost of implementing measures. This is usually a one-off expenditure for the owner.
Maintenance costs. This is an average annual cost. We usually consider maintenance practices that will prolong the life span of the control measures indefinitely. This can mean high one-off expenditure. This cost varies depending on the technical expertise employed. If specific agricultural practices are implemented to increase the life span of erosion control measures, their cost (loss of time, revenue, etc.) can be counted as a maintenance cost.
Losses inherent in the measures. Even if they are not maintained, erosion control measures impose certain constraints. They can hinder farm work causing a loss of time. If they take up land that can no longer be planted, we count the gross margin of the crop that would have been planted on the lost surface area as a cost. Note that the loss generated by the surface area of land taken up by a control measure is not estimated in the same way as the loss generated by erosion of a planted crop. For damage to crops, we count the decrease in net income since the farmer spent money for production but did not make any profit on his crop (except for farm subsidies on specific crops), whereas the farmer has no operating expenses for land taken up by measures. The loss is therefore only the loss of margin. Note also that the unfarmed land might be used as another source of revenue (exploitation of a grass strip, creation of a fishpond, etc.), and we must then deduct the gross margin thus obtained from the losses.
Subsidies. In the model initially proposed, we deducted the financial aid to be given to farmers from their gross margins (sales - losses). In the cases that we studied, some measures had already been planned or implemented with fixed-rate financing. We therefore decided to study the economic advantages of the existing measures for the various parties involved (farmer and community) rather than to set a new amount of aid for these farmers. Note that, in any case, government subsidies are only for implementation and not for maintenance, which remains at the expense of the private owners of the control measures. In some instances, the government does buy land to implement erosion control measures, but there are no examples of this in our sample.
To calculate the cost-effectiveness of a given measure, we also incorporated into our model any margin increases that it might make possible.
Increased earnings enabled by erosion control measures
The aim of erosion control measures is to reduce erosion damage on the property of a given actor in the catchment. To estimate financial gains, it is necessary to compare losses before and after the measures are implemented. However, we don't necessarily have all of this data. If the measure has not yet been implemented, its future effects are as yet unknown and we must make an estimate based on sizing calculations. If, on the other hand, the measures were implemented long ago and the former amount of damage is no longer known, past damage will have to be estimated.
We must then decide on what period we will base our calculations of average losses before the measures were implemented. Indeed, in a simplified model where annual costs do not vary, we can simply use the year before the measure was implemented as a reference. If, however, costs vary from year to year (notably as a function of the crops planted), it would be preferable to calculate an average annual cost over a longer period, generally one crop-rotation cycle (around 6 years in the Pays de Caux), in order to have a more representative value.
Determination of the cost-effectiveness of erosion control measures
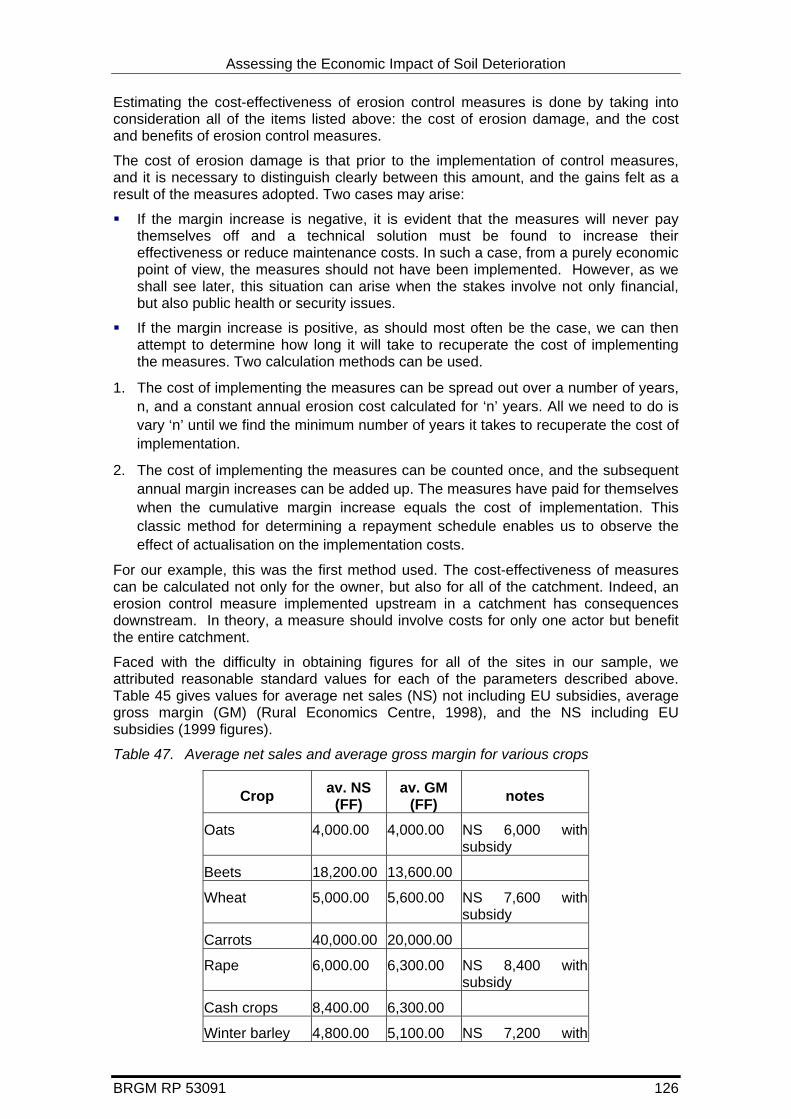
Assessing the Economic Impact of Soil Deterioration
Estimating the cost-effectiveness of erosion control measures is done by taking into consideration all of the items listed above: the cost of erosion damage, and the cost and benefits of erosion control measures.
The cost of erosion damage is that prior to the implementation of control measures, and it is necessary to distinguish clearly between this amount, and the gains felt as a result of the measures adopted. Two cases may arise:
If the margin increase is negative, it is evident that the measures will never pay themselves off and a technical solution must be found to increase their effectiveness or reduce maintenance costs. In such a case, from a purely economic point of view, the measures should not have been implemented. However, as we shall see later, this situation can arise when the stakes involve not only financial, but also public health or security issues.
If the margin increase is positive, as should most often be the case, we can then attempt to determine how long it will take to recuperate the cost of implementing the measures. Two calculation methods can be used.
1. The cost of implementing the measures can be spread out over a number of years, n, and a constant annual erosion cost calculated for ‘n’ years. All we need to do is vary ‘n’ until we find the minimum number of years it takes to recuperate the cost of implementation.
2. The cost of implementing the measures can be counted once, and the subsequent annual margin increases can be added up. The measures have paid for themselves when the cumulative margin increase equals the cost of implementation. This classic method for determining a repayment schedule enables us to observe the effect of actualisation on the implementation costs.
For our example, this was the first method used. The cost-effectiveness of measures can be calculated not only for the owner, but also for all of the catchment. Indeed, an erosion control measure implemented upstream in a catchment has consequences downstream. In theory, a measure should involve costs for only one actor but benefit the entire catchment.
Faced with the difficulty in obtaining figures for all of the sites in our sample, we attributed reasonable standard values for each of the parameters described above. Table 45 gives values for average net sales (NS) not including EU subsidies, average gross margin (GM) (Rural Economics Centre, 1998), and the NS including EU subsidies (1999 figures).
Table 47. Average net sales and average gross margin for various crops
Crop av. NS (FF)
av. GM (FF) notes
Oats 4,000.00 4,000.00 NS 6,000 with subsidy
Beets 18,200.00 13,600.00
Wheat 5,000.00 5,600.00 NS 7,600 with subsidy
Carrots 40,000.00 20,000.00
Rape 6,000.00 6,300.00 NS 8,400 with subsidy
Cash crops 8,400.00 6,300.00
Winter barley 4,800.00 5,100.00 NS 7,200 with
BRGM RP 53091 126

Assessing the Economic Impact of Soil Deterioration
BRGM RP 53091 127
Crop av. NS (FF)
av. GM (FF) notes
subsidy
Flax 7,000.00 9,600.00 NS 12,300 with subsidy
Barley 4,900.00 5,300.00 NS 7,400 with subsidy
Peas 4,000.00 5,800.00 NS 7,700 with subsidy
Potatoes 27,800.00 19,700.00
Clover 6,000.00 4,000.00
Table 46 gives the average unit cost (avunco) for the work most often undertaken as a result of erosion damage: filling of gullies, cleaning of roads and time lost during farm work due to a redistribution caused by gullies or the creation of grass strips or ditches for erosion control.
Table 48. Average unit cost for the most common operations resulting from erosion damage
Task AVUNCO Note
Filling in of gullies
600.00 F Price for 100 m of gully. 2 h of work with a back hoe and a dump truck. Can be as high as 1,000 F if more time is required.
Road cleaning
1,000.00 F Price for road cleaning (about 20 h of manual labour, or several hours if done by a specialised company). The unit number is the number of floods per year.
Time loss 1,000.00 F Average cost of farm labour per hour.

Assessing the Economic Impact of Soil Deterioration
8.3.3 CASE STUDY / France Erosion in Pays de Caux 8.3.3.1 Name Pierreville-Bacqueville catchment, Pays de Caux, Hte Normandie, France
8.3.3.2 Contact co-ordinates Yves Le Bissonnais
INRA, Science du Sol,
Avenue de la Pomme de Pin,
B.P. 20 619, Ardon,
45 166 OLIVET cedex. – France
tel: 33 (0)2 38 41 78 82
fax: 33 (0)2 38 41 78 69
Email : [email protected]
Véronique Souchère INRA SAD
Olivier Cerdan, BRGM Orléans
8.3.3.3 Information 8.3.3.3.1 General Name: Pierreville-Bacqueville; This study mainly focus on the agricultural losses due to water erosion
Location (lat long; map): 49.78N, 0.78W
Size of the area: 80 ha
Type of threats DPSIR: soil erosion, muddy flood
Main actors involved: all possible at local (municipality, …), regional (Préfet, Conseil Régional, Département, regional authorities in charge of land use planning, Environment, agricultural practices…), Farmers.
8.3.3.3.2 Environmental criteria Pre-dominant use(s) of area, population density: intensive agriculture, rural area, dispersed habitats, Hte Normandie = 145 inhabitants/km²
Geographical/Topographical (slope aspect, curvature, orientation ; soil category, climate, average rainfall): Loamy soils, gentle topography, oceanic climate, 700-800 mm/year
Conservation measures (typology, efficiency): retention ponds, vegetative filter strips, reinforcement of the talweg; no more damages after the implementation of the conservation measures during the period of study (one year).
Comprehensive description of damages (level of impacts – local, regional, national, time scale):
Local impacts/short time scale: Rills, gullies (5/year) and sheet erosion (total area affected every year ca. 4.5 ha); soil deposits on roads and ditches
Local to regional impacts/short time scale: pollution of groundwater wells
Description of event generating the threats :
Short intense rainfall event (e.g. up to 70 mm/h for ½-1h) or rainfall events less intense but with a longer duration, especially in winter (e.g. 60 mm in 7-8 h).
BRGM RP 53091 128

Assessing the Economic Impact of Soil Deterioration
BRGM RP 53091 129
Vulnerability of area: groundwater resources (high), habitats (medium, potentially in case of extreme events), agricultural productivity (medium), soil (low)
8.3.3.3.3 Economics Costs of preventive measures :
Ponds, vegetative filter strips, talweg reinforcement: 21,953 +6,244 € (Fond de Gestion de l’Espace Rural 80 %, farmers 20%).
Costs of suffered damages
Deposits on road and groundwater wells pollution: no data
Cost related to the losses of agricultural productivity (mean for 6 years):
2414 € for farmer 1
211 € for farmer 2
423 € for farmer 3
Costs of monitoring
Experimental catchments, follow up of water quality: No data on costs
Costs of remediation / clean up, etc (protective measures)
883 + 466 €/year
Methodology for costs estimation, «non used values», link between soil impact and economic uses:
The formula used to calculate the costs is (see details in Annex 1):
Total Cost = Cost on-site + Offsite erosion + Cost induced by the installation of the conservation measures + losses (agricultural production) induced by the presence of the conservation measures
Sources of information: Farmers interviews, prices of crops… come from economic studies.
Who bears the costs (affected sectors): Farmers + public area (subsidies + remediation)
8.3.3.3.4 References / Bibliography Le Bissonnais Y., Bruno J-F., Cerdan O., Couturier A., Elyakime B., Fox D., Lebrun P., Martin P., Morschel J., Papy F., Souchère V. 2003. Maîtrise de l’érosion hydrique des sols cultivés: phénomènes physiques et dispositifs d’action. Programme GESSOL, rapport final, Mars 2003.
Assessing the Economic Impact of Soil Deterioration
8.3.3.4 Annex 1 of Study on soil erosion in France It is important to determine at what point the benefits drawn from erosion control measures outweigh the cost of erosion damage. For example, on one of the catchments studied, a farmer cannot grow carrots (high gross margin crop) because of the vulnerability of his soil to erosion. We might therefore consider the possibility of growing carrots on this plot to be a gain enabled by erosion control measures. However, growing carrots on this plot might entail additional costs for the farmer that are in some cases difficult to estimate (need to enlarge storage buildings, possibly change equipment). We have, therefore, chosen to use a simple model in which neither the cropping system nor the crop sequence are modified.
A major consequence of this methodological choice is that a grass strip at the bottom of a talweg will be considered to be a control measure having a cost linked to its creation and to the fact that it takes up land, thereby generating the loss of a crop. The cost of maintaining a prairie crossed by a talweg is considered to be nil for the farmer. This last point is debatable because the farmer could have chosen to plough his prairie to plant annual crops that, even with an eroded talweg, might have been more profitable.
We attempt to determine the cost of erosion for all of the actors in a catchment. It is, therefore, necessary to determine an annual cost of erosion for each actor, a cost that varies depending on the cost of the measures and their effect on the erosion damage. We can then calculate a total cost for the catchment and compare the relative cost-effectiveness of various erosion control measures. To do this, the economic effects of erosion must be converted into parameters that can be used in our economic model.
The equation for the total annual cost for a private actor is:
Total cost = Erosion damage + Cost of implementing measures + Losses caused by measures - Government subsidy for erosion control measures - Margin increase due to measures
Because erosion control measure are often expensive to implement, their economic advantage must be measured over the long term. This equation must therefore include several years and all of the actors in the catchment. It notably enables us to calculate the number of years needed to recuperate the cost of implementation. To do this, we calculate the annual gain enabled by the measures and compare it to the initial investment.
For a given year, we have the following items:
The cost of erosion damage
This can be broken down into several distinct items:
The cost of restoring property and other non-agricultural damage
Expenses or losses that are not directly related to crops, but rather to property. These include work to fill gullies, repair dirt roads or clean mud off of paved roads.
Profit loss and crop loss
The loss in sales due to the destruction of crops is estimated from the surface area of destroyed crops and the total sales figure (not including farm subsidies, which are granted even if a crop is lost).
Time loss
Erosion damage can lead to a loss of time during harvesting, the cost of which depends on the crop.
BRGM RP 53091 130

Assessing the Economic Impact of Soil Deterioration
BRGM RP 53091 131
Cost of erosion control measures
The cost of implementing and maintaining control measures must be taken into consideration.
Cost of implementing measures. This is usually a one-off expenditure for the owner.
Maintenance costs. This is an average annual cost. We usually consider maintenance practices that will prolong the life span of the control measures indefinitely. This can mean high one-off expenditure. This cost varies depending on the technical expertise employed. If specific agricultural practices are implemented to increase the life-span of erosion control measures, their cost (loss of time, revenue, etc.) can be counted as a maintenance cost.
Losses inherent in the measures. Even if they are not maintained, erosion control measures impose certain constraints. They can hinder farm work causing a loss of time. If they take up land that can no longer be planted, we count the gross margin of the crop that would have been planted on the lost surface area as a cost. Note that the loss generated by the surface area of land taken up by a control measure is not estimated in the same way as the loss generated by erosion of a planted crop. For damage to crops, we count the decrease in net income since the farmer spent money for production but did not make any profit on his crop (except for farm subsidies on specific crops), whereas the farmer has no operating expenses for land taken up by measures. The loss is therefore only the loss of margin. Note also that the unfarmed land might be used as another source of revenue (exploitation of a grass strip, creation of a fish pond, etc.), and we must then deduct the gross margin thus obtained from the losses.
Subsidies. In the model initially proposed, we deducted the financial aid to be given to farmers from their gross margins (sales - losses). In the cases that we studied, some measures had already been planned or implemented with fixed-rate financing. We therefore decided to study the economic advantages of the existing measures for the various parties involved (farmer and community) rather than to set a new amount of aid for these farmers. Note that, in any case, government subsidies are only for implementation and not for maintenance, which remains at the expense of the private owners of the control measures. In some instances, the government does buy land to implement erosion control measures, but there are no examples of this in our sample.
To calculate the cost-effectiveness of a given measure, we also incorporated into our model any marginal increase that it might make possible.
Increased earnings enabled by erosion control measures
The aim of erosion control measures is to reduce erosion damage on the property of a given actor in the catchment. To estimate financial gains, it is necessary to compare losses before and after the measures are implemented. However, we don't necessarily have all of this data. If the measure has not yet been implemented, its future effects are as yet unknown and we must make an estimate based on sizing calculations. If, on the other hand, the measures were implemented long ago and the former amount of damage is no longer known, past damage will have to be estimated.
We must then decide on what period we will base our calculations of average losses before the measures were implemented. Indeed, in a simplified model where annual costs do not vary, we can simply use the year before the measure was implemented as a reference. If, however, costs vary from year to year (notably as a function of the crops planted), it would be preferable to calculate an average annual cost over a longer period, generally one crop-rotation cycle (around 6 years in the Pays de Caux), in order to have a more representative value.
Determination of the cost-effectiveness of erosion control measures

Assessing the Economic Impact of Soil Deterioration
Taking into consideration all of the items listed above does estimating the cost-effectiveness of erosion control measures: the cost of erosion damage, and the cost and benefits of erosion control measures.
The cost of erosion damage is that prior to the implementation of control measures, and it is necessary to distinguish clearly between this amount, and the gains felt as a result of the measures adopted. Two cases may arise:
If the margin increase is negative, it is evident that the measures will never pay themselves off and a technical solution must be found to increase their effectiveness or reduce maintenance costs. In such a case, from a purely economic point of view, the measures should not have been implemented. However, as we shall see later, this situation can arise when the stakes involve not only financial, but also public health or security issues.
If the margin increase is positive, as should most often be the case, we can then attempt to determine how long it will take to recuperate the cost of implementing the measures. Two calculation methods can be used.
The cost of implementing the measures can be spread out over a number of years, n, and a constant annual erosion cost calculated for n years. All we need to do is vary n until we find the minimum number of years it takes to recuperate the cost of implementation.
The cost of implementing the measures can be counted once, and the subsequent annual margin increases can be added up. The measures have paid for themselves when the cumulative margin increase equals the cost of implementation. This classic method for determining a repayment schedule enables us to observe the effect of actualisation on the implementation costs.
For our example, this was the first method used. The cost-effectiveness of measures can be calculated not only for the owner, but also for all of the catchment. Indeed, an erosion control measure implemented upstream in a catchment has consequences downstream. In theory, a measure should involve costs for only one actor but benefit the entire catchment.
Faced with the difficulty in obtaining figures for all of the sites in our sample, we attributed reasonable standard values for each of the parameters described above. Table 47 gives values for average net sales (NS) not including EU subsidies, average gross margin (GM) (Rural Economics Centre, 1998), and the NS including EU subsidies (1999 figures).
Table 49. Average net sales and average gross margin for various crops
Crop av. NS (FF)
av. GM (FF) notes
Oats 4,000.00 4,000.00 NS 6,000 with subsidy
Beets 18,200.00 13,600.00
Wheat 5,000.00 5,600.00 NS 7,600 with subsidy
Carrots 40,000.00 20,000.00
Rape 6,000.00 6,300.00 NS 8,400 with subsidy
Cash crops 8,400.00 6,300.00
Winter barley 4,800.00 5,100.00 NS 7,200 with subsidy
BRGM RP 53091 132

Assessing the Economic Impact of Soil Deterioration
BRGM RP 53091 133
Crop av. NS (FF)
av. GM (FF) notes
Flax 7,000.00 9,600.00 NS 12,300 with subsidy
Barley 4,900.00 5,300.00 NS 7,400 with subsidy
Peas 4,000.00 5,800.00 NS 7,700 with subsidy
Potatoes 27,800.00 19,700.00
Clover 6,000.00 4,000.00
Table 48 gives the average unit cost (avunco) for the work most often undertaken as a result of erosion damage: filling of gullies, cleaning of roads and time lost during farm work due to a redistribution caused by gullies or the creation of grass strips or ditches for erosion control.
Table 50. Average unit cost for the most common operations resulting from erosion damage
Task AVUNCO Note
Filling in of gullies
600 FF Price for 100 m of gully. 2 h of work with a back hoe and a dump truck. Can be as high as 1,000 FF if more time is required.
Road cleaning
1,000 FF Price for road cleaning (about 20 h of manual labour, or several hours if done by a specialised company). The unit number is the number of floods per year.
Time loss 1,000 FF Average cost of farm labour per hour.
Assessing the Economic Impact of Soil Deterioration
8.3.4 Case Study 2 / Contamination 8.3.4.1 Name Metaleurop Nord – Noyelles – Godault
France
8.3.4.2 Contact co-ordinates Dominique DARMENDRAIL – BRGM
Guillaume PANIE – DRIRE Nord – Pas de Calais
Bertrand ZUINDEAU – Institut Fédératif de Recherche sur les Economies et les Sociétés Industrielles (IFRESI)
Bertrand TOULOUSE – DRAF/SRPV
Emmanuel TEYS – ADEME Nord – Pas de Calais
8.3.4.3 Information 8.3.4.3.1 General Name: Metaleurop Nord – Noyelles – Godault
Location (lat long; map): Département Pas de Calais. See attached map.
Size of the area: industrial site on 30 ha, 1000 ha of urban and agricole soils heavily contaminated (>250 ppm Pb), 4000 ha with concentrations in lead >200 ppm.
Type of threats (DPSIR): Contamination / Local pollution affecting a large area
Main actors involved: all possible at local (municipality, industry,…), regional (Préfet, Conseil Régional, Département, regional authorities in charge of Human Health, Industry and Environnement, Animal productions, ADEME, ….
Additionally a specific scientific committee to support all the legal actions was established.
8.3.4.3.2 Environmental criteria Pre-dominant use(s) of area, population density: low density urbanistic area (dispersed habitat – 1050 inhabitants per km2) and agriculture.
Highly modified area by mining activities (in the coal mining basin), industrial activities (smelter), but also transport facilities (connection by water way, road and motorway, railway).
Geographical/Topographical (slope aspect, curvature, orientation; soil category, climate, average rainfall): flat, oceanic climate, 680 mm/year
Conservation measures (typology, efficiency):
Restriction of use (servitudes – Plan d’Intérêt Général implemented in January 1999 related to urban development restrictions, survey of agricultural productions with elimination of those which are unsuitable for consumption, realisation of a detailed risk assessment, acquisition and maintenance of the polluted soils (concentrations higher than 250 ppm), replacement of the soils polluted when construction of new buildings on the soils with more than 500 ppm Pb, cleaning of the school courses, information of the populations on the behaviours to be avoided).
1) Pumping well on the site to maintain groundwater plume in the site property limits.
Comprehensive description of damages (level of impacts – local, regional, national, time scale), [cf. list of pre-selected indicators]: contamination impact on soils, and in a less extent on groundwater, at local and broader areas with lead and cadmium; 400 ha
BRGM RP 53091 134

Assessing the Economic Impact of Soil Deterioration
BRGM RP 53091 135
of agriculture soils heavily contaminated (>250 ppm Pb), 600 hectares of urban soils heavily contaminated (>250 ppm Pb), 4000 ha with concentrations in lead >200 ppm.
1) Consequences on human health in the populations:
1994 – 1995: 14% of children presenting higher lead levels than the standard in force (100 micrograms per litre of blood).
2001 – 2002: 11% of children of 2 – 3 years in the 5 closest municipalities.
2) Consequences on workers human health / Number marked inaptitutes with work
1996: 22
1997: 20
1998: 36
1999: 45
2000: 30
2001: 19
for a potential population of workers of 3836
Description of event generating the threats:
1) Atmospheric emissions from the Pb smelter operating from 1894 up to beginning of 2003 (production of lead and zinc by thermal processes of the primary fusion):
350 tons of lead emitted in 1970s,
146 tons in 1978,
around 12 tons in 2003.
Surface water discharges in clear reduction by the start-up in 1988 of a sewage station:
150 tons of lead discharges in 1988,
4 to 5 tons in 2003 for lead, 1.9 tons of cadmium, 10 tons of zinc.
Consequences: contamination of sediments (Cd up to 2000 ppm, Hg up to 80 ppm, Ni up to 500 ppm, Pb up to 10 000 ppm, Zn up to 9 000 ppm, Cu up to 380 ppm, As up to 350 ppm).
Vulnerability of area: medium for the groundwater resources in the area. Important for soils.
8.3.4.3.3 Economics Costs of preventive measures:
Excavation of contaminated soils in residential areas and replacement by «safe» soil: 195,000 € /year (ADEME budget)
Cleaning of school external areas in a municipality: currently 3,000 €, up to 10,000 € /year;
Acquisition of the farms located around the site and refitting in forests in the most contaminated zone (>250 ppm Pb): 150,000 € up to now; 70,000 € for acquisition of 5 ha of contaminated land and 80,000 € for maintenance and refitting of plants on 80 ha; this should increase in the following months up to an acquisition of 400 ha (44 ha with priority) with Pb concentration above 250 ppm.
Reduction of emissions during the activity? Improvement of the process and capture of emissions?
Reduction of dust emissions after the close-down of the site? Main exposure pathway?

Assessing the Economic Impact of Soil Deterioration
Hydraulic pumping to avoid plume diffusion?
Prevention of human health risk: 150,000 € for sampling and analysis of all agriculture productions (ADEME budget).
Costs of suffered damages:
subsidies for compensation of loss of activities:
• 10,000 € in 2003 for 1,5 ha of potatoes unsuitable for consumption,
• approximately 30,000 € for the whole of the downgrading of cultures in animal feeds and withdrawals of certain products of the food chain in observance of the European regulations into force;
impact of the contamination on the real estate values of proximity (see Zuindeau report): for a normal housing price of 48,000 €
• – 12% at 500 m of the site
• – 6,3% at 800 m of the site
• – 3,5% at 1000 m of the site
Costs of monitoring:
Medical follow-up of the populations (tracking of lead levels in children):
• 2002 – 2003 on 5 villages in the Pas de Calais Departement, around 400 children: 80,400 €
• 2003 – 2004 on the same 5 villages of Pas de Calais + 4 villages of Nord: 205,000 €.
Survey of the agricultural productions (milk, muscles of the animals (meat), plants for the animal or human feeds, …): 16,000 € per year for the plants, probably the same for animals.
Medical follow-up of the former workers (tracking of lead levels): 200,000 €/ year
Costs of groundwater monitoring: 12,000 € per year
Costs of remediation / clean up, etc (protective measures):
In-depth diagnosis and detailed risk assessment on the site (impact on groundwater and workers Human Health): 250,000 €
In-depth diagnosis and Detailed risk assessment in the surroundings of the site (impact on populations)
Demolition of buildings, pre-treatment of the site for an industrial use (SITA project – 22,5 M€) with specific subsidies from the public partners (for demolishing actions, 7.5 M€, for re-industralisation, 6 M€).
cost in relation with the groundwater trapping (electric consumption and treatment plant): 300,000 €/year.
Elimination of crops unsuitable for consumption: see above.
Methodology for costs estimation, «non-used values», link between soil impact and economic uses:
Hedonic prices method.
Sources of information:
BRGM RP 53091 136
Assessing the Economic Impact of Soil Deterioration
BRGM RP 53091 137
341 land transactions between 1995 and 1999 in the area for an average price of 324,759 francs (49,509 €), for an average livable surface from 85 to 98 m2 and an average surface of ground from 540 to 650 m².
price of m² in the three studied municipalities varying from 3,400 to 4,100 francs (518 € to 625 €).
Who bears the costs (affected sectors):
Essentially public area for the prevention, suffered damages, monitoring and reclamation off-site costs.
Partly by a private investor for the reclamation of the site (redevelopment project by a waste treatment company agreed at the local level).
Social costs?
900 workers of the company, + 3,000 indirect works? Social plan? Human Health specific plan?
human health impact on children (additional medicine costs)
3.4. References / Bibliography List of existing documents with, if possible, files or copies of documents
Authorities notes.
G. Letombe, B. Zuindeau, 2001 - Programme de recherches concertées / l’impact de la proximité d’un site industriel sur les valeurs immobilières : application de la méthode des prix hédoniques à trois communes de la communauté d’agglomération d’Hénin-Carvin.

Assessing the Economic Impact of Soil Deterioration
BRGM RP 53091 138

Assessing the Economic Impact of Soil Deterioration
BRGM RP 53091 139
8.3.5 Case Study 3 / Salinisation 8.3.5.1 Name Central Ebro Salinisation case
8.3.5.2 2) Contact co-ordinates Dr. Juan Herrero-Isern
Government of Aragon
Agri- Research Centre
Soils and Irrigation Department
PO Box 727; 50080 Zaragoza, Spain
Phone 34 976 716 392; fax 34 976 716 335
Email: [email protected]
8.3.5.3 Information 8.3.5.3.1 General Name: Irrigated districts in central Ebro valley
Location (lat long; map): about 41º N; 0º 25’ W
Size of the area: more than 500,000 ha
Type of threats DPSIR: Salinisation
Main actors involved: farmers, water users and re-users within the area and outside the area, Water Basin Authority (= Confederación Hidrográfica del Ebro).
8.3.5.3.2 Environmental criteria Pre-dominant use(s) of area, population density: irrigated agriculture. Density of population is low if only the rural population is accounted, manpower for agriculture is scarce.
Geographical/Topographical (slope aspect, curvature, orientation; soil category, climate, average rainfall): mainly flat areas, Inceptisols and Aridisols, arid or semiarid, 400 to 500 mm/year, potential evapotranspiration 1,300 to 1,400 mm/year.
Conservation measures (typology, efficiency): drainage by open ditches, cropping patterns adapted to soil salt-affection.
Comprehensive description of damages (level of impacts – local, regional, national, time scale), [cf. list of pre-selected indicators]: decreased yields, crops range limited to salt-tolerant plants and to the scarce water in reservoirs, valuable habitats threatened or already destroyed by irrigation works, decreased soil’s structural stability, salinisation of water bodies receiving the drainage waters from the salt-affected areas.
Description of event generating the threats: intensification of agricultural production, improper irrigation and drainage management, improper land levelling with soil destruction and burial beneath geological material generating salt accumulations underground having a depleting effect on crop yields as its level approaches the crop root zone.
Vulnerability of area: important due to climate and soil quality local conditions.
8.3.5.3.3 Economics Costs of preventive measures: related to control of salinity in irrigated soils (to be estimated).
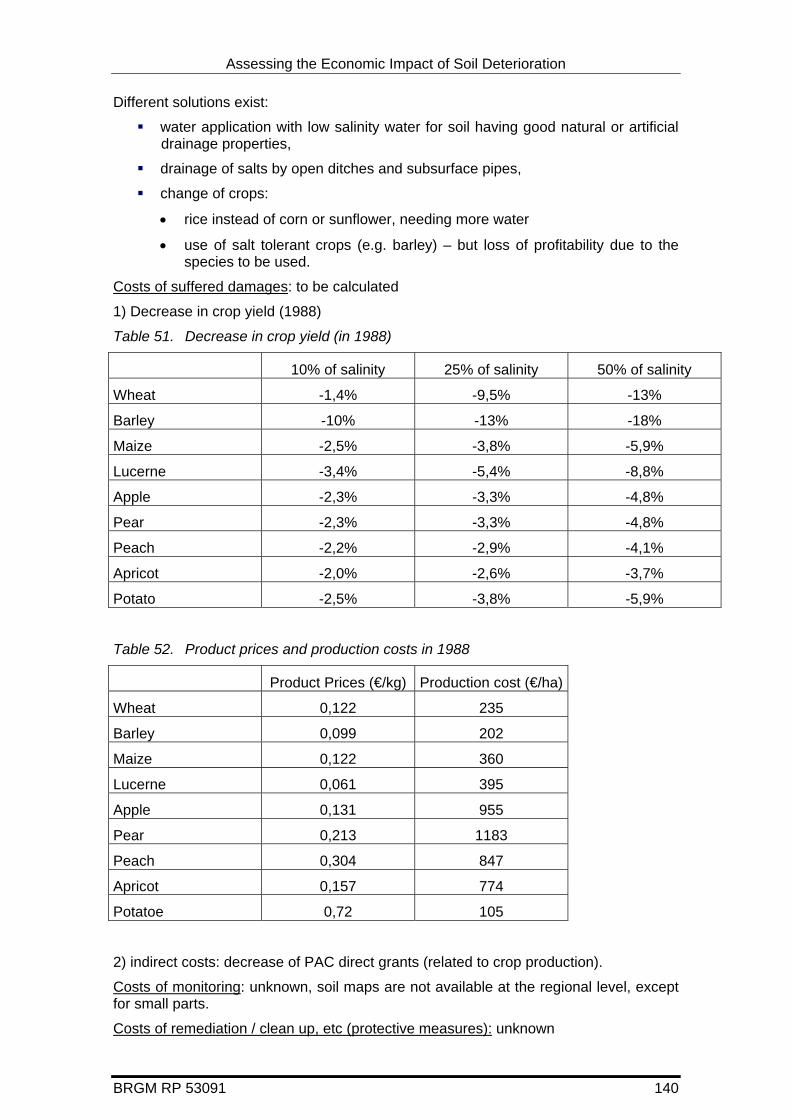
Assessing the Economic Impact of Soil Deterioration
Different solutions exist:
water application with low salinity water for soil having good natural or artificial drainage properties,
drainage of salts by open ditches and subsurface pipes,
change of crops:
• rice instead of corn or sunflower, needing more water
• use of salt tolerant crops (e.g. barley) – but loss of profitability due to the species to be used.
Costs of suffered damages: to be calculated
1) Decrease in crop yield (1988)
Table 51. Decrease in crop yield (in 1988)
10% of salinity 25% of salinity 50% of salinity
Wheat -1,4% -9,5% -13%
Barley -10% -13% -18%
Maize -2,5% -3,8% -5,9%
Lucerne -3,4% -5,4% -8,8%
Apple -2,3% -3,3% -4,8%
Pear -2,3% -3,3% -4,8%
Peach -2,2% -2,9% -4,1%
Apricot -2,0% -2,6% -3,7%
Potato -2,5% -3,8% -5,9%
Table 52. Product prices and production costs in 1988
Product Prices (€/kg) Production cost (€/ha)
Wheat 0,122 235
Barley 0,099 202
Maize 0,122 360
Lucerne 0,061 395
Apple 0,131 955
Pear 0,213 1183
Peach 0,304 847
Apricot 0,157 774
Potatoe 0,72 105
2) indirect costs: decrease of PAC direct grants (related to crop production).
Costs of monitoring: unknown, soil maps are not available at the regional level, except for small parts.
Costs of remediation / clean up, etc (protective measures): unknown
BRGM RP 53091 140
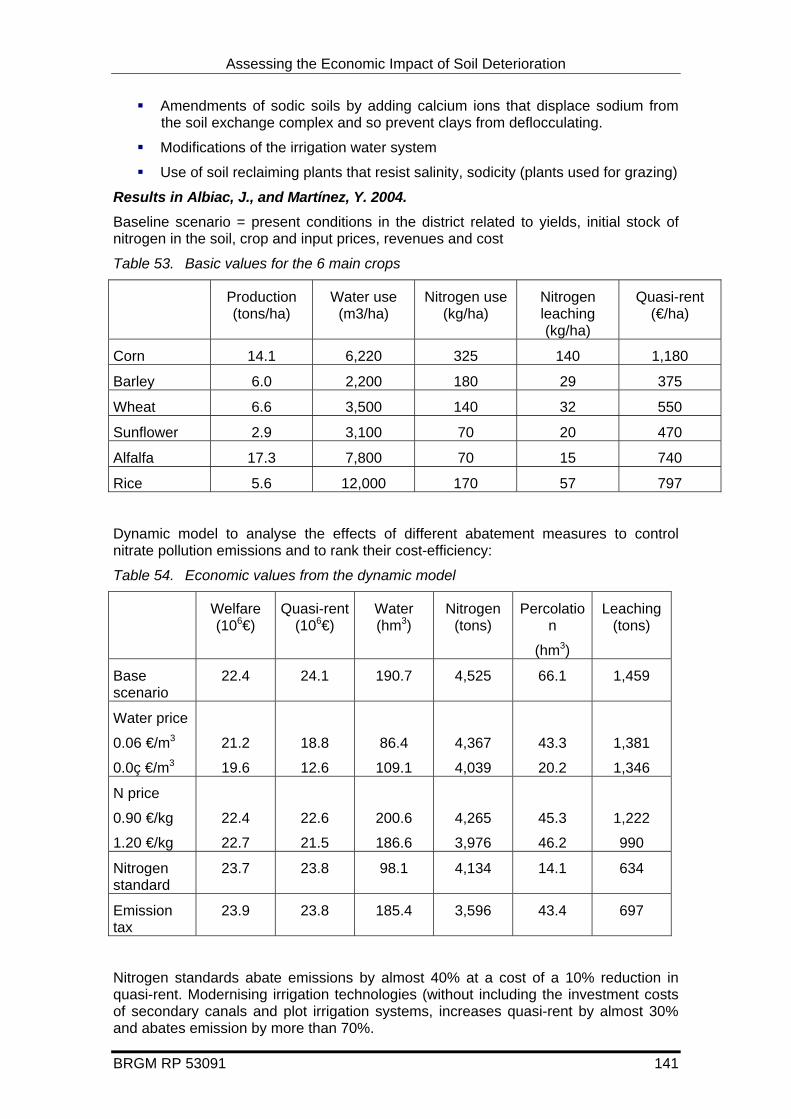
Assessing the Economic Impact of Soil Deterioration
BRGM RP 53091 141
Amendments of sodic soils by adding calcium ions that displace sodium from the soil exchange complex and so prevent clays from deflocculating.
Modifications of the irrigation water system
Use of soil reclaiming plants that resist salinity, sodicity (plants used for grazing)
Results in Albiac, J., and Martínez, Y. 2004. Baseline scenario = present conditions in the district related to yields, initial stock of nitrogen in the soil, crop and input prices, revenues and cost
Table 53. Basic values for the 6 main crops
Production (tons/ha)
Water use (m3/ha)
Nitrogen use (kg/ha)
Nitrogen leaching (kg/ha)
Quasi-rent (€/ha)
Corn 14.1 6,220 325 140 1,180
Barley 6.0 2,200 180 29 375
Wheat 6.6 3,500 140 32 550
Sunflower 2.9 3,100 70 20 470
Alfalfa 17.3 7,800 70 15 740
Rice 5.6 12,000 170 57 797
Dynamic model to analyse the effects of different abatement measures to control nitrate pollution emissions and to rank their cost-efficiency:
Table 54. Economic values from the dynamic model
Welfare (106€)
Quasi-rent (106€)
Water (hm3)
Nitrogen (tons)
Percolation
(hm3)
Leaching (tons)
Base scenario
22.4 24.1 190.7 4,525 66.1 1,459
Water price
0.06 €/m3
0.0ç €/m3
21.2
19.6
18.8
12.6
86.4
109.1
4,367
4,039
43.3
20.2
1,381
1,346
N price
0.90 €/kg
1.20 €/kg
22.4
22.7
22.6
21.5
200.6
186.6
4,265
3,976
45.3
46.2
1,222
990
Nitrogen standard
23.7 23.8 98.1 4,134 14.1 634
Emission tax
23.9 23.8 185.4 3,596 43.4 697
Nitrogen standards abate emissions by almost 40% at a cost of a 10% reduction in quasi-rent. Modernising irrigation technologies (without including the investment costs of secondary canals and plot irrigation systems, increases quasi-rent by almost 30% and abates emission by more than 70%.
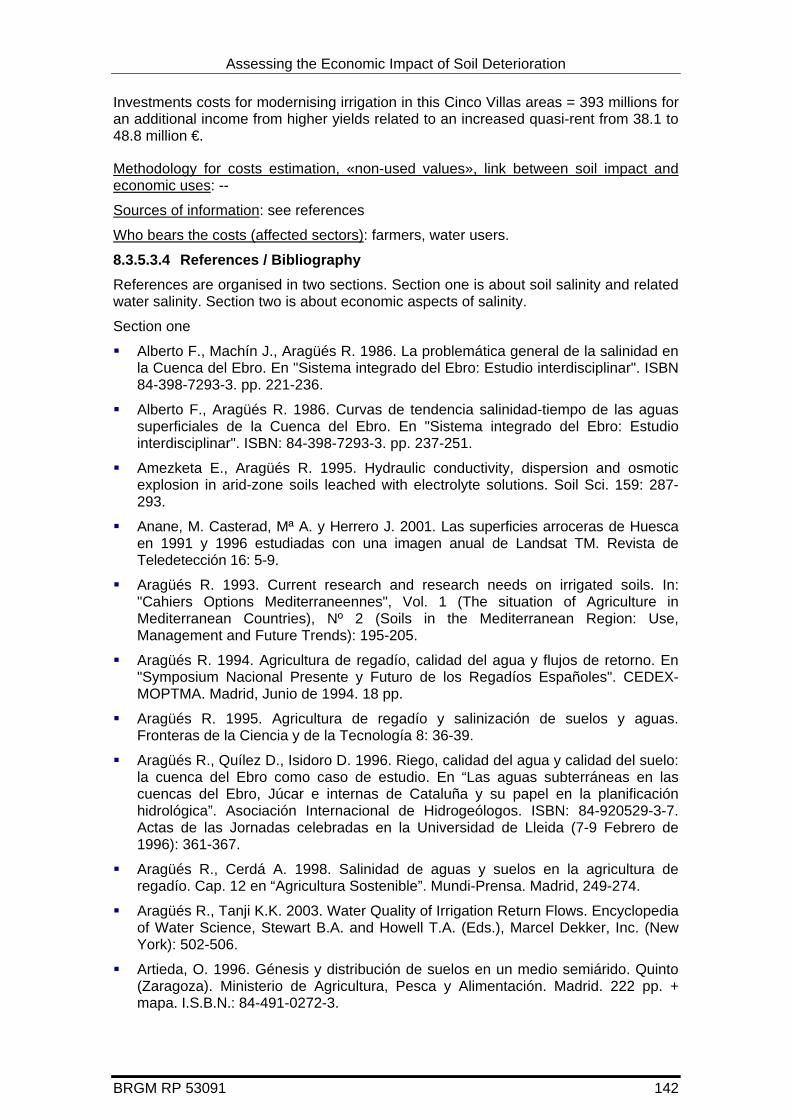
Assessing the Economic Impact of Soil Deterioration
Investments costs for modernising irrigation in this Cinco Villas areas = 393 millions for an additional income from higher yields related to an increased quasi-rent from 38.1 to 48.8 million €.
Methodology for costs estimation, «non-used values», link between soil impact and economic uses: --
Sources of information: see references
Who bears the costs (affected sectors): farmers, water users.
8.3.5.3.4 References / Bibliography References are organised in two sections. Section one is about soil salinity and related water salinity. Section two is about economic aspects of salinity.
Section one
Alberto F., Machín J., Aragüés R. 1986. La problemática general de la salinidad en la Cuenca del Ebro. En "Sistema integrado del Ebro: Estudio interdisciplinar". ISBN 84-398-7293-3. pp. 221-236.
Alberto F., Aragüés R. 1986. Curvas de tendencia salinidad-tiempo de las aguas superficiales de la Cuenca del Ebro. En "Sistema integrado del Ebro: Estudio interdisciplinar". ISBN: 84-398-7293-3. pp. 237-251.
Amezketa E., Aragüés R. 1995. Hydraulic conductivity, dispersion and osmotic explosion in arid-zone soils leached with electrolyte solutions. Soil Sci. 159: 287-293.
Anane, M. Casterad, Mª A. y Herrero J. 2001. Las superficies arroceras de Huesca en 1991 y 1996 estudiadas con una imagen anual de Landsat TM. Revista de Teledetección 16: 5-9.
Aragüés R. 1993. Current research and research needs on irrigated soils. In: "Cahiers Options Mediterraneennes", Vol. 1 (The situation of Agriculture in Mediterranean Countries), Nº 2 (Soils in the Mediterranean Region: Use, Management and Future Trends): 195-205.
Aragüés R. 1994. Agricultura de regadío, calidad del agua y flujos de retorno. En "Symposium Nacional Presente y Futuro de los Regadíos Españoles". CEDEX-MOPTMA. Madrid, Junio de 1994. 18 pp.
Aragüés R. 1995. Agricultura de regadío y salinización de suelos y aguas. Fronteras de la Ciencia y de la Tecnología 8: 36-39.
Aragüés R., Quílez D., Isidoro D. 1996. Riego, calidad del agua y calidad del suelo: la cuenca del Ebro como caso de estudio. En “Las aguas subterráneas en las cuencas del Ebro, Júcar e internas de Cataluña y su papel en la planificación hidrológica”. Asociación Internacional de Hidrogeólogos. ISBN: 84-920529-3-7. Actas de las Jornadas celebradas en la Universidad de Lleida (7-9 Febrero de 1996): 361-367.
Aragüés R., Cerdá A. 1998. Salinidad de aguas y suelos en la agricultura de regadío. Cap. 12 en “Agricultura Sostenible”. Mundi-Prensa. Madrid, 249-274.
Aragüés R., Tanji K.K. 2003. Water Quality of Irrigation Return Flows. Encyclopedia of Water Science, Stewart B.A. and Howell T.A. (Eds.), Marcel Dekker, Inc. (New York): 502-506.
Artieda, O. 1996. Génesis y distribución de suelos en un medio semiárido. Quinto (Zaragoza). Ministerio de Agricultura, Pesca y Alimentación. Madrid. 222 pp. + mapa. I.S.B.N.: 84-491-0272-3.
BRGM RP 53091 142

Assessing the Economic Impact of Soil Deterioration
BRGM RP 53091 143
Boixadera, J., Poch, R.M. y Herrero, C. (Eds.) 2000. Soilscapes of Catalonia and Aragon (NE Spain): Tour guide of the annual excursion of the Belgian Soil Science Society 1999. Société Belge de Pédologie.
Castañeda del Álamo, C. 2002. El agua de las saladas de Monegros sur estudiada con datos de campo y de satélite. Consejo de Protección de la Naturaleza de Aragón. Zaragoza. 158 pp. I.S.B.N.: 84-7753-919-7.
Casterad, MªA. y Herrero, J. 1998. Irrivol: A method to estimate the yearly and monthly water applied in an irrigation district. Water Resources Research 34 (11): 3045-3049.
Causapé J., Auqué L., Gimeno Mª J., Mandado J., Quílez D., Aragüés R. Irrigation effects on the salinity of the Arba and Riguel Rivers (Spain): present diagnosis and expected evolution using geochemical models. Journal of Environmental Geology (in press).
Causapé J., Quílez D., Aragüés R. 2004. Salt and nitrate concentrations in the surface waters of the CR-V irrigation district (Bardenas I, Spain): diagnosis and prescriptions for reducing off-site contamination. Journal of Hydrology (in press).
Faci J., Aragüés R., Alberto F., Quílez D., Machín J., Arrúe J.L. 1985. Water and salt balance in an irrigated area of the Ebro River Basin (Spain). Irrig. Sci. 6:29-37.
Herrero, J. (Ed.). 1986. Salinidad en los suelos: aspectos de su incidencia en regadíos de Huesca. Diputación General de Aragón. Zaragoza, 197 pp. I.S.B.N.: 84-505-4948-5.
Herrero, J. 1982. Salinidad del suelo en salobrares de Monegros y Somontano oscense como condicionante de la vegetación. Institución Fernando el Católico. Zaragoza, 50 pp. I.S.B.N.: 84-00-05120-0.
Herrero, J. 1987. Tendencias de salinidad en suelos del sistema de riegos Monegros-Flumen. VII Conferencia sobre Hidrología General y Aplicada, SMAGUA: 411-421. Zaragoza.
Herrero, J. 1998. Enseignements de l’expérience espagnole en matière d’intensification agricole dans le centre du bassin de l’Ebre et de ses impacts sur les ressources naturelles. Revue de l’Institut National Agronomique de Tunisie, numéro spécial 1998, Centenaire de l’INAT: 253-265.
Herrero, J. 1999. La información medioambiental ante el regadío y su modernización. pp. 375-388. En: P. Arrojo y F.J. Martínez (Eds.). El agua a debate desde la universidad. Institución Fernando el Católico. Zaragoza, 888 pp. ISBN: 84-7820-502-0.
Herrero, J. y Aragüés, R. 1988. Suelos afectados por salinidad en Aragón. Surcos de Aragón 9: 5-8.
Herrero, J. y Bercero, A. 1991. La salinidad en el nuevo regadío de Quinto (Zaragoza). Suelo y Planta 1: 585-602.
Herrero, J. y Casterad, MªA. 1999. Using satellite and other data to estimate the annual water demand of an irrigation district. Environmental Monitoring and Assessment 55 (2): 305-317.
Herrero, J. y Porta, J. 1991. Aridisols of Spain. En: Kimble, J.M. (Ed.) Characteri-sation, classification and utilisation of cold Aridisols and Vertisols: 61-66. USDA, Soil Conservation Service, NSSC, Lincoln, NE. 253 pp.
Herrero, J. y Snyder, R.L. 1997. Aridity and irrigation in Aragon, Spain. Journal of Arid Environments 35: 535-547.

Assessing the Economic Impact of Soil Deterioration
Herrero J., Aragüés R., Amezketa E. 1993. Salt-affected soils and agriculture in the Ebro basin. In: "2nd European Intensive Course on Applied Geomorphology: Arid Regions". Erasmus ICP-91/93-I-1226/07, publ. nº 5: 139-150.
Herrero, J., Rodríguez, R. y Porta, J. 1989. Colmatación de drenes en suelos afectados por salinidad. Institución Fernando el Católico. Zaragoza, 134 pp.
Isidoro D., Causapé J., Quílez D., Aragüés R. 2002. Calidad de las aguas de drenaje de la Comunidad de regantes V del canal de las Bardenas (Zaragoza). Invest. Agr.: Prod. Prot. Veg. 17: 375-394.
Isla R., Aragüés R., Royo A. 2003. Spatial variability of salt-affected soils in the middle Ebro Valley (Spain) and implications in plant breeding for increased productivity. Euphytica 134: 325-334.
López-Bruna D., Aragüés R. 1995. Estabilidad estructural de cinco suelos de Monegros II regados con un simulador de lluvia: Efecto de la calidad del agua y del acolchado. Invest. Agr.: Prod. Prot. Veg. 10: 441-462.
López-Bruna D., Aragüés R. 1996. Efecto del yeso y fosfoyeso sobre la estabilidad estructural de cinco suelos de Monegros II regados con un simulador de lluvia. Invest. Agr.: Prod. Prot. veg. 11: 101-116.
Martín-Ordóñez, T., Casterad Mª A. y Herrero, J. 2000. Three years of mapping irrigation water in the Flumen irrigation district, Spain, pp. 191-194 en J.L. Casanova (Ed.): Remote Sensing in the 21st Century: Economic and Environmental Applications. Balkema, Rotterdam, 610 pp.
Nogués Navarro, J. 2002. Mapa de suelos (E 1:25000) de Barbués y Torres de Barbués (Huesca). Aplicaciones para modernización de regadíos. Consejo de Protección de la Naturaleza de Aragón. Zaragoza. 175 pp. + mapas. I.S.B.N.: 84-89862-28-1.
Nogués, J. y Herrero, J. 2003. The impact of transition from flood to sprinkling irrigation on water district consumption. Journal of Hydrology 276: 37-52.
Nogués, J., Herrero, J., Rodríguez-Ochoa, R. y Boixadera, J. 2000. Land evaluation in a salt-affected irrigated district using an index of productive potential. Environmental Management 25 (2): 143-152.
Porta, J. y Herrero, J. 1996. Vulnerability of soils under irrigation. En: Pereira, L.S., Feddes, R.A., Gilley, J.R. y Lesaffre, B. (Eds.) Sustainability of irrigated agriculture: 85-96. Kluwer Academic Publishers. 642 pp.
Porta, J., Boixadera, J., Herrero, J., Bosch, A., Herrero, C., López-Acevedo, M., Roca, J. y Rodríguez, R. 1989. Suelos de secano en zona semiárida. Guía de las excursiones científicas de la XVI Reunión de la Sociedad Española de la Ciencia del Suelo. Lérida. 91 pp.
Quílez D., Aragüés R., y Tanji K. 1992. Salinity of rivers: Transfer function-noise approach. J. Irrig. Drain. Eng. 118: 343-359.
Rodríguez, R., Herrero, J. y Porta, J. 1989. Suelos de regadío con drenaje enterrado. Guía de las excursiones científicas de la XVI Reunión de la Sociedad Española de la Ciencia del Suelo. Lérida. 95 pp.
Rodríguez, R., Herrero, J. y Porta, J. 1990. Micromorphological assessment of drain siltation risk indexes in a saline-sodic soil in Monegros irrigation district (Spain). En: L.A. Douglas (Ed.) Soil Micromorphology: A basic and applied science. Developments in Soil Science 19: 41-52. Elsevier. Amsterdam.
Tedeschi, A., Beltrán, A. y Aragüés, R. 2001. Irrigation management and hydrosalinity balance in a semi-arid area in the middle Ebro river basin (Spain). Agricultural Water Management 49: 31-51.
BRGM RP 53091 144
Assessing the Economic Impact of Soil Deterioration
BRGM RP 53091 145
Section two
Albiac, J., and Martínez, Y. 2004. Agricultural pollution control under Spanish and European environmental policies. Paper presented at the Thirteenth EAERE Conference. Budapest. Hungary.
Albiac, J., Mema, M., Feijóo, M.L., Calvo, E., Mestre, F. y Tapia, J. 2000. Análisis económico del regadío de Flumen-Monegros. 10 pp. Actas del II Symposium Nacional Los Regadíos Españoles. Madrid, marzo 2000. CEDEX y Colegio Oficial de Ingenieros Agrónomos del Centro y Canarias.
Albisu L.M., Gil J.M., Aragüés R. 1987. Impacto de la salinidad en la agricultura de la Cuenca del Gállego. Unidad Economía y Sociología Agrarias. Documento de trabajo 87/1. SIA Diputación General de Aragón. Zaragoza, 126 pp.
Albisu, L.M., Gil, J.M. y Aragüés, R. 1988. Impacto económico de agua salina en la agricultura de la cuenca del Gállego. Comunicaciones INIA nº 25. Ministero de Agricultura. mMadrid, 131 pp.
Albisu L.M., Gil J.M., Albiac J., Aragüés R. 1986. Impacto económico de la salinidad en la agricultura de la Cuenca del Gállego. Unidad de Economía y Sociología Agrarias. Documento de trabajo 86/8. SIA Diputación General de Aragón. Zaragoza, 124 pp.
Astorquiza, I. 1994. Transformación en regadíos de zonas de condiciones naturales limitantes. Evaluación de la sostenibilidad de Monegros II. Revista Española de Economía Agraria 167: 209-228.
Astorquiza, I. 1995. Economic andd physical impact of an irrigation development project: policy analysis for deep percolation control. In L. M. Albisu and C. Romero (Eds.) Environmental and land use issues: an economic perspective. Proceedings of the 34th Seminar of the European Association of Agricultural Economists (EAAE), 7th - 9th February 1994, Zaragoza (Spain).Wissenschaftverlag Vauk. Kiel. 537 pp. ISBN 3-8175-0196-X.
Calvo, E., Feijóo, M.L. y Albiac, J. 1999. La influencia de la política agraria común en la zona de regadío Flumen-Monegros. Estudios de Economía Aplicada 15: 3-22.
Feijóo, M., Calvo, E. y Albiac, J. 2000. Economic and environmental policy analysis of the Flumen-Monegros irrigation system in Huesca, Spain. Geographical Analysis 32: 5-41.
Zekri, S., Albisu, L.M., Aragüés, R. y Herrero, J. 1990. Impacto económico de la salinidad de los suelos en la agricultura de Bardenas I. Comunicaciones INIA, serie economía nº 36. Madrid, 129 pp.

Assessing the Economic Impact of Soil Deterioration
8.3.6 Case Study 4 / Sweden Organic Matter Loss 8.3.6.1 Name Information on two Swedish sites where wetland restoration has been made and some costs are known.
This concerns peat mining and after use as wetland with prospect for carbon accumulation.
8.3.6.2 Contact co-ordinates Lars Lundin, Swedish University of Agricultural Sciences (SLU) Uppsala, Sweden.
E-mail: Lars.Lundin@ sml.slu.se
8.3.6.3 Information 8.3.6.3.1 General Name: Two sites rather close by: Porla and Västkärr (West fen)
Location (lat long; map): No map directly available (Could be submitted). Approx. location to SW Sweden; N 59o 00’; E 14o 30’
Forest drainage and peat cutting are spread over Sweden, except in the High Mountains in the NW of Sweden.
Size of the area: Porla wetland is ca. 20 ha in a 200 ha catchment and Västkärr is 80 ha.
Type of threats DPSIR: Excavation made, left for wetland restoration.
Main actors involved: Peat company, land owner and local authorities.
8.3.6.3.2 Environmental criteria Pre-dominant use(s) of area, population density:
1) Porla: Peat mining for ca. 100 years on a previously natural bog. Now rewetted. No actual population.
2) Västkärr: Originally a lagg fen that used in agriculture (e.g. potatoes), later peat excavation and now rewetted and turned into a bird santcuary. One land owner living close by.
Geographical/Topographical (slope aspect, curvature, orientation; soil category, climate, average rainfall)
1) Porla: A downslope depression, rather flat, peat on till soils, annual temp. ca. 6oC and P ca. 700 mm
2) Västkärr: Low-lying flat, thin peat on postglacial clay, annual temp. ca. 6oC and P ca. 700 mm
Conservation measures (typology, efficiency)
Comprehensive description of damages (level of impacts – local, regional, national, time scale): Damage: Peatland devastated, local impact, wetland restoration during 1-10 years then turning into overgrown mires.
Impacts on biodiversity (changed in wetland biodiversity) and on land values (sometimes higher after peat cutting).
Potential impact on groundwater quality.
BRGM RP 53091 146
Assessing the Economic Impact of Soil Deterioration
BRGM RP 53091 147
Description of event generating the threats
Peat Mining activities.
Vulnerability of area:
8.3.6.3.3 Economics Costs of preventive measures
Costs of suffered damages
Costs of monitoring
Costs of remediation / clean up, etc (protective measures)
Costs for restoration: Porla ca. 25,000 €; Västkärr: ca. 35,000 €
Restoration in wetlands and forests.
Methodology for costs estimation, « non used values », link between soil impact and economic uses.
Sources of information
Who bears the costs (affected sectors)
Mainly the peat company pays.
8.3.6.3.4 References / Bibliography There are some conference papers and a final report from an EU project called BRIDGE.
Assessing the Economic Impact of Soil Deterioration
BRGM RP 53091 148

Assessing the Economic Impact of Soil Deterioration
BRGM RP 53091 149
8.4 APPENDIX 3 INFORMATION AT NATIONAL LEVEL

Assessing the Economic Impact of Soil Deterioration
8.4.1 Ireland
The general consensus in Ireland is that soil quality is generally good. However, there is increasing pressure on soils particularly from land use changes, intensification of agriculture, erosion and overgrazing, disposal of organic wastes to soil, afforestation, industry and urbanisation. In addition, untimely or excessive applications of nutrients to soil, in particular phosphorus has resulted in water quality deterioration. This emphasises the major interactions and connectivity between all environmental media. This is why soil protection is now considered on an equal level with the protection of air and water in Ireland.
A Soil Protection Strategy (Irish Environmental Protection Agency – Towards setting environmental quality objectives for soil: developing a soil protection strategy for Ireland; a discussion paper) has been developed and proposed in 2002, based on the following principles:
the protection of soil quality may pose some unique difficulties, e.g. most soil resources are in private ownership, soils perform multiple functions,
soil quality refers to the status which will sustainably support its multiple properties and functions, within natural or managed ecosystem boundaries, in a sustainable manner,
The implementation of best management practices should be promoted to protect soil quality,
The soil strategy must also develop the mechanisms by which changes in soil quality can be measured and the effectiveness of remedial actions assessed: this requires the development of a national soil quality monitoring programme and a selection of a set of indicators which are representative of soil quality.
During the elaboration of this Soil Strategy, an inventory of the sources of information has been elaborated (on soil classification – ten main “Great Soil Groups”, amongst others soil fertility, soil organic content, soil contamination, forestry soil yield). An evaluation of the land use at the national level has been completed using the “Corine Land Cover” information system (69% agriculture, 14% Wetlands, 14% forests and semi-natural areas, 2% of water, 1% of artificial surfaces).
Pressures and impacts on soil resources have been identified. The main pressures on soil in Ireland arise from the following sectors:
intensive agriculture and organic waste disposal,
forestry,
industry,
peat extraction,
and urbanisation and infrastructure development.
Those pressures have been qualified, rarely quantified (industrial organic waste disposal, industrial contaminated sites).
The current work is related to:
a better identification and a review of the existing information in soils in Ireland: they should be assessed in relation to providing information on soil quality and changes over time, e.g. what information is currently available, what does this tell us about soil quality changes over time and under different land uses and pressure, etc.
BRGM RP 53091 150

Assessing the Economic Impact of Soil Deterioration
BRGM RP 53091 151
the development of a set of key soil quality indicators, these indicators must be capable of informing policy makers, regulators and soil users so that questions such as “what is soil quality like in Ireland? Is it good? Is it bad? How is it changing over time? Good or Bad soil quality has two components, (a) a scientific understanding of the state of soil resources supporting soil functions, and (b) decisions made by society on the intended use for soil.
the establishment of the soil quality monitoring network,
the development of a code of good practices for soil management.
Some examples of soil quality indicators have been provided in the strategy document.
Table 55. Soil indicators
Indicator Soil property / soil function Soil organic carbon content Biomass production, filtering and buffering soil
structure, formation of soil aggregates, soil fertility, ability to retain water, etc.
Cation exchange capacity filtering and buffering capacities, nutrient reserve Base saturation filtering and buffering capacities and indicates
reserves left in soil to buffer against acidity Soil pH Acidity or alkalinity of soil and influences land use,
biomass production and biodiversity Oisens P or Morgans P Plant available P, and also indicator of soil fertility
status and potential for biomass production. Links to potential for water eutrophication
Microbial biomass Size of microbial populations and indicates the potential for soil to recycle organic matter and nutrients, relevant to soil fertility and indicates the activity level within a soil. Ability to transform chemical
Soil macro and micro fauna and flora
Biodiversity, soil health, soil fertility
Soil N mineralisation potential Availability of N reserve, indicates activity of soil microbial biomass, relevant to soil fertility
Soil bulk density Measure of the porosity and compaction of soil, physical environment for roots and soil organisms
Particle size distribution Physical environment for roots Macroporosity and readily available water
Indicates the number of larger pores in the soil which are important for soil aeration and storage of plant – available water
Area of land lost to urbanisation and development
Loss of soil
Sediment load to water courses
Soil erosion and loss of soil functions
Heavy metal concentration in soils
Anthropogenic soil contamination, possible loss of soil functions
No indicator on the economic impact of the soil degradation is currently identified.
All the actions planned are now undertaken in tandem with the developments at the European level.
Assessing the Economic Impact of Soil Deterioration
8.4.2 The Netherlands In The Netherlands soil cleanup operations started in the early 1980s when an inventory of seriously contaminated sites was drawn up. In particular ongoing local-scale polluting activities were identified as requiring preventive measures. Large-scale diffuse sources also cause soil pollution but in general they do not lead to the creation of seriously contaminated sites. As a result, they do not show up in the inventory of sites for cleanup.
The underlying premise of the “Soil Protection Act”, which came into force in 1987, is that pollution of soil is not allowed. If a soil became polluted after the Act came into force then, in principle, the pollution should be removed irrespective of the risks. The ALARA principle (As Low as Reasonably Achievable) and the use of best available techniques are instruments that can be used to control soil pollution. In practice it is seldom possible or feasible to control or prevent all releases to soil. Therefore, the Act states that emissions and the resulting soil pollution can be tolerated as long as the soil quality does not decline (stand-still principle) and that the multi-functionality of the soil is not endangered. For the implementation of this policy, so-called target values or criteria related to target values are used. As long as the concentrations of pollutants in soil remain below the target values, the soil is considered multifunctional, i.e. fit for any land use, bareing in mind any limitations due to the natural composition of the soil.
If soil contamination occurred before 1987, the contamination still has to be managed; and if a site is seriously contaminated then a cleanup might be necessary. For a large number of substances, intervention values have been derived, which represent seriously contaminated soil. Such soil has to be managed before, during, and after the cleanup. The management strategy adopted depends on local circumstances but should always be focused on the prevention of contaminant dispersion, the reduction of site-specific risks, and the improvement of soil quality. Social and economic factors also influence the way soil contamination is managed. In some cases it might be necessary to adapt the end-use of a site.
Current legislation requires that the polluter should pay for the cost of cleanup. If this is not possible then the owner of the contaminated site is responsible. In cases of so-called innocent owners, the authorities using public money pay for the cleanup. At the moment, this process is managed in a way, which gives the owner a more central position in remedial action decisions including more responsibility for the costs.
The Ministry of Housing, Spatial Planning and the Environment (VROM) is responsible for defining general soil policy. The Ministry defines the Soil Protection Act, and instruments based on the Act such as General Administrative Orders, soil quality objectives and procedures for estimating site-specific risks. The local authorities, provinces and municipalities are responsible for applying the Act and associated instruments, and deciding how best deal with specific contaminated sites. The National Institute of Public Health and Environmental Protection (RIVM) provides the scientific basis for soil quality objectives and risk assessment procedures. The Technical Committee on Soil Protection (TCB) advises the Minister on the implementation of technical and scientifically based instruments in soil protection policy. The development of instruments such as quality objectives takes place in close co-operation with all relevant parties to ensure that it will be suitable for use and widely accepted. Because cleanup costs have to be borne primarily by polluters and site owners, special treaties have been developed between the Ministry and specific bodies such as railroad companies and the trade organisation for laundries.
Risk-based soil quality objectives are an important instrument in Dutch soil policy, especially in relation to the cleanup of contaminated soils. Target values and intervention values have been established for about one hundred substances for soil and groundwater, and are related to the percentage of organic matter and clay in the soil. If target values are met, the soil is considered clean or multifunctional. If the
BRGM RP 53091 152
Assessing the Economic Impact of Soil Deterioration
BRGM RP 53091 153
average contaminant concentration in a minimum soil volume of 25 m3 exceeds the intervention value, the contamination is classified as serious (in the case of groundwater contamination, a minimum volume of 100 m3 applies). Target values are not related to a volume criterion at the moment, but this will probably occur in the near future. Recently target values have been re-examined and, for a number of substances, new risk-based values were proposed.
The target and intervention values are part of a general framework of risk-based environmental quality objectives. Exceeding such objectives indicates the potential for risk, assuming that exposure always occurs to its full extent. However, in practice full exposure will not always occur, and it is important to take local circumstances into account when estimating actual risks. For the time being the number of procedures for estimating actual risks is limited. The most advanced procedure developed is that used to determine the urgency for cleanup.
According to the Soil Protection Act the following questions should be answered in relation to the cleanup of contaminated sites:
Is the site seriously contaminated?
Is cleanup urgent?
When should cleanup start?
What is the cleanup objective?
This last question has been subject to many discussions and debates in recent years. In the past, the strategy has focused on cleanup resulting in a multifunctional soil unless the cleanup caused environmental problems, was impossible for technical reasons, or was too expensive. If a total cleanup appeared to be impossible the site was isolated controlled and monitored (ICM approach). ICM solutions could involve partial soil excavation and could be related either to current or intended use of the soil. A phased approach to remediation was allowed so long as any immediate danger from the site was dealt with as soon as possible. In practice, the distinction between total cleanup and ICM was found to be too rigid and not cost-effective. Therefore other potential solutions were explored. Recently this resulted in a new strategy.
For new sites (contaminated during and after 1987), a total cleanup should be performed.
For old sites (contaminated before 1987) and with mobile contaminants, the contamination should be removed as far as possible in a cost effective way.
For old sites with non-mobile contaminants, the contamination should be removed to the extent necessary, recognising the end-use of the site (function oriented approach).
The general outline of the new approach was adopted by the Dutch Parliament in 1997. Advice on how to deal with certain aspects of this approach (e.g. cost effectiveness, criteria for mobility) has been defined.
The success of the Dutch system partly reflects the organisation of the process. In this context it is useful to summarise some major characteristics.
The distinction between scientific and political aspects. Research projects leading to soil quality objectives or risk assessment procedures are usually divided into scientific and political phases. In the scientific phase, objectives and procedures are derived in an objective manner to the extent possible in the light of scientific knowledge. In the political phase the practical implications for soil policy are discussed including economic, financial and social factors.
Estimation of the consequences of instruments before being enforced.
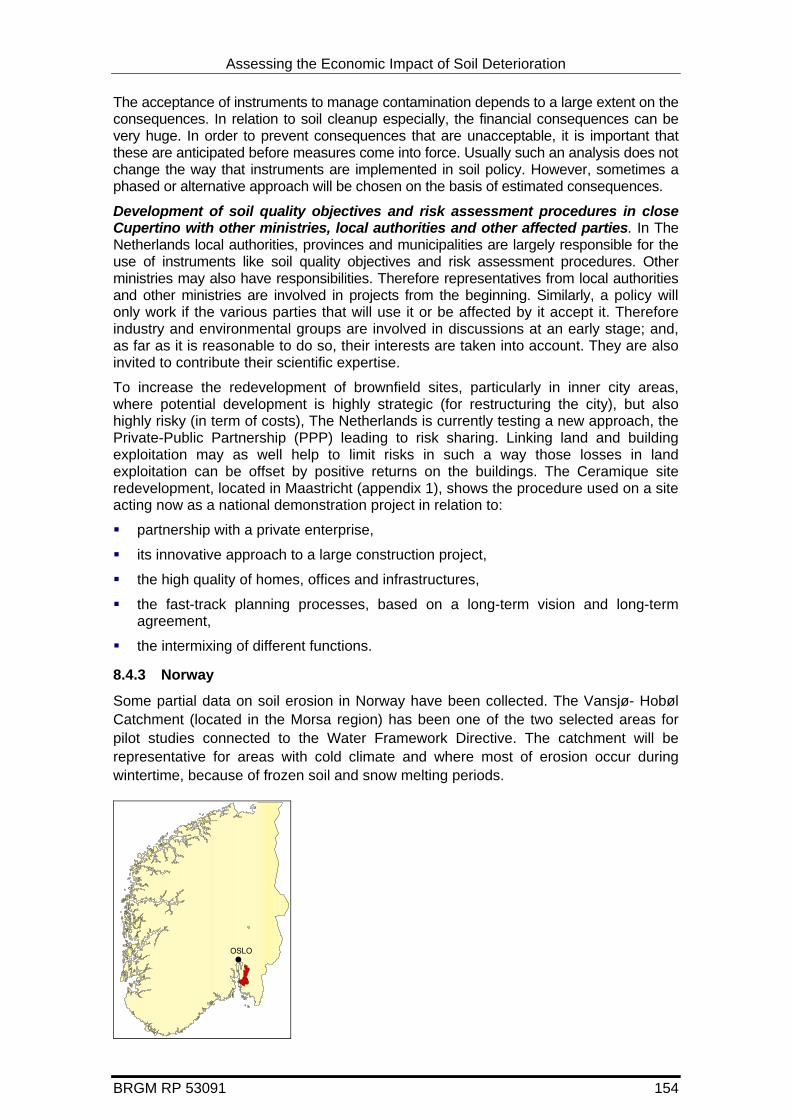
Assessing the Economic Impact of Soil Deterioration
The acceptance of instruments to manage contamination depends to a large extent on the consequences. In relation to soil cleanup especially, the financial consequences can be very huge. In order to prevent consequences that are unacceptable, it is important that these are anticipated before measures come into force. Usually such an analysis does not change the way that instruments are implemented in soil policy. However, sometimes a phased or alternative approach will be chosen on the basis of estimated consequences.
Development of soil quality objectives and risk assessment procedures in close Cupertino with other ministries, local authorities and other affected parties. In The Netherlands local authorities, provinces and municipalities are largely responsible for the use of instruments like soil quality objectives and risk assessment procedures. Other ministries may also have responsibilities. Therefore representatives from local authorities and other ministries are involved in projects from the beginning. Similarly, a policy will only work if the various parties that will use it or be affected by it accept it. Therefore industry and environmental groups are involved in discussions at an early stage; and, as far as it is reasonable to do so, their interests are taken into account. They are also invited to contribute their scientific expertise.
To increase the redevelopment of brownfield sites, particularly in inner city areas, where potential development is highly strategic (for restructuring the city), but also highly risky (in term of costs), The Netherlands is currently testing a new approach, the Private-Public Partnership (PPP) leading to risk sharing. Linking land and building exploitation may as well help to limit risks in such a way those losses in land exploitation can be offset by positive returns on the buildings. The Ceramique site redevelopment, located in Maastricht (appendix 1), shows the procedure used on a site acting now as a national demonstration project in relation to:
partnership with a private enterprise,
its innovative approach to a large construction project,
the high quality of homes, offices and infrastructures,
the fast-track planning processes, based on a long-term vision and long-term agreement,
the intermixing of different functions.
8.4.3 Norway
Some partial data on soil erosion in Norway have been collected. The Vansjø- Hobøl Catchment (located in the Morsa region) has been one of the two selected areas for pilot studies connected to the Water Framework Directive. The catchment will be representative for areas with cold climate and where most of erosion occur during wintertime, because of frozen soil and snow melting periods.
BRGM RP 53091 154
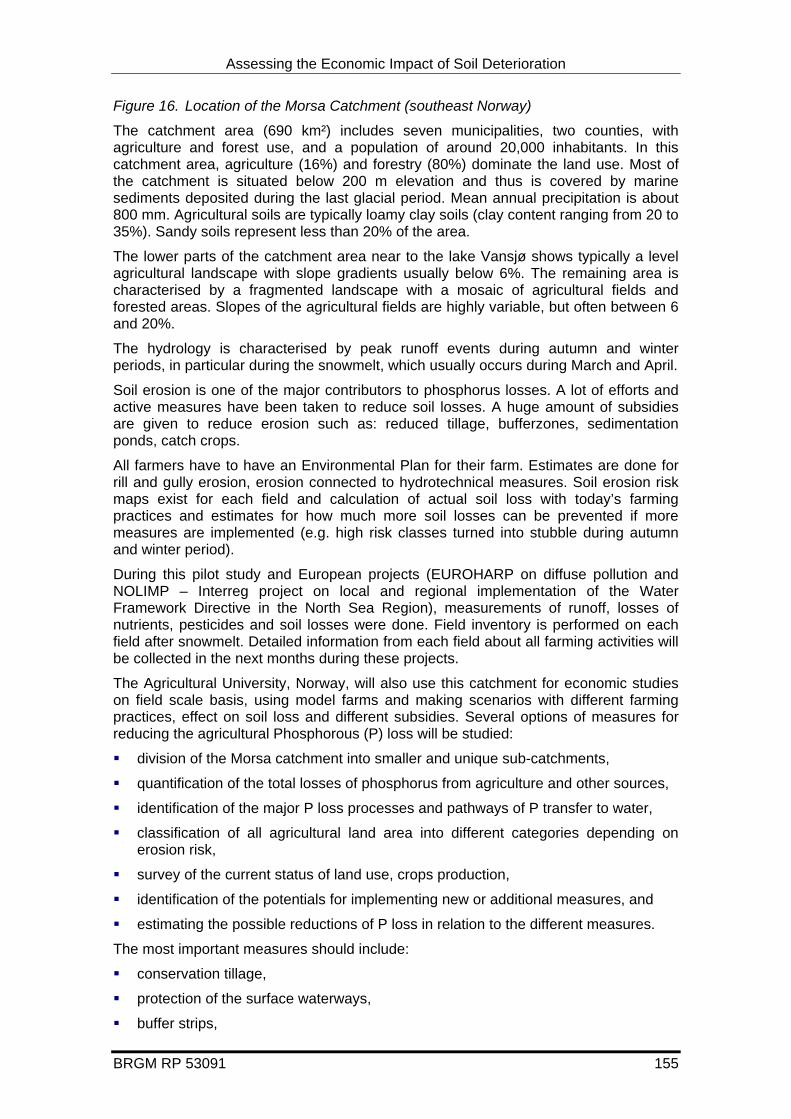
Assessing the Economic Impact of Soil Deterioration
BRGM RP 53091 155
Figure 16. Location of the Morsa Catchment (southeast Norway)
The catchment area (690 km²) includes seven municipalities, two counties, with agriculture and forest use, and a population of around 20,000 inhabitants. In this catchment area, agriculture (16%) and forestry (80%) dominate the land use. Most of the catchment is situated below 200 m elevation and thus is covered by marine sediments deposited during the last glacial period. Mean annual precipitation is about 800 mm. Agricultural soils are typically loamy clay soils (clay content ranging from 20 to 35%). Sandy soils represent less than 20% of the area.
The lower parts of the catchment area near to the lake Vansjø shows typically a level agricultural landscape with slope gradients usually below 6%. The remaining area is characterised by a fragmented landscape with a mosaic of agricultural fields and forested areas. Slopes of the agricultural fields are highly variable, but often between 6 and 20%.
The hydrology is characterised by peak runoff events during autumn and winter periods, in particular during the snowmelt, which usually occurs during March and April.
Soil erosion is one of the major contributors to phosphorus losses. A lot of efforts and active measures have been taken to reduce soil losses. A huge amount of subsidies are given to reduce erosion such as: reduced tillage, bufferzones, sedimentation ponds, catch crops.
All farmers have to have an Environmental Plan for their farm. Estimates are done for rill and gully erosion, erosion connected to hydrotechnical measures. Soil erosion risk maps exist for each field and calculation of actual soil loss with today’s farming practices and estimates for how much more soil losses can be prevented if more measures are implemented (e.g. high risk classes turned into stubble during autumn and winter period).
During this pilot study and European projects (EUROHARP on diffuse pollution and NOLIMP – Interreg project on local and regional implementation of the Water Framework Directive in the North Sea Region), measurements of runoff, losses of nutrients, pesticides and soil losses were done. Field inventory is performed on each field after snowmelt. Detailed information from each field about all farming activities will be collected in the next months during these projects.
The Agricultural University, Norway, will also use this catchment for economic studies on field scale basis, using model farms and making scenarios with different farming practices, effect on soil loss and different subsidies. Several options of measures for reducing the agricultural Phosphorous (P) loss will be studied:
division of the Morsa catchment into smaller and unique sub-catchments,
quantification of the total losses of phosphorus from agriculture and other sources,
identification of the major P loss processes and pathways of P transfer to water,
classification of all agricultural land area into different categories depending on erosion risk,
survey of the current status of land use, crops production,
identification of the potentials for implementing new or additional measures, and
estimating the possible reductions of P loss in relation to the different measures.
The most important measures should include:
conservation tillage,
protection of the surface waterways,
buffer strips,
Assessing the Economic Impact of Soil Deterioration
sedimentation ponds or constructed wetlands,
balanced fertilisation.
The results of the pilot project should be available in the following months.
8.4.4 Finland During the exchanges with the Finnish Ministry for Environment and its experts, some additional information on other threats than contamination was given:
The loss of organic matter and salinisation are not really causing soil degradation in Finland. Also erosion is not a big problem (maybe in some southwestern parts of the country were it is mainly harmful due to its effect to the water quality and in Lapland in places where there are too many reindeers) and therefore if economic impacts exist they are minor.
Acid deposition has been shown not to be a significant factor contributing to forest health in Finland according to the ICP Forest level I defoliation surveys and to have no noticeable effect on soil acidification. Sulphur (S) deposition has substantially declined during the 1990s. Acid deposition on forest production is therefore unlikely.
Levels of heavy metals (e.g. Pd, Cd, Zn and Cu) in humus layer are below concentrations that would affect microbiological activity and ecosystem functioning, including stand growth, except within the immediate vicinity of a few point sources (e.g. Harjavalta). Emissions of heavy metals from the smelters on the Kola Peninsula do not reach Finland, except for a very limited area in northeastern Finnish Lapland.
8.4.5 Other countries During this Case Studies identification, some additional information has been collected through the different contacts:
8.4.6 Situation in other countries Iceland: soil erosion in relation with sheep grazing (Arnalds & Barkarson, 2003),
Denmark: soil erosion where the dominant soil erosion processes are wind, sheet, rill, tillage and bank erosion(Veihe et al., 2003).
England and Wales and agriculture issues (England and Wales Environment Agency, 2002).
Lithuania: soil erosion (Jankauskas and Jankauskiene, 2003).
8.4.7 Situation on some specific threats Wind erosion (Riksen and De Graff, 2001).
Unfortunately, those studies show either the environmental situation or some economic figures. The following contacts with the authors haven’t been successful for complementing the literature documents.
BRGM RP 53091 156
Assessing the Economic Impact of Soil Deterioration
BRGM RP 53091 157
8.5 APPENDIX 4 ENVIRONMENTAL INDICATORS AND SOURCES OF DATA

Assessing the Economic Impact of Soil Deterioration
Table 56. Overview of indicators for soil degradation
Degradation type
Soil quality / degradation indicator Unit Sources of information
Erosion Area affected by erosion (agricultural and non-agricultural) (differentiated by intensity categories)
ha 1) CORINE soil erosion risk assessment: Area under risk of erosion in Southern Europe: 111.4Mha (22.9 Mha = area with high or extreme risk)
2) Plot Database (Cerdan et al.): Area potentially under risk of erosion (with very low risk included): 220 Mha (58 Mha = area with high risk)
Soil loss per year by erosion from agricultural land
t/ha/y Plot Database (Cerdan et al.)
Area under risk of erosion % 1) Plot Database (Cerdan et al.)
2) EEA, 2001
BRGM RP 53091 158
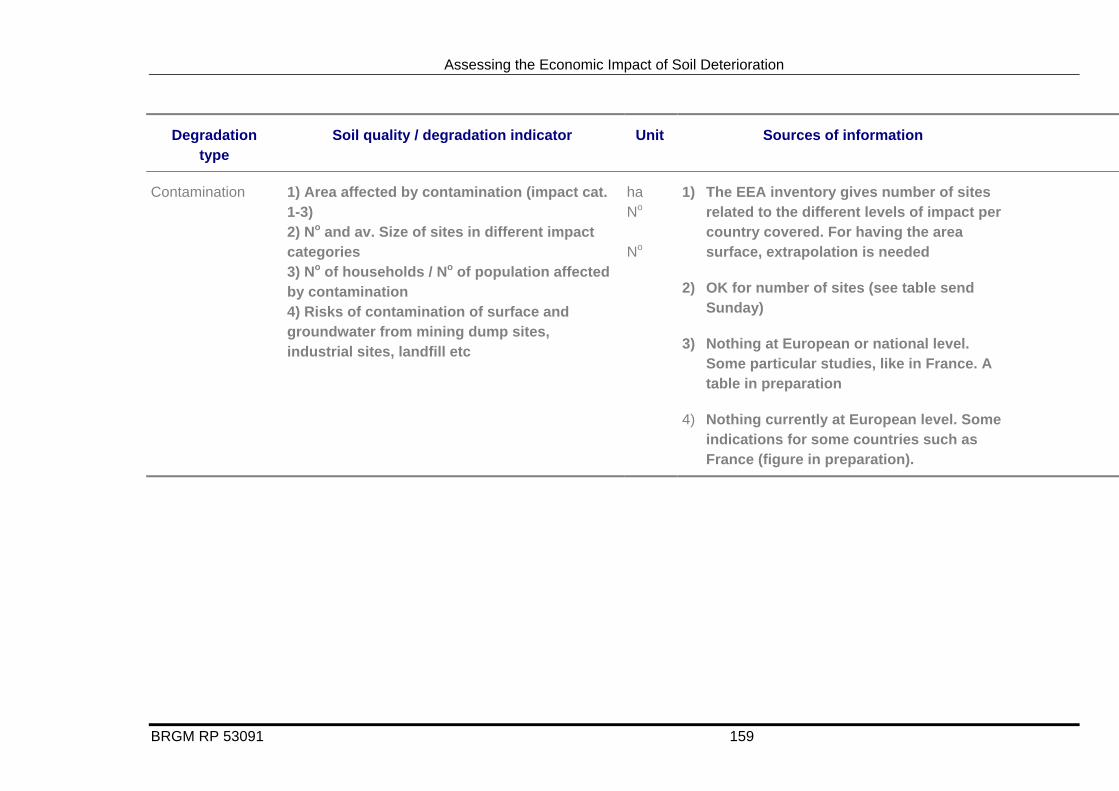
Assessing the Economic Impact of Soil Deterioration
BRGM RP 53091 159
Degradation type
Soil quality / degradation indicator Unit Sources of information
Contamination 1) Area affected by contamination (impact cat. 1-3) 2) No and av. Size of sites in different impact categories 3) No of households / No of population affected by contamination 4) Risks of contamination of surface and groundwater from mining dump sites, industrial sites, landfill etc
ha No No
1) The EEA inventory gives number of sites related to the different levels of impact per country covered. For having the area surface, extrapolation is needed
2) OK for number of sites (see table send Sunday)
3) Nothing at European or national level. Some particular studies, like in France. A table in preparation
4) Nothing currently at European level. Some indications for some countries such as France (figure in preparation).
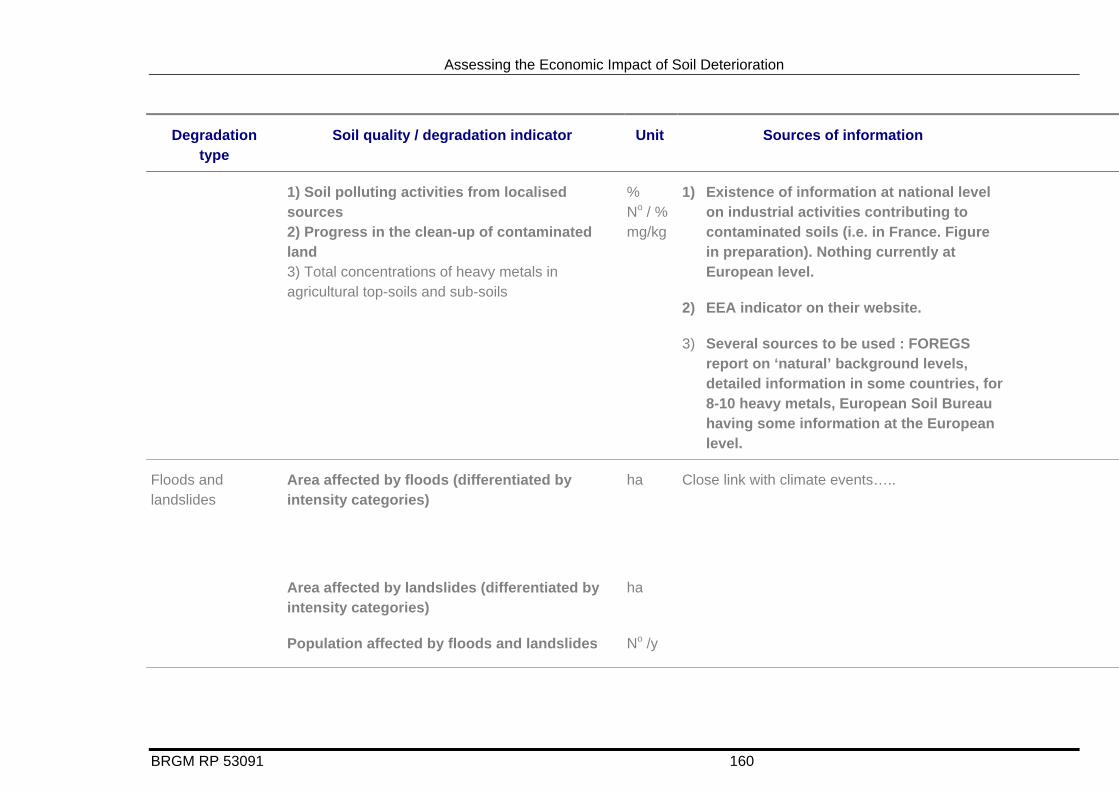
Assessing the Economic Impact of Soil Deterioration
BRGM RP 53091 160
Degradation type
Soil quality / degradation indicator Unit Sources of information
1) Soil polluting activities from localised sources 2) Progress in the clean-up of contaminated land 3) Total concentrations of heavy metals in agricultural top-soils and sub-soils
% No / %mg/kg
1) Existence of information at national level on industrial activities contributing to contaminated soils (i.e. in France. Figure in preparation). Nothing currently at European level.
2) EEA indicator on their website.
3) Several sources to be used : FOREGS report on ‘natural’ background levels, detailed information in some countries, for 8-10 heavy metals, European Soil Bureau having some information at the European level.
Floods and landslides
Area affected by floods (differentiated by intensity categories)
ha Close link with climate events…..
Area affected by landslides (differentiated by intensity categories)
ha
Population affected by floods and landslides No /y
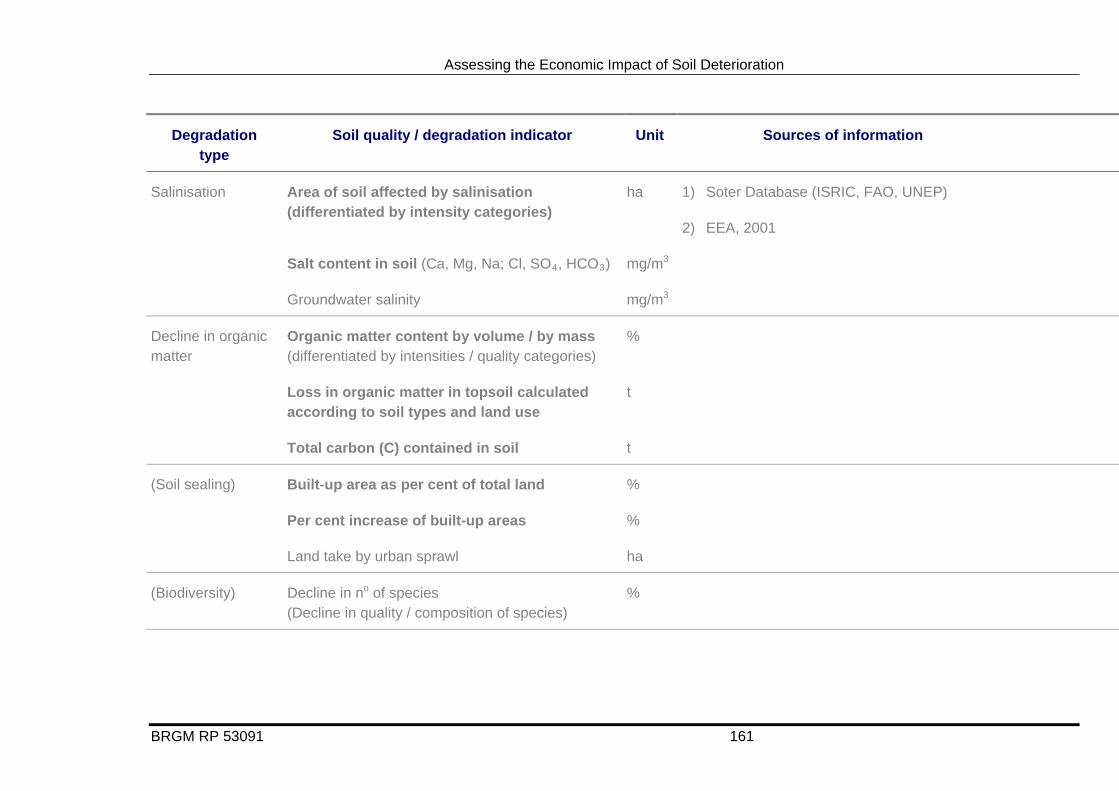
Assessing the Economic Impact of Soil Deterioration
BRGM RP 53091 161
Degradation type
Soil quality / degradation indicator Unit Sources of information
Salinisation Area of soil affected by salinisation (differentiated by intensity categories)
ha 1) Soter Database (ISRIC, FAO, UNEP)
2) EEA, 2001
Salt content in soil (Ca, Mg, Na; Cl, SO4, HCO3) mg/m3
Groundwater salinity mg/m3
Decline in organic matter
Organic matter content by volume / by mass (differentiated by intensities / quality categories)
%
Loss in organic matter in topsoil calculated according to soil types and land use
t
Total carbon (C) contained in soil t
(Soil sealing) Built-up area as per cent of total land %
Per cent increase of built-up areas %
Land take by urban sprawl ha
(Biodiversity) Decline in no of species (Decline in quality / composition of species)
%
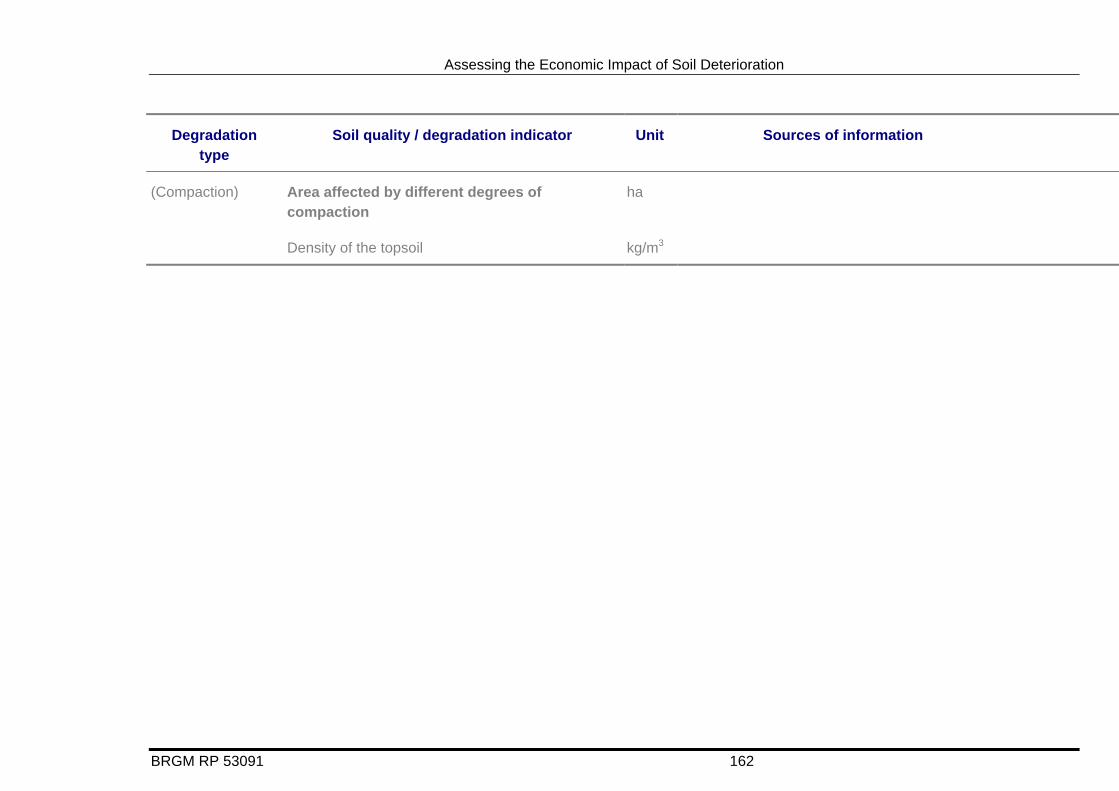
Assessing the Economic Impact of Soil Deterioration
BRGM RP 53091 162
Degradation type
Soil quality / degradation indicator Unit Sources of information
(Compaction) Area affected by different degrees of compaction
ha
Density of the topsoil kg/m3

Assessing the Economic Impact of Soil Deterioration
APPENDIX 4
BRGM RP 53091 163

Assessing the Economic Impact of Soil Deterioration
BRGM SERVICE ENVIRONNEMENT INDUSTRIEL ET PROCÉDÉS INNOVANTS
Unité Environnement industriel BP 6009 - 45060 Orléans cedex 2 - France -Tél. : 33 (0)2 38 64 34 34
BRGM RP 53091 164
Related Documents