Adv Data Anal Classif DOI 10.1007/s11634-014-0186-2 REGULAR ARTICLE Assessing the asymmetric effects on branch rivalry of Spanish financial sector restructuring Marti Sagarra · Frank M. T. A. Busing · Cecilio Mar-Molinero · Josep Rialp Received: 16 August 2013 / Revised: 22 August 2014 / Accepted: 8 September 2014 © Springer-Verlag Berlin Heidelberg 2014 Abstract Spanish financial institutions have been heavily affected by the banking crisis that began in 2008. Many of them, especially Spanish savings banks (or Cajas), had to merge with other institutions or had to be rescued. We address the question of up to what point the nature of competition in this sector has changed as a result of the crisis. Although institutions compete in many ways, we concentrate on their presence in the main street through bank branches open to the public (i.e., retail banking competition). Our measure of inter-firm rivalry is based on a geographical proximity measure that we calculate for the years 2008 (before the crisis) and 2012 (the last available data set). The technical approach is based on multidimensional unfolding, a methodology which allows us to graphically represent the asymmetric nature of such rivalry. These maps visualise the salient aspects of the system during the two dates analysed, and can be understood without a detailed technical knowledge. Keywords Strategy · Competitive market structure · Asymmetric competition · Multidimensional unfolding · Bank branches Mathematics Subject Classification 62H99 · 91B99 · 91C15 M. Sagarra (B ) · C. Mar-Molinero · J. Rialp Department of Business Economics, Faculty of Economics and Business Studies, Universitat Autònoma de Barcelona, 08193 Bellaterra (Cerdanyola del Vallès), Spain e-mail: [email protected] F. M. T. A. Busing Leiden University, Leiden, The Netherlands C. Mar-Molinero Kent Business School, University of Kent, Kent, UK 123

Welcome message from author
This document is posted to help you gain knowledge. Please leave a comment to let me know what you think about it! Share it to your friends and learn new things together.
Transcript
Adv Data Anal ClassifDOI 10.1007/s11634-014-0186-2
REGULAR ARTICLE
Assessing the asymmetric effects on branch rivalryof Spanish financial sector restructuring
Marti Sagarra · Frank M. T. A. Busing ·Cecilio Mar-Molinero · Josep Rialp
Received: 16 August 2013 / Revised: 22 August 2014 / Accepted: 8 September 2014© Springer-Verlag Berlin Heidelberg 2014
Abstract Spanish financial institutions have been heavily affected by the bankingcrisis that began in 2008. Many of them, especially Spanish savings banks (or Cajas),had to merge with other institutions or had to be rescued. We address the question of upto what point the nature of competition in this sector has changed as a result of the crisis.Although institutions compete in many ways, we concentrate on their presence in themain street through bank branches open to the public (i.e., retail banking competition).Our measure of inter-firm rivalry is based on a geographical proximity measure thatwe calculate for the years 2008 (before the crisis) and 2012 (the last available dataset). The technical approach is based on multidimensional unfolding, a methodologywhich allows us to graphically represent the asymmetric nature of such rivalry. Thesemaps visualise the salient aspects of the system during the two dates analysed, andcan be understood without a detailed technical knowledge.
Keywords Strategy · Competitive market structure · Asymmetric competition ·Multidimensional unfolding · Bank branches
Mathematics Subject Classification 62H99 · 91B99 · 91C15
M. Sagarra (B) · C. Mar-Molinero · J. RialpDepartment of Business Economics, Faculty of Economics and Business Studies, Universitat Autònomade Barcelona, 08193 Bellaterra (Cerdanyola del Vallès), Spaine-mail: [email protected]
F. M. T. A. BusingLeiden University, Leiden, The Netherlands
C. Mar-MolineroKent Business School, University of Kent, Kent, UK
123
M. Sagarra et al.
1 Introduction
Analysing the structure of market competition is important in order to understandthe behaviour, performance, and even survival of firms in a given area of activity.Consequently, inter-firm rivalry studies have received much attention in the analysisof strategic behaviour, but these studies have concentrated on industrial analysis, oreven the analysis of strategic groups. Such studies are based on aggregated measures,such as the number of firms, the market share of dominant firms, or concentrationindexes, and they can miss relevant information on the nature of inter-firm rivalry(Fuentelsaz and Gómez 2008).
Chen (1996) goes one step further by changing the emphasis from aggregate indus-try measures to the individual firms that take the decisions. This author suggests thatthe analysis should take into account two dimensions of rivalry: (a) market commonal-ity, based on the number of markets that a firm shares with its rivals, and (b) resourcesimilarity, which takes into account up to what point a competitor shares strategicresources, in type and quantities, with the firm that is the object of the competition.Chen (1996) builds indexes to measure market commonality and resource similar-ity between pairs of firms. Thus, for every sector of activity this procedure makes itpossible to build matrices that capture inter-firm rivalry. These matrices are, in gen-eral, asymmetric, since the competitive pressure that firm A exerts on firm B is notnecessarily the same as the competitive pressure that firm B exerts on firm A.
Although Chen’s concept of market commonality (i.e. multimarket contact) hasattracted much attention for the analysis of various economic sectors, existing studiestake a single-company perspective: the usual approach being to produce as manycompetitive maps as companies are in the dataset, and assess the differences betweentwo or more competitive maps in order to reveal asymmetries in the market. However,such comparisons among multiple maps become difficult when the number of playersis high.
In an attempt to visualise Chen’s market commonality measure, D’Aveni (2001,2002) proposed the drawing of symbolic maps. Symbolic maps contain arrows andcircles of various widths which attempt to reveal the structure of competitive pressureswithin an industry. He gives a detailed discussion of competition in the AmericanAirline Industry and shows how its structure and its subsequent developments can beunderstood with reference to his maps. D’Aveni’s maps do not appear to have beenderived using any particular technical approach. Indeed, he comments that “an initialpressure map is…a formless array of sources and targets of pressure with spaghetti-liketangle lines and arrows connecting them”. He suggests that this initial map should beproduced and later simplified “to show only the relationships that yield clear insights”.Examples of the use of D’Aveni’s symbolic maps based on Chen’s measure are Jansenet al. (2005), and Costa da Cruz and Starke-Rodrigues (2013)
An alternative approach to mapping Chen’s rivalry matrices has been the use ofComplex Network Models. In these models, a graph is created using as nodes the firmsthat compete. The original versions of this approach were based on symmetric rivalrymatrices that used as arc intensity a measure of the degree of competition betweentwo firms such as, for example, the number of products that they have in common. Inlater versions, oriented arcs were used in order to account for the asymmetric nature of
123
Assessing the asymmetric effects on branch rivalry
rivalry between companies, the capacity of the arc being related to Chen’s measuresof market commonality and resource similarity (Monsuur 2005; Yang et al. 2007;Zhuang and Yang 2008). However, the mapping of asymmetric rivalry matrices wasnot successfully resolved, and a two-tier approach was followed: first, a symmetricmatrix was represented using all the firms; and at the second stage, a focal firm wasselected and its competitive relationships with other firms represented. Thus, it wasnecessary to create a second stage map for every firm (Yang et al. 2009).
González-Moreno and Sáez-Martínez (2008) took a different path to the mappingof inter-firm rivalry. They visualized this rivalry using simple configurations obtainedby means of Multidimensional Scaling (MDS) methods. MDS is a sensible approachin this context but, in its basic form, cannot cope with asymmetric relationships suchas the ones that Chen’s approach reveals.
Here we propose a methodology that integrates and visualises inter-firm asymmetriccompetitive relationships, for all the firms, within a single framework. We propose thatmultidimensional unfolding (MDU) techniques be used to construct a configurationthat visualises the asymmetric nature of inter-firm rivalry and reveals its mean features.
MDU can be used to visualise all the firms that compete in a given market and theasymmetric nature of this competition in a single map. It has the advantage that themaps are not difficult to understand, and that the technique can be generalised in orderto include a further aspect of competition: its evolution over time. MDU has been usedbefore in the analysis of competition as, for example, by De Sarbo and Grewal (2007).However, De Sarbo and Grewal, applied MDU to consumer choice sets and not to theanalysis of rivalry between companies.
Our aim is to assess changes in the rivalry structure of the Spanish banking sectorbefore and after its restructuring as a consequence of the financial crisis whose start canbe traced to the year 2008. We base our work on Chen’s concept of market common-ality. Competition between banking institutions can take place in many ways, but herewe concentrate on the presence of branches of Commercial Banks and Cajas (savingsbanks) in the main street (i.e., retail banking competition), something that has receivedmuch attention in Spain after the de-regulation of the Cajas (Serra Ramoneda 2011).
As a result of fierce rivalry between institutions, the number of branches of the Cajasexpanded continuously between 1985 and 2008 only to suffer a strong decline afterthis date. We take the year 2008, the last one before the financial crisis, and the year2012, the last year for which we have data, and ask the following questions. First, is itpossible to visualize, using information from the branch networks of Spanish financialinstitutions—at postal code level—the whole asymmetric competitive structure of thesector? Second, is it possible to visualise the changes of this competitive structurebetween the years 2008 and 2012, their effects, and their implications?
It is concluded in the paper that, despite the many changes that have taken placeduring the period studied, the basic structure of the banking sector in Spain remainsunchanged. Before the financial crisis there were a few large banking institutions thatalso operate in international markets, and a number of smaller national institutions,mainly Cajas (savings banks) that tended to offer neighbourhood banking servicesand tended to operate within a regional scope. The regulator, acting on the view thatthe financial crisis had hit the Cajas harder because of their smaller size, encouraged aseries of mergers between Cajas on the grounds that this would improve their chances
123
M. Sagarra et al.
of surviving in the market. We find that, although these mergers took place, the resultinginstitutions were not large enough to substantially change the nature of rivalry inSpanish banking.
After this introduction we give a short background to the changes that have takenplace in Spain with respect to financial institutions, mainly Cajas. This is followed by adiscussion of Chen’s (1996) concept of market commonality, on which our analysis isbased, and the way in which this concept is applied to Spanish financial institutions. Asection on data sources and another section on methodology follow. Empirical findingsare presented next, and the paper ends with a concluding section.
2 Evolution of the financial industry in Spain
The traditional players in Spanish banking sector have been commercial banks, theCajas (savings banks), and credit cooperatives. During the decade 2001–2010 thecommercial banks and the Cajas have accounted each for about one half of the Spanishcredit market, while credit cooperatives have held approximately the remaining 5 %of the market (Bank of Spain 2011).
Until 1977 Cajas and commercial banks had different regulatory frameworks, but aRoyal Decree (Real Decreto 2290/1977) established functional equivalence betweenthese two kinds of institutions by increasing the Cajas’ operational freedom and byopening the Spanish financial system to international capital markets. Since then, theCajas are no longer publicly managed and highly controlled entities, and have becomedirect competitors for commercial banks. Until recently, the mutual status of the Cajasprevented their being acquired by commercial banks.
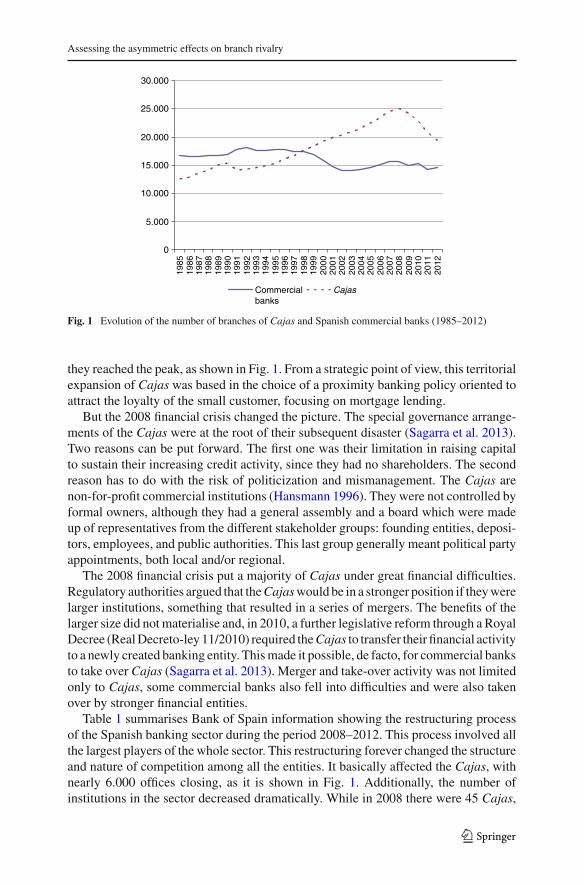
Competition between Cajas and commercial banks initially focused on depositscapture, and was followed by the expansion of the Cajas’ credit operations (Azofra-Palenzuela and Santamaría-Mariscal 2004), but it was not until 1988 that this com-petition strongly hardened. Before and during the 1980s, the Cajas were restricted intheir geographical coverage (at a Province level), something that is often reflected intheir name, but a 1988 Royal Decree (Real Decreto 1582/1988) permitted the Cajasto operate anywhere in the country, thus further enhancing competition in the Spanishfinancial sector. Figure 1, prepared with Bank of Spain data, shows the evolution ofthe number of branches of Cajas compared with those of commercial banks for theperiod 1985–2012.
As a result of regulatory changes, Commercial banks and Cajas competed in equalterms, and their mutual or private owned status ceased to influence their strategic poli-cies. In what follows, we will refer to both institutions as if they were an homogeneousgroup. As a consequence, the Cajas began to displace commercial banks from theirtraditional markets and businesses, especially retail banking. Figure 1 shows that dur-ing the 1990s almost 4,000 commercial bank branches were closed. Simultaneously,commercial banks strengthened their international areas of business. At the same time,and due to these strategic moves made by commercial banks, the Cajas multiplied theirpresence in the main street by opening branches all over Spain (Azofra-Palenzuela andSantamaría-Mariscal 2004). In less than 25 years the Cajas doubled the number ofbranches, from 12,547 branches in 1985 to 24,985 branches in 2008, the year in which
123
Assessing the asymmetric effects on branch rivalry
0
5.000
10.000
15.000
20.000
25.000
30.000
1985
1986
1987
1988
1989
1990
1991
1992
1993
1994
1995
1996
1997
1998
1999
2000
2001
2002
2003
2004
2005
2006
2007
2008
2009
2010
2011
2012
Commercialbanks
Cajas
Fig. 1 Evolution of the number of branches of Cajas and Spanish commercial banks (1985–2012)
they reached the peak, as shown in Fig. 1. From a strategic point of view, this territorialexpansion of Cajas was based in the choice of a proximity banking policy oriented toattract the loyalty of the small customer, focusing on mortgage lending.
But the 2008 financial crisis changed the picture. The special governance arrange-ments of the Cajas were at the root of their subsequent disaster (Sagarra et al. 2013).Two reasons can be put forward. The first one was their limitation in raising capitalto sustain their increasing credit activity, since they had no shareholders. The secondreason has to do with the risk of politicization and mismanagement. The Cajas arenon-for-profit commercial institutions (Hansmann 1996). They were not controlled byformal owners, although they had a general assembly and a board which were madeup of representatives from the different stakeholder groups: founding entities, deposi-tors, employees, and public authorities. This last group generally meant political partyappointments, both local and/or regional.
The 2008 financial crisis put a majority of Cajas under great financial difficulties.Regulatory authorities argued that the Cajas would be in a stronger position if they werelarger institutions, something that resulted in a series of mergers. The benefits of thelarger size did not materialise and, in 2010, a further legislative reform through a RoyalDecree (Real Decreto-ley 11/2010) required the Cajas to transfer their financial activityto a newly created banking entity. This made it possible, de facto, for commercial banksto take over Cajas (Sagarra et al. 2013). Merger and take-over activity was not limitedonly to Cajas, some commercial banks also fell into difficulties and were also takenover by stronger financial entities.
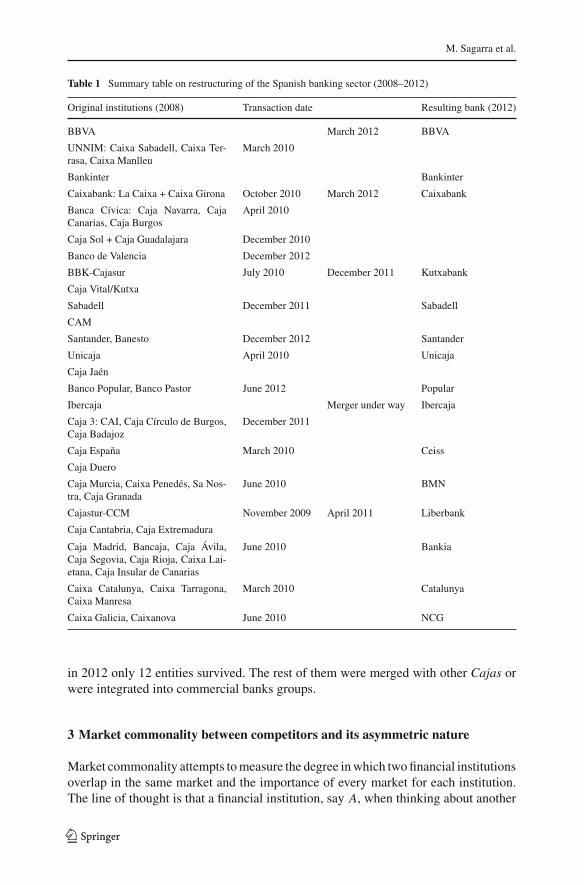
Table 1 summarises Bank of Spain information showing the restructuring processof the Spanish banking sector during the period 2008–2012. This process involved allthe largest players of the whole sector. This restructuring forever changed the structureand nature of competition among all the entities. It basically affected the Cajas, withnearly 6.000 offices closing, as it is shown in Fig. 1. Additionally, the number ofinstitutions in the sector decreased dramatically. While in 2008 there were 45 Cajas,
123
M. Sagarra et al.
Table 1 Summary table on restructuring of the Spanish banking sector (2008–2012)
Original institutions (2008) Transaction date Resulting bank (2012)
BBVA March 2012 BBVA
UNNIM: Caixa Sabadell, Caixa Ter-rasa, Caixa Manlleu
March 2010
Bankinter Bankinter
Caixabank: La Caixa + Caixa Girona October 2010 March 2012 Caixabank
Banca Cívica: Caja Navarra, CajaCanarias, Caja Burgos
April 2010
Caja Sol + Caja Guadalajara December 2010
Banco de Valencia December 2012
BBK-Cajasur July 2010 December 2011 Kutxabank
Caja Vital/Kutxa
Sabadell December 2011 Sabadell
CAM
Santander, Banesto December 2012 Santander
Unicaja April 2010 Unicaja
Caja Jaén
Banco Popular, Banco Pastor June 2012 Popular
Ibercaja Merger under way Ibercaja
Caja 3: CAI, Caja Círculo de Burgos,Caja Badajoz
December 2011
Caja España March 2010 Ceiss
Caja Duero
Caja Murcia, Caixa Penedés, Sa Nos-tra, Caja Granada
June 2010 BMN
Cajastur-CCM November 2009 April 2011 Liberbank
Caja Cantabria, Caja Extremadura
Caja Madrid, Bancaja, Caja Ávila,Caja Segovia, Caja Rioja, Caixa Lai-etana, Caja Insular de Canarias
June 2010 Bankia
Caixa Catalunya, Caixa Tarragona,Caixa Manresa
March 2010 Catalunya
Caixa Galicia, Caixanova June 2010 NCG
in 2012 only 12 entities survived. The rest of them were merged with other Cajas orwere integrated into commercial banks groups.
3 Market commonality between competitors and its asymmetric nature
Market commonality attempts to measure the degree in which two financial institutionsoverlap in the same market and the importance of every market for each institution.The line of thought is that a financial institution, say A, when thinking about another
123
Assessing the asymmetric effects on branch rivalry
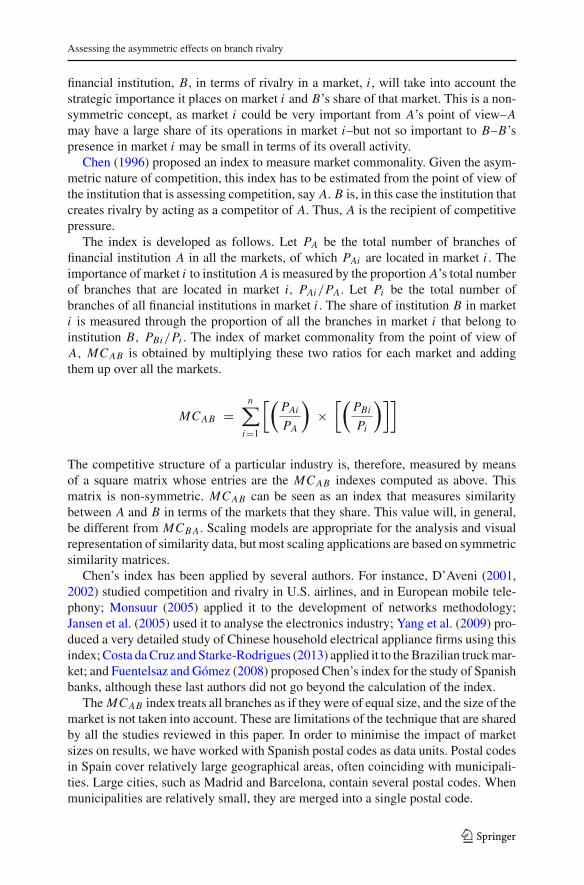
financial institution, B, in terms of rivalry in a market, i , will take into account thestrategic importance it places on market i and B’s share of that market. This is a non-symmetric concept, as market i could be very important from A’s point of view–Amay have a large share of its operations in market i–but not so important to B–B’spresence in market i may be small in terms of its overall activity.
Chen (1996) proposed an index to measure market commonality. Given the asym-metric nature of competition, this index has to be estimated from the point of view ofthe institution that is assessing competition, say A. B is, in this case the institution thatcreates rivalry by acting as a competitor of A. Thus, A is the recipient of competitivepressure.
The index is developed as follows. Let PA be the total number of branches offinancial institution A in all the markets, of which PAi are located in market i . Theimportance of market i to institution A is measured by the proportion A’s total numberof branches that are located in market i, PAi/PA. Let Pi be the total number ofbranches of all financial institutions in market i . The share of institution B in marketi is measured through the proportion of all the branches in market i that belong toinstitution B, PBi/Pi . The index of market commonality from the point of view ofA, MCAB is obtained by multiplying these two ratios for each market and addingthem up over all the markets.
MCAB =n∑
i=1
[(PAi
PA
)×
[(PBi
Pi
)]]
The competitive structure of a particular industry is, therefore, measured by meansof a square matrix whose entries are the MCAB indexes computed as above. Thismatrix is non-symmetric. MCAB can be seen as an index that measures similaritybetween A and B in terms of the markets that they share. This value will, in general,be different from MCB A. Scaling models are appropriate for the analysis and visualrepresentation of similarity data, but most scaling applications are based on symmetricsimilarity matrices.
Chen’s index has been applied by several authors. For instance, D’Aveni (2001,2002) studied competition and rivalry in U.S. airlines, and in European mobile tele-phony; Monsuur (2005) applied it to the development of networks methodology;Jansen et al. (2005) used it to analyse the electronics industry; Yang et al. (2009) pro-duced a very detailed study of Chinese household electrical appliance firms using thisindex; Costa da Cruz and Starke-Rodrigues (2013) applied it to the Brazilian truck mar-ket; and Fuentelsaz and Gómez (2008) proposed Chen’s index for the study of Spanishbanks, although these last authors did not go beyond the calculation of the index.
The MCAB index treats all branches as if they were of equal size, and the size of themarket is not taken into account. These are limitations of the technique that are sharedby all the studies reviewed in this paper. In order to minimise the impact of marketsizes on results, we have worked with Spanish postal codes as data units. Postal codesin Spain cover relatively large geographical areas, often coinciding with municipali-ties. Large cities, such as Madrid and Barcelona, contain several postal codes. Whenmunicipalities are relatively small, they are merged into a single postal code.
123
M. Sagarra et al.
In this paper we use Multidimensional Unfolding (MDU), a technique that belongsto the Multidimensional Scaling family, and that is appropriate for non-symmetric(two-way, two-mode) distance data, in order to visualise the main features in Chen’srivalry matrix.
The analysis of non-symmetric relationships using multidimensional scaling mod-els has received relatively little attention as compared to ordinary multidimensionalscaling models, although there are some exceptions that confirm the rule such as, forexample, citations among journals (Heiser and Busing 2004; Leydesdorff and Vaughan2006; Schneider and Borlund 2009), car switching (Harshman et al. 1982; Okada andImaizumi 1987), voting behaviour (De Rooij 2012), or brand switching (De Sarbo andGrewal 2007; Okada and Tsurumi 2012).
4 The data
The source of our data is the Guide of Banks, Credit Cooperatives and Spanish SavingsBanks, edited yearly by Maestre-Ediban publishing house, in particular the years 2008and 2012. We have chosen this database because it records the location of the branchesof all the Spanish financial institutions at postal code level. There are other databasesin existence, but they do not contain so much detail. This choice allows us to analyzethe competitive structure of the Spanish financial sector with an unusual level of detail.An analysis at a higher level of aggregation could mask some important competitivefeatures among institutions.
As a first step, it was necessary to clean the database. Financial institutions that didnot have a physical branch were removed. We removed branches that did not engage inany financial activity. We also removed branches that were assigned to more than oneentity at the same address and took care with branches that had changed ownershipafter a process of merger. Finally, we checked that, for a given financial institution, thetotal number of branches given by our cleaned dataset matched the total number ofbranches given by the periodically published Statistical Bulletin from Bank of Spain,or the total number of branches given by the Statistical Yearbooks published by threeSpanish banking associations.
5 Methodological approach
We calculated Chen’s market commonality indexes for all financial institutions in theSpanish market in 2008 and 2012. These indexes were collected in a rivalry matrix for2008 and another rivalry matrix for 2012. However, the rivalry matrices do not containall the financial institutions. Since our goal is to analyse the impact of competitionon financial restructuring and to visualise it in the form of configurations, not allinstitutions were included in the rivalry matrices. The inclusion of all the institutionswould have resulted in much more cluttered configuration. We included in the rivalrymatrices the 15 financial institutions that remained in 2012. When the institution, in2012, was the result of a merger, we included in the 2008 matrix the leading memberof the group, as given in Table 1. The indexes in the matrices were, however, computedtaking into account all the financial institutions. Although we represent only the most
123
Assessing the asymmetric effects on branch rivalry
important surviving institutions, we respected the influence exerted by the institutionsnot included in the rivalry matrices. The 15 institutions in the rivalry matrices accountedfor 51 % of the total number of branches in the business in 2008, and for 83.5 % of thebranches in 2012. We also performed the analysis with larger matrices that includedall the financial institutions in the data set, but the results reported here did not change.
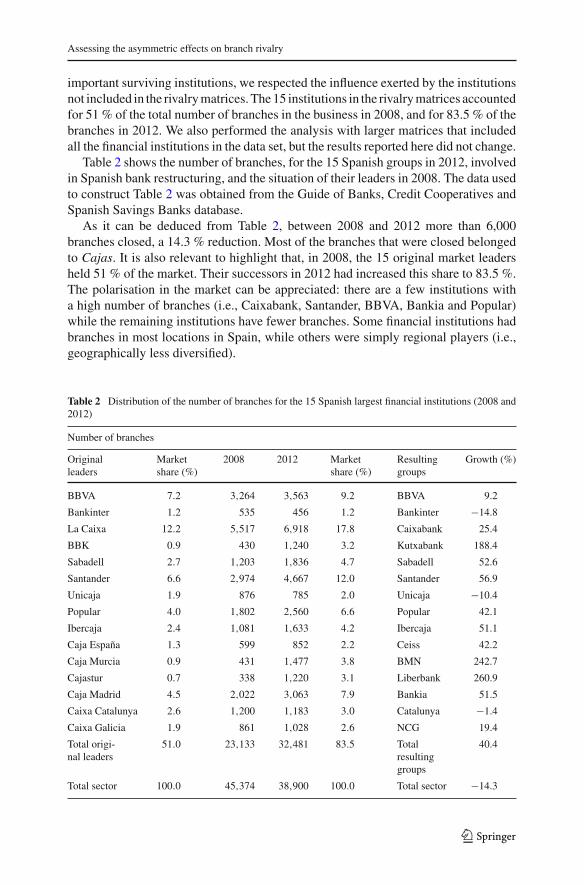
Table 2 shows the number of branches, for the 15 Spanish groups in 2012, involvedin Spanish bank restructuring, and the situation of their leaders in 2008. The data usedto construct Table 2 was obtained from the Guide of Banks, Credit Cooperatives andSpanish Savings Banks database.
As it can be deduced from Table 2, between 2008 and 2012 more than 6,000branches closed, a 14.3 % reduction. Most of the branches that were closed belongedto Cajas. It is also relevant to highlight that, in 2008, the 15 original market leadersheld 51 % of the market. Their successors in 2012 had increased this share to 83.5 %.The polarisation in the market can be appreciated: there are a few institutions witha high number of branches (i.e., Caixabank, Santander, BBVA, Bankia and Popular)while the remaining institutions have fewer branches. Some financial institutions hadbranches in most locations in Spain, while others were simply regional players (i.e.,geographically less diversified).
Table 2 Distribution of the number of branches for the 15 Spanish largest financial institutions (2008 and2012)
Number of branches
Originalleaders
Marketshare (%)
2008 2012 Marketshare (%)
Resultinggroups
Growth (%)
BBVA 7.2 3,264 3,563 9.2 BBVA 9.2
Bankinter 1.2 535 456 1.2 Bankinter −14.8
La Caixa 12.2 5,517 6,918 17.8 Caixabank 25.4
BBK 0.9 430 1,240 3.2 Kutxabank 188.4
Sabadell 2.7 1,203 1,836 4.7 Sabadell 52.6
Santander 6.6 2,974 4,667 12.0 Santander 56.9
Unicaja 1.9 876 785 2.0 Unicaja −10.4
Popular 4.0 1,802 2,560 6.6 Popular 42.1
Ibercaja 2.4 1,081 1,633 4.2 Ibercaja 51.1
Caja España 1.3 599 852 2.2 Ceiss 42.2
Caja Murcia 0.9 431 1,477 3.8 BMN 242.7
Cajastur 0.7 338 1,220 3.1 Liberbank 260.9
Caja Madrid 4.5 2,022 3,063 7.9 Bankia 51.5
Caixa Catalunya 2.6 1,200 1,183 3.0 Catalunya −1.4
Caixa Galicia 1.9 861 1,028 2.6 NCG 19.4
Total origi-nal leaders
51.0 23,133 32,481 83.5 Totalresultinggroups
40.4
Total sector 100.0 45,374 38,900 100.0 Total sector −14.3
123
M. Sagarra et al.
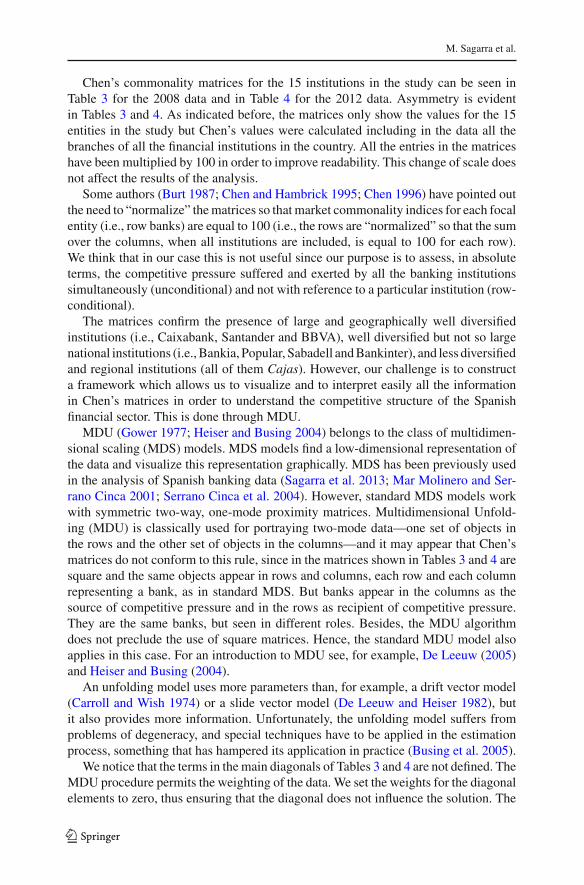
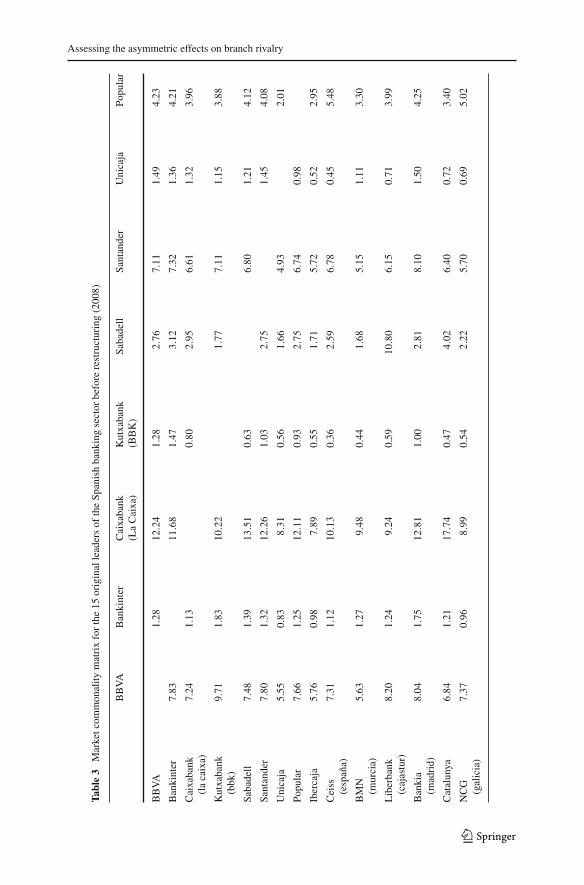
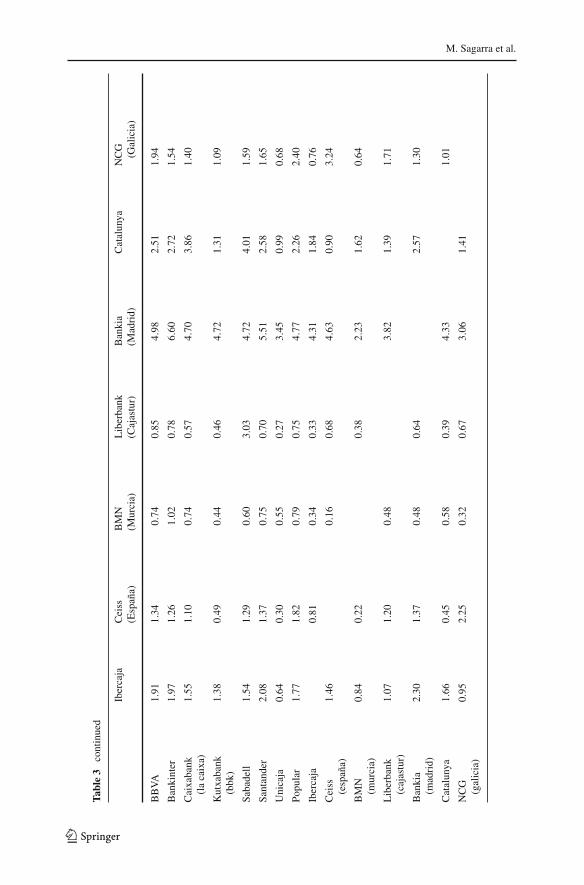
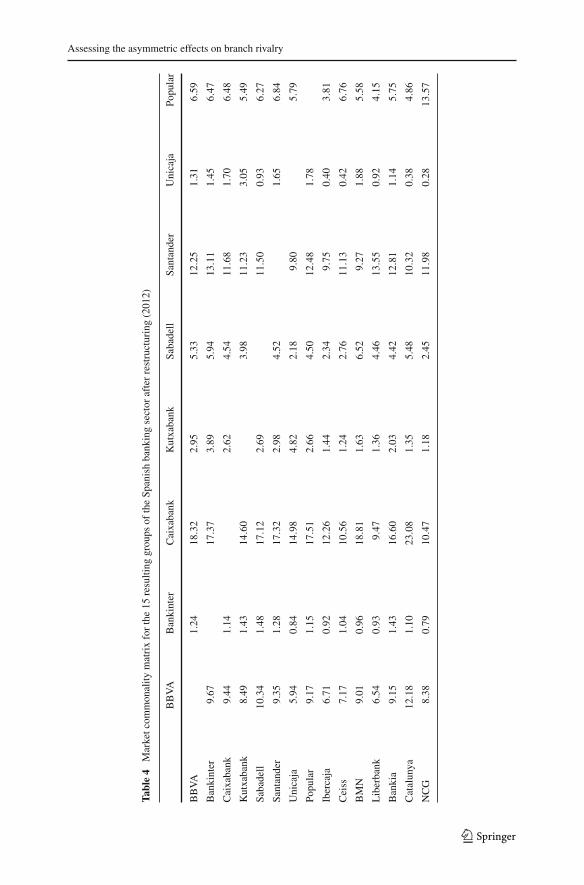
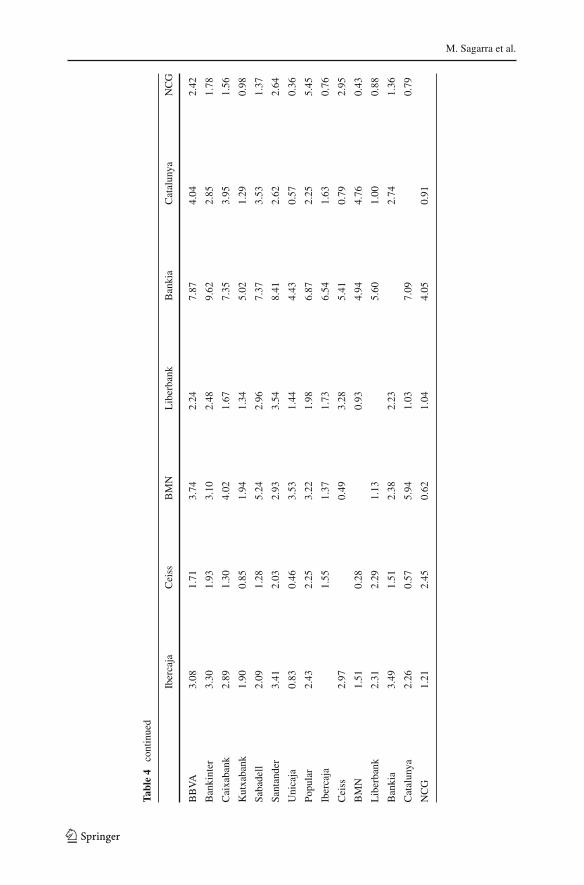
Chen’s commonality matrices for the 15 institutions in the study can be seen inTable 3 for the 2008 data and in Table 4 for the 2012 data. Asymmetry is evidentin Tables 3 and 4. As indicated before, the matrices only show the values for the 15entities in the study but Chen’s values were calculated including in the data all thebranches of all the financial institutions in the country. All the entries in the matriceshave been multiplied by 100 in order to improve readability. This change of scale doesnot affect the results of the analysis.
Some authors (Burt 1987; Chen and Hambrick 1995; Chen 1996) have pointed outthe need to “normalize” the matrices so that market commonality indices for each focalentity (i.e., row banks) are equal to 100 (i.e., the rows are “normalized” so that the sumover the columns, when all institutions are included, is equal to 100 for each row).We think that in our case this is not useful since our purpose is to assess, in absoluteterms, the competitive pressure suffered and exerted by all the banking institutionssimultaneously (unconditional) and not with reference to a particular institution (row-conditional).
The matrices confirm the presence of large and geographically well diversifiedinstitutions (i.e., Caixabank, Santander and BBVA), well diversified but not so largenational institutions (i.e., Bankia, Popular, Sabadell and Bankinter), and less diversifiedand regional institutions (all of them Cajas). However, our challenge is to constructa framework which allows us to visualize and to interpret easily all the informationin Chen’s matrices in order to understand the competitive structure of the Spanishfinancial sector. This is done through MDU.
MDU (Gower 1977; Heiser and Busing 2004) belongs to the class of multidimen-sional scaling (MDS) models. MDS models find a low-dimensional representation ofthe data and visualize this representation graphically. MDS has been previously usedin the analysis of Spanish banking data (Sagarra et al. 2013; Mar Molinero and Ser-rano Cinca 2001; Serrano Cinca et al. 2004). However, standard MDS models workwith symmetric two-way, one-mode proximity matrices. Multidimensional Unfold-ing (MDU) is classically used for portraying two-mode data—one set of objects inthe rows and the other set of objects in the columns—and it may appear that Chen’smatrices do not conform to this rule, since in the matrices shown in Tables 3 and 4 aresquare and the same objects appear in rows and columns, each row and each columnrepresenting a bank, as in standard MDS. But banks appear in the columns as thesource of competitive pressure and in the rows as recipient of competitive pressure.They are the same banks, but seen in different roles. Besides, the MDU algorithmdoes not preclude the use of square matrices. Hence, the standard MDU model alsoapplies in this case. For an introduction to MDU see, for example, De Leeuw (2005)and Heiser and Busing (2004).
An unfolding model uses more parameters than, for example, a drift vector model(Carroll and Wish 1974) or a slide vector model (De Leeuw and Heiser 1982), butit also provides more information. Unfortunately, the unfolding model suffers fromproblems of degeneracy, and special techniques have to be applied in the estimationprocess, something that has hampered its application in practice (Busing et al. 2005).
We notice that the terms in the main diagonals of Tables 3 and 4 are not defined. TheMDU procedure permits the weighting of the data. We set the weights for the diagonalelements to zero, thus ensuring that the diagonal does not influence the solution. The
123
Assessing the asymmetric effects on branch rivalry
Tabl
e3
Mar
ketc
omm
onal
itym
atri
xfo
rth
e15
orig
inal
lead
ers
ofth
eSp
anis
hba
nkin
gse
ctor
befo
rere
stru
ctur
ing
(200
8)
BB
VA
Ban
kint
erC
aixa
bank
(La
Cai
xa)
Kut
xaba
nk(B
BK
)Sa
bade
llSa
ntan
der
Uni
caja
Popu
lar
BB
VA
1.28
12.2
41.
282.
767.
111.
494.
23
Ban
kint
er7.
8311
.68
1.47
3.12
7.32
1.36
4.21
Cai
xaba
nk(l
aca
ixa)
7.24
1.13
0.80
2.95
6.61
1.32
3.96
Kut
xaba
nk(b
bk)
9.71
1.83
10.2
21.
777.
111.
153.
88
Saba
dell
7.48
1.39
13.5
10.
636.
801.
214.
12
Sant
ande
r7.
801.
3212
.26
1.03
2.75
1.45
4.08
Uni
caja
5.55
0.83
8.31
0.56
1.66
4.93
2.01
Popu
lar
7.66
1.25
12.1
10.
932.
756.
740.
98
Iber
caja
5.76
0.98
7.89
0.55
1.71
5.72
0.52
2.95
Cei
ss(e
spañ
a)7.
311.
1210
.13
0.36
2.59
6.78
0.45
5.48
BM
N(m
urci
a)5.
631.
279.
480.
441.
685.
151.
113.
30
Lib
erba
nk(c
ajas
tur)
8.20
1.24
9.24
0.59
10.8
06.
150.
713.
99
Ban
kia
(mad
rid)
8.04
1.75
12.8
11.
002.
818.
101.
504.
25
Cat
alun
ya6.
841.
2117
.74
0.47
4.02
6.40
0.72
3.40
NC
G(g
alic
ia)
7.37
0.96
8.99
0.54
2.22
5.70
0.69
5.02
123
M. Sagarra et al.
Tabl
e3
cont
inue
d
Iber
caja
Cei
ss(E
spañ
a)B
MN
(Mur
cia)
Lib
erba
nk(C
ajas
tur)
Ban
kia
(Mad
rid)
Cat
alun
yaN
CG
(Gal
icia
)
BB
VA
1.91
1.34
0.74
0.85
4.98
2.51
1.94
Ban
kint
er1.
971.
261.
020.
786.
602.
721.
54
Cai
xaba
nk(l
aca
ixa)
1.55
1.10
0.74
0.57
4.70
3.86
1.40
Kut
xaba
nk(b
bk)
1.38
0.49
0.44
0.46
4.72
1.31
1.09
Saba
dell
1.54
1.29
0.60
3.03
4.72
4.01
1.59
Sant
ande
r2.
081.
370.
750.
705.
512.
581.
65
Uni
caja
0.64
0.30
0.55
0.27
3.45
0.99
0.68
Popu
lar
1.77
1.82
0.79
0.75
4.77
2.26
2.40
Iber
caja
0.81
0.34
0.33
4.31
1.84
0.76
Cei
ss(e
spañ
a)1.
460.
160.
684.
630.
903.
24
BM
N(m
urci
a)0.
840.
220.
382.
231.
620.
64
Lib
erba
nk(c
ajas
tur)
1.07
1.20
0.48
3.82
1.39
1.71
Ban
kia
(mad
rid)
2.30
1.37
0.48
0.64
2.57
1.30
Cat
alun
ya1.
660.
450.
580.
394.
331.
01
NC
G(g
alic
ia)
0.95
2.25
0.32
0.67
3.06
1.41
123
Assessing the asymmetric effects on branch rivalry
Tabl
e4
Mar
ketc
omm
onal
itym
atri
xfo
rth
e15
resu
lting
grou
psof
the
Span
ish
bank
ing
sect
oraf
ter
rest
ruct
urin
g(2
012)
BB
VA
Ban
kint
erC
aixa
bank
Kut
xaba
nkSa
bade
llSa
ntan
der
Uni
caja
Popu
lar
BB
VA
1.24
18.3
22.
955.
3312
.25
1.31
6.59
Ban
kint
er9.
6717
.37
3.89
5.94
13.1
11.
456.
47
Cai
xaba
nk9.
441.
142.
624.
5411
.68
1.70
6.48
Kut
xaba
nk8.
491.
4314
.60
3.98
11.2
33.
055.
49
Saba
dell
10.3
41.
4817
.12
2.69
11.5
00.
936.
27
Sant
ande
r9.
351.
2817
.32
2.98
4.52
1.65
6.84
Uni
caja
5.94
0.84
14.9
84.
822.
189.
805.
79
Popu
lar
9.17
1.15
17.5
12.
664.
5012
.48
1.78
Iber
caja
6.71
0.92
12.2
61.
442.
349.
750.
403.
81
Cei
ss7.
171.
0410
.56
1.24
2.76
11.1
30.
426.
76
BM
N9.
010.
9618
.81
1.63
6.52
9.27
1.88
5.58
Lib
erba
nk6.
540.
939.
471.
364.
4613
.55
0.92
4.15
Ban
kia
9.15
1.43
16.6
02.
034.
4212
.81
1.14
5.75
Cat
alun
ya12
.18
1.10
23.0
81.
355.
4810
.32
0.38
4.86
NC
G8.
380.
7910
.47
1.18
2.45
11.9
80.
2813
.57
123
M. Sagarra et al.
Tabl
e4
cont
inue
d
Iber
caja
Cei
ssB
MN
Lib
erba
nkB
anki
aC
atal
unya
NC
G
BB
VA
3.08
1.71
3.74
2.24
7.87
4.04
2.42
Ban
kint
er3.
301.
933.
102.
489.
622.
851.
78
Cai
xaba
nk2.
891.
304.
021.
677.
353.
951.
56
Kut
xaba
nk1.
900.
851.
941.
345.
021.
290.
98
Saba
dell
2.09
1.28
5.24
2.96
7.37
3.53
1.37
Sant
ande
r3.
412.
032.
933.
548.
412.
622.
64
Uni
caja
0.83
0.46
3.53
1.44
4.43
0.57
0.36
Popu
lar
2.43
2.25
3.22
1.98
6.87
2.25
5.45
Iber
caja
1.55
1.37
1.73
6.54
1.63
0.76
Cei
ss2.
970.
493.
285.
410.
792.
95
BM
N1.
510.
280.
934.
944.
760.
43
Lib
erba
nk2.
312.
291.
135.
601.
000.
88
Ban
kia
3.49
1.51
2.38
2.23
2.74
1.36
Cat
alun
ya2.
260.
575.
941.
037.
090.
79
NC
G1.
212.
450.
621.
044.
050.
91
123
Assessing the asymmetric effects on branch rivalry
off-diagonal elements can be interpreted as similarities because large values indicatestrong competitors that operate with similar intensity in each market and for whomthe markets are equally important.
For unfolding, similarities need to be converted into dissimilarities, and due to thelarge differences in the size of the coefficients, and to the many almost zero valuesin the matrices, a reverse scale transformation was employed as suggested by Fleisset al. (2003), i.e.,
δAB = 1√sin−1(MCAB)
The sinus transformation is used to reverse the scale and to differentiate in the objectsthat have close-to-zero values (De Sarbo and Grewal 2007). If we do not transformthe initial data, the almost zero values dominate the solution in such a way that thepoints in the solution collapse and only a few very tight clusters remain.
The most important reason for distinguishing between all close-to-zero values lies inthe rational initial configuration. Since the “classical scaling” employed here uses theactual data values, and not their rank orders, it is of great importance that the data showsome variation. Furthermore, we do not use an optimal monotone transformation, butan optimal spline transformation, since this provides the best interpretable solution.As an alternative, we could have used an ordinal transformation, and base the analysison rank orders. This would have differentiated between the close-to-zero data values,but it would also have removed all interval information.
Decomposition of the asymmetric 2008 matrix into a symmetric and a skew-symmetric component shows that 77.5 % of the total sum-of-squares is due to sym-metry and 22.5 % is due to asymmetry (79.9 and 20.1 % for 2012). This implies that,although the symmetric part is dominant, the asymmetric part is large enough to justifyan asymmetrical analysis, as done here.
For the unfolding analysis, we used a preliminary version of IBM SPSS PREFS-CAL (available from [email protected]) with defaults options except for thefollowing: an unconditional monotone spline transformation (second degree and oneinterior knot) was used for improved comparability and fit and penalty parameter ω
(omega) was set equal to 2.0 for some increase in variation. Both a rational start (clas-sical scaling on the super-matrix with imputations based on the triangle inequality)and multiple random starts were used to avoid local minima and to obtain the bestpossible solution.
The fit of the two-dimensional solutions was good [stress-I = 0.1054 (2008) and0.1386 (2012)]. The fit of the three-dimensional solutions was better, obviously, butnot worth the additional interpretational difficulty (see Table 5).
6 Empirical findings
Figure 2 shows the multidimensional unfolding common space for the asymmetriccompetitive structure of the 15 original leaders in 2008, and Fig. 3 shows the commonspace for the 15 resulting champions in 2012. To cope with translational and rotational
123
M. Sagarra et al.
Table 5 Statistics for the unfolding model
2008 2012
2-dims 3-dims 2-dims 3-dims
Stress-1 0.1054 0.0862 0.1386 0.1019
Dispersion accounted for (DAF) 0.9889 0.9926 0.9808 0.9896
Variance accounted for (VAF) 0.9469 0.9633 0.9015 0.9413
Spearman’s rho 0.9698 0.9785 0.9495 0.9703
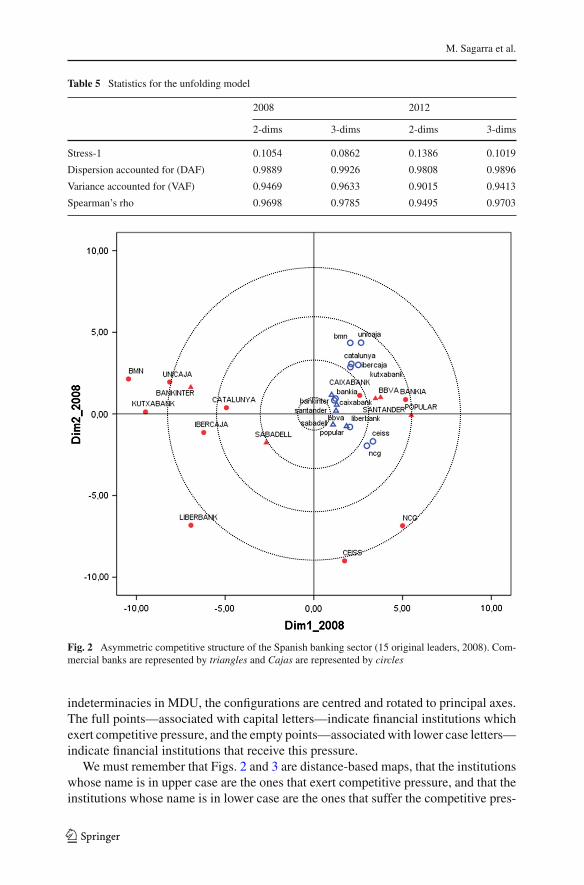
Fig. 2 Asymmetric competitive structure of the Spanish banking sector (15 original leaders, 2008). Com-mercial banks are represented by triangles and Cajas are represented by circles
indeterminacies in MDU, the configurations are centred and rotated to principal axes.The full points—associated with capital letters—indicate financial institutions whichexert competitive pressure, and the empty points—associated with lower case letters—indicate financial institutions that receive this pressure.
We must remember that Figs. 2 and 3 are distance-based maps, that the institutionswhose name is in upper case are the ones that exert competitive pressure, and that theinstitutions whose name is in lower case are the ones that suffer the competitive pres-
123
Assessing the asymmetric effects on branch rivalry
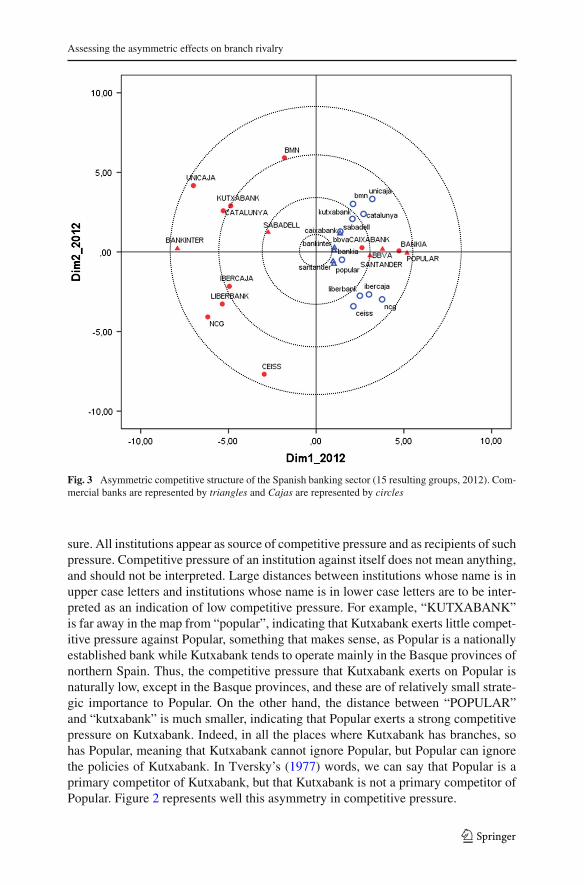
Fig. 3 Asymmetric competitive structure of the Spanish banking sector (15 resulting groups, 2012). Com-mercial banks are represented by triangles and Cajas are represented by circles
sure. All institutions appear as source of competitive pressure and as recipients of suchpressure. Competitive pressure of an institution against itself does not mean anything,and should not be interpreted. Large distances between institutions whose name is inupper case letters and institutions whose name is in lower case letters are to be inter-preted as an indication of low competitive pressure. For example, “KUTXABANK”is far away in the map from “popular”, indicating that Kutxabank exerts little compet-itive pressure against Popular, something that makes sense, as Popular is a nationallyestablished bank while Kutxabank tends to operate mainly in the Basque provinces ofnorthern Spain. Thus, the competitive pressure that Kutxabank exerts on Popular isnaturally low, except in the Basque provinces, and these are of relatively small strate-gic importance to Popular. On the other hand, the distance between “POPULAR”and “kutxabank” is much smaller, indicating that Popular exerts a strong competitivepressure on Kutxabank. Indeed, in all the places where Kutxabank has branches, sohas Popular, meaning that Kutxabank cannot ignore Popular, but Popular can ignorethe policies of Kutxabank. In Tversky’s (1977) words, we can say that Popular is aprimary competitor of Kutxabank, but that Kutxabank is not a primary competitor ofPopular. Figure 2 represents well this asymmetry in competitive pressure.
123
M. Sagarra et al.
If we concentrate on the entities that exert pressure (capital letters), we can see aclear division between the positive and the negative side of Dimension 1. The largestand most geographically diversified institutions in Spain (i.e., Caixabank, Santander,BBVA, Bankia and Popular) are located on the right hand side of the maps (positiveside of Dimension 1). Regionally based institutions, all of them Cajas before the re-structuring, are to be found on the left of the maps (negative side of Dimension 1), withthe only exception of Ceiss and NCG. We conclude that Dimension 1 is associated withgeographical coverage from the point of view of the institution that exerts competitivepressure. This polarisation observed in Figs. 2 and 3 confirms that, from a rivalry pointof view, nationally based institutions face a very different situation in terms of marketrivalry from locally based institutions. Chen (1996) argues that such differences canlead to different rivalry policies.
We now turn our attention to banks as recipients of competitive pressure. Theseare represented by empty points with lower case letters. In this case, all institutionsconcentrate towards the centre of the first dimension, slightly to the right. They areclose to the points that represent the largest Spanish banking institutions as source ofcompetitive pressure (SANTANDER, CAIXABANK, BBVA, BANKIA, POPULAR,and SABADELL), and far away from the points that represent regional institutionsas source of competitive pressure (UNICAJA, CATALUNYA, IBERCAJA, LIBER-BANK, KUTXABANK, BMN, CEISS, NCG). Amongst the second group of bankinginstitutions we also find BANKINTER, a relatively small but well diversified nationalbank. We conclude from the observation of Figs. 2 and 3 that large national banksexert strong competitive pressure on all banking institutions, but that the remaininginstitutions only exert limited competitive pressure on banking institutions.
The geographical nature of the Cajas market can also be inferred from Fig. 2. At thebottom of this figure we find NCG, CEISS, and LIBERBANK. All these institutionsoperate mainly in the north of Spain, while at the top of the figure we find Unicaja,and BMN, institutions that operate mainly in the south of the country. Institutions thatoperate all over the country are to be found in the middle of Fig. 2. This indicates thatinstitutions that operate in the north do not compete with institutions that operate inthe south. For example, the distance between “UNICAJA” and “ncg” is very large,indicating that Unicaja does not consider NCG to be a marketing rival. In the sameway, the distance between “NCG” and “unicaja” is also very large, indicating thatNCG does not consider Unicaja to be a rival. This was to be expected since NCGoperates mainly in the north west of Spain and Unicaja in the far south.
We see that Figs. 2 and 3 capture the rivalry relations in the Spanish financialmarkets, and are useful in the interpretation of the behaviour of the institutions. Thesefigures summarise all the available information, and not information for one institutionat a time. MDU appears as a very strong tool to visualise rivalry relations betweenSpanish financial institutions.
A first appreciation of the impact on rivalry of the changes that took place as aconsequence of the financial sector re-structuring that took place between 2008 and2012 can be obtained by comparing Figs. 2 and 3. For instance, it is showed thecreation of new medium sized national players which compete just one step below ofSabadell: BMN, Kutxabank and Liberbank. In fact, BMN, Kutxabank, and Liberbankwere the least influencing banks in 2008, as can be deduced from their position on
123
Assessing the asymmetric effects on branch rivalry
the far left hand side of Fig. 2. Also, BBVA has lost part of his influence, especiallywhen compared with his most direct rival, Santander (the reason being that Santandermerged with Banesto, another national bank that was not plotted in Fig. 2). Amongthe medium sized regional players, Bankinter, Catalunya, Unicaja and NCG (the oldCaixa Galicia) lose part of their leadership in the restructuring, becoming the new lessinfluencing banks. But the most striking feature when comparing Figs. 2 and 3 is theirsimilarity. After a painful re-structuring period, things look very much the same interms of rivalry.
Spanish financial authorities insisted on a process of mergers in order to moveaway from a history of atomisation and large players. The reasoning was that largerinstitutions arising from the series of mergers would be more efficient and more ableto stand on their feet. The end result was can be seen in Fig. 3: a more distributedimage of regional institutions, which increased their influence in the market, althoughnot sufficiently to become rivals to the large national banks.
Rotational indeterminacy (i.e., the dimensions are not unique) is characteristic ofscaling procedures, of which multidimensional unfolding is only one example. For thisreason we may interpret any direction in the map. However, we find that in both Figs. 2and 3 the axes have a clear interpretation. The horizontal axis could be interpretedas “power” in terms of number of branches. This dimension seems to be centred,separating the entities in two types, regional or medium and small players (on the left),and national or big players (on the right). Also, we find that the vertical axis could beassociated with the geographic location and diversification. This second dimension isof special interest for the regional entities, since it separates them depending on theSpanish geographical area they are located. To verify the accuracy of the interpretationof this second dimension, we have constructed aggregated matrices of the number ofbranches per each entity at a province level and at a regional level and we havecalculated the Herfindahl–Hirschman index of branch concentration, confirming ourintuition about this “geographical market diversification” concept. These matrices areavailable upon request.
The above discussion is based on the observation that the configurations shownin Figs. 2 and 3 appear to look very similar, but apparent similarity between con-figurations, even if both configurations are rotated to principal axes, does not meanthat they are at maximum congruence. To address this issue, a Procrustes analysiswas performed to inspect the apparent similarity. The root mean squared error (thesquare root of the sum of the squared differences between the corresponding 2008and 2012 coordinates) decreased 5.79 points (from 19.38 to 13.59) due to a smallrotation, caused by different principal axes, and a dilation factor of 0.73. Further, aMantel permutation test showed a significant (p < 0.001) correlation of 0.83 betweenthe two configurations. These results strengthened the possibility of a 3-way unfold-ing analysis of the two matrices. However, we must remember that there have beenimportant changes between 2008 and 2012, and that we are not comparing completelyidentical sets of entities. Nevertheless, three different 3-way models were estimated:An identity model, a weighted Euclidean model, and a generalized Euclidean model.The results are given in Table 6.
It can be seen in Table 6 that three-way models show an increase in Stress values.This was to be expected, as fitting all the data to a single model is more restrictive
123
M. Sagarra et al.
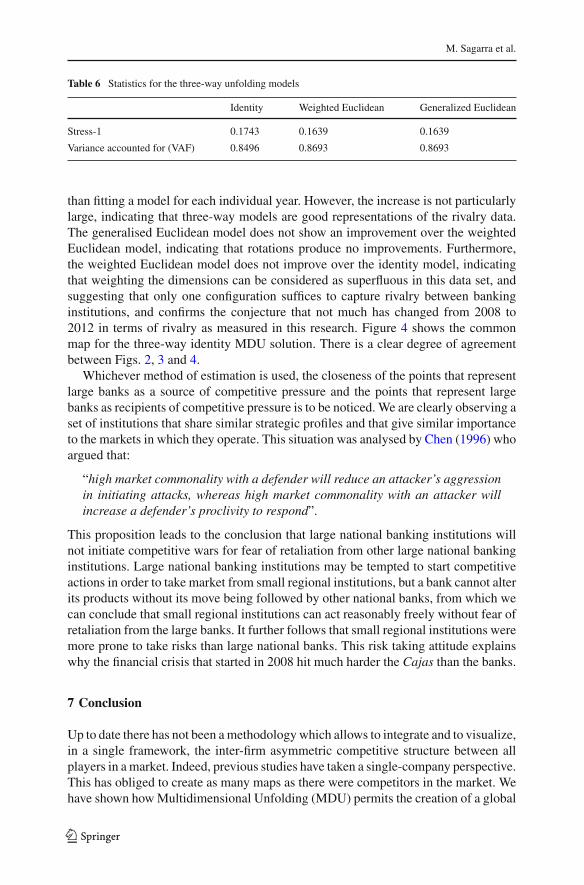
Table 6 Statistics for the three-way unfolding models
Identity Weighted Euclidean Generalized Euclidean
Stress-1 0.1743 0.1639 0.1639
Variance accounted for (VAF) 0.8496 0.8693 0.8693
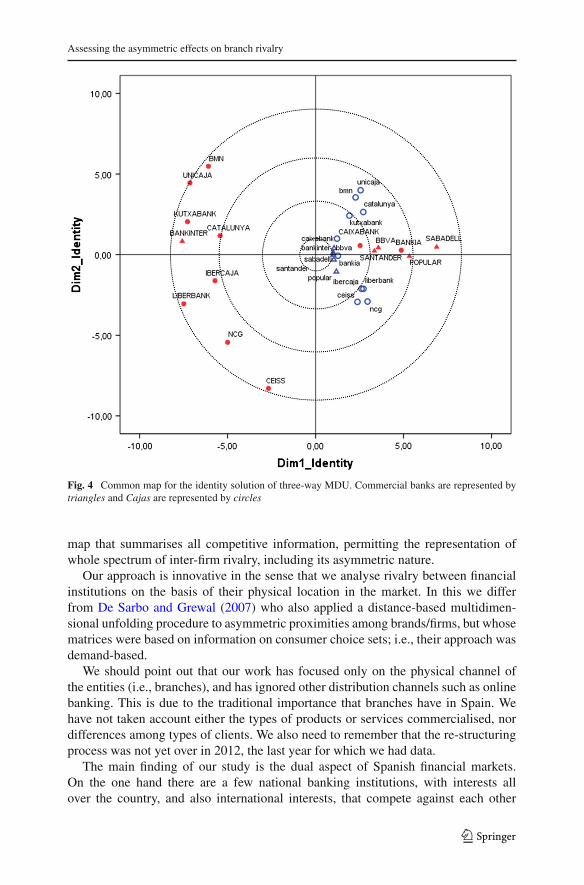
than fitting a model for each individual year. However, the increase is not particularlylarge, indicating that three-way models are good representations of the rivalry data.The generalised Euclidean model does not show an improvement over the weightedEuclidean model, indicating that rotations produce no improvements. Furthermore,the weighted Euclidean model does not improve over the identity model, indicatingthat weighting the dimensions can be considered as superfluous in this data set, andsuggesting that only one configuration suffices to capture rivalry between bankinginstitutions, and confirms the conjecture that not much has changed from 2008 to2012 in terms of rivalry as measured in this research. Figure 4 shows the commonmap for the three-way identity MDU solution. There is a clear degree of agreementbetween Figs. 2, 3 and 4.
Whichever method of estimation is used, the closeness of the points that representlarge banks as a source of competitive pressure and the points that represent largebanks as recipients of competitive pressure is to be noticed. We are clearly observing aset of institutions that share similar strategic profiles and that give similar importanceto the markets in which they operate. This situation was analysed by Chen (1996) whoargued that:
“high market commonality with a defender will reduce an attacker’s aggressionin initiating attacks, whereas high market commonality with an attacker willincrease a defender’s proclivity to respond”.
This proposition leads to the conclusion that large national banking institutions willnot initiate competitive wars for fear of retaliation from other large national bankinginstitutions. Large national banking institutions may be tempted to start competitiveactions in order to take market from small regional institutions, but a bank cannot alterits products without its move being followed by other national banks, from which wecan conclude that small regional institutions can act reasonably freely without fear ofretaliation from the large banks. It further follows that small regional institutions weremore prone to take risks than large national banks. This risk taking attitude explainswhy the financial crisis that started in 2008 hit much harder the Cajas than the banks.
7 Conclusion
Up to date there has not been a methodology which allows to integrate and to visualize,in a single framework, the inter-firm asymmetric competitive structure between allplayers in a market. Indeed, previous studies have taken a single-company perspective.This has obliged to create as many maps as there were competitors in the market. Wehave shown how Multidimensional Unfolding (MDU) permits the creation of a global
123
Assessing the asymmetric effects on branch rivalry
Fig. 4 Common map for the identity solution of three-way MDU. Commercial banks are represented bytriangles and Cajas are represented by circles
map that summarises all competitive information, permitting the representation ofwhole spectrum of inter-firm rivalry, including its asymmetric nature.
Our approach is innovative in the sense that we analyse rivalry between financialinstitutions on the basis of their physical location in the market. In this we differfrom De Sarbo and Grewal (2007) who also applied a distance-based multidimen-sional unfolding procedure to asymmetric proximities among brands/firms, but whosematrices were based on information on consumer choice sets; i.e., their approach wasdemand-based.
We should point out that our work has focused only on the physical channel ofthe entities (i.e., branches), and has ignored other distribution channels such as onlinebanking. This is due to the traditional importance that branches have in Spain. Wehave not taken account either the types of products or services commercialised, nordifferences among types of clients. We also need to remember that the re-structuringprocess was not yet over in 2012, the last year for which we had data.
The main finding of our study is the dual aspect of Spanish financial markets.On the one hand there are a few national banking institutions, with interests allover the country, and also international interests, that compete against each other
123
M. Sagarra et al.
in the main street, and for whom all areas (post codes) are equally important. Oneof these institutions will think twice before starting a move in the market for fear ofretaliation from other similar institutions. On the other hand, we find smaller, morelocalised financial institutions that are exposed to the competitive pressure of the largebanks, but have a freer hand to innovate in the market. These smaller institutionscan act without fear of retaliation from other similar institutions given their differentgeographical coverage, although the situation is changing as a result of the merg-ers that followed the 2008 financial crisis. Fear of retaliation from the large banksis also limited, as large banks cannot innovate without retaliation from other largebanks.
Although one could interpret these results with the classical phrase “plus ça change,plus c’est la même chose”, there have in fact, been many changes in the structure ofproximity banking in Spain. The institutions that have arisen from the ashes of theCajas now have commercial bank status. A single, unified banking framework hasbeen created, and this is something that will impact on future developments.
Acknowledgments Two anonymous referees and the editors provided extensive comments and sugges-tions which greatly improved the paper. The authors also acknowledge support from the Projects ECO2010-16760 and ECO2010-21393-C04-01 financed by the Spanish Ministry of Science and Innovation.
References
Azofra-Palenzuela V, Santamaría-Mariscal M (2004) El gobierno de las cajas de ahorro españolas. UniversiaBus Rev 2:48–59
Bank of Spain (2011) Report on Banking Supervision in Spain, 2010Burt R (1987) Social contagion and innovation: cohesion versus structural equivalence. Am J Sociol
92:1287–1335Busing FMTA, Groenen PJF, Heiser WJ (2005) Avoiding degeneracy in multidimensional unfolding by
penalizing on the coefficient of variation. Psychometrika 70:71–98Carroll JD, Wish M (1974) Multidimensional perceptual models and measurement methods. In: Carerette
EC, Friedman MP (eds) Handbook of perception. Academic Press, New YorkChen M-J (1996) Competitor analysis and interfirm rivalry: toward a theoretical integration. Acad Manag
Rev 21(1):100–134Chen M-J, Hambrick DC (1995) Speed, stealth, and selective attack: how small firms differ from large firms
in competitive behaviour. Acad Manag J 38:453–482Costa da Cruz R, Starke-Rodrigues FCT (2013) Competitive pressure systems mapping in the Brazilian
truck market. Indep J Manag Prod 4(1):148–170D’Aveni RA (2001) Strategic supremacy: how industry leaders create growth, wealth, and power through
spheres of influence. The Free Press, New YorkD’Aveni RA (2002) Competitive pressure systems mapping and managing multimarket contact. MIT Sloan
Manag Rev 44(1):39–49De Sarbo WS, Grewal R (2007) An alternative efficient representation of demand-based competitive asym-
metry. Strateg Manag J 28(7):755–766De Leeuw J (2005) Multidimensional unfolding. Entry in the encyclopedia of statistics in behavioural
science. Wiley, HobokenDe Leeuw J, Heiser WJ (1982) Theory of multidimensional scaling. In: Krisnaiah PR, Kanal LN (eds)
Handbook of statistics, vol 2. North Holland, AmsterdamDe Rooij M (2012) An application of the mixed effects trend vector model to asymmetric change data with
auxiliary variables. Behaviormetrika 39:75–90Fleiss JL, Levin B, Paik MC (2003) Statistical methods for rates and proportions. Wiley, New YorkFuentelsaz L, Gómez J (2008) ‘Quiénes son mis rivales? Contacto multimercado y asimetría competitiva
en la banca española. Universia Business Review, special issue, pp 112–129
123
Assessing the asymmetric effects on branch rivalry
González-Moreno A, Sáez-Martínez FJ (2008) Rivalry and strategic groups: what makes a company a rival?J Manag Gov 12(3):261–285
Gower JC (1977) The analysis of asymmetry and orthogonality. In: Barra JR, Brodeau F, Romier G, vanCutsem B (eds) Recent developments in statistics. North Holland, Amsterdam, pp 109–123
Hansmann H (1996) The ownership of enterprise. Harvard University Press, CambridgeHarshman RA, Green PE, Wind Y, Lundy ME (1982) A model for the analysis of asymmetric data in
marketing research. Mark Sci 1:205–242Heiser WJ, Busing FMTA (2004) Multidimensional scaling and unfolding of symmetric and asymmetric
proximity relations. In: Kaplan D (ed) The Sage handbook of quantitative methodology for the socialsciences. Sage Publications Inc, Thousand Oaks, pp 25–48
Jansen LKC, Rotondaro RG, Jansen JU (2005) Estratégias de sobrevivência para pequenas e médias empre-sas em ambientes globalizados: um estudo de caso do setor eletroeletrônico. Gestão & Produção12(3):405–416
Leydesdorff L, Vaughan L (2006) Co-occurrence matrices and their applications in information science:extending ACA to the web environment. J Am Soc Inf Sci Technol 57:1616–1628
Mar Molinero C, Serrano Cinca C (2001) A multivariate analysis of bank failure in Spain. Eur J Finance7:165–183
Monsuur H (2005) A square law for power of positions in a network. Oper Res Proc 2004:416–424Okada A, Imaizumi T (1987) Nonmetric multidimensional scaling of asymmetric proximities. Behav-
iormetrika 14(21):81–96Okada A, Tsurumi H (2012) Asymmetric multidimensional scaling of brand switching among margarine
brands. Behaviormetrika 39(1):111–126Real Decreto 2290/1977, de 27 de agosto, por el que se regulan los órganos de gobierno y las funciones de
las Cajas de AhorrosReal Decreto 1582/1988, de 29 de diciembre, de modificación del Real Decreto 1370/1985, en materia de
expansión de Entidades de DepósitoReal Decreto-ley 11/2010, de 9 de julio, de órganos de gobierno y otros aspectos del régimen jurídico de
las Cajas de AhorrosSagarra M, Mar-Molinero C, García-Cestona M (2013) Spanish savings banks in the credit crunch: could
distress have been predicted before the crisis? A multivariate statistical analysis. Eur J Finance (forth-coming)
Serra Ramoneda A (2011) Los Errores De Las Cajas. Ediciones Invisibles, BarcelonaSerrano Cinca C, Mar Molinero C, Chaparro F (2004) Spanish savings banks: a view on intangibles. Knowl
Manag Res Pract 2:103–117Schneider JW, Borlund P (2009) Analyzing cross-reference transactions between authors by use of an
asymmetric proximity measure and multidimensional unfolding. Proc Am Soc Inf Sci Technol 46(1):1–19
Yang J, Lu L, Xie W, Chen G, Zhuang D (2007) On competitive relationship networks: a new method forindustrial competition analysis. Phys A 382(2):704–714
Yang J, Wang W, Chen G (2009) A two-level complex network model and its application. Phys A388(12):2435–2449
Tversky A (1977) Features of similarity. Psychol Rev 84:327–352Zhuang D, Yang JM (2008) Simulation of rivalry spread effect over the competitive pressure network. In:
Proceeding of IEEE, SMC, Singapore
123
Related Documents