Biogeosciences, 4, 647–656, 2007 www.biogeosciences.net/4/647/2007/ © Author(s) 2007. This work is licensed under a Creative Commons License. Biogeosciences Assessing the ability of three land ecosystem models to simulate gross carbon uptake of forests from boreal to Mediterranean climate in Europe M. Jung 1,2 , G. Le Maire 3 , S. Zaehle 3 , S. Luyssaert 4,5 , M. Vetter 1 , G. Churkina 1,6 , P. Ciais 3 , N. Viovy 3 , and M. Reichstein 1 1 Max Planck Institute for Biogeochemistry, Jena, Germany 2 International Max Planck Research School on Earth System Modelling, Hamburg, Germany 3 Laboratory for Climate Sciences and the Environment (LSCE), Joint Unit of CEA-CNRS, Gif-sur-Yvette, France 4 Department of Biology, University of Antwerp, Universiteitsplein 1, B-2610 Wilrijk, Belgium 5 College of Forestry, Oregon State University, Corvallis, OR 97331-5752 USA 6 School of Natural Resources and Environment, University of Michigan, Ann Arbor, USA Received: 28 March 2007 – Published in Biogeosciences Discuss.: 26 April 2007 Revised: 26 July 2007 – Accepted: 9 August 2007 – Published: 14 August 2007 Abstract. Three terrestrial biosphere models (LPJ, Or- chidee, Biome-BGC) were evaluated with respect to their ability to simulate large-scale climate related trends in gross primary production (GPP) across European forests. Simu- lated GPP and leaf area index (LAI) were compared with GPP estimates based on flux separated eddy covariance mea- surements of net ecosystem exchange and LAI measure- ments along a temperature gradient ranging from the boreal to the Mediterranean region. The three models capture qual- itatively the pattern suggested by the site data: an increase in GPP from boreal to temperate and a subsequent decline from temperate to Mediterranean climates. The models con- sistently predict higher GPP for boreal and lower GPP for Mediterranean forests. Based on a decomposition of GPP into absorbed photosynthetic active radiation (APAR) and ra- diation use efficiency (RUE), the overestimation of GPP for the boreal coniferous forests appears to be primarily related to too high simulated LAI - and thus light absorption (APAR) – rather than too high radiation use efficiency. We cannot at- tribute the tendency of the models to underestimate GPP in the water limited region to model structural deficiencies with confidence. A likely dry bias of the input meteorological data in southern Europe may create this pattern. On average, the models compare similarly well to the site GPP data (RMSE of ∼30% or 420 gC/m2/yr) but differences are apparent for different ecosystem types. In terms of abso- lute values, we find the agreement between site based GPP estimates and simulations acceptable when we consider un- certainties about the accuracy in model drivers, a potential representation bias of the eddy covariance sites, and uncer- Correspondence to: M. Jung ([email protected]) tainties related to the method of deriving GPP from eddy covariance measurements data. Continental to global data- model comparison studies should be fostered in the future since they are necessary to identify consistent model bias along environmental gradients. 1 Introduction Continental to global scale simulations of the land carbon cy- cle are subject to uncertainties related to model structure, pa- rameters, and input driver data (McGuire et al., 2001; Moor- croft, 2006; Morales et al., 2005; Zaehle et al., 2005). Con- fronting simulations with measurements allows assessing the model’s performance, gaining confidence in the model pre- dictions and/or identify major issues with the model struc- ture. Such comparisons have been repeatedly made for sin- gle or few intensively investigated eddy covariance flux mea- surement sites when it was possible to parameterise and drive the models with in-situ data (e.g. Churkina et al., 2003; Kucharik et al., 2006; Morales et al., 2005). These analyses revealed important insights regarding the credibil- ity of the model’s dynamics and simulated temporal vari- ations. However, models designed for the continental to global scale should also be evaluated on that scale, i.e. in- vestigating how well the broad patterns along large environ- mental gradients are reproduced. Such studies have rarely been presented, primarily due to a lack of consistent syn- thesis work of carbon flux measurements. Global data for net primary productivity (NPP) are available (Scurlock et al., 1999, http://www-eosdis.ornl.gov/NPP/npp home.html) but prove to be difficult to use as benchmarks (e.g. Cramer et Published by Copernicus Publications on behalf of the European Geosciences Union.

Welcome message from author
This document is posted to help you gain knowledge. Please leave a comment to let me know what you think about it! Share it to your friends and learn new things together.
Transcript
Biogeosciences, 4, 647–656, 2007www.biogeosciences.net/4/647/2007/© Author(s) 2007. This work is licensedunder a Creative Commons License.
Biogeosciences
Assessing the ability of three land ecosystem models to simulategross carbon uptake of forests from boreal to Mediterranean climatein Europe
M. Jung1,2, G. Le Maire3, S. Zaehle3, S. Luyssaert4,5, M. Vetter1, G. Churkina1,6, P. Ciais3, N. Viovy3, andM. Reichstein1
1Max Planck Institute for Biogeochemistry, Jena, Germany2International Max Planck Research School on Earth System Modelling, Hamburg, Germany3Laboratory for Climate Sciences and the Environment (LSCE), Joint Unit of CEA-CNRS, Gif-sur-Yvette, France4Department of Biology, University of Antwerp, Universiteitsplein 1, B-2610 Wilrijk, Belgium5College of Forestry, Oregon State University, Corvallis, OR 97331-5752 USA6School of Natural Resources and Environment, University of Michigan, Ann Arbor, USA
Received: 28 March 2007 – Published in Biogeosciences Discuss.: 26 April 2007Revised: 26 July 2007 – Accepted: 9 August 2007 – Published: 14 August 2007
Abstract. Three terrestrial biosphere models (LPJ, Or-chidee, Biome-BGC) were evaluated with respect to theirability to simulate large-scale climate related trends in grossprimary production (GPP) across European forests. Simu-lated GPP and leaf area index (LAI) were compared withGPP estimates based on flux separated eddy covariance mea-surements of net ecosystem exchange and LAI measure-ments along a temperature gradient ranging from the borealto the Mediterranean region. The three models capture qual-itatively the pattern suggested by the site data: an increasein GPP from boreal to temperate and a subsequent declinefrom temperate to Mediterranean climates. The models con-sistently predict higher GPP for boreal and lower GPP forMediterranean forests. Based on a decomposition of GPPinto absorbed photosynthetic active radiation (APAR) and ra-diation use efficiency (RUE), the overestimation of GPP forthe boreal coniferous forests appears to be primarily relatedto too high simulated LAI - and thus light absorption (APAR)– rather than too high radiation use efficiency. We cannot at-tribute the tendency of the models to underestimate GPP inthe water limited region to model structural deficiencies withconfidence. A likely dry bias of the input meteorological datain southern Europe may create this pattern.
On average, the models compare similarly well to the siteGPP data (RMSE of∼30% or 420 gC/m2/yr) but differencesare apparent for different ecosystem types. In terms of abso-lute values, we find the agreement between site based GPPestimates and simulations acceptable when we consider un-certainties about the accuracy in model drivers, a potentialrepresentation bias of the eddy covariance sites, and uncer-
Correspondence to:M. Jung([email protected])
tainties related to the method of deriving GPP from eddycovariance measurements data. Continental to global data-model comparison studies should be fostered in the futuresince they are necessary to identify consistent model biasalong environmental gradients.
1 Introduction
Continental to global scale simulations of the land carbon cy-cle are subject to uncertainties related to model structure, pa-rameters, and input driver data (McGuire et al., 2001; Moor-croft, 2006; Morales et al., 2005; Zaehle et al., 2005). Con-fronting simulations with measurements allows assessing themodel’s performance, gaining confidence in the model pre-dictions and/or identify major issues with the model struc-ture. Such comparisons have been repeatedly made for sin-gle or few intensively investigated eddy covariance flux mea-surement sites when it was possible to parameterise anddrive the models with in-situ data (e.g. Churkina et al.,2003; Kucharik et al., 2006; Morales et al., 2005). Theseanalyses revealed important insights regarding the credibil-ity of the model’s dynamics and simulated temporal vari-ations. However, models designed for the continental toglobal scale should also be evaluated on that scale, i.e. in-vestigating how well the broad patterns along large environ-mental gradients are reproduced. Such studies have rarelybeen presented, primarily due to a lack of consistent syn-thesis work of carbon flux measurements. Global data fornet primary productivity (NPP) are available (Scurlock et al.,1999,http://www-eosdis.ornl.gov/NPP/npphome.html) butprove to be difficult to use as benchmarks (e.g. Cramer et
Published by Copernicus Publications on behalf of the European Geosciences Union.
648 M. Jung et al.: Assessing land ecosystem models
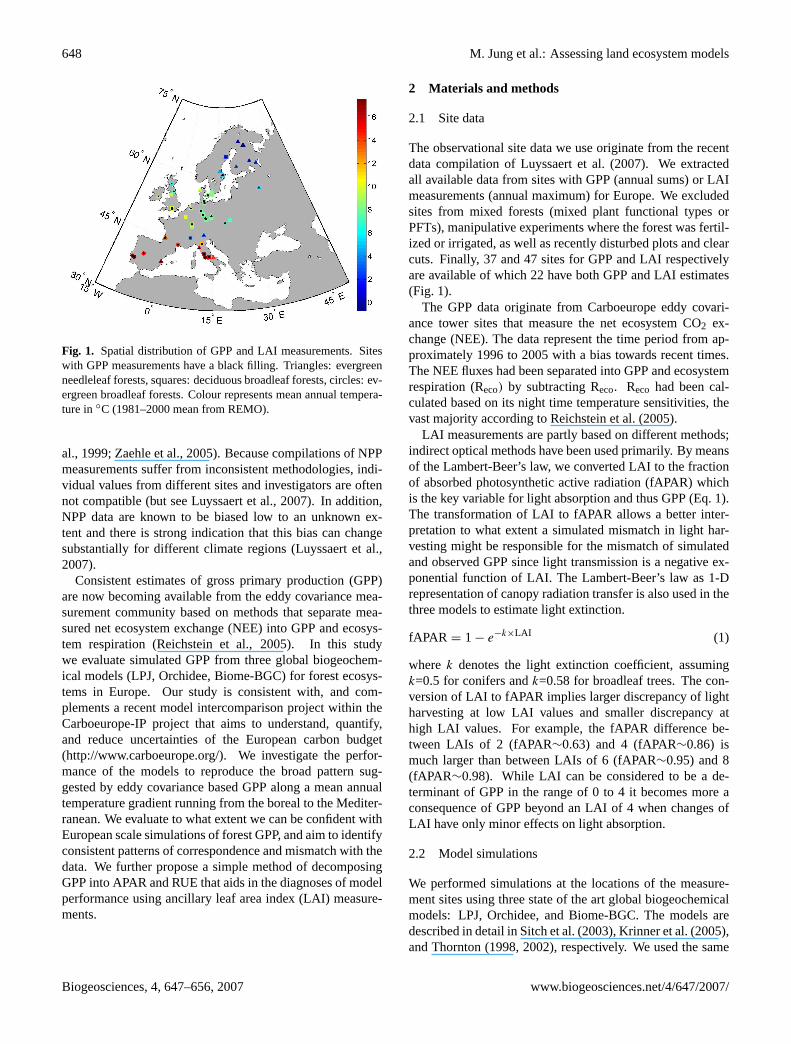
Fig. 1. Spatial distribution of GPP and LAI measurements. Siteswith GPP measurements have a black filling. Triangles: evergreenneedleleaf forests, squares: deciduous broadleaf forests, circles: ev-ergreen broadleaf forests. Colour represents mean annual tempera-ture in◦C (1981–2000 mean from REMO).
al., 1999; Zaehle et al., 2005). Because compilations of NPPmeasurements suffer from inconsistent methodologies, indi-vidual values from different sites and investigators are oftennot compatible (but see Luyssaert et al., 2007). In addition,NPP data are known to be biased low to an unknown ex-tent and there is strong indication that this bias can changesubstantially for different climate regions (Luyssaert et al.,2007).
Consistent estimates of gross primary production (GPP)are now becoming available from the eddy covariance mea-surement community based on methods that separate mea-sured net ecosystem exchange (NEE) into GPP and ecosys-tem respiration (Reichstein et al., 2005). In this studywe evaluate simulated GPP from three global biogeochem-ical models (LPJ, Orchidee, Biome-BGC) for forest ecosys-tems in Europe. Our study is consistent with, and com-plements a recent model intercomparison project within theCarboeurope-IP project that aims to understand, quantify,and reduce uncertainties of the European carbon budget(http://www.carboeurope.org/). We investigate the perfor-mance of the models to reproduce the broad pattern sug-gested by eddy covariance based GPP along a mean annualtemperature gradient running from the boreal to the Mediter-ranean. We evaluate to what extent we can be confident withEuropean scale simulations of forest GPP, and aim to identifyconsistent patterns of correspondence and mismatch with thedata. We further propose a simple method of decomposingGPP into APAR and RUE that aids in the diagnoses of modelperformance using ancillary leaf area index (LAI) measure-ments.
2 Materials and methods
2.1 Site data
The observational site data we use originate from the recentdata compilation of Luyssaert et al. (2007). We extractedall available data from sites with GPP (annual sums) or LAImeasurements (annual maximum) for Europe. We excludedsites from mixed forests (mixed plant functional types orPFTs), manipulative experiments where the forest was fertil-ized or irrigated, as well as recently disturbed plots and clearcuts. Finally, 37 and 47 sites for GPP and LAI respectivelyare available of which 22 have both GPP and LAI estimates(Fig. 1).
The GPP data originate from Carboeurope eddy covari-ance tower sites that measure the net ecosystem CO2 ex-change (NEE). The data represent the time period from ap-proximately 1996 to 2005 with a bias towards recent times.The NEE fluxes had been separated into GPP and ecosystemrespiration (Reco) by subtracting Reco. Reco had been cal-culated based on its night time temperature sensitivities, thevast majority according to Reichstein et al. (2005).
LAI measurements are partly based on different methods;indirect optical methods have been used primarily. By meansof the Lambert-Beer’s law, we converted LAI to the fractionof absorbed photosynthetic active radiation (fAPAR) whichis the key variable for light absorption and thus GPP (Eq. 1).The transformation of LAI to fAPAR allows a better inter-pretation to what extent a simulated mismatch in light har-vesting might be responsible for the mismatch of simulatedand observed GPP since light transmission is a negative ex-ponential function of LAI. The Lambert-Beer’s law as 1-Drepresentation of canopy radiation transfer is also used in thethree models to estimate light extinction.
fAPAR = 1 − e−k×LAI (1)
wherek denotes the light extinction coefficient, assumingk=0.5 for conifers andk=0.58 for broadleaf trees. The con-version of LAI to fAPAR implies larger discrepancy of lightharvesting at low LAI values and smaller discrepancy athigh LAI values. For example, the fAPAR difference be-tween LAIs of 2 (fAPAR∼0.63) and 4 (fAPAR∼0.86) ismuch larger than between LAIs of 6 (fAPAR∼0.95) and 8(fAPAR∼0.98). While LAI can be considered to be a de-terminant of GPP in the range of 0 to 4 it becomes more aconsequence of GPP beyond an LAI of 4 when changes ofLAI have only minor effects on light absorption.
2.2 Model simulations
We performed simulations at the locations of the measure-ment sites using three state of the art global biogeochemicalmodels: LPJ, Orchidee, and Biome-BGC. The models aredescribed in detail in Sitch et al. (2003), Krinner et al. (2005),and Thornton (1998, 2002), respectively. We used the same
Biogeosciences, 4, 647–656, 2007 www.biogeosciences.net/4/647/2007/
M. Jung et al.: Assessing land ecosystem models 649
input data for each model, according to a modelling proto-col that is consistent with model intercomparison studies byVetter et al. (2007) and Jung et al. (2007)in review to ensurecomparability. We prescribed the PFT according to the pre-vailing vegetation type given in the database by Luyssaertet al. (2007). No site history was prescribed that accountsfor age and management related effects; the models simu-late mature forest stands. Soil water holding capacity andmeteorological model drivers originate from gridded datasets with a spatial resolution of 0.25◦. Water holding ca-pacity data are based on IGBP-DIS, 2000 soil texture data.Meteorological model input from 1958–2005 is from a re-gional climate model (REMO, Jacob and Podzun, 1997) thatwas driven with NCEP reanalysis (Kalnay et al., 1996) atthe boundaries of the European model domain (Feser et al.,2001). Details about model drivers and the modelling proto-col are available in Vetter et al. (2007) and the Carboeurope-IP model intercomparison homepage (http://www.bgc-jena.mpg.de/bgc-systems/projects/cei/index.shtml).
For consistency, we matched simulated GPP and LAI withthe site data on a site by site and year by year basis. Sub-sequently, the yearly data were aggregated (averaged) to thesite level. In cases two or more measurement sites with thesame PFT fell within the same 0.25◦ gridcell (i.e. identicalmodel output), data on site level were further averaged togain more representative values on the 0.25◦ gridcell level.
2.3 Decomposing GPP into APAR and RUE
We decomposed GPP [gC m−2 yr−1] into absorbed photo-synthetic active radiation (APAR [MJ m−2 yr−1) and radia-tion use efficiency (RUE [gC MJ−1]). This procedure pro-vides further information about possible causes of mismatchbetween simulated and site eddy covariance based GPP.
GPP=APAR× RUE (2)
We calculate APAR for the models according to a standardmethod used in model intercomparisons from monthly meanleaf area index and radiation (e.g. Bondeau et al., 1999;Ruimy et al., 1999) (Eq. 3). For the actual forest, there iscommonly only one annual LAI measurements that repre-sents approximately the annual maximum. In order estimateAPAR for the forest sites we use the simulated seasonal pat-tern of fAPAR from the models but scale the simulated max-imum fAPAR to the measured fAPAR (both calculated fromLAI). In this way we calculate the APAR of the forest sites byusing the modelled leaf phenology but correct for the wrongmagnitude of modelled fAPAR. Our approach yields consis-tent estimates of APAR for the simulated and actual forestthat allows comparison among them.
APAR =
12∑m=1
fAPARsim m × PARm [×CF ] (3)
with
CF=fAPARobs
fAPARmax sim(4)
Where, APAR denotes the absorbed photosynthetic active ra-diation [MJ m−2 yr−1], m is an index for the month, fAPARis the fraction of absorbed photosynthetic active radiation,calculated according to Eq. (1), the subscript sim denotes thesimulation, PAR is photosynthetic active radiation [MJ m−2
month−1] from REMO, assuming PAR=0.48 x global (shortwave) radiation. CF is a correction factor that was only usedfor the estimation of APAR at the actual forest sites based onone LAI measurement.
The calculation is performed for all years with GPP mea-surements with subsequent averaging over the years. Sincethe seasonal pattern of simulated fAPAR (leaf phenology)may differ among models we calculate an actual site APARfor each model. The differences between the site APARs fordifferent models are then entirely related to differently simu-lated phenology not due to the maximum reached LAI. Siteand modelled RUE can now be calculated based on Equa-tion 2, i.e. using eddy covariance flux separated GPP andsite APAR, and simulated GPP and simulated APAR respec-tively.
Our method to decompose GPP into APAR and RUE forboth, simulated and actual forest ecosystems uses severalnecessary simplifications and is only a first order approxi-mation. We do not account for factors like albedo, diffuseradiation, and complex canopy structure that are relevant tothe realistic estimations of fAPAR from LAI. Moreover, themodels use internally partly different representations of theenergy budget (e.g. albedo), differ slightly in the PFT specificlight extinction coefficients and assumptions about upscalingof light absorption from tree to grid cell level. The derivedabsolute values of APAR and RUE are neither comparableamong models nor to field measurements. However, our ap-proach yields consistent results for APAR and RUE betweensimulated and actual forest ecosystem, since we apply thesame method. It is an efficient way of assessing whether sys-tematic differences of light harvesting can explain the mis-match between observed and modelled GPP. A drawback ofthe method is that it does not account for the observed sea-sonal pattern of light absorption due to a lack of measurementdata with high temporal resolution. Consequently, we rely onthe modelled seasonal pattern of LAI. Using the simulatedseasonal pattern of LAI is only a minor issue for evergreenconiferous forests and we therefore restrict the applicationof the decomposition method to coniferous forests. Usingthe method for deciduous vegetation would require a prioriconfidence in the simulated timing of leaf onset, maximumLAI and leaf senescence for all three models. Alternatively,the availability of seasonally resolved measurements of LAIand/or of light interception for many sites would make it pos-sible to use the actual observed seasonal cycle of leaf phenol-ogy.
www.biogeosciences.net/4/647/2007/ Biogeosciences, 4, 647–656, 2007
650 M. Jung et al.: Assessing land ecosystem models
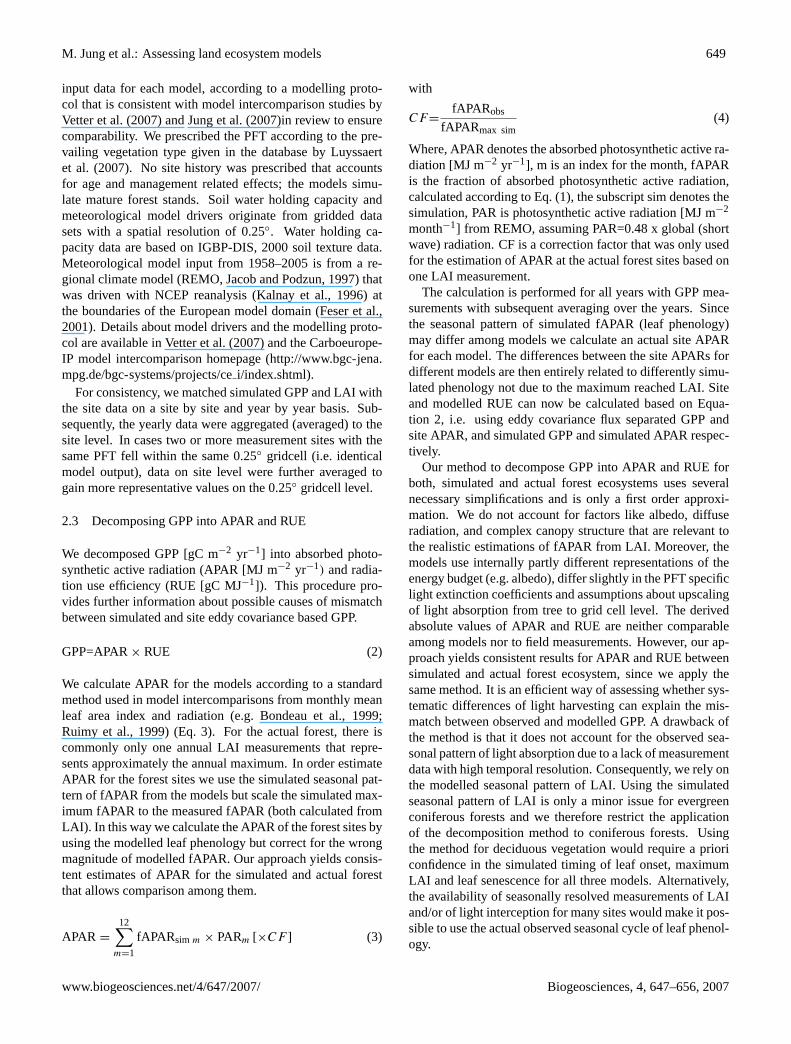
Fig. 2. Top panel: eddy covariance flux separated (filled markers) and modelled (open markers) GPP along the mean annual temperaturegradient across Europe. Bottom panel: difference between modelled and eddy covariance flux separated GPP along mean annual temperature(MAT, 1981-2000 mean based on the REMO data set). ENF: evergreen needleleaf forests, DBF: deciduous broadleaf forests, EBF: evergreenbroadleaf forests.
Table 1. Relative RMSE and mean eddy covariance flux separated and modelled GPP, stratified by forest ecosystem type. The relativeRMSE is calculated as RMSE divided by the mean of the eddy covariance flux separated GPP values.
Forest ecosystem type Numberof sites
Mean GPP [gC/m2/yr] Relative RMSE [%]
Observed LPJ Orchidee Biome-BGC
LPJ Orchidee Biome-BGC
All 37 1400 1097 1252 1243 32.34 29.56 29.65
Boreal evergreen needleleaf 9 1003 1102 1225 1232 23.65 33.80 31.95Temperate evergreen needleleaf 10 1643 1311 1537 1600 25.12 16.43 21.08Temperate deciduous broadleaf 10 1534 1060 1305 1067 33.35 27.41 33.75Mediterranean evergreen needleleaf 2 1586 879 894 1259 44.61 43.65 21.08Mediterranean deciduous broadleaf 2 1197 811 558 665 42.35 60.84 51.32Mediterranean evergreen broadleafforest
4 1358 893 989 1097 41.03 32.59 28.29
3 Results and discussion
3.1 Gross primary productivity
LPJ, Orchidee, and Biome-BGC reproduce the general pat-tern of GPP changes along the temperature (MAT) gradientacross Europe. Across the continent GPP increase from bo-real to temperate and subsequently decreases from temperateto Mediterranean regions (Fig. 2). However, the models con-sistently predict higher GPP for the boreal and lower GPP forthe Mediterranean zone than suggested by eddy covariancebased GPP. Variations of GPP by the LPJ model are smallerthan indicated by eddy covariance based GPP and the othertwo models Orchidee, and Biome-BGC. By comparing the
means of observed and modelled GPP over all sites, we findthat all the three models predict on average lower GPP thanthe eddy covariance based (Table 1), while the difference be-tween simulated and observed means is not significant forOrchidee and Biome-BGC (according to a one-way analysisof variance (ANOVA)).
The root mean square error of prediction (RMSE) over allsites is in the order of 420 gC/m2/yr (∼30%) for the threemodels (Table 1). The stratification by ecosystem typesreveals differences among models as well as among for-est types and reveals individual contributions to the over-all RMSE. On average, the RMSE is smallest for temper-ate coniferous sites (16–25%) and largest for Mediterraneanforest ecosystems (21–61%), which has also been observed
Biogeosciences, 4, 647–656, 2007 www.biogeosciences.net/4/647/2007/
M. Jung et al.: Assessing land ecosystem models 651
by Morales et al. (2005) with respect to monthly simula-tions of net ecosystem exchange and evapotranspiration fromOrchidee, LPJ-GUESS, and RHESSyS (Biome-BGC is partof RHESSyS). LPJ, Orchidee, and Biome-BGC consistentlypredict higher GPP for the boreal forest by 10 to 23%, lowerGPP for temperate deciduous broadleaf forest and Mediter-ranean sites by 15 to 31% and 21 to 45% respectively. Be-tween the models, LPJ is closest regarding the boreal forests(RMSE of 24%), Orchidee for temperate sites (RMSE of16 and 27% for conifers and broadleaves respectively), andBiome-BGC for Mediterranean evergreens (RMSE of 21 and28% for conifers and broadleaves respectively). The latterstatement is somewhat ambiguous, given the small numberof data points in the Mediterranean.
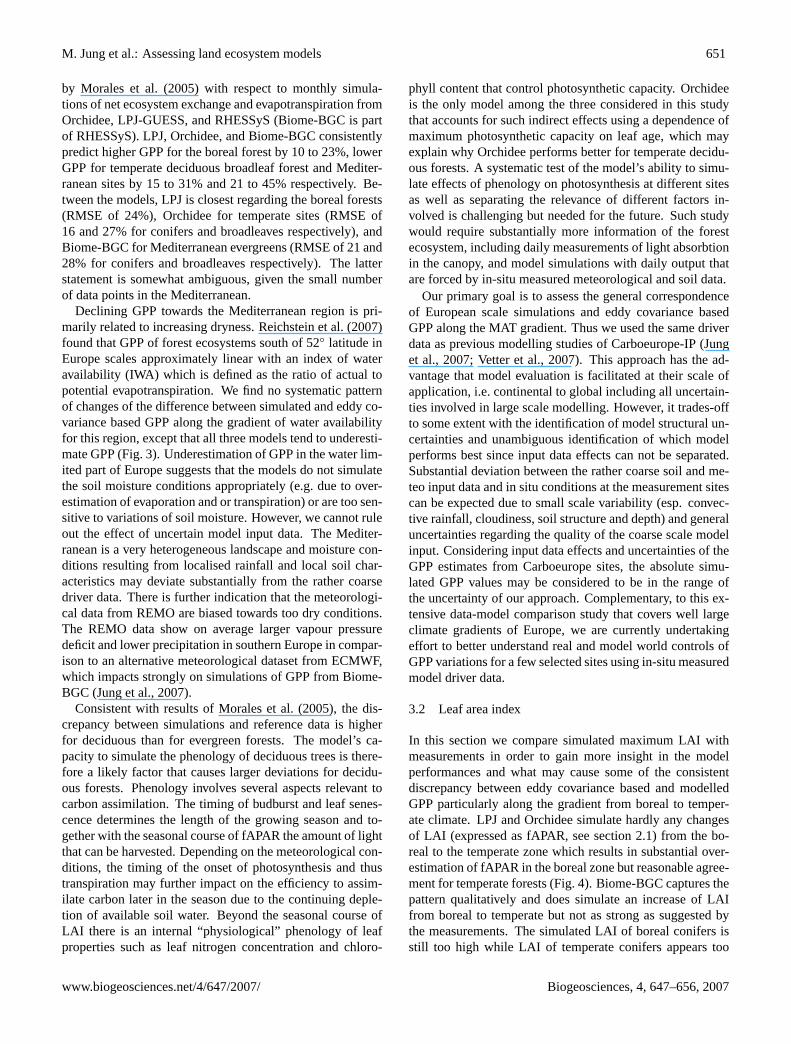
Declining GPP towards the Mediterranean region is pri-marily related to increasing dryness. Reichstein et al. (2007)found that GPP of forest ecosystems south of 52◦ latitude inEurope scales approximately linear with an index of wateravailability (IWA) which is defined as the ratio of actual topotential evapotranspiration. We find no systematic patternof changes of the difference between simulated and eddy co-variance based GPP along the gradient of water availabilityfor this region, except that all three models tend to underesti-mate GPP (Fig. 3). Underestimation of GPP in the water lim-ited part of Europe suggests that the models do not simulatethe soil moisture conditions appropriately (e.g. due to over-estimation of evaporation and or transpiration) or are too sen-sitive to variations of soil moisture. However, we cannot ruleout the effect of uncertain model input data. The Mediter-ranean is a very heterogeneous landscape and moisture con-ditions resulting from localised rainfall and local soil char-acteristics may deviate substantially from the rather coarsedriver data. There is further indication that the meteorologi-cal data from REMO are biased towards too dry conditions.The REMO data show on average larger vapour pressuredeficit and lower precipitation in southern Europe in compar-ison to an alternative meteorological dataset from ECMWF,which impacts strongly on simulations of GPP from Biome-BGC (Jung et al., 2007).
Consistent with results of Morales et al. (2005), the dis-crepancy between simulations and reference data is higherfor deciduous than for evergreen forests. The model’s ca-pacity to simulate the phenology of deciduous trees is there-fore a likely factor that causes larger deviations for decidu-ous forests. Phenology involves several aspects relevant tocarbon assimilation. The timing of budburst and leaf senes-cence determines the length of the growing season and to-gether with the seasonal course of fAPAR the amount of lightthat can be harvested. Depending on the meteorological con-ditions, the timing of the onset of photosynthesis and thustranspiration may further impact on the efficiency to assim-ilate carbon later in the season due to the continuing deple-tion of available soil water. Beyond the seasonal course ofLAI there is an internal “physiological” phenology of leafproperties such as leaf nitrogen concentration and chloro-
phyll content that control photosynthetic capacity. Orchideeis the only model among the three considered in this studythat accounts for such indirect effects using a dependence ofmaximum photosynthetic capacity on leaf age, which mayexplain why Orchidee performs better for temperate decidu-ous forests. A systematic test of the model’s ability to simu-late effects of phenology on photosynthesis at different sitesas well as separating the relevance of different factors in-volved is challenging but needed for the future. Such studywould require substantially more information of the forestecosystem, including daily measurements of light absorbtionin the canopy, and model simulations with daily output thatare forced by in-situ measured meteorological and soil data.
Our primary goal is to assess the general correspondenceof European scale simulations and eddy covariance basedGPP along the MAT gradient. Thus we used the same driverdata as previous modelling studies of Carboeurope-IP (Junget al., 2007; Vetter et al., 2007). This approach has the ad-vantage that model evaluation is facilitated at their scale ofapplication, i.e. continental to global including all uncertain-ties involved in large scale modelling. However, it trades-offto some extent with the identification of model structural un-certainties and unambiguous identification of which modelperforms best since input data effects can not be separated.Substantial deviation between the rather coarse soil and me-teo input data and in situ conditions at the measurement sitescan be expected due to small scale variability (esp. convec-tive rainfall, cloudiness, soil structure and depth) and generaluncertainties regarding the quality of the coarse scale modelinput. Considering input data effects and uncertainties of theGPP estimates from Carboeurope sites, the absolute simu-lated GPP values may be considered to be in the range ofthe uncertainty of our approach. Complementary, to this ex-tensive data-model comparison study that covers well largeclimate gradients of Europe, we are currently undertakingeffort to better understand real and model world controls ofGPP variations for a few selected sites using in-situ measuredmodel driver data.
3.2 Leaf area index
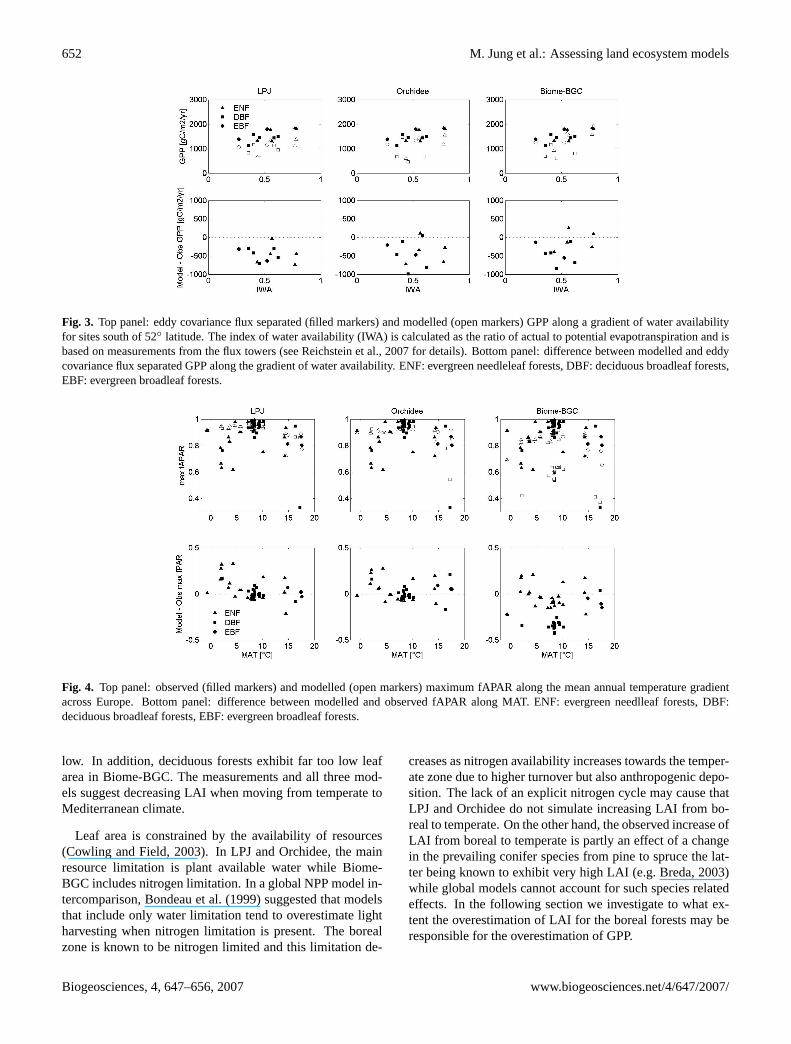
In this section we compare simulated maximum LAI withmeasurements in order to gain more insight in the modelperformances and what may cause some of the consistentdiscrepancy between eddy covariance based and modelledGPP particularly along the gradient from boreal to temper-ate climate. LPJ and Orchidee simulate hardly any changesof LAI (expressed as fAPAR, see section 2.1) from the bo-real to the temperate zone which results in substantial over-estimation of fAPAR in the boreal zone but reasonable agree-ment for temperate forests (Fig. 4). Biome-BGC captures thepattern qualitatively and does simulate an increase of LAIfrom boreal to temperate but not as strong as suggested bythe measurements. The simulated LAI of boreal conifers isstill too high while LAI of temperate conifers appears too
www.biogeosciences.net/4/647/2007/ Biogeosciences, 4, 647–656, 2007
652 M. Jung et al.: Assessing land ecosystem models
Fig. 3. Top panel: eddy covariance flux separated (filled markers) and modelled (open markers) GPP along a gradient of water availabilityfor sites south of 52◦ latitude. The index of water availability (IWA) is calculated as the ratio of actual to potential evapotranspiration and isbased on measurements from the flux towers (see Reichstein et al., 2007 for details). Bottom panel: difference between modelled and eddycovariance flux separated GPP along the gradient of water availability. ENF: evergreen needleleaf forests, DBF: deciduous broadleaf forests,EBF: evergreen broadleaf forests.
Fig. 4. Top panel: observed (filled markers) and modelled (open markers) maximum fAPAR along the mean annual temperature gradientacross Europe. Bottom panel: difference between modelled and observed fAPAR along MAT. ENF: evergreen needlleaf forests, DBF:deciduous broadleaf forests, EBF: evergreen broadleaf forests.
low. In addition, deciduous forests exhibit far too low leafarea in Biome-BGC. The measurements and all three mod-els suggest decreasing LAI when moving from temperate toMediterranean climate.
Leaf area is constrained by the availability of resources(Cowling and Field, 2003). In LPJ and Orchidee, the mainresource limitation is plant available water while Biome-BGC includes nitrogen limitation. In a global NPP model in-tercomparison, Bondeau et al. (1999) suggested that modelsthat include only water limitation tend to overestimate lightharvesting when nitrogen limitation is present. The borealzone is known to be nitrogen limited and this limitation de-
creases as nitrogen availability increases towards the temper-ate zone due to higher turnover but also anthropogenic depo-sition. The lack of an explicit nitrogen cycle may cause thatLPJ and Orchidee do not simulate increasing LAI from bo-real to temperate. On the other hand, the observed increase ofLAI from boreal to temperate is partly an effect of a changein the prevailing conifer species from pine to spruce the lat-ter being known to exhibit very high LAI (e.g. Breda, 2003)while global models cannot account for such species relatedeffects. In the following section we investigate to what ex-tent the overestimation of LAI for the boreal forests may beresponsible for the overestimation of GPP.
Biogeosciences, 4, 647–656, 2007 www.biogeosciences.net/4/647/2007/
M. Jung et al.: Assessing land ecosystem models 653
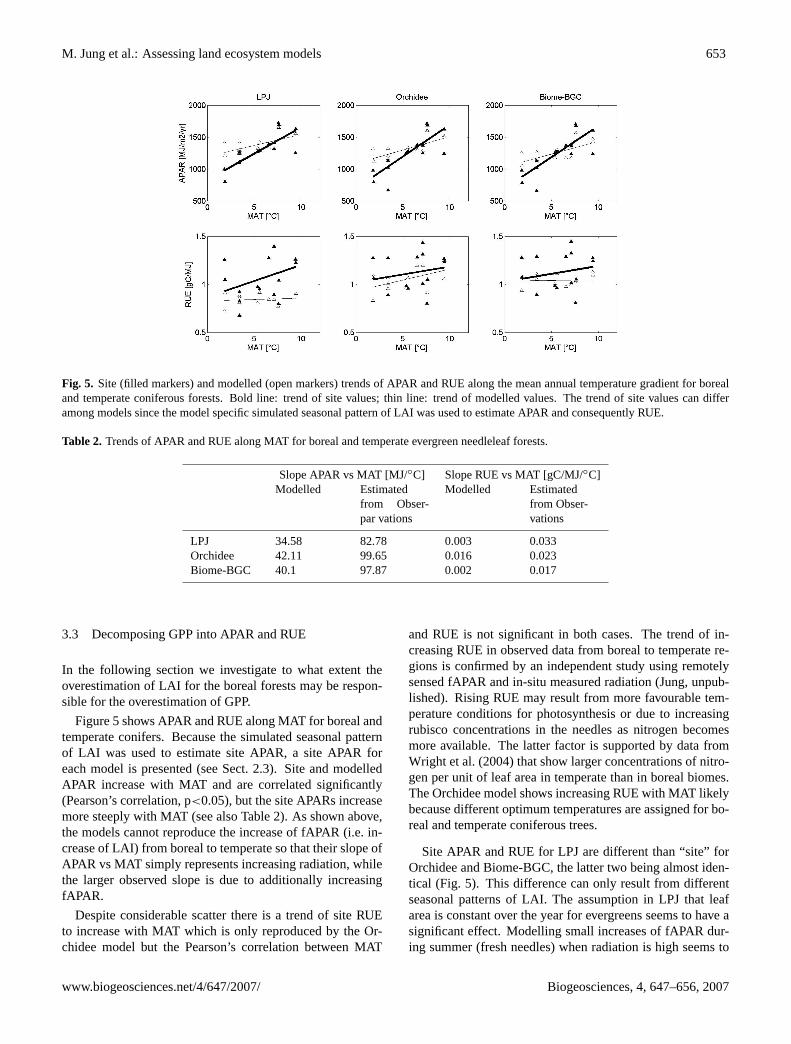
Fig. 5. Site (filled markers) and modelled (open markers) trends of APAR and RUE along the mean annual temperature gradient for borealand temperate coniferous forests. Bold line: trend of site values; thin line: trend of modelled values. The trend of site values can differamong models since the model specific simulated seasonal pattern of LAI was used to estimate APAR and consequently RUE.
Table 2. Trends of APAR and RUE along MAT for boreal and temperate evergreen needleleaf forests.
Slope APAR vs MAT [MJ/◦C] Slope RUE vs MAT [gC/MJ/◦C]Modelled Estimated
from Obser-par vations
Modelled Estimatedfrom Obser-vations
LPJ 34.58 82.78 0.003 0.033Orchidee 42.11 99.65 0.016 0.023Biome-BGC 40.1 97.87 0.002 0.017
3.3 Decomposing GPP into APAR and RUE
In the following section we investigate to what extent theoverestimation of LAI for the boreal forests may be respon-sible for the overestimation of GPP.
Figure 5 shows APAR and RUE along MAT for boreal andtemperate conifers. Because the simulated seasonal patternof LAI was used to estimate site APAR, a site APAR foreach model is presented (see Sect. 2.3). Site and modelledAPAR increase with MAT and are correlated significantly(Pearson’s correlation, p<0.05), but the site APARs increasemore steeply with MAT (see also Table 2). As shown above,the models cannot reproduce the increase of fAPAR (i.e. in-crease of LAI) from boreal to temperate so that their slope ofAPAR vs MAT simply represents increasing radiation, whilethe larger observed slope is due to additionally increasingfAPAR.
Despite considerable scatter there is a trend of site RUEto increase with MAT which is only reproduced by the Or-chidee model but the Pearson’s correlation between MAT
and RUE is not significant in both cases. The trend of in-creasing RUE in observed data from boreal to temperate re-gions is confirmed by an independent study using remotelysensed fAPAR and in-situ measured radiation (Jung, unpub-lished). Rising RUE may result from more favourable tem-perature conditions for photosynthesis or due to increasingrubisco concentrations in the needles as nitrogen becomesmore available. The latter factor is supported by data fromWright et al. (2004) that show larger concentrations of nitro-gen per unit of leaf area in temperate than in boreal biomes.The Orchidee model shows increasing RUE with MAT likelybecause different optimum temperatures are assigned for bo-real and temperate coniferous trees.
Site APAR and RUE for LPJ are different than “site” forOrchidee and Biome-BGC, the latter two being almost iden-tical (Fig. 5). This difference can only result from differentseasonal patterns of LAI. The assumption in LPJ that leafarea is constant over the year for evergreens seems to have asignificant effect. Modelling small increases of fAPAR dur-ing summer (fresh needles) when radiation is high seems to
www.biogeosciences.net/4/647/2007/ Biogeosciences, 4, 647–656, 2007
654 M. Jung et al.: Assessing land ecosystem models
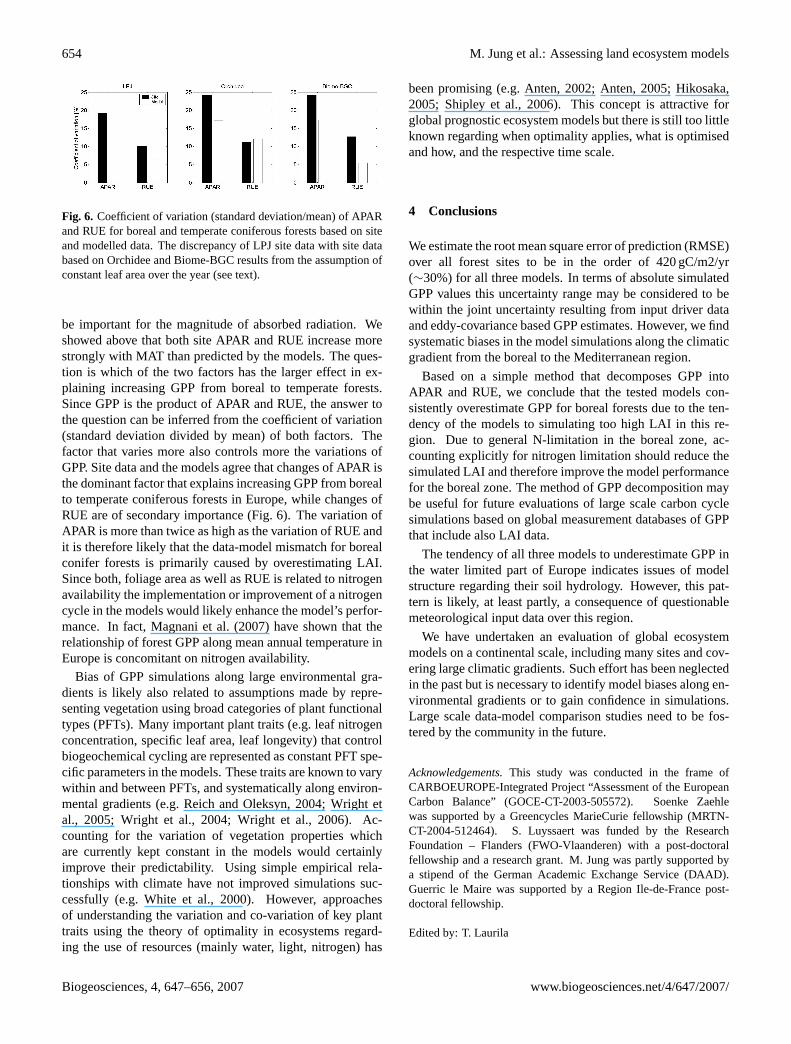
Fig. 6. Coefficient of variation (standard deviation/mean) of APARand RUE for boreal and temperate coniferous forests based on siteand modelled data. The discrepancy of LPJ site data with site databased on Orchidee and Biome-BGC results from the assumption ofconstant leaf area over the year (see text).
be important for the magnitude of absorbed radiation. Weshowed above that both site APAR and RUE increase morestrongly with MAT than predicted by the models. The ques-tion is which of the two factors has the larger effect in ex-plaining increasing GPP from boreal to temperate forests.Since GPP is the product of APAR and RUE, the answer tothe question can be inferred from the coefficient of variation(standard deviation divided by mean) of both factors. Thefactor that varies more also controls more the variations ofGPP. Site data and the models agree that changes of APAR isthe dominant factor that explains increasing GPP from borealto temperate coniferous forests in Europe, while changes ofRUE are of secondary importance (Fig. 6). The variation ofAPAR is more than twice as high as the variation of RUE andit is therefore likely that the data-model mismatch for borealconifer forests is primarily caused by overestimating LAI.Since both, foliage area as well as RUE is related to nitrogenavailability the implementation or improvement of a nitrogencycle in the models would likely enhance the model’s perfor-mance. In fact, Magnani et al. (2007) have shown that therelationship of forest GPP along mean annual temperature inEurope is concomitant on nitrogen availability.
Bias of GPP simulations along large environmental gra-dients is likely also related to assumptions made by repre-senting vegetation using broad categories of plant functionaltypes (PFTs). Many important plant traits (e.g. leaf nitrogenconcentration, specific leaf area, leaf longevity) that controlbiogeochemical cycling are represented as constant PFT spe-cific parameters in the models. These traits are known to varywithin and between PFTs, and systematically along environ-mental gradients (e.g. Reich and Oleksyn, 2004; Wright etal., 2005; Wright et al., 2004; Wright et al., 2006). Ac-counting for the variation of vegetation properties whichare currently kept constant in the models would certainlyimprove their predictability. Using simple empirical rela-tionships with climate have not improved simulations suc-cessfully (e.g. White et al., 2000). However, approachesof understanding the variation and co-variation of key planttraits using the theory of optimality in ecosystems regard-ing the use of resources (mainly water, light, nitrogen) has
been promising (e.g. Anten, 2002; Anten, 2005; Hikosaka,2005; Shipley et al., 2006). This concept is attractive forglobal prognostic ecosystem models but there is still too littleknown regarding when optimality applies, what is optimisedand how, and the respective time scale.
4 Conclusions
We estimate the root mean square error of prediction (RMSE)over all forest sites to be in the order of 420 gC/m2/yr(∼30%) for all three models. In terms of absolute simulatedGPP values this uncertainty range may be considered to bewithin the joint uncertainty resulting from input driver dataand eddy-covariance based GPP estimates. However, we findsystematic biases in the model simulations along the climaticgradient from the boreal to the Mediterranean region.
Based on a simple method that decomposes GPP intoAPAR and RUE, we conclude that the tested models con-sistently overestimate GPP for boreal forests due to the ten-dency of the models to simulating too high LAI in this re-gion. Due to general N-limitation in the boreal zone, ac-counting explicitly for nitrogen limitation should reduce thesimulated LAI and therefore improve the model performancefor the boreal zone. The method of GPP decomposition maybe useful for future evaluations of large scale carbon cyclesimulations based on global measurement databases of GPPthat include also LAI data.
The tendency of all three models to underestimate GPP inthe water limited part of Europe indicates issues of modelstructure regarding their soil hydrology. However, this pat-tern is likely, at least partly, a consequence of questionablemeteorological input data over this region.
We have undertaken an evaluation of global ecosystemmodels on a continental scale, including many sites and cov-ering large climatic gradients. Such effort has been neglectedin the past but is necessary to identify model biases along en-vironmental gradients or to gain confidence in simulations.Large scale data-model comparison studies need to be fos-tered by the community in the future.
Acknowledgements.This study was conducted in the frame ofCARBOEUROPE-Integrated Project “Assessment of the EuropeanCarbon Balance” (GOCE-CT-2003-505572). Soenke Zaehlewas supported by a Greencycles MarieCurie fellowship (MRTN-CT-2004-512464). S. Luyssaert was funded by the ResearchFoundation – Flanders (FWO-Vlaanderen) with a post-doctoralfellowship and a research grant. M. Jung was partly supported bya stipend of the German Academic Exchange Service (DAAD).Guerric le Maire was supported by a Region Ile-de-France post-doctoral fellowship.
Edited by: T. Laurila
Biogeosciences, 4, 647–656, 2007 www.biogeosciences.net/4/647/2007/
M. Jung et al.: Assessing land ecosystem models 655
References
Anten, N. P. R.: Evolutionarily stable leaf area production in plantpopulations, J. Theoretical Biol., 217(1), 15–32, 2002.
Anten, N. P. R.: Optimal photosynthetic characteristics of individ-ual plants in vegetation stands and implications for species coex-istence, Annals of Botany (London), 95(3), 497–508, 2005.
Bondeau, A., Kicklighter, D. W., and Kaduk, J.: Comparing globalmodels of terrestrial net primary productivity (NPP): impor-tance of vegetation structure on seasonal NPP estimates, GlobalChange Biol., 5, 35–45, 1999.
Breda, N.: Ground-based measurements of leaf area index: a reviewof methods, instruments and current controversies, J. Experimen-tal Botany, 54(392), 2403–2417, 2003.
Churkina, G., Tenhunen, J., Thornton, P., Falge, E. M., Elbers,J. A., Erhard, M., Grunwald, T., Kowalski, A. S., Rannik, U.,and Sprinz, D.: Analyzing the ecosystem carbon dynamics offour European coniferous forests using a biogeochemistry model,Ecosystems, 6(2), 168–184, 2003.
Cowling, S. A. and Field, C. B.: Environmental control of leaf areaproduction: Implications for vegetation and land-surface model-ing, Global Biogeochem. Cycles, 17(1), p. 14, 2003.
Cramer, W., Kicklighter, D. W., Bondeau, A., Moore, B., Churkina,C., Nemry, B., Ruimy, A., and Schloss, A. L.: Comparing globalmodels of terrestrial net primary productivity (NPP): overviewand key results, Global Change Biol., 5, 1–15, 1999.
Feser, F., Weisse, R., and von Storch, H.: Multi-decadal Atmo-spheric Modeling for Europe Yields Multi-purpose Data, EOSTransactions, 82, 305–310, 2001.
Hikosaka, K.: Leaf Canopy as a Dynamic System: Ecophysiol-ogy and Optimality in Leaf Turnover, Ann. Bot., 95(3), 521–533,doi:10.1093/aob/mci050, 2005.
IGBP-DIS: Global Soil Data Products CD-ROM. Global Soil DataTask 2000.
Jacob, D. and Podzun, R.: Sensitivity studies with the regional cli-mate model REMO, Meteorol. Atmos. Phys., 63(1–2), 119–129,1997.
Jung, M., Vetter, M., Herold, M., Churkina, G., Reichstein, M., Za-ehle, S., Cias, P., Viovy, N., Bondeau, A., Chen, Y., Trusilova,K., Feser, F., and Heimann, M.: Uncertainties of modelling GPPover Europe: A systematic study on the effects of using differ-ent drivers and terrestrial biosphere models, Global Biogeochem.Cycles, accepted, 2007.
Kalnay, E., Kanamitsu, M., Kistler, R., Collins, W., Deaven, D.,Gandin, L., Iredell, M., Saha, S., White, G., Woollen, J., Zhu, Y.,Chelliah, M., Ebisuzaki, W., Higgins, W., Janowiak, J., Mo, K.C., Ropelewski, C., Wang, J., Leetmaa, A., Reynolds, R., Jenne,R., and Joseph, D.: The NCEP/NCAR 40-year reanalysis project,Bull. Am. Meteorol. Soc., 77(3), 437–471, 1996.
Krinner, G., Viovy, N., de Noblet-Ducoudre, N., Ogee, J., Polcher,J., Friedlingstein, P., Ciais, P., Sitch, S., and Prentice, I. C.:A dynamic global vegetation model for studies of the cou-pled atmosphere-biosphere system, Global Biogeochem. Cycles,19(1), 33 pp., 2005.
Kucharik, C. J. Barford, C. C., El Maayar, M., Wofsy, S. C., Mon-son, R. K., and Baldocchi, D. D.: A multiyear evaluation of a Dy-namic Global Vegetation Model at three AmeriFlux forest sites:Vegetation structure, phenology, soil temperature, and CO2 andH2O vapor exchange, Ecol. Model. 196(1–2), 1–3, 20061.
Luyssaert, S., Inglima, I., Jung, M., Reichstein, M., Papale, D.,
Piao, S., Schulze, E.-D., Wingate, L., Matteucci, G., Aubinet,M., Beer, C., Bernhofer, C., Black, K. G., Bonal, D., Chambers,J., Ciais, P., Davis, K. J., Delucia, E. H., Dolman, A., Don, A.,Gielen, B., Grace, J., Granier, A., Grelle, A., Griffis, T., Grn-wald, T., Guidolotti, G., Hanson, P., Harding, R., Hollinger, D.,Kolari, P., Kruijt, B., Kutsch, W., Lagergren, F., Laurila, T.,Law, B., Le Maire, G., Lindroth, A., Magnani, F., Marek, M.,Mateus, J., Migliavacca, M., Misson, L., Montagnani, L., Mon-crieff, J., Moors, E., Munger, J. W., Nikinmaa, E., Loustau, D.,Pita, G., Rebmann, C., Richardson, A. D., Roupsard, O., Saigusa,N., Sanz, M., Seufert, G., Soerensen, L., Tang, J., Valentini, R.,Vesala, T., and Janssens, I. A.: The CO2-balance of boreal, tem-perate and tropical forests derived from a global database, GlobalChange Biol., accepted, 2007.
Magnani, F. Mencuccini, M., Borghetti, M., Berbigier, P.,Berninger, F., Delzon, S., Grelle, A., Hari, P., Jarvis, P. G.,Kolari, P., Kowalski, A. S., Lankreijer, H., Law, B. E., Lin-droth, A., Loustau, D., Manca, G., Moncrieff, J. B., Rayment,M., Tedeschi, V., Valentini, R., and Grace, J.: The human foot-print in the carbon cycle of temperate and boreal forests, Nature,447(7146), 849–851, 2007.
McGuire, A. D., Sitch, S., Clein, J. S., Dargaville, R., Esser, G., Fo-ley, J., Heimann, M., Joos, F., Kaplan, J., Kicklighter, D. W.,Meier, R. A., Melillo, J. M., Moore, B., Prentice, I. C., Ra-mankutty, N., Reichenau, T., Schloss, A., Tian, H., Williams,L. J., and Wittenberg, U.: Carbon balance of the terrestrialbiosphere in the twentieth century: Analyses of CO2, climateand land use effects with four process-based ecosystem models,Global Biogeochem. Cycles, 15(1), 183–206, 2001.
Moorcroft, P. R.: How close are we to a predictive science of thebiosphere?, Trends in Ecology & Evolution, 21(7), 400–407,2006.
Morales, P., Sykes, M. T., Prentice, I. C., Smith, P., Smith, B., Bug-mann, H., Zierl, B., Friedlingstein, P., Viovy, N., Sabate, S.,Sanchez, A., Pla, E., Gracia, C. A., Sitch, S., Arneth, A., andOgee, J.: Comparing and evaluating process-based ecosystemmodel predictions of carbon and water fluxes in major Europeanforest biomes, Global Change Biol., 11(12), 2211–2233, 2005.
Reich, P. B. and Oleksyn, J.: Global patterns of plant leaf N and P inrelation to temperature and latitude. Proceedings of the NationalAcademy of Sciences of the United States of America, 101(30),11 001–11 006, 2004.
Reichstein, M., Falge, E., Baldocchi, D., Papale, D., Aubinet,M., Berbigier, P., Bernhofer, C., Buchmann, N., Gilmanov,T., Granier, A., Grunwald, T., Havrankova, K., Ilvesniemi, H.,Janous, D., Knohl, A., Laurila, T., Lohila, A., Loustau, D., Mat-teucci, G., Meyers, T., Miglietta, F., Ourcival, J. M., Pumpanen,J., Rambal, S., Rotenberg, E., Sanz, M., Tenhunen, J., Seufert,G., Vaccari, F., Vesala, T., Yakir, D., and Valentini, R.: Onthe separation of net ecosystem exchange into assimilation andecosystem respiration: review and improved algorithm, GlobalChange Biol., 11(9), 1424–1439, 2005.
Reichstein, M., Papale, D., Valentini, R., Aubinet, M., Bernhofer,C., Knohl, A., Laurila, T., Lindroth, A., Moors, E., Pilegaard, K.,and Seufert, G.: Determinants of terrestrial ecosystem carbonbalance inferred from European eddy covariance flux sites, Geo-phys. Res. Lett. 34, 5 pp., doi:10.1029/2006GL027880, 2007.
Ruimy, A., Kergoat, L. and Bondeau, A.: Comparing global modelsof terrestrial net primary productivity (NPP): analysis of differ-
www.biogeosciences.net/4/647/2007/ Biogeosciences, 4, 647–656, 2007
656 M. Jung et al.: Assessing land ecosystem models
ences in light absorption and light-use efficiency, Global ChangeBiol., 5, 56–64, 1999.
Scurlock, J. M. O., Cramer, W., Olson, R. J., Parton, W. J., andPrince, S. D.: Terrestrial NPP: Toward a consistent data set forglobal model evaluation, Ecol. Appl., 9(3), 913–919, 1999.
Shipley, B., Lechoweicz, M. J., Wright, I., and Reich, P. B.: Funda-mental trade-offs generating the worldwide leaf economics spec-trum, Ecology, 87(3), 535–541, 2006.
Sitch, S., Smith, B., Prentice, I. C., Arneth, A., Bondeau, A.,Cramer, W., Kaplan, J. O., Levis, S., Lucht, W., Sykes, M. T.,Thonicke, K., and Venevsky, S.: Evaluation of ecosystem dy-namics, plant geography and terrestrial carbon cycling in the LPJdynamic global vegetation model, Global Change Biol., 9(2),161–185, 2003.
Thornton, P.: Regional Ecosystem Simulation: Combining Surface-and Satellite-Based Observations to Study Linkages betweenTerrestrial Energy and Mass Budgets. PhD Thesis, University ofMontana, Missoula, 1998.
Thornton, P.: Modeling and measuring the effects of disturbancehistory and climate on carbon and water budgets in evergreenneedleleaf forests, Agr. Forest Meteorol., 113, 185–222, 2002.
Vetter, M., Churkina, G., Bondeau, A., Chen, Y., Ciais, P., Feser,F., Freibauer, A., Geyer, R., Heimann, M., Jones, C., Jung, M.,Papale, D., Reichstein, M., Tenhunen, J., Tomelleri, E., Viovy,N., and Zaehle, S: Analyzing the causes and spatial pattern ofthe European 2003 carbon flux anomaly in Europe using sevenmodels, Biogeosciences Discuss., 4, 1201–1240, 2007,http://www.biogeosciences-discuss.net/4/1201/2007/.
White, A., Thornton, P., Running, S., and Nemani, R.: Parame-terization and sensitivity analysis of the Biome-BGC terrestrialecosystem model: Net primary production controls, Earth Inter-actions, 4(3), 1–85, 2000.
Wright, I. J., Reich, P. B., Cornelissen, J. H. C., Falster, D. S.,Groom, P. K., Hikosaka, K., Lee, W., Lusk, C. H., Niinemets, U.,Oleksyn, J., Osada, N., Poorter, H., Warton, D. I., and Westoby,M.: Modulation of leaf economic traits and trait relationships byclimate, Global Ecol. Biogeogr., 14(5), 411–421, 2005.
Wright, I. J., Global Ecology and Biogeography et al.: The world-wide leaf economics spectrum, Nature, 428(6985), 821–827,2004.
Wright, J. P., Global Ecology and Biogeography et al.: Conven-tional functional classification schemes underestimate the rela-tionship with ecosystem functioning, Ecol. Lett., 9(2), 111–120,2006.
Zaehle, S., Sitch, S., Smith, B., and Hatterman, F.: Effects of pa-rameter uncertainties on the modeling of terrestrial biosphere dy-namics, Global Biogeochem. Cycles, 19(3), 18 pp., 2005.
Biogeosciences, 4, 647–656, 2007 www.biogeosciences.net/4/647/2007/
Related Documents