Intelligence Brief Assessing the 2017 Medicare Advantage Star ratings On October 12, 2016, the Centers for Medicare and Medicaid Services (CMS) released the Medicare Advantage (MA) Star ratings for 2017. Given the multiple sources of volatility in the MA market, including the recent election results, we wanted to understand how payors are performing on these metrics, because delivering quality programs that receive a Star bonus is an important lever payors can use to improve their MA performance. We therefore analyzed CMS’s data covering 530 MA health plans—from the 50 states, the District of Columbia, and Puerto Rico—to develop a perspective on the payor industry’s Stars performance. We also compared this year’s results against the Star ratings CMS released in previous years. We found that the overall enrollment-weighted average Star score in 2017 was largely unchanged from 2016, although, on average, contracts 1 did improve their underlying performance on the Star measures. We also uncovered trends indicating it will be critical for payors to continue to invest in their capabilities. For example, contracts with a 4-Star rating or higher (4+ rating) appear to be more likely to survive in the market and to experience much stronger enrollment growth than lower-performing competitors. More specifically: ■ The industry-wide enrollment-weighted average Star rating was 4.03 in 2016 and 4.00 in 2017. 2 This year, like last year, the enrollment-weighted average score for contract performance improved by 0.10 Stars. However, changes in cut points and the addition of the Categorical Adjustment Index 3 offset the increase. ■ Health maintenance organizations (HMOs) outperformed the market, with an enrollment- weighted average Star rating of 4.08 in 2017. The score for preferred provider organizations (PPOs) decreased to 3.80. 1 Star ratings are awarded at the contract level. Contracts can contain multiple plans and multiple plan designs. 2 Methodology used to calculate enrollment-weighted average is described in the appendix. 3 The Categorical Adjustment Index (CAI) is a factor that is added to (or subtracted from) a contract’s Star rating to adjust for the within-contract disparities in performance associated with a contract’s percentages of beneficiaries with low-income subsidy/dual-eligible and disability status.

Welcome message from author
This document is posted to help you gain knowledge. Please leave a comment to let me know what you think about it! Share it to your friends and learn new things together.
Transcript
Intelligence Brief
Assessing the 2017 Medicare Advantage Star ratings
On October 12, 2016, the Centers for Medicare and Medicaid Services (CMS) released the
Medicare Advantage (MA) Star ratings for 2017. Given the multiple sources of volatility in the
MA market, including the recent election results, we wanted to understand how payors are
performing on these metrics, because delivering quality programs that receive a Star bonus is an
important lever payors can use to improve their MA performance.
We therefore analyzed CMS’s data covering 530 MA health plans—from the 50 states, the
District of Columbia, and Puerto Rico—to develop a perspective on the payor industry’s Stars
performance. We also compared this year’s results against the Star ratings CMS released in
previous years. We found that the overall enrollment-weighted average Star score in 2017 was
largely unchanged from 2016, although, on average, contracts1 did improve their underlying
performance on the Star measures. We also uncovered trends indicating it will be critical for
payors to continue to invest in their capabilities. For example, contracts with a 4-Star rating or
higher (4+ rating) appear to be more likely to survive in the market and to experience much
stronger enrollment growth than lower-performing competitors.
More specifically:
■ The industry-wide enrollment-weighted average Star rating was 4.03 in 2016 and 4.00 in
2017.2 This year, like last year, the enrollment-weighted average score for contract
performance improved by 0.10 Stars. However, changes in cut points and the addition of
the Categorical Adjustment Index3 offset the increase.
■ Health maintenance organizations (HMOs) outperformed the market, with an enrollment-
weighted average Star rating of 4.08 in 2017. The score for preferred provider organizations
(PPOs) decreased to 3.80.
1 Star ratings are awarded at the contract level. Contracts can contain multiple plans and multiple plan designs.
2 Methodology used to calculate enrollment-weighted average is described in the appendix.
3 The Categorical Adjustment Index (CAI) is a factor that is added to (or subtracted from) a contract’s Star rating to
adjust for the within-contract disparities in performance associated with a contract’s percentages of beneficiaries
with low-income subsidy/dual-eligible and disability status.

McKinsey Center for U.S. Health System Reform
Assessing the 2017 Medicare Advantage Star ratings 2
■ Contracts built around integrated delivery networks (IDNs)4 received a higher rating (4.45)
than did contracts offered by commercial carriers5 (3.89) or Blues carriers (3.93).
■ Star ratings correlate with enrollment growth rates. Among the 2014 contracts that
remained in the market in 2016, those that retained a 4+ Star rating experienced 40.9%
growth. However, contracts that lost a 4+ Star rating had much slower growth (7.8%), and
contracts with consistent performance below 4 Stars had only 0.9% growth.
■ On a member-weighted basis, 90% of contracts that left the market between 2013 and 2016
were below 4 Stars.
■ Plan maturity is associated with higher Star ratings: scores were 3.42 for contracts that have
been in the program for fewer than five years, 3.72 for those with 5 to 10 years’
participation, and 4.09 for those in the program for more than 10 years.
■ A plan’s ability to handle member complaints, manage chronic conditions, and deliver
preventive care had the strongest correlation with overall performance changes.
Star ratings have remained flat since last year
Between last year and this year, the enrollment-weighted average MA Star rating remained
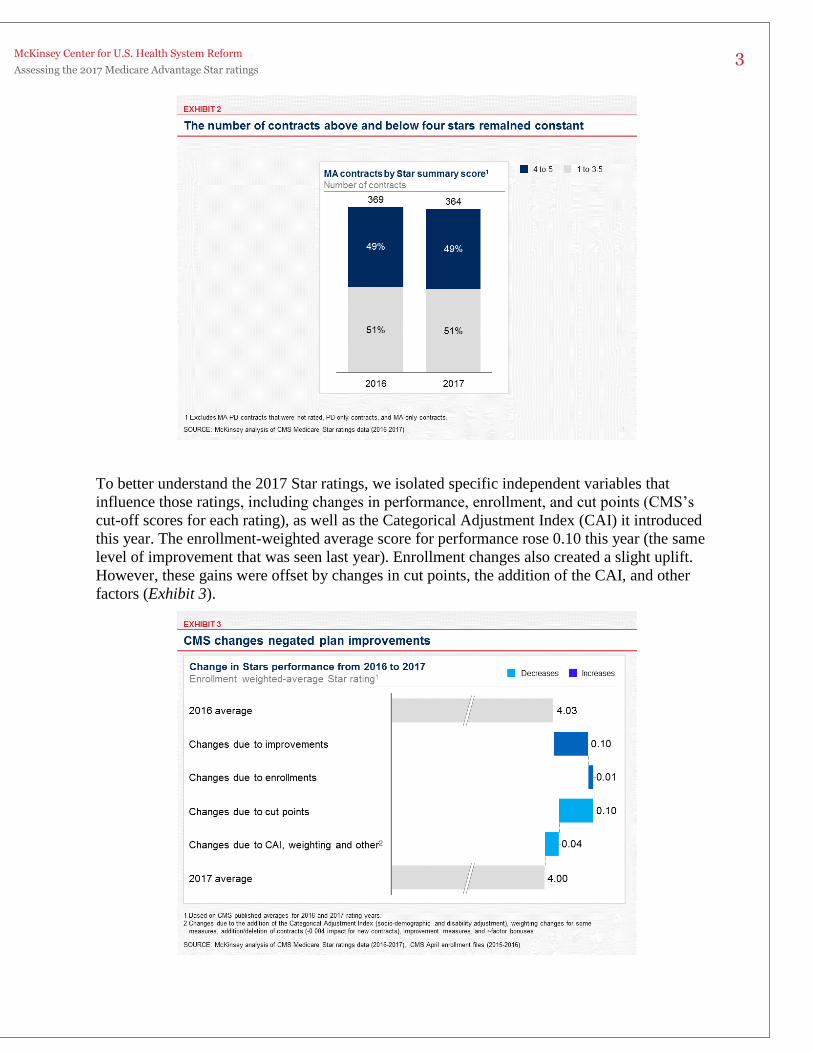
essentially flat—changing from 4.03 to 4.00 (Exhibit 1). This is the first time in six years the
score did not increase. Similarly, the proportion of contracts that received 4+ Stars did not
change from 2016 to 2017 (Exhibit 2).
4 Includes both provider-led IDNs and payor-led IDNs.
5 Commercial carriers are defined as those operated by for-profit entities that are not part of the Blue Cross Blue
Shield Association and not considered part of an integrated delivery network (IDN).
McKinsey Center for U.S. Health System Reform
Assessing the 2017 Medicare Advantage Star ratings 3
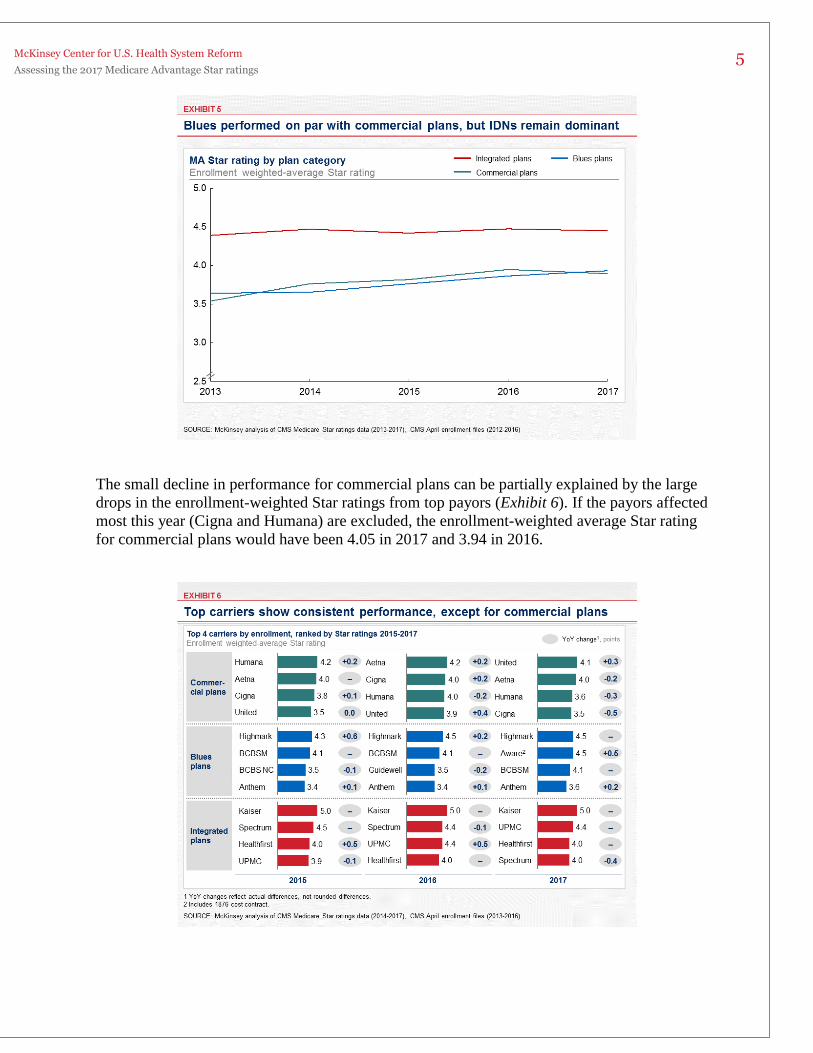
To better understand the 2017 Star ratings, we isolated specific independent variables that
influence those ratings, including changes in performance, enrollment, and cut points (CMS’s
cut-off scores for each rating), as well as the Categorical Adjustment Index (CAI) it introduced
this year. The enrollment-weighted average score for performance rose 0.10 this year (the same
level of improvement that was seen last year). Enrollment changes also created a slight uplift.
However, these gains were offset by changes in cut points, the addition of the CAI, and other
factors (Exhibit 3).

McKinsey Center for U.S. Health System Reform
Assessing the 2017 Medicare Advantage Star ratings 4
HMOs outperformed the market
Among all MA contracts, HMOs received the highest enrollment-weighted average 2017 Star
rating (4.08), on par with last year’s 4.07 and higher than the overall average. PPO scores
declined from last year. Local PPO contracts dropped from 4.16 to 3.94, and regional PPO
contracts decreased from 3.33 to 3.18 (Exhibit 4).
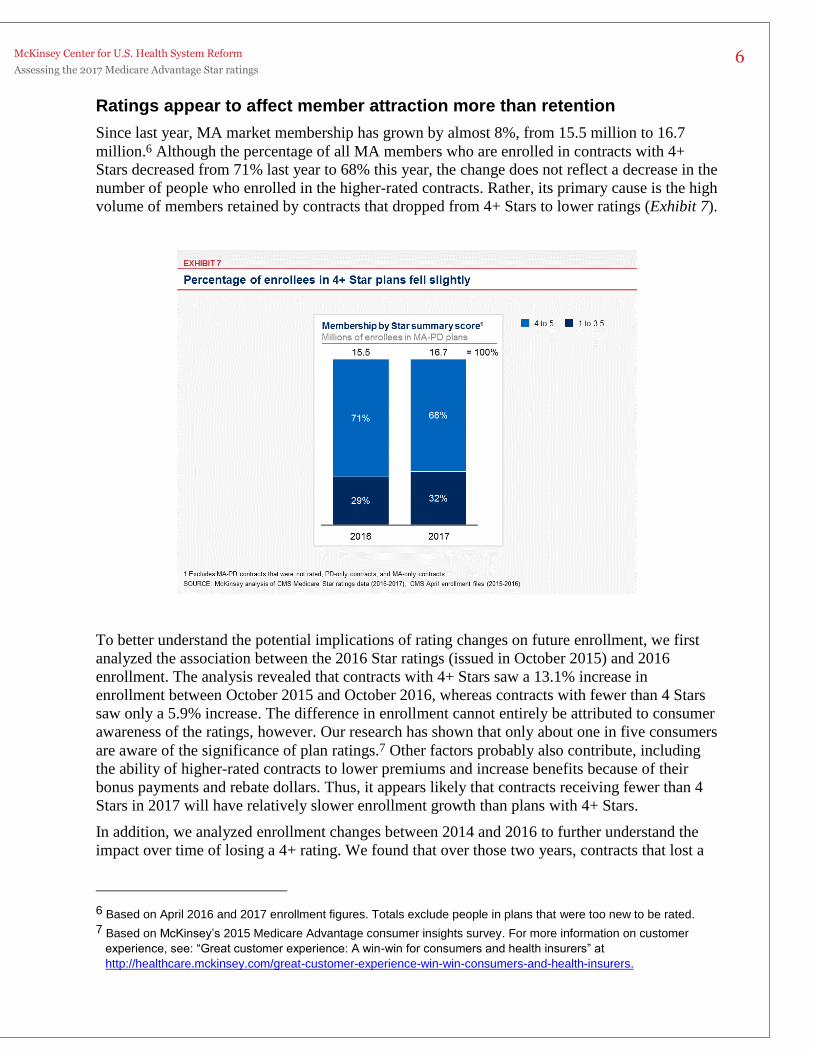
IDNs continue to outperform Blues and commercial contracts
Between the 2016 and 2017 ratings, the enrollment-weighted average score for Blues plans rose
slightly (from 3.86 to 3.93), whereas commercial plans experienced a small decline (from 3.95 to
3.89); 2017 was the first time since 2013 that Blues plans had a higher score than commercial
plans. The 2017 rating for IDNs was much higher (4.45) but was largely unchanged from the
previous year (4.47). IDNs have held the lead position for the past five years (Exhibit 5).
However, if Kaiser Permanente is excluded, the enrollment-weighted average 2017 score for
IDNs drops to 4.02, significantly closer to the national average for all plans without Kaiser
(3.92).
One factor contributing to the Blues’ performance improvement was the rating given to Aware’s
(BCBS Minnesota’s) 1876 contract, which was too new to be rated last year. Aware, which
received a rating of 4.5 stars, includes 7% of all Blues enrollment this year. If that contract is
excluded, the Blues’ enrollment-weighted average score would be 3.89, on par with the rating for
commercial plans. The slight improvement from last year’s 3.86 was driven primarily by the
higher ratings given this year to three of Anthem’s HMO plans and two of Guidewell’s plans
(one HMO and one regional PPO).
McKinsey Center for U.S. Health System Reform
Assessing the 2017 Medicare Advantage Star ratings 5
The small decline in performance for commercial plans can be partially explained by the large
drops in the enrollment-weighted Star ratings from top payors (Exhibit 6). If the payors affected
most this year (Cigna and Humana) are excluded, the enrollment-weighted average Star rating
for commercial plans would have been 4.05 in 2017 and 3.94 in 2016.
McKinsey Center for U.S. Health System Reform
Assessing the 2017 Medicare Advantage Star ratings 6
Ratings appear to affect member attraction more than retention
Since last year, MA market membership has grown by almost 8%, from 15.5 million to 16.7
million.6 Although the percentage of all MA members who are enrolled in contracts with 4+
Stars decreased from 71% last year to 68% this year, the change does not reflect a decrease in the
number of people who enrolled in the higher-rated contracts. Rather, its primary cause is the high
volume of members retained by contracts that dropped from 4+ Stars to lower ratings (Exhibit 7).
To better understand the potential implications of rating changes on future enrollment, we first
analyzed the association between the 2016 Star ratings (issued in October 2015) and 2016
enrollment. The analysis revealed that contracts with 4+ Stars saw a 13.1% increase in
enrollment between October 2015 and October 2016, whereas contracts with fewer than 4 Stars
saw only a 5.9% increase. The difference in enrollment cannot entirely be attributed to consumer
awareness of the ratings, however. Our research has shown that only about one in five consumers
are aware of the significance of plan ratings.7 Other factors probably also contribute, including
the ability of higher-rated contracts to lower premiums and increase benefits because of their
bonus payments and rebate dollars. Thus, it appears likely that contracts receiving fewer than 4
Stars in 2017 will have relatively slower enrollment growth than plans with 4+ Stars.
In addition, we analyzed enrollment changes between 2014 and 2016 to further understand the
impact over time of losing a 4+ rating. We found that over those two years, contracts that lost a
6 Based on April 2016 and 2017 enrollment figures. Totals exclude people in plans that were too new to be rated.
7 Based on McKinsey’s 2015 Medicare Advantage consumer insights survey. For more information on customer
experience, see: “Great customer experience: A win-win for consumers and health insurers” at
http://healthcare.mckinsey.com/great-customer-experience-win-win-consumers-and-health-insurers.
McKinsey Center for U.S. Health System Reform
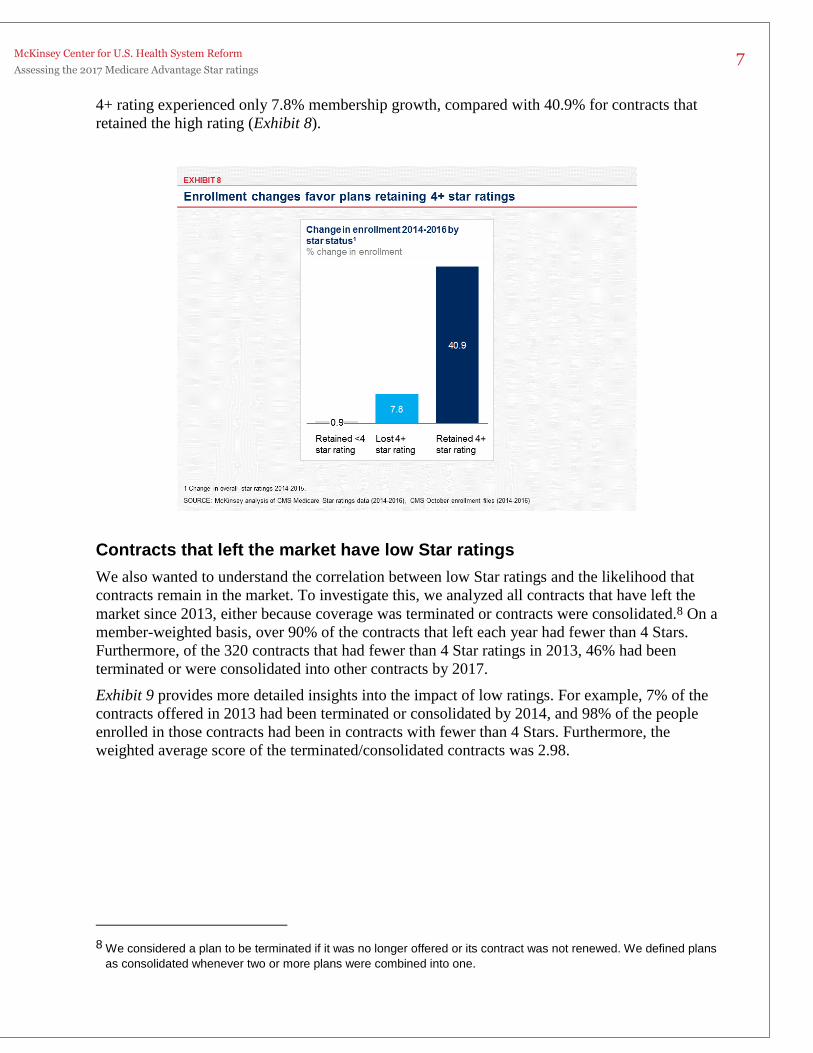
Assessing the 2017 Medicare Advantage Star ratings 7
4+ rating experienced only 7.8% membership growth, compared with 40.9% for contracts that
retained the high rating (Exhibit 8).
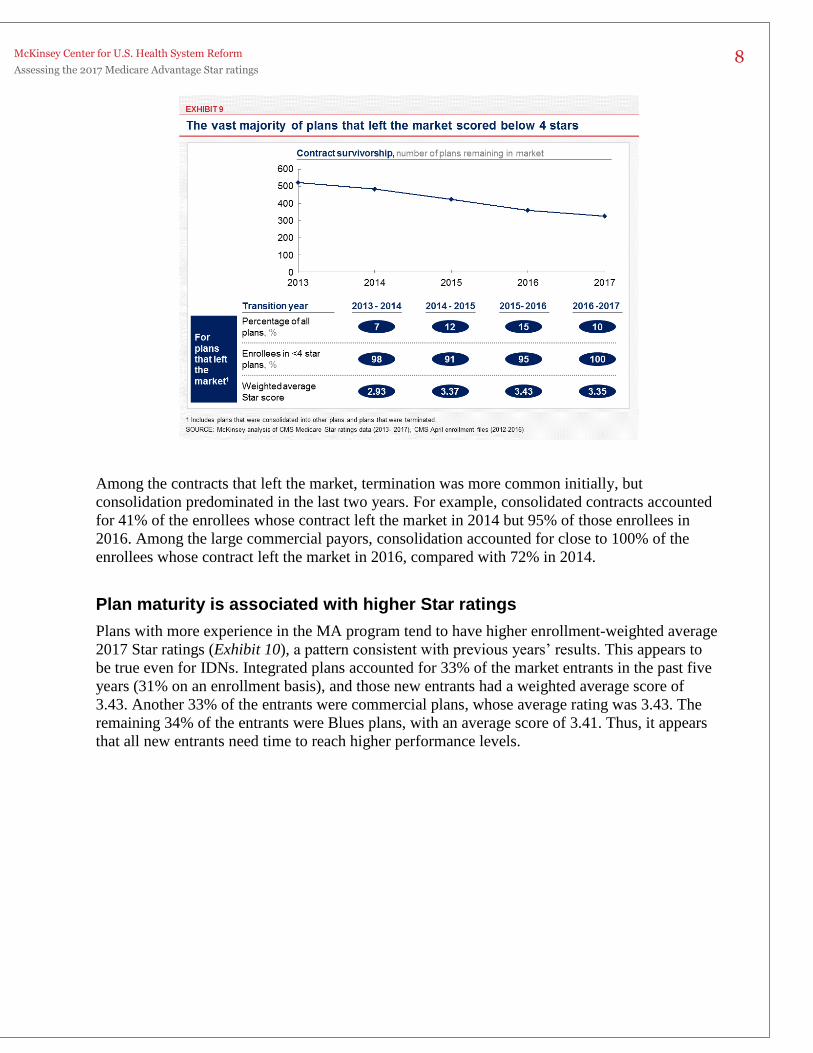
Contracts that left the market have low Star ratings
We also wanted to understand the correlation between low Star ratings and the likelihood that
contracts remain in the market. To investigate this, we analyzed all contracts that have left the
market since 2013, either because coverage was terminated or contracts were consolidated.8 On a
member-weighted basis, over 90% of the contracts that left each year had fewer than 4 Stars.
Furthermore, of the 320 contracts that had fewer than 4 Star ratings in 2013, 46% had been
terminated or were consolidated into other contracts by 2017.
Exhibit 9 provides more detailed insights into the impact of low ratings. For example, 7% of the
contracts offered in 2013 had been terminated or consolidated by 2014, and 98% of the people
enrolled in those contracts had been in contracts with fewer than 4 Stars. Furthermore, the
weighted average score of the terminated/consolidated contracts was 2.98.
8 We considered a plan to be terminated if it was no longer offered or its contract was not renewed. We defined plans
as consolidated whenever two or more plans were combined into one.
McKinsey Center for U.S. Health System Reform
Assessing the 2017 Medicare Advantage Star ratings 8
Among the contracts that left the market, termination was more common initially, but
consolidation predominated in the last two years. For example, consolidated contracts accounted
for 41% of the enrollees whose contract left the market in 2014 but 95% of those enrollees in
2016. Among the large commercial payors, consolidation accounted for close to 100% of the
enrollees whose contract left the market in 2016, compared with 72% in 2014.
Plan maturity is associated with higher Star ratings
Plans with more experience in the MA program tend to have higher enrollment-weighted average
2017 Star ratings (Exhibit 10), a pattern consistent with previous years’ results. This appears to
be true even for IDNs. Integrated plans accounted for 33% of the market entrants in the past five
years (31% on an enrollment basis), and those new entrants had a weighted average score of
3.43. Another 33% of the entrants were commercial plans, whose average rating was 3.43. The
remaining 34% of the entrants were Blues plans, with an average score of 3.41. Thus, it appears
that all new entrants need time to reach higher performance levels.

McKinsey Center for U.S. Health System Reform
Assessing the 2017 Medicare Advantage Star ratings 9
Some performance factors correlate with positive Star performance
To identify where MA plans should target their improvement efforts, we ran a regression
analysis to determine how performance on specific measure domains affected their overall Star
ratings. CMS groups the measures into nine domains. The top three domains that influenced
scores (ranked in order of correlation with positive Star performance) are:
■ HD4: Member Complaints and Changes in the Health Plan’s Performance
■ HD2: Managing Chronic (Long Term) Conditions
■ HD1: Staying Healthy: Screenings, Tests and Vaccines
Exhibit 11 lists, in order, all nine domains. An explanation of which metrics fall within these
domains is provided in the appendix.

McKinsey Center for U.S. Health System Reform
Assessing the 2017 Medicare Advantage Star ratings 10
□ □ □
The findings in this Intelligence Brief provide a perspective on how CMS is rating the
performance of the MA plans offered for 2017. The information is based on publicly reported
data released on October 12, 2016.
—Monisha Machado-Pereira, Erica Coe, Dan Jamieson, Ananya Banerjee, Rebecca Hurley, and
Cara Repasky
The authors would like to thank Sophie Solomon, Camille Gregory, Adam Rudin, Eric Stoltz, and
Alex Luterek for their assistance with the analyses used in this article.

McKinsey Center for U.S. Health System Reform
Assessing the 2017 Medicare Advantage Star ratings 11
Appendix
Methodology
Enrollment-weighted average. On October 12, 2016, CMS released data on Medicare Advantage
contracts and plans offered for 2017, in advance of the annual enrollment period. McKinsey calculated
enrollment-weighted averages by taking the total number of enrollees in contracts and plans for 2016,
assigning higher weights to plans with higher enrollment.
The results were used to calculate the enrollment-weighted averages for 2017 Star ratings. The
enrollment-weighted average demonstrates Stars performance among carriers and products with the
highest level of participation and thus allows us to understand overall trends.
Enrollment. The October 2016 summary Star rating data from CMS was used as a filter for the April
2016 CMS Medicare Advantage enrollment by state, county, and contract.
Therefore, enrollment in contracts that did not exist in the October 2016 ratings file are not included in
the enrollment data in this Intelligence Brief.
Sanctioned plans. Sanctioned plans (e.g., Cigna) were included in the analysis because they received
ratings and were included in CMS’s overall figures.
Domain measures. Exhibit 12 (below) includes a full list of the measures included in each domain.
Glossary
Integrated delivery network (IDN). A health plan model, either provider-led or payor-led, with close
alignment between the payor and provider functions.
McKinsey Center for U.S. Health System Reform
Assessing the 2017 Medicare Advantage Star ratings 12
Health maintenance organization (HMO). A plan model centered on a primary care physician who acts
as gatekeeper to other services and referrals; it provides no coverage for out-of-network services except in
emergency or urgent-care situations.
Preferred provider organization (PPO). A health plan model that allows members to see physicians and
receive services that are not part of a network, but the out-of-network services require a higher copayment.
Local PPOs serve specific counties that the plan chose to include in its service areas. Regional PPOs serve
one of twenty-six regions decided by Medicare, usually one or more states.
1876 contract. A plan that is operated by an HMO or competitive medical plan (CMP) based on a cost
reimbursement contract. Enrollees are not restricted to the HMO or CMP network, and can receive coverage
through original Medicare as well. Medicare payments to the HMO/CMP are based on the reasonable cost
of providing services to the Medicare beneficiaries.
Related papers from McKinsey
■ “Transitions in coverage type are the norm for most consumers over time” (July 2016)
■ “Improving acquisition and retention in Medicare” (March 2016)
■ “Assessing the 2016 MA Star ratings” (October 2015)
■ “2016 Medicare Advantage rates: Perspectives for payors” (April 2015)
■ “Individual market: Insights into consumer behavior at the end of open
enrollment” (September 2015)
■ “Assessing the 2015 MA Star ratings” (November 2014)
■ Individual market enrollment: Updated view” (March 2014)
■ “Exchange product benefit design: Consumer responsibility and value
consciousness” (February 2014)
■ “Individual market enrollment: Early assessments and observations” (January 2014)
■ “Hospital networks: Configurations on the exchanges and their impact on
premiums” (December 2013)
■ “Exchanges go live: Early trends in exchange dynamics” (October 2013)
■ “Emerging exchange dynamics: Temporary turbulence or sustainable market
disruption?” (September 2013)
October 2016
Copyright © 2016 McKinsey & Company
Any use of this material without specific permission of McKinsey & Company is strictly prohibited.
Related Documents