An-Najah National University Faculty of Graduate Studies Assessing Service Quality and Customer Satisfaction Using SERVQUAL Model: An Empirical Study of Palestinian Conventional Banks By Jamal Eddin Okal Supervised Dr. Ayham Jaaron This Thesis is Submitted in Partial Fulfillment of the Requirements for the Degree of Master of Engineering Management, Faculty of Graduate Studies, An-Najah National University, Nablus - Palestine. 2013

Welcome message from author
This document is posted to help you gain knowledge. Please leave a comment to let me know what you think about it! Share it to your friends and learn new things together.
Transcript
An-Najah National University
Faculty of Graduate Studies
Assessing Service Quality and Customer Satisfaction
Using SERVQUAL Model: An Empirical Study of
Palestinian Conventional Banks
By
Jamal Eddin Okal
Supervised
Dr. Ayham Jaaron
This Thesis is Submitted in Partial Fulfillment of the Requirements for
the Degree of Master of Engineering Management, Faculty of
Graduate Studies, An-Najah National University, Nablus - Palestine.
2013
II
Assessing Service Quality and Customer Satisfaction
Using SERVQUAL Model: An Empirical Study of
Palestinian Conventional Banks
By
Jamal Eddin Okal
This Thesis was Defended Successfully on 15/2/2013 and approved by:
Defense Committee Members Signature
1. Dr. Ayham Jaaron / Supervisor ................................
2. Dr. Mahasen Anabtawi / External Examiner …………………….
3. Dr. Mohammed Othman / Internal Examiner ……………………..

III
Dedication
To My Mother, Father, Brothers and Sisters
To My Loyal Wife
And To My Lovely Daughter
(Tala)
May Allah bless them all
For their support, encouragement and constant assistance to bring this work
to light
With All My Respect
Jamal
IV
Acknowledgment
Praise be to Allah the Almighty, and peace and blessing be upon his
messenger. All thanks to Allah: we can achieve nothing without his will,
help and support.
First and foremost I would like to offer my sincerest thanks to my
supervisor Dr.Ayham Jaroon for his invaluable academic and humanitarian
support. I would like to express my genuine gratitude to him for his patient,
kind supervision, continuous encouragement, and constructive guidance.
Without his extensive assistance and unlimited support this research would
not have been completed.
I would like to offer my thanks and my love to my lovely mother, father,
brothers, sisters, and my loyal wife Lana for their patience, moral support
and prayers. I will never forget my lovely daughter, Tala.
I have to express my deep and sincere gratitude to my Sister in law Dalia
Alazzeh and my brothers and friends Mahmoud Badawi and Raed Alsaialat
for their influential support
I would like to extend my thanks to all of my colleagues at Cairo Amman
Bank, for their help in the data collection stage and for encouraging me
during the research.
Finally, I would like to thank everybody who was important to the
successful realization of the study.
V
اإلقرار
انا الموقع ادناه، مقدم الرسالة التي تحمل العنوان:
Assessing Service Quality and Customer Satisfaction Using
SERVQUAL Model: An Empirical Study of Palestinian
Conventional Banks
ما تمت اإلشارة اليو باستثناءاقر بان ما اشتممت عميو ىذه الرسالة إنما ىو نتاج جيدي الخاص، حيثما ورد، و ان ىذه الرسالة ككل، او اي جزء من ىذه الرسالة لم يقدم من قبل لنيل درجة او لقب
عممي او بحثي لدى أية مؤسسة تعميمية او بحثية اخرى.
Declaration
The work provided in this thesis, unless otherwise referenced, is the
researcher‟s own work, and has not been submitted elsewhere for any other
degree or qualification.
Student Name: :اسم الطالب
Signature: :التوقيع
Date: :التاريخ
VI
Table of Contents
No Subject Page
Dedication III
Acknowledgment IV
Declaration V
List of Tables IX
List of Figures X
List of Abbreviations XI
Abstract XII
Chapter One: Introduction 1
1.1 Overview 1
1.2 Background 2
1.3 Research Problem 6
1.4 Research Objectives 8
1.5 Research Questions 9
1.6 Research Hypotheses 9
1.7 Significance of the research 10
1.8 Research Structure 11
Chapter Two: Literature Review 12
2.1 Service Quality 12
2.1.1 Service Quality Background 12
2.1.2 Service Quality and Competition in Banking Sector 14
2.1.3 Service Quality and Banks Performance 16
2.1.4 Service Quality and Customer Behavior 17
2.2 Impact of Service Quality on Customer Satisfaction 21
2.3 Customer Loyalty 28
2.4 Service Quality Dimensions 33
2.5 Service Quality Models 34
2.5.1 Technical and Functional Quality Model 36
2.5.2 GAP Model (SERVQUAL) 37
2.5.3 Attribute service quality model 42
2.5.4 Performance Only Model (SERVPERF) 44
2.5.5 Attribute and overall affect model 44
2.5.6 PCP attribute model 45
2.5.7 Internal service quality model 47
2.5.8 The Hierarchical Model of Service Quality 48
2.6 SERVQUAL VS. SERVPREF 50
VII
2.7 Service Sector in Palestine 53
2.8 Service Quality Studies in Palestine 55
Chapter Three: Methodology 59
3.1 Overview 59
3.2 Research Approach 59
3.3 Research Strategy 61
3.3.1 Quantitative Method – Questionnaire 64
3.3.2 Qualitative Method – Interview 65
3.4 Sampling Technique 67
3.5 Questionnaire Design 71
3.6 Data Analysis Technique 72
3.6 Validity and Reliability 75
3.6.1 Reliability 75
3.6.2 Validity 76
3.7 Ethical Considerations 77
Chapter Four: Data Analysis 78
4.1 Overview 78
4.2 Demographic Information 78
4.2.1 Gender of Respondents 78
4.2.2 The Bank Size 79
4.2.3 Number of Years the Respondents Deal with the Bank 80
4.3 Statistical Analysis for SERVQUAL Model 80
4.3.1 SERVQUAL Model – Tangibles Domain 80
4.3.2 SERVQUAL Model – Reliability Domain 82
4.3.3 SERVQUAL Model – Assurance Domain 83
4.3.4 SERVQUAL Model – Responsiveness Domain 84
4.3.5 SERVQUAL Model – Empathy Domain 84
4.3.6 SERVQUAL Model – Overall Results 85
4.4 Hypothesis Testing 88
4.4.1 First Hypothesis: Testing difference between expected
and perceived service quality
89
4.4.2 Second Hypothesis: Testing difference between
expected and perceived service quality due to
respondents‟ gender
91
4.4.3 Third Hypothesis: Testing difference between expected
and perceived service quality, due to number of years
dealing with the bank
95
4.4.4 Fourth Hypothesis: Testing the difference between
expected and perceived service quality due to Bank size
98
4.5 Qualitative Data Analysis 101
4.5.1 First Theme: Implement latest and up-to-date
technologies
102
VIII
4.5.2 Second Theme: The need of less complicated
procedures (Internal and external)
103
4.5.3 Third Theme: Lack of investment in service quality 105
4.5.4 Fourth Theme: Enhancing employees Knowledge and
Loyalty
107
Chapter Five: Discussion 109
5.1 Overview 109
5.2 Reliability Domain 109
5.3 Responsiveness Domain 112
5.4 Assurance Domain 115
5.5 Empathy Domain 117
5.6 Tangibles Domain 121
5.7 Independent variables 122
5.8 Managerial Model 14
Chapter Six: Conclusions and Recommendations 130
6.1 Overview 130
6.2 Conclusions 130
6.3 Recommendations 131
6.4 Limitation of the study 133
6.5 Future Research Directions 133
References 134
Appendix A: Thesis Survey 166
Appendix B: Interviews Questions 171
Appendix C: Experts from banking sector 172
Appendix D: Front Line Bank Employees 173
Appendix E: Bank Quality Managers 174
Appendix F: Experts reviewed the interviews questions 175
ب الملخص

IX
List of Tables
No Subject Page
Table 1 Service Quality Models - Adapted: Seth et al. (2005) 35
Table 2 Summary of Service Quality Studies in Palestine 58
Table 3 Applicable case for each research strategy. Source Yin,
2003
63
Table 4 KOLMOGOROV-SMIRNOV TEST OF NORMALITY 74
Table 5 Reliability coefficients of each perceived domain of the
study
76
Table 6 Some of the Recent Studies used SERVQUAL Model 77
Table 7 Distribution of Respondents According to Gender 78
Table 8 Means of Tangibles Domain 82
Table 9 Means for Reliability Domain 83
Table 10 Means for Assurance Domain 83
Table 11 Means for Responsiveness Domain 84
Table 12 Means for Empathy Domain 85
Table 13 Means of SERVQUAL domains and Weighted Gap 86
Table 14 Mean Scores Interval Rating 88
Table 15 Wilcoxon Signed Ranks Test to examine the differences
between the respondents‟ expectations and perceived
services
90
Table 16 Mann Whitney test to compare the respondents' expected
and perceived services quality due to gender
94
Table 17 Kruskal Wallis test to compare the Customers‟ expected
and perceived services quality due to Years
97
Table 18 Kruskal Wallis test to compare the Customers‟ expected
and perceived services quality due to Bank Size
99
Table 19 Thematic Analysis Results 101
X
List of Figures
No Subject Page
Figure 1 Technical and Functional Quality Model – SOURCE:
GRONROOS (1984)
37
Figure 2 GAP SERVICE QUALITY MODEL – SOURCE:
PARASURAMAN ET AL. (1985)
39
Figure 3 service quality dimensions importance to customers 40
Figure 4 EXTENDED SERVICE QUALITY MODEL–
SOURCE: ZEITHAML ET AL. (1988)
41
Figure 5 ATTRIBUTE SERVICE QUALITY MODEL-
SOURCE: HAYWOOD-FARMER (1988) AS
ADAPTED BY SETH ET AL. (2005)
43
Figure 6 ATTRIBUTE AND OVERALL AFFECT MODEL –
SOURCE: DABHOLKAR ET AL. (1996)
45
Figure 7 PCP ATTRIBUTE MODEL – SOURCE: PHILIP AND
HAZLETT (1997)
47
Figure 8 INTERNAL SERVICE QUALITY MODEL-
SOURCE: FROST AND KUMAR (2000)
48
Figure 9 THE HIERARCHICAL MODEL OF SERVICE
QUALITY - SOURCE: BRADY AND CRONIN
(2001)
49
Figure 10 Deductive and inductive reasoning. Source: Trochim,
2006
60
Figure 11 RESEARCH FRAMEWORK 62
Figure 12 Questionnaire Variables 72
Figure 13 DISTRIBUTION OF RESPONDENTS ACCORDING
TO BANK SIZE
79
Figure 14 Number of Years the Respondents Deals with the Bank 80
Figure 15 Respondents results of all 22 questionnaire questions
(see appendix A)
85
Figure 16 SERVQUAL Domains Expectations and Perceptions 87
Figure 17 Research managerial model 129
XI
List of Abbreviations
PMA Palestine Monetary Authority
GDP Gross Domestic Product
ATM Automated Teller Machine
SERVQUAL Service Quality
BSQ Bank Service Quality
R&D Research and Development
PCBS Palestinian central bureau of statistics
VIP Very Important Person
XII
Assessing Service Quality and Customer Satisfaction Using
SERVQUAL Model: An Empirical Study of Palestinian Conventional
Banks
By
Jamal Eddin Okal
Supervised
Dr. Ayham Jaaron
Abstract
The banking sector is one of the most influencing sectors in the Palestinian
economy. But this sector lacks to quality services offered to the customers.
Therefore the purpose of this research is to assess service quality and
customers‟ satisfaction levels of offered services in the Palestinian
convectional banks. While customers‟ satisfaction plays an important role
in the banking sector. This research seeks to understand how service
quality is being implemented in the Palestinian conventional banks and the
implication of this on the local market. This research is considered as one
of the first researches that asses customers‟ satisfaction level in the
Palestinian conventional banks.
The researcher used a mixed methodology of quantitative and qualitative
methods for data collection. SERVQUAL model was used to create the
research questionnaire as a quantitative data collection tool for this
research. The researcher distributed 450 self-administrated questionnaires.
The data was collected from 397 complete questionnaires, and were
analyzed using SPSS software. The researcher used nonparametric methods
XIII
such as: Wilcoxon signed rank and Mann Whitney to get accurate results,
while the collected data was not normally distributed. On the other hand,
the researcher supported the quantitative results by performing qualitative
data analysis. Therefore, the researcher performed eight semi-structured
interviews, and analyzed data using codifying common sense approach.
The researcher analyzed the five domains of SERVQUAL model, and the
results showed that empathy domain was the weakest domain between all
of them, while this domain has the biggest gap between customers‟
expectations and perceptions. This domain followed by assurance,
reliability and responsiveness. And the smallest gap was detected in
tangibles domain. In addition, the researcher tested the effect of three
independent variables on service quality. The results showed that only
respondents‟ gender affects service quality, while number of years dealing
with the bank, and bank size variables didn‟t have any effect on service
quality.
In the light of this research results, the researcher developed a managerial
model that can helps service quality managers in the Palestinian
conventional banks to enhance their customers‟ satisfaction toward offered
services, by improving banks‟ service quality.
Keywords: Service Quality, Customer Satisfaction, SERVQUAL model,
Semi-Structure Interviews, Conventional Banks, Palestine.
1
Chapter One
Introduction
1.1 Overview
The innovative ideas for banking services have travelled fast around the
globe, evolving several competition strategies (Davenport et al., 2007).
These strategies were used by different banks to provide a set of attractive
services such as: Mobile Banking, Internet Banking, Bill Payment, Self-
serve Branches, Money Transfer, Special Currency Exchange Rates, Fast
Loans and Short / Long Term Loans. On the other hand, these services are
now available in many banks. According to Naeem and Saif (2009), a bank
can differentiate itself from competitors by providing high quality customer
service. In the customer satisfaction/service quality arena, aggregate market
studies have shown that higher customer satisfaction leads to higher level
of performance(Parastoo, So and Saeidi, 2015). A satisfied customer is
more likely to repurchase a product and share his experience with five or
six other people (Gronroos, 2001; Zairi, 2000), on the other side unsatisfied
customer can banish more business from the organization than ten highly
satisfied customers do (Mohsan et al., 2011).
So by adopting “service quality” concept, customers‟ satisfaction will be
improved rapidly. According to Oliver (1997) service quality can be
described as the result of customer comparisons between their expectations
about the service they will use and their perceptions about the service
company. This research will try to measure the gap between customers‟
2
expectation and perception in Palestinian Conventional banks in order to
enhance customers‟ satisfaction.
1.2 Background
Service quality is considered an integral constituent in business‟s success, it
is becoming a business strategy and a way of coping with highly
competitive markets. Several researches pointed out the benefits of
delivering quality services for customers such as gaining customer
satisfaction and loyalty (Mittal and Gera, 2013; Hussein and Hapsari, 2015)
The importance of service quality lies in expanding the customer base
through the word of mouth (advertising), building a good corporate image
and reducing operating costs which ultimately lead to business profit
(Berry et al., 1989; Cronin et al., 2000; Kang and James, 2004; Reichheld
and Kenny, 1990; Rust and Zahorik, 1993; Yoon and Suh, 2004). It‟s
argued as well that banks that manage service quality adequately can obtain
what called a competitive edge mainly: higher revenue, customer loyalty
and customer retention (Kumar et al., 2010). In addition, it is vital for
banks to understand customer needs and to compete with global
organization by adopting new technological system (Malhotra and
Mukherjee, 2004). Considering its importance for businesses, researching
service quality might be fruitful and represent under-researched area
especially in Palestine where political context varies.
3
An interesting body of literature has emerged in the last century which
discussed the service quality notion in different sectors (See for example
Gronroos, 1978; Parasuraman et al., 1988; Kasper et al., 1999). Crosby
(1979) defined the service quality by its conformance to customer‟s needs.
While Parasuraman et al. (1985, 1988) stated that the difference between
customer expectation of service and their perception of service
performance represent service quality. Moreover, Kasper et al. (1999)
defined service quality as the degree to which the service provider can
satisfy the expectations of the customer.
Notably, the service quality is unlike the product quality, so it is hard to
perceive and measure. Mainly because they share of the three consensus
characteristics evident in the literature as they were described by the
profound work of Parasuraman et al. (1985): intangibility (services are not
countable objects they reflect provider performance in certain point in
time), heterogeneous in nature (sectors that involve high labor content can‟t
maintain a uniform quality for all customers in each day ,quality is subject
to variation), inseparability (The quality takes place during the service
delivery under intense interaction between customer and service provider
the eventually customer might affect or shape quality process). While other
academics includes the perishability feature (Chang and Yeh, 2002; Kasper
et al., 1999).
4
Several studies attempt to break down the service quality into dimensions
and components, for example Gronroos (1978) broke down the service
quality into two main components: technical quality described by what the
service provider present during the service process and functional quality
described by the way the employee present the service to customers.
Furthermore, Lehtinen and Lehtinen (1982) divided service quality to three
dimensions‟ physical quality, corporate quality and interactive quality. The
three dimensions represent respectively a combination of corporate
building, corporate image and the employee‟s interaction with customers.
In this vein, Parasuraman et al (1985) performed an explanatory research to
develop a model for service quality. Research relied on executive
interviews in four sectors, Retail banking, credit card, security brokerage
and Maintenance Company. Choosing this sector is apparent for the intense
interaction with customers. Building the model required these interviews to
understand the management perception of consumer expectations. Later
interviews were implemented with twelve groups to explore the perception
of consumer on service quality and their expectation. The research
presented a ten dimension for service quality: tangibles, reliability,
responsiveness, competence, courtesy, credibility, security, access,
communication and understanding/knowing the customer. While this
model is subjective and socially constructed, one might argue that it‟s not
applicable in all contexts.
5
Three years later Zeithaml et al. (1988) refined the ten dimensions into five
to measure customer‟s perceived value of service quality famously known
as SERVQUAL. SERVQUAL which is widely used in the literature as it
became the best service quality model, it contains five dimension
tangibility (physical appearance for objects), reliability (dependable service
provider), assurance (features that diffuse customer confidence),
responsiveness (quick assistant to customers), and empathy (available
personal to help customers). Still, Angur et al. (1999) used the model and
data indicated that dimensions were not equally significant in explaining
variances in the overall service quality. They found that assurance appeared
to be the least important dimension. Responsiveness and reliability were
the most essential dimensions, followed by the empathy and tangible
dimensions, yet it was concluded from their study that SERVQUAL is the
best model to measure service quality in the banking sector.
In 1992, Cronin and Taylor investigated the relationship between service
quality and customer satisfaction suggesting that conceptualization for
service quality is based on a flowed paradigm. They tested the new
paradigm by SERVPERF, which uses the perception of customer on
service quality (perception was measured through distribution of 660
questionnaires in US market). Unlike SERVQUAL model, expectation is
not an element in SERVPERF (Baumann et al., 2007). Many academics
found that SERVEPRF is more efficient than SERVQUAL in relation to
numbers of measured items from 44 to 22 (Cronin and Taylor, 1992;
Bolton and Drew, 1991). Also, this paradigm considers the customer
6
satisfaction a significant link between purchase and post-purchase process
in terms of attitude change, repeat purchase and brand loyalty (Churchill
and Surprenant, 1982).
Several studies posted the two paradigms of emerge in different countries
covering the service quality in banking sector. Angur et al. (1999)
investigated service quality in banking sector in India (two retail banks),
the overall results of the study supported a multidimensional construct of
service quality favoring the SERVQUAL model for its detailed diagnostic
information and emphasizing inapplicability of some factors. Also,
Lymperopoulos and Chaniotakis (2006) investigated the impact of service
quality in customer‟s selection; the study gave a better insight of service
quality in depositing money in several banks to master the quality
relationship. While Tsoukatos and Mastrojianni (2010) studied quality of
retail banking concluding a quality scale carved out from the combination
of SERVQUAL (precise determinants are assurance, efficiency, reliability
and confidence) and bank service quality scale.
1.3 Research Problem
One of the most influencing sectors in the Palestinian economy is the
Banking sector. According to Palestinian central bureau of statistics –
2015, financial and insurance activities account for 4% of real GDP (PCBS,
2016). The overall percent contribution from this sector to real GDP,
witnessed a large growth between 2014-2015 recorded at 19.2% (PCBS,
2016). The growth in this sector triggered high level of competition with
7
the aim of customer satisfaction. Customer satisfaction is very important in
this industry as evident in the literature, for instance aggregate market
studies have shown that to achieve higher level of performance,
customers‟ satisfaction should be enhanced (Parastoo, So and Saeidi,
2015).
Even though this sector has recorded growth in real GDP amount during
the last two years. Several banks are suffering from lower revenues in
relation with customers switching from one bank to another for a better
service quality. In this vein, there is an argument that despite several
initiatives taken by the management of Palestinian banks to increase
revenue creation, the overall sales revenue performance continues to grow
lesser than anticipated. Palestinian banks has lots of problems with
customers where most of them are dissatisfied with the offered services. As
a matter of fact, there are discrepancies between perceived performance
and expectations from customers point of view (perceived performance is
less than expectation) that makes them dissatisfied.
Still, there is a great possibility to improve the service quality provided by
banks through minimizing the gap between bank performance and
customer satisfaction. This research will study these claims by using the
SERVQUAL model and will suggest a conceptual framework to enhance
service quality strategies. Improved service quality is the critical factor that
will determine whether the business will survive or fail (Thompson, Green
and Bokma 2000). Better service quality typically helps to get higher
market share and better returns (Slu and Mou 2003). Taking into
8
consideration service quality parameters to improve service performance,
SERVQUAL model will be used to assess service quality parameters in
customer service departments of Palestinian Conventional Banks. This
model will be utilized to measure the difference between customers‟
expectations and perceptions in terms of performance, using various
service quality dimensions including tangibility, reliability, responsiveness,
assurance and empathy. Striving at meeting or exceeding customer
expectations; Palestinian Conventional Banks will be able to increase
market share and maintain a high service quality.
1.4 Research Objectives
The research seeks to achieve the following objectives:
1. Determining the level of service quality in Palestinian conventional
banks using the SEVQUAL Model as perceived by their customers.
2. Clarify the results of questioners‟ data analysis by performing interviews
with banks employees, to identify the weaknesses.
3. Assessing customer satisfaction with Palestinian conventional banks
services.
4. Developing conceptual framework to enhance service quality in
Palestinian Conventional Banks.
9
1.5 Research Questions
The key questions of this research include:
What is the level of service quality in the Palestinian conventional
banks?
What are the problems facing quality managers in the banking sector?
What appropriate model can be used in Palestinian conventional banks
with respecting its conditions to improve service quality?
What are the perceived quality dimensions differences between banks‟
customers and quality managers?
What is the effect of respondents‟ demographic information on the
perceived service quality?
1.6 Research Hypotheses
The researcher tested four main hypotheses as shown below using
Wilcoxon signed rank and Mann Whitney tests to explain the difference
between respondents. And also, Wilcoxon signed rank test was used to
check if respondent touches a significant difference between expected and
perceived services. Moreover, Kruskal Wallis test was used to check the
correlation between the year‟s intervals and other dependent variables:
1. There is no significant difference between the expected and perceived
service quality as seen by the respondents.
10
2. There is no significant difference between the expected and perceived
service quality due to the respondent gender.
3. There is no significant difference between the expected and perceived
service quality due to the number of years dealing with the bank.
4. There is no significant difference between the expected and perceived
service quality due to the Bank size.
1.7 Significance of the research
Based on the research problem, there is a need to develop a managerial
model to assess and improve service quality in Palestinian conventional
banks. While service quality plays an important role in enhancing banks
profitability and performance. However, it was detected that there were
many problems in banking sector due to low level of service quality. And
customers were not satisfied. Therefore, they were looking for better
service quality, and for that reason, they were switching from one bank to
another. This behavior was affecting banks market share which reflected
directly on the revenue. Finally, this research results will support efforts in
enhancing service quality level in the Palestinian conventional banks.
11
1.8 Research Structure
This research includes six chapters and these have been organized as
follows:
Chapter one, deals with the introduction to the research, including
background of the research, research problem, research objectives, key
questions, research hypotheses, significance of the research, and research
structure.
Chapter two, addresses the conventional banking sector in Palestine. And
also, it reviews the fundamentals of service quality in order to deeply
understand the critical factors of service quality.
Chapter three, represents the research methodology. The research strategy
was presented. And also, describing data collection instruments and
methods of data analysis.
Chapter four, presents data analysis of the quantitative and qualitative data
by using appropriate data analysis methods.
Chapter five, discussed research results and from these results a proposed
model was developed, which can be used to improve service quality in the
Palestinian conventional banks.
Finally, Chapter six presents the conclusions of the research, research
recommendations, research limitations, and future research directions.
12
Chapter Two
Literature Review
2.1 Service Quality
2.1.1 Service Quality Background
The term of service quality started to emerge in the last century and it was
discussed in different sectors (See for example Gronroos, 1978;
Parasuraman et al., 1988; Kasper et al., 1999). This was due to high
competition between firms in an increasingly competitive environment
(Carvalho and Brito, 2010; Choudhury, 2014; Okoe et al., 2013; Vanpariya
and Ganguly, 2010). Nielsen and Host (2000) noted that due to the absence
of well understanding of service quality definition, it was hard to employ
the concept of service quality.
The service quality had a great attention from both academicians and
practitioners (Negi, 2009). Hence, defining it is a significant for firms to
reach service quality improvement; many researchers tried to define it.
However, service quality term is a combination of two terms “service” and
“quality”, therefore these terms must be clarified in order to give a better
understanding to “service quality” term. Service term has many definitions
but the most comprehensive one was provided by Gronroos (2001), which
is "an activity or series of activities of a more or less intangible nature than
normal, but not necessarily, taken place in the interaction between the
customer and the service employees and/or physical resources or goods
and/or systems of the service provider, which are provided as solutions to
13
customer problems". Another definition of service was introduced by
While Kotler and Armstrong (2012). They defined it as an intangible action
offered to customer and at the end of it, no one will own anything. While
Quality term was also defined by several researchers, Crosby (1979)
defined quality by its conformance to customer‟s needs. Moreover, Batagan
et al. (2009) stated that quality represents the extent of satisfying
customer‟s needs.
Service quality term was ambiguous, therefore, it was differently defined
by several researchers, and they have shown that when investigating
service quality, it is unsuitable to use a product base definition of quality.
Garvin (1984) stated that service quality is the subjectively perceived
quality of service received by customers. Furthermore, Gronroos (1984)
defined service quality as the outcome of an evaluation process in which
the consumer compares his expectations with the perception of the services
he received. While Parasuraman et al. (1985, 1988) stated that the
difference between customer expectation of service and their perception of
service performance represent service quality. Moreover, Lewis et al.
(1994) stated that service quality can be described as how much the service
meets the customer expectations. And according to Bitner and Hubbert
(1994), „„service quality is consumers‟ overall impression of the relative
inferiority/superiority of the organization and its services‟‟. Later on,
Kasper et al. (1999) defined service quality as the degree to which the
service provider can satisfy the expectations of the customer.

14
Also, in service marketing literature, service quality was defined as the
overall assessment of a service by customer (Eshghi et al., 2007). While
Akroush (2008) said that service quality is the result of the comparison
between what customers feel firms should offer, and perceptions of the
performance provided by these firms. Moreover, Horn and Rudolf (2011)
defined service quality as the customers‟ satisfaction with the actual
performance of the service. The researcher thought that Parasuraman et al.
(1985, 1988) definition is the most suitable one to describe service quality.
However, all of the above definitions were broadly accepted as the basic
definition of service quality by several researchers.
2.1.2 Service Quality and Competition in Banking Sector
Service quality is considered integral in business‟s success; it is becoming a
business strategy and a way of coping with highly competitive markets.
Several researchers confirmed that in a competitive market it is vital to the
firms to offer premium service quality to their customers in order to
succeed and survive and to gain a competitive advantage especially in
services industry. (Spathis et al., 2004; Kheng et al., 2010; Ilyas et al.,
2013; Khan and Fasih, 2014; Domenge and Arciniega, 2015). This strategy
has been well recognized by the financial institutions. The evaluation of the
banks‟ performance in the eye of the customers is a continuous process.
Service quality has a major impact on this process which is essential for
improving customer satisfaction and customer loyalty. Therefore, these
factors are critical for improving banks‟ performance and increasing banks‟
profitability and gaining a larger market share, which will lead to a
15
remarkable market position (Khan and Fasih, 2014). Moreover, Perrien et
al. (1992) stated that due to the high competitive environment, financial
institutions have to revise their strategies and focus on long-lasting
relationships with customers. In addition, Al Karim and Chowdhury (2014)
stated that the banking industry is customer oriented, namely; banks rely on
the customer to survive in the competitive market, therefore banks have to
implement a high level of service quality to maintain a high level of
customer satisfaction, and acquire a sustainable competitive advantage.
However, sustaining a leading position in such competitive market is the
most important for banks; they could achieve this goal through
differentiating themselves from competitors by offering and holding an
outstanding level of service quality (Zeithaml et al., 1996; Ladhari, 2008;
Al Karim and Chowdhury, 2014). Moreover, Naeem and Saif (2009) stated
that if a bank wants to distinguish itself from the competitors, it has to
provide customers with an extraordinary service quality. Therefore, banks
provide the same services to their customers, such as: ATMs, Internet
Banking, Mobile Banking, Bill payment and similar “technology based
services”, these services become common for banks‟ customers (Rawani
and Gupta, 2000). Banks have to distinguish themselves by focusing on the
“high touch” factors more than the “high tech” factors (Angur et al., 1999).
On the other hand, Njanike (2008) stated that due to low Information
Communication Technology (ICT) infrastructure in the developing
countries, the service quality is low too; which impacts the rate of return on
investment in the banking sector. Furthermore, Newman (2001)
16
emphasized on differentiating banks from its competitors and improving
the relationship with the customers, they have to redefine their corporate
image by emphasizing on service quality.
2.1.3 Service Quality and Banks Performance
Firms‟ performance consisted of firms‟ operations and strategies (Hunger
and Wheelen, 2003). The relationship between service quality and firms
performance was investigated in specialized business literature. Several
researchers confirmed the existence of a positive significant impact of
service quality on banks performance (Duncan and Elliott, 2004;
Chumpitaz and Paparoidamis, 2004; Akroush and Khatib, 2009). In
addition, Lewis (1993) stated that the role of service quality to enhance the
business performance could be summarized by reducing costs and
increasing productivity. Accordingly, Melville et al. (2004) showed that
firms‟ performance has two aspects: the first one is operational efficiency
(such as improvement of service quality), and the second one is
improvement of the bottom line (such as revenue increase, reducing costs).
Firms‟ performance could be measured through firms‟ profitability
(Soteriou and Zenios, 1999). In fact, several empirical studies showed a
positive relationship between service quality and firms‟ profitability.
Therefore, reducing firms‟ cost and increasing revenues may be achieved
through improving customers‟ loyalty and retaining customers, who may
repurchase form this firm again or recommend it to referrals, which in
return increases firms‟ profitability (Lee et al., 2000; Baker and Crompton,
17
2000; Gurau and Ranchhod, 2001; Parida and Baksi, 2011; Horn and
Rudolf, 2011). Moreover, Akroush and Khatib (2009) stated that service
firms which cares about service quality and consider it as an important
strategy gains several advantages such as: securing medium and long term
benefits that confirm continuous improvements, premium prices, better
customer value, and customer orientation leading to higher profits.
Therefore, Rust et al. (2002) suggested three strategies to improve firms‟
profitability through service quality: 1) increase revenue by improving
customer – perceived quality, 2) reducing cost and improving efficiency,
and 3) a dual strategy that is a combination of the previous two strategies.
Furthermore, improving firms‟ profitability only does not guarantee a
sustainable leading market position, and to do so, it is essential to measure
the firms‟ performance continuously. Al-hawari (2005) showed two
methods to measure firms‟ performance: 1) subjective method (measuring
firms‟ performance based on stakeholders‟ evaluation and expectations or
comparison with their competitors, and 2) objective method (measuring the
performance based on the absolute measures such as financial ratios).
2.1.4 Service Quality and Customer Behavior
Service quality and profits relationship is not straightforward. To
understand this relation, it is necessary to recognize the inner relationship
between service quality and customers‟ behavioral intentions (Zahorik and
Rust, 1992). Customer behavioral intentions could be defined as a certain
intentions initiated due to the perceptions and the overall satisfaction levels,
these intentions determines the future relationship with the service provider
18
(Kamakura et al. 2002). Furthermore, Acheampong and Asamoah (2013)
defined customer behavioral intentions as “intentions that the customer
forms about his/her future behavior based on the perceptions of the
service”. Several researchers confirmed the positive relationship between
service quality, and customer‟s behavioral intentions (Yi et al. 2008;
Garma and Bove 2011; Jayawardhena and Farrell 2011). Moreover, in the
tourism industry Gonzalez et al. (2007) showed the impact of service
quality and customer satisfaction on behavioral intentions. Furthermore,
Zeithaml et al. (1996) pointed to the negative relationship between service
quality and customers‟ complaining behavior.
Positive behavioral intentions have several indicators such as spreading
positive word–of–mouth about the firm services, recommending firms‟
service to referrals, encouraging referrals to do business with the firm,
repurchase from the firm, considering the firm as the first choice when
service is needed, and continuing to do business with the firm (Choudhury,
2014). Parasuraman et al. (1988) stated that there is a positive relationship
between customers‟ perceptions of service quality and their willingness to
recommend firms‟ services to referrals, while Cronin and Taylor (1992)
focused on repurchase intentions, and they did not found any positive
impact of service quality on repurchase intentions, whereas Boulding et al.
(1993) focused on both repurchase intentions and willingness to
recommend firms‟ services to referrals, and they found a positive
relationship between them. Similarly, Reichheld and Kenny (1990) argued
that whenever the relationship between customer and firm was longer, the
19
firms‟ profitability will increase, due to the repurchase intention and
probability of recommendation to customer referrals.
According to the social exchange theory, people attempt to reciprocate
those who benefit them (Bateman and Organ, 1983). Hence, when a firm
satisfies its customers with offered services or when the customers feel that
received services is beyond their expectation, they are more likely to be
reciprocated by engaging in voluntary behaviors that may benefit the firm
(Patterson et al., 2001). Therefore, customers considered as firms‟ assets,
and they have different requirements and behaviors, thus firms have to deal
with each customer differently according to his/her behaviors (Lee et al.,
2016). Moreover, Yi et al. (2008) specified three dimensions of customer
behaviors: 1) customer feedback on the services (this kind of information
helps the firms to enhance their services), 2) helping other customers and 3)
recommend firms‟ services to referrals. These dimensions are useful for the
firm itself (increase profit and reduce costs) and for other customers
(getting adequate level of service quality). Furthermore, Mittal and Gera
(2013) noted that behavioral intentions might be affected by service
variables (i.e. quality, satisfaction and value). Furthermore, Kordshouli et
al. (2016) stated that customers‟ behavior might be affected by their
perception of service quality, and to encourage customers‟ behaviors, firms
have to offer high level of services quality
20
Bolton and Drew (1991) developed a quantitative model which provides
better understanding for changing in customers‟ attitude based on their
evaluation of service quality and their prior attitude, they used their model
to study the effect of service change on the customers‟ behavior. Mittal and
Gera (2013) performed an empirical research in the second largest bank in
India, to explore the relationship of the perceived service quality
dimensions, customer satisfaction, and perceived value with behavioral
intentions, and they found that customer decision making process is
comprehensive and complex, and it is necessary to incorporate the effect of
all the three service variables: 1)quality, 2)satisfaction, and 3)value while
determining their impact on customers‟ behavioral intentions. In addition,
Kordshouli et al. (2016) suggested a framework in their research, and this
framework showed that service quality affects customers‟ satisfaction
which will affect the customers‟ positive behavior, namely whenever the
level of service quality is high, customers‟ positive behavior will improve.
According to Fowler (2013), positive behaviors toward the firm enhance
firms‟ service quality and reduce costs.
Customers‟ behaviors might play a major role in assessing firms‟ strategies
that aims to satisfy customers (Rust and Oliver, 2000). According to Garma
and Bove (2011), one of the most important strategies to improve service
quality is the collaborative work with customers in the service delivery
process and by providing sufficient support for encouraging them toward
positive behaviors. Behavioral intentions are the only way to determining
customers actual retentions, while customers forms certain intentions about
21
future relationship with the firm based on their satisfaction level of the
received service (Kamakura et al., 2002)
2.2 Impact of Service Quality on Customer Satisfaction
Researchers become more precise about the meaning of customer
satisfaction. Lewis and Booms (1983) defined customer satisfaction as the
ability of the service provider to satisfy customer needs. While Yi (1990)
defined it as a collective outcome of perception, evaluation, and
psychological reactions to the consumption experience with a service.
Johnston (1995) noted that satisfaction is related to the customers‟ mood
when they receive the service. Solomon (1998) explained the customer
satisfaction as a set of feeling created when trying a service. But Anderson
and Fornell (2000) defined customer satisfaction as a tool to measure the
service quality experienced by customers that feels this service. In addition,
Caruana et al. (2000) stated that customer satisfaction is “a post-purchase,
global affirmative summary response occurring when customers are
questioned and are undertaken relative to retail banking services offered by
competitors”. According to Razak et al. (2007), customer satisfaction is the
result of customers‟ evaluation of a set of experiences performed with a
service provider. Moreover, Zeithaml (2009) stated that customer
satisfaction is an assessment of the service capability to meet customers‟
expectations. Furthermore, Kotler and Armstrong (2012) claimed that
customer satisfaction is a feeling obtained by the customer after performing
an evaluation process on the experienced service. Later on, Magesh (2010)
22
stated that customer satisfaction is a feeling of pleasure because one has
something or has achieved something.
In the last few years, banks‟ customers were seeking for the best quality of
offered services and nothing less, it was due to several choices they have,
and low cost for switching from one bank to another, at this point banks
recognized this new demand and decided to start changing their offered
services. Therefore, several benefits could be obtained from improving the
level of customer satisfaction. Some researchers considered customers‟
satisfaction as an essential indicator of overall business success, while
market power now is shifted to the customers. (Anderson et al., 1994;
Choudhury, 2014; Al Karim and Chowdhury, 2014). Subsequently, when
the banks satisfy their customers; banks market share and income will
increase, and as a result they will maintain a leading position in the
financial sector (Guo et al., 2008; Muyeed, 2012). Accordingly,
Syzmanski and David (2001) stated that customer satisfaction influences
repurchase behavior and price sensitivity which also have a major impact
on firms‟ profitability. Moreover, Rahman (2005) assumed that firm‟s will
gain loyalty, retention and profitability factors automatically, when they
care about customer satisfaction. Accordingly, Kaur et al. (2009) argued
that providing services that make customers more satisfied and loyal is
important for any firm wanting to compete in a highly competitive
environment.
23
Researchers identified several factors that affect customers‟ satisfaction.
Sureshchandar (2002) stated that the demographic characteristics of
customers are important factor to understand firms‟ customers in a proper
way, which leads to improve the customer satisfaction level. According to
Bryant and Cha (1996), customers‟ satisfaction levels vary between
customers, depending on four factors: 1) gender, 2) age, 3) socioeconomic
status, and 4) residence. In Vietnam, for example, which is a resource
challenging environment, Thur and Hau (2010) found that service
providers should understand personal values of customers that may vary
due to cultural and social demographic characteristics and provide
appropriate services in order to improve the customer satisfaction level.
It is very vital for any firm to care about achieving high level of customer
satisfaction. Service quality definition showed that there is a strong
relationship between service quality and customer satisfaction. Several
empirical studies examined this tight relationship; they found that there is a
positive relationship between them (Parasuraman et al., 1988; Kuo et al.,
2010; Ananth el al., 2011; Shanka, 2012; Al Karim and Chowdhury, 2014;
Khan and Fasih, 2014). Numerous researchers stated that to enhance the
level of customer satisfaction, firms have to improve their service quality
(Lee et al. 2016; Choudhury 2014a; Horn and Rudolf, 2011; Acheampong
and Asamoah, 2013) by concentrating on all service quality dimensions (Al
Karim and Chowdhury, 2014), these dimensions will be explained in a
separate section in this study. Furthermore, Pizam and Ellis (1999) argued
that if firms want to gain customer satisfaction, they must satisfy different
24
customers‟ needs in order to build a sustainable relationship with
customers, otherwise the profitability will be affected resulting from
dissatisfied customers‟ behaviors: (negative word–of–mouth, customer
switching from one firm to another, or consumption reduction).
In the same context, customer satisfaction could be achieved through
enhancing employees‟ satisfaction level. Several studies found a correlation
between customer satisfaction and measures of employee satisfaction
(Heskett et al., 1994; Koys, 2001; Acheampong and Asamoah, 2013).
Moreover, the service profit chain confirmed that satisfied employees
results in satisfied customers and satisfied customers tend to repurchase
again, which increase the firms‟ profits. The service profit chain could be
defined as "involving direct and strong relationships between profit;
growth; customer loyalty; customer satisfaction; the value of goods and
services delivered to customers; and employee capability, satisfaction,
loyalty and productivity” (Heskett et al., 1994). Accordingly, the service-
profit chain creates relationships between firm‟s profitability, customer
satisfaction, and employee satisfaction. Therefore, Acheampong and
Asamoah (2013) explained the links in this chain, and it was as follows:
„Profit and growth, stimulated by customer satisfaction and loyalty which
results from employee satisfaction and loyalty‟.
In the same manner, Kaur et al. (2009) in their study of the internal market
orientation in Indian banking sector, they focused on the people aspect of
service delivery, and they found that if a bank wants to achieve a higher
level of service delivery, they must enhance their management system and
25
focus more on their employees, in order to serve their customers in a better
way and increase customers‟ satisfaction level. Furthermore, Hinson et al.
(2011) in their study in Ghana, which is a resource challenging
environment, they found that international bank brands are better than local
bank brands in the eye of the customers, regarding to the presence of
service standards and the well training of bank employees.
Akroush and Khatib (2009) claimed that customer satisfaction occurred
during the process of delivering the service to the customer; hence bank
managers have to pay more attention to this process. Likewise, Duncan and
Elliot (2004), stated that service quality is an integral process, it starts from
the point of creating the service until delivering it to the customer, passing
through the way of delivering it to customer, who will evaluate each step in
this process and not only the service itself. Therefore, Athanassopoulos et
al. (2001) noted that evaluating the service quality mainly depends on
customers‟ expectations; therefore the quality in the eye of the customer
will be high when the performance exceeds customers‟ expectations and it
will be low when performance doesn‟t meet their expectations.
Accordingly, Gitomer (1998) claimed that meeting customer expectations
and offering a high service quality, will lead to customer satisfaction.
Song et al. (2015) recognized that firms were paying more attention to
customer reviews and considering it as key success factor. However, firms
struggle to include this function into their management process. Several
advantages could be obtained by satisfying firms‟ customers, and many
disadvantages occurred through dissatisfied customers. Satisfied customers
26
might repurchase the service they experienced, also satisfied customers
might spread a positive word–of–mouth, and as a result firms could acquire
new customers. On the other hand, dissatisfied customers might change the
service provider, even they will give a negative word–of–mouth, which
might push away potential customers, and so service providers must pay
attention to customer satisfaction (Cronin et al., 2000).
In the same context, Al Karim and Chowdhury (2014) found that satisfied
customers will have repurchase intensions and they probably may share
their experience with five or six people around them, while dissatisfied
customers will have intensions to switch to another firm, and they probably
will share their bad experiance with ten people around them. This makes
them more important to the firm to take care of them. Also, Reichheld and
Kenny (1990) showed that 20–40 % of new aquired customers, were due to
recommendation of current satisfied customers. Furthermore, Duncan and
Elliot (2004) made a comparison between different firms having various
level of customer service. The results showed that firm with superb level of
customer service (satisfied customers) have a 72% increase in profit per
employee compared with other firms that have poor customer service
(dissatisfied customers), also they found that through offering high level of
services, firms can retain their existing customers, which is five times
cheaper for the firm than attract new customers. On the other hand
dissatisfied customer might show a complaining behavior, either to friends
and relatives or to compatitors or external agancies, which might lead to a
significant lose in firms‟ profit (Singh 1988).
27
Richins (1983) showed a chance in customer dissatisfaction, if complaints
are encouraged, the service provider has a chance to rectify the negative
effect of word–of–mouth, and retain the dissatisfied customers and turn
them into satisfied customers, whom might share their experience with
people around them. Likewise, Choudhury (2014) noted that complaints
hold a chance to satisfy customers, thus firms have to create a robust and
trustworthy complaint mechanisms to allow the customers to use it.
Customers‟ satisfaction and dissatisfaction of an offered service, could not
be considered as opposites, because each one of them have its own
elements. For example some customers may experience a set of bad
services that offered from a firm, which certainly will decrease the
customers‟ satisfaction level, but still this will not eventually make them
dissatisfied, in other words these customers would not switch from this
firm to another because of this bad service. Furtheremore, customer
dissatisfaction with service quality variables does not necessarily
discourage firms‟ successful relationship with its customers. However,
controlling dissatisfaction may not necessarily lead to satisfaction; it is due
to customers‟ knowledge that is not possible to reach their expectation
every time. Moreover, they accept this substandard level of services.
Situational factors, previous experiences and word–of–mouth plays an
important role to prevent customers from being dissatisfied. (Johnston,
1995; Carvalho and Brito, 2010; Okoe et al., 2013; Lee et al., 2016).
Therefore, firms must adopt new strategies that include both customers‟
dissatisfaction removal and increasing the satisfaction level (Carvalho and
28
Brito, 2010). And also, it is necessary to monitor and measure the level of
customer satisfaction continuously and in a systematic manner
(Chakravarty et al., 1996; Ananth el al., 2011).
2.3 Customer Loyalty
Gremler and Brown (1996) argued that customer loyalty is the degree of
customer intention to repurchase from a specific service provider, and only
considering this provider when the customer needs a service. Furthermore,
Duffy (2003) suggested that customer loyalty is a feeling which a customer
has towards a brand. This feeling stimulate customer to repurchase a
product or a service. According to Lovelock and Wirtz (2011), customer
loyalty is an optional choice for the customer to continue dealing with a
firm‟s services over time. This leads to the conclusion that service
providers must pay more attention to customer loyalty if they want to
improve customer confidence of the firm (Gerpott et al., 2001).
Researchers supposed that there is a positive relationship between customer
loyalty and financial results. Reichheld (1996) studied the relationship
linking customer retention (loyalty) and profitability over a period of time,
and the study results show that firms can increases their profitability by
retaining loyal customers. Accordingly, Lee et al. (2000) claimed that
through higher customer loyalty, firms‟ revenue and market share will
increase. Moreover, Hayes (2008) stated that firms could increase its
profitability through loyal customers.

29
Additionally, service quality considered as the most important element that
affect customers‟ loyalty (Bei and Chiao, 2001; Ranaweera and Neely,
2003; Shanka, 2012). Several researchers studied the relationship between
customer loyalty and service quality. A significant correlation between
them was confirmed by Spreng and Mackoy (1996). Another studies
showed that if banks want to improve their customer loyalty, banks have to
improve their service quality in order to satisfy their customers through
identifying their needs. Gaining such loyal customers will differentiate a
bank from its competitors. (Ehigie, 2006; Perng, 2007).
Many researchers investigated the indirect effect of service quality on
customer loyalty. Therefore, it was recognized that service quality affects
the corporate image in a positive manner; researchers found that the higher
service quality, as perceived by customers, the greater positive image of the
corporation (Alfin et al., 2013; Cham and Easvaralingam, 2012). Corporate
image is accepted to have a significant role in creating customer loyalty,
and it could be defined as „the perception that different audiences have of
an organization and results from the audiences‟ interpretation of the cues
presented by an organization‟ (Hussein and Hapsari, 2015). Shu (2010)
claimed that service quality has an indirect effect on customer loyalty
through the corporate image. Furthermore, Hussein and Hapsari (2015)
proved, in their study on the Indonesian banking sector, that offering high
service quality enhances customer loyalty through the corporate image.
They also found that the more the corporate image is positive, the more
customer loyalty level will be. In addition, Clemes et al. (2013), in their
30
research in telecommunications industry, claimed that one of the most
essential predictors of customer loyalty is the corporate image. On the other
hand, Hart and Rosenberger (2004) did not find a major impact of
corporate image on customer loyalty, and it only had a slightly significant
impact on customer loyalty. Another significant predictors of customer
loyalty was found by several researchers: customer satisfaction, and service
quality have another indirect effects on customer loyalty through customer
satisfaction (Bloemer, 1999). Also, banks need to manage the indirect
effects (through customer satisfaction) of service quality for enhancing
customer loyalty (Mittal and Gera, 2013). Moreover, Jones and Sasser
(1995) stated that “even in markets with relatively little competition,
providing customers with outstanding value may be the only reliable way
to achieve sustained customer satisfaction and loyalty”. Several researchers
accepted that customer loyalty is the result of customer satisfaction (Cronin
et al., 2000; Boulding et al., 1993; Zeithaml, 2000; Pont and McQuilken,
2005). Moreover, many researchers claimed that customer satisfaction is an
essential factor for ensuring customer loyalty (Lee et al., 2016; Pollack,
2009; Smith and Bolton, 1998).
On the other hand, Carvalho and Brito (2010) claimed that merely
satisfying customers will not retain them loyal. In addition, Karatepe et al.
(2005) observed that a satisfied customer become loyal if a firm focuses on
customer expectations, which has great advantages to the firm, it will retain
this loyal customer, which means higher profit, higher market share, and
expanding the customer base. According to Khan and Fasih (2014),
31
customer loyalty is formed under six assumptions: 1) It is a function of
psychological processes, 2) It involves bias, 3) It involves some decision
making unit, 4) May relate to some alternative brands, 5) Behavioral
response, and 6) It is expressed over time.
As it was explained in section 2.2, the word–of–mouth has an important
effect on the customers‟ satisfaction. In addition, the word–of–mouth
influences the customer‟s loyalty. Curtis et al. (2011) showed that customer
loyalty consisting of different aspects such as repurchasing and
recommendation. Additionally, Heskett et al. (1994) found that loyal
customers always take courage to repurchase and convice others to
purchase the service or product he/she tried. Moreover, Godin and
Gladwell (2001) argued that the major benefits can be obtained from
customers loyalty are repurchasing and advertising for the firm through
positive word–of–mouth. Furthermore, Boulding et al. (1993) and
Reichheld (2003) agreed that customer recommendation (which also
known as positive word–of–mouth) represent customer loyalty. Khan and
Fasih (2014) stated that loyal customers will work as marketing agents for
the bank, by spreading their positive experience, then bank‟s customer base
will be larger, and accordingly the market share will increase, which is
essential for any bank to enhance its profit.
Loyal customers are the most valuable assets to any firm, while the
probability of loyal customers to switch to another firm is less than non-
loyal customers, and also they have higher intention to repurchase than
non-loyal customers (Hussein and Hapsari, 2015). According to Rahman
32
(2005), customer‟s loyalty is not consisting only from repurchasing or
increased volume of purchased services or products, it is bigger than that.
Sometimes, customers may still be loyal to a firm without purchasing
firms‟ services or products, due to some conditions that reduced customers‟
needs for the firm‟s services or products. Furthermore, Mardalis (2006)
identifies six reasons to encourage firms to enhance their customer loyalty:
1) loyal customers provide tremendous benefits to the firm. 2) The cost of
gaining new customers is more expensive than retaining current customers.
3) The customers who already believed in the firm would also believe in
other things it offers. 4) The operational costs of a firm are more efficient if
it has many loyal customers. 5) The firm may deduct the psychological and
social costs, and 6) Loyal customers would defend the firm, and even
attract and recommend it to other people. Therefore, some researchers see
that customer loyalty reaches its maximum limits when a customer risking
his/her reputation to recommend a firm service (Reichheld, 2003).
Moreover, Khan and Fasih (2014) added customer loyalty to the essential
factors for improving banks‟ performance, and they emphasize on
monitoring the banks‟ service quality regularly in order to gain the extreme
customer satisfaction, which in return will improve their customer retention
and loyalty.
33
2.4 Service Quality Dimensions
Service quality consisted of multiple dimensions and components. Several
researchers tried to illustrate them such as: Gronroos (1978) who broke it
down to two main components: first one is technical quality that described
by what the service provider present during the service process, and second
component is functional quality that described by the way the employee
present the service to customers. In addition, Akroush and Khatib (2009)
studied the relationship between service quality dimensions (functional and
technical) and banks performance, they found that the aforementioned
service quality dimensions have a significant effect on banks performance.
Moreover, they found that the functional quality dimension has a stronger
effect on all banks performance indicators than the technical quality
dimension. Parasuraman et al. (1988) divided service quality into five
dimensions‟: reliability, responsiveness, tangibles, assurance and empathy.
Mels et al. (1997) stated that Parasuraman et al. (1988) model measures
only two factors: intrinsic service quality (like Gronroos (1978) functional
quality) and extrinsic service quality (like Gronroos (1978) technical
quality). Furthermore, Lehtinen and Lehtinen (1982) divided service
quality into three dimensions‟: physical quality, corporate quality and
interactive quality. The three dimensions represent respectively a
combination of corporate building, corporate image, and the employee‟s
interaction with customers. In their research, they compared their three
dimensions with Gronroos (1978) model‟s dimensions. Lehtinen and
Lehtinen (1982) have considered their approach to be a higher level of
34
abstraction than Gronroos (1978) approach. Physical quality is related to
both technical and functional dimensions. Interaction quality is related to
technical quality, but corporate quality can be evaluated before the service
process (technical quality). Lehtinen and Lehtinen (1982) suggest that the
dimensions influence each other as the process affects the result of the
service. In addition, Kang and James (2004) found that there are three
dimensions for service quality they are: functional, technical and image.
They also found a significant effect of the three dimensions on the
perceived service quality and customer satisfaction. Additionally, they
tested the five sub dimensions of Parasuraman et al. (1988), and the results
showed that these five sub dimensions represented by the functional quality
dimension. Also technical quality has been ignored, because the customers
would not be able to recognize the technical service quality. Further, they
found that the image functions could be used as a filter in service quality
perception. Malhotra et al. (2005) observed the service quality dimensions
in international market contexts. They found that service quality
dimensions namely; reliability, customer understanding, responsiveness,
competence, courtesy, communication, credibility, security, and tangibility
were different in international markets due to sociocultural and economic
factors.
2.5 Service Quality Models
During the past few decades service quality has become a major area of
attention for practitioners and researchers; due to its strong effect on
business performance, lower costs, customer satisfaction, customer loyalty
35
and profitability (Cronin and Taylor, 1992; Newman, 2001). Several
researches were performed to tackle aspects of defining, modeling and
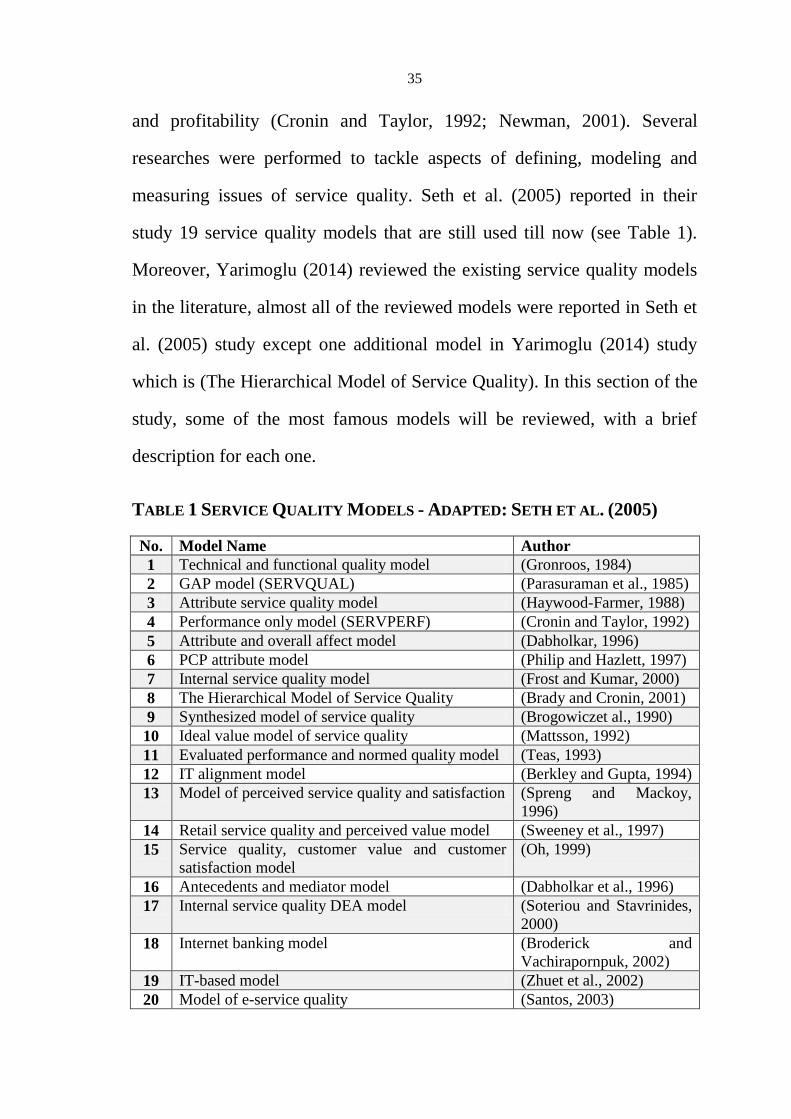
measuring issues of service quality. Seth et al. (2005) reported in their
study 19 service quality models that are still used till now (see Table 1).
Moreover, Yarimoglu (2014) reviewed the existing service quality models
in the literature, almost all of the reviewed models were reported in Seth et
al. (2005) study except one additional model in Yarimoglu (2014) study
which is (The Hierarchical Model of Service Quality). In this section of the
study, some of the most famous models will be reviewed, with a brief
description for each one.
TABLE 1 SERVICE QUALITY MODELS - ADAPTED: SETH ET AL. (2005)
No. Model Name Author
1 Technical and functional quality model (Gronroos, 1984)
2 GAP model (SERVQUAL) (Parasuraman et al., 1985)
3 Attribute service quality model (Haywood-Farmer, 1988)
4 Performance only model (SERVPERF) (Cronin and Taylor, 1992)
5 Attribute and overall affect model (Dabholkar, 1996)
6 PCP attribute model (Philip and Hazlett, 1997)
7 Internal service quality model (Frost and Kumar, 2000)
8 The Hierarchical Model of Service Quality (Brady and Cronin, 2001)
9 Synthesized model of service quality (Brogowiczet al., 1990)
10 Ideal value model of service quality (Mattsson, 1992)
11 Evaluated performance and normed quality model (Teas, 1993)
12 IT alignment model (Berkley and Gupta, 1994)
13 Model of perceived service quality and satisfaction (Spreng and Mackoy,
1996)
14 Retail service quality and perceived value model (Sweeney et al., 1997)
15 Service quality, customer value and customer
satisfaction model
(Oh, 1999)
16 Antecedents and mediator model (Dabholkar et al., 1996)
17 Internal service quality DEA model (Soteriou and Stavrinides,
2000)
18 Internet banking model (Broderick and
Vachirapornpuk, 2002)
19 IT-based model (Zhuet et al., 2002)
20 Model of e-service quality (Santos, 2003)
36
2.5.1 Technical and Functional Quality Model
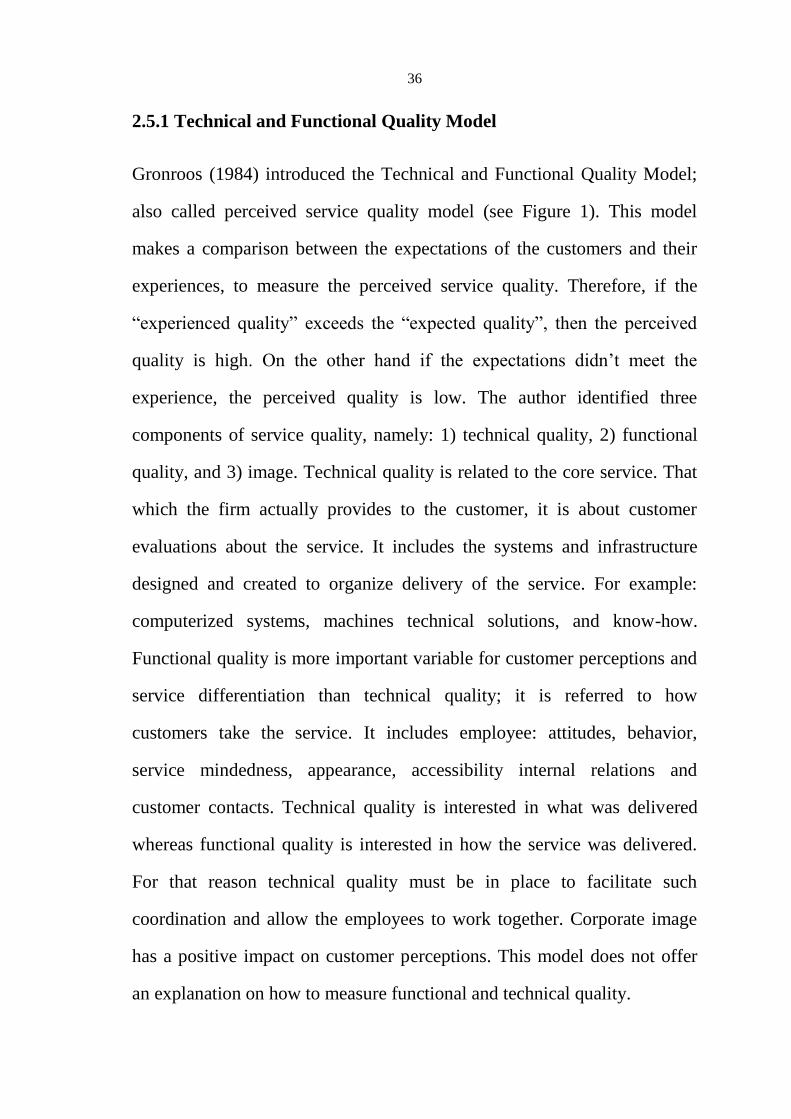
Gronroos (1984) introduced the Technical and Functional Quality Model;
also called perceived service quality model (see Figure 1). This model
makes a comparison between the expectations of the customers and their
experiences, to measure the perceived service quality. Therefore, if the
“experienced quality” exceeds the “expected quality”, then the perceived
quality is high. On the other hand if the expectations didn‟t meet the
experience, the perceived quality is low. The author identified three
components of service quality, namely: 1) technical quality, 2) functional
quality, and 3) image. Technical quality is related to the core service. That
which the firm actually provides to the customer, it is about customer
evaluations about the service. It includes the systems and infrastructure
designed and created to organize delivery of the service. For example:
computerized systems, machines technical solutions, and know-how.
Functional quality is more important variable for customer perceptions and
service differentiation than technical quality; it is referred to how
customers take the service. It includes employee: attitudes, behavior,
service mindedness, appearance, accessibility internal relations and
customer contacts. Technical quality is interested in what was delivered
whereas functional quality is interested in how the service was delivered.
For that reason technical quality must be in place to facilitate such
coordination and allow the employees to work together. Corporate image
has a positive impact on customer perceptions. This model does not offer
an explanation on how to measure functional and technical quality.
37
FIGURE 1: TECHNICAL AND FUNCTIONAL QUALITY MODEL – SOURCE: GRONROOS (1984).
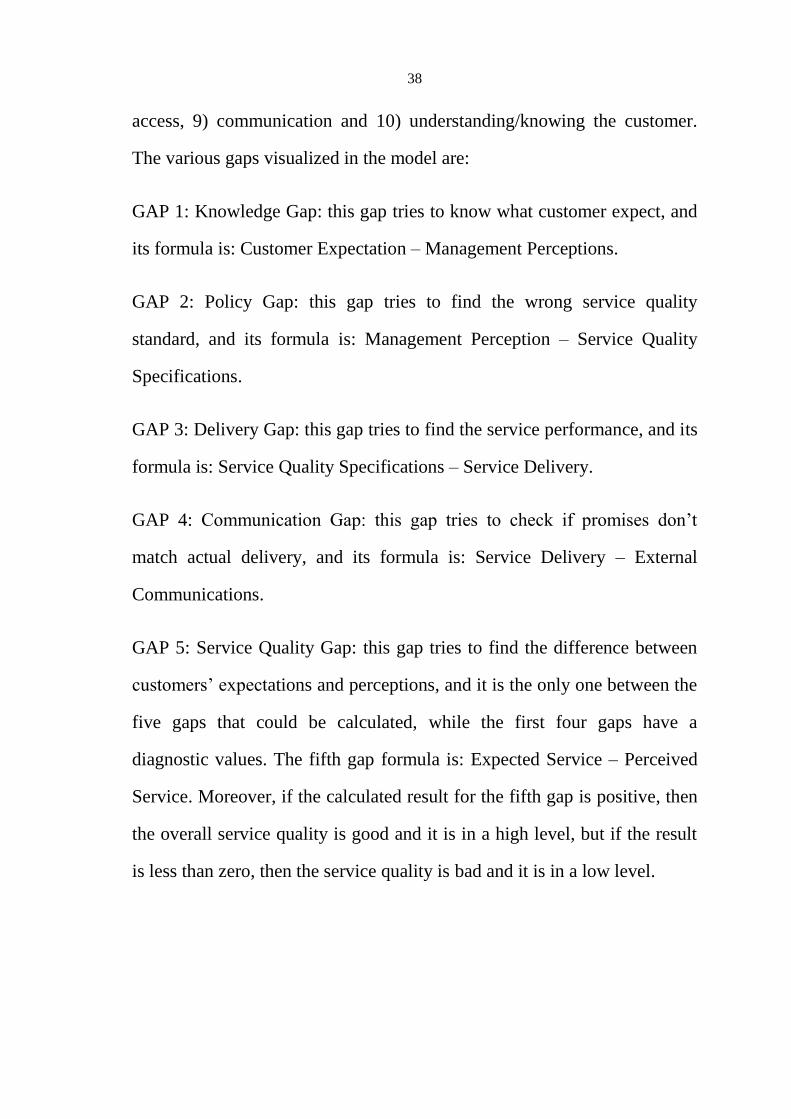
2.5.2 GAP Model (SERVQUAL)
Parasuraman et al. (1985) performed an explanatory research to develop a
model for service quality based on gap analysis (Figure 2) it was called the
GAP model. Research relied on executive interviews in four sectors: 1)
retail banking, 2) credit card, 3) security brokerage and 4) Maintenance
Company. Choosing this sector is apparent for the intense interaction with
customers. Building the model requires these interviews to understand the
management perception of consumer expectations. After that focus
interviews were implemented with twelve groups to explore the perception
of consumer on service quality and their expectation. The research
presented ten dimensions for service quality: 1) tangibles, 2) reliability, 3)
responsiveness, 4) competence, 5) courtesy, 6) credibility, 7) security, 8)
38
access, 9) communication and 10) understanding/knowing the customer.
The various gaps visualized in the model are:
GAP 1: Knowledge Gap: this gap tries to know what customer expect, and
its formula is: Customer Expectation – Management Perceptions.
GAP 2: Policy Gap: this gap tries to find the wrong service quality
standard, and its formula is: Management Perception – Service Quality
Specifications.
GAP 3: Delivery Gap: this gap tries to find the service performance, and its
formula is: Service Quality Specifications – Service Delivery.
GAP 4: Communication Gap: this gap tries to check if promises don‟t
match actual delivery, and its formula is: Service Delivery – External
Communications.
GAP 5: Service Quality Gap: this gap tries to find the difference between
customers‟ expectations and perceptions, and it is the only one between the
five gaps that could be calculated, while the first four gaps have a
diagnostic values. The fifth gap formula is: Expected Service – Perceived
Service. Moreover, if the calculated result for the fifth gap is positive, then
the overall service quality is good and it is in a high level, but if the result
is less than zero, then the service quality is bad and it is in a low level.
39
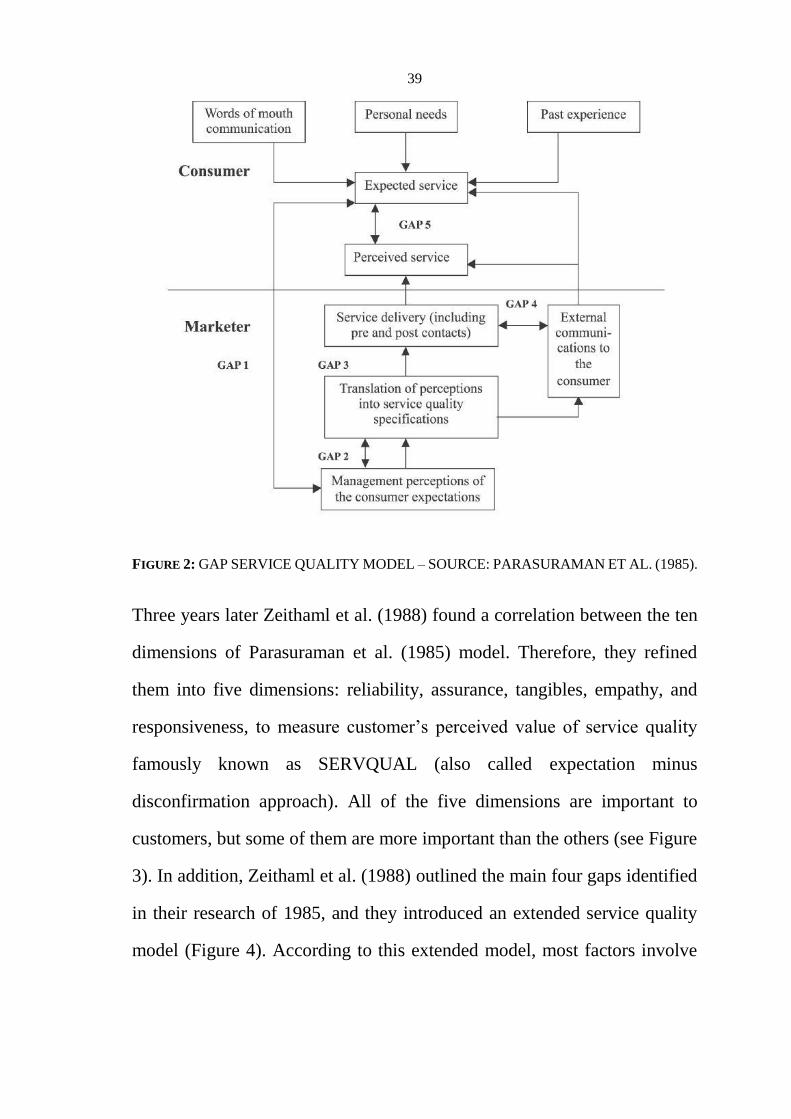
FIGURE 2: GAP SERVICE QUALITY MODEL – SOURCE: PARASURAMAN ET AL. (1985).
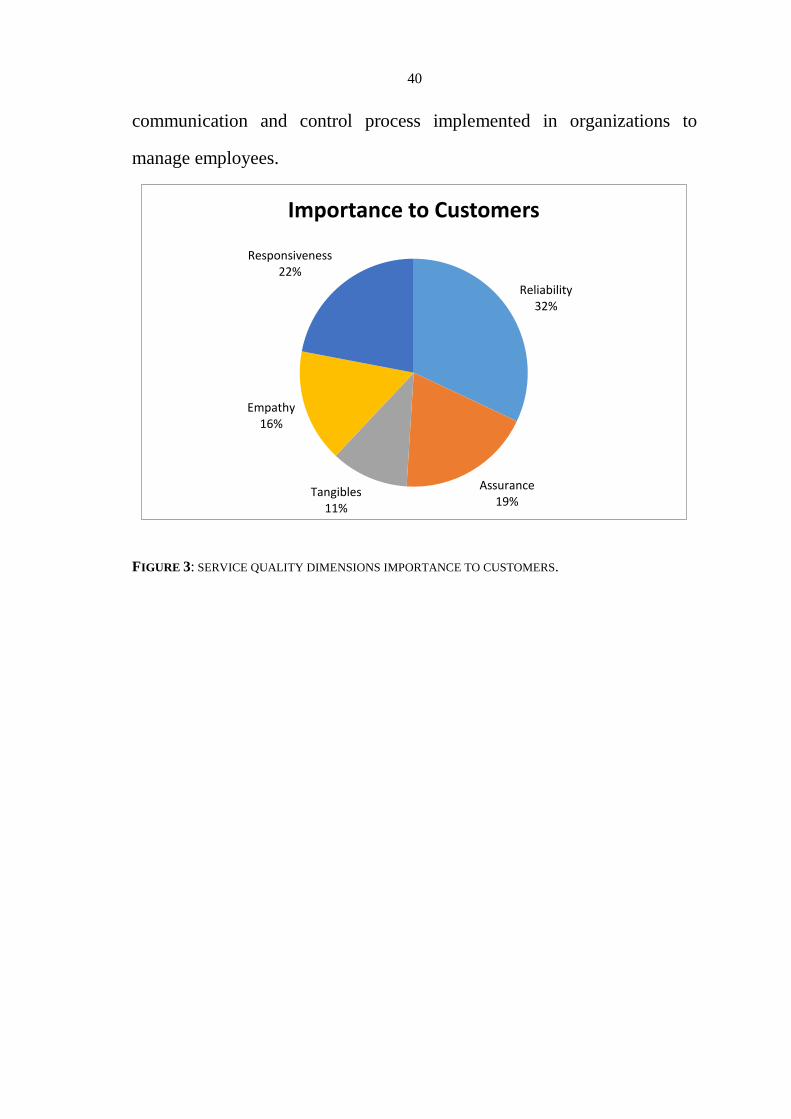
Three years later Zeithaml et al. (1988) found a correlation between the ten
dimensions of Parasuraman et al. (1985) model. Therefore, they refined
them into five dimensions: reliability, assurance, tangibles, empathy, and
responsiveness, to measure customer‟s perceived value of service quality
famously known as SERVQUAL (also called expectation minus
disconfirmation approach). All of the five dimensions are important to
customers, but some of them are more important than the others (see Figure
3). In addition, Zeithaml et al. (1988) outlined the main four gaps identified
in their research of 1985, and they introduced an extended service quality
model (Figure 4). According to this extended model, most factors involve
40
communication and control process implemented in organizations to
manage employees.
FIGURE 3: SERVICE QUALITY DIMENSIONS IMPORTANCE TO CUSTOMERS.
Reliability 32%
Assurance 19%
Tangibles 11%
Empathy 16%
Responsiveness 22%
Importance to Customers
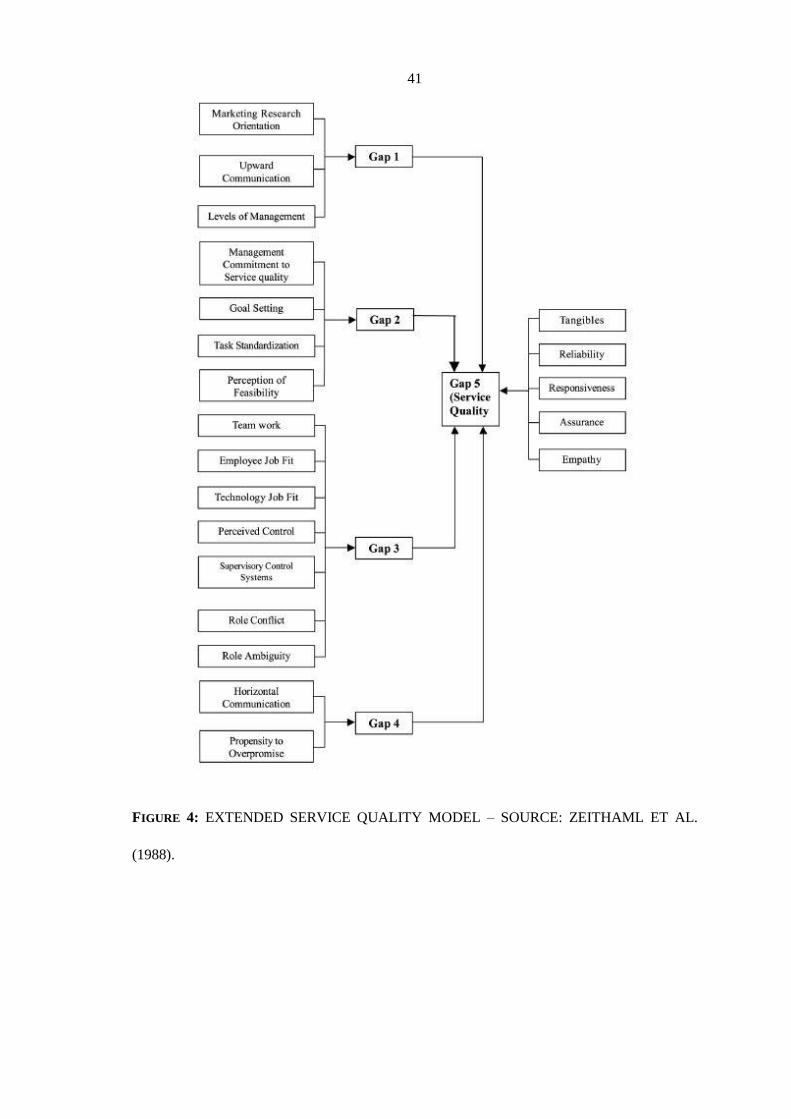
41
FIGURE 4: EXTENDED SERVICE QUALITY MODEL – SOURCE: ZEITHAML ET AL.
(1988).
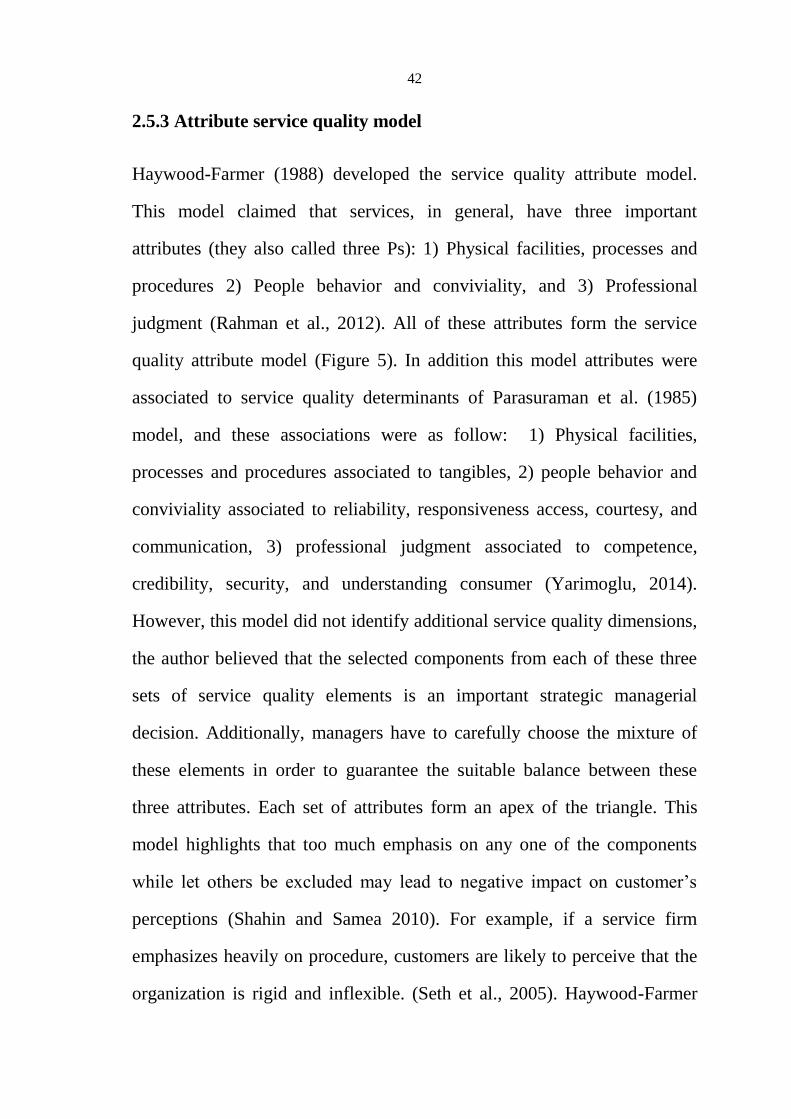
42
2.5.3 Attribute service quality model
Haywood-Farmer (1988) developed the service quality attribute model.
This model claimed that services, in general, have three important
attributes (they also called three Ps): 1) Physical facilities, processes and
procedures 2) People behavior and conviviality, and 3) Professional
judgment (Rahman et al., 2012). All of these attributes form the service
quality attribute model (Figure 5). In addition this model attributes were
associated to service quality determinants of Parasuraman et al. (1985)
model, and these associations were as follow: 1) Physical facilities,
processes and procedures associated to tangibles, 2) people behavior and
conviviality associated to reliability, responsiveness access, courtesy, and
communication, 3) professional judgment associated to competence,
credibility, security, and understanding consumer (Yarimoglu, 2014).
However, this model did not identify additional service quality dimensions,
the author believed that the selected components from each of these three
sets of service quality elements is an important strategic managerial
decision. Additionally, managers have to carefully choose the mixture of
these elements in order to guarantee the suitable balance between these
three attributes. Each set of attributes form an apex of the triangle. This
model highlights that too much emphasis on any one of the components
while let others be excluded may lead to negative impact on customer‟s
perceptions (Shahin and Samea 2010). For example, if a service firm
emphasizes heavily on procedure, customers are likely to perceive that the
organization is rigid and inflexible. (Seth et al., 2005). Haywood-Farmer
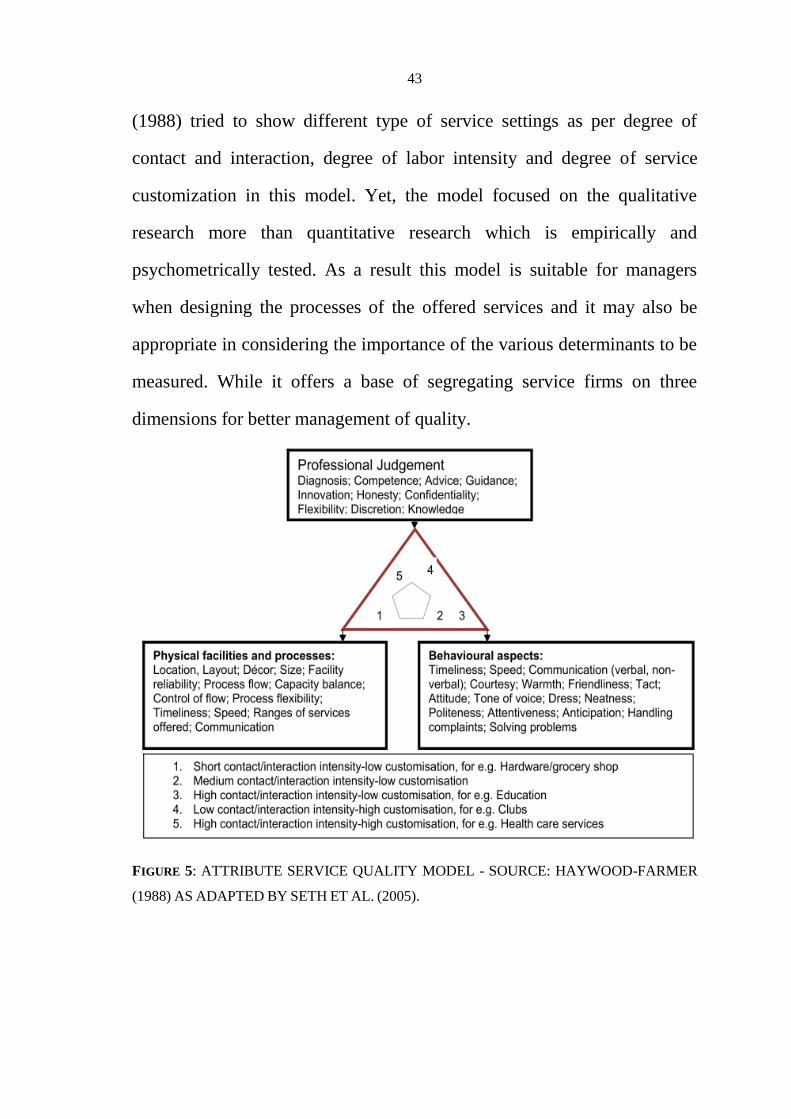
43
(1988) tried to show different type of service settings as per degree of
contact and interaction, degree of labor intensity and degree of service
customization in this model. Yet, the model focused on the qualitative
research more than quantitative research which is empirically and
psychometrically tested. As a result this model is suitable for managers
when designing the processes of the offered services and it may also be
appropriate in considering the importance of the various determinants to be
measured. While it offers a base of segregating service firms on three
dimensions for better management of quality.
FIGURE 5: ATTRIBUTE SERVICE QUALITY MODEL - SOURCE: HAYWOOD-FARMER
(1988) AS ADAPTED BY SETH ET AL. (2005).
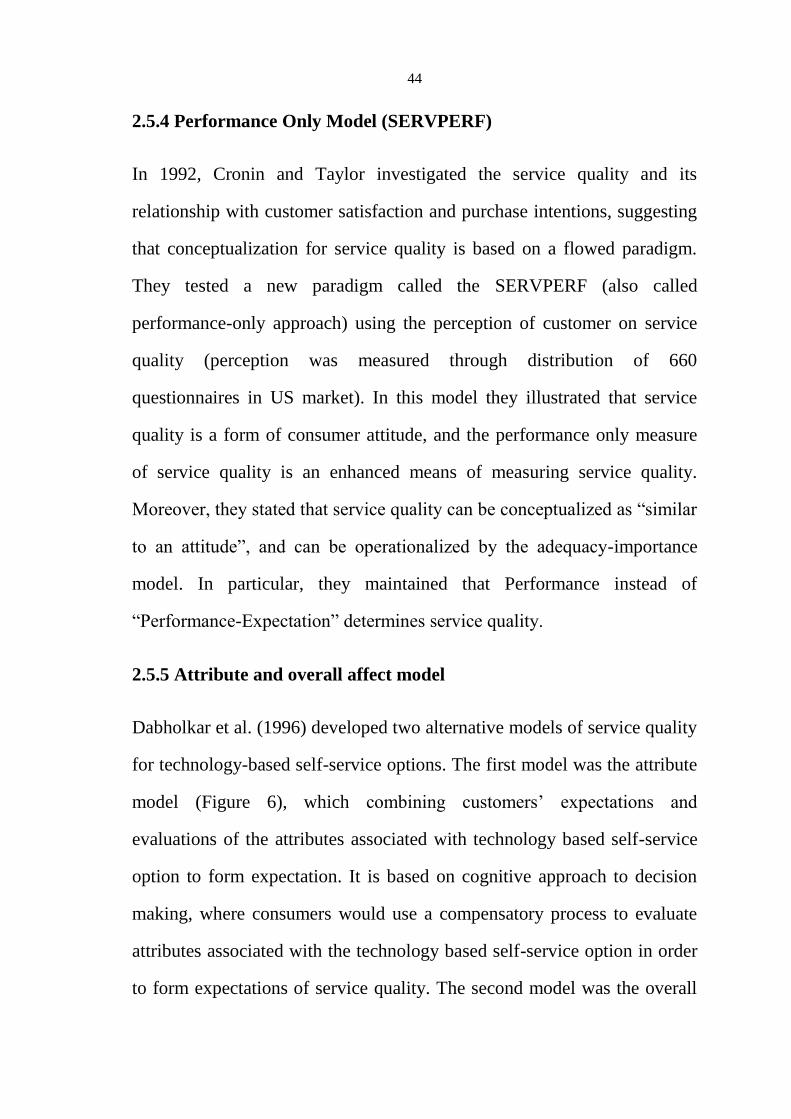
44
2.5.4 Performance Only Model (SERVPERF)
In 1992, Cronin and Taylor investigated the service quality and its
relationship with customer satisfaction and purchase intentions, suggesting
that conceptualization for service quality is based on a flowed paradigm.
They tested a new paradigm called the SERVPERF (also called
performance-only approach) using the perception of customer on service
quality (perception was measured through distribution of 660
questionnaires in US market). In this model they illustrated that service
quality is a form of consumer attitude, and the performance only measure
of service quality is an enhanced means of measuring service quality.
Moreover, they stated that service quality can be conceptualized as “similar
to an attitude”, and can be operationalized by the adequacy-importance
model. In particular, they maintained that Performance instead of
“Performance-Expectation” determines service quality.
2.5.5 Attribute and overall affect model
Dabholkar et al. (1996) developed two alternative models of service quality
for technology-based self-service options. The first model was the attribute
model (Figure 6), which combining customers‟ expectations and
evaluations of the attributes associated with technology based self-service
option to form expectation. It is based on cognitive approach to decision
making, where consumers would use a compensatory process to evaluate
attributes associated with the technology based self-service option in order
to form expectations of service quality. The second model was the overall
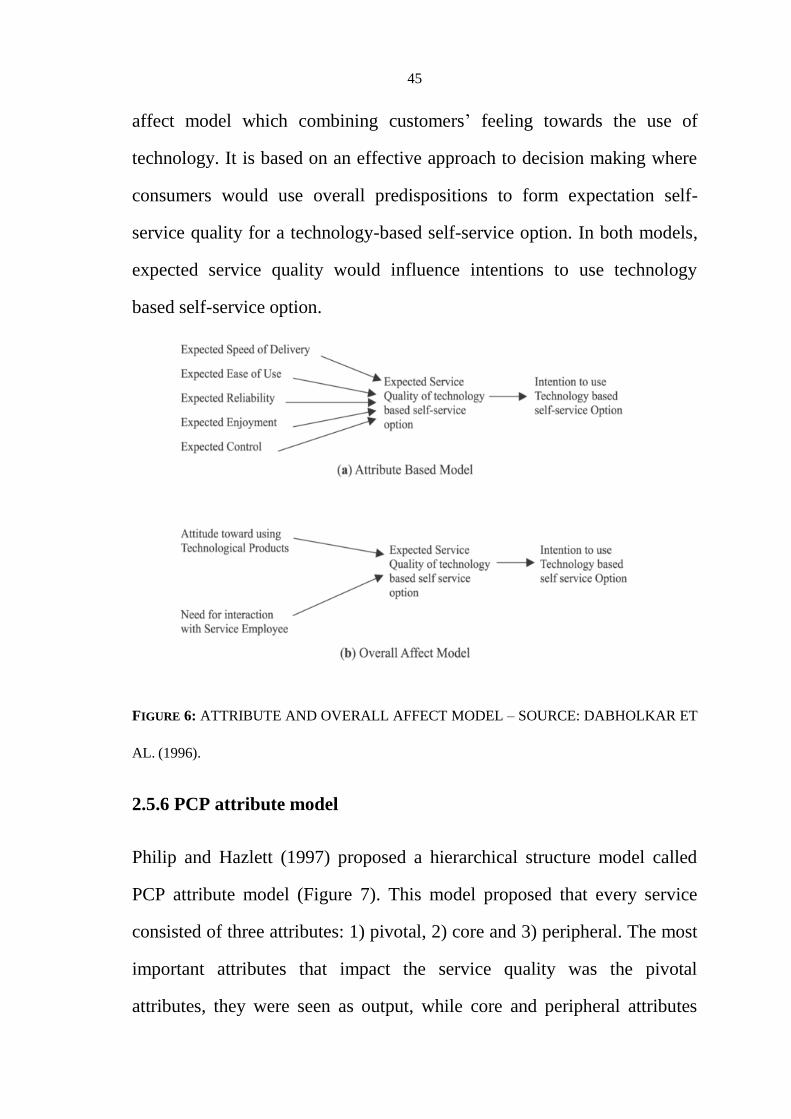
45
affect model which combining customers‟ feeling towards the use of
technology. It is based on an effective approach to decision making where
consumers would use overall predispositions to form expectation self-
service quality for a technology-based self-service option. In both models,
expected service quality would influence intentions to use technology
based self-service option.
FIGURE 6: ATTRIBUTE AND OVERALL AFFECT MODEL – SOURCE: DABHOLKAR ET
AL. (1996).
2.5.6 PCP attribute model
Philip and Hazlett (1997) proposed a hierarchical structure model called
PCP attribute model (Figure 7). This model proposed that every service
consisted of three attributes: 1) pivotal, 2) core and 3) peripheral. The most
important attributes that impact the service quality was the pivotal
attributes, they were seen as output, while core and peripheral attributes
46
were seen as inputs and processes. This model put these attributes in a
hierarchical structure. The importance level decreased from top to bottom.
The pivotal attributes were placed at the top, they were followed by the
core attributes, and at the bottom peripheral attributes. The importance of
the pivotal attributes comes from their location, they were placed at the
core, therefore they affect the customer decision to deal with a specific
firm, and significantly affect the satisfaction level. They were also defined
as the “end product”. According to Seth et al. (2005) the pivotal attributes
could be described as “what the consumer expects to achieve and receive,
perhaps even “take away, when the service process is duly completed”.
Core attributes were placed around the pivotal attributes, they can be best
described as “the amalgamation of the people, processes and the service
organizational structure through which consumers must interact and/or
negotiate so that they can achieve/receive the pivotal attribute” (Seth et al.,
2005). Peripheral attributes defined as the “incidental extras” or decoration
considered to add a “roundness” to the service that enhances the customer
feeling about the service and give him/her a big amount of gladness. When
a consumer tries a service for the first time, the satisfaction level will
depend mainly on the pivotal attributes if they were achieved, however
when the customer uses this service regularly, the importance of core and
peripheral attributes will increase.
47
FIGURE 7: PCP ATTRIBUTE MODEL – SOURCE: PHILIP AND HAZLETT (1997).
2.5.7 Internal service quality model
Frost and Kumar (2000) developed an internal service quality model called
INTSERVQUAL (Figure 8) based on the concept of the GAP Model
(Parasuraman et al., 1985) and the SERVQUAL model (Parasuraman et al.,
1988). The model measures the service quality dimensions of internal
customers such as front-line staff and support staff in airline industry. As a
result of the study, it was found that internal service quality was affected by
responsiveness mostly, however; reliability was found as the most
important influencer in SERVQUAL. This model defined three internal
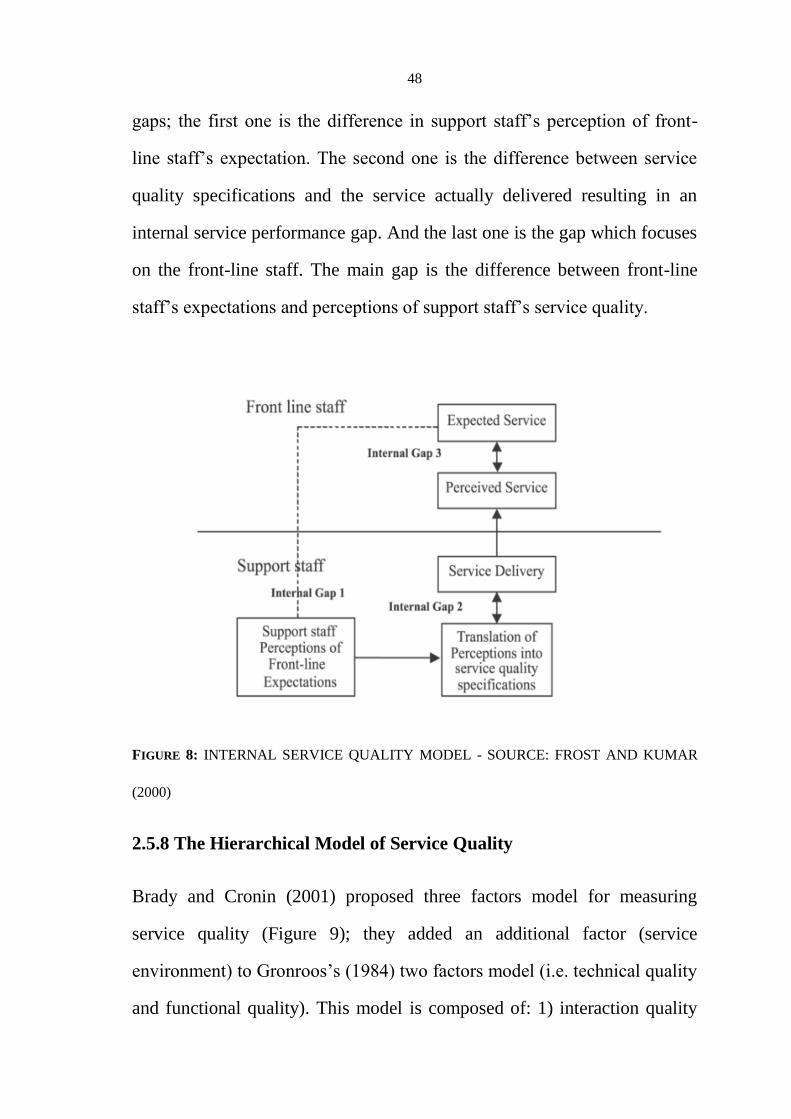
48
gaps; the first one is the difference in support staff‟s perception of front-
line staff‟s expectation. The second one is the difference between service
quality specifications and the service actually delivered resulting in an
internal service performance gap. And the last one is the gap which focuses
on the front-line staff. The main gap is the difference between front-line
staff‟s expectations and perceptions of support staff‟s service quality.
FIGURE 8: INTERNAL SERVICE QUALITY MODEL - SOURCE: FROST AND KUMAR
(2000)
2.5.8 The Hierarchical Model of Service Quality
Brady and Cronin (2001) proposed three factors model for measuring
service quality (Figure 9); they added an additional factor (service
environment) to Gronroos‟s (1984) two factors model (i.e. technical quality
and functional quality). This model is composed of: 1) interaction quality
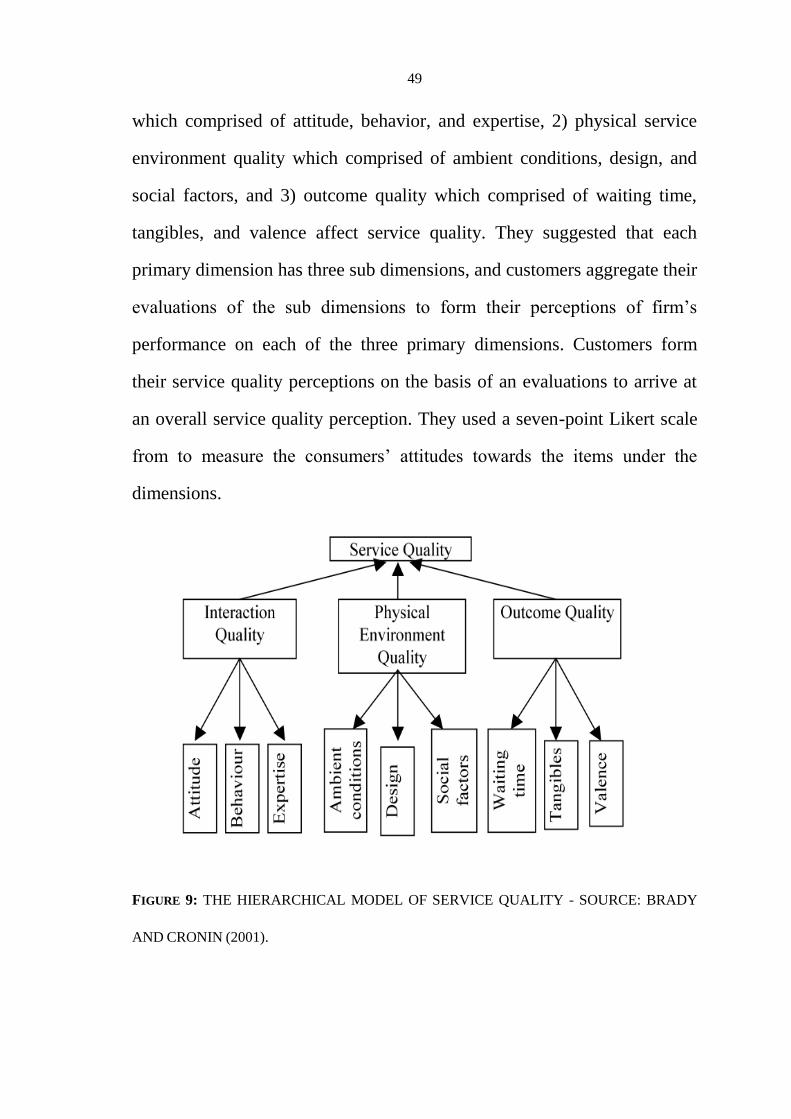
49
which comprised of attitude, behavior, and expertise, 2) physical service
environment quality which comprised of ambient conditions, design, and
social factors, and 3) outcome quality which comprised of waiting time,
tangibles, and valence affect service quality. They suggested that each
primary dimension has three sub dimensions, and customers aggregate their
evaluations of the sub dimensions to form their perceptions of firm‟s
performance on each of the three primary dimensions. Customers form
their service quality perceptions on the basis of an evaluations to arrive at
an overall service quality perception. They used a seven-point Likert scale
from to measure the consumers‟ attitudes towards the items under the
dimensions.
FIGURE 9: THE HIERARCHICAL MODEL OF SERVICE QUALITY - SOURCE: BRADY
AND CRONIN (2001).
50
2.6 SERVQUAL VS. SERVPREF
Many service quality models were used by several researchers. For
example, Spathis et al. (2004) in their research on managing service quality
in Greece banks by looking at the customers gender effect, they studied the
quality perceptions of male and female customers and the difference they
attach to quality dimensions, therefore they used the Bank Service Quality
(BSQ) scale, and they found that male customers have a more positive
perception of the service quality they receive than do female customers.
Morover, Tsoukatos and Mastrojianni (2010) studied quality of retail
banking concluding a quality scale carved out from the combination of
SERVQUAL (precise determinants are assurance, efficiency, reliability and
confidence) and BSQ scale. Many other models were used in the literature,
each of them has its advantages and also some disadvantages.
SERVQUAL is widely used in the literature as it became the best service
quality model, and this was due to its superior effect on the business and
academic communities. Buttle (1996) referred this success to the technique
it uses for assessing and managing service quality. SERVQUAL consist of
five dimensions: tangibility (physical appearance for objects), reliability
(dependable service provider), assurance (features that diffuse customer
confidence), responsiveness (quick assistant to customers), and empathy
(available personal to help customers). While Angur et al. (1999)
investigated service quality in banking sector in India (two major retail
banks), the overall result of the study supported a multidimensional
construct of service quality favoring the SERVQUAL model for its detailed
51
diagnostic information and emphasizing inapplicability of some factors.
Under their context, assurance appeared to be the least important.
Responsiveness and reliability were the most essential dimensions,
followed by the empathy and tangible dimensions.
Nevertheless, this model was criticized by several researchers; Teas (1993)
claimed that SERVQUAL model has uncertain validity because it has
conceptual and definitional issues, such as the conceptual definition of
expectations and measurement validity of expectation. However, Carman
(1990) stated that researchers now agreed that the number of service quality
dimensions depends on the provided service it self. Furthermore, Okoe et
al. (2013) criticized this model because it neglects the effect of corporate
image and reputation on the scores, and also it assumes that the respondents
have prior knowledge about the service they are evaluating. Thus, several
scholars pointed to the importance of the corporate image as an essential
factor for firm success, and it can be significantly affected by the received
services (Gronroos, 1984; Cham and Easvaralingam, 2012; Alfin et al.,
2013). However, unlike SERVQUAL model, expectation is not an element
in SERVPERF (Baumann et al., 2007). Babakus and Boller (1992) showed
that service quality in SERVQUAL model, is affected only by perception
of performance.
Many academics found that SERVEPRF is more efficient than
SERVQUAL with respect to numbers of measured items; which is 44 in
SERVQUAL as compared to only 22 in SERVEPRF model (Cronin and
Taylor, 1992; Bolton and Drew, 1991). Also, this paradigm considers the
52
customer satisfaction a significant link between purchase and post-purchase
process in terms of attitude change, repeat purchase and brand loyalty
(Churchill and Surprenant, 1982). Furtheremore, Brady and Cronin (2001)
supported Cronin and Taylor (1992) findings and prefered SERVPREF;
they applied this model in additional sectors such as spectator sports,
entertainment, helth care, and long-distance carries. However, Parasuraman
et al. (1994) proved empirically Cronin and Taylor (1992) and Teas (1993)
concerns, also Parasuraman et al. (1994) refined SERVQUAL‟s structure.
Post the two paradigms, several studies emerged in different countries
covering the service quality in banking sector. Stafford et al. (2011)
highlighted that SERVQUAL and SERVPREF models can be used as a
measuring tool for service quality, while Angur et al. (1999) is favoring the
SERVQUAL model for its detailed diagnostic information and
emphasizing inapplicability of some factors. Even Blodgett and Wakefield
(1999) discussed the integration of environmental psychology with
SERVQUAL to make a fuller assessment of the role of tangible aspects of
service delivery. They found that using SERVQUAL model is much better
than using SERVPREF model for the measurement of service quality, even
in a developing economy environment. Khan and Fasih (2014) used
SERVQUAL model in their research and found a significant relation
between the model dimensions and customer satisfaction and loyalty.
53
Despite the critics (e.g. Cronin and Taylor, 1992; Teas, 1993; Okoe et al.,
2013) of SERVQUAL model, it is still widely used, and many researchers
still consider it as an excellent instrument for measuring service quality. As
it was shown above, SERVQUAL model has many advantages such as : 1)
its estimation of the gap size, 2) the detailed diagnostic information it
provides, and 3) it “provides a basic Skelton which can be adopted or
supplemented to fit the characteristics or specific research needs of a
particular organization” (Parasuraman et al., 1988; Buttle, 1996; Angur et
al., 1999; Blodgett and Wakefield, 1999; Newman, 2001; Christopher et
al., 2002; Santos, 2003; Khan and Fasih, 2014).
In this research there are two suitable models for measuring service quality
in the banking sector, they are SERVQUAL and SERVPREF models. The
researcher preferred to adopt the SERVQUAL model, due to its detailed
daiagnostics. In addition, SERVQUAL model asks the customers after
getting the service which is more accurate when mesuaring the quality of a
service.
2.7 Service Sector in Palestine
Several studies were performed around the world about the service sector,
this sector was growing in a high manner. In Palestine, which is a
developing country, operating under a challenging environment conditions
with low income and limited resources, the service sector is considered as
an important player in the Palestinian economy. As a result, in the last
twenty years the service sector was significantly increased. According to
54
El-Jafari et al. (2003), the contributions of services sector to Palestinian
GDP has increased from 46.7% in the mid-1970s to 52.2% between 1995-
2000. In a more recent study by Al Falah (2013), it was explained that the
contributions of services sector to Palestinian GDP has increased to 57% in
2012, and that more than 62% of the Palestinian labor force was employed
in the service sector. Furthermore, Morrar and Gallouj (2013) confirmed
that Palestinian economy is a service economy.
There are two types of services: Traditional services (such as trade,
transportation and distribution services), and Modern services; such as
R&D, financial, and those services are linked to the information and
communication sector (Morrar and Gallouj, 2013). In Palestine, the service
sector is highly dependable on the traditional services, while modern
services were very small in size until the mid-1990s. The 2012 statistics
show that the traditional services share 85% of the contributions of services
sector to Palestinian GDP and 98% of total employment, and till now some
service sectors do not exist (such as air and sea transport) (Al Falah, 2013;
Morrar and Gallouj, 2013).
Despite the importance of the service sector, a few studies where
performed on the Palestinian service sector, such as El-Jafari et al. (2003).
Authors in this study investigated the Palestinian services sector and its role
in economic development. Also, Morrar and Gallouj (2013) discussed the
service sector productivity in Palestine, they found that foreign direct
investment has a positive and significant influence on the growth of labor
productivity. capital intensive service sectors have a high influence on the
55
growth of labor productivity compared to other sectors. Moreover, Al Falah
(2013) debated the expansion reasons in the services sector and its role in
terms of employment and contribution to the formation of the Gross
Domestic Product.
2.8 Service Quality Studies in Palestine
One of the most influencing service sectors in the Palestinian economy is
the Banking sector. According to Palestinian central bureau of statistics –
2015, financial and insurance activities account for 4% of real GDP (PCBS,
2016). The overall percent contribution from this sector to real GDP,
witnessed a large growth between 2014 and 2015 recorded at 19.2%
(PCBS, 2016). The growth in this sector triggered high levels of
competition with the aim of increasing customer satisfaction.
Despite the importance of the banking sector in Palestine, there is still
scarcity of researches performed to assess its quality of provided services.
In this section, a brief description will be shown on some of the previous
service quality studies in Palestine.
Shu‟sha (2005) measured the services quality level in one of the Palestinian
Banks, from customer‟s perspective. SERVQUAL model was used in this
study to measure the gap between the actual performance of the provided
services and the expected performance. The study results figured a gap
between the actual and the expected performance of the provided services.
The study comes with two recommendations: 1) enhancing the quality of
provided services provided in order to reach or exceed customer‟s
56
expectations level, and 2) adopting the service quality as a strategy for
competition and improvements. Another study by Al Khaldy (2006) aimed
to measure the level of services quality of the Palestinian Islamic banks,
from customer‟s perspective. The SERVQUAL model was used to measure
the level of services quality in the Islamic banks, between the actual
performance of the offered services and its perceptive performance. The
data was collected by distributing questionnaiers, and after analyzing the
collected data, the results showed a gap between the expected services and
the actual performance. The results of this study comes with a
recommendation to these types of banks, which is improving and
developing the banks services to reach the customers‟ expectations, and
these banks should concentrate on training their employees especially the
front line employees. Murad (2011) explored several direct and indirect
factors that affect customer switching intentions from bank to another in
two Palestinian banks. The direct factors were: service quality, price,
commitment, and anger incident, and the indirect factors were customer
involvement in decision making, switching costs, alternative attractiveness,
and duration of customer relationship. The author adopted a different
model than the one used by Shu‟sha (2005) for measuring the service
quality, which is the hierarchical model that proposed by Brady and Cronin
(2001). This model consists of three dimensions; namely: outcome quality,
interaction quality, and physical environment quality. The author found that
regarding to the direct factors, the customer switching intentions vary
according to the bank and customer's category. While switching costs have
57
no moderating effect, and alternative attractiveness increases switching
intentions, while the long duration of customer relationship reduces
customers‟ switching intentions.
ElHinnawi (2011) evaluated the effect of relationship marketing
underpinnings on customer loyalty in one of the Palestinian banks. The gap
approach was used to measure the relationship marketing underpinnings
five dimensions (trust, commitment, conflict handling, values and
empathy). The results of this study showed that the level of relationship
marketing underpinnings is high from the perception of business customers
in West Bank – Palestinian, while it was moderate in Gaza Strip –
Palestine, and the loyalty level was higher in West Bank than Gaza.
Therefore the study recommended that the banks have to enhance and
reinforce the five relationship marketing underpinnings to keep and
increase the customer‟s loyalty. AlFoqahaa (2012) studied the factors
affecting customer satisfaction with Islamic banking services in Palestine.
The study aimed to clarify the effect of the dimensions of perceived service
quality of Islamic banks, and the role of Islamic banks‟ perceived image by
customers. The author found a significant effect of reliability and assurance
on customers‟ satisfaction, and he didn‟t found a significant effect of
tangibility, responsiveness, and empathy factors. Also he stated that a
“significant impact for the study‟s collective independent variables was
found (The quality of Islamic banking services, trust, and corporate
image)”. All of the above studies were summarized in Table 2, in addition
to this research summary.
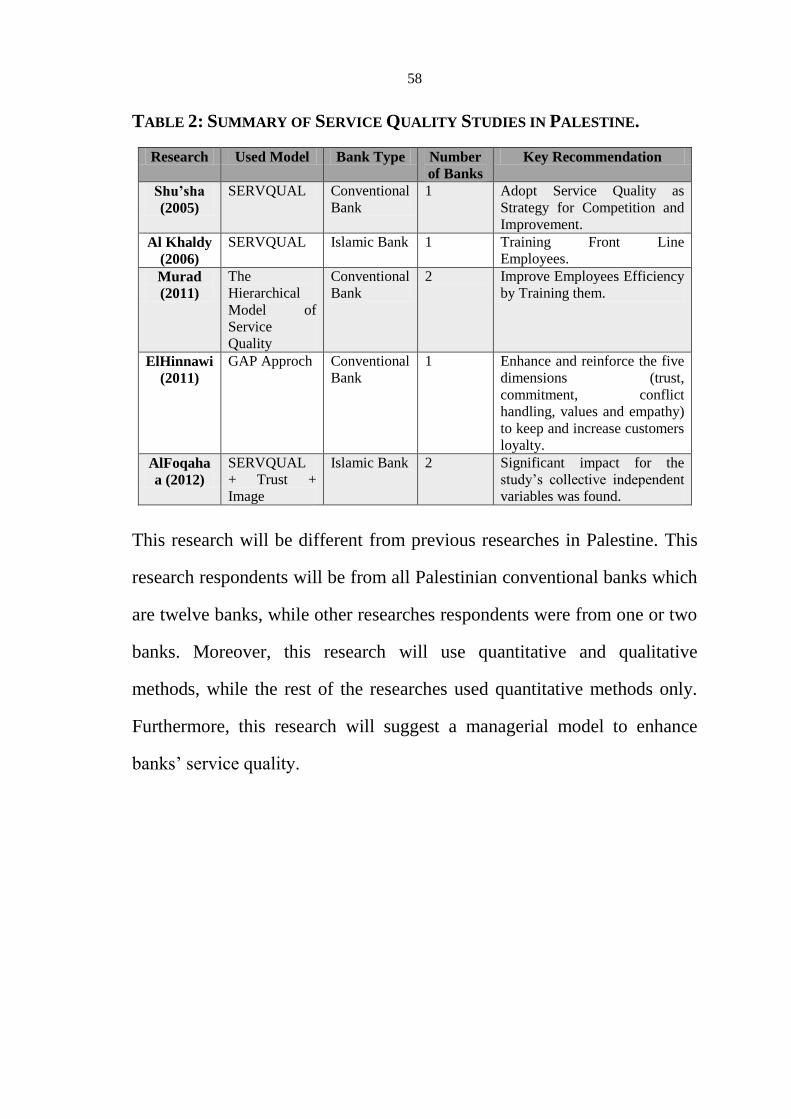
58
TABLE 2: SUMMARY OF SERVICE QUALITY STUDIES IN PALESTINE.
Research Used Model Bank Type Number
of Banks
Key Recommendation
Shu’sha
(2005)
SERVQUAL Conventional
Bank
1 Adopt Service Quality as
Strategy for Competition and
Improvement.
Al Khaldy
(2006)
SERVQUAL Islamic Bank 1 Training Front Line
Employees.
Murad
(2011)
The
Hierarchical
Model of
Service
Quality
Conventional
Bank
2 Improve Employees Efficiency
by Training them.
ElHinnawi
(2011)
GAP Approch Conventional
Bank
1 Enhance and reinforce the five
dimensions (trust,
commitment, conflict
handling, values and empathy)
to keep and increase customers
loyalty.
AlFoqaha
a (2012)
SERVQUAL
+ Trust +
Image
Islamic Bank 2 Significant impact for the
study‟s collective independent
variables was found.
This research will be different from previous researches in Palestine. This
research respondents will be from all Palestinian conventional banks which
are twelve banks, while other researches respondents were from one or two
banks. Moreover, this research will use quantitative and qualitative
methods, while the rest of the researches used quantitative methods only.
Furthermore, this research will suggest a managerial model to enhance
banks‟ service quality.
59
Chapter Three
Methodology
3.1 Overview
The researcher presented in this chapter a comprehensive presentation of
the research methodology and procedures which have been followed in
assessing service quality and customer satisfaction of Palestinian
conventional banks. Also the researcher presented the population and the
sample of the research, data collection and analysis methods, it also
demonstrates how the validity and reliability of the questionnaire are
assured.
3.2 Research Approach
This research tried to figure out the quality level of provided services in the
Palestinian conventional banks from the customer‟s perspective, and also,
the most significant criterions to evaluate service quality in order to
improve banks performance by providing them with some essential
recommendations.
To form the conclusion when conducting research, there are two theoretical
approaches: inductive and deductive approaches. According to Ghauri and
Gronhaug (2002), there are two different methods to determine what is true
or false, as well to derive a conclusion. In addition, they stated that
induction depends on empirical evidence, whereas deduction depends on
logic. Moreover, Trochim (2006) stated that induction approach starts from
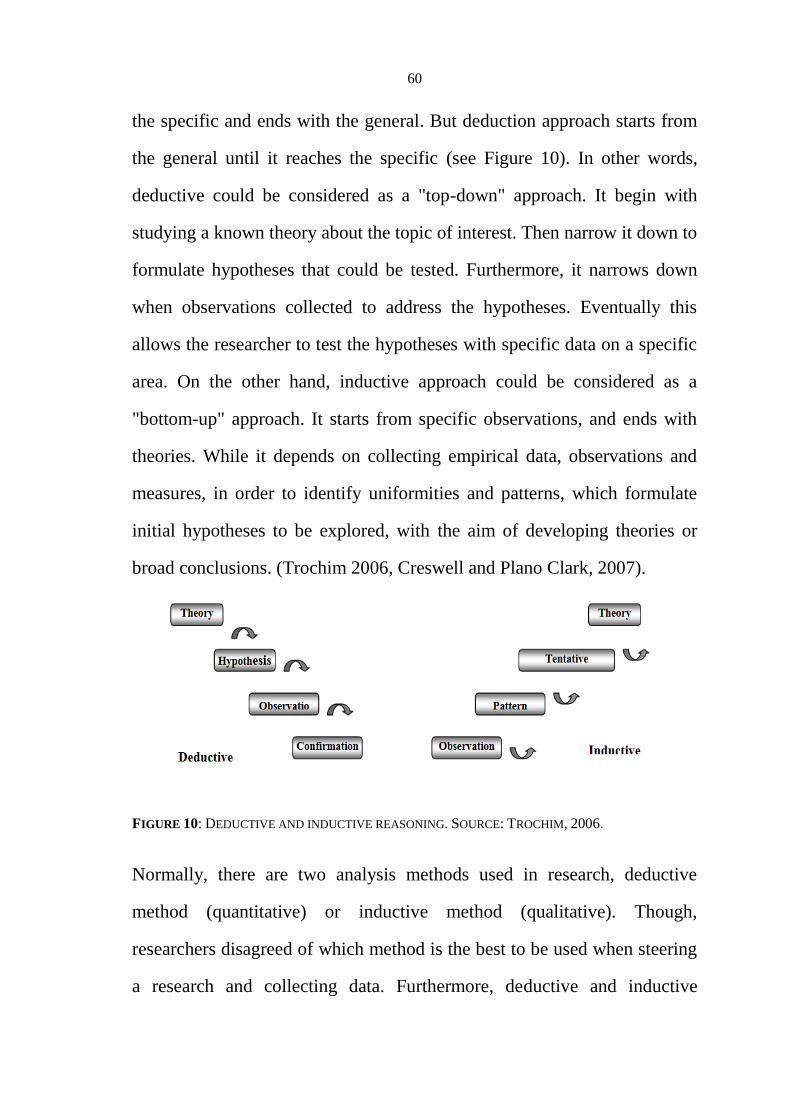
60
the specific and ends with the general. But deduction approach starts from
the general until it reaches the specific (see Figure 10). In other words,
deductive could be considered as a "top-down" approach. It begin with
studying a known theory about the topic of interest. Then narrow it down to
formulate hypotheses that could be tested. Furthermore, it narrows down
when observations collected to address the hypotheses. Eventually this
allows the researcher to test the hypotheses with specific data on a specific
area. On the other hand, inductive approach could be considered as a
"bottom-up" approach. It starts from specific observations, and ends with
theories. While it depends on collecting empirical data, observations and
measures, in order to identify uniformities and patterns, which formulate
initial hypotheses to be explored, with the aim of developing theories or
broad conclusions. (Trochim 2006, Creswell and Plano Clark, 2007).
FIGURE 10: DEDUCTIVE AND INDUCTIVE REASONING. SOURCE: TROCHIM, 2006.
Normally, there are two analysis methods used in research, deductive
method (quantitative) or inductive method (qualitative). Though,
researchers disagreed of which method is the best to be used when steering
a research and collecting data. Furthermore, deductive and inductive
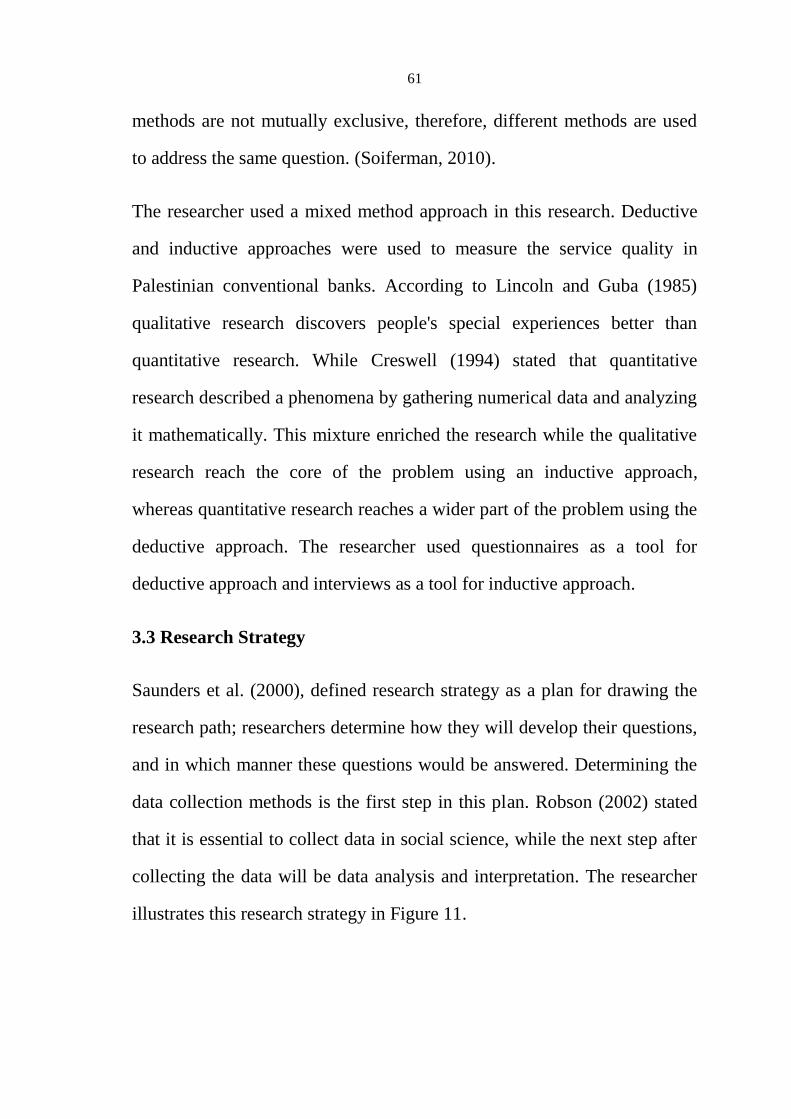
61
methods are not mutually exclusive, therefore, different methods are used
to address the same question. (Soiferman, 2010).
The researcher used a mixed method approach in this research. Deductive
and inductive approaches were used to measure the service quality in
Palestinian conventional banks. According to Lincoln and Guba (1985)
qualitative research discovers people's special experiences better than
quantitative research. While Creswell (1994) stated that quantitative
research described a phenomena by gathering numerical data and analyzing
it mathematically. This mixture enriched the research while the qualitative
research reach the core of the problem using an inductive approach,
whereas quantitative research reaches a wider part of the problem using the
deductive approach. The researcher used questionnaires as a tool for
deductive approach and interviews as a tool for inductive approach.
3.3 Research Strategy
Saunders et al. (2000), defined research strategy as a plan for drawing the
research path; researchers determine how they will develop their questions,
and in which manner these questions would be answered. Determining the
data collection methods is the first step in this plan. Robson (2002) stated
that it is essential to collect data in social science, while the next step after
collecting the data will be data analysis and interpretation. The researcher
illustrates this research strategy in Figure 11.
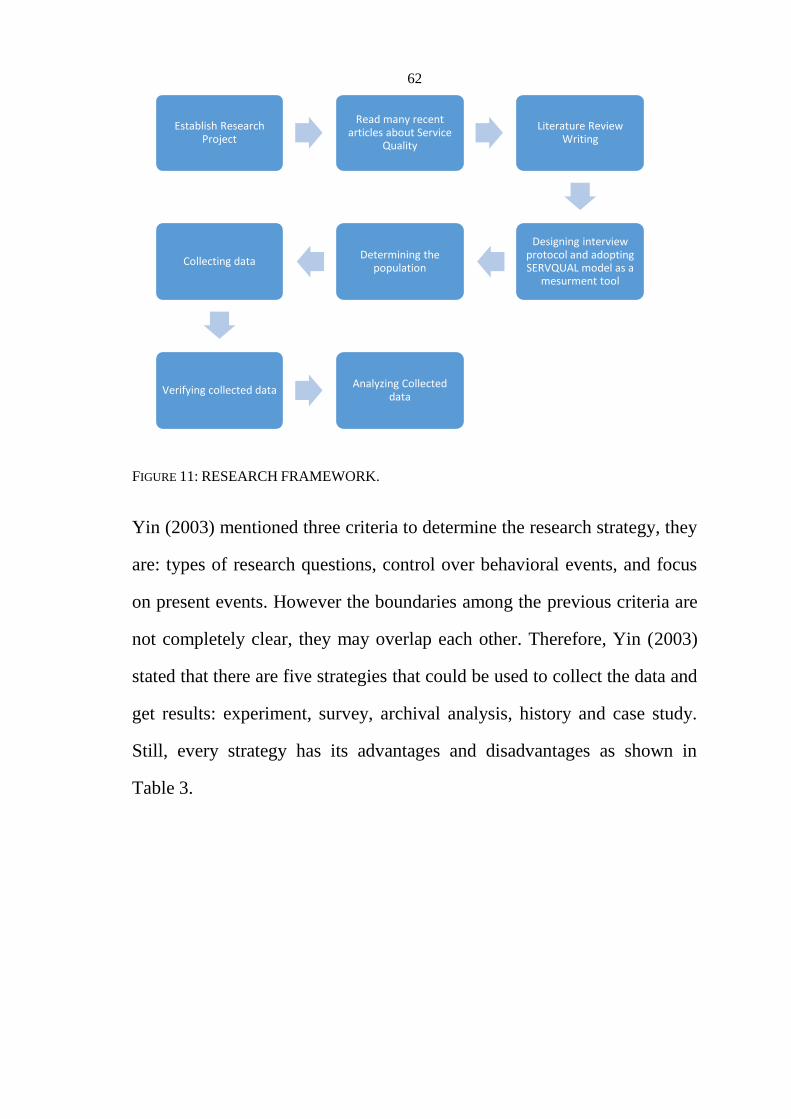
62
FIGURE 11: RESEARCH FRAMEWORK.
Yin (2003) mentioned three criteria to determine the research strategy, they
are: types of research questions, control over behavioral events, and focus
on present events. However the boundaries among the previous criteria are
not completely clear, they may overlap each other. Therefore, Yin (2003)
stated that there are five strategies that could be used to collect the data and
get results: experiment, survey, archival analysis, history and case study.
Still, every strategy has its advantages and disadvantages as shown in
Table 3.
Establish Research Project
Read many recent articles about Service
Quality
Literature Review Writing
Designing interview protocol and adopting SERVQUAL model as a
mesurment tool
Determining the population
Collecting data
Verifying collected data Analyzing Collected
data
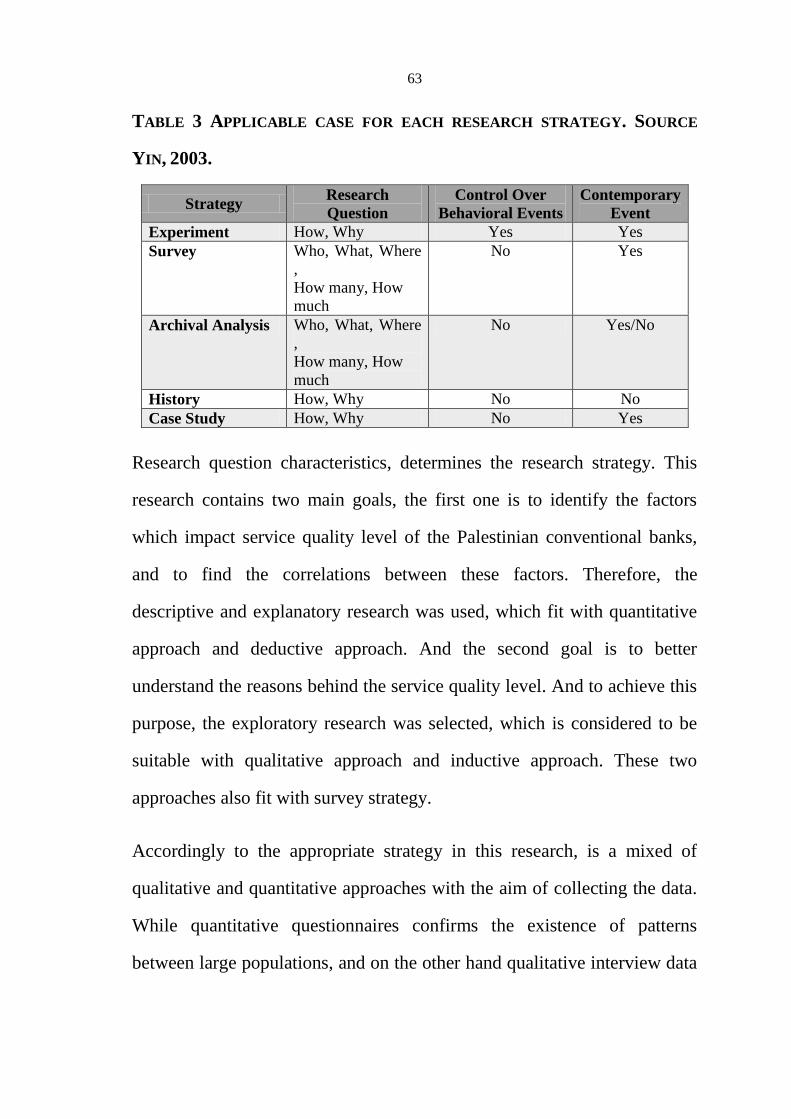
63
TABLE 3 APPLICABLE CASE FOR EACH RESEARCH STRATEGY. SOURCE
YIN, 2003.
Strategy Research
Question
Control Over
Behavioral Events
Contemporary
Event
Experiment How, Why Yes Yes
Survey Who, What, Where
,
How many, How
much
No Yes
Archival Analysis Who, What, Where
,
How many, How
much
No Yes/No
History How, Why No No
Case Study How, Why No Yes
Research question characteristics, determines the research strategy. This
research contains two main goals, the first one is to identify the factors
which impact service quality level of the Palestinian conventional banks,
and to find the correlations between these factors. Therefore, the
descriptive and explanatory research was used, which fit with quantitative
approach and deductive approach. And the second goal is to better
understand the reasons behind the service quality level. And to achieve this
purpose, the exploratory research was selected, which is considered to be
suitable with qualitative approach and inductive approach. These two
approaches also fit with survey strategy.
Accordingly to the appropriate strategy in this research, is a mixed of
qualitative and quantitative approaches with the aim of collecting the data.
While quantitative questionnaires confirms the existence of patterns
between large populations, and on the other hand qualitative interview data
64
often collect more detailed ideas about participant attitudes, thoughts, and
actions (Kendall, 2008).
3.3.1 Quantitative Method – Questionnaire
Creswell (2003) stated that the quantitative approach objective "is to test
hypotheses that the researcher generates". In the quantitative approach, a
huge volume of numbers is generated and need to be summarized,
described and analyzed. Khan (2010) argued that numerical data and
statistics are used in quantitative approach, to characterize a phenomenon
and discover the relationships between its variables. However, to simplify
the data characteristics, it could be presented on graphs and charts, in
addition to cross tabulation and calculating means and standard deviations
(Lacey and Luff, 2007).
Regarding to this research and its questions and after extended literature
review questionnaire was established using the SERVQUAL model, which
was originally established by Parasuraman et al. (1988) (see Appendix A)
as a main tool for quantitative data collection, while it saves time and
effort. The questionnaire was translated to Arabic language, and it contains
three main parts:
1. The definition of the research.
2. The primary information about the demographic specifications of the
sample individuals.
65
3. A set of 22 questions. All these questions were closed-ended because all
possible answers were given to the respondents. The seven-point Likert
scale has been used for the main research questions. These 22 questions
were categorized into 5 dimensions, namely: reliability, responsiveness,
assurance, tangibles and empathy. Each dimension is measured by four to
five items (please refer back to section 2.5.8 for more details on the
SERVQUAL model).
3.3.2 Qualitative Method – Interview
Creswell (2003) mentioned that qualitative approach objective "is to
discover and encapsulate meanings once the researcher becomes immersed
in the data". Morvaridi (1998) considered the qualitative method as a
critical approach for social world. And also, he stated that realizing the
meanings and interpretations is the main objectives of this approach.
However, qualitative and quantitative approaches differ from each other in
the style, language usage, and also in ideas generation. Moreover, in
qualitative approach, local population forms an important source of
information to understand the research problem. While discovering specific
populations‟ opinions, behaviors, and perceptions, provide information to
the researcher about the phenomenon variables and values. Therefore,
qualitative approach provides information and explanations about people
opinions and experiences (FHI, 2005).
66
For qualitative analysis, interviews performed with 8 employees of the
concerning banks. According to Saunders et al. (2007) interviews can be
used as a helpful tool in collecting valid and consistent data, which are
related to research questions and objectives. Therefore, interviews are
considered data driven because they will be used to understand the
relationship between different variables and dimension governing the
Palestinian conventional banking environment. The input from these
interviews is an important element for building the managerial model.
According to Robson (2002), there are three types of interviews:
1. Structured interview: its‟ questions determined previously with static
wording.
2. Semi-structured interview: its‟ questions determined previously. But
questions wording changes and clarifies, to explain the questions to the
interviewee.
3. Unstructured interview: the questions are developed during the interview
conversation, while usually the interviewer has a broad area of interest and
concerns.
Directing verbal questions to interviewees, considered as a powerful
technique for interviews. While this technique allows the researcher to get
special aspects of behavior, and gather comprehensive qualitative data
about sensitive subjects. Semi-Structured interviews are used in flexible,
qualitative designs widely, while it can be replicated easily (Robson, 2002).
King (2004) stated that semi-structured interviews are designed to help
67
researcher covers the theme and possibly some key questions. Therefore,
the researcher used the semi-structured interviews due to its flexibility,
while the interview questions working and order may changes depending
on interviewers‟ opinion of what looks more suitable to be asked first and
how. In addition, some questions could be deleted, or adding new questions
to a specific interviewee.
3.4 Sampling Technique
Sampling considered as an essential part of research. Where sample means
selection a set of observations from the population. While population refers
to the total set of observations, such as all customers of Palestinian banks,
customers of Palestinian Islamic banks, or all customers of Palestinian
conventional banks. The research sample is a subgroup from the whole
group (population), which is selected according to specific procedures to
represent that population. Sampling is practical, while if the researchers
choose the right sample, they will get results that reflect the whole
population on the large; therefore the sampling process saves time and
money (Robson, 2002; Patton, 1990).
This research main objective is examining level of service quality as
perceived by Palestinian conventional banks customers through
determining the factors that influences it. So all customers of Palestinian
conventional banks are accepted to be in the research population.
Therefore, in the quantitative approach, probability sampling was chosen to
get random sample where each customer in Palestinian conventional banks
68
can participate. Saunders et al. (2000) stated that researches depends on
surveys as a data collection tool, mostly uses probability sampling, where
researcher forms conclusions from the population sample in order to
answer the research questions. Therefore, the population of this study
consisted of all customers of Palestinian conventional banks, for the year
2017.
The total number of customers was (1.3 million) according to Palestinian
Monetary (PMA, 2017). And by using sample size calculator (AAPOR and
AMA, 2017), with confidence interval of 5% and 95% confidence level,
the needed sample size is 384 customers. Here is the formula used in
Sample Size Calculator (AAPOR and AMA, 2017).
Sample Size:
= 384.16

69
Correction for Finite Population:
= 384.04
Where:
Z = Z value (confidence level)
P = percentage picking a choice, expressed as decimal
C = confidence interval, expressed as decimal (e.g., 0.03 = ±3)
Pop = population
On the other hand, qualitative interviews, gathers detailed data of
participant attitudes, thoughts, and actions. Moreover, the interviewer can
track comprehensive information about the subject. Also interviews are
useful to clarify specific questionnaires responses (McNamara, 1999). In
this research the interviews will get explanations from professionals and
practitioners on why customers of Palestinian conventional banks think
about their service quality. Therefore, non-probability sampling was chosen
for this qualitative approach. In non-probability sampling the selection of
elements for the sample is not necessarily made with the aim of being
statistically representative of the population. However this sampling
70
method provides a different technique based on researcher subjective
decision, to select the elements in the sample (Saunders et al., 2000).
Convenience sampling, judgment (purposive) sampling and quota sampling
are the most used non-probability sampling methods (Samuel et al., 2003),
here is a brief description for each one:
1. Convenience Sampling: in this method the researcher selects the sample
members by determining who can provide required information about the
topic, and also, who are available to respond to the research interviews
(Hair et al., 2003).
2. Judgment (Purposive) Sampling: this method is used to determine
elements of the sample, and also it involves for exact purpose (Hair et al.,
2003).
3. Quota Sampling: this method purpose is to obtain a proportional
representation of the target population strata for total sample (Cooper and
Schindler, 2003).
In interviews with quality specialists, the population was the Palestinian
conventional banks. Interviews were meant to understand the problem area.
In this case, specialists who have sufficient experience are needed, so non-
probability sampling is selected, and the most suitable type of non-
probability sampling fits this situation is judgment sampling, because this
research want to reach a specific purpose from experts.
71
The research interviews were separated in two levels. The first level of
interviews conducted with four front line employees (see Appendix D); the
reason that front line employees were targeted is due to their daily contact
with the customers. And the second level of interviews conducted with four
quality managers (see Appendix E) who are responsible for the service
quality.
3.5 Questionnaire Design
The questionnaire used in this research contains two types of variables:
dependent and independent variables (see Figure 12). The independent
variables were divided into three variables and each one have several
levels: Respondent gender (two levels: male, and female), the bank size
(twelve banks were grouped into four groups depending on the number of
bank branches and offices: 1-10, 11-20, 21-30, more than 31), and number
of years dealing with the bank (three levels: 1-4 years, 4-8 years, more than
8 years). On the other hand, there were five dependent variables, which
represented in the respondent‟s responses to the questionnaire paragraphs
that measures service quality in Palestinian conventional banks and the
total score of the service quality domains. These variables were the
SERVQUAL domains: Tangibility, Reliability, Responsiveness,
Assurance, and Empathy.
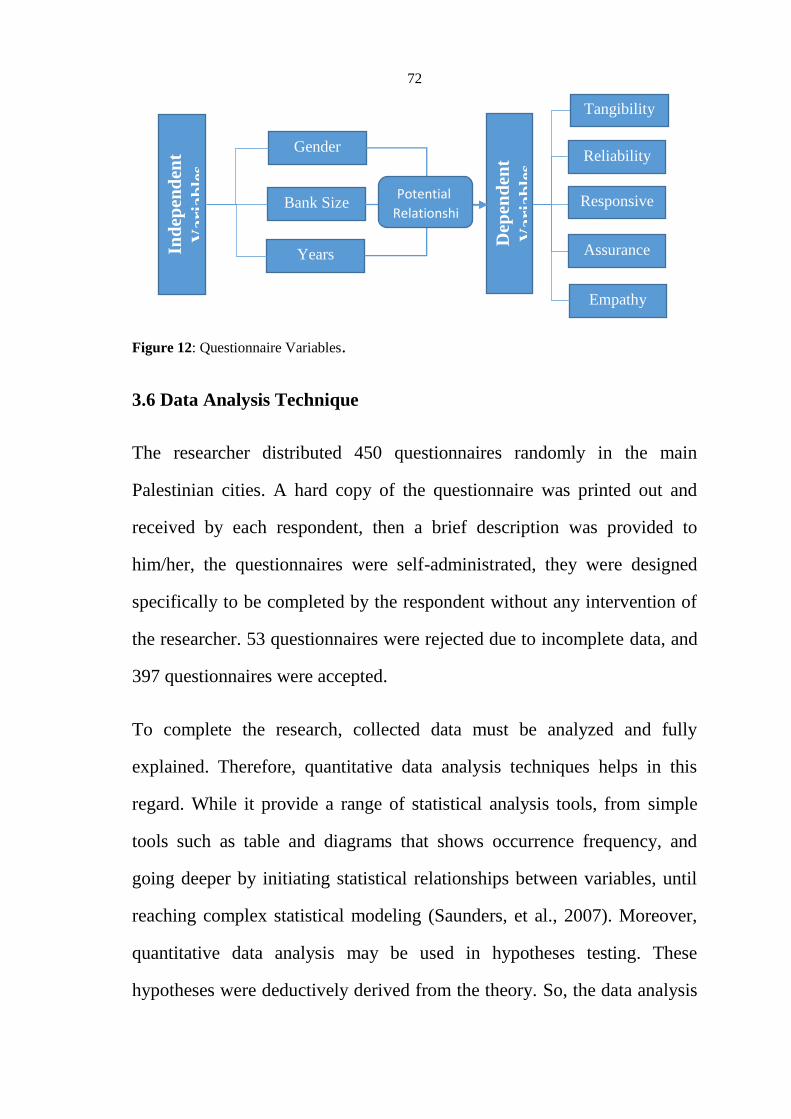
72
Figure 12: Questionnaire Variables.
3.6 Data Analysis Technique
The researcher distributed 450 questionnaires randomly in the main
Palestinian cities. A hard copy of the questionnaire was printed out and
received by each respondent, then a brief description was provided to
him/her, the questionnaires were self-administrated, they were designed
specifically to be completed by the respondent without any intervention of
the researcher. 53 questionnaires were rejected due to incomplete data, and
397 questionnaires were accepted.
To complete the research, collected data must be analyzed and fully
explained. Therefore, quantitative data analysis techniques helps in this
regard. While it provide a range of statistical analysis tools, from simple
tools such as table and diagrams that shows occurrence frequency, and
going deeper by initiating statistical relationships between variables, until
reaching complex statistical modeling (Saunders, et al., 2007). Moreover,
quantitative data analysis may be used in hypotheses testing. These
hypotheses were deductively derived from the theory. So, the data analysis
Ind
epen
den
t
Va
ria
ble
s
Gender
Bank Size
Years
Dep
end
ent
Va
ria
ble
s
Tangibility
Reliability
Responsive
Assurance
Empathy
Potential
Relationshi
ps
73
results, determine whether to accept or reject the theory. And also,
quantitative data can be analyzed using variety of computer software, such
as Microsoft Excel, or more complex and specialized data analysis software
SPSS (Statistical Package for Social Sciences) (Saunders et al., 2007).
Therefore, the accepted questionnaires were processed and analyzed using
SPSS application.
This research used a mixed approach for data collection (quantitative and
qualitative). For qualitative data collection, the researcher used semi-
structured interviews. Analyzing qualitative data can be performed using
codifying common sense, which represented in refinement interviewee
answers to be better demonstrated and clarified. This method works with
simple qualitative data, but if the data is more complicated, then it is
essential to use different treatment (Robson, 2002).
The researcher used several statistics analysis tools to outline the statistical
difference between respondents in this research. First of all, data normality
was checked, to determine which appropriate tests to be used. Therefore,
the “Kolmogorov-Smirnov Test” was performed, and resulted in data to be
not normally distributed (see Table 4). Consequently, non-parametric tests
must be used to get the accurate results. Means, frequencies and standard
deviations were used to estimate the respondents‟ responses on each item
and total score. Wilcoxon signed rank and Mann Whitney tests were used
to explain the difference between respondents; these two tests were used
because correlations between dependent and independent variables will be
tested, as well as the researcher need to highlight whether the means of
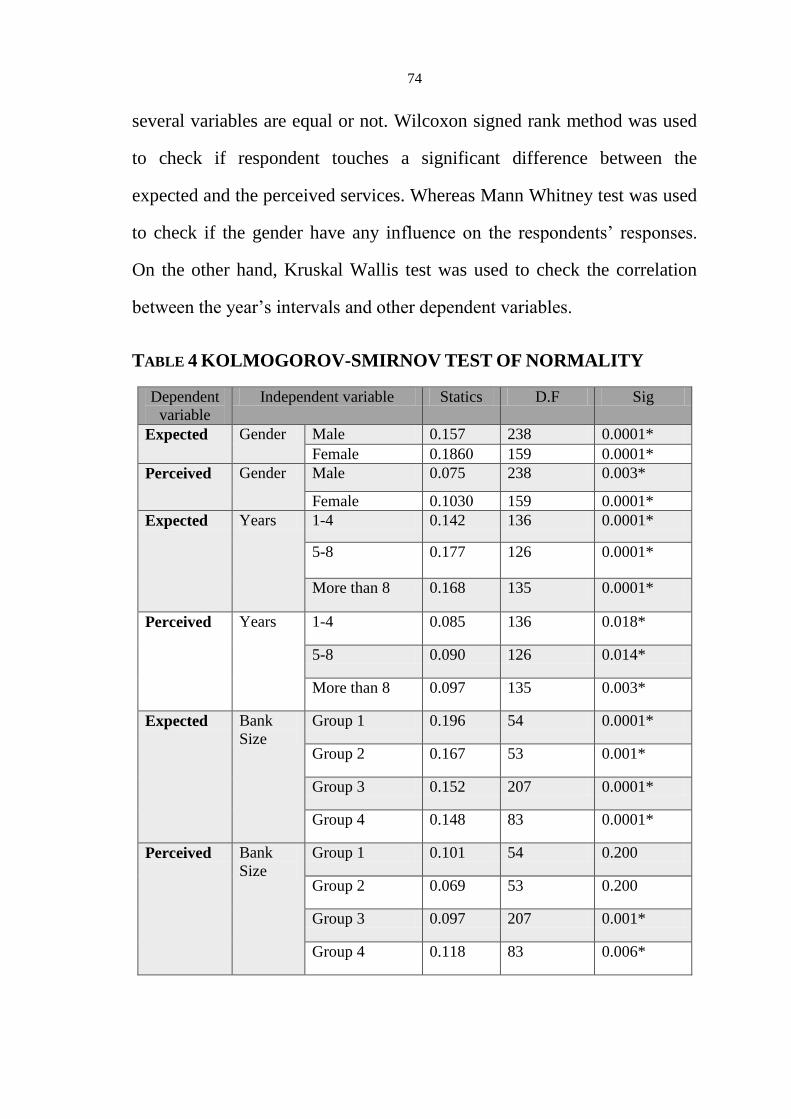
74
several variables are equal or not. Wilcoxon signed rank method was used
to check if respondent touches a significant difference between the
expected and the perceived services. Whereas Mann Whitney test was used
to check if the gender have any influence on the respondents‟ responses.
On the other hand, Kruskal Wallis test was used to check the correlation
between the year‟s intervals and other dependent variables.
TABLE 4 KOLMOGOROV-SMIRNOV TEST OF NORMALITY
Dependent
variable
Independent variable Statics D.F Sig
Expected Gender Male 0.157 238 0.0001*
Female 0.1860 159 0.0001*
Perceived Gender Male 0.075 238 0.003*
Female 0.1030 159 0.0001*
Expected Years 1-4 0.142 136 0.0001*
5-8 0.177 126 0.0001*
More than 8 0.168 135 0.0001*
Perceived Years 1-4 0.085 136 0.018*
5-8 0.090 126 0.014*
More than 8 0.097 135 0.003*
Expected Bank
Size
Group 1 0.196 54 0.0001*
Group 2 0.167 53 0.001*
Group 3 0.152 207 0.0001*
Group 4 0.148 83 0.0001*
Perceived Bank
Size
Group 1 0.101 54 0.200
Group 2 0.069 53 0.200
Group 3 0.097 207 0.001*
Group 4 0.118 83 0.006*
75
3.6 Validity and Reliability
Validity and reliability are vital for the research, while they reduce the
possibility of getting wrong answers, and ensure that the research
questionnaire and interviews are consistent, clear and understandable by
all. (Saunders and Thonhill, 2003).
3.6.1 Reliability
The sample reliability of this research was tested by the researcher, using
the Cronbach alpha coefficient. By using this method, the correlation
between each item in the questionnaire and others can be measured.
Cronbach alpha value normally ranging between (0) and (+1). Moreover,
the higher Cronbach alpha value, represents a higher internal consistency
degree. Table (5) shows the results of Cronbach alpha values for each
questionnaire domain, and the entire questionnaire. Firstly, Cronbach alpha
values for expected domains, were ranging between 0.701 and 0.914. Also,
Cronbach alpha values for perceived domains, were ranging between 0.822
and 0.873. These ranges considered high, the results ensures the reliability
of each domain of the questionnaire. Cronbach's Alpha equals 0.950 for the
entire expected domains in the questionnaire, and 0.954 for the entire
perceived domains in the questionnaire. Cronbach alpha results shows great
reliability degree of the entire questionnaire.
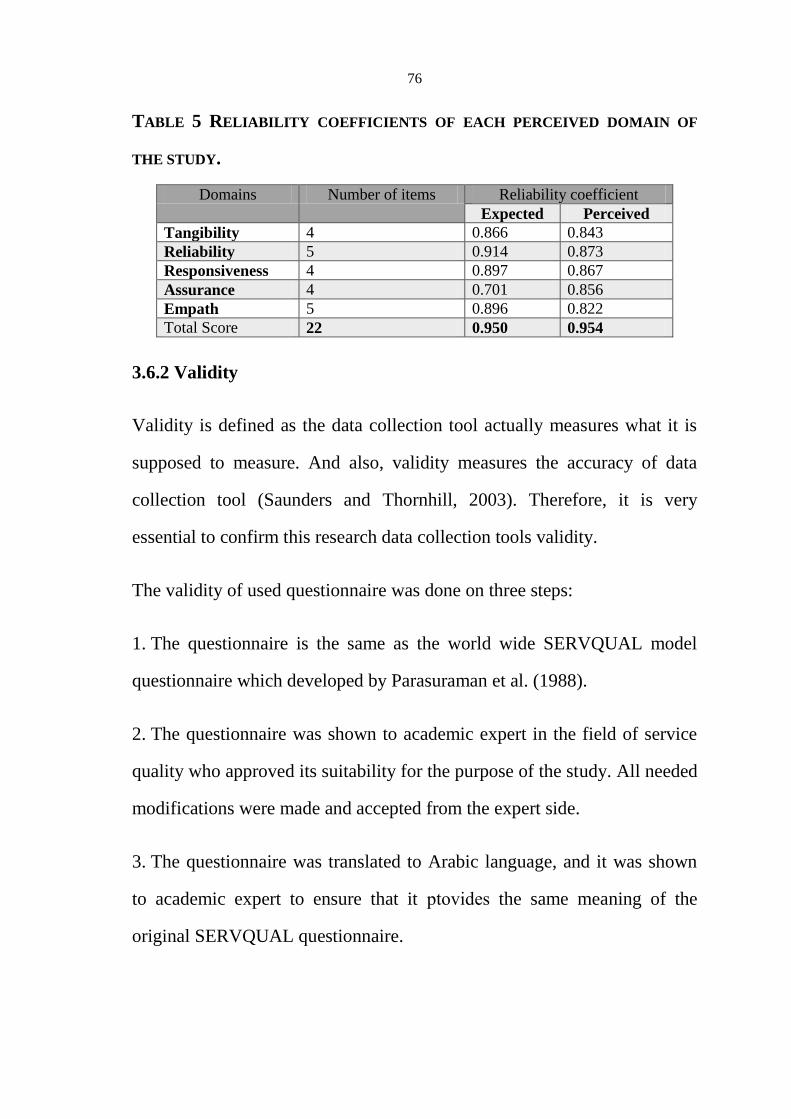
76
TABLE 5 RELIABILITY COEFFICIENTS OF EACH PERCEIVED DOMAIN OF
THE STUDY.
Domains Number of items Reliability coefficient
Expected Perceived
Tangibility 4 0.866 0.843
Reliability 5 0.914 0.873
Responsiveness 4 0.897 0.867
Assurance 4 0.701 0.856
Empath 5 0.896 0.822
Total Score 22 0.950 0.954
3.6.2 Validity
Validity is defined as the data collection tool actually measures what it is
supposed to measure. And also, validity measures the accuracy of data
collection tool (Saunders and Thornhill, 2003). Therefore, it is very
essential to confirm this research data collection tools validity.
The validity of used questionnaire was done on three steps:
1. The questionnaire is the same as the world wide SERVQUAL model
questionnaire which developed by Parasuraman et al. (1988).
2. The questionnaire was shown to academic expert in the field of service
quality who approved its suitability for the purpose of the study. All needed
modifications were made and accepted from the expert side.
3. The questionnaire was translated to Arabic language, and it was shown
to academic expert to ensure that it sedivotp the same meaning of the
original SERVQUAL questionnaire.
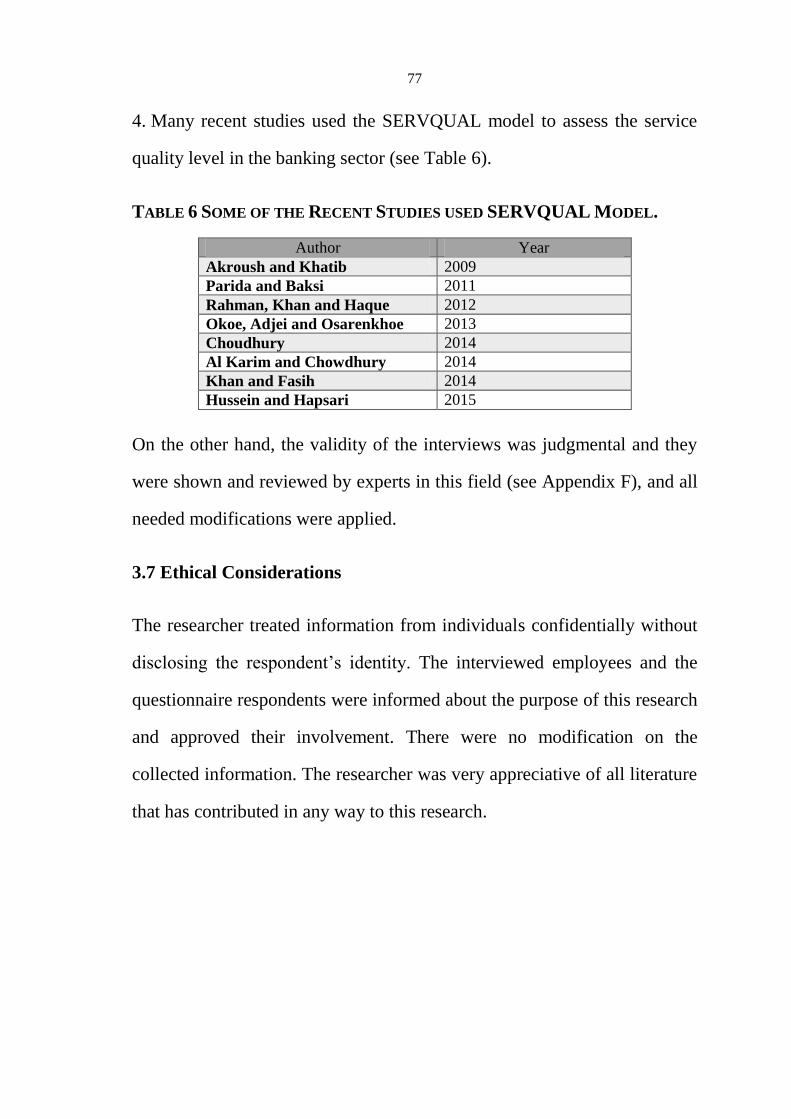
77
4. Many recent studies used the SERVQUAL model to assess the service
quality level in the banking sector (see Table 6).
TABLE 6 SOME OF THE RECENT STUDIES USED SERVQUAL MODEL.
Author Year
Akroush and Khatib 2009
Parida and Baksi 2011
Rahman, Khan and Haque 2012
Okoe, Adjei and Osarenkhoe 2013
Choudhury 2014
Al Karim and Chowdhury 2014
Khan and Fasih 2014
Hussein and Hapsari 2015
On the other hand, the validity of the interviews was judgmental and they
were shown and reviewed by experts in this field (see Appendix F), and all
needed modifications were applied.
3.7 Ethical Considerations
The researcher treated information from individuals confidentially without
disclosing the respondent‟s identity. The interviewed employees and the
questionnaire respondents were informed about the purpose of this research
and approved their involvement. There were no modification on the
collected information. The researcher was very appreciative of all literature
that has contributed in any way to this research.
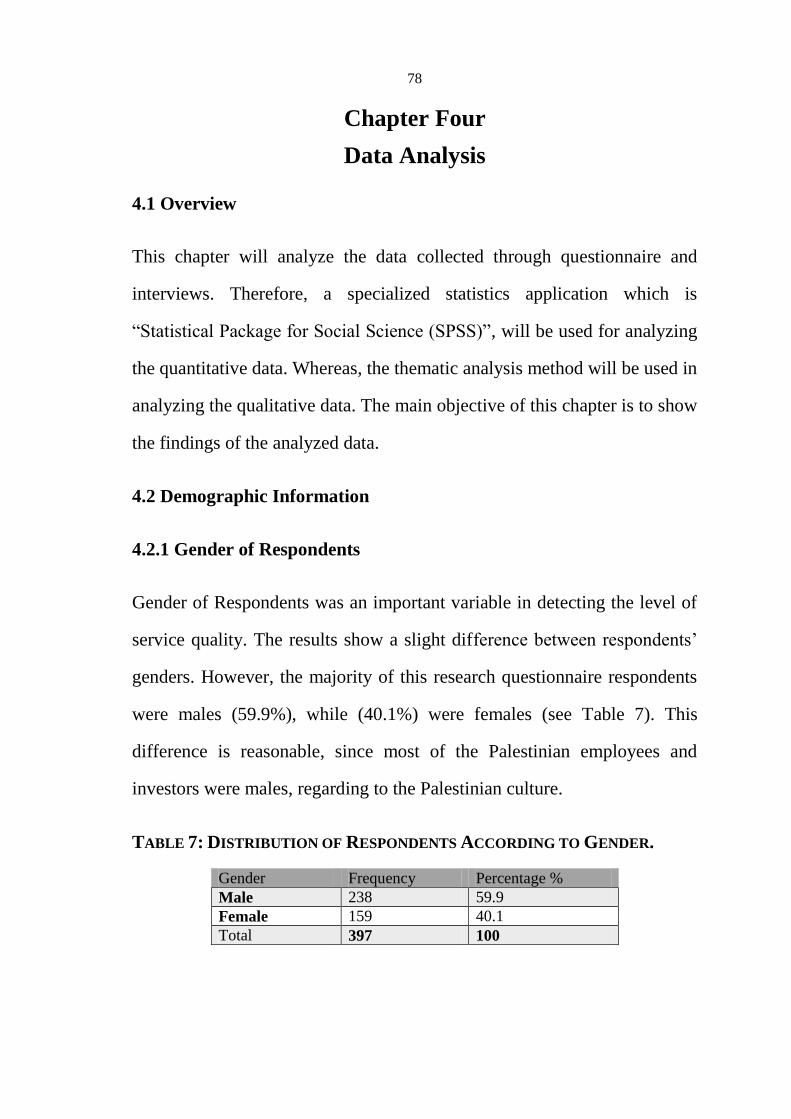
78
Chapter Four
Data Analysis
4.1 Overview
This chapter will analyze the data collected through questionnaire and
interviews. Therefore, a specialized statistics application which is
“Statistical Package for Social Science (SPSS)”, will be used for analyzing
the quantitative data. Whereas, the thematic analysis method will be used in
analyzing the qualitative data. The main objective of this chapter is to show
the findings of the analyzed data.
4.2 Demographic Information
4.2.1 Gender of Respondents
Gender of Respondents was an important variable in detecting the level of
service quality. The results show a slight difference between respondents‟
genders. However, the majority of this research questionnaire respondents
were males (59.9%), while (40.1%) were females (see Table 7). This
difference is reasonable, since most of the Palestinian employees and
investors were males, regarding to the Palestinian culture.
TABLE 7: DISTRIBUTION OF RESPONDENTS ACCORDING TO GENDER.
Gender Frequency Percentage %
Male 238 59.9
Female 159 40.1
Total 397 100
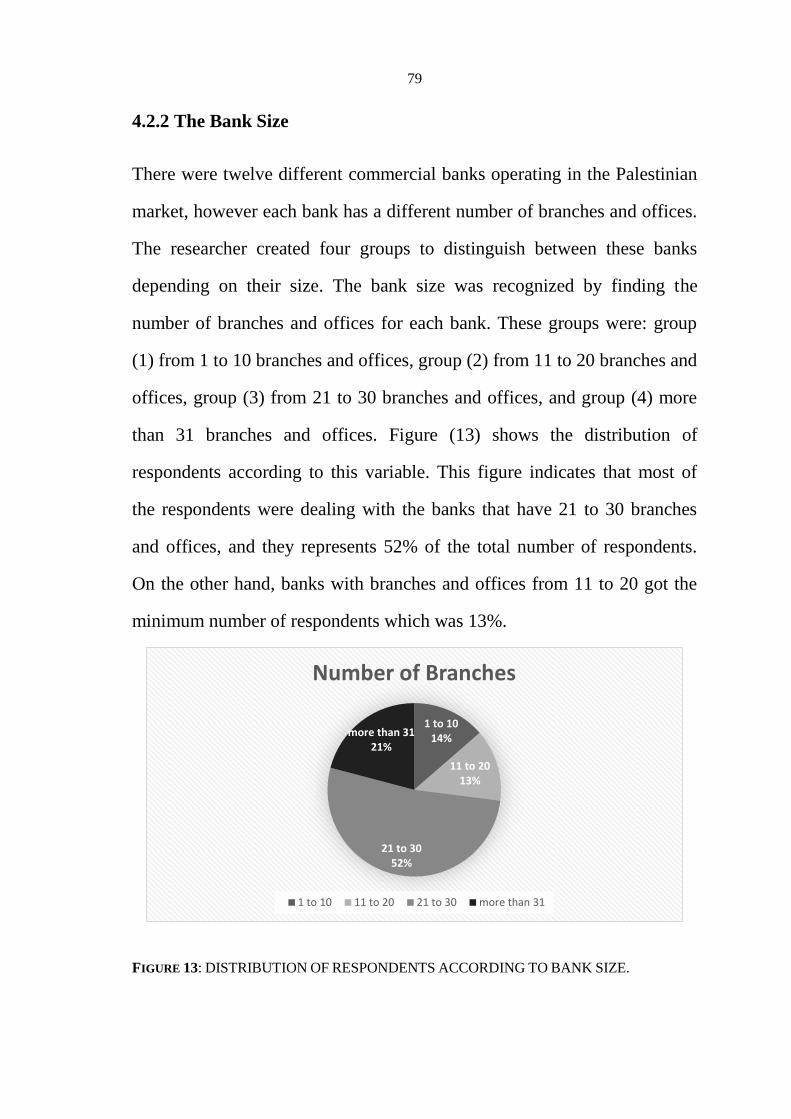
79
4.2.2 The Bank Size
There were twelve different commercial banks operating in the Palestinian
market, however each bank has a different number of branches and offices.
The researcher created four groups to distinguish between these banks
depending on their size. The bank size was recognized by finding the
number of branches and offices for each bank. These groups were: group
(1) from 1 to 10 branches and offices, group (2) from 11 to 20 branches and
offices, group (3) from 21 to 30 branches and offices, and group (4) more
than 31 branches and offices. Figure (13) shows the distribution of
respondents according to this variable. This figure indicates that most of
the respondents were dealing with the banks that have 21 to 30 branches
and offices, and they represents 52% of the total number of respondents.
On the other hand, banks with branches and offices from 11 to 20 got the
minimum number of respondents which was 13%.
FIGURE 13: DISTRIBUTION OF RESPONDENTS ACCORDING TO BANK SIZE.
1 to 10 14%
11 to 20 13%
21 to 30 52%
more than 31 21%
Number of Branches
1 to 10 11 to 20 21 to 30 more than 31
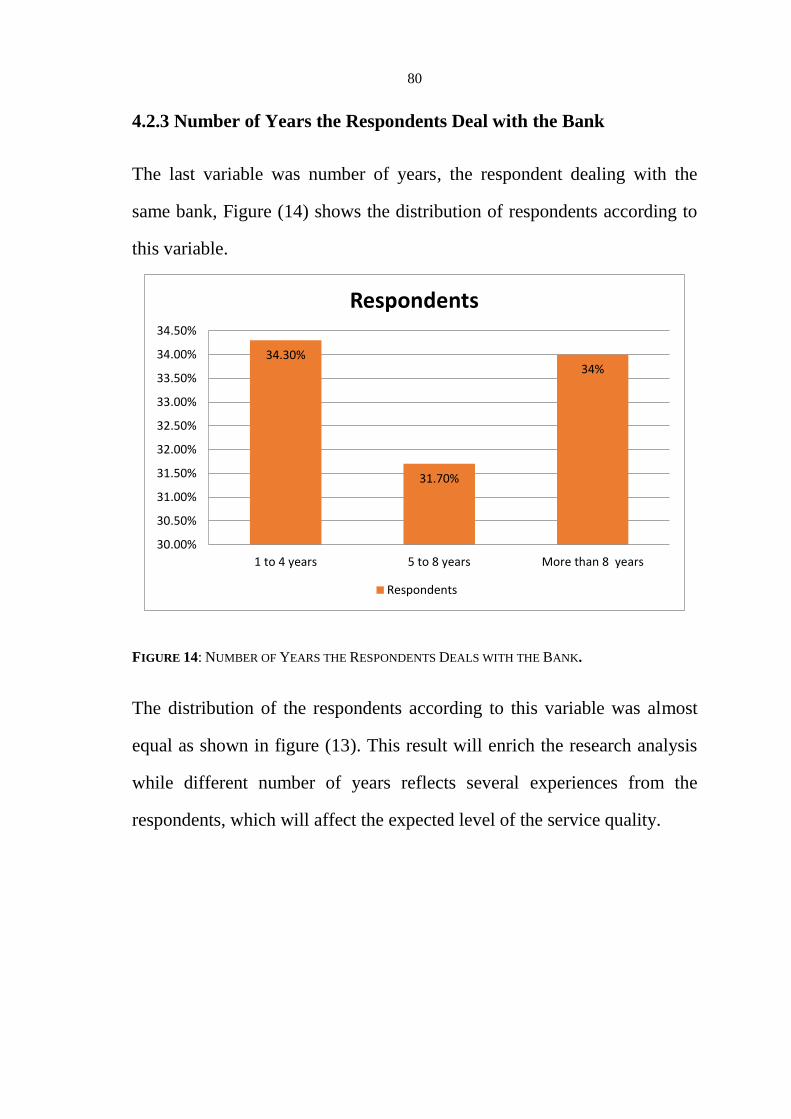
80
4.2.3 Number of Years the Respondents Deal with the Bank
The last variable was number of years, the respondent dealing with the
same bank, Figure (14) shows the distribution of respondents according to
this variable.
FIGURE 14: NUMBER OF YEARS THE RESPONDENTS DEALS WITH THE BANK.
The distribution of the respondents according to this variable was almost
equal as shown in figure (13). This result will enrich the research analysis
while different number of years reflects several experiences from the
respondents, which will affect the expected level of the service quality.
34.30%
31.70%
34%
1 to 4 years 5 to 8 years More than 8 years
30.00%
30.50%
31.00%
31.50%
32.00%
32.50%
33.00%
33.50%
34.00%
34.50%
Respondents
Respondents
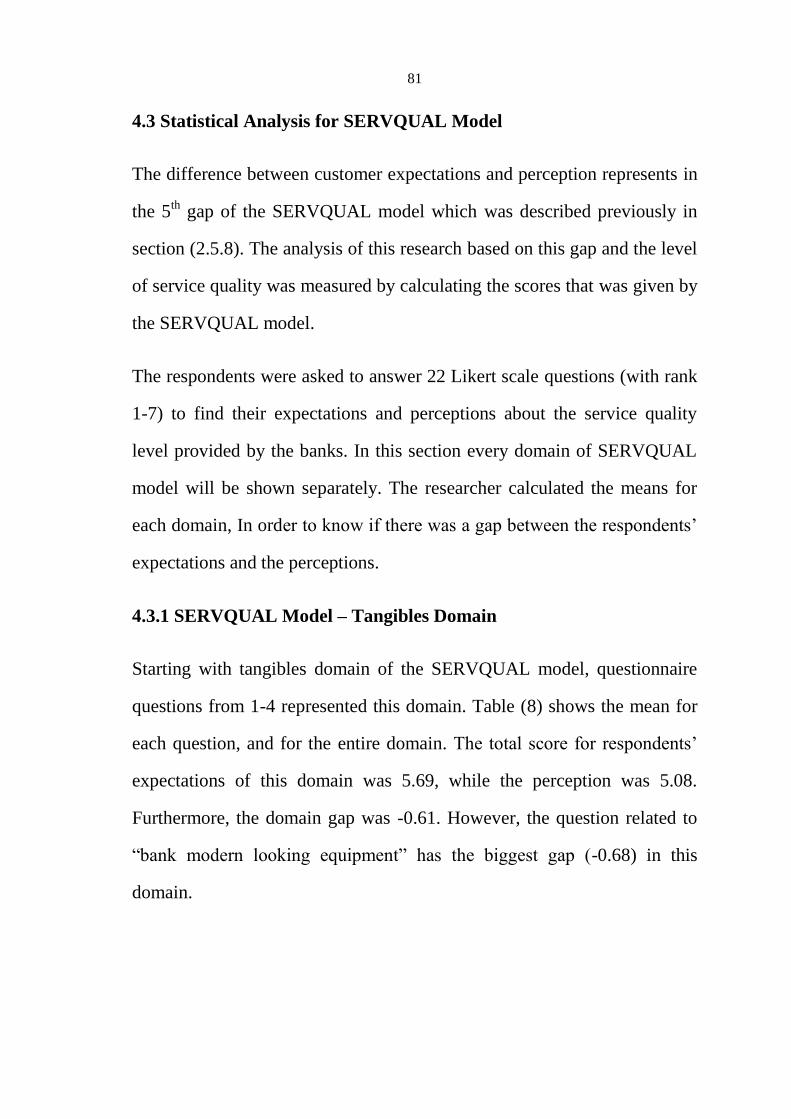
81
4.3 Statistical Analysis for SERVQUAL Model
The difference between customer expectations and perception represents in
the 5th
gap of the SERVQUAL model which was described previously in
section (2.5.8). The analysis of this research based on this gap and the level
of service quality was measured by calculating the scores that was given by
the SERVQUAL model.
The respondents were asked to answer 22 Likert scale questions (with rank
1-7) to find their expectations and perceptions about the service quality
level provided by the banks. In this section every domain of SERVQUAL
model will be shown separately. The researcher calculated the means for
each domain, In order to know if there was a gap between the respondents‟
expectations and the perceptions.
4.3.1 SERVQUAL Model – Tangibles Domain
Starting with tangibles domain of the SERVQUAL model, questionnaire
questions from 1-4 represented this domain. Table (8) shows the mean for
each question, and for the entire domain. The total score for respondents‟
expectations of this domain was 5.69, while the perception was 5.08.
Furthermore, the domain gap was -0.61. However, the question related to
“bank modern looking equipment” has the biggest gap (-0.68) in this
domain.
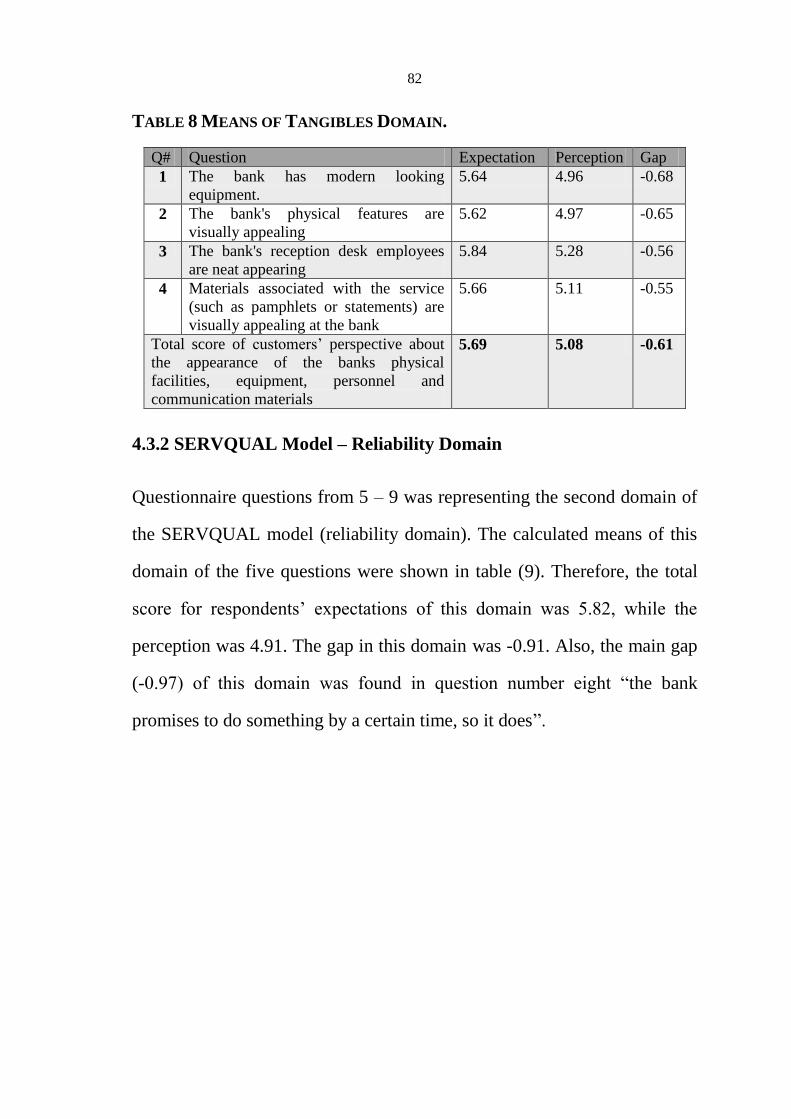
82
TABLE 8 MEANS OF TANGIBLES DOMAIN.
Q# Question Expectation Perception Gap
1 The bank has modern looking
equipment.
5.64 4.96 -0.68
2 The bank's physical features are
visually appealing
5.62 4.97 -0.65
3 The bank's reception desk employees
are neat appearing
5.84 5.28 -0.56
4 Materials associated with the service
(such as pamphlets or statements) are
visually appealing at the bank
5.66 5.11 -0.55
Total score of customers‟ perspective about
the appearance of the banks physical
facilities, equipment, personnel and
communication materials
5.69 5.08 -0.61
4.3.2 SERVQUAL Model – Reliability Domain
Questionnaire questions from 5 – 9 was representing the second domain of
the SERVQUAL model (reliability domain). The calculated means of this
domain of the five questions were shown in table (9). Therefore, the total
score for respondents‟ expectations of this domain was 5.82, while the
perception was 4.91. The gap in this domain was -0.91. Also, the main gap
(-0.97) of this domain was found in question number eight “the bank
promises to do something by a certain time, so it does”.

83
TABLE 9: MEANS FOR RELIABILITY DOMAIN.
Q# Question Expectation Perception Gap
5 When the bank promises to do something
by a certain time, it does so
5.66 4.73 -0.93
6 When you have a problem, the bank
shows a sincere interest in solving it
5.81 4.87 -0.94
7 The bank performs the service right the
first time.
5.76 4.91 -0.85
8 The bank provides its service at the time
it promises to do so
5.84 4.87 -0.97
9 The bank insists on error free records. 6.05 5.18 -0.87
Total score of customers‟ perspective about the
bank's ability to perform the promised service
dependably and accurately
5.82 4.91 -0.91
4.3.3 SERVQUAL Model – Assurance Domain
Assurance questions were from 10 – 13, which represented the third
domain of SERVQUAL model. Table (10) showed the means for each
question. The total score for respondents‟ expectation of this domain was
5.77, while the perception was 4.86. The gap of this domain was -0.91. In
addition, question number 13 “employees in the bank are never busy to
respond to customer request” have the biggest gap (-1) of this domain.
TABLE 10: MEANS FOR ASSURANCE DOMAIN.
Q# Question Expectation Perception Gap
10 Employees in the bank tell you exactly
when the services will be performed
5.69 4.77 -0.92
11 Employees in the bank give you prompt
service.
5.79 4.86 -0.93
12 Employees in the bank are always willing
to help you.
5.80 5.00 -0.8
13 Employees in the bank are never too busy
to respond to your request
5.82 4.82 -1
Total score of customers‟ perspective about the
banks willingness to help customers and
provide prompt service
5.77 4.86 -0.91
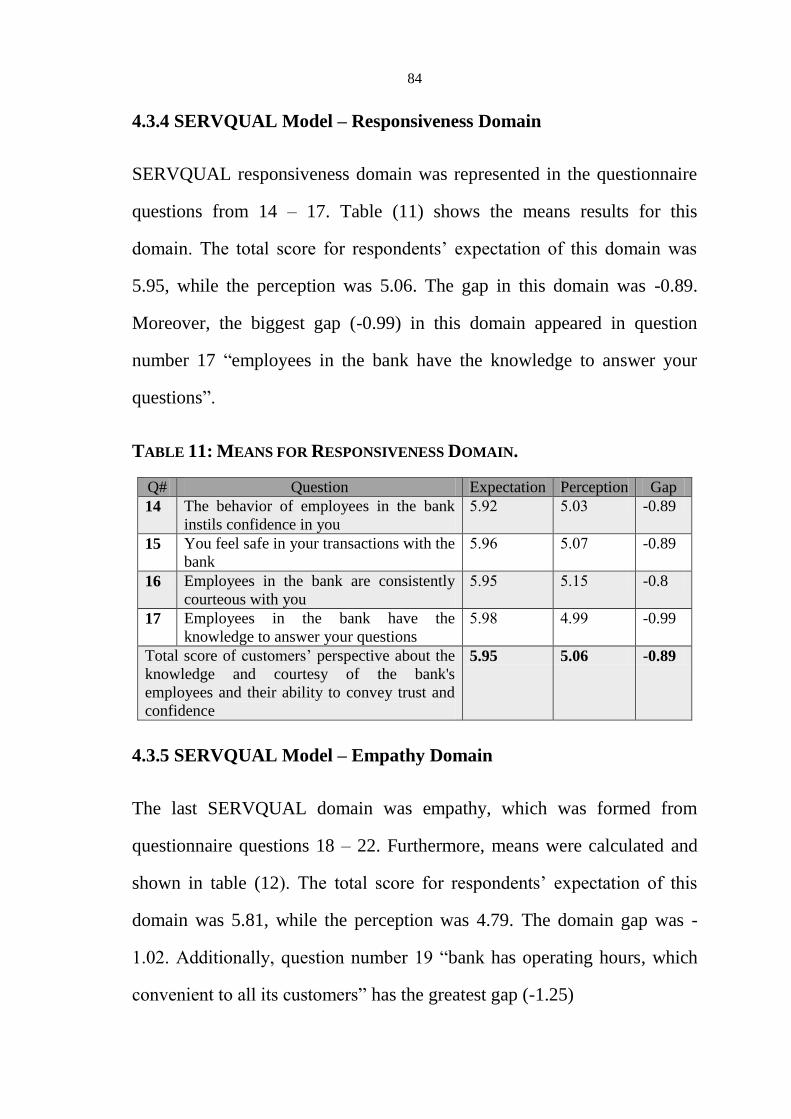
84
4.3.4 SERVQUAL Model – Responsiveness Domain
SERVQUAL responsiveness domain was represented in the questionnaire
questions from 14 – 17. Table (11) shows the means results for this
domain. The total score for respondents‟ expectation of this domain was
5.95, while the perception was 5.06. The gap in this domain was -0.89.
Moreover, the biggest gap (-0.99) in this domain appeared in question
number 17 “employees in the bank have the knowledge to answer your
questions”.
TABLE 11: MEANS FOR RESPONSIVENESS DOMAIN.
Q# Question Expectation Perception Gap
14 The behavior of employees in the bank
instils confidence in you
29.5 2905 -0.89
15 You feel safe in your transactions with the
bank
29.5 2905 -0.89
16 Employees in the bank are consistently
courteous with you
29.2 29.2 -0.8
17 Employees in the bank have the
knowledge to answer your questions
29.5 99.. -0.99
Total score of customers‟ perspective about the
knowledge and courtesy of the bank's
employees and their ability to convey trust and
confidence
5.95 5.06 -0.89
4.3.5 SERVQUAL Model – Empathy Domain
The last SERVQUAL domain was empathy, which was formed from
questionnaire questions 18 – 22. Furthermore, means were calculated and
shown in table (12). The total score for respondents‟ expectation of this
domain was 5.81, while the perception was 4.79. The domain gap was -
1.02. Additionally, question number 19 “bank has operating hours, which
convenient to all its customers” has the greatest gap (-1.25)
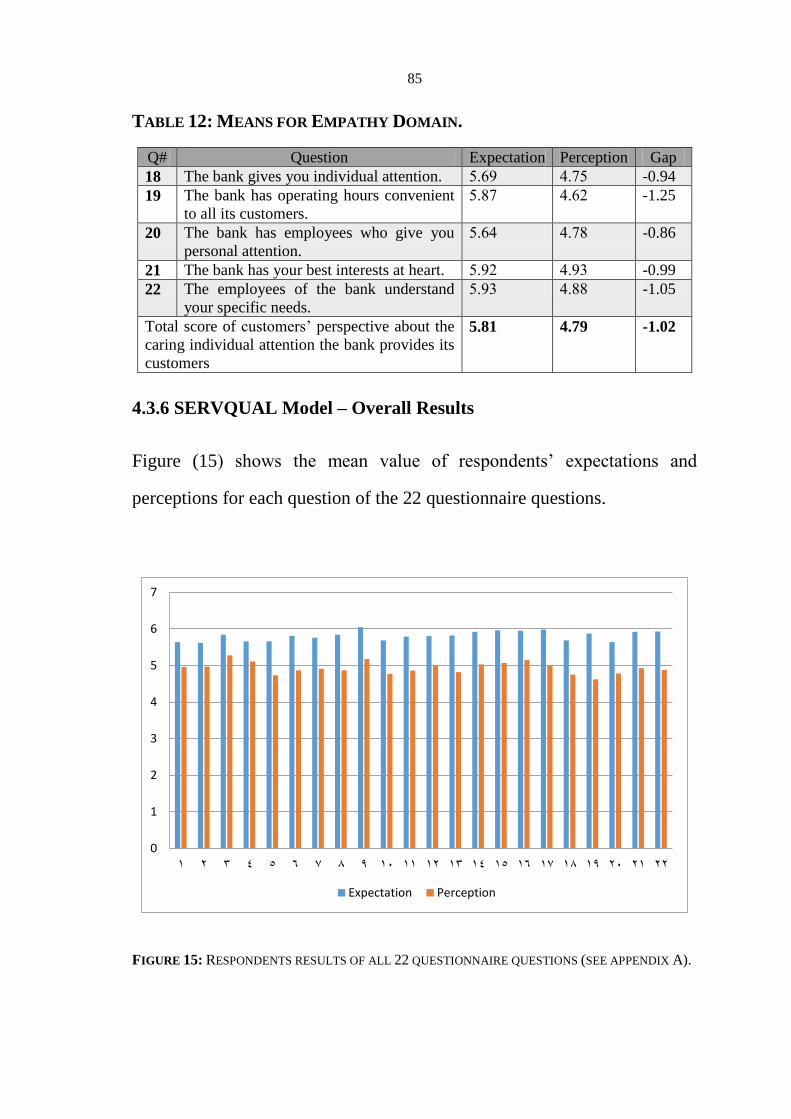
85
TABLE 12: MEANS FOR EMPATHY DOMAIN.
Q# Question Expectation Perception Gap
18 The bank gives you individual attention. 295. 9952 -0.94
19 The bank has operating hours convenient
to all its customers.
2955 9955 -1.25
20 The bank has employees who give you
personal attention.
2959 9955 -0.86
21 The bank has your best interests at heart. 29.5 99.5 -0.99
22 The employees of the bank understand
your specific needs.
29.5 9955 -1.05
Total score of customers‟ perspective about the
caring individual attention the bank provides its
customers
5.81 4.79 -1.02
4.3.6 SERVQUAL Model – Overall Results
Figure (15) shows the mean value of respondents‟ expectations and
perceptions for each question of the 22 questionnaire questions.
FIGURE 15: RESPONDENTS RESULTS OF ALL 22 QUESTIONNAIRE QUESTIONS (SEE APPENDIX A).
0
1
2
3
4
5
6
7
1 2 3 4 5 6 7 8 9 10 11 12 13 14 15 16 17 18 19 20 21 22
Expectation Perception
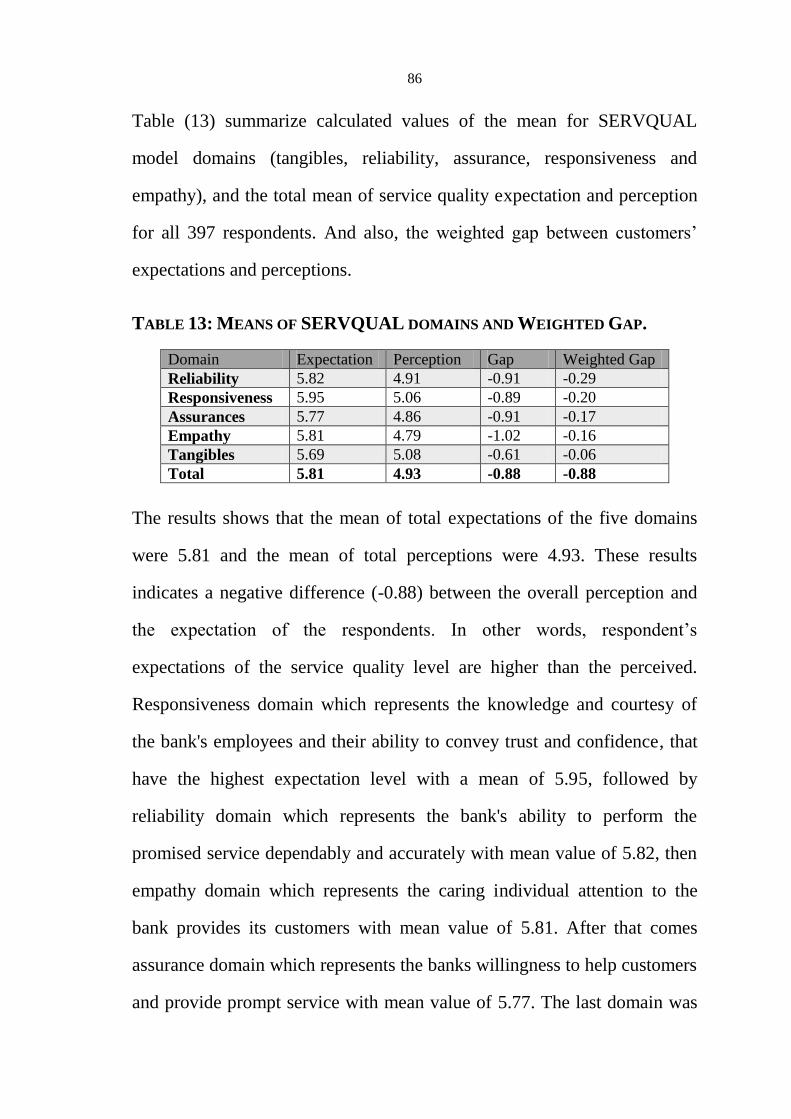
86
Table (13) summarize calculated values of the mean for SERVQUAL
model domains (tangibles, reliability, assurance, responsiveness and
empathy), and the total mean of service quality expectation and perception
for all 397 respondents. And also, the weighted gap between customers‟
expectations and perceptions.
TABLE 13: MEANS OF SERVQUAL DOMAINS AND WEIGHTED GAP.
Domain Expectation Perception Gap Weighted Gap
Reliability 5.82 4.91 -0.91 -0.29
Responsiveness 5.95 5.06 -0.89 -0.20
Assurances 5.77 4.86 -0.91 -0.17
Empathy 5.81 4.79 -1.02 -0.16
Tangibles 5.69 5.08 -0.61 -0.06
Total 5.81 4.93 -0.88 -0.88
The results shows that the mean of total expectations of the five domains
were 5.81 and the mean of total perceptions were 4.93. These results
indicates a negative difference (-0.88) between the overall perception and
the expectation of the respondents. In other words, respondent‟s
expectations of the service quality level are higher than the perceived.
Responsiveness domain which represents the knowledge and courtesy of
the bank's employees and their ability to convey trust and confidence, that
have the highest expectation level with a mean of 5.95, followed by
reliability domain which represents the bank's ability to perform the
promised service dependably and accurately with mean value of 5.82, then
empathy domain which represents the caring individual attention to the
bank provides its customers with mean value of 5.81. After that comes
assurance domain which represents the banks willingness to help customers
and provide prompt service with mean value of 5.77. The last domain was
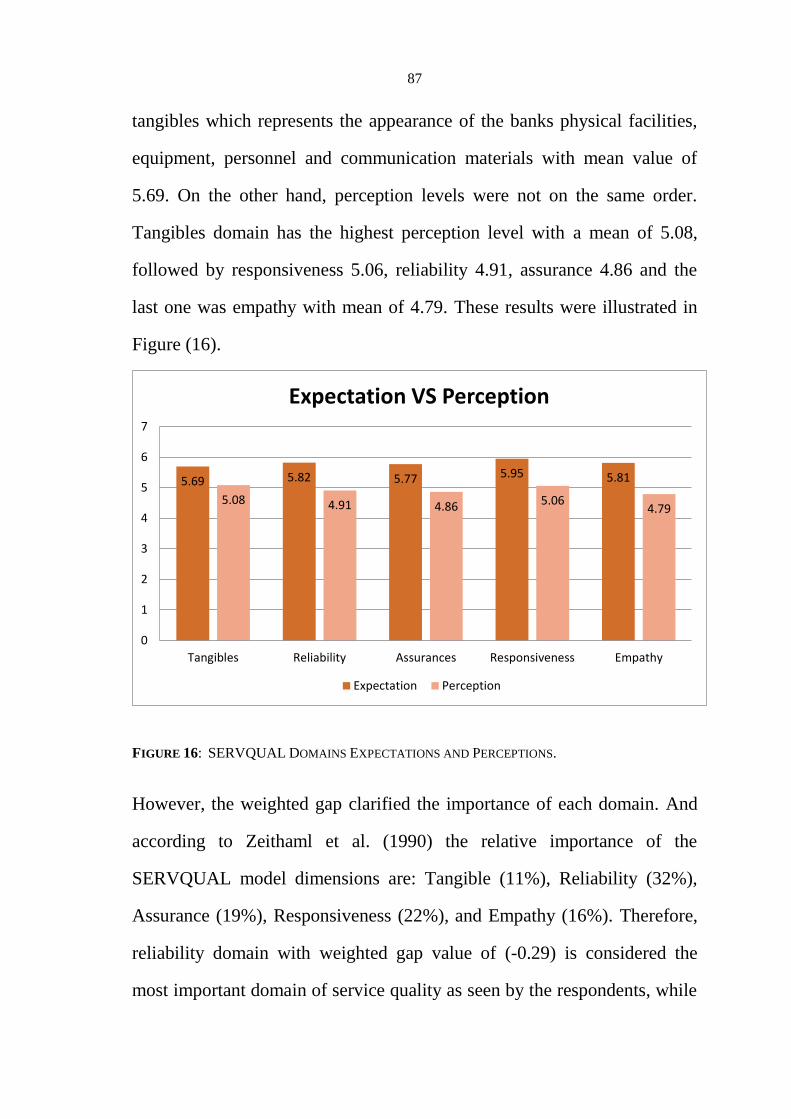
87
tangibles which represents the appearance of the banks physical facilities,
equipment, personnel and communication materials with mean value of
5.69. On the other hand, perception levels were not on the same order.
Tangibles domain has the highest perception level with a mean of 5.08,
followed by responsiveness 5.06, reliability 4.91, assurance 4.86 and the
last one was empathy with mean of 4.79. These results were illustrated in
Figure (16).
FIGURE 16: SERVQUAL DOMAINS EXPECTATIONS AND PERCEPTIONS.
However, the weighted gap clarified the importance of each domain. And
according to Zeithaml et al. (1990) the relative importance of the
SERVQUAL model dimensions are: Tangible (11%), Reliability (32%),
Assurance (19%), Responsiveness (22%), and Empathy (16%). Therefore,
reliability domain with weighted gap value of (-0.29) is considered the
most important domain of service quality as seen by the respondents, while
5.69 5.82 5.77 5.95 5.81
5.08 4.91 4.86 5.06 4.79
0
1
2
3
4
5
6
7
Tangibles Reliability Assurances Responsiveness Empathy
Expectation VS Perception
Expectation Perception
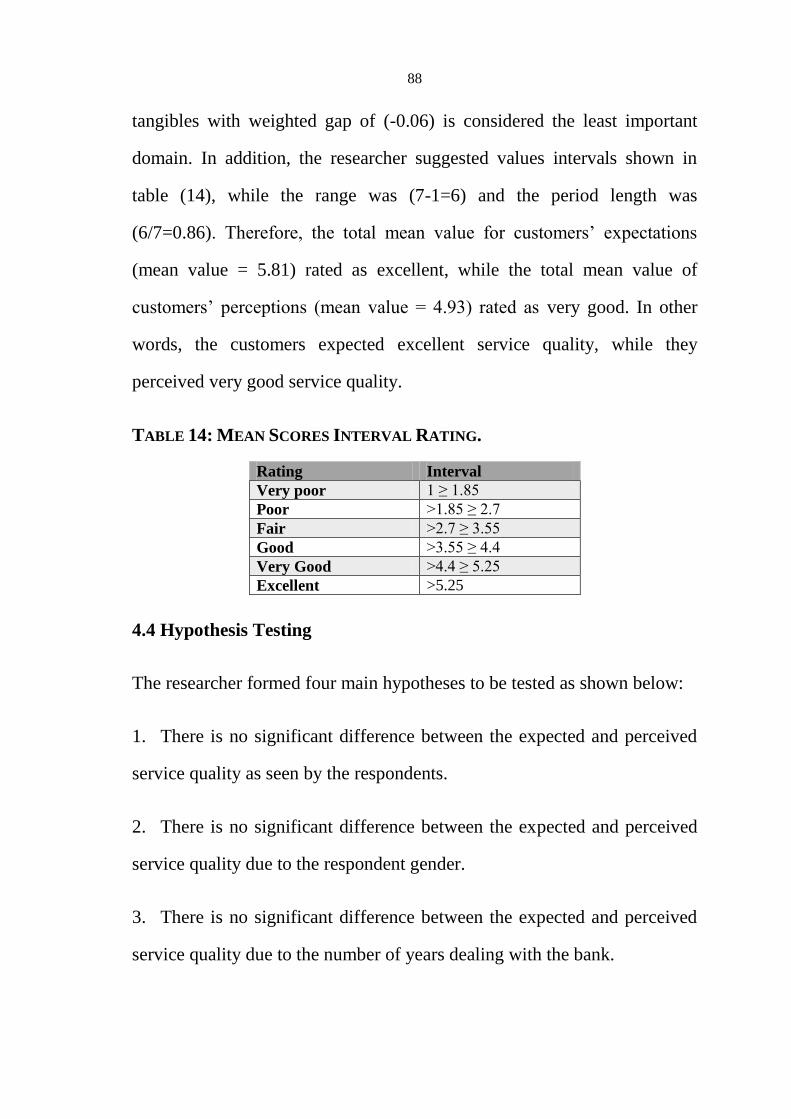
88
tangibles with weighted gap of (-0.06) is considered the least important
domain. In addition, the researcher suggested values intervals shown in
table (14), while the range was (7-1=6) and the period length was
(6/7=0.86). Therefore, the total mean value for customers‟ expectations
(mean value = 5.81) rated as excellent, while the total mean value of
customers‟ perceptions (mean value = 4.93) rated as very good. In other
words, the customers expected excellent service quality, while they
perceived very good service quality.
TABLE 14: MEAN SCORES INTERVAL RATING.
Rating Interval
Very poor 1 ≥ 1.85
Poor >1.85 ≥ 2.7
Fair >2.7 ≥ 3.55
Good >3.55 ≥ 4.4
Very Good >4.4 ≥ 5.25
Excellent >5.25
4.4 Hypothesis Testing
The researcher formed four main hypotheses to be tested as shown below:
1. There is no significant difference between the expected and perceived
service quality as seen by the respondents.
2. There is no significant difference between the expected and perceived
service quality due to the respondent gender.
3. There is no significant difference between the expected and perceived
service quality due to the number of years dealing with the bank.
89
4. There is no significant difference between the expected and perceived
service quality due to the Bank size.
4.4.1 First Hypothesis: Testing difference between expected and
perceived service quality
The researcher formulate two hypothesis for this test as shown below:
: There is no significant difference between the expected and perceived
service quality as seen by the respondents.
: There is a significant difference between the expected and perceived
service quality as seen by the respondents.
As seen before in section (4.3), there was a gap between the mean of
customers‟ expectations and perception, for that reason, this hypothesis
was formed. However, to test this hypothesis, the researcher has to check
all the SERVQUAL five domains (Tangibles, Reliability, Assurances,
Responsiveness and Empathy). The overall result determines whether to
accept or reject this hypothesis. Thus, the non-parametric Wilcoxon
Signed Rank Test was performed, which is similar to the parametric T-
Test, to check the difference between scores in two related samples
(expected and perceived), at significant level α=0.05. The test results were
listed inside Table (15). The p-value of each domain of the five domains
was less than the significant level (p-value = 0.0001 < 0.05), which leads
to reject the null hypothesis. In other words, there is a significant
difference between the expected and perceived service quality as seen by
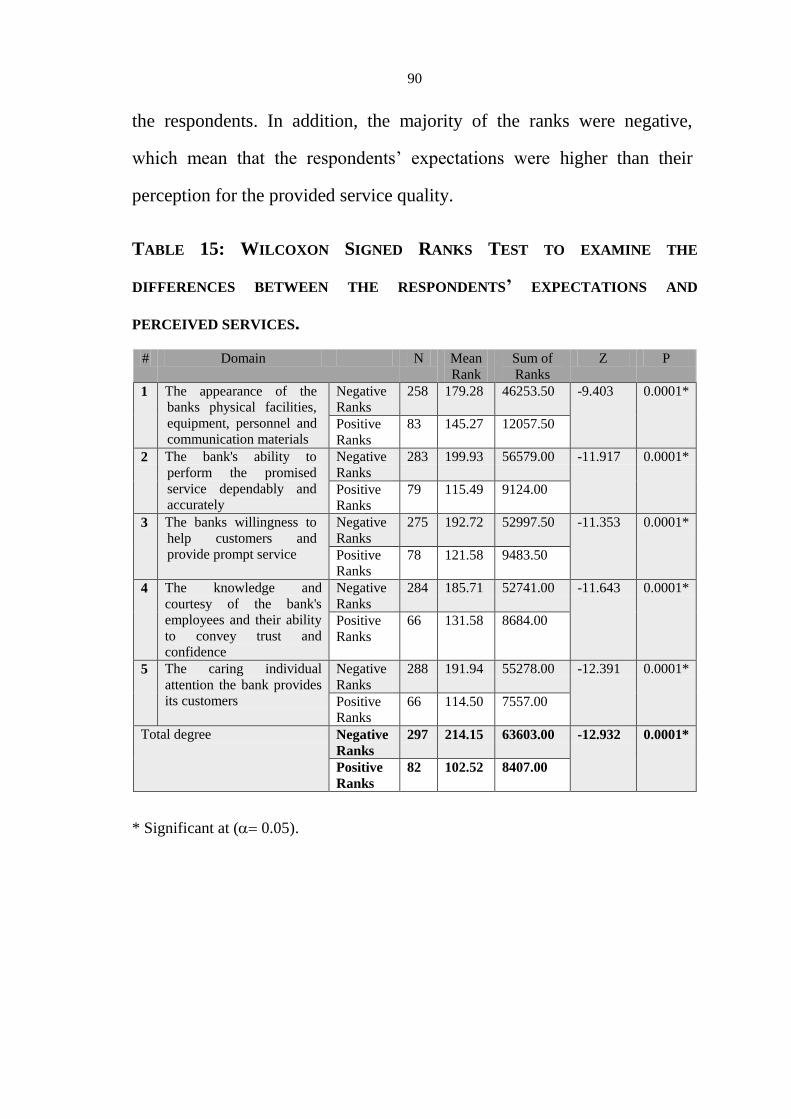
90
the respondents. In addition, the majority of the ranks were negative,
which mean that the respondents‟ expectations were higher than their
perception for the provided service quality.
TABLE 15: WILCOXON SIGNED RANKS TEST TO EXAMINE THE
DIFFERENCES BETWEEN THE RESPONDENTS’ EXPECTATIONS AND
PERCEIVED SERVICES.
# Domain N Mean
Rank
Sum of
Ranks
Z P
1 The appearance of the
banks physical facilities,
equipment, personnel and
communication materials
Negative
Ranks
258 179.28 46253.50 -9.403 0.0001*
Positive
Ranks
83 145.27 12057.50
2 The bank's ability to
perform the promised
service dependably and
accurately
Negative
Ranks
283 199.93 56579.00 -11.917 0.0001*
Positive
Ranks
79 115.49 9124.00
3 The banks willingness to
help customers and
provide prompt service
Negative
Ranks
275 192.72 52997.50 -11.353 0.0001*
Positive
Ranks
78 121.58 9483.50
4 The knowledge and
courtesy of the bank's
employees and their ability
to convey trust and
confidence
Negative
Ranks
284 185.71 52741.00 -11.643 0.0001*
Positive
Ranks
66 131.58 8684.00
5 The caring individual
attention the bank provides
its customers
Negative
Ranks
288 191.94 55278.00 -12.391 0.0001*
Positive
Ranks
66 114.50 7557.00
Total degree Negative
Ranks
297 214.15 63603.00 -12.932 0.0001*
Positive
Ranks
82 102.52 8407.00
* Significant at ( 0.05).
91
4.4.2 Second Hypothesis: Testing difference between expected and
perceived service quality due to respondents’ gender.
The researcher formulate two hypothesis for this test as shown below:
: There is no significant difference between the expected and perceived
service quality due to the respondents‟ gender.
: There is a significant difference between the expected and perceived
service quality due to the respondents‟ gender.
In order to test this hypothesis, the researcher has to check gender effect on
all the SERVQUAL domains (Tangibles, Reliability, Assurances,
Responsiveness and Empathy). The overall result determines whether to
accept or reject this hypothesis. The non-parametric Mann Whitney Test
was performed, which is used to determine whether two independent
groups (males and females) having the same distribution at a significant
level α=0.05. This test was performed to check if there was a significant
difference between males and females responses on the expected and
perceived service quality. For that reason the researcher divided this
hypothesis into two sub hypothesis:
1. There is no significant difference between males and females on
expected service quality.
2. There is no significant difference between males and females on
perceived service quality.
92
4.4.2.1 Gender First Sub Hypothesis: Testing difference between males
and females on expected service quality.
The researcher formulate two hypothesis for this test as shown below:
: There is no significant difference between males and females on
expected service quality.
: There is a significant difference between males and females on
expected service quality.
In general the test results showed the p-value = 0.022 < 0.05, therefore the
null hypothesis was rejected, and there is a significant difference between
males and females responses on the expected service quality (see Table
16). Furthermore, this difference was detected by checking the average
rank, which was higher in the female group. In other words, expected
service quality level in the eye of females group was higher than males
group.
And to be more accurate, the researcher checked each domain separately to
know if all of them have a significant differences between males and
females responses. The test results mentioned in Table (16) shows that
there is no significant difference between males and females responses for
three domain: tangibles with p-value = 0.067 > 0.05, reliability with p-
value = 0.051 > 0.05, and empathy with p-value = 0.129 > 0.05. However,
assurance and responsiveness domains indicates a significant differences
between males and females responses on the expected service quality,
93
while the p-value = 0.015 < 0.05 for assurance domain and p-value = 0.045
< 0.05 for responsiveness domain. Furthermore, these differences were
detected by checking the average rank, which was higher in the female
group. Thus, females group expect higher level of service quality than
males group.
4.4.2.2 Gender Second Sub Hypothesis: Testing difference between
males and females on perceived service quality.
The researcher formulate two hypothesis for this test as shown below:
: There is no significant difference between males and females on
perceived service quality.
: There is a significant difference between males and females on
perceived service quality.
Mann Whitney Test was performed again on two groups (males and
females) to check if there was a significant difference between them on the
perceived service quality. The test resulted p-value = 0.016 < 0.05,
therefore the null hypothesis was rejected, and there is a significant
difference between males and females responses as shown in Table (16).
Moreover, this difference was detected by checking the average rank,
which was higher in the female group. In other words, perceived service
quality level in the eye of females group was higher than males group.
To get more details, the test was applied on the five domains. Tangibles,
reliability and assurance domains shows a significant differences between
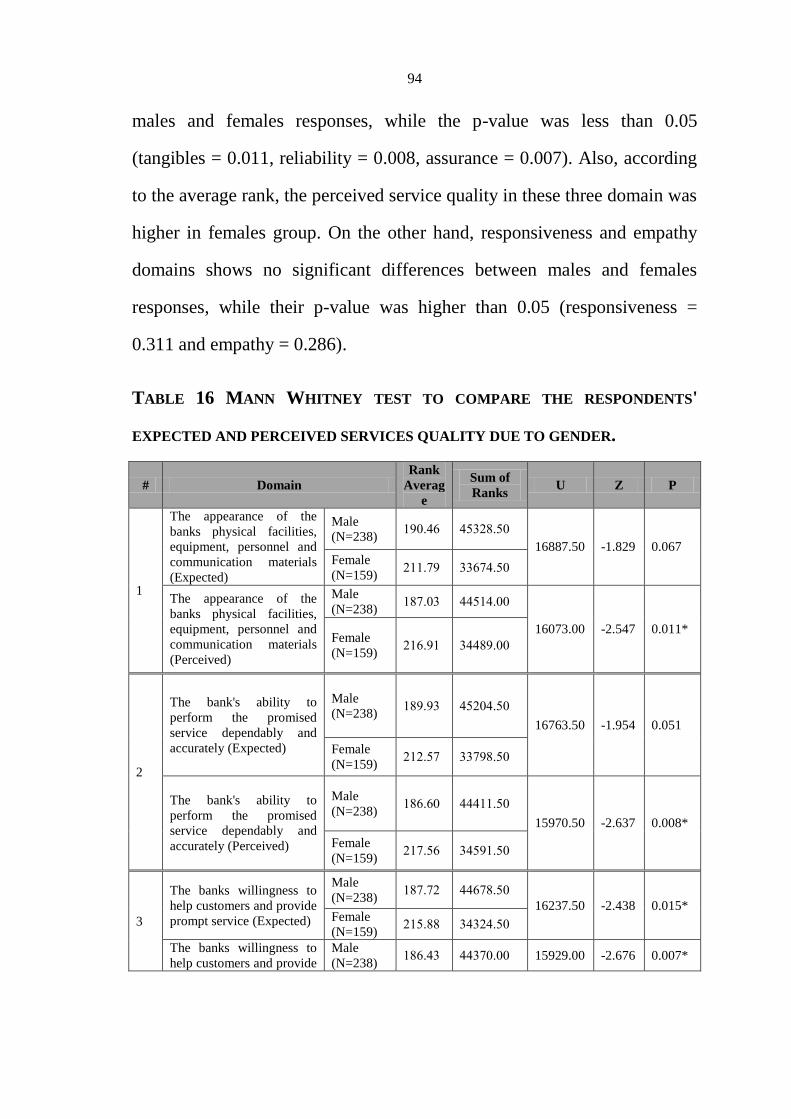
94
males and females responses, while the p-value was less than 0.05
(tangibles = 0.011, reliability = 0.008, assurance = 0.007). Also, according
to the average rank, the perceived service quality in these three domain was
higher in females group. On the other hand, responsiveness and empathy
domains shows no significant differences between males and females
responses, while their p-value was higher than 0.05 (responsiveness =
0.311 and empathy = 0.286).
TABLE 16 MANN WHITNEY TEST TO COMPARE THE RESPONDENTS'
EXPECTED AND PERCEIVED SERVICES QUALITY DUE TO GENDER.
# Domain
Rank
Averag
e
Sum of
Ranks U Z P
1
The appearance of the
banks physical facilities,
equipment, personnel and
communication materials
(Expected)
Male
(N=238) ..0995 92555920
16887.50 -1.829 0.067 Female
(N=159) 5..95. 55559920
The appearance of the
banks physical facilities,
equipment, personnel and
communication materials
(Perceived)
Male
(N=238) .55905 992.9900
16073.00 -2.547 0.011* Female
(N=159) 5.59.. 5995.900
2
The bank's ability to
perform the promised
service dependably and
accurately (Expected)
Male
(N=238) .5.9.5 92509920
16763.50 -1.954 0.051
Female
(N=159) 5.5925 555.5920
The bank's ability to
perform the promised
service dependably and
accurately (Perceived)
Male
(N=238) .55950 999..920
15970.50 -2.637 0.008*
Female
(N=159) 5.5925 592..920
3
The banks willingness to
help customers and provide
prompt service (Expected)
Male
(N=238) .55955 99555920
16237.50 -2.438 0.015* Female
(N=159) 5.2955 59559920
The banks willingness to
help customers and provide
Male
(N=238) .55995 99550900 15929.00 -2.676 0.007*

95
prompt service (Perceived) Female
(N=159) 5.5955 59555900
4
The knowledge and
courtesy of the bank's
employees and their ability
to convey trust and
confidence (Expected)
Male
(N=238) .5.95. 92.5.900
16728.00 -2.005 0.045* Female
(N=159) 5.595. 55559900
The knowledge and
courtesy of the bank's
employees and their ability
to convey trust and
confidence (Perceived)
Male
(N=238) ..9952 95550920
17789.50 -1.012 0.311 Female
(N=159) 5059.5 55555920
5
The caring individual
attention the bank provides
its customers (Expected)
Male
(N=238) ...9.. 92559900
17233.00 -1.519 0.129 Female
(N=159) 50.955 5555.900
The caring individual
attention the bank provides
its customers (Perceived)
Male
(N=238) ..59.. 95.55920
17727.50 -1.067 0.286 Female
(N=159) 50592. 55559920
Total degree (Expected)
Male
(N=238) 633821 55341844
16365.50 -2.283 0.022* Female
(N=159) 264842 05641844
Total degree (Perceived)
Male
(N=238) 632816 55146844
16210.00 -2.240 0.016* Female
(N=159) 261844 05042844
* Significant at ( 0.05).
4.4.3 Third Hypothesis: Testing difference between expected and
perceived service quality, due to number of years dealing with the
bank.
The researcher formulates two hypotheses for this test as they are shown
below:
: There is no significant difference between the expected and perceived
service quality due to the number of years dealing with the bank.
: There is a significant difference between the expected and perceived
service quality due to the number of years dealing with the bank.
96
In this hypothesis the researcher tried to find if there is an effect on number
of years that the respondent deals with a bank, and the level of expected
and perceived service quality offered by the bank. The questionnaire
contained three years intervals (1-4, 5-8 and more than 8 years). Hence
there were three groups. The Kruskal Wallis Test was performed to check
if there was a significant difference at 0.05 between the different groups
for both expected and perceived services. This test was repeated on the five
domains of the SERVQUAL model to indicate the weakness of each
domain alone, and the overall service quality provided by the Banks.
The test results listed in Table (17) showed that all domains p-value greater
than the significant level 0.05. Therefore, the null hypothesis was
accepted. In other words, there was no effect for the number of years
dealing with the bank on expected and perceived service quality.

97
TABLE 17: KRUSKAL WALLIS TEST TO COMPARE THE CUSTOMERS’
EXPECTED AND PERCEIVED SERVICES QUALITY DUE TO YEARS.
Domain Year Freq. Rank
Average D.F
Chi
Square Sig.*
The appearance of the banks
physical facilities, equipment,
personnel and communication
materials (Expected)
1-4 .55 ..095.
5 .952. 099.5 5-8 .55 ..59.5
More than 8 .52 505955
The appearance of the banks
physical facilities, equipment,
personnel and communication
materials (Perceived)
1-4 .55 ..0955
5 59225 09.5. 5-8 .55 ...955
More than 8 .52 5.990.
The bank's ability to perform the
promised service dependably and
accurately (Expected)
1-4 .55 ..099.
5 .995. 09950 5-8 .55 ...995
More than 8 .52 5059.5
The bank's ability to perform the
promised service dependably and
accurately (Perceived)
1-4 .55 ...9.9
5 .9025 092.0 5-8 .55 5009..
More than 8 .52 502905
The banks willingness to help
customers and provide prompt
service (Expected)
1-4 .55 .5995.
5 59555 09.92 5-8 .55 50.95.
More than 8 .52 5..955
The banks willingness to help
customers and provide prompt
service (Perceived)
1-4 .55 .55952
5 5995. 09.55 5-8 .55 ..5955
More than 8 .52 5.59.5
The knowledge and courtesy of the
bank's employees and their ability
to convey trust and confidence
(Expected)
1-4 .55 ...959
5 59559 09599 5-8 .55 ..5955
More than 8 .52 5.59..
The knowledge and courtesy of the
bank's employees and their ability
to convey trust and confidence
(Perceived)
1-4 .55 ...922
5 .9552 09255 5-8 .55 ..59..
More than 8 .52 505955
The caring individual attention the
bank provides its customers
(Expected)
1-4 .55 ...95.
5 .9995 09952 5-8 .55 ..5955
More than 8 .52 5059.2
The caring individual attention the
bank provides its customers
(Perceived)
1-4 .55 ..2955
5 .9555 0999. 5-8 .55 ...955
More than 8 .52 5059.5
Total degree (Expected)
1-4 601 633834
2 28515 48242 5-8 621 642852
More than
8 604 264816
Total degree (Perceived)
1-4 601 633842
2 28443 48205 5-8 621 644821
More than
8 604 262860
* Significant at ( 0.05)
98
4.4.4 Fourth Hypothesis: Testing the difference between expected and
perceived service quality due to Bank size.
The researcher formulates two hypotheses for this test as shown below:
: There is no significant difference between the expected and perceived
service quality due to the Bank size.
: There is a significant difference between the expected and perceived
service quality due to the Bank size.
The bank size was an important variable for this research, therefore this
hypothesis was formed to figure out if there is an effect of the bank size on
the level of expected and perceived service quality, from the respondents‟
point of view. The questionnaire contained twelve different commercial
banks. These banks were grouped into four different groups (see section
4.2.2). The Kruskal Wallis Test was performed to check if there was a
significant difference at 0.05 between the different groups for both
expected and perceived services. This test was repeated on the five
domains of the SERVQUAL model to indicate the weakness of each
domain alone, and the overall service quality offered to the respondents.
The test results listed in Table (18). Most domains showed a p-value
greater than the significant level 0.05. Therefore, the null hypothesis
was accepted. In other words, there was no significant difference of the
offered service quality level, due to the bank size as perceived by this
research respondents.
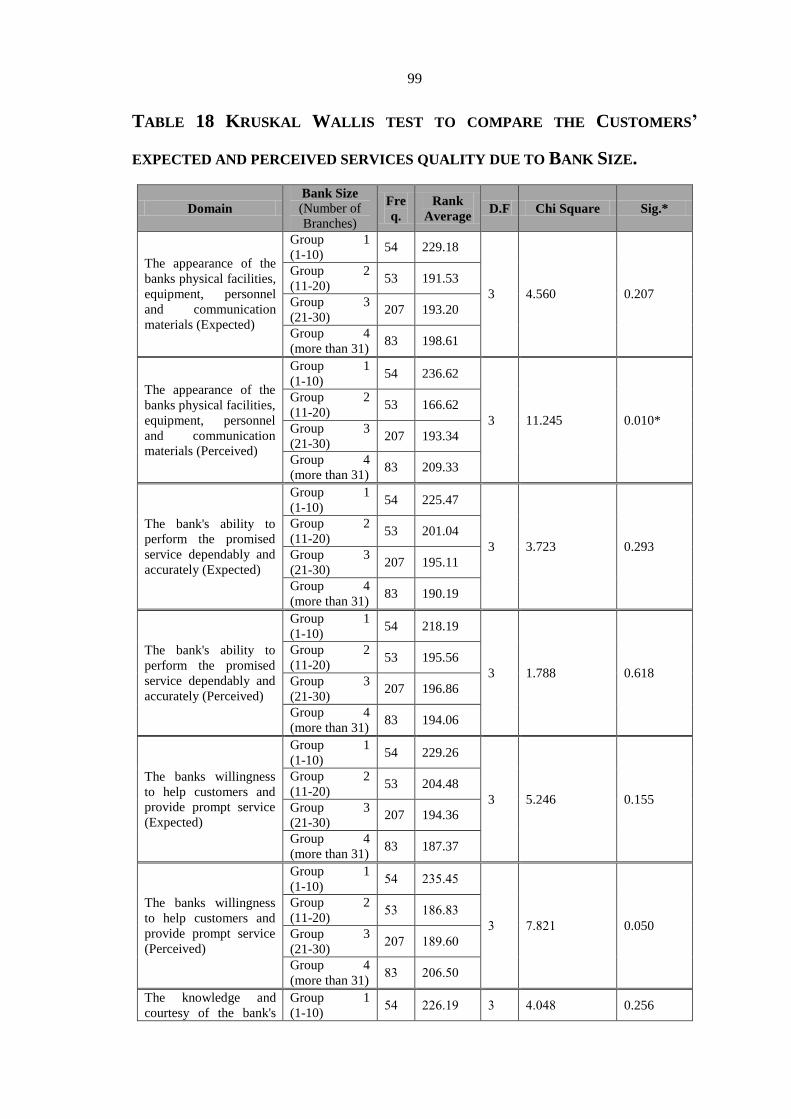
99
TABLE 18 KRUSKAL WALLIS TEST TO COMPARE THE CUSTOMERS’
EXPECTED AND PERCEIVED SERVICES QUALITY DUE TO BANK SIZE.
Domain
Bank Size
(Number of
Branches)
Fre
q.
Rank
Average D.F Chi Square Sig.*
The appearance of the
banks physical facilities,
equipment, personnel
and communication
materials (Expected)
Group 1
(1-10) 54 229.18
3 4.560 0.207
Group 2
(11-20) 53 191.53
Group 3
(21-30) 207 193.20
Group 4
(more than 31) 83 198.61
The appearance of the
banks physical facilities,
equipment, personnel
and communication
materials (Perceived)
Group 1
(1-10) 54 236.62
3 11.245 0.010*
Group 2
(11-20) 53 166.62
Group 3
(21-30) 207 193.34
Group 4
(more than 31) 83 209.33
The bank's ability to
perform the promised
service dependably and
accurately (Expected)
Group 1
(1-10) 54 225.47
3 3.723 0.293
Group 2
(11-20) 53 201.04
Group 3
(21-30) 207 195.11
Group 4
(more than 31) 83 190.19
The bank's ability to
perform the promised
service dependably and
accurately (Perceived)
Group 1
(1-10) 54 218.19
3 1.788 0.618
Group 2
(11-20) 53 195.56
Group 3
(21-30) 207 196.86
Group 4
(more than 31) 83 194.06
The banks willingness
to help customers and
provide prompt service
(Expected)
Group 1
(1-10) 54 229.26
3 5.246 0.155
Group 2
(11-20) 53 204.48
Group 3
(21-30) 207 194.36
Group 4
(more than 31) 83 187.37
The banks willingness
to help customers and
provide prompt service
(Perceived)
Group 1
(1-10) 29 552992
5 5955. 0.050
Group 2
(11-20) 25 .55955
Group 3
(21-30) 505 .5.950
Group 4
(more than 31) 55 505920
The knowledge and
courtesy of the bank's
Group 1
(1-10) 29 5559.. 5 99095 0.256
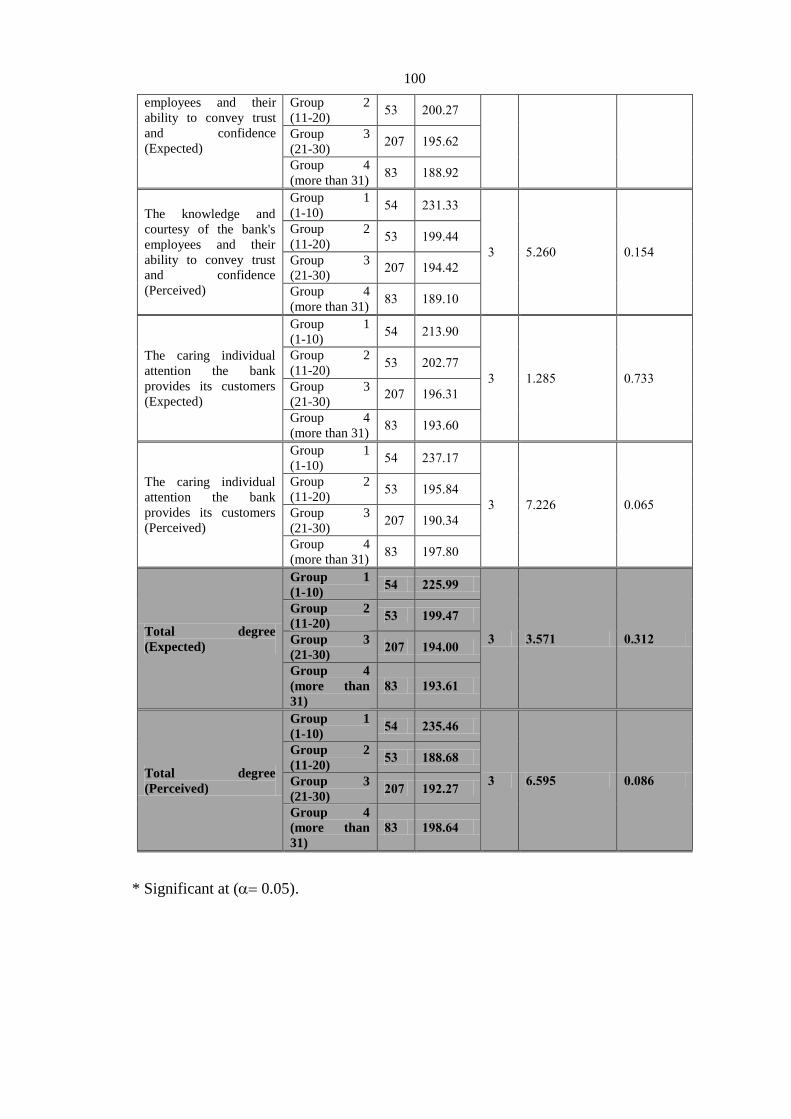
100
employees and their
ability to convey trust
and confidence
(Expected)
Group 2
(11-20) 25 500955
Group 3
(21-30) 505 ..2955
Group 4
(more than 31) 55 .559.5
The knowledge and
courtesy of the bank's
employees and their
ability to convey trust
and confidence
(Perceived)
Group 1
(1-10) 29 55.955
5 29550 09.29
Group 2
(11-20) 25 ...999
Group 3
(21-30) 505 ..9995
Group 4
(more than 31) 55 .5.9.0
The caring individual
attention the bank
provides its customers
(Expected)
Group 1
(1-10) 29 5.59.0
5 .9552 09555
Group 2
(11-20) 25 505955
Group 3
(21-30) 505 ..595.
Group 4
(more than 31) 55 ..5950
The caring individual
attention the bank
provides its customers
(Perceived)
Group 1
(1-10) 29 5559.5
5 59555 09052
Group 2
(11-20) 25 ..2959
Group 3
(21-30) 505 ..0959
Group 4
(more than 31) 55 ..5950
Total degree
(Expected)
Group 1
(1-10) 45 224844
0 08426 48062
Group 2
(11-20) 40 644852
Group 3
(21-30) 242 645844
Group 4
(more than
31)
30 640816
Total degree
(Perceived)
Group 1
(1-10) 45 204851
0 18444 48431
Group 2
(11-20) 40 633813
Group 3
(21-30) 242 642822
Group 4
(more than
31)
30 643815
* Significant at ( 0.05).
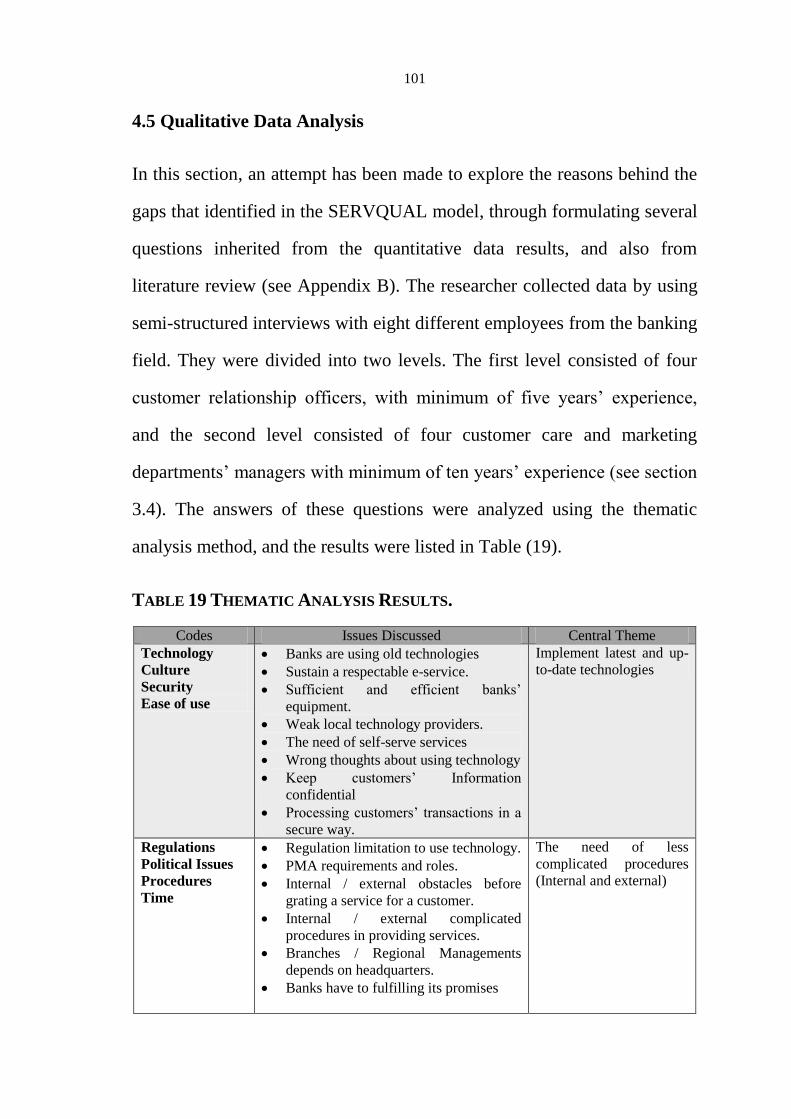
101
4.5 Qualitative Data Analysis
In this section, an attempt has been made to explore the reasons behind the
gaps that identified in the SERVQUAL model, through formulating several
questions inherited from the quantitative data results, and also from
literature review (see Appendix B). The researcher collected data by using
semi-structured interviews with eight different employees from the banking
field. They were divided into two levels. The first level consisted of four
customer relationship officers, with minimum of five years‟ experience,
and the second level consisted of four customer care and marketing
departments‟ managers with minimum of ten years‟ experience (see section
3.4). The answers of these questions were analyzed using the thematic
analysis method, and the results were listed in Table (19).
TABLE 19 THEMATIC ANALYSIS RESULTS.
Codes Issues Discussed Central Theme
Technology
Culture
Security
Ease of use
Banks are using old technologies
Sustain a respectable e-service.
Sufficient and efficient banks‟
equipment.
Weak local technology providers.
The need of self-serve services
Wrong thoughts about using technology
Keep customers‟ Information
confidential
Processing customers‟ transactions in a
secure way.
Implement latest and up-
to-date technologies
Regulations
Political Issues
Procedures
Time
Regulation limitation to use technology.
PMA requirements and roles.
Internal / external obstacles before
grating a service for a customer.
Internal / external complicated
procedures in providing services.
Branches / Regional Managements
depends on headquarters.
Banks have to fulfilling its promises
The need of less
complicated procedures
(Internal and external)
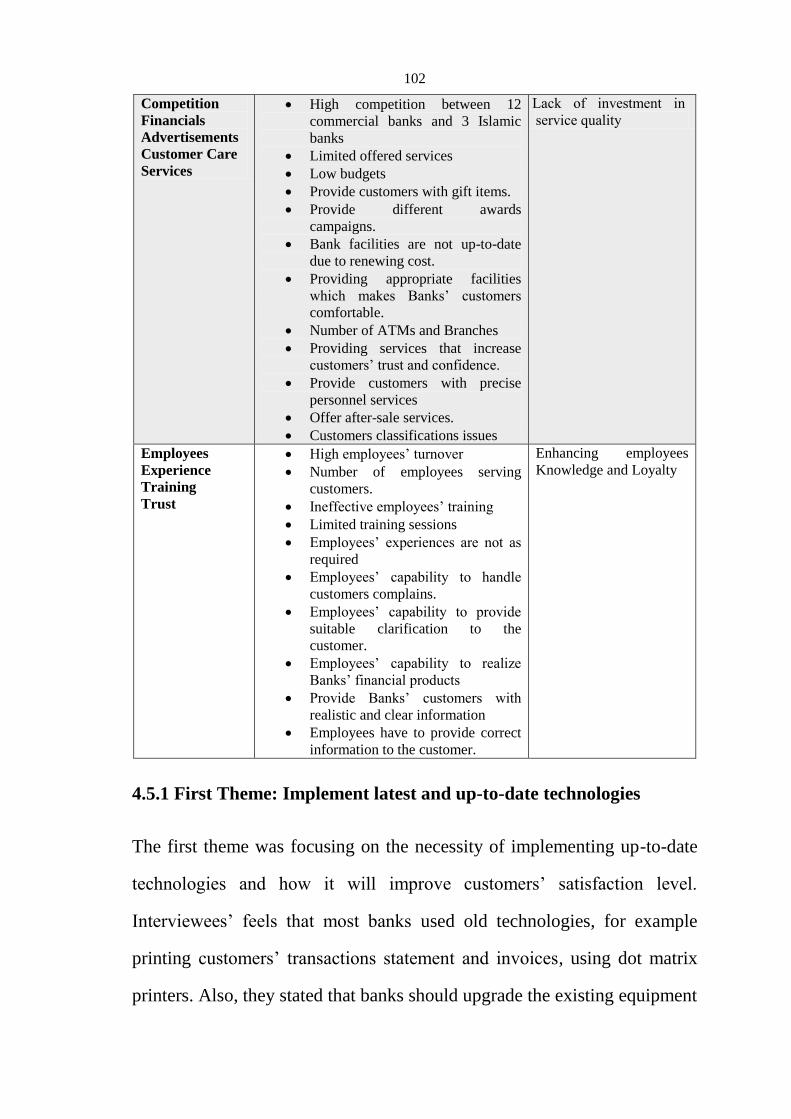
102
Competition
Financials
Advertisements
Customer Care
Services
High competition between 12
commercial banks and 3 Islamic
banks
Limited offered services
Low budgets
Provide customers with gift items.
Provide different awards
campaigns.
Bank facilities are not up-to-date
due to renewing cost.
Providing appropriate facilities
which makes Banks‟ customers
comfortable.
Number of ATMs and Branches
Providing services that increase
customers‟ trust and confidence.
Provide customers with precise
personnel services
Offer after-sale services.
Customers classifications issues
ni L deL vaitpe taeL vaL
ptiivitLecnvves
Employees
Experience
Training
Trust
High employees‟ turnover
Number of employees serving
customers.
Ineffective employees‟ training
Limited training sessions
Employees‟ experiences are not as
required
Employees‟ capability to handle
customers complains.
Employees‟ capability to provide
suitable clarification to the
customer.
Employees‟ capability to realize
Banks‟ financial products
Provide Banks‟ customers with
realistic and clear information
Employees have to provide correct
information to the customer.
Enhancing employees
Knowledge and Loyalty
4.5.1 First Theme: Implement latest and up-to-date technologies
The first theme was focusing on the necessity of implementing up-to-date
technologies and how it will improve customers‟ satisfaction level.
Interviewees‟ feels that most banks used old technologies, for example
printing customers‟ transactions statement and invoices, using dot matrix
printers. Also, they stated that banks should upgrade the existing equipment
103
to modern and efficient equipment such as: queuing machines, ATMs,
teller PCs, and currency rates board. Furthermore, interviewees‟ feels
wrong thoughts about using technologies when dealing with some
customers, these thoughts were limiting the optimal use of technology.
On the other hand, interviewees stated that many customers were looking
for self-serve services. These services would help banks‟ customers to
minimize their efforts when requesting a service and also save their time.
However, banks have to sustain a respectable e-services. Regardless, if the
provided services were electronic or not, interviewees agreed that
customers‟ satisfaction level would improve if banks sustained reliable
services, and also kept customers‟ information confidential. Moreover,
processing customers‟ transactions must be in a secure way to eliminate the
hacking possibilities. These elements will make banks‟ customers feels
secure when they use the bank services.
4.5.2 Second Theme: The need of less complicated procedures (Internal
and external)
The second theme was dealing with complications that may face the bank
decision makers, which affects service quality levels. The interviewees
divided the barriers into two groups, internal and external barriers. Internal
barriers, have the greatest effect on customers‟ satisfaction level, since it
could be enhanced or even eliminated. While, external barriers were
uncontrollable by banks, and also, customers will face same external
barriers with all Palestinian banks.
104
The Palestine Monetary Authority (PMA) is the emerging central bank of
Palestine. It is the official party that forms general banks regulations.
However, there were some limitations of using the latest technologies to
facilitate retrieving needed services for the customers, for example till now
digital signature was not officially approved by PMA. Moreover, there
were other PMA requirements that prevent serving customer on spot
without an interaction from Bank employee, such as the need of making
inquiry with PMA system before granting loan or cheque book for a
customer. Another external barrier is the political issues in Palestine, these
issues prevents Palestinian service providers from importing needed
technologies such as 4G (or higher) technology on the mobile network,
which if exists, it will provide many different of services.
On the other hand, internal barriers have major effect on customers‟
satisfaction, while these barriers could be reduced to the minimum. Eight
out of the twelve commercial banks are foreign banks. Hence, they have
regional management inside Palestine and Headquarter outside Palestine.
Service creation is centralized in most of the Palestinian banks, so the
authority will be in banks‟ regional management or headquarter, and in
both cases the branch who deals with the customer will wait until get the
needed approvals, which could take days. Additionally, banks have to
fulfill its promises to customers in the specified date, but with the
centralization issue it will be hard to achieve this goal.
105
However, internal and external barriers have a common problem, which is
complicated procedures when providing a service. These complications,
resulted from long workflow placed long time ago without continuously
reviewing and improving it. Sometimes, an obstacle face an employee who
works on granting a service, such as approval on account overdraft, and so,
delivery of the needed service will be delayed, which impacts service
quality level in a negative way.
4.5.3 Third Theme: y nl uq cneimasina cn misecni fo kcaL
The aim of the third theme was highlighting financial roles in improving
service quality level. The existence of twelve commercial banks and three
Islamic banks makes the banking sector very competitive inside Palestine.
However, offered services still limited to basic services, especially when
comparing with banking sector worldwide. Interviewees feels that by
providing new services that increase customers‟ trust and confidence, and
also, offering different awards campaigns regularly will improve
customers‟ satisfaction which certainly will improve service quality level.
Furthermore, some interviewees stated that providing customers with
precise personnel services for example VIP services, plays an important
role in competing with other banks. Some banks classifying their customers
differently due to customers‟: salary, account balance for specific period,
account depositing frequency or other methods. However, some complains
were raised to quality managers due to these classifications, while less
priority customers have to wait for longer time than VIP customers, which
increases the chance for competing banks to attract complaining customers.
106
Therefore, banks must offer after-sale services to check if the offered
service fits all of its customers and satisfied them.
An interviewee stated that “competing other banks is not easy, banks have
to invest more on marketing”. The majority of interviewees agreed that
banks are not investing properly on enhancing their service quality, while
limited budget is insufficient for competing other banks. In addition,
customers need to locate banks‟ branches and ATMs easily and
everywhere. When the bank spreads its‟ branches and ATMs widely, they
will attract more customers. Yet, spreading banks‟ branches and ATMs is
very costly. Thus, branches and ATMs locations must be studied carefully
to satisfy as many customers as possible. Moreover, renewing banks
facilities that makes banks‟ customers comfortable such as: air conditions,
and comfortable seats, will provide a positive impact to banks‟ service
quality. And also, this issue is limited because of low budgets.
Additionally, interviewees agreed that, the majority of banks‟ customers
satisfaction level increased when branches employees provides them with
gift items, it is cheap and effective, but still, these items needs an extra
cost.
107
4.5.4 Fourth Theme: Enhancing employees Knowledge and Loyalty
The last theme was concentrating on bank employees as a success key
factor. Employees plays an important role in improving bank service
quality level, by enhancing customers‟ satisfaction level. Customers are
looking to be served accurately and in the shortest period, and to reach such
goal, banks have to increase number of employees serving their customers,
and also, improve employees‟ knowledge, especially employees who have
direct contact with customers. This knowledge could be summarized in
employees‟ capability to provide suitable clarification to the customer, and
provide them with realistic and clear information about the needed service.
Also, employees have to realize banks‟ financial products and convince
customers about these products, taking into consideration to provide the
customers with correct related information. Moreover, bank employees
should have the needed capabilities to handle customers complains.
Some interviewees stated that number of employees in Palestinian banking
sector is relatively small. Consequently, number of experienced employees
is very small, in addition to the high salaries they got. So, when a bank
wants to hire new employee, they may have to pay a lot for an employee
with good experience, moreover, they have to convince this employee with
the offered position benefits. Otherwise, banks could hire fresh or average
experienced employee. This type of employees needs a lot of effective
training sessions, in order to enhance their experiences. Moreover, training
sessions must be held regularly to keep banks employees up-to-date.

108
On the other hand, some interviewees stated that employees‟ turnover is
very high. And it is a critical issue for banks, while all investments on such
employees were wasted. Therefore, banks have to minimize this issue by
enhancing employees‟ loyalty. However, employees‟ turn over affect
customers‟ comfortability, while some customer‟s feels very comfortable
when dealing with an employee, due to the trust that employee built
between him and the customer.
109
Chapter Five
Discussion
5.1 Overview
In this chapter, the researcher will discuss the research results, by
combining quantitative and qualitative results for each variable. In addition,
the researcher will compare and contrast this research results with previous
studies from literature. And at the end of this chapter, the researcher will
propose a managerial model that could help in improving service quality of
conventional banks.
5.2 Reliability Domain
Another domain of SERVQUAL model was reliability. This domain means
that banks have to accomplish promised services in an accurate and
dependable way. Additionally, banks‟ performance must consist on the
highest standard. As well, Gronroos (2007) stated that reliability is
connected to performance.
The reliability domain gap was calculated and it was (-0.91). This result
was confirmed with other researches results (Kabir and Carlsson, 2010;
Okoe, 2013). While Eleboda (2014) research results showed that reliability
have the largest gap between SERVQUAL domains. However, Ilyas et al.
(2013) didn‟t confirm this result while reliability domain gap in their
research was positive which indicates that perceived reliability exceeds the
expectations. Moreover, Shanka (2012) research results found that banks
110
were good in reliability. However, the weighted gap was (-0.29) for this
domain which is the largest one, therefore, it is the most important domain
between the five domains.
The researcher investigated the reasons behind this gap deeply. The
quantitative data analysis results related to customer dependency on bank
promises were negative. Therefore, customers couldn‟t depend on banks
promises when requesting a service. The research results showed that
services delivery time is very sensitive for the customer, for example when
requesting a cheque book or even a credit card. Moreover, interview results
showed that customers were looking to be served accurately in the shortest
period (see interviews results in section 4.5.4). This goal could be reached
by expanding banks staff in order to minimize the waiting time for the
customers, or even by offering a variety of electronic services (see
interviews results in section 4.5.1). Furthermore, todays‟ customers are
looking for self-serve services that allows them to get the required service
without any interaction form bank employees, therefore, no need to reach
banks branches and wait until get the needed services. Still, banks‟ service
developers were aware about this need, but due to wrong thoughts from
number of customers about using technologies, they were very careful in
offering self-serve services, while these thoughts were limiting the optimal
use of these services. This result was confirmed with Kumar et al. (2009),
while they stated that customers‟ still performing their requests through the
traditional ways by using banks branches and ATMs, regardless to the
availability of latest technologies. Additionally, such services need to
111
implement the latest technologies. However, there were some limitations
from PMA to use these technologies, in addition to lack of regulations that
allows dealing officially with these technologies, for example: digital
signature till now was not approved (see interviews results in section
4.5.2). Furthermore, the political issues in Palestine form additional barrier
that prevents service providers from importing needed technologies, such
as 3G service on the mobile network (Paltel Group, 2015). Similar
technologies could lead to major changes in the banking sector and service
sector in general.
In addition, banks showed some weaknesses in customer problem solving
mechanism. Interviewees stated that many complaints were raised to
quality managers in a daily basis, some banks are not interested in these
complains (see interviews results in section 4.5.3), for example: some
banks classified their customers as regular and VIP. Therefore, VIP
customers don‟t have to wait when requesting a service, so when they need
a service, they will pass regular customers who were waiting to be served.
Such service creates major complains for regular customers, and so, some
banks didn‟t care about these regular customers. Consequently, the chance
for competitor banks increases to attract complaining customer. Also, some
customers‟ complains are not raised to quality managers, instead of that,
branches employees have to resolve it immediately, to avoid losing
complaining customer. Yet, banks should improve their employees
capabilities to handle customer complains (see interviews results in section
4.5.4).
112
However, customers‟ satisfaction level was relatively high regarding to
error free records. Such results indicates that customers don‟t want any
error in their records, while any error could impact their accounts in a way
or another. But still, customers‟ showed dissatisfaction about the delivered
services, which indicates a weakness in employees‟ knowledge. Therefore,
when banks provides expert employees to their customers, those employees
who can get error free and on time services to the customers as promised,
then customers‟ satisfaction level will be enhanced, which will produce a
positive word of mouth to others about this bank, then the potential of
attraction new customers will increase. Moreover, Hinson et al. (2006)
supported this idea, while they stated that high service quality level will
attract new customers, while current customers will spread a positive word
of mouth. In addition, Aborampah (2010) stated that reliable banks have
two advantages, the first one is building confidence of current customers,
and the second advantage is attracting new customers.
5.3 Responsiveness Domain
Responsiveness domain represented quick assistant to customers, which
means helping banks‟ customers and provide them with prompt
attentiveness, not in emergency cases only, but in everyday requests. This
domain is connected to banks‟ performance (Gronroos 2007).
The research results showed customers‟ dissatisfaction from responsiveness
domain in the banks. This dissatisfaction was indicated by calculating the
gap between customers‟ expectations and perceptions, and it was negative
113
(-0.89). Moreover, this result was confirmed by previous studies (Ananth el
al., 2011; Shanka, 2012; Okoe, 2013). In addition, Ravichandran et al
(2010) found that responsiveness is the only domain that was related to
customers‟ satisfaction. On the other hand, this result didn‟t confirm with
Alkarim and Chowdhury (2014) research results, which placed
responsiveness in the first place of dissatisfaction between all of
SERVQUAL domains. However, the researcher calculated the weighted
gap for this domain and it was (-0.20), which place it in the second place of
importance after the reliability domain.
However, this result puts responsiveness domain in third place of
customers‟ dissatisfaction about the overall service quality satisfaction
level. This result highlighted an important problem about customers‟
confidence and trust of their banks. Interviews results illustrated possible
reasons for this problem (see interviews results in section 4.5.4). One of
these reasons was due to employees‟ insufficient knowledge, especially
employees who have direct contact with customers. This knowledge could
be summarized in employees‟ capability to provide suitable clarification to
the customer. And so, if this knowledge is insufficient, then employees will
not understand customers‟ needs, and they will ask for additional help from
other employees. As a result of such behavior, customers‟ confidence about
banks‟ employees will decrease. Hinson et al. (2011) confirmed this result
and stated that banks should consider employees training as a critical factor
to improve their knowledge, in order to ensure delivering services
successfully, which in turn will improve customers‟ confidence.
114
Additionally, another reason for customers‟ confidence and trust problem is
customers‟ fear of data leakage outside their bank. Consequently, banks
should ensure to their customers that data is protected well. This result was
supported by Lau et al. (2013), they emphasize on the necessity of
protecting customers data from being exposed to marketers. Additionally,
building confidence with customers is important to share their significant
information and thought about repurchasing.
Moreover, employees‟ loyalty plays an important role in this problem,
while regular dealing with same employees creates a kind of comfortable
atmosphere to the customers, this atmosphere builds trust between
customers and the employees serving them. Therefore, employees‟
turnover affects customers‟ comfortability, which indeed affects their trust
about new employees. And so, by enhancing employees‟ loyalty, their
turnover will decrease, and that will sustain a comfortable atmosphere for
the customers, which in turn will sustain a high level of customer trust and
confidence of the bank. Shanka (2012) stated that banks should honor
employees that were providing customers with quality services, and were
appreciated from customers, with special rewards, in order to improve their
loyalty.
Interviews results support the idea of offering new services, that increase
customers‟ trust and confidence (see interviews results in section 4.5.3).
Moreover, these services must use high security features, in order to
process customers‟ transactions securely and to minimize the hacking
possibilities. Furthermore, banks services must keep customers‟
115
information confidential (see interviews results in section 4.5.1). Ganguli
and Roy (2010) stated that customers‟ behaviors are changing due to
implementing new technologies in the banks to accelerate service delivery,
and also banks should enhance customers‟ confidence to encourage them to
accept new electronic service delivery channels.
5.4 Assurance Domain
Assurance domain is related to features that diffuse customer confidence.
Therefore, banks‟ customers must feel that banks‟ employees are the
experts of the provided services. Gronroos (2007) stated that assurance is
another SERVQUAL model domain connected to functional quality.
However, the results showed customers were dissatisfied with this domain,
and it was statistically proved that there is a significant difference between
expected and perceived assurance domain items, which illustrates
customers‟ dissatisfaction.
Assurance domain gap was calculated for this domain and it was (-0.91),
this result supported by previous research result by Ilyas et al. (2013).
Furthermore, Shanka (2012) research results found that banks were good in
assurance. However, the weighted gap for this domain was calculated and it
was (-0.17), which place it in the third place of importance after the
responsiveness domain.
116
In addition, this research results showed that customers were dissatisfied in
employees‟ availability to help them. In fact, this result occurred due large
number of customers compared to the number of employees serving their
requests. However, banks normally depend on serving their customers to
survive in the competitive market, but when banks‟ employees are always
busy to respond to customers‟ requests, then as a normal reaction,
customers will start searching for other competitor who responds to their
requests, and also, they will spread a negative word-of-mouth about this
bank, which may lead to a significant loss in the bank profit. This result
was supported in Mohsan et al. (2011) research, while dissatisfied customer
could badly affect the business more than ten satisfied customers. Also,
Kumar et al. (2010) confirmed that banks which care about their service
quality could compete in retaining their customers, and improving banks‟
revenue.
Additionally, customers were dissatisfied about not providing them with
promoted service, and inaccurate service delivery date. Nevertheless, two
reasons might be behind this issue, the first one because of the insufficient
employees‟ knowledge, so customers have to wait until employees get the
needed information about the requested service, or the employee might
provide the customer with inaccurate period for delivering the needed
service (see interviews results in section 4.5.4). Moreover, Quyet et al.
(2015) stated that banks employees should understand the depth of the
banks products, in order to appropriately advise their customers. The
second reason of this issue, is due to long procedures adopted by banks‟ top
117
management, or even from PMA (see interviews results in section 4.5.2).
Furthermore, most banks in Palestine are using centralized services
generation methods, which moves the authority of granting a service from
branches to banks‟ regional managements of headquarters. Then, branches
have to wait until get the needed approvals, and get back to its‟ customer.
In spite of centralization advantages, it could lead to time wasting.
Therefore, these procedures must be refined, in order to avoid any delay in
delivering the needed services to the customers. In addition, external issues
may affect service delivery such as some of PMA requirements. However,
internal complicated workflow placed long time ago have greater impact on
service delivery than external issues. Consequently, banks have to
continuously review and improve its internal procedures in order to fulfill
its promises of service delivering to customers in the specified date.
Moreover, banks‟ employees have to provide their customers with kind and
warm responses, when offering a service, which will lead to improve
customer confidence. This result was supported by Quyet et al. (2015) and
Kumar et al. (2010).
5.5 Empathy Domain
Empathy domain is one of SERVQUAL model domains. It is associated to
available personal provided from the bank who help customers and take
care of them, in addition to understand the customers‟ needs in the proper
manner. Furthermore, Gronroos (2007), stated that this domain is
118
connected to firm functional quality, which was described by the way
employee presents a service to the customer.
Additionally, the results showed that empathy domain have the largest gap
(-1.02) between all SERVQUAL domains. This result confirmed with
previous researches results (Ilyas et al., 2013; Ananth el al., 2011; Shanka,
2012). On the other hand, Eleboda (2014) research result showed that
empathy domain has the smallest gap between all SERVQUAL domains. In
addition, the weighted gap for this domain was calculated and it was (-
0.16), which place it in the fourth place of importance after the assurance
domain.
However, banks have to look after this domain, and to do so, the researcher
investigated deeply inside it. Therefore, the researcher checked empathy
domain items, and one of these items was the most important for the
customers, which is banks‟ operating hours, and it was obvious that
customers were dissatisfied with it. But banks inside Palestine were
committed to PMA instructions, which determines banks operating hours
(from 8:30 am until 2:30 pm). Furthermore, majority of banks‟ customers
are employees, and in the specified period they will be at their offices, so
they will be unable to reach banks‟ branches or offices. Consequently,
respondents were expecting appropriate working hours. In addition to
provide banks‟ customers with alternative solutions, that could increase
their satisfaction level. Such solutions could be reached by offering
different electronic services that allow customers to perform most of their
needs without existing inside banks‟ branches, for example: direct
119
depositing using ATMs, or money transfer for other customers using
Mobile or Internet banking. Moreover, Okoe et al. (2013) confirmed that
banks should improve their services accessibility. This result was also
supported by Hinson et al. (2006), they stated that banks have to offer
many services and not only the basics in order to compete other banks.
Also, customers were dissatisfied due to employees‟ related problems,
such as: weakness in understanding customers‟ specific needs, and
employees were unable to provide them with precise personnel services.
Interviews results showed weakness in banks‟ employees‟ knowledge, and
inappropriate customer care level (see interviews results in section 4.5.4).
This result was supported with Aborampah (2010) research results. He
stated that banks have to be thoughtful about their customers‟ financial
circumstances, and so banks have to offer special services to their
customers. Moreover, Ehigie (2006) stated that recognizing and satisfying
customers‟ needs, is essential to enhance banks services, since banks could
distinguish themselves from competitors by their own offered services. In
addition, Malhotra and Mukherjee (2004), confirmed this result. They
stated that customers‟ needs always change, so recognizing these needs
and implementing latest technologies is very critical for a bank to compete
other banks.
Furthermore, employees‟ weaknesses were due to their slight experience,
and ineffective customer care training courses. Therefore, banks‟ must
improve their employees‟ customer care behavior continuously, especially
for employees who have direct contact with customers. Normally, this
120
problem occurs with fresh employees, while needed skills still not
transferred to them completely. The researcher thought about two choices
to avoid this problem: first by hiring experienced employees, and these
employees have the needed skills to deal with customers and their needs.
Or the second choice was arranging regular training courses for fresh
employees. Nonetheless, both solutions are costly, while experienced
employees‟ salaries are high, and arranging training courses needs
experienced trainees and banks have to pay a lot for them. This result was
supported by Quyet et al. (2015), while they stated that banks should
minimize the gap between them and their customers, by improving their
employees‟ professional skills. And also, Shanka (2012) supported this
result and stated that banks should train and improve their employees‟
skills continuously, in order to provide caring for their customers, and
deliver services quickly. Furthermore, inappropriate customer care may
lead to many problems with banks‟ customers, one of them is creating bad
feelings toward the bank, and then customers will see their bank as an
organization that is not interested in their needs. For that reason, some
interviewees were aware about this point (see interviews results in section
4.5.3), and they confirmed the need of precise personnel services, in
addition to provide them with gift items, in order to improve customer care
level, to gain a competitive advantage in the market. This result was
supported with previous research, according to Ndubisi (2006), reaching
customers‟ satisfaction could be done by offering precise personnel
services that is flexible and adjustable in its nature, to suit customers‟
121
needs. However, interviewees stated that gift items considered as
additional cost to the bank, and due to limited budgets, this feature is not
available in most banks.
Further, interviews results added another related problem, which is low
level of employees‟ loyalty (see interviews results in section 4.5.4), also it
may lead to employees‟ resigns. Therefore, all investments (investments in
time and knowledge) on resigned employees were wasted. Moreover,
employees‟ loyalty problem maybe reflected on the bank image. In the
same vain, Hinson et al. (2006) stated that by offering high service quality,
employees‟ turnover will decrease.
5.6 Tangibles Domain
The last domain of SERVQUAL model is Tangibles, it represents the
physical appearance for objects, including staff appearances, attractive
advertisement billboards, and physical facilities. These elements are
essential for producing a comfortable atmosphere. Also, Gronroos (2007)
stated that this domain could be connected to functional quality.
Bank managers could evaluate and enhance this domain without asking
their customers about it. Consequently, the calculated gap (-0.61), and it
was the smallest one between all SERVQUAL domains. Moreover, this
result confirmed with Alkarim and Chowdhury (2014). And also, Shanka
(2012) and Okoe et al. (2013) found that banks were relatively doing well
on tangible domain. However, the weighted gap for this domain was
122
calculated and it was (-0.06), which place it in the last place of importance
after the empathy domain.
Additionally, most banks‟ quality managers were reviewing and evaluating
this domain elements regularly. Yet, banks have to enhance some of this
domains elements, banks‟ equipment must look modern to give banks‟
customers the feeling that they are dealing with civilized bank. While some
banks still use old technologies, such as: dot matrix printers, which are
used to print customers‟ invoices. Moreover, banks should upgrade their
existing equipment to modern and efficient equipment (see interviews
results in section 4.5.1). And also banks have to develop the attractiveness
of their physical features, by renewing banks‟ facilities that make banks‟
customers comfortable. However, limited budgets prevent banks from
upgrading and renewing their facilities and equipment easily (see
interviews results in section 4.5.3).
5.7 Independent variables
The researcher tested the gender effect on all service quality domains, and
the results showed that there is a significant difference between expected
and perceived service quality due to respondents‟ gender, which means that
both males and females were not satisfied, while each gender has its own
perceptions and expectations, and normally they were not at the same level.
Moreover, females group were expecting and perceiving a higher level of
service quality than males. The researcher thought that due to the nature of
females, they always looking for highest possible level of service quality.
123
This result was supported by Quyet et al. (2015) in their research, while
they stated that service quality standards are higher in females‟ customers‟
than males‟ customers. However, Ilyas et al. (2013) stated that there is a
difference in perceived service quality due to customers‟ gender.
In addition, the researcher checked the effect of number of years dealing
with the bank. The results showed that this variable didn‟t have any effect
on customers‟ perceived and expected service quality domains. Normally,
the length of dealing with the bank represents the relationship strength
between banks and their customers. However, the results indicated bad
experiences, related to all service quality domains regardless, if customer
was new with this bank or not.
Another test was performed concerning to service quality domains, was
about the effect of the bank size (number of bank branches and offices).
The results didn‟t show any effect of bank size on most of service quality
domains (empathy, assurance, reliability and responsiveness), while it has
an effect only on perceived tangibles domain. Usually, customers prefer
banks that are widespread, in order to reach their accounts easily.
Nevertheless, customers have the same feeling about this domain without
paying attention to the bank size, which forms a big problem for most
banks, while an important strategic goals for spreading the bank widely is
to serve their customers and make the bank reach easily. But this was not
the result appeared in this research.
124
5.8 Managerial Model
The researcher developed a managerial model that could help service
managers to improve their customers‟ satisfaction levels by enhancing their
service quality. This model used the power of both qualitative and
quantitative data. Therefore, it is based on SERVQUAL model and
employees knowledge in order to enhance customers‟ satisfaction level.
Figure (17) shows this model.
This model starts with top management involvement, which is vital to
improve banks‟ service quality successfully. Top management have the
power to force all departments to participate in changing current service
quality level. And also, monitor improvement process and provide
resources and support, they needed. Top management will interact directly
with strategic planning functions. In some banks this function could be
represented as a separate department. This party should provide feedback to
the top of the management and interact with middle management.
Strategic planning function is considered as the main function in
organizational orientation section of this model. Also, it has three sub
functions that all are interrelated. The first sub function is capacity
building, which is normally a human resource department job. This model
suggested to start with banks‟ employees. While banks‟ employees are
banks‟ interface, and service quality depends mainly on how employees
deliver services to customers. However, capacity building is very critical,
and it must be checked regularly in order to enhance if it needed.
125
One of the capacity building function is staff expansion, while numbers of
offered services and customers in banking sector are growing, therefore,
human resource department should check bank staff size, because when a
customer needs a service, he/she will wait in a queue until a free employee
responds to his/her request. Therefore, service quality managers have to
check customers‟ queue waiting time and if it is long, they have to
feedback to human resource department, in order to provide them with
additional resources to serve more customers‟ request, in the minimum
possible time. Moreover, employees‟ training is another important function
of capacity building, and it could be separated into two types of training.
The first one is employees‟ knowledge training. The expected result of this
training is to ensure that the employee have to know banks‟ procedures,
services, boundaries, PMA instructions, and country regulations accurately,
in order to provide customers with accurate answers about their requests.
According to Jun et al. (2006) training is the way to extend employees‟
knowledge and reach individual development. The second type of training
is employees‟ professional skills improvement. These skills allow
employee to absorb customers‟ complains and provide them with kind and
warm responses, in order to create comfortable feelings toward the bank.
Moreover, employees‟ training will lead to loyal employees. And also,
employees‟ motivation plays important role in developing employees‟
loyalty. According to Turkyilmaz et al. (2011) research results, there are
five factors effect on employees‟ loyalty, respectively: training and
personnel development, working conditions, reward and recognition,
126
empowerment, participation and teamwork. Moreover, by enhancing these
factors, banks will create loyal employees. Therefore, loyal employee will
not easily resign from a bank, and so, all investments on this employee
won‟t be wasted. In addition, this employee will strive to reflect a good
image of the bank. Employee‟s loyalty improvements are very essential in
improving customers‟ satisfaction. Acheampong and Asamoah (2013)
explained, that links between employees‟ loyalty and customers‟
satisfaction as: „Profit and growth, stimulated by customer satisfaction and
loyalty which results from employee satisfaction and loyalty‟. Therefore,
capacity building will improve two service quality domains: empathy and
assurance.
Another function of strategic planning is infrastructure enhancement, which
should improve two of service quality domains: tangibility and reliability.
This could be done by improving current information technology hardware
and software. These improvements should build robust base for offering
new services, and creating different ways to deliver services to customers.
Furthermore, banks should improve their offered services. Moreover, banks
have to distinguish themselves by offering outstanding services. And to
achieve this goal, electronic services concept should be implemented,
because customers today tend to perform regular services by themselves.
For example, banks should spread multifunctional ATMs that allow
customers to withdrawal, deposit, printing account statement, and printing
cheque book. In the same time, banks should offer different electronic
services, while allow customers to perform all possible requests using
127
mobile, internet or even ATMs. Moreover, electronic services should
implement the highest security levels to protect customers data from any
leakage could occurred. However, to build such infrastructure, appropriate
employees should be available. Therefore, a direct interaction between
infrastructure enhancement and capacity building function must be
established.
Strategic planning has another key function, which is competition follow-
up. Banking sector is very competitive. So, banks should scan local market
and compare their offered services with other banks‟ services, and try to
offer better services than others. In addition, banks should check worldwide
services, and implement the applicable services, while sometimes not all
services could be implemented. Furthermore, to gain a competitive
advantage, innovative services must be implemented, these services will
make the bank a market leader, and so, improve banks‟ profit. Therefore, a
direct link with capacity building and infrastructure enhancement functions
must be established to interact together quickly, to gain a competitive
advantages by implementing outstanding services.
The second section of this model concern process orientation, which is
represented in procedures enhancement function. This function is directly
monitored by strategic planning function, while improving procedures,
starts with business procedures reengineering and simplification, by
looking deeply into banks‟ internal procedures which affect service
delivery time, which is precious for customers, and so, banks should
minimize service delivery time to the minimum, by checking each process
128
in the procedures and eliminate unnecessary processes, or using electronic
systems that saves efforts and time such as workflow systems. Such
systems minimize wasted time in moving papers from one to another
employee. Also, updating employees‟ knowledge of new enhanced
procedures is a vital success to take the advantage from these procedures.
Moreover, some internal procedures were developed long time ago.
Therefore, reviewing and improving procedures continuously is very
essential to sustain effective internal procedures. Besides, when service
delivery time is minimized, responsiveness domain of service quality will
be improved.
As an output of this model enhancements, all the service quality domains
were improved. For that reason, customers‟ satisfaction should be
improved. Furthermore, monitoring customers‟ satisfaction regularly is the
most important function of strategic planning functions. However, caring
about customers‟ feedback of service quality, allows strategic planning to
review and enhance weak functions of this model, and to use it as the way
to sustain loyal customers.
The previous model was presented to three senior experts in banking sector
(see Appendix C) to verify and provide their feedback about it. These
experts look at this model and understand it by asking the researcher some
questions, then they added innovation function to compete other banks.
And also, they added procedures simplification when enhancing
procedures, which minimize service delivery time.
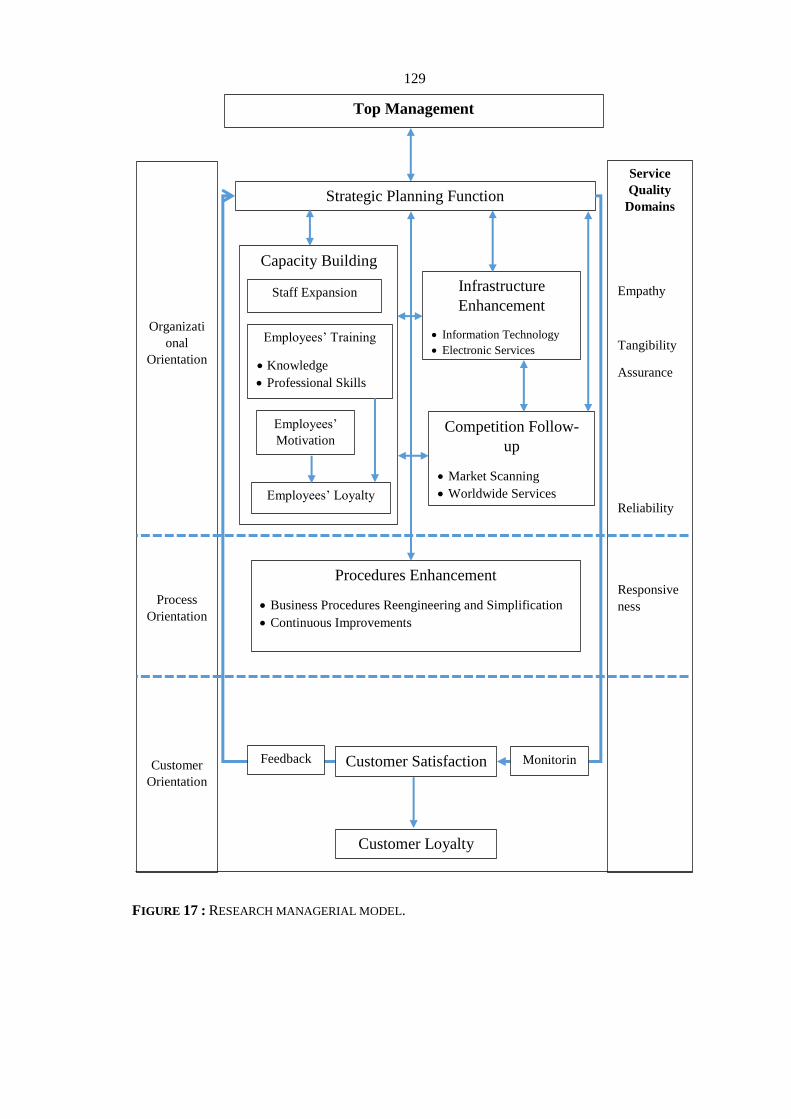
129
FIGURE 17 : RESEARCH MANAGERIAL MODEL.
Top Management
Capacity Building
Competition Follow-
up
Market Scanning
Worldwide Services
Innovative Services
Infrastructure
Enhancement
Information Technology
Electronic Services
Procedures Enhancement
Business Procedures Reengineering and Simplification
Continuous Improvements
E svdsttp’L dsnves
Service
Quality
Domains
Empathy
Tangibility
Assurance
Reliability
Responsive
ness
Strategic Planning Function
Staff Expansion
Customer Satisfaction
Organizati
onal
Orientation
Process
Orientation
Customer
Orientation
Customer Loyalty
E svdsttp’LTinvavag
Knowledge
Professional Skills
Feedback
E svdsttp’L
Motivation
Monitorin
g
130
Chapter Six
Conclusions and Recommendations
6.1 Overview
This chapter will present research conclusions and recommendation in
order to improve service quality in Palestinian conventional banks. And
also, the researcher will suggest future studies to provide research direction
for future researchers, in order to explore and build upon this research.
6.2 Conclusions
This research assessed service quality in conventional banks inside
Palestine, mainly by calculating the gap between expected and perceived
service quality, using SERVQUAL model. Also, the researcher tried to find
if there was an effect of three independent variables (customers‟ gender,
number of years dealing with bank and bank size) on perceived and
expected service quality. Moreover, the researcher supported the
quantitative results by performing several semi structure interviews.
Therefore, the researcher figure out several conclusions:
1. Perceived service quality level was less than customers‟ expectations,
while they perceived very good service quality, but they were expecting
excellent service quality.
2. Banks‟ employees didn‟t provide services in proper manner and correct
way, from the first time and within specified time.
3. Employees‟ behavior didn‟t provide confidence to customers.
131
4. Bank has a chance to improve service quality to reach customers‟
expectations, and satisfying them, to gain their loyalty, which could be
used as a strategy to gain competitive advantage and compete other banks,
and also attract new customers.
5. Customers‟ expected service quality level was high.
6. Empathy domain was the weakest domain between all of service
quality domains due to the gap size.
7. Service quality was affected by customers‟ gender.
8. Number of years dealing with the bank, didn‟t have any effect on
customers‟ perceived and expected service quality.
9. Bank size affects tangibles domain of service quality, while empathy,
assurance, reliability and responsiveness didn‟t affected by bank size.
6.3 Recommendations
The researcher suggested several recommendations:
1. Banks‟ managers must determine factors that affects customers‟
satisfaction which is a very important issue. Therefore, monitoring
customers‟ satisfaction periodically, to determine these factors is essential
to sustain loyal customers.
2. Bank methods of assessing customers‟ satisfaction is not powerful,
therefore, the researcher recommends to use SERVQUAL model as an
instrument, for measuring service quality in the Palestinian conventional
132
banks. While including SERVQUAL model domains in banks‟ strategy to
enhance customers‟ satisfaction.
3. Using this research managerial model as bank strategy, in order to
enhance service quality level, which in return will improve customers‟
satisfaction in a way to gain loyal customers.
4. Initiate sufficient training courses for banks‟ employees that enhances
their professional skills and knowledge, which in return will affect
customers‟ satisfaction by enhancing empathy, assurance and reliability
elements of the bank.
5. Involve banks‟ front line employees in developing new services. While
these employees are in direct and daily contact with banks‟ customers.
Therefore, they aware of new services aspects that customers prefer.
6. Most of banks‟ customers are full time employees, and have the same
working hours as banks‟ branches. So, banks‟ management should
customize branches working hours to satisfy all customers, especially
customers with full time jobs.
7. Today‟s trend goes to electronic services. Therefore, banks should
strive to satisfy their customers by offering outstanding electronic self-
services as a way to improve banks‟ productivity and profitability.
8. This research results indicated procedures that contains unnecessary
processes. Thus, business procedures reengineering concept should be
implemented in the Palestinian conventional banks.
133
9. Pay more attention to customers‟ complains, in order to figure out their
needs, and satisfy them in a better way. This could be done by improving
the communication between customers themselves and banks‟ customers
care department.
6.4 Limitation of the study
The first limitation was facing difficulties in convincing respondents to
give this research questionnaire time and complete it. And also, banks‟
policy of not disclosing sensitive data, and so, the interviewees could
provide useful information for this research. Moreover, paucity of previous
studies tackling service quality in Palestinian conventional banks, forms
another limitation of this research.
6.5 Future Research Directions
A fruitful area of future research is to perform a comparative study between
conventional and Islamic banks inside Palestine, in order to figure out
satisfaction levels between these different banks types. Also, another
direction is to compare service quality level between Palestinian banks and
other nearby countries such as Jordan and Egypt. Moreover, future
researches may consider additional variable that may affects customers‟
satisfaction of service quality, which is pricing of banks‟ services.
134
References
Aborampah, A. (2010), Customer Satisfaction in the Banking
Industry: a Comparative Study of Ghana and Spain. PHD Thises.
University of Girona.
Acheampong, I. and Asamoah, K. (2013), Service Delivery and
Business Growth Among Banks in Ghana Using the Service Profit Chain
Model. International Journal of Global Business. Vol.6, No.2,pp.57-79.
Akroush, M.N. (2008), Exploring the mediating effect of service
quality implementation on the relationship between service quality and
performance in the banking industry in Jordan, Global Business and
Economics Review. Vol.10, No.1, pp.98-122.
Akroush, M.N. and Khatib, F.S. (2009), The Impact of Service Quality
Dimensions on Performance: An Empirical Investigation of Jordan’s
Commercial Banks, Journal of Accounting – Business and
Management. Vol. 16, No.1, pp.22-44.
Al Karim, R. and Chowdhury, T. (2014), Customer Satisfaction on
Service Quality in Private Commercial Banking Sector in Bangladesh.
British Journal of Marketing Studies, Vol.2, No.2, pp.1-11.
Al Khaldy, A. F. F. (2006) Measuring Islamic banking services’
quality in Palestine: Customers’ points of view (MSc Thesis). Islamic
University of Gaza, Postgraduate Studies, Management Department,
Arabic.
135
Al Falah, B. (2013) , Structure of the Palestinian Services Sector and
Its Economic Impact. Palestine Economic Policy Research Institute
(MAS) Jerusalem and Ramallah.
Alfin, R., Alhabsji, T., Nimran, U. and Suharyono. (2013), Effect of
Service Quality and Product Quality to Corporate Image, Customer‟s
Satisfaction and Customer‟s Trust. IOSR Journal of Business and
Management.
AlFoqahaa, S. (2012), Factors Affecting Customers Satisfaction with
Islamic Banking Services in Palestine, Jordanian Journal of Business
Administration, Vol.8, No.2, pp.236-263.
Al-hawari, M. (2005), The effect of automated service quality on bank
financial performance and the mediating role of customer retention,
Journal of Financial Services Marketing Vol. 10, No.3, pp.228–243.
American Association for Public Opinion Research (AAPOR),
American Marketing Association (AMA). Sample Size Calculator.
http://www.surveysystem.com/sscalc.htm.
Ananth, A., Ramesh, R. and Prabaharan, B. (2011), Service quality gap
analysis in private sector bank - a customer perspective. Indian Journal
of Commerce and Management Studies.Vol.2 ,No.1, pp.244.252.
Anderson, E.W. and Fornell, C. (2000), Foundations of the American
Customer Satisfaction Index. Total Quality Management. Vol.11, No.6,
pp.869-S82.
136
Anderson, E.W., Fornell, C. and Lehmann, D.R. (1994), Customer
Satisfaction, Market Share, and Profitability: Findings from Sweden.
Journal of Marketing. Vol.58, No.3, pp.53-66.
Angur, M.G., Nataraajan, R. and Jahera Jr, J.S. (1999), Service quality
in the banking industry: an assessment in a developing economy.
International journal of bank marketing.Vol.17, No.3, pp.116-125.
Athanassopoulos, A., Gounaris, S. and Stathakopoulos (2001),
Behavioural Responses to Customers Satisfaction: An Empirical Study,
European Journal of Marketing. Vol.35, No.5/6, pp.687-707.
Babakus, E. and Boller, G. W. (1992), An empirical assessment of the
SERVQUAL scale. Journal of Business Research.Vol.26, No.6,
pp.253-68.
Baker, D. and Crompton, J. (2000), Quality, satisfaction and
behavioural intentions. Annals of Tourism Research. Vol.27, pp.785–804.
Batagan, L., Pocovnicu, A. and Capisizu, S. (2009), E-service quality
management. Journal of Applied Quantitative Methods, Vol. 4 No. 3,
pp.372-381.
Bateman, T. S. and Organ, D. W. (1983), Job Satisfaction and the
Good Soldier: The Relationship between Affect and Employee
Citizenship. Academic and Management Journal. Vol.26, pp.587-595.
137
Baumann, C., Burton, S., Elliott, G. and Kehr, H.M. (2007), Prediction
of attitude and behavioural intentions in retail banking. International
Journal of Bank Marketing, Vol.25, No.2, pp.102-116.
Bei, L.T. and Chiao, Y.C. (2001), An Integrated Model for the Effects
of Perceived Product, Perceived Service Quality, and Perceived Price
Fairness on Consumer Satisfaction and Loyalty. Journal of Consumer
Satisfaction. Vol.14.
Berry, L.L., Bennett, D.R. and Brown, C.W. (1989), Service quality:
A profit strategy for financial institutions. Irwin Professional Pub.
Bitner, M.J. and Hubbert, A.R. (1994), ―Encounter satisfaction
versus overall satisfaction versus service quality: the consumer’s
voice‖, in Rust, R.T. and Oliver, R.L. (Eds), Service Quality: New
Directions in Theory and Practice, Sage Publications, Thousand Oaks, CA.
Blodgett, G. and Wakefield, L. (1999), Customer response to
intangible and tangible service factors. Psychology and Marketing.
Vol.16, No.1, pp.51-68.
Bloemer, J. (1999), Linking perceived service quality and service
loyalty: a multi-dimensional perspective. European Journal of
Marketing. Vol.33, No.11/12, pp.1082-1106.
Bolton, R.N. and Drew, J.H. (1991), A longitudinal analysis of the
impact of service changes on customer attitudes. The Journal of
Marketing, pp.1-9.
138
Boulding, W., Kalra, A., Staelin, R. and Zeithaml, V. (1993), A
Dynamic Process Model of Service Quality: From Expectations to
Behavioural Intentions, Journal of Marketing Research. Vol.30, No.1,
pp.7-27.
Brady, M.K. and Cronin, J.J. (2001), Some new thoughts on
conceptualizing perceived service quality: a hierarchical approach.
Journal of Marketing. Vol.65, pp.34-49.
Bryant, B.E. and Cha, J. (1996), Crossing the threshold. Marketing
Research. Vol.8, No.4, p.20.
Buttle, F. 1996. SERVQUAL: Review, Critique, Research Agenda,
European Journal of Marketing, Vol.30, No.1, pp.8-32.
Carman, J.M. (1990) Consumer perceptions of service quality: an
assessment of the SERVQUAL dimensions, Journal of Retailing. Vol.66,
No.2,pp.27 – 45
Caruana, A., Money, A. H. and Berthon, P. R. (2000), Service quality
and satisfaction: The moderating role of value. European Journal of
Marketing. Vol.34, No.11/12, pp.1338-1352.
Carvalho, C., Brito, C. and Cabral, J.S. (2010). Towards a conceptual
model for assessing the quality of public services. International Review
on Public and Nonprofit Marketing, Vol.7, No.1, pp.69-86.
139
Chakravarty, S., Widdows, R. and Feinberg, R. (1996), How moments of
truth define bank- customer relationships, Journal of Retail Banking
Services. Vol.18, No.1, pp.29-34.
Cham, T. H. and Easvaralingam, Y. (2012), Service quality, image and
loyalty towards Malaysian hotels. International Journal of Services,
Economics and Management Vol.4, No.4, pp.267-281
Chang, YH and Yeh, CH (2002), A survey analysis of service quality
for domestic airlines. European Journal of Operational Research.
Vol.139, No.1, pp.166-177.
Choudhury, K. (2014). The influence of customer-perceived service
quality on customers’ behavioural intentions: a study of public and
private sector banks, class and mass banking and consumer policy
implications. International Review on Public and Nonprofit Marketing,
Vol.11, No.1, pp.47-73.
Christopher, M., Payne, A. and Ballantyne, D. (2002) Relationship
Marketing: Creating Stakeholder Value, 2nd edn. Oxford: Butterworth
Heinemann.
Chumpitaz, R. and Paparoidamis N. (2004) Service Quality and
Marketing Performance in Business-to-Business Markets: Exploring
the Mediating Role of Client Satisfaction, Managing Service Quality,
Vol.14, No.2/3, pp.235-248.
140
Churchill, Jr, G.A. and Surprenant, C. (1982), An investigation into the
determinants of customer satisfaction. Journal of marketing research,
pp.491-504.
Clemes, M. D., Xu, S. and Gan, C. (2013), Mobile Communications: A
Comprehensive Hierarchical Modelling Approach. Asia Pacific Journal
of Marketing and Logistics. Vol.26, No.1, pp.8-8.
Cooper, D. R. and Schindler, P. S. (2003), Business Research Methods
(8 th edn.) McGraw- Hill: New York.
Creswell, J.W. (1994) Research Design: Qualitative & Quantitative
Approaches, London: SAGE Publications.
Creswell, J.W. (2003) Research Design: Qualitative, Quantitative and
Mixed Methods Approach, Second Edition, Sage Publication, Inc.
Creswell, J.W., Plano and Clark, V.L. (2007) Designing and
conducting mixed methods research. Thousand Oaks, CA: Sage
Publications.
Cronin, Jr, J.J. and Taylor, S.A. (1992) Measuring service quality: a
reexamination and extension. The journal of marketing, pp.55-68.
Cronin, J.J., Brady, M.K. and Hult, G.T.M. (2000), Assessing the effects
of quality, value, and customer satisfaction on consumer behavioral
intentions in service environments. Journal of retailing. Vol.76, No.2,
pp.193-218.
141
Crosby, P.B. (1979), Quality is Free, New York: McGraw-Hill.
Curtis, T., Abratt, R., Rhoades, D.L. and Dion, P. (2011), Customer
Loyalty, Repurchase and Satisfaction: A Meta-Analytical Review.
Journal of Consumer Satisfaction, Dissatisfaction and Complaining
Behavior. Vol.24.
Dabholkar, P., Thorpe, D. I. and Rentz, J. O. (1996), A measure of
service quality for retail stores: Scale development and validation.
Journal of the Academy of Marketing Science. Vol.24, No.1, pp.3–16.
Davenport, T.H., Leibold, M. and Voelpel, S.C. (2007), Strategic
Management in the Innovation Economy: Strategic Approaches and
Tools for Dynamic Innovation Capabilities. John Wiley and Sons.
Domenge, R. and Arciniega, L.M. (2015), Development of a short
questionnaire for measuring service quality perceptions. Vol.42, No.1,
pp.11–17.
Duffy, D.L. (2003), Internal and external factors which affect
customer loyalty. Journal of consumer marketing. Vol.20, No.5,
pp.480-485.
Duncan, E. and Elliot, G. (2004), Efficiency, Customer Service and
Financial Performance Among Australian Financial Institutions, The
International Journal of Bank Marketing. Vol.22, No.5, pp.319-342.
142
Ehigie, B. O. (2006) , Correlates of customer loyalty to their bank: a
case study in Nigeria. International Journal of Bank Marketing. Vol.24,
No.7, pp.494-508.
Eleboda, S.S. (2014), Application of the Diagnostic Capability of
SERVQUAL Model to an Estimation of Service Quality Gaps in Nigeria
GSM Industry. European Journal of Business and Management. Vol.6,
No.32, pp.50-62.
ElHinnawi, R. (2011), The impact of relationship marketing
underpinnings on customer‟s loyalty Case study _ Bank of Palestine.
Islamic University of Gaza, Postgraduate Studies, commerce Department
of business administration, Arabic.
El-Jafari, M., Makhool, B., Lafi, D. and Atyani, N. (2003), Palestinian
Services Sector and Its Role in Economic Development. Palestine
Economic Policy Research Institute (MAS).
Eshghi, A., Haughton, D. and Topi, H. (2007), Determinants of
customer loyalty in the wireless telecommunications industry
Telecommunications Policy. Vol.31, pp.93-106.
Family Health International (FHI). Qualitative Research Methods: A
Data Collector's Field Guide. USA- North Carolina.2005.
Fowler, J.G. (2013), Customer citizenship behavior: an expanded
theoretical understanding. International Journal of Business and Social
Science. Vol.4, No.5.
143
Frost, F. A., and Kumar, M. (2000) INTSERVQUAL – an internal
adaptation of the GAP model in a large service organisation. Journal of
Services Marketing. Vol.14, No.5, pp.358-377.
Ganguli, S. and Roy, S. K. (2010) Generic Technology-based service
quality dimensions in banking: impact on customer satisfaction and
loyalty. International Journal of Bank Marketing. Vol.29, No.3,
pp.224-246.
Garma, R. and Bove, L. (2011), Contributing to Well-being: Customer
Citizenship Behaviors Directed to Service Personnel. Journal of
Strategic Marketing. Vol.19, No.7, pp.633-649.
Garvin, D.A. (1984), What does product quality really mean?. Sloan
Management Review. Vol. 26, No.1, pp.25-43.
Gerpott, T. J., Rams, W. and Schindler, A. (2001), Customer retention,
loyalty, and satisfaction in the German mobile cellular
telecommunications market. Telecommunications Policy.Vol.25, No.4,
pp.249-69.
Ghauri, P. and Gronhaug, K. (2002), Research Methods in Business
Studies. Harlow: Pearson Education.
Gitomer, J. (1998), Customer satisfaction is worthless, customer
loyalty is priceless: How to make customers love you, keep them
coming back, and tell everyone they know. Austin, TX: Bard Press.
144
Godin, S. and Gladwell, M. (2001), Unleashing the Ideavirus: Stop
Marketing AT People! Turn Your Ideas into Epidemics by Helping
Your Customers Do the Marketing thing for You. Hachette Books;
Reprint edition (October 10, 2001).
Gonzalez, M.E.A., Comesana, L.R. and Brea, J.A.F. (2007), Assessing
tourist behavioral intentions through perceived service quality and
customer satisfaction, In Journal of Business Research. Vol.60, No.2,
pp.153-160.
Gremler, D.D. and Brown, S.W. (1996), Service loyalty: its nature,
importance and implications. Proceedings of American Marketing
Association. International Service Quality Association Inc. (ISQA) c/o
Business Research Institute, St John‟s University. pp.171-180.
Gronroos, C. (1978), A service-orientated approach to marketing of
services. European Journal of marketing. Vol.12, No.8, pp.588-601
Gronroos, C. (1984), A service quality model and its market
implications. European Journal of Marketing. Vol.18, No.4, pp.36-44.
Gronroos, C. (2001), The Perceived Service Quality Concept – A
Mistake?. Managing Service Quality. Vol.11, No.3, pp.150–152.
Gronroos, C. (2007), A service quality model and its marketing
implications, European Journal of Marketing. Vol.18, pp.35-44.
145
Guo, X., Duff, A. and Hair, M. (2008), Service Quality Measurement in
the Chinese Corporate Banking Market, International Journal of Bank
Marketing. Vol.26, No.5, pp.305-327.
Gurau, C. and Ranchhod, A. (2001), Measuring customer satisfaction:
A platform for calculating, predicting and increasing customer
profitabilit. Journal of Targeting, Measurement and Analysis for
Marketing. Vol.10, No.3, pp.203-219
Hair, J. F., Anderson, R. E. Tatham, L. and Black, W. (2003),
Multivariate Data Analysis 5th Edition ,Prentice Hall.
Hart, A. E. and Rosenberger III, P. J. (2004) The effect of corporate
image in the formation of customer loyalty: An Australian replication.
Australasian Marketing Journal (AMJ) Vo.12, No.3, pp.88-96.
Hayes, B. E. (2008), The true test of loyalty. Quality Progress. Vol.41,
No.6, pp.20.
Haywood-Farmer, J. (1988), A conceptual model of service quality.
International Journal of Operations and Production Management.
Vol.8, No.6, pp.19-29.
Heskett, J. L., Jones, T. O., Loveman, G. W. Sasser, W. E., Jr. and
Schlesinger, L. A. (1994), Putting the Service-Profit Chain to Work.
Harvard Business Review. Vol.72, No.2, pp.164-174
146
Hinson, R., Mohammed, A. and Mensah , R. (2006), Determinants of
Ghanaian bank service quality in a universal banking dispensation,
Banks and Bank Systems. Vol.1, No.1
Hinson, R., Owusu-Frimpong, N. and Dasah, J. (2011), Brands and
service-quality perceptions. Marketing Intelligence and Planning. Vol.29,
No.3, pp.264-283.
Horn, C. and Rudolf, M. (2011). Service quality in the private banking
business. Financial Markets and Portfolio Management, Vol.25, No.2,
pp.173-195.
Hunger, J.D. and Wheelen, T.L. (2003), Essentials of Strategic
Management. Prentice Hall.
Hussein, A. S. and Hapsari, R. (2015), Customers’ Perceptions of
Service Quality Dimensions in the Indonesian Banking Industry: an
Empirical Study. Journal of Indonesian Economy and Business. Vol.30.
No.1, pp.17-29
Ilyas, A., Nasir, H., Malik, M.R., Mirza, U.E., Munir, S., Sajid, A.
(2013). Assessing the service quality of Bank using SERVQUAL model.
Interdisciplinary Journal of Contemporary Research in Business.
Vol.4, No.11, pp.390-400.
147
Jayawardhena, C. and Farrell, A.M. (2011), Effects of Retail
Employees' Behaviours on Customers' Service Evaluation. International
Journal of Retail and Distribution Management. Vol.39, No.3, pp.203-
217
Johnston, R. (1995), The Determinants of Service Quality: Satisfiers
and Dissatisfiers. International Journal of Service Industry
Management. Vol.6, No.5, pp.53-71.
Jones, T.O. and Sasser, W.E Jr. (1995), Why Satisfied Customers
Defect, Harvard Business Review, Vol.73, No.6, pp.88-99
Jun, M., Cai, S. and Shin, H. (2006), TQM practice in maquiladora:
antecedents of employee satisfaction and loyalty. Journal of Operations
Management, Vol.24, pp.791-812.
Kabir, H. and Carlsson, T. (2010), Service Quality - Expectations,
perceptions and satisfaction about Service Quality at Destination
Gotland - A case study. Gotland University.
Kamakura, W. A., Vikas, M., Fernando, R. and Jose A.M. (2002)
Assessing the Service Profit Chain. Marketing Science. Vol.21,
(Summer), pp.294–317.
Kang, G.D. and James, J. (2004), Service quality dimensions: an
examination of Gronroos's service quality model. Managing Service
Quality: An International Journal. Vol.14, No.4, pp.266-277.
148
Karatepe, O., Yavas, U. and Babakus, E. (2005), Measuring service
quality of banks: Scale development and validation, Journal of Retailing
and Consumer Services. Vol.12, pp.373-383.
Kasper, H., Helsdingen, P. v., and Vries, W. d. (1999), Services
Marketing Manage-ment: an International Perspective. John Wiley and
Sons, Chichester, UK.
Kaur, G., Sharma, R. D. and Nitusha, S. (2009), Internal market
orientation in Indian banking: an empirical analysis. Managing Service
Quality. Vol.19, No.5, pp.595-627.
Kendall, L. (2008), The conduct of qualitative interview: Research
questions, methodological issues, and researching online. In J. Coiro, M.
Knobel, C. Lankshear and D. Leu (Eds.), Handbook of research on new
literacies (pp. 133-149). New York: Lawrence Erlbaum Associates.
Khan, M. A. (2010) Automobile industry in Pakistan. Economic
Review. Vol.41, No.12, pp.22.
Khan, M. and Fasih, M. (2014) Impact of Service Quality on Customer
Satisfaction and Customer Loyalty: Evidence from Banking Sector.
Pakistan Journal of Commerce and Social Sciences. Vol.8, No.2,
pp.331-354.
149
Kheng, L., Mahamad, O., and Ramayah, T. (2010) The Impact of
Service Quality on Customer Loyalty: A Study of Banks in Penang,
Malaysia. International Journal of Marketing Studies. Vol.2, No.2,
pp.57-66.
King, N. (2004), Using Interviews in Qualitative Research, in Cassell,
C. and Symon, G. (eds), Essential Guide to Qualitative Methods in
Organizational Research, London: Sage.
Kordshouli, H.R., Jafarpour, Y. and Bouzanjani, A.A. (2016), An
analysis of the prosocial behaviors of customers in response to the firms’
service quality. Iranian Journal of Management Studies. Vol.9, No.1,
pp.21-41
Kotler, P. and Armstrong, G. (2012), Principles of Marketing, 14th
Edition. New Jersy: Pearson Education Inc.
Koys, D. J. (2001), The effects of employee satisfaction,
organizational citizenship behavior, and turnover on organizational
effectiveness: A unit-level, longitudinal study. Personnel Psychology,
Vol.54, No.1, pp.101-114.
Kumar, M., Kee, F. T. and Manshor, A. T. (2009), Determining the
relative importance of critical factors in delivering service quality of
banks; An application of dominance analysis in SERVQUAL model,
Managing Service Quality, Vol.19, No.2, pp.211-228.
150
Kumar, M., Kee, F. T. and Charles, V. (2010), Comparative evaluation
of critical factors in delivering service quality of banks: An application of
dominance analysis in modified SERVQUAL model. International
Journal of Quality and Reliability Management. Vol.27, No.3,
pp.351-377.
Kuo, T.H., Ho, L., Lin, C. and Kai, K.K. (2010), Employee
empowerment in a technology advanced work environment. Industrial
Management and Data Systems, Vol.110 No.1, pp.24-42.
Lacey, A. and Luff, D. (2007), Qualitative Data Analysis Authors. The
NIHR RDS for the East Midlands / Yorkshire and the Humber. pp.1-46.
Ladhari, R. (2008), Alternative Measure of Service Quality: A Review,
Journal of Managing Service Quality. Vol.18, No.1, pp.65-86.
Lau, M.M., Cheung, R., Lam, A.Y.C. and Chu, Y.T. (2013), Measuring
Service Quality in the Banking Industry: A Hong Kong Based Study.
Contemporary Management Research. Vol.9, No.3, pp.263-282.
Lee MC (2000), The determinants of perceived service quality and its
relationship with satisfaction, Journal of Services Marketing, Vol.14,
No. 3, pp. 217-231.
Lee, Y.C., Wang, Y.C., Lu, S.C., Hsieh, Y.F., Chien, C.H. and Tsai, S.B.
(2016), An empirical research on customer satisfaction study : a
consideration of different levels of performance. SpringerPlus. Vol.5,
pp.1577.
151
Lehtinen, U. and Lehtinen, J.R. (1982), Service quality: a study of
quality dimensions. Service Management Institute.
Lewis, B. R. (1993), Service quality: recent developments in financial
services. International Journal of Bank Marketing. Vol.2, No.6,
pp.19-26.
Lewis, B. R., Orledge, J. and Mitchell, V. W. (1994), Service Quality:
Students’ Assessment of Banks and Building Societies, International
Journal of Bank Marketing. Vol. 12, No.4, pp.3-12.
Lewis, R.C., and Booms, B.H. (1983), The marketing aspects of
service quality, in Berry, L.,Shostack, G. and Upah, G. (Eds),
Emerging Perspectives on Services Marketing, American Marketing
Association, Chicago, IL, pp. 99-107.
Lincoln, Y. S. and Guba, E. G. (1985), Naturalistic inquiry. Beverly
Hills, CA: Sage.
Lovelock, C. H. and Wirtz, J. (2011), Service marketing: people,
technology, Strategy (7 ed.). New Jersey: Prentice Hall.
Lymperopoulos, C., Chaniotakis, I.E. and Soureli, M. (2006), The
importance of service quality in bank selection for mortgage loans.
Managing Service Quality: An International Journal. Vol.16, No.4,
pp.365-379.
152
Magesh, R. (2010), A Study on Quality of Service as a Tool for
Enhancement of Customer Satisfaction in Banks, Global Journal of
Finance and Management. Vol.2, pp.123-133.
Malhotra, N. and Mukherjee, A. (2004), The relative influence of
organisational commitment and job satisfaction on service quality of
customer-contact employees in banking call centres. Journal of Services
Marketing. Vol.18, No.3, pp.162-174.
Malhotra, N.K., Ulgado, F.M., Agarwal, J., Shainesh, G. and Wu, L.,
2005. Dimensions of service quality in developed and developing
economies: multi-country cross-cultural comparisons. International
marketing review, Vol.22, No.3, pp.256-278.
Mardalis, A. (2006). Meraih loyalitas pelanggan. Benefit: Journal
Manajemen dan Bisnis, Vol.9, No.2, pp.111-119.
McNamara, C. (1999), General Guidelines for Conducting
Interviews. Minnesota.
Mels, G., Boshoff, C. and Nel, D. (1997), The Dimensions of Service
Quality: the Original European Perspective Revisited, The Service
Industries Journal. Vol.17, No.1, pp.173-89.
Melville, N., Kraemer, K. and Gurbaxani, V. (2004), Review:
Information Technology and Organizational Performance: An
Integrative Model of IT Business Value". MIS Quarterly. Vol.28, No.2,
pp.283-322.
153
Mittal, S. and Gera, R. (2013) „Relationship between service quality
dimensions and behavioural intentions: an sem study of public sector
retail banking customers in india’, Journal of Services Research. Vol.12,
No.2, pp.148–171.
Mohsan, F., Nawaz, M.M., Khan, M.S., Shaukat, Z. and Aslam, N.,
2011. Impact of customer satisfaction on customer loyalty and intentions
to switch: Evidence from banking sector of Pakistan. International
Journal of Business and Social Science, Vol.2, No.16.
Morrar, R. and Gallouj, F. (2013), The Growth of the Service Sector in
Palestine: The productivity challenge. Finding Growth Through Service
Activities In Barren Times, Sep 2013, Aix en Provence, France.
Morvaridi, B. (1998), interviewing, Module Two. Graduate School,
Faculty of Social Science and humanities. University of Bradford, UK
Family Health International (FHI).
Murad, M. (2011), Direct and Moderating Factors Affecting
Customer Switching Intentions : An Empirical Study on Bank of
Palestine and Cairo Amman Bank in Gaza Strip. The Islamic University
- Gaza Deanery of Higher Studies Faculty of Commerce Department of
Business Administration.
Muyeed, M. A. (2012), Customer Perception on Service Quality in
Retail Banking in Developing Countries-A Case Study. International
Journal of Marketing Studies. Vol.4, No.1, pp.116-122.
154
Naeem, H. and Saif, I. (2009), Service Quality and its impact on
Customer Satisfaction: An empirical evidence from the Pakistani
banking sector, The International Business and Economics Research
Journal. Vol.8, No.12, pp.85-99.
Ndubisi, N. O. (2006), A structural equation modeling of the
antecedents of relationship quality in the Malaysia banking sector.
Journal of Financial Services Marketing. Vol.11, No.2, pp.131-141.
Negi, R. (2009), Determining customer satisfaction through perceived
service quality: A study of Ethiopian mobile users, International Journal
of Mobile Marketing. Vol.4, No.1, pp.31-38.
Newman, K. (2001), Interrogating SERVQUAL: a critical assessment
of service quality measurement in a high street retail bank, International
Journal of Bank Marketing. Vol.19, No.3, pp.126-39.
Nielsen, J.F. and Host, V. (2000), The Path to Service Encounter
Performance in Public and Private ‘Bureaucracies’. The Service
Industries Journal. Vol.20, No.1.
Njanike, K. (2008), The impact of Globalization on Banking Service
Quality in Zimbabwe. Annals of the university of Petrosani, Economics.
Vol.10, No.1, pp.205-216.
Okoe, A.F., Adjei, J.S. and Osarenkhoe, A. (2013), Service Quality in
the Banking Sector in Ghana. International Journal of Marketing
Studies. Vol.5, No.2, pp.81-92.
155
Oliver, R. (1997) Satisfaction: A behavioural perspective on the
consumer. New York: McGraw Hill.
Paltel Group. (2015) http://www.paltelgroup.ps/pginfo/?p=27120
Parastoo, S., So, S. and Saeidi, P. (2015), „How does corporate social
responsibility contribute to firm financial performance ? The mediating
role of competitive advantage, reputation, and customer satisfaction’,
Journal of Business Research. Vol.68, pp.341–350.
Parasuraman, A., Berry, L.L., and Zeithaml, V.A. (1988), SERVQUAL:
a multi-item scale for measuring consumer perception of service quality.
Journal of Retailing, Vol.64, Spring, pp.12-40.
Parasuraman, A., Berry, L.L., and Zeithaml, V.A. (1994), Reassessment
of expectations as a comparison standard in measuring service quality:
implications for further research", Journal of Marketing. Vol.58,
January, pp.111-24.
Parasuraman, A., Zeithaml, V.A. and Berry, L.L. (1985), A conceptual
model of service quality and its implications for future research. The
Journal of Marketing, pp.41-50.
Parida, B.B. and Baksi, A.K. (2011), Customer Retention and
Profitability: CRM Environment. Journal of Indian Management.
Vol.April. Pp.66-85.
156
Patterson, P. G., Rujirutana M.A. and Tasman, S. (2001), Switching
Costs as a Moderator of Service Satisfaction Processes in Thailand,”
Journal of International Consumer Marketing . Vol.14, No.1, pp.1-21.
Patton, M.Q. (1990), Qualitative evaluation and research methods.
2nd edn, SAGE Publications, Inc., CA, US.
Pcbs (2016), 20/03/2016,
http://www.pcbs.gov.ps/Portals/_Rainbow/Documents/Percent%20%20%2
0%20%20%20%20%20%20%20%202000-
2015%20%20%20%20%20%20E.htm
Perng, Y. H. (2007), A Service Quality Improvement Dynamic
Decision Support System for Refurbishment Contractors, Total Quality
Management and Business Excellence. Vol.18, No.7, pp.731-49.
Perrien, J., Filiatrault, P. and Ricard, L. (1992), Relational marketing
and commercial banking: a critical analysis. International Journal of
Bank Marketing. Vol.10, No.7, pp.25-9.
Philip, G. and Hazlett, S. (1997), The Measurement of service quality: a
new p-c-p attributes model. International Journal of Quality and
Reliability Management. Vol.14, No.3, pp.260-286.
Pizam, A. and Ellis, T. (1999), Customer satisfaction and its
measurement in hospitality enterprises, International Journal of
Contemporary Hospitality Management. Vol.11, No.7, pp.326- 39.
157
PMA. (2017),
http://www.pma.ps/Default.aspx?tabid=183&language=en-US
Pollack, B. L. (2009), Linking the hierarchical service quality model to
customer satisfaction and loyalty. Journal of Services Marketing.
Vol.23, No.1, pp.42-50.
Pont, M. and McQuilken, L. (2005) An empirical investigation of
customer satisfaction and loyalty across two divergent bank segments.
Journal of Financial Services Marketing. Vol.9, pp.344-359.
Quyet, T.V., Vinh, N.Q. and Chang, T. (2015), Service Quality Effects
on Customer Satisfaction in Banking Industry. International Journal of
u-and e-Service, Science and Technology. Vol.8, No.8, pp.199-206.
Rahman, M.S., Khan, A.H. and Haque, M.M. (2012), A conceptual
study on the relationship between service quality towards customer
satisfaction: Servqual and gronroos's service quality model
perspective. Asian Social Science. Vol.8, No.13, pp.201-210.
Rahman, Z. (2005), Customer experience management — A case
study of an Indian bank. Database Marketing and Customer Strategy
Management. Vol.13, No.3, pp.203-221.
Ranaweera, C. and Neely, A. (2003) Some moderating effects on the
service quality-customer retention link. International Journal of
Operations and Production Management. Vol.23, No.2, pp.230–248.

158
Ravichandran, K., Mani, B.T., Kumar, S.A. and Prabhakaran, S. (2010),
Influence of Service Quality on Customer Satisfaction, Application of
SERVQUAL Model. International Journal of Business and
Management. Vol.5, No.4, pp.117-124.
Rawani, A. M. and Gupta, M. P. (2000), IT versus service quality in
banks-a few learning issues. Proceedings of the International Conference
on Delivering Service Quality-Managerial Challenges for the 21st Century,
New Delhi, pp.167-72.
Razak, R. M., Chong, C.S. and Lin, B. (2007), Service quality of a local
Malaysian bank: Customers’ expectations, perceptions, satisfaction and
loyalty. International Journal of Services and Standards. Vol.3, No.1,
pp.18-38.
Reichheld, F. and Kenny, D. (1990), The Hidden Advantages of
Customer Retention. Journal of Retail Banking. Vol.XII, No.4, pp.19-23.
Reichheld, F.F. (1996), Learning from customer defections, Harvard
Business Review, March/April, pp.56-69.
Reichheld, F.F. (2003), The One Number You Need to Grow. Harvard
Business Review. Vol.81, December, pp.46-54.
Richins, M. (1983), Negative word of mouth by dissatisfied customers:
A pilot study. Journal of Marketing. The Journal of Marketing. Vol.47,
pp.68-78.
159
Robson, C. (2002), Real world research: a resource for social
scientists and practitioner-researchers Oxford, Blackwell.
Rust, R.T. and Zahorik, A.J., (1993), Customer satisfaction, customer
retention, and market share. Journal of retailing. Vol.69, No.2,
pp.193-215.
Rust, R.T. and Richard L.O. (2000), Should We Delight the Customer?.
Journal of the Academy of Marketing Science. Vol.28, Winter,
pp.86–94.
Rust, R.T., Christine, M. and Peter, R.D. (2002), Getting Return on
Quality: Revenue Expansion, Cost Reduction, or Both?, Journal of
Marketing, Vol.66, October, pp.7-24.
Samuel, M. D., Joly ,D.O., Wild, M. A., Wright , S. D. Wright , Otis ,D.
L. ,Werge, R. W. and Miller, M. W. (2003), Surveillance strategies for
detecting chronic wasting disease in free-ranging deer and elk. Result
of a CWD surveillance workshop- USGS- National Wildlife Health Center,
Madison, Wisconsin.
Santos, J. (2003), E-service quality: a model of virtual service quality
dimensions. Managing Service Quality, Vol.13, No. 3, pp. 233-246.
Saunders, M., Lewis, P. and Thornhill, A. (2000), Research Methods
for business students (2nd ed.), Essex: Pearson Educations.
160
Saunders, M., Lewis, P. and Thornhill, A. (2007) Research methods for
business students. Harlow, FT/Prentice Hall.
Saunders, M. and Thornhill, A. (2003) Organizational justice, trust
and the management of change an exploration, Personnel Review
Vol.32,No.3,pp.360-375.
Seth, N., Deshmukh, S.G. and Vart, P. (2005) Service quality models : a
review. International Journal of Quality and Reliability Management.
Vol.22. No.9. pp.913-949.
Shahin, A. and Samea, M. (2010) Developing the Models of Service
Quality Gaps : A Critical Discussion. Business Manaagement and
Strategy. Vol.1, No.1, pp.1-11.
Shanka, M.S. (2012) Bank Service Quality , Customer Satisfaction and
Loyalty in Ethiopian Banking Sector. Journal of Business
Administration and Management Sciiences Research. Vol.1, No.1,
pp.1-9.
Shu, X. (2010) A Hierarchical model of the Chinese mobile
communications market: an empirical analysis.
Shu'Sha, H.G. (2005) Measuring Banking Service Quality In Gaza
Strip: A customers' Perspective. Islamic University of Gaza,
Postgraduate Studies, Management Department, Arabic.
161
Singh, J. (1988), Consumer Complaint Intentions and Behavior:
Definitional and Taxonomical Issues. Journal of Marketing. Vol.52,
(January), pp.93-107.
Smith, A.K. and Bolton, R.N. (1998). An experimental investigation of
customer reactions to service failure and recovery encounters: paradox
or peril?. Journal of service research, Vol.1, No.1, pp.65-81.
Soiferman, L.K. (2010) Compare and Contrast Inductive and
Deductive Research Approaches. University of Manitoba. April.
Solomon, R.C. (1998) The moral psychology of business: Care and
compassion in the corporation, Business Ethics Quarterly. Vol.8,
pp.515-533.
Song, B., Lee, C. and Yoon, B. (2015), Diagnosing service quality
using customer reviews: an index approach based on sentiment and
gap analyses. Service Business. August.
Soteriou, A. and Zenios, S.A. (1999) Operations, Quality, and
Profitability in the Provision of Banking Services. Management Science.
Vol.45, No.9, pp.1221-1238.
Spathis, C., Petridou, E. and Glaveli, N. (2004), Managing service
quality in banks: customers’ gender effects. Managing Service Quality.
Vol.14, No.1, pp.90-102.
162
Spreng, R.A. and Mac Koy, R.D. (1996), An empirical examination of a
model of perceived service quality and satisfaction. Journal of Retailing.
Vol.72, No.2, pp.201-14.
Stafford, M. R., Prybutok, V., Wells, B. P. and Kappelman, L. (2011)
Assessing the fit and stability of alternative measures of service quality.
Journal of Applied Business Research. Vol.15, No.2, pp.13-30.
Storey, A., Thompson, J.B., Green, C. and Bokma, A. (2000). Customer
E-Services: Problems and Solutions.
Sureshchandar, G. (2002), Determinants of customer perceived service
quality: a confirmatory factor analysis approach, Journal of Services
Marketing. Vol.16, No.1, pp.9-34.
Syzmanski, D.M. and David, H.H. (2001), Customer Satisfaction: A
Meta-Analysis of the Empirical Evidence. Journal of the Academy of
Marketing Science. Vol.29, No.1, pp.16-35.
Teas, R.K. (1993), Expectations, performance evaluation, and
consumers’ perceptions of quality. Journal of Marketing, October,
pp.18-34.
Thur, N. P. and Hau, L. N. (2010), Service personal values and
customer loyalty: a study of banking services in a transitional economy.
International Journal of Bank Marketing. Vol.28, No.6, pp.463-478.
Trochim, W.M.K. (2006) Research methods knowledge base.
163
Tsoukatos, E. and Mastrojianni, E. (2010). Key determinants of service
quality in retail banking. EuroMed Journal of Business, Vol.5, No.1,
pp.85-100.
Turkyilmaz, A., Akman, G., Ozkan, C., and Pastuszak, Z. (2011)
Empirical study of public sector employee loyalty and satisfaction.
Industrial Management and Data Systems. Vol.111, No.5, pp.675-696.
Vanpariya, B. and Ganguly, P. (2010), SERVQUAL versus
SERVPERF: An Assessment from Indian Banking Sector. Quest
Journal of Management and Research. Vol.1, No.1, pp.3-14.
Yarimoglu, E.K. (2014), A Review on Dimensions of Service Quality
Models. Journal of Marketing Management. Vol.2, No.2, pp.79-93.
Yi, Y. (1990). A critical review of consumer satisfaction. Review of
marketing, Vol.4, No.1, pp.68-123.
Yi, Y. and Gong, T. (2008), The effects of customer justice perception
and effect on customer citizenship behavior and customer
dysfunctional behavior. Industrial Marketing Management. Vol.37, No.7,
pp.767-783.
Yin, R.K. (2003), Case study Research-Design and Methods (3 rd
ed.), Thousand Oaks, CA: sage publications.
164
Yoon, S. and Suh, H. (2004) Ensuring IT consulting SERVQUAL and
user satisfaction: a modified measurement tool. Information Systems
Frontiers. Vol.6, No.4, pp.341-351.
Zahorik, A. J. and Rust, R.T. (1992) Modeling the Impact of Service
Quality on Profitability: A Review in Advances in Service Marketing
and Management, T. Swartz, ed. Greenwich, CT: JAI Press, pp.247–76.
Zairi, M. (2000). Managing Customer Dissatisfaction through
Effective Complaint Management Systems. The TQM Magazine. Vol.12,
No.5, pp.331-335.
Zeithaml, V., Berry, L. L. and Parasuraman, A. (1988) Communication
and control processes in the delivery of service quality. Journal of
marketing. Vol.52, pp.35-48.
Zeithaml, V., Berry, L.L. and Parasuraman, A. (1996) The behavioral
consequences of service quality", Journal of Marketing. Vol.60,
pp.31-46.
Zeithaml, V.A. (2000), Service quality, profitability, and the economic
worth of customers: what we know and what we need to learn. Journal of
the academy of marketing science. Vol.28, No.1, pp.67-85.
Zeithaml, V. A., Bitner, M. J. and Gremler, D. D. (2009) Services
Marketing: Integrating Customer Focus Across the Firm, 5th edition,
New York: McGraw-Hill.
165
Zeithaml, V.A., Parasuraman, A. and Berry, L.L. (1990) Delivering
quality service: Balancing customer perceptions and expectations.
Simon and Schuster.
Zeithaml, V.A., Parasuraman, A. and Malhotra, A. (2000) A Conceptual
Framework for Understanding e-Service Quality: Implications for
Future Research and Managerial Practice’, Marketing Science
Institute, Working Paper Series, Report No.00-115, Cambridge.

166
Appendix
Appendix A
Thesis Survey
لقياس مدى جودة الخدمة ورضا العمالء في البنوك الفمسطينية استبيان
كمال عوكل وأنا مرشح لمحصول عمى درجة الماجستير الدين اسمحوا لي في البداية أن أقدم نفسي. اسمي جمال كجزء من أطروحتي، يجب ان اقوم بإجراء مسح ميداني لقياس .جامعة النجاح الوطنية -في كمية الدراسات العميا
مدى جودة الخدمة و رضا العمالء في البنوك الفمسطينية. وسأكون ممتنا لمغاية إذا امكنكم مساعدتي من خالل .استكمال االستبيان ادناه. حيث سيتم استخدام كافة البيانات ألغراض عممية فقط
الوقت المقدر إلكمال ىذا االستبيان حوالي خمس دقائق
جمال الدين كمال عوكل ماجستير ادارة ىندسيةطالب فمسطين –نابمس
gmail.comJamal.okal@ 00972598910833
البيانات الولية :اولً
جنس معبئ االستبيان : )__( ذكر ، )__( انثى
اسم البنك الذي تتعامل معو : -1
)__( البنك العقاري المصري العربي )__( البنك العربي )__( البنك االىمي االردني )__( بنك فمسطين )__( بنك االستثمار الفمسطيني )__( بنك القاىرة عمان )__( البنك االردني التجاري )__( بنك االردن
)__( بنك االسكان لمتجارة و التمويل )__( بنك القدس )__( البنك االردني الكويتي )__( البنك الوطني
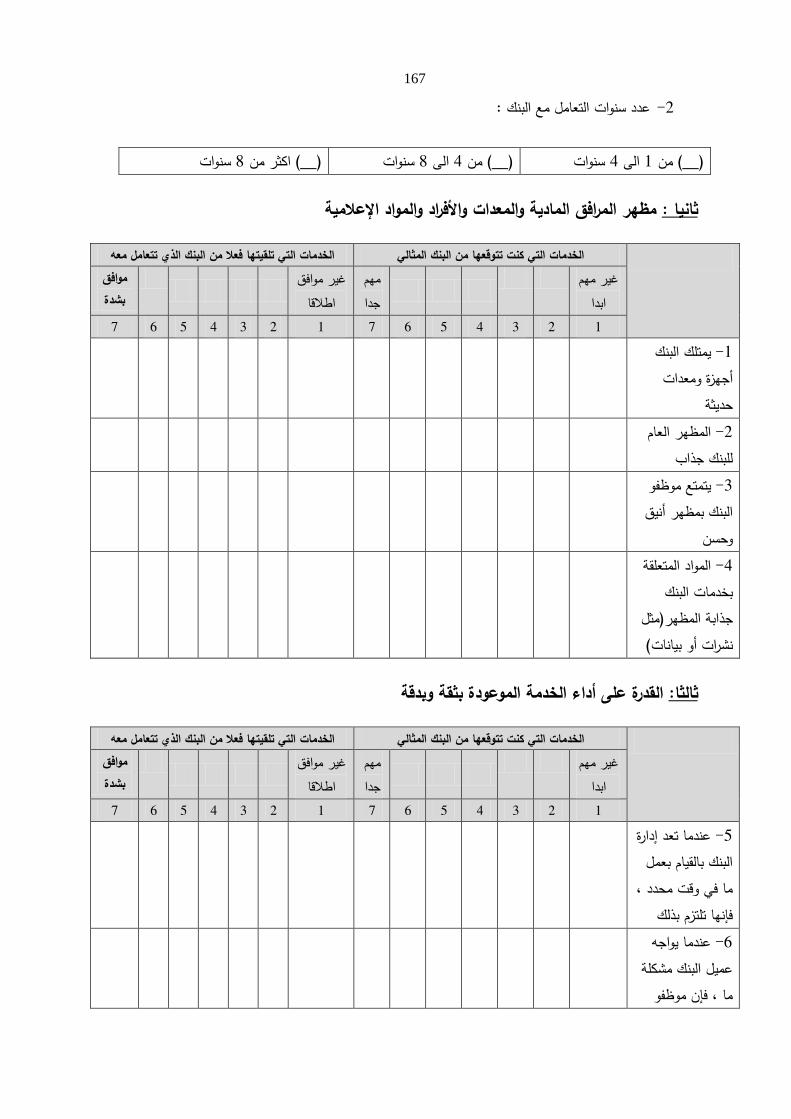
167
عدد سنوات التعامل مع البنك : -2
سنوات 8)__( اكثر من سنوات 8الى 4)__( من سنوات 4الى 1)__( من
مظير المرافق المادية والمعدات واألفراد والمواد اإلعالمية ثانيا :
الخدمات التي تمقيتيا فعال من البنك الذي تتعامل معو الخدمات التي كنت تتوقعيا من البنك المثالي غير ميم
ابدا
ميم جدا
غير موافق اطالقا
موافق
بشدة1 2 3 4 5 6 7 1 2 3 4 5 6 7
يمتمك البنك -1أجيزة ومعدات
حديثة
المظير العام -2 لمبنك جذاب
يتمتع موظفو -3البنك بمظير أنيق
وحسن
المواد المتعمقة -4بخدمات البنك
جذابة المظير)مثل نشرات أو بيانات(
القدرة عمى أداء الخدمة الموعودة بثقة وبدقة ثالثا:
الخدمات التي تمقيتيا فعال من البنك الذي تتعامل معو الخدمات التي كنت تتوقعيا من البنك المثالي غير ميم
ابدا
ميم جدا
موافق غير اطالقا
موافق
بشدة1 2 3 4 5 6 7 1 2 3 4 5 6 7
عندما تعد إدارة -5البنك بالقيام بعمل
ما في وقت محدد ، فإنيا تمتزم بذلك
عندما يواجو -6عميل البنك مشكمة
ما ، فإن موظفو
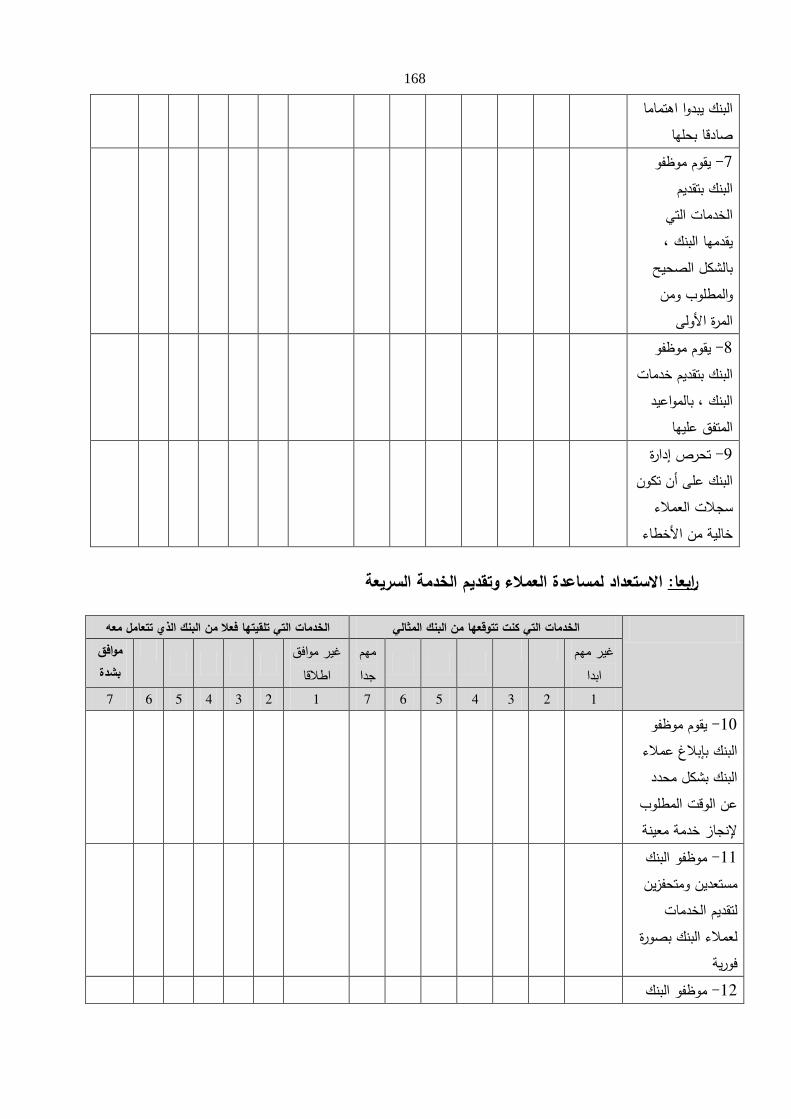
168
البنك يبدوا اىتماما صادقا بحميا
يقوم موظفو -7البنك بتقديم
الخدمات التي يقدميا البنك ،
بالشكل الصحيح والمطموب ومن
المرة األولى
يقوم موظفو -8البنك بتقديم خدمات
البنك ، بالمواعيد المتفق عمييا
تحرص إدارة -9البنك عمى أن تكون
سجالت العمالء خالية من األخطاء
الستعداد لمساعدة العمالء وتقديم الخدمة السريعة رابعا:
الخدمات التي تمقيتيا فعال من البنك الذي تتعامل معو الخدمات التي كنت تتوقعيا من البنك المثالي غير ميم
ابدا
ميم جدا
غير موافق اطالقا
موافق
بشدة1 2 3 4 5 6 7 1 2 3 4 5 6 7
يقوم موظفو -11البنك بإبالغ عمالء البنك بشكل محدد
عن الوقت المطموب إلنجاز خدمة معينة
موظفو البنك -11مستعدين ومتحفزين
لتقديم الخدمات لعمالء البنك بصورة
فورية
موظفو البنك -12
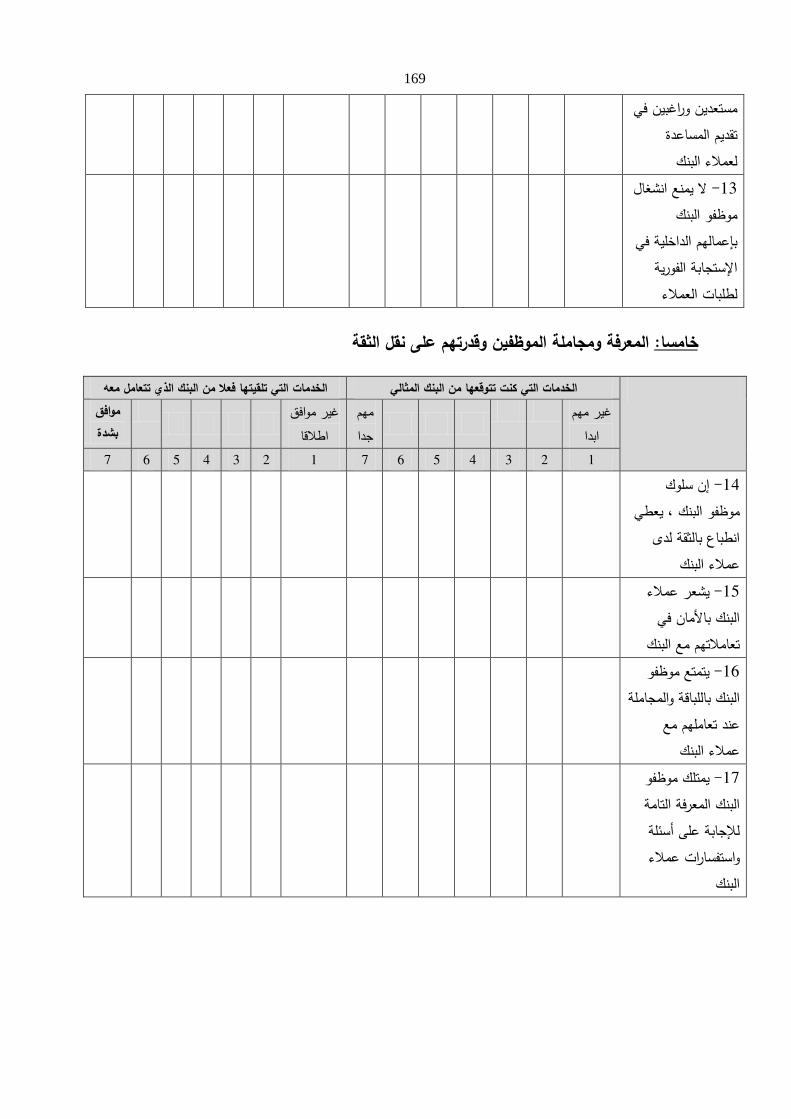
169
مستعدين وراغبين في تقديم المساعدة
لعمالء البنكال يمنع انشغال -13
موظفو البنك بإعماليم الداخمية في
اإلستجابة الفورية لطمبات العمالء
المعرفة ومجاممة الموظفين وقدرتيم عمى نقل الثقة خامسا:
الخدمات التي تمقيتيا فعال من البنك الذي تتعامل معو الخدمات التي كنت تتوقعيا من البنك المثالي غير ميم
ابدا
ميم جدا
غير موافق اطالقا
موافق
بشدة1 2 3 4 5 6 7 1 2 3 4 5 6 7
إن سموك -14موظفو البنك ، يعطي
انطباع بالثقة لدى عمالء البنك
يشعر عمالء -15البنك باألمان في
تعامالتيم مع البنك
يتمتع موظفو -16بالمباقة والمجاممة البنك
عند تعامميم مع عمالء البنك
يمتمك موظفو -17البنك المعرفة التامة لإلجابة عمى أسئمة واستفسارات عمالء
البنك
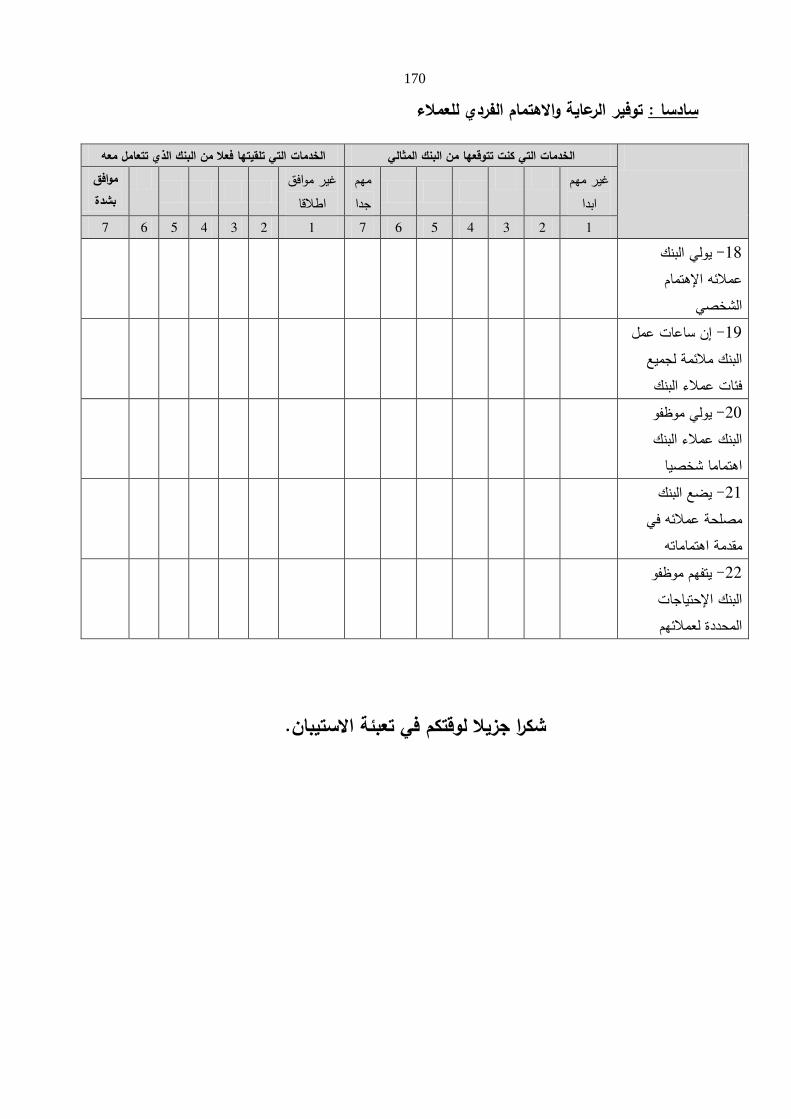
170
توفير الرعاية والىتمام الفردي لمعمالء سادسا :
التي تمقيتيا فعال من البنك الذي تتعامل معو الخدمات الخدمات التي كنت تتوقعيا من البنك المثالي غير ميم
ابدا
ميم جدا
غير موافق اطالقا
موافق
بشدة1 2 3 4 5 6 7 1 2 3 4 5 6 7
يولي البنك -18عمالئو اإلىتمام
الشخصي
إن ساعات عمل -19البنك مالئمة لجميع
فئات عمالء البنك
يولي موظفو -21البنك عمالء البنك
اىتماما شخصيا
يضع البنك -21مصمحة عمالئو في
مقدمة اىتماماتو
يتفيم موظفو -22البنك اإلحتياجات المحددة لعمالئيم
شكرا جزيال لوقتكم في تعبئة الستيبان.
171
Appendix B
Interviews Questions
1. What are the most common factors that prevent meeting customers‟
needs?
2. Based on your experience, what would you say make the customer
satisfied/dissatisfied with the service?
3. What are the most common factors that impact managers‟ and
customers‟ perception of the service quality?
4. Why the customers see the appearance of the banks physical facilities,
equipment, personnel and communication materials below their
expectation?
5. Why the customers see the bank's ability to perform the promised
service dependably and accurately below their expectation?
6. Why the customers see the banks willingness to help them and provide
prompt service below their expectation?
7. Why customers feels the knowledge and courtesy of the bank's
employees and their ability to convey trust and confidence below their
expectation?
8. Why customers feels that the bank caring about them is below their
expectations?
What are the necessary action should be taken by the bank to improve the
service quality?
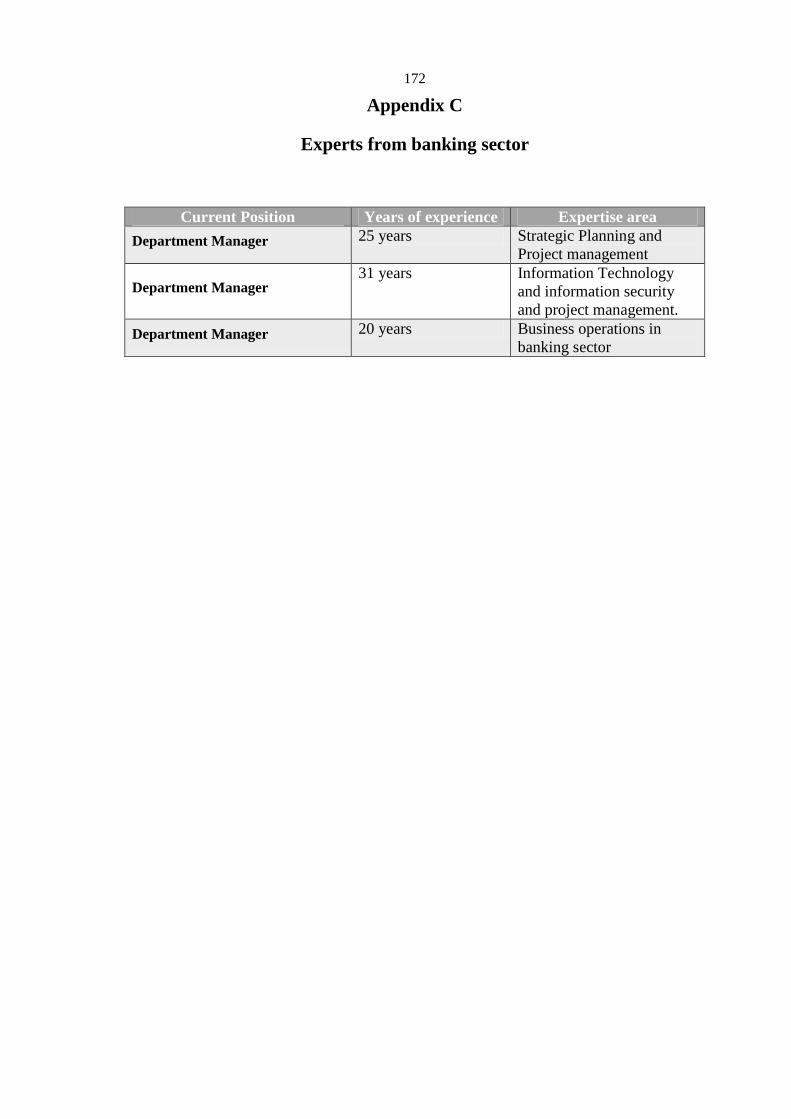
172
Appendix C
Experts from banking sector
Current Position Years of experience Expertise area
Department Manager 25 years Strategic Planning and
Project management
Department Manager 31 years Information Technology
and information security
and project management.
Department Manager 20 years Business operations in
banking sector
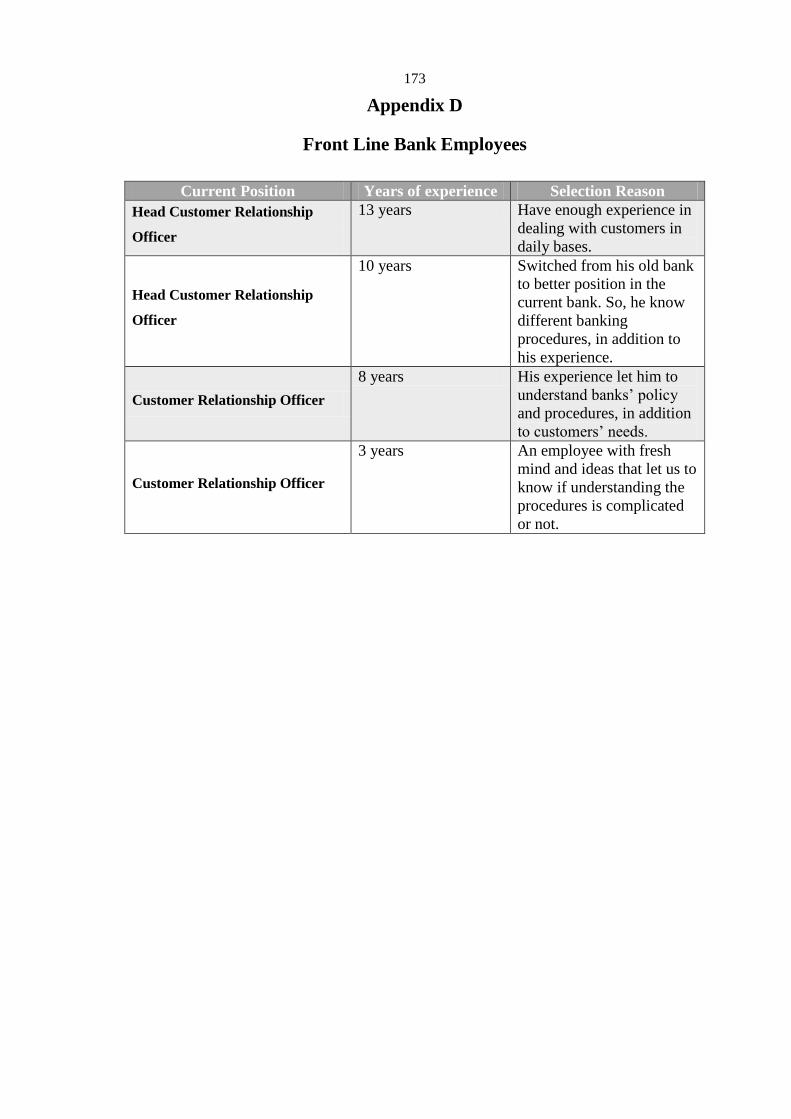
173
Appendix D
Front Line Bank Employees
Current Position Years of experience Selection Reason
Head Customer Relationship
Officer
13 years Have enough experience in
dealing with customers in
daily bases.
Head Customer Relationship
Officer
10 years Switched from his old bank
to better position in the
current bank. So, he know
different banking
procedures, in addition to
his experience.
Customer Relationship Officer
8 years His experience let him to
understand banks‟ policy
and procedures, in addition
to customers‟ needs.
Customer Relationship Officer
3 years An employee with fresh
mind and ideas that let us to
know if understanding the
procedures is complicated
or not.
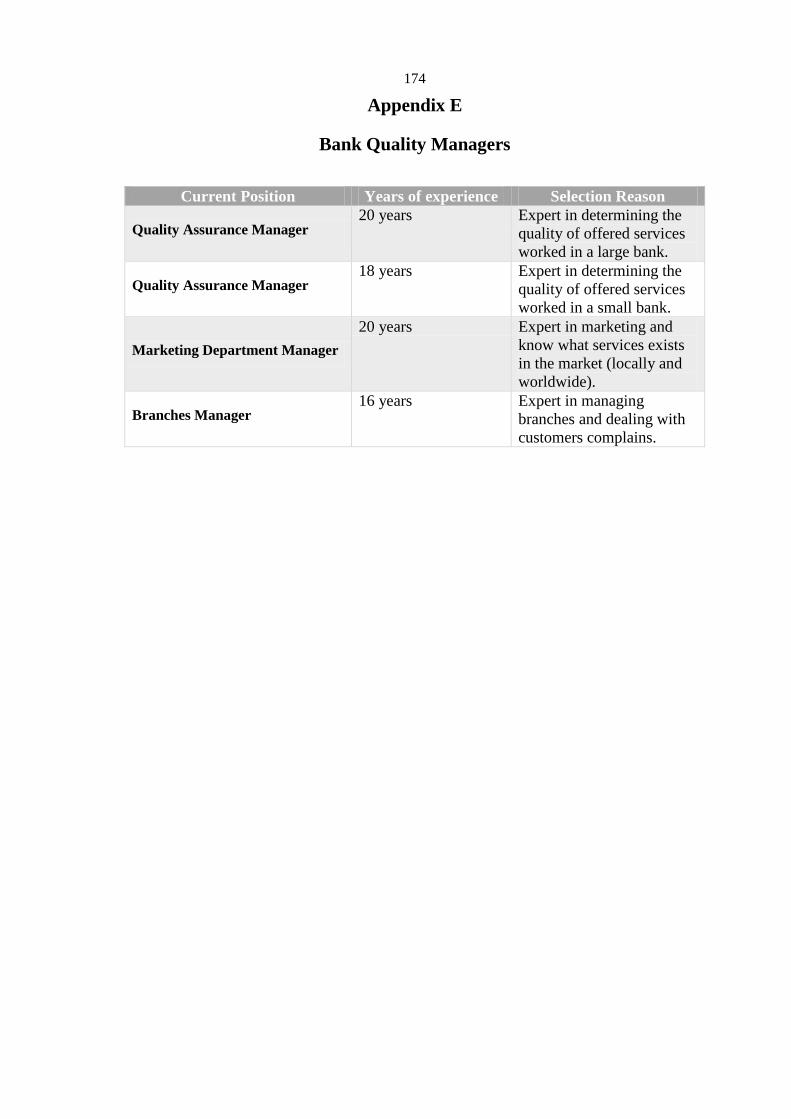
174
Appendix E
Bank Quality Managers
Current Position Years of experience Selection Reason
Quality Assurance Manager 20 years Expert in determining the
quality of offered services
worked in a large bank.
Quality Assurance Manager 18 years Expert in determining the
quality of offered services
worked in a small bank.
Marketing Department Manager
20 years Expert in marketing and
know what services exists
in the market (locally and
worldwide).
Branches Manager 16 years Expert in managing
branches and dealing with
customers complains.
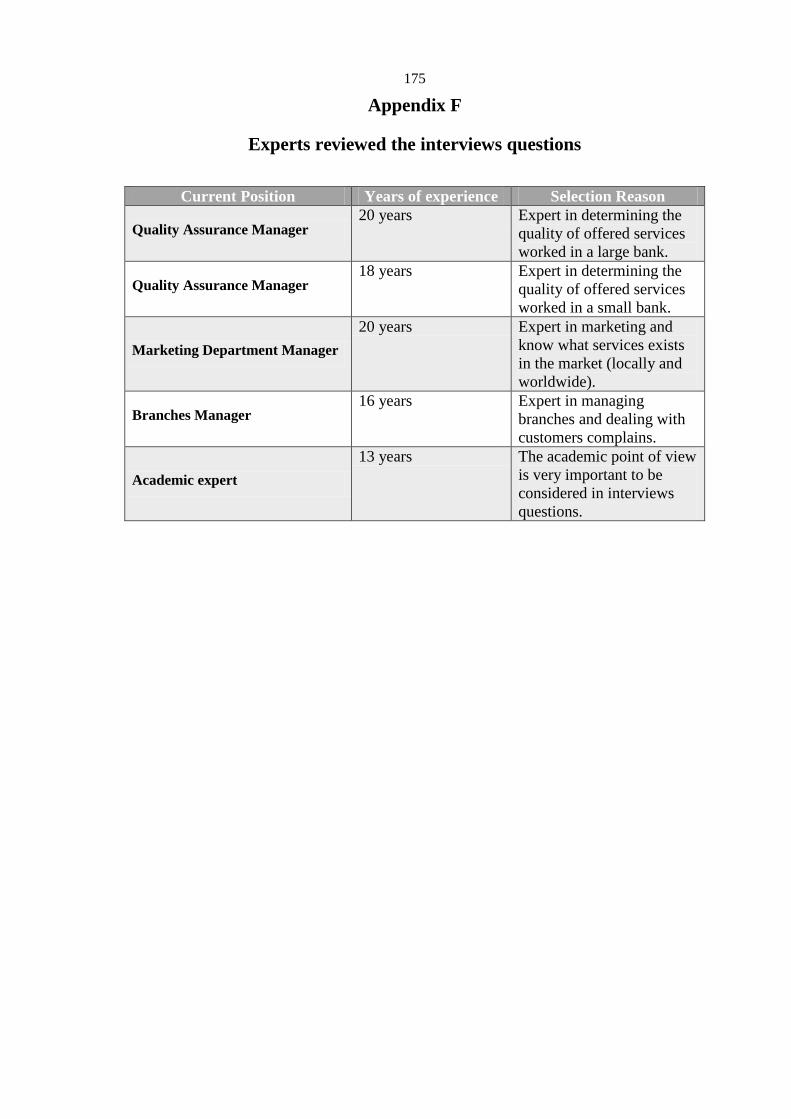
175
Appendix F
Experts reviewed the interviews questions
Current Position Years of experience Selection Reason
Quality Assurance Manager 20 years Expert in determining the
quality of offered services
worked in a large bank.
Quality Assurance Manager 18 years Expert in determining the
quality of offered services
worked in a small bank.
Marketing Department Manager
20 years Expert in marketing and
know what services exists
in the market (locally and
worldwide).
Branches Manager 16 years Expert in managing
branches and dealing with
customers complains.
Academic expert
13 years The academic point of view
is very important to be
considered in interviews
questions.

جامعو النجاح الوطنية كميو الدراسات العميا
: SERVQUALتقييم جودة الخدمة ورضا الزبون باستخدام نموذج دراسة حالة البنوك الفمسطينية
اعداد جمال الدين كمال نايف عوكل
إشراف اييم جعروند.
اليندسية، اإلدارة في الماجستير درجة عمى الحصول لمتطمبات األطروحة استكمالً ىذه قدمت .فمسطين -نابمس الوطنية، النجاح جامعة في العميا، كمية الدراسات في
2463

Lب
: دراسة حالةSERVQUALتقييم جودة الخدمة ورضا الزبون باستخدام نموذج البنوك الفمسطينية
اعداد جمال الدين كمال نايف عوكل
إشراف د. اييم جعرون
الممخص
القطاعيعتبر القطاع المصرفي احد اىم القطاعات المؤثرة في االقتصاد الفمسطيني. ولكن ىذا جودة الخدمة الى جودة الخدمة المقدمة الى العمالء. لذلك تيدف ىذه الدراسة الى تقييم يفتقر
الخدمات المقدمة ليم من قبل البنوك التقميدية في فمسطين. حيث ان عنمدى رضا العمالء و يسعى ىذا البحث إلى فيم كيفية تنفيذ كما في القطاع المصرفي. و مؤثر لرضا العمالء دور فعال
ا يترتب عمى ذلك من آثار عمى السوق المحمي.جودة الخدمة في البنوك التقميدية الفمسطينية ومالتي تقييم مستوى رضا العمالء في البنوك التقميدية البحوث أوائل ىذا البحث من ويعتبر
مماثمة في القطاع المصرفي الفمسطيني.ال قمة البحوثالفمسطينية، بسبب
اوال تم استخدام .قام الباحث باستخدام منيجية مختمطة لجمع البيانات بالطرق الكمية والنوعية وعميوجمع البيانات الكمية. لكأداة وماخداست وذلك ليتم استبيانإلنشاء SERVQUALنموذج
استبيان معبأ بشكل كامل، وتم تحميل ىذه 397استبيان، وتم تحميل 451قام الباحث بتوزيع قام الباحث باستخدام . كما SPSS برنامج ىواالستبيانات باستخدام برنامج حاسوبي متخصص و
لمحصول عمى نتائج دقيقة، وذلك الن طرق االحصاء الالمعممي مثل: مان وتني، ووليكسونومن ناحية اخرى قام الباحث بدعم وتفسير نتائج تحميل البيانات كانت موزعة توزيع غير طبيعي.
البيانات الكمية باستخدام الطرق النوعية، حيث تم عمل مقابالت شبو منظمو وتحميميا باستخدام طرق تحميل الموضوعات.

Lج
، واظيرت النتائج SERVQUALالخمس الخاصة بنموذج المجاالتقام الباحث بفحص ومن ثم الفمسطينية تواجو ضعف عام في مستوى جودة الخدمة، كما التقميديةان العمالء يعتقدون ان البنوك
بين تصورات العمالء الفجوةالتعاطف، وذلك بسبب كبر مجالتبين ان اكبر ضعف كان في ومن ثم يتبعو مجال الثقة ومن ثم االعتماديةمن قبل البنوك. و بالنسبة لمخدمات المقدمة توقعاتيم و
. اما اصغر فجوه فكانت في مجال العناصر الممموسة. كما قام الباحث بفحص تأثير االستجابةالمقدمة لمعمالء. وقد اظيرت النتائج ان جنس ات مستقمة عمى مستوى جودة الخدمات ثالث متغير
مة المدركة والمتوقعة. ولم تظير النتائج اي تأثير لعدد السنوات العميل لو تأثير عمى مستوى الخد بيا العميل مع البنك او حجم البنك عمى مستوى جودة الخدمة.تعامل التي
مدراء جودة نتائج ىذه الدراسة، فام الباحث بتطوير نموذج اداري يمكن ان يساعد في ضوءو مستوى رضا العمالء عن الخدمات المقدمة ليم، تحسين ميدية الفمسطينية، لقتالخدمة في البنوك ال
من خالل تحسين جودة الخدمات المصرفية.

Related Documents