Abstract The rapid development of microarray technol- ogies has raised many challenging problems in experi- ment design and data analysis. Although many numerical algorithms have been successfully applied to analyze gene expression data, the effects of variations and uncer- tainties in measured gene expression levels across samples and experiments have been largely ignored in the literature. In this article, in the context of hierarchi- cal clustering algorithms, we introduce a statistical resampling method to assess the reliability of gene clus- ters identified from any hierarchical clustering method. Using the clustering trees constructed from the resam- pled data, we can evaluate the confidence value for each node in the observed clustering tree. A majority-rule consensus tree can be obtained, showing clusters that on- ly occur in a majority of the resampled trees. We illus- trate our proposed methods with applications to two pub- lished data sets. Although the methods are discussed in the context of hierarchical clustering methods, they can be applied with other cluster-identification methods for gene expression data to assess the reliability of any gene cluster of interest. Keywords Gene expression · Hierarchical clustering · Bootstrap · Consensus tree Introduction Recent development of microarray technologies has made it possible to simultaneously measure expression levels of tens of thousands of genes, and shifted our at- tention towards an integrated understanding of the gene- tic networks underlying complex biological phenotypes. Large-scale gene expression studies have been carried out to study cell cycle (Eisen et al. 1998), tumor tissues (DeRisi et al. 1996; Khan et al. 1999), drug targets (Debouck and Goodfellow 1999; Marton et al. 1998), and resequence and mutational analysis (Hacia 1999). Generally speaking, statistical methods can be developed to address three types of questions using microarray data, which are, in order of complexity: Which genes are differently expressed among the samples studied? Which genes are expressed in a coordi- nated manner across a set of conditions? What are the global biological pathways? Although the ultimate goal is to identify genetic net- work architectures (the third question), the amount of in- formation required to achieve this goal may be, at this point, beyond experimental capacity for complex sys- tems. As a first step towards this ultimate goal, many ex- isting statistical procedures, most notably a variety of clustering algorithms, have been applied to analyze mi- croarray data to identify genes expressed in a coordinat- ed manner (the second question). These methods include hierarchical clustering algorithms (e.g., Eisen et al. 1998; Heyer et al. 1999), principal components analysis (e.g., Hilsenbeck et al. 1999; Raychaudhuri et al. 2000), multi- dimensional scaling methods (e.g., D’Haeseleer et al. 1998), self-organizing maps (Tamayo et al. 1999; Törönen et al. 1999), and graph-theoretic techniques (Ben-Dor and Yakhini 1999). They all fall into the unsu- pervised analysis category in contrast to the supervised learning algorithms, where there are some pre-defined classes, either for tissue samples (e.g., Golub et al. 1999) or for gene groups (e.g., Brown et al. 2000). These clus- tering methods have been found to work well in practice because genes with related functions were found to be enriched in particular clusters (Eisen et al. 1998), normal tissue samples and tumors can be classified with very high accuracy using gene expression data (Alon et al. 1999), and similarities and differences among tumors that cannot be recognized by traditional morphological examination can be identified through gene expression data (Anbazhagan et al. 1999; Golub et al. 1999). Although the above approaches have proved valuable in gene expression pattern detection, most published K. Zhang · H. Zhao ( ✉ ) Department of Epidemiology and Public Health, Yale University School of Medicine, New Haven, CT 06520, USA e-mail: [email protected] Tel.: +1-203-7856271, Fax: +1-203-7856912 Funct Integr Genomics (2000) 1:156–173 DOI 10.1007/s101420000019 ORIGINAL PAPER Kui Zhang · Hongyu Zhao Assessing reliability of gene clusters from gene expression data Received: 4 May 2000 / Accepted: 5 July 2000 / Published online: 23 August 2000 © Springer-Verlag 2000

Welcome message from author
This document is posted to help you gain knowledge. Please leave a comment to let me know what you think about it! Share it to your friends and learn new things together.
Transcript
Abstract The rapid development of microarray technol-ogies has raised many challenging problems in experi-ment design and data analysis. Although many numericalalgorithms have been successfully applied to analyzegene expression data, the effects of variations and uncer-tainties in measured gene expression levels across samples and experiments have been largely ignored inthe literature. In this article, in the context of hierarchi-cal clustering algorithms, we introduce a statistical resampling method to assess the reliability of gene clus-ters identified from any hierarchical clustering method.Using the clustering trees constructed from the resam-pled data, we can evaluate the confidence value for eachnode in the observed clustering tree. A majority-ruleconsensus tree can be obtained, showing clusters that on-ly occur in a majority of the resampled trees. We illus-trate our proposed methods with applications to two pub-lished data sets. Although the methods are discussed inthe context of hierarchical clustering methods, they canbe applied with other cluster-identification methods forgene expression data to assess the reliability of any genecluster of interest.
Keywords Gene expression · Hierarchical clustering ·Bootstrap · Consensus tree
Introduction
Recent development of microarray technologies hasmade it possible to simultaneously measure expressionlevels of tens of thousands of genes, and shifted our at-tention towards an integrated understanding of the gene-tic networks underlying complex biological phenotypes.Large-scale gene expression studies have been carriedout to study cell cycle (Eisen et al. 1998), tumor tissues
(DeRisi et al. 1996; Khan et al. 1999), drug targets (Debouck and Goodfellow 1999; Marton et al. 1998),and resequence and mutational analysis (Hacia 1999).Generally speaking, statistical methods can be developedto address three types of questions using microarray data, which are, in order of complexity:
Which genes are differently expressed among thesamples studied? Which genes are expressed in a coordi-nated manner across a set of conditions? What are theglobal biological pathways?
Although the ultimate goal is to identify genetic net-work architectures (the third question), the amount of in-formation required to achieve this goal may be, at thispoint, beyond experimental capacity for complex sys-tems. As a first step towards this ultimate goal, many ex-isting statistical procedures, most notably a variety ofclustering algorithms, have been applied to analyze mi-croarray data to identify genes expressed in a coordinat-ed manner (the second question). These methods includehierarchical clustering algorithms (e.g., Eisen et al. 1998;Heyer et al. 1999), principal components analysis (e.g.,Hilsenbeck et al. 1999; Raychaudhuri et al. 2000), multi-dimensional scaling methods (e.g., D’Haeseleer et al.1998), self-organizing maps (Tamayo et al. 1999;Törönen et al. 1999), and graph-theoretic techniques(Ben-Dor and Yakhini 1999). They all fall into the unsu-pervised analysis category in contrast to the supervisedlearning algorithms, where there are some pre-definedclasses, either for tissue samples (e.g., Golub et al. 1999)or for gene groups (e.g., Brown et al. 2000). These clus-tering methods have been found to work well in practicebecause genes with related functions were found to beenriched in particular clusters (Eisen et al. 1998), normaltissue samples and tumors can be classified with veryhigh accuracy using gene expression data (Alon et al.1999), and similarities and differences among tumorsthat cannot be recognized by traditional morphologicalexamination can be identified through gene expressiondata (Anbazhagan et al. 1999; Golub et al. 1999).
Although the above approaches have proved valuablein gene expression pattern detection, most published
K. Zhang · H. Zhao (✉ )Department of Epidemiology and Public Health, Yale University School of Medicine, New Haven, CT 06520, USAe-mail: [email protected].: +1-203-7856271, Fax: +1-203-7856912
Funct Integr Genomics (2000) 1:156–173DOI 10.1007/s101420000019
O R I G I N A L PA P E R
Kui Zhang · Hongyu Zhao
Assessing reliability of gene clusters from gene expression data
Received: 4 May 2000 / Accepted: 5 July 2000 / Published online: 23 August 2000© Springer-Verlag 2000
157
large-scale studies are quite elusive over the variations inmeasured gene expression levels among different sam-ples and experiments. For glass slide arrays, up to two-fold differences among replicated experiments are com-monly observed. Mir and Southern (1999) studied the ef-fect of structure on nucleic acid heteroduplex formationby analyzing hybridization of tRNA to a complete set ofcomplementary oligonucleotides ranging from single nu-cleotides to dodecanucleotides. They found that majordeterminants of hybridization lie in the structure of theRNA. Their finding is very relevant to gene expressionstudies using Affymetrix GeneChip microarrays, where20 pairs of oligonucleotides corresponding to the samegene or EST are hybridized to the sample and a singleexpression level is derived from these 40 observations.
In essentially all published studies, the observed geneexpression levels are treated as if they were an accuratemeasure of the true expression level, and the effects ofmeasurement errors have seldom been addressed. How-ever, it is not apparent how variations in the measure-ments might affect the conclusions drawn from thesestudies. For example, if we have identified a group of tengenes with similar expression profiles, we need to deter-mine whether this cluster is a real cluster or a superficialone resulting from random variations in gene expressionmeasurements. Therefore, it is both desirable and crucialto assess the reliability and statistical significance of anindividual gene cluster of interest. In this article, as afirst step towards an understanding of the effects of mea-surement errors on cluster identification, we propose aresampling method under the hierarchical clusteringframework, the most commonly used approach in micro-array analysis. Our procedure can be divided into threesteps: we first generate a large number of resampled mi-croarray data with information on the magnitude of mea-surement errors; we then use the majority-rule to con-struct a consensus tree; and lastly, we estimate the confi-dence value for each branch in the clustering tree fromthe original data set. In this article, we describe ourmethods and apply them to two published data sets. Al-though most of the discussion is within the context of hi-erarchical clustering algorithms, our methods can be ap-plied to other unsupervised or supervised algorithms toassess the effects of measurement errors on cluster iden-tification.
Materials and methods
Hierarchical clustering algorithms
There is a large volume of literature on cluster analysis in statistics(e.g., Hartigan 1975), and many methods are available in generalstatistics packages (e.g., S-Plus, SAS) and specialized programs(e.g., PHYLIP). The hierarchical clustering methods are common-ly used because of their simplicity and fast running time. The firststep of a hierarchical clustering algorithm is to select an appropri-ate mathematical description of similarity. There are many possi-ble similarity measures that can be used, including euclidean dis-tance, Pearson correlation coefficient, and rank correlation. Theactual choice should reflect the nature of the biological question
and the technology that was used to obtain the data. After calculat-ing similarities among all the genes, the second step in a hierarchi-cal clustering algorithm is to join the two most similar objects intoa single cluster and recompute the similarity matrix. Three com-mon options for this step are single linkage, average linkage, andcomplete linkage. These options differ in how the similarity ma-trix is recomputed among clusters. The process ends when all theobjects agglomerate to a single cluster. We can use a binary tree torepresent the result of a hierarchical clustering algorithm. It is notthe purpose of this paper to survey all hierarchical clusteringmethods available, but rather to illustrate how to use the proposedresampling method to study the influence of random errors oncluster identification and make a statistical inference from the re-sulting clustering tree.
Resampling methods
Statistical resampling methods have been used extensively in ge-netic research. In the context of phylogenetic analysis, Felsenstein(1985) proposed using the bootstrap method to estimate the confi-dence value for each clade in a phylogenetic tree. Although therehas been some criticism of this method (e.g., Hillis and Bull1993), Efron et al. (1996) showed that Felsenstein’s method is notbiased, and it can be corrected to better agree with standard ideasof confidence levels and hypothesis testing at the expense of con-siderably more computation.
Because bootstrap has been well studied in statistics (e.g., Efron 1979; Efron and Tibshirani 1993), we describe this methodonly briefly here. Suppose we have an original data set with n ob-servations and we want to make a statistical inference of a popula-tion parameter from this data set. We first compute a sample statis-tic to estimate the population parameter. In the typical bootstrapmethod (also called nonparametric bootstrap), we sample n obser-vations at random with replacement from the observed sample.Using the bootstrap method, some data points will not be includedin the bootstrap data set, some data points will be included onlyonce, and still others will be included twice or more. We thencompute the sample statistic based on this bootstrap data set. If werepeat the bootstrap procedure a large number of times, theamount of variation in the sample statistics calculated from thebootstrap data sets can be used to assess the uncertainty in our es-timate of the population parameter.
Because of the nature of gene expression data, we adopt herethe parametric bootstrap method. Suppose we know the uncer-tainty (standard error) in our measure of gene expression data. Thestandard errors can be estimated from replicated experiments inthe study (e.g., Wen et al. 1998) or from previous experimentswith similar conditions. Let xij denote the gene expression for genei at condition j and let sij denote our estimated variation for thismeasure. In our resampling approach, we “bootstrap” the gene ex-pression level for each gene under each experimental conditionfrom the normal distribution N(xij, sij). Simulated data can also begenerated assuming other distributions for the gene expressionmeasurements. For example, we simulate data from log-normaldistributions in the Discussion section. We then construct a binarytree (which will be rigorously defined in the next section) by usinga hierarchical clustering algorithm. For a large number of resam-pled data sets, we can generate a set of binary trees. These treescan then be used to assess the reliability of the clusters observed inthe original data set as discussed in the following. Note that if weassume the gene expression measurement follows a non-normaldistribution, we will sample the “new” measurement from this dis-tribution.
Consensus tree
From the binary trees constructed using the resampled data, wecan define a consensus tree made up of all those nodes that appearin a majority of these resampled trees (Margush and McMorris1981; Felsenstein 1985). The definition of the majority-consensustree is given below following Margush and McMorris (1981).
158
First, we must give a more rigorous representation of a treeand a binary tree. If S={1,2,...,n} is a set of n objects (e.g., genesor tissue samples), then an n-tree is a type of hierarchical classifi-cation of S with the following definition:
Definition (Margush and McMorris 1981)
Let P(S) denote the set of all subsets of S. An n-tree is a subset Tof P(S) satisfying the following three conditions:
1. S ∈ T, Φ∉ Τ.
2. {i}∈ T for all i ∈ S.
3. If A, B∈ T with A∩ B≠Φ, then A�B or B�A.
Definition
An n-tree T is a binary tree if for any subset A ∈ B and |A|≠1, then
�A1∈ T and A2∈ T satisfy A=A1∪ A2.
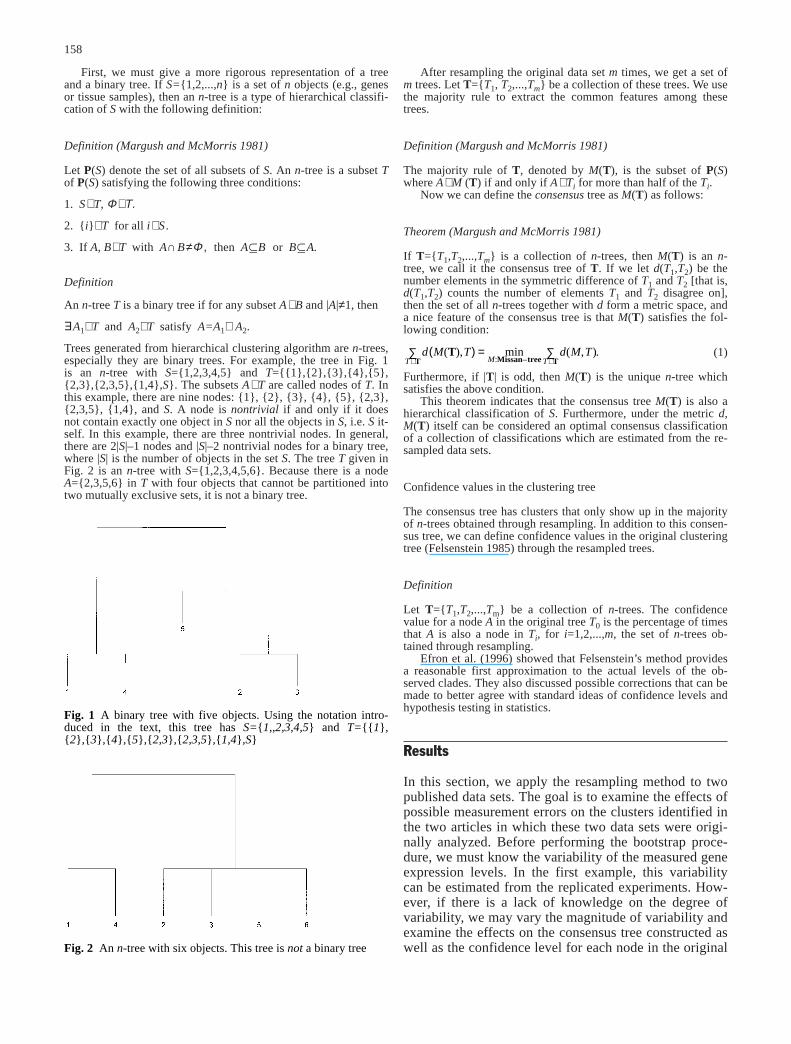
Trees generated from hierarchical clustering algorithm are n-trees,especially they are binary trees. For example, the tree in Fig. 1 is an n-tree with S={1,2,3,4,5} and T={{1},{2},{3},{4},{5},{2,3},{2,3,5},{1,4},S}. The subsets A ∈ T are called nodes of T. Inthis example, there are nine nodes: {1}, {2}, {3}, {4}, {5}, {2,3},{2,3,5}, {1,4}, and S. A node is nontrivial if and only if it doesnot contain exactly one object in S nor all the objects in S, i.e. S it-self. In this example, there are three nontrivial nodes. In general,there are 2|S|–1 nodes and |S|–2 nontrivial nodes for a binary tree,where |S| is the number of objects in the set S. The tree T given inFig. 2 is an n-tree with S={1,2,3,4,5,6}. Because there is a nodeA={2,3,5,6} in T with four objects that cannot be partitioned intotwo mutually exclusive sets, it is not a binary tree.
After resampling the original data set m times, we get a set ofm trees. Let T={T1, T2,...,Tm} be a collection of these trees. We usethe majority rule to extract the common features among thesetrees.
Definition (Margush and McMorris 1981)
The majority rule of T, denoted by M(T), is the subset of P(S)where A ∈ M (T) if and only if A ∈ Ti for more than half of the Ti.
Now we can define the consensus tree as M(T) as follows:
Theorem (Margush and McMorris 1981)
If T={T1,T2,...,Tm} is a collection of n-trees, then M(T) is an n-tree, we call it the consensus tree of T. If we let d(T1,T2) be thenumber elements in the symmetric difference of T1 and T2 [that is,d(T1,T2) counts the number of elements T1 and T2 disagree on],then the set of all n-trees together with d form a metric space, anda nice feature of the consensus tree is that M(T) satisfies the fol-lowing condition:
(1)
Furthermore, if |T| is odd, then M(T) is the unique n-tree whichsatisfies the above condition.
This theorem indicates that the consensus tree M(T) is also ahierarchical classification of S. Furthermore, under the metric d,M(T) itself can be considered an optimal consensus classificationof a collection of classifications which are estimated from the re-sampled data sets.
Confidence values in the clustering tree
The consensus tree has clusters that only show up in the majorityof n-trees obtained through resampling. In addition to this consen-sus tree, we can define confidence values in the original clusteringtree (Felsenstein 1985) through the resampled trees.
Definition
Let T={T1,T2,...,Tm} be a collection of n-trees. The confidencevalue for a node A in the original tree T0 is the percentage of timesthat A is also a node in Ti, for i=1,2,...,m, the set of n-trees ob-tained through resampling.
Efron et al. (1996) showed that Felsenstein’s method providesa reasonable first approximation to the actual levels of the ob-served clades. They also discussed possible corrections that can bemade to better agree with standard ideas of confidence levels andhypothesis testing in statistics.
Results
In this section, we apply the resampling method to twopublished data sets. The goal is to examine the effects ofpossible measurement errors on the clusters identified inthe two articles in which these two data sets were origi-nally analyzed. Before performing the bootstrap proce-dure, we must know the variability of the measured geneexpression levels. In the first example, this variabilitycan be estimated from the replicated experiments. How-ever, if there is a lack of knowledge on the degree ofvariability, we may vary the magnitude of variability andexamine the effects on the consensus tree constructed aswell as the confidence level for each node in the original
d M T d M TT M T
( ), min ( , ).:
TT Missan–tree T
( )∑ = ∑∈ ∈
Fig. 1 A binary tree with five objects. Using the notation intro-duced in the text, this tree has S={1,,2,3,4,5} and T={{1},{2},{3},{4},{5},{2,3},{2,3,5},{1,4},S}
Fig. 2 An n-tree with six objects. This tree is not a binary tree
159
Fig. 3 The clustering tree for the data set in Wen et al. (1998),with the distance for each node
160
tree. This approach will be utilized in our analysis of thesecond data set.
Temporal gene expression mapping of central nervoussystem development
In their study of rat central nervous system development,Wen et al. (1998) used reverse transcription-coupledPCR (RT-PCR) to produce a temporal map of fluctua-tions in mRNA expression of 112 genes. Using distancematrices for the pairwise comparison of these genes,they distinguished six gene clusters. They noted thatgenes belonging to distinct functional classes and genefamilies map to particular expression files. Their data setis available at http://rsb.info.nih.gov/molphysiol/PNAS/GEMtable.html. In the table provided by the authors,there are raw ratio-metric RT-PCR data from triplicateexperiments and the standard error for each gene. Thegene expression levels used in our analysis were the av-erage from the three replicated experiments and the stan-dard errors were also estimated from the same three ex-perimental measurements. This data set suits our illustra-tion purpose well because of the availability of the estimate of variation in the observed gene expressionlevels.
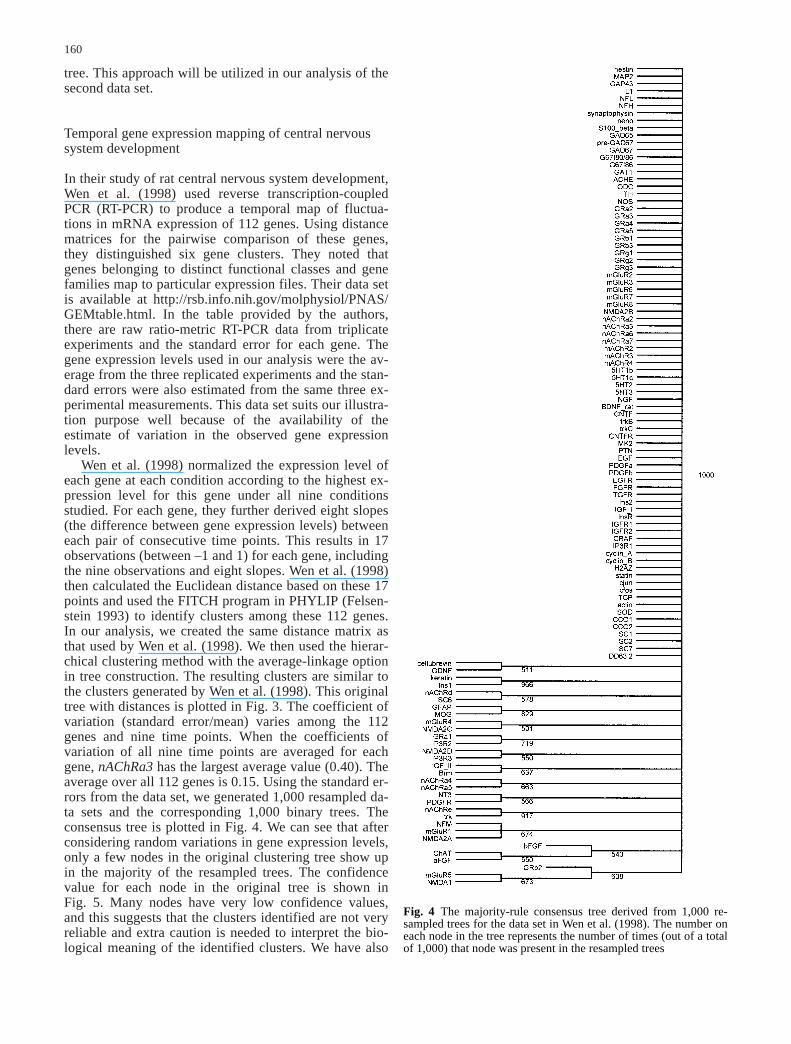
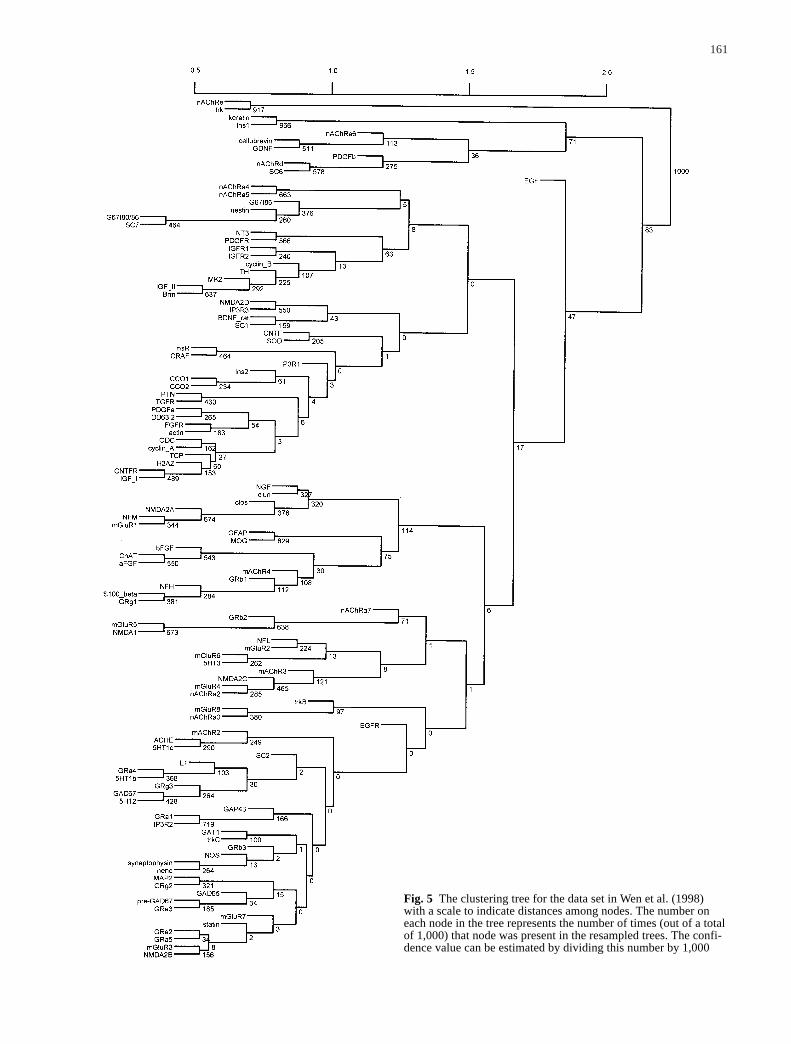
Wen et al. (1998) normalized the expression level ofeach gene at each condition according to the highest ex-pression level for this gene under all nine conditionsstudied. For each gene, they further derived eight slopes(the difference between gene expression levels) betweeneach pair of consecutive time points. This results in 17observations (between –1 and 1) for each gene, includingthe nine observations and eight slopes. Wen et al. (1998)then calculated the Euclidean distance based on these 17points and used the FITCH program in PHYLIP (Felsen-stein 1993) to identify clusters among these 112 genes.In our analysis, we created the same distance matrix asthat used by Wen et al. (1998). We then used the hierar-chical clustering method with the average-linkage optionin tree construction. The resulting clusters are similar tothe clusters generated by Wen et al. (1998). This originaltree with distances is plotted in Fig. 3. The coefficient ofvariation (standard error/mean) varies among the 112genes and nine time points. When the coefficients ofvariation of all nine time points are averaged for eachgene, nAChRa3 has the largest average value (0.40). Theaverage over all 112 genes is 0.15. Using the standard er-rors from the data set, we generated 1,000 resampled da-ta sets and the corresponding 1,000 binary trees. Theconsensus tree is plotted in Fig. 4. We can see that afterconsidering random variations in gene expression levels,only a few nodes in the original clustering tree show upin the majority of the resampled trees. The confidencevalue for each node in the original tree is shown inFig. 5. Many nodes have very low confidence values,and this suggests that the clusters identified are not veryreliable and extra caution is needed to interpret the bio-logical meaning of the identified clusters. We have also
Fig. 4 The majority-rule consensus tree derived from 1,000 re-sampled trees for the data set in Wen et al. (1998). The number oneach node in the tree represents the number of times (out of a totalof 1,000) that node was present in the resampled trees
161
Fig. 5 The clustering tree for the data set in Wen et al. (1998)with a scale to indicate distances among nodes. The number oneach node in the tree represents the number of times (out of a totalof 1,000) that node was present in the resampled trees. The confi-dence value can be estimated by dividing this number by 1,000
162
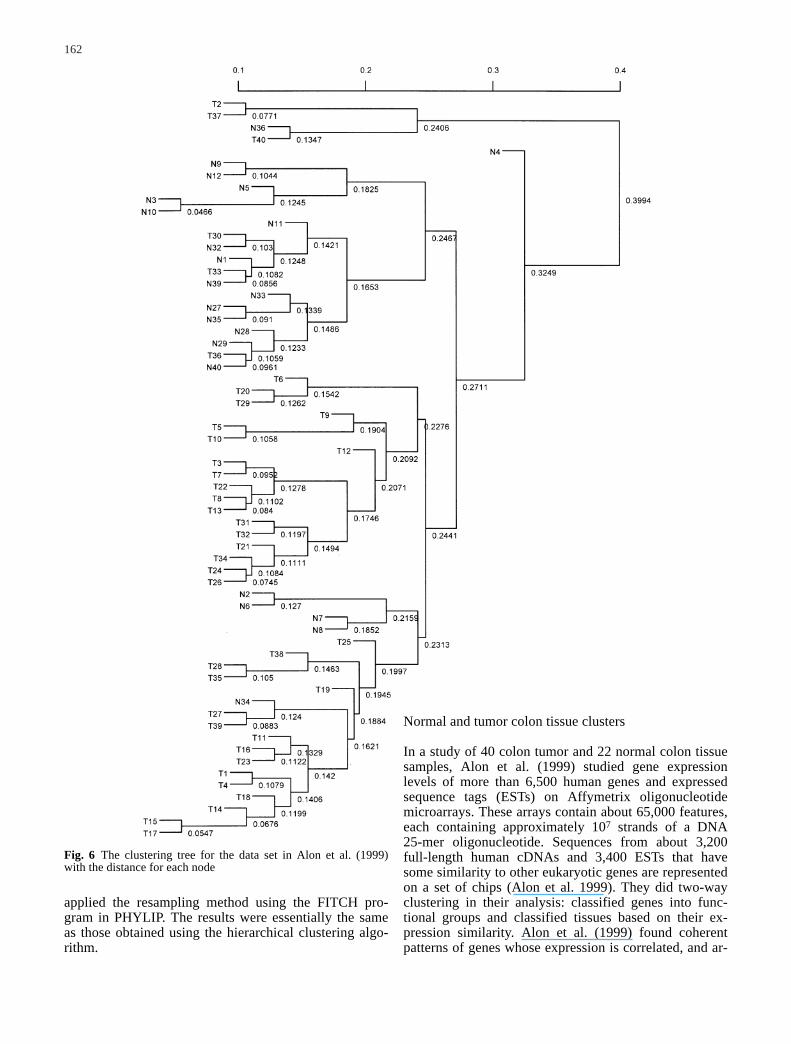
Fig. 6 The clustering tree for the data set in Alon et al. (1999)with the distance for each node
Normal and tumor colon tissue clusters
In a study of 40 colon tumor and 22 normal colon tissuesamples, Alon et al. (1999) studied gene expression levels of more than 6,500 human genes and expressedsequence tags (ESTs) on Affymetrix oligonucleotide microarrays. These arrays contain about 65,000 features,each containing approximately 107 strands of a DNA 25-mer oligonucleotide. Sequences from about 3,200full-length human cDNAs and 3,400 ESTs that havesome similarity to other eukaryotic genes are representedon a set of chips (Alon et al. 1999). They did two-wayclustering in their analysis: classified genes into func-tional groups and classified tissues based on their ex-pression similarity. Alon et al. (1999) found coherentpatterns of genes whose expression is correlated, and ar-
applied the resampling method using the FITCH pro-gram in PHYLIP. The results were essentially the sameas those obtained using the hierarchical clustering algo-rithm.
163
gued that this suggests a high degree of organization un-derlying gene expression in these tissues. Two thousandgenes with the highest minimal intensity across the samples are available from the web (http://www.molbio.princeton.edu/colondata). Among the 2,000 genes, threeESTs (HSAC07, UMGAP, and i) were listed four timeswith the same name and identical expression levels. Af-ter removing nine duplicates for these three ESTs, we gota data matrix with 62 columns and 1,991 rows. Every
column in this matrix represents a tumor or normal tissuesample, and every row corresponds to a gene or an EST.Alon et al. (1999) used the deterministic-annealing algo-rithm in their analysis. When we used the correlation coefficient as the similarity measure and the average-linkage hierarchical clustering method to classify thenormal and tumor colon tissues, we obtained essentiallythe same tree structure. This original tree with distancesis shown in Fig. 6.
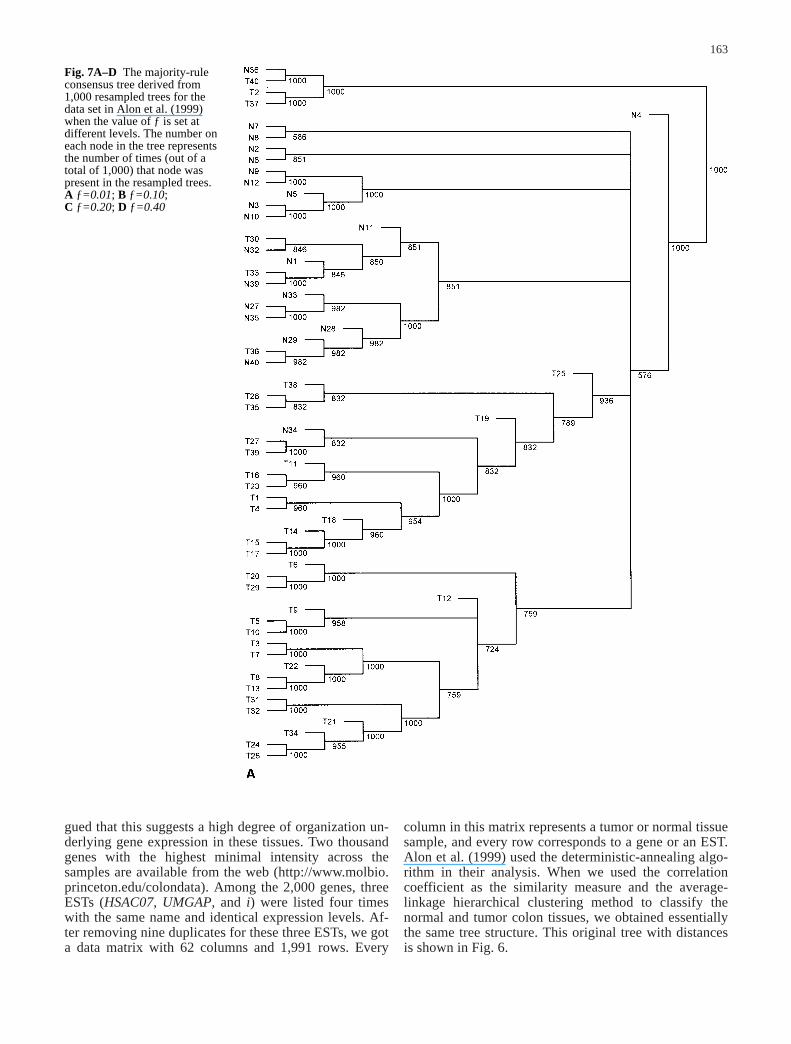
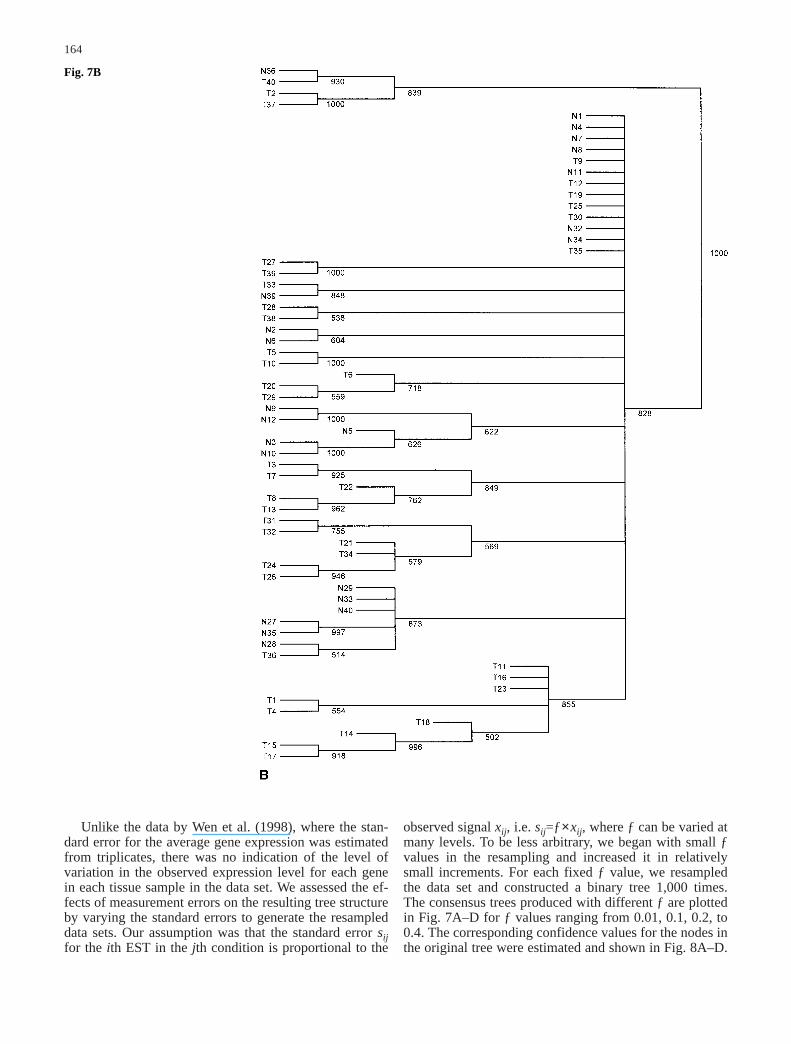
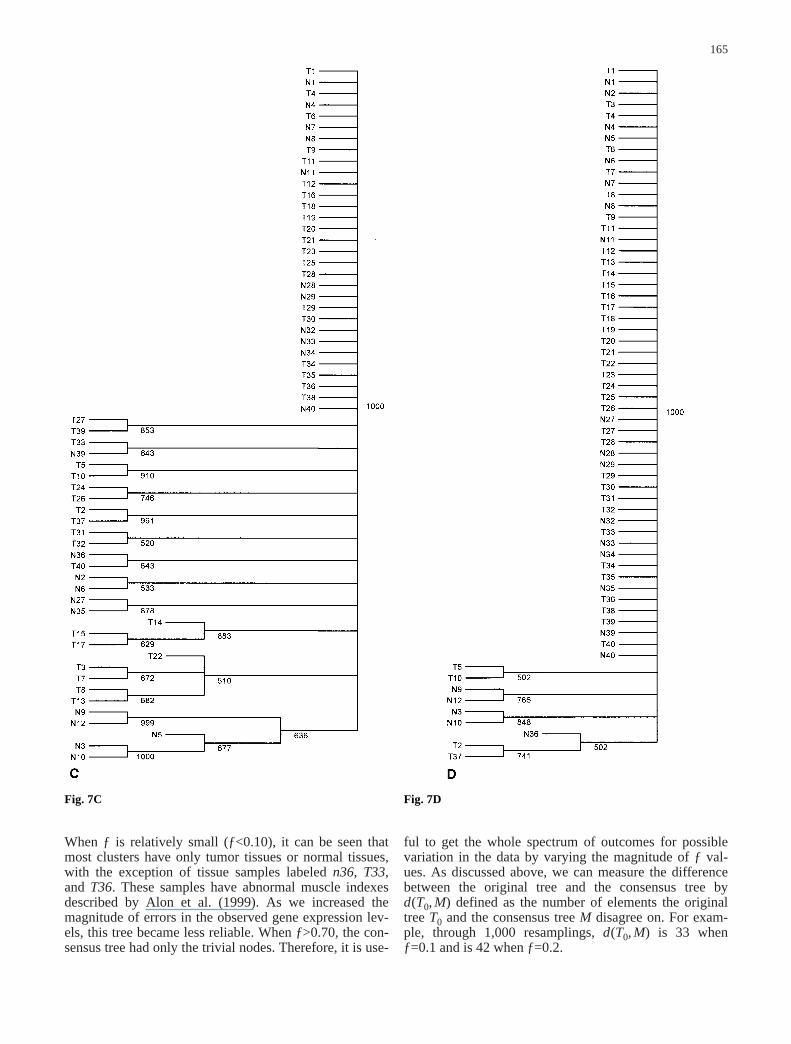
Fig. 7A–D The majority-ruleconsensus tree derived from1,000 resampled trees for thedata set in Alon et al. (1999)when the value of ƒ is set atdifferent levels. The number oneach node in the tree representsthe number of times (out of atotal of 1,000) that node waspresent in the resampled trees.A ƒ=0.01; B ƒ=0.10;C ƒ=0.20; D ƒ=0.40
164
Unlike the data by Wen et al. (1998), where the stan-dard error for the average gene expression was estimatedfrom triplicates, there was no indication of the level ofvariation in the observed expression level for each genein each tissue sample in the data set. We assessed the ef-fects of measurement errors on the resulting tree structureby varying the standard errors to generate the resampleddata sets. Our assumption was that the standard error sijfor the ith EST in the jth condition is proportional to the
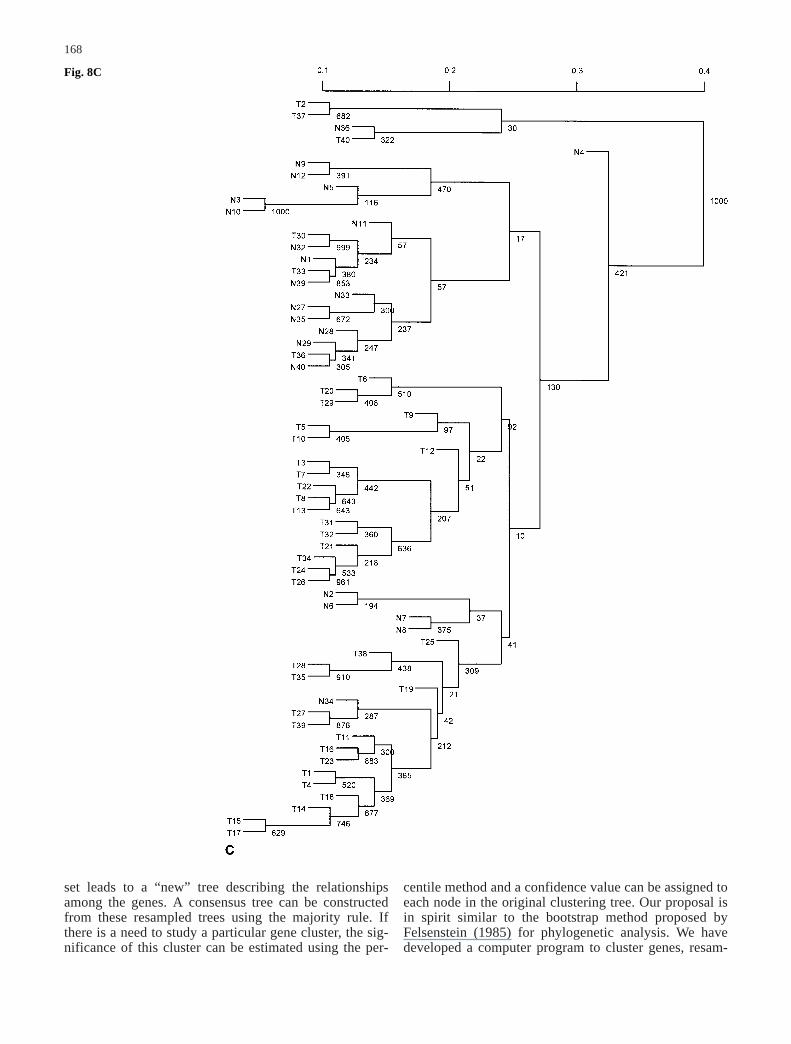
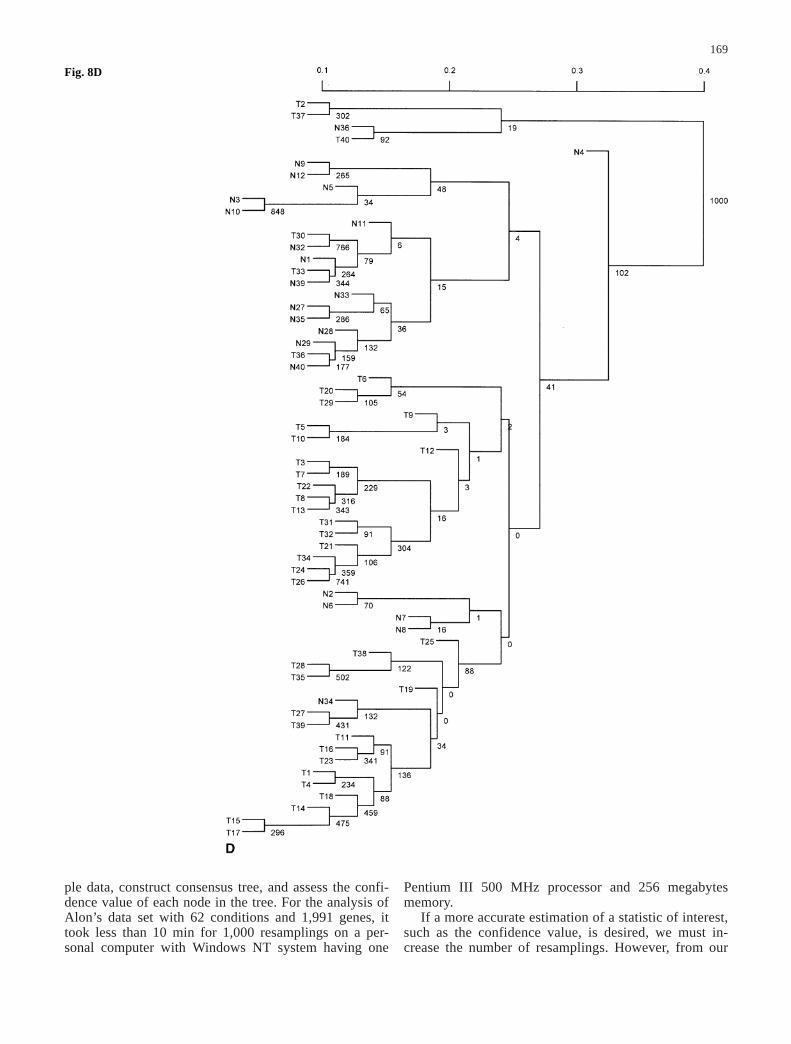
observed signal xij, i.e. sij=ƒ×xij, where ƒ can be varied atmany levels. To be less arbitrary, we began with small ƒvalues in the resampling and increased it in relativelysmall increments. For each fixed ƒ value, we resampledthe data set and constructed a binary tree 1,000 times.The consensus trees produced with different ƒ are plottedin Fig. 7A–D for ƒ values ranging from 0.01, 0.1, 0.2, to0.4. The corresponding confidence values for the nodes inthe original tree were estimated and shown in Fig. 8A–D.
Fig. 7B
165
When ƒ is relatively small (ƒ<0.10), it can be seen thatmost clusters have only tumor tissues or normal tissues,with the exception of tissue samples labeled n36, T33,and T36. These samples have abnormal muscle indexesdescribed by Alon et al. (1999). As we increased themagnitude of errors in the observed gene expression lev-els, this tree became less reliable. When ƒ>0.70, the con-sensus tree had only the trivial nodes. Therefore, it is use-
ful to get the whole spectrum of outcomes for possiblevariation in the data by varying the magnitude of ƒ val-ues. As discussed above, we can measure the differencebetween the original tree and the consensus tree byd(T0, M) defined as the number of elements the originaltree T0 and the consensus tree M disagree on. For exam-ple, through 1,000 resamplings, d(T0, M) is 33 whenƒ=0.1 and is 42 when ƒ=0.2.
Fig. 7C Fig. 7D
166
Discussion
With microarray-based genomic surveys becoming morefeasible, numerous methods have been developed tomine the potential information in these massive data sets.
One area that has often been ignored in microarray dataanalysis is the variability in gene expression levels. Aftermany gene clusters are identified from large-scale geneexpression data, we must be able to investigate the reli-ability of the observed clusters. In this article, we have
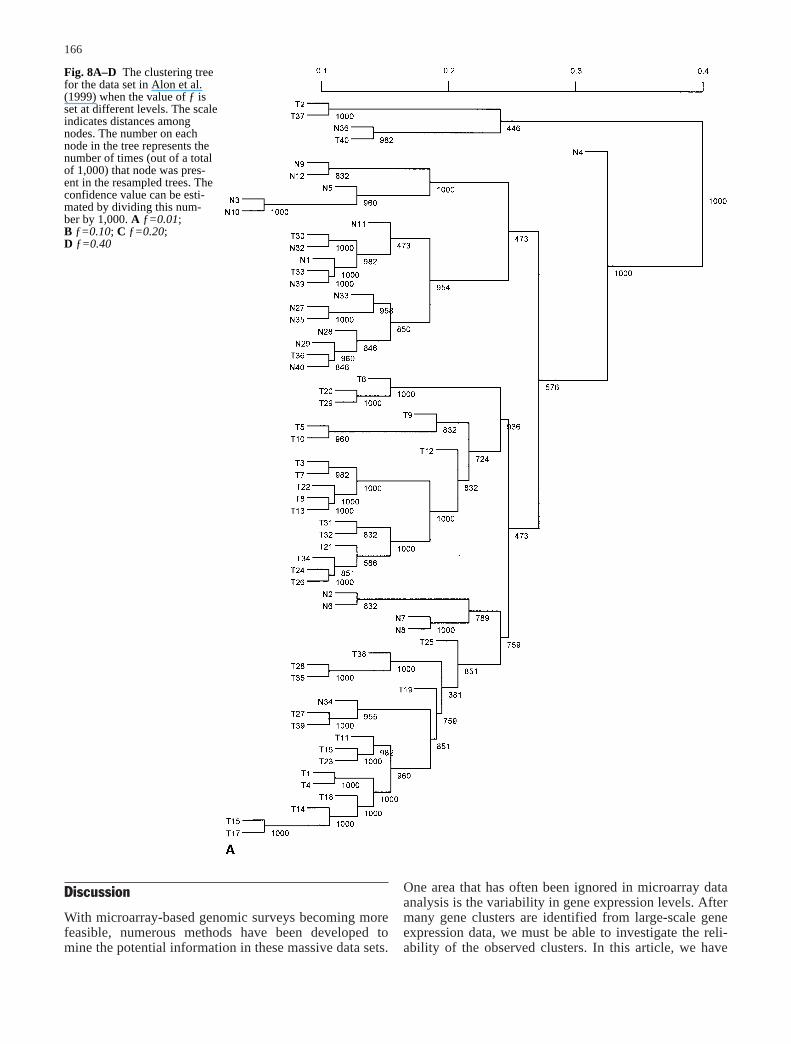
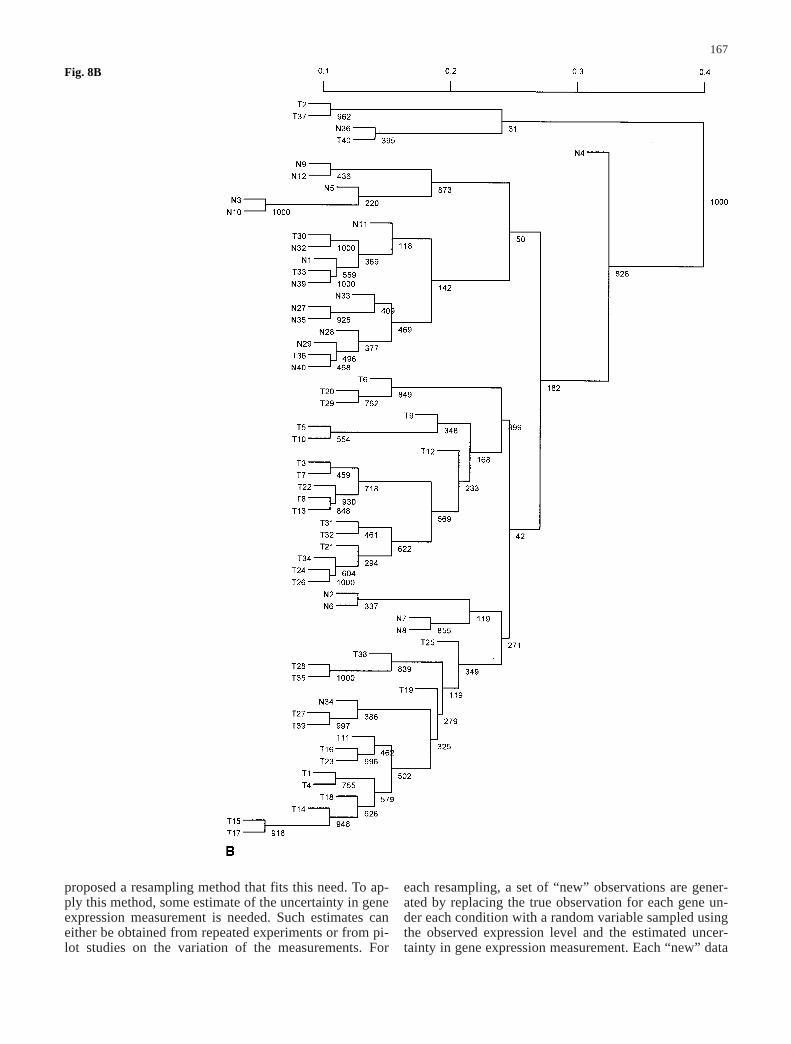
Fig. 8A–D The clustering treefor the data set in Alon et al.(1999) when the value of ƒ isset at different levels. The scaleindicates distances amongnodes. The number on eachnode in the tree represents thenumber of times (out of a totalof 1,000) that node was pres-ent in the resampled trees. Theconfidence value can be esti-mated by dividing this num-ber by 1,000. A ƒ=0.01;B ƒ=0.10; C ƒ=0.20;D ƒ=0.40
167
proposed a resampling method that fits this need. To ap-ply this method, some estimate of the uncertainty in geneexpression measurement is needed. Such estimates caneither be obtained from repeated experiments or from pi-lot studies on the variation of the measurements. For
each resampling, a set of “new” observations are gener-ated by replacing the true observation for each gene un-der each condition with a random variable sampled usingthe observed expression level and the estimated uncer-tainty in gene expression measurement. Each “new” data
Fig. 8B
168
set leads to a “new” tree describing the relationshipsamong the genes. A consensus tree can be constructedfrom these resampled trees using the majority rule. Ifthere is a need to study a particular gene cluster, the sig-nificance of this cluster can be estimated using the per-
centile method and a confidence value can be assigned toeach node in the original clustering tree. Our proposal isin spirit similar to the bootstrap method proposed by Felsenstein (1985) for phylogenetic analysis. We havedeveloped a computer program to cluster genes, resam-
Fig. 8C
169
ple data, construct consensus tree, and assess the confi-dence value of each node in the tree. For the analysis ofAlon’s data set with 62 conditions and 1,991 genes, ittook less than 10 min for 1,000 resamplings on a per-sonal computer with Windows NT system having one
Pentium III 500 MHz processor and 256 megabytesmemory.
If a more accurate estimation of a statistic of interest,such as the confidence value, is desired, we must in-crease the number of resamplings. However, from our
Fig. 8D
170
experience, resampling more than 1,000 times is usuallynot necessary for most practical purposes. This is con-sistent with the observations by Efron et al. (1996). Al-though this resampling method is not biased (Efron et al. 1996), the estimate of confidence values can be
corrected to better correspond to the standard ideas ofconfidence levels and hypothesis testing. Detailed dis-cussion on this method was described in Efron et al.(1996). The basic idea is to bootstrap on the bootstrapsamples. Although this bias-correction method is very
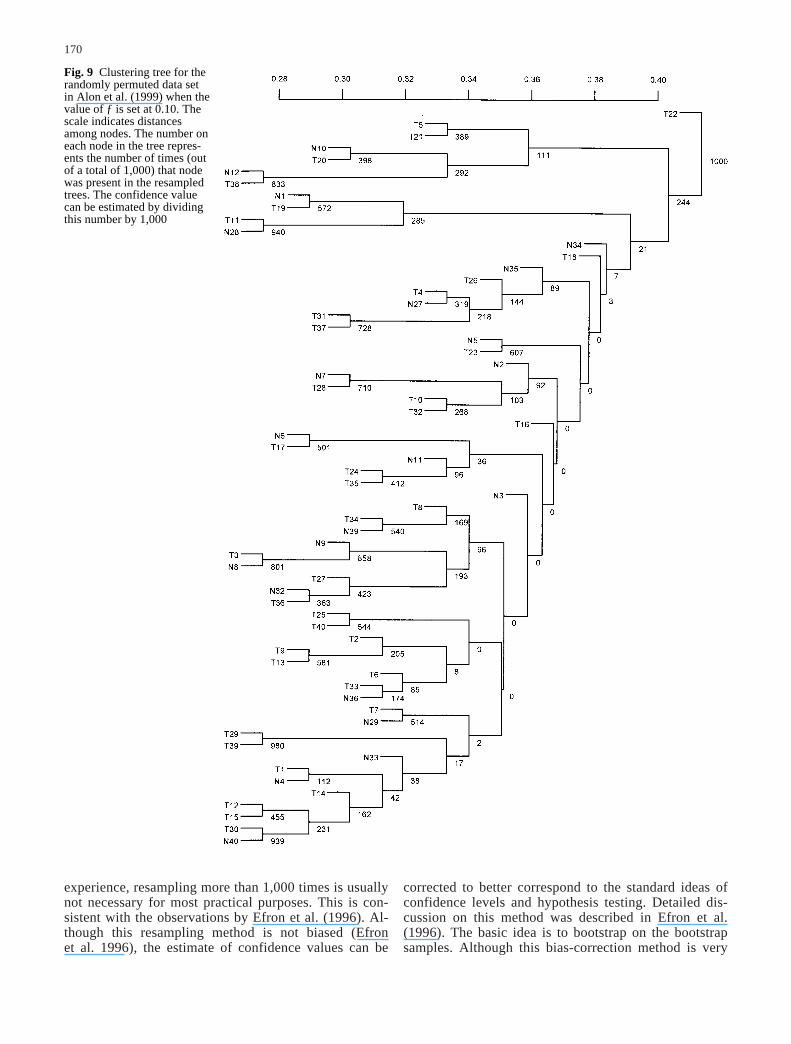
Fig. 9 Clustering tree for therandomly permuted data set in Alon et al. (1999) when thevalue of ƒ is set at 0.10. Thescale indicates distances among nodes. The number oneach node in the tree repres-ents the number of times (outof a total of 1,000) that nodewas present in the resampledtrees. The confidence value can be estimated by dividingthis number by 1,000
171
appealing, a large amount of extra computation is needed.
To understand the structure of the consensus treewhen there are no inherent clusters in the data, the initialgene expression measurements can be randomized acrossall conditions (samples) or across all genes and then beanalyzed using the same procedure. When we apply thismethod to the normal and tumor colon tissue data (Alonet al. 1999), for each gene, we randomly permuted thegene expression levels among the samples independentlyfrom other genes. This procedure will break any cluster-ing in the data. One such example is shown in Fig. 9,where the original tree constructed from the permuteddata is shown with confidence values estimated through1,000 resampings when the error rate was set at ƒ=0.1. Itis apparent that the confidence values are much lowerthan those in Fig. 7B. In addition, the normal and tumorcolon tissue samples are no longer clustered. The struc-ture from this permuted tree further suggests that theclusters observed in the original tree represent true clus-ters.
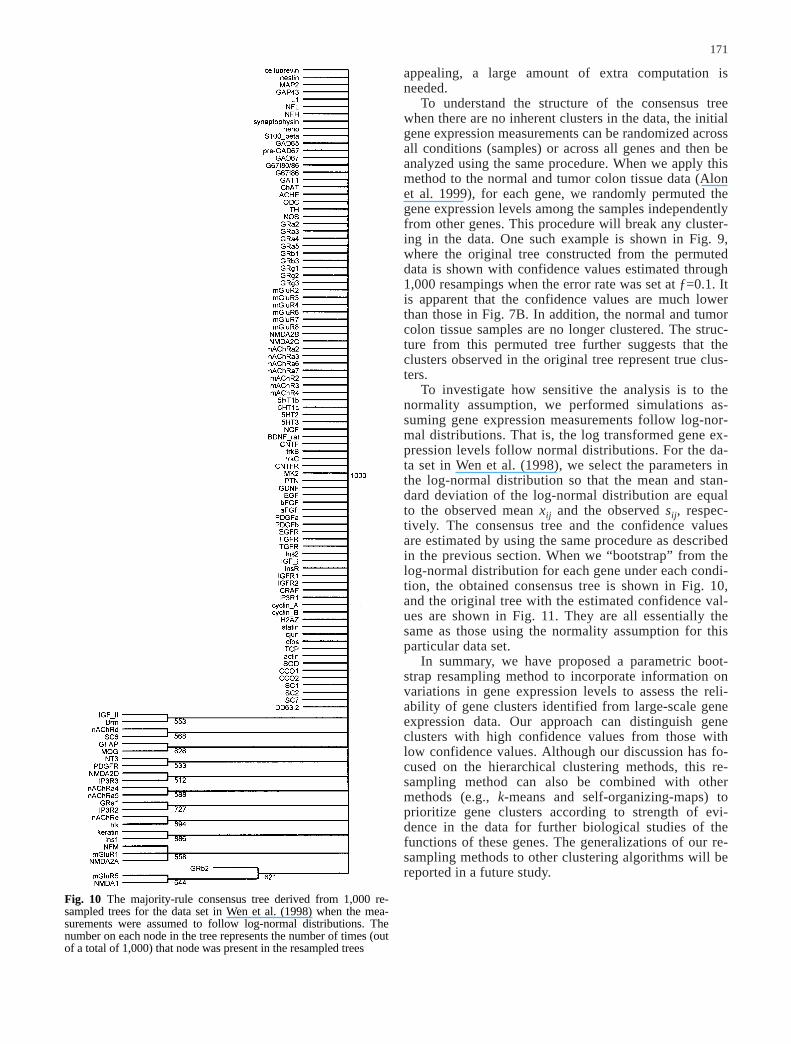
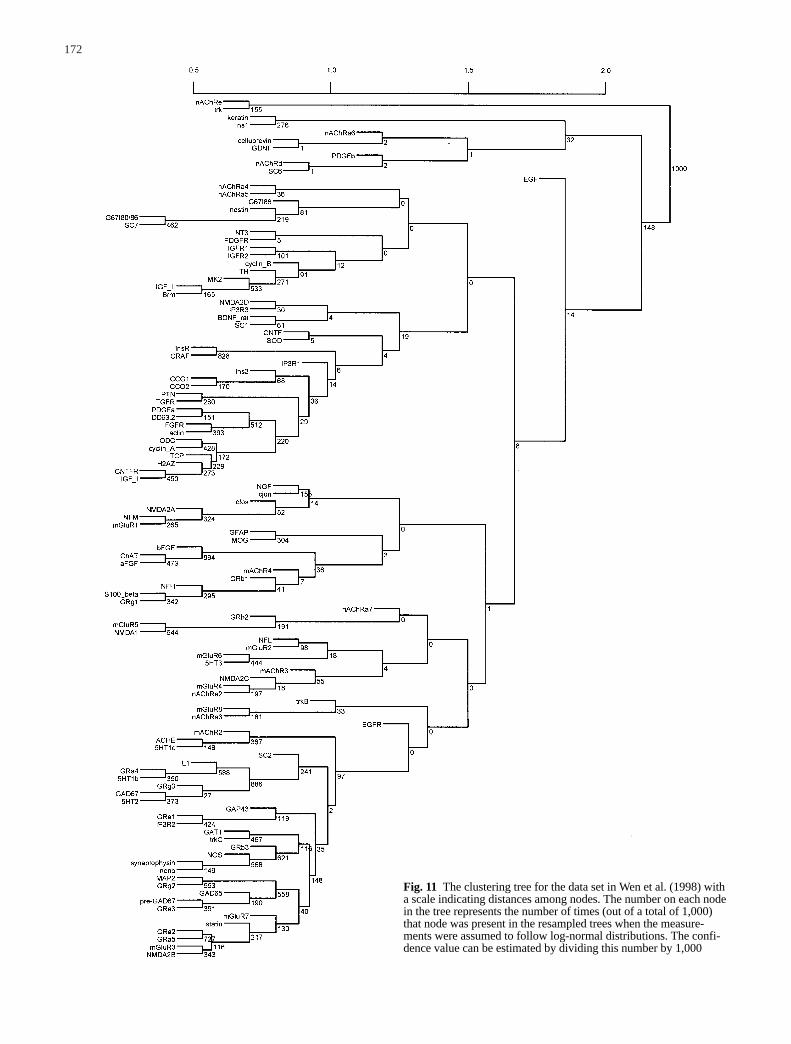
To investigate how sensitive the analysis is to thenormality assumption, we performed simulations as-suming gene expression measurements follow log-nor-mal distributions. That is, the log transformed gene ex-pression levels follow normal distributions. For the da-ta set in Wen et al. (1998), we select the parameters inthe log-normal distribution so that the mean and stan-dard deviation of the log-normal distribution are equalto the observed mean xij and the observed sij, respec-tively. The consensus tree and the confidence valuesare estimated by using the same procedure as describedin the previous section. When we “bootstrap” from thelog-normal distribution for each gene under each condi-tion, the obtained consensus tree is shown in Fig. 10,and the original tree with the estimated confidence val-ues are shown in Fig. 11. They are all essentially thesame as those using the normality assumption for thisparticular data set.
In summary, we have proposed a parametric boot-strap resampling method to incorporate information onvariations in gene expression levels to assess the reli-ability of gene clusters identified from large-scale geneexpression data. Our approach can distinguish geneclusters with high confidence values from those withlow confidence values. Although our discussion has fo-cused on the hierarchical clustering methods, this re-sampling method can also be combined with othermethods (e.g., k-means and self-organizing-maps) toprioritize gene clusters according to strength of evi-dence in the data for further biological studies of thefunctions of these genes. The generalizations of our re-sampling methods to other clustering algorithms will bereported in a future study.
Fig. 10 The majority-rule consensus tree derived from 1,000 re-sampled trees for the data set in Wen et al. (1998) when the mea-surements were assumed to follow log-normal distributions. Thenumber on each node in the tree represents the number of times (outof a total of 1,000) that node was present in the resampled trees
172
Fig. 11 The clustering tree for the data set in Wen et al. (1998) witha scale indicating distances among nodes. The number on each nodein the tree represents the number of times (out of a total of 1,000)that node was present in the resampled trees when the measure-ments were assumed to follow log-normal distributions. The confi-dence value can be estimated by dividing this number by 1,000
Felsenstein J (1993) PHYLIP (Phylogeny Inference Package), ver-sion 3.5c. Distributed by the author. Department of Genetics,University of Washington, Seattle
Golub TR, Slonim DK, Tamayo P, Huard C, Gaasenbeek M, Mesirov JP, Coller H, Loh ML, Downing JR, Caligluri MA,Bloomfield CD, Lander ES (1999) Molecular classification ofcancer: class discovery and class prediction by gene expres-sion monitoring. Science 286:531–537
Hacia JG (1999) Resequence and mutational analysis using oligo-nucleotide microarrays. Nat Genet 21:42–47
Hartigan JA (1975) Clustering algorithms. Wiley, New YorkHeyer LJ, Kruglyak S, Yooseph S (1999) Exploring expression
data: identification and analysis of coexpressed genes. Genome Res 9:1106–1115
Hillis DM, Bull JJ (1993) An empirical test of bootstrapping as amethod for assessing confidence in phylogenetic analysis. SystBiol 42:182–192
Hilsenbeck SG, Friedrichs WE, Schiff R, O’Connell P, HansenRK, Obserne CK, Fuqua SAW (1999) Statistical analysis ofarray expression data as applied to the problem of tamoxifenresistance. J Natl Cancer Inst 91:453–459
Khan J, Saal LH, Bittner ML, Chen YD, Trent JM, Meltzer PS(1999) Expression profiling in cancer using cDNA microar-rays. Electrophoresis 20:223–229
Margush T, McMorris FR (1981) Consensus n-trees. Bull MathBiol 43:239–244
Marton MJ, DeRisi JL, Bennett HA, Iyer VR, Meyer MR, RobertsCJ, Stoughton R, Burchard J, Slade D, Dai HY, Bassett DE,Hartwell LH, Brown PO, Friend SH (1998) Drug target vali-dation and identification of secondary drug target effects usingDNA microarrays. Nat Med 4:1293–1301
Mir KU, Southern EM (1999) Determining the influence of struc-ture on hybridization using oligonucleotide arrays. Nat Bio-technol 17:788–792
Raychaudhuri S, Stuart JM, Altman RB (2000) Principal compo-nents analysis to summarize microarray experiments: applica-tion to sporulation time series. Pac Symp Biocomput 5:452–463
Tamayo P, Slonim D, Mesirov J, Zhu Q, Kitareewan S, DmitrovskyE, Lander ES, Golub TR (1999) Interpreting patterns of geneexpression with self-organizing maps: methods and applica-tion to hematopoietic differentiation. Science 96:2907–2912
Törönen P, Kolehmainen M, Wong G, Castrén E (1999) Analysisof gene data using self-organizing maps. FEBS Lett 451:142–146
Wen X, Fuhrman S, Michaels GS, Carr DB, Smith S, Barker JL,Somogyi R (1998) Large-scale temporal gene expression map-ping of central nervous system development. Proc Natl AcadSci USA 95:334–339
173
Acknowledgements We would like to thank Shuanglin Zhang,Jinming Li, and two anonymous referees for their helpful com-ments. This work was supported in part by grants MG59507 andHD36834 from the National Institutes of Health and ResearchGrant FY98–0752 from the March of Dimes Birth Defects Foun-dation.
References
Alon U, Barkai N, Notterman DA, Gish K, Ybarra S, Mack D,Levine AJ (1999) Broad patterns of gene expression revealedby clustering of tumor and normal colon tissues probed by oligonucleotide arrays. Proc Natl Acad Sci USA 96:6745–6750
Anbazhagan R, Tihan T, Borman DM, Johnston JC, Saltz JH, Wegering A, Piantadosi S, Gabrielson E (1999) Classificationof small cell lung cancer and pulmonary cacinnoid by gene ex-pression profiles. Cancer Res 59:5119–5122
Ben-Dor A, Yakhini Z (1999) Clustering gene expression patterns.J Comput Biol 6:281–287
Brown MPS, Grundy WN, Lin D, Cristianini N, Sugnet CW,Furey TS, Ares M, Haussler D (2000) Knowledge-based anal-ysis of microarray gene expression data by using support vec-tor machines. Proc Natl Acad Sci USA 97:262–267
Debouck C, Goodfellow PN (1999) DNA microarrays in drug dis-covery and development. Nature 21:48–55
DeRisi J, Oenaland L, Brown PO, Bittner ML, Meltzer PS, RayM, Chen YD, Su YA, Trent JM (1996) Use of a cDNA micro-array to analyze gene expression patterns in human cancer.Nat Genet 14:457–460
D’Haeseleer P, Wen X, Fuhrman S, Somogyi R (1998) Mining thegene expression matrix: inferring gene relationships fromlarge scale gene expression data. In: Paton RC, Holcombe M(eds) Information processing in cells and tissues. Plenum,New York
Efron B (1979) Bootstrap methods: another look at the jackknife.Ann Stat 7:1–26
Efron B, Tibshirani RJ (1993) An introduction to the bootstrap.Chapman and Hall, New York
Efron B, Halloran E, Holmes S (1996) Bootstrap confidence levelsfor phylogenetic trees. Proc Natl Acad Sci USA 93:13429–13434
Eisen MB, Spellman PT, Brown PO, Bostein D (1998) Clusteranalysis and display of genome-wide expression patterns. ProcNatl Acad Sci USA 95:14863–14868
Felsenstein J (1985) Confidence limits on phylogenies: an ap-proach using the bootstrap. Evolution 39:783–791
Related Documents