http://dx.doi.org/10.4314/rj.v1i2S.1D Rwanda Journal, Series D, Volume 1, 2016, Life and Natural Sciences: Special issue II Assessing Maize Foliar Water Stress Levels Under Field Conditions Using In-Situ Spectroscopy A. Ngie 1* ; F. Ahmed 1 ; K. Abutaleb 1 1 University of the Witwatersrand, Johannesburg, South Africa * Corresponding author: email: [email protected] Abstract: Plant physiological processes required for crop productivity are dependent on the availability of water to crops. Water availability to crops therefore requires real time monitoring for timeous rescue or intervention measures. Such monitoring over vast areas is only possible through remotely sensed techniques such as spectroscopy with its numerous fine wavelengths and is non-destructive to the crops as opposed to other traditional ground-based methods. The management of spectral reflectance data to extract information of importance for plant water status has been motivated by knowledge of the availability of specific bands in the electromagnetic spectrum responsible for water absorption. The purpose of this study was to investigate the potential of using selected spectral bands to develop water indices that could monitor the water status at leaf level on maize (Zea mays) plants grown under field conditions. Leaf spectral reflectance of maize plants was collected under three different water conditions being healthy (H), intermediary water stressed (IWS) and water stressed (WS) using a leaf-clip of a handheld spectroradiometer. The spectral reflectance indicated an increased reflectance in portions of the visible, near-infrared and short infrared regions of the electromagnetic spectrum for the water stressed maize plants. The random forest (RF) algorithm was utilised to extract wavelengths of importance from which water indices were developed among which were the normalised difference water index (NDWI860-1240) and the water band index (WBI950-970). The indices were used in a combined algorithm of RF and partial least square (PLS) for its predictive ability to classify the maize leaf water status into the three categories (H, IWS and WS). The results showed an overall accuracy of 70±1.2 %. Therefore, confirming the potential of assessing leaf water content using in-situ spectroscopy. The three most important indices were NDWI860-1240, NDWI1700-1530 and NDWI1530-1360. An in-depth study would be required to quantify and measure actual water content in maize leaves and possibly upscale to canopy level which would directly support irrigation management plans. Keywords: in-situ spectroscopy, maize, partial least square, random forest, water spectral indices, water stress

Welcome message from author
This document is posted to help you gain knowledge. Please leave a comment to let me know what you think about it! Share it to your friends and learn new things together.
Transcript

http://dx.doi.org/10.4314/rj.v1i2S.1D
Rwanda Journal, Series D, Volume 1, 2016, Life and Natural Sciences: Special issue II
Assessing Maize Foliar Water Stress Levels Under Field
Conditions Using In-Situ Spectroscopy
A. Ngie1*; F. Ahmed1; K. Abutaleb1
1University of the Witwatersrand, Johannesburg, South Africa
* Corresponding author: email: [email protected]
Abstract: Plant physiological processes required for crop productivity are dependent on the availability of water
to crops. Water availability to crops therefore requires real time monitoring for timeous rescue or intervention
measures. Such monitoring over vast areas is only possible through remotely sensed techniques such as
spectroscopy with its numerous fine wavelengths and is non-destructive to the crops as opposed to other
traditional ground-based methods. The management of spectral reflectance data to extract information of
importance for plant water status has been motivated by knowledge of the availability of specific bands in the
electromagnetic spectrum responsible for water absorption. The purpose of this study was to investigate the
potential of using selected spectral bands to develop water indices that could monitor the water status at leaf level
on maize (Zea mays) plants grown under field conditions. Leaf spectral reflectance of maize plants was collected
under three different water conditions being healthy (H), intermediary water stressed (IWS) and water stressed
(WS) using a leaf-clip of a handheld spectroradiometer. The spectral reflectance indicated an increased reflectance
in portions of the visible, near-infrared and short infrared regions of the electromagnetic spectrum for the water
stressed maize plants. The random forest (RF) algorithm was utilised to extract wavelengths of importance from
which water indices were developed among which were the normalised difference water index (NDWI860-1240)
and the water band index (WBI950-970). The indices were used in a combined algorithm of RF and partial least
square (PLS) for its predictive ability to classify the maize leaf water status into the three categories (H, IWS and
WS). The results showed an overall accuracy of 70±1.2 %. Therefore, confirming the potential of assessing leaf
water content using in-situ spectroscopy. The three most important indices were NDWI860-1240, NDWI1700-1530 and
NDWI1530-1360. An in-depth study would be required to quantify and measure actual water content in maize leaves
and possibly upscale to canopy level which would directly support irrigation management plans.
Keywords: in-situ spectroscopy, maize, partial least square, random forest, water spectral indices, water stress

http://dx.doi.org/10.4314/rj.v1i2S.1D
Rwanda Journal, Series D, Volume 1, 2016, Life and Natural Sciences: Special issue II
INTRODUCTION A. Background on plant water availability
Water is a key determinant in field crop productivity globally though its availability is highly variable.
Challenging climate scenarios of unprecedented spatio-temporal temperature and rainfall patterns does translate
into changes in availability of water to crops (IPCC, 2007). Accurate water content estimation is required to make
decisions on management schemes and also crop yield estimation in agricultural studies (Peñuelas et al., 1993).
The water content/status of a plant can be measured from root, stem and leaf material or the whole canopy. Leaf
analyses are however, the most important for evaluating the nutrient and water status of plants in comparison to
other tissue types (Suo et al., 2010).
Leaf water content has been considered as an indirect estimate of the changes in the water status in the leaves
and could be measured through the reactions of altered plant cell structures (Canny & Huang, 2006). The leaf is
also mostly responsible for photosynthesis, an essential physiological process in plants. The health and nutrient
status with water status inclusive of the plants can be evaluated from the leaves where its decrease would serve
as an important indicator of stress or a limiting factor (de Jong et al., 2012). Therefore, leaf water content can be
used for the determination of the water status of the plants. Initially, plant water stress has been measured through
destructive approaches that are limited in spatial extent as a result of being labour intensive (Graeff & Claupein,
2007).
The basis of detecting water stress with remote sensing relates to the difference in reflectance properties of
plants under different water stress levels at certain wavelengths in the NIR portion of the electromagnetic
spectrum (Genc et al., 2013). The interpretation of these hyperspectral data is complicated by the inter-
relationships between wavelength variables which require extensive statistical techniques to analyse the data for
meaningful information to be derived. While some studies made use of the leaf spectral reflectance directly to
assess leaf water content (Gaussman, 1977; Tucker, 1980; Hunt & Rock, 1989; Marraci et al., 1991), others have
perform data transformations and developed water indices (Ceccato et al., 2002; Sims & Gamon, 2003; Govender
et al., 2009) to aid in the generation of information about the water status in plants.
B. Leaf water content and water indices
Water indices have been developed to evaluate plant water content at both leaf and canopy levels over the years
the most frequently used ones include the water band index (WBI) (Peñuelas et al., 1993), normalized difference
water index (NDWI) (Gao, 1995; Serrano et al., 2000) and recently the shortwave infrared water stress index
(SIWSI) (Fensholt & Sandholt, 2003). These indices were developed from the combinations of bands or
wavelengths from the NIR (WBI and NDWI) and the SWIR (SIWSI). However, more recently there have been

http://dx.doi.org/10.4314/rj.v1i2S.1D
Rwanda Journal, Series D, Volume 1, 2016, Life and Natural Sciences: Special issue II
attempts on using the blue, green, red wavelengths or bands (VIS region) and the NIR wavelengths in developing
indices to estimate vegetation water content (Genc et al., 2013).
The bands identified as suitable for water status assessment would not be exactly the same for all crops but
serve as a guide to band centres for water absorption (Danson et al., 1992; Penuelas et al., 1993; Sims & Gamon,
2003; Clevers et al., 2008 & 2010; Elsayed et al., 2011; Genc et al., 2013). The minor water-absorption bands
which are situated around 970 and 1200 nm have proven ability to provide and or even quantify leaf water status
in plants more than the major bands of the 1400 and 1900 nm region of the electromagnetic spectrum (Clevers et
al., 2010). The spectral indices developed from the minor water absorption band centres have also proven feasible
(correlation of 0.70 on the right slope of 970 nm) in determining foliar water status (de Jong et al., 2014).
The water band index (WBI) is derived from the ratio of reflectance measured at 950 and 970 nm (Peñuelaset
al., 1993); and 900 - 970 nm (Peñuelaset al., 1997). This spectral index has been correlated with ground-based
measurements of plant water content at both the leaf and canopy scales. It is, however, more sensitive to leaf
water content than the water content of the whole plant. This is advantageous in agricultural applications where
leaf water content changes more noticeably in response to drought conditions than the water content of the entire
plant foliage (Champagne et al., 2003).
The normalised difference water index (NDWI) has been another widely used index for monitoring water status
of vegetation both through multispectral (Jackson et al., 2004) and hyperspectral (Eitel et al., 2006; Elsayed et
al., 2011; Winterhalter et al., 2011) remote sensing. It is measured by a ratio of difference between the reflectance
value at 860 and 1240 nm wavelengths (Gao, 1996). The index is measured of wavelengths both from the NIR
region of the electromagnetic spectrum and its application in detecting water content has been widely used
(Govender et al., 2009). However, other wavelengths have been used to develop ratios which have also illustrated
important as a result of crop types or management conditions in monitoring water status (Winterhalter et al.,
2011).
The SWIR (1400-2500) has also proven important in leaf water content measurement with the identification of
the 1550 and 1750 nm wavelengths (Tucker, 1980); and in recent studies the VIS region was also identified as
important in water status assessment (Graeff & Claupein, 2007; Genc et al., 2013). The detection of leaf water
content in the VIS/NIR regions linking it to chlorophyll and nitrogen status was recently assessed with successful
outcomes (Zhang et al., 2012) whereas others previously realized only the NIR and SWIR regions to be important
in leaf water content assessment (Ceccato et al., 2001).
Hyperspectral remote sensing therefore, is able to provide information on rapidly occurring water status changes
in plants driven by dynamism in immediate environmental conditions. Maize (Zea mays) being an important field

http://dx.doi.org/10.4314/rj.v1i2S.1D
Rwanda Journal, Series D, Volume 1, 2016, Life and Natural Sciences: Special issue II
crop that relies on water availability for enhanced productivity has been tested in monitoring with this technology
(Elsayed et al., 2011; Winterhalter et al., 2011; Genc et al., 2013). It is clear that water status assessment varies
across crop types and geographical locations as a result of varying water budgets. What is clearly more important
is that water stress affects crop productivity and thus requires monitoring.
This study then seeks to utilise known spectral indices such as NDWI860/1240 and WBI950/970 together with others
developed from selected wavelengths in detecting water status to distinguish different water status in maize leaves
under field conditions. Firstly, the spectral data is resampled to 10 nm and a feature selection is performed to
extract wavelengths of importance that contribute to the detection of water status in the maize leaves using in-situ
spectral measurements. Secondly, the selected wavelengths were used to develop spectral indices. Lastly, the
indices are all used as independent variables for the classification of the various water status of the maize leaves
while ranking them according to importance based on the error size obtained when running the permutations
without each index.
MATERIALS AND METHODS C. Study area
The fields used for this study were located at the Glen Agricultural College fields in Bloemfontein
(Free State province of South Africa) with geographical coordinates as 28°56'45.86" S,
26°19'35.93" E (maize field) and 28°56'53.34" S, 26°19'41.49" E (adjacent field). The fields were
located about 20 km north of Bloemfontein (Figure 2). The area has mean annual precipitation of
about 600 mm and mean annual maximum and minimum temperatures of 25° C and 8° C respectively
(Botha et al., 2007). Summers are hot and dry with scarce episodes of rainfall while the winters are
frosty and cold. The growing of crops such as maize is only done once in a summer farming season
that commences in December and runs through to July. As a result of its sparse rainfall, the growth
of crops is through irrigation schemes.
D. Field design
The field used for this study was grown under the same conditions with the same maize cultivar
(PAN 6616) on the 15th of January 2014. It was grown under irrigation scheme but the amount of
water applied could not be measured since it was the flooding system. This flooding system meant
the whole field does not receive water equally, thereby creating variable water availabilities to the
plants across the field. The area located close to the water source gets saturated with water before it
flows to the other parts of the field. Hence, the areas furthest from the water source stay water stressed

http://dx.doi.org/10.4314/rj.v1i2S.1D
Rwanda Journal, Series D, Volume 1, 2016, Life and Natural Sciences: Special issue II
and in between the two areas is an intermediary scenario with limited amounts of water available to
the plants (Figure 1).
Figure 1: Maize leaves showing the different categories of water status on the day of spectral
measurements: a is healthy or unstressed leaves; b is intermediary water stressed leaves; and c is
water stressed leaves
a b c

http://dx.doi.org/10.4314/rj.v1i2S.1D
Rwanda Journal, Series D, Volume 1, 2016, Life and Natural Sciences: Special issue II
Figure 2: Study area showing the maize field in Glen, Bloemfontein. (Insert image from GoogleEarth
4/10/2014)

http://dx.doi.org/10.4314/rj.v1i2S.1D
Rwanda Journal, Series D, Volume 1, 2016, Life and Natural Sciences: Special issue II
E. Spectral measurement and pre-processing
The spectra were collected on the 11th of April 2014 (11-12 weeks after planting) by selecting the
top-most completely opened leaf. The measurements were taken in the morning period between
10 am and 12 noon to avoid the interference from the process of evapotranspiration and the difference
in water potential between the plants are at their greatest (Cleary & Zaerr, 1984).The spectral
measurements were done on the adaxial surface of each leaf using the leaf-clip device of the hand-
held portable PSR-3500 spectroradiometer (©2012 Spectral Evolution, Inc, USA), with the average
scan time set at 10 ms (averaged to reduce scanner noise). The leaf-clip was used in this case as a
result of its direct-contact probe which limits ambient light.
The spectroradiometer system operates in the range of 340-2500 nm. The complete system collects
and stores data which is calibrated to units of spectral radiance (W/m2/nm/sr) as output (PSR, 2012).
The non-destructive measurements in the field were obtained on both sides of the midrib but avoiding
the midrib region. The radiance measurements were calibrated using a white spectralon reference
panel before scanning the leaves and converted to relative reflectance (%).
The spectra were measured at a total of 1024 wavelengths with a spectral range of 0 to 4 nm. In
order to reduce the number of wavelengths, the spectral measurements were resampled using a
Gaussian model (full-width half-maximum) in the Environment for Visualizing Images (ENVI)
software (v.4.5, ITT Visual Information Systems) that resulted in 217 wavelengths with a 10 nm
spectral range.
Data analysis F. Wavelength selection and development of indices
Data analysis was performed in RStudio using the random forest (RF) algorithm. RF is an ensemble
approach that is capable of performing a divide-and-conquer rule that improves performance of data
management (Brieman, 2001). This is done through recursive partitioning of the data into subsets
(trees) known as ntree drawing random subsets of variables known as mtry (ibid). The RF is a machine
learning algorithm that has the potential of handling huge data sets of large predictor variable numbers
(wavelengths) as oppose to the small sample size. In order to assess the impact of a predictor variable,
the RF permutation of importance measured is biased due to the preferential selection of correlated

http://dx.doi.org/10.4314/rj.v1i2S.1D
Rwanda Journal, Series D, Volume 1, 2016, Life and Natural Sciences: Special issue II
wavelengths (Stroblet al., 2007). The bias is adjusted in the conditional random forest (cforest)
proposed by Strobl et al. (2008).
Every tree is constructed using a different bootstrap sample from the original data that gets
partitioned into smaller subsets or trees that are combined with the notion of an ensemble at the nodes.
The RF algorithm uses two thirds (2/3 or 70%; 13 samples) of the data (training data set) in every
bootstrap sample while a third (1/3 or 30%; 7 samples) being the test data set is left out of the
construction and used for validation where an error estimate is generated for every predictive variable.
The error estimate is known as the out-of-bag (OOB) error and measures the variable of importance
in the algorithm. For cforest the ntree were tested by 50s up to 500 and the mtry as √𝑛 where n is the
217 wavelengths. Hence the mtry was 15.
The top 10 wavelengths in the entire spectrum as ranked by the OOB errors were selected and used
to develop the spectral vegetation indices relating to the NDWI (Equation 1). These wavelengths were
considered as those of most informative to water status in maize leaves under field conditions.
𝑵𝑫𝑾𝑰 = 𝝀𝑵𝑰𝑹−𝝀𝑺𝑾𝑰𝑹
𝝀𝑵𝑰𝑹+𝝀𝑺𝑾𝑰𝑹 (2)
G. Assessment of maize foliar water status with spectral indices
The combined RF and partial least square (PLS) were used for the predictive classification of the
water status of the maize leaves. The RF+PLS algorithm was introduced by Boulesteix et al. (2008)
and has the pre-validation idea that is based on cross-validation to avoid over-fitting embedded within
the data set. It is fast and flexible in performing analysis of such huge data sets. The PLS has been
found to produce satisfactory predictions (Zhang et al., 2012).
The bootstrap option of the RF+PLS used splits the data set of the indices developed. A total of 23
indices developed from the selected wavelengths (independent variables) and a sample size of 20*3
water classes or status (total of 60 samples) were utilized for this algorithm. The training data set is
used to construct and predict with the algorithm while the test is used to confirm predicted values into
the various classes. The Overall accuracy and individual producer’s as well as user’s accuracies are
later summarized for the 100 iterations performed per ntree. For data sets having n≤30, the minsplit
parameter which controls the minimal size of nodes to be split within the bootstrap of the algorithm
was defined as 4 (Boulesteix et al., 2008).

http://dx.doi.org/10.4314/rj.v1i2S.1D
Rwanda Journal, Series D, Volume 1, 2016, Life and Natural Sciences: Special issue II
The OOB is used to get a running adjusted unbiased estimate of the classification error as trees are
added to the forest. This was applied in the RF+PLS algorithm to get estimates of index importance
in the classification of the water status of maize leaves. In other words the OOB is obtained by
comparing how much the error estimate increases when a variable is permuted while all other
variables are left unchanged (Archer & Kimes, 2008). For the RF+PLS, the ntree were tested at 50s
up to 500 with an mtry of 5.
Results and discussion The reflectance spectra of water stressed plants absorb less light in the visible and NIR regions of
the spectrum than plants not experiencing water stress (Figure 3). The use of the leaf clip minimised
atmospheric interferences, hence minimal cleaning of noise. The sample number for each category of
water status measured had to be equalised at 20 which was the minimal number of samples per
category, thereby establishing the total number of samples for this study as 60.
Figure 3: Leaf spectra for 3 categories of water status in maize leaves (H is healthy or unstressed,
IWS is intermediary stressed and WS is water stressed)
The spectra for the water stressed and unstressed maize leaves showed a distinctive difference on
the visible, NIR and SWIR regions of the spectrum (Figure 4). The water stressed spectra recorded
more reflectance in the visible region than unstressed ones because of the reduced chlorophyll content
resulting from water deficiency that accounts for most of the absorption in this region. The alteration
0
5
10
15
20
25
30
35
40
45
50
250 500 750 1000 1250 1500 1750 2000 2250 2500
Ref
lect
an
ce(%
)
Wavelengths
H IWS
WS
http://dx.doi.org/10.4314/rj.v1i2S.1D
Rwanda Journal, Series D, Volume 1, 2016, Life and Natural Sciences: Special issue II
in the leaf structure also accounts for the visualised difference around the NIR region. This is as a
result of the deficiency in liquid water within the plant tissues as explained by Canny and Huang
(2006).
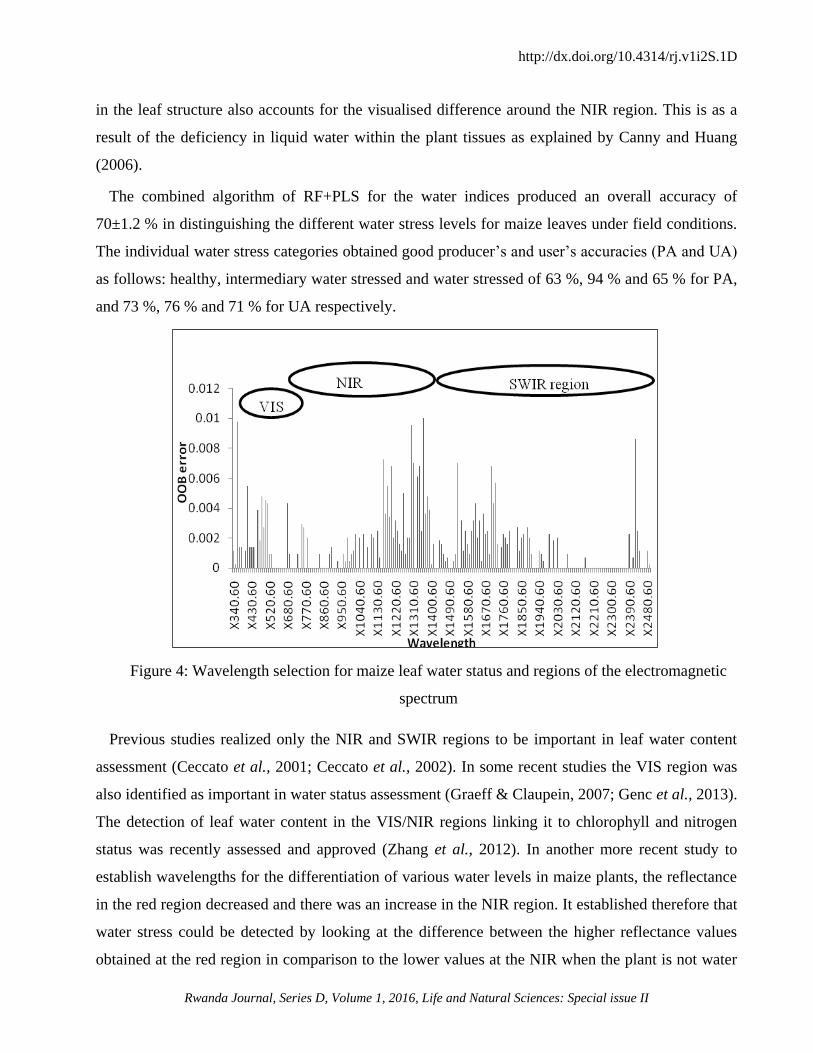
The combined algorithm of RF+PLS for the water indices produced an overall accuracy of
70±1.2 % in distinguishing the different water stress levels for maize leaves under field conditions.
The individual water stress categories obtained good producer’s and user’s accuracies (PA and UA)
as follows: healthy, intermediary water stressed and water stressed of 63 %, 94 % and 65 % for PA,
and 73 %, 76 % and 71 % for UA respectively.
Figure 4: Wavelength selection for maize leaf water status and regions of the electromagnetic
spectrum
Previous studies realized only the NIR and SWIR regions to be important in leaf water content
assessment (Ceccato et al., 2001; Ceccato et al., 2002). In some recent studies the VIS region was
also identified as important in water status assessment (Graeff & Claupein, 2007; Genc et al., 2013).
The detection of leaf water content in the VIS/NIR regions linking it to chlorophyll and nitrogen
status was recently assessed and approved (Zhang et al., 2012). In another more recent study to
establish wavelengths for the differentiation of various water levels in maize plants, the reflectance
in the red region decreased and there was an increase in the NIR region. It established therefore that
water stress could be detected by looking at the difference between the higher reflectance values
obtained at the red region in comparison to the lower values at the NIR when the plant is not water

http://dx.doi.org/10.4314/rj.v1i2S.1D
Rwanda Journal, Series D, Volume 1, 2016, Life and Natural Sciences: Special issue II
stressed (Genc et al., 2013). The study reaffirmed the importance of the VIS region in water status
detection in plants. Therefore, water stress in crops has the potential of disturbing the proper
functioning of the process of photosynthesis.
The red edge region has also proven important in the detection of plant water content using spectral
reflectance. For instance Liu et al. (2004) realized that the relationship between some of the known
indices (WBI950/970 and NDWI860/1240) and the leaf water content for wheat was actually less
significant but highly significant when the red edge position (680 – 740 nm) was compared with it.
Graeff and Claupein (2007) discovered wavelength ratios of 510/780 nm and 540/780 nm as suitable
in detecting water content in wheat grown under controlled conditions. Winterhalter et al. (2011) also
identified the spectral indices from the VIS region (R440/R685; R525/R685; R600/R680 and R630/R680) as
highly significant in assessing relative water content in maize at pot levels and while at canopy level
the significant index was the NDWI840/1650.
The variable of importance ranked the water-based indices according to their contribution in
distinguishing maize water leaf status through a measure of their OOB error. The results obtained
indicated the NDWI860-1240 as an important index for the monitoring of water stress in maize plants
under field conditions (Figure 5). Other indices of importance included (1700-1530; 1530-1360). The
WBI950-970 did not perform well in the monitoring of water stress levels in maize leaves under field
conditions as proven by the variable importance results.
Figure 5: Selected indices for water stress level detection in maize
0
0.005
0.01
0.015
0.02
0.025
0.03
0.035
0.04
X1
20
0..360
X1
30
0..2
420
X1
53
0..2
420
X1
70
0..1
530
X1
20
0..1
530
X1
34
0..1
700
X1
33
0..1
530
X1
20
0..1
700
X1
70
0..2
420
X1
30
0..1
700
X1
26
0..1
620
X1
26
0..1
380
X1
26
0..1
530
X1
36
0..1
260
X1
53
0..1
360
X1
26
0..680
X8
60
..1
240
X9
00
..970
X8
50
..720

http://dx.doi.org/10.4314/rj.v1i2S.1D
Rwanda Journal, Series D, Volume 1, 2016, Life and Natural Sciences: Special issue II
Conclusion The wavelengths of importance extracted as relevant in the assessment of maize leaf water status
were actually located across the entire electromagnetic spectrum with a majority of them around the
NIR and SWIR transition area (1300 and 1700 nm). The red edge region did not show strong
importance in the assessment of leaf water content of maize plants under field conditions. The few
wavelengths in the VIS could be accounted for by the influence plant water status has on the
chlorophyll concentration. While the minor and major water absorption regions around the NIR and
SWIR showed stronger importance.
The developed ratios from the selected wavelengths in combination to the known water indices
(WBI950-970 and NDWI860-1240) showed a successful prediction and classification of the leaf water
status in the maize leaves under field conditions. The RF+PLS algorithm resulted in an OA of
70±1.2 %. The water-based ratios of importance extracted included the NDWI(860-1240; 1700-1530; 1530-
1360). Therefore, spectroscopy could be used to assess the leaf water status of maize plants grown
under field conditions.
Further research is required to be able to predict specific quantities of water in the leaf through well
structured experiments. These experiments would control water applications to the plants and aid with
the calculation of relative water content in the maize leaves through laboratory measurements that are
required as ground-truth data.
Acknowledgement We appreciate the University of Johannesburg-Common wealth scholarship for funding the studies
and field support from the Department of Agriculture, Free State, South Africa. The input from the
anonymous reviewers is also appreciated.
References Archer, K.J. and R.V. Kimes, 2008: Empirical characterisation of random forest variable
importance measures. Computational Statistics and Data Analysis 52, 2249-2260.
Boulesteix, A.L., C. Porzelius and M. Daumer, 2008: Microarray-based classification and clinical
predictors: On combined classifiers and additional predictive value. Bioinformatics 24(15), 1698-
1706. 10.1093/bioinformatics/btn262.
Breiman, L., 2001: Random Forests. Machine Learning 45(1), 5-32.

http://dx.doi.org/10.4314/rj.v1i2S.1D
Rwanda Journal, Series D, Volume 1, 2016, Life and Natural Sciences: Special issue II
Canny, M.J. and C.X. Huang, 2006: Leaf water content and palisade cell size. New Phytologist.
170(1), 75-85. DOI: 10.1111/j.1469-8137.2005.01633.x
Ceccato, P., S. Flasse, S. Tarantola, S. Jacquemoud and J-M Gregoire, 2001: Detection vegetation
leaf water content using reflectance in the optical domain. Remote Sensing of Environment77,
22-33.
Ceccato, P., N. Gobron, S. Flasse, B. Pint and S. Tarantola, 2002: Designing a spectral index to
estimate vegetation water content from remote sensing data: part 1: theoretical approach. Remote
Sensing of Environment 82(2–3), 188-197.
Champagne, C.M., K. Staenz, A., Bannari, H. Mcnairin and J.C. Deguise, 2003: Validation of a
hyperspectral curve fitting model for the estimation of plant water content of agricultural
canopies. Remote Sensing of Environment 87,148-160.
Cleary, B. and J. Zaerr, 1984: Guidelines for measuring plant moisture stress with a pressure
chamber. PMS Instrument Company. Royal Oaks Drive, Corvallis, Oregon, USA.
Clevers, J.G.P.W., L. Kooistra and M.E. Schaepman, 2008: Using spectral information from the
NIR water absorption feature for the retrieval of canopy water content. International Journal of
Applied Earth Observation and Geoinformation 10, 388-397.
Clevers, J.G.P.W., L. Kooistra and M.E. Schaepman, 2010: Estimating canopy water content using
hyperspectral remote sensing data. International Journal of Applied Earth Observation and
Geoinformation 12, 119-125.
Danson, F.M., M.D. Steven, T.J. Malthus and J.A. Clark, 1992: High-spectral resolution data for
determining leaf water content. International Journal of Remote Sensing 13(3), 461-470.
de Jong, S.M., E.A. Addink and J.C. Doelman, 2014: Detecting leaf-water content in Mediterranean
trees using high-resolution spectrometry. International Journal of Applied Earth Observation
and Geoinformation 27, 128-136.
de Jong, S.M., E.A. Addink, P. Hoogenboom and W. Nijland, 2012: The spectral response of
Buxussempervirens to different types of environmental stress, a laboratory experiment. ISPRS
Journal of Photogrammetry and Remote Sensing 74, 56-65.
Eitel J.U.H., P.E. Gessler, A.M.S. Smith and R.Robberecht, 2006: Suitability of existing and novel
spectral indices to remotely detect water stress in Populus spp. Forest Ecology and Management
229, 170-182.
http://dx.doi.org/10.4314/rj.v1i2S.1D
Rwanda Journal, Series D, Volume 1, 2016, Life and Natural Sciences: Special issue II
Elsayed, S., B. Misteleand U. Schmidhalter, 2011: Can changes in leaf water potential be assessed
spectrally? Functional Plant Biology 38(6), 523-533.
Gao, B.C. 1996: NDWI-A normalized difference water index for remote sensing of vegetation
liquid water from space.Remote sensing of Environment 58(3), 257-266.
Gaussman H.W., 1977: Reflectance of leaf components. Remote Sensing Environment 6,1-9.
Genc, L., M. Inalpulat, U. Kizil, M. Mirik, S. E. Smith and M. Mendes, 2013: Determination of
water stress with spectral reflectance on sweet corn (Zea mays L.) using classification tree (CT)
analysis. Zemdirbyste-Agriculture 100(1), 81-90.
Govender, M., P.J. Dye, I.M.Weiersbye, E.T.F.Witkowski and F Ahmed, 2009: Review of
commonly used remote sensing and ground-based technologies to measure plant water stress,
ISSN 0378-4738 (Print) = Water SA 35(5) ISSN 1816-7950 (On-line), 741-752.
Graeff, S. and W. Claupein, 2007: Identification and discrimination of water stress in wheat leaves
(Triticumaestivum L.) by means of reflectance measurements. Irrigation Science 26(1), 61-70.
Hunt, E. R. and B. N. Rock, 1989: Detection of changes in leaf water content using near and
middle-infrared reflectance. Remote Sensing of Environment 30, 43-54.
IPCC, 2007: IPCC Fourth Assessment Report: Climate Change 2007. Cambridge University Press,
Cambridge.
Jackson T.J., D. Chen, M. Cosh, F. Li, M. Anderson, C. Walt-Hall, P. Doriaswamy and E.R. Hunt,
2004: Vegetation water content mapping using Landsat data derived normalized difference water
index for corn and soybeans. Remote Sensing of Environment 92, 475-482.
Liu, L., J. Wang, W. Huang, C. Zhao, B. Zhang and Q. Tong, 2004: Estimating winter wheat plant
water content using red edge parameters. International Journal of Remote Sensing 17, 3331-
3342.
Maracci, G., G. Schmuck, B. Hosgood and G. Andreoli, 1991: Interpretation of reflectance spectra
by plant physiological parameters. In: Proceedings of International Geoscience and Remote
Sensing Symposium (IGARSS’91), Remote Sensing: Global Monitoring for Earth Management.
Helsinki University of Technology, Espoo (Finland), 3 - 6 June 1991 (pp. 2303 - 2306). New
York: IEEE.
Peñuelas, J., I. Filella, C. Biel, L. Serrano and R. Save, 1993: The reflectance at the 950-970 region
as an indicator of plant water status. International Journal of Remote Sensing 14(10), 1887-1905.

http://dx.doi.org/10.4314/rj.v1i2S.1D
Rwanda Journal, Series D, Volume 1, 2016, Life and Natural Sciences: Special issue II
Peñuelas, J., J. Piñol, R. Ogaya, and I. Filella, 1997: Estimation of plant water concentration by the
reflectance Water Index WI (R900/R970). International Journal of Remote Sensing 18(13),
2869-2875.
PSR Series Spectroradiometer Manual Revision: 1.05. 9/24/2012
RStudio 2015: RStudio: Integrated development environment for R (Version 0.96.122) [Computer
software]. Boston, MA. Retrieved January 20, 2015. Available from http://www.rstudio.org/
Sims, D.A. and J.A. Gamon, 2003: Estimation of vegetation water content and photosynthetic tissue
area from spectral reflectance: a comparison of indices based on liquid water and chlorophyll
absorption features. Remote Sensing of Environment 84(4), 526-537.
Strobl, C., A-L. Boulesteix, T. Kneib, T. Augustin and A. Zeileis, 2008: Conditional variable
importance for random forests. BMC Bioinformatics, available online at:
http://www.biomedcentral.com/1471-2105/9/307 Accessed 30/03/2015.
Strobl, C., Boulesteix, A., A. Zeileis and T. Hothorn, 2007: Bias in random forest variable
importance measures: illustrations, sources and a solution. BMC Bioinformatics, 8: 1-21.
Suo, X.M., Y.T. Jiang, M. Yang, S.K. Li, K.R. Wang and C.T. Wang, 2010: Artificial neural
network to predict leaf population chlorophyll content from cotton plant images. Agricultural
Sciences in China 9(1), 38-45.
Tucker, C.J., 1980: Remote sensing of leaf water content in the near infrared. Remote Sensing of
Environment 10, 23-32.
Winterhalter, L, B, Mistele, S, Jampatong and U. Schmidhalter, 2011: High throughput sensing of
aerial biomass and above-ground nitrogen uptake in the vegetative stage of well-watered and
drought stressed tropical maize hybrids. Crop Science 51, 479-489.
doi:10.2135/cropsci2010.07.0397
Zhang, Q., Q. Li, and G. Zhang, 2012: Rapid determination of leaf water content using VIS/NIR
spectroscopy analysis with wavelength selection. Spectroscopy: An International Journal 27(2),
93-105.
Related Documents