INSTITUTE FOR HEALTH METRICS AND EVALUATION UNIVERSITY OF WASHINGTON Assessing Impact, Improving Health Progress in Child Health Across Regions in Uganda A REPORT OF THE MCPA PROJECT

Welcome message from author
This document is posted to help you gain knowledge. Please leave a comment to let me know what you think about it! Share it to your friends and learn new things together.
Transcript
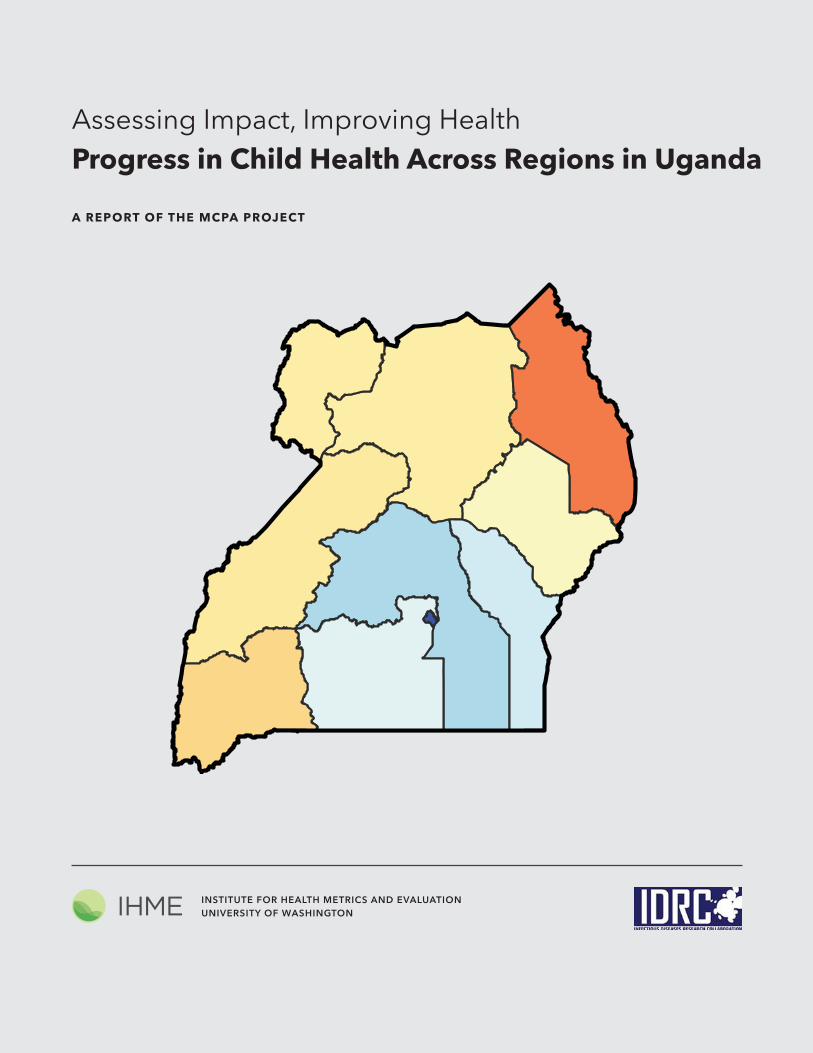
INSTITUTE FOR HEALTH METRICS AND EVALUATIONUNIVERSITY OF WASHINGTON
Assessing Impact, Improving HealthProgress in Child Health Across Regions in Uganda
A REPORT OF THE MCPA PROJECT
1 9
2 0
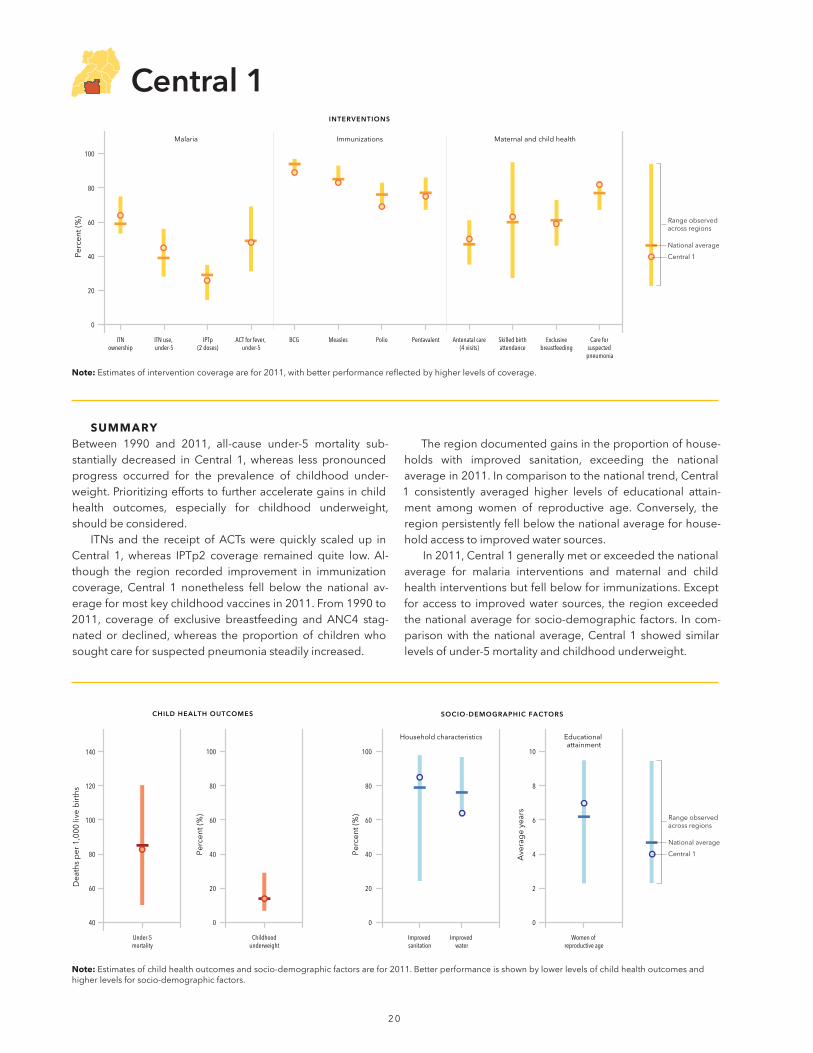
SUMMARY-
-
-
-
-
-
-
-
-
Malaria Immunizations Maternal and child health
INTERVENTIONS
ACT for fever, under-5
IPTp(2 doses)
Exclusivebreastfeeding
Antenatal care(4 visits)
ITNownership
ITN use, under-5
BCG PentavalentMeasles Polio Skilled birthattendance
Care for suspected
pneumonia
0
20
40
60
80
100
Perc
ent (
%) Range observed
across regions
National average
Central 1
Dea
ths
per
1,0
00 li
ve b
irth
s
40
60
80
100
120
140
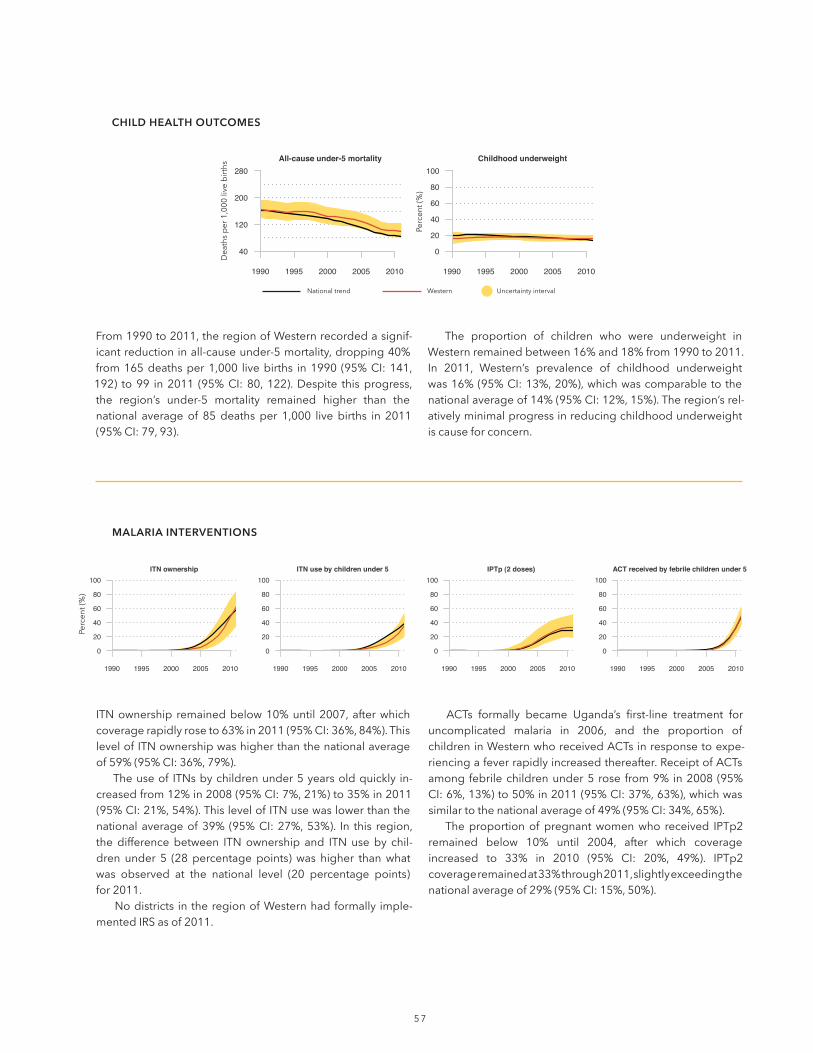
CHILD HEALTH OUTCOMES
Childhoodunderweight
Under-5mortality
Household characteristics Educational attainment
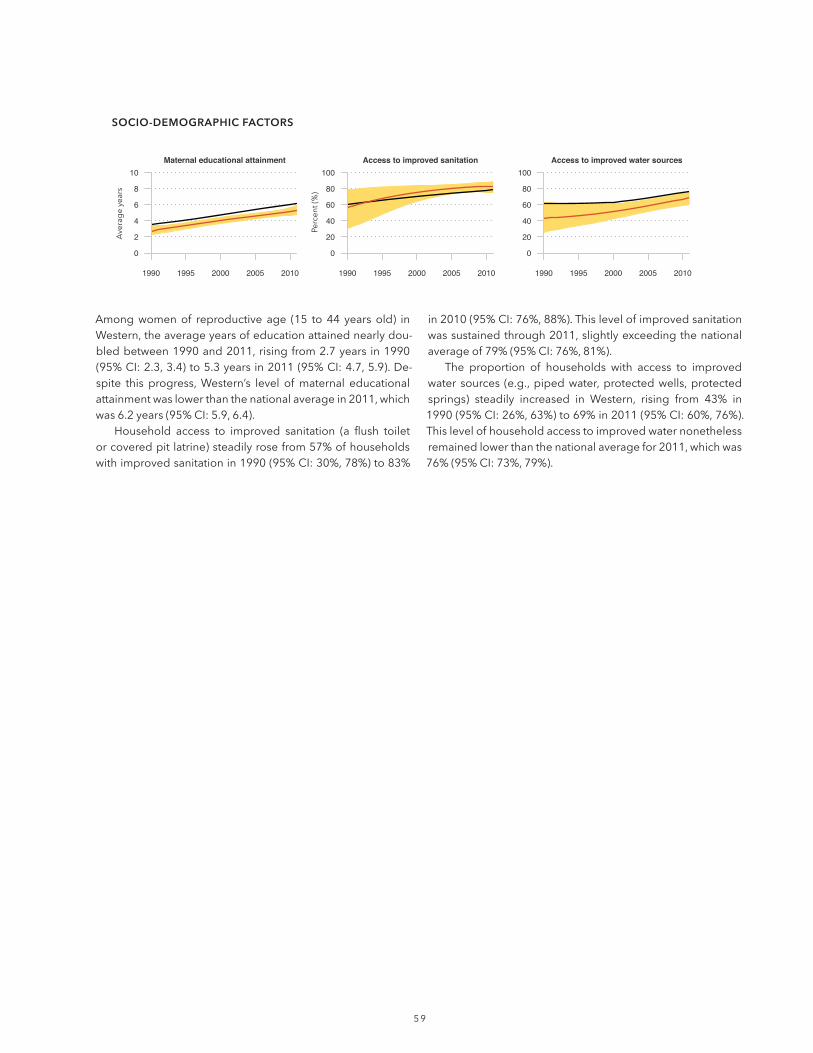
SOCIO-DEMOGRAPHIC FACTORS
Improved sanitation
Improved water
0
20
40
60
80
100
Perc
ent (
%)
0
20
40
60
80
100
Perc
ent (
%)
Women of reproductive age
0
2
4
6
8
10
Ave
rag
e ye
ars
Range observed across regions
National average
Central 1
Note:
Note:
2 1
-
-
-
-
-
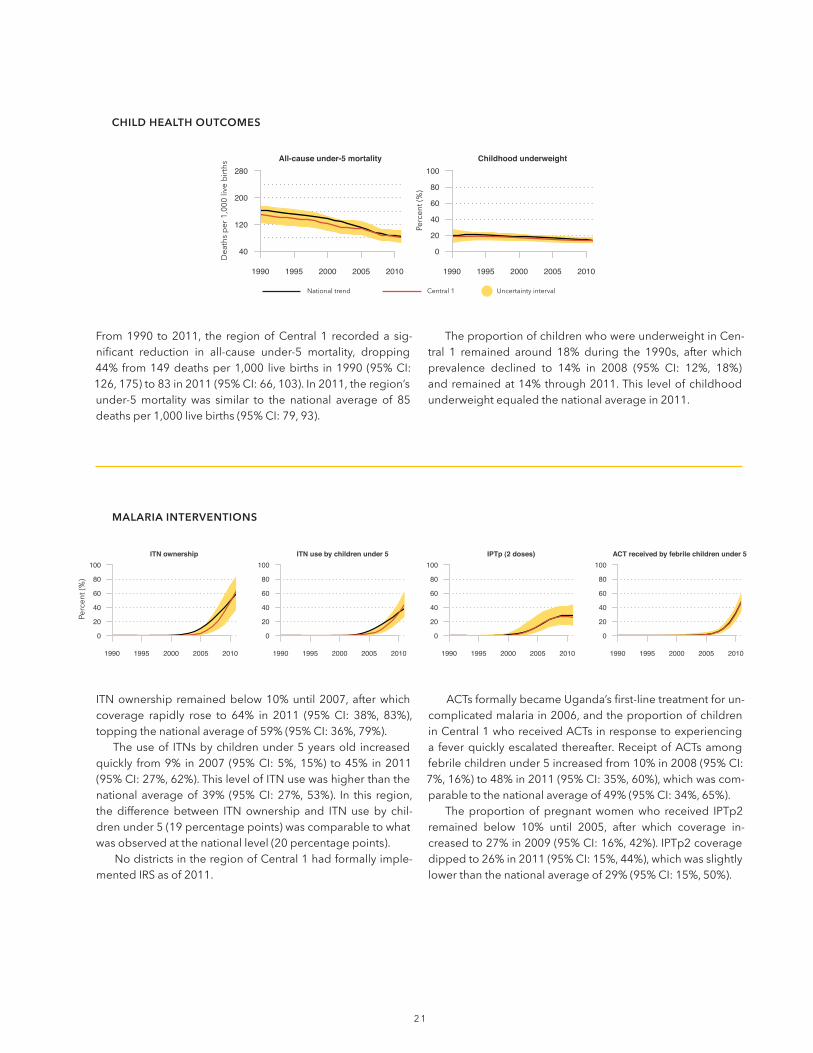
MALARIA INTERVENTIONS
ITN ownership
0
20
40
60
80
100
1990 1995 2000 2005 2010
ITN use by children under 5
0
20
40
60
80
100
1990 1995 2000 2005 2010
IPTp (2 doses)
0
20
40
60
80
100
1990 1995 2000 2005 2010
ACT received by febrile children under 5
0
20
40
60
80
100
1990 1995 2000 2005 2010
All-cause under-5 mortality
40
120
200
280
1990 1995 2000 2005 2010
Childhood underweight
0
20
40
60
80
100
1990 1995 2000 2005 2010
- -
CHILD HEALTH OUTCOMES
2 2
-
-
-
-
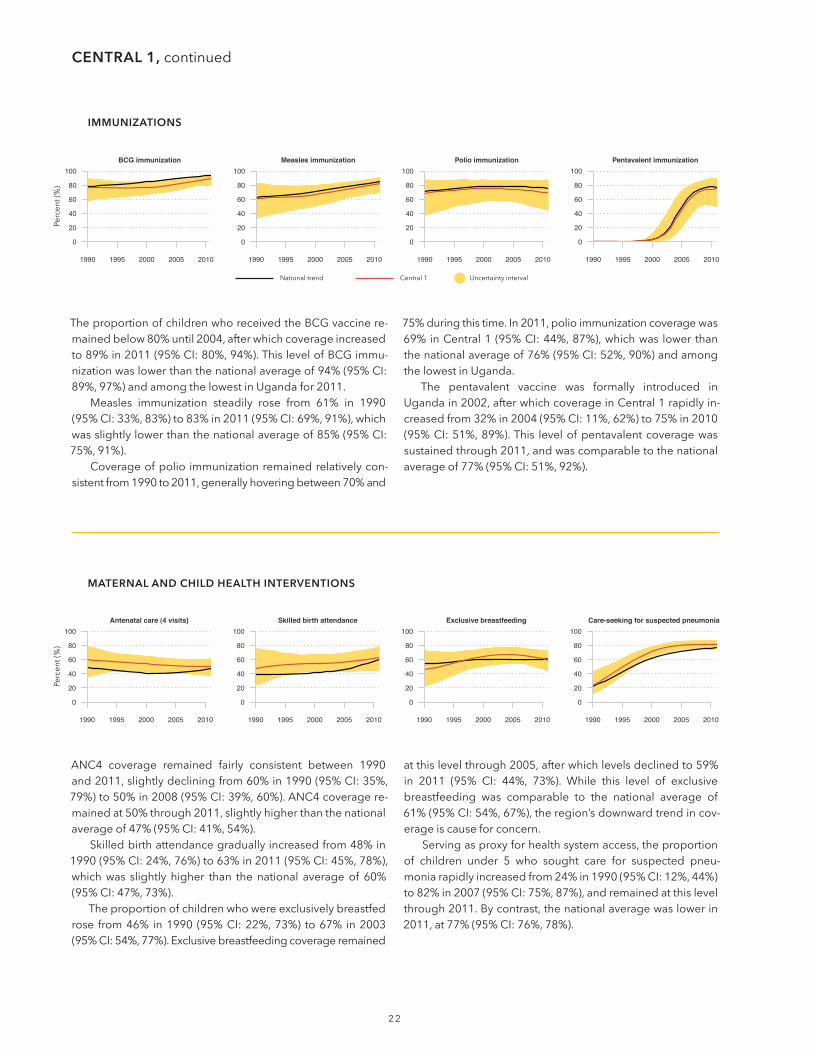
IMMUNIZATIONS
BCG immunization
0
20
40
60
80
100
1990 1995 2000 2005 2010
Measles immunization
0
20
40
60
80
100
1990 1995 2000 2005 2010
Polio immunization
0
20
40
60
80
100
1990 1995 2000 2005 2010
Pentavalent immunization
0
20
40
60
80
100
1990 1995 2000 2005 2010
--
-
MATERNAL AND CHILD HEALTH INTERVENTIONS
Antenatal care (4 visits)
0
20
40
60
80
100
1990 1995 2000 2005 2010
Skilled birth attendance
0
20
40
60
80
100
1990 1995 2000 2005 2010
Exclusive breastfeeding
0
20
40
60
80
100
1990 1995 2000 2005 2010
Care-seeking for suspected pneumonia
0
20
40
60
80
100
1990 1995 2000 2005 2010
CENTRAL 1,
2 3
-
-
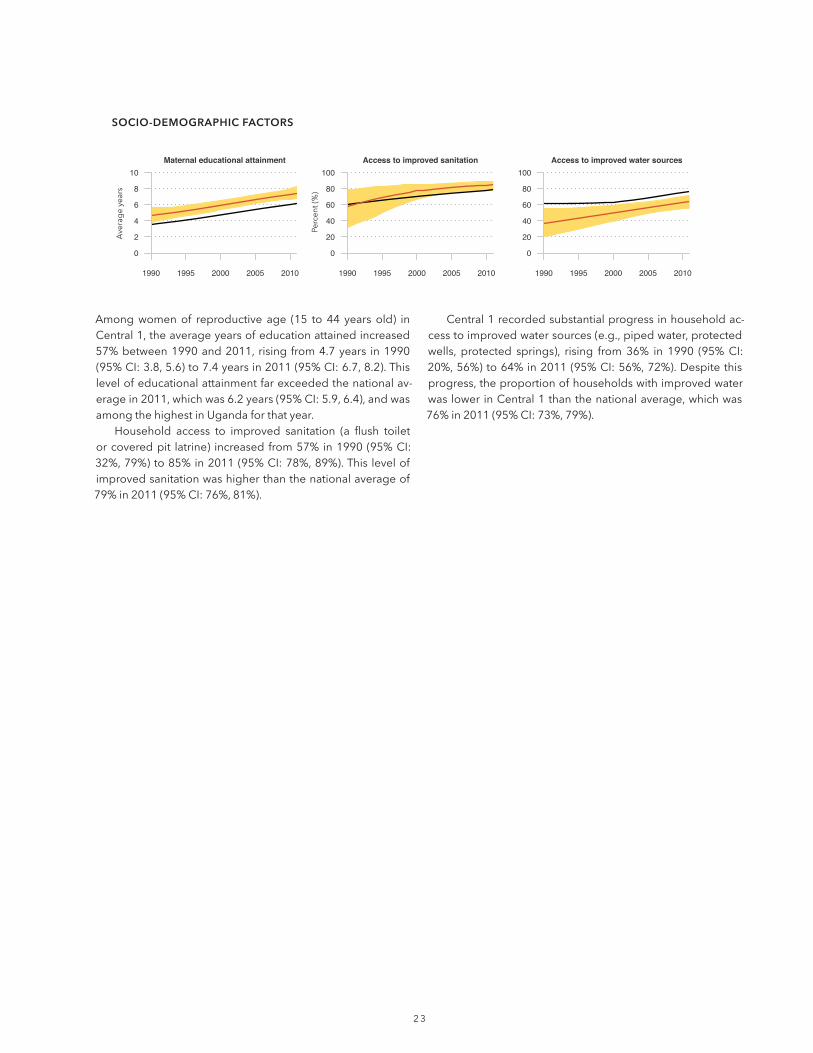
Maternal educational attainment
0
2
4
6
8
10
1990 1995 2000 2005 2010
Access to improved sanitation
0
20
40
60
80
100
1990 1995 2000 2005 2010
Access to improved water sources
0
20
40
60
80
100
1990 1995 2000 2005 2010
2 4
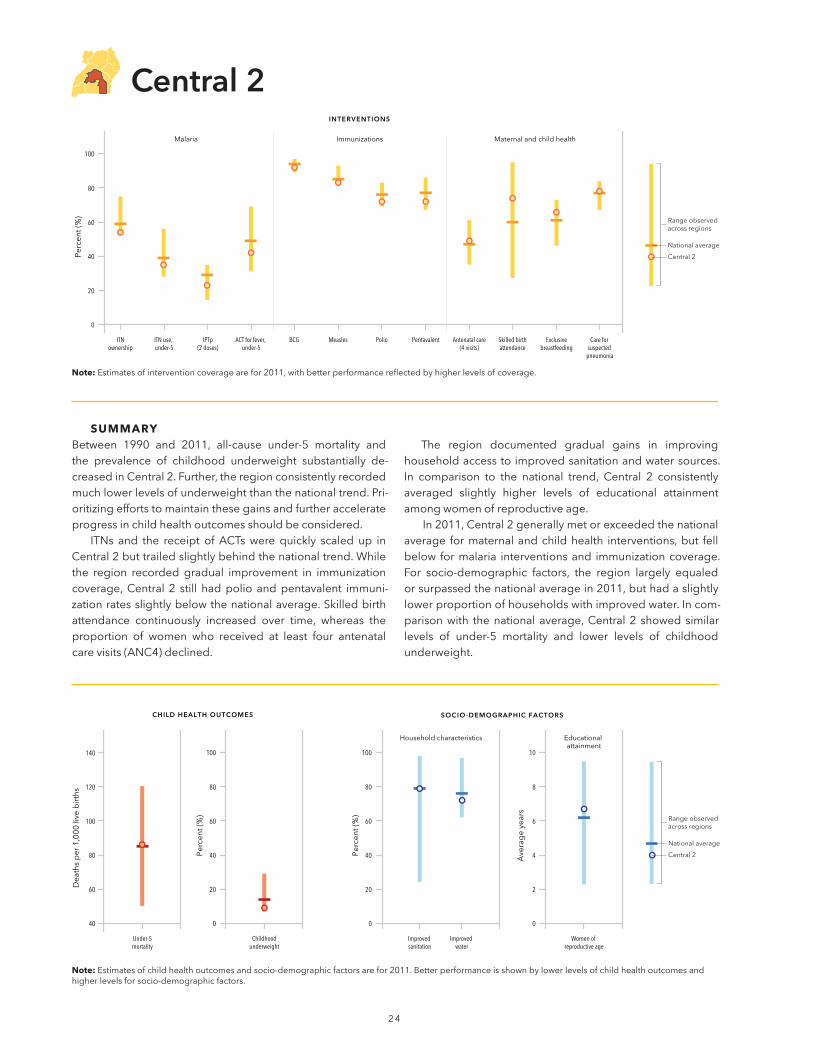
SUMMARY
-
-
--
Malaria Immunizations Maternal and child health
INTERVENTIONS
ACT for fever, under-5
IPTp(2 doses)
Exclusivebreastfeeding
Antenatal care(4 visits)
ITNownership
ITN use, under-5
BCG PentavalentMeasles Polio Skilled birthattendance
Care for suspected
pneumonia
0
20
40
60
80
100
Perc
ent (
%) Range observed
across regions
National average
Central 2
Dea
ths
per
1,0
00 li
ve b
irth
s
40
60
80
100
120
140
CHILD HEALTH OUTCOMES
Childhoodunderweight
Under-5mortality
Household characteristics Educational attainment
SOCIO-DEMOGRAPHIC FACTORS
Improved sanitation
Improved water
0
20
40
60
80
100
Perc
ent (
%)
0
20
40
60
80
100
Perc
ent (
%)
Women of reproductive age
0
2
4
6
8
10
Ave
rag
e ye
ars
Range observed across regions
National average
Central 2
Note:
Note:

2 5
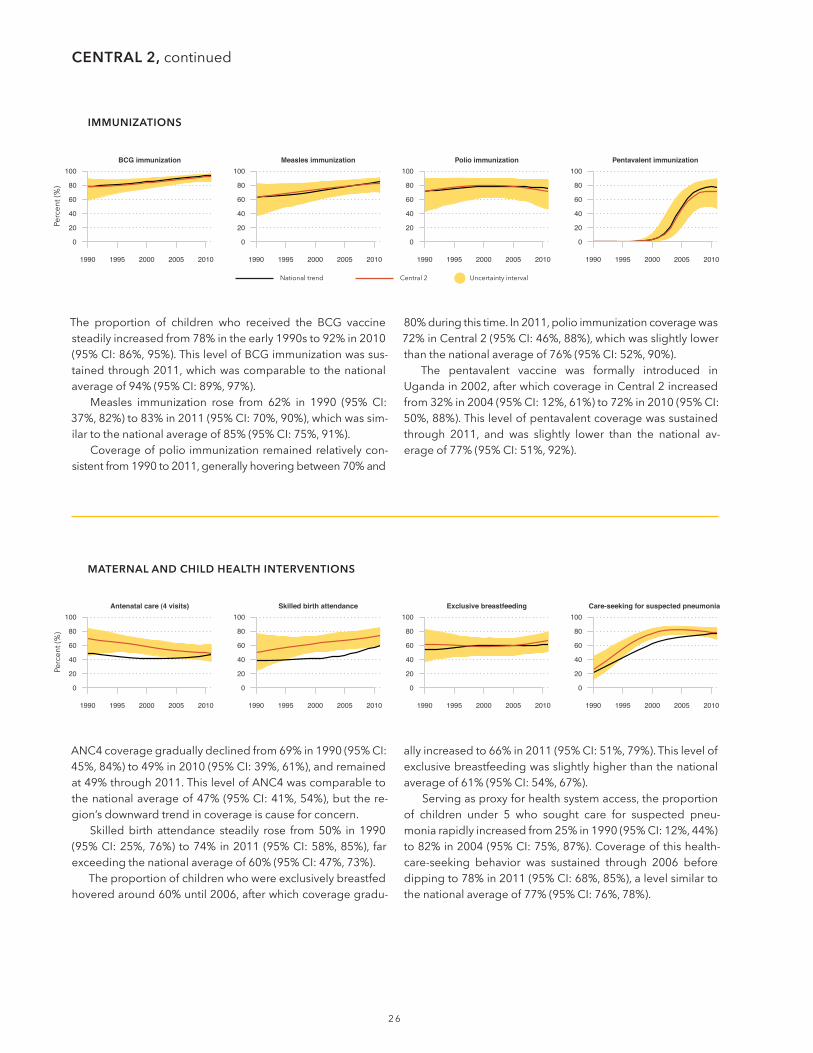
-
-
-
-
-
MALARIA INTERVENTIONS
ITN ownership
0
20
40
60
80
100
1990 1995 2000 2005 2010
ITN use by children under 5
0
20
40
60
80
100
1990 1995 2000 2005 2010
IPTp (2 doses)
0
20
40
60
80
100
1990 1995 2000 2005 2010
ACT received by febrile children under 5
0
20
40
60
80
100
1990 1995 2000 2005 2010
All-cause under-5 mortality
40
120
200
280
1990 1995 2000 2005 2010
Childhood underweight
0
20
40
60
80
100
1990 1995 2000 2005 2010
- -
-
CHILD HEALTH OUTCOMES
2 6
-
-
--
IMMUNIZATIONS
BCG immunization
0
20
40
60
80
100
1990 1995 2000 2005 2010
Measles immunization
0
20
40
60
80
100
1990 1995 2000 2005 2010
Polio immunization
0
20
40
60
80
100
1990 1995 2000 2005 2010
Pentavalent immunization
0
20
40
60
80
100
1990 1995 2000 2005 2010
-
-
-
MATERNAL AND CHILD HEALTH INTERVENTIONS
Antenatal care (4 visits)
0
20
40
60
80
100
1990 1995 2000 2005 2010
Skilled birth attendance
0
20
40
60
80
100
1990 1995 2000 2005 2010
Exclusive breastfeeding
0
20
40
60
80
100
1990 1995 2000 2005 2010
Care-seeking for suspected pneumonia
0
20
40
60
80
100
1990 1995 2000 2005 2010
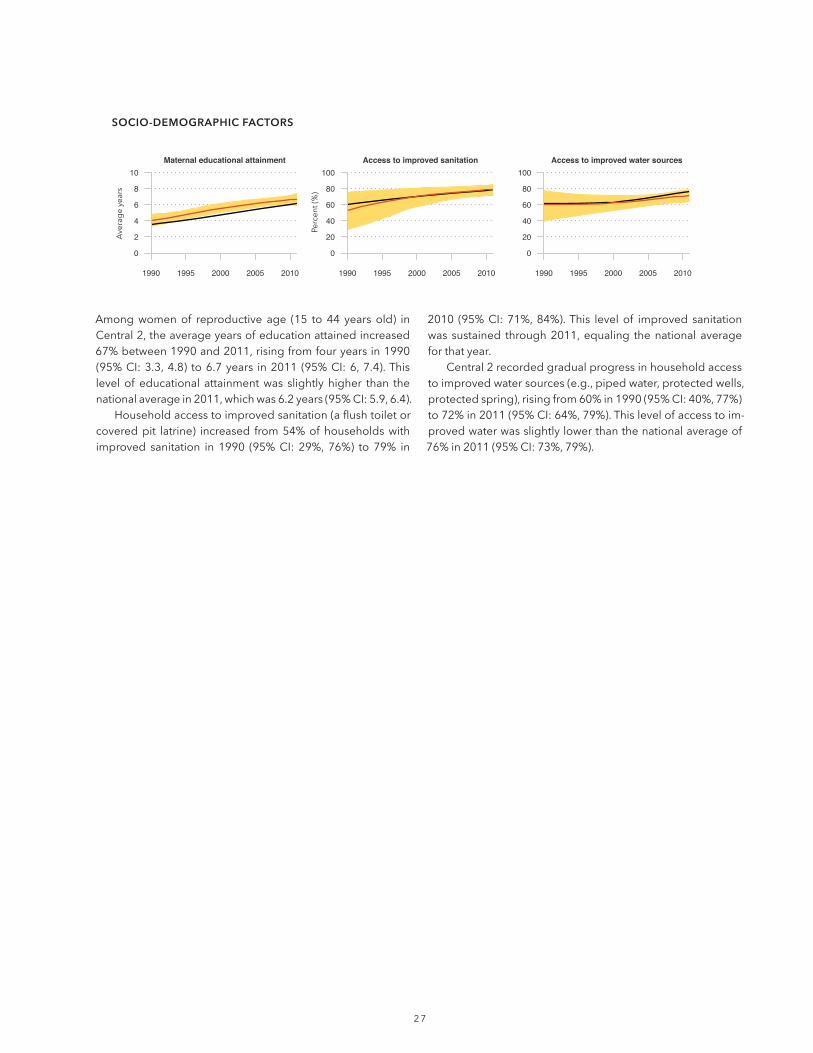
-
Maternal educational attainment
0
2
4
6
8
10
1990 1995 2000 2005 2010
Access to improved sanitation
0
20
40
60
80
100
1990 1995 2000 2005 2010
Access to improved water sources
0
20
40
60
80
100
1990 1995 2000 2005 2010

2 8
SUMMARY-
-
-
-
-
Malaria Immunizations Maternal and child health
INTERVENTIONS
ACT for fever, under-5
IPTp(2 doses)
Exclusivebreastfeeding
Antenatal care(4 visits)
ITNownership
ITN use, under-5
BCG PentavalentMeasles Polio Skilled birthattendance
Care for suspected
pneumonia
0
20
40
60
80
100
Perc
ent (
%) Range observed
across regions
National average
East Central
Dea
ths
per
1,0
00 li
ve b
irth
s
40
60
80
100
120
140
CHILD HEALTH OUTCOMES
Childhoodunderweight
Under-5mortality
Household characteristics Educational attainment
SOCIO-DEMOGRAPHIC FACTORS
Improved sanitation
Improved water
0
20
40
60
80
100
Perc
ent (
%)
0
20
40
60
80
100
Perc
ent (
%)
Women of reproductive age
0
2
4
6
8
10
Ave
rag
e ye
ars
Range observed across regions
National average
East Central
Note:
Note:
2 9
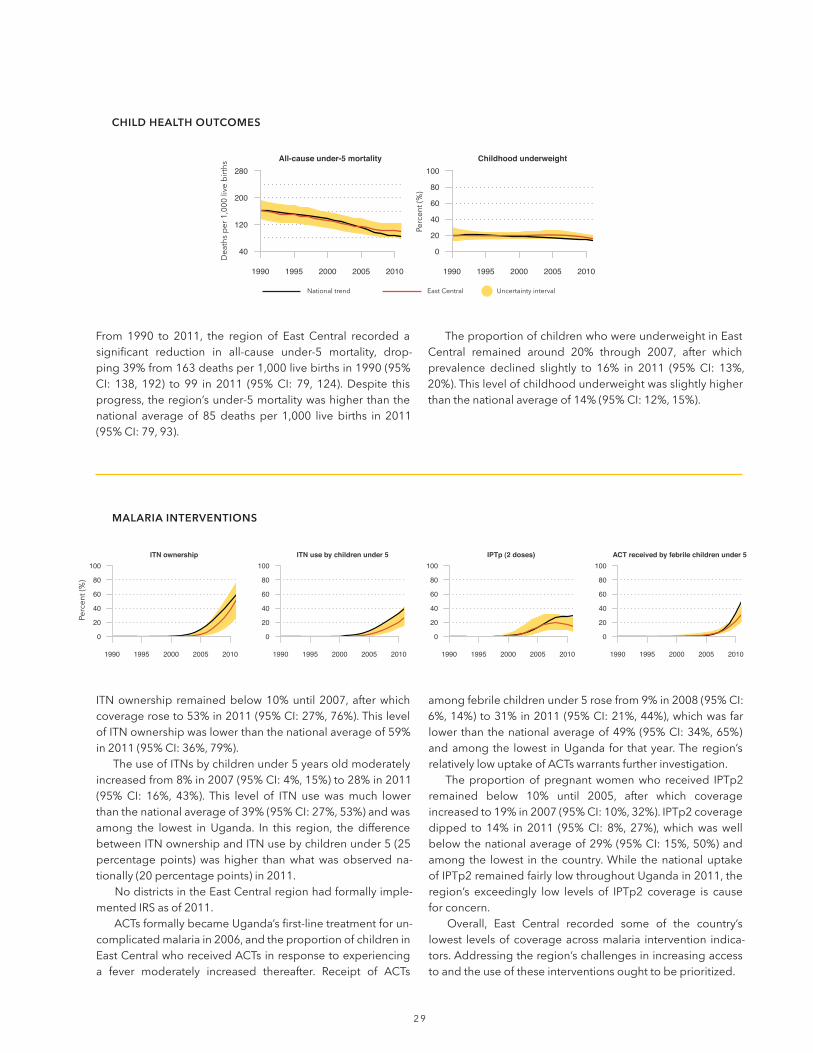
-
-
-
for concern.
-
MALARIA INTERVENTIONS
ITN ownership
0
20
40
60
80
100
1990 1995 2000 2005 2010
ITN use by children under 5
0
20
40
60
80
100
1990 1995 2000 2005 2010
IPTp (2 doses)
0
20
40
60
80
100
1990 1995 2000 2005 2010
ACT received by febrile children under 5
0
20
40
60
80
100
1990 1995 2000 2005 2010
All-cause under-5 mortality
40
120
200
280
1990 1995 2000 2005 2010
Childhood underweight
0
20
40
60
80
100
1990 1995 2000 2005 2010
-
CHILD HEALTH OUTCOMES

3 0
-
-
IMMUNIZATIONS
BCG immunization
0
20
40
60
80
100
1990 1995 2000 2005 2010
Measles immunization
0
20
40
60
80
100
1990 1995 2000 2005 2010
Polio immunization
0
20
40
60
80
100
1990 1995 2000 2005 2010
Pentavalent immunization
0
20
40
60
80
100
1990 1995 2000 2005 2010
-
MATERNAL AND CHILD HEALTH INTERVENTIONS
Antenatal care (4 visits)
0
20
40
60
80
100
1990 1995 2000 2005 2010
Skilled birth attendance
0
20
40
60
80
100
1990 1995 2000 2005 2010
Exclusive breastfeeding
0
20
40
60
80
100
1990 1995 2000 2005 2010
Care-seeking for suspected pneumonia
0
20
40
60
80
100
1990 1995 2000 2005 2010
EAST CENTRAL,
3 1
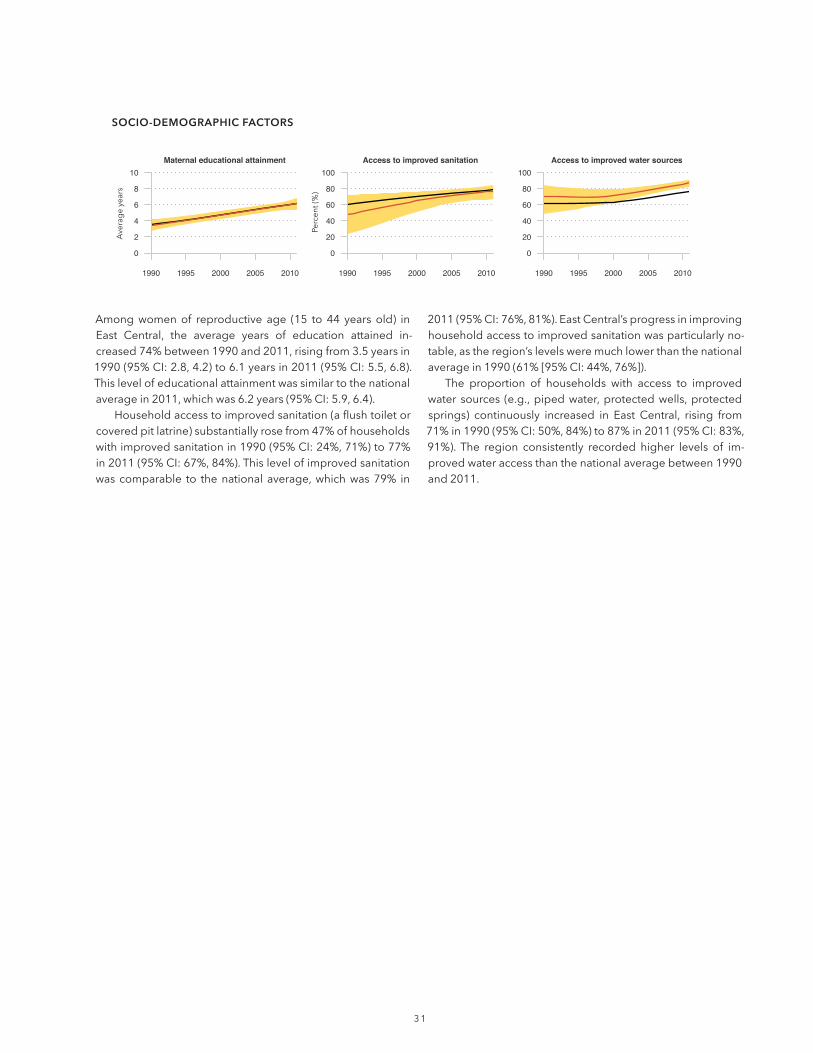
- -
-
and 2011.
Maternal educational attainment
0
2
4
6
8
10
1990 1995 2000 2005 2010
Access to improved sanitation
0
20
40
60
80
100
1990 1995 2000 2005 2010
Access to improved water sources
0
20
40
60
80
100
1990 1995 2000 2005 2010
3 2
SUMMARY-
-
-
-
-
-
Malaria Immunizations Maternal and child health
INTERVENTIONS
ACT for fever, under-5
IPTp(2 doses)
Exclusivebreastfeeding
Antenatal care(4 visits)
ITNownership
ITN use, under-5
BCG PentavalentMeasles Polio Skilled birthattendance
Care for suspected
pneumonia
0
20
40
60
80
100
Perc
ent (
%) Range observed
across regions
National average
Eastern
Dea
ths
per
1,0
00 li
ve b
irth
s
40
60
80
100
120
140
CHILD HEALTH OUTCOMES
Childhoodunderweight
Under-5mortality
Household characteristics Educational attainment
SOCIO-DEMOGRAPHIC FACTORS
Improved sanitation
Improved water
0
20
40
60
80
100
Perc
ent (
%)
0
20
40
60
80
100
Perc
ent (
%)
Women of reproductive age
0
2
4
6
8
10
Ave
rag
e ye
ars
Range observed across regions
National average
Eastern
Note:
Note:
3 3
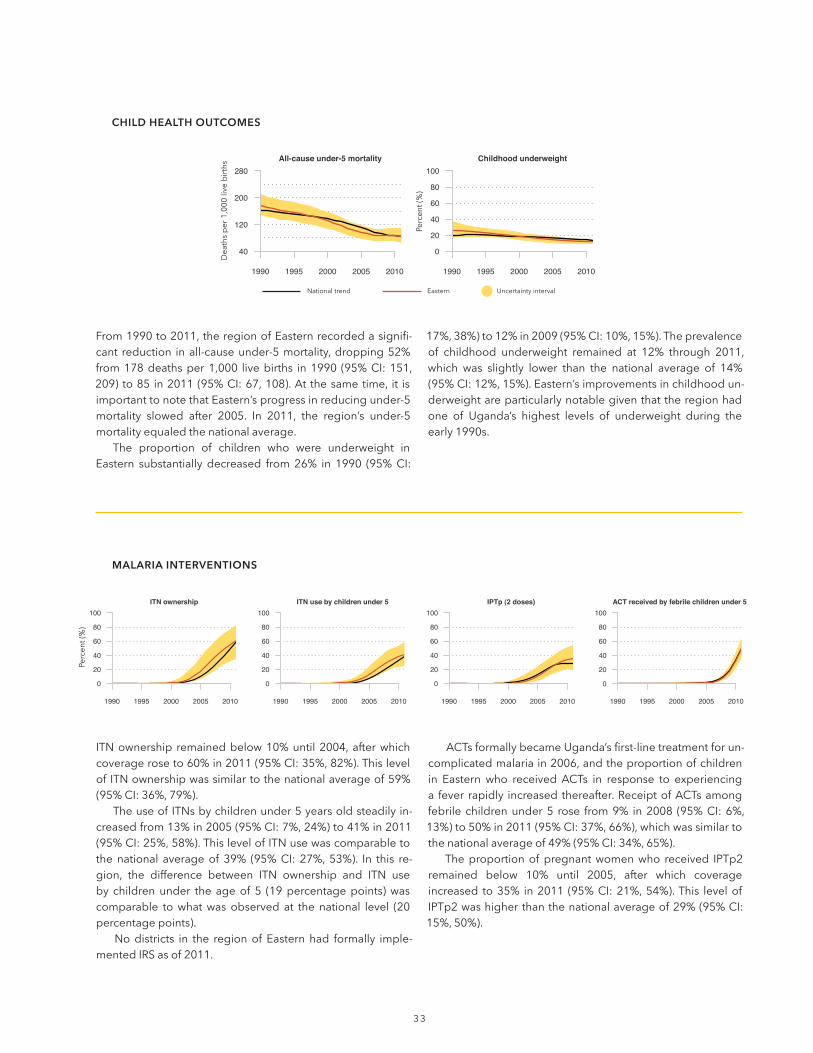
-
-
-
-
MALARIA INTERVENTIONS
ITN ownership
0
20
40
60
80
100
1990 1995 2000 2005 2010
ITN use by children under 5
0
20
40
60
80
100
1990 1995 2000 2005 2010
IPTp (2 doses)
0
20
40
60
80
100
1990 1995 2000 2005 2010
ACT received by febrile children under 5
0
20
40
60
80
100
1990 1995 2000 2005 2010
All-cause under-5 mortality
40
120
200
280
1990 1995 2000 2005 2010
Childhood underweight
0
20
40
60
80
100
1990 1995 2000 2005 2010
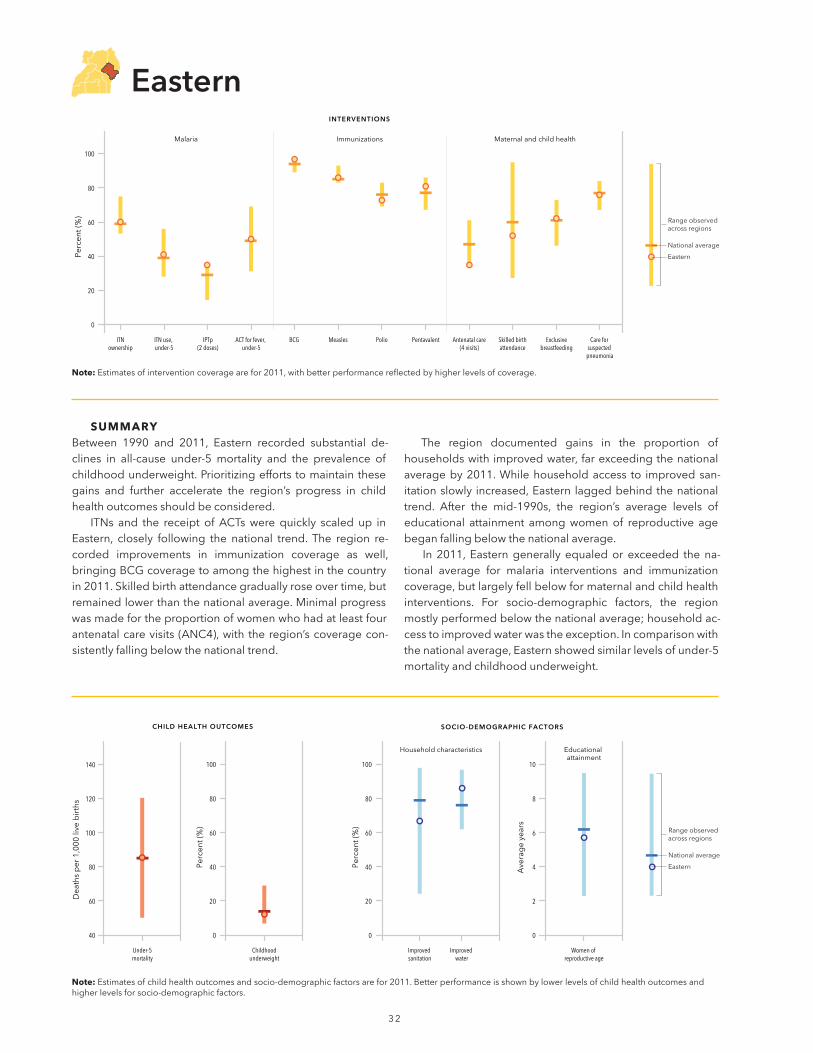
-
-
early 1990s.
CHILD HEALTH OUTCOMES
3 4
-
IMMUNIZATIONS
BCG immunization
0
20
40
60
80
100
1990 1995 2000 2005 2010
Measles immunization
0
20
40
60
80
100
1990 1995 2000 2005 2010
Polio immunization
0
20
40
60
80
100
1990 1995 2000 2005 2010
Pentavalent immunization
0
20
40
60
80
100
1990 1995 2000 2005 2010
-
-
-
MATERNAL AND CHILD HEALTH INTERVENTIONS
Antenatal care (4 visits)
0
20
40
60
80
100
1990 1995 2000 2005 2010
Skilled birth attendance
0
20
40
60
80
100
1990 1995 2000 2005 2010
Exclusive breastfeeding
0
20
40
60
80
100
1990 1995 2000 2005 2010
Care-seeking for suspected pneumonia
0
20
40
60
80
100
1990 1995 2000 2005 2010
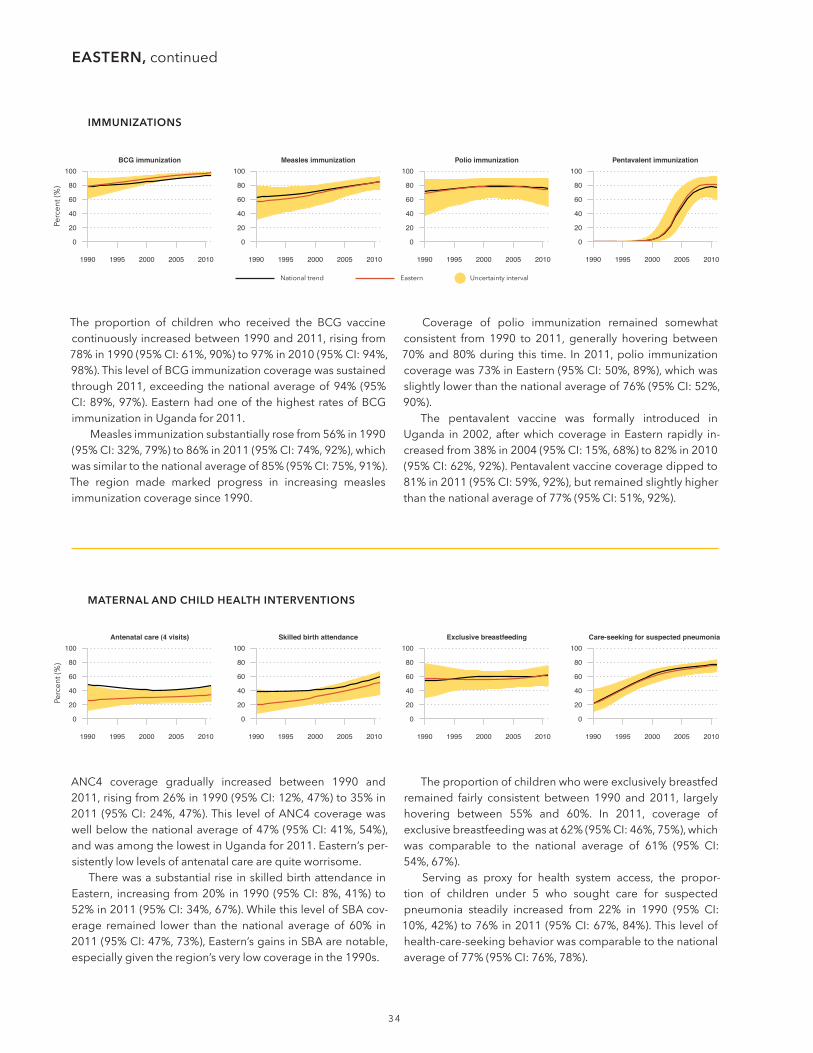
EASTERN,
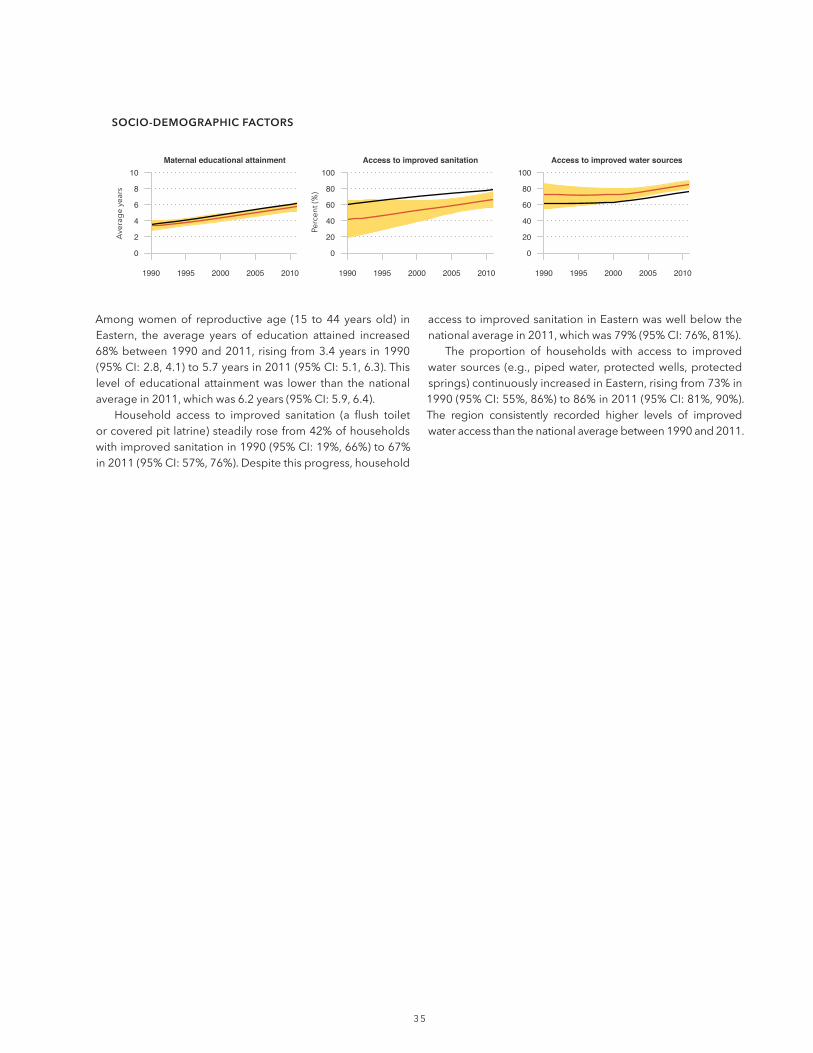
3 5
Maternal educational attainment
0
2
4
6
8
10
1990 1995 2000 2005 2010
Access to improved sanitation
0
20
40
60
80
100
1990 1995 2000 2005 2010
Access to improved water sources
0
20
40
60
80
100
1990 1995 2000 2005 2010

3 6
SUMMARY
-
-
-
Malaria Immunizations Maternal and child health
INTERVENTIONS
ACT for fever, under-5
IPTp(2 doses)
Exclusivebreastfeeding
Antenatal care(4 visits)
ITNownership
ITN use, under-5
BCG PentavalentMeasles Polio Skilled birthattendance
Care for suspected
pneumonia
0
20
40
60
80
100
Perc
ent (
%) Range observed
across regions
National average
Kampala
Dea
ths
per
1,0
00 li
ve b
irth
s
40
60
80
100
120
140
CHILD HEALTH OUTCOMES
Childhoodunderweight
Under-5mortality
Household characteristics Educational attainment
SOCIO-DEMOGRAPHIC FACTORS
Improved sanitation
Improved water
0
20
40
60
80
100
Perc
ent (
%)
0
20
40
60
80
100
Perc
ent (
%)
Women of reproductive age
0
2
4
6
8
10
Ave
rag
e ye
ars
Range observed across regions
National average
Kampala
Note:
Note:
-
-
-
-
-
-
-
MALARIA INTERVENTIONS
ITN ownership
0
20
40
60
80
100
1990 1995 2000 2005 2010
ITN use by children under 5
0
20
40
60
80
100
1990 1995 2000 2005 2010
IPTp (2 doses)
0
20
40
60
80
100
1990 1995 2000 2005 2010
ACT received by febrile children under 5
0
20
40
60
80
100
1990 1995 2000 2005 2010
All-cause under-5 mortality
40
120
200
280
1990 1995 2000 2005 2010
Childhood underweight
0
20
40
60
80
100
1990 1995 2000 2005 2010
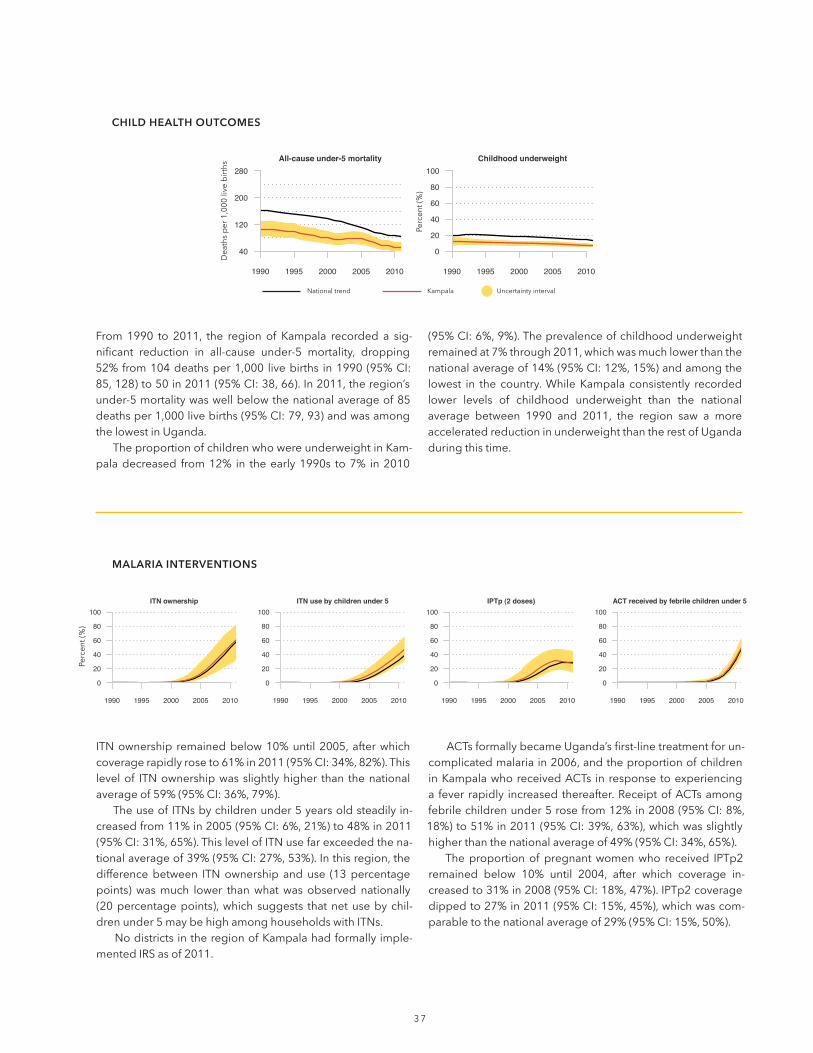
-
-
CHILD HEALTH OUTCOMES

3 8
-
-
-
-
IMMUNIZATIONS
BCG immunization
0
20
40
60
80
100
1990 1995 2000 2005 2010
Measles immunization
0
20
40
60
80
100
1990 1995 2000 2005 2010
Polio immunization
0
20
40
60
80
100
1990 1995 2000 2005 2010
Pentavalent immunization
0
20
40
60
80
100
1990 1995 2000 2005 2010
-
-
-
MATERNAL AND CHILD HEALTH INTERVENTIONS
Antenatal care (4 visits)
0
20
40
60
80
100
1990 1995 2000 2005 2010
Skilled birth attendance
0
20
40
60
80
100
1990 1995 2000 2005 2010
Exclusive breastfeeding
0
20
40
60
80
100
1990 1995 2000 2005 2010
Care-seeking for suspected pneumonia
0
20
40
60
80
100
1990 1995 2000 2005 2010

3 9
-
-
Maternal educational attainment
0
2
4
6
8
10
1990 1995 2000 2005 2010
Access to improved sanitation
0
20
40
60
80
100
1990 1995 2000 2005 2010
Access to improved water sources
0
20
40
60
80
100
1990 1995 2000 2005 2010
4 0
SUMMARY
-
-
-
-
-
-
-
Malaria Immunizations Maternal and child health
INTERVENTIONS
ACT for fever, under-5
IPTp(2 doses)
Exclusivebreastfeeding
Antenatal care(4 visits)
ITNownership
ITN use, under-5
BCG PentavalentMeasles Polio Skilled birthattendance
Care for suspected
pneumonia
0
20
40
60
80
100
Perc
ent (
%) Range observed
across regions
National average
Karamoja
Dea
ths
per
1,0
00 li
ve b
irth
s
40
60
80
100
120
140
CHILD HEALTH OUTCOMES
Childhoodunderweight
Under-5mortality
Household characteristics Educational attainment
SOCIO-DEMOGRAPHIC FACTORS
Improved sanitation
Improved water
0
20
40
60
80
100
Perc
ent (
%)
0
20
40
60
80
100
Perc
ent (
%)
Women of reproductive age
0
2
4
6
8
10
Ave
rag
e ye
ars
Range observed across regions
National average
Karamoja
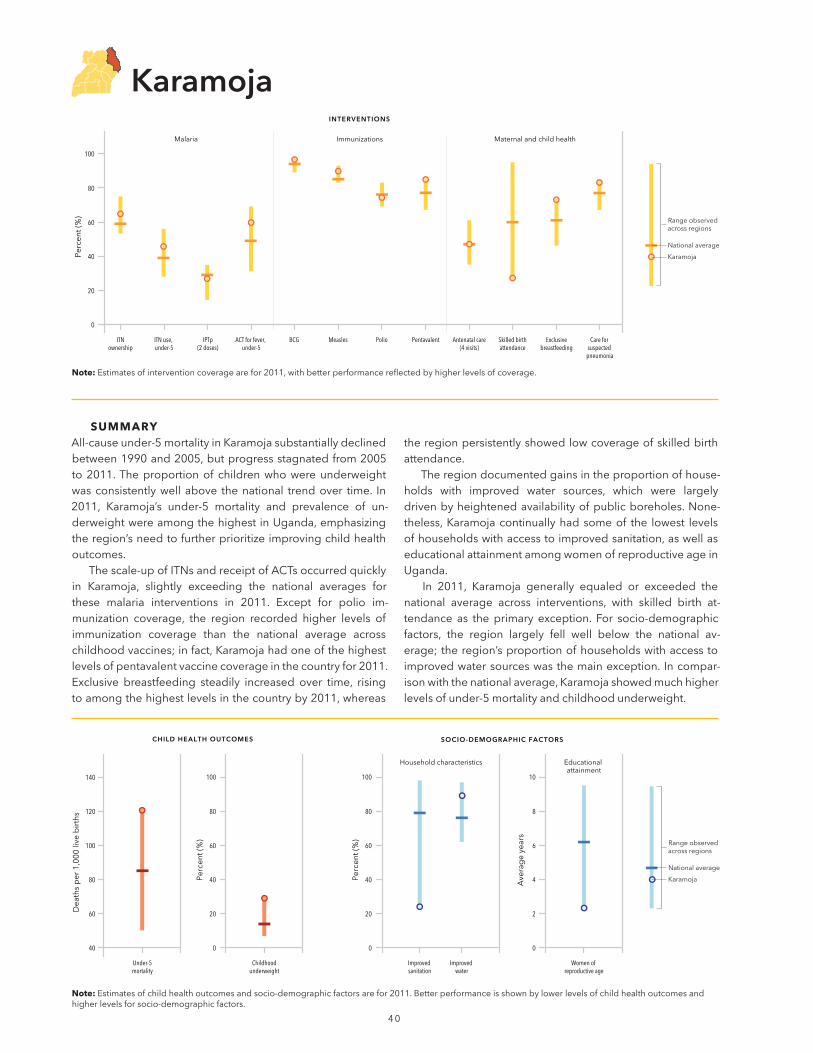
Note:
Karamoja
Note:
4 1
-
MALARIA INTERVENTIONS
ITN ownership
0
20
40
60
80
100
1990 1995 2000 2005 2010
ITN use by children under 5
0
20
40
60
80
100
1990 1995 2000 2005 2010
IPTp (2 doses)
0
20
40
60
80
100
1990 1995 2000 2005 2010
ACT received by febrile children under 5
0
20
40
60
80
100
1990 1995 2000 2005 2010
All-cause under-5 mortality
40
120
200
280
1990 1995 2000 2005 2010
Childhood underweight
0
20
40
60
80
100
1990 1995 2000 2005 2010
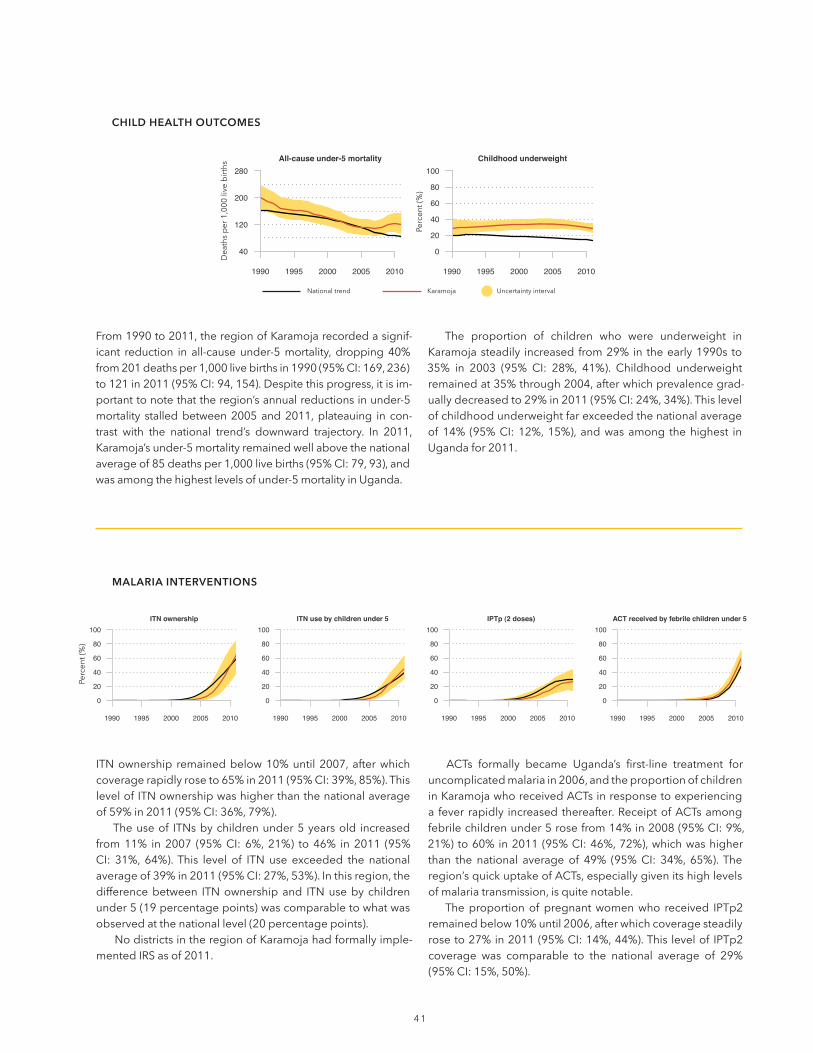
-
-
-
-
CHILD HEALTH OUTCOMES
Karamoja
4 2
Karamoja
-
-
-
-
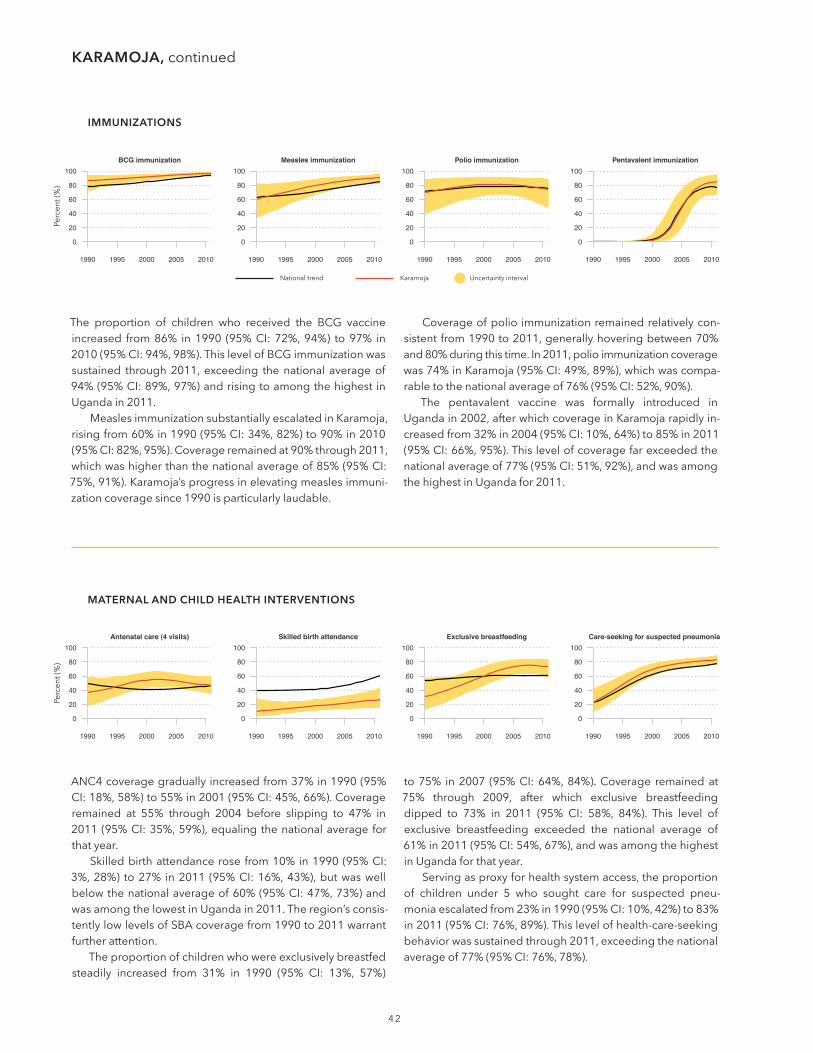
IMMUNIZATIONS
BCG immunization
0
20
40
60
80
100
1990 1995 2000 2005 2010
Measles immunization
0
20
40
60
80
100
1990 1995 2000 2005 2010
Polio immunization
0
20
40
60
80
100
1990 1995 2000 2005 2010
Pentavalent immunization
0
20
40
60
80
100
1990 1995 2000 2005 2010
-
-
MATERNAL AND CHILD HEALTH INTERVENTIONS
Antenatal care (4 visits)
0
20
40
60
80
100
1990 1995 2000 2005 2010
Skilled birth attendance
0
20
40
60
80
100
1990 1995 2000 2005 2010
Exclusive breastfeeding
0
20
40
60
80
100
1990 1995 2000 2005 2010
Care-seeking for suspected pneumonia
0
20
40
60
80
100
1990 1995 2000 2005 2010
KARAMOJA,
4 3
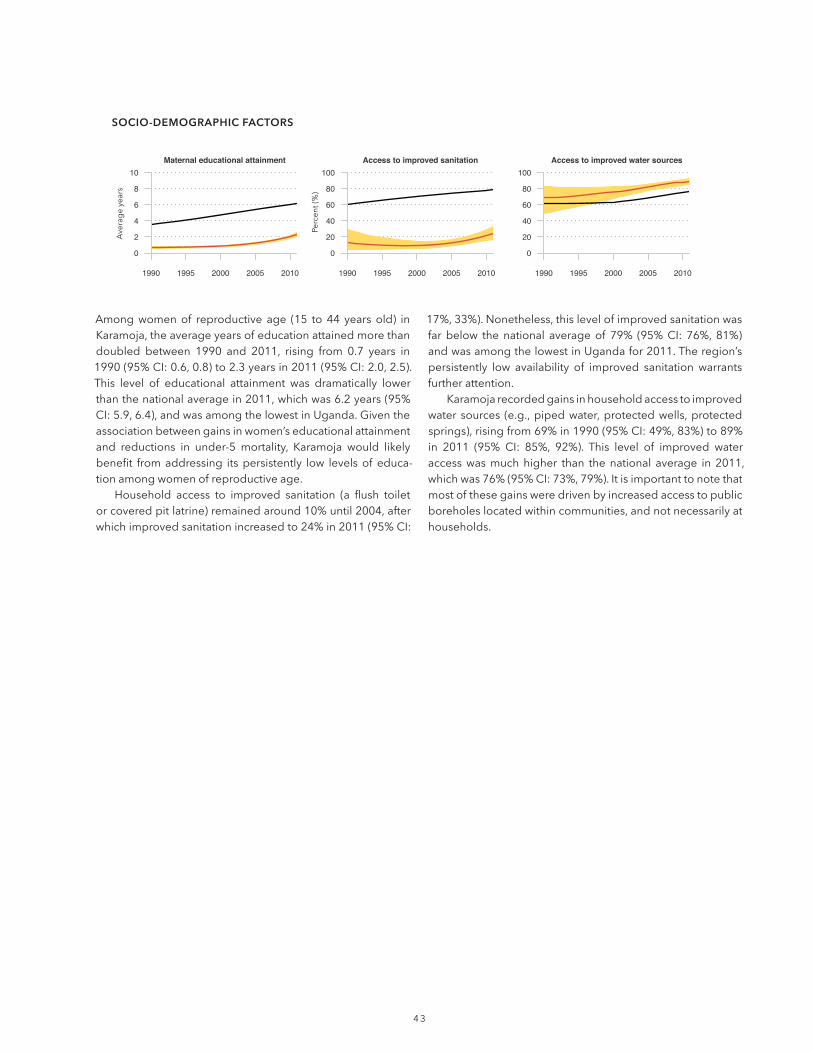
-
Maternal educational attainment
0
2
4
6
8
10
1990 1995 2000 2005 2010
Access to improved sanitation
0
20
40
60
80
100
1990 1995 2000 2005 2010
Access to improved water sources
0
20
40
60
80
100
1990 1995 2000 2005 2010
4 4
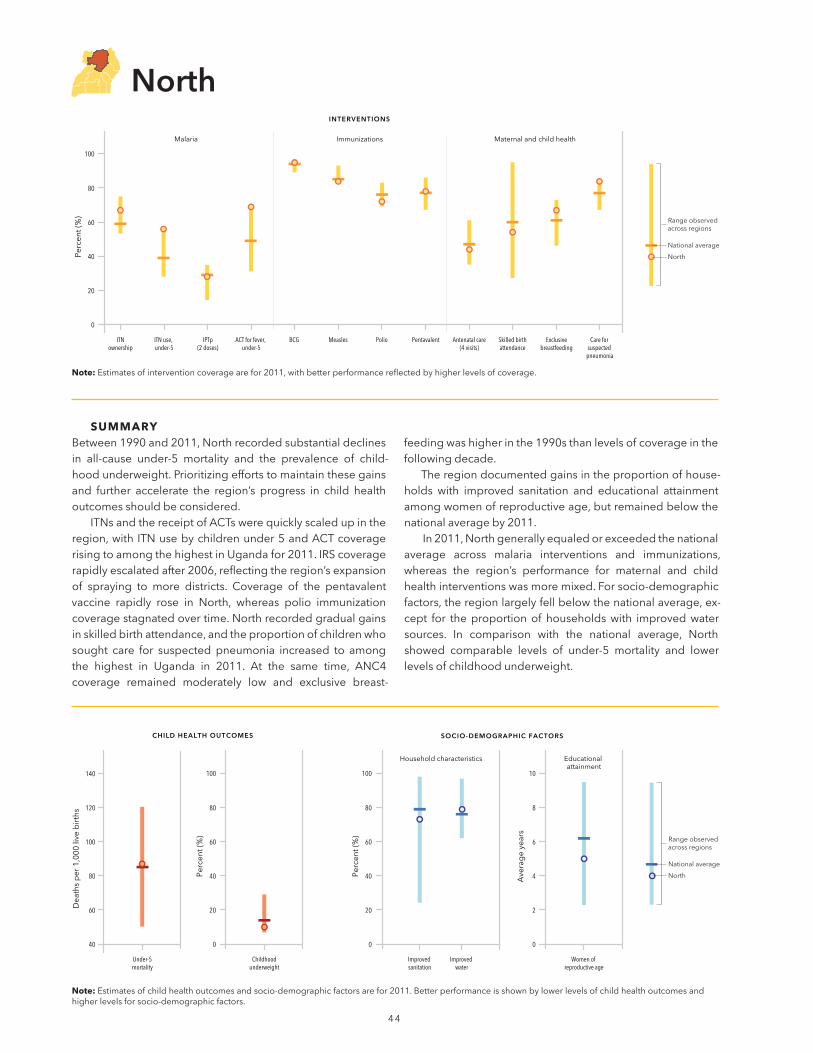
SUMMARY
-
-
-
-
Malaria Immunizations Maternal and child health
INTERVENTIONS
ACT for fever, under-5
IPTp(2 doses)
Exclusivebreastfeeding
Antenatal care(4 visits)
ITNownership
ITN use, under-5
BCG PentavalentMeasles Polio Skilled birthattendance
Care for suspected
pneumonia
0
20
40
60
80
100
Perc
ent (
%) Range observed
across regions
National average
North
Dea
ths
per
1,0
00 li
ve b
irth
s
40
60
80
100
120
140
CHILD HEALTH OUTCOMES
Childhoodunderweight
Under-5mortality
Household characteristics Educational attainment
SOCIO-DEMOGRAPHIC FACTORS
Improved sanitation
Improved water
0
20
40
60
80
100
Perc
ent (
%)
0
20
40
60
80
100
Perc
ent (
%)
Women of reproductive age
0
2
4
6
8
10
Ave
rag
e ye
ars
Range observed across regions
National average
North
Note:
Note:
4 5
-
-
-
-
-
MALARIA INTERVENTIONS
ITN ownership
0
20
40
60
80
100
1990 1995 2000 2005 2010
ITN use by children under 5
0
20
40
60
80
100
1990 1995 2000 2005 2010
Indoor residual spraying
0
20
40
60
80
100
1990 1995 2000 2005 2010
IPTp (2 doses)
0
20
40
60
80
100
1990 1995 2000 2005 2010
ACT received by febrile children under 5
0
20
40
60
80
100
1990 1995 2000 2005 2010
All-cause under-5 mortality
40
120
200
280
1990 1995 2000 2005 2010
Childhood underweight
0
20
40
60
80
100
1990 1995 2000 2005 2010
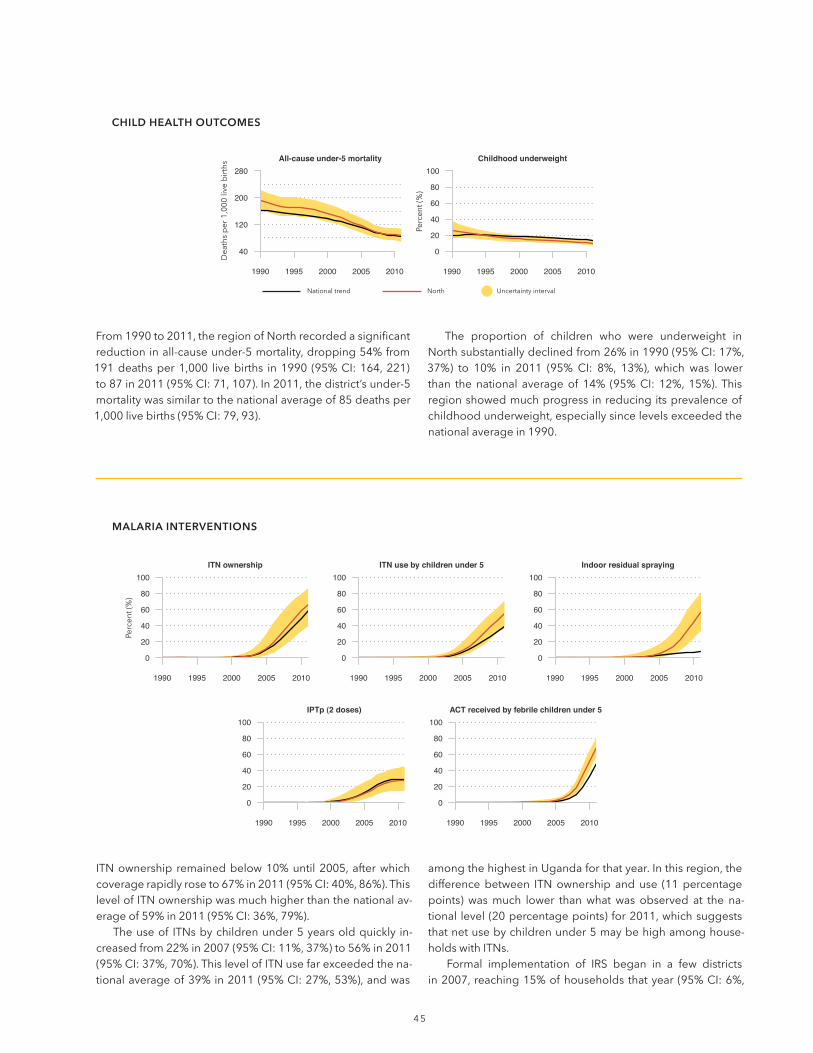
CHILD HEALTH OUTCOMES
4 6
-
-
-
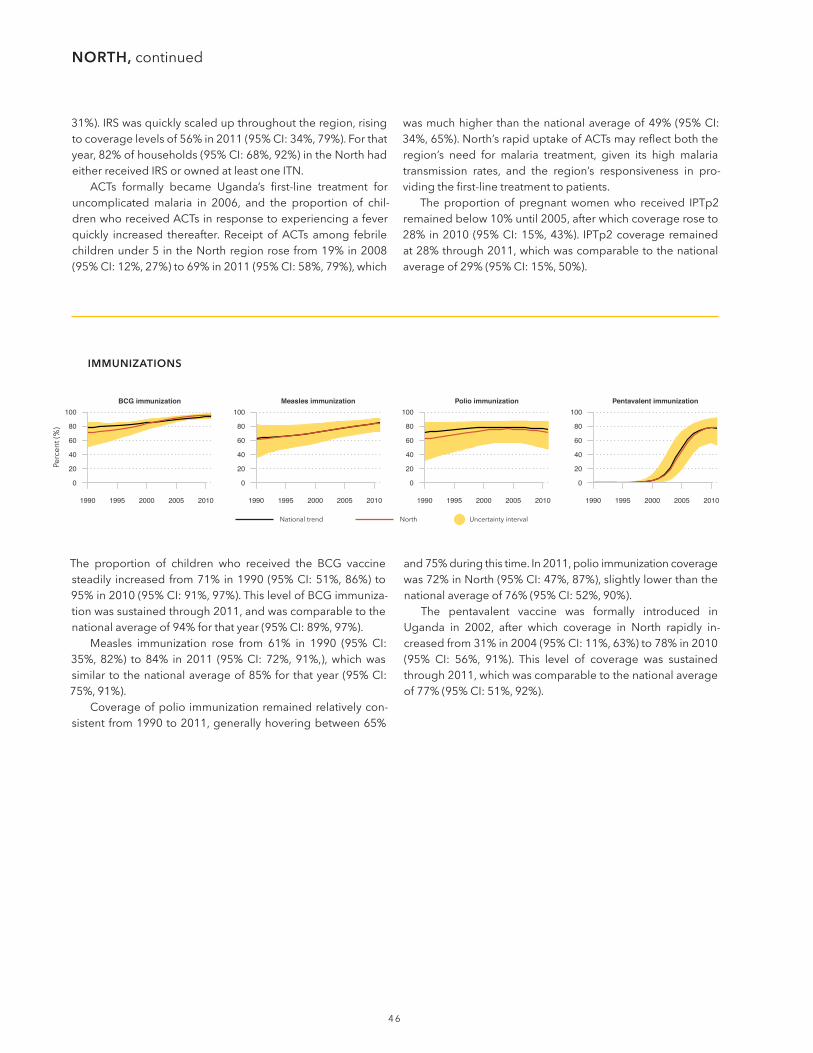
IMMUNIZATIONS
BCG immunization
0
20
40
60
80
100
1990 1995 2000 2005 2010
Measles immunization
0
20
40
60
80
100
1990 1995 2000 2005 2010
Polio immunization
0
20
40
60
80
100
1990 1995 2000 2005 2010
Pentavalent immunization
0
20
40
60
80
100
1990 1995 2000 2005 2010
NORTH,
-
-

-
-
-
-
MATERNAL AND CHILD HEALTH INTERVENTIONS
Antenatal care (4 visits)
0
20
40
60
80
100
1990 1995 2000 2005 2010
Skilled birth attendance
0
20
40
60
80
100
1990 1995 2000 2005 2010
Exclusive breastfeeding
0
20
40
60
80
100
1990 1995 2000 2005 2010
Care-seeking for suspected pneumonia
0
20
40
60
80
100
1990 1995 2000 2005 2010
--
Maternal educational attainment
0
2
4
6
8
10
1990 1995 2000 2005 2010
Access to improved sanitation
0
20
40
60
80
100
1990 1995 2000 2005 2010
Access to improved water sources
0
20
40
60
80
100
1990 1995 2000 2005 2010

4 8
SUMMARY-
-
-
-
-
-
-
Malaria Immunizations Maternal and child health
INTERVENTIONS
ACT for fever, under-5
IPTp(2 doses)
Exclusivebreastfeeding
Antenatal care(4 visits)
ITNownership
ITN use, under-5
BCG PentavalentMeasles Polio Skilled birthattendance
Care for suspected
pneumonia
0
20
40
60
80
100
Perc
ent (
%) Range observed
across regions
National average
Southwest
Dea
ths
per
1,0
00 li
ve b
irth
s
40
60
80
100
120
140
CHILD HEALTH OUTCOMES
Childhoodunderweight
Under-5mortality
Household characteristics Educational attainment
SOCIO-DEMOGRAPHIC FACTORS
Improved sanitation
Improved water
0
20
40
60
80
100
Perc
ent (
%)
0
20
40
60
80
100
Perc
ent (
%)
Women of reproductive age
0
2
4
6
8
10
Ave
rag
e ye
ars
Range observed across regions
National average
Southwest
Note:
Note:
4 9
-
-
-
-
-
-
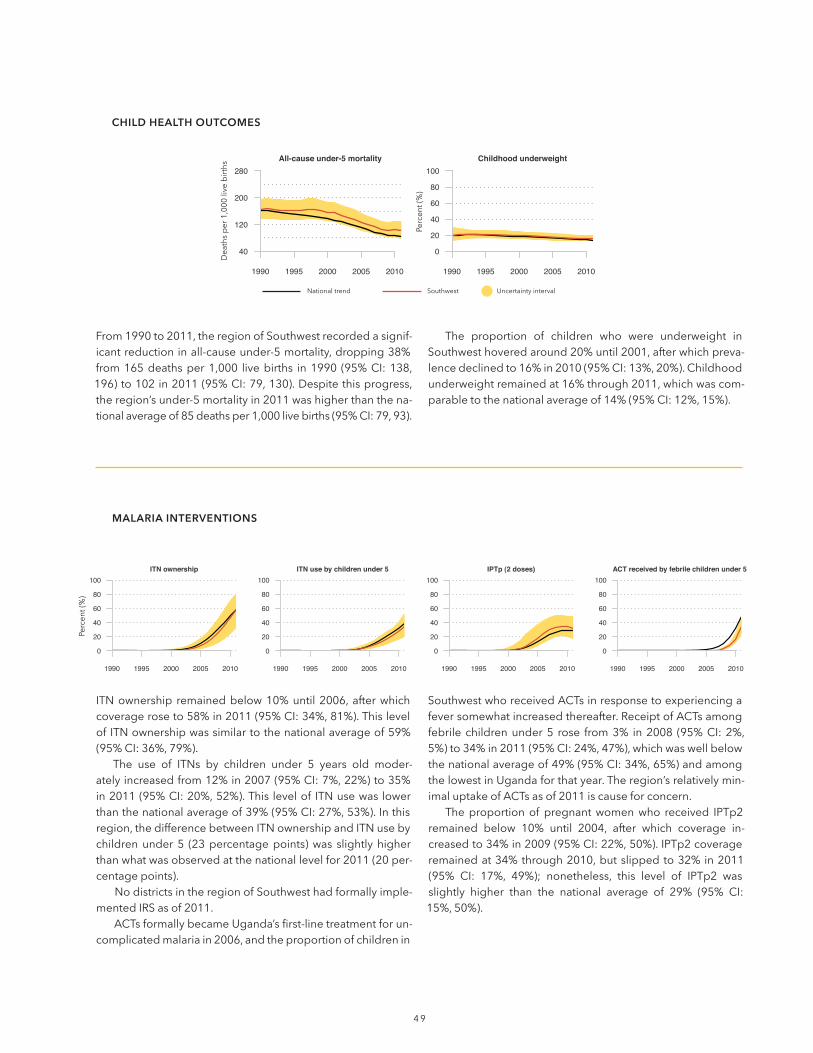
MALARIA INTERVENTIONS
ITN ownership
0
20
40
60
80
100
1990 1995 2000 2005 2010
ITN use by children under 5
0
20
40
60
80
100
1990 1995 2000 2005 2010
IPTp (2 doses)
0
20
40
60
80
100
1990 1995 2000 2005 2010
ACT received by febrile children under 5
0
20
40
60
80
100
1990 1995 2000 2005 2010
All-cause under-5 mortality
40
120
200
280
1990 1995 2000 2005 2010
Childhood underweight
0
20
40
60
80
100
1990 1995 2000 2005 2010
-
-
-
-
CHILD HEALTH OUTCOMES
5 0
-
-
-
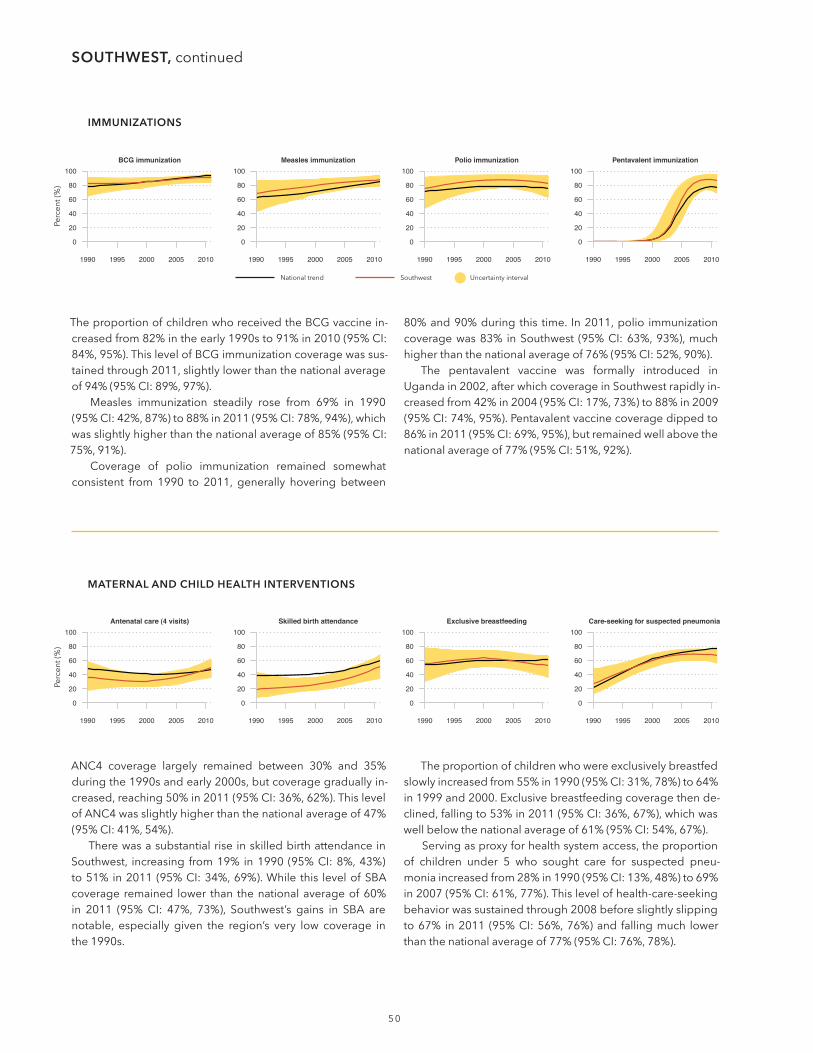
IMMUNIZATIONS
BCG immunization
0
20
40
60
80
100
1990 1995 2000 2005 2010
Measles immunization
0
20
40
60
80
100
1990 1995 2000 2005 2010
Polio immunization
0
20
40
60
80
100
1990 1995 2000 2005 2010
Pentavalent immunization
0
20
40
60
80
100
1990 1995 2000 2005 2010
-
-
-
MATERNAL AND CHILD HEALTH INTERVENTIONS
Antenatal care (4 visits)
0
20
40
60
80
100
1990 1995 2000 2005 2010
Skilled birth attendance
0
20
40
60
80
100
1990 1995 2000 2005 2010
Exclusive breastfeeding
0
20
40
60
80
100
1990 1995 2000 2005 2010
Care-seeking for suspected pneumonia
0
20
40
60
80
100
1990 1995 2000 2005 2010
SOUTHWEST,
5 1
-
-
-
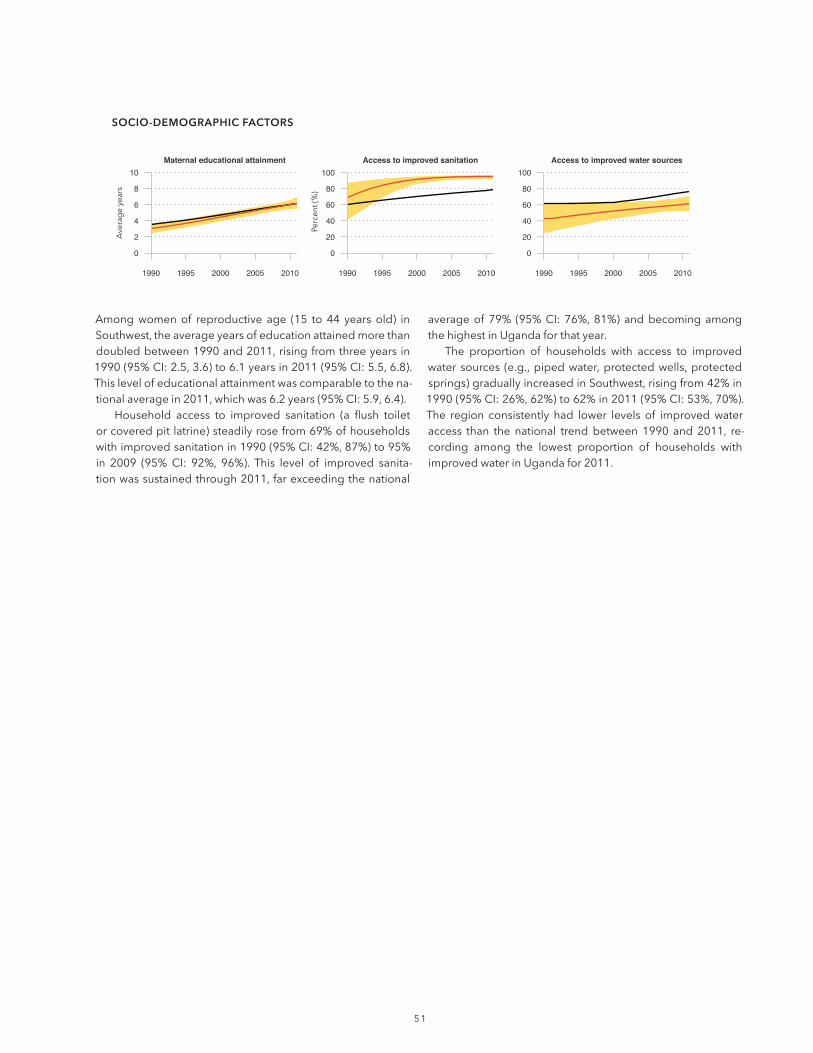
Maternal educational attainment
0
2
4
6
8
10
1990 1995 2000 2005 2010
Access to improved sanitation
0
20
40
60
80
100
1990 1995 2000 2005 2010
Access to improved water sources
0
20
40
60
80
100
1990 1995 2000 2005 2010

5 2
SUMMARY
-
-
-
-
Malaria Immunizations Maternal and child health
INTERVENTIONS
ACT for fever, under-5
IPTp(2 doses)
Exclusivebreastfeeding
Antenatal care(4 visits)
ITNownership
ITN use, under-5
BCG PentavalentMeasles Polio Skilled birthattendance
Care for suspected
pneumonia
0
20
40
60
80
100
Perc
ent (
%) Range observed
across regions
National average
West Nile
Dea
ths
per
1,0
00 li
ve b
irth
s
40
60
80
100
120
140
CHILD HEALTH OUTCOMES
Childhoodunderweight
Under-5mortality
Household characteristics Educational attainment
SOCIO-DEMOGRAPHIC FACTORS
Improved sanitation
Improved water
0
20
40
60
80
100
Perc
ent (
%)
0
20
40
60
80
100
Perc
ent (
%)
Women of reproductive age
0
2
4
6
8
10
Ave
rag
e ye
ars
Range observed across regions
National average
West Nile
Note:
Note:
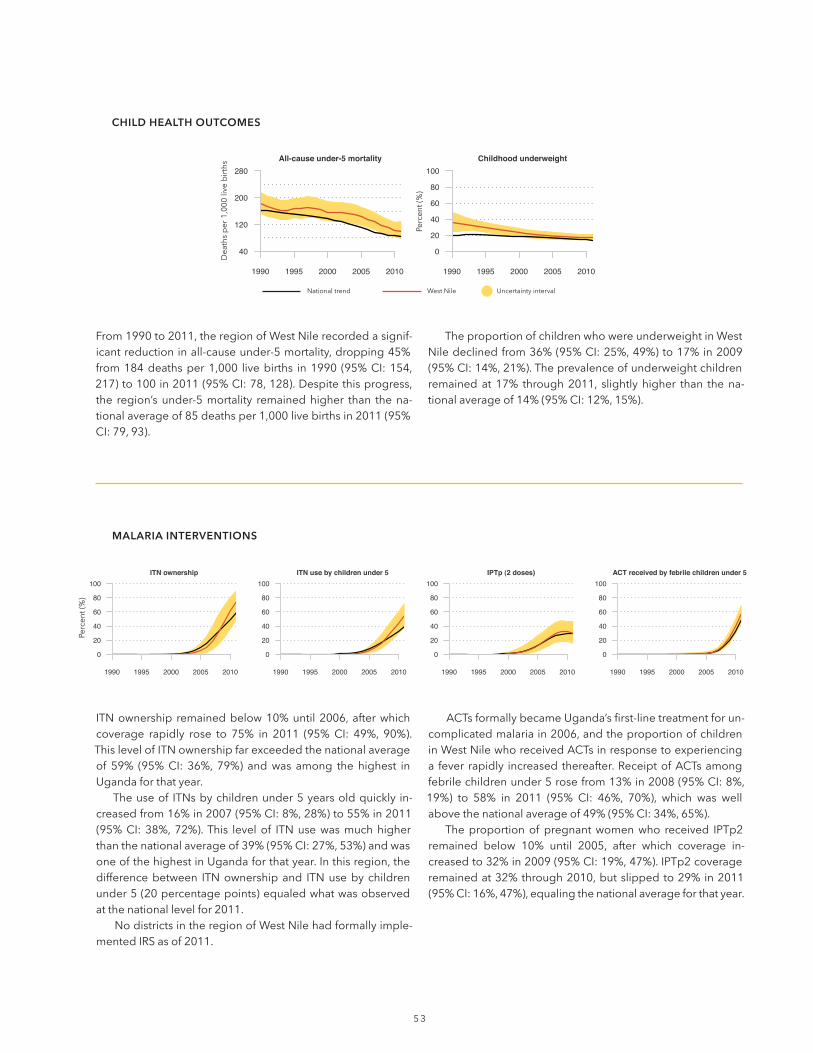
5 3
-
-
-
-
MALARIA INTERVENTIONS
ITN ownership
0
20
40
60
80
100
1990 1995 2000 2005 2010
ITN use by children under 5
0
20
40
60
80
100
1990 1995 2000 2005 2010
IPTp (2 doses)
0
20
40
60
80
100
1990 1995 2000 2005 2010
ACT received by febrile children under 5
0
20
40
60
80
100
1990 1995 2000 2005 2010
All-cause under-5 mortality
40
120
200
280
1990 1995 2000 2005 2010
Childhood underweight
0
20
40
60
80
100
1990 1995 2000 2005 2010
-
--
CHILD HEALTH OUTCOMES
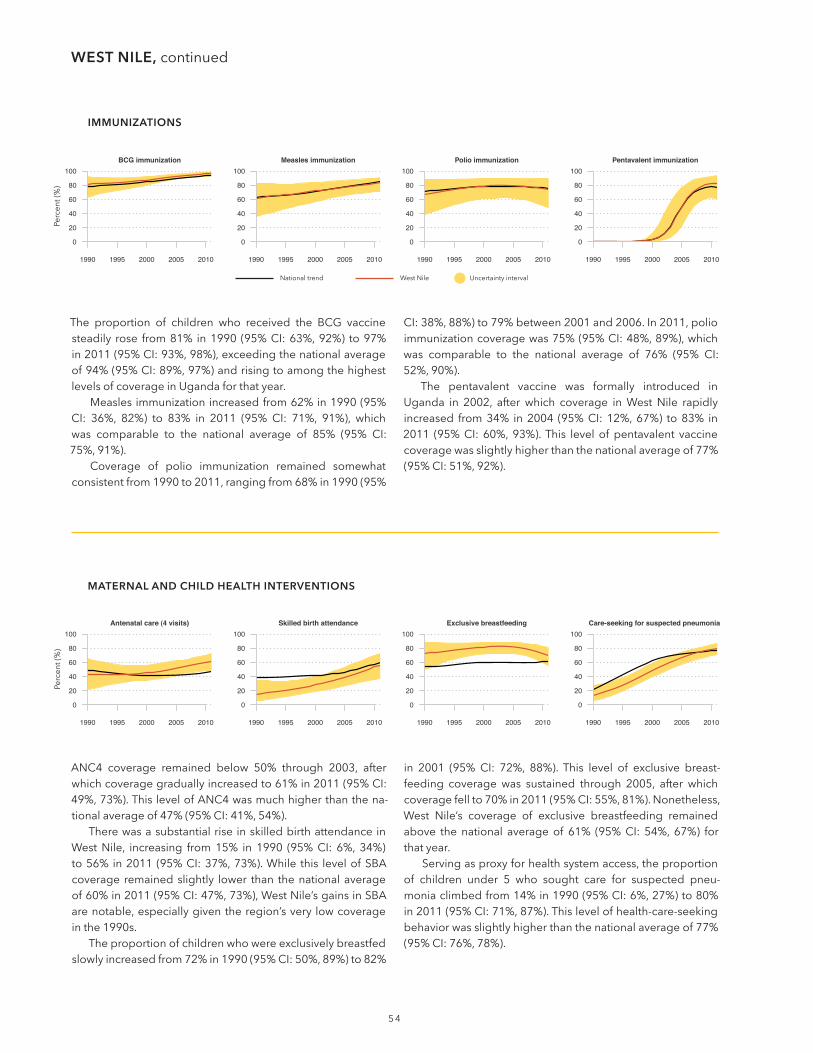
5 4
IMMUNIZATIONS
BCG immunization
0
20
40
60
80
100
1990 1995 2000 2005 2010
Measles immunization
0
20
40
60
80
100
1990 1995 2000 2005 2010
Polio immunization
0
20
40
60
80
100
1990 1995 2000 2005 2010
Pentavalent immunization
0
20
40
60
80
100
1990 1995 2000 2005 2010
-
-
-
MATERNAL AND CHILD HEALTH INTERVENTIONS
Antenatal care (4 visits)
0
20
40
60
80
100
1990 1995 2000 2005 2010
Skilled birth attendance
0
20
40
60
80
100
1990 1995 2000 2005 2010
Exclusive breastfeeding
0
20
40
60
80
100
1990 1995 2000 2005 2010
Care-seeking for suspected pneumonia
0
20
40
60
80
100
1990 1995 2000 2005 2010
WEST NILE,
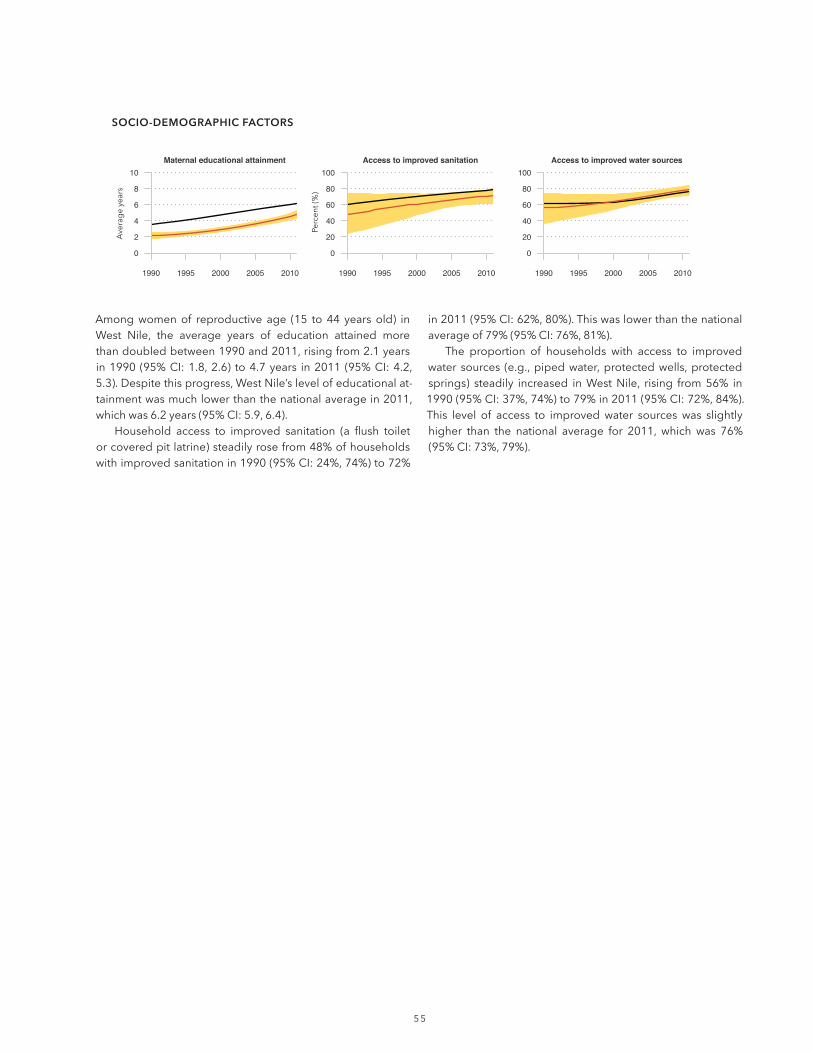
5 5
-
Maternal educational attainment
0
2
4
6
8
10
1990 1995 2000 2005 2010
Access to improved sanitation
0
20
40
60
80
100
1990 1995 2000 2005 2010
Access to improved water sources
0
20
40
60
80
100
1990 1995 2000 2005 2010
5 6
SUMMARY
-
-
-
Malaria Immunizations Maternal and child health
INTERVENTIONS
ACT for fever, under-5
IPTp(2 doses)
Exclusivebreastfeeding
Antenatal care(4 visits)
ITNownership
ITN use, under-5
BCG PentavalentMeasles Polio Skilled birthattendance
Care for suspected
pneumonia
0
20
40
60
80
100
Perc
ent (
%) Range observed
across regions
National average
Western
Dea
ths
per
1,0
00 li
ve b
irth
s
40
60
80
100
120
140
CHILD HEALTH OUTCOMES
Childhoodunderweight
Under-5mortality
Household characteristics Educational attainment
SOCIO-DEMOGRAPHIC FACTORS
Improved sanitation
Improved water
0
20
40
60
80
100
Perc
ent (
%)
0
20
40
60
80
100
Perc
ent (
%)
Women of reproductive age
0
2
4
6
8
10
Ave
rag
e ye
ars
Range observed across regions
National average
Western
Note:
Note:
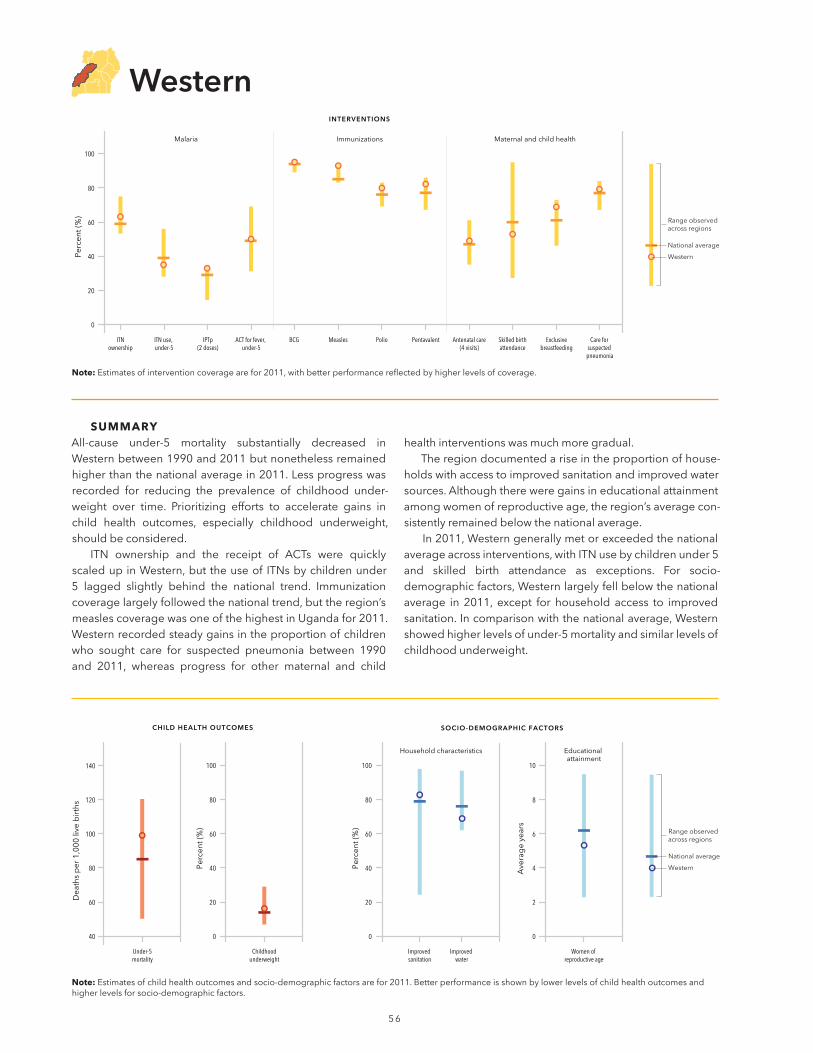
-
-
for 2011.
-
-
MALARIA INTERVENTIONS
ITN ownership
0
20
40
60
80
100
1990 1995 2000 2005 2010
ITN use by children under 5
0
20
40
60
80
100
1990 1995 2000 2005 2010
IPTp (2 doses)
0
20
40
60
80
100
1990 1995 2000 2005 2010
ACT received by febrile children under 5
0
20
40
60
80
100
1990 1995 2000 2005 2010
All-cause under-5 mortality
40
120
200
280
1990 1995 2000 2005 2010
Childhood underweight
0
20
40
60
80
100
1990 1995 2000 2005 2010
-
-
CHILD HEALTH OUTCOMES

5 8
-
IMMUNIZATIONS
BCG immunization
0
20
40
60
80
100
1990 1995 2000 2005 2010
Measles immunization
0
20
40
60
80
100
1990 1995 2000 2005 2010
Polio immunization
0
20
40
60
80
100
1990 1995 2000 2005 2010
Pentavalent immunization
0
20
40
60
80
100
1990 1995 2000 2005 2010
-
MATERNAL AND CHILD HEALTH INTERVENTIONS
Antenatal care (4 visits)
0
20
40
60
80
100
1990 1995 2000 2005 2010
Skilled birth attendance
0
20
40
60
80
100
1990 1995 2000 2005 2010
Exclusive breastfeeding
0
20
40
60
80
100
1990 1995 2000 2005 2010
Care-seeking for suspected pneumonia
0
20
40
60
80
100
1990 1995 2000 2005 2010
WESTERN,
5 9
-
-
Maternal educational attainment
0
2
4
6
8
10
1990 1995 2000 2005 2010
Access to improved sanitation
0
20
40
60
80
100
1990 1995 2000 2005 2010
Access to improved water sources
0
20
40
60
80
100
1990 1995 2000 2005 2010
INSTITUTE FOR HEALTH METRICS AND EVALUATION
2301 Fifth Ave., Suite 600
Seattle, WA 98121
USA
TELEPHONE: +1-206-897-2800
FAX: +1-206-897-2899
EMAIL: [email protected]
www.healthdata.org
Related Documents