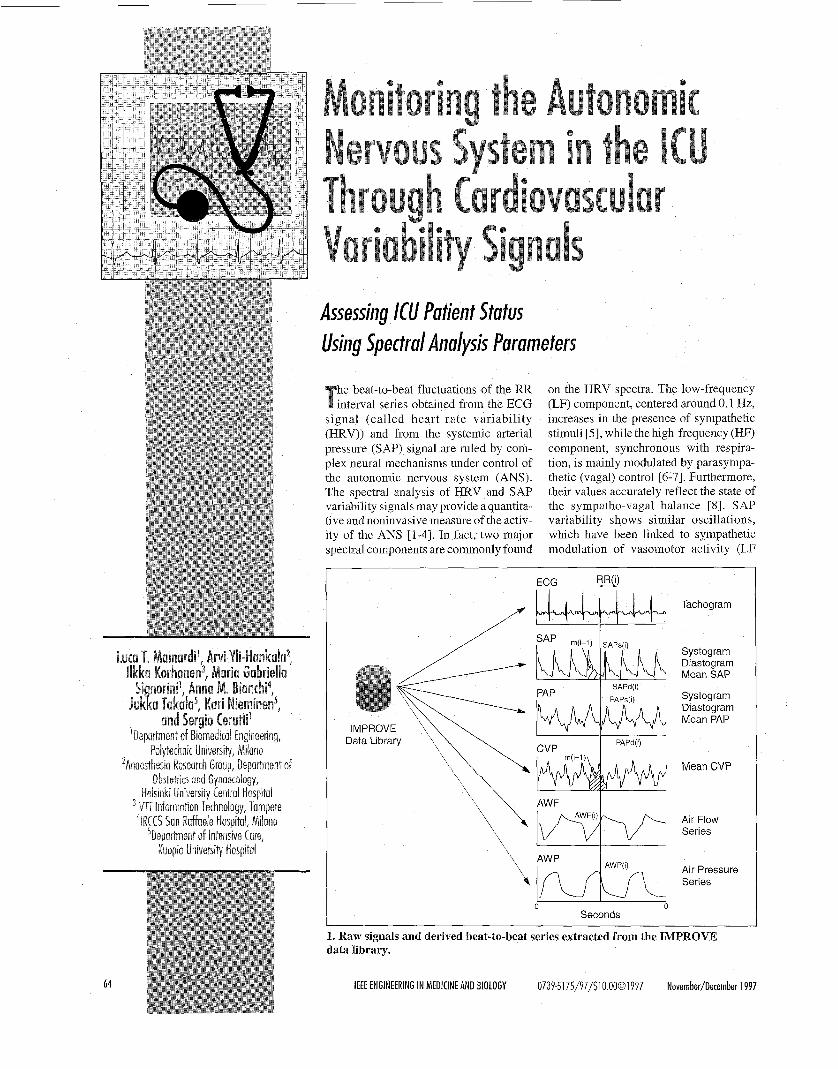
64 Assessing ICU Patient Status Using Spectral Analysis Parameters he beat-to-beat fluctuations of the RR interval series obtained from the ECG signal (called heart-rate variability (HRV)) and from the systemic arterial pressure (SAP) signal are ruled by com- plex neural mechanisms under control of the autonomic nervous system (ANS). The spectral analysis of HRV and SAP variability signals may provide a quantita- tive and noninvasive measure of the activ- ity of the ANS 11-41, In fact, two major spectral components are commonly found on the HRV spectra. The low-frequency (LF) component, centered around 0.1 Hz, increases in the presence of sympathetic stimuli [5], while the high-frequency (HF) component, synchronous with respira- tion, is mainly modulated by parasympa- thetic (vagal) control [6-71. Furthermore, their values accurately reflect the state of the sympatho-vagal balance [8]. SAP variability shows similar oscillations, which have been linked to sympathetic modulation of vasomotor activity (LF Tachogram /w Systogram Diastogram Mean SAP Systogram Diastogram Mean PAP Mean CVP \\ [ * Air Series Flow \ I I Seconds 1. Raw signals and derived beat-to-beat series extracted from the IMPROVE data library. IEEE ENGINEERING IN MEDICINE AND BIOLOGY 0739-51 75/97/$10.0001997 November/December 1997

Welcome message from author
This document is posted to help you gain knowledge. Please leave a comment to let me know what you think about it! Share it to your friends and learn new things together.
Transcript
64
Assessing ICU Patient Status Using Spectral Analysis Parameters
he beat-to-beat fluctuations of the RR interval series obtained from the ECG
signal (called heart-rate variability (HRV)) and from the systemic arterial pressure (SAP) signal are ruled by com- plex neural mechanisms under control of the autonomic nervous system (ANS). The spectral analysis of HRV and SAP variability signals may provide a quantita- tive and noninvasive measure of the activ- ity of the ANS 11-41, In fact, two major spectral components are commonly found
on the HRV spectra. The low-frequency (LF) component, centered around 0.1 Hz, increases in the presence of sympathetic stimuli [5], while the high-frequency (HF) component, synchronous with respira- tion, is mainly modulated by parasympa- thetic (vagal) control [6-71. Furthermore, their values accurately reflect the state of the sympatho-vagal balance [8]. SAP variability shows similar oscillations, which have been linked to sympathetic modulation of vasomotor activity (LF
Tachogram /w Systogram Diastogram Mean SAP
Systogram Diastogram Mean PAP
Mean CVP
\\ [* Air Series Flow
\ I I
Seconds
1. Raw signals and derived beat-to-beat series extracted from the IMPROVE data library.
IEEE ENGINEERING IN MEDICINE AND BIOLOGY 0739-51 75 /97 /$10 .0001997 November/December 1997

400 ' I
200
SAPS (mmHg)
100 I
100
PAPS (mmHg) (c)
0 '
100 1
AWF (I/m) (d)
0 500 1000 1500 2000 -1 00
Beat Number
2. Beat-to-beat variability series obtained during airway suction. Data are from rec- ord #40. (a) RR tachogram, (b) systogram from SAP, (c) systogram from PAP, and (d) respiratory series from AWF.
power in SAP spectrum) [9-111 and to res- piration (HF) mainly through its mechani- cal effects 1121. Similar rhythms are seen also in other signals of cardiovascular ori- gin, such as peripheral flow [ 131 and cen- tral venous pressure (CVP) [14], thus suggesting the widespread influence of autonomic control on circulation.
Although linear models may explain HR and SAP dynamics 1151, some nonlin- ear processes are certainly involved [4, 16, 171. Recent findings on fractal sys- tems have documented processes that are
characterized by self-similarity patterns and that show Fourier spectra that are non- flat and have llf" power distribution; that is, the spectra have inverse proportional- ity to the frequency values with a scaling law defined by a. This 1 If distribution has been verified in many biological and physiological systems. The initial evi- dence of llf behavior was reported for the human HRV signal [18] and then con- firmed by [19] and [20] for arterial blood pressure in dogs. Under normal conditions,
index cy. shows values near 1, confirming the broad-band nature of the spectrum, while 0: increases in the presence of patho- logical cardiovascular events. The power law regression parameter, a -slope, may predict the risk of death in patients after myocardial infarction [21, 221.
In this article, we aim to study the useful- ness of cardiovascular variability parame- ters for monitoring intensive-care unit (ICU) patients. Previous results have asso- ciated significant changes in HRV parame- ters to several cardiological and noncardiological diseases 141. Moreover, patients who had a favorable course after myocardial infarction presented higher val- ues of IHRV, leading to the conclusion that an augmented HRV may be protective against cardiac mortality and sudden car- diac death [4]. In ICU patients, the decrease in the itotal power and the lack of sympa- thetic modulation was associated with in- creased mortality [23]. During sepsis syndrome, the total HRV and the sympa- thetic mediated component were sign& cantly lower with respect to the control phase [24]. In addition, human endotoxe- mia was connected with a loss of physio- logical beat-to-beat variability [25].
In this study, both long-term and short-term spectral parameters [4] are in- vestigated. Long-term variability is as- sessedl through the evaluation of the a-slope on beat-to-beat 24-h spectra, and the results are correlated to the patient out- come. Short-term variability parameters
Table 1. List of patients included into the study. D: deceased; S: survived. I Main Disorders During Study
November/Detember 1997 IEEE ENGINEERING IN MEDICINE AND BIOLOGY 65

are calculated before, during, and after an airway suction (AWS) maneuver, which is a common procedure in intensive care. It is used to clean the patients airway from mu- cous secretions during respirator-controlled ventilation, thus improving gas (oxy- gedcarbon dioxide) exchange at alveolar level. During AWS, severe pain and tra- cheal irritation, which, in turn, induce coughing against the ventilator and increase airway pressure, are supposed to provoke a sympathetic activation. The short-term variability parameters, which are computed in different time epochs around the AWS, may be employed during these events for advanced monitoring of A N S responses to this therapeutic intervention.
Methods Series Extraction
All data were extracted from the IM- PROVE data library (DL) [26-271. The beat-to-beat variability series, obtained from the raw signals of the DL, contained traditional measures such as RR interval tachograms from ECGs, systograms
(SAPS, i.e., the beat-to-beat values of sys- tolic arterial pressure), diastograms (SAPd, i.e., the beat-to-beat values of dia- stolic arterial pressure) series from the systemic ar ter ia l p ressure , and respiration-related series from airway pressure (AWP) and airway flow (AWF) signals. In addition, other beat-to-beat measures were computed from pulmo- nary arterial pressure (systolic (PAPS) and diastolic (PAPd) values) or from the CVP signal (mean values (CVPm)).
QRS detection and RR interval meas- urements were automatically performed by a derivative/threshold algorithm [28]. Because of the low sampling rate (100 Hz), we performed a QRS parabolic inter- polation and we measured the RR interval as the distance between the maximum of two successive interpolating parabolas, thus reducing the influence of low sam- pling rate [29-301. The accuracy in QRS detection, the absence of missed or misde- tected beats, or the presence of artifacts, were visually checked and corrected by the operator using a commercially avail-
able software (Cardioline Remco Italia, AD35 Top). Each beat was automatically classified (normal, ventricular, artifact) and the code was used to improve the suc- cessive analysis.
The position of the R wave was used as a reference point for the extraction of the other beat-to-beat series. In particular, the systogram and the diastogram were ob- tained on both systemic and pulmonary pressures by measuring the systolic and the diastolic values inside the cardiac cy- cle (see Fig. 1). The beat-to-beat CVP se- ries was extracted by computing the mean value inside the cardmc cycle. To reduce noise, CVP, SAP, and PAP signals were low-pass filtered (cut-off frequency 15 Hz) before extracting the beat-to-beat se- ries. Finally, two respiratory-related se- ries were obtained by sampling the airway pressure and the airway flow signals in correspondence with the QRS complex on the ECG. Respiratory signals were previ- ously filtered by a low-pass filter (cut-off frequency 0.5 Hz), in order to reduce arti- fact and noise and to avoid aliasing.
0.05
0.5 T RR 0.00 L.,
-0.05
Mean 1.5
1 .o I I Y-H* 0.0 I . . . . . I* -0.5
LF Power 1.2
0.6
0.0
I -0.6
HF Power RMSSD 1 T 0.6 1
1 1 -0.5 -0 1 , -0.5
0.0
-0 6 -0.7 -0 5 II 1 1 1 IV v I 1 111 IV v II 111 IV v I I 1 1 1 IV v
Epochs Epochs Epochs Epochs
3. Global results obtained from the population studied. For each parameter, the mean difference change from the basal values are plotted in each epoch considered. The 95% CI are superimposed. Values are in dB units (see text for details); * p < 0.05.
IEEE ENGINEERING I N MEDICINE AND BIOLOGY November/Oecember 1997 66

RR Series
R = 0.3451 SLOPE = -1.09
-4 ‘ -6 -5 -4 -3 -2 -1
log (Ha
SAP Series 8
4 - - P I” 2 - 2
E E v U) -
0 - R = 0.2381 SLOPE = -0.8071
-2 -
4 ‘ -6 -5 4 -3 -2 -1
log (Hz)
PAP Series 5 , ’,’ A r
4 -
3 -
2 - I
I
I E 0 - E
0 -1
2 ’ - m
v U) -
R = 0 3665 SLOPE = -0.9853 -2 -
4. Examples of l/f spectrum from (a) RR interval, (b) SAPS and (c) PAPS series. The linear log-log regression is superimposed in the range 104-10-2 Hz. Both slope and regression coefficients are shown.
Spectral Analysis Spectral analysis was performed by
means of a parametric approach based on the autoregressive (AR) model. In this ap- proach, the signal, y(t), is seen as the out- put of an AR model of p order, and its spectrum can be computed as:
where Llk {k=1,2, ...,p} are the model coef- ficients, o2 is the variance of the white-noise process feeding the model, At is the sampling interval (At = 1, for RR ta- chogram series), and zls are the poles of the model. The spectral estimation is ob- tained from the identification of model coefficients. Several techniques do exist that make it possible to identify the model coefficients that give the best fit of the data, y( t) [ 3 11. From the evaluation of the model poles, it is possible to divide the spectrum into bell-shaped curves, in cor- respondence with each spectral peak, and to compute the values of power, Pi, and frequency, f i , of each spectral component from the position and the residual, r,, of each pole:
= 2narctg (Im( zt ) / Re( z,))
The power, PI, becomes 2 Re (ri) 02in the case of complex conjugate pole pairs, and Re(ri) in the case of a real pole [32- 341. In this article, parametric estimation was obtained through the Levinson- Durbiri algorithm, while model order was automatically selected through AIC (Akaike Information Criteria [35]), among those orders that guarantee the whiteness of the prediction error [36].
llf Parameters Systems with periodic or quasi-
periodic behavior have spectra that show a small number of components, while broad-band spectra are generally charac- terized by more complex patterns, which are typical of stochastic noise or determi- nistic chaos. A particular broad-band spec- trum has power values that scale with the frequency, according to the following law:
November/December 1997 IEEE ENGINEERING IN MEDICINE AND BIOLOGY 67
Mean
1 SAPS I
CI RMSSD CI LF power CI HF power CI
"1 I 606.24+90.65
(ms) "1 (ms) "1 (ms2) (ms') (ms')
21.87k90.63 -9.26; 53.0 575.1; 7.37k12.28 3.16; 14.49*17.38 8.51; 20.46 637.38 11.59
I
II
111
IV
V
I I
("Hg) ("&I) ("HCl) ("Hg) ("Hg 2, ("Hg *) ("Hg2) ("HL12)
110.13518.01 103.95, 3.624.95 1.9; 5.3 8.73+16.88 2.93; 14.53 11.08520.28 4.11; 18.04
112.15*19.77 105.36; 5.26i7.79 2 58; 9.59k19 2 3.0; 16.19 13.36222.9 5.5, 21.23
1 16.32
1 18.94 7.94
133.56k30.01 123.25; 11.6+8.89 8 55; 108.0351 15.24 68.45; 147.62 58.16+72.03 33 42, 82.90
125.63~25 9 116.74, 6.23210 05 2.78; 13.68k26.1 4.71; 22.64 18.89*36.85 6.22; 31 5 4
118.21220.32 11 1.23; 5.67k8.47 2.76; 8.59k11.38 4.68; 13.0 14.67227.84 5.10; 24.23
143.87 14 65
134.53 9.69
125.19 8.58
V ! 28.73217.82 21.96; 4.3252.1 8 3.48; 1.9658.24 -1.17; 5.09 4.05+4.54 1 135.51 15.15 !
I
I I
111
iV
27.37517.11 20.86; 3.191t1.56 2.59, 0 1920.25 0.09; 0.28 33.88 3.78
32.03526.65 21.9; 5.76~7.39 2.95; 283 1921494.6 -285.35; 851.73 42.17 8.57
37.46k20.94 29.49; 12.35c7.59 9.47; 105.985124.13 58.76; 153.19
31.02+18.36 24.03; 5.222.96 4.07; 0.7521.35 0.23; 1.26
45.42 15.24
38.0 6.33
68
3.2953.05
28.375120.49
52.82266.08
5.628.01
IEEE ENGINEERING IN MEDICINE AND BIOLOGY
2 13; 4.45
-17.46; 74.2
27.68; 77.95
2.55; 8.65
November/December 1997
L I I 1.61

P ( f ) = f " For each patient, a single power spec-
Mean RR
t" was calculated on the whole data rec- ord by using the fast Fourier algorithm. After plotting the spectrum on a log-log scale, the log (power) was re-
tween 10 and 10 Hz. The a parameter
where a is a constant. In the range l<a<3, the curve has noninteger (fractal) dimen- sion. A power-law spectrum of this kind
and is typical of a fractal process [37]. does not possess a privileged time gressed on log (frequency) in the range be-
Variance LF power HF power
(a) RR l/f Slope a 2
T
Basal conditions
12 days later 11.13-12.13 12 days later 12.13-13.13 12 days later 13.13-14.13 112 days later 14.13-15.13 ,12 days later 15.13-16.13 12 days later 16.13-17.13 ,12 days later 17.45-1 8.1 5
Dead Survived
(b) SAP l/f Slope a 1,6
T T
686.3 0r24.9 19.88516.39 4.15k3.68 4.12k3.34
806.88k22.03 44.8851 9.9 4.12k5.60 4.4422.83 855.4021 6.36 65.61k21.54 0.8051.3 8.41e8.24 781.69k14.26 35.91220.17 1.5921.41 3.2623.51
784.0021 7.00 29.07~26.03 0.30+0.20 2.07k2.01 838.84k8.38 10.0029.40 0.29k0.29 1.76r0.59 838.0120.75 4.87r1.24 - 1.62r0.51 855.33rtl.76 6.9224.60 - 2.31k 2.00
~~
Dead Survived
(c) PAP l/f Slope a 1,6 I
T
" Dead Survived
5. Mean and standard deviation values of the a-slope parameters as obtained for the study population on (a) RR, (b) SAP, and (c) PAP spectra.
was obtained as the slope of the regression line on ithe power spectrum for time-series length exceeding 90,000 points.
No filtering procedures were per- formed, maintaining the original integrity of the data. Possible presence of high-fre- quency artifacts, such as those induced by ectopic beats, only slightly affect the re- sults, a!$ the analysis is mainly concerned with the very LF (VLF) and ultra LF (ULF) (components (up to HZ).
Despite of the apparent simplicity of the method, which does not require any a priori hypothesis, this approach has dem- onstratled a powerful capability in the global evaluation of time-series proper- ties [21-221. Different and more compli- cated methods exist for estimating the long-range dependence and self- similarity of time series [38]. Some of these aire particularly useful to confirm the long memory characteristics in biological processes, as the behavior of VLF and ULF component in cardiovascular vari- ability series seems to suggest.
Patient and Event Selection Data for the IMPROVE DL were col-
lected from a heterogeneous ICU patient population. The various diagnoses and medications may differently influence the beat-to-beat HRV parameters. We there- fore decided to focus the short-term analysis on a common repetitive stimulus such as the AWS. In order to reduce the ef- fect of confounding variables, the DL an- notations were screened by clinical experts. At least the 30 minutes preceding the selected AWS had to be free from nursing activities and changes in the rate of vasoactive drug infusion. We selected 15 patients out of the 59 recordings of the DL. Patients had various courses of illness and both positive and negative outcomes. The demographic data are shown in Table 1. The selected population had no arrhyth- mias, in0 rhythmic dysfunctions that might
1 Table 3. Mean spectral parameters from records #56, #59a, and #59b of the DL. 1
November/December 1997 IEEE ENGINEERING IN MEDICINE AND BIOLOGY 69

alter the variability analysis, and good quality of their ECG and pressure signals during and after AWS.
For analysis of the suction periods, dif- ferent time epochs were defined. They in- cluded five periods centered around each episode: Period I or basal period (roughly 20 minutes before the beginning of the suction), period I1 (in the five minutes pre- ceding the suction), period I11 (during AWS), and finally periods IV and V (5 and 10 minutes after the end of AWS, re- spectively). In these periods, the simulta- neous presence of pseudo-stationary segments on all the beat-to-beat series were manually annotated by an operator through interactive software and then used for the successive analysis. Because the number of suction periods varied among the patients, we considered only one suction period for each patient for sta- tistical analysis.
(a)
Statistical Analysis Spectral parameters show a great
interindividual spread of values. Therefore,
100
PSD (m m H g2/Hz)
a normalization procedure is required to make the data comparable. The procedure used in this article is a decibel (dB) trans- formation of the data, with individualized baselines. This transformation has two ad- vantages: 1) it makes the indexes directly comparable and 2) the logarithmic trans- formation, inherent in decibel measure, reduces skewness of the variables. Data were transformed according to the follow- ing expression (baseline values were dif- ferent for different patients):
dB change from baseline = log(current valuehaseline))
Mean values of dB-transformed data and the 95% confidence interval (CI) of the mean were computed for every vari- ability parameter in each epoch consid- ered. It is worth noting that with a number of cases (n > lo), the absence of overlap between two confidence limits indicates that the two sample means dif- fer at the specified level of confidence [39]. Regression analysis and paired t-test were used as necessary. Staiistical
PSD (m m H g2/Hz)
significance was accepted whenp < 0.05.
Results The section is divided in three parts;
the first two are dedicated to presentation of the results obtained from short-term and long-term analysis while the third
PSD (A.U )
200
PSD (msec2/Hz
RR SAPS
(b) 5000
AWS
200
PSD (msec2/Hz)
0.6
0 0.0 0.6 0 0 0 6 0 0 0.6
Frequency (Hz) Frequency (Hz) Frequency (Hz)
6. Power Spectrum Density (PSD) for RR tachogram (a,d,g), systogram (b,e,h) and AWF (c,f,i) in different epochs for the same patient. Data were divided into separate files in the DL (#56, #59a, #59b).
70 IEEE ENGINEERING I N MEDICINE AND BIOLOGY NovembedDecember 1997
presents results obtained from particular DL records. The selection of the de- scriptive cases was done to demonstrate both the potential usefulness and the possible problems connected with the extraction of spectral parameters from ICU patients.
Short-Term Parameters As an example, Fig. 2 shows the vari-
ability series during and after airway suctioning, beginning at sample #200. AWS produced changes in the variabil- ity series, affecting both the mean values and the oscillatory pattern of the series. In particular, mean RR interval was re-
duced, while mean SAP and PAP values increased. All these parameters showed a slow course of recovery toward the presuction values, which lasts up to over 1500 samples after the AWS (roughly 12 minutes in this case). RR and SAPs values showed the slower recovery trend. Several artifacts, on each beat- to-beat measure during the suction, are clearly visible in the figure, suggesting not to consider data during these epochs.
The main variability results are shown in Table 2 and Fig. 3. Suction caused changes in both RR interval and pressure values. RR interval decreased significantly (mean f std:606.24 +.
2nd Day at ICU
7 (a)
I , . I
I . I Dayof Exodus : ; (12 Days Later)
. . 400 '
: : 'I T
. I I I I .
I I . 1 '
0.2 -j . , I 1 . I .
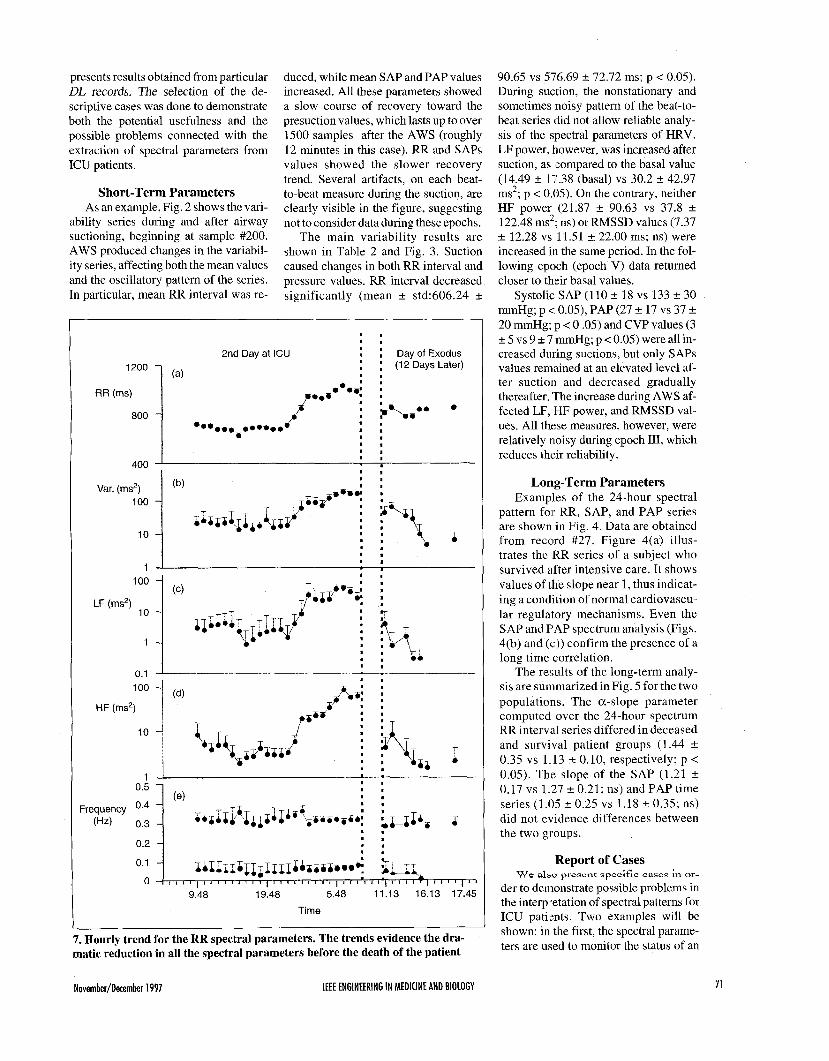
7. Hourly trend for the RR spectral parameters. The trends evidence the dra- matic reduction in all the spectral parameters before the death of the patient
90.65 vs 576.69 +. 72.72 ms; p < 0.05). During suction, the nonstationary and sometimes noisy pattern of the beat-to- beat series did not allow reliable analy- sis of the slpectral parameters of HRV. LF power, however, was increased after suction, as (compared to the basal value (14.49 +. 17.38 (basal) vs 30.2 +. 42.97 ms2; p < 0.05). On the contrary, neither HF power (21.87 f 90.63 vs 37.8 f 122.48 ms2; ns) or RMSSD values (7.37 +. 12.28 vs 11.51 f 22.00 ms; ns) were increased in the same period. In the fol- lowing epoch (epoch V) data returned closer to their basal values.
Systolic SAP (110 f 18 vs 133 +. 30 mmHg; p < 0.05), PAP (27 f 17 vs 37 f 20 mmHg; p < 0 .OS) and CVP values (3 +. 5 vs 9 2 7 mmHg; p < 0.05) were all in- creased during suctions, but only SAPs values remained at an elevated level af- ter suction and decreased gradually thereafter. The increase during AWS af- fected LF, HF power, and RMSSD val- UGS. All these measures, however, were relatively noisy during epoch 111, which reduces their reliability.
Long-Term Parameters Examples of the 24-hour spectral
pattern for RR, SAP, and PAP series are shown in Fig. 4. Data are obtained from record #27. Figure 4(a) illus- trates the RR series of a subject who survived after intensive care. It shows values of the slope near 1, thus indicat- ing a condition of normal cardiovascu- lar regulatory mechanisms. Even the SAP and PAP spectrum analysis (Figs. 4(b) and (c)) confirm the presence of a long time correlation.
The r e d t s of the long-term analy- sis are summarized in Fig. 5 for the two populations. The a-slope parameter computed over the 24-hour spectrum RR interval series differed in deceased and survival patient groups (1.44 f 0.35 vs 1.13 f 0.10, respectively; p < 0.05). The slope of the SAP (1.21 f 0.17 vs 1.27 f 0.21; ns) and PAP time series (1.05 5 0.25 vs 1.18 f 0.35; ns) did not evidence differences between the two groups.
Report of Cases
der to demonstrate possible problems in the interpiretation of spectral patterns for ICU pati(-nts. Two examples will be shown: in the first, the spectral parame- ters are uised to monitor the status of an
W e a1z.o prescnt specific cases in or-
November/Detember 1997 IEEE ENGINEERING IN MEDICINE AND BIOLOGY 71

ICU patient, while in the second case, the influence of the external ventilator on RR interval is considered. In Fig. 6, the spec- trum of RR, SAPs, and AWF series have been computed for the same patient in dif- ferent epochs. Data come from various records of the DL (records #56, #59a, #59b). The first file was recorded 2 days after the patient entered the ICU; while the two successive files were registered 12 days later, within 6 hours and within 0.5 hour before the death of the patient, re- spectively The spectral pattern changes considerably from the first recording (Fig
A U
0
6(a-c)) to the final (Fig. 6(g-i)). Global variance decreases in going from the up- per spectra to the lower ones, affecting both LF and HF rhythms in the RR and SAPS series. In particular, the LF rhythm disappears in both RR and SAPs spectra in Fig. 6(d,e), while the residual HF modulation is induced by the external ventilator. No variability is found in the lower spectra except for the mechanical influence of the ventilator on SAPs.
The heavy reduction in spontaneous variability is clearly evidenced in the hourly trend of spectral parameters shown
0
750 I 1
600 ' I 0 500 1000 1500 2000 2500 3000
Beats (a) X I O '
3
0 0 (Hz) 0 5
(b) (4 8. Tachogram obtained from record #3 of the DL. The spectral characteristics of the RR series (a) suddenly change, as shown by the different spectral patterns in (b, c). The two PSDs are obtained from the left part (b) and from the right part (c) of the tachogram, respectively.
- AWF - RR
- AWF 40 I - RR
-40 ' -40 ' 0 143 0 143
Time (s) Time (s)
(a) (b)
9. Superimposition of RR interval tachogram (red line) and ventilation beat-to-beat series (black line). In (a), the mechanical ventilator modulating the RR variability induces cycling variation corresponding with each ventilatory act. In (b), the exter- nal ventilation is able to trigger a nonlinear interaction, and the RR variations are induced with a rate 1:4 respiratory acts. It may be interesting to note that a one-to- one response is still present in (b).
72 IEEE ENGINEERING IN MEDICINE AND BIOLOGY
rs
0
in Fig. 7. Both LF and HF powers and variance show a decreasing trend in the hours preceding the death. In particular, the fall in LF rhythms seems to precede the decreasing in both total variance and HF power values. No LF rhythms are found in the 2 hours preceding the death of the patient. In Table 3, the mean hourly values in the last 6 hours of the recording are compared with the basal period. The basal period includes the first 10 hours of record #56 (see also Fig. 7 for reference). The table shows that LF power is signifi- cantly reduced just 5 hours before the death of the patient, while both HF and to- tal variance parameters, in the same pe- riod, maintain values similar or higher than in basal conditions. A significant de- crease in total variance is found two hours later, when no more LF components are detectable in the spectra.
The second example shows possible effects of mechanical ventilation on HRV. The ventilator exerts sinusoid positive pressure on the cardiovascular system, which may interfere with physiological mechanisms of control. Frequently, such an interaction could be interpreted as lin- ear, as in the case of respiratory sinus ar- rhythmia quantified through spectral techniques. However, sometimes nonlin- ear interactions can be seen such as during entrainment [40] or coupling cycle. In or- der to display nonlinear interactions be- tween mechanical ventilation and HRV, Fig. 8 shows the tachogram obtained from patient #3 of the DL. Two epochs can be clearly recognized. In the two epochs, both the signal variance and the harmonic contents of the signals are different (Fig.
November/December 1997

8(a)). In particular, while a HF rhythm predominantly influences the spectrum of the first part of the tachogram (Fig. 8(b)), the spectrum of second part shows a stable rhythm that falls into the LF range (Fig. 8(c)). Such a rhythm could be erroneously attributed to the common source of LF fre- quency oscillations, if one simply looks at the PSD of the tachogram. However, this is a rhythm that is triggered by respiration, as shown in Fig. 9(a, b). This figure was obtained by superimposing the beat-to- beat series of RR and respiration. Fig. 9(a) refers to the first part of the tachogram of Fig. S(a), while Fig. 9(b) is obtained in correspondence with the second part of the same RR series. In the latter case, res- piration induces variations in RR intervals that are synchronized every four inspira- tions, with the typical period-doubling pattern that characterizes nonlinear inter- actions [41].
Discussion and Conclusions Only limited data are currently avail-
able on cardiovascular variability beat- to-beat series in ICU patients. We there- fore analyzed both short-term and long- term variability parameters in ICU pa- tients extracted from the IMPROVE DL. Short-term parameters, obtained from HRV, showed decreased RR interval val- ues and an increased LF power in the five minutes following the AWS maneuver. Neither HF power nor RMSSD values in- creased, suggesting an increased sympa- thetic activity induced by AWS. Such an activation may be expected on a clinical basis. In fact, the manipulation of larynx and upper trachea with laryngoscopopy and endotracheal intubation causes a sym- pathoadrenal response with increase in ar- terial pressures and heart rate [42-43]. Similar responses are seen in ICU patients during and after AWS. Short-term pa- rameters, obtained from SAP, did not show relevant variations, except an in- crease in SAP mean value and in RMSSD immediately after the suction. Similar re- sults were found for both PAP (just a slight increase in LF power after the suc- tion) and CVP index. Although the ANS control indexes did not change consis- tently, the increase is certainly relevant from a clinical point of view.
Long-term parameters significantly differ between patients who survived and those who did not. The former showed a-slope values close to 1 (almost normal values), while the latter had significantly
higher values. As pointed out in the meth- ods section, spectra following the scaling law can be identified only when the a-slope value exceeds 1 : the patients ana- lyzed have RR signals with strong power-law relations. In the class of pa- tients who survived, a assumes values higher in respect to physiologically nor- mal subjects and more similar to the val- ues that can be found in the analysis of HRV signal in hypertensive patients [44]. The increase of a-values in patients who died confirmed the prognostic value of the index for the evaluation of death risk. On the contrary, slope of PAP and SAP spec- tra did not differ between the two groups.
Results obtained for pressure variabil- ity in ICU patients seem to indicate a greater stability of these signals. Short- term and long-term indexes maintain or show only small changes with respect to normal patterns, even in nonphysiological conditions. These results indirectly con- firm the RR series as a most sensitive in- dex of altered physiological status.
The changes in short-term variability parameters during and after AWS, and previous results on HRV parameters, in ICU patients [23-251 suggest that cardio- vascular variability analysis may be help- ful in monitoring the ANS balance during ICU treatments and disorders. Our meas- ures followed the end course of the pa- tients who died. Results show a drastic reduction of all the variability parameters, which started 5 or 6 hours before the pati- ent’s death. In particular, disappearance of the LF components in both RR and SAP spectra is in agreement with previous re-
sults [23], which indicated in the de- pressed LF rhythm a predictor of mortadity in ICU patients.
Even if variability parameters may in the future have clinical relevance for the routine monitoring of ICU patients, their interpretation presents several problems. Variclus factors (such as different disor- ders, diagnoses, and medications) might influence the RR and SAP variability. Thus. the correct attribution of spectral changes to the proper causes may be very complex. In addition, short-term variabil- ity parameters during arrhythmias, atrial fibril lation, or when cardiac contractions are ruled by a pacemaker may provide dif- ferent information that must be properly interpreted. Finally, the use of mechanical ventilation for most ICU patients may heavily influence physiological variabil- ity, making it sometimes difficult to at- tribute changes in the spectral rhythms to sympathetic or parasympathetic activity. In thje example presented, the ventilator triggered a huge rhythm in the RR inter- val. Such a rhythm was found to fall in the LF range as a result of nonlinear period- doubling mechanisms. This interaction may also have clinical relevance with ANS control. Despite these problems, long- term parameters were predictive of patient death even in the presence of dif- ferent disorders and moderate arrhyth- mias during the recordings.
In conclusion, both short-term and long-term spectral parameters were em- ployed for the assessment of patient status in the ICU. Short-term parameters were sensitive to the AWS and may also be em- ployed to monitor the response to differ- ent therapeutic interventions. Long-term parameters showed significantly in- creased a-slope values in nonsurviving patients. This result suggests that the a-slope value on 24-h RR spectra may be a relevant prognostic index.
Luca T. Mairzardi re- ceived the Laurea de- gree in Electronic Engineering from the Polytechnic University, Milan, Italy, in 1990. After 1991, he spent two years as a Research Fellow, with a grant
supported by Remco Italia-Cardioline, at the Department of Biomedical Engineer- ing of Polytechnic University in Milan. Since 1993, he has been a Ph.D. student at the same department. His research activ-
November/Detember 1997 IEEE ENGINEERING I N MEDICINE AND BIDLOGY 73

ity is in the field of biomedical signal processing with particular emphasis to control mechanisms of cardiovascular functions, heart rate and blood pressure variability, developing algorithms for time-frequency analysis, and synthesis of nonstationary signals.
Arvi Y 1 i-Hanlial a , M.D., Ph.D., was born in 1956 in Kuru, Fin- land. He graduated in Medicine in 1983 and specialized in Anesthe- siology in 1989 at the University of Tampere. He published his Ph.D.
thesis in 1991 and is now working as a staff anesthesiologist at Women’s Hospi- tal of the University of Helsinki.
Ilkka Korhonen was bom in 1968 in Hanka- salmi, Finland. He re- ceived his MSc. degree in digital signal proc- essing from Tampere University of Technol- ogy in 199 1. Since then, he has been working at
the Medical Engineering Laboratory of the Technical Research Center of Finland, Finnish Institute of Occupational Health, and currently at VTT Information Tech- nology. His main research interest is to apply biosignal interpretation methods in physiological research, critical care pa- tient monitoring, and home health care. He is currently finishing his Ph.D. thesis in the multivariate modeling of cardiovas- cular dynamics.
Maria G. Szgnorzni is a Post-Doctoral Fellow at the Department of Bio- medical Engineering of the Polytechnic Univer- sity, Milano, Italy. Her main research field is concerned the nonlinear an and
modeling of the cardiovascular signals and systems. After receiving the Italian degree (Laurea), she has been working at the same University in the heart rate regu- lation and control analysis of newborns and fetuses. From 1991 to 1995 she at- tended the Ph.D. course in Biomedical Engineering, receiving the Ph.D. degree in 1995 defending a thesis on “Study of chaotic deterministic models with appli- cations to the cardiovascular system.” She is the author of several papers on cardio-
vascular time series analysis with both linear and nonlinear approaches.
Anna M . Bianchi (M’93) received the Laurea degree in Elec- tronic Engineering from the Politechnic Univer- sity of Milano, Italy, in 1987. Since 1987 she has been a Research Fellow in the Lab of
Biomedical Engineering, IRCCS S. Raf- faele Hospital, and since 1990 she has been Research Assistant in the same labo- ratory. Since 1996 she has been an assis- tant professor of Applied Electronics at the BS Biomedical Engineering School of the Polytechnic University of Milano. Her research interests are mainly related to biomedical signal processing and bio- medical system modeling with particular applications to the cardiovascular and neurosensorial systems. She is studying and developing methods and algorithms for t ime-frequency analysis of nonstationary signals, including time-fre- quency distributions, wavelets, and recur- sive parametric identification. She is the author of various papers and book chap- ters on these topics published in interna- tional literature.
Karl Nieminen was born in 1964 in Espoo, Finland. He has been working as a re- search scientist since 1995 and an in- training clinician since 1996 in the De- partment of Anaestesiology and Intensive Care in Kuopio University Hospital.
Sergio Cerutti (M’81) received the Laurea de- gree in Electronic Engi- neer ing from the Polytechnic University, Milan, Italy, in 1971. From 1982 to 1990 he has been Associate Pro- fessor of Biomedical
Engineering at the Department of Bio- medical Engineering of the same Poly- technic, where currently (since 1994) he is Professor on Biomedical Signal and Data Processing. From 1990 to 1994 he was also Professor of Biomedical Engineering at the Department of Computer and Sys- tem Sciences of the University of Rome “La Sapienza.” His research activity is mainly dedicated to various aspects of biomedical signal processing and model- ling related to the cardiovascular system and in the field of neurosciences. He is the author of various papers and books on
these topics published in international sci- entific literature. He spent over a year as a Visiting Professor at the MIT and Harvard School of Public Health, Boston, MA. He has been member of AdCom of IEEE- EMBS (1992-1996) as Representative of Region 8. He is Chairman of the Biomedi- cal Engineering Group of Italian AEI (As- sociation of Electrical Engineering) and is a member of IEEE-AEI, IFMBE-AIIMB, ESEM, IEC-CEI, and other international and national scientific associations.
Address for Correspondence: Dr. Luca T. Mainardi, Department of Biomedical Engineering, Polytechnic University, Pi- azza Leonard0 da Vinci 32, 20133 Mi- lano, Italy. Tel: 39-2-23993342. Fax: 39-2-23993360. E-mail: mainardi @cdc8g5.cdc.polimi.it
References 1 Malliani A, Pagani M, Lombardi F, Cerutti S: Cardiovascular neural regulation explored in the frequency domain, Circulation Research ad- vanced series, vol 84, pp 482-492, 1991 2 Kamath MV, Fallen EL: Power spectral analysis of HRV a non invasive signature of car- diac autonomic functions, Critical Rev in Biom Eng , 1993, vol 21, no 3, pp 245-311 3 Malik M, Camm AJ (eds.): Heart Rate Val i -
ability, Futura Publishing Company, Inc , 1995 4. Task Force of the European Society of cardiol- ogy and the North American Society of pacing and electrophysiology, Heart rate variability standards of measurement, physiological inter- pretation and clinical use, Special report, Circulu- tion, vol 93, n 5, 1996 5 Pagani M, Lombardi F, Guzzetti S, Rimoldi 0, Furlan R, et al.: Blood pressure Variability as a possible marker of sympatho-vagal interaction in man and conscious dog, Circ R e s , vol59,
6 Hirsch JA, Bishop B: Respiratory sinus ar- rhythmia in humans: how breathing pattern modulates heart rate, Am J Physiol , vol. 241, pp. 11 620- 11629, I98 1 7 Pomeranz B, Macaulay RJB, Caudill MA, Kutz I, Adam 1): Assessment of autonomic func- tion in humans by heart rate spectral analysis, Am J Physiol, vol 248, pp H151-Hl53, 1985 8 Mantano N, Gnecchi Ruscone T,. Porta A, Lombardi, et al.: Power spectrum analysis of heart rate variability to assess the changes in sym- pathovagal balance during graded orthostatic tilt, Circulation, vol 90, n 4, pp 1826-1831, 1994 9. Rimoldi 0, Pierini S, Ferrari A, Cerutti S, Pagani M, and Malliani A: Analysis of short term oscillations of R R and arterial pressure in conscious dogs, Am J Physiol, vol. 258, pp H967-H976,1990 10 Askelrod S, Gordon D, Madwed JB, Sni- dam NC, Shannon DC, and Cohen RJ: Hemo- dynamic regulation investigation by spectral analysis, Am J Physiol , vol 249, pp H867- H875, 1985
pp 178-193, 1986.
74 IEEE ENGINEERING IN MEDICINE AND BIOLOGY November/Detember 1997

11. Furlan R, Guzzetti S, Crivellaro W, et al: Continuous 24h-hour assessment of the neural regulation of systemic arterial pressure and RR variabilities in ambulant subjects, Circulation,
12. Kitney RI, Fulton T, McDonald PH, Link- ens DA: Transient interactions between blood pressure, respiration and heart rate in man, J. Bio- med. Engin., vol. 7, pp. 217-224, 1985. 13. Porta A, Baselli G, Mainardi LT, Lucini D, Pagani M, et al.: Beat-to-beat variability of microvascular peripheral resistences assessed with a non-invasive approach, IEEE Computers in Cardiology, pp. 201-205, 1995 14. Barbieri R, Triedman JK, DiVirgilio V, Ce- rutti S, Saul J P Arterial Pressure Control Duting Non-hypoEIypertensive Changes in Central ve- nus volume: Assesment with multivariate autore- gressive model ing, IEEE Computers in Cardiology, pp. 85-89, 1996 15. Baselli G, Porta A, Ferrari G: Models for the analysis of cardiovascular variability signals, in Heart Rate Variability, Malik M., Camm AJ (eds.), Armonk, NT. Futura Publishing com- pany, 1995. 16. Korhonen I, Turjanmaa V: Second-order non-linearity of heart rate and blood pressure short-term variability. IEEE Computers in Cardi- ology, pp. 293-296, 1995. 17. Signorini MG, Saliani V, Lucini I), Pagani M, Cerutti S: Parameters form deterministic chaos in the processing of respiration signals dur- ing mental stress, J. of Ambulatory Monitoring,
18. Kobayashy M, Musha T: l/f fluctuations of heartheat period, IEEE Transaction BME-29, pp. 456-464, 1982. 19. Saul JP, Albrecht P, Berger RD, Cohen RJ: Analysis of long term heart rate Variability: meth- ods, l/f scaling and implications, Proc. IEEE Computers in Cardiology. Con$ (IEEE Computer Society Press, Washington), 1988. 20. Marsh DJ, Osborn, JL, Cowley AW: l/f fluctuations in arterial pressure and regulation of renal blood flow in dogs, Am.J.Physiol.,2.58 (Re- nal Fluid Electrolyte Physiol.,27), F1394-FI400, 1990. 21, Lombardi F, Sandrone G, Mortara A, Tor- zillo D, La Rovere MT, et al.: Linear and nonlin- ear dynamics of heart rate variability after acute myocardial infarction with normal and reduced
vol. 81, pp. 537-547, 1990.
vol. 5, pp. 139-152, 1992.
left ventricular ejection fraction. Am. J . Cardiol.
22. Bigger TJ Jr, Steinman RC, Rolnitzky LM, Fleiss JL, Albrecht P, Cohen RJ: Power law be- havior of RR interval variability in healthy middle-aged persons, patients with recent acute myocardial infarction, and patients with heart transplant, Circulation, vol. 93, 12, pp. 2142- 2151, 1996. 23. Winchell RJ, Hoyt DB: Spectral analysis of heart rate variability in the ICU: a measure of autonomic functions, J. of Surg. Res., vol 63(1),
24. Garrard CS, Kontoyannis DA: Spectral analysis of heart rate variability in sepsis syndrome, Cinic. Auton. Res., vol 3(1), pp.
25. Godin PJ, Fleisher LA, Eidsath A, Vandi- vier RW, Preas HL, et al.: Experimental human endotoxemia increases cardiac regularity: results with a loss of physiologic beat-to-heat variability of heart rate, Crit. Care med., vol. 24, pp. 11 17- 1124, 1996 26. Korhonen I, Ojaniemi J, Nieminen K, van Gils M, Heikela A, Kari A.: Building the IM- PROVE Data Library: technical description and lessons learned. IEEE Eng Med Biol., vol. 16(6),
27. Kari A., et al.: A Clinical Description of the IMPROVE Data Library. IEEE Eng Med Biol.,
28. Baselli G, Cerutti S: Identification tech- niques applied to processing of signals from car- diovascular system, Med. In$ (London), vol. 10, pp. 223-235, 1985, 29. Merri M, Farden DC, Mottley JC, Title- baum EL: Sampling frequency of the electrogar- diogram for spectral analysis of the heart rate Variability, IEEE Trans. on Biomedical Eng., vol.
30. Bianchi AM, Mainardi LT, Petrucci E, Sig- norini MG, Mainardi M, Cerutti S: Time- variant power spectrum analysis for the detection of transient episodes in HRV signal, IEEE Trans. on BME, vol. 40, no. 2, pp. 136-144, 1993. 3 1. Marple SL: Digital spectral analysis with up- plications, Prentice Hall, Englewood Cliffs, New Jersey, 1987. 32. Zetterberg LH: Estimation parameters for a linear difference equation with applica-
77, pp. 1283-1288, 1996.
pp. 11-16, 1996.
5-13, 1993
pp. 25-32, 1997.
vol. 16(6), pp. 21-24,40, 1997.
37, pp. 99-106, 1990.
tion to EEG analysis, Math. Biosc., vol. 5, pp,
33. Basielli G, Cerutti S, Civardi S,LombardiF, Malliani A, et al.: Heart rate variability signal processing: a quantitative approach as an aid to di- agnosis in cardiovascular pathologies, Int. J. of Bio-Me,d. and Comp., vol. 20, pp. 51-70, 1987. 34. Mainardi LT, Bianchi AM, Baselli G, Ce- rutti S: Pole-tracking algorithms for the extrac- tion of lime-variant heart rate Variability spectral parameters, IEEE Trans. on BME, vol. 42, no. 3,
35. Box GEP and Jenkins GM: Time series analysis, Forecasting and control, Ed: Holden Day, New York, 1976. 36. Cerutti S, Baselli G, Bianchi AM, Mainardi LT, Signorini MG, Malliani A: Cardiovascular variability signals: from signal processing to modelling complex physiological interactions, Automedica, vol. 16, pp. 45-69. 37. Mandelbrot B: The fractal geometry of the nature, W.H. Freeman, New York, 1983. 38. Taqqu MS, Teverovsky V, Willinger W: Es- timators for long range dependence: an empirical study, Fractals, vol. 3, pp. 785-798, 1996. 39. Bulpitt CJ: Confidence intervals, Lancet, vol.
40. Kitney RI, Linkens D, Selman A, et al.: The interaciion between heart rate and respiration. 11. Nonlinear analysis based on computer modeling, Automedica, vol. 4, pp. 141-153, 1982. 41. West, BJ: Fractal physiology and chaos in medicine, World Scient. Publishing Co. Pte. Ltd., 1090. 42. Scheinin B, Scheinin M, Vuorinen J, Lind- gren L,: “Alfentanil obtunds cardiovascular and sympatho-adrenal responses to suxamethonium- facilitated laryngoscopy and intubation”, British Journal of Anaesthesia, vol. 62, pp. 385-392, 1989. 43. Halssan HG, El-Sharkawy TY, Renck H, Mansour G, Fouda A: “Hemodynamic and catecholamine responses to laryngoscopy with vs. without endotracheal intubation,” Acta An- aesthe.uiologica Scandinavica, pp. 442-447, vol. 35,1991. 44. Cerutti S and Signorini MG: The heart rate variability signal: among rhythms noise and chaos, In Biomed Signal Processing, G Inbar, I Gath (eds.), Plenum press, pp. 235-249, 1996.
227-275, 1969
pp. 250-259, 1995
5 , pp. 494-497, 1987
November/Detember 1997 IEEE ENGINEERING IN MEDICINE AND BIOLOGY 75
Related Documents