ASSESSING HYDROMETEOROLOGICAL IMPACTS WITH TERRESTRIAL AND AERIAL LIDAR DATA IN MONTERREY, MEXICO F.D. Yépez Rincón a,* , D. F. Lozano García a , P.Vela Coiffier a , L. Rivera Rivera a a Environmental Quality Center, ITESM, Ave. Eugenio Garza Sada 2501 Sur, Col. Tecnológico, C.P.64849 Monterrey, N.L. México – * [email protected] KEY WORDS: Hidrometeorological impacts, Lidar, Environmental policy, Risk Management. ABSTRACT Light Detection Ranging (Lidar) is an efficient tool to gather points reflected from a terrain and store them in a xyz coordinate system, allowing the generation of 3D data sets to manage geoinformation. Translation of these coordinates, from an arbitrary system into a geographical base, makes data feasible and useful to calculate volumes and define topographic characteristics at different scales. Lidar technological advancement in topographic mapping enables the generation of highly accurate and densely sampled elevation models, which are in high demand by many industries like construction, mining and forestry. This study merges terrestrial and aerial Lidar data to evaluate the effectiveness of these tools assessing volumetric changes after a hurricane event of riverbeds and scour bridges The resulted information could be an optimal approach to improve hydrological and hydraulic models, to aid authorities in proper to decision making in construction, urban planning, and homeland security. 1. INTRODUCTION Many countries consider prevention and mitigation as the most effective way to reduce the negative consequences of natural disasters. For example, bridge scouring is the number one cause of structural failure (Yu and Yu, 2011); only in the United States over 1.000 bridges had fallen in a period of 30 years, 60% are attributed to catastrophic events related to hydrometeorological phenomena and only 2% to seismic causes (NCHRP, 2003 and Shirole and Holt, 1991). Structural engineers around the world have the task to develop real time bridge scour monitoring systems to evaluate risk management, especially in rivertowns. The strangling of the natural river’s flow is a common phenomenon, attributed mostly to the limited hydraulic calculations. Historical stream banks were wider, but with urbanization and city grow these became narrower. Nevertheless, the actual bridge structure design considers the current width of the rivers. When an intensive flow occurs, rivers regain its original width and the bridge structures stand eroded. Lidar data and its spatial statistics allow a most accurate calculation of volumetric changes at different scale projects (Woodlard and Colby, 2002). Terrestrial and aerial Lidar data could assess effectively river beds and scour bridges volumetric changes after a hurricane event. This paper proposes the Lidar system as a technological tool to obtain an accurate set of information, which can give a better approach for the creation of Digital Terrain Models (DTM) (Bitelli et al., 2004), land use classification, bridge geoinformation, among many other products that could be used for the National Water Commission or other agencies to solve information deficiencies to improve environmental policies and/or risk management. The objective of this paper was to create a new 3D cloud point with the fusion of terrestrial and aerial Lidar data by using different tests of alignment quality between the data and calculating damages using DTM information as well as field work, this to assess damages along highways and bridges in the rivertown. 2. MATERIALS AND METHODS 2.1 Study area and data sets The City of Monterrey, also known as the Metropolitan Area of Monterrey (MAM) is located Northeast Mexico and has a total area of 578.3 km 2 . It is composed of 9 municipalities; six of them affected by the Santa Catarina River (SCR), which crosses the city from West to East, with approximately 58.86 km line (Figure 1). This type of urban morphology (roads along the river) is a typical case of rivertowns. Historically, the MAM has been affected by hurricanes and the National Weather Service - National Oceanic and Atmospheric Administration (NOAA) recorded, from a time period from 1851 to 2008, around 283 storms with wind speeds from 0-196 MPH. The most recent case is hurricane Alex (July 1st, 2010), which collapsed the city’s economy for weeks and destroyed the two main highways built parallel to the river. Historical records registered a hurricane in 1909 with a similar hydrological behavior, which also destroyed many of the structures and bridges built at the area back then. Figure 1. The MAM polygon (background Landsat 5, April 28 th , 2010), showing river study area (blue line), the 25 bridges along the SCR (yellow/black dots) and the sampled areas for the volume calculation tests (circles). International Archives of the Photogrammetry, Remote Sensing and Spatial Information Sciences, Volume XL-7/W2, 2013 ISPRS2013-SSG, 11 – 17 November 2013, Antalya, Turkey This contribution has been peer-reviewed. doi:10.5194/isprsarchives-XL-7-W2-271-2013 271

Welcome message from author
This document is posted to help you gain knowledge. Please leave a comment to let me know what you think about it! Share it to your friends and learn new things together.
Transcript
ASSESSING HYDROMETEOROLOGICAL IMPACTS WITH TERRESTRIAL AND
AERIAL LIDAR DATA IN MONTERREY, MEXICO
F.D. Yépez Rincón a,*, D. F. Lozano García a, P.Vela Coiffier a, L. Rivera Rivera a
a Environmental Quality Center, ITESM, Ave. Eugenio Garza Sada 2501 Sur, Col. Tecnológico, C.P.64849
Monterrey, N.L. México – *[email protected]
KEY WORDS: Hidrometeorological impacts, Lidar, Environmental policy, Risk Management.
ABSTRACT
Light Detection Ranging (Lidar) is an efficient tool to gather points reflected from a terrain and store them in a xyz coordinate
system, allowing the generation of 3D data sets to manage geoinformation. Translation of these coordinates, from an arbitrary system
into a geographical base, makes data feasible and useful to calculate volumes and define topographic characteristics at different
scales. Lidar technological advancement in topographic mapping enables the generation of highly accurate and densely sampled
elevation models, which are in high demand by many industries like construction, mining and forestry. This study merges terrestrial
and aerial Lidar data to evaluate the effectiveness of these tools assessing volumetric changes after a hurricane event of riverbeds and
scour bridges The resulted information could be an optimal approach to improve hydrological and hydraulic models, to aid
authorities in proper to decision making in construction, urban planning, and homeland security.
1. INTRODUCTION
Many countries consider prevention and mitigation as the most
effective way to reduce the negative consequences of natural
disasters. For example, bridge scouring is the number one cause
of structural failure (Yu and Yu, 2011); only in the United
States over 1.000 bridges had fallen in a period of 30 years,
60% are attributed to catastrophic events related to
hydrometeorological phenomena and only 2% to seismic causes
(NCHRP, 2003 and Shirole and Holt, 1991). Structural
engineers around the world have the task to develop real time
bridge scour monitoring systems to evaluate risk management,
especially in rivertowns. The strangling of the natural river’s
flow is a common phenomenon, attributed mostly to the limited
hydraulic calculations.
Historical stream banks were wider, but with urbanization and
city grow these became narrower. Nevertheless, the actual
bridge structure design considers the current width of the rivers.
When an intensive flow occurs, rivers regain its original width
and the bridge structures stand eroded. Lidar data and its spatial
statistics allow a most accurate calculation of volumetric
changes at different scale projects (Woodlard and Colby, 2002).
Terrestrial and aerial Lidar data could assess effectively river
beds and scour bridges volumetric changes after a hurricane
event. This paper proposes the Lidar system as a technological
tool to obtain an accurate set of information, which can give a
better approach for the creation of Digital Terrain Models
(DTM) (Bitelli et al., 2004), land use classification, bridge
geoinformation, among many other products that could be used
for the National Water Commission or other agencies to solve
information deficiencies to improve environmental policies
and/or risk management.
The objective of this paper was to create a new 3D cloud point
with the fusion of terrestrial and aerial Lidar data by using
different tests of alignment quality between the data and
calculating damages using DTM information as well as field
work, this to assess damages along highways and bridges in the
rivertown.
2. MATERIALS AND METHODS
2.1 Study area and data sets
The City of Monterrey, also known as the Metropolitan Area of
Monterrey (MAM) is located Northeast Mexico and has a total
area of 578.3 km2. It is composed of 9 municipalities; six of
them affected by the Santa Catarina River (SCR), which crosses
the city from West to East, with approximately 58.86 km line
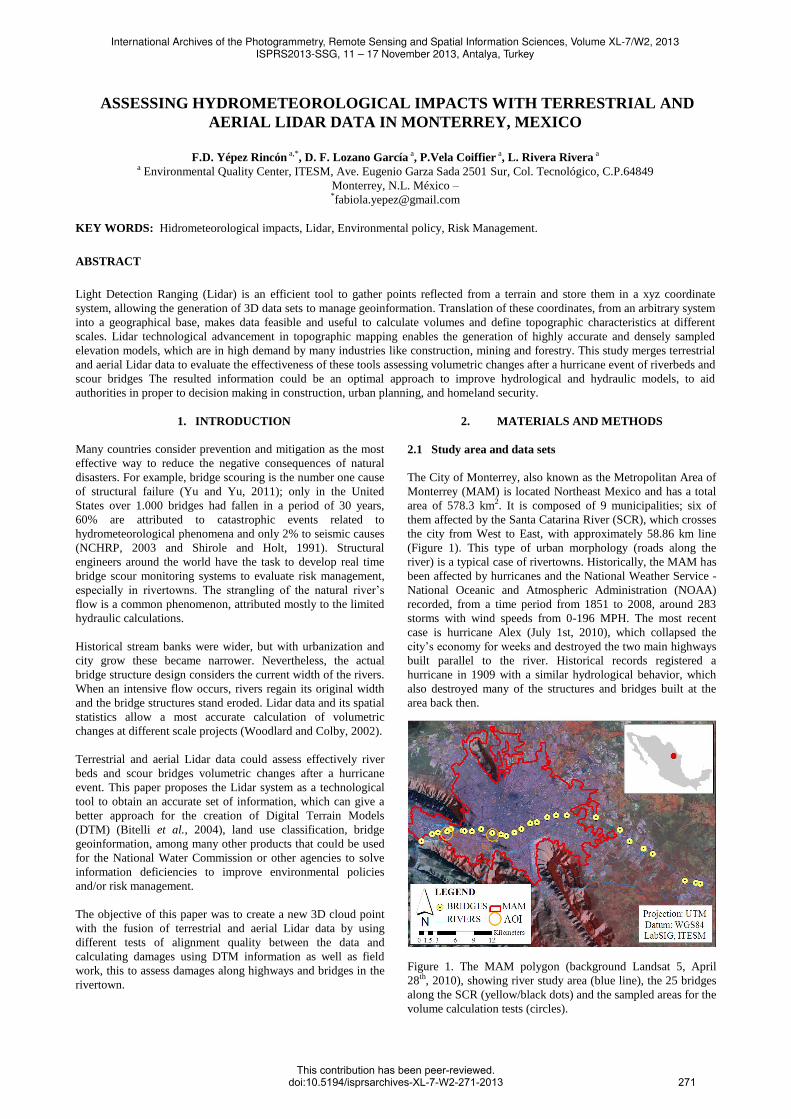
(Figure 1). This type of urban morphology (roads along the
river) is a typical case of rivertowns. Historically, the MAM has
been affected by hurricanes and the National Weather Service -
National Oceanic and Atmospheric Administration (NOAA)
recorded, from a time period from 1851 to 2008, around 283
storms with wind speeds from 0-196 MPH. The most recent
case is hurricane Alex (July 1st, 2010), which collapsed the
city’s economy for weeks and destroyed the two main highways
built parallel to the river. Historical records registered a
hurricane in 1909 with a similar hydrological behavior, which
also destroyed many of the structures and bridges built at the
area back then.
Figure 1. The MAM polygon (background Landsat 5, April
28th, 2010), showing river study area (blue line), the 25 bridges
along the SCR (yellow/black dots) and the sampled areas for the
volume calculation tests (circles).
International Archives of the Photogrammetry, Remote Sensing and Spatial Information Sciences, Volume XL-7/W2, 2013ISPRS2013-SSG, 11 – 17 November 2013, Antalya, Turkey
This contribution has been peer-reviewed.doi:10.5194/isprsarchives-XL-7-W2-271-2013 271
Hurricane Alex left some places along the SCR in complete
devastation. There was an extreme need to reevaluate the
hydrological and hydraulic models in order to perform an
accurate reconstruction. The catastrophe left 12 mortal victims
and expensive rebuilding costs calculated in millions of dollars.
This is an example of the urgent need of more complete
topographic databases, urban structure monitoring systems and
management risk plans, which could allow a better
implementation of preventive programs to avoid dramatic
consequences.
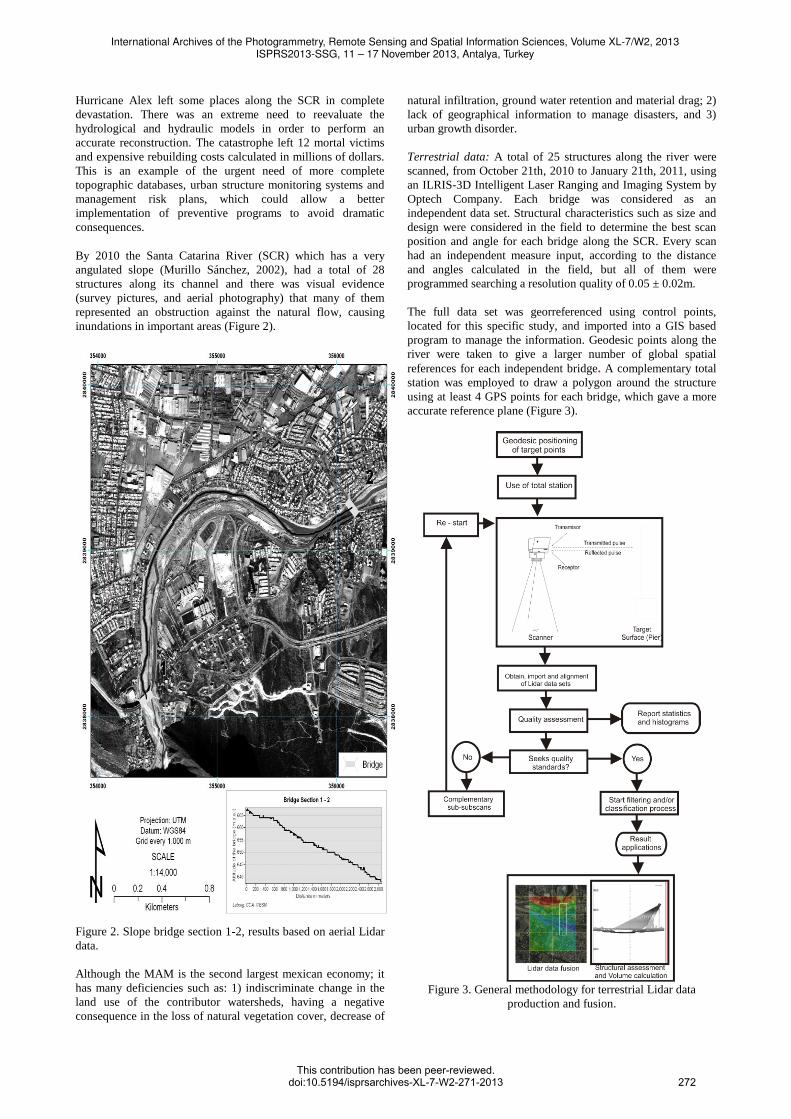
By 2010 the Santa Catarina River (SCR) which has a very
angulated slope (Murillo Sánchez, 2002), had a total of 28
structures along its channel and there was visual evidence
(survey pictures, and aerial photography) that many of them
represented an obstruction against the natural flow, causing
inundations in important areas (Figure 2).
Figure 2. Slope bridge section 1-2, results based on aerial Lidar
data.
Although the MAM is the second largest mexican economy; it
has many deficiencies such as: 1) indiscriminate change in the
land use of the contributor watersheds, having a negative
consequence in the loss of natural vegetation cover, decrease of
natural infiltration, ground water retention and material drag; 2)
lack of geographical information to manage disasters, and 3)
urban growth disorder.
Terrestrial data: A total of 25 structures along the river were
scanned, from October 21th, 2010 to January 21th, 2011, using
an ILRIS-3D Intelligent Laser Ranging and Imaging System by
Optech Company. Each bridge was considered as an
independent data set. Structural characteristics such as size and
design were considered in the field to determine the best scan
position and angle for each bridge along the SCR. Every scan
had an independent measure input, according to the distance
and angles calculated in the field, but all of them were
programmed searching a resolution quality of 0.05 ± 0.02m.
The full data set was georreferenced using control points,
located for this specific study, and imported into a GIS based
program to manage the information. Geodesic points along the
river were taken to give a larger number of global spatial
references for each independent bridge. A complementary total
station was employed to draw a polygon around the structure
using at least 4 GPS points for each bridge, which gave a more
accurate reference plane (Figure 3).
Figure 3. General methodology for terrestrial Lidar data
production and fusion.
International Archives of the Photogrammetry, Remote Sensing and Spatial Information Sciences, Volume XL-7/W2, 2013ISPRS2013-SSG, 11 – 17 November 2013, Antalya, Turkey
This contribution has been peer-reviewed.doi:10.5194/isprsarchives-XL-7-W2-271-2013 272
Aerial data: An aerial survey was conducted on December 2010
to scan the entire city; the project was supported by the National
Water Commission. The survey used an ALS50 Airborne Laser
Scanner Phase 2+ from Leica, it provided resolution of 0.70 m
(xy) and 0.15 m (z). The total scanned area was 202, 237.5 km2.
The information was filtered using the first return, subdivided in
tiles 500x750 m, and exported by areas of interest (one by
bridge) covering the complete structure and part of its
surrounding environment.
Optical imagery: Two sets of optical images were used: (a) an
aerial photography survey by the Instituto Nacional de
Estadística y Geografía (INEGI) a week after the hurricane, and
(b) a World View 2 Imagery taken on December 2010, almost
simultaneous to the aerial Lidar survey. All the aerial photos
were rectified using a three order polynomial spatial adjustment
corrected from the orthophotography of the MAM from 2007.
2.2 Data processing: Alignment of the scans / Quality
assessment
Terrestrial data: The information was managed by bridge, and
every group of scans were aligned to a common reference plane
(Brenner et al., 2007), using composited 3D images, polygonal
models, global reference points, huge translation and image
alignment technique, which consisted of a least-squares iterative
algorithm that automatically refines the approximation, this is
called best-fit alignment technique (BFA). The BFA needs to be
fed by reference points within tolerance from their original
position. This alignment technique allows the combination of
BFA technique and known points, marked and measured with a
GPS previously.
All the alignment procedure was done using IMAlign module of
Polyworks V11 from InnovMetric Software (2011). The
alignment quality was also evaluated by statistics and
histograms for each 3D Image. The LP360 Viewer Software by
QCoherent (2009) was a very useful tool to perform a quick and
first evaluation. The information was first converted to LAS
format and imported to perform a first visual evaluation of the
data. During the first scan, important information of the bridges
was missing (parts of the deck, piers or abutment that were in
the cutline river) because the angle of vision was blocked. This
missing information was complemented with sub-scans in
posterior dates.
The bridges’ cloud points were filtered and classified using
information from the Optech’s parser and the optical camera
during the scanning process and also from aerial and satellite
imagery obtained for the entire project. All bridges were
evaluated and subdivided with a qualitative methodology
according to the American Association of State Highway and
Transportation Officials (AASHTO); and also considering its
actual structural condition (Veneziano et. al., 2003 and Khattak
et al., 2003). Waterway data needs to be analyzed to determine
if deficiencies can be brought into conformance with current
standards in a feasible and prudent manner without damaging
the bridge’s historical value for the city (WSDOT Historic
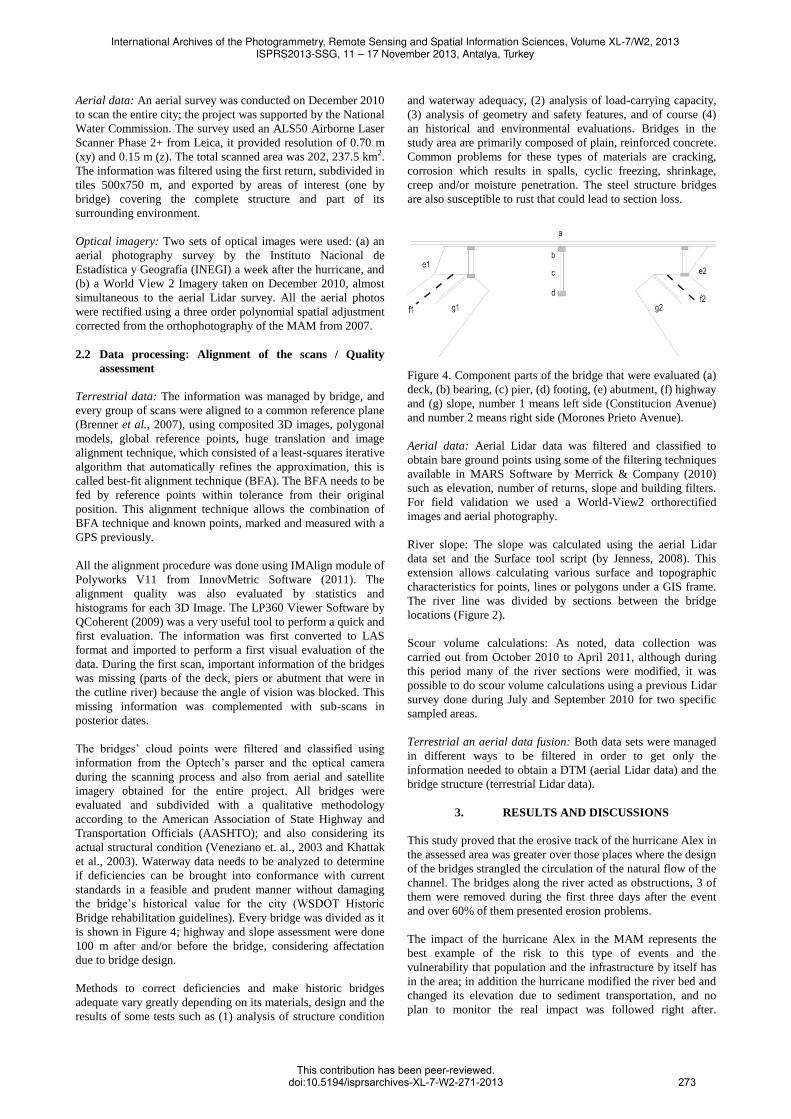
Bridge rehabilitation guidelines). Every bridge was divided as it
is shown in Figure 4; highway and slope assessment were done
100 m after and/or before the bridge, considering affectation
due to bridge design.
Methods to correct deficiencies and make historic bridges
adequate vary greatly depending on its materials, design and the
results of some tests such as (1) analysis of structure condition
and waterway adequacy, (2) analysis of load-carrying capacity,
(3) analysis of geometry and safety features, and of course (4)
an historical and environmental evaluations. Bridges in the
study area are primarily composed of plain, reinforced concrete.
Common problems for these types of materials are cracking,
corrosion which results in spalls, cyclic freezing, shrinkage,
creep and/or moisture penetration. The steel structure bridges
are also susceptible to rust that could lead to section loss.
Figure 4. Component parts of the bridge that were evaluated (a)
deck, (b) bearing, (c) pier, (d) footing, (e) abutment, (f) highway
and (g) slope, number 1 means left side (Constitucion Avenue)
and number 2 means right side (Morones Prieto Avenue).
Aerial data: Aerial Lidar data was filtered and classified to
obtain bare ground points using some of the filtering techniques
available in MARS Software by Merrick & Company (2010)
such as elevation, number of returns, slope and building filters.
For field validation we used a World-View2 orthorectified
images and aerial photography.
River slope: The slope was calculated using the aerial Lidar
data set and the Surface tool script (by Jenness, 2008). This
extension allows calculating various surface and topographic
characteristics for points, lines or polygons under a GIS frame.
The river line was divided by sections between the bridge
locations (Figure 2).
Scour volume calculations: As noted, data collection was
carried out from October 2010 to April 2011, although during
this period many of the river sections were modified, it was
possible to do scour volume calculations using a previous Lidar
survey done during July and September 2010 for two specific
sampled areas.
Terrestrial an aerial data fusion: Both data sets were managed
in different ways to be filtered in order to get only the
information needed to obtain a DTM (aerial Lidar data) and the
bridge structure (terrestrial Lidar data).
3. RESULTS AND DISCUSSIONS
This study proved that the erosive track of the hurricane Alex in
the assessed area was greater over those places where the design
of the bridges strangled the circulation of the natural flow of the
channel. The bridges along the river acted as obstructions, 3 of
them were removed during the first three days after the event
and over 60% of them presented erosion problems.
The impact of the hurricane Alex in the MAM represents the
best example of the risk to this type of events and the
vulnerability that population and the infrastructure by itself has
in the area; in addition the hurricane modified the river bed and
changed its elevation due to sediment transportation, and no
plan to monitor the real impact was followed right after.
International Archives of the Photogrammetry, Remote Sensing and Spatial Information Sciences, Volume XL-7/W2, 2013ISPRS2013-SSG, 11 – 17 November 2013, Antalya, Turkey
This contribution has been peer-reviewed.doi:10.5194/isprsarchives-XL-7-W2-271-2013 273
Government agencies focused on solving basic needs such as
electricity, roads rehabilitation, and attention to victims.
However, geoinformation after a catastrophic event represent
invaluable data for the future studies and to assess the real
impacts of this type of events at a local scale.
A total of 109 geodesic points were placed covering an area of
11.683 km2. 159 scans were needed to cover the 25 bridge
structures, averaging 6 scans by Unit Bridge and getting a total
of 185 millions of estimated point’s data set. Table 1, shows the
alignment statistics by bridge. Alignment Standard Deviation
ranged on 0.0195 mm using reference points and BFA
techniques having normal distributions. River slope average
was 2.11% calculated using a DTM created with the aerial Lidar
information by sections along the 58.86k m length of the river
study area.
Table 1. Precision scan alignment (SA) statistics by bridge.
Total bridges Max Min Average
Deck (m.a.s.l.) 690.14 324.29 502.3611
Slope (%) 4.592 1.11 2.17688
SA Mean 0.01355 -0.00311 0.000938
SA Std Dev. 0.03297 0.007922 0.019458
SA Min -0.051 -0.191 -0.10604
SA Max 0.191 0.036 0.10544
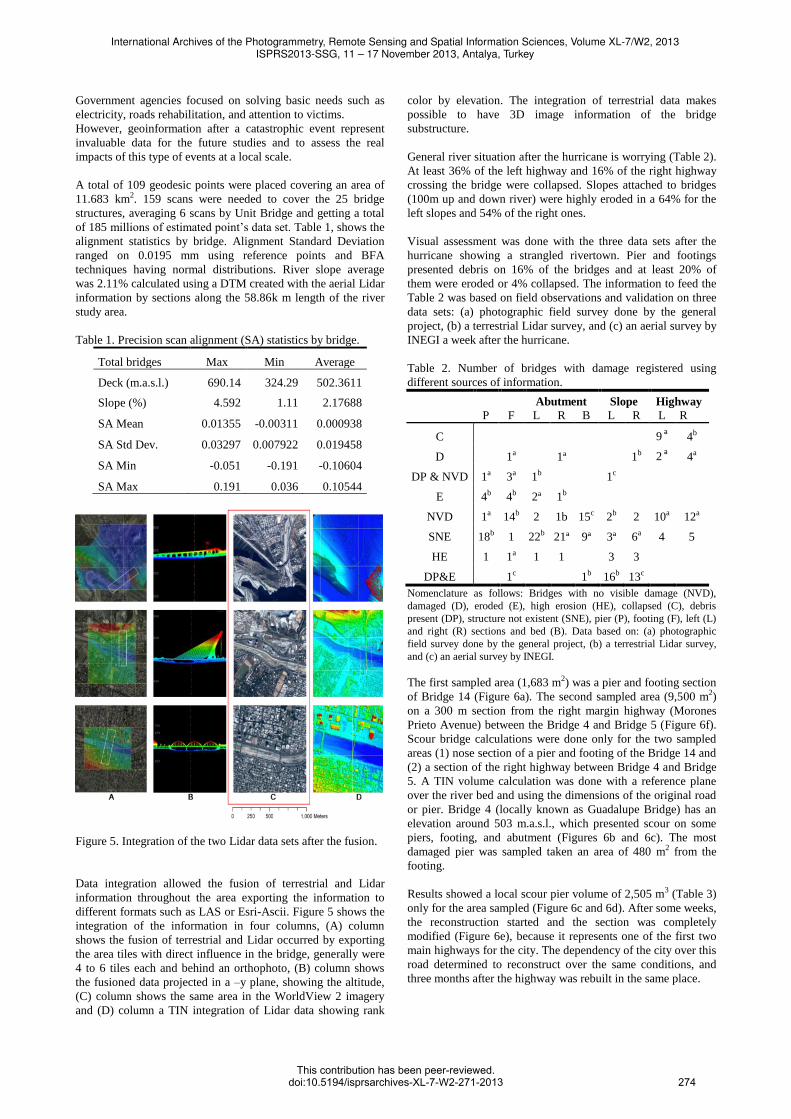
Figure 5. Integration of the two Lidar data sets after the fusion.
Data integration allowed the fusion of terrestrial and Lidar
information throughout the area exporting the information to
different formats such as LAS or Esri-Ascii. Figure 5 shows the
integration of the information in four columns, (A) column
shows the fusion of terrestrial and Lidar occurred by exporting
the area tiles with direct influence in the bridge, generally were
4 to 6 tiles each and behind an orthophoto, (B) column shows
the fusioned data projected in a –y plane, showing the altitude,
(C) column shows the same area in the WorldView 2 imagery
and (D) column a TIN integration of Lidar data showing rank
color by elevation. The integration of terrestrial data makes
possible to have 3D image information of the bridge
substructure.
General river situation after the hurricane is worrying (Table 2).
At least 36% of the left highway and 16% of the right highway
crossing the bridge were collapsed. Slopes attached to bridges
(100m up and down river) were highly eroded in a 64% for the
left slopes and 54% of the right ones.
Visual assessment was done with the three data sets after the
hurricane showing a strangled rivertown. Pier and footings
presented debris on 16% of the bridges and at least 20% of
them were eroded or 4% collapsed. The information to feed the
Table 2 was based on field observations and validation on three
data sets: (a) photographic field survey done by the general
project, (b) a terrestrial Lidar survey, and (c) an aerial survey by
INEGI a week after the hurricane.
Table 2. Number of bridges with damage registered using
different sources of information.
Abutment Slope Highway
P F L R B L R L R
C
9 a 4b
D
1a
1ª
1b 2 a 4a
DP & NVD 1a 3a 1b
1c
E 4b 4b 2ª 1b
NVD 1a 14b 2 1b 15c 2b 2 10a 12a
SNE 18b 1 22b 21ª 9ª 3ª 6a 4 5
HE 1 1a 1 1
3 3
DP&E 1c 1b 16b 13c
Nomenclature as follows: Bridges with no visible damage (NVD),
damaged (D), eroded (E), high erosion (HE), collapsed (C), debris
present (DP), structure not existent (SNE), pier (P), footing (F), left (L)
and right (R) sections and bed (B). Data based on: (a) photographic
field survey done by the general project, (b) a terrestrial Lidar survey,
and (c) an aerial survey by INEGI.
The first sampled area (1,683 m2) was a pier and footing section
of Bridge 14 (Figure 6a). The second sampled area (9,500 m2)
on a 300 m section from the right margin highway (Morones
Prieto Avenue) between the Bridge 4 and Bridge 5 (Figure 6f).
Scour bridge calculations were done only for the two sampled
areas (1) nose section of a pier and footing of the Bridge 14 and
(2) a section of the right highway between Bridge 4 and Bridge
5. A TIN volume calculation was done with a reference plane
over the river bed and using the dimensions of the original road
or pier. Bridge 4 (locally known as Guadalupe Bridge) has an
elevation around 503 m.a.s.l., which presented scour on some
piers, footing, and abutment (Figures 6b and 6c). The most
damaged pier was sampled taken an area of 480 m2 from the
footing.
Results showed a local scour pier volume of 2,505 m3 (Table 3)
only for the area sampled (Figure 6c and 6d). After some weeks,
the reconstruction started and the section was completely
modified (Figure 6e), because it represents one of the first two
main highways for the city. The dependency of the city over this
road determined to reconstruct over the same conditions, and
three months after the highway was rebuilt in the same place.
International Archives of the Photogrammetry, Remote Sensing and Spatial Information Sciences, Volume XL-7/W2, 2013ISPRS2013-SSG, 11 – 17 November 2013, Antalya, Turkey
This contribution has been peer-reviewed.doi:10.5194/isprsarchives-XL-7-W2-271-2013 274
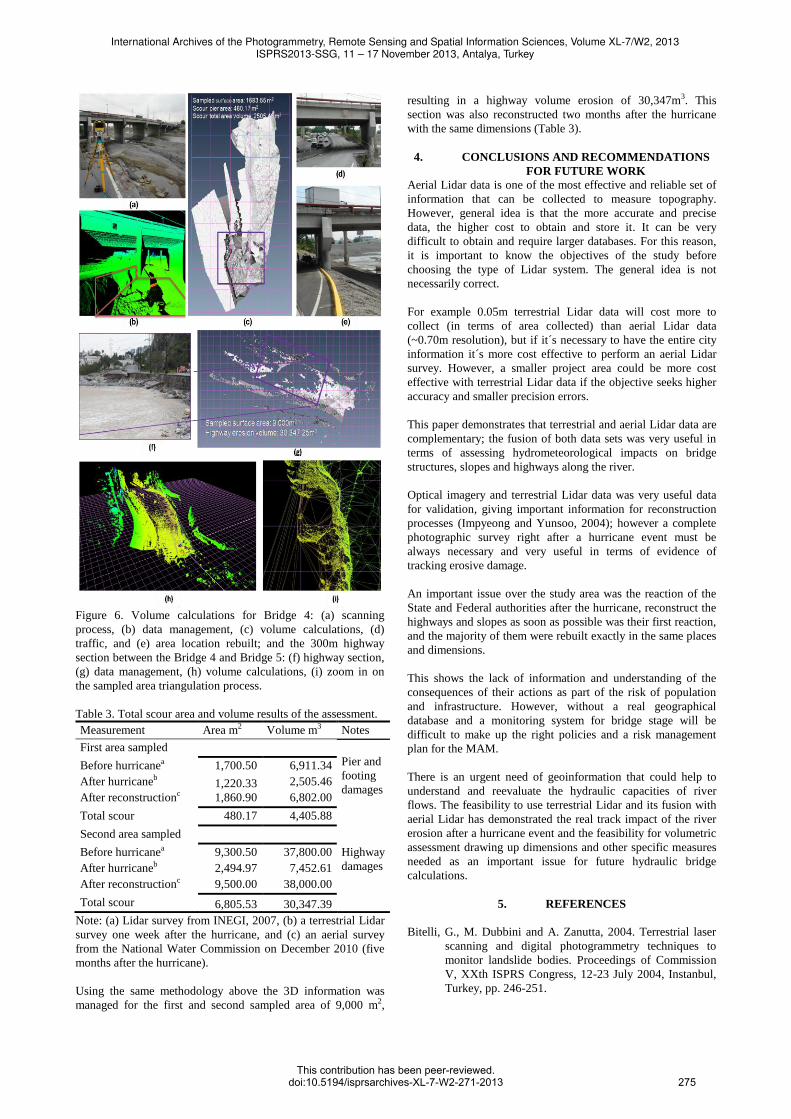
Figure 6. Volume calculations for Bridge 4: (a) scanning
process, (b) data management, (c) volume calculations, (d)
traffic, and (e) area location rebuilt; and the 300m highway
section between the Bridge 4 and Bridge 5: (f) highway section,
(g) data management, (h) volume calculations, (i) zoom in on
the sampled area triangulation process.
Table 3. Total scour area and volume results of the assessment.
Measurement Area m2 Volume m3 Notes
First area sampled
Pier and
footing
damages
Before hurricanea 1,700.50 6,911.34
After hurricaneb 1,220.33 2,505.46
After reconstructionc 1,860.90 6,802.00
Total scour 480.17 4,405.88
Second area sampled
Before hurricanea 9,300.50 37,800.00 Highway
damages
After hurricaneb 2,494.97 7,452.61
After reconstructionc 9,500.00 38,000.00
Total scour 6,805.53 30,347.39
Note: (a) Lidar survey from INEGI, 2007, (b) a terrestrial Lidar
survey one week after the hurricane, and (c) an aerial survey
from the National Water Commission on December 2010 (five
months after the hurricane).
Using the same methodology above the 3D information was
managed for the first and second sampled area of 9,000 m2,
resulting in a highway volume erosion of 30,347m3. This
section was also reconstructed two months after the hurricane
with the same dimensions (Table 3).
4. CONCLUSIONS AND RECOMMENDATIONS
FOR FUTURE WORK
Aerial Lidar data is one of the most effective and reliable set of
information that can be collected to measure topography.
However, general idea is that the more accurate and precise
data, the higher cost to obtain and store it. It can be very
difficult to obtain and require larger databases. For this reason,
it is important to know the objectives of the study before
choosing the type of Lidar system. The general idea is not
necessarily correct.
For example 0.05m terrestrial Lidar data will cost more to
collect (in terms of area collected) than aerial Lidar data
(~0.70m resolution), but if it´s necessary to have the entire city
information it´s more cost effective to perform an aerial Lidar
survey. However, a smaller project area could be more cost
effective with terrestrial Lidar data if the objective seeks higher
accuracy and smaller precision errors.
This paper demonstrates that terrestrial and aerial Lidar data are
complementary; the fusion of both data sets was very useful in
terms of assessing hydrometeorological impacts on bridge
structures, slopes and highways along the river.
Optical imagery and terrestrial Lidar data was very useful data
for validation, giving important information for reconstruction
processes (Impyeong and Yunsoo, 2004); however a complete
photographic survey right after a hurricane event must be
always necessary and very useful in terms of evidence of
tracking erosive damage.
An important issue over the study area was the reaction of the
State and Federal authorities after the hurricane, reconstruct the
highways and slopes as soon as possible was their first reaction,
and the majority of them were rebuilt exactly in the same places
and dimensions.
This shows the lack of information and understanding of the
consequences of their actions as part of the risk of population
and infrastructure. However, without a real geographical
database and a monitoring system for bridge stage will be
difficult to make up the right policies and a risk management
plan for the MAM.
There is an urgent need of geoinformation that could help to
understand and reevaluate the hydraulic capacities of river
flows. The feasibility to use terrestrial Lidar and its fusion with
aerial Lidar has demonstrated the real track impact of the river
erosion after a hurricane event and the feasibility for volumetric
assessment drawing up dimensions and other specific measures
needed as an important issue for future hydraulic bridge
calculations.
5. REFERENCES
Bitelli, G., M. Dubbini and A. Zanutta, 2004. Terrestrial laser
scanning and digital photogrammetry techniques to
monitor landslide bodies. Proceedings of Commission
V, XXth ISPRS Congress, 12-23 July 2004, Instanbul,
Turkey, pp. 246-251.
International Archives of the Photogrammetry, Remote Sensing and Spatial Information Sciences, Volume XL-7/W2, 2013ISPRS2013-SSG, 11 – 17 November 2013, Antalya, Turkey
This contribution has been peer-reviewed.doi:10.5194/isprsarchives-XL-7-W2-271-2013 275
Brenner, C., C. Dold and N. Ripperda, 2007. Coarse orientation
of terrestrial laser scans in urban environments, Journal
of Photogrammetry and Remote Sensing, 63(1):4-18.
Impyeong, L. and C. Yunsoo. 2004. Fusion of terrestrial laser
scanner data and images for building reconstruction.
Proceedings of Commission V, XXth ISPRS Congress,
12-23 July 2004, Instanbul, Turkey, p.6.
Jenness, J., 2008. Surface Tools (surf_tools.avx) extension for
ArcView 3.x, v. 1.6a. Jenness Enterprises. URL:
http://www.jennessent.com/arcview/surface_tools.htm,
Flagstaff, Arizona (last date accessed: 31 May 2011).
Khattak, A. J., S. Hallmark and R. Souleyrette, 2003.
Application of light detection and ranging technology to
highway safety, Transportation Research Record:
Journal of the Transportation Research Board of the
National Academies, 1836(2):7-15.
Murillo Sánchez, E., 2002. Estudio del efecto del cambio de
uso de suelo en el escurrimiento en la subcuenca 24Bf
“Monterrey”, aplicando un sistema de información
geográfica, M.Sc. Thesis, Instituto Tecnológico y de
Estudios Superiores de Monterrey, Monterrey, Nuevo
León, 119 p.
National Oceanic and Atmospheric Administration, 2010.
Historical hurricane tracks. URL:
http://csc.noaa.gov/hurricanes/#, NOAA/National
Weather Service, National Centers for Environmental
Prediction, National Hurricane Center, Miami, Florida
(last date accessed: 14 May 2010).
Shirole, A.M., and R.C Holt, 1991. Planning for a
comprehensive bridge safety assurance program, Third
Bridge Engineering Conference, Transport Research
Record 1290 Volume 1, 10-13 March 1991, Denver,
Colorado, pp. 39-50.
Veneziano, D., R. Souleyrette and S. Hallmark, 2003.
Integration of light detection and ranging technology
with photogrammetry in highway location and design,
Transportation Research Record: Journal of the
Transportation Research Board of the National
Academies, 1836(1):1-6.
Woodlard, J.W. and J. D. Colby, 2002. Spatial characterization,
resolution, and volumetric change of coastal dunes
using airborne Lidar: Cape Hatteras, North Carolina,
Geomorphology, 48(1): 269-287.
Yu, X. and X. Yu, 2011. Assessment of an automation
algorithm for TDR bridge scour monitoring system,
Advances in Structural Engineering, 14(1):13-24.
International Archives of the Photogrammetry, Remote Sensing and Spatial Information Sciences, Volume XL-7/W2, 2013ISPRS2013-SSG, 11 – 17 November 2013, Antalya, Turkey
This contribution has been peer-reviewed.doi:10.5194/isprsarchives-XL-7-W2-271-2013 276
Related Documents