See discussions, stats, and author profiles for this publication at: https://www.researchgate.net/publication/340085339 Assessing Human and Carbon Footprint of Ranchi Urban Environment using Remote Sensing Technology. Article in Journal of Urban and Environmental Engineering · October 2019 DOI: 10.4090/juee.2019.v13n2.257264 CITATIONS 0 READS 43 2 authors, including: Some of the authors of this publication are also working on these related projects: Geography of Tropical Cyclone phethai in Bay of Bengal View project Mapping and quantitative assessment of plant resources and its distribution in Madhya Pradesh, Central India View project Amit Kumar Central University of Jharkhand 58 PUBLICATIONS 228 CITATIONS SEE PROFILE All content following this page was uploaded by Amit Kumar on 21 March 2020. The user has requested enhancement of the downloaded file.

Welcome message from author
This document is posted to help you gain knowledge. Please leave a comment to let me know what you think about it! Share it to your friends and learn new things together.
Transcript
See discussions, stats, and author profiles for this publication at: https://www.researchgate.net/publication/340085339
Assessing Human and Carbon Footprint of Ranchi Urban Environment using
Remote Sensing Technology.
Article in Journal of Urban and Environmental Engineering · October 2019
DOI: 10.4090/juee.2019.v13n2.257264
CITATIONS
0READS
43
2 authors, including:
Some of the authors of this publication are also working on these related projects:
Geography of Tropical Cyclone phethai in Bay of Bengal View project
Mapping and quantitative assessment of plant resources and its distribution in Madhya Pradesh, Central India View project
Amit Kumar
Central University of Jharkhand
58 PUBLICATIONS 228 CITATIONS
SEE PROFILE
All content following this page was uploaded by Amit Kumar on 21 March 2020.
The user has requested enhancement of the downloaded file.
Journal of Urban and Environmental Engineering (JUEE), v.13, n.2, p. 257-265, 2019
UEEJ
Journal of Urban and Environmental Engineering, v.13, n.2, p.257-264
Journal of Urban and Environmental Engineering
ISSN 1982-3932 doi: 10.4090/juee.2019.v13n2.257264
www.journal-uee.org
ASSESSING HUMAN AND CARBON FOOTPRINT OF RANCHI URBAN ENVIRONMENT USING REMOTE SENSING
TECHNOLOGY
Amit Kumar1 and Ashwani Kumar2 1Department for Land Resource Management, School of Natural Resource Management, Central University of
Jharkhand, Ranchi 835205, India 2Faculty of Planning, Centre for Environmental Planning and Technology University, Ahmedabad 380009, India
Received 23 January 2019; received in revised form 06 October 2019; accepted 12 October 2019
Abstract: In the present study, the total carbon emission of rapidly growing Ranchi Urban
Agglomeration (RUA) was estimated in geospatial environment considering certain factors. The carbon emission estimation is based on the increase in human as well as vehicular population and loss of vegetation cover employing standardized conversion factors. The rapid built-up expansion (180%) and human population growth (223%) during 1975-2010 led to innumerable socio-economic and environmental impacts including deterioration of urban ecosystem. The built-up expansion as observed through satellite images reflects degradation in the natural ecosystem primarily apparent on forest ecosystem in RUA. The study reveals that after reorganization of Ranchi as state capital (post 2000), the carbon emission was more prevalent as compared to the earlier periods. The estimates of carbon stock (terrestrial carbon) represents that the vegetation cover, attributed as the major source of carbon sink, was lost and leads to emission of total 2.44 metric tonnes of carbon during 1975-2010. The vehicular based carbon emission estimation exhibits high level of carbon emission in RUA (198,038,728 metric tonnes) during the year 2010. The population distribution pattern in wards of Ranchi Municipal Corporation revealed that the wards located in the selected city core northern, north-eastern, eastern and south-western parts emitted than the mean city carbon emission (>38,500 metric tonnes) as compared to the wards located in central, north-eastern, south-western and south-western parts (>60,000 metric tonnes). The study suggests towards urgent imposition of regulations for rapid land use transformation together with preservation and growth of carbon sink locations of RUA.
Keywords:
Carbon footprint; Urban growth; Urban traffic; Geoinformatics
© 2019 Journal of Urban and Environmental Engineering (JUEE). All rights reserved.
Correspondence to: Amit Kumar. E-mail: [email protected]
Kumar and Kumar
Journal of Urban and Environmental Engineering (JUEE), v.13, n.2, p. 257-265, 2019
258
INTRODUCTION
Cities are increasingly expanding their boundaries and populations thus defining the human history as the history of urbanization (Santamouris 2002). These cities are often considered to be major causes of climate change through being centers of carbon intensive production and consumption (Satterthwaite 2010) and account for more than 70% of global fossil-fuel CO2 emissions (Romero-Lankao et al. 2015). Human beings around the world expand constructed surfaces for shelter, transportation, and commerce (Sutton et al. 2009). This is increasing enormous pressure over the human carrying capacity of the Earth due to resident’s ever-increasing per capita demand for goods and services, particularly material needs and energy (Dhakal 2004).
The rapid urban expansion led to extensive changes in land use/ land cover substantially replaced vegetation cover and other production natural cover with impervious surfaces (Seto and Kaufmann 2009). The impervious surfaces (viz., buildings, roads) usually absorbs higher solar radiation and store heat during the day time, both from solar radiation (due to its greater thermal capacity and conductivity) and from human activities such as traffic exhaust and energy use. This heat is then released during the night resulting in higher night-time temperatures in urban areas (Kershaw et al. 2010). Therefore, it has long been recognized that urban areas have their own localized climate and are typically warmer than surrounding non-urban areas forming Urban Heat Island (UHI) (Howard 1833; Oke 1982; Arnfield 2003). Also building related technologies such as air conditioners, heating and cooling systems, insulation systems and other building energy management systems affect energy use significantly.
Urban carbon emission has sharply increased owing to the rapid urbanization and motorization. Urban traffic is the third major greenhouse gas emission sector following energy supply and industrial production, accounting for 13.1% of the global emission. The energy implications from transportation systems depends on availability of built-in infrastructure for rail and road networks, mass transportation systems, share of public and private travel demand, role of alternative fuel vehicles, share of small-occupancy-vehicles, such as two wheelers as in India, China, Thailand, Indonesia and others. Increasingly, cars are dominating other means of automobile transportation in rapidly industrializing cities due to rising income, attached social stigma for owning
cars and inefficient public transportation systems. This is putting pressure on issues such as energy security as well as local air pollution and greenhouse gases from urban transportation. Carbon emissions from vehicles, traffic congestion and increasing particulate matter pose various challenges to urban ecosystem including widespread public health risks (Dhakal 2004; Mehrotra et al. 2009). The exposure of a large and concentrated urban population to worsening urban air pollution, water pollution, solid waste, deteriorated rainfall patterns and excessive temperature has increased vulnerabilities related to global climatic changes (Dhakal 2004).
Kumar et al. (2011a, 2011b) reported rapid urban expansion along with increasing population in recent decades. This led to innumerable socio-economic and environmental impacts. The increase in human and vehicular (4461.4% during 1997-2010) population resulted in deterioration of urban environment in Ranchi as substantiated by increasing and higher concentration of Suspended Particulate Matter (>300 µg/m3) and Respiratory Suspended Particulate Matter (>200 µg/m3), high concentration of Aerosol Optical Depth (0.30% to 0.35% at 340nm), critical (65-75 dB(A)) and high (>75 dB(A)) levels of ambient noise at major parts (Kumar et al. 2013) together with depletion of groundwater quantity (Kumar and Pandey, 2016) and water quality (Pandey and Kumar, 2015). These changes affect the absorption of solar radiation, surface temperature, evaporation rates and resulted in alteration of local climate. The meteorological conditions indicate increase in mean temperature (0.4ᴼC) and decrease in cumulative rainfall during 1960-2010 reflecting deteriorating trend of urban climatic conditions in Ranchi. The haphazard built-up growth largely at the expense of agricultural and other productive lands to fulfil the housing and non-housing requirement of ever increasing population led to increase in energy consumption, vehicular pollution as well as carbon emission.
Therefore, in the present study, the carbon footprint of Ranchi Urban Agglomeration (RUA) has been measured based on land use/ land cover (LULC) change, number of registered, population increase and ward level household population distribution. This may be helpful in preparation of city level climate change action plan and defining city level climate change mitigation and adaptation strategies. Although climate change is a multi-dimensional phenomenon, the present study considered only few factors of carbon emission and its implication of city climate change.
Pattanayak and Pattanayak
Journal of Urban and Environmental Engineering (JUEE), v.13, n.2, p. 257-265, 2019
259
STUDY AREA
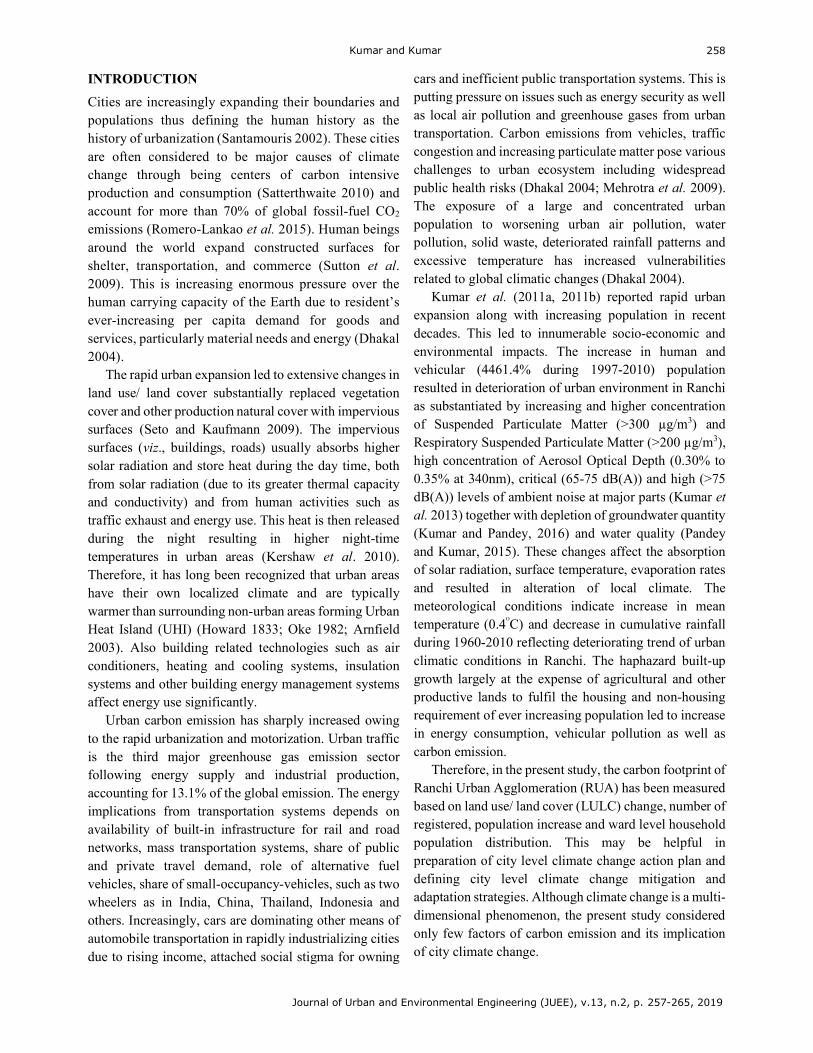
The study area (317.6 km2) comprising Ranchi Urban Agglomeration (RUA) is the capital of Jharkhand state. The RUA is located between 85º 13´ to 85º 25´ E longitude and 23º 13´to 23º 26´ N latitude at 645 m above sea level and is a part of the Chotanagpur plateau (Fig. 1). The demarcation of study area was based on 2 km outer buffer of Ranchi Municipal Corporation (RMC) boundary, which covers majority of continuous built-up land (as observed in satellite images in 2010) of Ranchi township.
Ranchi has a population of about 10,73,440 persons (Census of India, 2011) and having population density of 8656 persons/km2 with major proportion of the population being dominated by tribal communities. As per census of India 2011, 22.2% of population of Jharkhand is residing in urban area, and a major part of it resides in Ranchi City (17.7%). Administratively, the RUA comprises parts of Kanke, Namkum and Ratu Community Development Blocks in Ranchi district of Jharkhand State. Ranchi city is governed by municipal authority of the city (i.e., Ranchi Municipal Corporation). Physiographically, Ranchi city is located on Chotanagpur Plateau and characterized by undulating topography with elevation ranging from about 595 m to 754 m above sea level (asl). Swarnrekha river and its tributaries viz.,
Harmu, Potpoto, Kanchi, Saphi, Jumar, Radhu and Tajna are the major rivers draining the area.
Climate of the study area ranges from dry semi-humid to humid types. The city receives about 1400 mm of average annual rainfall. The cold weather commences early in November and comes to an end in the middle of March. The hot weather then sets in and lasts till the middle of June. Soon after, the monsoon season commences and continues till the end of September. The weather in the winter season is pleasant as the days are bright and warm with mean temperature of 19.6ºC. The highest temperature is often registered in May, which is the hottest month of the year and maximum temperature rises up to 45 ºC. Relative humidity ranges from 80% during winter, 65% during summer and 96% during monsoon season.
After its formation as state capital of Jharkhand state on 15th Nov. 2000, the Ranchi city has experienced rapid urbanization and resultant rapid land use transformation as well as high influx of population during the last decades. The majority of city core area is being transformed into high density built-up comprising multistoried buildings, commercial complexes and apartments, whereas at the rural-urban fringe the horizontal expansion was largely observed.
Fig. 1 Study área.
Kumar and Kumar
Journal of Urban and Environmental Engineering (JUEE), v.13, n.2, p. 257-265, 2019
260
DATA USE AND METHODOLOGY
In the present study, the carbon emission was estimated in Ranchi Urban Agglomeration based on three factors: a) loss of vegetation cover, b) number of registered vehicles, and c) population increase and household distribution pattern in municipal wards of RMC. The LULC of RUA prepared using multi-temporal satellite observation viz. LANDSAT MSS 1975, LANDSAT TM 1991, LANDSAT ETM+2001 and 2010 employing visual interpretation technique. The change in built-up and vegetation cover was estimated over the periods. The carbon emission was estimated employing standard conversion factor with reference to total wood volume following Canada’s Model Forest Program (CMFP, 2000). The total wood volume was calculated using loss in vegetation coverage, which later used in total dry matter biomass estimation and carbon stock/ terrestrial carbon estimation.
To determine annual greenhouse gas (GHG) emissions per passenger vehicle, the number of registered vehicles was used as base data, which was collected from District Transport Office (DTO), Ranchi. The total gallons of gasoline consumed were estimated using average movement of passenger vehicle per year and their average mileage. Gallons of gasoline consumed were multiplied by carbon dioxide per gallon of gasoline to determine carbon dioxide emitted per vehicle per year. Carbon dioxide emissions were then divided by the ratio of carbon dioxide emissions to total vehicle GHG emissions to account for vehicle methane and nitrous oxide emissions (EPA, 2012).
Based on a cursory examination of the per capita carbon emissions in Ranchi city as observed by ICLEI-South Asia (2009), the carbon emission in RUA was estimated on the basis of population increase. Later, municipal ward-wise carbon emission was calculated using distribution of households and population in municipal wards in GIS environment. The population data during various periods were collected from UNPD, 2015 and Census of India; whereas ward level household and population distribution data collected from Ranchi Municipal Corporation, for the year 2011.
RESULTS AND DISCUSSIONS
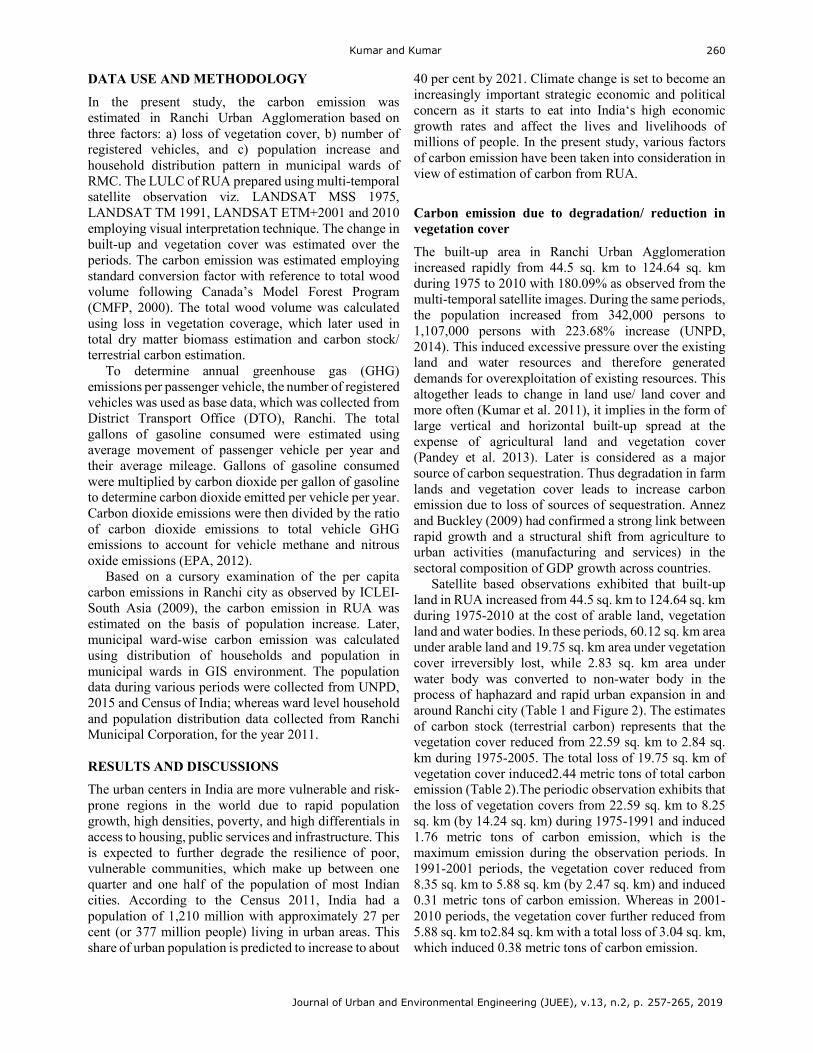
The urban centers in India are more vulnerable and risk-prone regions in the world due to rapid population growth, high densities, poverty, and high differentials in access to housing, public services and infrastructure. This is expected to further degrade the resilience of poor, vulnerable communities, which make up between one quarter and one half of the population of most Indian cities. According to the Census 2011, India had a population of 1,210 million with approximately 27 per cent (or 377 million people) living in urban areas. This share of urban population is predicted to increase to about
40 per cent by 2021. Climate change is set to become an increasingly important strategic economic and political concern as it starts to eat into India‘s high economic growth rates and affect the lives and livelihoods of millions of people. In the present study, various factors of carbon emission have been taken into consideration in view of estimation of carbon from RUA.
Carbon emission due to degradation/ reduction in vegetation cover
The built-up area in Ranchi Urban Agglomeration increased rapidly from 44.5 sq. km to 124.64 sq. km during 1975 to 2010 with 180.09% as observed from the multi-temporal satellite images. During the same periods, the population increased from 342,000 persons to 1,107,000 persons with 223.68% increase (UNPD, 2014). This induced excessive pressure over the existing land and water resources and therefore generated demands for overexploitation of existing resources. This altogether leads to change in land use/ land cover and more often (Kumar et al. 2011), it implies in the form of large vertical and horizontal built-up spread at the expense of agricultural land and vegetation cover (Pandey et al. 2013). Later is considered as a major source of carbon sequestration. Thus degradation in farm lands and vegetation cover leads to increase carbon emission due to loss of sources of sequestration. Annez and Buckley (2009) had confirmed a strong link between rapid growth and a structural shift from agriculture to urban activities (manufacturing and services) in the sectoral composition of GDP growth across countries.
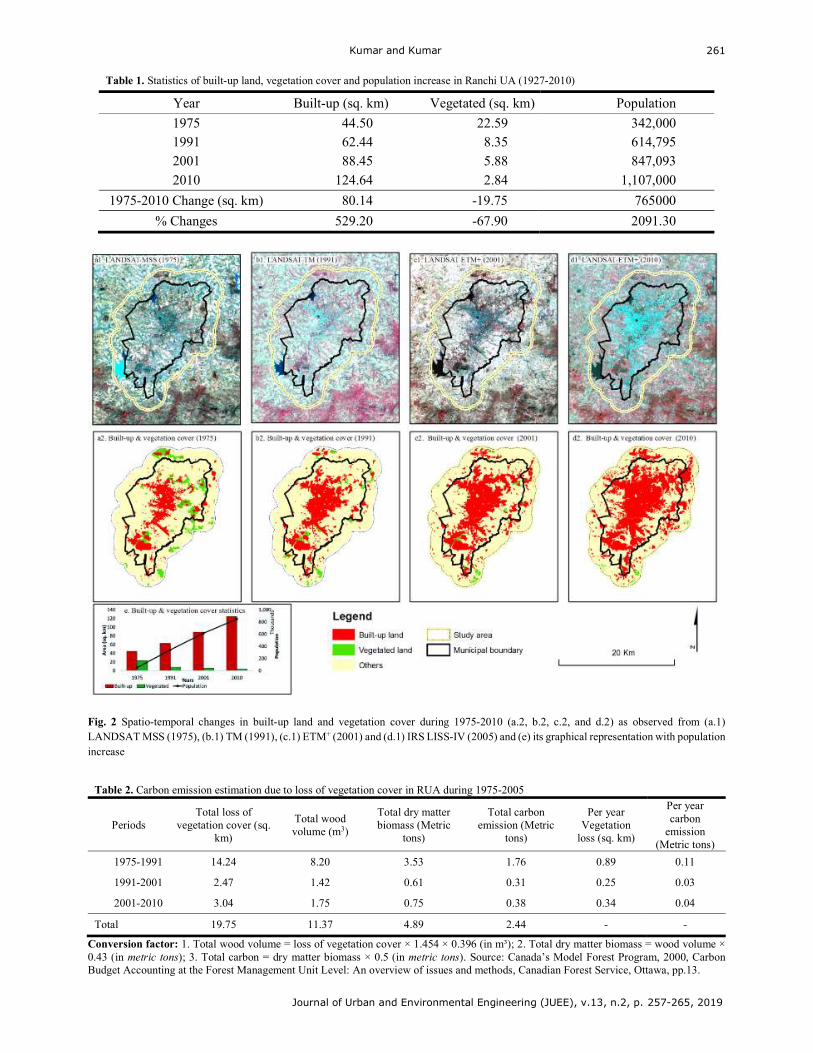
Satellite based observations exhibited that built-up land in RUA increased from 44.5 sq. km to 124.64 sq. km during 1975-2010 at the cost of arable land, vegetation land and water bodies. In these periods, 60.12 sq. km area under arable land and 19.75 sq. km area under vegetation cover irreversibly lost, while 2.83 sq. km area under water body was converted to non-water body in the process of haphazard and rapid urban expansion in and around Ranchi city (Table 1 and Figure 2). The estimates of carbon stock (terrestrial carbon) represents that the vegetation cover reduced from 22.59 sq. km to 2.84 sq. km during 1975-2005. The total loss of 19.75 sq. km of vegetation cover induced2.44 metric tons of total carbon emission (Table 2).The periodic observation exhibits that the loss of vegetation covers from 22.59 sq. km to 8.25 sq. km (by 14.24 sq. km) during 1975-1991 and induced 1.76 metric tons of carbon emission, which is the maximum emission during the observation periods. In 1991-2001 periods, the vegetation cover reduced from 8.35 sq. km to 5.88 sq. km (by 2.47 sq. km) and induced 0.31 metric tons of carbon emission. Whereas in 2001-2010 periods, the vegetation cover further reduced from 5.88 sq. km to2.84 sq. km with a total loss of 3.04 sq. km, which induced 0.38 metric tons of carbon emission.
Kumar and Kumar
Journal of Urban and Environmental Engineering (JUEE), v.13, n.2, p. 257-265, 2019
261
Table 1. Statistics of built-up land, vegetation cover and population increase in Ranchi UA (1927-2010)
Year Built-up (sq. km) Vegetated (sq. km) Population
1975 44.50 22.59 342,000 1991 62.44 8.35 614,795 2001 88.45 5.88 847,093
2010 124.64 2.84 1,107,000
1975-2010 Change (sq. km) 80.14 -19.75 765000
% Changes 529.20 -67.90 2091.30
Fig. 2 Spatio-temporal changes in built-up land and vegetation cover during 1975-2010 (a.2, b.2, c.2, and d.2) as observed from (a.1) LANDSAT MSS (1975), (b.1) TM (1991), (c.1) ETM+ (2001) and (d.1) IRS LISS-IV (2005) and (e) its graphical representation with population increase
Table 2. Carbon emission estimation due to loss of vegetation cover in RUA during 1975-2005
Periods Total loss of
vegetation cover (sq. km)
Total wood volume (m3)
Total dry matter biomass (Metric
tons)
Total carbon emission (Metric
tons)
Per year Vegetation
loss (sq. km)
Per year carbon
emission (Metric tons)
1975-1991 14.24 8.20 3.53 1.76 0.89 0.11
1991-2001 2.47 1.42 0.61 0.31 0.25 0.03
2001-2010 3.04 1.75 0.75 0.38 0.34 0.04
Total 19.75 11.37 4.89 2.44 - -
Conversion factor: 1. Total wood volume = loss of vegetation cover × 1.454 × 0.396 (in m³); 2. Total dry matter biomass = wood volume × 0.43 (in metric tons); 3. Total carbon = dry matter biomass × 0.5 (in metric tons). Source: Canada’s Model Forest Program, 2000, Carbon Budget Accounting at the Forest Management Unit Level: An overview of issues and methods, Canadian Forest Service, Ottawa, pp.13.
Kumar and Kumar
Journal of Urban and Environmental Engineering (JUEE), v.13, n.2, p. 257-265, 2019
262
The per year loss of vegetation cover based per year carbon emission statistics exhibits the increased loss of vegetation cover (0.89 sq. km/ year) and high emission (0.11 metric tons/ year) during 1975-1991.Whereas the later period i.e., 1991-2001, observed significant reduction in loss of vegetation cover (0.25 sq. km/ year) and low carbon emission (0.03 metric tons). The period 2001-2010 observed insignificant increase in loss of vegetation cover (0.34 sq. km) and slight increase in carbon emission (0.04 metric tons) (table 2). Various studies attributed rapid and haphazard urban expansion more specifically widening of road, new road construction and built-up development as one the contributing factor for the loss of vegetation cover. The episodic change in vegetation cover is mainly attributed to the established economic and climatic significance of the city in the initial period of 1975-1991 and later saturation in rapid built-up expansion during 1991-2001. The change in the administrative significance of city as the state capital in the year 2000 induced large human migration as well as influenced major built-up development activity, which increased the loss of vegetation cover in the vicinity.
Vehicular based Carbon emission
Motor vehicles have increased many folds in Jharkhand after getting its recognition as 28th state of India. District Transport Office (DTO), Ranchi registered the maximum number of vehicles in the State during 2001-2002, which includes highest number of buses, cars, taxis, jeeps, two-wheelers and three wheelers. Transportation is the major source of pollution and responsible for a significant percentage of principles pollutants, such as Sulfur dioxide, Nitrogen oxides, volatile organic compounds, particulate matters, CO2, CO and Lead. Pollutants from automobiles come as a byproduct of fuel combustion process (exhaust) and from evaporation of the fuel itself, for which there is no specific strategy and/ or policy to deal with. Generally, diesel operated old vehicles usually emit more pollutants as compared to petrol operated
vehicles. Average emission of CO from the two wheelers varies from 0.04% to 0.10% whereas emissions from an individual car are generally low.
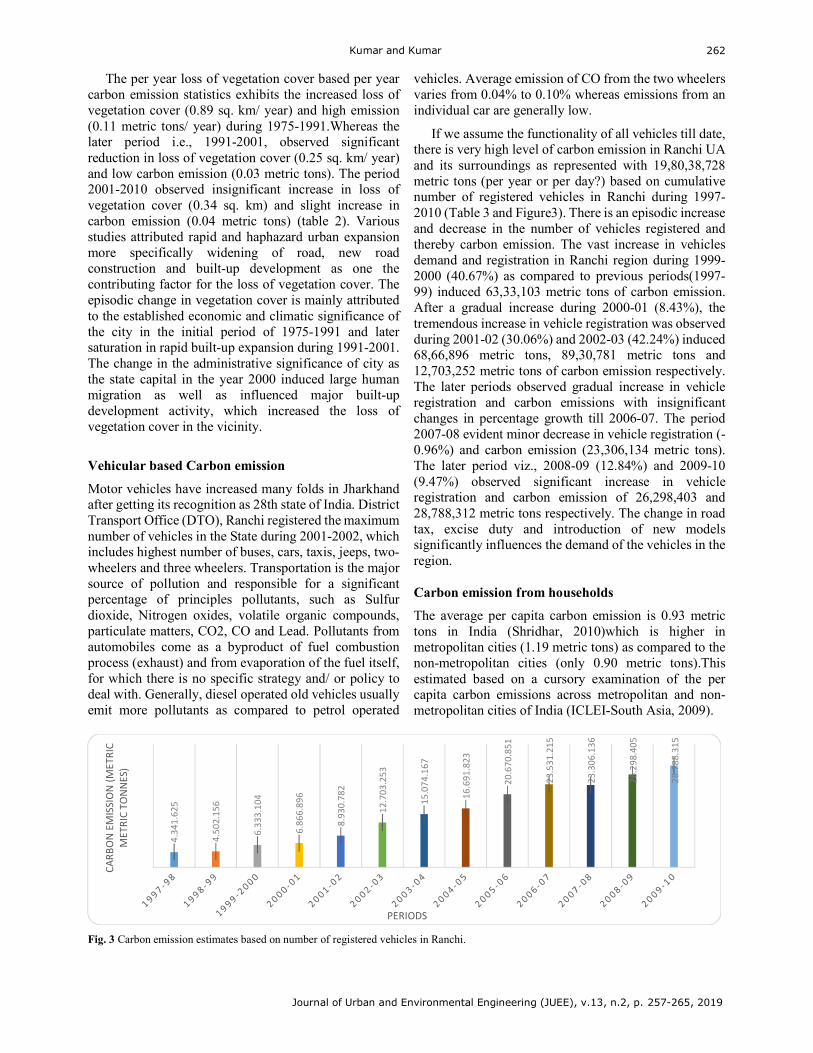
If we assume the functionality of all vehicles till date, there is very high level of carbon emission in Ranchi UA and its surroundings as represented with 19,80,38,728 metric tons (per year or per day?) based on cumulative number of registered vehicles in Ranchi during 1997-2010 (Table 3 and Figure3). There is an episodic increase and decrease in the number of vehicles registered and thereby carbon emission. The vast increase in vehicles demand and registration in Ranchi region during 1999-2000 (40.67%) as compared to previous periods(1997-99) induced 63,33,103 metric tons of carbon emission. After a gradual increase during 2000-01 (8.43%), the tremendous increase in vehicle registration was observed during 2001-02 (30.06%) and 2002-03 (42.24%) induced 68,66,896 metric tons, 89,30,781 metric tons and 12,703,252 metric tons of carbon emission respectively. The later periods observed gradual increase in vehicle registration and carbon emissions with insignificant changes in percentage growth till 2006-07. The period 2007-08 evident minor decrease in vehicle registration (-0.96%) and carbon emission (23,306,134 metric tons). The later period viz., 2008-09 (12.84%) and 2009-10 (9.47%) observed significant increase in vehicle registration and carbon emission of 26,298,403 and 28,788,312 metric tons respectively. The change in road tax, excise duty and introduction of new models significantly influences the demand of the vehicles in the region. Carbon emission from households
The average per capita carbon emission is 0.93 metric tons in India (Shridhar, 2010)which is higher in metropolitan cities (1.19 metric tons) as compared to the non-metropolitan cities (only 0.90 metric tons).This estimated based on a cursory examination of the per capita carbon emissions across metropolitan and non-metropolitan cities of India (ICLEI-South Asia, 2009).
Fig. 3 Carbon emission estimates based on number of registered vehicles in Ranchi.
4.34
1.62
5
4.50
2.15
6
6.33
3.10
4
6.86
6.89
6
8.93
0.78
2
12.7
03.2
53
15.0
74.1
67
16.6
91.8
23
20.6
70.8
51
23.5
31.2
15
23.3
06.1
36
26.2
98.4
05
28.7
88.3
15
CARB
ON
EM
ISSI
ON
(MET
RIC
MET
RIC
TON
NES
)
PERIODS
Pattanayak and Pattanayak
Journal of Urban and Environmental Engineering (JUEE), v.13, n.2, p. 257-265, 2019
263
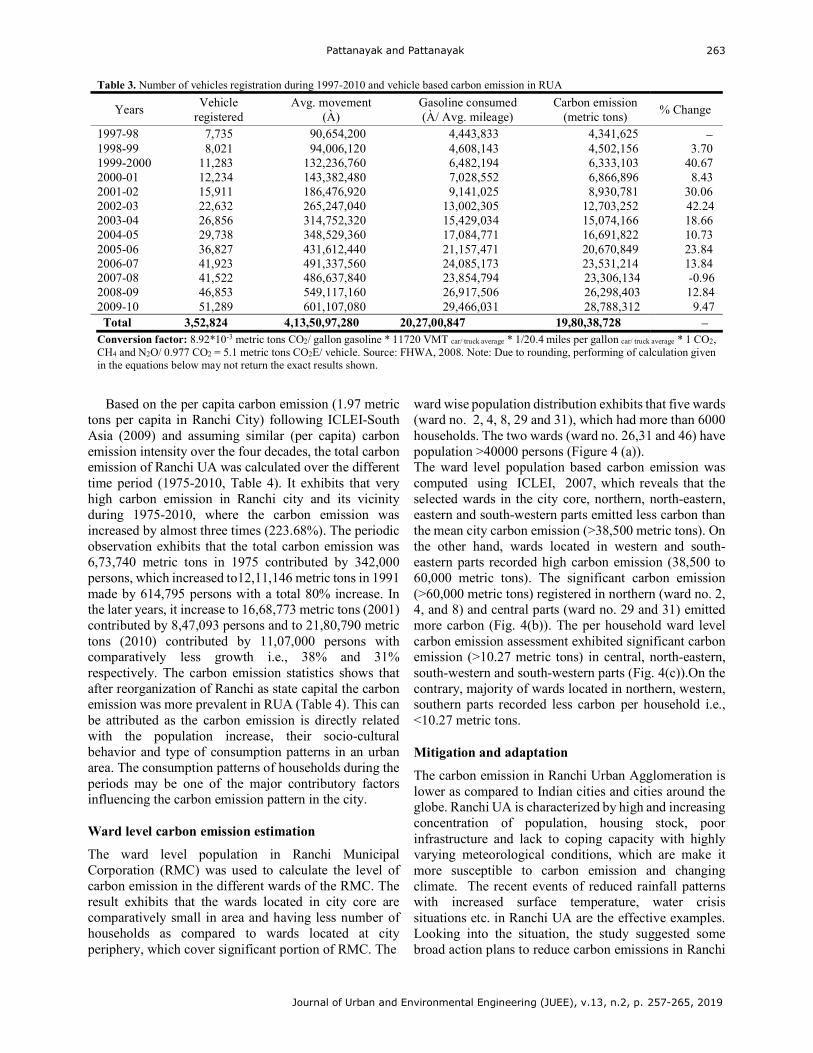
Table 3. Number of vehicles registration during 1997-2010 and vehicle based carbon emission in RUA
Years Vehicle
registered Avg. movement
(À) Gasoline consumed (À/ Avg. mileage)
Carbon emission (metric tons)
% Change
1997-98 7,735 90,654,200 4,443,833 4,341,625 1998-99 8,021 94,006,120 4,608,143 4,502,156 3.70 1999-2000 11,283 132,236,760 6,482,194 6,333,103 40.67 2000-01 12,234 143,382,480 7,028,552 6,866,896 8.43 2001-02 15,911 186,476,920 9,141,025 8,930,781 30.06 2002-03 22,632 265,247,040 13,002,305 12,703,252 42.24 2003-04 26,856 314,752,320 15,429,034 15,074,166 18.66 2004-05 29,738 348,529,360 17,084,771 16,691,822 10.73 2005-06 36,827 431,612,440 21,157,471 20,670,849 23.84 2006-07 41,923 491,337,560 24,085,173 23,531,214 13.84 2007-08 41,522 486,637,840 23,854,794 23,306,134 -0.96 2008-09 46,853 549,117,160 26,917,506 26,298,403 12.84 2009-10 51,289 601,107,080 29,466,031 28,788,312 9.47 Total 3,52,824 4,13,50,97,280 20,27,00,847 19,80,38,728
Conversion factor: 8.92*10-3 metric tons CO2/ gallon gasoline * 11720 VMT car/ truck average * 1/20.4 miles per gallon car/ truck average * 1 CO2, CH4 and N2O/ 0.977 CO2 = 5.1 metric tons CO2E/ vehicle. Source: FHWA, 2008. Note: Due to rounding, performing of calculation given in the equations below may not return the exact results shown.
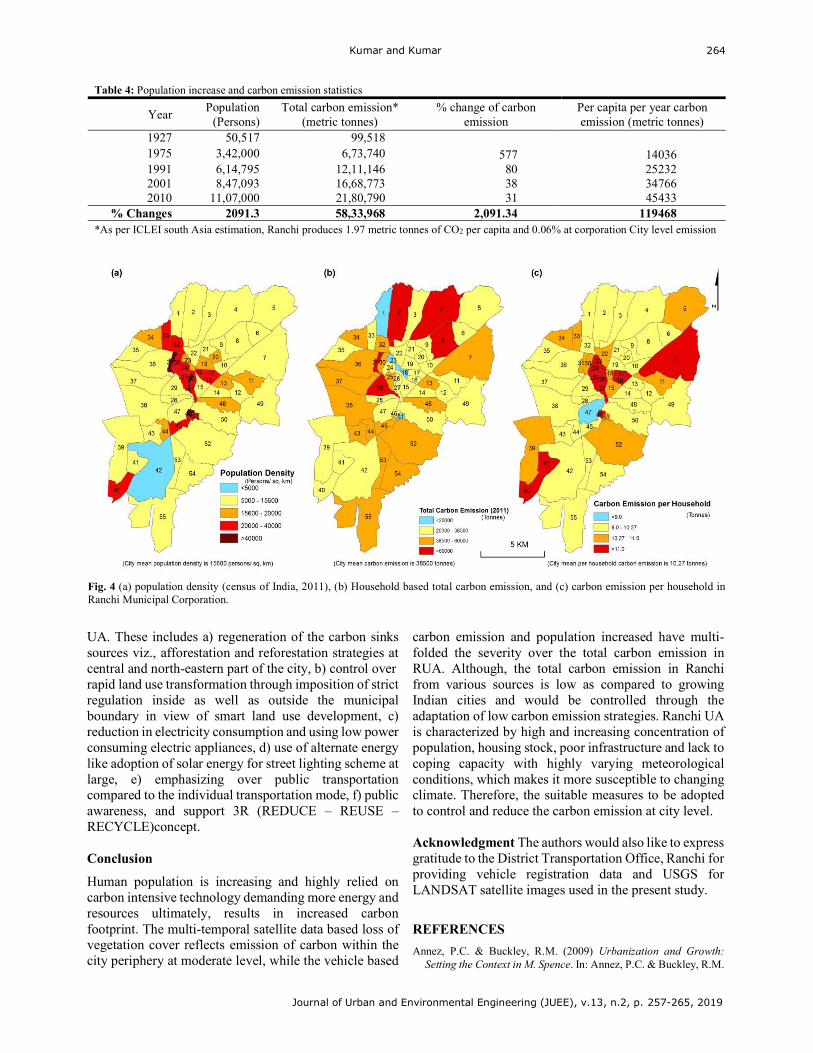
Based on the per capita carbon emission (1.97 metric tons per capita in Ranchi City) following ICLEI-South Asia (2009) and assuming similar (per capita) carbon emission intensity over the four decades, the total carbon emission of Ranchi UA was calculated over the different time period (1975-2010, Table 4). It exhibits that very high carbon emission in Ranchi city and its vicinity during 1975-2010, where the carbon emission was increased by almost three times (223.68%). The periodic observation exhibits that the total carbon emission was 6,73,740 metric tons in 1975 contributed by 342,000 persons, which increased to12,11,146 metric tons in 1991 made by 614,795 persons with a total 80% increase. In the later years, it increase to 16,68,773 metric tons (2001) contributed by 8,47,093 persons and to 21,80,790 metric tons (2010) contributed by 11,07,000 persons with comparatively less growth i.e., 38% and 31% respectively. The carbon emission statistics shows that after reorganization of Ranchi as state capital the carbon emission was more prevalent in RUA (Table 4). This can be attributed as the carbon emission is directly related with the population increase, their socio-cultural behavior and type of consumption patterns in an urban area. The consumption patterns of households during the periods may be one of the major contributory factors influencing the carbon emission pattern in the city.
Ward level carbon emission estimation
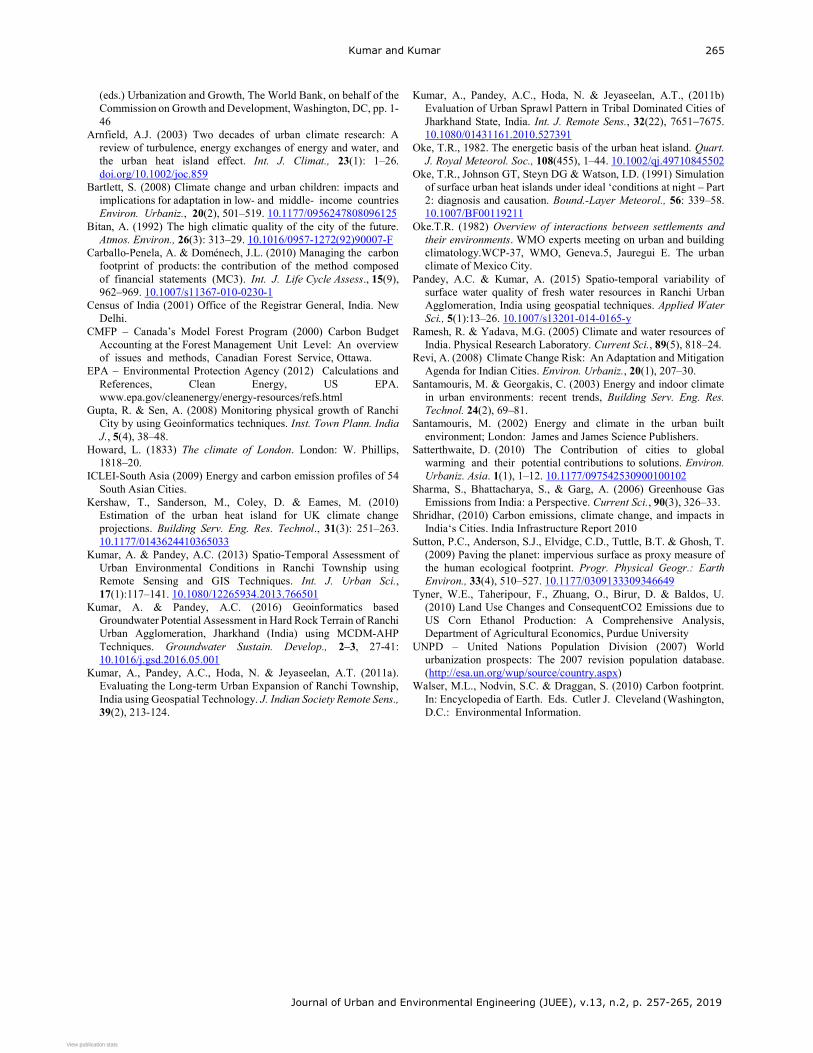
The ward level population in Ranchi Municipal Corporation (RMC) was used to calculate the level of carbon emission in the different wards of the RMC. The result exhibits that the wards located in city core are comparatively small in area and having less number of households as compared to wards located at city periphery, which cover significant portion of RMC. The
ward wise population distribution exhibits that five wards (ward no. 2, 4, 8, 29 and 31), which had more than 6000 households. The two wards (ward no. 26,31 and 46) have population >40000 persons (Figure 4 (a)). The ward level population based carbon emission was computed using ICLEI, 2007, which reveals that the selected wards in the city core, northern, north-eastern, eastern and south-western parts emitted less carbon than the mean city carbon emission (>38,500 metric tons). On the other hand, wards located in western and south- eastern parts recorded high carbon emission (38,500 to 60,000 metric tons). The significant carbon emission (>60,000 metric tons) registered in northern (ward no. 2, 4, and 8) and central parts (ward no. 29 and 31) emitted more carbon (Fig. 4(b)). The per household ward level carbon emission assessment exhibited significant carbon emission (>10.27 metric tons) in central, north-eastern, south-western and south-western parts (Fig. 4(c)).On the contrary, majority of wards located in northern, western, southern parts recorded less carbon per household i.e., <10.27 metric tons.
Mitigation and adaptation
The carbon emission in Ranchi Urban Agglomeration is lower as compared to Indian cities and cities around the globe. Ranchi UA is characterized by high and increasing concentration of population, housing stock, poor infrastructure and lack to coping capacity with highly varying meteorological conditions, which are make it more susceptible to carbon emission and changing climate. The recent events of reduced rainfall patterns with increased surface temperature, water crisis situations etc. in Ranchi UA are the effective examples. Looking into the situation, the study suggested some broad action plans to reduce carbon emissions in Ranchi
Kumar and Kumar
Journal of Urban and Environmental Engineering (JUEE), v.13, n.2, p. 257-265, 2019
264
Table 4: Population increase and carbon emission statistics
Year Population
(Persons) Total carbon emission*
(metric tonnes) % change of carbon
emission Per capita per year carbon emission (metric tonnes)
1927 50,517 99,518 1975 3,42,000 6,73,740 577 14036 1991 6,14,795 12,11,146 80 25232 2001 8,47,093 16,68,773 38 34766 2010 11,07,000 21,80,790 31 45433
% Changes 2091.3 58,33,968 2,091.34 119468 *As per ICLEI south Asia estimation, Ranchi produces 1.97 metric tonnes of CO2 per capita and 0.06% at corporation City level emission
Fig. 4 (a) population density (census of India, 2011), (b) Household based total carbon emission, and (c) carbon emission per household in Ranchi Municipal Corporation.
UA. These includes a) regeneration of the carbon sinks sources viz., afforestation and reforestation strategies at central and north-eastern part of the city, b) control over rapid land use transformation through imposition of strict regulation inside as well as outside the municipal boundary in view of smart land use development, c) reduction in electricity consumption and using low power consuming electric appliances, d) use of alternate energy like adoption of solar energy for street lighting scheme at large, e) emphasizing over public transportation compared to the individual transportation mode, f) public awareness, and support 3R (REDUCE – REUSE – RECYCLE)concept. Conclusion
Human population is increasing and highly relied on carbon intensive technology demanding more energy and resources ultimately, results in increased carbon footprint. The multi-temporal satellite data based loss of vegetation cover reflects emission of carbon within the city periphery at moderate level, while the vehicle based
carbon emission and population increased have multi-folded the severity over the total carbon emission in RUA. Although, the total carbon emission in Ranchi from various sources is low as compared to growing Indian cities and would be controlled through the adaptation of low carbon emission strategies. Ranchi UA is characterized by high and increasing concentration of population, housing stock, poor infrastructure and lack to coping capacity with highly varying meteorological conditions, which makes it more susceptible to changing climate. Therefore, the suitable measures to be adopted to control and reduce the carbon emission at city level. Acknowledgment The authors would also like to express gratitude to the District Transportation Office, Ranchi for providing vehicle registration data and USGS for LANDSAT satellite images used in the present study.
REFERENCES
Annez, P.C. & Buckley, R.M. (2009) Urbanization and Growth: Setting the Context in M. Spence. In: Annez, P.C. & Buckley, R.M.
Kumar and Kumar
Journal of Urban and Environmental Engineering (JUEE), v.13, n.2, p. 257-265, 2019
265
(eds.) Urbanization and Growth, The World Bank, on behalf of the Commission on Growth and Development, Washington, DC, pp. 1-46
Arnfield, A.J. (2003) Two decades of urban climate research: A review of turbulence, energy exchanges of energy and water, and the urban heat island effect. Int. J. Climat., 23(1): 1–26. doi.org/10.1002/joc.859
Bartlett, S. (2008) Climate change and urban children: impacts and implications for adaptation in low- and middle- income countries Environ. Urbaniz., 20(2), 501–519. 10.1177/0956247808096125
Bitan, A. (1992) The high climatic quality of the city of the future. Atmos. Environ., 26(3): 313–29. 10.1016/0957-1272(92)90007-F
Carballo-Penela, A. & Doménech, J.L. (2010) Managing the carbon footprint of products: the contribution of the method composed of financial statements (MC3). Int. J. Life Cycle Assess., 15(9), 962–969. 10.1007/s11367-010-0230-1
Census of India (2001) Office of the Registrar General, India. New Delhi.
CMFP Canada’s Model Forest Program (2000) Carbon Budget Accounting at the Forest Management Unit Level: An overview of issues and methods, Canadian Forest Service, Ottawa.
EPA Environmental Protection Agency (2012) Calculations and References, Clean Energy, US EPA. www.epa.gov/cleanenergy/energy-resources/refs.html
Gupta, R. & Sen, A. (2008) Monitoring physical growth of Ranchi City by using Geoinformatics techniques. Inst. Town Plann. India J., 5(4), 38–48.
Howard, L. (1833) The climate of London. London: W. Phillips, 1818–20.
ICLEI-South Asia (2009) Energy and carbon emission profiles of 54 South Asian Cities.
Kershaw, T., Sanderson, M., Coley, D. & Eames, M. (2010) Estimation of the urban heat island for UK climate change projections. Building Serv. Eng. Res. Technol., 31(3): 251–263. 10.1177/0143624410365033
Kumar, A. & Pandey, A.C. (2013) Spatio-Temporal Assessment of Urban Environmental Conditions in Ranchi Township using Remote Sensing and GIS Techniques. Int. J. Urban Sci., 17(1):117–141. 10.1080/12265934.2013.766501
Kumar, A. & Pandey, A.C. (2016) Geoinformatics based Groundwater Potential Assessment in Hard Rock Terrain of Ranchi Urban Agglomeration, Jharkhand (India) using MCDM-AHP Techniques. Groundwater Sustain. Develop., 2–3, 27-41: 10.1016/j.gsd.2016.05.001
Kumar, A., Pandey, A.C., Hoda, N. & Jeyaseelan, A.T. (2011a). Evaluating the Long-term Urban Expansion of Ranchi Township, India using Geospatial Technology. J. Indian Society Remote Sens., 39(2), 213-124.
Kumar, A., Pandey, A.C., Hoda, N. & Jeyaseelan, A.T., (2011b) Evaluation of Urban Sprawl Pattern in Tribal Dominated Cities of Jharkhand State, India. Int. J. Remote Sens., 32(22), 76517675. 10.1080/01431161.2010.527391
Oke, T.R., 1982. The energetic basis of the urban heat island. Quart. J. Royal Meteorol. Soc., 108(455), 1–44. 10.1002/qj.49710845502
Oke, T.R., Johnson GT, Steyn DG & Watson, I.D. (1991) Simulation of surface urban heat islands under ideal ‘conditions at night – Part 2: diagnosis and causation. Bound.-Layer Meteorol., 56: 339–58. 10.1007/BF00119211
Oke.T.R. (1982) Overview of interactions between settlements and their environments. WMO experts meeting on urban and building climatology.WCP-37, WMO, Geneva.5, Jauregui E. The urban climate of Mexico City.
Pandey, A.C. & Kumar, A. (2015) Spatio-temporal variability of surface water quality of fresh water resources in Ranchi Urban Agglomeration, India using geospatial techniques. Applied Water Sci., 5(1):13–26. 10.1007/s13201-014-0165-y
Ramesh, R. & Yadava, M.G. (2005) Climate and water resources of India. Physical Research Laboratory. Current Sci., 89(5), 818–24.
Revi, A. (2008) Climate Change Risk: An Adaptation and Mitigation Agenda for Indian Cities. Environ. Urbaniz., 20(1), 207–30.
Santamouris, M. & Georgakis, C. (2003) Energy and indoor climate in urban environments: recent trends, Building Serv. Eng. Res. Technol. 24(2), 69–81.
Santamouris, M. (2002) Energy and climate in the urban built environment; London: James and James Science Publishers.
Satterthwaite, D. (2010) The Contribution of cities to global warming and their potential contributions to solutions. Environ. Urbaniz. Asia. 1(1), 1–12. 10.1177/097542530900100102
Sharma, S., Bhattacharya, S., & Garg, A. (2006) Greenhouse Gas Emissions from India: a Perspective. Current Sci., 90(3), 326–33.
Shridhar, (2010) Carbon emissions, climate change, and impacts in India‘s Cities. India Infrastructure Report 2010
Sutton, P.C., Anderson, S.J., Elvidge, C.D., Tuttle, B.T. & Ghosh, T. (2009) Paving the planet: impervious surface as proxy measure of the human ecological footprint. Progr. Physical Geogr.: Earth Environ., 33(4), 510–527. 10.1177/0309133309346649
Tyner, W.E., Taheripour, F., Zhuang, O., Birur, D. & Baldos, U. (2010) Land Use Changes and ConsequentCO2 Emissions due to US Corn Ethanol Production: A Comprehensive Analysis, Department of Agricultural Economics, Purdue University
UNPD – United Nations Population Division (2007) World urbanization prospects: The 2007 revision population database. (http://esa.un.org/wup/source/country.aspx)
Walser, M.L., Nodvin, S.C. & Draggan, S. (2010) Carbon footprint. In: Encyclopedia of Earth. Eds. Cutler J. Cleveland (Washington, D.C.: Environmental Information.
View publication statsView publication stats
Related Documents