Assessing equitable and efficient solutions to reduce hospital demand Strategic Health Research Program (SHRP) SA Health 2007-08 SHRP Round FINAL REPORT October 2011

Welcome message from author
This document is posted to help you gain knowledge. Please leave a comment to let me know what you think about it! Share it to your friends and learn new things together.
Transcript
Assessing equitable and efficient solutions to reduce
hospital demand
Strategic Health Research Program (SHRP)
SA Health
2007-08 SHRP Round
FINAL REPORT
October 2011

Research Team:
Ms Clarabelle Pham
Ms Orla Caffrey
Professor Jonathan Karnon
Professor David Ben-Tovim
Mr Paul Hakendorf
Professor Maria Crotty
Dr Jason Gordon
Mr Andrew Partington
Policy Advisors:
Mr Kym Piper
Mr Paul Basso
Ms Shelley Horne
Correspondence:
Professor Jonathan Karnon
Discipline of Public Health
School of Population Health and Clinical Practice
The University of Adelaide
Mail Drop DX 650 550
Adelaide SA 5005
AUSTRALIA
Email: [email protected]
CONTENTS
Main messages .................................................................................................................................................... i
Executive summary............................................................................................................................................. ii
Full report .......................................................................................................................................................... 1
1 Background ............................................................................................................................................ 1
2 Methods ................................................................................................................................................ 2
2.1 Data linkage ................................................................................................................................... 2
2.2 Areas for investigation ................................................................................................................... 4
2.3 Risk adjusted cost-effectiveness (RAC-E) analyses ........................................................................ 8
2.4 Investigation of potential determinants of differences in costs and benefits ............................ 11
3 Applications of RAC-E analyses ............................................................................................................ 12
3.1 Stroke ........................................................................................................................................... 12
3.2 Chest pain .................................................................................................................................... 15
3.3 Hip fracture .................................................................................................................................. 18
3.4 Amputation .................................................................................................................................. 20
3.5 Further RAC-E related applications ............................................................................................. 21
3.6 Methods to investigate potential determinants of variation in RAC-E ....................................... 25
4 Further research and conclusions ....................................................................................................... 26
5 Additional resources ............................................................................................................................ 28
6 References ........................................................................................................................................... 30
Appendix 1 ....................................................................................................................................................... 31
Appendix 2 ....................................................................................................................................................... 32
Assessing equitable and efficient solutions to reduce hospital demand
Page | i
MAIN MESSAGES
Background
Despite the development of evidence-based clinical guidelines for a wide range of clinical
conditions, there is significant variation in clinical practice across alternative hospitals.
The aim of this study was to develop a generic method that uses routinely collected data to
compare the costs and benefits of alternative forms of clinical practice.
The developed method is labelled risk adjusted cost-effectiveness (RAC-E), referring to the need to
adjust for differences in casemix (i.e. risk of high costs and/or bad outcomes).
Methods
A dataset was assembled that comprised linked, routinely collected hospital separations data, area
level socioeconomic data, and mortality data. The dataset grouped hospital separations and date of
death (where applicable) for individual patients, which inform event pathways.
Priority areas for investigation were specified based on evidence suggestive of variation in practice.
RAC-E involves the estimation of long-term costs and survival for individual patients, which is
compared to expected costs and survival to generate net costs and survival. Mean net costs and
survival are compared across groups (e.g. hospitals) to identify cost-effective clinical practice.
RAC-E was analysed in the clinical areas of stroke, chest pain, and hip fracture for the year to July
2006, as well as for two community-based programs and a preoperative clinic for high risk patients.
Results
Significant differences in RAC-E were identified across the four main public hospitals in SA:
- For stroke, two hospitals had higher net costs and lower net survival than at least one other (i.e.
these hospitals were dominated). Of the other hospitals, if all patients were to be treated at the
more effective hospital, additional life years could be gained at a cost of $16,068 per life year.
- For patients presenting with chest pain, two hospitals were dominated, and the more effective
hospital gained additional life years at an incremental cost of $2,909.
- For hip fracture, two hospitals were dominated, and the more effective hospital had a mean
incremental cost per life year gained of $31,243.
Preliminary analyses to identify specific areas of variation in clinical practice were undertaken using
the technique of process mining, and some potentially important differences in clinical practice for
patients presenting with chest pain were identified.
Conclusions
RAC-E provides an empirical basis for defining cost-effective clinical practice, which can be applied
across wide areas of clinical practice at relatively low cost.
Further refinement of the RAC-E methodology is required (and ongoing), but the existing
methodology generates robust estimates of the consequences of variation in clinical practice,
which in combination with pathway methods, provides a powerful research tool to inform and
encourage the adoption of cost-effective clinical practice.
To facilitate the routine use of RAC-E to improve policy and practice, easier access to more detailed
and more contemporary data would be of great value.
Assessing equitable and efficient solutions to reduce hospital demand
Page | ii
EXECUTIVE SUMMARY
Despite the development of evidence-based clinical guidelines for a wide range of clinical conditions, there
is significant variation in clinical practice across alternative hospitals (Board & Watson 2010). A robust
methodology using linked, routinely collected data (including registry data, where available) to analyse the
relative costs and benefits of clinical practice at different hospitals would enable the identification of best
clinical practice across a wide range of diagnostic areas. Such cost-effectiveness data, in combination with
additional analyses of process (using mainly routinely collected data), is hypothesised to provide strong
incentives to underperformers to improve. This will lead to the more efficient use of scarce hospital
resources, meaning more health benefits will be derived from current health care budgets. In some cases,
separation costs per patient will be reduced, thus reducing hospital demand and enabling hospitals to treat
more patients more quickly with existing budgets.
The aim of this study was to develop and apply a robust methodology using routinely collected data to
analyse the relative costs and benefits of clinical practice at alternative hospitals, across a wide range of
diagnostic areas.
Data
Routinely collected data was obtained and linked from the following sources:
Hospital separation data:
4,072,341 records from the Integrated South Australian Activity Collection (ISAAC), describing patient
and admission characteristics, for all public and private hospital separations in South Australia (SA) from
2001 to 2008.
Socioeconomic data:
Area (postcode) level variables describing socioeconomic areas, socioeconomic disadvantage, economic
resources, and education and occupation.
Costing data:
1,530,634 separation-specific cost estimates at the four largest hospitals in SA from 2003 to 2008.
All-cause mortality data:
92,288 deaths from the Register for Births, Deaths, and Marriages between 2001 and 2008.
The resulting dataset grouped hospital separations and date of death (where applicable) for individual
patients, which inform event pathways.
Identifying priority areas for investigation
Using the data described above, a process was developed to prioritise conditions for investigation. The
criterion for further investigation was specified as evidence suggestive of variation in practice. Analysis of
changes in activity and costs over time, as well as comparisons of mean separation costs across the four key
public hospitals were undertaken, and individual meetings with a range of clinical experts assisted with the
interpretation of analyses.
Stroke and chest pain were selected for the first applications of the RAC-E framework, as both patient
cohorts had large increases in admission rates over the observation period, especially for chest pain (+75%).
The total costs expended on the two patient groups were significant, and the mean costs of the most costly
hospitals were approximately double the costs of the least costly hospitals for both conditions.
Assessing equitable and efficient solutions to reduce hospital demand
Page | iii
The following eight key conditions were also selected for further analysis: hip replacement, transient
ischaemic attack, headache, lens procedures sameday, chronic obstructive airways disease, implantable
cardioverter defribillator, cardiac pacemaker, and percutaneous coronary intervention.
Risk adjusted cost-effectiveness (RAC-E)
The framework for the comparative analysis of the costs and benefits of clinical practice was labelled risk
adjusted cost-effectiveness (RAC-E), highlighting the need to adjust for differences in the casemix of
patients treated at different hospitals (i.e. risk of high costs and/or bad outcomes).
Using the chest pain case study to illustrate, the analytic framework is summarised as the following six
stage process:
1. A cohort of eligible patients is defined as all patients with a principal diagnosis of chest pain who
were admitted to any of the four main public hospitals in SA within a defined time period.
2. A set of intermediate outcomes is defined (e.g. cardiac-related readmission, death, or no related
event). Using the linked data for the eligible patient cohort, each patient is assigned to one of the
intermediate outcomes over a defined (retrospective) observation period (e.g. 2 years from the
admission date for the chest pain separation).
3. Using the full set of linked data for all chest pain patients, separate regression models are
developed to predict future costs and mortality on the basis of relevant patient characteristics (e.g.
age, co-morbidities, socioeconomic status) and the intermediate endpoints.
4. Combining the observed and predicted data, each patient is assigned a predicted lifetime cost and a
survival (life years gained) estimate.
5. Using the lifetime cost and survival estimates for the eligible patient cohort, separate regression
models are developed to derive expected lifetime costs and survival on the basis of relevant patient
characteristics at the time of the initial chest pain admission (e.g. age, co-morbidities,
socioeconomic status).
6. Each eligible patient is assigned a net cost and a net benefit value, estimated as predicted minus
expected lifetime costs and survival, respectively. The net costs and benefits are summed across all
eligible patients at each of the four hospitals to calculate the mean net costs and benefits at each
hospital. The mean net costs and benefits are compared across the hospitals to identify the hospital
with the most cost-effective practice.
RAC-E applications
Results of applied RAC-E analyses in the clinical areas of stroke, chest pain, and hip fracture are reported
below. The main report describes further RAC-E analyses of two community-based programs, a
preoperative clinic for high risk patients, and clinical practice for amputation.
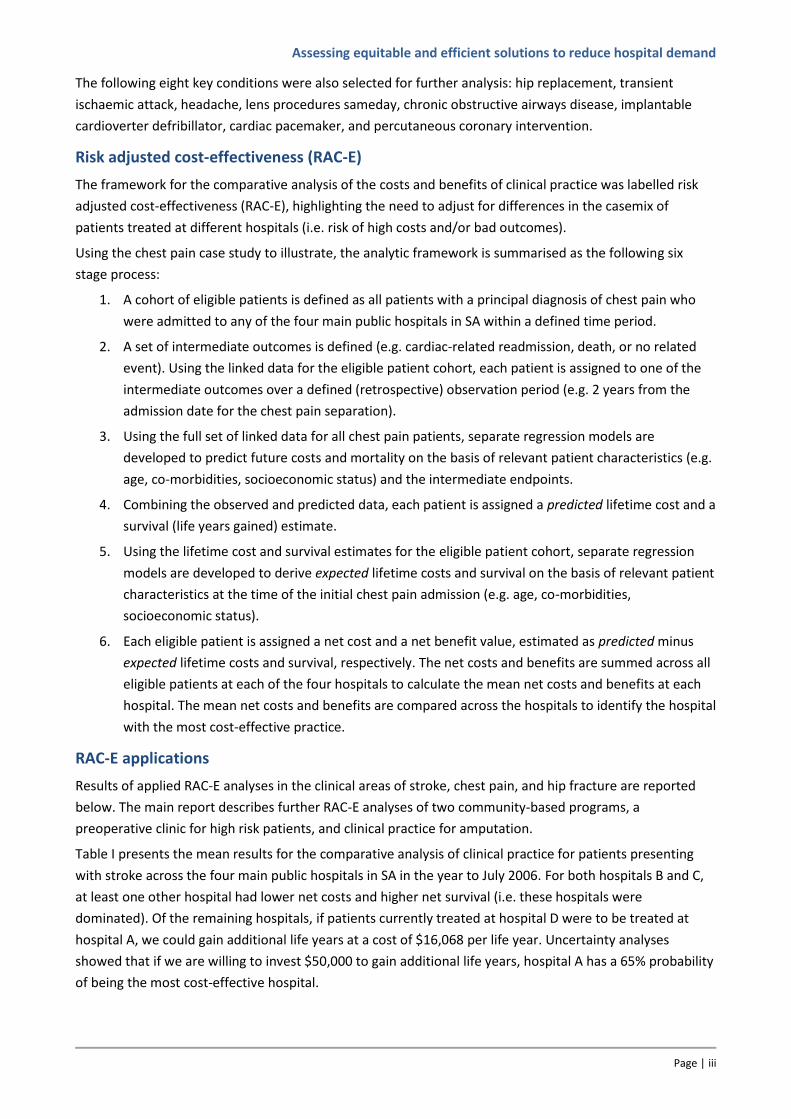
Table I presents the mean results for the comparative analysis of clinical practice for patients presenting
with stroke across the four main public hospitals in SA in the year to July 2006. For both hospitals B and C,
at least one other hospital had lower net costs and higher net survival (i.e. these hospitals were
dominated). Of the remaining hospitals, if patients currently treated at hospital D were to be treated at
hospital A, we could gain additional life years at a cost of $16,068 per life year. Uncertainty analyses
showed that if we are willing to invest $50,000 to gain additional life years, hospital A has a 65% probability
of being the most cost-effective hospital.
Assessing equitable and efficient solutions to reduce hospital demand
Page | iv
Table I. Risk adjusted cost-effectiveness (RAC-E) results for patients presenting with Stroke
Hospital Unadjusted separation costs
Net lifetime costs per patient
Net life years gained per patient
Notes
B $ 12,762 $ 179 -0.24 Dominated by hospital D
C $ 11,479 $ 1,412 -0.18 Dominated by hospitals A & D
D $ 6,329 -$ 4,698 0.05
A $ 10,771 $ 335 0.36
Cost difference LYs difference Incremental cost per LY gained
A vs D $ 5,033 0.31 $ 16,068
For patients presenting with chest pain, hospitals 3 and 4 were dominated, and hospital 1 gained additional
life years at an incremental cost of $2,909 compared to hospital 2. At a value of $25,000 per life year
gained, hospital 1 has a 99% probability of being the most cost-effective hospital.
For hip fracture, hospitals B and D were dominated. Hospital A had a mean incremental cost per life year
gained of $31,243 relative to hospital C. At a life year value of $50,000, hospital A had the largest expected
net benefits and a 35% probability of being the most cost-effective hospital.
Investigating determinants of variation in RAC-E
Preliminary analyses to identify specific areas of variation in clinical practice were undertaken. In chest
pain, for example, the hypothesis was generated that cost-effective clinical practice involved more nursing
time and medical intervention, with less test ordering.
More detailed analyses of process are required, and so ongoing research is investigating alternative
approaches to the comparative analysis of clinical practice. As with the application of RAC-E, the underlying
objective is to facilitate widespread application across multiple hospitals, without the need for the
collection of large amounts of additional data. Preliminary analyses using the technique of process mining
have identified some potentially important differences in clinical practice as applied to patients presenting
with chest pain.
Conclusions
The significance of the developed RAC-E methodology is that it provides an empirical basis for defining cost-
effective clinical practice (practice-based evidence). The use of routinely collected data means that RAC-E
can be applied across wide areas of clinical practice at relatively low cost.
Further refinement of the RAC-E methodology is required (and ongoing). In particular, further exploration
and application of process mining is required to define optimal, and preferably standardised, approaches to
the validation of evidence of variation in RAC-E.
However, the existing methodology generates robust estimates of the consequences of variation in clinical
practice (i.e. differences in costs and outcomes), which in combination with pathway methods, such as
process mining (to identify specific areas of variation) provides a powerful research tool to inform and
encourage the adoption of cost-effective clinical practice.
To facilitate the routine use of RAC-E to improve policy and practice, easier access to more detailed and
more contemporary data for both RAC-E analyses and process mining would be of great value.
Assessing equitable and efficient solutions to reduce hospital demand
Page | 1
FULL REPORT
1 BACKGROUND
Clinical practice involves the delivery of individual technologies used in the diagnosis, acute treatment,
rehabilitation, and/or long-term care of patients. Despite published guidelines in many clinical areas, there
is evidence of significant variation in clinical practice at alternative institutions (e.g. hospitals), as reflected
in a recent supplement of the Medical Journal of Australia (Board & Watson 2010).
To date, analyses of clinical practice have focused on frontier efficiency measurement of hospital
performance at an aggregate hospital level, and with relatively crude approaches to incorporating health
outcomes (Agency for Healthcare Research Quality 2008; Hollingsworth 2008).
Recognition of the potential value of linked routinely collected data as an asset to research has been
growing over the last decade (House of Lords 2001), but recent developments appear to herald a new era
in the availability and access to such data. In Australia, the Population Health Research Network has
received over Aus$60 million from Federal and State governments to establish linked access to de-
identified data from a wide range of health datasets. In the UK, as part of the Research Capacity
Programme, a pilot Health Research Support Service was due to begin providing widespread access to
linked patient data in Autumn 2010.
The increasing availability of linked routinely collected data provides a valuable data source that will no
doubt lead to improvements in frontier efficiency methods, which could certainly be applied at a condition
level to support the identification of best practice. However, it is not certain whether they are needed in
this context. By defining best practice as cost-effective practice, it seems apparent that such judgments
should be made on the same basis as judgements of the cost-effectiveness of new health technologies, and
that there is already a highly developed set of analytic tools available for that purpose.
A robust methodology using linked, routinely collected data (including registry data, where available) to
analyse the relative costs and benefits of clinical practice at different hospitals would enable the
identification of best clinical practice across a wide range of diagnostic areas. Such cost-effectiveness data,
in combination with additional analyses of process (using mainly routinely collected data), is hypothesised
to provide strong incentives for underperformers to improve. This will lead to the more efficient use of
scarce hospital resources, meaning more health benefits will be derived from current health care budgets.
In some cases, separation costs per patient will be reduced, thus reducing hospital demand and enabling
hospitals to treat more patients more quickly with existing budgets.
In other cases, some additional upfront resources may be required at particular hospitals to support the
improved use of existing technologies. In these cases, cost-effectiveness analyses of clinical practice will
inform the value of allocating resources to facilitate improvement in clinical practice relative to the value of
investments in new technologies.
This report describes the development and application of a general methodology using linked, routinely
collected data to analyse the risk adjusted cost-effectiveness (RAC-E) of clinical practice for specific
diagnostic areas at different hospitals. RAC-E provides a means of extrapolating costs and outcomes to
ensure all important differences are captured, whilst controlling for variation in relevant risk factors to
ensure that one hospital does not appear superior to another simply on the basis of their treating subjects
with differing casemix. As part of the RAC-E framework, we recognise the need to combine analyses of cost-
effectiveness with comparative analyses of process, and preliminary work is also reported around the
Assessing equitable and efficient solutions to reduce hospital demand
Page | 2
development of methods using routinely collected data to compare processes. Following a description of
the RAC-E methods, three case studies comparing different areas of clinical practice at the four main public
hospitals in South Australia are presented to illustrate the methodology.
2 METHODS
The following sections describe the components of the RAC-E analysis, including the data, the analytic
structure, the component regression models, and the final analyses undertaken to estimate the relative
cost-effectiveness of clinical practice at alternative hospitals and to represent the uncertainty around the
mean results. All analyses were undertaken using Stata, release 11.0 (StataCorp 2009).
2.1 DATA LINKAGE
Data sources
Routinely collected data was obtained and linked from the following sources:
Hospital separation data:
4,072,341 records from the Integrated South Australian Activity Collection (ISAAC), describing patient,
admission, and inpatient stay characteristics, including diagnosis related group (DRG), principal and
additional diagnoses, and procedure codes, for all hospital separations in SA from July 2001 to June
2008. For risk adjustment, co-morbidities were coded using the same performance indicators as defined
by Queensland Health in their application of the Variable Life Adjusted Display (VLAD) methodology
(Duckett et al. 2008), based on recorded principal and additional diagnoses in the year preceding the
index event.
Socioeconomic data:
Area (postcode) level variables describing socioeconomic areas, socioeconomic disadvantage, economic
resources, and education and occupation. Variables were created that represented the Indices as
continuous variables (scores), and as categorical variables (placing scores into deciles).
Costing data:
1,530,634 separation-specific cost estimates at the four largest hospitals in SA from July 2003 to June
2008, presented in 16 categories covering direct and indirect ward, surgery, allied health, diagnostics,
pharmacy, and prostheses related costs.
All-cause mortality data:
92,288 deaths from the Register for Births, Deaths, and Marriages between July 2001 and December
2008.
Linkage process
The two main data linkage tasks involved defining the linkages within the ISAAC hospital separations
dataset, and linking the mortality data to the ISAAC data. The cost data contained identifiers that matched
directly to specific inpatient separations, and so no linkage was required. Patient-level costs (State Cost
Weight Database) or year-specific DRG costs (where patient-level costs were unavailable) were used.
Within the ISAAC hospital separations data, the aim was to identify sets of separations experienced by
individual patients. Available patient identifiers included date of birth, gender, postcode and encrypted
Assessing equitable and efficient solutions to reduce hospital demand
Page | 3
Medicare number (a unique ten digit number assigned to Australians to manage the health care rebate
system). Patient names were not available due to ethics constraints.
During the linkage of the de-identified hospital data, the following actions were taken as part of the data
cleaning and linkage process:
1. Date of birth
Potential errors in recorded date of birth were corrected, focusing on one-digit data entry errors.
The correction process specified that if the encrypted Medicare number, year of birth and gender
were the same, and there was only a one-digit error in the month of birth, the recorded
separations were assumed to be for the same patient.
2. Medicare numbers
Medicare numbers were assumed to be for the same patient if:
- encrypted Medicare number, date of birth and gender were the same
- separations where encrypted Medicare numbers differed only by the last digit but the date of
birth, gender and postcode were the same, as the last digit change could be due to Medicare
card renewal or reissue.
Deterministic approaches were developed to correct potential Medicare number data entry
errors and to assign numbers to separations with missing Medicare numbers, but in the first
instance no further adjustments were made to the data, and separations with missing Medicare
numbers were deleted from the dataset. 369,574 (9%) separations without a recorded Medicare
number were excluded from the Master dataset.
3. Simultaneous admissions
There were cases where multiple separations had the same encrypted Medicare number, date of
birth, gender, postcode, admission date and admission time. Most were duplicates with some
triplicates. All simultaneous admissions were manually checked to determine which separation to
keep (only one separation was kept). Examples of reasons for deletion were:
- Patient was transferred to another hospital
- Earlier separation date or time
- Non-specific principal diagnosis
- Less severe principal diagnosis
- Missing Medicare number
4. Other issues
- There were cases where a date of death was followed by another hospital separation, which
could be due to same-sex twins where one twin had died. In such cases, all separations for
that PIV were deleted from the dataset.
- Non-South Australian postcodes were excluded
- Dates of death were adjusted for separations where patients died in hospital but no date of
death was recorded
In total 455,222 separations were excluded from the final dataset. The remaining 3,617,119 separations
were assigned to individual patients using the (corrected) date of birth, gender, and Medicare number
variables to form a single patient identification variable (PIV), and separations with the same PIV were
assigned to the same patient.
Assessing equitable and efficient solutions to reduce hospital demand
Page | 4
Linkage of the ISAAC data to the mortality data was undertaken by staff within the State Department of
Health, who had access to patient names. Manual checks of the results of a probabilistic linkage revealed
significant uncertainty around many linkages, which led to a process of manual linkage for around 66,000 of
the 92,288 mortality records, with reference to the Electoral register for confirmation of many identified
linkages.
Postcode variables were used to merge socioeconomic indicators into the Master dataset.
A link_id number was assigned to each separation (record) in the master dataset so the master dataset
could be split into smaller datasets for analysis whilst still maintaining linkages.
Ethical approval for this project was granted by the SA Health Human Research Ethics Committee (HREC
protocol no: 264-11-2011).
2.2 AREAS FOR INVESTIGATION
Analysis of non-linked ISAAC data
A process was developed to identify, select and prioritise conditions for investigation. The criterion for
further investigation was specified as evidence suggestive of variation in practice, either over time
(temporal variation) or between hospitals (geographic variation). The prioritisation process involved initial
analysis of the unlinked hospital separations data (ISAAC) and aggregate DRG cost estimates, followed by
discussion of the analysis with clinical experts across a range of specialties to identify potential causes of
the observed variation.
The dataset was analysed by Australian Refined Diagnosis Related Groups (AR-DRGs) to identify those DRGs
with the greatest variation in numbers of separations and bed days over time (indicating changes in
practice). Changes in costs and bed days for the corresponding 3-digit DRG stems, as well as related DRG
groups (e.g. F70 and F71 – major and non-major arrhythmia, respectively), were also investigated to check
that costs and/or bed days had not been transferred across DRG codes.
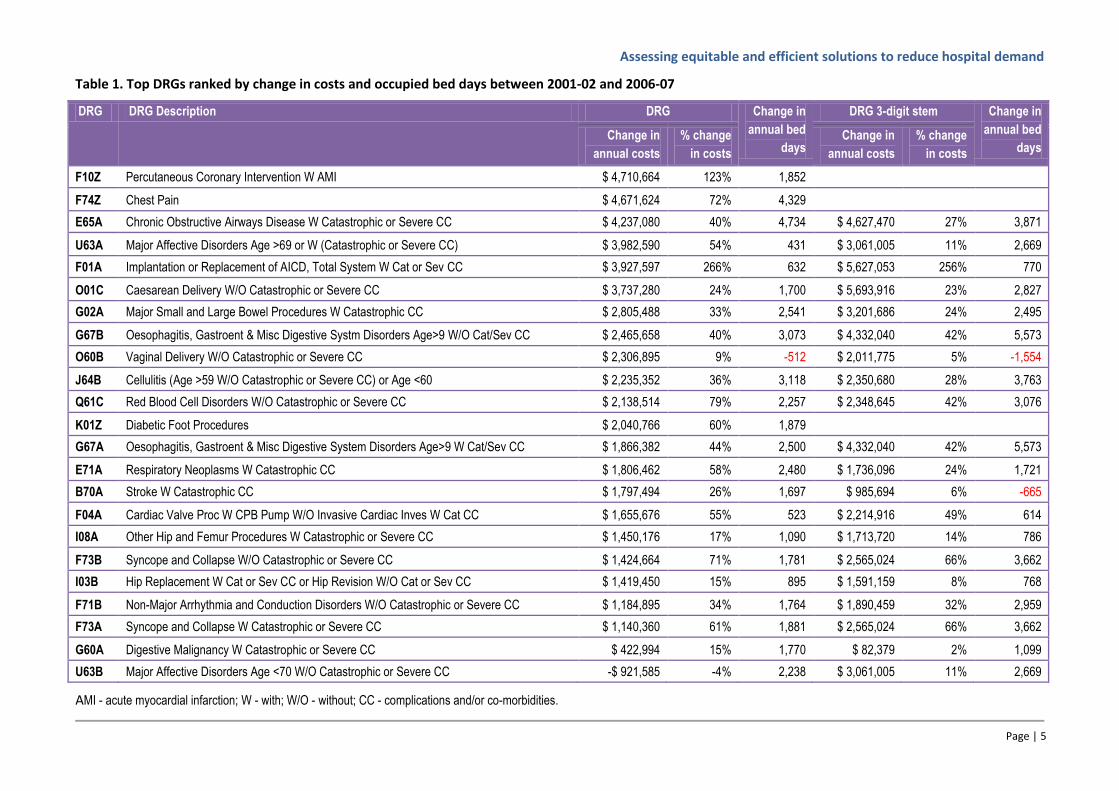
Table 1 presents a selection of the top ranked diagnostic related groups (DRGs) with respect to absolute
increases in costs and occupied bed days in South Australia over the period 2001-02 to 2006-07.
Two high profile cardiac DRG codes – percutaneous coronary intervention (F10Z) and chest pain (F74Z)
accounted for additional annual costs of over $9 million, and over 6000 additional bed days per year. Very
large increases were also observed for implantation or replacement of automatic implantable cardiac
defibrillator (AICD) (F01), which had increased costs of over $5.6 million across the stem DRG.
Chronic Obstructive Airways Disease (E65A) has a similarly large increase in activity (+ $4.2 million and
4,734 bed days per year). However, there appears to be some movement between respiratory related
DRGs – activity declined in the respiratory infections (E62), other respiratory system (E02) and bronchitis
and asthma (E69) DRGs. Across six related respiratory DRG stems (E02, E62, E65, E67, E69, and E74), there
were actually reductions in the aggregate annual costs and bed days of $2.266 million and 4,034,
respectively.
Caesarean delivery annual costs increased significantly – by almost $5.7 million across the O01 DRG stem.
Vaginal delivery costs also increased, though associated occupied bed days decreased by over 1,500 per
year.
Assessing equitable and efficient solutions to reduce hospital demand
Page | 5
Table 1. Top DRGs ranked by change in costs and occupied bed days between 2001-02 and 2006-07
DRG DRG Description DRG Change in
annual bed
days
DRG 3-digit stem Change in
annual bed
days Change in
annual costs
% change
in costs
Change in
annual costs
% change
in costs
F10Z Percutaneous Coronary Intervention W AMI $ 4,710,664 123% 1,852
F74Z Chest Pain $ 4,671,624 72% 4,329
E65A Chronic Obstructive Airways Disease W Catastrophic or Severe CC $ 4,237,080 40% 4,734 $ 4,627,470 27% 3,871
U63A Major Affective Disorders Age >69 or W (Catastrophic or Severe CC) $ 3,982,590 54% 431 $ 3,061,005 11% 2,669
F01A Implantation or Replacement of AICD, Total System W Cat or Sev CC $ 3,927,597 266% 632 $ 5,627,053 256% 770
O01C Caesarean Delivery W/O Catastrophic or Severe CC $ 3,737,280 24% 1,700 $ 5,693,916 23% 2,827
G02A Major Small and Large Bowel Procedures W Catastrophic CC $ 2,805,488 33% 2,541 $ 3,201,686 24% 2,495
G67B Oesophagitis, Gastroent & Misc Digestive Systm Disorders Age>9 W/O Cat/Sev CC $ 2,465,658 40% 3,073 $ 4,332,040 42% 5,573
O60B Vaginal Delivery W/O Catastrophic or Severe CC $ 2,306,895 9% -512 $ 2,011,775 5% -1,554
J64B Cellulitis (Age >59 W/O Catastrophic or Severe CC) or Age <60 $ 2,235,352 36% 3,118 $ 2,350,680 28% 3,763
Q61C Red Blood Cell Disorders W/O Catastrophic or Severe CC $ 2,138,514 79% 2,257 $ 2,348,645 42% 3,076
K01Z Diabetic Foot Procedures $ 2,040,766 60% 1,879
G67A Oesophagitis, Gastroent & Misc Digestive System Disorders Age>9 W Cat/Sev CC $ 1,866,382 44% 2,500 $ 4,332,040 42% 5,573
E71A Respiratory Neoplasms W Catastrophic CC $ 1,806,462 58% 2,480 $ 1,736,096 24% 1,721
B70A Stroke W Catastrophic CC $ 1,797,494 26% 1,697 $ 985,694 6% -665
F04A Cardiac Valve Proc W CPB Pump W/O Invasive Cardiac Inves W Cat CC $ 1,655,676 55% 523 $ 2,214,916 49% 614
I08A Other Hip and Femur Procedures W Catastrophic or Severe CC $ 1,450,176 17% 1,090 $ 1,713,720 14% 786
F73B Syncope and Collapse W/O Catastrophic or Severe CC $ 1,424,664 71% 1,781 $ 2,565,024 66% 3,662
I03B Hip Replacement W Cat or Sev CC or Hip Revision W/O Cat or Sev CC $ 1,419,450 15% 895 $ 1,591,159 8% 768
F71B Non-Major Arrhythmia and Conduction Disorders W/O Catastrophic or Severe CC $ 1,184,895 34% 1,764 $ 1,890,459 32% 2,959
F73A Syncope and Collapse W Catastrophic or Severe CC $ 1,140,360 61% 1,881 $ 2,565,024 66% 3,662
G60A Digestive Malignancy W Catastrophic or Severe CC $ 422,994 15% 1,770 $ 82,379 2% 1,099
U63B Major Affective Disorders Age <70 W/O Catastrophic or Severe CC -$ 921,585 -4% 2,238 $ 3,061,005 11% 2,669
AMI - acute myocardial infarction; W - with; W/O - without; CC - complications and/or co-morbidities.
Assessing equitable and efficient solutions to reduce hospital demand
Page | 6
Consultation with experts
The full set of analyses was presented, individually, to the following experts. The four represented
specialties were selected on the basis of the top ranking DRGs:
Prof Jeffrey Robinson and A/Prof Peter Baghurst (Obstetrics and Gynaecology)
A/Prof Peter Devitt (General surgery)
A/Prof Robert Adams (Respiratory)
Prof Paddy Phillips (Cardiovascular)
Nine conditions were selected for further investigation. Table A1 (Appendix 2) lists the nine conditions with
their respective reasons for consideration and recommendations for further research. Stroke and chest
pain were selected for the first applications of the RAC-E framework, as both patient cohorts had large
increases in admission rates, especially for chest pain (+75%). The total costs expended on the two patient
groups were significant, and the mean costs of the most costly hospitals were approximately double the
costs of the least costly hospital for both conditions. Local clinicians advised that variation in clinical
practice was a likely explanation of the observed cost differences.
Analysis of linked ISAAC data
Upon completion of the data linkage, this process was revised using the linked master dataset, which
included patient-level separation cost estimates to better inform the identification of areas of hospital
activity in which there were potentially important variations in clinical practice.
Mean separation costs for each DRG in 2006-07 across the four key hospitals were calculated. Comparisons
of the aggregate annual costs and the differences in the mean costs across hospitals identified the DRGs
with the greatest potential for variation in practice.
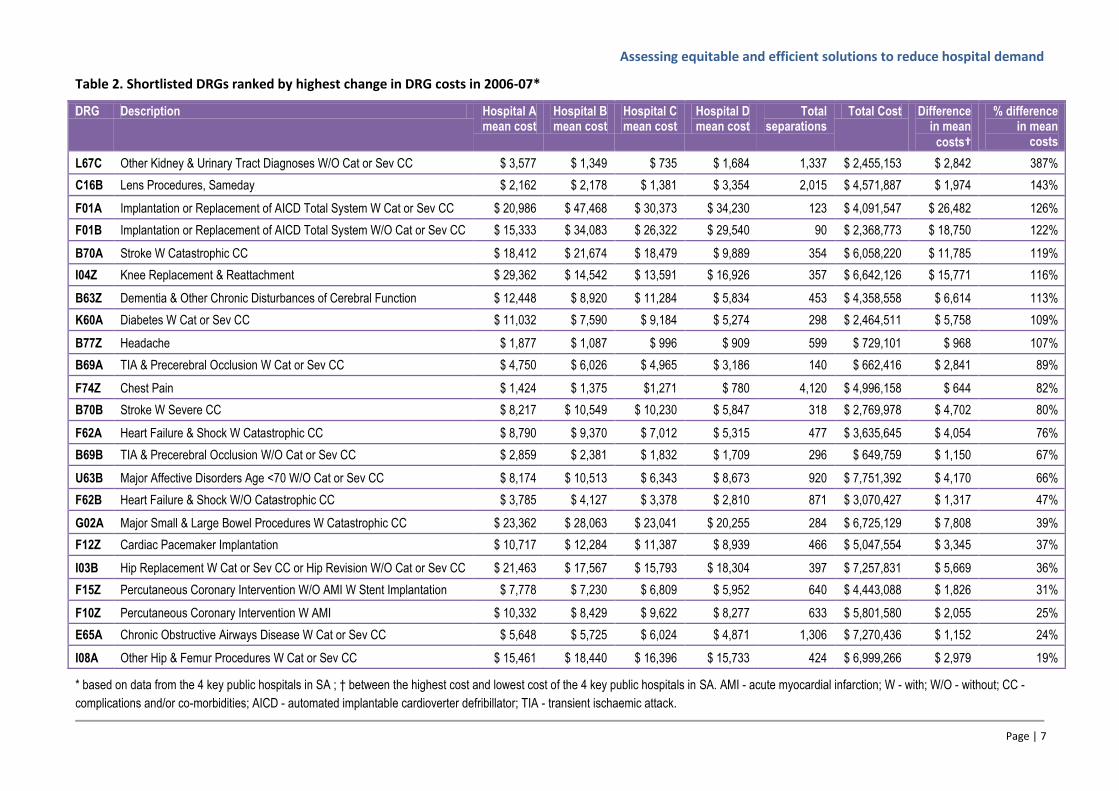
Potential case study DRGs within each major disease category were selected for the shortlist (Table 2),
based on the following criteria:
Significant increase in absolute mean cost
Significant increase in relative mean cost
Significant sample size
Significant total cost
There were a large number of same-day lens procedures (C16B) with a total annual cost of over $4 million
and a 143% difference in mean separation costs across the hospitals. A large number of patients were also
admitted for chest pain accounting for almost $5 million in annual costs and a 82% difference in mean costs
between the hospitals. The mean costs across the four hospitals varied greatly, particularly for other kidney
and urinary tract diagnoses (hospital C had a minimum mean cost of $735 compared with a maximum
mean cost of $3,577 for hospital A, a difference of 387%) and the implantation or replacement of an
automated implantable cardioverter defribillator (126% difference). Interestingly, the mean costs for a
diagnosis of headache suggested variations in practice across hospitals with a minimum mean cost of $909
at hospital D and a maximum mean costs of $1,877 at hospital A, a difference on 107%.
Assessing equitable and efficient solutions to reduce hospital demand
Page | 7
Table 2. Shortlisted DRGs ranked by highest change in DRG costs in 2006-07*
DRG Description Hospital A mean cost
Hospital B mean cost
Hospital C mean cost
Hospital D mean cost
Total separations
Total Cost Difference in mean
costs†
% difference in mean
costs
L67C Other Kidney & Urinary Tract Diagnoses W/O Cat or Sev CC $ 3,577 $ 1,349 $ 735 $ 1,684 1,337 $ 2,455,153 $ 2,842 387%
C16B Lens Procedures, Sameday $ 2,162 $ 2,178 $ 1,381 $ 3,354 2,015 $ 4,571,887 $ 1,974 143%
F01A Implantation or Replacement of AICD Total System W Cat or Sev CC $ 20,986 $ 47,468 $ 30,373 $ 34,230 123 $ 4,091,547 $ 26,482 126%
F01B Implantation or Replacement of AICD Total System W/O Cat or Sev CC $ 15,333 $ 34,083 $ 26,322 $ 29,540 90 $ 2,368,773 $ 18,750 122%
B70A Stroke W Catastrophic CC $ 18,412 $ 21,674 $ 18,479 $ 9,889 354 $ 6,058,220 $ 11,785 119%
I04Z Knee Replacement & Reattachment $ 29,362 $ 14,542 $ 13,591 $ 16,926 357 $ 6,642,126 $ 15,771 116%
B63Z Dementia & Other Chronic Disturbances of Cerebral Function $ 12,448 $ 8,920 $ 11,284 $ 5,834 453 $ 4,358,558 $ 6,614 113%
K60A Diabetes W Cat or Sev CC $ 11,032 $ 7,590 $ 9,184 $ 5,274 298 $ 2,464,511 $ 5,758 109%
B77Z Headache $ 1,877 $ 1,087 $ 996 $ 909 599 $ 729,101 $ 968 107%
B69A TIA & Precerebral Occlusion W Cat or Sev CC $ 4,750 $ 6,026 $ 4,965 $ 3,186 140 $ 662,416 $ 2,841 89%
F74Z Chest Pain $ 1,424 $ 1,375 $1,271 $ 780 4,120 $ 4,996,158 $ 644 82%
B70B Stroke W Severe CC $ 8,217 $ 10,549 $ 10,230 $ 5,847 318 $ 2,769,978 $ 4,702 80%
F62A Heart Failure & Shock W Catastrophic CC $ 8,790 $ 9,370 $ 7,012 $ 5,315 477 $ 3,635,645 $ 4,054 76%
B69B TIA & Precerebral Occlusion W/O Cat or Sev CC $ 2,859 $ 2,381 $ 1,832 $ 1,709 296 $ 649,759 $ 1,150 67%
U63B Major Affective Disorders Age <70 W/O Cat or Sev CC $ 8,174 $ 10,513 $ 6,343 $ 8,673 920 $ 7,751,392 $ 4,170 66%
F62B Heart Failure & Shock W/O Catastrophic CC $ 3,785 $ 4,127 $ 3,378 $ 2,810 871 $ 3,070,427 $ 1,317 47%
G02A Major Small & Large Bowel Procedures W Catastrophic CC $ 23,362 $ 28,063 $ 23,041 $ 20,255 284 $ 6,725,129 $ 7,808 39%
F12Z Cardiac Pacemaker Implantation $ 10,717 $ 12,284 $ 11,387 $ 8,939 466 $ 5,047,554 $ 3,345 37%
I03B Hip Replacement W Cat or Sev CC or Hip Revision W/O Cat or Sev CC $ 21,463 $ 17,567 $ 15,793 $ 18,304 397 $ 7,257,831 $ 5,669 36%
F15Z Percutaneous Coronary Intervention W/O AMI W Stent Implantation $ 7,778 $ 7,230 $ 6,809 $ 5,952 640 $ 4,443,088 $ 1,826 31%
F10Z Percutaneous Coronary Intervention W AMI $ 10,332 $ 8,429 $ 9,622 $ 8,277 633 $ 5,801,580 $ 2,055 25%
E65A Chronic Obstructive Airways Disease W Cat or Sev CC $ 5,648 $ 5,725 $ 6,024 $ 4,871 1,306 $ 7,270,436 $ 1,152 24%
I08A Other Hip & Femur Procedures W Cat or Sev CC $ 15,461 $ 18,440 $ 16,396 $ 15,733 424 $ 6,999,266 $ 2,979 19%
* based on data from the 4 key public hospitals in SA ; † between the highest cost and lowest cost of the 4 key public hospitals in SA. AMI - acute myocardial infarction; W - with; W/O - without; CC -
complications and/or co-morbidities; AICD - automated implantable cardioverter defribillator; TIA - transient ischaemic attack.
Assessing equitable and efficient solutions to reduce hospital demand
Page | 8
The following eight key conditions were analysed further: hip replacement (I08A, I03B), transient ischaemic
attack (B69), headache (B77Z), lens procedures sameday (C16B), chronic obstructive airways disease (E65),
automated implantable cardioverter defribillator (F01), cardiac pacemaker (F12Z), and percutaneous
coronary intervention (F10Z, F15Z, F16Z). A disaggregated analysis of the costs incurred in each of the 16
cost categories used in the hospital costing process identified specific areas in which costs varied most
between hospitals. Table A2 ( Appendix 2) lists the eight potential conditions that were identified with
recommendations for further research. This revised ranking confirmed stroke and chest pain as case studies
and identified hip fracture as the next case study.
2.3 RISK ADJUSTED COST-EFFECTIVENESS (RAC-E) ANALYSES
Having described the creation of a master dataset, and the identification of priority areas for investigation,
the following sections describe the sequential components of the RAC-E process. The methodology used to
undertake the analyses presented in this report is described, though as this is a new analytic framework it
should be recognised that an iterative process was used to refine the methodology. It is also the case that
further development and validation approaches are planned, which are discussed in the concluding section
of this report.
The stroke and chest pain case studies were undertaken in parallel, led by different researchers (CP –
stroke; OC – chest pain). In addition to the clinical members of the research team (DBT and MC), the
following clinical experts contributed to the development of the analytic framework to ensure that the
specification for each case study captured all relevant clinical factors and outcomes:
Dr Andrew Lee, Consultant Neurologist at the Flinders Medical Centre, was the primary clinical advisor for
the stroke study.
Professor Derek Chew, Director of Cardiology at the Flinders Medical Centre, and Professor Paddy Phillips,
Chief Medical Officer of South Australia, were the primary clinical advisors for the chest pain study.
Associate Professor Craig Whitehead, Geriatrician at the Repatriation General Hospital, was the primary
clinical advisor for the hip fracture study.
The aim
The aim of the analytic framework was to estimate differences in the long-term costs and benefits
associated with clinical practice for specific conditions at alternative hospitals, controlling for relevant
differences in the clinical and sociodemographic characteristics of patients treated at different hospitals.
The analytic framework
Using the chest pain case study to illustrate, the analytic framework is summarised as the following six
stage process:
1. A cohort of eligible patients is defined as all patients with a principal diagnosis of chest pain who
were admitted to any of the four main public hospitals in SA within a defined time period.
2. A set of intermediate outcomes is defined (e.g. cardiac-related readmission, death, or no related
event). Using the linked data for the eligible patient cohort, each patient is assigned to one of the
intermediate outcomes over a defined (retrospective) observation period (e.g. 2 years from the
admission date for the chest pain separation).
3. Using the full set of linked data for all chest pain patients, separate regression models are developed
to predict future costs and mortality on the basis of relevant patient characteristics (e.g. age, co-
morbidities, socioeconomic status) and the intermediate endpoints.
Assessing equitable and efficient solutions to reduce hospital demand
Page | 9
4. Combining the observed and predicted data, each patient is assigned a predicted lifetime cost and a
survival (life years gained) estimate.
5. Using the lifetime cost and survival estimates for the eligible patient cohort, separate regression
models are developed to derive expected lifetime costs and survival on the basis of relevant patient
characteristics at the time of the initial chest pain admission (e.g. age, co-morbidities, socioeconomic
status).
6. Each eligible patient is assigned a net cost and a net benefit value, estimated as predicted minus
expected lifetime costs and survival, respectively. The net costs and benefits are summed across all
eligible patients at each of the four hospitals to calculate the mean net costs and benefits at each
hospital. The mean net costs and benefits are compared across the hospitals to identify the hospital
with the most cost-effective practice.
The following sub-sections expand on the methods within each of these six steps.
1. Defining the eligible patient cohort
The first task is to define the method for identifying eligible patients, through the specification of the range
of principal diagnoses to be included. Here, clinical advice is required to select a patient cohort for whom
clinical practice is relatively homogeneous, i.e. there are no major differences in the expected management
pathways across patients within the defined cohort.
Secondly, consideration is given to obtaining numbers of patients to inform a sufficiently precise estimate
of the differences in costs and benefits of clinical practice between hospitals. Sample size may be increased
by specifying a longer time period for the analysis, but here we also need to consider the relevance of the
time period analysed to current clinical practice, the length of the observation period (over which we
identify relevant intermediate endpoints - steps 2 and 3).
2. Choice of intermediate endpoints
The specified intermediate endpoints form the structure of the analytic framework; it is from these
endpoints that the final costs and outcomes will be estimated. Intermediate endpoints are events that are
potentially related to the index event, i.e. we would expect differences in the rates of these events with
variations in the quality of clinical practice. In this study, intermediate endpoints were defined on the basis
of hospital separations experienced during the follow-up period.
In defining the endpoints, there is a trade-off between choosing enough intermediate endpoints to be able
to capture important differences in long-term costs and outcomes, and the analytic burden and loss of
precision (due to reduced sample sizes) of undertaking large numbers of regression-based extrapolation
analyses (step 3).
Clinical advice is essential to identify endpoints (hospital admissions) that are potentially related to the
index event, and to inform the grouping of sets of hospital admissions (e.g. according to principal
diagnosis). In addition, evidence from the literature can inform relevant categorisations, for example,
reviewing previous economic models in the disease area. Finally, analyses of the assembled linked dataset
may also be useful, for example, short-term mortality rates can be estimated to provide estimates of the
relative severity of alternative principal diagnoses.
Each eligible patients is then assigned to one of the defined intermediate endpoints representing the first
event experienced by the patient (if any) over the defined follow-up period.
Assessing equitable and efficient solutions to reduce hospital demand
Page | 10
3. Extrapolating costs and survival
To generate predicted estimates of lifetime costs and survival, datasets are created that contain all hospital
separations for all patients who experienced the index event (e.g. chest pain) over the period July 1, 2002
to June 30, 2008. In addition to variables describing clinical and sociodemographic characteristics of
patients at the time of their index event, additional variables are created that describe the intermediate
endpoint experienced by each patient (e.g. cardiac readmission, death, or no event), mortality status and
date of death (where appropriate), and annual cost estimates. The annual cost estimates are based on
experienced hospital admissions in each year following the index event.
The following sub-sections describe the regression analytic methods used to extrapolate lifetime costs and
survival beyond each intermediate endpoint using these datasets.
3.1 Survival models
Flexible parametric models for survival analysis, introduced by Royston and Parmar (Royston & Parmar
2002), were applied to the three datasets to predict survival beyond the follow-up endpoints. These models
use restricted cubic splines to estimate log cumulative hazards, controlling for the effect of relevant patient
characteristics.
To fit the models, we used backwards stepwise selection using the full range of demographic, socio-
economic, and clinical explanatory variables. The criterion for inclusion in the model was p≤0.05. These
initially defined models were then expanded to test for significant interactions between the included
explanatory variables. Interaction terms were included in the models if they improved model fit, as judged
by the Akaike's Information Criterion. The final stage of the analysis tested the effect of alternative
functional forms by comparing models that fitted a restricted cubic spline with between 1 and 5 knots.
To assess the overall fit of the parametric survival models, the mean survival curve was plotted against the
Kaplan-Meier survival curve.
3.2 Cost models
Annual costs in each full year of life beyond the intermediate endpoints were estimated using a two-stage
process that estimated the probability of patients incurring any hospital costs (using logistic regression),
followed by an estimate of the magnitude of the cost, if incurred (using generalised linear models - GLMs).
In some cases, e.g. following the recurrent stroke and cardiac intermediate endpoints, separate cost
models were specified to differentiate between costs incurred in the first year post-event, and costs
incurred in subsequent years.
Similar model selection criteria to those used for the survival models were applied. For the logistic
regression analyses, overall model fit was established using the Ramsey RESET test. For the GLMs, the
modified Park test was used to determine the most appropriate distribution, and the appropriate link
function was selected by testing different power functions with respect to the Pearson correlation,
Pregibon link, and the Modified Hosmer-Lemeshow tests.
Annual survival probabilities for each patient were derived from the estimated survival functions, to which
annual cost estimates and a 5% discount rate were applied. The discounted annual costs and survival
probabilities were summed to a maximum age of 100 years, which were then added to the costs incurred
and life years gained up to and including each patient’s intermediate endpoint to estimate lifetime costs
and survival for each patient.
Assessing equitable and efficient solutions to reduce hospital demand
Page | 11
4. Predicted lifetime costs and survival
Overall survival is predicted for each eligible patient by combining the time to patients’ intermediate
endpoint (e.g. either cardiac readmission or the end of the two year follow-up period for chest pain
patients) with the extrapolated survival time from the intermediate endpoint (as described in step 3). If a
patient dies during the follow-up period, lifetime survival is not extrapolated.
Predicted lifetime costs estimates for each eligible patient are generated by combining the costs incurred
during the index event (e.g. the hospital admission for the initial chest pain event), and readmission costs
for patients with the cardiac readmission intermediate endpoint, with the extrapolated costs predicted by
the regression models. Extrapolated lifetime costs are estimated by multiplying the estimated annual costs
by the predicted proportion of surviving patients in each year following the index event.
5. Expected lifetime costs and survival
The predicted lifetime costs and survival estimates for all eligible patients are combined into a single
dataset, and separate regression models are fitted to generate expected lifetime cost and survival
estimates. The models control for clinical and socio-economic and demographic factors that are observed
at the time of the index event.
As in the regression analyses described in step 3, GLM and Royston-Parmar parametric model are fitted to
estimate expected lifetime costs and survival, respectively.
6. Comparing net cost and benefit values
The final step involves the estimation of the net cost and benefits values for each eligible patient, which are
generated by subtracting expected (step 5) lifetime costs and survival from predicted lifetime costs and
survival (step 4), respectively.
The net costs and benefits are summed across all eligible patients attending each of the four hospitals to
calculate the mean net costs and benefits at each hospital. From these data, we identified hospitals that
were costing more (or less) and/or achieving better (or worse) patient outcomes than expected, controlling
(or adjusting) for differences in the baseline risk of patients incurring high costs or achieving poor
outcomes. Differences in net cost and survival estimates between hospitals can be interpreted as risk
adjusted differences in costs and survival: if costs incurred by patients at hospital A are $300 more than
expected, whilst costs incurred by patients at hospital B are $200 less than expected, then the risk adjusted
difference in per patient costs between hospitals A and B is $500.
A comprehensive sensitivity analysis involved a multi-stage bootstrapping (sampling with replacement)
approach, which precludes the need to parameterise the correlation between lifetime costs and survival.
The datasets for each of the intermediate endpoints were bootstrapped, and the coefficients for each of
the extrapolation models re-estimated. Each resulting dataset of lifetime costs and survival was also
bootstrapped and the coefficients for the expected costs and survival regression models re-estimated. This
sequential bootstrapping process was repeated for 2,000 iterations. The output data were used to plot
cost-effectiveness acceptability curves which display the probability that each hospital is cost-effective at
different threshold values for gaining additional life years.
2.4 INVESTIGATION OF POTENTIAL DETERMINANTS OF DIFFERENCES IN COSTS AND
BENEFITS
An important area of development within the RAC-E framework is the subsequent investigation of potential
determinants of the estimated differences in risk adjusted costs and survival between hospitals. Analyses
involving routinely collected data will always be subject to criticism regarding the limitations of the data
Assessing equitable and efficient solutions to reduce hospital demand
Page | 12
and the lack of randomisation to control for unobservable biases. The sequential investigation of
differences in the process of clinical practice, in areas where important differences in risk adjusted costs
and benefits have been identified, is intended to provide supplementary evidence to support the RAC-E
findings: if expert analysis of observed processes identifies better (more efficient) processes at the hospitals
that were estimated to have the best RAC-E, the combined evidence set should be harder to ignore.
Appraisal of available methodologies for the comparative analysis of clinical practice processes is ongoing,
though the technique of process mining has been identified as a promising approach that may be applied
using routinely collected data.
Initial analyses of the following routinely reported hospital activity and cost data were undertaken, from
which crude differences in the use of broad resource categories were identified:
Hospital activity data
Length of hospital stay
Provision of rehabilitative services (where applicable)
Rehabilitation length of stay (where applicable)
Diagnostic or clinical procedures (where applicable)
Hospital capacity
Cost data
In deriving separation-level cost estimates, hospitals assigned costs to 16 different categories, including
ward medical, ward nursing, non-clinical salaries, pathology, imaging, allied health, pharmacy, critical care,
operating room, emergency department, ward supplies and other overheads, specialist procedures,
oncosts, prostheses, hotel services, and depreciation.
3 APPLICATIONS OF RAC-E ANALYSES
The results for stroke, chest pain and hip fracture are presented below, including initial analyses of
potential determinants of the estimated differences in risk adjusted costs and survival for each case study.
3.1 STROKE
Patient cohort
Stroke events were stratified on the basis of the AR-DRG codes B70A, B70B and B70C (stroke with
catastrophic comorbidities or complications (CC), with severe CC, and without catastrophic or severe CC,
respectively), as the ICD-10.5-AM coding for stroke subtype was unreliable with the proportion of
unspecified stroke ranging between 0.5-32% across hospitals. Patients who died within 5 days of admission
or whose principal diagnosis was stroke but were categorised under the AR-DRG codes for craniotomy
(B02), extracranial vascular procedure (B04) or tracheostomy or ventilation >95 hours (A06) were excluded
from the analysis.
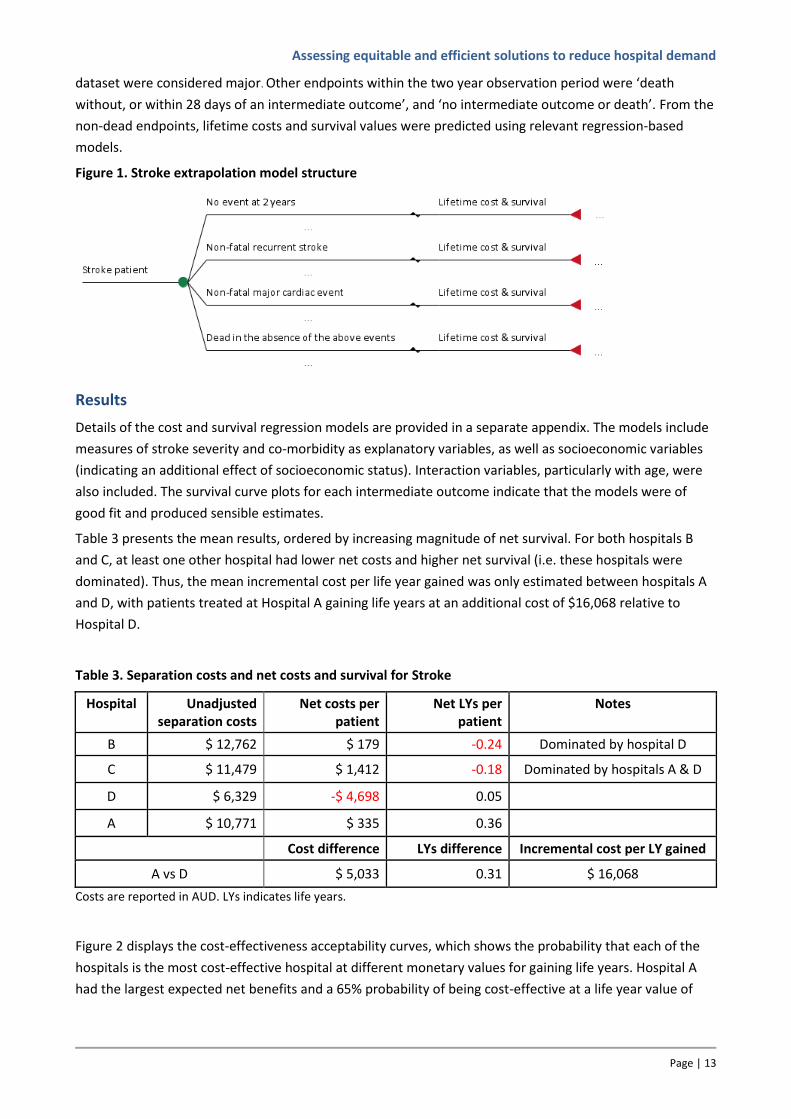
Figure 1 displays the structure of the extrapolation model, showing that beyond an initial stroke separation,
hospital admissions for non-fatal recurrent stroke, and non-fatal major cardiac event were categorised as
intermediate endpoints. In this analysis, a major cardiac event was defined by ranking all cardiac events (in
Major Disease Category 5 - Diseases of the Circulatory System) following a stroke event by frequency of
death. Those associated with the highest frequencies of death (proportion of death ≥40%) in the linked
Assessing equitable and efficient solutions to reduce hospital demand
Page | 13
dataset were considered major. Other endpoints within the two year observation period were ‘death
without, or within 28 days of an intermediate outcome’, and ‘no intermediate outcome or death’. From the
non-dead endpoints, lifetime costs and survival values were predicted using relevant regression-based
models.
Figure 1. Stroke extrapolation model structure
Results
Details of the cost and survival regression models are provided in a separate appendix. The models include
measures of stroke severity and co-morbidity as explanatory variables, as well as socioeconomic variables
(indicating an additional effect of socioeconomic status). Interaction variables, particularly with age, were
also included. The survival curve plots for each intermediate outcome indicate that the models were of
good fit and produced sensible estimates.
Table 3 presents the mean results, ordered by increasing magnitude of net survival. For both hospitals B
and C, at least one other hospital had lower net costs and higher net survival (i.e. these hospitals were
dominated). Thus, the mean incremental cost per life year gained was only estimated between hospitals A
and D, with patients treated at Hospital A gaining life years at an additional cost of $16,068 relative to
Hospital D.
Table 3. Separation costs and net costs and survival for Stroke
Hospital Unadjusted separation costs
Net costs per patient
Net LYs per patient
Notes
B $ 12,762 $ 179 -0.24 Dominated by hospital D
C $ 11,479 $ 1,412 -0.18 Dominated by hospitals A & D
D $ 6,329 -$ 4,698 0.05
A $ 10,771 $ 335 0.36
Cost difference LYs difference Incremental cost per LY gained
A vs D $ 5,033 0.31 $ 16,068
Costs are reported in AUD. LYs indicates life years.
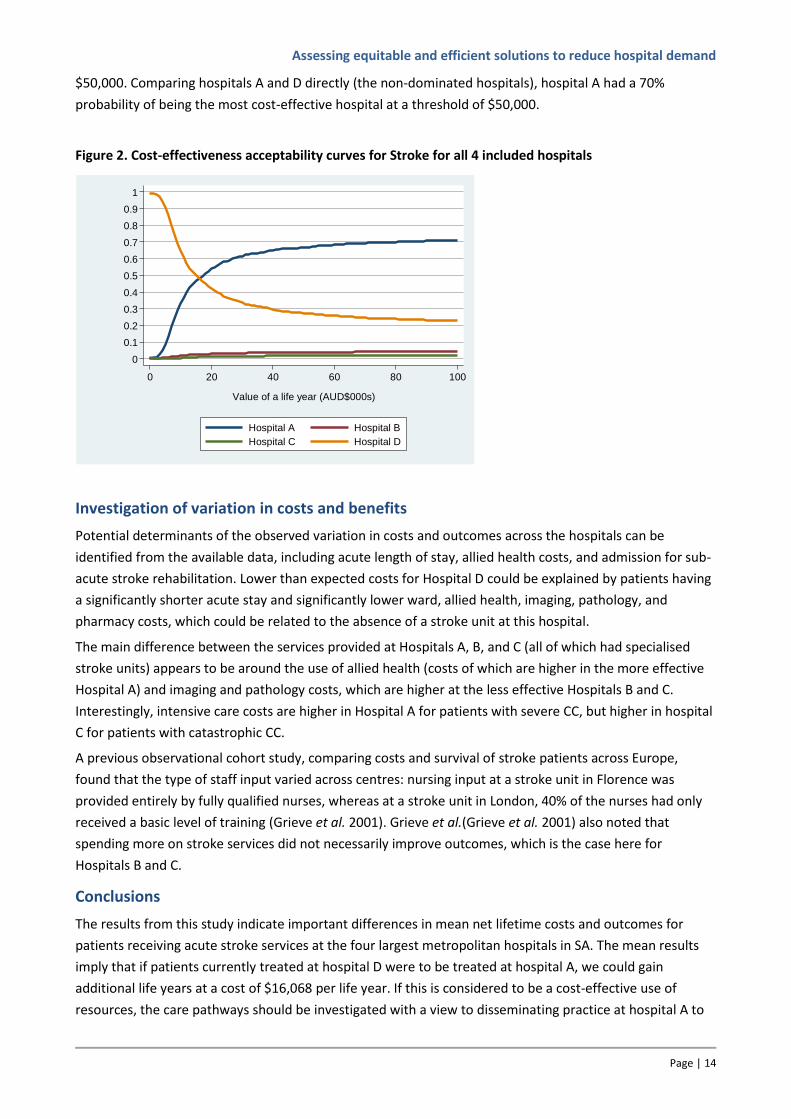
Figure 2 displays the cost-effectiveness acceptability curves, which shows the probability that each of the
hospitals is the most cost-effective hospital at different monetary values for gaining life years. Hospital A
had the largest expected net benefits and a 65% probability of being cost-effective at a life year value of
Assessing equitable and efficient solutions to reduce hospital demand
Page | 14
$50,000. Comparing hospitals A and D directly (the non-dominated hospitals), hospital A had a 70%
probability of being the most cost-effective hospital at a threshold of $50,000.
Figure 2. Cost-effectiveness acceptability curves for Stroke for all 4 included hospitals
Investigation of variation in costs and benefits
Potential determinants of the observed variation in costs and outcomes across the hospitals can be
identified from the available data, including acute length of stay, allied health costs, and admission for sub-
acute stroke rehabilitation. Lower than expected costs for Hospital D could be explained by patients having
a significantly shorter acute stay and significantly lower ward, allied health, imaging, pathology, and
pharmacy costs, which could be related to the absence of a stroke unit at this hospital.
The main difference between the services provided at Hospitals A, B, and C (all of which had specialised
stroke units) appears to be around the use of allied health (costs of which are higher in the more effective
Hospital A) and imaging and pathology costs, which are higher at the less effective Hospitals B and C.
Interestingly, intensive care costs are higher in Hospital A for patients with severe CC, but higher in hospital
C for patients with catastrophic CC.
A previous observational cohort study, comparing costs and survival of stroke patients across Europe,
found that the type of staff input varied across centres: nursing input at a stroke unit in Florence was
provided entirely by fully qualified nurses, whereas at a stroke unit in London, 40% of the nurses had only
received a basic level of training (Grieve et al. 2001). Grieve et al.(Grieve et al. 2001) also noted that
spending more on stroke services did not necessarily improve outcomes, which is the case here for
Hospitals B and C.
Conclusions
The results from this study indicate important differences in mean net lifetime costs and outcomes for
patients receiving acute stroke services at the four largest metropolitan hospitals in SA. The mean results
imply that if patients currently treated at hospital D were to be treated at hospital A, we could gain
additional life years at a cost of $16,068 per life year. If this is considered to be a cost-effective use of
resources, the care pathways should be investigated with a view to disseminating practice at hospital A to
0
1
0.1
0.2
0.3
0.4
0.5
0.6
0.7
0.8
0.9
Pro
ba
bili
ty h
ospita
ls a
re c
ost-
effe
ctive
0 20 40 60 80 100
Value of a life year (AUD$000s)
Hospital A Hospital B
Hospital C Hospital D
Assessing equitable and efficient solutions to reduce hospital demand
Page | 15
the other hospitals. This analysis has identified hospitals for further investigation to assess differences in
clinical pathways using improvement tools such as process mapping to describe patient journeys and gain a
better understanding of the complexity and the sequence of steps involved in the provision of care at each
hospital, with the intention of informing recommendations regarding the efficient use of hospital resources
for acute stroke management.
3.2 CHEST PAIN
Patient cohort
Eligible patients were admitted to hospital via an emergency department and had a principal diagnosis of
chest pain, defined using the ICD-10 AM code R07, in combination with one of two DRG codes: “Chest Pain”
(F74Z) or “Chest pain with invasive procedure” (F42B). Patients with a hospital admission in the year prior
to the qualifying chest pain admission, which was classified in the Major Diagnostic Category: Diseases and
Disorders of the Circulatory System, were excluded in order to focus on chest pain that was unlikely to be
related to recently treated heart disease.
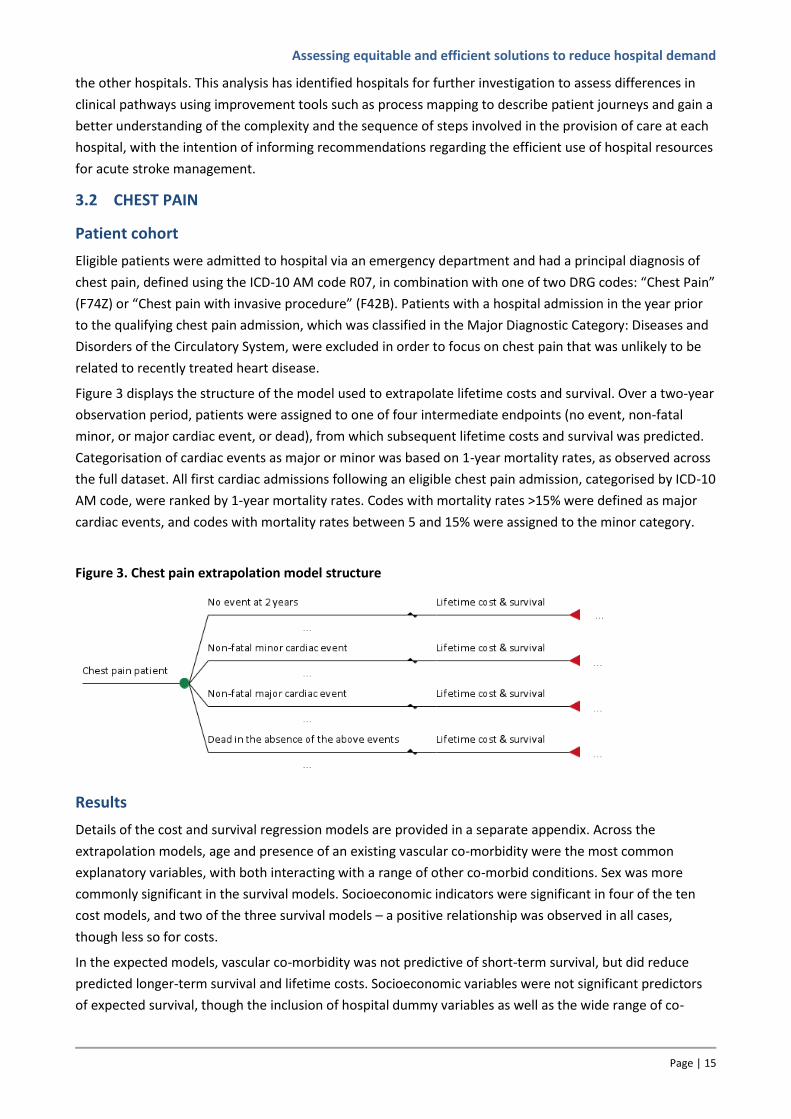
Figure 3 displays the structure of the model used to extrapolate lifetime costs and survival. Over a two-year
observation period, patients were assigned to one of four intermediate endpoints (no event, non-fatal
minor, or major cardiac event, or dead), from which subsequent lifetime costs and survival was predicted.
Categorisation of cardiac events as major or minor was based on 1-year mortality rates, as observed across
the full dataset. All first cardiac admissions following an eligible chest pain admission, categorised by ICD-10
AM code, were ranked by 1-year mortality rates. Codes with mortality rates >15% were defined as major
cardiac events, and codes with mortality rates between 5 and 15% were assigned to the minor category.
Figure 3. Chest pain extrapolation model structure
Results
Details of the cost and survival regression models are provided in a separate appendix. Across the
extrapolation models, age and presence of an existing vascular co-morbidity were the most common
explanatory variables, with both interacting with a range of other co-morbid conditions. Sex was more
commonly significant in the survival models. Socioeconomic indicators were significant in four of the ten
cost models, and two of the three survival models – a positive relationship was observed in all cases,
though less so for costs.
In the expected models, vascular co-morbidity was not predictive of short-term survival, but did reduce
predicted longer-term survival and lifetime costs. Socioeconomic variables were not significant predictors
of expected survival, though the inclusion of hospital dummy variables as well as the wide range of co-
Assessing equitable and efficient solutions to reduce hospital demand
Page | 16
morbidity variables may be capturing the effects of socioeconomic status on expected survival.
Socioeconomic disadvantage was a significant, but not strong, predictor of expected lifetime costs.
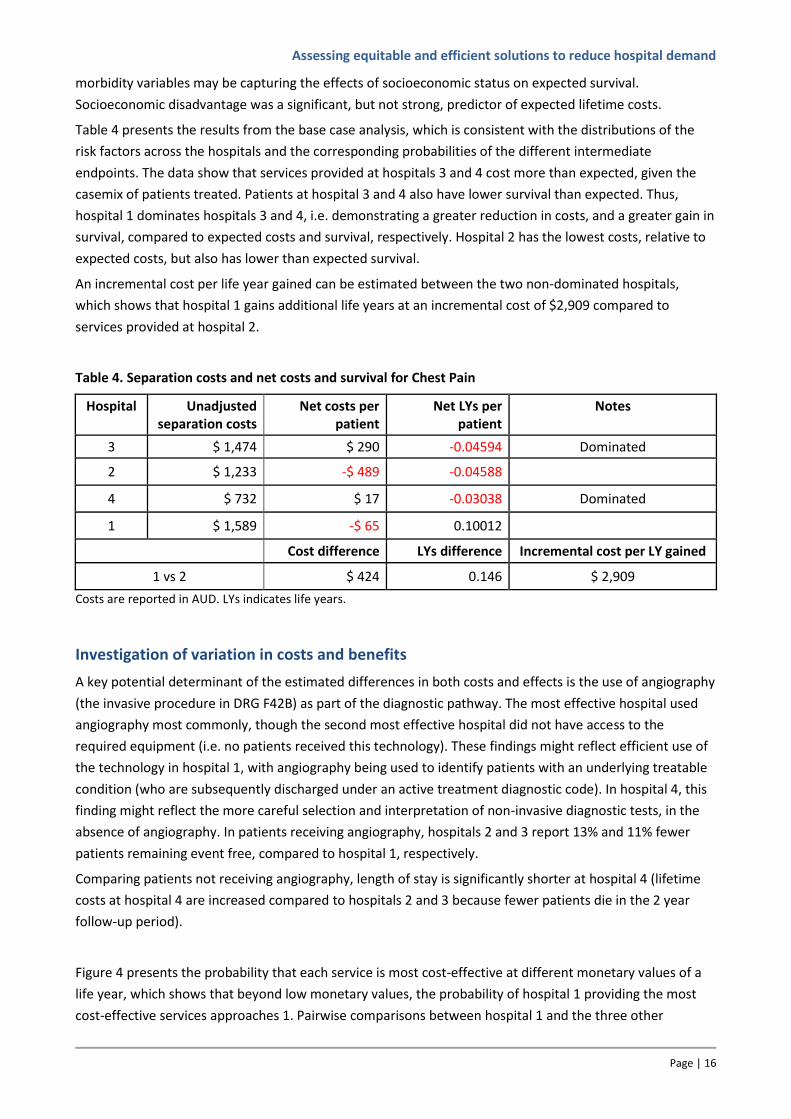
Table 4 presents the results from the base case analysis, which is consistent with the distributions of the
risk factors across the hospitals and the corresponding probabilities of the different intermediate
endpoints. The data show that services provided at hospitals 3 and 4 cost more than expected, given the
casemix of patients treated. Patients at hospital 3 and 4 also have lower survival than expected. Thus,
hospital 1 dominates hospitals 3 and 4, i.e. demonstrating a greater reduction in costs, and a greater gain in
survival, compared to expected costs and survival, respectively. Hospital 2 has the lowest costs, relative to
expected costs, but also has lower than expected survival.
An incremental cost per life year gained can be estimated between the two non-dominated hospitals,
which shows that hospital 1 gains additional life years at an incremental cost of $2,909 compared to
services provided at hospital 2.
Table 4. Separation costs and net costs and survival for Chest Pain
Hospital Unadjusted separation costs
Net costs per patient
Net LYs per patient
Notes
3 $ 1,474 $ 290 -0.04594 Dominated
2 $ 1,233 -$ 489 -0.04588
4 $ 732 $ 17 -0.03038 Dominated
1 $ 1,589 -$ 65 0.10012
Cost difference LYs difference Incremental cost per LY gained
1 vs 2 $ 424 0.146 $ 2,909
Costs are reported in AUD. LYs indicates life years.
Investigation of variation in costs and benefits
A key potential determinant of the estimated differences in both costs and effects is the use of angiography
(the invasive procedure in DRG F42B) as part of the diagnostic pathway. The most effective hospital used
angiography most commonly, though the second most effective hospital did not have access to the
required equipment (i.e. no patients received this technology). These findings might reflect efficient use of
the technology in hospital 1, with angiography being used to identify patients with an underlying treatable
condition (who are subsequently discharged under an active treatment diagnostic code). In hospital 4, this
finding might reflect the more careful selection and interpretation of non-invasive diagnostic tests, in the
absence of angiography. In patients receiving angiography, hospitals 2 and 3 report 13% and 11% fewer
patients remaining event free, compared to hospital 1, respectively.
Comparing patients not receiving angiography, length of stay is significantly shorter at hospital 4 (lifetime
costs at hospital 4 are increased compared to hospitals 2 and 3 because fewer patients die in the 2 year
follow-up period).
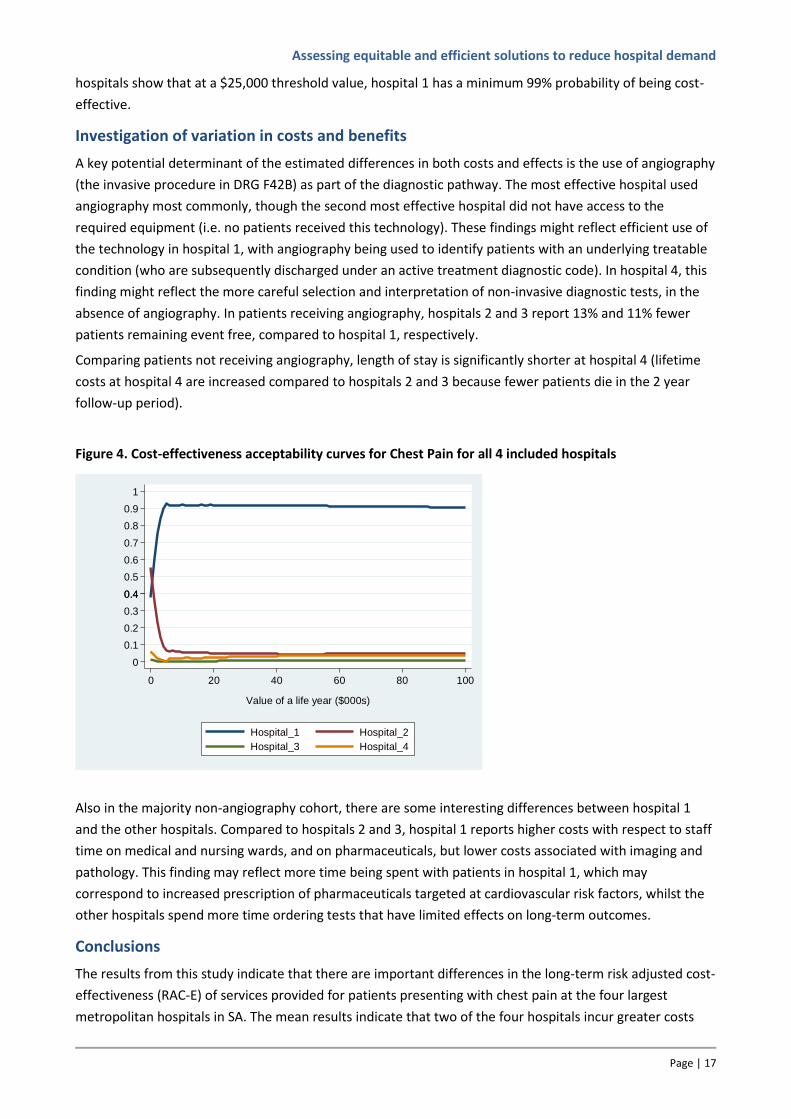
Figure 4 presents the probability that each service is most cost-effective at different monetary values of a
life year, which shows that beyond low monetary values, the probability of hospital 1 providing the most
cost-effective services approaches 1. Pairwise comparisons between hospital 1 and the three other
Assessing equitable and efficient solutions to reduce hospital demand
Page | 17
hospitals show that at a $25,000 threshold value, hospital 1 has a minimum 99% probability of being cost-
effective.
Investigation of variation in costs and benefits
A key potential determinant of the estimated differences in both costs and effects is the use of angiography
(the invasive procedure in DRG F42B) as part of the diagnostic pathway. The most effective hospital used
angiography most commonly, though the second most effective hospital did not have access to the
required equipment (i.e. no patients received this technology). These findings might reflect efficient use of
the technology in hospital 1, with angiography being used to identify patients with an underlying treatable
condition (who are subsequently discharged under an active treatment diagnostic code). In hospital 4, this
finding might reflect the more careful selection and interpretation of non-invasive diagnostic tests, in the
absence of angiography. In patients receiving angiography, hospitals 2 and 3 report 13% and 11% fewer
patients remaining event free, compared to hospital 1, respectively.
Comparing patients not receiving angiography, length of stay is significantly shorter at hospital 4 (lifetime
costs at hospital 4 are increased compared to hospitals 2 and 3 because fewer patients die in the 2 year
follow-up period).
Figure 4. Cost-effectiveness acceptability curves for Chest Pain for all 4 included hospitals
Also in the majority non-angiography cohort, there are some interesting differences between hospital 1
and the other hospitals. Compared to hospitals 2 and 3, hospital 1 reports higher costs with respect to staff
time on medical and nursing wards, and on pharmaceuticals, but lower costs associated with imaging and
pathology. This finding may reflect more time being spent with patients in hospital 1, which may
correspond to increased prescription of pharmaceuticals targeted at cardiovascular risk factors, whilst the
other hospitals spend more time ordering tests that have limited effects on long-term outcomes.
Conclusions
The results from this study indicate that there are important differences in the long-term risk adjusted cost-
effectiveness (RAC-E) of services provided for patients presenting with chest pain at the four largest
metropolitan hospitals in SA. The mean results indicate that two of the four hospitals incur greater costs
1
0.40.4
0
0.2
0.6
0.8
0.1
0.3
0.5
0.7
0.9
Pro
ba
bilt
y h
osp
itals
are
cost-
effe
ctive
0 20 40 60 80 100
Value of a life year ($000s)
Hospital_1 Hospital_2
Hospital_3 Hospital_4
Assessing equitable and efficient solutions to reduce hospital demand
Page | 18
and achieve poorer outcomes than at least one other hospital (i.e. are dominated). Of the non-dominated
hospitals, the mean results imply that if patients currently treated at hospital 2 were to be treated at
hospital 1, we would gain additional life years at a cost of $2,909 per life year. If this is considered to be a
cost-effective use of resources, the care pathways should be investigated with a view to disseminating
practice at hospital 1 to the other hospitals.
If all hospitals were able to achieve the same level of costs and effects as hospital 1, the health service
could expect to save $78 per patient treated at hospital 2, 3, or 4, and these patients would expect to gain
an additional 0.14 life years. Annually, this equates to net present value savings of $142,892 to the health
service and gains of 258 life years to this cohort of 1,843 patients.
Differences in costs and effects are likely to be a function of three factors:
differing thresholds for admitting patients presenting at an emergency department (ED) with chest
pain,
more accurate identification of patients presenting with chest pain who have, and do not have a
clinically relevant underlying cause for the symptoms,
better management of underlying factors that increase the risk of a future clinical event.
To assess these factors, comparative analyses of the clinical practice processes within the ED of the
different hospitals, for patients presenting with chest pain, is ongoing. These analyses are using the
technique of process mining as applied to routinely collected data.
3.3 HIP FRACTURE
Patient cohort
All hospitalisations for hip fracture were identified using ICD-10 AM codes S720 (fracture of neck of femur),
S721 (pertrochanteric fracture) and S722 (subtrochanteric fracture). The index hip fracture event was
defined as the first hip fracture hospital admission that occurred for a patient from July 1, 2002 onwards to
exclude patients who had experienced a recent hip fracture (i.e. within the previous year). Transfers for the
same hip fracture separation were excluded from the analysis so as to avoid double counting.
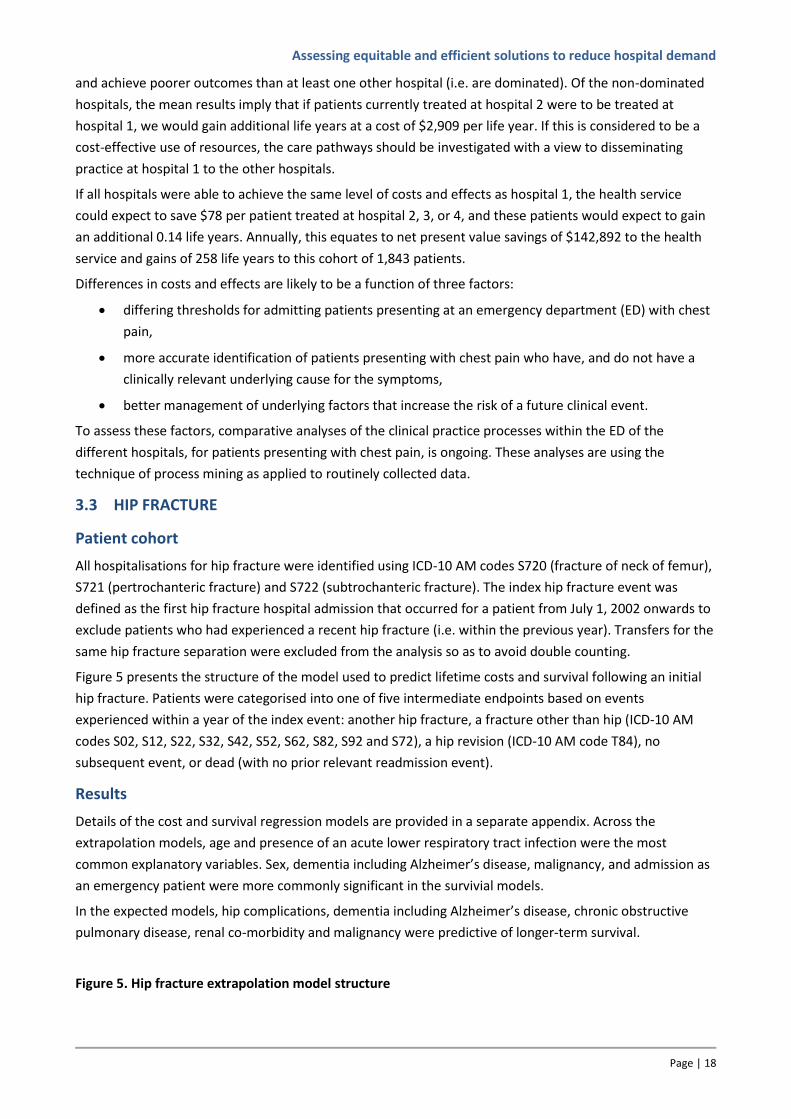
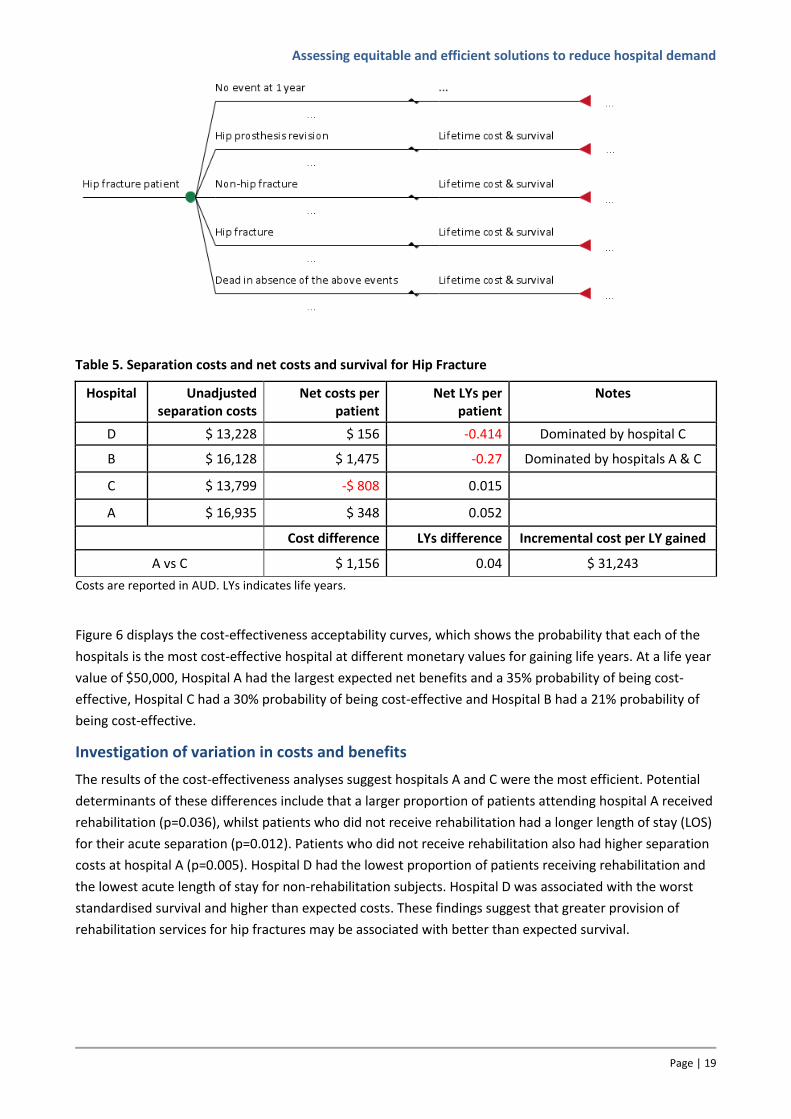
Figure 5 presents the structure of the model used to predict lifetime costs and survival following an initial
hip fracture. Patients were categorised into one of five intermediate endpoints based on events
experienced within a year of the index event: another hip fracture, a fracture other than hip (ICD-10 AM
codes S02, S12, S22, S32, S42, S52, S62, S82, S92 and S72), a hip revision (ICD-10 AM code T84), no
subsequent event, or dead (with no prior relevant readmission event).
Results
Details of the cost and survival regression models are provided in a separate appendix. Across the
extrapolation models, age and presence of an acute lower respiratory tract infection were the most
common explanatory variables. Sex, dementia including Alzheimer’s disease, malignancy, and admission as
an emergency patient were more commonly significant in the survivial models.
In the expected models, hip complications, dementia including Alzheimer’s disease, chronic obstructive
pulmonary disease, renal co-morbidity and malignancy were predictive of longer-term survival.
Figure 5. Hip fracture extrapolation model structure
Assessing equitable and efficient solutions to reduce hospital demand
Page | 19
Table 5. Separation costs and net costs and survival for Hip Fracture
Hospital Unadjusted separation costs
Net costs per patient
Net LYs per patient
Notes
D $ 13,228 $ 156 -0.414 Dominated by hospital C
B $ 16,128 $ 1,475 -0.27 Dominated by hospitals A & C
C $ 13,799 -$ 808 0.015
A $ 16,935 $ 348 0.052
Cost difference LYs difference Incremental cost per LY gained
A vs C $ 1,156 0.04 $ 31,243
Costs are reported in AUD. LYs indicates life years.
Figure 6 displays the cost-effectiveness acceptability curves, which shows the probability that each of the
hospitals is the most cost-effective hospital at different monetary values for gaining life years. At a life year
value of $50,000, Hospital A had the largest expected net benefits and a 35% probability of being cost-
effective, Hospital C had a 30% probability of being cost-effective and Hospital B had a 21% probability of
being cost-effective.
Investigation of variation in costs and benefits
The results of the cost-effectiveness analyses suggest hospitals A and C were the most efficient. Potential
determinants of these differences include that a larger proportion of patients attending hospital A received
rehabilitation (p=0.036), whilst patients who did not receive rehabilitation had a longer length of stay (LOS)
for their acute separation (p=0.012). Patients who did not receive rehabilitation also had higher separation
costs at hospital A (p=0.005). Hospital D had the lowest proportion of patients receiving rehabilitation and
the lowest acute length of stay for non-rehabilitation subjects. Hospital D was associated with the worst
standardised survival and higher than expected costs. These findings suggest that greater provision of
rehabilitation services for hip fractures may be associated with better than expected survival.
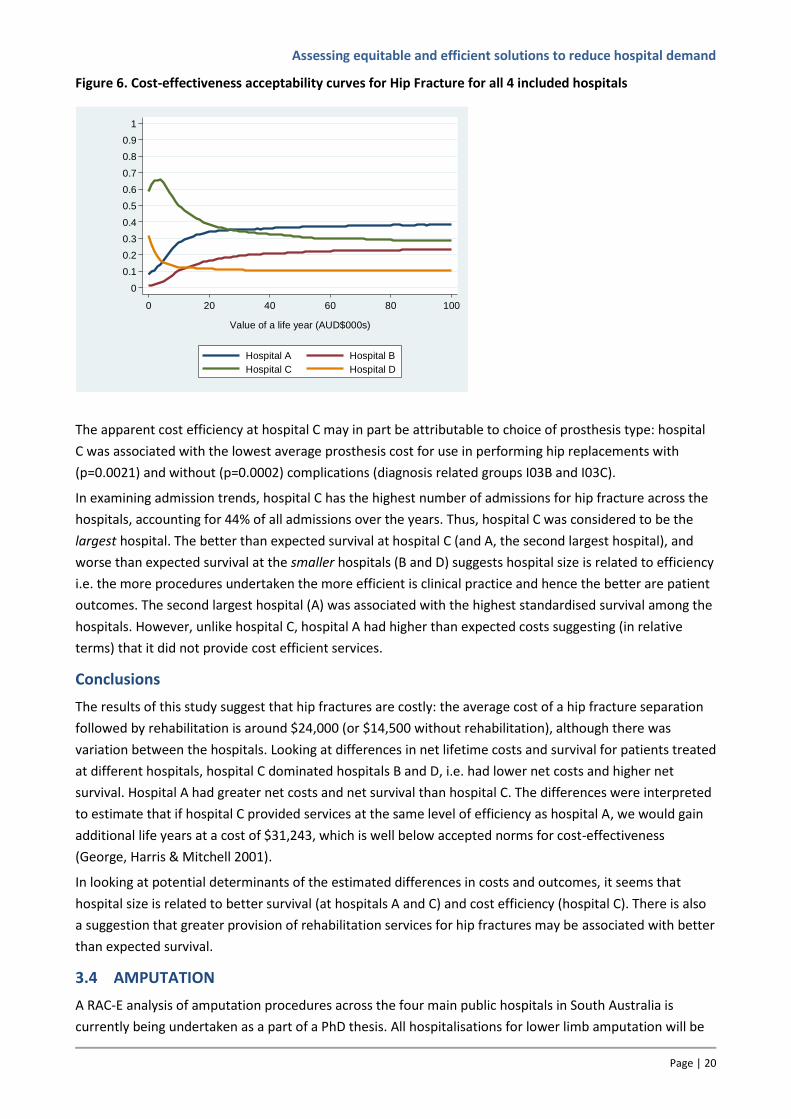
Assessing equitable and efficient solutions to reduce hospital demand
Page | 20
Figure 6. Cost-effectiveness acceptability curves for Hip Fracture for all 4 included hospitals
The apparent cost efficiency at hospital C may in part be attributable to choice of prosthesis type: hospital
C was associated with the lowest average prosthesis cost for use in performing hip replacements with
(p=0.0021) and without (p=0.0002) complications (diagnosis related groups I03B and I03C).
In examining admission trends, hospital C has the highest number of admissions for hip fracture across the
hospitals, accounting for 44% of all admissions over the years. Thus, hospital C was considered to be the
largest hospital. The better than expected survival at hospital C (and A, the second largest hospital), and
worse than expected survival at the smaller hospitals (B and D) suggests hospital size is related to efficiency
i.e. the more procedures undertaken the more efficient is clinical practice and hence the better are patient
outcomes. The second largest hospital (A) was associated with the highest standardised survival among the
hospitals. However, unlike hospital C, hospital A had higher than expected costs suggesting (in relative
terms) that it did not provide cost efficient services.
Conclusions
The results of this study suggest that hip fractures are costly: the average cost of a hip fracture separation
followed by rehabilitation is around $24,000 (or $14,500 without rehabilitation), although there was
variation between the hospitals. Looking at differences in net lifetime costs and survival for patients treated
at different hospitals, hospital C dominated hospitals B and D, i.e. had lower net costs and higher net
survival. Hospital A had greater net costs and net survival than hospital C. The differences were interpreted
to estimate that if hospital C provided services at the same level of efficiency as hospital A, we would gain
additional life years at a cost of $31,243, which is well below accepted norms for cost-effectiveness
(George, Harris & Mitchell 2001).
In looking at potential determinants of the estimated differences in costs and outcomes, it seems that
hospital size is related to better survival (at hospitals A and C) and cost efficiency (hospital C). There is also
a suggestion that greater provision of rehabilitation services for hip fractures may be associated with better
than expected survival.
3.4 AMPUTATION
A RAC-E analysis of amputation procedures across the four main public hospitals in South Australia is
currently being undertaken as a part of a PhD thesis. All hospitalisations for lower limb amputation will be
0
0.2
0.4
0.6
0.8
0.1
0.3
0.5
0.7
0.9
1
Pro
ba
bili
ty h
ospita
ls a
re c
ost-
effe
ctive
0 20 40 60 80 100
Value of a life year (AUD$000s)
Hospital A Hospital B
Hospital C Hospital D
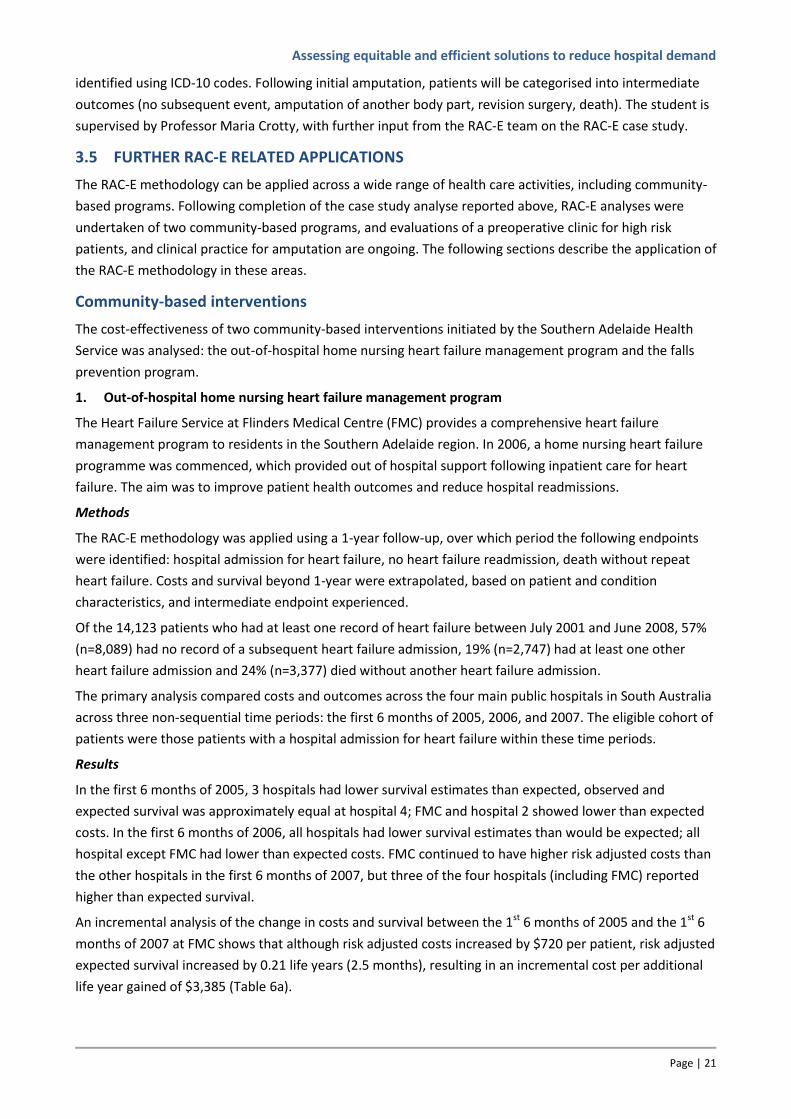
Assessing equitable and efficient solutions to reduce hospital demand
Page | 21
identified using ICD-10 codes. Following initial amputation, patients will be categorised into intermediate
outcomes (no subsequent event, amputation of another body part, revision surgery, death). The student is
supervised by Professor Maria Crotty, with further input from the RAC-E team on the RAC-E case study.
3.5 FURTHER RAC-E RELATED APPLICATIONS
The RAC-E methodology can be applied across a wide range of health care activities, including community-
based programs. Following completion of the case study analyse reported above, RAC-E analyses were
undertaken of two community-based programs, and evaluations of a preoperative clinic for high risk
patients, and clinical practice for amputation are ongoing. The following sections describe the application of
the RAC-E methodology in these areas.
Community-based interventions
The cost-effectiveness of two community-based interventions initiated by the Southern Adelaide Health
Service was analysed: the out-of-hospital home nursing heart failure management program and the falls
prevention program.
1. Out-of-hospital home nursing heart failure management program
The Heart Failure Service at Flinders Medical Centre (FMC) provides a comprehensive heart failure
management program to residents in the Southern Adelaide region. In 2006, a home nursing heart failure
programme was commenced, which provided out of hospital support following inpatient care for heart
failure. The aim was to improve patient health outcomes and reduce hospital readmissions.
Methods
The RAC-E methodology was applied using a 1-year follow-up, over which period the following endpoints
were identified: hospital admission for heart failure, no heart failure readmission, death without repeat
heart failure. Costs and survival beyond 1-year were extrapolated, based on patient and condition
characteristics, and intermediate endpoint experienced.
Of the 14,123 patients who had at least one record of heart failure between July 2001 and June 2008, 57%
(n=8,089) had no record of a subsequent heart failure admission, 19% (n=2,747) had at least one other
heart failure admission and 24% (n=3,377) died without another heart failure admission.
The primary analysis compared costs and outcomes across the four main public hospitals in South Australia
across three non-sequential time periods: the first 6 months of 2005, 2006, and 2007. The eligible cohort of
patients were those patients with a hospital admission for heart failure within these time periods.
Results
In the first 6 months of 2005, 3 hospitals had lower survival estimates than expected, observed and
expected survival was approximately equal at hospital 4; FMC and hospital 2 showed lower than expected
costs. In the first 6 months of 2006, all hospitals had lower survival estimates than would be expected; all
hospital except FMC had lower than expected costs. FMC continued to have higher risk adjusted costs than
the other hospitals in the first 6 months of 2007, but three of the four hospitals (including FMC) reported
higher than expected survival.
An incremental analysis of the change in costs and survival between the 1st 6 months of 2005 and the 1st 6
months of 2007 at FMC shows that although risk adjusted costs increased by $720 per patient, risk adjusted
expected survival increased by 0.21 life years (2.5 months), resulting in an incremental cost per additional
life year gained of $3,385 (Table 6a).
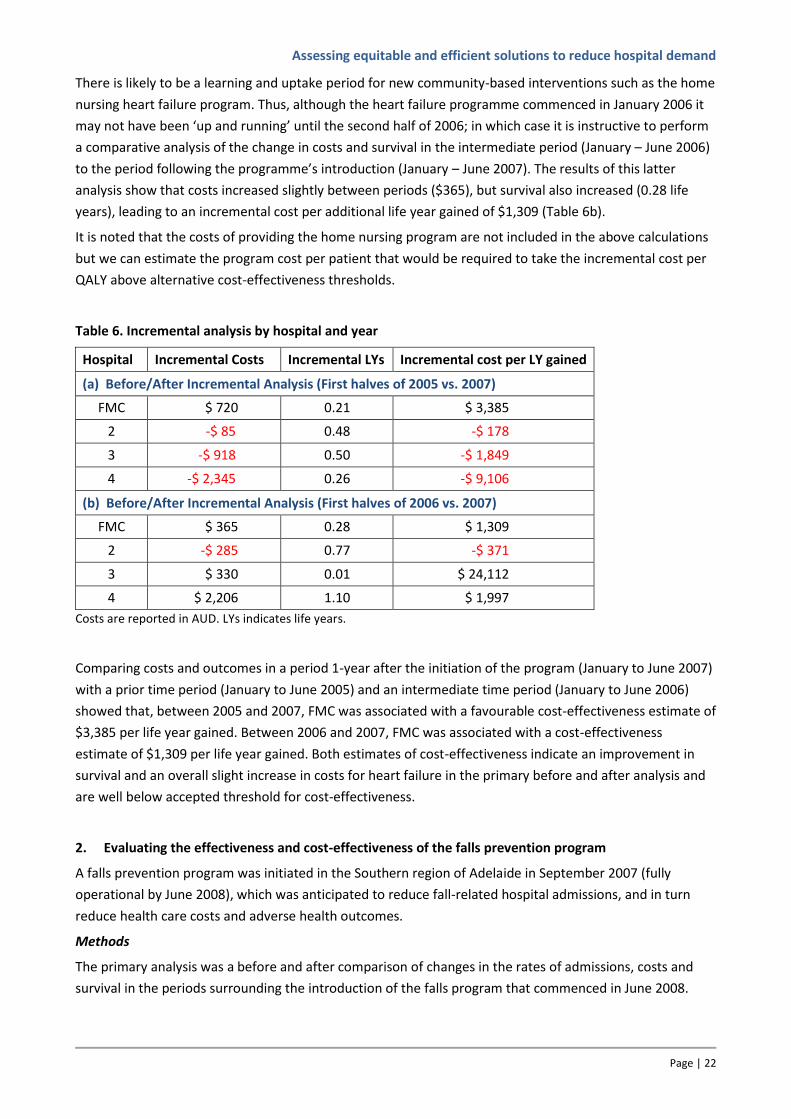
Assessing equitable and efficient solutions to reduce hospital demand
Page | 22
There is likely to be a learning and uptake period for new community-based interventions such as the home
nursing heart failure program. Thus, although the heart failure programme commenced in January 2006 it
may not have been ‘up and running’ until the second half of 2006; in which case it is instructive to perform
a comparative analysis of the change in costs and survival in the intermediate period (January – June 2006)
to the period following the programme’s introduction (January – June 2007). The results of this latter
analysis show that costs increased slightly between periods ($365), but survival also increased (0.28 life
years), leading to an incremental cost per additional life year gained of $1,309 (Table 6b).
It is noted that the costs of providing the home nursing program are not included in the above calculations
but we can estimate the program cost per patient that would be required to take the incremental cost per
QALY above alternative cost-effectiveness thresholds.
Table 6. Incremental analysis by hospital and year
Hospital Incremental Costs Incremental LYs Incremental cost per LY gained
(a) Before/After Incremental Analysis (First halves of 2005 vs. 2007)
FMC $ 720 0.21 $ 3,385
2 -$ 85 0.48 -$ 178
3 -$ 918 0.50 -$ 1,849
4 -$ 2,345 0.26 -$ 9,106
(b) Before/After Incremental Analysis (First halves of 2006 vs. 2007)
FMC $ 365 0.28 $ 1,309
2 -$ 285 0.77 -$ 371
3 $ 330 0.01 $ 24,112
4 $ 2,206 1.10 $ 1,997
Costs are reported in AUD. LYs indicates life years.
Comparing costs and outcomes in a period 1-year after the initiation of the program (January to June 2007)
with a prior time period (January to June 2005) and an intermediate time period (January to June 2006)
showed that, between 2005 and 2007, FMC was associated with a favourable cost-effectiveness estimate of
$3,385 per life year gained. Between 2006 and 2007, FMC was associated with a cost-effectiveness
estimate of $1,309 per life year gained. Both estimates of cost-effectiveness indicate an improvement in
survival and an overall slight increase in costs for heart failure in the primary before and after analysis and
are well below accepted threshold for cost-effectiveness.
2. Evaluating the effectiveness and cost-effectiveness of the falls prevention program
A falls prevention program was initiated in the Southern region of Adelaide in September 2007 (fully
operational by June 2008), which was anticipated to reduce fall-related hospital admissions, and in turn
reduce health care costs and adverse health outcomes.
Methods
The primary analysis was a before and after comparison of changes in the rates of admissions, costs and
survival in the periods surrounding the introduction of the falls program that commenced in June 2008.
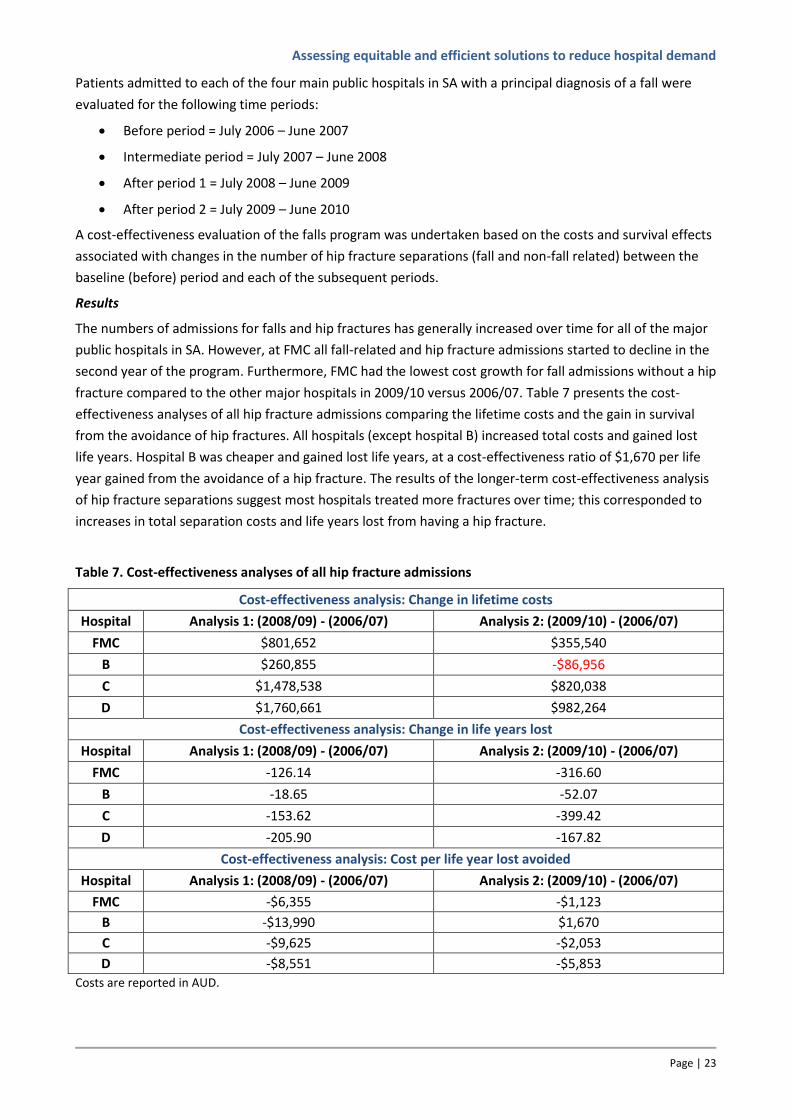
Assessing equitable and efficient solutions to reduce hospital demand
Page | 23
Patients admitted to each of the four main public hospitals in SA with a principal diagnosis of a fall were
evaluated for the following time periods:
Before period = July 2006 – June 2007
Intermediate period = July 2007 – June 2008
After period 1 = July 2008 – June 2009
After period 2 = July 2009 – June 2010
A cost-effectiveness evaluation of the falls program was undertaken based on the costs and survival effects
associated with changes in the number of hip fracture separations (fall and non-fall related) between the
baseline (before) period and each of the subsequent periods.
Results
The numbers of admissions for falls and hip fractures has generally increased over time for all of the major
public hospitals in SA. However, at FMC all fall-related and hip fracture admissions started to decline in the
second year of the program. Furthermore, FMC had the lowest cost growth for fall admissions without a hip
fracture compared to the other major hospitals in 2009/10 versus 2006/07. Table 7 presents the cost-
effectiveness analyses of all hip fracture admissions comparing the lifetime costs and the gain in survival
from the avoidance of hip fractures. All hospitals (except hospital B) increased total costs and gained lost
life years. Hospital B was cheaper and gained lost life years, at a cost-effectiveness ratio of $1,670 per life
year gained from the avoidance of a hip fracture. The results of the longer-term cost-effectiveness analysis
of hip fracture separations suggest most hospitals treated more fractures over time; this corresponded to
increases in total separation costs and life years lost from having a hip fracture.
Table 7. Cost-effectiveness analyses of all hip fracture admissions
Cost-effectiveness analysis: Change in lifetime costs
Hospital Analysis 1: (2008/09) - (2006/07) Analysis 2: (2009/10) - (2006/07)
FMC $801,652 $355,540
B $260,855 -$86,956
C $1,478,538 $820,038
D $1,760,661 $982,264
Cost-effectiveness analysis: Change in life years lost
Hospital Analysis 1: (2008/09) - (2006/07) Analysis 2: (2009/10) - (2006/07)
FMC -126.14 -316.60
B -18.65 -52.07
C -153.62 -399.42
D -205.90 -167.82
Cost-effectiveness analysis: Cost per life year lost avoided
Hospital Analysis 1: (2008/09) - (2006/07) Analysis 2: (2009/10) - (2006/07)
FMC -$6,355 -$1,123
B -$13,990 $1,670
C -$9,625 -$2,053
D -$8,551 -$5,853
Costs are reported in AUD.
Assessing equitable and efficient solutions to reduce hospital demand
Page | 24
In conclusion, the Southern Adelaide Health Services’ falls prevention initiative may have restricted growth
in fall-related and hip fracture admissions below a level that might have otherwise been observed.
Admissions for a fall and/or hip fracture at FMC increased in the year following the introduction of the falls
program. However, admissions at FMC started to decline in the second year of the program. Additional
investigation is indicated to understand why the anticipated reduction in fall-related admissions were not
observed.
Pre-operative clinic for high risk patients
A preliminary evaluation of the Perioperative High Risk Clinic at the Royal Adelaide Hospital was also
undertaken utilising the RAC-E methodology. The main aim was to determine the costs and benefits of
preoperative management of medical co-morbidities at specialist clinics. The case study evaluated the cost-
effectiveness of the clinics for patients referred for transurethral resection of the prostate (TURP),
compared with standard practice.
Methods
Between January 2008 and December 2010, 336 patients were placed on the surgical waiting list for an
elective TURP. Of these, 46 (14%) were referred to the high risk clinic for preoperative optimisation of
medical co-morbidities. A range of preoperative (e.g. age, co-morbidities) and postoperative (e.g. length of
stay, complications, readmissions) data were extracted from the OACIS hospital data repository for the 46
TURP patients referred to the clinic, and 184 patients who were listed for TURP, had at least one recorded
modifiable co-morbidity, but who were not referred to the high risk clinic. Eight modifiable co-morbidities
that are specifically targeted at the high risk clinic were identified: anaemia, diabetes mellitus, heart failure,
stroke, renal impairment, ischaemic heart disease, dementia including Alzheimer’s disease, asthma or
chronic obstructive pulmonary disease. To control for differences in baseline characteristics, the extracted
preoperative data were used to match clinic and control patients who proceeded to surgery, and those who
did not.
Results
The matched analysis of elective TURP patients indicates that patients who attended the high risk clinic for
preoperative medical optimisation of co-morbidities and went on to surgery had shorter length of stay and
lower numbers of postoperative complications and deaths. In the cohort of patients who did not go on to
surgery, 15% (4/26) of control patients cancelled on the day of surgery, whilst only 4% (1/26) of patients
who attended the high risk clinic cancelled on the day.
A combined analysis of patients who did, and did not go onto surgery is ongoing. The RAC-E methodology
will be used to predict separation costs, length of stay, and the likelihood of a TURP without serious
complications, and so inform estimates of net costs and net benefits for clinic and control patients. In this
analysis, data on outpatient attendances is also being accessed in order to provide more information on
outcomes, i.e. more frequent post-operative outpatient attendances may reflect worse outcomes.
Subsequent analyses of net costs and net benefits of different patient sub-groups (e.g. as defined by age,
and number and type of modifiable co-morbidities) across a broader range of surgical procedures will
identify those sub-groups with the greatest potential for cost-effective referral to the preoperative clinic.
This will inform optimal clinic capacities and referral patterns.
Assessing equitable and efficient solutions to reduce hospital demand
Page | 25
3.6 METHODS TO INVESTIGATE POTENTIAL DETERMINANTS OF VARIATION IN RAC-E
The presented analyses of potential determinants of variation in RAC-E in sections 3.1 to 3.3 are necessarily
crude, and it is recognised that further evidence of differences in care pathways might be required to
complement the results of the RAC-E analyses. To this end, an Honours student (Andrew Partington) has
been investigating alternative approaches to pathway analysis of clinical practice. A distinction was noted
between prescriptive and descriptive approaches, and within the latter category three possible approaches
to representing applied clinical practice were identified: group-based assessments, statistical process
control (SPC), and process mapping.
As with the application of RAC-E, our underlying objective in the analysis of pathways of care is to facilitate
widespread application across multiple hospitals, without the need for the collection of large amounts of
additional data. As an example of a group-based assessment, Lean Thinking is a proven method (Ben-Tovim
et al. 2008), but it requires significant logistical organisation that would not be feasible on a widespread
basis. SPC is commonly applied to outcomes (e.g. monitoring mortality rates), though it can be used to
compare differences in throughput it lacks the flexibility to represent complex clinical pathways in sufficient
detail.
Process mining involves the analysis of process information to represent applied pathways of clinical
practice. It comprises a wide range of analytic approaches, including cluster analyses of dominant pathways
and mapping to represent the sequential order of clinical decision making, which can also capture timing
between events/across a process, and the proportion of event occurrence (van der Aalst 2011).
Figure 7 illustrates one form of process mining output – Petri-nets, which represent the frequency and
timing of alternative processes. In this analysis of patients with an emergency department (ED) diagnosis of
chest pain, who are assigned to triage category 2 (patients seen within 10 minutes), there is a difference in
the total time from admission to ED to discharge from hospital (hospital A 67.44 vs. hospital B 52.73 hours).
The analysis can also hone in particular aspects of the process, for example, 53% (A) vs. 74% (B) of patients
are admitted to a cardiology ward, and the average delay between the decision to admit a patient to a
cardiology ward and discharge from the ED to the ward is 1.94 hours (A) vs. 7.99 hours (B).
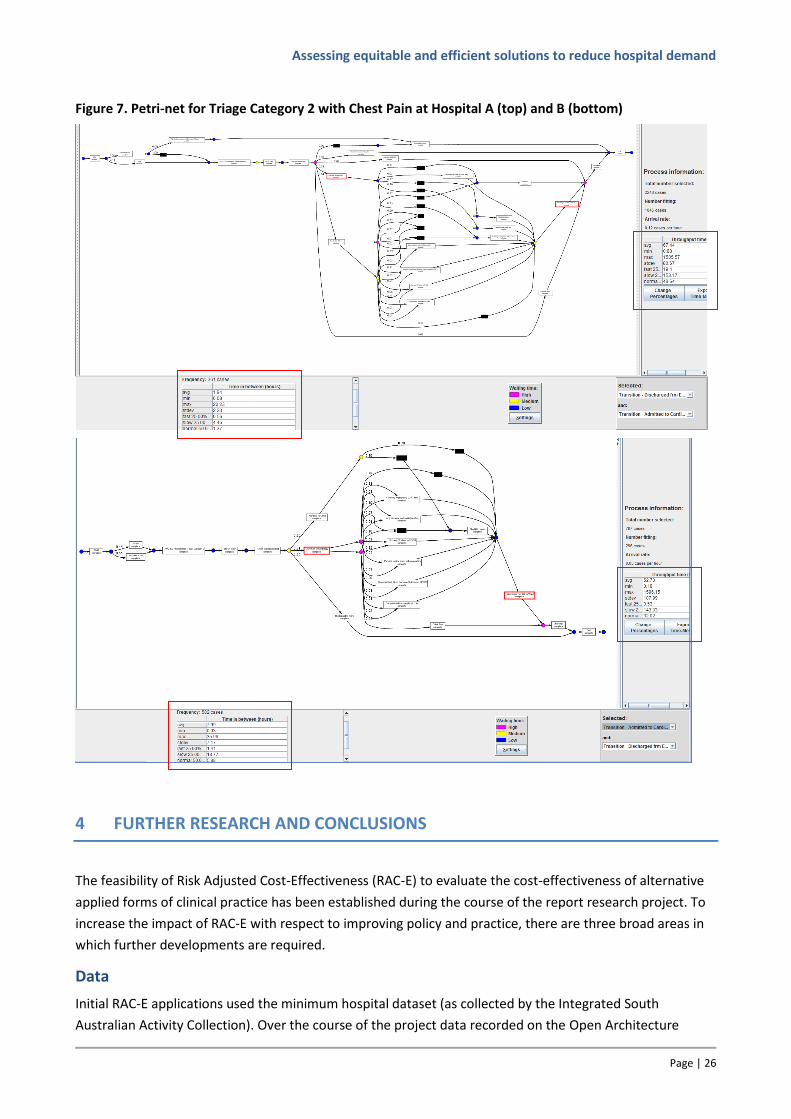
Assessing equitable and efficient solutions to reduce hospital demand
Page | 26
Figure 7. Petri-net for Triage Category 2 with Chest Pain at Hospital A (top) and B (bottom)
4 FURTHER RESEARCH AND CONCLUSIONS
The feasibility of Risk Adjusted Cost-Effectiveness (RAC-E) to evaluate the cost-effectiveness of alternative
applied forms of clinical practice has been established during the course of the report research project. To
increase the impact of RAC-E with respect to improving policy and practice, there are three broad areas in
which further developments are required.
Data
Initial RAC-E applications used the minimum hospital dataset (as collected by the Integrated South
Australian Activity Collection). Over the course of the project data recorded on the Open Architecture
Assessing equitable and efficient solutions to reduce hospital demand
Page | 27
Clinical Information System (OACIS) was found to provide significantly more information on clinical aspects,
for example, instead of potential inconsistent recording of whether a patient has diabetes (ISAAC),
laboratory test results recording glycated haemoglobin levels are available on OACIS, which provide a more
robust basis for controlling for differences in casemix between hospitals. As such OACIS is an extremely
useful data source, but there is no routine process for accessing OACIS data for research purposes. Future
research will be aided by improved access to OACIS data.
In the short- to medium-term, the intention is to start applying RAC-E to hospitals across Australia, and
hence identify cost-effective clinical practice from a wider set of institutions. This will require access to a
national source of linked, routinely collected data. Work in this area is starting to pick up pace, and the
Population Health Research Network has been established to create Australia's first national data linkage
network. It is expected that applications from researchers to undertake national data linkage projects will
be accepted in the first half of 2012 [http://www.phrn.org.au/for-data-users/register-your-interest].
Alternatively, access to registry data potentially provides an even better source of data to inform RAC-E.
Registries often collect more detailed demographic and clinical information than routinely collected data,
and data quality is generally better, for example, systems are put in place to reduce the amount of missing
data and quality audits check data validity. The research team has established good contacts with the lead
investigators of the Australian Stroke Registry (Professor Craig Anderson, University of Sydney), and the
Acute Coronary Syndrome Prospective Audit (ACACIA) and the SNAPSHOT ACS study (Professors Derek
Chew, Flinders University and David Brieger, University of Sydney). Future research will use data from these
studies to analyse RAC-E in these clinical areas.
Methodological RAC-E issues
A range of methods issues need to be explored. A key issue concerns the approach used to risk adjust.
Initial applications used fixed effects (or non-hierarchical) regression models to estimate expected cost and
outcome values. More recent applications have looked at the use of genetic matching algorithms to identify
matching cohorts of patients with similar baseline demographic and clinical characteristics.
If applied nationally, matching becomes infeasible. However, it will be important to control for differences
in hospital characteristics (e.g. size, teaching status, etc.) and so hierarchical (or multilevel) modelling
approaches will be required. The validity of regression-based approaches will need to be established
against more conservative methods, such as matching.
As in all observation studies, unmeasured confounding is a potential source of bias. Instrumental variables
(variables that are highly correlated with the probability of attending a particular hospital, but unrelated to
the measured outcomes) can be used to imitate the process of randomisation (Gowrisankaran & Town
1999). Further work is required to assess the potential for using variables such as distance between
hospitals and patients’ location prior to hospitalization, within the RAC-E framework.
Other issues include investigation of the trade-off between using recent data (to evaluate contemporary
clinical practice) and the duration of the observation period used to identify intermediate endpoints (from
which long-term costs and benefits are extrapolated). This will involve assessing the stability of RAC-E
across alternative observation periods, noting that the optimal observation period may vary by clinical area.
Another area of methodological development involves the use of the quality adjusted life year (QALY) as a
measure of outcome in RAC-E. The QALY is the preferred measure of outcome for cost-effectiveness
analysis because it represents both survival and quality of life (QoL) effects. Decision analytic frameworks
facilitate the estimation of QALYs via the assignment of QoL weights to health states represented in the
Assessing equitable and efficient solutions to reduce hospital demand
Page | 28
model. Approaches to extending RAC-E to incorporate QoL effects will be investigated, perhaps by
extending the health states and pathways represented in the decision analytic model structures.
Determinants of variation in RAC-E
As noted in section 3.6, the perceived limitations of linked routinely collected data, with respect to
completeness and detail, means that on their own, RAC-E analyses are unlikely to provide sufficient
evidence to change practice. Corroborating data, that identifies links areas of variation in clinical practice to
estimated differences in costs and benefits, are hypothesised to provide a greater incentive to both
clinicians and health service managers to change processes in order to improve performance.
The research team has identified the area of ‘process mining’ as a potentially useful quantitative method
that can be used to represent processes (or pathways) of care using routinely collected clinical data.
Preliminary applications to compare pathways of care for patients presenting with chest pain have shown
that it is particularly useful for identifying variations in processes between different hospitals.
Further exploration and application of process mining is required to define optimal, and preferably
standardized, approaches to the collection and formatting of routinely collected data, analysis, and
reporting of the outputs, so as to validate evidence of variation in RAC-E across institutions.
Conclusions
The significance of the developed RAC-E methodology is that it provides an empirical basis for defining cost-
effective clinical practice (practice-based evidence). The use of routinely collected data means that RAC-E
can be applied across wide areas of clinical practice at relatively low cost.
Further refinement of the RAC-E methodology is required (and ongoing). In particular, further exploration
and application of process mining is required to define optimal, and preferably standardised, approaches to
the validation of evidence of variation in RAC-E.
However, the existing methodology generates robust estimates of the consequences of variation in clinical
practice (i.e. differences in costs and outcomes), which in combination with pathway methods, such as
process mining (to identify specific areas of variation) provides a powerful research tool to inform and
encourage the adoption of cost-effective clinical practice.
To facilitate the routine use of RAC-E to improve policy and practice, easier access to more detailed and
more contemporary data for both RAC-E analyses and process mining would be of great value.
5 ADDITIONAL RESOURCES
Manuscripts:
Karnon J, Ben-Tovim D, Pham C, Caffrey O, Hakendorf P, Crotty M, Phillips P. The efficient price: an
opportunity for funding reform. Australian Health Review (accepted March 2011).
Karnon J. Fixing the postcode lottery is a matter of life and death, theconversation.edu.au/articles/fixing-
the-hospital-postcode-lottery-is-a-matter-of-life-and-death-1373. The Conversation (published 5 May
2011).
Caffrey O, Pham C, Karnon J, Ben-Tovim D, Hakendorf P, Crotty M. Comparing hospital services for patients
presenting with chest pain: risk adjusted cost-effectiveness (RAC-E). Revised version submitted to Health
Economics, October 2011.
Assessing equitable and efficient solutions to reduce hospital demand
Page | 29
Pham C, Caffrey O, Karnon J, Ben-Tovim D, Hakendorf P, Crotty M. Evaluating acute stroke services: risk
adjusted cost-effectiveness (RAC-E) analysis using routinely collected data. Submitted to BMC Health
Services Research, March 2011.
Gordon J, Pham C, Karnon J, Crotty M. Assessing the longer-term effectiveness and efficiency of hospital-
based hip fracture services: a retrospective analysis using linked routinely collected data. Submitted to
Journal of Health Services Research and Policy, October 2011.
Gordon J, Pham C, Karnon J, Crotty M. Trends in hip fracture admission rates and outcomes in South
Australia. Draft manuscript.
Presentations:
Evaluating acute stroke services: risk adjusted cost-effectiveness (RAC-E) analysis using routinely collected
data. Australian Health Economics Society Conference, Sydney, September 2010.
Identifying efficient acute clinical pathways for chest pain: using risk adjusted cost-effectiveness (RAC-E)
and linked, routinely collected data to compare hospitals. International Society for Pharmacoeconomics
and Outcomes Research, Baltimore, March 2011.
Economic analysis of health services: developing methods to identify, investigate, and disseminate best
clinical practice. Presented at the Health Economics Study Group, Bangor, Wales, July 2011.
Risk adjusted cost-effectiveness analysis of clinical practice: a first step, National Stroke Data and Quality
Improvement Meeting (NSDQI), Adelaide Convention Centre, 13 September 2011.
Assessing equitable and efficient solutions to reduce hospital demand
Page | 30
6 REFERENCES
Agency for Healthcare Research Quality. 2008. Health care efficiency measures: Identification, categorization, and evaluation no. AHRQ Publication No. 08-0030, Rockville, MD.
Ben-Tovim, DI, Bassham, JE, Bennett, DM, Dougherty, ML, Martin, MA, O'Neill, SJ, Sincock, JL & Szwarcbord,
MG. 2008. Redesigning care at the Flinders Medical Centre: clinical process redesign using "lean thinking". Med J Aust 188: S27-31.
Board, N & Watson, DE. 2010. Using what we gather - harnessing information for improved care. MJA 193:
S93-S94. Duckett, S, Coory, M, Kamp, M, Collins, J, Skethcher-Baker, K & Walker, K. 2008. VLADs for Dummies, ed.
Clinical Practice Improvement Centre, Wiley Publishing Australia Pty Ltd, Milton, QLD. George, B, Harris, A & Mitchell, A. 2001. Cost-effectiveness analysis and the consistency of decision making:
evidence from pharmaceutical reimbursement in Australia (1991 to 1996). Pharmacoeconomics 19: 1103-1109.
Gowrisankaran, G & Town, RJ. 1999. Estimating the quality of care in hospitals using instrumental variables.
J Health Econ 18: 747-767. Grieve, R, Hutton, J, Bhalla, A, Rastenyte, D, Ryglewicz, D, Sarti, C, Lamassa, M, Giroud, M, Dundas, R &
Wolfe, CD. 2001. A comparison of the costs and survival of hospital-admitted stroke patients across Europe. Stroke 32: 1684-1691.
Hollingsworth, B. 2008. The measurement of efficiency and productivity of health care delivery. Health
Economics 17: 1107-1128. House of Lords. 2001. Science and Technology - Fourth report. Royston, P & Parmar, MK. 2002. Flexible parametric proportional-hazards and proportional-odds models
for censored survival data, with application to prognostic modelling and estimation of treatment effects. Statistics in Medicine 21: 2175-2197.
StataCorp. 2009. Stata 11 Base Reference Manual, vol. 1, 3 vols., StataCorp LP, College Station, TX. van der Aalst, WMP. 2011. Process Mining: Discovery, Conformance and Enhancement of Business
Processes, 1 edn, Springer-Verlag, Berlin-Heidelberg.
Assessing equitable and efficient solutions to reduce hospital demand
Page | 31
APPENDIX 1
Project management
How well the research team worked together to fulfil the objectives of the project
The research team was assembled for the purposes of this project, and the team has worked extremely
well. The combination of health economics (Karnon), clinical epidemiology (Ben-Tovim and Hakendorf), and
clinical expertise in key areas of investigation (Crotty) has been of great value and led to ongoing research
relationships that have involved specific applications of RAC-E, as well as applications for funding to
continue the development and application of the RAC-E methodology.
Whether there was adequate support from the reference, advisory and/or user groups, as appropriate
The team have had ready access to a range of relevant clinical and policy expertise. In addition to the round
of interviews conducted with key clinical experts to inform priority areas for investigation, input to analytic
structure and interpretation of the results of the various applied RAC-E analyses have been obtained from
individual clinicians (as listed in the report), clinical networks (e.g. the Statewide Stroke Clinical Network),
policy forums (e.g. the Data Analysis group at SA Health, the Do It for Life co-ordinators, as well as the
policy steering group at SA Health).
The contributions made by the above groups to the production of the research, and research outputs,
and the effectiveness of collaborative arrangements across these groups
As above, the range of groups and individuals listed above provided significant input to the research at
various stages. All contacted groups and individuals had a keen interest in the subject of the research and
so collaborative arrangements worked well.
Any problematic issues which hindered the progress of the research
As RAC-E uses linked, routinely collected data, a significant period of time was required to assemble the
master dataset. SANT Datalink only came into being during the course of the research project and so we
were not able to access their services.
Initial RAC-E applications used the minimum hospital dataset (as collected by the Integrated South
Australian Activity Collection). Over the course of the project we moved towards the use of data collected
by OACIS, which provides significantly more information on clinical aspects of eligible patients (e.g. instead
of potentially inconsistent recording of whether a patient has diabetes (ISAAC), laboratory test results
recording HbA1c levels are available, which provide a more robust basis for controlling for differences in
casemix between hospitals. As such OACIS is an extremely useful data source, but there is no routine
process for accessing OACIS data for research purposes. Future research will be aided by improved access
to OACIS data.
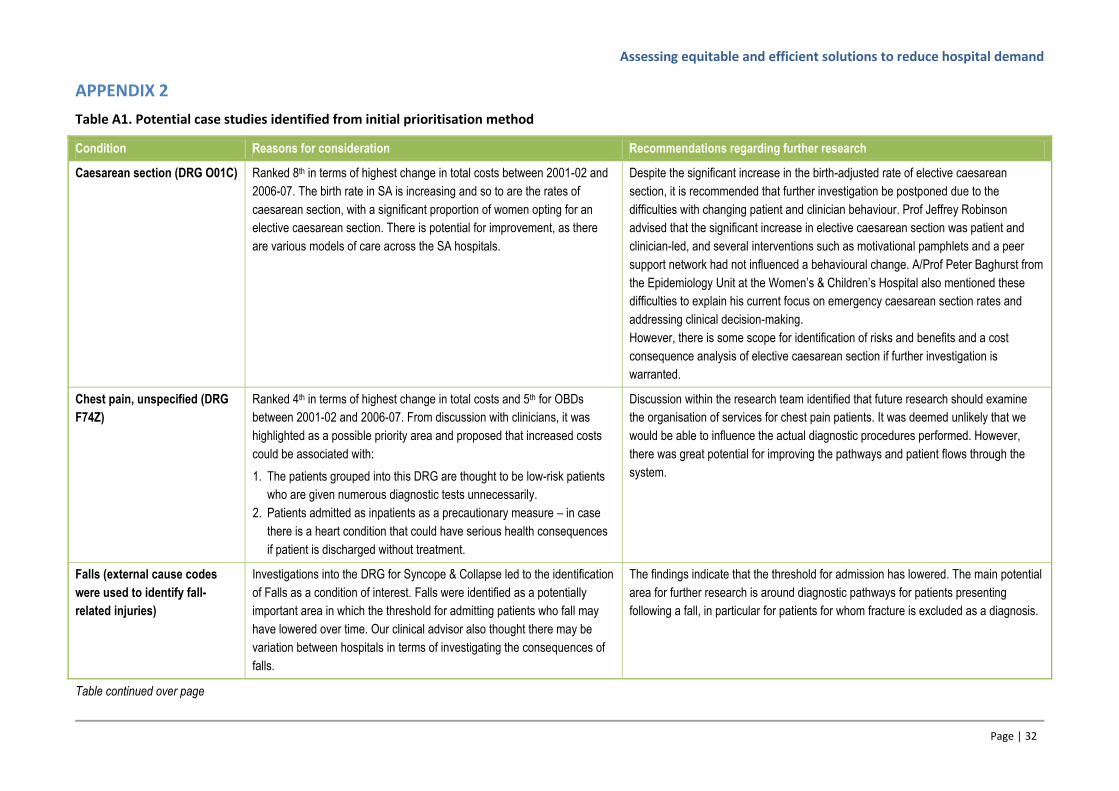
Assessing equitable and efficient solutions to reduce hospital demand
Page | 32
APPENDIX 2
Table A1. Potential case studies identified from initial prioritisation method
Condition Reasons for consideration Recommendations regarding further research
Caesarean section (DRG O01C) Ranked 8th in terms of highest change in total costs between 2001-02 and
2006-07. The birth rate in SA is increasing and so to are the rates of
caesarean section, with a significant proportion of women opting for an
elective caesarean section. There is potential for improvement, as there
are various models of care across the SA hospitals.
Despite the significant increase in the birth-adjusted rate of elective caesarean
section, it is recommended that further investigation be postponed due to the
difficulties with changing patient and clinician behaviour. Prof Jeffrey Robinson
advised that the significant increase in elective caesarean section was patient and
clinician-led, and several interventions such as motivational pamphlets and a peer
support network had not influenced a behavioural change. A/Prof Peter Baghurst from
the Epidemiology Unit at the Women’s & Children’s Hospital also mentioned these
difficulties to explain his current focus on emergency caesarean section rates and
addressing clinical decision-making.
However, there is some scope for identification of risks and benefits and a cost
consequence analysis of elective caesarean section if further investigation is
warranted.
Chest pain, unspecified (DRG
F74Z)
Ranked 4th in terms of highest change in total costs and 5th for OBDs
between 2001-02 and 2006-07. From discussion with clinicians, it was
highlighted as a possible priority area and proposed that increased costs
could be associated with:
1. The patients grouped into this DRG are thought to be low-risk patients
who are given numerous diagnostic tests unnecessarily.
2. Patients admitted as inpatients as a precautionary measure – in case
there is a heart condition that could have serious health consequences
if patient is discharged without treatment.
Discussion within the research team identified that future research should examine
the organisation of services for chest pain patients. It was deemed unlikely that we
would be able to influence the actual diagnostic procedures performed. However,
there was great potential for improving the pathways and patient flows through the
system.
Falls (external cause codes
were used to identify fall-
related injuries)
Investigations into the DRG for Syncope & Collapse led to the identification
of Falls as a condition of interest. Falls were identified as a potentially
important area in which the threshold for admitting patients who fall may
have lowered over time. Our clinical advisor also thought there may be
variation between hospitals in terms of investigating the consequences of
falls.
The findings indicate that the threshold for admission has lowered. The main potential
area for further research is around diagnostic pathways for patients presenting
following a fall, in particular for patients for whom fracture is excluded as a diagnosis.
Table continued over page
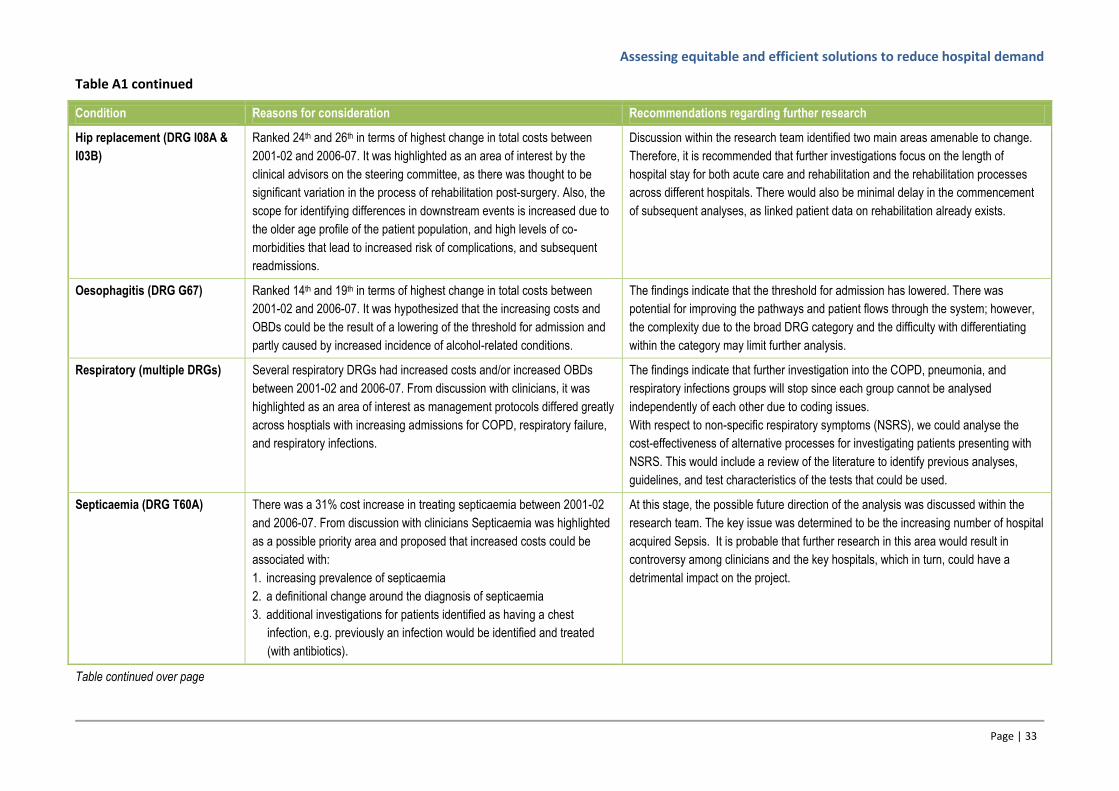
Assessing equitable and efficient solutions to reduce hospital demand
Page | 33
Table A1 continued
Condition Reasons for consideration Recommendations regarding further research
Hip replacement (DRG I08A &
I03B)
Ranked 24th and 26th in terms of highest change in total costs between
2001-02 and 2006-07. It was highlighted as an area of interest by the
clinical advisors on the steering committee, as there was thought to be
significant variation in the process of rehabilitation post-surgery. Also, the
scope for identifying differences in downstream events is increased due to
the older age profile of the patient population, and high levels of co-
morbidities that lead to increased risk of complications, and subsequent
readmissions.
Discussion within the research team identified two main areas amenable to change.
Therefore, it is recommended that further investigations focus on the length of
hospital stay for both acute care and rehabilitation and the rehabilitation processes
across different hospitals. There would also be minimal delay in the commencement
of subsequent analyses, as linked patient data on rehabilitation already exists.
Oesophagitis (DRG G67) Ranked 14th and 19th in terms of highest change in total costs between
2001-02 and 2006-07. It was hypothesized that the increasing costs and
OBDs could be the result of a lowering of the threshold for admission and
partly caused by increased incidence of alcohol-related conditions.
The findings indicate that the threshold for admission has lowered. There was
potential for improving the pathways and patient flows through the system; however,
the complexity due to the broad DRG category and the difficulty with differentiating
within the category may limit further analysis.
Respiratory (multiple DRGs) Several respiratory DRGs had increased costs and/or increased OBDs
between 2001-02 and 2006-07. From discussion with clinicians, it was
highlighted as an area of interest as management protocols differed greatly
across hosptials with increasing admissions for COPD, respiratory failure,
and respiratory infections.
The findings indicate that further investigation into the COPD, pneumonia, and
respiratory infections groups will stop since each group cannot be analysed
independently of each other due to coding issues.
With respect to non-specific respiratory symptoms (NSRS), we could analyse the
cost-effectiveness of alternative processes for investigating patients presenting with
NSRS. This would include a review of the literature to identify previous analyses,
guidelines, and test characteristics of the tests that could be used.
Septicaemia (DRG T60A) There was a 31% cost increase in treating septicaemia between 2001-02
and 2006-07. From discussion with clinicians Septicaemia was highlighted
as a possible priority area and proposed that increased costs could be
associated with:
1. increasing prevalence of septicaemia
2. a definitional change around the diagnosis of septicaemia
3. additional investigations for patients identified as having a chest
infection, e.g. previously an infection would be identified and treated
(with antibiotics).
At this stage, the possible future direction of the analysis was discussed within the
research team. The key issue was determined to be the increasing number of hospital
acquired Sepsis. It is probable that further research in this area would result in
controversy among clinicians and the key hospitals, which in turn, could have a
detrimental impact on the project.
Table continued over page

Assessing equitable and efficient solutions to reduce hospital demand
Page | 34
Table A1 continued
Condition Reasons for consideration Recommendations regarding further research
Stroke (DRG B70) Ranked 19th in terms of highest change in total costs between 2001-02 and
2006-07. It was highlighted as an area of interest by the clinical advisors
on the steering committee, as it is classified as a high burden of disease
illness with many stroke survivors requiring ongoing rehabilitation and
support in the community. The practices for the management and
treatment of stroke have also changed. In 2003-04, the Flinders Medical
Centre established a multidisciplinary stroke unit and the National Stroke
Foundation have recently published NHRMC-approved clinical guidelines.
Discussions within the research team identified that further research should evaluate
the management and treatment of stroke, comparing models of care in different
hospitals, and the effects of stroke rehabilitation. Similar to the case study for hips,
there would be minimal delay in the commencement of the rehabilitation analyses, as
linked patient data on rehabilitation already exists.
Transient ischaemic attack
(TIA) (DRG B69)
This was lower down on the rankings of highest change in total costs but
was deemed important by the clinical advisors as treatment and
management of this condition would have a direct impact on the risk of
stroke. Awareness of this condition has also increased markedly in recent
years through the National Stroke Foundation.
Discussions within the research team identified that further research should examine
the management of TIA (including the effects of increased tissue plasminogen
activator use) and its impact on the likelihood of stroke.
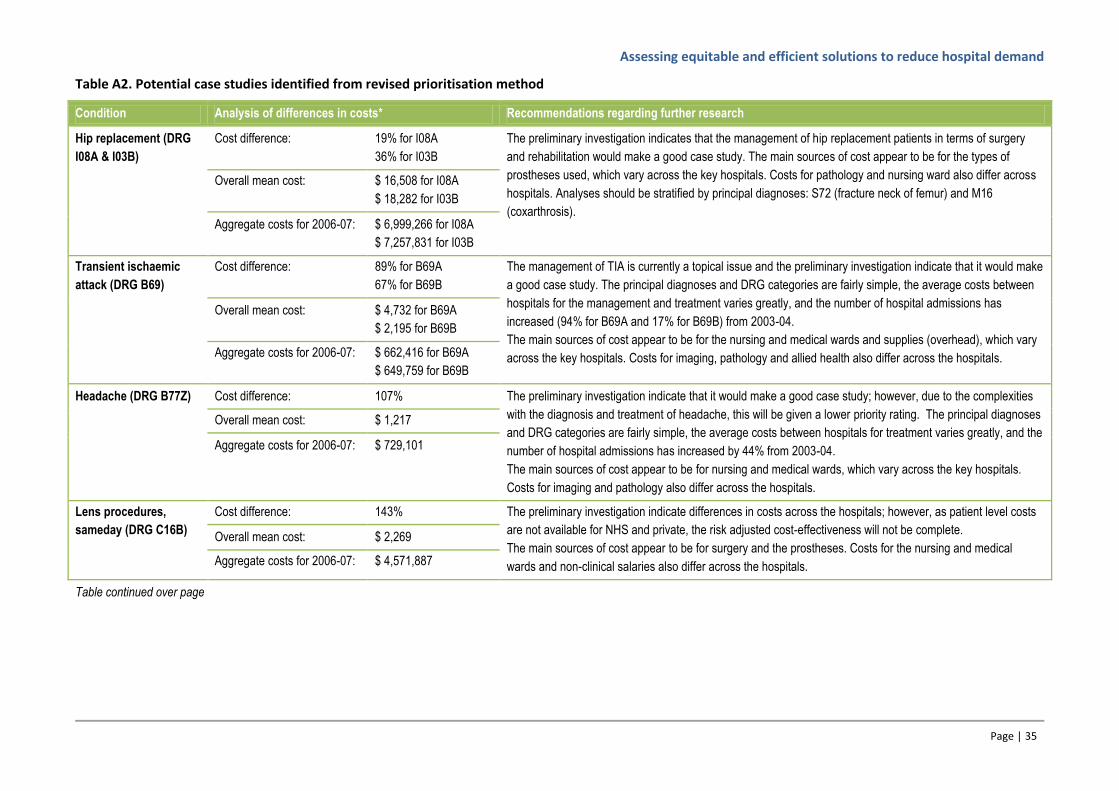
Assessing equitable and efficient solutions to reduce hospital demand
Page | 35
Table A2. Potential case studies identified from revised prioritisation method
Condition Analysis of differences in costs* Recommendations regarding further research
Hip replacement (DRG
I08A & I03B)
Cost difference: 19% for I08A
36% for I03B
The preliminary investigation indicates that the management of hip replacement patients in terms of surgery
and rehabilitation would make a good case study. The main sources of cost appear to be for the types of
prostheses used, which vary across the key hospitals. Costs for pathology and nursing ward also differ across
hospitals. Analyses should be stratified by principal diagnoses: S72 (fracture neck of femur) and M16
(coxarthrosis).
Overall mean cost: $ 16,508 for I08A
$ 18,282 for I03B
Aggregate costs for 2006-07: $ 6,999,266 for I08A
$ 7,257,831 for I03B
Transient ischaemic
attack (DRG B69)
Cost difference: 89% for B69A
67% for B69B
The management of TIA is currently a topical issue and the preliminary investigation indicate that it would make
a good case study. The principal diagnoses and DRG categories are fairly simple, the average costs between
hospitals for the management and treatment varies greatly, and the number of hospital admissions has
increased (94% for B69A and 17% for B69B) from 2003-04.
The main sources of cost appear to be for the nursing and medical wards and supplies (overhead), which vary
across the key hospitals. Costs for imaging, pathology and allied health also differ across the hospitals.
Overall mean cost: $ 4,732 for B69A
$ 2,195 for B69B
Aggregate costs for 2006-07: $ 662,416 for B69A
$ 649,759 for B69B
Headache (DRG B77Z) Cost difference: 107% The preliminary investigation indicate that it would make a good case study; however, due to the complexities
with the diagnosis and treatment of headache, this will be given a lower priority rating. The principal diagnoses
and DRG categories are fairly simple, the average costs between hospitals for treatment varies greatly, and the
number of hospital admissions has increased by 44% from 2003-04.
The main sources of cost appear to be for nursing and medical wards, which vary across the key hospitals.
Costs for imaging and pathology also differ across the hospitals.
Overall mean cost: $ 1,217
Aggregate costs for 2006-07: $ 729,101
Lens procedures,
sameday (DRG C16B)
Cost difference: 143% The preliminary investigation indicate differences in costs across the hospitals; however, as patient level costs
are not available for NHS and private, the risk adjusted cost-effectiveness will not be complete.
The main sources of cost appear to be for surgery and the prostheses. Costs for the nursing and medical
wards and non-clinical salaries also differ across the hospitals.
Overall mean cost: $ 2,269
Aggregate costs for 2006-07: $ 4,571,887
Table continued over page
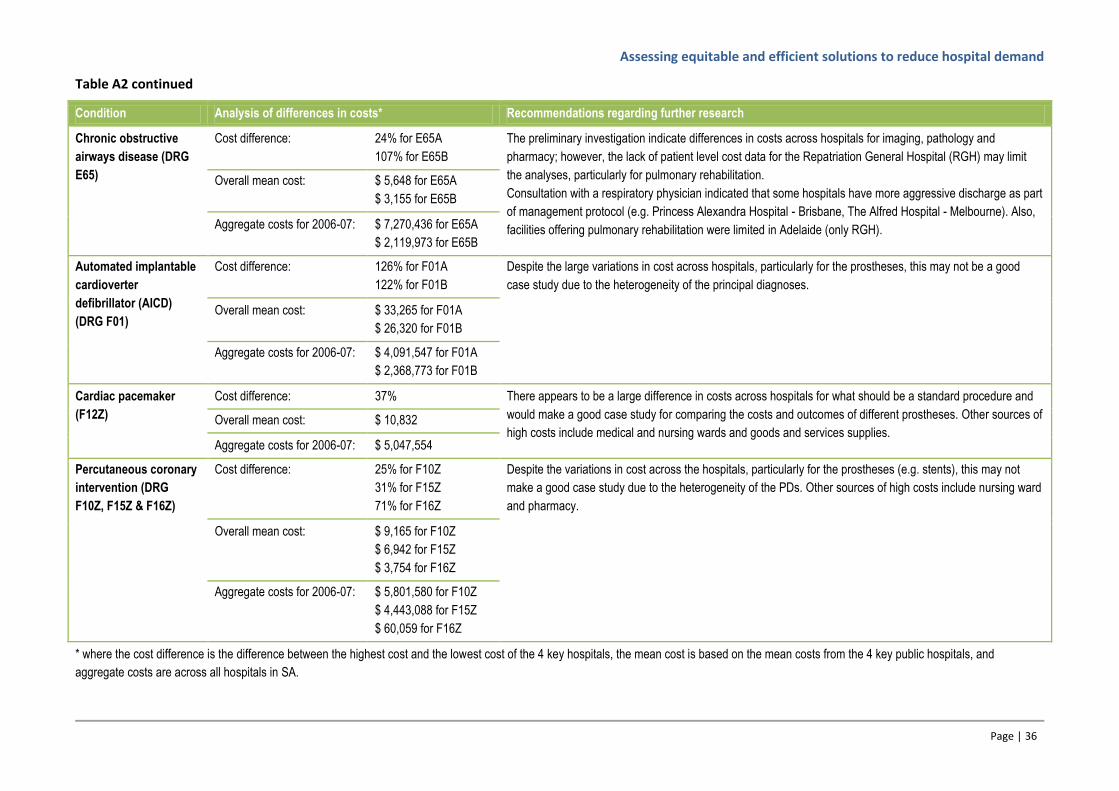
Assessing equitable and efficient solutions to reduce hospital demand
Page | 36
Table A2 continued
Condition Analysis of differences in costs* Recommendations regarding further research
Chronic obstructive
airways disease (DRG
E65)
Cost difference: 24% for E65A
107% for E65B
The preliminary investigation indicate differences in costs across hospitals for imaging, pathology and
pharmacy; however, the lack of patient level cost data for the Repatriation General Hospital (RGH) may limit
the analyses, particularly for pulmonary rehabilitation.
Consultation with a respiratory physician indicated that some hospitals have more aggressive discharge as part
of management protocol (e.g. Princess Alexandra Hospital - Brisbane, The Alfred Hospital - Melbourne). Also,
facilities offering pulmonary rehabilitation were limited in Adelaide (only RGH).
Overall mean cost: $ 5,648 for E65A
$ 3,155 for E65B
Aggregate costs for 2006-07: $ 7,270,436 for E65A
$ 2,119,973 for E65B
Automated implantable
cardioverter
defibrillator (AICD)
(DRG F01)
Cost difference: 126% for F01A
122% for F01B
Despite the large variations in cost across hospitals, particularly for the prostheses, this may not be a good
case study due to the heterogeneity of the principal diagnoses.
Overall mean cost: $ 33,265 for F01A
$ 26,320 for F01B
Aggregate costs for 2006-07: $ 4,091,547 for F01A
$ 2,368,773 for F01B
Cardiac pacemaker
(F12Z)
Cost difference: 37% There appears to be a large difference in costs across hospitals for what should be a standard procedure and
would make a good case study for comparing the costs and outcomes of different prostheses. Other sources of
high costs include medical and nursing wards and goods and services supplies. Overall mean cost: $ 10,832
Aggregate costs for 2006-07: $ 5,047,554
Percutaneous coronary
intervention (DRG
F10Z, F15Z & F16Z)
Cost difference: 25% for F10Z
31% for F15Z
71% for F16Z
Despite the variations in cost across the hospitals, particularly for the prostheses (e.g. stents), this may not
make a good case study due to the heterogeneity of the PDs. Other sources of high costs include nursing ward
and pharmacy.
Overall mean cost: $ 9,165 for F10Z
$ 6,942 for F15Z
$ 3,754 for F16Z
Aggregate costs for 2006-07: $ 5,801,580 for F10Z
$ 4,443,088 for F15Z
$ 60,059 for F16Z
* where the cost difference is the difference between the highest cost and the lowest cost of the 4 key hospitals, the mean cost is based on the mean costs from the 4 key public hospitals, and
aggregate costs are across all hospitals in SA.
Related Documents


