Assessing climate change vulnerability of ecosystems in the Southeast Jennifer Costanza January 15, 2015

Assessing ecosystem vulnerability
Jul 15, 2015
Welcome message from author
This document is posted to help you gain knowledge. Please leave a comment to let me know what you think about it! Share it to your friends and learn new things together.
Transcript
Assessing climate change vulnerability of ecosystems in the Southeast
Jennifer CostanzaJanuary 15, 2015
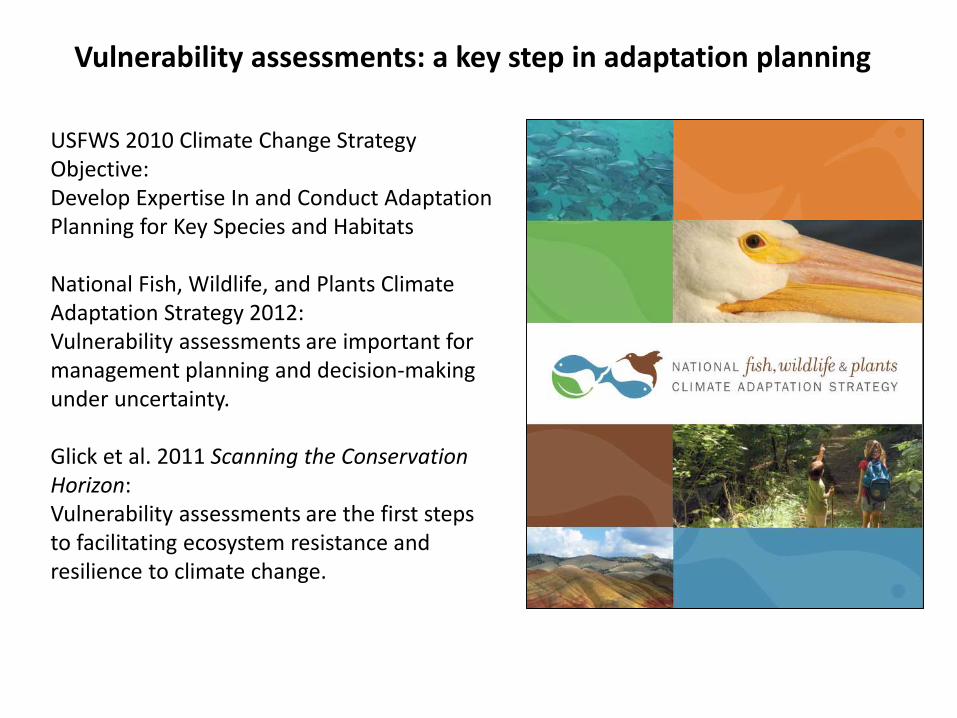
Vulnerability assessments: a key step in adaptation planning
USFWS 2010 Climate Change Strategy Objective: Develop Expertise In and Conduct Adaptation Planning for Key Species and Habitats
National Fish, Wildlife, and Plants Climate Adaptation Strategy 2012:Vulnerability assessments are important for management planning and decision-making under uncertainty.
Glick et al. 2011 Scanning the Conservation Horizon:Vulnerability assessments are the first steps to facilitating ecosystem resistance and resilience to climate change.
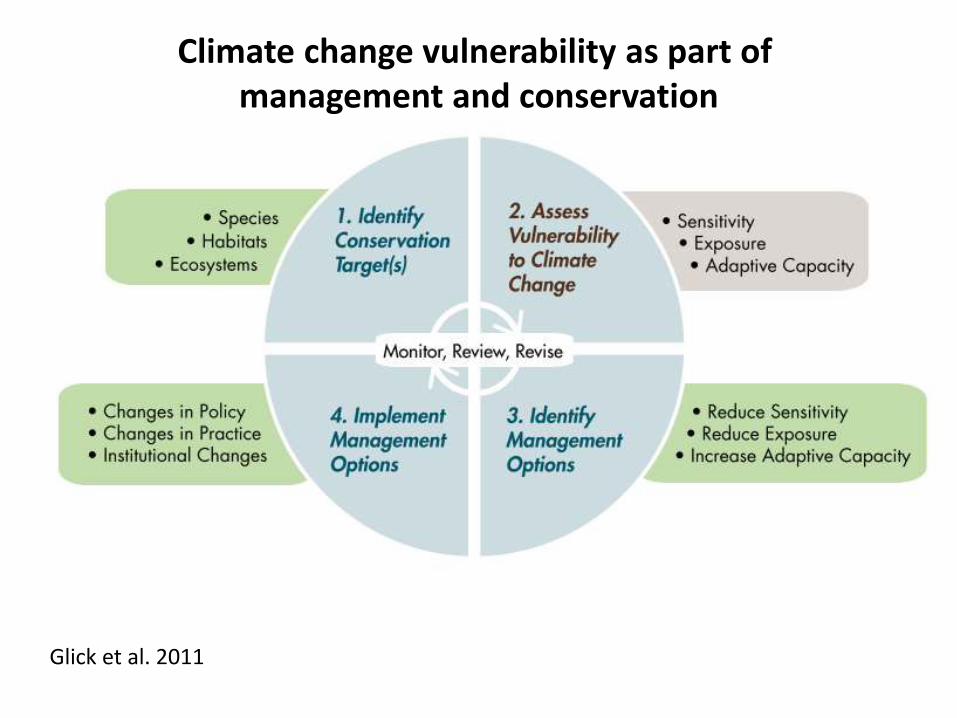
Climate change vulnerability as part of management and conservation
Glick et al. 2011
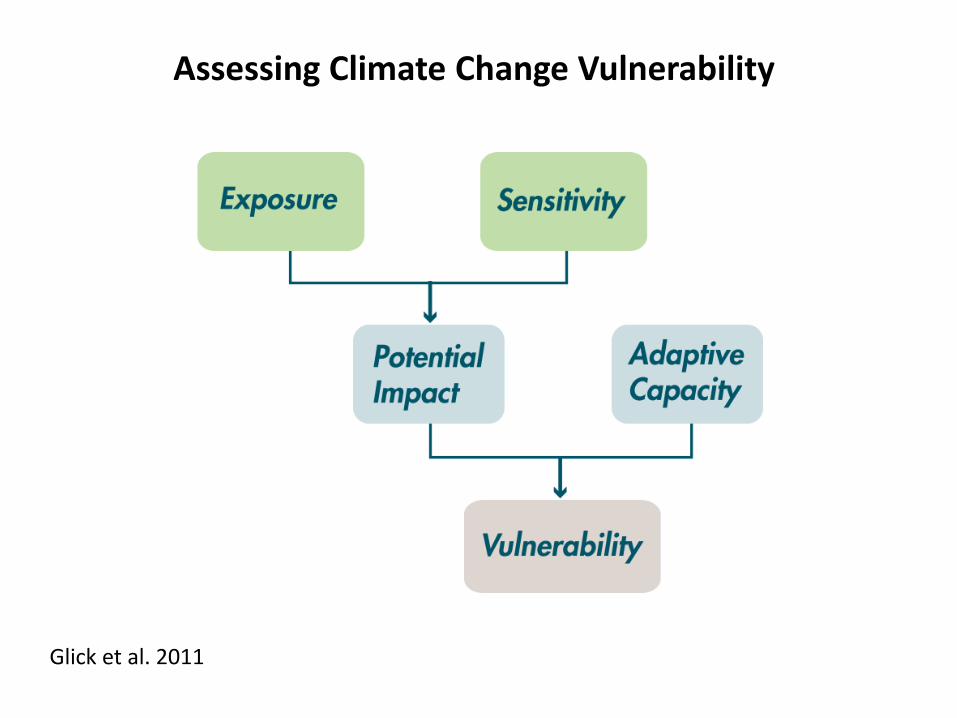
Assessing Climate Change Vulnerability
Glick et al. 2011
Objective
Assess climate change vulnerability for a set of ecosystems in the Southeast and Caribbean.
• Phase 1: Synthesize literature and GIS data on sensitivity, exposure, and adaptive capacity for 12 ecosystems
• Phase 2: Use NatureServe’s Habitat Climate Change Vulnerability Index (HCCVI) for 2 of these ecosystems
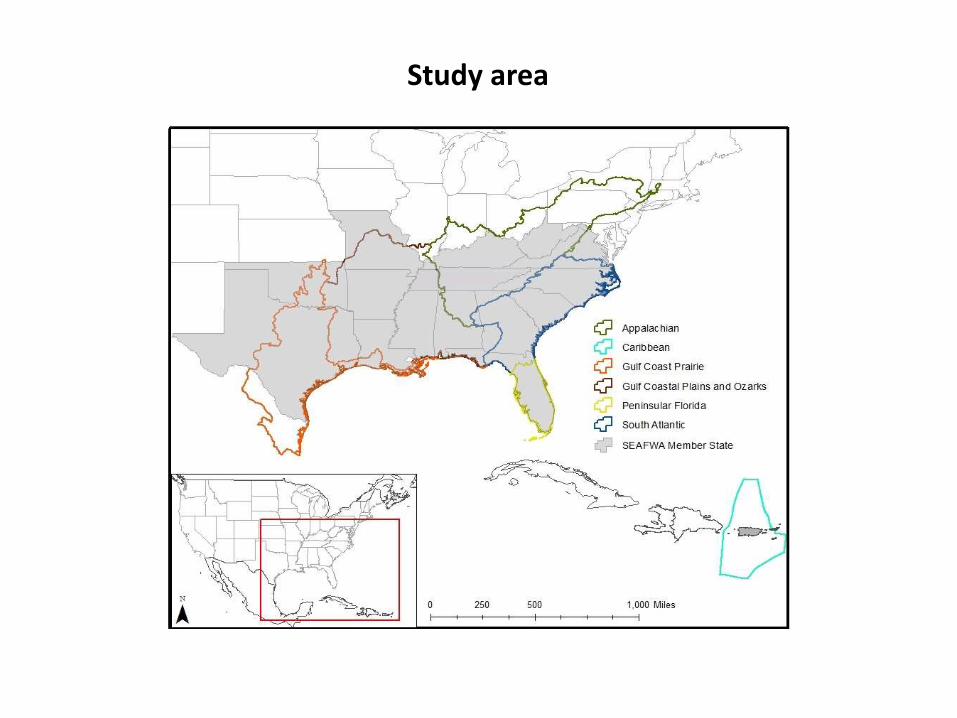
Study area
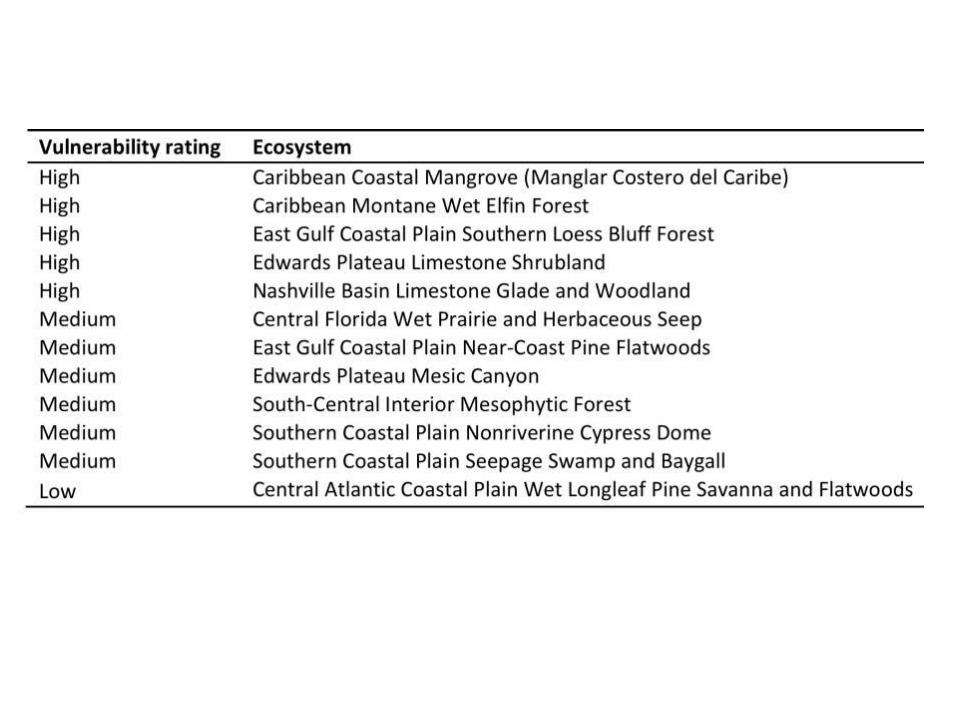
Approach: Ecosystem selection
Initial criteria: likely to be sensitive to climate change• Coastal or coastal plain regions• Wetlands• High elevation systems• Endemic to geographically discrete conditions, special soils
or other unique environments• IUCN Threatened• Suggestions from LCCs
Resulted in a list of 55 potential ecosystems in the Southeast and Caribbean.

Approach: Ecosystem selection
Ecosystem (NatureServe Ecological System)
Caribbean Coastal Mangrove
Caribbean Montane Wet Elfin Forest
Central Atlantic Coastal Plain Wet Longleaf Pine Savanna and Flatwoods
Central Florida Wet Prairie and Herbaceous Seep
East Gulf Coastal Plain Near-coast Pine Flatwoods
East Gulf Coastal Plain Southern Loess Bluff Forest
Edwards Plateau Limestone Shrubland
Edwards Plateau Mesic Canyon
Nashville Basin Limestone Glade and Woodland
South-Central Interior Mesophytic Forest
Southern Coastal Plain Nonriverine Cypress Dome
Southern Coastal Plain Seepage Swamp and Baygall
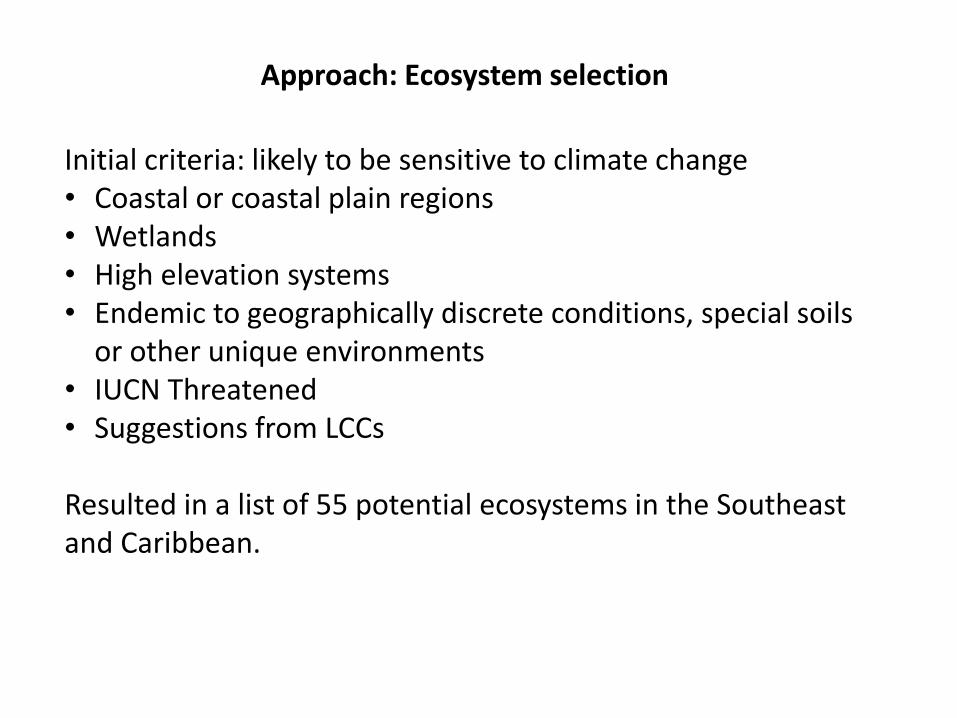
Many vulnerability assessments have been done for species
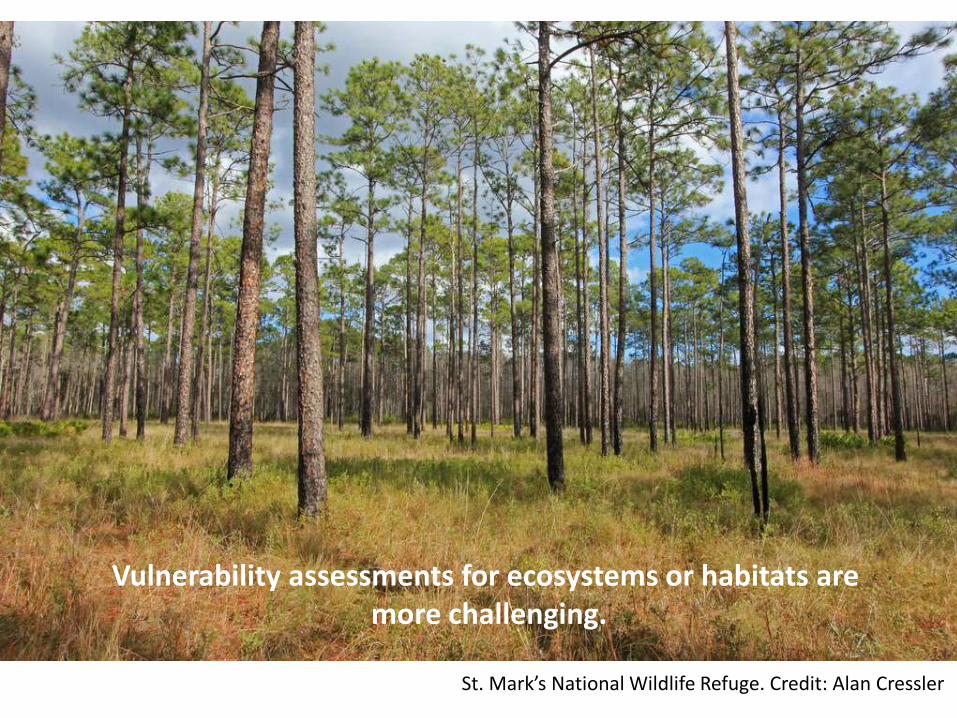
Vulnerability assessments for ecosystems or habitats are more challenging.
St. Mark’s National Wildlife Refuge. Credit: Alan Cressler
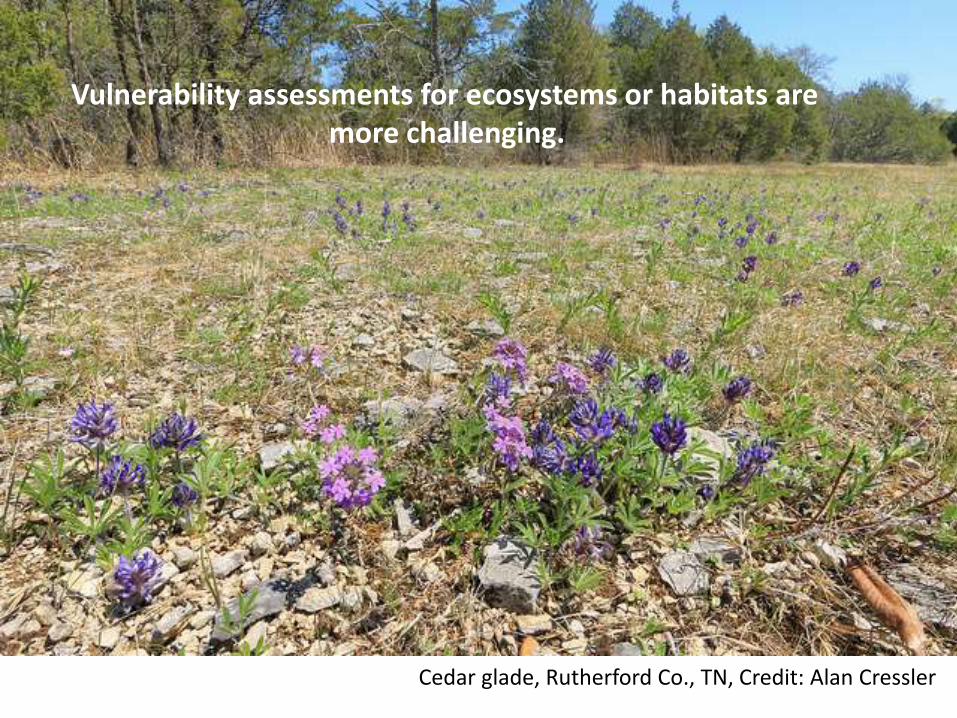
Cedar glade, Rutherford Co., TN, Credit: Alan Cressler
Vulnerability assessments for ecosystems or habitats are more challenging.
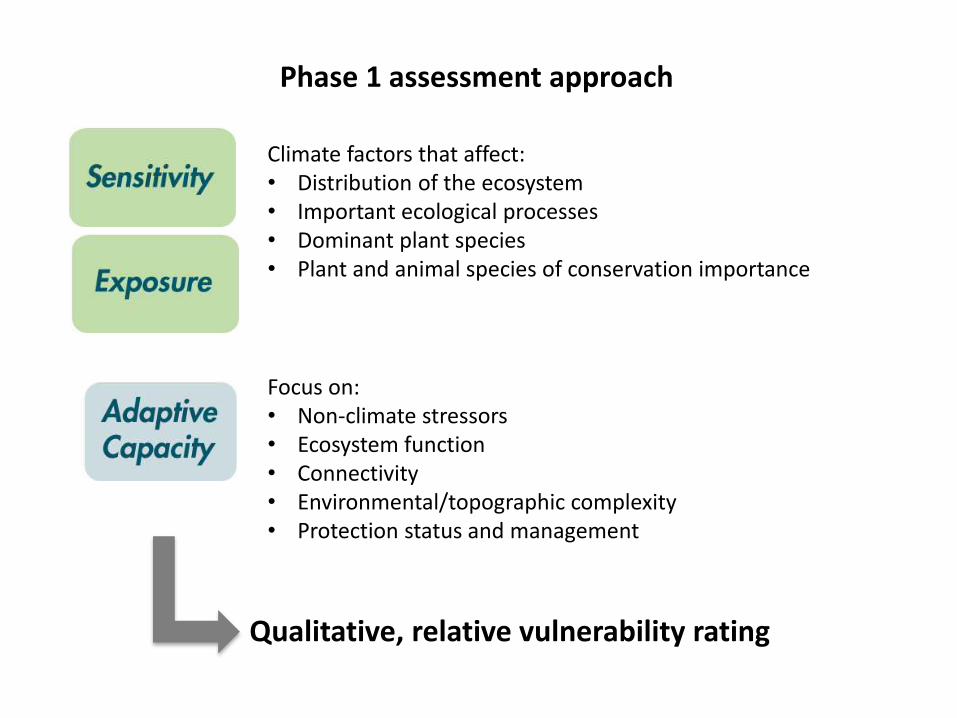
Phase 1 assessment approach
Climate factors that affect:• Distribution of the ecosystem• Important ecological processes • Dominant plant species• Plant and animal species of conservation importance
Focus on:• Non-climate stressors• Ecosystem function• Connectivity• Environmental/topographic complexity• Protection status and management
Qualitative, relative vulnerability rating
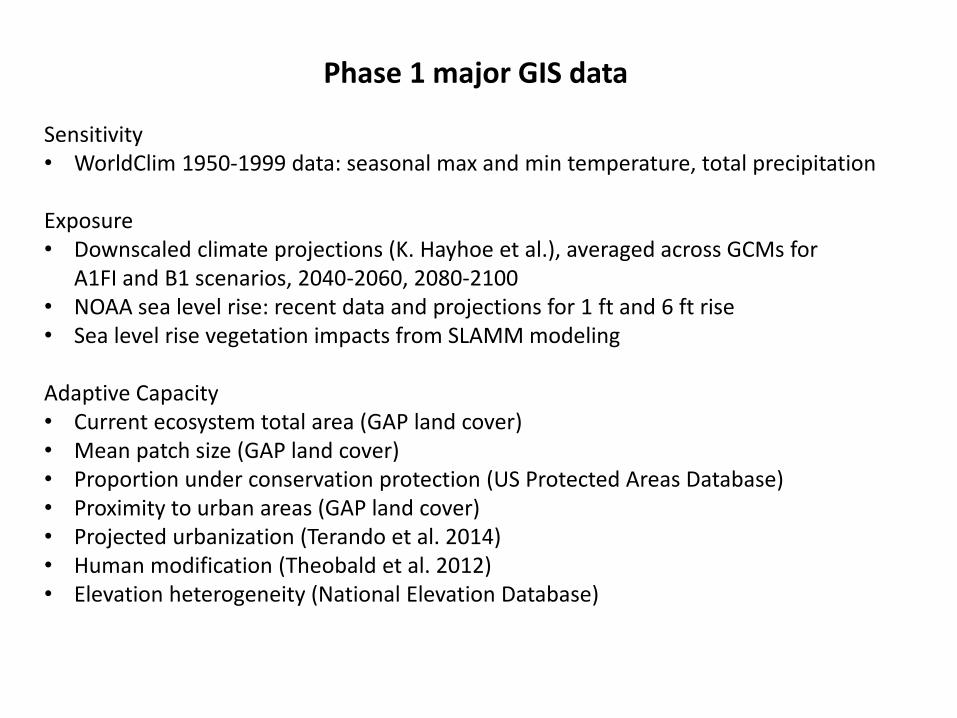
Phase 1 major GIS data
Sensitivity• WorldClim 1950-1999 data: seasonal max and min temperature, total precipitation
Exposure• Downscaled climate projections (K. Hayhoe et al.), averaged across GCMs for
A1FI and B1 scenarios, 2040-2060, 2080-2100• NOAA sea level rise: recent data and projections for 1 ft and 6 ft rise • Sea level rise vegetation impacts from SLAMM modeling
Adaptive Capacity• Current ecosystem total area (GAP land cover)• Mean patch size (GAP land cover)• Proportion under conservation protection (US Protected Areas Database)• Proximity to urban areas (GAP land cover)• Projected urbanization (Terando et al. 2014)• Human modification (Theobald et al. 2012)• Elevation heterogeneity (National Elevation Database)
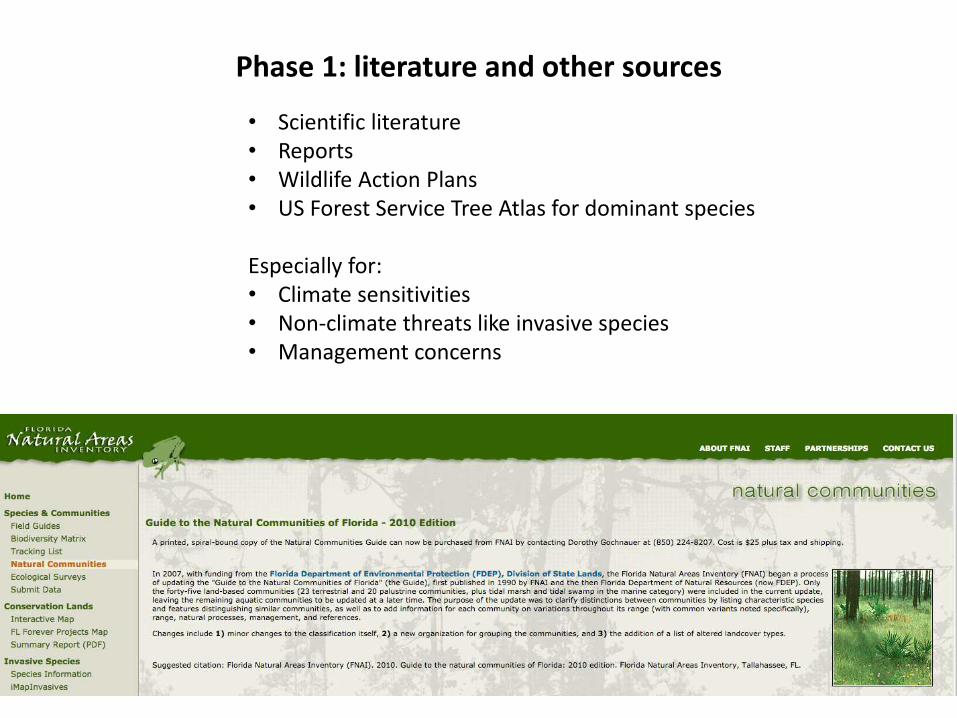
Phase 1: literature and other sources
• Scientific literature• Reports• Wildlife Action Plans• US Forest Service Tree Atlas for dominant species
Especially for: • Climate sensitivities• Non-climate threats like invasive species• Management concerns
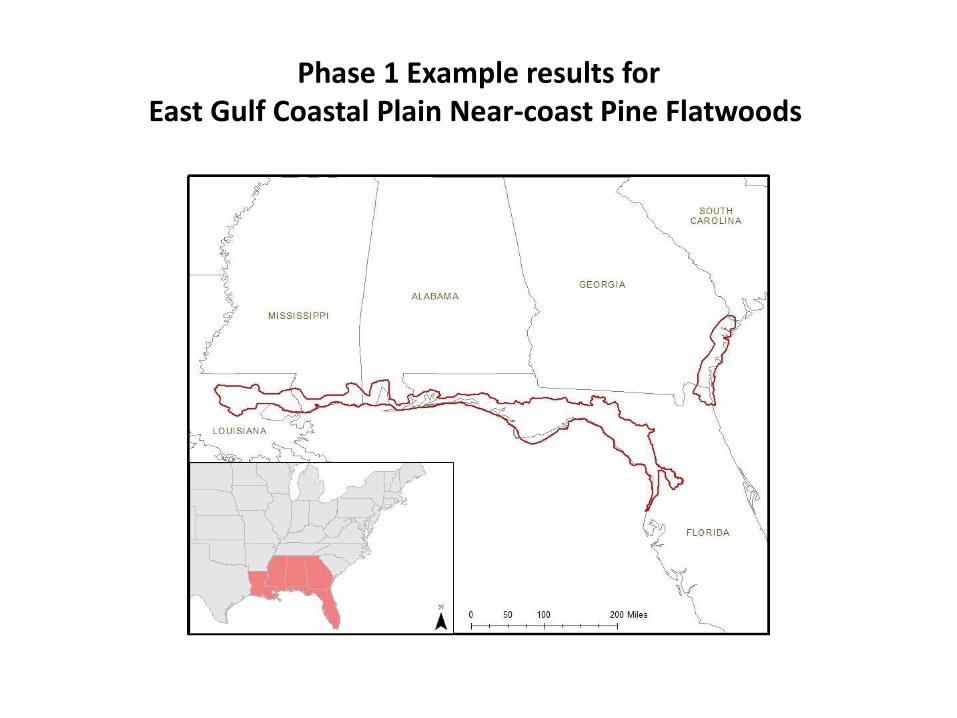
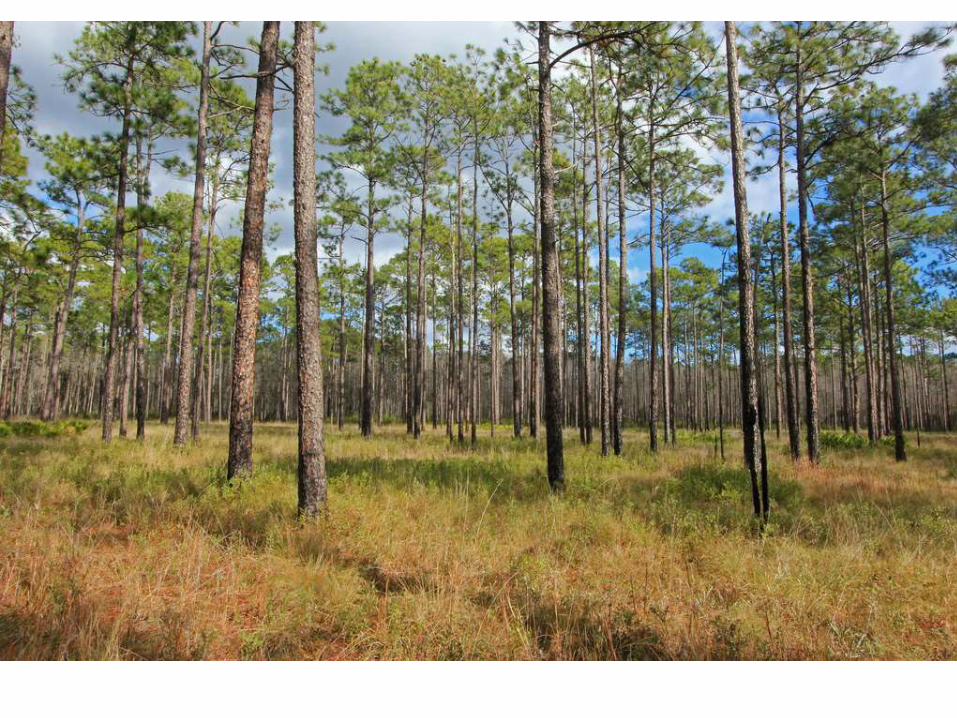
Phase 1 Example results forEast Gulf Coastal Plain Near-coast Pine Flatwoods
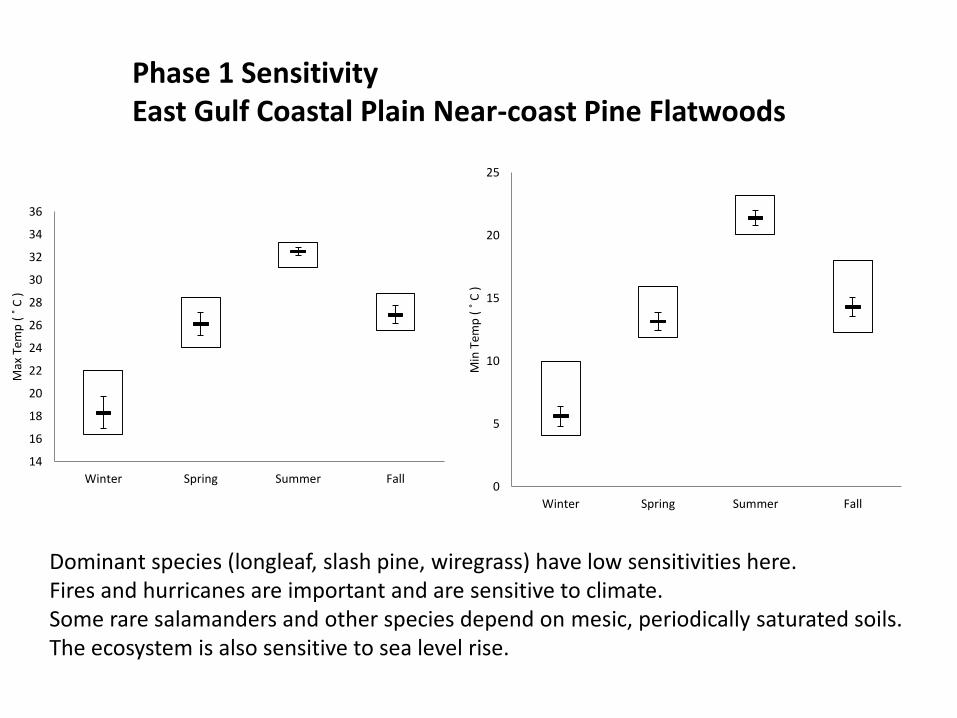
Phase 1 SensitivityEast Gulf Coastal Plain Near-coast Pine Flatwoods
14
16
18
20
22
24
26
28
30
32
34
36
Winter Spring Summer Fall
Max
Tem
p (
˚ C
)
0
5
10
15
20
25
Winter Spring Summer Fall
Min
Tem
p (
˚ C
)
Dominant species (longleaf, slash pine, wiregrass) have low sensitivities here.Fires and hurricanes are important and are sensitive to climate.Some rare salamanders and other species depend on mesic, periodically saturated soils.The ecosystem is also sensitive to sea level rise.
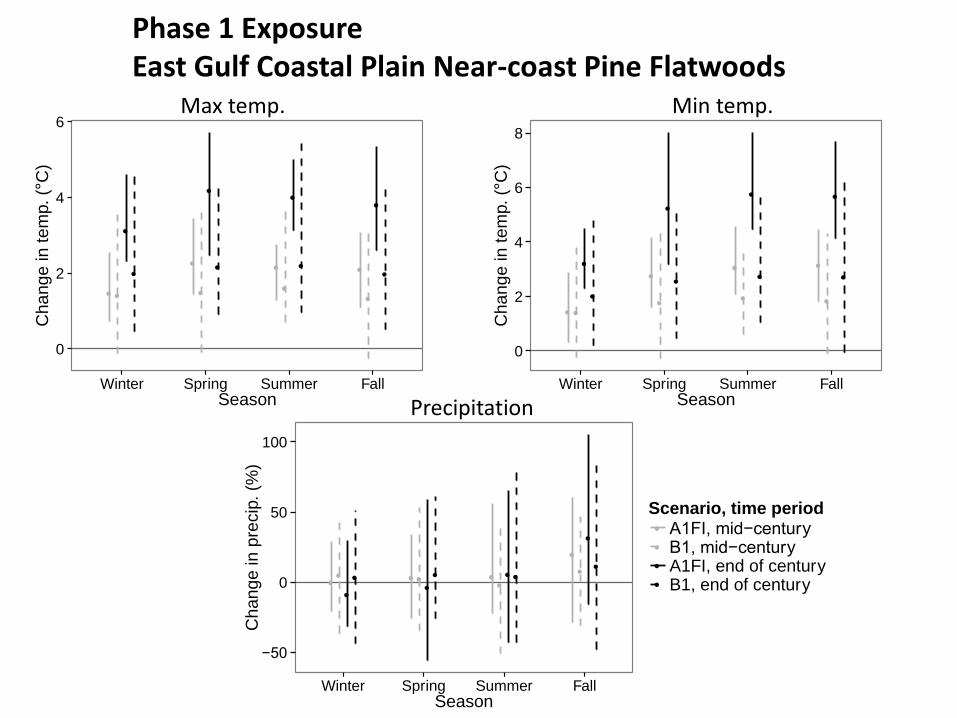
Phase 1 ExposureEast Gulf Coastal Plain Near-coast Pine Flatwoods
● ●
●
●●
●
●
● ●
●
●
● ●
●
●
●
0
2
4
6
Winter Spring Summer FallSeason
Cha
ng
e in
tem
p.
(°C
)
Scenario, time period●
●
●
●
A1FI, mid−centuryB1, mid−centuryA1FI, end of centuryB1, end of century
● ●
●
●
●
●
●
●
●
●
●
●●
●
●
●
0
2
4
6
8
Winter Spring Summer FallSeason
Cha
ng
e in
tem
p.
(°C
)
Scenario, time period●
●
●
●
A1FI, mid−centuryB1, mid−centuryA1FI, end of centuryB1, end of century
●●
●
● ● ●●
● ●●● ●
●
●
●
●
−50
0
50
100
Winter Spring Summer FallSeason
Ch
an
ge in p
recip
. (%
)
Scenario, time period●
●
●
●
A1FI, mid−centuryB1, mid−centuryA1FI, end of centuryB1, end of century
Max temp. Min temp.
Precipitation
●● ● ●
●
●
●
● ●
●
●
●
●●
●
●
0.5
1.0
1.5
2.0
Winter Spring Summer FallSeason
Ch
an
ge in s
td.
dev.
Scenario, time period●
●
●
●
A1FI, mid−centuryB1, mid−centuryA1FI, end of centuryB1, end of century
● ●● ●
●
●
●
●
●
● ●●
●●
●
●
0.8
1.2
1.6
Winter Spring Summer FallSeason
Ch
an
ge in s
td.
dev.
Scenario, time period●
●
●
●
A1FI, mid−centuryB1, mid−centuryA1FI, end of centuryB1, end of century
● ●● ●
●
●● ●
● ●●●
●
●
●●
0.5
1.0
1.5
2.0
Winter Spring Summer FallSeason
Ch
an
ge in s
td.
dev.
Scenario, time period●
●
●
●
A1FI, mid−centuryB1, mid−centuryA1FI, end of centuryB1, end of century
Max temp. Min temp.
Precipitation
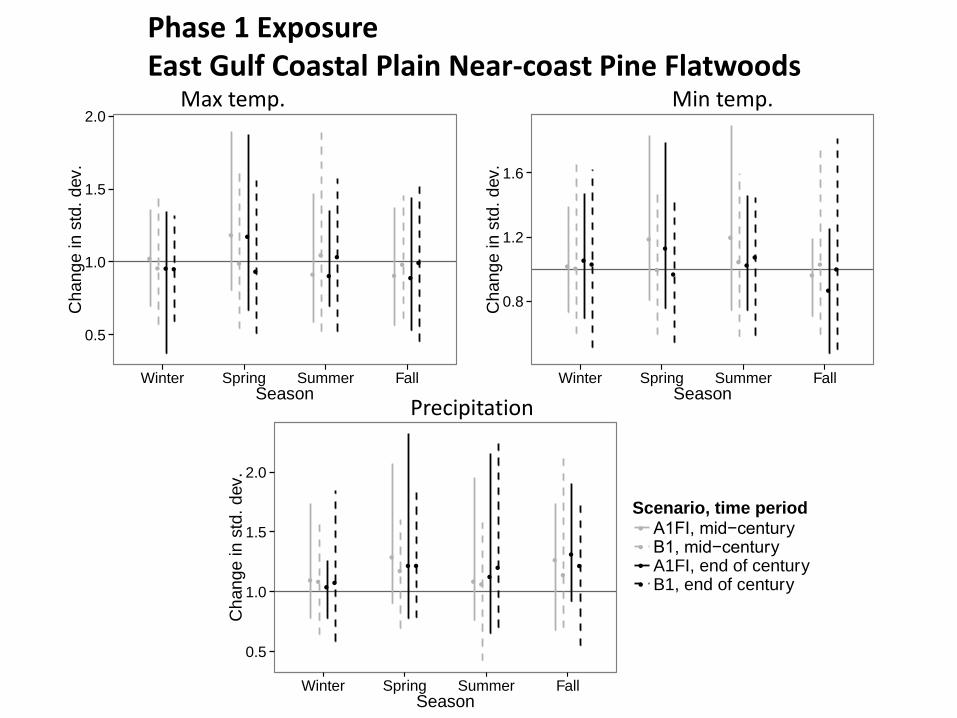
Phase 1 ExposureEast Gulf Coastal Plain Near-coast Pine Flatwoods
Phase 1 ExposureEast Gulf Coastal Plain Near-coast Pine Flatwoods
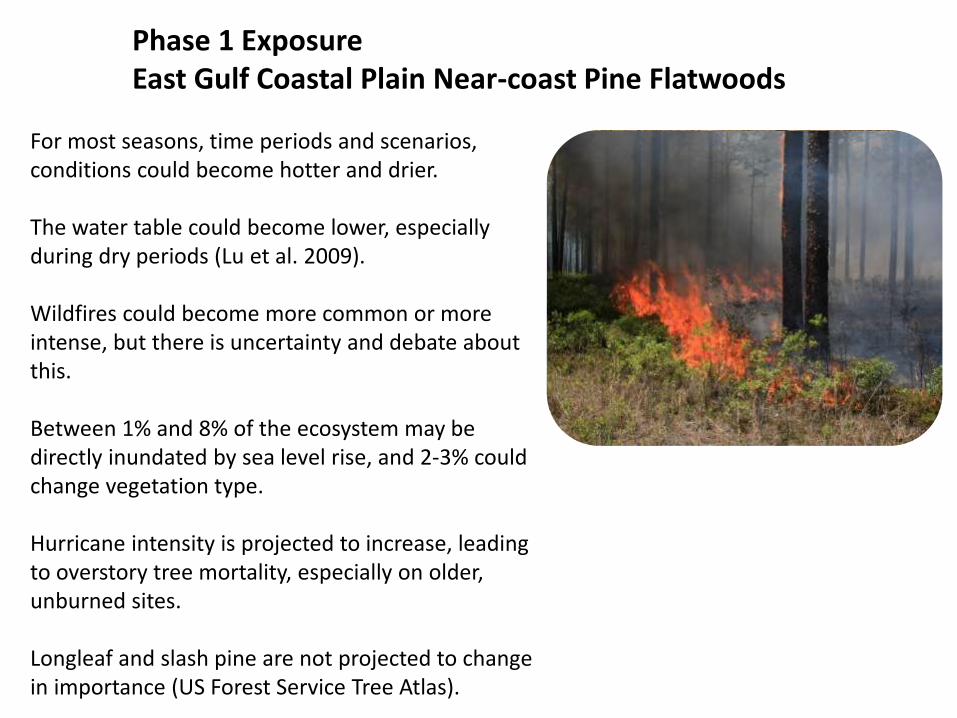
For most seasons, time periods and scenarios, conditions could become hotter and drier.
The water table could become lower, especially during dry periods (Lu et al. 2009).
Wildfires could become more common or more intense, but there is uncertainty and debate about this.
Between 1% and 8% of the ecosystem may be directly inundated by sea level rise, and 2-3% could change vegetation type.
Hurricane intensity is projected to increase, leading to overstory tree mortality, especially on older, unburned sites.
Longleaf and slash pine are not projected to change in importance (US Forest Service Tree Atlas).
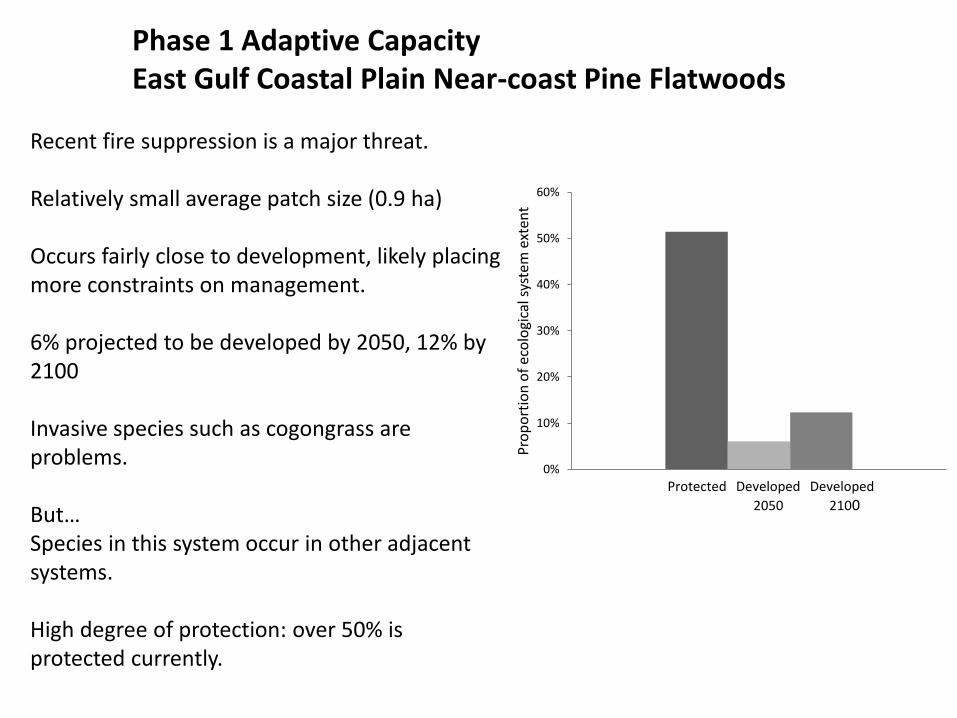
Phase 1 Adaptive CapacityEast Gulf Coastal Plain Near-coast Pine Flatwoods
Recent fire suppression is a major threat.
Relatively small average patch size (0.9 ha)
Occurs fairly close to development, likely placing more constraints on management.
6% projected to be developed by 2050, 12% by 2100
Invasive species such as cogongrass are problems.
But…Species in this system occur in other adjacent systems.
High degree of protection: over 50% is protected currently.
0%
10%
20%
30%
40%
50%
60%
Pro
po
rtio
n o
f ec
olo
gica
l sys
tem
ext
ent
Protected Developed Developed
2050 2100
Phase 1 Overall vulnerabilityEast Gulf Coastal Plain Near-coast Pine Flatwoods
Moderate
Some sensitivity and exposure, especially to changes in fires, hurricanes, hydrology, and sea level.
Substantial adaptive capacity.
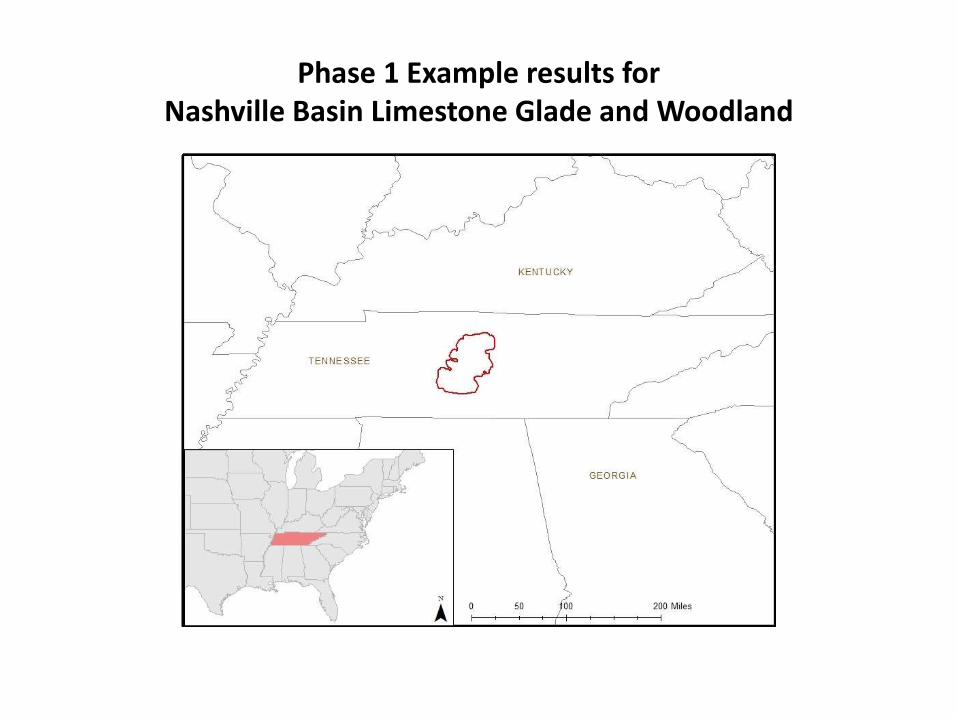
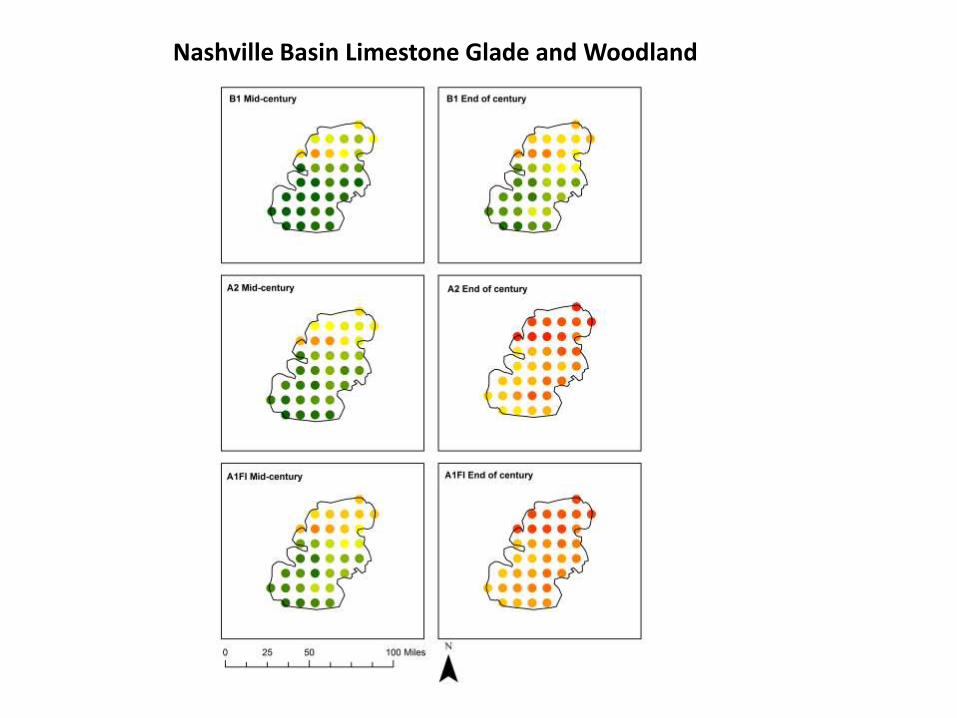
Phase 1 Example results forNashville Basin Limestone Glade and Woodland
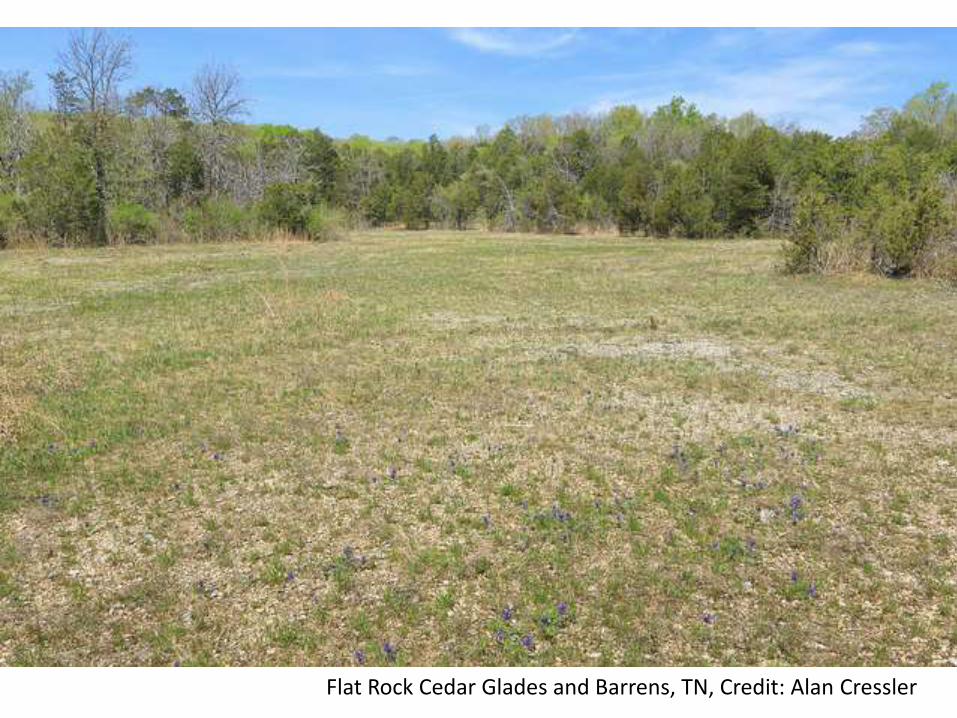
Flat Rock Cedar Glades and Barrens, TN, Credit: Alan Cressler
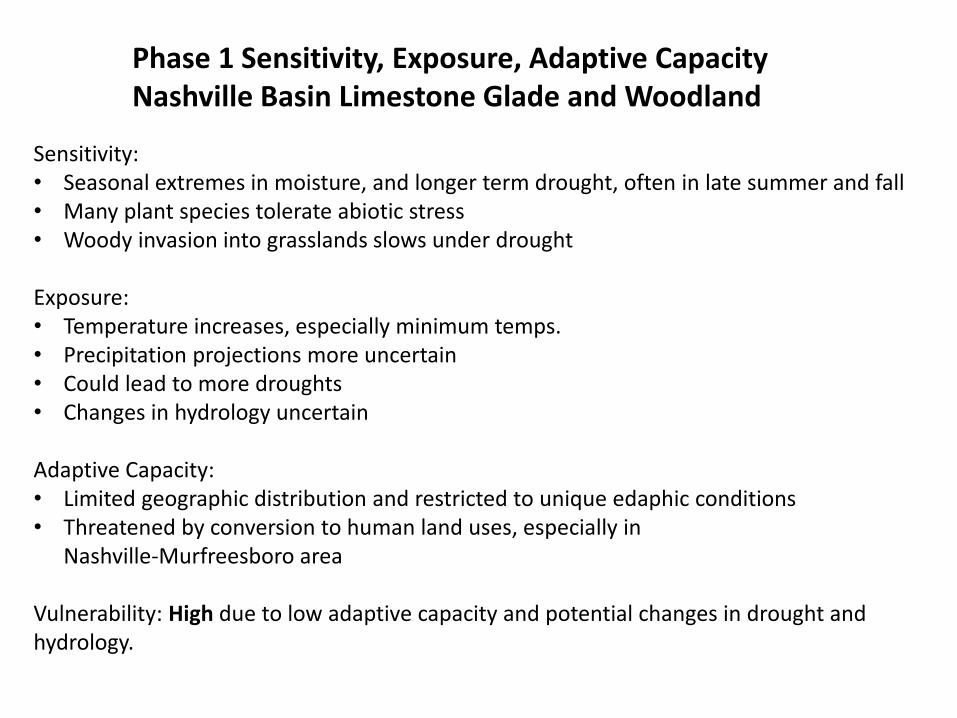
Phase 1 Sensitivity, Exposure, Adaptive CapacityNashville Basin Limestone Glade and Woodland
Sensitivity:• Seasonal extremes in moisture, and longer term drought, often in late summer and fall• Many plant species tolerate abiotic stress• Woody invasion into grasslands slows under drought
Exposure:• Temperature increases, especially minimum temps.• Precipitation projections more uncertain• Could lead to more droughts• Changes in hydrology uncertain
Adaptive Capacity:• Limited geographic distribution and restricted to unique edaphic conditions• Threatened by conversion to human land uses, especially in
Nashville-Murfreesboro area
Vulnerability: High due to low adaptive capacity and potential changes in drought and hydrology.
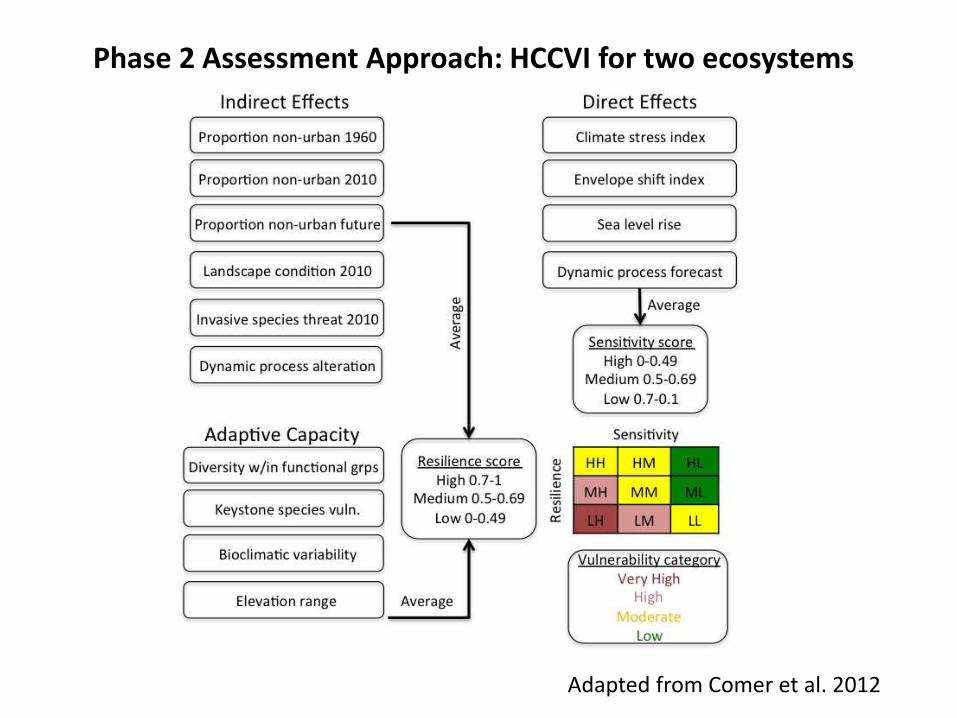
Phase 2 Assessment Approach: HCCVI for two ecosystems
Adapted from Comer et al. 2012
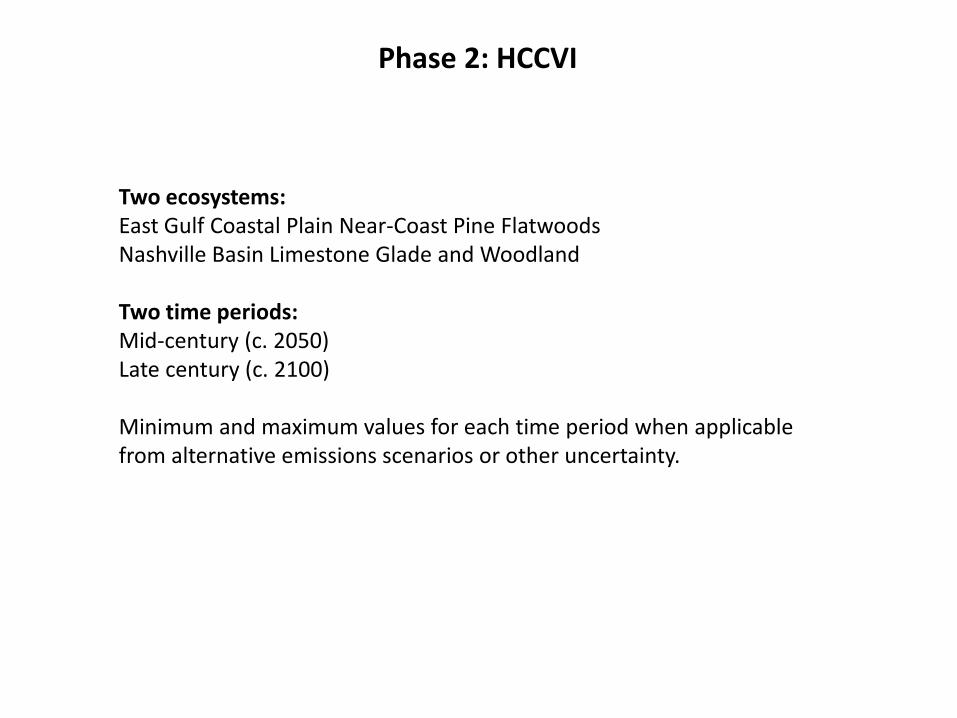
Phase 2: HCCVI
Two ecosystems:East Gulf Coastal Plain Near-Coast Pine FlatwoodsNashville Basin Limestone Glade and Woodland
Two time periods: Mid-century (c. 2050)Late century (c. 2100)
Minimum and maximum values for each time period when applicablefrom alternative emissions scenarios or other uncertainty.
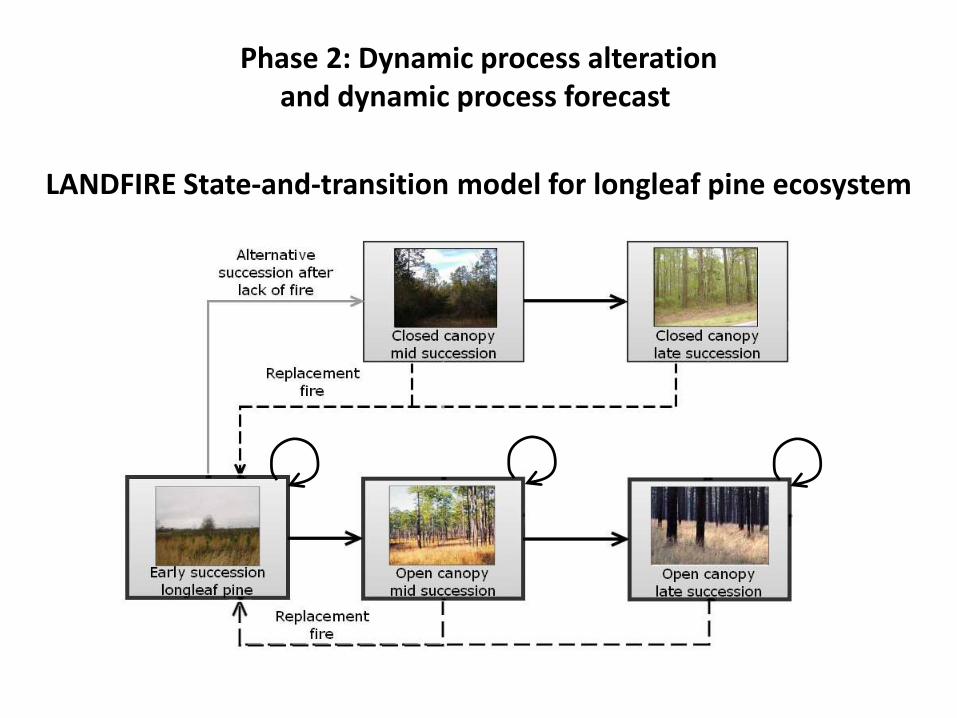
Phase 2: Dynamic process alterationand dynamic process forecast
LANDFIRE State-and-transition model for longleaf pine ecosystem
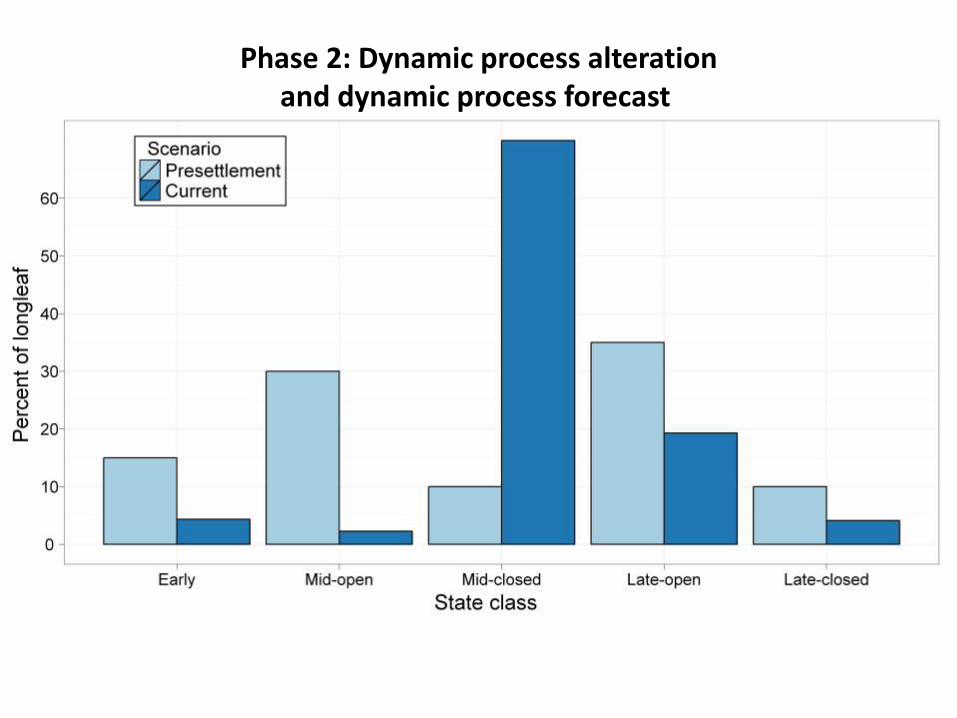
Phase 2: Dynamic process alterationand dynamic process forecast

Current: Dynamic process alteration
Future: Dynamic process forecast
Phase 2: Dynamic process alterationand dynamic process forecast
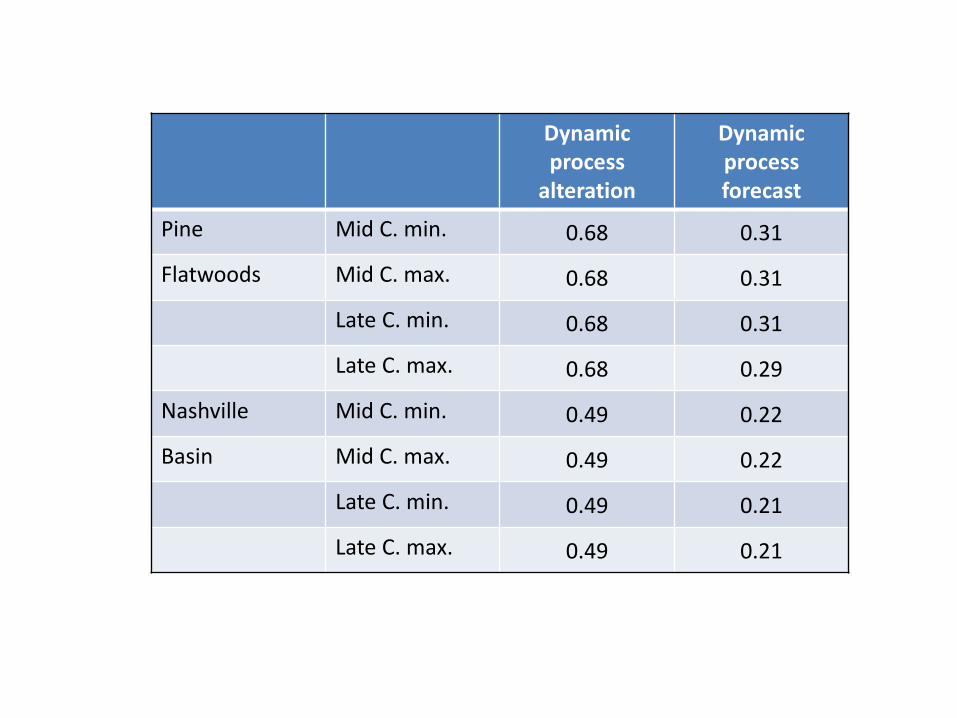
Dynamic process
alteration
Dynamic process forecast
Pine Mid C. min. 0.68 0.31
Flatwoods Mid C. max. 0.68 0.31
Late C. min. 0.68 0.31
Late C. max. 0.68 0.29
Nashville Mid C. min. 0.49 0.22
Basin Mid C. max. 0.49 0.22
Late C. min. 0.49 0.21
Late C. max. 0.49 0.21
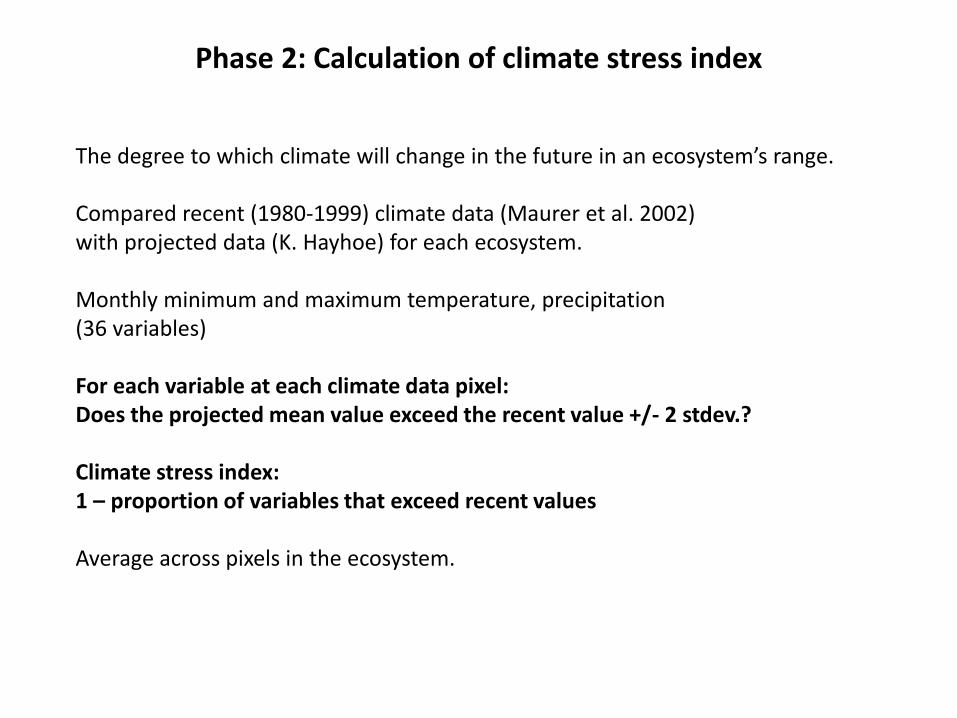
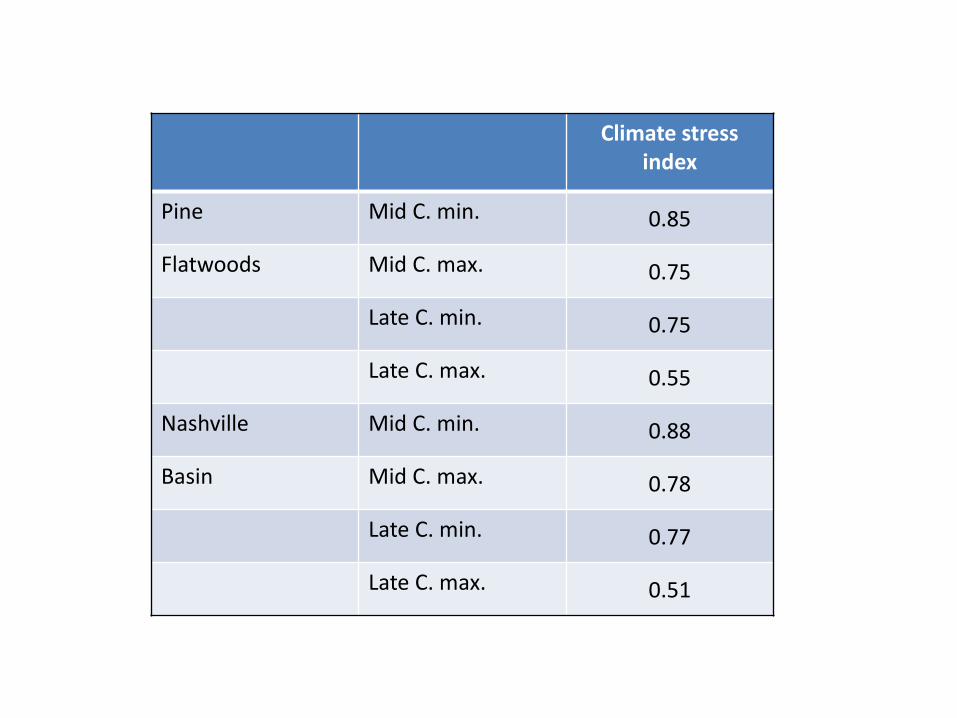
Phase 2: Calculation of climate stress index
The degree to which climate will change in the future in an ecosystem’s range.
Compared recent (1980-1999) climate data (Maurer et al. 2002)with projected data (K. Hayhoe) for each ecosystem.
Monthly minimum and maximum temperature, precipitation(36 variables)
For each variable at each climate data pixel:Does the projected mean value exceed the recent value +/- 2 stdev.?
Climate stress index: 1 – proportion of variables that exceed recent values
Average across pixels in the ecosystem.
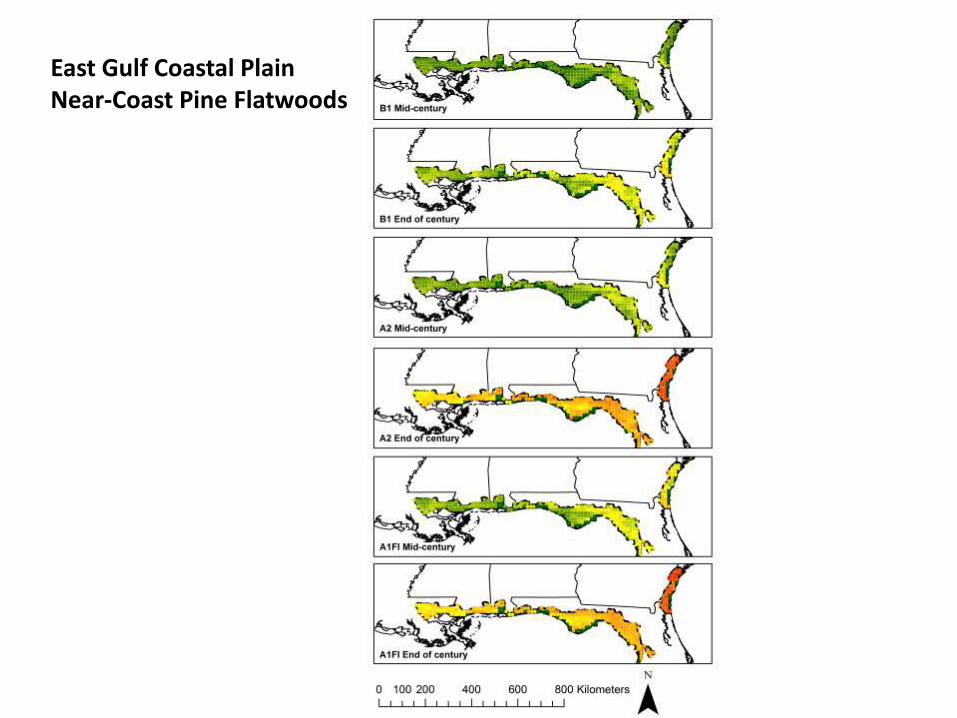
East Gulf Coastal PlainNear-Coast Pine Flatwoods
Nashville Basin Limestone Glade and Woodland
Climate stress index
Pine Mid C. min. 0.85
Flatwoods Mid C. max. 0.75
Late C. min. 0.75
Late C. max. 0.55
Nashville Mid C. min. 0.88
Basin Mid C. max. 0.78
Late C. min. 0.77
Late C. max. 0.51
Phase 2: Calculation of envelope shift index
The degree to which the suitable climate envelope will change.
Define the current climate envelope using MaxEnt and map to the current landscape.
Project where that envelope will occur in the future under alternate scenarios.
Envelope shift index: Average suitability score for the ecosystem’s current extent.
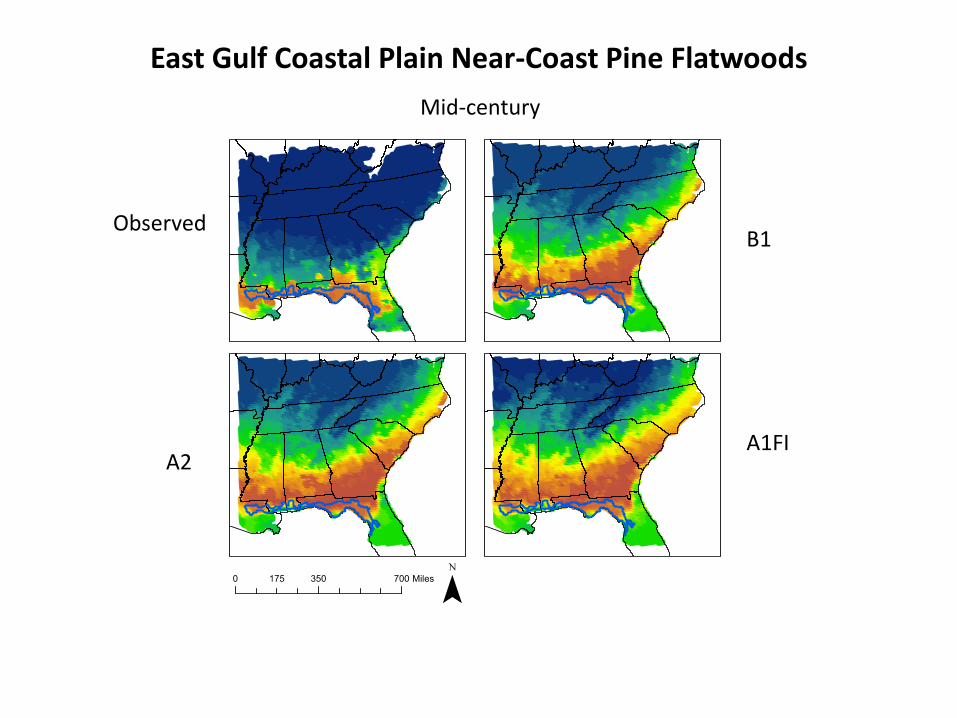
East Gulf Coastal Plain Near-Coast Pine Flatwoods
ObservedB1
A2A1FI
Mid-century
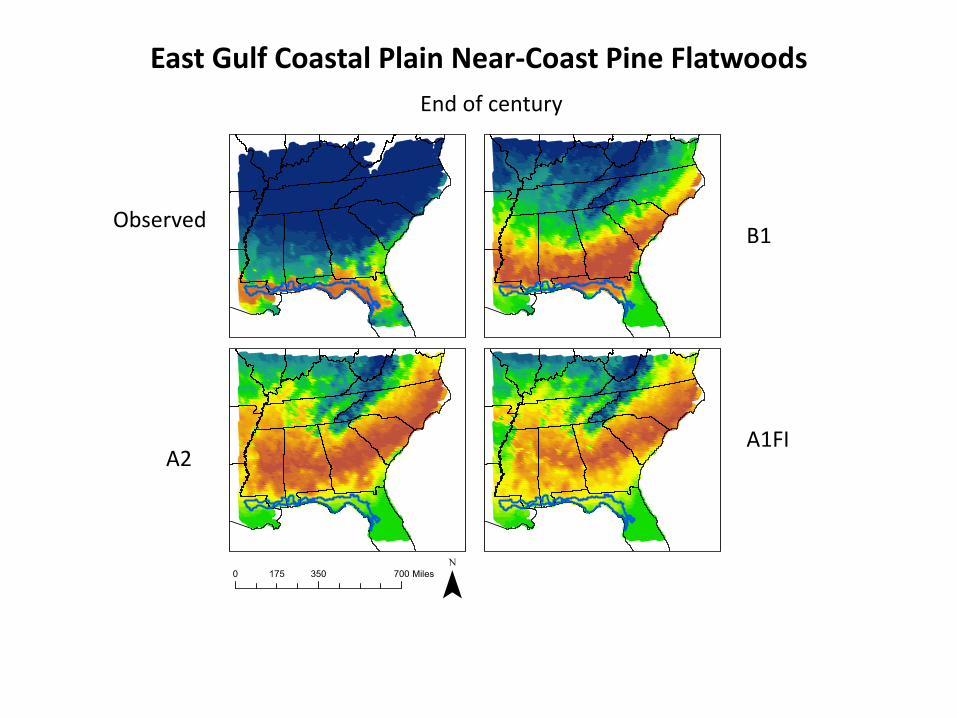
East Gulf Coastal Plain Near-Coast Pine Flatwoods
ObservedB1
A2A1FI
End of century
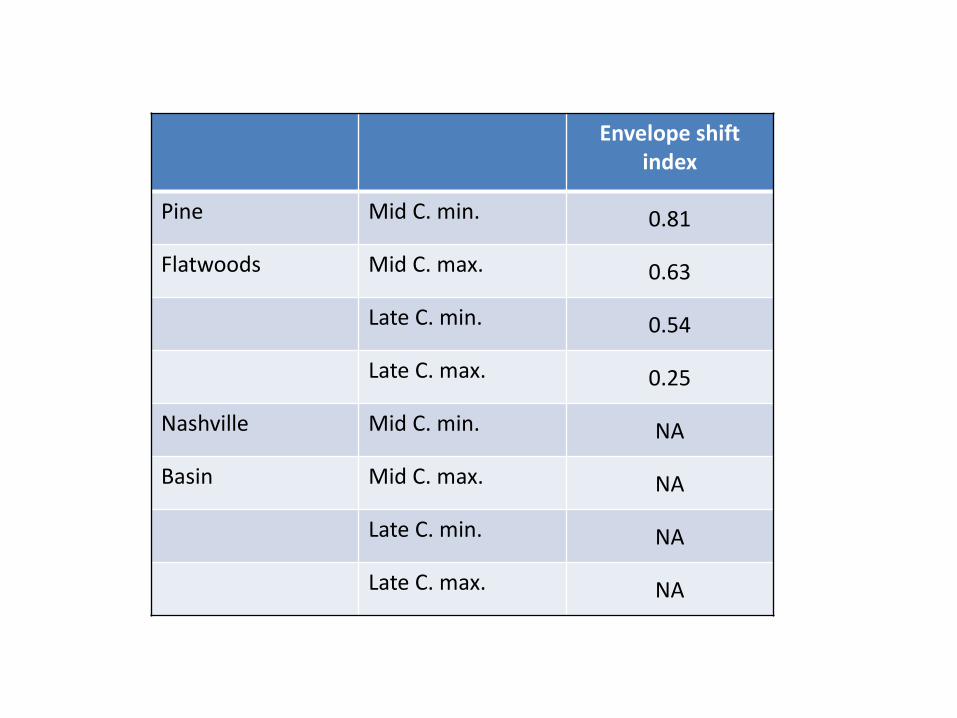
Envelope shift index
Pine Mid C. min. 0.81
Flatwoods Mid C. max. 0.63
Late C. min. 0.54
Late C. max. 0.25
Nashville Mid C. min. NA
Basin Mid C. max. NA
Late C. min. NA
Late C. max. NA
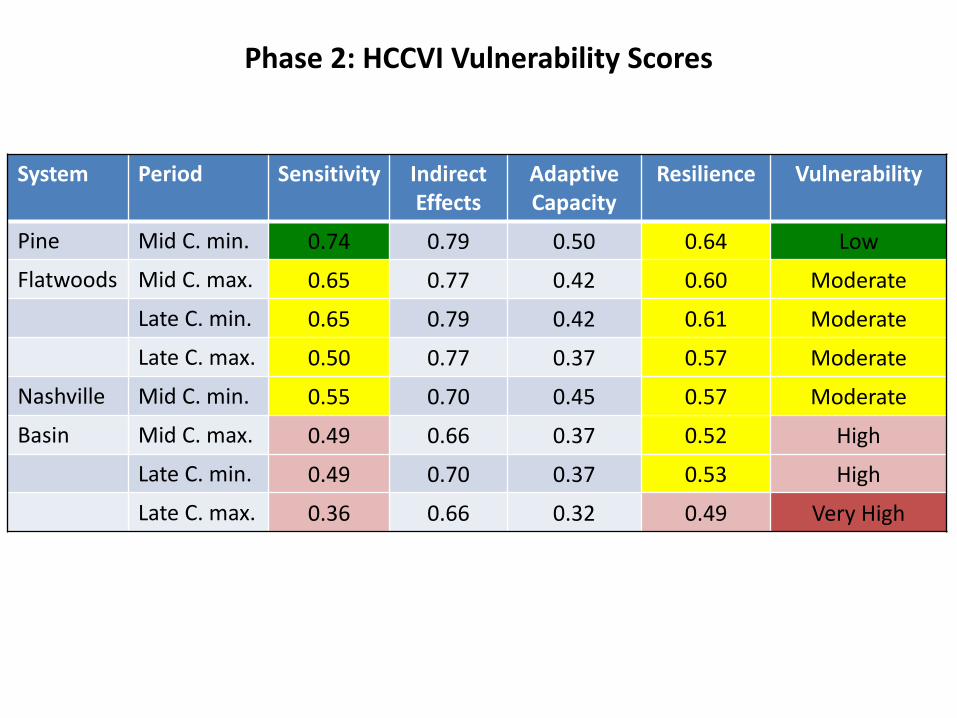
System Period Sensitivity Indirect Effects
Adaptive Capacity
Resilience Vulnerability
Pine Mid C. min. 0.74 0.79 0.50 0.64 Low
Flatwoods Mid C. max. 0.65 0.77 0.42 0.60 Moderate
Late C. min. 0.65 0.79 0.42 0.61 Moderate
Late C. max. 0.50 0.77 0.37 0.57 Moderate
Nashville Mid C. min. 0.55 0.70 0.45 0.57 Moderate
Basin Mid C. max. 0.49 0.66 0.37 0.52 High
Late C. min. 0.49 0.70 0.37 0.53 High
Late C. max. 0.36 0.66 0.32 0.49 Very High
Phase 2: HCCVI Vulnerability Scores
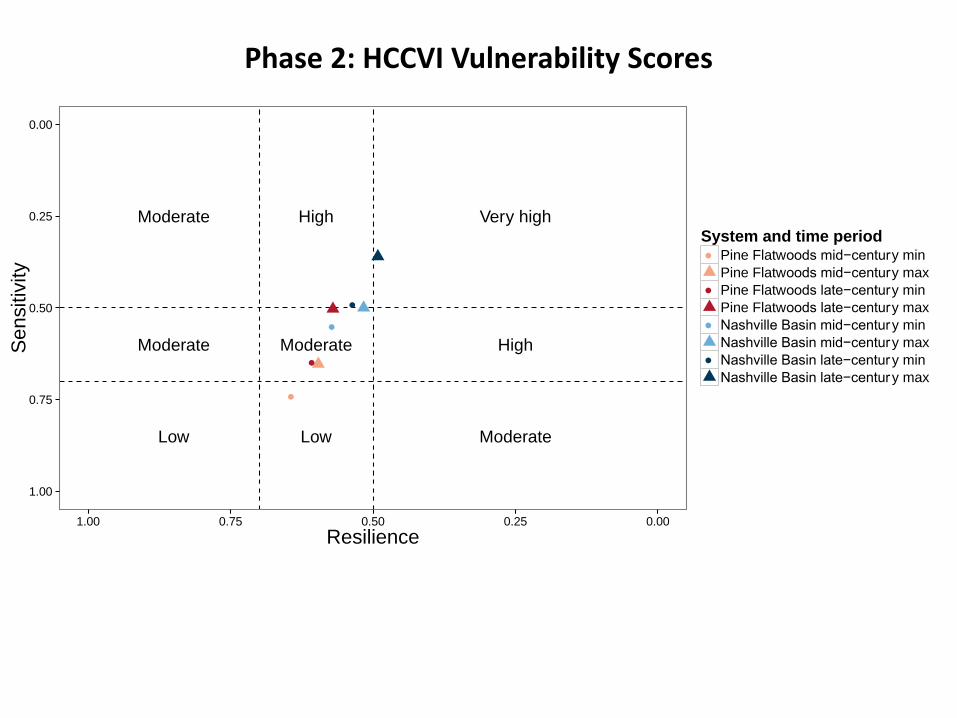
●
●
●
●
Moderate
Moderate
Low Low
Moderate
High
Moderate
High
Very high
0.00
0.25
0.50
0.75
1.00
0.000.250.500.751.00
Resilience
Se
nsitiv
ity
System and time period●
●
●
●
Pine Flatwoods mid−century min
Pine Flatwoods mid−century max
Pine Flatwoods late−century min
Pine Flatwoods late−century max
Nashville Basin mid−century min
Nashville Basin mid−century max
Nashville Basin late−century min
Nashville Basin late−century max
Phase 2: HCCVI Vulnerability Scores
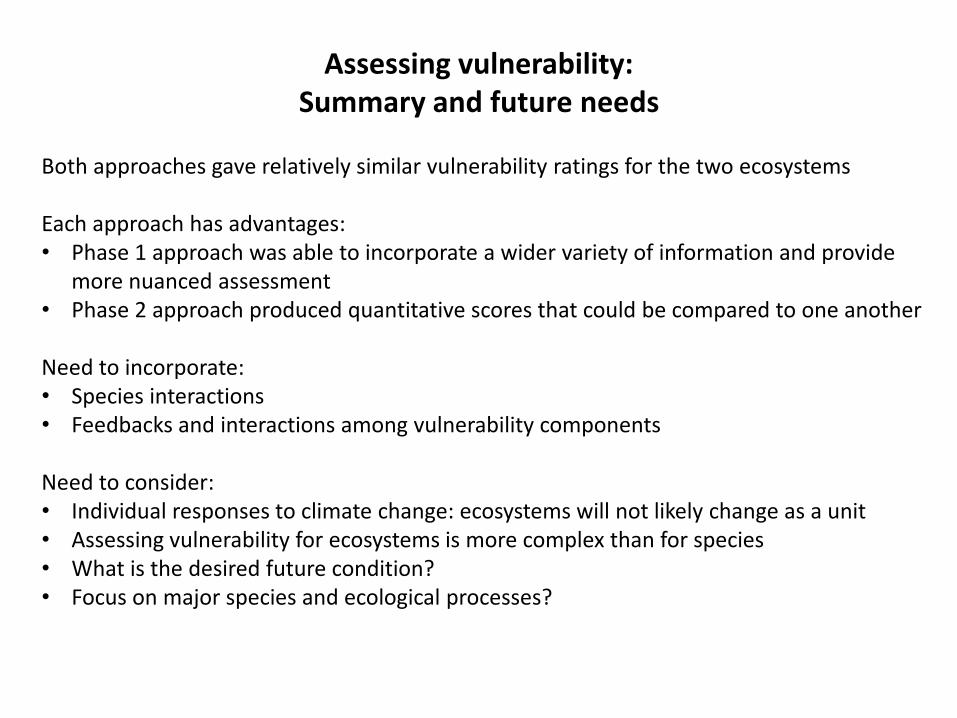
Assessing vulnerability:Summary and future needs
Both approaches gave relatively similar vulnerability ratings for the two ecosystems
Each approach has advantages:• Phase 1 approach was able to incorporate a wider variety of information and provide
more nuanced assessment• Phase 2 approach produced quantitative scores that could be compared to one another
Need to incorporate:• Species interactions• Feedbacks and interactions among vulnerability components
Need to consider:• Individual responses to climate change: ecosystems will not likely change as a unit• Assessing vulnerability for ecosystems is more complex than for species• What is the desired future condition? • Focus on major species and ecological processes?
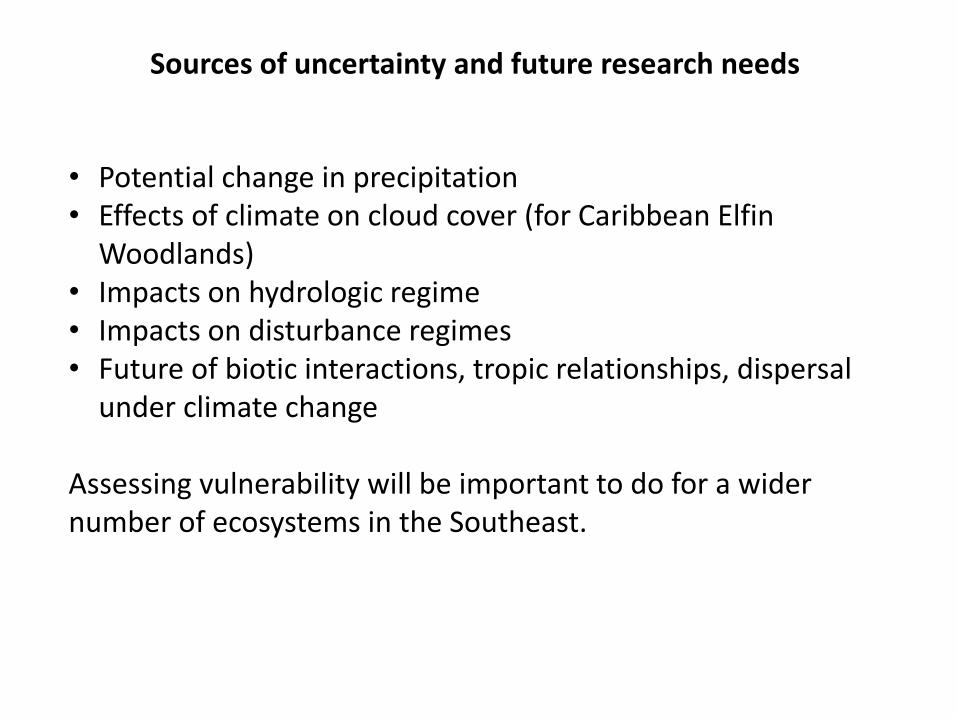
Sources of uncertainty and future research needs
• Potential change in precipitation• Effects of climate on cloud cover (for Caribbean Elfin
Woodlands)• Impacts on hydrologic regime• Impacts on disturbance regimes• Future of biotic interactions, tropic relationships, dispersal
under climate change
Assessing vulnerability will be important to do for a wider number of ecosystems in the Southeast.
Thank you!
Collaborators:Jaime Collazo, Matthew Rubino, NC State, Coop. Fish and Wildlife Research UnitScott Beck, NC StateMilo Pyne, Rickie White, NatureServeAdam Terando, USGS Southeast Climate Science Center
Funding:USGS Southeast Climate Science CenterUSGS Gap Analysis Program
Contact me with questions or for a copy of our draft report: [email protected]
Related Documents


