A PROSPECTIVE, CROSS - SECTIONAL STUDY OF 15,000 SOUTH INDIAN CHILDREN ASSESSING COMPETENCY OF THE BROSELOW-LUTEN PEDIATRIC RESUSCITATION TAPE Dr. Srihari Cattamanchi,* Postgraduate Resident, MD (A&EM), Department of Accident & Emergency Medicine, Sri Ramachandra Medical University, Porur – 600 116. Chennai. T.N, India

ASSESSING COMPETENCY OF THE BROSELOW-LUTEN PEDIATRIC RESUSCITATION TAPE - A PROSPECTIVE, CROSS - SECTIONAL STUDY OF 15,000 SOUTH INDIAN CHILDREN
Aug 18, 2015
Welcome message from author
This document is posted to help you gain knowledge. Please leave a comment to let me know what you think about it! Share it to your friends and learn new things together.
Transcript
A PROSPECTIVE, CROSS - SECTIONAL STUDY OF 15,000 SOUTH INDIAN CHILDREN
ASSESSING COMPETENCY OF THE BROSELOW-LUTEN PEDIATRIC
RESUSCITATION TAPE
Dr. Srihari Cattamanchi,*Postgraduate Resident, MD (A&EM),Department of Accident & Emergency Medicine,Sri Ramachandra Medical University,Porur – 600 116. Chennai. T.N, India

BACKGROUND
No standardized methods available for rapid weight estimation in children admitted for acute pediatric emergencies in Chennai, India.
The Broselow tape has shown to improve accuracy in weight prediction and eliminate the need for memorization and calculation in Emergency situations.
AIMS & OBJECTIVES
To determines the accuracy of the Broselow pediatric emergency tape in the Indian pediatric population.
To find out the standard deviation of Weight from Broselow pediatric emergency tape to Indian population.
To determine the usefulness of Broselow pediatric emergency tape in Indian Settings.

METHODS
Design: A prospective, cross-sectional study
Population: 15,000 South Indian children in three weight-based groups of >10 kg, 10-18 kg and <18 kg.
Duration: 2 months, September 15th 2008 to November 15th 2008.
Setting: The data was collected from children attending Sri Ramachandra Pediatric OPD and ED in tertiary care hospitals in Chennai, and also from 16 different schools in and around Chittoor municipality, in South India.

METHODS
Proforma: Age, sex, height, actual weight, & Broselow weight were recorded in a preformatted Performa.
Instrument: Broselow Luten Pediatric Emergency Tape.
Analysis: Measured weight was compared to Broselow predicted weight and percent difference was calculated. A cross – validated correction factor was derived by non linear regression. Analysis done using SPSS Ver. 15.0.

BROSELOW-LUTEN ZONES
Zone CM Length Kg Weight Age months0 Grey < 59.5 3 – 5 < 21 Pink 59.5-66.5 6-7 2-5
2 Red 66.5-74 8-9 5-11
3 Purple 74-84.5 10-11 11-19
4 Yellow 84.5-97.5 12-14 19-30
5 White 97.5-110 15-18 30-39.5
6 Blue 110-120.75 19-23 39.5-62.5
7 Orange 120.75-133.424-29 62.5-83
8 Green 133.4-146.5 30-36 83-107.5


PINKRED
PURPLE
YELLOW
BLUE
ORANGE
GREEN
WHITE
The Broselow-Luten SystemColor Wall Chart- Height
METHODOLOGY
Inclusion criteria: Children above 2 months of age and below 12 years of age were be eligible to participate in this study.
Exclusion: Severely Malnourished children & child with chronic illness.

RESULTS

AGE & SEX DISTRIBUTION
0 1 2 3 4 5 6 7 8 9 10 11 120
200
400
600
800
1000
1200
1400
1600
1800
Male
Age in Years
No
of C
hild
ren

DISTRIBUTION ACCORDING TO HEIGHT
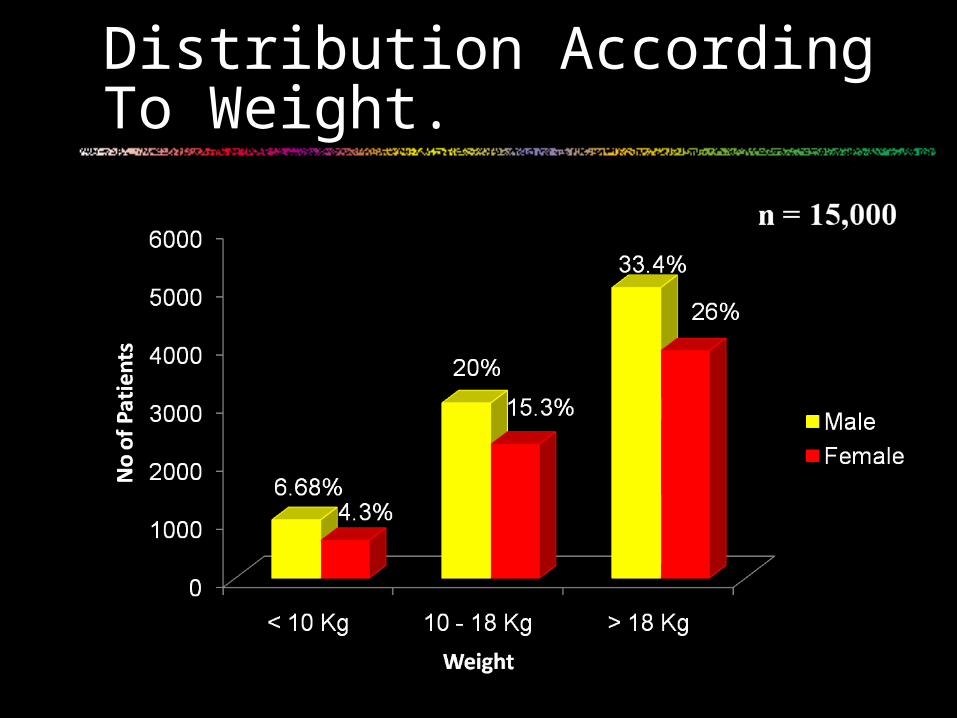
Distribution According To Weight.

Comparison of Broselow’s & Actual Weight
n = 15,000

Results..
• The mean percentage differences were – 2.4 +6.3, and -17.9% for each weight-based group.
• The Broselow color-coded zone Std. dev was 16.12, 11 & 24.5 in their respective group.
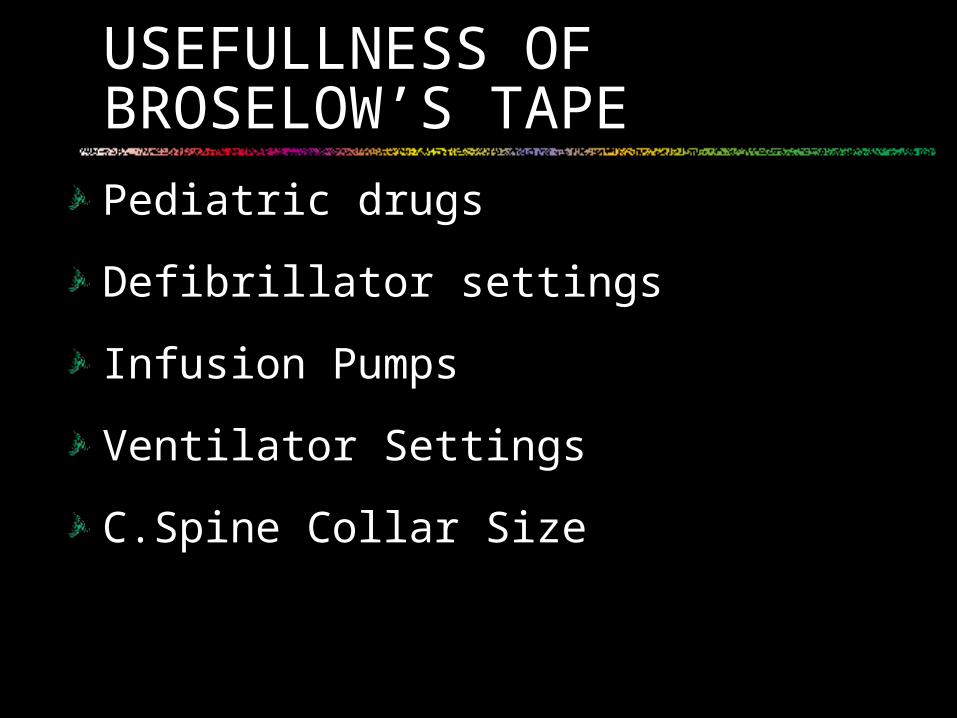
USEFULLNESS OF BROSELOW’S TAPE
Pediatric drugs
Defibrillator settings
Infusion Pumps
Ventilator Settings
C.Spine Collar Size

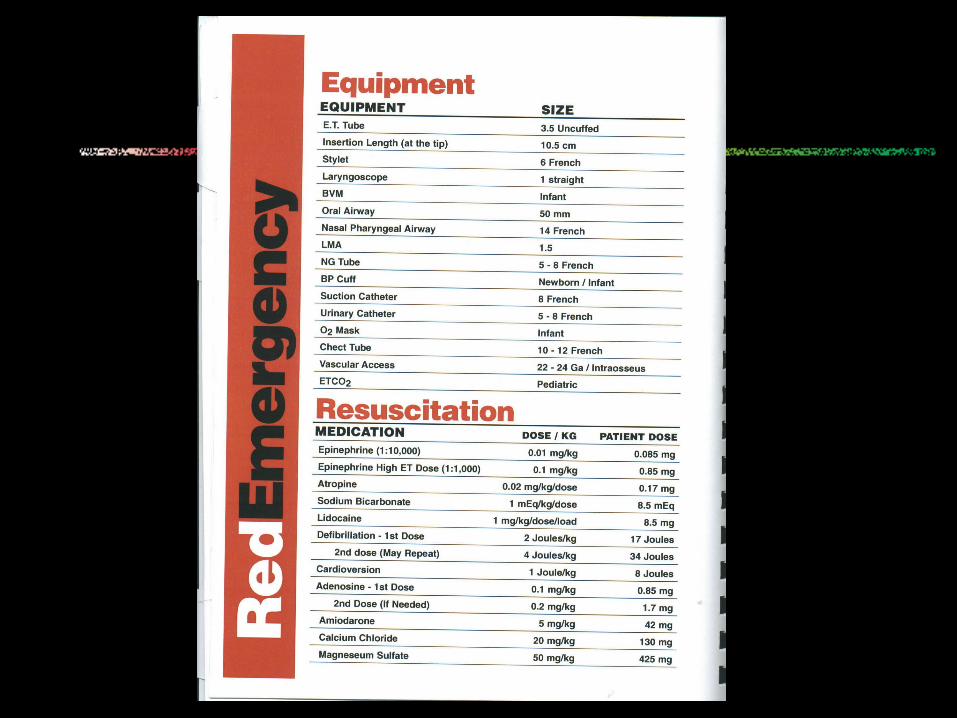
Medications
PALS
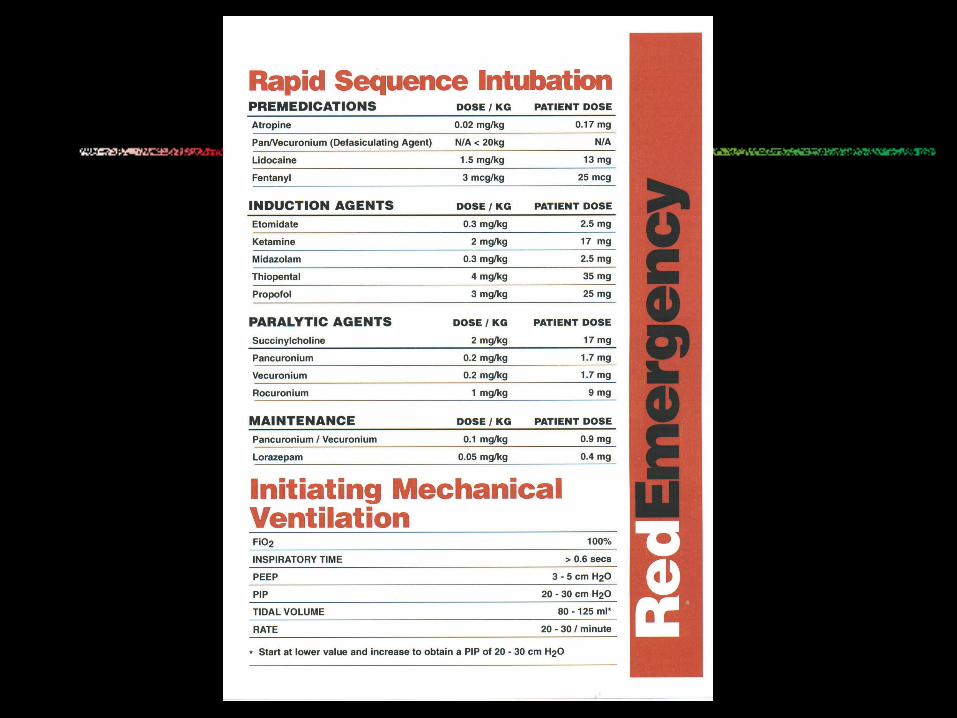
Rapid Sequence Intubation
Anaphylaxis
Pain and Sedation
Fluids and burns
Seizures & electrolyte correction
Oral Antibiotics

BROSELOW-LUTEN ZONES
Zone CM Length Wt in Kg Age in months0 Grey < 59.5 3 – 5 < 21 Pink 59.5-66.5 6-7 2-5
2 Red 66.5-74 8-9 5-11
3 Purple 74-84.5 10-11 11-19
4 Yellow 84.5-97.5 12-14 19-30
5 White 97.5-110 15-18 30-39.5
6 Blue 110-120.75 19-23 39.5-62.5
7 Orange 120.75-133.424-29 62.5-83
8 Green 133.4-146.5 30-36 83-107.5
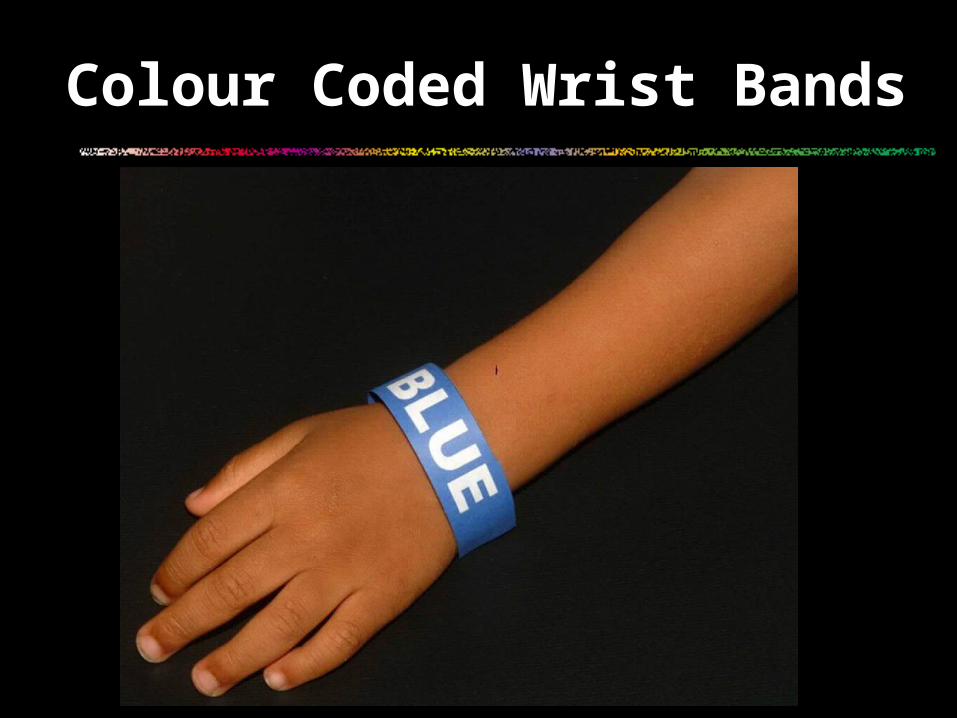
Colour Coded Wrist Bands

Broselow / Luten Reference Book


TIDAL VOLUME 60-100mL 75 - 125mL 100-150mL 125-200mL 150-250mL 200-300mL 250-400mL 350-500mL
FREQUENCY(BPM) 20 - 25 20 - 25 15 - 25 15 - 25 15 - 25 12 - 20 12 - 20 12 - 20
Parameters: FiO2 100%, PEEP 3 cm H2O, Inspiratory Time >0.6 sec, PIP 2030 cm H2O, Tidal Volume 10-15 mL/kg—Start low and increase to PIP 20-20 cm H2O
BOLUS ( mL) 130 170 210 260 325 420 530 660
FLUIDS
MAINTENANCE (mL/hr) 28 35 40 45 55 65 70 75
ZONE PINK RED PURPLE YELLOW WHITE BLUE ORANGE GREEN
ZONE PINK RED PURPLE YELLOW WHITE BLUE ORANGE GREEN
MINIMUM HOURLY URINE OUTPUT (mL/hr)
7-14 9--18 10-20 13-25 16-32 20-40 25-50 35-65
VENTILATOR

• Guidelines for Hospitals and Help Reduce CT Radiation for Children
• Using Color Coding for Kids
• CHICAGO--(BW HealthWire)--Nov. 26, 2001
• GE Medical Systems has applied the Broselow-Luten Pediatric System.
Colour Coding to reduce Radiation

LIMITATIONS
Children below 10 kg were less included than other Weight Groups.

Conclusion
• A total of 15,000 subjects were included.
• Females accounted for 46%.
• Mean age was 7.589 years.
• Height ranged from 55 – 146 cms with a mean of 119.83 cms.
• Weights ranged from 2.25 - 36.0 kg with a mean of 21.36 kg.

CONCLUSIONS
The Broselow tape overestimates weight by more than 10% in Indian children <10 kg & 30% in >18 Kgs
increasing risk of medical errors due to incorrect dosing or equipment selection.
Need for modified Indian pediatric emergency tape based on Broselow Luten colour coding is the need of the hour.

BENEFITS
Helps in Rapid Weight estimation in ED.
Reducing dosage errors due to wrong weight estimation.
Colour Coding of our New Pediatric Emergency Dept.
Colour coded band while transferring patient out of ED into wards.
Gave me inspiration to design a new Indianised Pediatric Emergency Tape based on this study, which is under progress.

Reference
HOW RELIABLE IS LENGTH-BASED EMERGENCY WEIGHT ESTIMATION IN INDIAN CHILDREN? RECONSIDERING THE BROSELOW TAPE.
NARESH RAMARAJAN, STANFORD UNIVERSITY, ANNALS OF EMERGENCY MEDICINE. 2008, APRIL.
Special Thanks
School Management & 13,000 Children of 16 Schools in Chittoor, Chennai & Bangalore.
Isabell Children Hospital - Chennai, Govt. Hospital - Chittoor & SRMC - Chennai.

COLOUR - “A Universal Language”
THANK YOU
Related Documents


