Assessing Children’s Homework Performance: Development of Multi-Dimensional, Multi-Informant Rating Scales Thomas J. Power, The Children’s Hospital of Philadelphia/University of Pennsylvania Stefan C. Dombrowski, Rider University Marley W. Watkins, The Pennsylvania State University Jennifer A. Mautone, and The Children’s Hospital of Philadelphia John W. Eagle University of Kansas Abstract Efforts to develop interventions to improve homework performance have been impeded by limitations in the measurement of homework performance. This study was conducted to develop rating scales for assessing homework performance among students in elementary and middle school. Items on the scales were intended to assess student strengths as well as deficits in homework performance. The sample included 163 students attending two school districts in the Northeast. Parents completed the 36-item Homework Performance Questionnaire – Parent Scale (HPQ-PS). Teachers completed the 22-item teacher scale (HPQ-TS) for each student for whom the HPQ-PS had been completed. A common factor analysis with principal axis extraction and promax rotation was used to analyze the findings. The results of the factor analysis of the HPQ-PS revealed three salient and meaningful factors: student task orientation/efficiency, student competence, and teacher support. The factor analysis of the HPQ-TS uncovered two salient and substantive factors: student responsibility and student competence. The findings of this study suggest that the HPQ is a promising set of measures for assessing student homework functioning and contextual factors that may influence performance. Directions for future research are presented. Keywords Homework; scale development; parent ratings; teacher ratings Family involvement in education is important for children to achieve success in school. Family involvement has multiple dimensions, including involvement in home-based educational Address correspondence to: Thomas J. Power, The Children’s Hospital of Philadelphia, CHOP North – 1471, 34 th St. & Civic Center Blvd., Philadelphia, PA 19104. Email: [email protected]. This study was supported by NIH research grant R01MH068290, awarded to the first author by the National Institute of Mental Health and Department of Education, National Center for Special Education Research. Publisher's Disclaimer: This is a PDF file of an unedited manuscript that has been accepted for publication. As a service to our customers we are providing this early version of the manuscript. The manuscript will undergo copyediting, typesetting, and review of the resulting proof before it is published in its final citable form. Please note that during the production process errors may be discovered which could affect the content, and all legal disclaimers that apply to the journal pertain. NIH Public Access Author Manuscript J Sch Psychol. Author manuscript; available in PMC 2008 June 1. Published in final edited form as: J Sch Psychol. 2007 June ; 45(3): 333–348. NIH-PA Author Manuscript NIH-PA Author Manuscript NIH-PA Author Manuscript

Welcome message from author
This document is posted to help you gain knowledge. Please leave a comment to let me know what you think about it! Share it to your friends and learn new things together.
Transcript
Assessing Children’s Homework Performance: Development ofMulti-Dimensional, Multi-Informant Rating Scales
Thomas J. Power,The Children’s Hospital of Philadelphia/University of Pennsylvania
Stefan C. Dombrowski,Rider University
Marley W. Watkins,The Pennsylvania State University
Jennifer A. Mautone, andThe Children’s Hospital of Philadelphia
John W. EagleUniversity of Kansas
AbstractEfforts to develop interventions to improve homework performance have been impeded bylimitations in the measurement of homework performance. This study was conducted to developrating scales for assessing homework performance among students in elementary and middle school.Items on the scales were intended to assess student strengths as well as deficits in homeworkperformance. The sample included 163 students attending two school districts in the Northeast.Parents completed the 36-item Homework Performance Questionnaire – Parent Scale (HPQ-PS).Teachers completed the 22-item teacher scale (HPQ-TS) for each student for whom the HPQ-PS hadbeen completed. A common factor analysis with principal axis extraction and promax rotation wasused to analyze the findings. The results of the factor analysis of the HPQ-PS revealed three salientand meaningful factors: student task orientation/efficiency, student competence, and teacher support.The factor analysis of the HPQ-TS uncovered two salient and substantive factors: studentresponsibility and student competence. The findings of this study suggest that the HPQ is a promisingset of measures for assessing student homework functioning and contextual factors that may influenceperformance. Directions for future research are presented.
KeywordsHomework; scale development; parent ratings; teacher ratings
Family involvement in education is important for children to achieve success in school. Familyinvolvement has multiple dimensions, including involvement in home-based educational
Address correspondence to: Thomas J. Power, The Children’s Hospital of Philadelphia, CHOP North – 1471, 34th St. & Civic CenterBlvd., Philadelphia, PA 19104. Email: [email protected] study was supported by NIH research grant R01MH068290, awarded to the first author by the National Institute of Mental Healthand Department of Education, National Center for Special Education Research.Publisher's Disclaimer: This is a PDF file of an unedited manuscript that has been accepted for publication. As a service to our customerswe are providing this early version of the manuscript. The manuscript will undergo copyediting, typesetting, and review of the resultingproof before it is published in its final citable form. Please note that during the production process errors may be discovered which couldaffect the content, and all legal disclaimers that apply to the journal pertain.
NIH Public AccessAuthor ManuscriptJ Sch Psychol. Author manuscript; available in PMC 2008 June 1.
Published in final edited form as:J Sch Psychol. 2007 June ; 45(3): 333–348.
NIH
-PA Author Manuscript
NIH
-PA Author Manuscript
NIH
-PA Author Manuscript
activities, involvement in school-based events and activities, and collaboration between familymembers and school professionals (Epstein, 1995; Manz, Fantuzzo, & Power, 2004). Althougheach dimension of family involvement is supportive of school success, there is evidence thatfamily involvement in educational activities in the home may be the dimension that has thestrongest association with academic performance and outcomes (Fantuzzo, McWayne, Perry,& Childs, 2004; Izzo, Weissberg, Kasprow, & Frendrich, 1999).
Homework provides ongoing opportunities for parents to become involved in their children’seducation. Homework has been defined as educational tasks assigned by teachers to becompleted by students during non-instructional periods of the day (Cooper, 1989). Thisdefinition acknowledges that homework may be completed in school, in after school programs,and at home, but for most students it is completed in the home setting.
Although the importance of homework has been disputed by some educators, there is aconsensus among researchers that homework can have many beneficial effects. First,homework provides students opportunities to practice and master lessons learned in school.Second, homework may engage students in projects that guide them in the application ofconcepts learned in the classroom (Keith & Keith, 2006). Third, it offers students a context todevelop work habits and study skills that will be helpful to them as they mature into adulthood(Cooper, 2001). Finally, homework provides parents and teachers ongoing, natural ways tocommunicate with each other about a student’s education (Olympia, Sheridan, Jenson, &Andrews, 1994). In general, research has demonstrated a positive association betweenhomework and academic performance, when performance is measured by amount of time spentdoing homework and amount of work completed and when academic performance is assessedusing standardized test scores and classroom grades (Cooper, 2001; Cooper, Lindsay, Nye, &Greathouse, 1998). The extent of the relationship between homework and academicperformance is moderated by grade level, with students in the upper grades demonstrating astronger association than those in the lower grades (Cooper, Robinson, & Pattall, 2006).
Despite its potential advantages, homework can present challenges to many students and theirfamilies. Homework that is too difficult or too time consuming can be frustrating anddiscouraging for students (Keith & Keith, 2006). Also, it can be a source of tension betweena parent and child and may exacerbate parent-child conflict (Power, Karustis, & Habboushe,2001). Further, homework issues can be a source of conflict between parents and teachers andlead to home-school communication problems.
Several intervention strategies have been designed to improve homework performance,including goal setting and contingency contracting (Miller & Kelley, 1994), conjointbehavioral consultation (Weiner, Sheridan, & Jenson, 1998), and self-management approaches(Olympia et al., 1994). These strategies have been demonstrated to be efficacious in single-subject studies. Nonetheless, progress in developing, evaluating, and disseminating homeworkinterventions has been impeded by limitations in the measures available for assessinghomework performance.
The most commonly used measure for assessing homework performance is the HomeworkProblem Checklist (HPC; Anesko, Schoiock, Ramirez, & Levine, 1987), a 20-item, parentrating scale. This questionnaire was developed to assess the extent to which students displaya broad range of homework problems. Factor analytic studies have revealed that this measureassesses two broad factors: inattention/work avoidance and poor productivity/nonadherencewith homework rules (Power, Werba, Watkins, Angelucci, & Eiraldi, 2006). This factorstructure emerged with students in general education classes as well as those referred to aspecialty clinic for children with attention-deficit/hyperactivity disorder (ADHD). Althoughthe HPC has been useful in screening for homework problems and assessing outcomes, it has
Power et al. Page 2
J Sch Psychol. Author manuscript; available in PMC 2008 June 1.
NIH
-PA Author Manuscript
NIH
-PA Author Manuscript
NIH
-PA Author Manuscript
several limitations. First, it was developed for students in elementary school and may have lessapplicability for students in middle school. Second, many of the items overlap with symptomsof ADHD, making it difficult to measure ADHD symptoms independent from homeworkperformance. Third, the items assess deficits in functioning and not strengths, which does notsupport a strength-based model of practice. Fourth, the HPC does not include a teacher version.In fact, it does not appear that a standardized, teacher-report measure of homework functioninghas ever been developed, which is a significant limitation given that teachers directly observemany behaviors related to homework (e.g., recording assignments, completing work, andturning in assignments on time).
This study focused on the development of parent and teacher ratings scales of homeworkperformance, which are referred to as the Homework Performance Questionnaire – Parent Scale(HPQ-PS) and HPQ – Teacher Scale (HPQ-TS). These scales have been developed for studentsin grades 1 through 8. A distinguishing feature of the scales is that they were developed inpartnership with parents and teachers through the use of focus groups and interviews. Thescales exclude items directly related to the core symptoms of ADHD. Further, the items onthese measures assess primarily student strengths and not deficits.
The primary purpose of this study was to conduct a preliminary examination of the constructvalidity of the HPQ-PS and HPQ-TS by exploring the factor structure of each measure. Also,this study explored the associations between factors on the parent-report and teacher-reportscales. Further, gender and grade level differences on salient factors were examined.
MethodParticipants
The sample for the present study was derived from general education classes in two schooldistricts serving children in kindergarten through eighth grade located within 30 miles of alarge urban center in the Northeast. The sample excluded children in kindergarten. District Ahas a first- through eighth- grade student population of 816 students, and District B includes705 first through eighth graders. Approximately 22% of the first through eighth students inthese school districts were randomly selected for participation in the present study. (See theprocedures section for details about recruitment.)
A total of 163 parents (return rate of 47.8%) across both districts participated in the study; 95parents participated from District A (58.6% return rate) and 68 from District B (38.0%). Themajority of the respondents were mothers (67.5%); in some cases parents completed the scaletogether (17.2%) or fathers (4.3%) and other caregivers (1.8%) completed the ratings.Respondent information was missing for 9.2% (n = 14) of the cases.
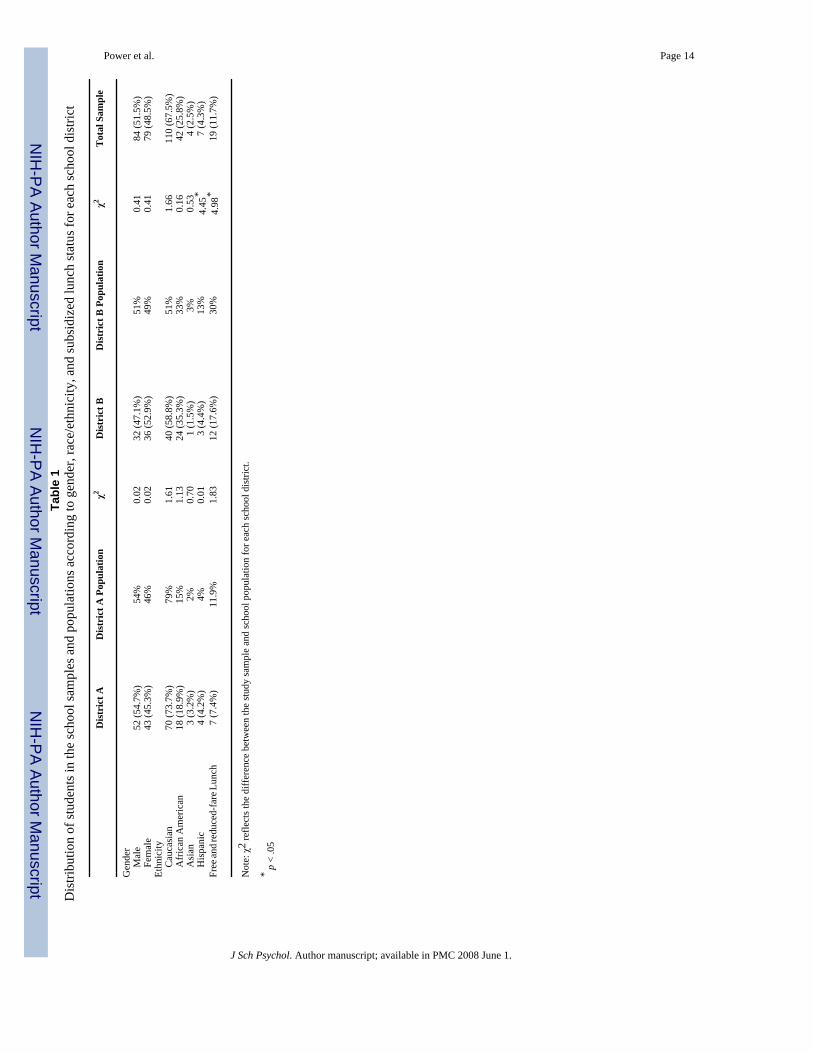
The sample included 84 boys (51.5%) and 79 girls (48.5%) approximately equally distributedacross grades 1 through 8. Forty-eight (29.4%) of the participants were in first or second grade,41 (25.2%) were in third or fourth grade, 39 (23.9%) were in fifth or sixth grade, and 35 (21.5%)were in seventh or eighth grade. Mean number of students per grade was 20.4 (range = 15-26).The racial/ethnic composition of the sample was 67.5% Caucasian, 25.8% African American,2.5% Asian, and 4.3% Hispanic; 11.6% of the sample received free or reduced-fare lunch. (SeeTable 1 for specific demographic data by district.)
Teachers of students whose parents completed the HPQ-PS were requested to complete theHPQ-TS. Teachers completed the HPQ-TS for 98.2% of the students for whom parent-reportscales were completed (n = 160). HPQ-TS scales were received for 100% (n = 95) of thestudents from District A and 95.6% (n = 65) of the students from District B.
Power et al. Page 3
J Sch Psychol. Author manuscript; available in PMC 2008 June 1.
NIH
-PA Author Manuscript
NIH
-PA Author Manuscript
NIH
-PA Author Manuscript
Table 1 presents demographic data for the sample and population from which it was derivedfor each school district. Chi square analyses indicated that there were no significant differencesbetween the study sample and the school district populations with regard to gender and racial/ethnic group status, with the exception of Hispanic students in District B (x2 = 4.45; p < .05).Although 13% of students in school District B were Hispanic, only 4.4% of the participantsfrom this district were Hispanic. Also, the sample from District B underrepresented studentsreceiving free or reduced fare lunch (x2 = 4.98; p < .05). Although 30% of students in DistrictB received free or reduced-fare lunch, only 17.6% of the participants from this district receivedsubsidized lunch.
Scale DevelopmentScale development occurred in three stages. Stage 1 involved an extensive review of thehomework literature and a review of the only existing measure of homework performance, theHPC. This review resulted in the identification of several strategies for scale development: (a)homework measures should include items related to work efficiency, given that this variableis highly responsive to interventions targeted to improve homework performance (Kahle &Kelley, 1994); (b) it is important to minimize the overlap in items between measures of ADHDand indices of homework, given that measures of homework performance are often used toassess academic impairments related to ADHD or outcomes of interventions for this disorder(e.g., Lahey et al., 1994; Hinshaw et al., 1997; Power, Soffer, Clarke, & Mautone, 2006); (c)homework measures should assess whether the assignments are appropriate for the child’s skilllevel, and are not overly difficult, which may impede learning and frustrate the child (Burns,2002; Gravois & Gickling, 2002), and (d) there is a strong need for a teacher-report measureof homework performance (Power et al., 2006).
Stage 2 consisted of a series of focus groups, conducted separately with parents and teachers.The focus groups were conducted in District B, which consisted of families of diversesocioeconomic and ethnic backgrounds. Separate focus groups were held at the elementaryand middle school levels. Parents and teachers were asked a series of questions regardingchildren’s homework functioning. Sample questions included: “What are the challenges youface with homework?”; “What homework strengths does your child (do your students)display?”; and “Describe the impact of homework on the parent-teacher relationship.” Eachfocus group lasted between 45 and 60 minutes. The group facilitator, a PhD-level psychologist,consistently asked participants to comment on responses made by other attendees to check forlevel of agreement and request elaboration and clarification as a way of establishing thecredibility of the data (Lincoln & Gruba, 1985). The discussions held in these groups wereaudiotaped and transcribed. Members of the research team categorized the responses, using aprocess known as inductive coding (LeCompte & Schensul, 1999), which consisted ofclustering items referring to similar themes. Subsequently, the investigators collaborated toidentify a common set of categories.
During Stage 3, initial versions of the parent and teacher scales were developed. Items weregenerated based upon conclusions derived from the literature review and themes that emergedfrom the focus groups. These items were further refined through individual interviews withseven parents and seven teachers associated with elementary and middle schools located inboth suburban and urban settings. Parents and teachers reviewed the questionnaire, whichpresented items to be rated on a four-point scale ranging from 0 = rarely/never to 3 = always/almost always, and provided feedback regarding the clarity and appropriateness of the itemsand scaling method used. Based on this feedback, items and response categories were modified.The following paragraphs include a more detailed description of Stages 2 and 3 in thedevelopment of the HPQ-PS and HPQ-TS.
Power et al. Page 4
J Sch Psychol. Author manuscript; available in PMC 2008 June 1.
NIH
-PA Author Manuscript
NIH
-PA Author Manuscript
NIH
-PA Author Manuscript
Homework Performance Questionnaire – Parent Scale (HPQ-PS)—Three focusgroups were held with parents, which included a total of 12 parents of children in elementaryand middle school. Parent responses addressed three broad themes: (a) child behaviors duringhomework; (b) family involvement with homework; and (c) teacher approaches to assigninghomework. In general, parent responses focused mostly on the teacher’s role with homework,including comments about quantity of homework assigned, type of homework assigned (e.g.,material not covered in class; homework not at the child’s level), and lack of clarity in givingdirections for homework assignments.
The revised version of the HPQ-PS1 consisted of 32 items requesting parents to assess theirchild’s homework behavior during the past 4 weeks. A four-point Likert scale response formatwas used (0 = rarely/never; 1 = some of the time; 2 = most of the time; 3 = always/almostalways). Items referring to each of the three thematic categories emerging from the focus groupswere included in the scale.
An additional four items (non-Likert) were included to collect background informationregarding a child’s homework behavior. The intent of these items was to identify informationpertinent to a specific child that might assist in the development of interventions to improvehomework performance. These items included: (a) the average amount of time a child spendsdoing homework; (b) whether the child has trouble completing homework in any subjects; (c)whether the child is expected to write homework assignments in a notebook; and (d) what thechild does when he or she can not remember what to do for homework (e.g., call a homeworkhotline; call a friend). Responses to these additional items were not analyzed in this study.
Homework Performance Questionnaire – Teacher Scale (HPQ-TS)—Two focusgroups were held with teachers, including a total of 18 teachers at the elementary and middleschool levels. Teacher responses to the focus group questions centered on two major themes:(a) child behaviors during homework; and (b) lack of family involvement with homework (e.g.,lack of supervision, failure to make homework a priority).
Based on feedback from individual interviews with teachers, the initial version of the HPQ-TS was revised. Both specific items and response categories were modified. In addition, itemspertaining to family involvement were omitted due to concerns expressed by teachers. Teacherscautioned that parental knowledge of teacher ratings of family involvement might adverselyaffect the quality of the parent-teacher relationship. Further, our research team was concernedthat some teachers might feel uncomfortable reporting their actual perceptions on itemspertaining to family involvement.
The revised version of the HPQ-TS1 consisted of 14 items that referred to student homeworkbehaviors observable by teachers. The 14 items were divided into two categories: (a) homeworkbehaviors and (b) homework performance. Ten of the items requested teachers to report thepercentage of time that specific homework-related behaviors occurred during the previous fourweeks. An additional four items requested teachers to indicate the percentage correspondingwith the student’s performance or accuracy during the previous four weeks. Teacher responseswere recorded using a five-point Likert scale: 0 = 0% to 39%; 1 = 40% to 69%; 2 = 70% to79%; 3 = 80% to 89%; 4 = 90% to 100%. Teacher responses used a five-point scale usingpercentage values as anchor points, because pilot studies demonstrated their ability to makethese relatively fine discriminations.
The HPQ-TS also included eight (non-Likert) items to collect background informationregarding a student’s homework-related behavior and performance. As with the HPQ-PS, these
1To obtain a copy of the HPQ-PS or HPQ-TS, please contact the corresponding author.
Power et al. Page 5
J Sch Psychol. Author manuscript; available in PMC 2008 June 1.
NIH
-PA Author Manuscript
NIH
-PA Author Manuscript
NIH
-PA Author Manuscript
items were intended to assist in homework intervention development. These items included:(a) the subject areas in which the teacher instructs the child; (b) the maximum amount of timechildren at this grade level should be spending doing homework; (c) whether the child isexpected to write homework assignments in a notebook; (d) how often the teacher checks tosee whether the student writes down homework assignments accurately; (e) how often theteacher checks to see whether the student takes home the materials needed for homework; (f)suggestions for families when students have difficulty remembering homework assignments;(g) how often the teacher checks to see that homework has been completed accurately; and (h)the percentage of the child’s grade that is affected by the amount or quality of homeworkcompleted. Responses to these additional items were not analyzed in this study.
ProceduresFor grades 1 through 4, four children (two boys and two girls) were chosen from class listsusing a systematic sampling approach (e.g., selection of the second and tenth boy and the fifthand eighth girl, as listed alphabetically) for each general education class. For grades 5 through8, two children (one boy and one girl) were chosen using a similar sampling procedure fromeach math class and two children were selected from each language arts class. The selectionswere checked to insure that the same child was not selected from each class. District B had arelatively high percentage of parents who did not speak English fluently. Because an Englishlanguage version of the HPQ-PS was used in this preliminary study, a representative from eachof the schools in District B (i.e., teacher of English Language Learning class or buildingprincipal) was consulted to identify children whose parents did not speak English. Thesechildren were excluded from the sample.
Parents of the 341 selected students (162 from District A and 179 from District B) were maileda packet of information including a letter signed by the principal introducing the study, aconsent form, a copy of the HPQ-PS, and a self-addressed, stamped envelope. Parents wereasked to read the consent form and indicate whether they chose to have their child participatein the study. Parents who consented to participate in the study were requested to complete theHPQ-PS. Parents were requested to return the consent form and HPQ-PS by mail, regardlessof whether consent was granted. Approximately 6 weeks after the initial letter was sent, anotherpacket was mailed to parents who did not respond after the first request. A third request wasmade approximately 5 weeks after the second request. The return rates after each of the threemailings were 25.2%, 36.7%, and 47.8%. Shortly thereafter, teachers were requested tocomplete the HPQ-TS for each child whose parent(s) completed the measure.
Data AnalysesCommon factor analysis was selected over principal components analysis because the goal ofthe study was to identify the latent structure of the HPQ scales (Wegener & Fabrigar, 2000).Additionally, common factor analysis may produce more accurate estimates of populationparameters than does principal components analysis (Widaman, 1993). Given its relativetolerance of multivariate nonnormality and its superior recovery of weak factors, principal axisextraction was used (Briggs & MacCallum, 2003). Communalities were initially estimated bysquared multiple correlations and were iterated twice to produce final communality estimates(Gorsuch, 2003). Following the advice of Velicer, Eaton, and Fava (2000), minimum averagepartials (MAP; Velicer, 1976) and parallel analysis (Horn, 1965), supplemented by a visualscree test (Cattell, 1966), were used to determine the number of factors to retain for rotation.It was assumed that factors would be moderately correlated. Thus, a Promax rotation with ak value of 4 was selected (Tataryn, Wood, & Gorsuch, 1999). Pattern coefficients ≥.32 werepredetermined to be salient. If an item demonstrated pattern coefficients ≥.32 on more thanone factor, the highest psychologically meaningful pattern coefficient was deemed salient. A
Power et al. Page 6
J Sch Psychol. Author manuscript; available in PMC 2008 June 1.
NIH
-PA Author Manuscript
NIH
-PA Author Manuscript
NIH
-PA Author Manuscript
priori criteria for determining factor adequacy included a minimum of five salient loadings,internal consistency reliability ≥.70, and theoretical meaningfulness.
ResultsOn the HPQ-PS, no cases had to be eliminated because of missing data. As expected for thecontent and number of response options, six of the parent items were severely skewed and twoitems were severely kurtotic (Fabrigar, Wegener, MacCallum, & Strahan, 1999). On the HPQ-TS, one case had to be eliminated because of missing data. Eight of the teacher items wereseverely skewed and one item was severely kurtotic (Fabrigar et al., 1999).
Factor Analysis of the HPQ-PSResults from Bartlett’s Test of Sphericity (Bartlett, 1954) indicated that the correlation matrixwas not random (χ2 = 1936.27; df = 465; p < .001). The Kaiser-Meyer-Olkin (Kaiser, 1974)statistic was .825, well above the minimum standard for conducting a factor analysis suggestedby Kline (1994). Measures of sampling adequacy for each variable were also within reasonablelimits. Thus, the correlation matrix was appropriate for factor analysis.
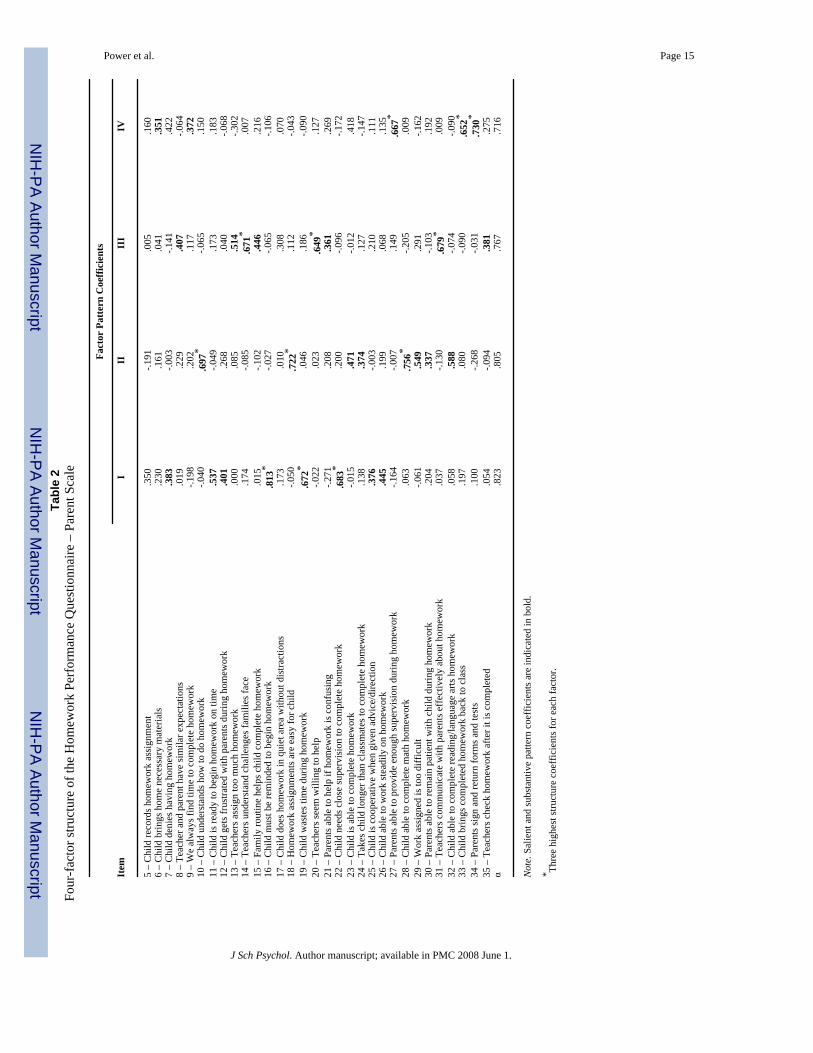
Parallel analysis suggested that six factors be retained, but the MAP criterion recommendedfour factors. The visual scree demonstrated two ‘bends,’ one at six factors and another at fourfactors. Given that it is better to over-factor than under-factor (Wood, Tataryn, & Gorsuch,1996), six- to four-factor solutions were examined for both substantive and statisticalsuitability. Both the six- and five-factor solutions were problematic in that one or more factorshad an insufficient number of salient items. In contrast, the four-factor solution containedsufficient salient items in each factor and accounted for 39% of the total variance. Factorintercorrelations ranged from .21 to .46.
Nine items loaded saliently on factor I (see Table 2) with an internal consistency of .799.However, coefficient alpha would have been .823 if item 5 were deleted, suggesting that onlyeight items should be retained. These eight salient items seemed to refer to a student taskorientation/efficiency dimension. Eight items with an alpha coefficient of .805 loaded salientlyon factor II. These items appeared to tap a student competence dimension. Eight salient itemswith an internal consistency reliability of .767 loaded on factor III. Factor III seemed to assessa teacher support dimension. Factor IV, which seemed to assess parent involvement, wassaliently loaded by five items with a coefficient alpha of .716. Unfortunately, responses to theitems on this factor were so severely skewed that there was very little variability in thedistribution of responses. In other words, almost all of the parents rated the items in a way thatdemonstrated high levels of parent involvement. The findings indicated that this factor wasproblematic and needed to be significantly modified or deleted.
Factor Analysis of the HPQ-TSResults from Bartlett’s Test of Sphericity (Bartlett, 1954) indicated that the correlation matrixwas not random (χ2 = 1507.7; df = 91; p < .001). The Kaiser-Meyer-Olkin (Kaiser, 1974)statistic was .876, well above the minimum standard suggested by Kline (1994). Measures ofsampling adequacy for each variable were also within reasonable limits. Thus, the correlationmatrix was appropriate for factor analysis.
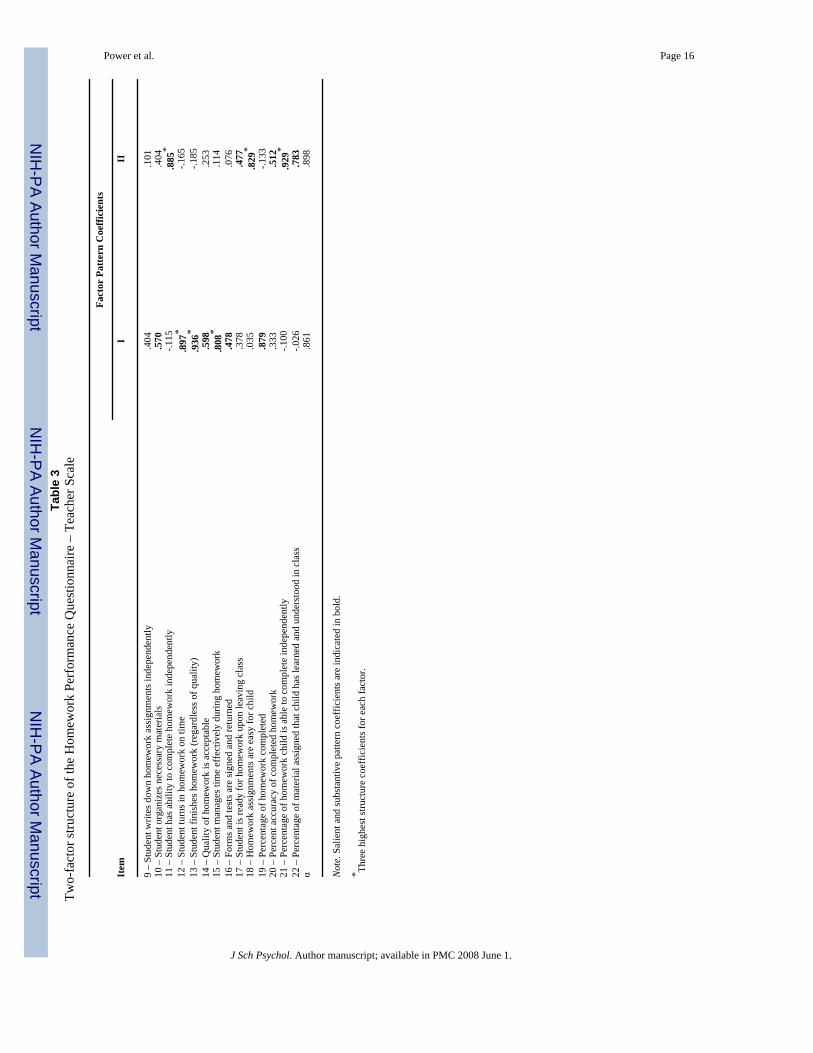
Both MAP and parallel analysis suggested that two factors be retained, but the visual scree testindicated three factors. Consequently, both solutions were iteratively evaluated. The three-factor solution was problematic because the third factor was saliently loaded by only two items.In contrast, the two-factor solution contained a sufficient number of salient items in each factorand accounted for 58.6% of the total variance. The factor intercorrelation was .40.
Power et al. Page 7
J Sch Psychol. Author manuscript; available in PMC 2008 June 1.
NIH
-PA Author Manuscript
NIH
-PA Author Manuscript
NIH
-PA Author Manuscript
Eight items loaded saliently on factor I (see Table 3) with an internal consistency of .861.However, coefficient alpha would have been .878 if item 9 were deleted, suggesting that onlyseven items should be retained. These seven salient items seemed to refer to a studentresponsibility dimension. Six items loaded saliently on factor II with an internal consistencyof .898. Those six salient items appeared to tap a student competence dimension.
Intercorrelations Between Parent and Teacher FactorsUnit-weighted factor scores on the HPQ-PS and HPQ-TS were intercorrelated. Parent factor I(student task engagement) was significantly correlated with teacher factor I (studentresponsibility; r = .28, p < .01) but not significantly correlated with teacher factor II (studentcompetence; r = .11, p = .19). Also, parent factor II (student competence) was significantlycorrelated with teacher factor I (student responsibility; r = .29, p < .01) as well as teacher factorII (student competence; r = .44, p < .01).
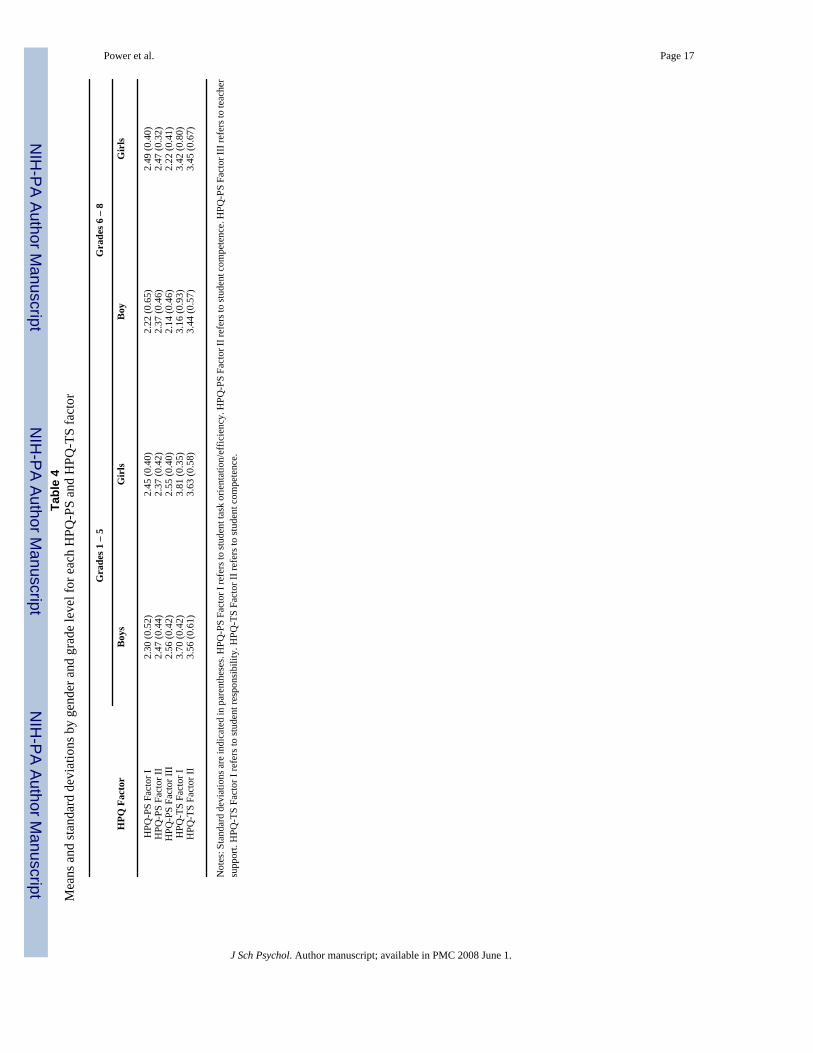
Child Gender and Grade Level DifferencesUnit-weighted factor scores were created by summing the responses to the salient andsubstantive items in each factor and dividing by the number of items in the factor. On eachscale, higher scores indicated greater levels of adaptive functioning. Grade levels were dividedinto two groups, Grades 1 through 5 and Grades 6 through 8, which generally correspond withelementary versus middle school. The sample sizes for the gender by grade grouping cellsranged from 25 to 54. The cell sizes for middle school students were about 50% the size of theelementary school cells, which is a sufficient level of balance for conducting a multivariateanalysis of variance (MANOVA). The variances were generally similar across the gender bygrade grouping cells, with the exception of the variances between grade groups for the teacher-rated student responsibility factor, suggesting that grade effects on this factor be interpretedwith caution. Separate two-way (gender by grade grouping) MANOVAs were conducted forthe parent and teacher factors.
Means and standard deviations by gender and grade grouping for each of the HPQ factors arereported in Table 4. For the HPQ-PS, MANOVA results showed a significant main effect forgender (Wilks’ Lambda of .941, F [3, 157] = 3.278, p = .023, partial eta2 = .059) and for gradegrouping (Wilks’ Lambda of .941, F [3,157] = 11.327, p < .001, partial eta2 = .178), but anonsignificant interaction effect (partial eta2 = .012). Follow-up univariate analysesdemonstrated that boys received higher ratings than girls on the task engagement/efficiencyfactor with a small effect size (F [1,157] = 6.426, p = .012, partial eta2 = .039). A significantgender effect was not identified on the other factors. There was a significant grade groupingeffect on the teacher support factor only (F [1,157] = 28.453, p < .001, partial eta2 = .152);students in elementary school were rated higher than those in middle school, with a large effectsize.
For the HPQ-TS, MANOVA results showed a significant effect for grade grouping (Wilks’Lambda of .874, F [2, 154] = 11.062, p < .001, partial eta2 = .126), but a non-significant maineffect for gender (partial eta2 = .023) and a non-significant interaction term (partial eta2 = .007). Univariate follow-up analyses demonstrated significant results related to grade grouping,but only on the student responsibility factor; teachers rated elementary students higher thanmiddle school students, with a moderate effect size, on this factor (F [1,154] = 21.797, p < .001, partial eta2 = .123).
DiscussionThe findings of this study suggest that the HPQ parent and teacher scales are promisingmeasures of homework performance. In particular, the findings support the presence of three
Power et al. Page 8
J Sch Psychol. Author manuscript; available in PMC 2008 June 1.
NIH
-PA Author Manuscript
NIH
-PA Author Manuscript
NIH
-PA Author Manuscript
substantive factors for the HPQ-PS: student task engagement/efficiency, student competence,and teacher support. Also, the findings provide evidence for two substantive factors for theHPQ-TS: student responsibility and student competence. Each of the three factors of the HPQ-PS consisted of eight items, and the internal consistency reliability indices for these factorswere in the moderate to high range. The HPQ-TS factors consisted of at least six items and theinternal consistency reliability indices for these factors were high.
Both the HPQ-PS and HPQ-TS assessed a factor related to student competence, referring to astudent’s ability to complete assignments accurately and independently. The moderate-levelcorrelation between informants on this factor is similar in magnitude to the correlationsbetween parents and teachers on other constructs (e.g. inattention, hyperactivity, conductproblems) using rating scales such as the Achenbach System of Empirically Based Assessment(Achenbach & Rescorla, 2001), Behavior Assessment System for Children, Second Edition(Reynolds & Kamphaus, 2004), and the ADHD Rating Scale – IV (DuPaul, Power,Anastopoulos, & Reid, 1998). The moderate-level correlation between parents and teacherssuggests that the student competence factor of the HPQ-PS is similar to its counterpart on theHPQ-TS and that each informant provides relatively unique information about a student’scompetence related to homework functioning. The student competence factor could beinterpreted as referring to the degree of match between the difficulty level of homeworkassignments and the student’s ability to complete assignments, or the degree of instructionalmatch. This factor may be useful in assessing the extent to which assignments are at a difficultylevel appropriate for the student.
Although the HPQ-PS student task engagement/efficiency factor and the HPQ-TS studentresponsibility factor were significantly correlated with each other, they appear to assesssomewhat different dimensions of homework functioning. The parent-reported taskengagement/efficiency factor provides information about student behaviors while preparingfor homework and actually completing the work. In contrast, the teacher-reported studentresponsibility factor reflects primarily student productivity and compliance with homeworkrules (i.e., behaviors that the teacher can directly observe or at least be in a position toapprehend).
A unique aspect of the HPQ-PS is that it provides information about the extent to which parentsview teachers as supportive to families in coping with the challenges of homework. The teachersupport factor refers to contextual issues that may have an affect on homework performanceand the quality of the family-school relationship. It is noteworthy that parental ratings ofelementary school children were substantially higher (large effect size) than their ratings ofmiddle school children, suggesting that parents view teachers as more supportive and helpfulwith homework challenges at the elementary level than at the middle school level.
The HPQ-PS teacher support factor provides potentially valuable information about contextualfactors that may influence homework performance. This factor refers to the extent to whichparents think that teachers understand the challenges parents face in coping with homeworkand are able to communicate with parents effectively regarding homework. Although theteacher support factor appears to have educational utility, the inclusion of these items in somecases could have adverse effects in that teacher knowledge of parental ratings on these itemscould strain the parent-teacher relationship.
LimitationsThe school districts included in the study sample represented a diverse range of students bothwith regard to ethnic/racial grouping and socioeconomic status. However, the sampleunderrepresented the population of Latino children attending one of the school districts targetedfor this study. In this preliminary study an English language version of the HPQ-PS was used,
Power et al. Page 9
J Sch Psychol. Author manuscript; available in PMC 2008 June 1.
NIH
-PA Author Manuscript
NIH
-PA Author Manuscript
NIH
-PA Author Manuscript
which excluded children whose parents spoke limited English. As such, the findings of thisstudy may not reflect adequately the views of many Latino families from these schools. Also,the sample underrepresented students of lower socioeconomic status, as indexed by eligibilityfor free and reduced-fare lunch, which is common in studies conducted through schools(National Center for Educational Statistics, 2004). Specialized strategies including incentivesystems have been recommended to improve rates of recruitment, particularly in schoolssituated in underresourced urban and rural settings (Blom-Hoffman, Leff, Franko, & Power,2006).
Although the sample was relatively diverse, it includes children from only two districts locatedin the Northeast section of the country. In future research, it will be important to include schoolsthroughout the country that are representative of the diverse ethnic, racial, and socioeconomicgroupings that comprise the United States.
The sample size of this study is relatively small and the external validity of the rating scaleshas not yet been established. Because additional research is needed to determine the validityof the measures and to establish normative parameters, the scales are not yet recommended forclinical use.
Directions for ResearchThe version of the HPQ-TS used in this study did not include items referring to teacherperceptions of the extent to which parents are supportive of teachers in their efforts to guidestudents through the homework process. In future versions of this measure, it may be usefulto include items referring to parent support, which would serve as a counterpart to factor IIIon the HPQ-PS referring to teacher support. However, because the practice of requestingteachers to rate level of parent support could have adverse effects on the family-schoolrelationship if parents were to learn about the findings, it is recommended that items pertainingto a parent support factor be administered only when teacher ratings can be kept confidential,such as in the context of a research study.
The validity of the HPQ needs to be further established by correlating its factors with variouscriterion measures. For example, factor scores for the HPQ-PS could be correlated with factorscores for the parent-rated HPC, graded samples of children’s homework, and parent ratingsof the quality of the parent-teacher relationship, as assessed by a measure such as the Parent-Teacher Involvement Questionnaire (Kohl, Lengua, McMahon, & Conduct ProblemsPrevention Research Group, 2000). Factor scores on the HPQ-TS could be correlated withteacher records of homework completion, graded samples of children’s homework, and ananalysis of the completeness and accuracy of students’ homework assignment books.
For purposes of normative comparison, it is important that the HPQ be standardized with asample representing the diverse geographic regions, ethnic and racial groups, andsocioeconomic groupings in the United States. Further, it would be useful to establish cut-points for universal screening by conducting predictive power analyses to determine thethreshold at which children are at risk for having homework problems.
ConclusionsThis article describes the development of parent and teacher ratings scales to assess children’shomework performance. A unique feature of the rating scales is that they were developed witha focus on the assessment of strengths with regard to homework performance. Also, the scaleswere developed to assess contextual factors that have an effect on students’ homeworkperformance. The findings of this study indicate that the HPQ-PS assesses three factors: studenttask engagement/efficiency, student competence, and teacher support; and that the HPQ-TS
Power et al. Page 10
J Sch Psychol. Author manuscript; available in PMC 2008 June 1.
NIH
-PA Author Manuscript
NIH
-PA Author Manuscript
NIH
-PA Author Manuscript
assesses two factors: student responsibility and student competence. The student competencefactors of the HPQ-PS and HPQ-TS would appear to be useful in assessing the extent to whichhomework assignments are at an appropriate instructional level for students. Also, the teachersupport factor of the HPQ-PS may provide helpful information about the extent to whichteachers are responsive to parents in addressing homework concerns. Additional research onthe HPQ is needed to determine whether it is possible to reliably, validly, and ethically assessfamily contextual factors that influence homework performance. Also, research is needed toestablish the validity of the HPQ in relation to a wide range of criterion measures, identifybenchmarks for normative comparison, and identify cut-points for universal screening.
Acknowledgements
The authors are very grateful to the parents, teachers, and administrators affiliated with the school districts participatingin this study.
ReferencesAchenbach, TM.; Rescorla, LA. Manual for the ASEBA School-Age Forms and Profiles. Burlington,
VT: University of Vermont, Department of Psychiatry; 2001.Anesko KM, Schoiock G, Ramirez R, Levine FM. The Homework Problem Checklist: Assessing
children’s homework difficulties. Behavioral Assessment 1987;9:179–185.Bartlett MS. A further note on the multiplying factors for various Χ2 approximations in factor analysis.
Journal of the Royal Statistical Society 1954;16:296–298.Blom-Hoffman J, Leff SS, Franko D, Power TJ. Increasing student participation in school-based health
promotion program evaluations: A multicomponent strategy. 2006Manuscript under reviewBriggs NE, MacCallum RC. Recovery of weak common factors by maximum likelihood and ordinary
least squares estimation. Multivariate Behavioral Research 2003;38:25–56.Cattell RB. The scree test for the number of factors. Multivariate Behavioral Research 1966;1:245–276.Cooper, H. Homework. White Plains, NY: Longman; 1989.Cooper, H. The battle over homework: Common ground for administrators, teachers, and parents . 2.
Thousand Oaks, CA: Corwin Press; 2001.Cooper H, Lindsay JJ, Nye B, Greathouse S. Relationships among attitudes about homework, amount of
homework assigned and completed, and student achievement. Journal of Educational Psychology1998;90:70–83.
Cooper H, Robinson JC, Patall EA. Does homework improve academic achievement? A synthesis ofresearch. Review of Educational Research 2006;76:1–62.
DuPaul, GJ.; Power, TJ.; Anastopoulos, AD.; Reid, R. The ADHD Rating Scale –IV: Checklists, norms,and clinical interpretation. New York: Guilford Press; 1998.
Epstein JL. School/family/community partnerships: Caring for the children we share. Phi Delta Kappan1995;76(9):701–712.
Fabrigar LR, Wegener DT, MacCallum RC, Strahan EJ. Evaluating the use of exploratory factor analysisin psychological research. Psychological Methods 1999;4:272–299.
Fantuzzo J, McWayne C, Perry MA, Childs S. Multiple dimensions of family involvement and theirrelations to behavioral and learning competencies for urban, lowincome children. School PsychologyReview 2004;33:467–480.
Gorsuch, RL. Factor analysis. In: Schinka, JA.; Velicer, F., editors. Handbook of psychology: Volume2, research methods in psychology. Hoboken, NJ: Wiley; 2003. p. 143-164.
Gravois, TA.; Gickling, EE. Best practices in curriculum-based assessment. In: Thomas, A.; Grimes, J.,editors. Best practices in school psychology IV. Bethesda, MD: National Association of SchoolPsychologists; 2002. p. 885-898.
Hinshaw SP, March JS, Abikoff H, Arnold LE, Cantwell DP, Conners CK, et al. Comprehensiveassessment of childhood attention-deficit hyperactivity disorder in the context of a multisite,multimodal clinical trial. Journal of Attention Disorders 1997;1:217–234.
Power et al. Page 11
J Sch Psychol. Author manuscript; available in PMC 2008 June 1.
NIH
-PA Author Manuscript
NIH
-PA Author Manuscript
NIH
-PA Author Manuscript
Horn J. A rationale and test for the number of factors in factor analysis. Psychometrika 1965;30:179–185. [PubMed: 14306381]
Izzo CV, Weissberg RP, Kasprow WJ, Frendrich M. A longitudinal assessment of teacher perceptionsof parent involvement in children’s education and school performance. American Journal ofCommunity Psychology 1999;27:817–839. [PubMed: 10723536]
Kahle AL, Kelley ML. Children’s homework problems: A comparison of goal setting and parent training.Behavior Therapy 1994;25:275–290.
Kaiser HF. An index of factorial simplicity. Psychometrika 1974;39:31–36.Keith, TZ.; Keith, PB. Homework. In: Bear, GG.; Minke, KM., editors. Children’s Needs III:
Development, Prevention, and Intervention. Washington, DC: National Association of SchoolPsychologists; 2006. p. 615-629.
Kline, P. An easy guide to factor analysis. NY: Routledge; 1994.Kohl GO, Lengua LJ, McMahon RJ, Conduct Problems Prevention Research Group. Parent involvement
in school: Conceptualizing multiple dimensions and their relations with family and demographic riskfactors. Journal of School Psychology 2000;38:501–524.
Lahey BB, Applegate B, McBurnett K, Biederman J, Greenhill L, Hynd GW, et al. DSM-IV field trialfor attention-deficit hyperactivity disorder in children and adolescents. American Journal ofPsychiatry 1994;151:1673–1685. [PubMed: 7943460]
LeCompte, MD.; Schensul, JJ. Ethnographers’ toolkit, Book 5: Analyzing and interpreting ethnographicdata. Walnut Creek, CA: Altamira Press; 1999.
Lincoln, YS.; Gruba, EG. Naturalistic inquiry. Thousand Oaks, CA: Sage; 1985.Manz PH, Fantuzzo JF, Power TJ. Multidimensional assessment of family involvement among urban
elementary students. Journal of School Psychology 2004;42:461–475.Miller DL, Kelley ML. The use of goal setting and contingency contracting for improving children’s
homework performance. Journal of Applied Behavior Analysis 1994;27:73–84. [PubMed: 8188565]National Center for Educational Statistics . The condition of education. Washington, DC: US Department
of Education; 2004.Olympia DE, Sheridan SM, Jenson WR, Andrews D. Using student-managed interventions to increase
homework completion and accuracy. Journal of Applied Behavior Analysis 1994;27:85–99.[PubMed: 16795827]
Power, TJ.; Karustis, JL.; Habboushe, DF. Homework success for children with ADHD: A family-schoolintervention program. New York: Guilford Press; 2001.
Power TJ, Soffer SL, Clarke AT, Mautone JA. Multisystemic intervention for children with ADHD.Report on Emotional & Behavioral Disorders in Youth 2006;6:51–52. 67–69.
Power TJ, Werba BE, Watkins MW, Angelucci JG, Eiraldi RB. Patterns of parent-reported homeworkproblems among ADHD-referred and non-referred children. School Psychology Quarterly2006;21:13–33.
Reynolds, CR.; Kamphaus, RW. Behavior Assessment System for Children. Second Edition. Circle Pines,MN: American Guidance Service; 2004.
Tataryn DJ, Wood JM, Gorsuch RL. Setting the value of k in promax: A Monte Carlo study. Educationaland Psychological Measurement 1999;59:384–391.
Velicer WF. Determining the number of components from the matrix of partial correlations.Psychometrika 1976;41:321–327.
Velicer, WF.; Eaton, CA.; Fava, JL. Construct explication through factor or component analysis: A reviewand evaluation of alternative procedures for determining the number of factors or components. In:Goffin, RD.; Helmes, E., editors. Problems and solutions in human assessment: Honoring DouglasN Jackson at seventy. Boston: Kluwer Academic Publishers; 2000. p. 41-71.
Wegener, DT.; Fabrigar, LR. Analysis and design for nonexperimental data. In: Reis, HT.; Judd, CM.,editors. Handbook of research methods in social and personality psychology. NY: CambridgeUniversity Press; 2000. p. 412-450.
Weiner RK, Sheridan SM, Jenson WR. The effects of conjoint behavior consultation and a structuredhomework program on math completion and accuracy in junior high school students. SchoolPsychology Quarterly 1998;13:281–309.
Power et al. Page 12
J Sch Psychol. Author manuscript; available in PMC 2008 June 1.
NIH
-PA Author Manuscript
NIH
-PA Author Manuscript
NIH
-PA Author Manuscript
Widaman KF. Common factor analysis versus principal component analysis: Differential bias inrepresenting model parameters? Multivariate Behavioral Research 1993;28:263–311.
Wood JM, Tataryn DJ, Gorsuch RL. Effects of under- and overextraction on principal axis factor analysiswith varimax rotation. Psychological Methods 1996;1:354–365.
Power et al. Page 13
J Sch Psychol. Author manuscript; available in PMC 2008 June 1.
NIH
-PA Author Manuscript
NIH
-PA Author Manuscript
NIH
-PA Author Manuscript
NIH
-PA Author Manuscript
NIH
-PA Author Manuscript
NIH
-PA Author Manuscript
Power et al. Page 14Ta
ble
1D
istri
butio
n of
stud
ents
in th
e sc
hool
sam
ples
and
pop
ulat
ions
acc
ordi
ng to
gen
der,
race
/eth
nici
ty, a
nd su
bsid
ized
lunc
h st
atus
for e
ach
scho
ol d
istri
ct
Dis
tric
t AD
istr
ict A
Pop
ulat
ion
χ2D
istr
ict B
Dis
tric
t B P
opul
atio
nχ2
Tot
al S
ampl
e
Gen
der
M
ale
52 (5
4.7%
)54
%0.
0232
(47.
1%)
51%
0.41
84 (5
1.5%
)
Fem
ale
43 (4
5.3%
)46
%0.
0236
(52.
9%)
49%
0.41
79 (4
8.5%
)Et
hnic
ity
Cau
casi
an70
(73.
7%)
79%
1.61
40 (5
8.8%
)51
%1.
6611
0 (6
7.5%
)
Afr
ican
Am
eric
an18
(18.
9%)
15%
1.13
24 (3
5.3%
)33
%0.
1642
(25.
8%)
A
sian
3 (3
.2%
)2%
0.70
1 (1
.5%
)3%
0.53
4 (2
.5%
)
His
pani
c4
(4.2
%)
4%0.
013
(4.4
%)
13%
4.45
*7
(4.3
%)
Free
and r
educ
ed-f
are L
unch
7 (7
.4%
)11
.9%
1.83
12 (1
7.6%
)30
%4.
98*
19 (1
1.7%
)
Not
e: χ
2 re
flect
s the
diff
eren
ce b
etw
een
the
stud
y sa
mpl
e an
d sc
hool
pop
ulat
ion
for e
ach
scho
ol d
istri
ct.
* p
< .0
5
J Sch Psychol. Author manuscript; available in PMC 2008 June 1.
NIH
-PA Author Manuscript
NIH
-PA Author Manuscript
NIH
-PA Author Manuscript
Power et al. Page 15Ta
ble
2Fo
ur-f
acto
r stru
ctur
e of
the
Hom
ewor
k Pe
rfor
man
ce Q
uest
ionn
aire
– P
aren
t Sca
le
Fact
or P
atte
rn C
oeffi
cien
ts
Item
III
III
IV
5 –
Chi
ld re
cord
s hom
ewor
k as
sign
men
t.3
50-.1
91.0
05.1
606
– C
hild
brin
gs h
ome
nece
ssar
y m
ater
ials
.230
.161
.041
.351
7 –
Chi
ld d
enie
s hav
ing
hom
ewor
k.3
83-.0
03-.1
41.4
228
– Te
ache
r and
par
ent h
ave
sim
ilar e
xpec
tatio
ns.0
19.2
29.4
07-.0
649
– W
e al
way
s fin
d tim
e to
com
plet
e ho
mew
ork
-.198
.202
.117
.372
10 –
Chi
ld u
nder
stan
ds h
ow to
do
hom
ewor
k-.0
40.6
97*
-.065
.150
11 –
Chi
ld is
read
y to
beg
in h
omew
ork
on ti
me
.537
-.049
.173
.183
12 –
Chi
ld g
ets f
rust
rate
d w
ith p
aren
ts d
urin
g ho
mew
ork
.401
.268
.040
-.068
13 –
Tea
cher
s ass
ign
too
muc
h ho
mew
ork
.000
.085
.514
-.302
14 –
Tea
cher
s und
erst
and
chal
leng
es fa
mili
es fa
ce.1
74-.0
85.6
71*
.007
15 –
Fam
ily ro
utin
e he
lps c
hild
com
plet
e ho
mew
ork
.015
-.102
.446
.216
16 –
Chi
ld m
ust b
e re
min
ded
to b
egin
hom
ewor
k.8
13*
-.027
-.065
-.106
17 –
Chi
ld d
oes h
omew
ork
in q
uiet
are
a w
ithou
t dis
tract
ions
.173
.010
.308
.070
18 –
Hom
ewor
k as
sign
men
ts a
re e
asy
for c
hild
-.050
.722
*.1
12-.0
4319
– C
hild
was
tes t
ime
durin
g ho
mew
ork
.672
*.0
46.1
86-.0
9020
– T
each
ers s
eem
will
ing
to h
elp
-.022
.023
.649
*.1
2721
– P
aren
ts a
ble
to h
elp
if ho
mew
ork
is c
onfu
sing
-.271
.208
.361
.269
22 –
Chi
ld n
eeds
clo
se su
perv
isio
n to
com
plet
e ho
mew
ork
.683
*.2
00-.0
96-.1
7223
– C
hild
is a
ble
to c
ompl
ete
hom
ewor
k-.0
15.4
71-.0
12.4
1824
– T
akes
chi
ld lo
nger
than
cla
ssm
ates
to c
ompl
ete
hom
ewor
k.1
38.3
74.1
27-.1
4725
– C
hild
is c
oope
rativ
e w
hen
give
n ad
vice
/dire
ctio
n.3
76-.0
03.2
10.1
1126
– C
hild
abl
e to
wor
k st
eadi
ly o
n ho
mew
ork
.445
.199
.068
.135
27 –
Par
ents
abl
e to
pro
vide
eno
ugh
supe
rvis
ion
durin
g ho
mew
ork
-.164
-.007
.149
.667
*28
– C
hild
abl
e to
com
plet
e m
ath
hom
ewor
k.0
63.7
56*
-.205
.009
29 –
Wor
k as
sign
ed is
too
diff
icul
t-.0
61.5
49.2
91-.1
6230
– P
aren
ts a
ble
to re
mai
n pa
tient
with
chi
ld d
urin
g ho
mew
ork
.204
.337
-.103
.192
31 –
Tea
cher
s com
mun
icat
e w
ith p
aren
ts e
ffec
tivel
y ab
out h
omew
ork
.037
-.130
.679
*.0
0932
– C
hild
abl
e to
com
plet
e re
adin
g/la
ngua
ge a
rts h
omew
ork
.058
.588
-.074
-.090
33 –
Chi
ld b
rings
com
plet
ed h
omew
ork
back
to c
lass
.197
.080
-.090
.652
*34
– P
aren
ts si
gn a
nd re
turn
form
s and
test
s.1
00-.2
68-.0
31.7
30*
35 –
Tea
cher
s che
ck h
omew
ork
afte
r it i
s com
plet
ed.0
54-.0
94.3
81.2
75α
.823
.805
.767
.716
Not
e. S
alie
nt a
nd su
bsta
ntiv
e pa
ttern
coe
ffic
ient
s are
indi
cate
d in
bol
d.
* Thre
e hi
ghes
t stru
ctur
e co
effic
ient
s for
eac
h fa
ctor
.
J Sch Psychol. Author manuscript; available in PMC 2008 June 1.
NIH
-PA Author Manuscript
NIH
-PA Author Manuscript
NIH
-PA Author Manuscript
Power et al. Page 16Ta
ble
3Tw
o-fa
ctor
stru
ctur
e of
the
Hom
ewor
k Pe
rfor
man
ce Q
uest
ionn
aire
– T
each
er S
cale
Fact
or P
atte
rn C
oeffi
cien
ts
Item
III
9 –
Stud
ent w
rites
dow
n ho
mew
ork
assi
gnm
ents
inde
pend
ently
.404
.101
10 –
Stu
dent
org
aniz
es n
eces
sary
mat
eria
ls.5
70.4
0411
– S
tude
nt h
as a
bilit
y to
com
plet
e ho
mew
ork
inde
pend
ently
-.115
.885
*12
– S
tude
nt tu
rns i
n ho
mew
ork
on ti
me
.897
*-.1
6513
– S
tude
nt fi
nish
es h
omew
ork
(reg
ardl
ess o
f qua
lity)
.936
*-.1
8514
– Q
ualit
y of
hom
ewor
k is
acc
epta
ble
.598
.253
15 –
Stu
dent
man
ages
tim
e ef
fect
ivel
y du
ring
hom
ewor
k.8
08*
.114
16 –
For
ms a
nd te
sts a
re si
gned
and
retu
rned
.478
.076
17 –
Stu
dent
is re
ady
for h
omew
ork
upon
leav
ing
clas
s.3
78.4
7718
– H
omew
ork
assi
gnm
ents
are
eas
y fo
r chi
ld.0
35.8
29*
19 –
Per
cent
age
of h
omew
ork
com
plet
ed.8
79-.1
3320
– P
erce
nt a
ccur
acy
of c
ompl
eted
hom
ewor
k.3
33.5
1221
– P
erce
ntag
e of
hom
ewor
k ch
ild is
abl
e to
com
plet
e in
depe
nden
tly-.1
00.9
29*
22 –
Per
cent
age
of m
ater
ial a
ssig
ned
that
chi
ld h
as le
arne
d an
d un
ders
tood
in c
lass
-.026
.783
α.8
61.8
98
Not
e. S
alie
nt a
nd su
bsta
ntiv
e pa
ttern
coe
ffic
ient
s are
indi
cate
d in
bol
d.
* Thre
e hi
ghes
t stru
ctur
e co
effic
ient
s for
eac
h fa
ctor
.
J Sch Psychol. Author manuscript; available in PMC 2008 June 1.
NIH
-PA Author Manuscript
NIH
-PA Author Manuscript
NIH
-PA Author Manuscript
Power et al. Page 17Ta
ble
4M
eans
and
stan
dard
dev
iatio
ns b
y ge
nder
and
gra
de le
vel f
or e
ach
HPQ
-PS
and
HPQ
-TS
fact
or
Gra
des 1
– 5
Gra
des 6
– 8
HPQ
Fac
tor
Boy
sG
irls
Boy
Gir
ls
HPQ
-PS
Fact
or I
2.30
(0.5
2)2.
45 (0
.40)
2.22
(0.6
5)2.
49 (0
.40)
HPQ
-PS
Fact
or II
2.47
(0.4
4)2.
37 (0
.42)
2.37
(0.4
6)2.
47 (0
.32)
HPQ
-PS
Fact
or II
I2.
56 (0
.42)
2.55
(0.4
0)2.
14 (0
.46)
2.22
(0.4
1)H
PQ-T
S Fa
ctor
I3.
70 (0
.42)
3.81
(0.3
5)3.
16 (0
.93)
3.42
(0.8
0)H
PQ-T
S Fa
ctor
II3.
56 (0
.61)
3.63
(0.5
8)3.
44 (0
.57)
3.45
(0.6
7)
Not
es: S
tand
ard
devi
atio
ns a
re in
dica
ted
in p
aren
thes
es. H
PQ-P
S Fa
ctor
I re
fers
to st
uden
t tas
k or
ient
atio
n/ef
ficie
ncy.
HPQ
-PS
Fact
or II
refe
rs to
stud
ent c
ompe
tenc
e. H
PQ-P
S Fa
ctor
III r
efer
s to
teac
her
supp
ort.
HPQ
-TS
Fact
or I
refe
rs to
stud
ent r
espo
nsib
ility
. HPQ
-TS
Fact
or II
refe
rs to
stud
ent c
ompe
tenc
e.
J Sch Psychol. Author manuscript; available in PMC 2008 June 1.
Related Documents