ORIGINAL PAPER Assessing causes of recent organic carbon losses from cropland soils by means of regional-scaled input balances for the case of Flanders (Belgium) Steven Sleutel Stefaan De Neve Georges Hofman Received: 26 July 2006 / Accepted: 11 January 2007 / Published online: 21 February 2007 Ó Springer Science+Business Media B.V. 2007 Abstract Several recent reports on cropland soil organic carbon (SOC) stock changes throughout Europe indicate a general continuing loss of SOC from these soils. As most arable soils in Europe are not in an equilibrium situation because of past changes in land-use and man- agement practices, shifts in both have been suggested to drive this decline of SOC stocks. A lack of data has prevented the unambiguous verification of the contribution of these factors to SOC loss. First, this study focused on recent evolutions in management options for SOC sequestration in Flanders and showed that despite such practices have increased since 1990, their current contribution is still limited. Strikingly, their expansion is at odds with the reported general losses of SOC (–0.48 t OC ha –1 year –1 on average). We used very detailed datasets of livestock numbers, N-application rates and cropping surfaces to calculate regional shifts in input of effective OC from animal manure application, cereal straw incorporation and crop residue incorporation which amounted to –0.094, –0.045 and –0.017 t OC ha –1 year –1 , respectively. Shifts in management were identi- fied to have potentially brought about but a third of the recent loss of SOC in the study area, although for central West-Flanders and the East- ern border of Flanders larger impacts of manage- ment were observed. This study suggests other influences such as land-use change and climate change to be involved as well. We estimated that another 10%–45% of the loss of SOC could potentially be attributed to land-use changes from grassland to cropland during the 1970–1990 period and about 10% to the observed temperature increase. While being a regional-scaled case study, these findings may be relevant to other European regions in particular (Denmark, The Netherlands, North-West Germany, Brittany and the North- West of France, the Po-valley in Italy and parts of England), with similar climate and intensity of agriculture, and where comparable trends in farming management may well have taken place. Keywords Soil organic carbon Carbon sequestration Soil management Animal manure Humification coefficient Land use Introduction In the context of climate change cropland pro- duction is discussed both as a source of green- house gasses as well as a possible sink for carbon. Art. 3.4 of the Kyoto Protocol allows carbon S. Sleutel (&) S. De Neve G. Hofman Department of Soil Management and Soil Care, Ghent University, Coupure Links 653, 9000 Gent, Belgium e-mail: [email protected] 123 Nutr Cycl Agroecosyst (2007) 78:265–278 DOI 10.1007/s10705-007-9090-x

Welcome message from author
This document is posted to help you gain knowledge. Please leave a comment to let me know what you think about it! Share it to your friends and learn new things together.
Transcript

ORIGINAL PAPER
Assessing causes of recent organic carbon losses fromcropland soils by means of regional-scaled input balancesfor the case of Flanders (Belgium)
Steven Sleutel Æ Stefaan De Neve ÆGeorges Hofman
Received: 26 July 2006 / Accepted: 11 January 2007 / Published online: 21 February 2007� Springer Science+Business Media B.V. 2007
Abstract Several recent reports on cropland
soil organic carbon (SOC) stock changes
throughout Europe indicate a general continuing
loss of SOC from these soils. As most arable soils
in Europe are not in an equilibrium situation
because of past changes in land-use and man-
agement practices, shifts in both have been
suggested to drive this decline of SOC stocks.
A lack of data has prevented the unambiguous
verification of the contribution of these factors to
SOC loss. First, this study focused on recent
evolutions in management options for SOC
sequestration in Flanders and showed that
despite such practices have increased since
1990, their current contribution is still limited.
Strikingly, their expansion is at odds with the
reported general losses of SOC (–0.48 t OC ha–1
year–1 on average). We used very detailed
datasets of livestock numbers, N-application
rates and cropping surfaces to calculate regional
shifts in input of effective OC from animal
manure application, cereal straw incorporation
and crop residue incorporation which amounted
to –0.094, –0.045 and –0.017 t OC ha–1 year–1,
respectively. Shifts in management were identi-
fied to have potentially brought about but a third
of the recent loss of SOC in the study area,
although for central West-Flanders and the East-
ern border of Flanders larger impacts of manage-
ment were observed. This study suggests other
influences such as land-use change and climate
change to be involved as well. We estimated that
another 10%–45% of the loss of SOC could
potentially be attributed to land-use changes from
grassland to cropland during the 1970–1990 period
and about 10% to the observed temperature
increase. While being a regional-scaled case study,
these findings may be relevant to other European
regions in particular (Denmark, The Netherlands,
North-West Germany, Brittany and the North-
West of France, the Po-valley in Italy and parts of
England), with similar climate and intensity of
agriculture, and where comparable trends in
farming management may well have taken place.
Keywords Soil organic carbon � Carbon
sequestration � Soil management � Animal
manure � Humification coefficient � Land use
Introduction
In the context of climate change cropland pro-
duction is discussed both as a source of green-
house gasses as well as a possible sink for carbon.
Art. 3.4 of the Kyoto Protocol allows carbon
S. Sleutel (&) � S. De Neve � G. HofmanDepartment of Soil Management and Soil Care,Ghent University, Coupure Links 653, 9000 Gent,Belgiume-mail: [email protected]
123
Nutr Cycl Agroecosyst (2007) 78:265–278
DOI 10.1007/s10705-007-9090-x

sequestration due to human-induced agricultural
activities, which have started after 1990, to be
accounted for during the 2008–2012 commitment
period. Every participating country may choose
which additional agricultural management options
it will take into account. Consequently, this also
implies that any possible extra emissions from
these alternative management options will also
have to be reported during the commitment
period. Quantification of their net sequestration
potential will thus be crucial, since selection of
management options with a net negative green-
house gas balance, when compared to the ‘‘busi-
ness as usual’’ scenario, will have negative
consequences on the National greenhouse gas
balance. Numerous previous studies have all
focused on the ‘‘biological’’ sequestration poten-
tial (Vleeshouwers and Verhagen 2002; Freibauer
et al. 2004) which is likely to strongly exceed the
sequestration that may be actually achieved.
Smith et al. (2005b) concluded that in the EU15
as a whole cropland management has not in-
creased SOC sequestration significantly since 1990
nor is it predicted to do so in the near future.
Similarly, the present study focuses on estimating
recent evolutions in management for SOC seques-
tration in the intensively managed cropland
soils of Flanders (Belgium) and uses the current
contribution of such management as a safe mea-
sure of the actually achievable SOC sequestration
potential.
In previous studies (Sleutel et al. 2003, 2006),
we have demonstrated that large-scale SOC stock
losses have recently occurred in Flanders
(Belgium). Both recent changes in OM-input
management as well as past shifts in land-use
were hypothesized to contribute to this decrease
in SOC stock. As is the case for any region in the
world, a lack of data constricted unambiguous
verification of such a hypothesis. For example,
Bellamy et al. (2005) observed similar recent
general SOC stock losses based on large-scale
soil inventories, but a further analysis of possible
causes was indeed hindered by data restrictions.
Sleutel et al. (2006) did however find supporting
indications for West Flanders, i.e., a part of the
study area, which suggest a strong impact of
manure and crop residue inputs on evolution of
SOC levels.
The objectives of the present study were:
(1) to link recent evolutions in manuring and
crop rotations to SOC stock changes for the
whole of Flanders on a very detailed scale,
i.e., at the community level.
(2) to investigate the past and current extent of
practice of a number of management options
for SOC sequestration and evaluate their
future potential.
To do so, we examined very detailed datasets
of livestock numbers, manure application rates,
individual crop surfaces and a unique extensive
SOC stock dataset, which all cover the whole
study area and were available at the community
scale. The research described in this paper uses
Flanders as a case study area to illustrate the
development of regional-scaled OM balances as a
means for explaining SOC stock evolutions.
Farming management in the study area
Agriculture in the study area Flanders (the
Northern part of Belgium) is very intensive,
characterized by a large use of agricultural inputs
and by a very intensive livestock production, with
a predominance of pig and poultry production.
The agricultural and horticultural holdings in
Flanders are small scaled, with a mean area of
15 ha. Large animal manure applications on both
arable land and grassland are a direct conse-
quence of the high livestock density, and this
manure is mostly applied in the form of slurry
(only about fifth of all N in manure is applied as
farmyard manure). The use of other organic
fertilizers such as composts is very limited.
Table 1 compares the composition of a number
of organic amendments that are commonly
applied in Western European cropland produc-
tion. The European nitrate directive (91/676/
CEE) was practically enforced in Flanders with
the implementation of the Flemish ‘‘Manure
Action Plan’’. Since 1991, the Manure Action
Plan prescribes the type and quantity of manure
that can be applied to field crops and pasture, thus
preventing the excessive rates of manure appli-
cation that often occurred in the past. This caused
an excess of about 2,390,000 t of pig slurry and
266 Nutr Cycl Agroecosyst (2007) 78:265–278
123
356,000 t of poultry slurry in 2003 that had to be
processed in Flanders or exported, which clearly
demonstrates that there remains a large overpro-
duction of manure. The main arable crops are
maize, winter cereals, potatoes, temporary pas-
ture, sugar beet and field grown vegetables
(Table 2), which are non-uniformly distributed
over the whole of Flanders: cattle production is
concentrated in the heavy textured soils in the
North-Eastern Polder area and the North-East
(the Northern Campines). There is a concentra-
tion of pig production in the North of West-
Flanders. Intense production of field-grown veg-
etables is concentrated in the centre of the
province of West-Flanders and on sandy soils in
the South of the Province of Antwerp. The silt
region, which covers the whole Southern border is
characterized by pure arable crop production with
winter cereals, sugar beets and potatoes. During
winter time the soil is often left bare after harvest
in Western European croplands, but the use of
green manures as catch crops and as an effective
erosion control measure is now actively pro-
moted, also in Flanders. Typical green manure
crops include yellow mustard (Sinapis alba),
Italian ray grass (Lolium multiflorum) and Phac-
elia (Phacelia tanacetifolia), among others. They
provide a mean OM input of 2.0 t OM ha–1
(Sleutel et al. 2003). The composition of the most
frequently used green manures in the study area is
given in Table 3 (data taken from Anonymous
2002). Organic farming occupies but a very small
share of the total agricultural land, but there was
a substantial increase in the organically farmed
cropland and grassland during the last decade,
from 296 ha in 1991 to 3470 ha in 2001, of which
some 678 ha is estimated to be cropland (Biofo-
rum 2002). In spite of this exponential increase
over the last years, the sector still merely accounts
for 0.63% of the total Flemish agricultural land,
Table 1 Dry matter (DM), OM, total N and P content and the humification coefficient or fraction of OMeff of commonlyapplied organic fertilizers (Source: Bries et al. 1995; Vanongeval et al. 1995; De Neve et al. 2003)
Organic fertilizer DM content(t DM t–1)
OM content(t OM t–1)
hc (–) N content(kg N t–1)
P content(kg P2O5 t–1)
Slurry (pigs) 0.09 0.06 0.4 6.5 4.0Slurry (cattle) 0.09 0.06 0.4 4.4 1.8Farmyard manure (pigs) 0.23 0.16 0.5 7.5 9.0Farmyard manure (cattle) 0.24 0.14 0.5 5.5 3.5VFG-composta 0.79 0.23 0.87 12.3 3.9Green-compost 0.51 0.18 0.95 9.6 2.9
a VFG vegetable, fruit and garden waste
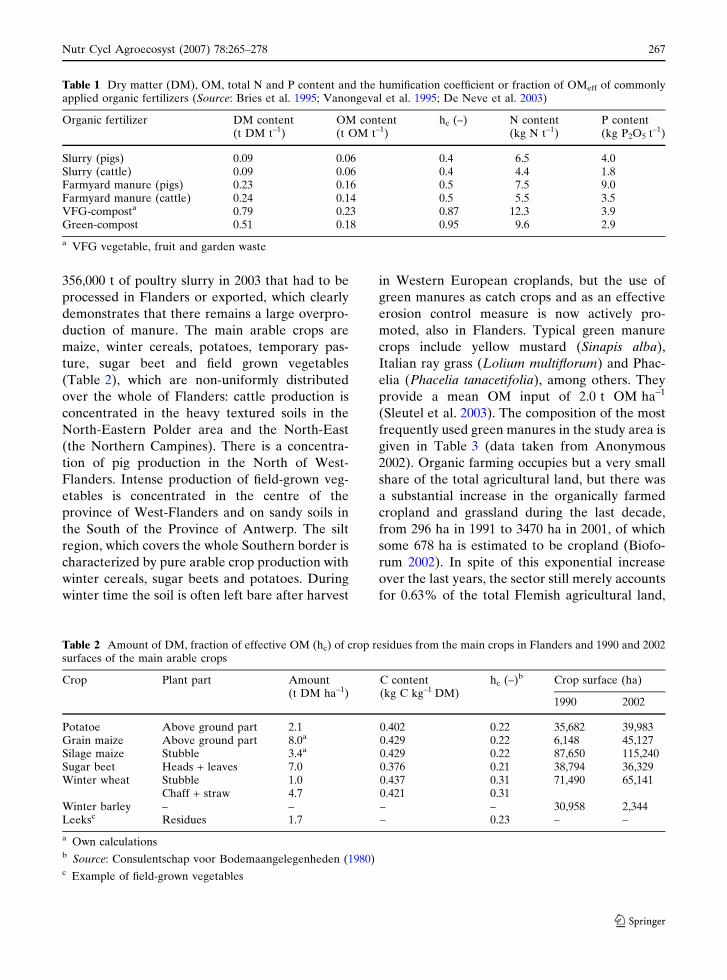
Table 2 Amount of DM, fraction of effective OM (hc) of crop residues from the main crops in Flanders and 1990 and 2002surfaces of the main arable crops
Crop Plant part Amount(t DM ha–1)
C content(kg C kg–1 DM)
hc (–)b Crop surface (ha)
1990 2002
Potatoe Above ground part 2.1 0.402 0.22 35,682 39,983Grain maize Above ground part 8.0a 0.429 0.22 6,148 45,127Silage maize Stubble 3.4a 0.429 0.22 87,650 115,240Sugar beet Heads + leaves 7.0 0.376 0.21 38,794 36,329Winter wheat Stubble 1.0 0.437 0.31 71,490 65,141
Chaff + straw 4.7 0.421 0.31Winter barley – – – – 30,958 2,344Leeksc Residues 1.7 – 0.23 – –
a Own calculationsb Source: Consulentschap voor Bodemaangelegenheden (1980)c Example of field-grown vegetables
Nutr Cycl Agroecosyst (2007) 78:265–278 267
123
which clearly shows its potential for further
expansion.
Materials and methods
Evaluation of management options for SOC
sequestration
Decomposition of SOM is directly influenced by
physical and chemical soil properties and climatic
and management factors. Higher inputs of OM
imply a larger application of organic manures such
as farmyard manure, compost and wastes as
replacements for mineral fertilizers and slurry.
Use of green manures and temporary pasture (ley-
farming) and alternative crop rotations provide
other alternatives for maintaining or increasing
the SOC stock. In order to evaluate the individual
role of these management options in the OM
balance of Flemish cropland soils, the extent of
each one of these management options in Flanders
in the ‘‘current’’ (2002) and baseline (1990) year
were calculated. Additionally, based on these
data, their potential for future SOC sequestration
is calculated. Data sources and assumptions made
are given below.
Decomposability of OM inputs differs strongly
between crops, manures and composts and is
dependant on their composition. Under field
conditions, after one year merely 15% to more
than 50% of this OM will remain in soil unde-
composed. Therefore, to assess and compare the
ability of different management options for SOC
sequestration it is more sensible to calculate with
the effective amount of OC (OCeff) added to the
soil, which is assumed to be the fraction (hc) of
the incorporated OC that remains in the soil after
one year under field conditions (Henin and
Dupuis 1945). For example, results from three
Belgian field experiments on the use of vegeta-
bles-, fruit- and garden waste compost (VFG-
compost) in arable rotations (details shown in
Table 4) were used to compare these calculations
of OCeff inputs to measured SOC sequestration
rates. From the yearly SOC storage in these
experiments a mean SOC storage of 0.083 t OC t–1
applied compost was deducted. The calculated
amount of OCeff per ton VFG-compost (based on
data in Table 1) was 0.101 t OCeff t–1, which
closely matches to this storage, and demonstrates
that the here applied humification coefficient-
based calculation of OCeff input as an estimate of
SOC sequestration is realistic. This approach has
furthermore been applied in recent simulation
models of C sequestration in soils (Vleeshouwers
and Verhagen 2002).
We calculated 1990 and 2002 OCeff inputs from
several management options:
(a) Green Manuring: The average input of
OCeff per ha of green manure can be calculated to
be 0.34 t OCeff ha–1 year–1 (based on Table 3).
The total area of crops after which a green
manure could be sown (cereals, early potatoes
and legumes) currently amounts to some
93,000 ha. In 2002 only 34,342 ha was subsidized
for green manuring by the Flemish Government,
which indicates that but a third of this manage-
ment option’s potential is being used. We here
assumed that virtually no green manure crops
were sown in 1990.
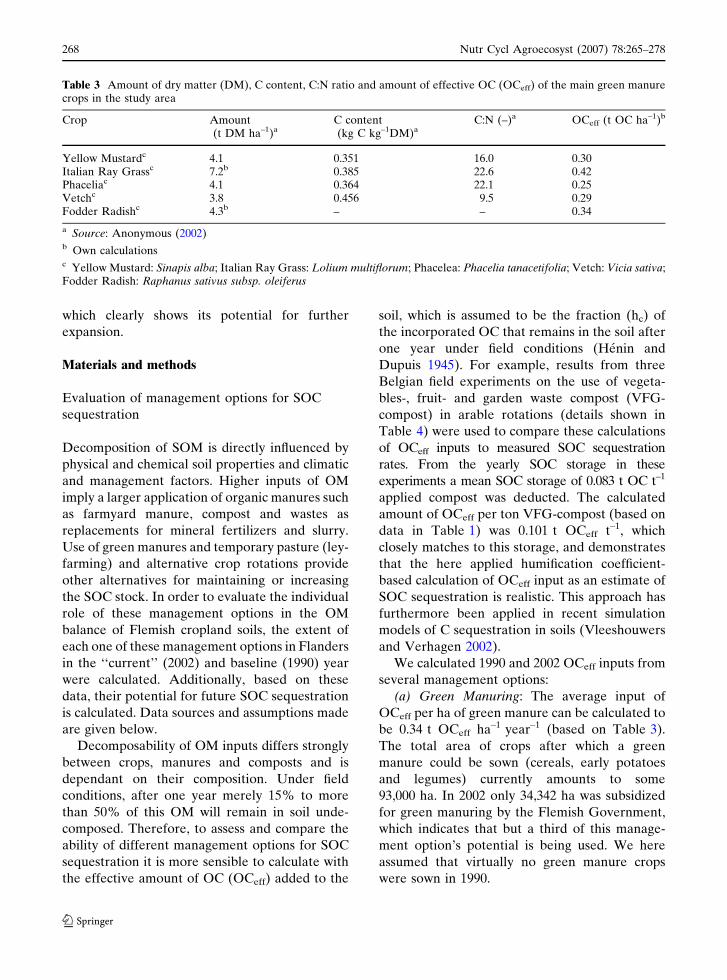
Table 3 Amount of dry matter (DM), C content, C:N ratio and amount of effective OC (OCeff) of the main green manurecrops in the study area
Crop Amount(t DM ha–1)a
C content(kg C kg–1DM)a
C:N (–)a OCeff (t OC ha–1)b
Yellow Mustardc 4.1 0.351 16.0 0.30Italian Ray Grassc 7.2b 0.385 22.6 0.42Phaceliac 4.1 0.364 22.1 0.25Vetchc 3.8 0.456 9.5 0.29Fodder Radishc 4.3b – – 0.34
a Source: Anonymous (2002)b Own calculationsc Yellow Mustard: Sinapis alba; Italian Ray Grass: Lolium multiflorum; Phacelea: Phacelia tanacetifolia; Vetch: Vicia sativa;Fodder Radish: Raphanus sativus subsp. oleiferus
268 Nutr Cycl Agroecosyst (2007) 78:265–278
123
(b) Crop rotations: Practically, the effect of
different crop rotations on the SOM balance can
be summarized as the sum of the effects of the
individual crops, which differs mainly by the
amount and composition of their harvest residues.
Table 3 gives the humification coefficients of
harvest residues of the main arable crops in
Flanders. It is, however, difficult to predict future
cropping area changes and it is also impossible to
precisely estimate the fraction of residues which
was incorporated in 1990 and which is incorpo-
rated at present. Regardless of these obstructions,
we assume all crop residues except cereal straw,
to have been incorporated for further calcula-
tions. From Table 2, it can be concluded that a
large decrease in the cropping surfaces of cereal
crops and to a lesser extent of sugar beets were
compensated by a large increase of the acreages
of both grain and silage maize. Taking into
account crop surface area, OM from harvest
residues and hc values, possible changes in input
of OCeff between 1990 and 2002 are calculated.
Cereal straw is mostly removed from the field
and used as bedding material in animal housing,
and will eventually be returned to the field as
farmyard manure. However, no figures are avail-
able for calculating the proportion which is directly
incorporated in the field and which is applied as
farmyard manure. For the calculation of shifts of
the input of OCeff from cereal straw we considered
the hc of straw to be roughly equal in both cases.
(c) Ley farming: The surface of temporary
pasture strongly increased from 38,080 ha in 1990
to 57,262 ha in 2001. From a literature study for
Northern Europe (Katterer and Andren 1999), a
surplus mean effective OC storage of 0.8 t OC
ha–1 year–1 was found in crop rotations with 50%
pasture and this value was also used here.
(d) Organic farming: There was a substantial
increase in the organically farmed cropland and
grassland during the 1990–2002 period. Based on
Baritz et al. (2004), who reported increases in
SOC stocks of 0–1.98 t OC ha–1 year–1 after
conversion to organic farming, calculations for
SOC accumulation under organic farming were
based on an average 1 t OC ha–1 storage rate.
(e) Compost application: Up to 268,000 t
green-waste compost and VFG-compost have
been produced in Flanders in 2002 (VLACO
2003). However, merely 6% of all produced
compost was applied to cropland in 2002 and
none in 1990. This demonstrates that there is still
a large potential for expansion of this manage-
ment option given that its potential application is
not constrained by resource availability.
(f) Animal manure: Because of environmental
constraints, including the European nitrate direc-
tive (91/676/CEE), which sets limits for nutrient
application, the potential for SOC sequestration
by means of manure application is restricted. As
the future application of animal slurries can only
be lower compared to the pre-1990 situation,
future SOC sequestration by extra slurry amend-
ment will be impossible. Based on livestock
distribution figures (VLM 2003), excretion and
C:N values, we calculated productions of OC in
animal manure of 814 kt OC in 1990 and 770 kt
OC in 2002. We assumed that all animal manure
was applied on agricultural land in 1990. Accord-
ing to the Flemish Land Agency (VLM 2003) on
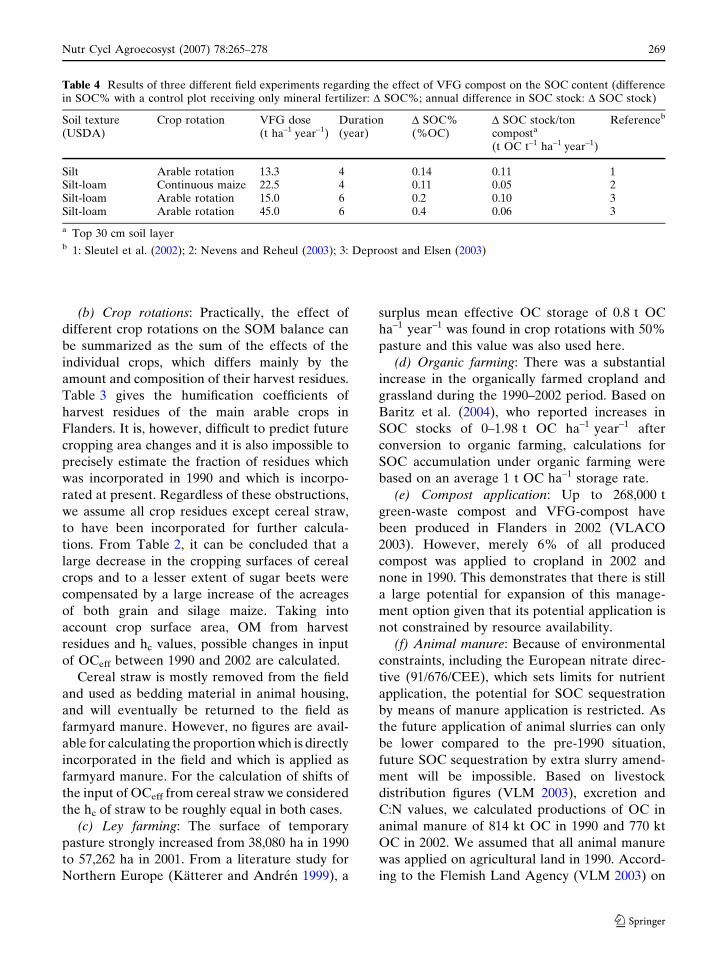
Table 4 Results of three different field experiments regarding the effect of VFG compost on the SOC content (differencein SOC% with a control plot receiving only mineral fertilizer: D SOC%; annual difference in SOC stock: D SOC stock)
Soil texture(USDA)
Crop rotation VFG dose(t ha–1 year–1)
Duration(year)
D SOC%(%OC)
D SOC stock/toncomposta
(t OC t–1 ha–1 year–1)
Referenceb
Silt Arable rotation 13.3 4 0.14 0.11 1Silt-loam Continuous maize 22.5 4 0.11 0.05 2Silt-loam Arable rotation 15.0 6 0.2 0.10 3Silt-loam Arable rotation 45.0 6 0.4 0.06 3
a Top 30 cm soil layerb 1: Sleutel et al. (2002); 2: Nevens and Reheul (2003); 3: Deproost and Elsen (2003)
Nutr Cycl Agroecosyst (2007) 78:265–278 269
123
average 212 kg N ha–1 year–1 from animal manure
was applied on agricultural land in 2002. This
amount corresponds with about 0.9 t OC
ha–1 year-1 resulting in a total input of 514 kt
OC year–1 in 2002.
Regional scale assessment of the relation
between SOC stock changes and OM-input
management
In a previous study (Sleutel et al. 2003), we
concluded that general losses of SOC had
occurred in cropland soils for the whole of
Flanders during the 1990s. As no clear causes
could be identified for this loss of SOC, we here
investigated the evolution of the OM input from
these options in more detail. With detailed
datasets of crop surfaces, livestock numbers and
manure application rates at our disposal a spa-
tially explicit approach was possible. The differ-
ence in average OCeff input per ha cropland
between 2000 and 1990 was calculated at the
community scale, which is the finest scale at which
data of crop surfaces and animal numbers are
available for the study area. Average application
rates of the OCeff input were calculated using
livestock density and crop area data (NIS 1990,
2000). The average inputs to cropland of OCeff
from crop residues, animal manure and cereal
straw per community were calculated separately:
The difference in OCeff input from crop resi-
dues (in t OCeff ha–1 year–1) of the 10 most
cultivated crops was calculated per community as:
DOCeff;crops ¼P10
i¼1 Si;2000 � IOCeffi
S2000
�P10
i¼1 Si;1990 � IOCeffi
S1990
with Si is the surface area occupied by crop i, in
2000 or 1990; IOCeffiis the input of OCeff per ha of
crop i (in kg OCeff ha–1 year–1) and S2000 and S1990
the cropland surfaces for that community for 2000
and 1990, respectively.
All manure was assumed to be incorporated in
1990, but for 2000 the actual proportion of
manure applied to agricultural land was based
on figures from the Flemish Land Agency (VLM
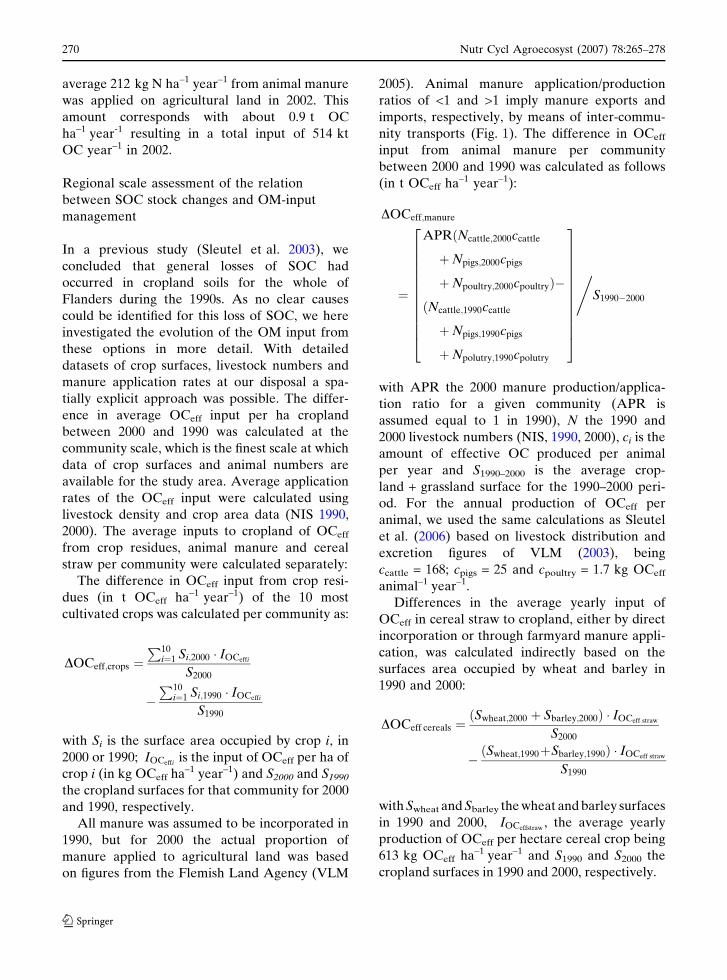
2005). Animal manure application/production
ratios of <1 and >1 imply manure exports and
imports, respectively, by means of inter-commu-
nity transports (Fig. 1). The difference in OCeff
input from animal manure per community
between 2000 and 1990 was calculated as follows
(in t OCeff ha–1 year–1):
DOCeff;manure
¼
APRðNcattle;2000ccattle
þNpigs;2000cpigs
þNpoultry;2000cpoultryÞ�
ðNcattle;1990ccattle
þNpigs;1990cpigs
þNpolutry;1990cpolutry
2
666666666664
3
777777777775
,
S1990�2000
with APR the 2000 manure production/applica-
tion ratio for a given community (APR is
assumed equal to 1 in 1990), N the 1990 and
2000 livestock numbers (NIS, 1990, 2000), ci is the
amount of effective OC produced per animal
per year and S1990–2000 is the average crop-
land + grassland surface for the 1990–2000 peri-
od. For the annual production of OCeff per
animal, we used the same calculations as Sleutel
et al. (2006) based on livestock distribution and
excretion figures of VLM (2003), being
ccattle = 168; cpigs = 25 and cpoultry = 1.7 kg OCeff
animal–1 year–1.
Differences in the average yearly input of
OCeff in cereal straw to cropland, either by direct
incorporation or through farmyard manure appli-
cation, was calculated indirectly based on the
surfaces area occupied by wheat and barley in
1990 and 2000:
DOCeff cereals ¼ðSwheat;2000 þ Sbarley;2000Þ � IOCeff straw
S2000
� ðSwheat;1990þSbarley;1990Þ � IOCeff straw
S1990
with Swheat and Sbarley the wheat and barley surfaces
in 1990 and 2000, IOCeffstraw, the average yearly
production of OCeff per hectare cereal crop being
613 kg OCeff ha–1 year–1 and S1990 and S2000 the
cropland surfaces in 1990 and 2000, respectively.
270 Nutr Cycl Agroecosyst (2007) 78:265–278
123
Over 190,000 SOC measurements (0–24 cm)
have been made in Flemish cropland soils in the
1989–2000 period. These SOC data were
grouped in three-year periods (1989–1991,
1992–1994, 1995–1997, 1998–2000) and were
available as means plus standard deviation per
community. This large dataset was used to
calculate SOC stocks and their evolution with
time, without any need for data-extrapolation.
As the data were only available to us as means
per community, normal linear regression of the
SOC contents against time yielded few signifi-
cant regressions (for merely 18% of all commu-
nities) due to a lack of data points (at most 4 per
community). To increase the number of data
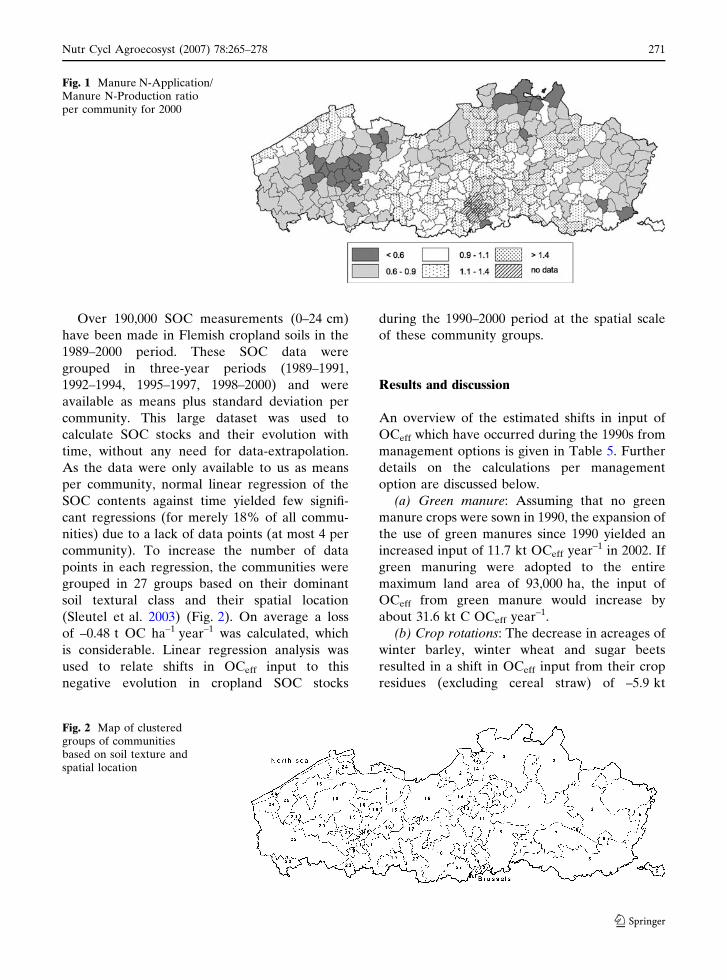
points in each regression, the communities were
grouped in 27 groups based on their dominant
soil textural class and their spatial location
(Sleutel et al. 2003) (Fig. 2). On average a loss
of –0.48 t OC ha–1 year–1 was calculated, which
is considerable. Linear regression analysis was
used to relate shifts in OCeff input to this
negative evolution in cropland SOC stocks
during the 1990–2000 period at the spatial scale
of these community groups.
Results and discussion
An overview of the estimated shifts in input of
OCeff which have occurred during the 1990s from
management options is given in Table 5. Further
details on the calculations per management
option are discussed below.
(a) Green manure: Assuming that no green
manure crops were sown in 1990, the expansion of
the use of green manures since 1990 yielded an
increased input of 11.7 kt OCeff year–1 in 2002. If
green manuring were adopted to the entire
maximum land area of 93,000 ha, the input of
OCeff from green manure would increase by
about 31.6 kt C OCeff year–1.
(b) Crop rotations: The decrease in acreages of
winter barley, winter wheat and sugar beets
resulted in a shift in OCeff input from their crop
residues (excluding cereal straw) of –5.9 kt
Fig. 1 Manure N-Application/Manure N-Production ratioper community for 2000
Fig. 2 Map of clusteredgroups of communitiesbased on soil texture andspatial location
Nutr Cycl Agroecosyst (2007) 78:265–278 271
123
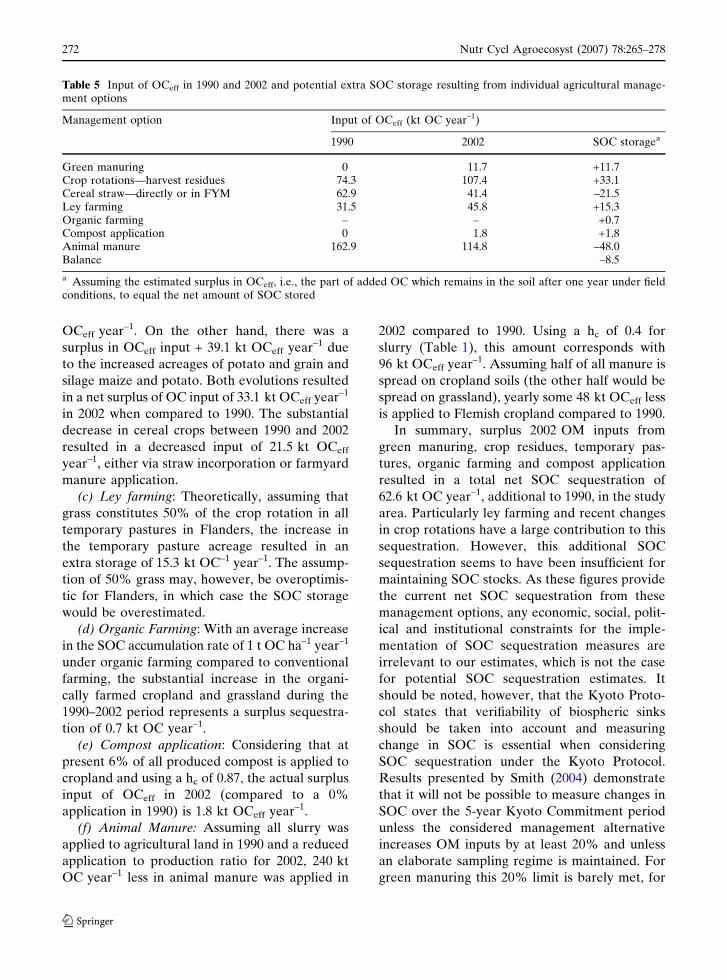
OCeff year–1. On the other hand, there was a
surplus in OCeff input + 39.1 kt OCeff year–1 due
to the increased acreages of potato and grain and
silage maize and potato. Both evolutions resulted
in a net surplus of OC input of 33.1 kt OCeff year–1
in 2002 when compared to 1990. The substantial
decrease in cereal crops between 1990 and 2002
resulted in a decreased input of 21.5 kt OCeff
year–1, either via straw incorporation or farmyard
manure application.
(c) Ley farming: Theoretically, assuming that
grass constitutes 50% of the crop rotation in all
temporary pastures in Flanders, the increase in
the temporary pasture acreage resulted in an
extra storage of 15.3 kt OC–1 year–1. The assump-
tion of 50% grass may, however, be overoptimis-
tic for Flanders, in which case the SOC storage
would be overestimated.
(d) Organic Farming: With an average increase
in the SOC accumulation rate of 1 t OC ha–1 year–1
under organic farming compared to conventional
farming, the substantial increase in the organi-
cally farmed cropland and grassland during the
1990–2002 period represents a surplus sequestra-
tion of 0.7 kt OC year–1.
(e) Compost application: Considering that at
present 6% of all produced compost is applied to
cropland and using a hc of 0.87, the actual surplus
input of OCeff in 2002 (compared to a 0%
application in 1990) is 1.8 kt OCeff year–1.
(f) Animal Manure: Assuming all slurry was
applied to agricultural land in 1990 and a reduced
application to production ratio for 2002, 240 kt
OC year–1 less in animal manure was applied in
2002 compared to 1990. Using a hc of 0.4 for
slurry (Table 1), this amount corresponds with
96 kt OCeff year–1. Assuming half of all manure is
spread on cropland soils (the other half would be
spread on grassland), yearly some 48 kt OCeff less
is applied to Flemish cropland compared to 1990.
In summary, surplus 2002 OM inputs from
green manuring, crop residues, temporary pas-
tures, organic farming and compost application
resulted in a total net SOC sequestration of
62.6 kt OC year–1, additional to 1990, in the study
area. Particularly ley farming and recent changes
in crop rotations have a large contribution to this
sequestration. However, this additional SOC
sequestration seems to have been insufficient for
maintaining SOC stocks. As these figures provide
the current net SOC sequestration from these
management options, any economic, social, polit-
ical and institutional constraints for the imple-
mentation of SOC sequestration measures are
irrelevant to our estimates, which is not the case
for potential SOC sequestration estimates. It
should be noted, however, that the Kyoto Proto-
col states that verifiability of biospheric sinks
should be taken into account and measuring
change in SOC is essential when considering
SOC sequestration under the Kyoto Protocol.
Results presented by Smith (2004) demonstrate
that it will not be possible to measure changes in
SOC over the 5-year Kyoto Commitment period
unless the considered management alternative
increases OM inputs by at least 20% and unless
an elaborate sampling regime is maintained. For
green manuring this 20% limit is barely met, for
Table 5 Input of OCeff in 1990 and 2002 and potential extra SOC storage resulting from individual agricultural manage-ment options
Management option Input of OCeff (kt OC year–1)
1990 2002 SOC storagea
Green manuring 0 11.7 +11.7Crop rotations—harvest residues 74.3 107.4 +33.1Cereal straw—directly or in FYM 62.9 41.4 –21.5Ley farming 31.5 45.8 +15.3Organic farming – – +0.7Compost application 0 1.8 +1.8Animal manure 162.9 114.8 –48.0Balance –8.5
a Assuming the estimated surplus in OCeff, i.e., the part of added OC which remains in the soil after one year under fieldconditions, to equal the net amount of SOC stored
272 Nutr Cycl Agroecosyst (2007) 78:265–278
123
temporary pastures perspectives are fair, but for
any other options changes will be much less than
20%.
Regional scale assessment of the relation
between SOC stock changes and OM
management
Differences among communities in the average
input of OCeff from animal manure applied per
ha cropland between 2000 and 1990 varied
between –0.44 and +0.33 t OCeff ha–1 year–1
(mean: –0.094 ± 0.171 t OCeff ha–1 y–1). Overall
there were significant decreases in manure appli-
cation in the sandy and sandy loam soils in the
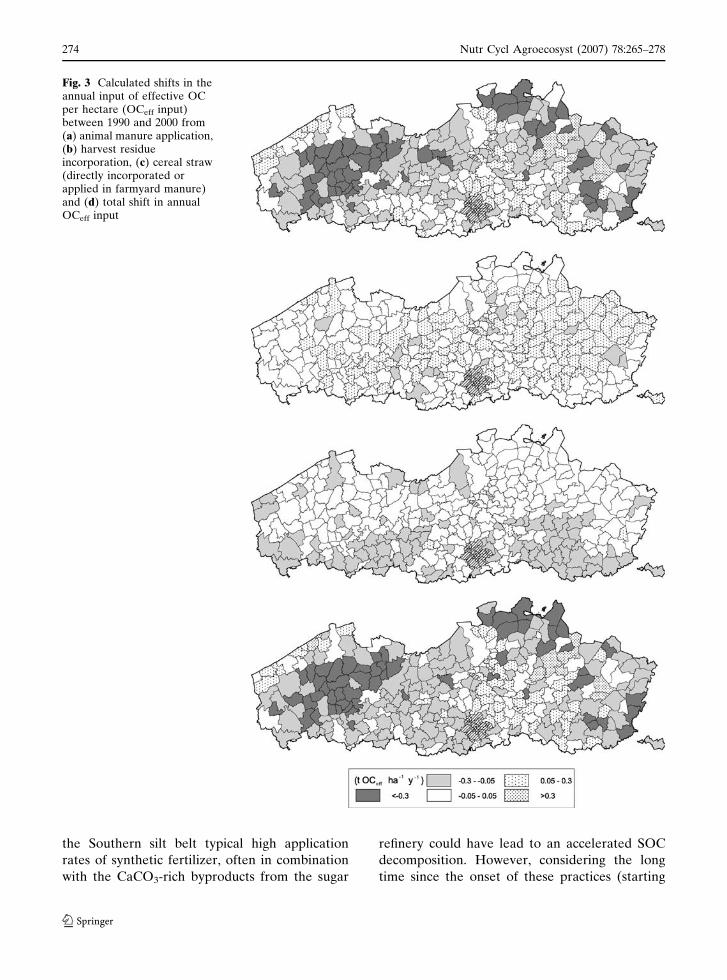
West and North-East of Flanders (Fig. 3(a)). As
a cause of dense pig production in West-Flanders
and poultry and cattle production in the North-
East, there was a surplus manure production in
2000, which could not be applied integrally to
agricultural land anymore (Fig. 1) as was still the
case in 1990. This reduction in manure applica-
tion brought about the decrease in OCeff input in
these areas. Differences in the yearly amount of
OCeff from incorporated harvest residues be-
tween 2000 and 1990 were relatively small and
varied between –0.06 and +0.02 t OCeff ha–1
year–1. On average there was a slight decrease
(mean: –0.017 ± 0.017 t OCeff ha–1 year–1) spread
over the whole study area (Fig. 3(b)). Decreases
in the acreages and harvest indices of cereal
crops resulted in an average decreased input of
OCeff from cereal straw (mean: –0.045 ± 0.017 t
OCeff ha–1 year–1). Since cereal crops are mainly
grown in the Silt region in the South of Flanders,
decreases in OCeff input from cereal straw
application through incorporation or through
farmyard manure application were mostly re-
stricted to that area (Fig. 3(c)).
The total differences in the amount of OCeff
applied per ha cropland from animal manure
application, crop residue incorporation and cereal
straw (either by direct incorporation or through
farmyard manure application) between 2000 and
1990 varied between –0.47 and +0.29 t OCeff
ha–1 year–1 among communities (mean: –0.157 ±
0.169 t OCeff ha–1 year–1). Decreases in OCeff
input occurred from central to Western Flanders
and along the Northern and Eastern borders
(Fig. 3(d)). The average rate of change per
community of the SOC stock (DSOC) between
2000 and 1990 amounted –0.48 t OC ha–1 year–1
(Sleutel et al. 2003). A weighted linear regression
against the change in SOC stock per group of
communities calculated by Sleutel et al. (2003)
yielded no significant relation with the changes in
the average OCeff input from crop residues or
cereal straw. This result could be expected given
the small magnitude of these changes in OCeff.
Group 13 was not included in this regression
analysis because the estimated SOC stock de-
crease in that group (–1.78 t OC ha–1 y–1) was
unrealistically high. There was a significant
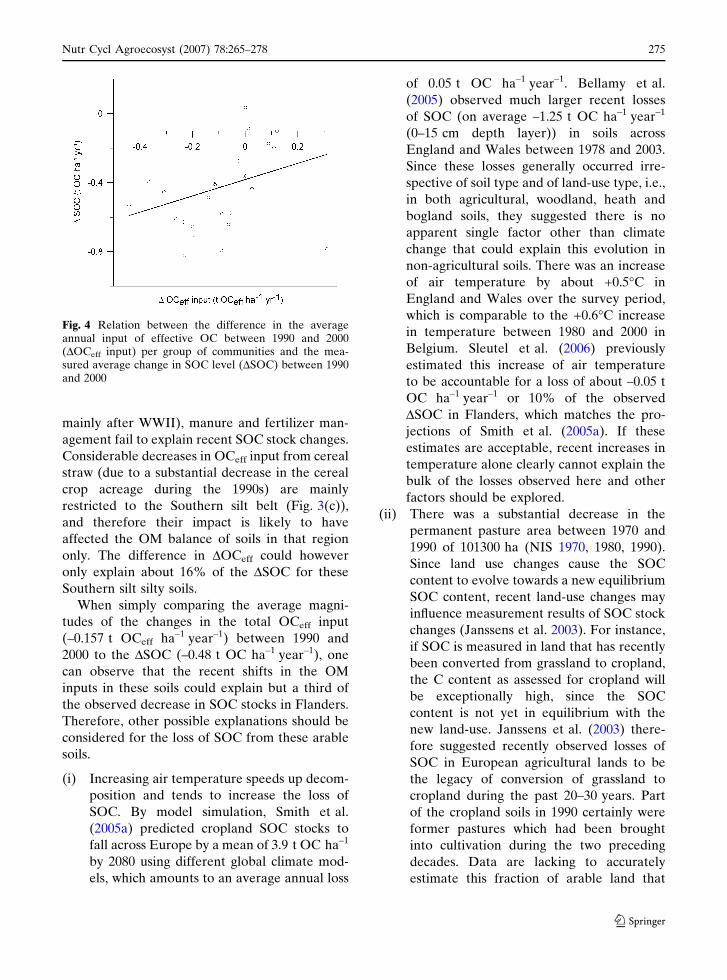
positive relation (P = 0.1) between DSOC and
the total change in input from OCeff:
DSOC = 0.47 DOCeff – 0.36. Although this rela-
tionship was weak (R2 = 0.14), this suggests that
the observed SOC stock changes are indeed
directly related to shifts in management (Fig. 4).
For some areas such as central West-Flanders
(groups 18, 19, 20, 22; see Fig. 2) and the Eastern
border of Flanders (groups 1, 2; see Fig. 2) DOCeff
can explain about 70%–100% and 40% of DSOC,
respectively, of which most can be attributed to
reductions in manure applications. In a recent
study (Sleutel et al. 2006), we investigated losses
of SOM in West-Flemish cropland soils more
closely. A clear relationship was found between
calculated shifts in OCeff input from manure and
a measured loss of SOC in the period 1990–2003,
which was based on another independent dataset
of SOC generated by an additional soil survey.
Although no significant regression was found
between DSOC and DOCeff from animal manure
for the study area as a whole, these results point
at a strong connection between the SOM balance
and manure management for central West-Flan-
ders and the Eastern border of Flanders.
In contrast, for the Southern silt belt (groups 5,
7, 8, 9, 10, 23, 27; see Fig. 2) lower manure
applications cannot explain the observed recent
losses in SOC. Historically, most of the traditional
mixed farms with livestock and arable crops in
this region were replaced by specialized arable
farms. Sleutel et al. (2003) indeed found the very
low OC stocks in these soils to be correlated to
the livestock density for groups 8, 7 and 9.
Additionally, Lettens et al. (2005) argued that in
Nutr Cycl Agroecosyst (2007) 78:265–278 273
123
the Southern silt belt typical high application
rates of synthetic fertilizer, often in combination
with the CaCO3-rich byproducts from the sugar
refinery could have lead to an accelerated SOC
decomposition. However, considering the long
time since the onset of these practices (starting
Fig. 3 Calculated shifts in theannual input of effective OCper hectare (OCeff input)between 1990 and 2000 from(a) animal manure application,(b) harvest residueincorporation, (c) cereal straw(directly incorporated orapplied in farmyard manure)and (d) total shift in annualOCeff input
274 Nutr Cycl Agroecosyst (2007) 78:265–278
123
mainly after WWII), manure and fertilizer man-
agement fail to explain recent SOC stock changes.
Considerable decreases in OCeff input from cereal
straw (due to a substantial decrease in the cereal
crop acreage during the 1990s) are mainly
restricted to the Southern silt belt (Fig. 3(c)),
and therefore their impact is likely to have
affected the OM balance of soils in that region
only. The difference in DOCeff could however
only explain about 16% of the DSOC for these
Southern silt silty soils.
When simply comparing the average magni-
tudes of the changes in the total OCeff input
(–0.157 t OCeff ha–1 year–1) between 1990 and
2000 to the DSOC (–0.48 t OC ha–1 year–1), one
can observe that the recent shifts in the OM
inputs in these soils could explain but a third of
the observed decrease in SOC stocks in Flanders.
Therefore, other possible explanations should be
considered for the loss of SOC from these arable
soils.
(i) Increasing air temperature speeds up decom-
position and tends to increase the loss of
SOC. By model simulation, Smith et al.
(2005a) predicted cropland SOC stocks to
fall across Europe by a mean of 3.9 t OC ha–1
by 2080 using different global climate mod-
els, which amounts to an average annual loss
of 0.05 t OC ha–1 year–1. Bellamy et al.
(2005) observed much larger recent losses
of SOC (on average –1.25 t OC ha–1 year–1
(0–15 cm depth layer)) in soils across
England and Wales between 1978 and 2003.
Since these losses generally occurred irre-
spective of soil type and of land-use type, i.e.,
in both agricultural, woodland, heath and
bogland soils, they suggested there is no
apparent single factor other than climate
change that could explain this evolution in
non-agricultural soils. There was an increase
of air temperature by about +0.5�C in
England and Wales over the survey period,
which is comparable to the +0.6�C increase
in temperature between 1980 and 2000 in
Belgium. Sleutel et al. (2006) previously
estimated this increase of air temperature
to be accountable for a loss of about –0.05 t
OC ha–1 year–1 or 10% of the observed
DSOC in Flanders, which matches the pro-
jections of Smith et al. (2005a). If these
estimates are acceptable, recent increases in
temperature alone clearly cannot explain the
bulk of the losses observed here and other
factors should be explored.
(ii) There was a substantial decrease in the
permanent pasture area between 1970 and
1990 of 101300 ha (NIS 1970, 1980, 1990).
Since land use changes cause the SOC
content to evolve towards a new equilibrium
SOC content, recent land-use changes may
influence measurement results of SOC stock
changes (Janssens et al. 2003). For instance,
if SOC is measured in land that has recently
been converted from grassland to cropland,
the C content as assessed for cropland will
be exceptionally high, since the SOC
content is not yet in equilibrium with the
new land-use. Janssens et al. (2003) there-
fore suggested recently observed losses of
SOC in European agricultural lands to be
the legacy of conversion of grassland to
cropland during the past 20–30 years. Part
of the cropland soils in 1990 certainly were
former pastures which had been brought
into cultivation during the two preceding
decades. Data are lacking to accurately
estimate this fraction of arable land that
Fig. 4 Relation between the difference in the averageannual input of effective OC between 1990 and 2000(DOCeff input) per group of communities and the mea-sured average change in SOC level (DSOC) between 1990and 2000
Nutr Cycl Agroecosyst (2007) 78:265–278 275
123
was previously converted from grassland,
but assuming 50% of all recently tilled
pastures to have been converted into crop-
land would be a safe estimate. Extensive
literature is available on SOC changes
resulting from land-use change. Guo and
Gifford (2002) analyzed research results
from 74 publications on the evolution of
SOC stocks after land-use change in a meta
analysis and reported that conversion of
pasture into arable land causes a decrease of
the SOC stock by 58% on average within a
period of 30 years. Alternatively, Lettens
et al. (2005) estimated losses of SOC of 31%
following such a conversion for Belgian
soils. The loss of SOM with cultivation is
usually exponential, with losses being rapid
during the first 10–20 years, then slower,
with a new equilibrium finally approached in
50–60 years (Arrouays et al. 1995); how-
ever, the time scale varies with climate and
soil type. Soussanna et al. (2004) fitted an
exponential model to a chronosequence of
SOC data after tilling a pasture soil in
France: C(t) = Cc–(Cc–C1)�e–kt (with C(t)
the SOC content at time t (years after
conversion); Cc is the equilibrium SOC
content under cropland and C1 is the SOC
content at the time of tilling of the pasture
soil). Lettens et al. (2005) estimated the
average SOC stock in Flemish grassland
soils in 1960 and 1990 to be 71 and 93 t OC
ha–1, respectively. Assuming this increase in
SOC stock between these two dates to have
followed a linear path, the average grassland
SOC content (i.e., C1) for the 1970–1975,
1975–1980, 1980–1985 and 1985–1990 time
periods were 79.7, 83.3, 87.1 and 90.7 t
OC ha–1 (0–30 cm), respectively. Calculat-
ing with the model used by Soussana et al.
(2004), an average (from Guo and Gifford
2002; Lettens et al., 2005) loss of SOC of
44% (hence Cc = 0.56 C1) and the by Sous-
sana et al. (2004) estimated k = 0.07 year–1,
we calculated the evolution of the SOC
content of previous grassland soils after
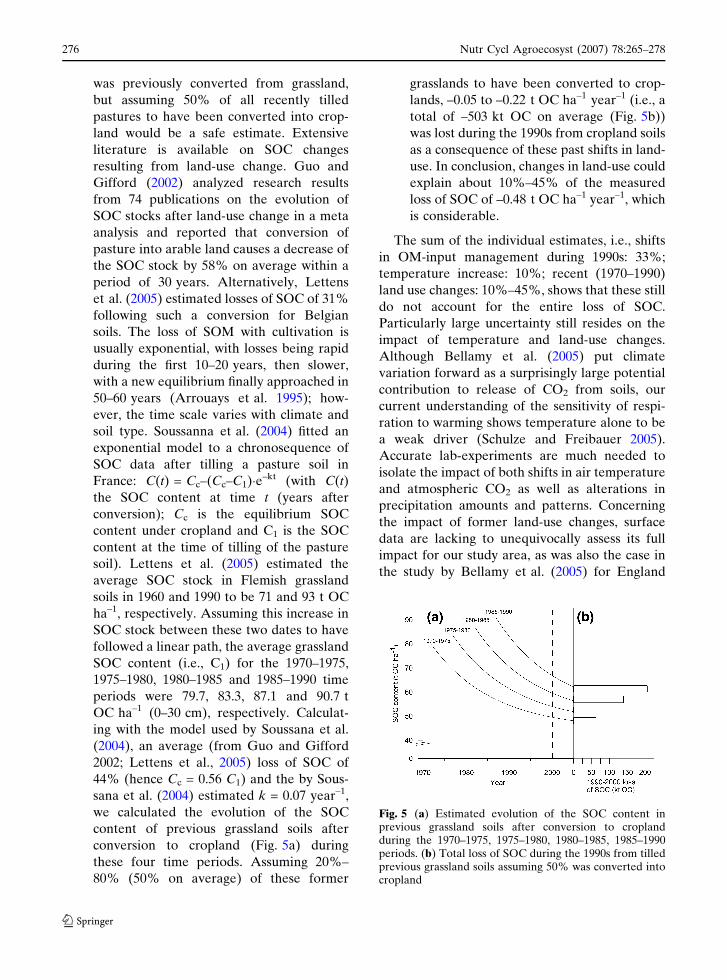
conversion to cropland (Fig. 5a) during
these four time periods. Assuming 20%–
80% (50% on average) of these former
grasslands to have been converted to crop-
lands, –0.05 to –0.22 t OC ha–1 year–1 (i.e., a
total of –503 kt OC on average (Fig. 5b))
was lost during the 1990s from cropland soils
as a consequence of these past shifts in land-
use. In conclusion, changes in land-use could
explain about 10%–45% of the measured
loss of SOC of –0.48 t OC ha–1 year–1, which
is considerable.
The sum of the individual estimates, i.e., shifts
in OM-input management during 1990s: 33%;
temperature increase: 10%; recent (1970–1990)
land use changes: 10%–45%, shows that these still
do not account for the entire loss of SOC.
Particularly large uncertainty still resides on the
impact of temperature and land-use changes.
Although Bellamy et al. (2005) put climate
variation forward as a surprisingly large potential
contribution to release of CO2 from soils, our
current understanding of the sensitivity of respi-
ration to warming shows temperature alone to be
a weak driver (Schulze and Freibauer 2005).
Accurate lab-experiments are much needed to
isolate the impact of both shifts in air temperature
and atmospheric CO2 as well as alterations in
precipitation amounts and patterns. Concerning
the impact of former land-use changes, surface
data are lacking to unequivocally assess its full
impact for our study area, as was also the case in
the study by Bellamy et al. (2005) for England
Fig. 5 (a) Estimated evolution of the SOC content inprevious grassland soils after conversion to croplandduring the 1970–1975, 1975–1980, 1980–1985, 1985–1990periods. (b) Total loss of SOC during the 1990s from tilledprevious grassland soils assuming 50% was converted intocropland
276 Nutr Cycl Agroecosyst (2007) 78:265–278
123
and Wales. Still, an important result from the
approach used here is that it suggests the impact
of former land-use changes to be even larger than
of recent changes in agricultural management.
Since large-scale conversions of grassland to
cropland have been general over Europe since
the 1960s with a stabilization in the early 1990s
(Freibauer et al. 2004), similar considerable losses
of SOC are likely to be taking place in croplands
of other European countries as well. To our
knowledge, for the first time different potential
causes of loss of SOC from very intensively
managed cropland soils were investigated
together into such detail on a regional scale.
Our findings of negative SOM balances in inten-
sively managed croplands due to recent changes
in crop rotations and in animal manure produc-
tion, are relevant to other European regions in
particular (Denmark, The Netherlands, North-
West Germany, Brittany and the North-West of
France, the Po-valley in Italy and parts
of England), with similar climate and intensity
of agriculture, and where comparable trends in
farming management may well have taken place.
Similar SOM input balance based calculations
could be used to quantify the relative importance
of shifts in agricultural management for changes
in cropland SOC stocks for these regions as well.
Conclusions
Surplus post–1990 inputs of OCeff from green
manuring, crop residue incorporation, temporary
pastures, organic farming and compost applica-
tion seem to have been insufficient for maintain-
ing or increasing SOC stocks in Flemish cropland.
Furthermore, these surpluses are at odds with the
recently observed general SOC stock decreases.
The post–1990 expanse of these management
options, makes them however, eligible for SOC
sequestration which is accountable under the
Kyoto Protocol’s art. 3.4. Negative shifts during
the 1990s in OM inputs from animal manure
application, crop residue and cereal straw incor-
poration combined were identified to be related
to the observed SOC losses on a regional scale.
Previous suggestions that changes in management
are the single main driver for the observed SOC
stock losses in Flanders appear to be invalid, since
these changes in OM input were found to
contribute only a third of the loss of SOC for
the whole of Flanders. Differing trends were,
however, seen in specific regions. The spatially
explicit approach did show that, in contrast to
Flanders as a whole, for central West-Flanders
and the Eastern border of Flanders management
played a dominant role in the recent SOC stock
losses.
There were indications for a small contribution
to the SOC losses by recent temperature increases
and a large contribution of pre–1990 land-use
changes. Uncertainty associated with the impact
of recent land-use changes does, however, remain
unquantified. Still, with the substantial amount of
management data at our disposal, the present
study is the first one to distinguish and quantify
individual causes for observed SOC stock changes
on a regional scale.
Acknowledgement The corresponding author is financedby a post-doctoral grant of the Research Foundation—Flanders (FWO).
References
Anonymous (2002) Assessment of the amount of mineralnitrogen in the soil as a policy tool. Final report part 2:database construction, mineralization and denitrifica-tion, experimental field research and model fieldcalibration and validation (in Dutch). Soil Service ofBelgium, Catholic University of Louvain and GhentUniversity, Gent
Arrouays D, Balesdent J, Mariotti A, Girardin C (1995)Modelling organic carbon turnover in clearedtemperate forest soils converted to maize croppingby using 13C natural abundance. Plant Soil 173:191–196
Baritz R, De Neve S, Barancikova G, Gronlund A, LeifeldJ, Katzensteiner K, Koch FJ, Palliere C, Romanya J,Schaminee J (2004) Land use practices and soilorganic matter. In: Van Camp L, Bujarrabal B,Gentile AR, Jones RJA, Montanarella L, OlazabalC, Selvaradjou SK (eds) Thematic strategy for soilprotection, vol. III organic matter, pp 439–465, EUDG Joint Research Centre, EUR 21319 EN/3
Bellamy PH, Loveland PJ, Bradley RI, Lark RM, KirkGJD (2005) Carbon losses from all soils acrossEngland and Wales 1978–2003. Nature 437:245–248
Bioforum (2002) http://www.bioforum.be/oppervlakte_2002_Tabel.htm. [accessed: Oct 2003]
Nutr Cycl Agroecosyst (2007) 78:265–278 277
123
Bries J, Vandendriessche H, Geypens M (1995) Fertiliza-tion and sprinkling of potatoes in relation to yield andquality (in Dutch). IWONL, Brussels
Consulentschap Bodemaangelegenheden (1980) Organi-sche stof in de akkerbouw. Vlugschrift voor delandbouw, no 317, Consulentschap in algemene dienstvoor bodemaangelegenheden in de landbouw
De Neve S, Sleutel S, Hofman G (2003) Carbon miner-alization from composts and food industry wastesadded to soil. Nutr Cycl Agro Ecosyst 67:13–20
Deproost P, Elsen F (2003) Monitoring of the effect ofVFG application on soil physical properties (inDutch). Bodemkundige Dienst van Belgie, Leuven
Freibauer A, Rounsevell MDA, Smith P, Verhagen J(2004) Carbon sequestration in the agricultural soilsof Europe. Geoderma 122:1–23
Guo LB, Gifford RM (2002) Soil carbon stocks and landuse change: a meta analysis. Glob Chan Biol 8:345–360
Henin S, Dupuis M (1945) Essai de bilan de la matiereorganique du sol. Annales Agronomiques 15:17–29
Janssens IA, Freibauer A, Ciais P, Smith P, Nabuurs GJ,Folberth G, Schlamadinger B, Hutjes RWA, Ceule-mans R, Schulze ED, Valentini R, Dolman AJ (2003)Europe’s terrestrial biosphere absorbs 7 to 12% ofEuropean anthropogenic CO2 emissions. Science300:1538–1542
Katterer T, Andren O (1999) Long-term agricultural fieldexperiments in Northern Europe: analysis of theinfluence of management on soil carbon stocks usingthe ICBM model. Agr Ecosyst Environ 72:165–179
Lettens S, Van Orshoven J, Van Wesemael B, Muys B,Perrin D (2005) Soil organic carbon changes inlandscape units of Belgium between 1960 and 2000with reference to (1990) Glob. Chan Biol 11:2128–2140
Nevens F, Reheul D (2003) The application of vegetable,fruit and garden waste (VFG) compost in addition tocattle slurry in a silage maize monoculture: nitrogenavailability and use. Eur J Agron 19:189–203
NIS 1970, 1980, 1990, 2000 Agriculture and horticulturecounting on 15 May. National Institute of Statistics,Ministry of Economic Affairs, Brussels
Schulze ED, Freibauer A (2005) Carbon unlocked fromsoils. Nature 437:205–206
Sleutel S, De Neve S, Hofman G (2002) Researchassignment completed for VLACO—Influence of
VFG compost in an arable rotation. Part IV: Influenceon soil properties (in Dutch). Ghent University,Ghent
Sleutel S, De Neve S, Hofman G, Boeckx P, Beheydt D,Van Cleemput O, Mestdagh I, Lootens P, Carlier L,Van Camp N, Verbeeck H, Van De Walle I, SamsonR, Lust N, Lemeur R (2003) Carbon stock changesand carbon sequestration potential of Flemish crop-land soils. Glob Chan Biol 9:1193–1203
Sleutel S, De Neve S, Singier B, Hofman G (2006) OrganicC levels in intensively managed arable soils – longterm regional trends and characterization of fractions.Soil Use Man 22:188–196
Smith J, Smith P, Wattenbach M, Zaehle S, Hiederer R,Jones RJA, Montanarella L, Rounsevell MDA,Reginster I, Ewert F (2005a) Projected changes inmineral soil carbon of European croplands andgrasslands, 1990–2080. Glob Chan Biol 11:2141–2152
Smith P (2004) How long before a change in soil organiccarbon can be detected? Glob Chan Biol 10:1878–1883
Smith P, Andren O, Karlsson T, Perala P, Regina K,Rounsevell M, Van Wesemael B (2005b) Carbonsequestration potential in European croplands hasbeen overestimated. Glob Chan Biol 11:2153–2163
Soussana J-F, Loiseau P, Vuichard N, Ceschia E, Bales-dent J, Chevallier T, Arrouays D (2004) Carboncycling and sequestration opportunities in temparategrasslands. Soil Use Man 20:219–230
Vanongeval L, Hendrickx G, Geypens M (1995) Modelingof the long-term evolution of the organic mattercontent. In: Geypens M, Honnay JP (eds) Agricul-tural and environmentally oriented functions of theorganic matter in the soil (in Dutch), IWONL,Brussels, pp 129–154
VLACO (2003) http://www.vlaco.be [accessed: October2003]
Vleeshouwers LM, Verhagen A (2002) Carbon emissionand sequestration by agricultural land use: a modelstudy for Europe. Glob Chan Biol 8:519–530
VLM (2003) Year Report 2002 (in Dutch). Flemish LandAgency, Brussels, p 130
VLM (2005) http://www.vlm.be/ASP/Stats.asp, FlemishLand Agency, Brussels. [accessed: November 2005]
278 Nutr Cycl Agroecosyst (2007) 78:265–278
123
Related Documents