Assessing Activity Pattern Similarity with Multidimensional Sequence Alignment Based on a Multiobjective Optimization Evolutionary Algorithm Mei-Po Kwan 1 , Ningchuan Xiao 2 , Guoxiang Ding 3 1 Department of Geography and Geographic Information Science, University of Illinois at Urbana- Champaign, Champaign, IL, USA, 2 Department of Geography, The Ohio State University, Columbus, OH, USA, 3 Department of Analytics and Research, Travelers Insurance, Hartford, CT, USA Due to the complexity and multidimensional characteristics of human activities, assessing the similarity of human activity patterns and classifying individuals with similar patterns remains highly challenging. This article presents a new and unique methodology for evaluating the similarity among individual activity patterns. It conceptualizes multidimen- sional sequence alignment as a multiobjective optimization problem and solves this problem with an evolutionary algorithm (EA). The study utilizes sequence alignment to code multiple facets of human activities into multidimensional sequences and to treat similarity assessment as a multiobjective optimization problem that aims to minimize the alignment cost for all dimensions simultaneously. A multiobjective optimization evolution- ary algorithm is used to generate a diverse set of optimal or near-optimal alignment solutions. Evolutionary operators are specifically designed for this problem, and a local search method is also incorporated to improve the search ability of the algorithm. We demonstrate the effectiveness of our method by comparing it with a popular existing method called ClustalG using a set of 50 sequences. The results indicate that our method outper- forms the existing method for most of our selected cases. The multiobjective EA presented in this article provides an effective approach for assessing activity pattern similarity and a foundation for identifying distinctive groups of individuals with similar activity patterns. Introduction The use of location-aware devices to collect detailed space–time data about individuals has increased dramatically in geographic, health, and social science research in the past decade or so (e.g., Wiehe et al. 2008; Shoval et al. 2011; Wesolowski et al. 2012; Richardson et al. 2013; Shen, Kwan, and Chai 2013). These data offer many opportunities for individual-based research to Correspondence: Mei-Po Kwan, Department of Geography and Geographic Information Science, University of Illinois at Urbana-Champaign, 255 Computing Applications Building, MC-150, 605 E Springfield Ave., Champaign, IL 61820 e-mail: [email protected] Submitted: February 17, 2012. Revised version accepted: March 12, 2013. Geographical Analysis (2014) 46, 297–320 doi: 10.1111/gean.12040 © 2014 The Ohio State University 297

Welcome message from author
This document is posted to help you gain knowledge. Please leave a comment to let me know what you think about it! Share it to your friends and learn new things together.
Transcript
Assessing Activity Pattern Similarity with
Multidimensional Sequence Alignment Based
on a Multiobjective Optimization Evolutionary
Algorithm
Mei-Po Kwan1, Ningchuan Xiao2, Guoxiang Ding3
1Department of Geography and Geographic Information Science, University of Illinois at Urbana-Champaign, Champaign, IL, USA, 2Department of Geography, The Ohio State University, Columbus,OH, USA, 3Department of Analytics and Research, Travelers Insurance, Hartford, CT, USA
Due to the complexity and multidimensional characteristics of human activities, assessingthe similarity of human activity patterns and classifying individuals with similar patternsremains highly challenging. This article presents a new and unique methodology forevaluating the similarity among individual activity patterns. It conceptualizes multidimen-sional sequence alignment as a multiobjective optimization problem and solves thisproblem with an evolutionary algorithm (EA). The study utilizes sequence alignment tocode multiple facets of human activities into multidimensional sequences and to treatsimilarity assessment as a multiobjective optimization problem that aims to minimize thealignment cost for all dimensions simultaneously. A multiobjective optimization evolution-ary algorithm is used to generate a diverse set of optimal or near-optimal alignmentsolutions. Evolutionary operators are specifically designed for this problem, and a localsearch method is also incorporated to improve the search ability of the algorithm. Wedemonstrate the effectiveness of our method by comparing it with a popular existing methodcalled ClustalG using a set of 50 sequences. The results indicate that our method outper-forms the existing method for most of our selected cases. The multiobjective EA presentedin this article provides an effective approach for assessing activity pattern similarity and afoundation for identifying distinctive groups of individuals with similar activity patterns.
Introduction
The use of location-aware devices to collect detailed space–time data about individuals hasincreased dramatically in geographic, health, and social science research in the past decade or so(e.g., Wiehe et al. 2008; Shoval et al. 2011; Wesolowski et al. 2012; Richardson et al. 2013; Shen,Kwan, and Chai 2013). These data offer many opportunities for individual-based research to
Correspondence: Mei-Po Kwan, Department of Geography and Geographic Information Science,University of Illinois at Urbana-Champaign, 255 Computing Applications Building, MC-150, 605 ESpringfield Ave., Champaign, IL 61820e-mail: [email protected]
Submitted: February 17, 2012. Revised version accepted: March 12, 2013.
Geographical Analysis (2014) 46, 297–320
doi: 10.1111/gean.12040© 2014 The Ohio State University
297
enhance our understanding of complex human spatial behavior and social interactions (Smyth2001; Kwan 2004, 2013; Raubal, Miller, and Bridwell 2004; Griffith et al. 2013; Palmer et al.2013). As part of this endeavor, researchers have sought to derive representative human activitypatterns with these high-resolution space–time data using various clustering methods, such ask-means and hierarchical clustering (Becken, Simmons, and Frampton 2003; Schlich andAxhausen 2004; Gao et al. 2010; Chen et al. 2011; Sadahiro, Lay, and Kobayashi 2013). Oftenthese methods are based on similarity analysis that, in turn, relies on various distance measuresfor evaluating the closeness or similarity between individual space–time behavior (Koppelmanand Pas 1985; Joh, Arentze, and Timmermans 2001a; Schlich and Axhausen 2003; Sinha andMark 2005; Long and Nelson 2013).
During the past three decades, geographers and transport researchers have conducted manystudies to develop distance or similarity measures for activity pattern classification (Burnett andHanson 1982; Pas 1983; Koppelman and Pas 1985; Hanson and Huff 1986; Wilson 1998a, 2001;Joh, Arentze, and Timmermans 2001b, c; Joh et al. 2002). In Geographic Information Science,developing new methods for analyzing the space–time trajectories of moving humans or objectshas attracted much attention in recent years, perhaps inspired by the time-geographic studies ofhuman activity patterns in the late 1990s and early 2000s (e.g., Hornsby and Cole 2007; Laubeet al. 2007; Dodge, Laube, and Weibel 2012; Orellana and Wachowicz 2012; Persson andEllegård 2012). Although these past efforts have made considerable progress in advancing thefield, some major challenges still remain. Among these is the difficulty of deriving representativeactivity patterns while taking into account the multiple dimensions of human activity-travelbehavior, which include activity location, purpose, type, sequence, timing, and duration. Fre-quently existing distance or similarity measures are based on only limited dimensions of humanor object movement (i.e., spatial, temporal, or attribute proximity), and little attention has beenpaid to comparing human activity patterns in terms of many dimensions at the same time (Demšarand Virrantaus 2010). Furthermore, most studies to date tend to focus more on the geometric andstatistical properties of movement trajectories (e.g., direction, acceleration, or geometric shape)than on the substantive characteristics of human activities and trips (e.g., travel purpose, travelmode, or the number of accompanying persons) (e.g., Gonzalez, Hidalgo, and Barabási 2008;Dodge, Laube, and Weibel 2012).
This article addresses these challenges by presenting a unique methodology for assessing thesimilarity between multidimensional human activity patterns. It conceptualizes sequence align-ment as a multiobjective optimization problem and proposes a solution method to this problemusing an evolutionary algorithm (EA). The solution utilizes sequence alignment to code multiplefacets of human activities into multidimensional sequences and to treat similarity assessment asa multiobjective optimization problem that aims to minimize the alignment cost for all dimen-sions simultaneously. This article demonstrates the effectiveness of the method by comparing itwith a popular existing method called ClustalG using a set of 50 sequences. The results indicatethat our method outperforms the existing method for most of the cases. The multiobjective EAdescribed here provides an effective approach for assessing activity pattern similarity and afoundation for identifying distinctive groups of individuals with similar activity patterns.
Analysis of human activity patterns
Many issues of interest to geographers, transportation scientists, health researchers, and urbanplanners will benefit greatly from a better understanding of human activity patterns in space–time
Geographical Analysis
298
(Kwan 1999, 2013; Richardson et al. 2013). The analysis of moving objects and humans is arelatively young field with many research issues to be explored (Dodge, Laube, and Weibel 2012;Orellana and Wachowicz 2012; Long and Nelson 2013), for instance, how to identify objects withabnormal movement patterns, how to derive distinctive and meaningful patterns from multidi-mensional trajectory data, and how to analyze multidimensional semantics of moving objects.These are challenging problems because moving objects exhibit multidimensional spatiotempo-ral characteristics that need to be handled synthetically (Han and Gao 2009; Miller and Han 2009;Zhu et al. 2009). Classifying moving objects into distinctive groups provides one way to discoverunderlying patterns and interactions.
Human activities and their contexts can be described by interrelated variables that reflecttheir multiple facets, including the location, sequence, timing and duration of activities, activitytype, travel purpose, travel mode, speed, direction, the number of accompanying persons duringan activity or trip, and other sociodemographic characteristics (Kwan 2000, 2004, 2012). Thesevarious facets are the multiple dimensions of human activity-travel behavior. To study humanactivity patterns, appropriate analytical methods need to be applied in order to derive distinctivebehavioral patterns. An important basis for all of these methods is a distance or similaritymeasure that allows researchers to determine how close or similar an individual’s activity patternis to that of another individual.
In light of the many different facets of human activity-travel behavior, an effective distancemeasure should allow us to take into account many characteristics of human activities in additionto the spatial and temporal dimensions. Three of these characteristics deserve particular attention.First, individuals conduct different activities at certain times. Differences in the attributes of theseactivities (e.g., type and purpose), or compositional differences, should be captured when com-paring individual activity patterns. Second, the interdependency among these dimensions needsto be maintained in a distance or similarity measure (e.g., certain activities can take place only atcertain places and/or at certain times). Third, human activities unfold in a sequential order overtime. When comparing activity patterns, the distance measure should be able to compare struc-tural differences in human activities and their contextual variables (e.g., certain activities have tobe performed before specific other activities; Pas 1983). While many past studies have useddistance measures to derive human activity patterns, they all have limitations in achieving thesethree important goals.
Burnett and Hanson (1982), for instance, developed an early distance measure to comparethe difference between individual activity patterns based on a number of attributes, such asactivity type, activity location, travel distance, and travel mode. A distance score was obtainedby summing the differences across all attributes. Based on Burnett and Hanson’s distancescore, Pas (1983) developed a general expression of similarity between two activity patterns byintroducing the concept of primary-secondary attributes and by assigning weights to aggregatethem as the distance measure between each pair of activity patterns. This measure was furtherimproved by Koppelman and Pas (1985) by using a linear assignment programming method tocapture the differences in activity composition. Ma and Goulias (1997) used the standardizedz-score of variables to measure the distance between patterns. Cha, McCleary, and Uysal(1995) employed factor analysis to obtain the distance score among Japanese overseas travel-ers. These researchers used pattern classification to facilitate the analysis of activity patterns.However, the distance measures they implemented differentiate activity patterns based only onactivity composition, while the sequential and structural aspects of activity patterns were notaddressed.
Mei-Po Kwan et al. Assessing Activity Pattern Similarity
299
Some recent efforts have started to incorporate both compositional and sequential charac-teristics of activity patterns into distance measures (e.g., Joh, Arentze, and Timmermans 2001a;Shoval and Isaacson 2007). One example is the feature extraction method based on the Walsh–Hadamard transformation (Recker, McNally, and Root 1985). In this approach, a set of measure-ments that define activity patterns is represented by column vectors, and transformationtechniques are applied to the column vectors to develop a taxonomy for the pattern space. Thismethod has the advantage of including the sequential order entailed in activity patterns, althoughit still cannot integrate the multiple dimensions of activity patterns simultaneously into thedistance measure. With respect to the limitations of past research about human activity patterns,sequence alignment seems a promising and powerful alternative.
Sequence alignmentSequence alignment is a method widely used in molecular biology for identifying regions ofsimilarity in DNA, RNA, or protein sequences (Kruskal 1983). Compared with all other methodspreviously discussed, an outstanding strength of sequence alignment is its capability to take intoaccount the multiple attributes as well as the compositional and sequential characteristics ofhuman activity patterns. Researchers in various fields—including sociology (Abbott 1995; Stoveland Bolan 2004), transportation (Joh, Arentze, and Timmermans 2001a), tourism (Bargeman,Joh, and Timmermans 2002; Shoval and Isaacson 2007), and retailing (Joh, Timmermans, andPopkowski-Leszczyc 2003)—have realized the value of sequence alignment. Wilson (1998a, b)was the first to introduce sequence alignment into travel behavior research, where, similar tomolecular sequences, each person’s daily activities are coded as a sequence of characters torepresent different activity characteristics.
Sequence alignment seeks to align two sequences by transforming one into the other usingthe minimal number of character edit operations (i.e., insertions, deletions, and substitutions;Needleman and Wunsch 1970). The minimal number of edit operations used to align twosequences is defined as the distance (or alignment cost) between them. Consider two examplesequences, LHTH and LTWTH, where each alphabet represents a type of activity. We writeone sequence above the other, and an alignment can be obtained by arranging the same orsimilar characters in the same column. In our example, a possible alignment can be written asL H T H
L T W T H
−, where a dash (–) represents a gap of length one inserted between the first two
elements of the sequence on the top. An insertion in one sequence can be seen as a deletion inthe other one, and a substitution can be treated as the combination of a deletion and aninsertion operation. In our example, inserting a gap between L and H in the top sequence isequivalent to deleting the second letter (T) from the bottom sequence. Similarly, the secondletter in the top sequence (H) is substituted by W, or equivalently, the third letter in the bottomsequence is substituted by H. Therefore, the example alignment can be written using an operationset {d2, d3, i3}, indicating the deletion of the second and third elements from the bottom sequence,and the insertion of an element at the third position to the bottom sequence. After the alignment,these two sequences have the same character at each position and the alignment score or cost(edit operations required) is three. For this example, all other alignment alternatives will requireat least three operations. Therefore, we can say the distance between the two sequences is three(assuming equal weight of insertion and deletion). This is a simple example that illustrates onemethod of aligning two sequences. Different methods exist for aligning two sequences, eachrequiring a different set of operations.
Geographical Analysis
300
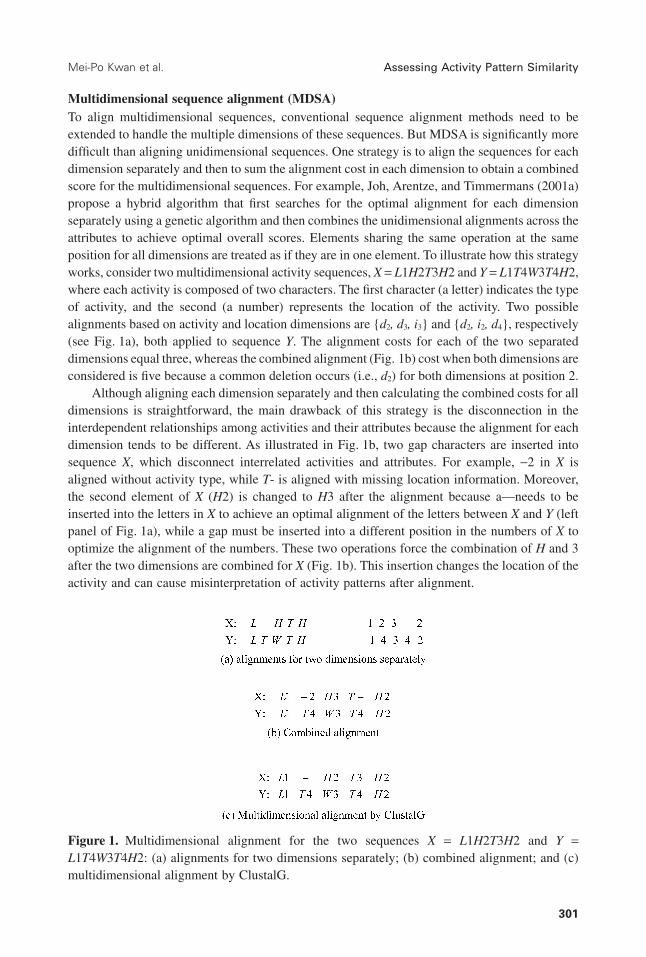
Multidimensional sequence alignment (MDSA)To align multidimensional sequences, conventional sequence alignment methods need to beextended to handle the multiple dimensions of these sequences. But MDSA is significantly moredifficult than aligning unidimensional sequences. One strategy is to align the sequences for eachdimension separately and then to sum the alignment cost in each dimension to obtain a combinedscore for the multidimensional sequences. For example, Joh, Arentze, and Timmermans (2001a)propose a hybrid algorithm that first searches for the optimal alignment for each dimensionseparately using a genetic algorithm and then combines the unidimensional alignments across theattributes to achieve optimal overall scores. Elements sharing the same operation at the sameposition for all dimensions are treated as if they are in one element. To illustrate how this strategyworks, consider two multidimensional activity sequences, X = L1H2T3H2 and Y = L1T4W3T4H2,where each activity is composed of two characters. The first character (a letter) indicates the typeof activity, and the second (a number) represents the location of the activity. Two possiblealignments based on activity and location dimensions are {d2, d3, i3} and {d2, i2, d4}, respectively(see Fig. 1a), both applied to sequence Y. The alignment costs for each of the two separateddimensions equal three, whereas the combined alignment (Fig. 1b) cost when both dimensions areconsidered is five because a common deletion occurs (i.e., d2) for both dimensions at position 2.
Although aligning each dimension separately and then calculating the combined costs for alldimensions is straightforward, the main drawback of this strategy is the disconnection in theinterdependent relationships among activities and their attributes because the alignment for eachdimension tends to be different. As illustrated in Fig. 1b, two gap characters are inserted intosequence X, which disconnect interrelated activities and attributes. For example, −2 in X isaligned without activity type, while T- is aligned with missing location information. Moreover,the second element of X (H2) is changed to H3 after the alignment because a—needs to beinserted into the letters in X to achieve an optimal alignment of the letters between X and Y (leftpanel of Fig. 1a), while a gap must be inserted into a different position in the numbers of X tooptimize the alignment of the numbers. These two operations force the combination of H and 3after the two dimensions are combined for X (Fig. 1b). This insertion changes the location of theactivity and can cause misinterpretation of activity patterns after alignment.
Figure 1. Multidimensional alignment for the two sequences X = L1H2T3H2 and Y =L1T4W3T4H2: (a) alignments for two dimensions separately; (b) combined alignment; and (c)multidimensional alignment by ClustalG.
Mei-Po Kwan et al. Assessing Activity Pattern Similarity
301
Wilson (1998a) and Wilson, Harvey, and Thompson (1999) suggest a method for MDSA thatinvolves combining the elements from all dimensions into one element and then performing aconventional unidimensional sequence alignment (e.g., using dynamic programming [DP]). TheClustalG software implements this strategy by extending existing unidimensional sequencealignment methods. For example, the operation set for aligning X and Y is {d2, d3, d4, i3, i4}.Therefore, the distance between X and Y is 5 (Fig. 1c). In this method, activities that are differentin any of their attributes (e.g., T3 in X and T4 in Y) are treated as entirely different (which maycause overestimation of the alignment cost). Besides, though ClustalG employs conventionalsequence alignment to achieve optimal alignment at the aggregate level, the optimality of thealignment for separate dimensions is not guaranteed, as we subsequently discuss.
To overcome some of these limitations and to advance MDSA methods, this article summa-rizes a formulation of MDSA as a multiobjective optimization problem where alignment isperformed in all dimensions in the analyzed sequences while the dimensions are evaluatedseparately. In this formulation, interdependency between different dimensions is maintainedwhile partial differences between activities are also taken into account. However, finding solu-tions to multiobjective optimization problems is difficult and often computationally intensive(Wang and Jiang 1994; Notredame and Higgins 1996; Zhang and Wong 1997; Joh, Arentze, andTimmermans 2001a). Therefore, we developed an EA-based approach to MDSA. Although EAshave been proven to be effective in alignments in various real-world applications (Cai, Juedes,and Liakhovitch 2000; Joh, Arentze, and Timmermans 2001a; Zhang and Huang 2004), ourapproach is based on a different alignment representation. In the next two sections, we discuss thedesign of the special EA operators (e.g., recombination, mutation) as well as the encodingstrategy of our method.
MDSA as a multiobjective optimization problem
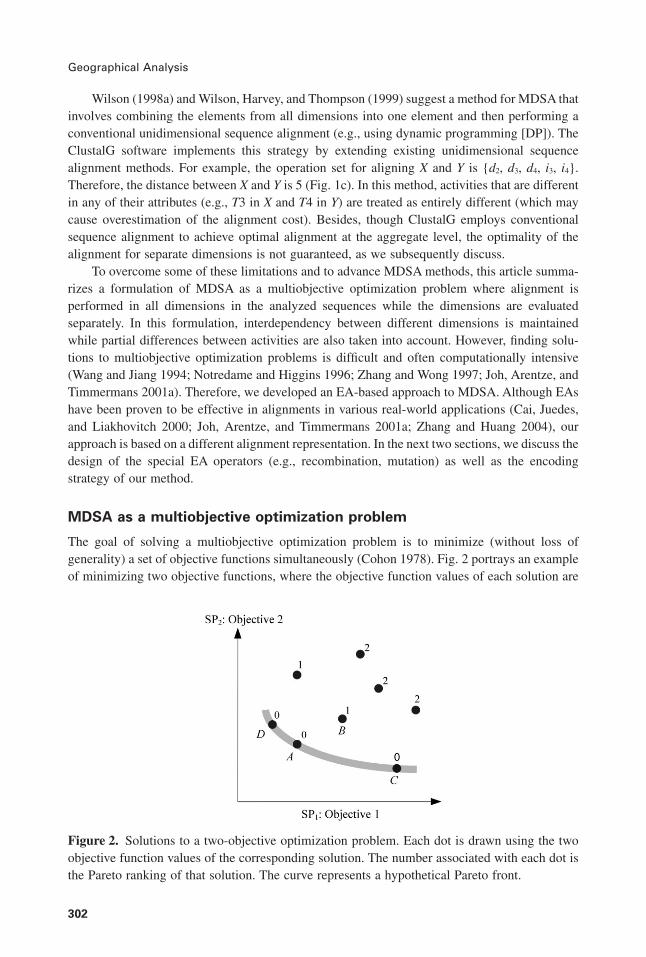
The goal of solving a multiobjective optimization problem is to minimize (without loss ofgenerality) a set of objective functions simultaneously (Cohon 1978). Fig. 2 portrays an exampleof minimizing two objective functions, where the objective function values of each solution are
Figure 2. Solutions to a two-objective optimization problem. Each dot is drawn using the twoobjective function values of the corresponding solution. The number associated with each dot isthe Pareto ranking of that solution. The curve represents a hypothetical Pareto front.
Geographical Analysis
302
used as the coordinates to plot the solution. Solution A is said to dominate solution B because Ahas smaller values than B for both objective functions. Solutions A, C, and D, however, do notdominate each other and are not dominated by any other solutions in the figure. These solutionsare called nondominated (Van Veldhuizen and Lamont 2000; Tan et al. 2001). The nondominatedsolutions are the optimal solutions to a problem and form a front that is generally referred to asthe Pareto front (Deb 2001).
For two multidimensional sequences, we define an objective function for each dimension.For example, the alignment in Fig. 1c can be evaluated by calculating a distance score for twounidimensional alignments, L-HTH and LTWTH, and 1-232 and 14342. Formally, we calculatethe sum-of-pairs alignment score (Gonnet, Korostensky, and Benner 2000) of each alignment.Let S1 and S2 be two unidimensional sequences with length m and n, respectively. Eachsequence element is a character from a finite alphabet set Σ that does not include the reserved gapcharacter (–). Let J be the length of a sequence after alignment. J satisfies the condition ofMAX(m,n) ≤ J ≤ m + n. The alignment of the two sequences can be written as a 2 × J matrixA = (aij) that satisfies the following three conditions: (1) the matrix is padded with gap charactersso that aij ∈ ′∑ = ∑ −∪{ }; (2) removing the gap characters from each row reproduces thecorresponding sequence; and (3) no column exists that contains only gap characters. The left orright panel in Fig. 1a is an example of A. The sum-of-pairs alignment score of alignment A canbe computed as the sum of character substitution costs at each position:
d a aj jj
J
1 21, ,( )
=∑ (1)
where d defines a symmetric matrix that contains substitution costs between each pair ofcharacters in ′∑ . In this study, we use the Levenshtein distance (Myka and Güntzer 1996) todefine the cost matrix, which can be written as
d a b
a b a b
a b a b
a b
,
,
.( ) =∈∑ ≠
= − ∈∑( ) ∈∑ = −( )=
⎧⎨⎪
⎩⎪
2
1
0
and
and or and‘ ’ ‘ ’ (2)
The MDSA can be formulated as a multiobjective optimization problem that minimizes thesum-of-pairs distance scores for the dimensions simultaneously:
MIN: ,, ,SP d a a ii ij ijj
J= ( ) ∀
=∑ 1 21(3)
where SPi is the sum-of-pairs distance scores of dimension i for an alignment A, and a bij ij1 2, ∈ ′∑are the j-th characters in dimension i from the first and second sequences, respectively. In ourcase, we have two dimensions, and therefore 1 ≤ i ≤ 2.
Design of a multiobjective EA for MDSA
EAs have been widely used to search for solutions to optimization problems involving large,complex, and poorly understood search spaces (Deb 2001; Tan et al. 2001; Xiao, Bennett, andArmstrong 2002, 2007). An EA can be used to produce a diverse set of alternative solutions andto search for the Pareto front for a multiobjective optimization problem. At the beginning of anEA, a population of random solutions is created and then evaluated by corresponding objective
Mei-Po Kwan et al. Assessing Activity Pattern Similarity
303
functions. Solutions close to the current Pareto front receive high fitness function values and havea high chance to be selected in the next generation of the population. Then, a breeding process isused to generate a new population. First, a certain percentage of the fittest individuals from thecurrent generation is copied to fill the new generation directly. To create the remaining portion ofthe new generation, parent solutions are selected from the current population based on theirfitness values and then are recombined to generate new solutions. A small portion of the newsolutions is altered (mutated) on a random basis. The EA repeats this process until a predefinedtermination condition, such as the maximum number of generations (MaxGen), is met. For amultiobjective optimization problem, maintaining the diversity among the solutions is alsoimportant to avoid converging to a single point on the Pareto front.
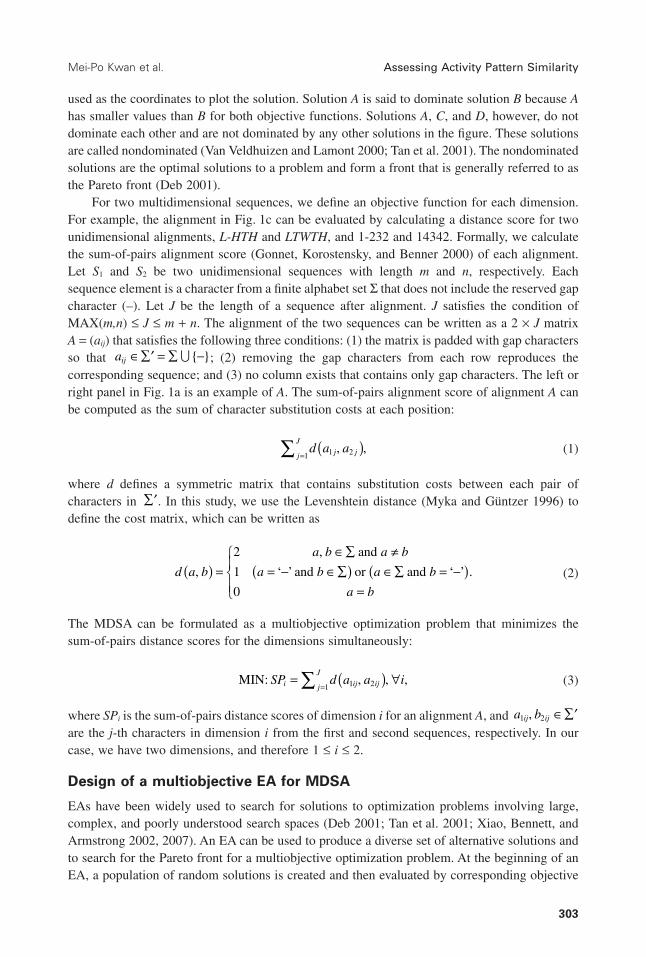
Graph representation of sequence alignmentAn alignment between any two sequences can be represented as a path in a directed acyclic graph,as illustrated in Fig. 3a for an alignment between the two sequences discussed in the secondsection of this article. In this graph, activities in X are arranged as rows and Y as columns. Ahorizontal arrow corresponds to the insertion of a gap in the sequence in the rows or the deletionof characters in the columns. A vertical arrow corresponds to the insertion of a gap in thesequence in the columns or the deletion of characters in the rows. Finally, a diagonal arrowcorresponds to either substitution if the characters in a row and column are different, or identityif the characters are the same. Each possible alignment is a chain of connected arrows betweenthe start and end nodes on the graph. Each path is evaluated for the two dimensions using the costmatrix defined by equation (2). In our example, for the six arrows along the path in Fig. 3a, thecosts for the first dimension (letters) are 0, 1, 1, 1, 0, and 0, respectively, with a sum-of-pairsdistance of 3, while the costs for the second dimension (numbers) are 0, 1, 1, 1, 2, and 0,respectively, with a sum of 5.
For a single objective alignment problem, finding the optimal alignment is a problem ofsearching for the least-cost path on the acyclic graph, with the length of the least-cost path beingno longer than the sum of both sequences to be aligned. Needleman and Wunsch (1970) proposed
Figure 3. Graph representation of a sequence alignment: (a) alignment as a path on a directedacyclic graph; (b) encoding edit operations; (c) the chromosome corresponding to the path in (a).
Geographical Analysis
304
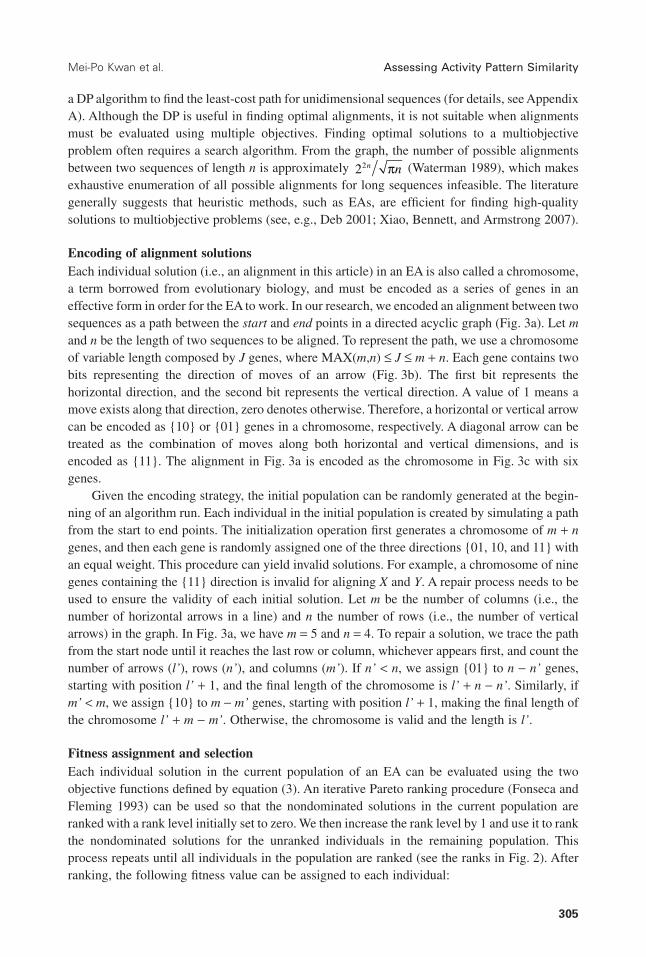
a DP algorithm to find the least-cost path for unidimensional sequences (for details, see AppendixA). Although the DP is useful in finding optimal alignments, it is not suitable when alignmentsmust be evaluated using multiple objectives. Finding optimal solutions to a multiobjectiveproblem often requires a search algorithm. From the graph, the number of possible alignmentsbetween two sequences of length n is approximately 22n nπ (Waterman 1989), which makesexhaustive enumeration of all possible alignments for long sequences infeasible. The literaturegenerally suggests that heuristic methods, such as EAs, are efficient for finding high-qualitysolutions to multiobjective problems (see, e.g., Deb 2001; Xiao, Bennett, and Armstrong 2007).
Encoding of alignment solutionsEach individual solution (i.e., an alignment in this article) in an EA is also called a chromosome,a term borrowed from evolutionary biology, and must be encoded as a series of genes in aneffective form in order for the EA to work. In our research, we encoded an alignment between twosequences as a path between the start and end points in a directed acyclic graph (Fig. 3a). Let mand n be the length of two sequences to be aligned. To represent the path, we use a chromosomeof variable length composed by J genes, where MAX(m,n) ≤ J ≤ m + n. Each gene contains twobits representing the direction of moves of an arrow (Fig. 3b). The first bit represents thehorizontal direction, and the second bit represents the vertical direction. A value of 1 means amove exists along that direction, zero denotes otherwise. Therefore, a horizontal or vertical arrowcan be encoded as {10} or {01} genes in a chromosome, respectively. A diagonal arrow can betreated as the combination of moves along both horizontal and vertical dimensions, and isencoded as {11}. The alignment in Fig. 3a is encoded as the chromosome in Fig. 3c with sixgenes.
Given the encoding strategy, the initial population can be randomly generated at the begin-ning of an algorithm run. Each individual in the initial population is created by simulating a pathfrom the start to end points. The initialization operation first generates a chromosome of m + ngenes, and then each gene is randomly assigned one of the three directions {01, 10, and 11} withan equal weight. This procedure can yield invalid solutions. For example, a chromosome of ninegenes containing the {11} direction is invalid for aligning X and Y. A repair process needs to beused to ensure the validity of each initial solution. Let m be the number of columns (i.e., thenumber of horizontal arrows in a line) and n the number of rows (i.e., the number of verticalarrows) in the graph. In Fig. 3a, we have m = 5 and n = 4. To repair a solution, we trace the pathfrom the start node until it reaches the last row or column, whichever appears first, and count thenumber of arrows (l’), rows (n’), and columns (m’). If n’ < n, we assign {01} to n − n’ genes,starting with position l’ + 1, and the final length of the chromosome is l’ + n − n’. Similarly, ifm’ < m, we assign {10} to m − m’ genes, starting with position l’ + 1, making the final length ofthe chromosome l’ + m − m’. Otherwise, the chromosome is valid and the length is l’.
Fitness assignment and selectionEach individual solution in the current population of an EA can be evaluated using the twoobjective functions defined by equation (3). An iterative Pareto ranking procedure (Fonseca andFleming 1993) can be used so that the nondominated solutions in the current population areranked with a rank level initially set to zero. We then increase the rank level by 1 and use it to rankthe nondominated solutions for the unranked individuals in the remaining population. Thisprocess repeats until all individuals in the population are ranked (see the ranks in Fig. 2). Afterranking, the following fitness value can be assigned to each individual:
Mei-Po Kwan et al. Assessing Activity Pattern Similarity
305
fN R
Ni
i= +−
0 5. ,pop
pop(4)
where i denotes the i-th individual with a rank Ri, Npop is the size of or number of individuals inthe population, and the constant 0.5 is used to ensure that the minimum fitness value is 0.5 andthat each individual has a chance to be selected.
To encourage diversity in the solutions, the fitness value of each individual is adjusted usinga technique called fitness sharing (Goldberg and Richardson 1987), such that
′ =( )∑
ff
sh di
i
ijj
Npop, (5)
where function sh(d) is defined as
sh dd
if d( ) = − ⎛⎝⎜
⎞⎠⎟ <
⎧⎨⎪
⎩⎪
1
0
σσ
α
shareshare
otherwise
, (6)
where α is a constant coefficient and σshare is a distance threshold. Parameter σshare defines aneighborhood such that fitness values of solutions in that neighborhood decrease. A commonlyused α value is two, while σshare often is problem specific. After sharing, fitness values forsolutions that are close to each other in the solution space (e.g., A and D in Fig. 2) decrease,whereas solutions around less crowded areas (e.g., C in Fig. 2) receive higher fitness values sothat they are more likely to be selected in the next generation, making the search process moreexplorative.
After each solution is assigned a fitness value, a selection operator is used to determineindividuals chosen to produce the offspring. We used a method called stochastic universalsampling (Baker 1987). In this method, the individuals in a population are mapped onto con-tinuous line segments, where the length of each segment equals the fitness value of the corre-sponding individual. To select M individuals from the population, we first define a step intervalas P f Mi
Ni= ∑ ′=1
pop , and then randomly generate a number between 0 and P. Using that randomnumber as the starting position, the process advances M steps, and the individual line segmentscontaining these steps subsequently are selected. Individuals with high fitness values may beselected multiple times. The selected individuals are shuffled before they are used to create newsolutions.
RecombinationA recombination operation is used to generate a new alignment from two selected parentalignments. However, conventional recombination operators cannot be directly employed in ourproblem because our special encoding method allows for variable lengths of chromosomes(different paths may have different lengths) and the validity of a chromosome (i.e., {00} is not avalid direction code for a gene). We developed a new recombination operator for our research(Fig. 4).
The chromosome representations for the two parent alignments in Fig. 4a and 4b are{11,10,11,11,11} and {11,01,11,10,11,10}, respectively (note the different lengths). A
Geographical Analysis
306
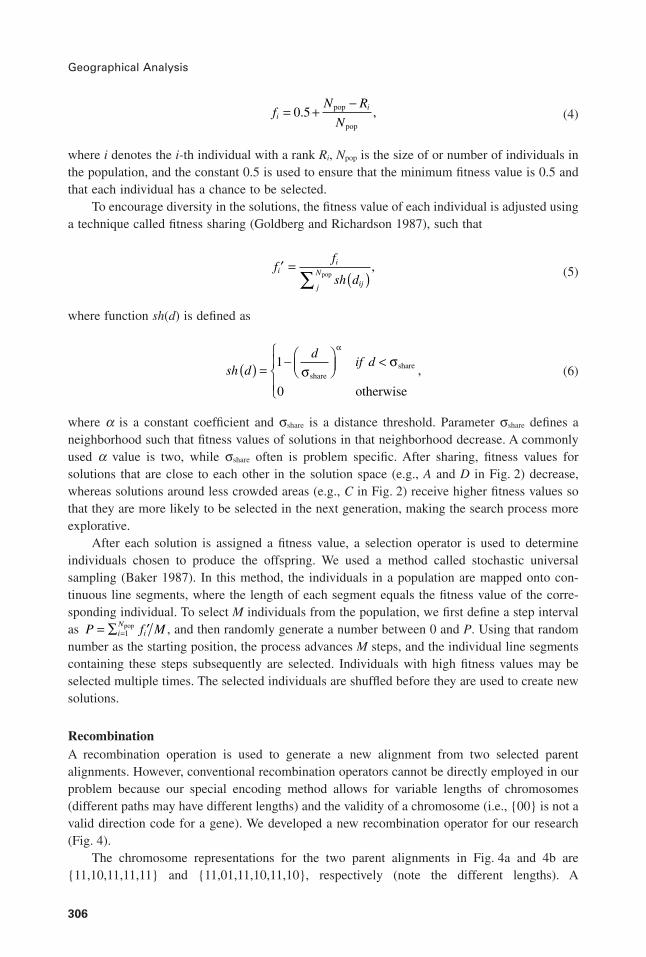
recombination point (RP) is randomly located on the path of parent 1, and the segment from startto RP in parent 1, {11,10}, is directly copied to the offspring. Then, segments of parent 2 arecopied backward from the end point to a point either directly underneath or right at the RP point,forming a temporary offspring of {11,10,*,*, 10,11,10}, where the * symbol indicates thedirections that are not found in the two parents (Fig. 4c). Finally, a sequence of vertical orhorizontal arrows is used to replace the * symbols to complete the offspring as {11, 10, 01, 01,10, 11, 10} (Fig. 4d). This recombination operator ensures the validity of the offspring andattempts to keep as much of the genetic information from both parents as possible. In our design,each pair of parents is applied twice, so that two children are generated. In the EA, a parametercalled recombination probability (Prec) is used to control the execution of the recombinationoperation. If a random number drawn from a uniform distribution between 0 and 1 is smaller thanPrec, the recombination operation is executed twice to yield two new individuals; otherwise, thetwo parents are directly copied to the new population.
MutationA mutation operation is used to slightly alter a solution to introduce new genetic information andto increase the diversity of a population. In a mutation operation, an individual is randomly
Figure 4. Recombination operation that uses the two parent solutions (a) and (b) to create atemporal solution (c) that it modifies to form the child solution (d).
Mei-Po Kwan et al. Assessing Activity Pattern Similarity
307
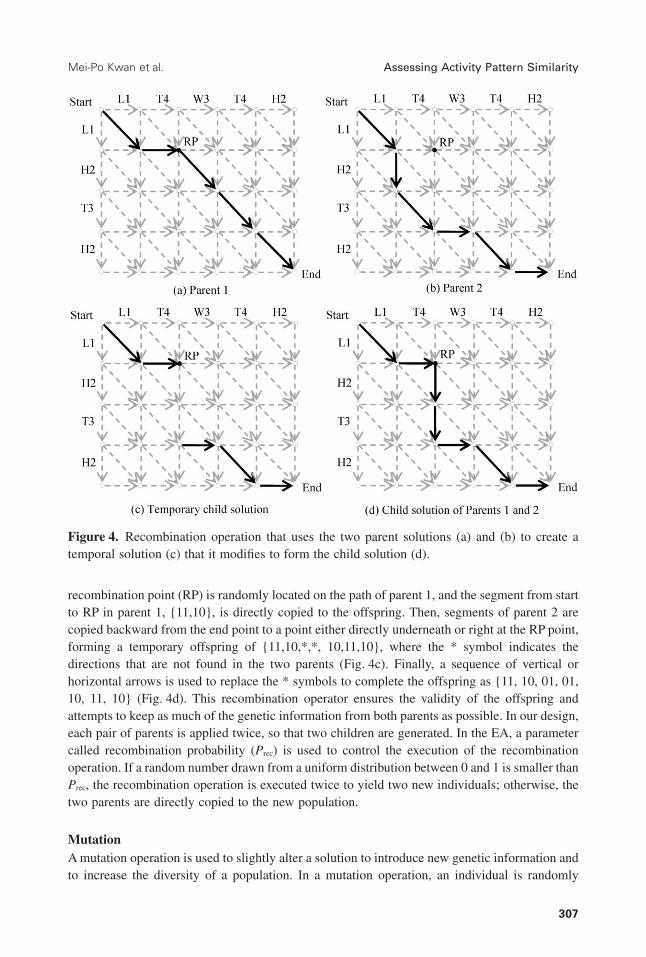
picked from the newly generated offspring with a mutation probability (Pmut). Fig. 5 illustrates themutation process developed in this study. In this example, the selected individual is encoded as{11,11,10,01,11,10}. A short segment between two randomly selected points along the path of thealignment is replaced by another random segment between these two points. In our example, theoriginal segment between points P1 and P2, {11,10} are replaced by {10,11}, and we have a newchromosome {11,10,11,01,11,10}.
Local searchOne critical feature of an EA design is a balance between exploiting existing information usingoperations such as a recombination, and exploring new information using mutation operations(Eiben and Schippers 1998). Although the mutation operation generally can find new informationthat has not been explored before, researchers have demonstrated that incorporating other localsearch mechanisms in an EA can effectively increase search performance (see, e.g., Xiao 2006).In our research, if a new solution undergoes a mutation process, we also apply a DP to a subsetof a solution to improve its Pareto ranking. First, this process randomly chooses a short segmentalong the path on the graph (e.g., from P1 to P2 in Fig. 5b), and then one of the dimensions israndomly selected to construct two unidimensional subsequences. Next, the DP algorithm devel-oped by Needleman and Wunsch (1970) is used to obtain an optimal alignment of the twosubsequences, which is used to replace the original alignment. Appendix A formulates a briefdescription of the DP algorithm.
SummaryAn outline of the multiobjective optimization evolutionary algorithm (MOEA) for MDSA isprovided in Fig. 6. The MOEA continues until reaching the MaxGen allowed. The algorithmselects a total of (1-relite) × Npop individuals from a population (Line 8) and uses the selectedindividuals to create the same number of offspring (Line 9). Here, relite is a ratio between 0 and1. A portion of the offspring undergoes mutation and the DP algorithm (Line 10). Finally, theoffspring are inserted into a population (Line 11) to replace 100 × (1-relite) percent of itsindividuals. During each generation, the highest ranked relite × Npop individuals in the currentpopulation are kept. This technique, called elitism (Deb 2001; Coello Coello, Lamont, and Van
Figure 5. Mutation operation.
Geographical Analysis
308
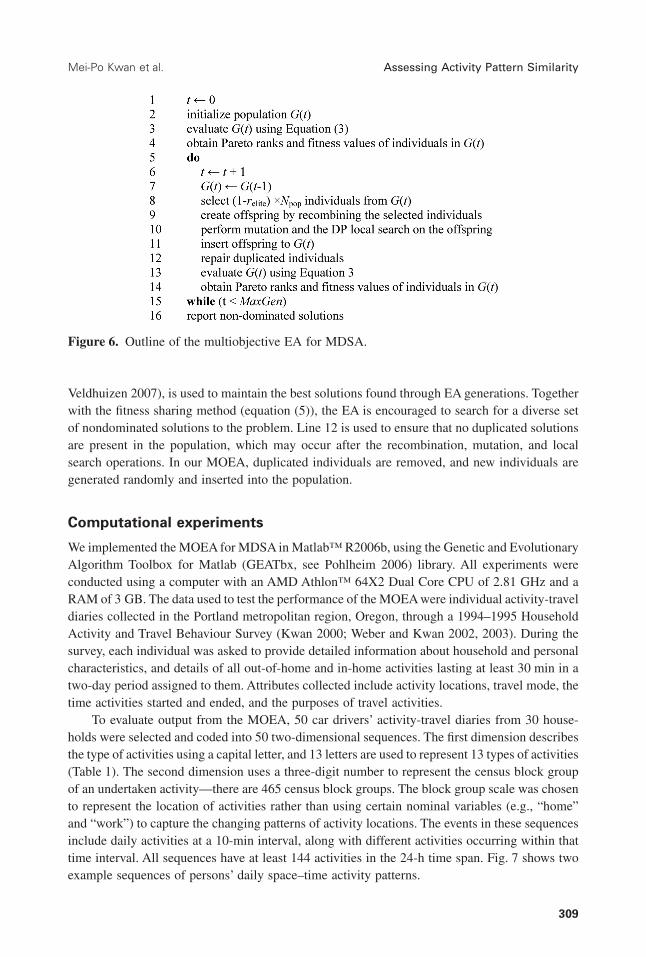
Veldhuizen 2007), is used to maintain the best solutions found through EA generations. Togetherwith the fitness sharing method (equation (5)), the EA is encouraged to search for a diverse setof nondominated solutions to the problem. Line 12 is used to ensure that no duplicated solutionsare present in the population, which may occur after the recombination, mutation, and localsearch operations. In our MOEA, duplicated individuals are removed, and new individuals aregenerated randomly and inserted into the population.
Computational experiments
We implemented the MOEA for MDSA in Matlab™ R2006b, using the Genetic and EvolutionaryAlgorithm Toolbox for Matlab (GEATbx, see Pohlheim 2006) library. All experiments wereconducted using a computer with an AMD Athlon™ 64X2 Dual Core CPU of 2.81 GHz and aRAM of 3 GB. The data used to test the performance of the MOEA were individual activity-traveldiaries collected in the Portland metropolitan region, Oregon, through a 1994–1995 HouseholdActivity and Travel Behaviour Survey (Kwan 2000; Weber and Kwan 2002, 2003). During thesurvey, each individual was asked to provide detailed information about household and personalcharacteristics, and details of all out-of-home and in-home activities lasting at least 30 min in atwo-day period assigned to them. Attributes collected include activity locations, travel mode, thetime activities started and ended, and the purposes of travel activities.
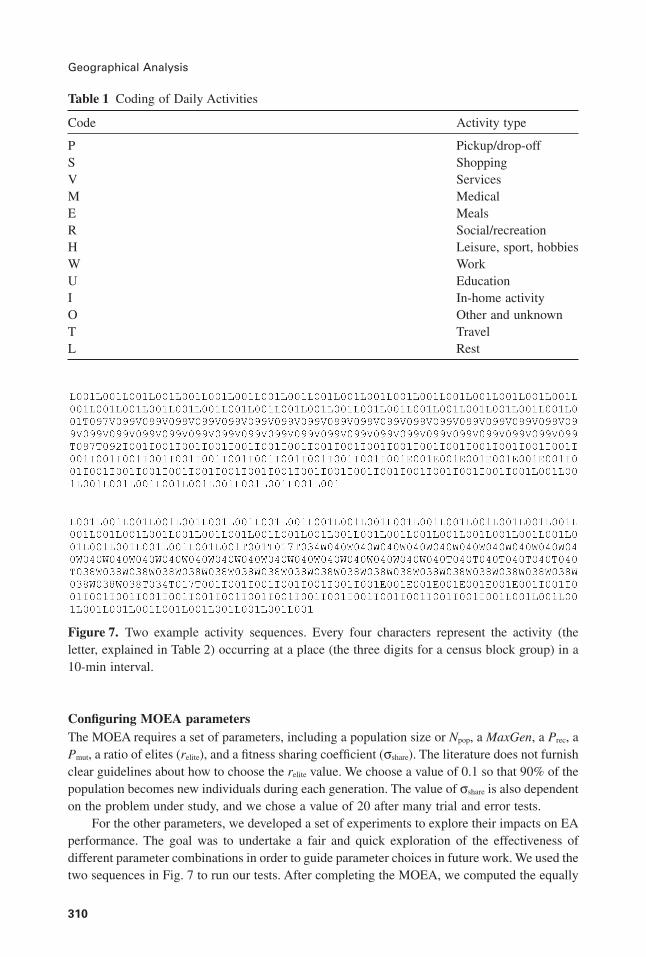
To evaluate output from the MOEA, 50 car drivers’ activity-travel diaries from 30 house-holds were selected and coded into 50 two-dimensional sequences. The first dimension describesthe type of activities using a capital letter, and 13 letters are used to represent 13 types of activities(Table 1). The second dimension uses a three-digit number to represent the census block groupof an undertaken activity—there are 465 census block groups. The block group scale was chosento represent the location of activities rather than using certain nominal variables (e.g., “home”and “work”) to capture the changing patterns of activity locations. The events in these sequencesinclude daily activities at a 10-min interval, along with different activities occurring within thattime interval. All sequences have at least 144 activities in the 24-h time span. Fig. 7 shows twoexample sequences of persons’ daily space–time activity patterns.
Figure 6. Outline of the multiobjective EA for MDSA.
Mei-Po Kwan et al. Assessing Activity Pattern Similarity
309
Configuring MOEA parametersThe MOEA requires a set of parameters, including a population size or Npop, a MaxGen, a Prec, aPmut, a ratio of elites (relite), and a fitness sharing coefficient (σshare). The literature does not furnishclear guidelines about how to choose the relite value. We choose a value of 0.1 so that 90% of thepopulation becomes new individuals during each generation. The value of σshare is also dependenton the problem under study, and we chose a value of 20 after many trial and error tests.
For the other parameters, we developed a set of experiments to explore their impacts on EAperformance. The goal was to undertake a fair and quick exploration of the effectiveness ofdifferent parameter combinations in order to guide parameter choices in future work. We used thetwo sequences in Fig. 7 to run our tests. After completing the MOEA, we computed the equally
Table 1 Coding of Daily Activities
Code Activity type
P Pickup/drop-offS ShoppingV ServicesM MedicalE MealsR Social/recreationH Leisure, sport, hobbiesW WorkU EducationI In-home activityO Other and unknownT TravelL Rest
Figure 7. Two example activity sequences. Every four characters represent the activity (theletter, explained in Table 2) occurring at a place (the three digits for a census block group) in a10-min interval.
Geographical Analysis
310
weighted sum of the two objective function values for each nondominated solution using thefollowing equation:
SP SPii=
=∑1
2 1
2, (7)
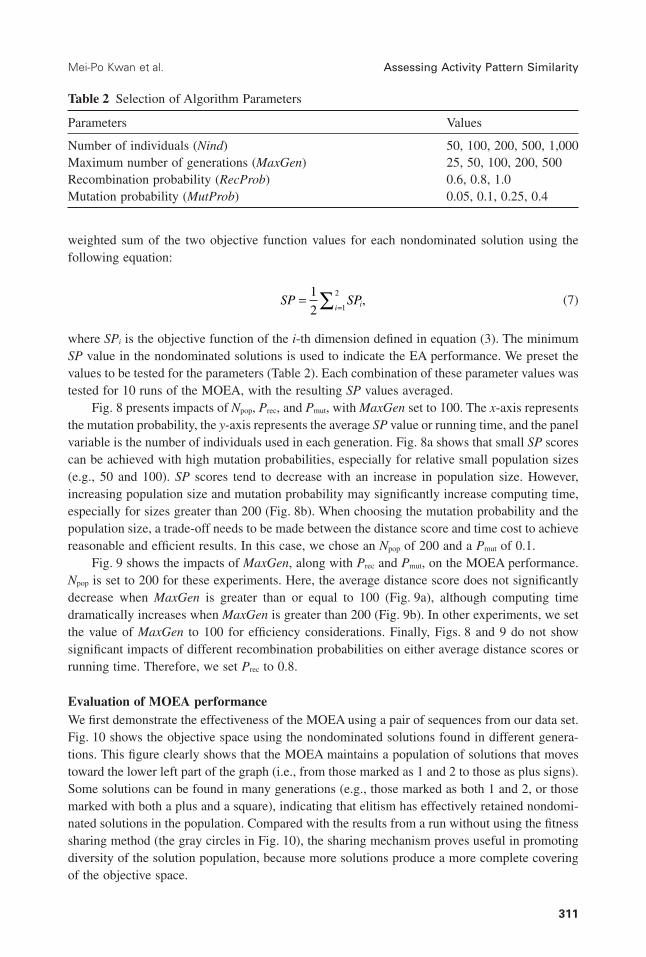
where SPi is the objective function of the i-th dimension defined in equation (3). The minimumSP value in the nondominated solutions is used to indicate the EA performance. We preset thevalues to be tested for the parameters (Table 2). Each combination of these parameter values wastested for 10 runs of the MOEA, with the resulting SP values averaged.
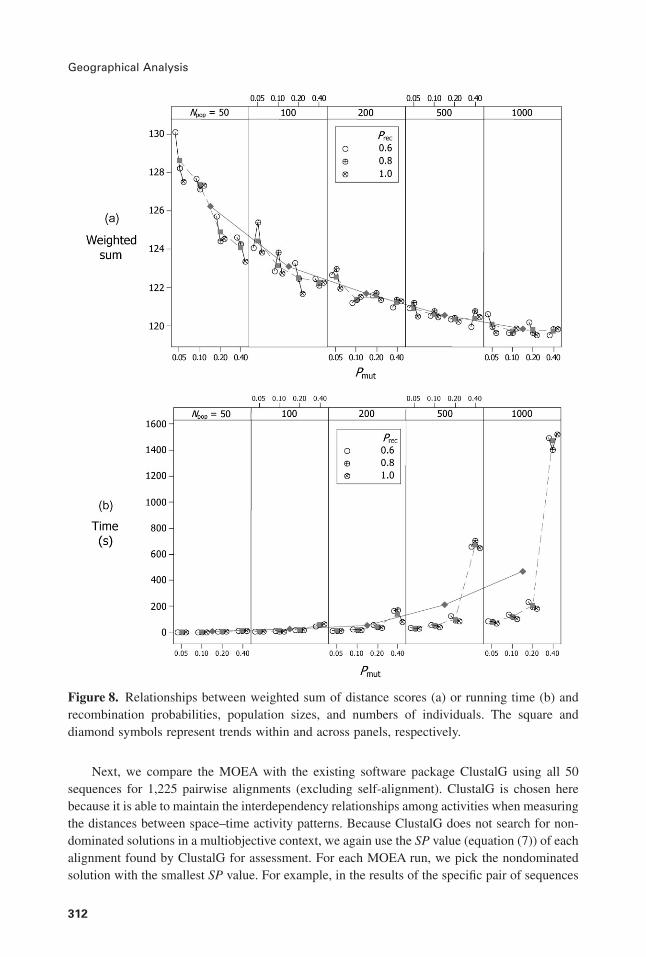
Fig. 8 presents impacts of Npop, Prec, and Pmut, with MaxGen set to 100. The x-axis representsthe mutation probability, the y-axis represents the average SP value or running time, and the panelvariable is the number of individuals used in each generation. Fig. 8a shows that small SP scorescan be achieved with high mutation probabilities, especially for relative small population sizes(e.g., 50 and 100). SP scores tend to decrease with an increase in population size. However,increasing population size and mutation probability may significantly increase computing time,especially for sizes greater than 200 (Fig. 8b). When choosing the mutation probability and thepopulation size, a trade-off needs to be made between the distance score and time cost to achievereasonable and efficient results. In this case, we chose an Npop of 200 and a Pmut of 0.1.
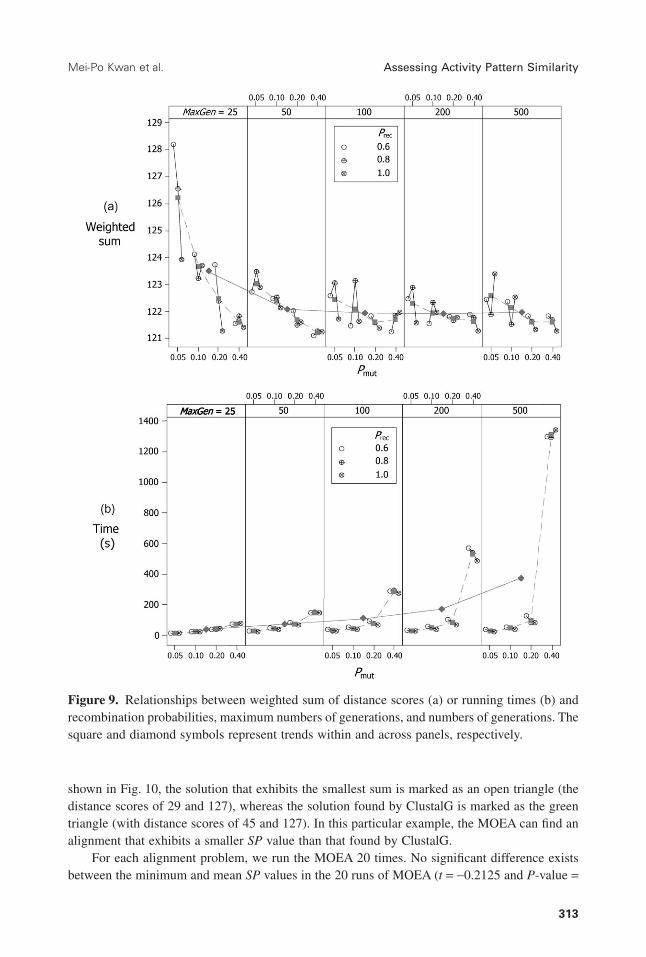
Fig. 9 shows the impacts of MaxGen, along with Prec and Pmut, on the MOEA performance.Npop is set to 200 for these experiments. Here, the average distance score does not significantlydecrease when MaxGen is greater than or equal to 100 (Fig. 9a), although computing timedramatically increases when MaxGen is greater than 200 (Fig. 9b). In other experiments, we setthe value of MaxGen to 100 for efficiency considerations. Finally, Figs. 8 and 9 do not showsignificant impacts of different recombination probabilities on either average distance scores orrunning time. Therefore, we set Prec to 0.8.
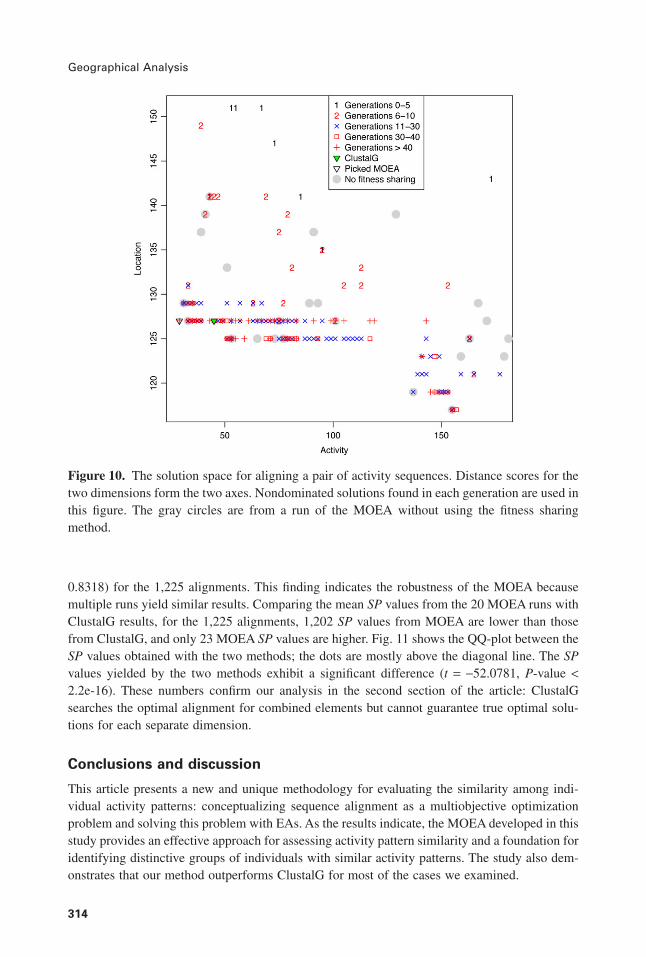
Evaluation of MOEA performanceWe first demonstrate the effectiveness of the MOEA using a pair of sequences from our data set.Fig. 10 shows the objective space using the nondominated solutions found in different genera-tions. This figure clearly shows that the MOEA maintains a population of solutions that movestoward the lower left part of the graph (i.e., from those marked as 1 and 2 to those as plus signs).Some solutions can be found in many generations (e.g., those marked as both 1 and 2, or thosemarked with both a plus and a square), indicating that elitism has effectively retained nondomi-nated solutions in the population. Compared with the results from a run without using the fitnesssharing method (the gray circles in Fig. 10), the sharing mechanism proves useful in promotingdiversity of the solution population, because more solutions produce a more complete coveringof the objective space.
Table 2 Selection of Algorithm Parameters
Parameters Values
Number of individuals (Nind) 50, 100, 200, 500, 1,000Maximum number of generations (MaxGen) 25, 50, 100, 200, 500Recombination probability (RecProb) 0.6, 0.8, 1.0Mutation probability (MutProb) 0.05, 0.1, 0.25, 0.4
Mei-Po Kwan et al. Assessing Activity Pattern Similarity
311
Next, we compare the MOEA with the existing software package ClustalG using all 50sequences for 1,225 pairwise alignments (excluding self-alignment). ClustalG is chosen herebecause it is able to maintain the interdependency relationships among activities when measuringthe distances between space–time activity patterns. Because ClustalG does not search for non-dominated solutions in a multiobjective context, we again use the SP value (equation (7)) of eachalignment found by ClustalG for assessment. For each MOEA run, we pick the nondominatedsolution with the smallest SP value. For example, in the results of the specific pair of sequences
Figure 8. Relationships between weighted sum of distance scores (a) or running time (b) andrecombination probabilities, population sizes, and numbers of individuals. The square anddiamond symbols represent trends within and across panels, respectively.
Geographical Analysis
312
shown in Fig. 10, the solution that exhibits the smallest sum is marked as an open triangle (thedistance scores of 29 and 127), whereas the solution found by ClustalG is marked as the greentriangle (with distance scores of 45 and 127). In this particular example, the MOEA can find analignment that exhibits a smaller SP value than that found by ClustalG.
For each alignment problem, we run the MOEA 20 times. No significant difference existsbetween the minimum and mean SP values in the 20 runs of MOEA (t = −0.2125 and P-value =
Figure 9. Relationships between weighted sum of distance scores (a) or running times (b) andrecombination probabilities, maximum numbers of generations, and numbers of generations. Thesquare and diamond symbols represent trends within and across panels, respectively.
Mei-Po Kwan et al. Assessing Activity Pattern Similarity
313
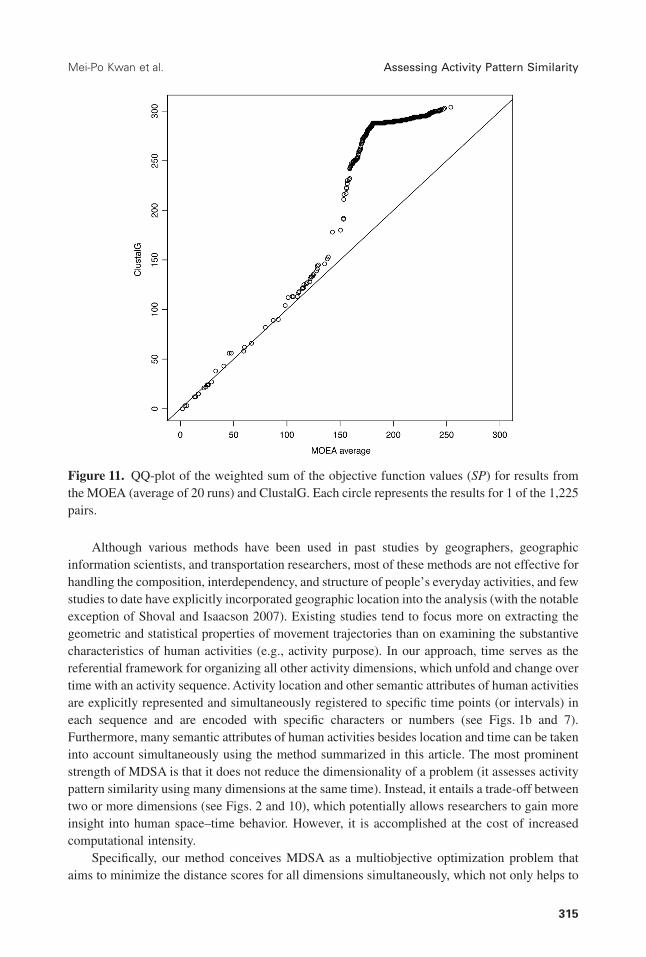
0.8318) for the 1,225 alignments. This finding indicates the robustness of the MOEA becausemultiple runs yield similar results. Comparing the mean SP values from the 20 MOEA runs withClustalG results, for the 1,225 alignments, 1,202 SP values from MOEA are lower than thosefrom ClustalG, and only 23 MOEA SP values are higher. Fig. 11 shows the QQ-plot between theSP values obtained with the two methods; the dots are mostly above the diagonal line. The SPvalues yielded by the two methods exhibit a significant difference (t = −52.0781, P-value <2.2e-16). These numbers confirm our analysis in the second section of the article: ClustalGsearches the optimal alignment for combined elements but cannot guarantee true optimal solu-tions for each separate dimension.
Conclusions and discussion
This article presents a new and unique methodology for evaluating the similarity among indi-vidual activity patterns: conceptualizing sequence alignment as a multiobjective optimizationproblem and solving this problem with EAs. As the results indicate, the MOEA developed in thisstudy provides an effective approach for assessing activity pattern similarity and a foundation foridentifying distinctive groups of individuals with similar activity patterns. The study also dem-onstrates that our method outperforms ClustalG for most of the cases we examined.
Figure 10. The solution space for aligning a pair of activity sequences. Distance scores for thetwo dimensions form the two axes. Nondominated solutions found in each generation are used inthis figure. The gray circles are from a run of the MOEA without using the fitness sharingmethod.
Geographical Analysis
314
Although various methods have been used in past studies by geographers, geographicinformation scientists, and transportation researchers, most of these methods are not effective forhandling the composition, interdependency, and structure of people’s everyday activities, and fewstudies to date have explicitly incorporated geographic location into the analysis (with the notableexception of Shoval and Isaacson 2007). Existing studies tend to focus more on extracting thegeometric and statistical properties of movement trajectories than on examining the substantivecharacteristics of human activities (e.g., activity purpose). In our approach, time serves as thereferential framework for organizing all other activity dimensions, which unfold and change overtime with an activity sequence. Activity location and other semantic attributes of human activitiesare explicitly represented and simultaneously registered to specific time points (or intervals) ineach sequence and are encoded with specific characters or numbers (see Figs. 1b and 7).Furthermore, many semantic attributes of human activities besides location and time can be takeninto account simultaneously using the method summarized in this article. The most prominentstrength of MDSA is that it does not reduce the dimensionality of a problem (it assesses activitypattern similarity using many dimensions at the same time). Instead, it entails a trade-off betweentwo or more dimensions (see Figs. 2 and 10), which potentially allows researchers to gain moreinsight into human space–time behavior. However, it is accomplished at the cost of increasedcomputational intensity.
Specifically, our method conceives MDSA as a multiobjective optimization problem thataims to minimize the distance scores for all dimensions simultaneously, which not only helps to
Figure 11. QQ-plot of the weighted sum of the objective function values (SP) for results fromthe MOEA (average of 20 runs) and ClustalG. Each circle represents the results for 1 of the 1,225pairs.
Mei-Po Kwan et al. Assessing Activity Pattern Similarity
315
maintain the interdependency relationships of different activity attributes but also provides theflexibility of handling various numbers of attribute dimensions. When compared with otheralgorithms, our MOEA can use different distance measures for different activity dimensionsthrough defining a corresponding substitution matrix in its objective function. For example, aspatial proximity matrix can be defined for the spatial dimension to compare real geographiclocations, and various semantic matrices can be defined for comparing activity pattern differenceswith respect to specific attribute dimensions (e.g., activity type or activity purpose). This flex-ibility removes the constraints of existing algorithms and lays a foundation for the clustering ofmovement trajectories of humans or objects with many interacting dimensions. Using theMOEA, the number of activity dimensions that can be handled for high-dimensional activity databecomes flexible by defining a corresponding number of objectives in multidimensional solutionspace.
However, significant challenges to using MDSA and MOEA remain. For example, becausetime is the referential framework for organizing all other activity dimensions, analyzing motionpatterns or extracting space–time patterns (e.g., cyclical or repeating movements) is difficult.Further, when comparing patterns with primary and secondary activities, coding human activitiesappropriately and defining a good substitution cost matrix to be used in the objective function areimportant. For example, given three persons’ daily activities of “home-work-home,” “home-work-lunch-work-home,” and “home-shopping-home,” if the distance measure is defined as thenumber of character edit operations, the distance score between the first and the third sequencesis smaller than that between the first and the second. However, the first two sequences should bemore similar because both are commute-related activity patterns. Therefore, sequence alignmentdepends heavily on how activity sequences are coded and how the substitution cost matrix isdefined. In this case, one option is to code the sequences with the consideration of activityduration, with each character representing a certain amount of time, which eliminates the biasescaused by sequence length differences. Because secondary activities often are dependent onprimary activities, in the substitution cost matrix, smaller substitution costs should be defined forprimary-secondary activities than for any other activities. Effectively defining substitution costsrequires a good substantive understanding of human activity-travel behavior and domain-specificexpert knowledge.
Another topic for future research is the computational intensity of sequence alignmentmethods and EAs. One problem relates to the combinatorial explosion as a result of the use offiner spatial and temporal granularity in sequence alignment (Joh, Arentze, and Timmermans2001a). In this study, for example, activity attributes are organized along a temporal sequence of144 time intervals (10-min intervals over a 24-h period), and 465 geographic locations areexplicitly coded (the study area in Shoval and Isaacson 2007 has only 26 zones). When finertemporal and spatial scales are used, the combinatorial explosion becomes significant and posesa considerable challenge for applying sequence alignment. Furthermore, when compared to theDP method used in ClustalG, the MOEA is more computationally intensive due to its iterativenature. To increase the search speed and to make the algorithm feasible for tackling largeproblems, the single-population MOEA needs to be extended to a multiple-population MOEAand implemented on a massively parallel architecture for high-dimensional applications (Xiaoand Armstrong 2003). In addition, although we have proposed the MOEA to compute thedistance between multidimensional sequences, the test of the reliability and significance of thedistance scores for multidimensional sequences needs to be investigated in future research(Wilson 2006).
Geographical Analysis
316
Acknowledgements
Mei-Po Kwan’s work on this article was supported by the following grants: NSF BCS-1244691,NIH R01DA032371-01, and NSFC 41228001. In addition, part of this research was supported bya grant from the National Natural Science Foundation of China (No. 71272030).
Appendix A. DP for sequence alignment
To describe briefly the DP method developed by Needleman and Wunsch (1970), we use A andB to denote two sequences to be aligned, and Ai (1 ≤ i ≤ m) and Bj (1 ≤ j ≤ n) to denote the i-thand j-th characters in the sequences, respectively. We construct an m × n matrix and use S(i, j) todenote the value at cell (i, j). Before filling in the values in the matrix, we set S(0,0) = 0, S(i, 0)= i × d, and S(0, j) = j × d, where d is the cost of inserting a gap into a sequence. Using the costsdefined in equation (2), we have d = 1. Moreover, we also apply equation (2) to compute d(Ai, Bj)as the distance score between the i-th and j-th characters in A and B, respectively. We thenrecursively set S(i, j) to be the minimum of three values: S(i − 1, j − 1) + d(Ai, Bj), S(i, j − 1) +d, and S(i − 1, j) + d, representing three edit operation directions: diagonal (substitution oridentity), horizontal (inserting a gap into A after the i-th character), and vertical (inserting a gapinto B after the j-th character), respectively. After completing the process, the directions chosenare used to trace back the optimal alignment starting from cell (m, n), and hence the optimal costis S(m, n).
References
Abbott, A. (1995). “Sequence Analysis: New Methods for Old Ideas.” Annual Review of Sociology 21,93–113.
Baker, J. E. (1987). “Reducing Bias and Inefficiency in the Selection Algorithm.” In Proceedings of theSecond International Conference on Genetic Algorithms and Their Application, 14–21, edited by J.J. Grefenstette. Hillsdale, NJ: Lawrence Erlbaum Associates.
Bargeman, B., C.-H. Joh, and H. Timmermans. (2002). “Vacation Behavior Using a Sequence AlignmentMethod.” Annals of Tourism Research 29, 320–37.
Becken, S., D. Simmons, and C. Frampton. (2003). “Segmenting Tourists by Their Travel Pattern forInsights into Achieving Energy Efficiency.” Journal of Travel Research 42(1), 48–56.
Burnett, P., and S. Hanson. (1982). “The Analysis of Travel As An Example of Complex Human Behav-ior in Spatially-Constrained Situations: Definition and Measurement Issues.” TransportationResearch A 16, 87–102.
Cai, L., D. Juedes, and E. Liakhovitch. (2000). “Evolutionary Computation Techniques for MultipleSequence Alignment.” In Proceedings of the 2000 Congress on Evolutionary Computation, 829–35.Piscataway, NJ: IEEE Service Center.
Cha, S., K. W. McCleary, and M. Uysal. (1995). “Travel Motivations of Japanese Overseas Travelers: AFactor-Cluster Segmentation Approach.” Journal of Travel Research 34(1), 33–9.
Chen, J., S.-L. Shaw, H. Yu, F. Lu, Y. Chai, and Q. Jia. (2011). “Exploratory Data Analysis ofActivity Diary Data: A Space–Time GIS Approach.” Journal of Transport Geography 19,394–404.
Coello Coello, C. A., G. B. Lamont, and D. A. Van Veldhuizen. (2007). Evolutionary Algorithms forSolving Multi-Objective Problems, 3rd ed. Berlin: Springer.
Cohon, J. L. (1978). Multiobjective Programming and Planning. New York: Academic Press.Deb, K. (2001). Multi-Objective Optimization Using Evolutionary Algorithms. New York: Wiley.Demšar, U., and K. Virrantaus. (2010). “Space–Time Density of Trajectories: Exploring Spatio-Temporal
Patterns in Movement Data.” International Journal of Geographical Information Science 24(10),1527–42.
Mei-Po Kwan et al. Assessing Activity Pattern Similarity
317
Dodge, S., P. Laube, and R. Weibel. (2012). “Movement Similarity Assessment Using Symbolic Represen-tation of Trajectories.” International Journal of Geographical Information Science 26(9), 1563–88.
Eiben, A. E., and C. A. Schippers. (1998). “On Evolutionary Exploration and Exploitation.” FundamentaInformaticae 35(1–4), 35–50.
Fonseca, C. M., and P. J. Fleming. (1993). “Genetic Algorithms in Multiobjective Optimization: Formu-lation, Discussion and Generalization.” In Proceedings of the Fifth International Conference onGenetic Algorithms, 416–23, edited by S. Forrest. San Mateo, CA: Morgan Kaufmann.
Gao, Y., B. Zheng, G. Chen, and Q. Li. (2010). “Algorithms for Constrained K-Nearest NeighborQueries over Moving Object Trajectories.” Geoinformatica 14, 241–76.
Goldberg, D. E., and J. Richardson. (1987). “Genetic Algorithms with Sharing for Multimodal FunctionOptimization.” In Genetic Algorithms and Their Applications: Proceedings of the Second Interna-tional Conference on Genetic Algorithms, 41–9, edited by J. J. Grefenstette. Hillsdale, NJ: Law-rence Erlbaum Associates.
Gonnet, G. H., C. Korostensky, and S. Benner. (2000). “Evaluation Measures of Multiple SequenceAlignments.” Journal of Computational Biology 7, 261–76.
Gonzalez, M. C., C. A. Hidalgo, and A.-L. Barabási. (2008). “Understanding Individual Human MobilityPatterns.” Nature 453, 779–82.
Griffith, D. A., Y. Chun, M. E. O’Kelly, B. J. L. Berry, R. P. Haining, and M.-P. Kwan. (2013). “Geo-graphical Analysis: Its First Forty Years.” Geographical Analysis 45(1), 1–27.
Han, J. W., and J. Gao. (2009). “Research Challenges for Data Mining in Science and Engineering.” InNext Generation of Data Mining, 1–25, edited by H. Kargupta, J. W. Han, P. Yu, R. Motwani andV. Kumar. New York: CRC Press.
Hanson, S., and J. Huff. (1986). “Classification Issues in the Analysis of Complex Travel Behavior.”Transportation 13, 271–93.
Hornsby, K. S., and S. Cole. (2007). “Modeling Moving Geospatial Objects from An Event-Based Per-spective.” Transactions in GIS 11(4), 555–73.
Joh, C.-H., T. A. Arentze, and H. J. T. Timmermans. (2001a). “Multidimensional Sequence AlignmentMethods for Activity-Travel Pattern Analysis.” Geographical Analysis 33(3), 247–70.
Joh, C.-H., T. Arentze, and H. Timmermans. (2001b). “Pattern Recognition in Complex Activity TravelPatterns: Comparison of Euclidean Distance, Signal-Processing Theoretical, and MultidimensionalSequence Alignment Methods.” Transportation Research Record 1752, 16–22.
Joh, C.-H., T. Arentze, and H. Timmermans. (2001c). “A Position-Sensitive Sequence-AlignmentMethod Illustrated for Space–Time Activity-Diary Data.” Environment and Planning A 33, 313–38.
Joh, C.-H., T. Arentze, F. Hofman, and H. Timmermans. (2002). “Activity Pattern Similarity: A Multidi-mensional Sequence Alignment Method.” Transportation Research Part B: Methodological 36(5),385–403.
Joh, C.-H., H. J. P. Timmermans, and P. T. L. Popkowski-Leszczyc. (2003). “Identifying Purchase-History Sensitive Shopper Segments Using Scanner Panel Data and Sequence Alignment Methods.”Journal of Retailing and Consumer Services 10, 135–44.
Koppelman, F. S., and E. I. Pas. (1985). “Travel-Activity Behavior in Time and Space: Methods for Rep-resentation and Analysis.” In Measuring the Unmeasurable, 587–623, edited by P. Nijkamp, H.Leitner and N. Wrigley. The Hague: Martinus Nijhoff.
Kruskal, J. B. (1983). “An Overview of Sequence Comparison.” In Time Warps, String Edits, and Mac-romolecules: The Theory and Practice of Sequence Comparison, 1–44, edited by D. Sankoff and J.Kruskal. Reading, MA: Addison-Wesley.
Kwan, M.-P. (1999). “Gender, the Home-Work Link, and Space–Time Patterns of Non-EmploymentActivities.” Economic Geography 75(4), 370–94.
Kwan, M.-P. (2000). “Interactive Geovisualization of Activity-Travel Patterns Using Three-DimensionalGeographical Information Systems: A Methodological Exploration with A Large Data Set.” Trans-portation Research C 8, 185–203.
Kwan, M.-P. (2004). “GIS Methods in Time-Geographic Research: Geocomputation and Geovisualiza-tion of Human Activity Patterns.” Geografiska Annaler B 86, 267–80.
Kwan, M.-P. (2012). “The Uncertain Geographic Context Problem.” Annals of the Association of Ameri-can Geographers 102(5), 958–68.
Geographical Analysis
318
Kwan, M.-P. (2013). “Beyond Space (As We Knew It): Toward Temporally Integrated Geographies ofSegregation, Health, and Accessibility.” Annals of the Association of American Geographers 103(5),1078–86.
Laube, P., T. Dennis, P. Forer, and M. Walker. (2007). “Movement beyond the Snapshot: DynamicAnalysis of Geospatial Lifelines.” Computers, Environment and Urban Systems 31, 481–501.
Long, J. A., and T. A. Nelson. (2013). “A Review of Quantitative Methods for Movement Data.” Interna-tional Journal of Geographical Information Science 27(2), 292–318.
Ma, J., and K. G. Goulias. (1997). “A Dynamic Analysis of Person and Household Activity and TravelPatterns Using Data from the First Two Waves in the Puget Sound Transportation Panel.” Transpor-tation 24, 309–31.
Miller, H. J., and J. W. Han. (2009). “Geographic Data Mining and Knowledge Discovery: An Over-view.” In Geographic Data Mining and Knowledge Discovery, 2nd ed. 1–26, edited by H. J. Millerand J. W. Han. New York: CRC Press.
Myka, A., and U. Güntzer. (1996). “Fuzzy Full-Text Searches in OCR Databases.” In Digital Libraries:Research and Technology Advances, Adl’95 Forum, 131–48, edited by N. R. Adams, B. K.Bhargava, M. Halem and Y. Yesha. Berlin: Springer.
Needleman, S. B., and C. D. Wunsch. (1970). “A General Method Applicale to the Search for Similari-ties in the Amino Acid Sequence of Two Proteins.” Journal of Molecular Biology 48, 443–53.
Notredame, C., and D. G. Higgins. (1996). “SAGA: Sequence Alignment by Genetic Algorithm.”Nucleic Acids Research 24, 1515–24.
Orellana, D., and M. Wachowicz. (2012). “Exploring Patterns of Movement Suspension in PedestrianMobility.” Geographical Analysis 43(3), 241–60.
Palmer, J. R., T. J. Espenshade, F. Bartumeus, C. Y. Chung, N. E. Ozgencil, and K. Li. (2013). “NewApproaches to Human Mobility: Using Mobile Phones for Demographic Research.” Demography50(3), 1105–28.
Pas, E. I. (1983). “A Flexible and Integrated Methodology for Analytical Classification of Daily Travel-Activity Behavior.” Transportation Science 17, 405–29.
Persson, O., and K. Ellegård. (2012). “Torsten Hägerstrand in the Citation Time Web.” ProfessionalGeographer 64(2), 250–61.
Pohlheim, H. (2006). GEATbx: Introduction. Available at http://www.geatbx.com (accessed on 9 Septem-ber 2013).
Raubal, M., H. J. Miller, and S. Bridwell. (2004). “User-Centred Time Geography for Location-BasedServices.” Geografiska Annaler B 86, 245–65.
Recker, W. W., M. G. McNally, and G. S. Root. (1985). “Travel/Activity Analysis: Pattern Recognition,Classification, and Interpretation.” Transportation Research A 19, 279–96.
Richardson, D. B., N. D. Volkow, M. Kwan, R. M. Kaplan, M. F. Goodchild, and R. T. Croyle. (2013).“Spatial Turn in Health Research.” Science 339(6126), 1390–92.
Sadahiro, Y., R. Lay, and T. Kobayashi. (2013). “Trajectories of Moving Objects on A Network: Detec-tion of Similarities, Visualization of Relations, and Classification of Trajectories.” Transactions inGIS 17(1), 18–40.
Schlich, R., and K. W. Axhausen. (2003). “Habitual Travel Behaviour: Evidence from A Six-WeekTravel Diary.” Transportation 30, 13–36.
Schlich, R., and K. W. Axhausen. (2004). “Analysing Interpersonal Variability for Homogeneous Groupsof Travellers.” Working Report on Transport and Land Use Planning, Institut für Verkehrsplanungund Transportsysteme (IVT). Zürich: ETH.
Shen, Y., M. Kwan, and Y. Chai. (2013). “Investigating Commuting Flexibility with GPS Data and 3DGeovisualizations: A Case Study of Beijing, China.” Journal of Transport Geography 32, 1–11.
Shoval, N., and M. Isaacson. (2007). “Sequence Alignment As A Method for Human Activity Analysis inSpace and Time.” Annals of the Association of American Geographers 97(2), 282–97.
Shoval, N., H.-W. Wahl, G. Auslander, M. Isaacson, F. Oswald, T. Edry, R. Landau, and J. Heinik.(2011). “Use of the Global Positioning System to Measure the Out-of-Home Mobility of OlderAdults with Differing Cognitive Functioning.” Ageing & Society 31, 849–69.
Sinha, G., and D. M. Mark. (2005). “Measuring Similarity between Geospatial Lifelines in Studies ofEnvironmental Health.” Journal of Geographical Systems 7(1), 115–36.
Mei-Po Kwan et al. Assessing Activity Pattern Similarity
319
Smyth, C. S. (2001). “Mining Mobile Trajectories.” In Geographic Data Mining and Knowledge Discov-ery, 337–61, edited by H. J. Miller and J. Han. New York: Taylor & Francis.
Stovel, K., and M. Bolan. (2004). “Residential Trajectories: Using Optimal Alignment to Reveal theStructure of Residential Mobility.” Sociological Methods and Research 32, 559–98.
Tan, K. C., T. H. Lee, D. Khoo, and E. F. Khor. (2001). “A Multiobjective Evolutionary AlgorithmToolbox for Computer-Aided Multiobjective Optimization.” IEEE Transactions on Systems, Manand Cybernetics, Part B 31, 537–56.
Van Veldhuizen, D. A., and G. B. Lamont. (2000). “Multiobjective Evolutionary Algorithms: Analyzingthe State-of-the-Art.” Evolutionary Computation 8, 125–47.
Wang, D., and T. Jiang. (1994). “On the Complexity of Multiple Sequence Alignment.” Journal of Com-putational Biology 1, 337–48.
Waterman, M. S. (1989). Mathematical Methods for DNA Sequences. Boca Raton, FL: CRC Press.Weber, J., and M.-P. Kwan. (2002). “Bringing Time Back In: A Study on the Influence of Travel Time
Variations and Facility Opening Hours on Individual Accessibility.” Professional Geographer 54,226–40.
Weber, J., and M.-P. Kwan. (2003). “Evaluating the Effects of Geographic Contexts on Individual Acces-sibility: A Multilevel Approach.” Urban Geography 24, 647–71.
Wesolowski, A., N. Eagle, A. J. Tatem, D. L. Smith, A. M. Noor, and R. W. Snow. (2012). “Quantifyingthe Impact of Human Mobility on Malaria.” Science 338, 267–70.
Wiehe, S. E., S. C. Hoch, G. C. Liu, A. E. Carroll, J. S. Wilson, and J. D. Fortenberry. (2008). “Adoles-cent Travel Patterns: Pilot Data Indicating Distance from Home Varies by Time of Day and Day ofWeek.” Journal of Adolescent Health 42, 418–20.
Wilson, C. (1998a). “Activity Pattern Analysis by Means of Sequence-Alignment Methods.” Environ-ment and Planning A 30, 1017–38.
Wilson, C. (1998b). “Analysis of Travel Behavior Using Sequence Alignment Methods.” TransportationResearch Record 1465, 52–9.
Wilson, C. (2001). “Activity Patterns of Canadian Women: An Application of ClustalG Sequence Align-ment Software.” Transportation Research Record 1777, 55–67.
Wilson, C. (2006). “Reliability of Sequence-Alignment Analysis of Social Processes: Monte Carlo Testsof ClustalG Software.” Environment and Planning A 38, 187–204.
Wilson, C., A. Harvey, and J. Thompson. (1999). “ClustalG: Software for Analysis of Activities andSequential Events.” Paper presented at the Workshop on Longitudinal Research in Social Science: ACanadian Focus, Windermere Manor, London, Ontario, Canada, 25–27 October 1999.
Xiao, N. (2006). “An Evolutionary Algorithm for Site Search Problems.” Geographical Analysis 38(3),227–47.
Xiao, N., and M. Armstrong. (2003). “A Specialized Island Model and Its Application in MultiobjectiveOptimization.” In Genetic and Evolutionary Computation—GECCO 2003, 1530–40, edited by E.Cantú-Paz, J. A. Foster, K. Deb, D. Lawrence, R. Roy, U.-M. O’Reilly, H.-C. Beyer, R. Standish,et al. Lecture Notes in Computer Science 2724. Berlin: Springer.
Xiao, N., D. A. Bennett, and M. Armstrong. (2002). “Using Evolutionary Algorithms to Generate Alter-natives for Multiobjective Site Search Problems.” Environment and Planning A 34(4), 639–56.
Xiao, N., D. A. Bennett, and M. P. Armstrong. (2007). “Interactive Evolutionary Approaches to Multiob-jective Spatial Decision Making: A Synthetic Review.” Computers, Environment and Urban Systems31, 232–52.
Zhang, C., and A. K. C. Wong. (1997). “A Genetic Algorithm for Multiple Molecular Sequence Align-ment.” Bioinformatics 13, 565–81.
Zhang, G., and D. Huang. (2004). “Aligning Multiple Protein Sequence by An Improved Genetic Algo-rithm.” Proceedings of the 2004 IEEE International Joint Conference on Neural Networks, 1179–83. doi 10.1109/IJCNN.2004.1381047.
Zhu, F. D., X. F. Yang, J. W. Han, and P. Yu. (2009). “Mining Frequent Approximate Sequential Pat-terns.” In Next Generation of Data Mining, 66–87, edited by H. Kargupta, J. W. Han, P. Yu, R.Motwani and V. Kumar. New York: CRC Press.
Geographical Analysis
320
Related Documents