ASPECTS OF CIRCUIT BREAKER P E R F O R M A N C E D U R I N G H I G H VOLTAGE SHUNT REACTOR SWITCHING By Ben Charles Giudici P.Eng. B.A. Sc. (Electrical Engineering) University of British Columbia A THESIS SUBMITTED IN PARTIAL FULFILLMENT OF THE REQUIREMENTS FOR THE DEGREE OF MASTER OF APPLIED SCIENCE in THE FACULTY OF GRADUATE STUDIES ELECTRICAL ENGINEERING We accept this thesis as conforming to the required standard THE UNIVERSITY OF BRITISH COLUMBIA March 1989 © Ben Charles Giudici P.Eng., 1989

Welcome message from author
This document is posted to help you gain knowledge. Please leave a comment to let me know what you think about it! Share it to your friends and learn new things together.
Transcript
A S P E C T S O F C I R C U I T B R E A K E R P E R F O R M A N C E D U R I N G H I G H
V O L T A G E S H U N T R E A C T O R S W I T C H I N G
By
Ben Charles Giudici P.Eng.
B .A. Sc. (Electrical Engineering) University of British Columbia
A THESIS SUBMITTED IN PARTIAL FULFILLMENT OF
THE REQUIREMENTS FOR THE DEGREE OF
MASTER OF APPLIED SCIENCE
in
THE FACULTY OF GRADUATE STUDIES
ELECTRICAL ENGINEERING
We accept this thesis as conforming
to the required standard
THE UNIVERSITY OF BRITISH COLUMBIA
March 1989
© Ben Charles Giudici P.Eng., 1989
In presenting this thesis in partial fulfilment of the requirements for an advanced degree at the University of British Columbia, I agree that the Library shall make it freely available for reference and study. I further agree that permission for extensive copying of this thesis for scholarly purposes may be granted by the head of my department or by his or her representatives. It is understood that copying or publication of this thesis for financial gain shall not be allowed without my written permission.
Department of eusc-reicAL. ^*<x^ i tQ&e.g-i >o<
The University of British Columbia Vancouver, Canada
DE-6 (2/88)
in presenting this thesis in partial fulfilment of the requirements for an advanced degree at the University of British Columbia, I agree that the Library shall make it freely available for reference and study. I further agree that permission for extensive copying of this thesis for scholarly purposes may be granted by the head of my department or by his or her representatives. It is understood that copying or publication of this thesis for financial gain shall not be allowed without my written permission.
Department of E L E C T S C A . L _ eNiaiMe&e.is-r^
The University of British Columbia Vancouver, Canada
Date A p R i i , 2.1 ; 1^8^
DE-6 (2/88)
A b s t r a c t
High voltage shunt reactor switching is a difficult circuit breaker duty. Severe reactor network
insulation stresses can occur on breaker current chopping and even more so on breaker reignition.
Predicting reactor switching transients is fundamental to assessing insulation concerns, and
evaluating circuit breaker performance.
This work demonstrates measurement of circuit breaker interruption characteristics relevant
to reactor switching, and their use in computer simulation of reactor switching transients. A
technique for predicting circuit breaker reactor switching performance through simulation is
also introduced and tested.
i i

Table of Contents
Abstract 1 1
List of Tables vii
List of Figures v »i
Acknowledgement x i i
1 Introduction to Shunt Reactor Switching 1
2 Essential Reactor Switching Theory 5
2.1 Arc Quenching and Current Chopping 5
2.1.1 Arc Dynamics and Instability 6
2.1.2 The Current Chopping Number 13
2.1.3 Current Chopping Overvoltages 14
2.2 Dielectric Reignition and Related Transients 18
2.2.1 Transient Recovery Voltage 19
2.2.2 Reignition Transients 20
2.2.3 Virtual Current Chopping 27
2.2.4 Multiple Reignitions and Suppression Peak Escalation 27
3 Switching Three Phase Reactor Networks 29
3.1 General Three Phase Reactor Load Side Oscillation 30
3.1.1 Three Single Phase Solidly Grounded Reactors 36
3.1.2 Single Tank Three Phase Solidly Grounded Reactors 38
3.1.3 Three Phase Reactor Networks With Neutral Reactor 39
iii
3.1.4 Ungrounded Y Connected Three Phase Reactors 39
3.1.5 Neutral Offset Due to Staggered Clearing of Phase Currents 40
3.2 Phase Interactions on Reignition 41
3.3 Predicting Three Phase Reactor Network Switching Transients 43
3.3.1 Considerations in Analytical Approaches 43
3.3.2 Computer Simulation Considerations 45
4 Breaker Characteristics Relevant to Reactor Switching 47
4.1 Contrasting Circuit Breaker Technologies 48
4.1.1 Oil Circuit Breakers 49
4.1.2 Air Blast Circuit Breakers 51
4.1.3 SF 6 Gas Circuit Breakers 56
4.2 Current Chopping and Recovery Voltage Withstand Characteristics 58
4.2.1 Measuring Current Chopping and Reignition Characteristics 60
5 Reactor Switching Field Tests 63
5.1 Nicola 5CB25 Testing 65
5.1.1 5CB25 Test Instrumentation 65
5.1.2 5CB25 Test Observations . . 66
5.1.3 Characterizing 5CB25 Performance of 5RX11 Switching 72
5.2 Nicola 5CB15 Testing 76
5.2.1 5CB15 Test Observations 77
5.2.2 Characterizing 5CB15 Performance During 5RX11 Switching 79
5.3 Nicola 5CB3 Testing 82
5.3.1 5CB3 Test Observations 83
5.3.2 Characterizing 5CB3 Performance During 5RX3 Switching 88
5.4 Nicola 5D44 Testing 89
5.4.1 5D44 Test Observations and Characteristics 90
iv
5.5 Switchgear Field Testing Summary 93
6 Simulating Reactor Switching to Predict Circuit Breaker Performance 96
6.1 A Method for Predicting Breaker Performance During Reactor Interruption . . . 96
6.2 Modelling for Current Chopping and Load Side Oscillation Simulation 99
6.2.1 Three Phase Grounded Reactor (5RX11) Modelling for Load Side Oscil
lation Study 99
6.2.2 Buss Representation for Load Side Oscillation Study 101
6.2.3 Source Representation for Load Side Oscillation Simulation 102
6.3 Modelling for Reignition Simulation 104
6.3.1 High Frequency Load Bus Modelling 106
6.3.2 High Frequency Reactor Modelling 106
6.3.3 High Frequency Distributed Source Representations 108
6.4 Verification of Breaker Performance Prediction for Three Phase Grounded Re
actor Switching 109
6.4.1 5CB25 Test 5 Reconstruction 109
6.4.2 Considering 5CB25 Test 5 C Phase Reignition 113
6.4.3 5CB25 Test 4 Reconstruction 117
6.4.4 5CB15 Test 4 Reconstruction 122
6.4.5 Considering 5CB15 Test 4 B Phase Reignition 129 /
6.5 Predicting Four Reactor Scheme Switching Performance . 130
6.5.1 Considering 5RX3 Load Side Oscillations 130
6.5.2 5CB3 Test 11 Reconstruction 134
6.5.3 Considering 5CB3 Test 11 A Phase Reignition 138
7 Conclusions 140
7.1 Possible Avenues for Further Research 142
Appendices 143
v
A Arc Thermal Time Constant and Equivalent Circuits 143
A.l Exponential Response on Arc Perturbation 143
A.2 Arc Equivalent Circuits 144
A.2.1 Parallel Arc Equivalent Network 145
A.2.2 Series Arc Equivalent Network 147
B Reactor Load Side Oscillation Following Current Chopping 149
C Analysis of Reignition Oscillations 154
C.l The Second Parallel Oscillation 154
C.2 The Main Circuit Oscillation 160
D Effects of Introducing a Neutral (Grounding) Reactor 167
E Effects of Introducing an Opening Resistor 170
E.l Reduction and Phase Shifting of Network Voltage 170
E.2 Reduced Chopping Levels Through Increased Stability 176
Bibliography 179
vi
Lis t of Tables
4.1 Single Interrupter Chopping Numbers for Various Breakers 58
5.2 Contrasting Air Blast Breaker Current Chopping Measurements 94
vii
L i s t o f F igures
1.1 Common Shunt Reactor Configurations 3
2.2 Arc Conductivity as a Function of Temperature [7] 7
2.3 Arc Instability Leading to Current Chopping 8
2.4 Static Arc Characteristic With Static and Dynamic Resistances 9
2.5 Arc Equivalent Networks for Small Current Perturbations 10
2.6 Circuits for Study of Arc Interaction with the Network 11
2.7 Load Side Oscillation in Figure 2.9 Network for 20 A Chopped Current 16
2.8 Breaker TRV for the Load Side Oscillation Above 16
2.9 Circuit for Analysis of Load Side Oscillation on Current Chopping 17
2.10 Circuits for Study of Reignition Oscillations 21
2.11 Oscillation Voltages for 850 kV Reignition 26
2.12 Oscillation Currents for 850 kV Reignition 26
3.13 Three Phase Reactor Load Side Oscillation with Light Capacitive Coupling . . . 31
3.14 General Three Phase Reactor Network 31
3.15 Referred Mutual Equivalent Three Phase Reactor Network 33
3.16 Solidly Grounded Equivalent Three Phase Reactor Network 33
3.17 Neutral Voltage Offset on Staggered Phase Interruption 42
4.18 Electrical Breakdown Strength of Common Interrupting Media 49
4.19 Thermal Conductivities of Arc Quenching Gases 50
4.20 Interruption at 20 A Current Chopping with 5 kQ. Opening Resistor 54
4.21 Interruption at 20 A Current Chopping with No Opening Resistor 54
4.22 Breaker TRV for 20 A Chopping Interruptions with Various Opening Resistors . 55
viii
5.23 Nicola Substation Operating One Line Diagram 64
5.24 Nicola 5CB5 Testing Control and Timing Diagram 66
5.25 5CB25 Test Trip No. 1 68
5.26 Nicola 5CB25/5RX11 Network Elevation Diagram 69
5.27 5CB25 Test Trip No.2 70
5.28 5CB25 Test Trip No. 24 71
5.29 5CB25 Resistor Switch Arcing Characteristic 72
5.30 5CB25 Test Trip No. 4 74
5.31 5CB25 Resistor Switch Current Chopping Characteristic 75
5.32 5CB25 Resistor Switch Reignition Characteristic 75
5.33 5CB15 Typical Test Interruption 78
5.34 5CB15 Arcing Characteristic 80
5.35 5CB15 Current Chopping Characteristic 80
5.36 5CB15 Reignition Characteristic 81
5.37 5CB3 Test Trip No. 4 84
5.38 5CB3 Test Trip No. 7 85
5.39 5CB3 Arcing Characteristic 86
5.40 5CB3 Current Chopping Characteristic . 86
5.41 5CB3 Reignition Characteristic 87
5.42 5D44 Arcing Characteristic Prior to Modification 90
5.43 5D44 Typical Test Interruption . 91
5.44 5D44 Test Interruption with Recovery Voltage Reignition 91
5.45 5D44 Arcing Characteristic After Modification 92
5.46 5D44 Reignition Characteristic After Modification 93
6.47 5RX11 Load Side Oscillation Model 99
6.48 Load Side Bus Model Geometry 100
6.49 5CB25 Test 5: C Phase Load Side Oscillation Field Record 102
ix
6.50 5CB25 Test 5: C Phase Balanced Bus Simulation 103
6.51 5CB25 Test 5: C Phase Flat Line Bus Simulation 103
6.52 5CB25 Test 5: C Phase Six Phase Flat Line Bus Simulation 104
6.53 Complete 5RX11 Network Load Side Oscillation Model 105
6.54 5RX11 Distributed High Frequency Model 106
6.55 Distributed High Frequency Substation Source Model 107
6.56 5CB25 Test 5 Reconstruction: Estimating Current Chopping 110
6.57 5CB25 Test 5 Reconstruction: Predicting Reignition 110
6.58 5CB25 Test 5 Reconstruction: Simulated Voltages Il l
6.59 5CB25 Test 5 Reconstruction: Simulated Currents Il l
6.60 5CB25 Test 5 C Phase Reignition - Lumped Source Simulated Voltages 114
6.61 5CB25 Test 5 C Phase Reignition - Lumped Source Simulated Currents 114
6.62 5CB25 Test 5 C Phase Reignition - Simulated 5RX11 and 5CVT25 Voltages . . 115
6.63 5CB25 Test 5 C Phase Reignition - Distributed Source Simulated Voltages . . . 116
6.64 5CB25 Test 5 C Phase Reignition - Distributed Source Simulated Currents . . . 116
6.65 5CB25 Test 4 Reconstruction: Estimating Current Chopping 118
6.66 5CB25 Test 4 Reconstruction: Predicting Reignition 118
6.67 5CB25 Test 4 Reconstruction: Simulated A Phase Voltage 119
6.68 5CB25 Test 4 Reconstruction: Simulated B Phase Voltage 119
6.69 5CB25 Test 4 Reconstruction: Simulated C Phase Voltage 120
6.70 5CB25 Test 4 Reconstruction: Simulated Currents 120
6.71 5CB15 Test 4 Reconstruction: Estimating Current Chopping 123
6.72 5CB15 Test 4 Reconstruction: Predicting Reignition 123
6.73 5CB15 Test 4 Reconstruction: Simulated Voltages 126
6.74 5CB15 Test 4 Reconstruction: Simulated Currents 126
6.75 5CB15 Test 4 B Phase Reignition: Simulated Voltages 128
6.76 5CB15 Test 4 B Phase Reignition: Simulated Currents 128
x
6.77 5RX3 Load Side Oscillation Model . 129
6.78 5CB3 Test 4 Load Side Oscillation: Simulated A Phase Voltage 131
6.79 5CB3 Test 4 Load Side Oscillation: Simulated B Phase Voltage 131
6.80 5CB3 Test 4 Load Side Oscillation: Simulated C Phase Voltage 132
6.81 5RX3 Test 4: Simulated Breaker TRV with 5NR3 in and Bypassed 132
6.82 5CB3 Test 11: A Phase Interruption - Field Record 133
6.83 5CB3 Test 11 Reconstruction: Estimating Current Chopping 135
6.84 5CB3 Test 11 Reconstruction: Predicting Reignition 135
6.85 5CB3 Test 11 Reconstruction: Simulated Voltages 137
6.86 5CB3 Test 11 Reconstruction: Simulated Currents 137
6.87 5RX3 Distributed High Frequency Model 138
6.88 5CB3 Test 11 A Phase Reignition: Simulated Reactor Voltage 139
A.89 Response of Arc Equivalent Circuits to a Current Step 146
C. 90 Networks for Analysis of Reignition Oscillations 155
D. 91 Four Reactor Network and its Solidly Grounded Equivalent 168
E. 92 Single Phase Reactor Switching with an Opening Resistor 171
E.93 5000 Q, Opening Resistor Interruption with 20 A Current Chopping 172
E.94 Breaker TRV for 20 Current Chopping Interruptions with Various Opening Re
sistors 173
E.95 Effects of an Opening Resistor on Arc Stability 177
xi
Acknowledgement
The author gratefully acknowledges the guidance of Dr. H .W. Dommel, Dr . L . M . Wedepohl,
and Dr. J .R. Mart i of the Department of Electrical Engineering of the University of British
Columbia in preparing this thesis.
Special thanks are also due Messr's D .F . Peelo, B . L . Avent, J . H . Sawada, and J . K . Drakos
of B.C.Hydro for their assistance, and to N S E R C for their financial support.
xi i
C h a p t e r 1
I n t r o d u c t i o n to Shunt Reac to r S w i t c h i n g
Operation of extra high voltage transmission systems during light load periods gives rise to an
excess of reactive power since circuits will typically be operating well below surge impedance
loading. Reactive power generated by distributed line capacitances exceed that absorbed by dis
tributed series inductances, and system voltages tend to rise. Voltage control requires reactive
power absorption from the network or reduced reactive power production. Heavy loading con
ditions in contrast, require increased reactive power production to balance a tendency toward
reduced system voltage levels.
A combination of various equipment and operating methods are used in modern power
systems to achieve acceptable voltage profiles during the wide reactive power swings which
occur with a normal range of loading conditions. These could include,
• Operation of generators as synchronous condensers during light loads
• Application of dedicated synchronous condensers
• Power transformer on load tap changer operations
• Switching shunt reactor or capacitor banks
• Removal of lightly loaded transmission circuits from service
• Static var compensators
The exact approaches applied depend as much on utility planning and operating philosophy as
the nature of the load characteristics. B. C. Hydro, at the time of writing, uses all the above
techniques except static var compensation.
1
Chapter 1. Introduction to Shunt Reactor Switching 2
In recent years, shunt reactors have become progressively more important in the control of
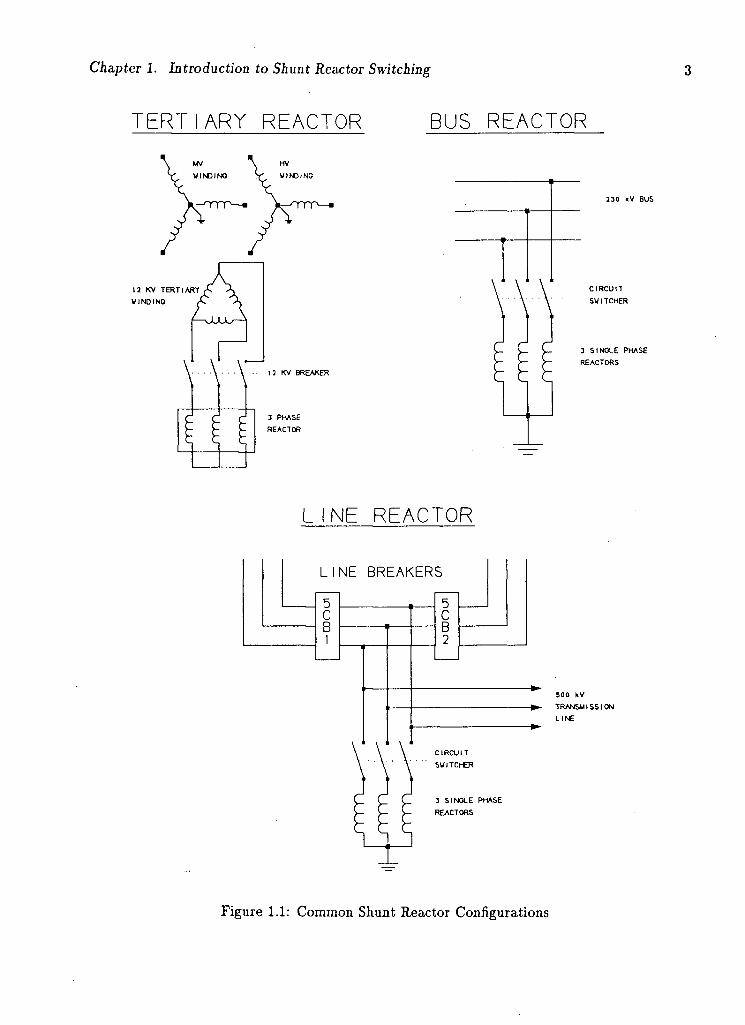
B.C.Hydro's 500 kV system voltage levels. Typically, shunt reactor schemes are bus connected
at one or both line terminations to compensate 60 - 65% of the associated distributed circuit
shunt capacitance. Reactors are sometimes connected to the transmission network indirectly
via medium voltage or tertiary windings of 500 kV/230 kV power transformers as shown in
figure 1.1 where typical power system shunt reactor configurations are depicted.
Where frequent transmission connected reactor switching is anticipated, dedicated break
ers allow switching without forcing the associated line out of service. Such devices need only
be capable of interrupting normal reactor current as reactor faults are cleared by the circuit
breakers in the line position. Where dedicated reactor breakers are not provided, the associ
ated transmission line is commonly removed from service during light load conditions and line
reactors switched into or out of service using a single line breaker. Line breakers and dedicated
reactor breakers (if applied) must be capable of interrupting normal reactor currents which are
typically below 200 A.
Interruption of-small inductive currents can impose a severe breaker duty even though full
rated interrupting current can be more than 100 times larger. Shunt reactor and unloaded
transformer switching are examples of small inductive current interruption frequently encoun
tered in the course of power system operation. Transmission line connected shunt reactors may
be switched as often as several times a day in the normal course of voltage control and this
duty must be given careful consideration when specifying breakers for such applications.
Due to an effect called current chopping, reactor breakers can force inductive load currents
to zero in advance of a power frequency zero crossing. An oscillation develops in the interrupted
network at 10-100 times above system frequency, during which overvoltages well in excess of 2
p.u. can develop with respect to ground or between phases. Further, due to the high network
oscillation frequency, a rapidly rising recovery voltage develops across the opening breaker
contacts. Should the opening interrupter withstand voltage be exceeded, abrupt arc current
reignition will occur, generating high frequency transients. Reignition transients can not only
Chapter 1. Introduction to Shunt Reactor Switching
TERTIARY REACTOR BUS REACTOR HV
12 KV TERTIARY VINDINO
I 1 KV BREAKER
3 PHASE REACTOR
230 KV BUS
CIRCUIT SWITCHER
3 SINGLE PHASE REACTORS
LINE REACTOR
L INE BREAKERS
CIRCUIT SWITCHER
3 SINGLE PHASE REACTORS
500 kV TRANSMISSION LINE
Figure 1.1: Common Shunt Reactor Configurations
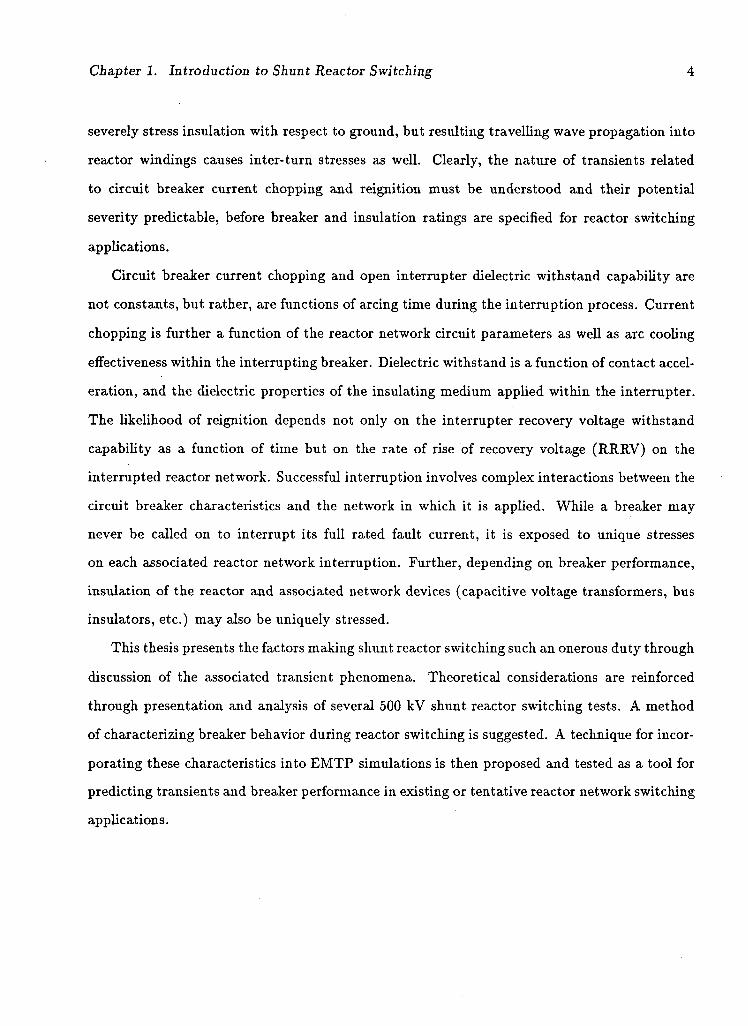
Chapter 1. Introduction to Shunt Reactor Switching 4
severely stress insulation with respect to ground, but resulting travelling wave propagation into
reactor windings causes inter-turn stresses as well. Clearly, the nature of transients related
to circuit breaker current chopping and reignition must be understood and their potential
severity predictable, before breaker and insulation ratings are specified for reactor switching
applications.
Circuit breaker current chopping and open interrupter dielectric withstand capability are
not constants, but rather, are functions of arcing time during the interruption process. Current
chopping is further a function of the reactor network circuit parameters as well as arc cooling
effectiveness within the interrupting breaker. Dielectric withstand is a function of contact accel
eration, and the dielectric properties of the insulating medium applied within the interrupter.
The likelihood of reignition depends not only on the interrupter recovery voltage withstand
capability as a function of time but on the rate of rise of recovery voltage ( R R R V ) on the
interrupted reactor network. Successful interruption involves complex interactions between the
circuit breaker characteristics and the network in which it is applied. While a breaker may
never be called on to interrupt its full rated fault current, it is exposed to unique stresses
on each associated reactor network interruption. Further, depending on breaker performance,
insulation of the reactor and associated network devices (capacitive voltage transformers, bus
insulators, etc.) may also be uniquely stressed.
This thesis presents the factors making shunt reactor switching such an onerous duty through
discussion of the associated transient phenomena. Theoretical considerations are reinforced
through presentation and analysis of several 500 k V shunt reactor switching tests. A method
of characterizing breaker behavior during reactor switching is suggested. A technique for incor
porating these characteristics into E M T P simulations is then proposed and tested as a tool for
predicting transients and breaker performance in existing or tentative reactor network switching
applications.
Chapter 2
Essential Reactor Switching Theory
This chapter introduces the transient phenomena which make reactor interruption a unique
switching duty. Concepts are presented initially with reference to the single phase case. Addi
tional considerations in switching practical three phase reactor networks are addressed in the
following chapter.
Interruption of an AC current ideally takes place at a natural current zero. Practical circuit
breakers rarely behave this way when interrupting small inductive currents. Large voltages de
veloped following interruption can result in abrupt restoration of current flow if opening breaker
contacts cannot withstand dielectric stresses. As a result, conduction frequently continues be
yond the initial current zeroes following contact separation. Reactor network interruption typ
ically produces unique transient overvoltages which cannot be neglected in assessing insulation
requirements.
2.1 Arc Quenching and Current Chopping
Excepting semiconductor devices, all circuit breakers and switches in practical use work with
some type of gas discharge following contact separation. Current continues to flow in a conduct
ing gas between the open contacts in the form of an arc, until quenched by some interrupting
mechanism. Electrical conductivity of the gas is maintained by thermal ionization, where arc
temperatures in the order of 10,000 ° K cause the gas to behave as a conducting plasma [24],[7].
Voltage dropped across the arc inputs power, tending to support high plasma temperatures.
As the current approaches a natural zero crossing, arc diameter shrinks as current density re
mains approximately constant. Due to thermal inertia, the arc cannot cool instantaneously,
5
Chapter 2. Essential Reactor Switching Theory 6
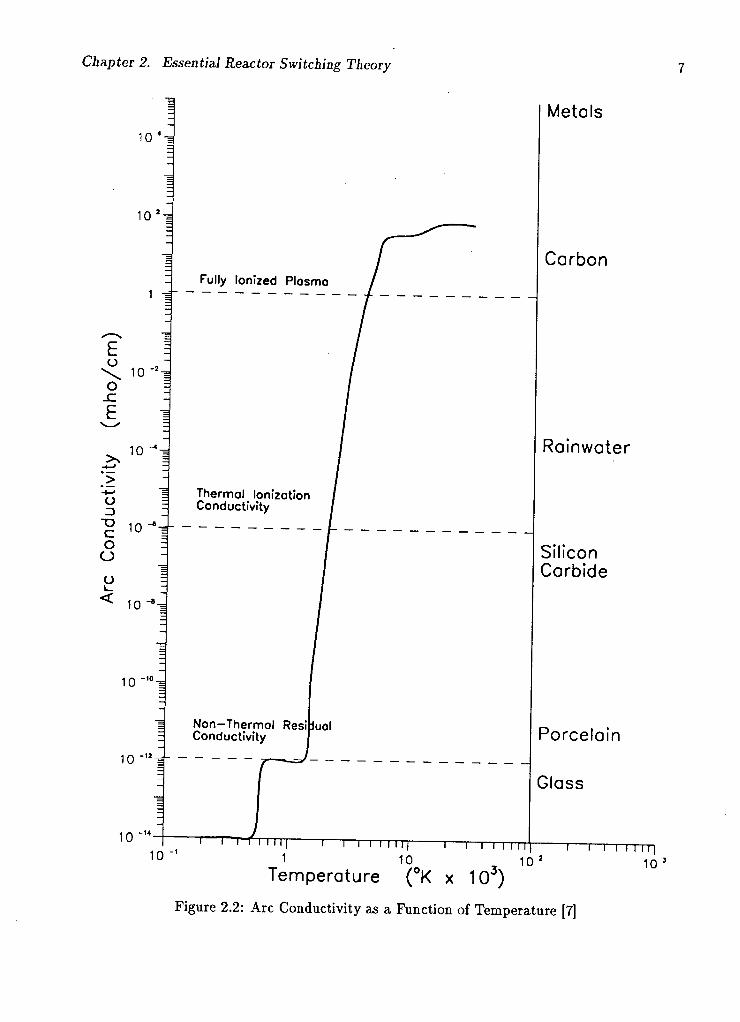
and a channel of hot conducting gas remains for a time following the current zero. Figure 2.2
shows typical arc conductivity as a function of temperature. If arc temperature remains high
enough, arc conductivity will be sufficiently high for voltage across the open contacts to initiate
a new half cycle of arc current. This is referred to as thermal reignition and leads to a smooth
re-instatement of conduction. If cooled to below 2000 ° K , the arc behaves as an insulator,
preventing further conduction beyond the natural current zero.
Circuit breakers are frequently able to force arc current to zero in advance of a natural zero
crossing through an effect called current chopping. The degree of current chopping during any
particular interruption depends heavily on the breaker arc cooling mechanism, as well as the
nature of the network being switched. Current chopping levels have an important influence
on reactor network overvoltages and the transient recovery voltage (TRV) opening breaker
contacts must withstand for successful interruption. Current chopping is the result of unstable
interactions between the arc and the network external to the circuit breaker. Arc cooling
mechanisms specific to various breaker types influence the onset of instability by controlling the
rate at which, and the degree to which arc plasma conductivity is reduced during an attempted
interruption.
2.1.1 A r c D y n a m i c s and Ins t ab i l i t y
During successful interruption, an arc is rapidly transformed from a good conductor to a good
insulator through virulent cooling. As the arc is cooled, abrupt changes in conductivity occur,
causing current oscillations due to arc interactions with the network being interrupted. If
arc cooling is sufficiently intense, oscillations can become unstable, producing high frequency
current zeroes in advance of a natural zero. Interruption can occur at such a zero essentially
forcing or chopping the power frequency current to zero prematurely. This effect is depicted in
figure 2.3. Interactions between an electric arc, arc cooling mechanisms, and the network being
interrupted leading to current chopping through arc instability have been studied in detail by
Rizk [23],[22],[24]. His work led to a better understanding of arc and circuit breaker phenomena
Chapter 2. Essential Reactor Switching Theory
Metals
1 0 4 -
1 0 2 i
Carbon
1 "1 Fully Ionized Plosmo
\ 10 "2 =
o = -C -
1 Rainwater
~o 1 13 Z
"g 10--g
o =
o -
U z
< 10
Thermal Ionization / Conductivity /
Si l icon Carb ide
10 -"-z
1 Non-Thermal Residual Conductivity j Porce la in
10
-= Glass
10 - 1 4 - -> i i i i i 111 i i l l 1 111 1 1 1 I I I 11] i i i i 1111 (
1 1 1 - 1 1 1 "I I I I I I I I M 1—r I I I I n \ r-1 10 10 2
Temperature ( °K x 10 )
Figure 2.2: Arc Conductivity as a Function of Temperature [7]
Chapter 2. Essential Reactor Switching Theory 8
10-
Instobility Current 28.6 Amps
7.00 n — i — i — i — i — i — i — i — i — | — i — n — i — i — i — i — i — r
Chopping Current 27 Amp*
60 Hz Zero
i—i—i—i—i—r 7.50 8.00 Time After Natural Zero (ms)
8.50
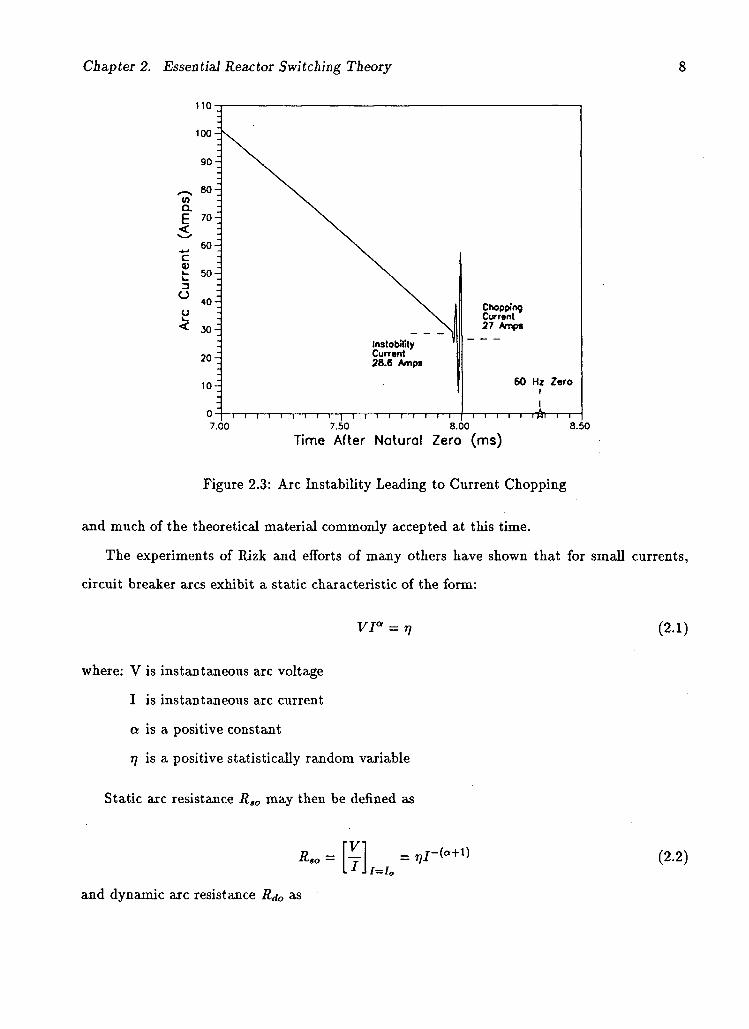
Figure 2.3: Arc Instability Leading to Current Chopping
and much of the theoretical material commonly accepted at this time.
The experiments of Rizk and efforts of many others have shown that for small currents,
circuit breaker arcs exhibit a static characteristic of the form:
vr = n
where: V is instantaneous arc voltage
I is instantaneous arc current
a is a positive constant
77 is a positive statistically random variable
Static arc resistance Rso may then be defined as
(2.1)
I=Io (2.2)
and dynamic arc resistance RdQ as
Chapter 2. Essential Reactor Switching Theory 9
6.0
> 4.0 -
o I 2.0
a = 1.0 T? = 10,000 Stotic Resistance R«, Dynamic Resistance R,JO=-aR» Static Characteristic
•1.2
0.8
-0.4
0.0 i i i i i i i i i | i i i i i i i i i i i i i i i i i i i i i i i i i i i i i | i i i i i i i i i 1.2
•0.0
-0.4
w E XL
o o c o or o < -0.8
10 20 30 40 Arc Current (Amps)
50
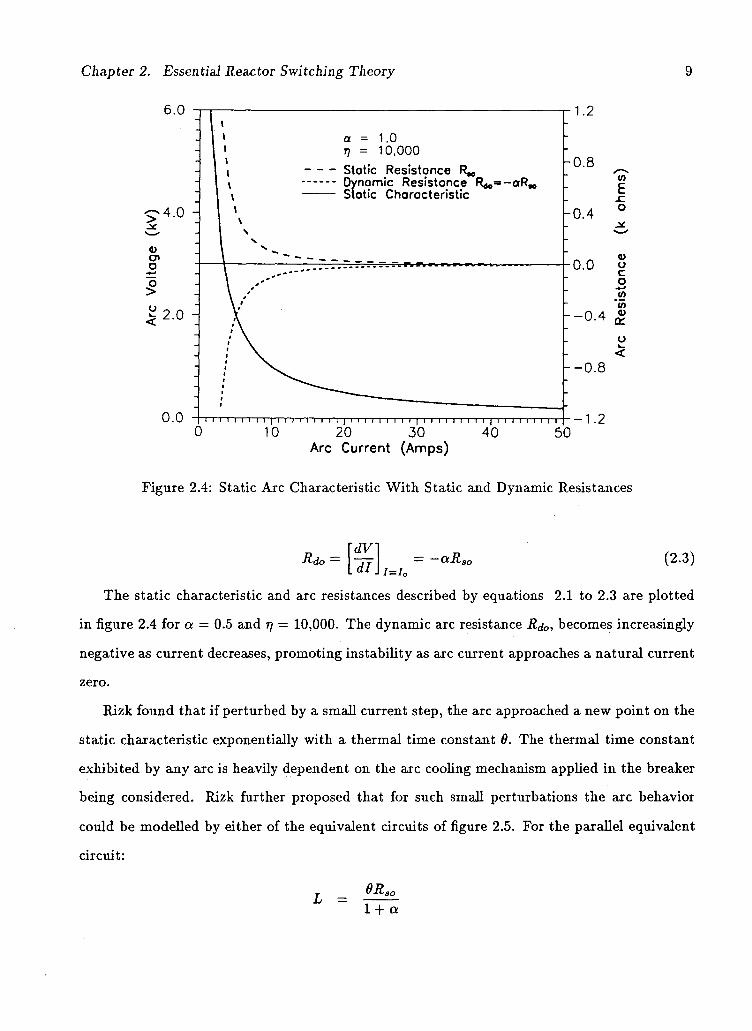
Figure 2.4: Static Arc Characteristic With Static and Dynamic Resistances
Rdo — dV dl
= -ctR. (2.3)
The static characteristic and arc resistances described by equations 2.1 to 2.3 are plotted
in figure 2.4 for a = 0.5 and n = 10,000. The dynamic arc resistance RjQ, becomes increasingly
negative as current decreases, promoting instability as arc current approaches a natural current
zero.
Rizk found that if perturbed by a small current step, the arc approached a new point on the
static characteristic exponentially with a thermal time constant 9. The thermal time constant
exhibited by any arc is heavily dependent on the arc cooling mechanism applied in the breaker
being considered. Rizk further proposed that for such small perturbations the arc behavior
could be modelled by either of the equivalent circuits of figure 2.5. For the parallel equivalent
circuit:
9Rso L = 1 + a
Chapter 2. Essential Reactor Switching Theory
P A R A L L E L EQUIVALENT S ER I E S EQUIVALENT
10
R r - ° R s o 1 t a
L = OR.
t t a (I ta]R so
-otR,
><1 ta)0R.
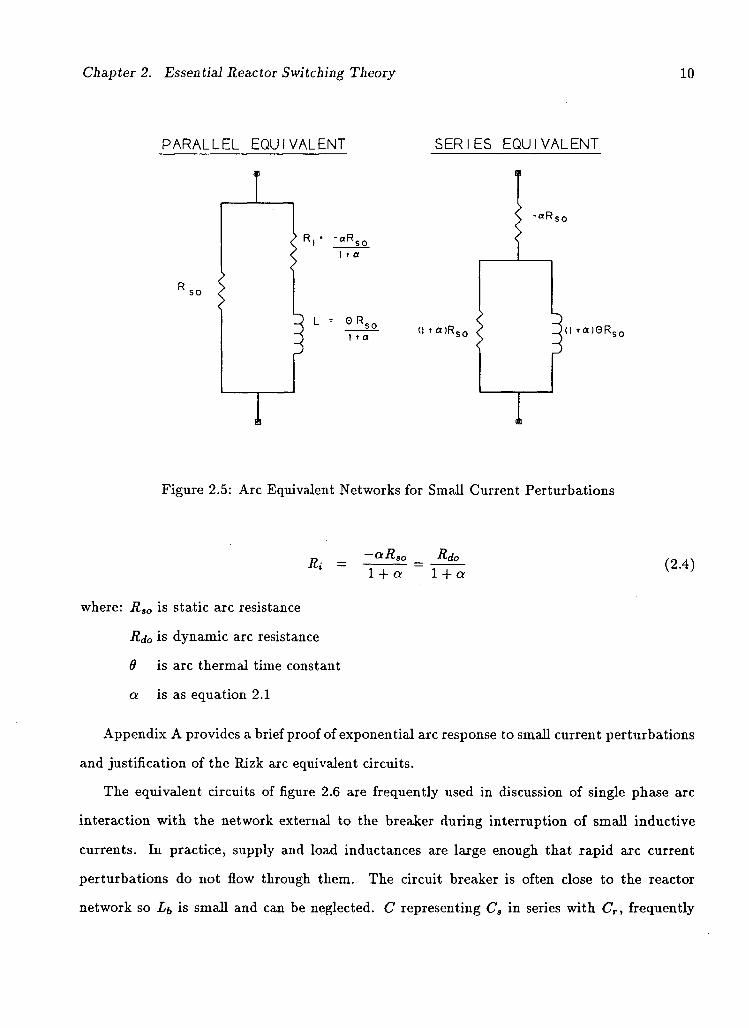
Figure 2.5: Arc Equivalent Networks for Small Current Perturbations
aR. Rdo 1 + a 1 + a
(2.4)
where: Rso is static arc resistance
Rdo is dynamic arc resistance
0 is arc thermal time constant
a is as equation 2.1
Appendix A provides a brief proof of exponential arc response to small current perturbations
and justification of the Rizk arc equivalent circuits.
The equivalent circuits of figure 2.6 are frequently used in discussion of single phase arc
interaction with the network external to the breaker during interruption of small inductive
currents. In practice, supply and load inductances are large enough that rapid arc current
perturbations do not flow through them. The circuit breaker is often close to the reactor
network so Lb is small and can be neglected. C representing C3 in series with Cr, frequently
Chapter 2. Essential Reactor Switching Theory 11
SOURCE NETWORK
ARC
-'N/VS -R so -3 Lb
| L m n r L
t >
REACTOR NETWORK
ARC RESPONSE TO A PERTURBING CURRENT STEP
K O = i t-o r © — ^ - L • 0R.
so 1 t a
R i " "aRso
c • c s c r
e(t)
^SOURCE AND REACTOR INDUCTANCES ARE LARGE AND APPEAR AS OPEN CIRCUITS TO THE PERTURBING CURRENT STEP.
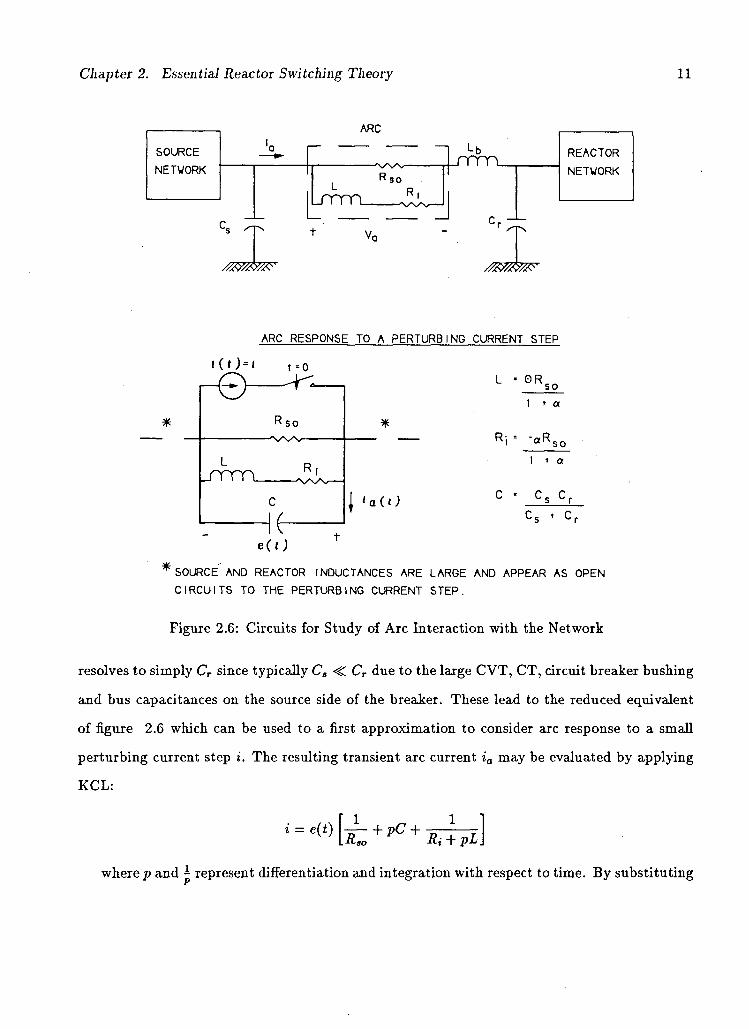
Figure 2.6: Circuits for Study of Arc Interaction with the Network
resolves to simply CT since typically C„ <C Cr due to the large C V T , C T , circuit breaker bushing
and bus capacitances on the source side of the breaker. These lead to the reduced equivalent
of figure 2.6 which can be used to a first approximation to consider arc response to a small
perturbing current step i. The resulting transient arc current ia may be evaluated by applying
K C L :
e(t) LRso Ri + pL.
where p and 1 represent differentiation and integration with respect to time. B y substituting

Chapter 2. Essential Reactor Switching Theory 12
e(t) = gr and noting pi = 0, the arc current is given by
1 d 2ia dia
~W ~dt 2i + L RaoC
Rso + Rj _ g RsoLC
(2.5)
Assuming solutions of the form ia = Ke X t yields a characteristic equation with a pair of
complex conjugate roots for u% > j3 2. The solution of equation 2.5 then has the following
general form:
*'o(0 = I0e~fit[co8udt + <t>] (2.6)
= \Ju2 - /?2
" = 2 Ri 1 - r + L RsoC
Rso + Ri RsoLC
where: is damped natural frequency
u>o is natural frequency
P is the damping coefficient
Ia and (j> are determined by initial conditions at the
time of perturbation
Arc current oscillations become unstable if damping coefficient f3 < 0. That is:
— + 1 < 0 L RaoC ~
Substituting the Rizk equivalents of equation 2.4 this reduces to:
(2.7)
1 Rso
Rdo l 9 C
< 0 (2.8)
Chapter 2. Essential Reactor Switching Theory 13
9 < -RdoC
< RaoCa
Can ra+l
Arc instability is hence more likely as a current zero approaches and R d 0 grows increasing
negative. Note that since R d 0 becomes increasingly negative as a current zero approaches, /?
progressively decreases so that u\ > /32 will eventually hold. It is thus perfectly justified to
have assumed complex conjugate roots for equation 2.5. Rizk [24] observed that thermal time
constant was about 100 times smaller for arcs cooled by an air blast than free burning arcs
of similar magnitude. Hence where forced arc cooling mechanisms are applied, the instability
threshold described by equation 2.8 will be brought on by the combined effects of:
• reduced time constant 6 through increased cooling
• larger negative dynamic arc resistance Rdo as current decreases towards a natural zero.
At the stability threshold f3 = 0, oscillation frequency is simply:
and the arc behaves like a pure inductance. Instability frequencies as high as 105 kHz were
measured in the air blast breaker experiments of Gardner and Irwin [9]. If the circuit breaker is
able to interrupt at a high frequency current zero produced by unstable arc oscillations, power
frequency current will appear to have been chopped prematurely to zero.
2 . 1 . 2 T h e C u r r e n t C h o p p i n g N u m b e r
From the arc instability leading to current chopping depicted in figure 2.3, the current at onset
of instability i,-, is not exactly the same as the apparently chopped current ich since a finite
time is required for high frequency current zeroes to develop from the instability. Published
(2.9)
Chapter 2. Essential Reactor Switching Theory 14
test results suggest i; — ich is not normally large. Gardner and Irwin [9] for example found
the ratio ^ ranged from 1.0 to 1.4 for widely varied inductive networks switched with an air
blast breaker. It is generally accepted [1] that errors are small in assuming ich « z,-. Chopping
current can then be predicted from equation 2.8 re-arranged to give current at the onset of arc
instability:
ich 'Can' (2.10)
n = 1/(1 +a)
Experimental work supports a close proportionality between ich and the square root of
apparent network capacitance C for oil, air blast and SFg circuit breakers [1],[17],[14]. This
corresponds to equation 2.10 for the case a = 1.0 yielding a constant power static arc charac
teristic. A constant of proportionality, Ac/, called the chopping number, may then be used to
describe the current chopping behavior of a device during a particular interruption as:
ich = Kh&l 2 (2.11)
Kh =
Circuit breaker chopping number depends on arcing time and is normally distributed in
switching experiments where arcing time is held constant. These effects are due to the in
fluence of arcing time on arc cooling intensity and the statistically random behavior of static
arc characteristics between switching operations represented by the random variable t] in equa
tion 2.1.
2.1.3 C u r r e n t C h o p p i n g Overvol tages
Current chopping during interruption of small inductive currents triggers a load side oscillation
as magnetic energy stored at the moment of chopping is released into the reactor network. The
Chapter 2. Essential Reactor Switching Theory 15
first and possibly several successive voltage peaks can be well in excess of 1.0 pu and must be
considered in assessing insulation concerns. Load network parameters influence the oscillation
frequency typically ranging from 0.5 - 10.0 kHz. For the purposes of predicting load side
overvoltages, it is usually sufficiently accurate to assume current chopping occurs as an abrupt
step.
Figure 2.7 shows an example reactor load side oscillation following 20 A current chopping
in advance of a natural zero for the network of figure 2.9. The initial overvoltage peak is
called the suppression peak and always has the same polarity as load voltage at the instant just
prior to chopping. The second is of opposite polarity and is called the recovery peak. Voltage
across the open breaker contacts during interruption is called the breaker transient recovery
voltage (TRV), and will normally be maximum at the recovery peak for single phase and solidly
grounded three phase reactors.
Load side oscillation following reactor interruption is controlled by the chopping current ich,
and the values of reactor network elements. The network of figure 2.9 may be used to study the
load side oscillation following current chopping for a single phase reactor. Analysis outlined in
Appendix B gives load side voltage after current chopping as:
V(t) 'COs((x^ — 1p) (2.12)
m
0L i r RiR2 i 2 [(R1-rR2)L C(Ri + R2)\
Chapter 2. Essential Reactor Switching Theory 16
800
O - 6 0 0 -
Suppression Peok
Recovery Peok
Ct ~800 | i i i i i i i i i | i i i i i i i i i | i i i i i i i i i | i i i i i i i i i | i i I I i i i i i | i i i i i i i i i 0 2 4 6 8 10 12
Time After Contoct Separation (ms)
Figure 2.7: Load Side Oscillation in Figure 2.9 Network for 20 A Chopped Current
1200 •
> > or
o V
CD
800 -
400 -
-400-
Recovery Peok TRV
Suppression Peok TRV
800 I i i I I I I I I I | I I I I I I I I I | I I I i i I I I I | I I I I I I I I I | I I I I I I I I I | I I I I I I I I I 0 2 4 6 8 10 12
Time After Contact Separation (ms)
Figure 2.8: Breaker TRV for the Load Side Oscillation Above
Chapter 2. Essential Reactor Switching Theory 17
r—TrrcL t =0 ( t ) 1(0) = i c h
V 0 s inc j s t 6 V(t) c L R-
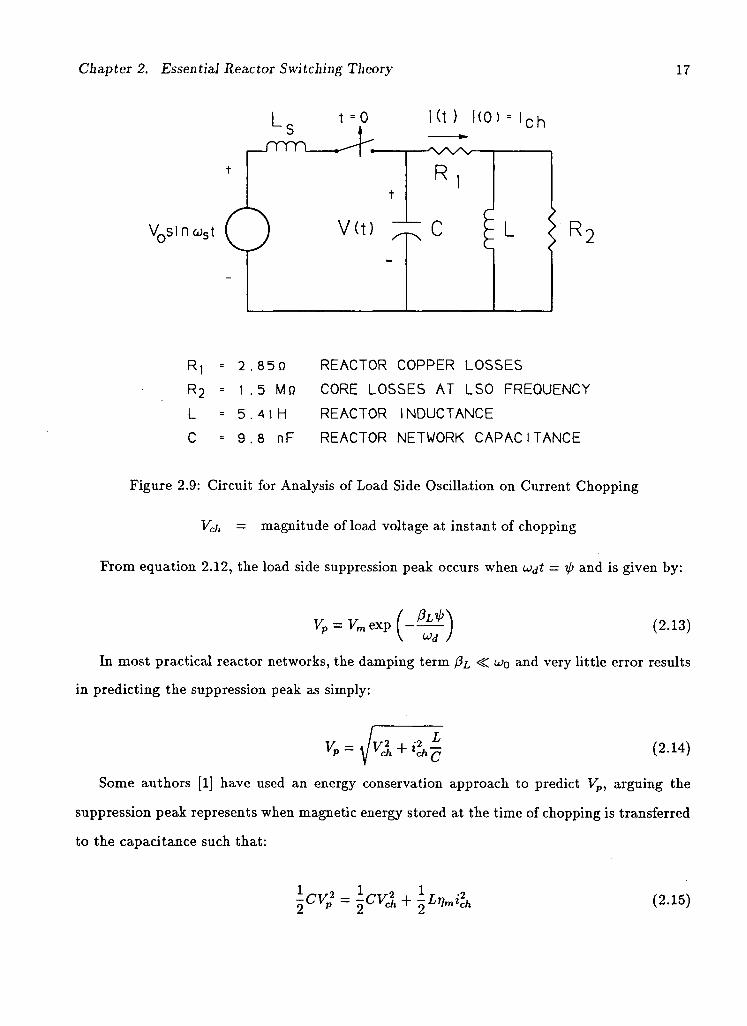
R, = 2.850 REACTOR COPPER LOSSES R 2 = 1 .5 MO CORE LOSSES AT LS0 FREQUENCY L = 5.41H REACTOR INDUCTANCE C - 9.8 nF REACTOR NETWORK CAPAC ITANCE
Figure 2.9: Circuit for Analysis of Load Side Oscillation on Current Chopping
Vch — magnitude of load voltage at instant of chopping
From equation 2.12, the load side suppression peak occurs when u^t = ip and is given by:
Vp = Vm exp (2.13)
In most practical reactor networks, the damping term fij, <C wo and very little error results
in predicting the suppression peak as simply:
(2.14) rP — M *ch< chg
Some authors [1] have used an energy conservation approach to predict Vp, arguing the
suppression peak represents when magnetic energy stored at the time of chopping is transferred
to the capacitance such that:
(2.15)
Chapter 2. Essential Reactor Switching Theory 18
Magnetic efficiency nm accounts for energy losses in the inductor core. The frequency
dependent resistance R2 in figure 2.9 representing core losses is large for shunt reactors so
nm « 1.0. This is equivalent to neglecting damping and yields the same result as equation
2.14 using network analysis. A further simplification is often imposed by assuming Vch « Va
(system peak voltage) since current chopping normally takes place near a load current zero.
Then a per unit suppression peak overvoltage factor may be defined from equation 2.15 as
follows:
Taking advantage of equation 2.11, equation 2.16 can be expressed in terms of the chopping
number if known:
Little error results from assuming Vch ~ Va over a reasonably large range of chopping cur
rents. A difficulty in applying equations 2.13 or 2.16 is that R2 and hence nm are frequency
dependent [25] and must usually be determined from a switching test where /?£, may be mea
sured.
2.2 D ie l ec t r i c R e i g n i t i o n and Re la t ed Transients
At the onset of load side oscillation, opening breaker contacts are stressed by the difference
between load side and system voltages. If recovery voltage exceeds the withstand capability of
the opening contacts, the arc will abruptly reignite and conduction continues across the open
contacts. Reignition can involve large transfers of energy between source and load networks and
the resulting high frequency transients can be exceptionally severe. Reignition transients can
propagate as travelling waves, resulting in appreciable reactor inter-turn stresses in addition to
expected insulation stress with respect to ground. The impact of reignition transients coupling
(2.16)
(2.17)
Chapter 2. Essential Reactor Switching Theory 1 9
into substation control cables, protection and control systems, alarm systems, and commu
nications equipment observed by the author and others, can be very undesirable. Dielectric
reignition occurs due to inadequate dielectric strength of the contact gap following successful
arc quenching. This must not be confused with the very different thermal reignition mechanism
where the arc, having been insufficiently cooled, remains conductive through the natural cur
rent zero. Arc voltage reheats the arc invoking a new half cycle of current. Thermal reignition
results in a smooth, virtually transient free, restoration of arc current which was really not
completely quenched. From this point on unless otherwise mentioned, reignition shall refer to
dielectric reignition.
2.2.1 Transient Recovery Voltage
The transient recovery voltage (TRV) across interrupting breaker contacts is simply the dif
ference between load side oscillation and system side voltages following interruption. Using
equation 2.12 for the single phase case, TRV may be expressed as follows:
VTRV = V3 sm(ujst + 7 ) - Vme-^ 1 cos^r - 0) (2.18)
where : V, is peak system voltage
LJ„ is system angular frequency
7 is system voltage angle at the time of chopping
V m , PE,I and xfr are as defined for equation 2.12
The circuit breaker TRV resulting from the load side oscillation following 20 A current
chopping on interrupting the network of figure 2.9 is shown in figure 2.8. As expected, the first
TRV maximum occurs at the load side suppression peak, while the second and largest coincides
with the load side recovery peak. Dielectric strength grows with time as the interrupting
contact gap widens, and conductive arc by products recombine or are removed [7],[3],[14]. If
RRRV exceeds the rate at which dielectric strength is established between the opening breaker
contacts, dielectric reignition will occur. Largest RRRV usually occurs between the time of
Chapter 2. Essential Reactor Switching Theory 20
current chopping and the load side recovery peak making reignitions most common in this
interval. Clearly, the larger the TRV at reignition, the greater the resulting energy transfer
between source and load networks. The severity of the resulting reignition overvoltages is also
accordingly increased.
Rate of rise of recovery voltage (RRRV) and maximum TRV, depend on chopping current
and load side network natural frequency. Devices capable of high current chopping levels will
be exposed to large RRRV and TRV and have greater chance of reignition unless TRV is limited
in some fashion.
2.2.2 Reignition Transients
As reignition occurs, load side and source side voltages are quickly equalized in an oscillatory
exchange of energy. In practice, travelling waves will result due to the distributed nature of the
source impedance and reactor network, however elements may be lumped for analysis to gain
an understanding of reignition transient phenomena. Effects of distributed impedances will be
investigated in Chapter 6 where reactor switching simulation results are presented.
There are three mechanisms considered to be predominant during a reignition, occurring in
the following sequence:
• First parallel oscillation
• Second parallel oscillation
• Main circuit oscillation
Though these oscillations all begin at the moment of reignition, their frequencies differ by at
least an order of magnitude. It is hence acceptable to consider each separately from the others
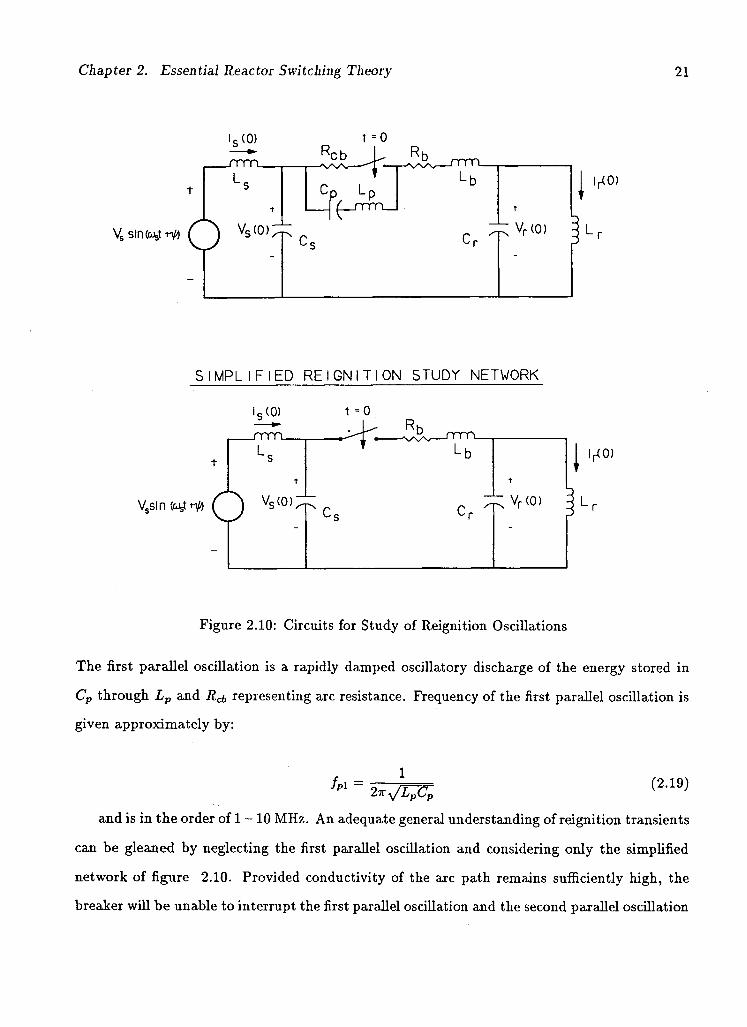
[1] using the circuits of figure 2.10. Each pole of a high voltage breaker consists of a number of series connected interrupters with
parallel grading capacitor networks to help distribute TRV evenly between them. Cp and Lp
represent the equivalent capacitance and stray inductance of the interrupter grading network.
Chapter 2. Essential Reactor Switching Theory 21
t =0
Vs sintoJstr o vs<o>;
S I M P L I F I E D R E I G N I T I O N STUDY NETWORK
t =0
V.sln ( U s t f #
Figure 2.10: Circuits for Study of Reignition Oscillations
The first parallel oscillation is a rapidly damped oscillatory discharge of the energy stored in
Cp through Lp and R& representing arc resistance. Frequency of the first parallel oscillation is
given approximately by:
/PI (2.19) 2Wy/LpCp
and is in the order of 1 - 10 MHz. An adequate general understanding of reignition transients
can be gleaned by neglecting the first parallel oscillation and considering only the simplified
network of figure 2.10. Provided conductivity of the arc path remains sufficiently high, the
breaker will be unable to interrupt the first parallel oscillation and the second parallel oscillation
Chapter 2. Essential Reactor Switching Theory 22
develops.
During the second parallel oscillation, energy exchange between source and load side capac
itances, C3 and C r , will ultimately reduce voltage across the breaker to almost zero. L b and Rb
represent the bus between the reactor and circuit breaker causing a damped oscillatory energy
exchange. Rb may also represent arc resistance. Second parallel frequency is typically in the
range 100 kHz - 500 kHz and the oscillation short-lived. Accordingly, initial inductor currents
is(0) and Jr(0) at onset of reignition remain practically constant during the second parallel os
cillation. Analysis based on this assumption in Appendix C shows the second parallel damped
natural frequency is:
Ud2 = \Juj - 0* (2.20)
L b C r C g
8 - A Generally it is considered valid to neglect damping in estimating the second parallel oscil
lation frequency [1],[16] which is then given by:
f « « h l c ' + c ' 2ir V L b C r C s ^ ^
As outlined in Appendix C, the breaker current and load side voltage have the following
forms during the second parallel oscillation for reignition at t = 0:
ib(t) ~ Crig(o) + C 3 i r ( o )
C g + C r
1 - c - * ' * C O S
+ 1 I C g C r
L b ( C r + C g )
[Vg{o)-Vr(o)} e - 0 ' 1 smojd2t (2.22)
Chapter 2. Essential Reactor Switching Theory 23
Vr(t) ~
+
where: i«(0), ir(0), Vr(0), and Va(0) are initial currents and voltages
as defined in figure 2.10.
Extremely large overvoltages may be generated during the second parallel oscillation but
the complexity of equation 2.23 does not make this immediately clear. Consider a reignition
occurring when Vr and Vs are at peak values of opposite polarity. Currents ir and is would
then be approximately zero. It is clear from equation 2.18 that Vr(f) — Va(t) can be well in
excess of 2.0 pu at that instant depending on current chopping at the previous interruption.
Assuming that Cs ^> Cr as is generally the case, load side voltage becomes:
With Vs « 1.0 pu, Vr(t) shortly after reignition could reach over 3.0 pu since cjj2 ^
and /3p <c Ud2- Time of reignition with respect to load side oscillation hence alters reignition
Equation 2.24 further illustrates Vr(t) approaching V»(0), equalizing system and load side volt
ages as the oscillation progresses. After a time tj when sinusoidal terms have decayed, ib(t)
reaches a quasi steady state following a number of zero crossings. If the breaker is not able to
interrupt the second parallel current, a main circuit oscillation begins at t' = 0 for /' = t — tj
with the following initial conditions:
Vr(t) « V,(o) + [Vr(o) - V.^e-Wcosujit (2.24)
severity, the worst case being reignition near a recovery peak where Vr(r) — Vs(r) is maximum.
(2.25)
Chapter 2. Essential Reactor Switching Theory 24
All elements of the simplified network in figure 2.10 are involved in energy exchanges during
the main circuit oscillation. L(, is usually neglected in the analysis since it is much smaller than
La or Lr. Neglecting damping, main circuit oscillation frequency is given as shown in Appendix
C by:
The main circuit oscillation begins with the initial conditions of equation 2.25, and as shown
in Appendix C, the load side voltage during this period is given by:
Vr(t) ~ V0 sin(u;s + i>) + [Vr(td) - V0 sin ip] e - / 3 m' cos umt (2.27)
+-is(o) - ir(o)
Ca + Cr
— iOaV0 cos ip sm u>mt
0m =
L3 + Lr
L3Lr(Cs + Cr)
1 2RT(Ca-rCr)
where: ih is the source voltage angle at the moment of reignition
As expected, equation 2.27 shows the load side voltage follows the 60 Hz source voltage
once the main circuit oscillation damps.
Breaker current during the main circuit oscillation from Appendix C has the following form:
*&(*) CrLrU2 - 1
uaLr
VQ cos(uat + v>) + . . . V0cos^l n ,
u>aLr . (2.28)
+umCr [V0siiLip - Vr(td)]e~ 0 m t sinojmt
Cr
+ r ' r [it(o) - ir(o)-Lja(Ca + Cr)V0cosi)]e f l m tcosumt
Depending on network parameters and initial conditions, ib(t) may not cross zero and the
breaker may not be able to interrupt the main circuit oscillation. Steady state 60 Hz current
Chapter 2. Essential Reactor Switching Theory 25
will be re-established, and interruption attempted at the next zero crossing. Test waveforms
depicting this common behavior wil l be presented in Chapter 5.
While reignitions are more likely following the suppression peak, they can occur sooner.
Reignition before the suppression peak is most likely when time between initial contact part
and current chopping (arcing time) is short. Contact separation is then insufficient to withstand
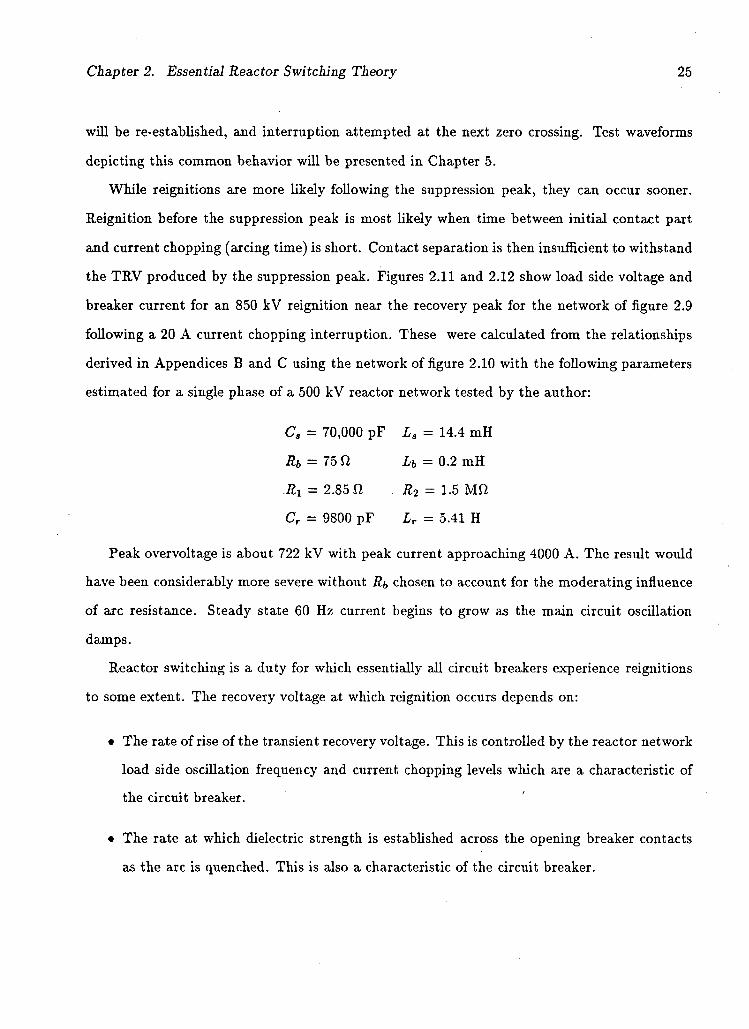
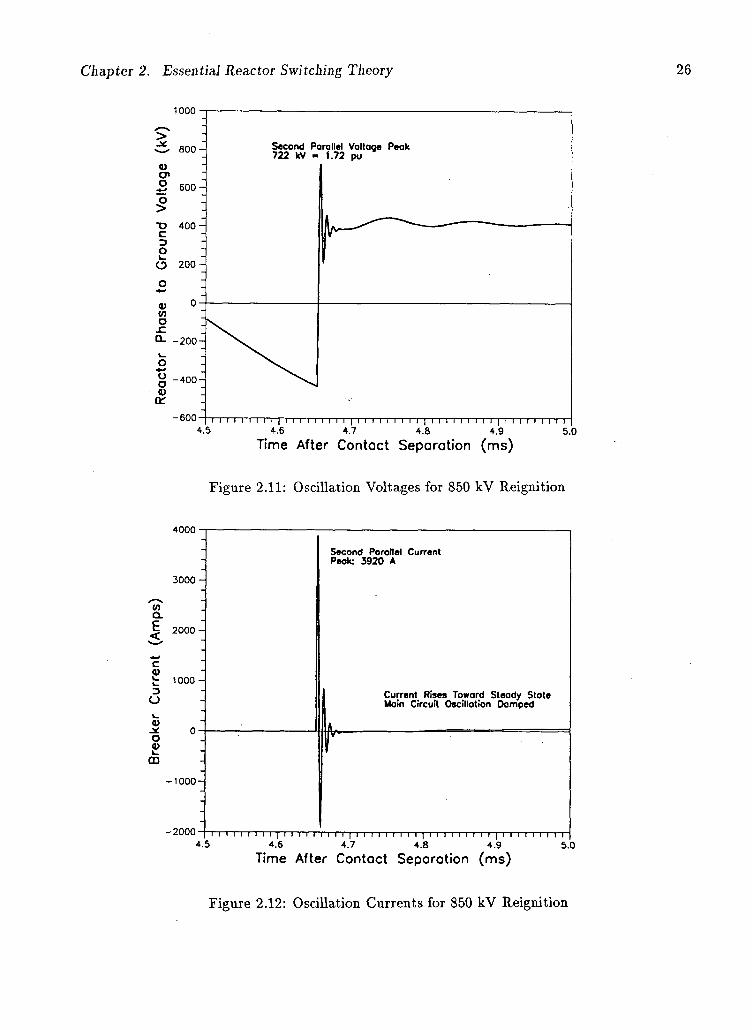
the T R V produced by the suppression peak. Figures 2.11 and 2.12 show load side voltage and
breaker current for an 850 k V reignition near the recovery peak for the network of figure 2.9
following a 20 A current chopping interruption. These were calculated from the relationships
derived in Appendices B and C using the network of figure 2.10 with the following parameters
estimated for a single phase of a 500 k V reactor network tested by the author:
Ca = 70,000 pF La = 14.4 m H
Rb = 75 ft Lb = 0.2 mH
Ri = 2.85 ft R2 = 1.5 Mft
Cr = 9800 pF Lr = 5.41 H
Peak overvoltage is about 722 k V with peak current approaching 4000 A . The result would
have been considerably more severe without Rb chosen to account for the moderating influence
of arc resistance. Steady state 60 Hz current begins to grow as the main circuit oscillation
damps.
Reactor switching is a duty for which essentially all circuit breakers experience reignitions
to some extent. The recovery voltage at which reignition occurs depends on:
• The rate of rise of the transient recovery voltage. This is controlled by the reactor network
load side oscillation frequency and current chopping levels which are a characteristic of
the circuit breaker.
• The rate at which dielectric strength is established across the opening breaker contacts
as the arc is quenched. This is also a characteristic of the circuit breaker.
Chapter 2. Essential Reactor Switching Theory 26
1000
800-
a 6oo-
400-
O 200-
-200-
-400-
-600
Second Porallel Voltage Peak 722 kV - 1.72 pu
i i i i i i i i i | i i i i i i i i i | i i i i i i i i i | i i i i i i i i i | i i i i i i i i i 4.5 4.6 4.7 4.8 4.9 5.0
Time After Contact Separation (ms)
Figure 2.11: Oscillation Voltages for 850 kV Reignition
4000 •
3000-
OT CL
E 2000 -
C
t 1000-
CJ
-1000-
Second Porallel Current Peok: 3920 A
Current Rises Toward Steady State Moin Circuit Oscillation Damped
-2000- i I I I I I I I | I I i I I I I I I | I I I I I I I I I | I I I I I I I I I | I I I I I I I i I
4.5 4.6 4.7 4.8 4.9 5.0
Time After Contact Separation (ms)
Figure 2.12: Oscillation Currents for 850 kV Reignition
Chapter 2. Essential Reactor Switching Theory 27
2.2.3 Virtual Current Chopping
Breaker current interruptions at a current zero of either of these oscillations will appear to
the rest of the network as if power frequency current has been chopped. This effect is one
form of a phenomenon referred to as virtual current chopping. A load side oscillation results
with suppression peak related to apparently chopped current by equation 2.16. The current
chopping is not brought on by arc instability and is not a manifestation of the conventional
current chopping mechanism. It is simply an instance of interruption at a high frequency current
zero. Reignition followed by virtual current chopping via interruption of the second parallel
oscillation, can be repetitive with several successive reignitions and interruptions, until either
60 Hz current is re-established or oscillation interruption is successful.
2.2.4 Multiple Reignitions and Suppression Peak Escalation
As in the case of conventional current chopping, recovery voltage following virtual current
chopping on interruption of second parallel oscillation, may exceed what the circuit breaker
contacts can withstand. If so, reignition will recur exhibiting the previously described oscillation
mechanisms. Depending on the circuit breaker it is then possible that:
• High frequency interruption will recur with the breaker successfully withstanding the
resulting recovery voltage.
• Sixty hertz current will be re-established and interruption attempted at the next zero
crossing.
• High frequency interruption is followed by multiple reignition/interruption events until
successful interruption or 60 Hz current is re-established.
Multiple reignitions can lead to a condition called voltage escalation [1],[26]. It is simply an
escalation in suppression peak magnitude at each interruption in a multiple reignition sequence.
Stored load side energy following reignition current interruption generally differs from that
Chapter 2. Essential Reactor Switching Theory 28
stored before reignition due to a partial energy exchange. If stored load energy is greater at
interruption of reignition current than before the precious reignition, the resulting suppression
peak will be larger than its predecessor. Interruption of second parallel currents, multiple
reignitions, and hence voltage escalation can only occur with breakers capable of quenching
high frequency currents.
Multiple 60 Hz reignitions are also possible, occurring most commonly where:
• Contacts part so slightly in advance of a natural zero, that breaker recovery voltage
withstand capability at both the first and second current zero is exceeded.
• Circuit breakers incapable of reliable reactor switching may reignite at several successive
60 Hz current zeroes before clearing if at all.
Breaker current chopping capability increasing with arcing time is frequently the cause of
successively larger suppression peaks during multiple 60 Hz reignitions.

Chapter 3
Switching Three Phase Reactor Networks
To this point, discussion has focused on single phase reactor switching. Current chopping,
reignition, and associated transients are complex and are best understood by first considering
the single phase case, and then extending principles to three phase networks.
Although similar to single phase phenomena already presented, transients related to three
phase reactor network switching can be complicated by phase interactions. The extent of
electrical coupling between phases depends heavily on the nature of the load network and in
general, inter-phase coupling on the source side of the breaker has a relatively minor influence.
Both capacitive and inductive coupling can affect reactor switching transients to varying extents
and must be considered. As each phase of the load network is successively interrupted, phase
interactions can include:
• Load side oscillation voltages and hence breaker recovery voltages are influenced by the
load side oscillations or reignition transients of adjacent phases.
• Interruption processes on one or more adjacent phases are influenced by reignition in one
particular phase. Virtual current chopping brought on by an adjacent phase reignition is
a prime example of this interaction form.
The extent to which transient currents and voltages couple to adjacent phases is highly
dependent on the ratios of zero sequence to positive sequence reactance and admittance
and yj-) in the reactor network. Analytical treatment of interruption transients is much more
complicated than the single phase case due to the number of reactive network elements and the
associated initial conditions required for solution. Further, solution must be performed in three
29
Chapter 3. Switching Three Phase Reactor Networks 30
steps as each phase is successively interrupted. Analytic solutions for three phase network
transient recovery voltage have been derived by Van Den Heuvel [26] in considerable detail
using lumped parameter network models with both capacitive and inductive phase coupling
and analytical solutions for the three phase case will not be considered here in detail. The
origin and general nature of the most important phase interactions will be examined briefly
and their practical effects outlined.
3.1 General Three Phase Reactor Load Side Oscillation
Where the phases of a reactor network are coupled, load side oscillation on any particular
phase is affected by those of the other phases. The first interrupting phase produces a load side
oscillation of the same form as equation 2.12 for the single phase case but of lower frequency. As
the other phases interrupt, double frequency oscillations involving all phases and new natural
frequencies result. The extent of energy transfer to adjacent phases depends on the type and
degree of coupling as well as initial conditions at each successive phase interruption. As will
later be shown, even small amounts of capacitive coupling can lead to double frequency load
side oscillations. Chopping current is usually largest in the last phase to clear, leading to the
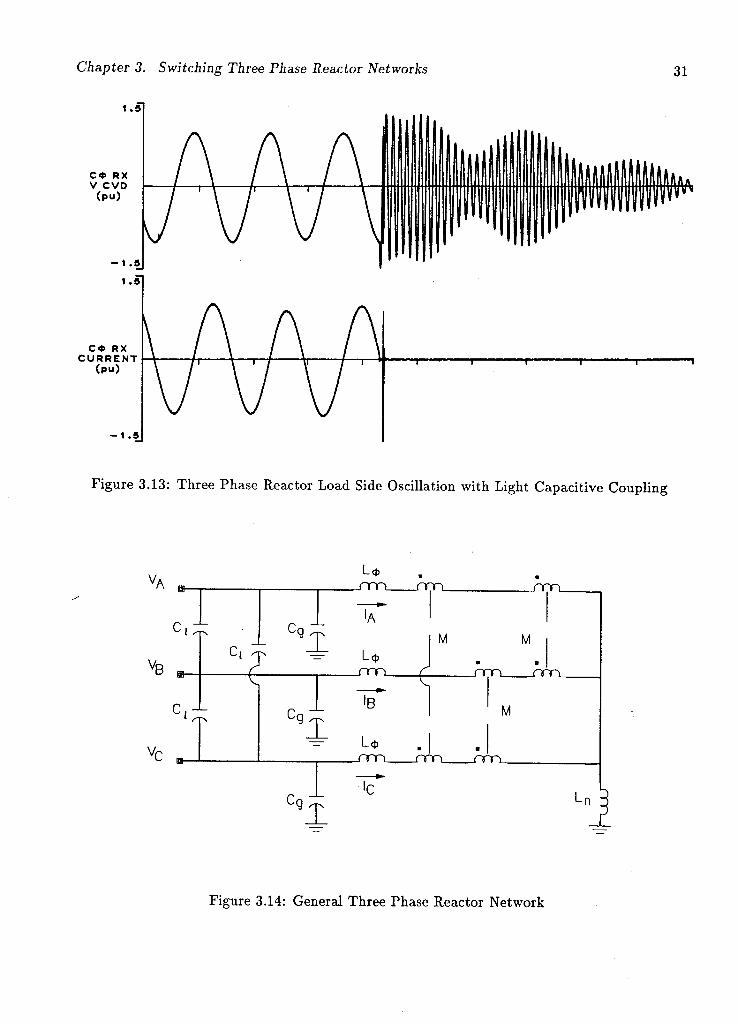
largest chopping overvoltages in the interruption sequence. Figure 3.13 gives an example of load
side oscillation interaction during interruption of a three phase network with small capacitive
coupling tested by the author.
A general three phase reactor network is represented in figure 3.14. represents the self
inductance of each phase reactor while L„ represents a neutral reactor inductance when present.
M represents mutual inductance between the network phases including both reactor and as
sociated busses. Cg and C\ represent the phase to ground and phase to phases capacitances
contributed by busses, CVT, CT, breaker insulators, bus insulators and surge arresters pri
marily. This model assumes for simplicity that the network impedances and admittances are
balanced though this is generally not the case.
Chapter 3. Switching Three Phase Reactor Networks 31
1 .5
C » R X V C V D
( p u )
- 1 .5
1 .3
C * R X C U R R E N T
( p u )
- 1 .5
\ A A A 1 1 1 1 1 1
Figure 3.13: Three Phase Reactor Load Side Oscillation with Light Capacitive Coupling
C
Vc B »
C,
m n n m
lA
'JL L — L<t>
m n ^
IB
M M •
m n m n
M
Cg
U . | m n m n m n
ic
Figure 3.14: General Three Phase Reactor Network
Chapter 3. Switching Three Phase Reactor Networks 32
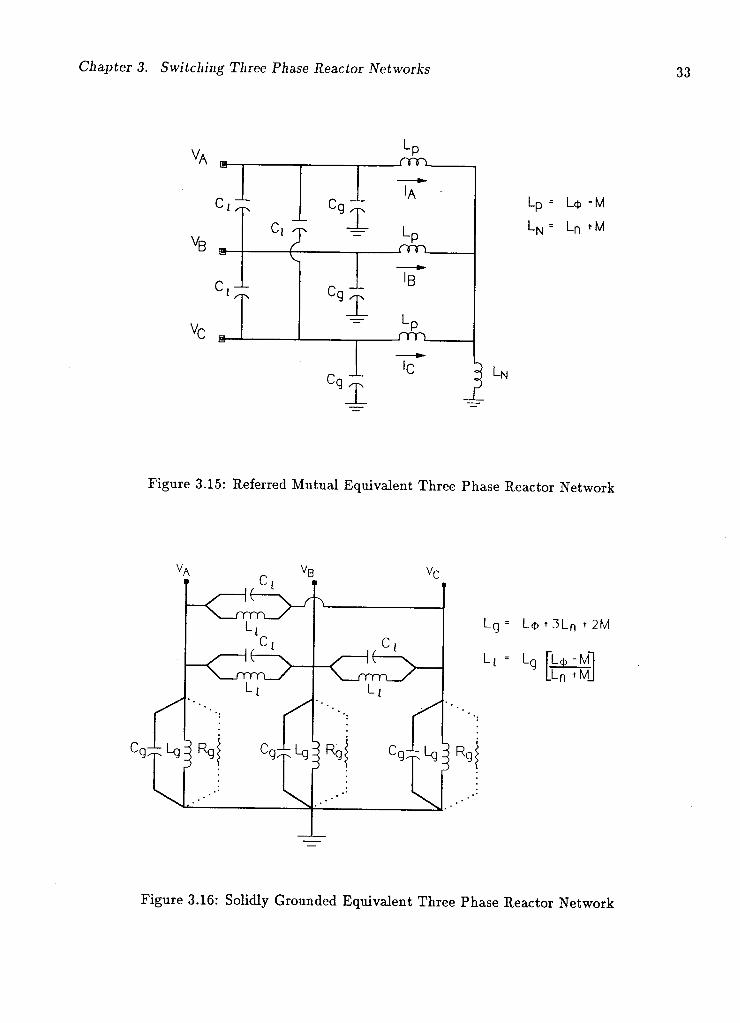
Mutual inductance can be referred to the neutral to form the equivalent network of fig
ure 3.15. From the analysis given in Appendix D, the referred mutual equivalent of figure 3.15,
and solidly grounded equivalent representation of figure 3.16 behave identically if:
(3.29)
= L+ + ZLN + 2M
3. LN
= [L+ + 3 i „ + 2M]
LT = 3XP+ p
L+-M
[LN + M\
Load side oscillations may now be considered by including the effects of capacitances and
damping resistances in the grounded equivalent network of figure 3.16. Assuming all phases
have interrupted, no sources are connected and using operational notation, nodal analysis leads
to:
Dm Dm
Ds Dm
Dm D,
VA IA 0
VB = IB = 0
VC Ic 0
Where Da and Dm are given by:
Ds = p(2Cl + Cg) + l (-7- + JI P
(3.30)
Since the system of differential equations is symmetrical, it may be decoupled by applying the
3. Switching Three Phase Reactor Networks
V
Vf B
Vr
Lp = L<p -M
-N " L n L n *M
Figure 3.15: Referred Mutual Equivalent Three Phase Reactor Network
Figure 3.16: Solidly Grounded Equivalent Three Phase Reactor Network
Chapter 3. Switching Three Phase Reactor Networks 34
Fortescue transformation1 to phase voltages:
VQ _ 1
VI ~ 3 '
v2
1 1 1
1 a a 2
1 a 2 a
and identically to phase currents to decouple the system into positive, negative and zero modes
as follows:
VC
D, + 2Dm 0 0 V q T q 0
0 D.-Dm 0 • Vi = h = 0 (3.31)
0 0 Da - Dm J L V2 J L h J L ° . Noting that the positive and negative mode differential equations are identical, two natural
oscillation modes exist governed by the decoupled positive and zero mode differential equations:
d 2Vx dVj +
1 + (3I g + Li)Vx
dt 2 ' dt Rg(3Ci + Cg) ' LlLg(ZCl + Cg)
V0 d 2V0 dV0 1 eft2 + dt RgCg
+
CgLg 0
(3.32)
(3.33)
In practice, reactor network damping will be light and oscillatory solutions of the following
forms are expected:
Vi(*) = Kte-h* cos(uldt + fa) (3.34)
" 1 1 1 " 1 Fortescue j • 1 a a 2 or Clark | •
1 a 2 a transformations could equally well be applied
1 1 1 2 -1 -1 0 \/3 —/3
as the rows of either are eigen vectors of the characteristic matrix in equation 3.30. Either will thus produce the decoupled system of equation 3.31.
Chapter 3. Switching Three Phase Reactor Networks 35
ft = 1 2Rg(3Q + Cg)
3Lg + Lt
2
LiLg{3Ci + Cg)
<+>ld = - Pi
where: (i\ is positive mode damping coefficient
ui\ is positive mode natural frequency
u\d is positive mode damped natural frequency
K\ and (j>\ are determined by positive mode initial conditions. The negative mode solution form
will be the same but with constants Ki and depending on negative mode initial conditions.
Then the zero mode solution has the following form:
Vb(0 Ii'oe-^ 1 cos(uodt + fa) (3.35)
Po 1
IRgCg
1 2
LgC,
where: /?o is zero mode damping coefficient
u>o is zero mode natural frequency
UQd is zero mode damped natural frequency
KQ and (j>o are determined by zero mode initial conditions.
Chapter 3. Switching Three Phase Reactor Networks 36
Transforming back to phase quantities, voltages become weighted sums of the positive,
negative, and zero mode voltages. The general form of a resulting phase voltage neglecting
damping could be written:
V(t) = AQ cos(u>0* + <t>o) + AL2 cos(u>i.i + <f>i2)
= 2A0 cos (UJQ +<jJl)t <f>Q + <f>l2
COS (up - Ui)t <f>0 - <(>l2 (3.36)
+ (A12 - A0) cos(uit + <pn)
where A\2 and <f>\2 have absorbed the positive and negative modes into one term. The first
term of equation 3.36 produces a modulated load side oscillation, manifesting the sum and
difference of the mode frequencies. Substituting into the mode frequency expressions for La
and L\\
CgiL* + 3Ln + 2M)
r 1 .LQCO.
(3C| + Cg)(L+ - M)
LXiCi.
where the positive and zero mode inductances and capacitances are given by:
(3.37)
(3.38)
Li = Lj, - M
L0 = L<i> + ZLn + 2M
(3.39)
C\ = 3Cj + Cg (3.40)
Chapter 3. Switching Three Phase Reactor Networks 37
The ratio of the mode frequencies may then be expressed as:
LQCO i 2
-XrjYb UQ [LiCil
(3.41)
The effects of phase to phase capacitance, mutual inductance, and neutral inductance on
load side oscillation, all of which were not present in the single phase case, can be clearly
demonstrated using equations 3.37, 3.38 and 3.41.
3.1.1 Three Single Phase Solidly Grounded Reactors
The grounded Y connection of three single phase reactors is commonly used in line shunt
compensation applications by B.C. Hydro. In this case, the reactors are not magnetically
coupled. Mutual inductance in the reactor network busses is generally small compared to the
reactor phase inductance and M may be assumed zero. Since the bank is solidly grounded, L„
is zero and the following relationships result:
I T = L 0
•A-i
U0
Ul
CgLj, (3.42)
(3.43)
If air insulated busses connect the reactor to the associated circuit breaker, Ci <C Cg due to
relatively large instrument transformer and surge arrester capacitances. As a result, yj- ~ 1.0,
and ^ ~ 1.0. Modulation of load side oscillation is accordingly slow and is entirely due
to capacitive coupling via C/. As will be observed in Chapters 5 and 6, modulation can be
pronounced even with Ci <C Cg. Slow phase interactions during load side oscillation means
suppression and recovery peaks will not be significantly influenced by adjacent phases and it is
generally accepted this case may be treated as three individual single phase reactors [1]. The
suppression peak for each phase could then be predicted using equation 2.14 as:
Chapter 3. Switching Three Phase Reactor Networks 38
(3.44)
where ich is the chopped current, and Va the peak system voltage. The three phase reactor
VA rating is:
2usL(t,
and recalling from Chapter 2 that ich = Xch>/U^ , the suppression peak may be expressed
as simply a function of breaker chopping number and reactor rating:
Equations 3.44, and 3.45 provide a means of assessing suppression peak in the simplest
solidly grounded three phase case. However, if Ci <jt. Cg, as where cables or very long air insu
lated busses connect the reactor network to a circuit breaker, validity of single phase treatment
may fail. Further, single phase equations offer no insight into the effects of phase interactions
beyond the first cycle of load side oscillation or during reignition.
3.1.2 S ingle Tank Three Phase So l id ly G r o u n d e d Reac tors
Three phase reactors are often constructed on a common core and housed in a single tank. De
pending on core geometry and winding arrangement, mutual inductance can vary significantly.
A knowledge of the mutual inductance is necessary to properly assess load side oscillation.
Core geometries may result in M < and little error will result in treating the reactor as
in section 3.1.1 after careful consideration. Common construction methods result in negative
reactor mutual inductance for the sense of M shown in figure 3.14. Since the bank is solidly
grounded:
V2 [y/lbJsL^
3 K 2
(3.45)
Chapter 3. Switching Three Phase Reactor Networks 39
Xo = L+ + 2M Xx L+-M ~ *
[ 1 U° ~ [Cg{L^ + 2M)
f 1 _ W l " [{3Q + Cg)(L+ - M)
With respect to the same network with M = 0, ^ decreases, and load side oscillation mod
ulation will be more rapid. TRV and RRRV may be larger than for M = 0 and equations 3.44
or 3.45 cannot be applied with confidence where M is not negligible.
3.1.3 T h r e e Phase Reac to r N e t w o r k s W i t h N e u t r a l Reac to r
Four reactor schemes with > Ln are commonly applied in shunt compensation of trans
mission lines protected by single pole tripping relaying systems. Figure 3.16 demonstrates the
equivalent phase to phase inductance Li resulting intentionally from this connection to com
pensate the capacitive coupling between transmission line phases which hinders single phase
fault clearing. With discrete phase reactor tanks mutual inductance M = 0 and:
(3.46)
(3.47)
|° = i + H > i.o
W 0 = Cg(Lj> + ZLn)
1 i 2
(3.48)
(3.49) _(3Ci + Cg)^
For a B.C. Hydro four reactor scheme considered by the author in Chapter 5, Ln « 0.51^
and « 2.5.
In effect, the neutral reactor generates positive inductive coupling between phases of the
reactor network. Zero mode natural frequency is substantially reduced and ^ increased over
solid grounding of the same network. The difference between mode frequencies \u>\ — OJ0\ will
Chapter 3. Switching Three Phase Reactor Networks 40
be larger. More rapid load side oscillation modulation can thus be expected over the solidly
grounded case. A significant increase in TRV and RRRV can result with a neutral reactor
due to phase currents interrupting at different times as will be demonstrated in section 3.1.5.
Equations 3.44 and 3.45 cannot be confidently applied.
3.1.4 U n g r o u n d e d Y Connec ted Three Phase Reac tors
An ungrounded reactor connection corresponds to the case where Ln approaches oo and Cg
connects to the neutral bus of figure 3.16. In this instance, Cg will not include instrument
transformer or bus capacitances since they exist with respect to ground. Cg will rather represent
a potentially small effective capacitance to neutral of the reactor winding and busses. Phase
to ground capacitances in the network will generate phase to phase capacitance contributions
increasing Ci such that ^ < 1.0 typically. Reactors of this type are frequently constructed on
a common core and mutual inductance can be significant. Allowing Ln to approach oo:
= oo (3.50)
u0 = 0 (3.51)
UX = (3Ct + CgXLt - M)
(3.52)
Equations 3.50 and 3.51 imply that zero mode oscillation cannot exist.
An ungrounded connection imposes very strong inductive coupling between phases of the
reactor network as indicated by setting Ln —• oo in equation 3.29 yielding:
Lg = OO
This represents in effect, the network of figure 3.16 with only phase to phase inductances and
Chapter 3. Switching Three Phase Reactor Networks 41
hence strong inductive coupling. Phase interactions are very pronounced during interruption
and equations 3.44 and 3.45 cannot be applied.
3.1.5 Neutral Offset Due to Staggered Clearing of Phase Currents
Due to steady state reactor currents being out of phase, each pole of the breaker interrupts
at a different time. In the case of reactors which are not solidly grounded or where mutual
inductance is not negligible, a neutral offset voltage is imposed as the first and second poles of
the breaker interrupt.
Consider the simple network of figure 3.17 where the first phase has interrupted. By super
position the neutral voltage is:
,7 M+L„ — — M 1 2Ln + M + Lj,
where V\ is the source phasor voltage of the first interrupted phase. When the second phase
clears, as shown in figure 3.17, Vjv is offset to a new value:
VN2 = V3 T
L" (3.54)
v Ln + M
L<t> + Ln
where V3 is the source phasor voltage of the remaining uninterrupted phase.
Both the effective load side oscillations and recovery voltages of the first two interrupting
phases are offset to levels dependent on the nature of the reactor network. For the two special
cases considered in Chapters 5 and 6:
1. Solidly grounded reactors with M = 0, Vm = VJV2 = 0 and neutral offset is zero.

Chapter 3. Switching Three Phase Reactor Networks 42
F IRST PHASE C L E A R I N G
SECOND PHASE C L E A R I N G
Figure 3.17: Neutral Voltage Offset on Staggered Phase Interruption
2. Four reactor schemes with M ~ 0, Vjvi = -Vx 2L^+L^, • VN2 = Vn,£+Ln' ^Ni < =jL-
First and second phase suppression peaks are reduced by the neutral offset, while recovery
peaks are increased. Maximum breaker TRV is thus increased by neutral offset voltages
for the first and second interrupting phases. Suppression peaks will no longer represent
the largest phase to ground voltages during load side oscillation.
Chapter 3. Switching Three Phase Reactor Networks 43
3.2 Phase Interactions on Reignition
Current chopping in the first or subsequent phase to interrupt frequently leads to reignition.
As in the single phase case, reignition involves second parallel and possibly main circuit oscilla
tions. An important difference from the single phase case is all capacitive and inductive circuit
elements adjacent to the reigniting phase breaker pole are involved in energy exchange during
reignition oscillations. Oscillation current in the reigniting phase may hence be partly sourced
by adjacent phases which have not yet interrupted. Further a large reignition current may
couple voltages onto, and alter currents in, adjacent phases. In either case, a high frequency
component is superimposed on the 60 Hz currents of uninterrupted phases. Should either of
the resulting phase currents pass through zero, they may be interrupted. To the network, this
appears as though power frequency current has been chopped to zero. This is an alternate
form of virtual current chopping to that described in the previous chapter and is only possi
ble in poly-phase systems. Though not frequently observed, it is most likely to occur where
interphase coupling is pronounced as in the case of ungrounded three phase reactor networks.
Transient voltages coupled to adjacent phases on reignition were observed to some degree in
field testing of a solidly grounded three phase reactor network with weak capacitive coupling.
3.3 Predicting Three Phase Reactor Network Switching Transients
It useful to be able to predict reactor switching transients in order to:
1. Estimate maximum phase to ground voltages during load side oscillation to assess insu
lation concerns.
2. Evaluate recovery voltages to determine whether the circuit breaker can withstand the
reactor interruption duty.
3. Gain an appreciation of transient voltages and currents in both reigniting and adjacent
phases.

Chapter 3. Switching Three Phase Reactor Networks 44
4. Determine whether interphase coupling influences network transients significantly.
Considerable efforts have been directed at calculation of transients which might be expe
rienced on interruption of three phase reactor networks. These can be broadly categorized as
analytical approaches, or computer simulation using faculties such as E M T P . Each approach has
merits and choice of methods will depend on the network being considered, and the phenomena
of concern.
3.3.1 Considerations in Analytical Approaches
The complexities of approaching three phase reactor network switching analytically are well
known and have not been covered here in detail. Considerable efforts have been expended in
this area [26]. Most commonly, classical time domain or frequency domain solution methods
have been applied using eigen vector techniques to decouple and simplify solution of three phase
differential equations.
Application of analytical methods to the three phase reactor switching problem has several
advantages including:
• Insight into effects of various coupling types, network grounding methods, or changes in
network parameters can be readily gained by studying the form of the analytic solutions
for various network configurations.
• Transients can be understood by simply choosing an appropriate network solution.
• No knowledge of simulation facilities such as E M T P is necessary.
However, there are clear limitations in many cases which must be understood before considering
analytical solution:
• Interruption of each successive phase must be individually formulated and solved applying
initial conditions which will be influenced by the solution for the previous interruption.
Chapter 3. Switching Three Phase Reactor Networks 45
• Studying the effect of alternate coupling types or grounding methods requires derivation
of separate solutions.
• Published literature primarily emphasizes solution only of load side oscillation transients
following interruption. Analytical solution of reignition transients for three phase net
works is very complicated and little seems to have been published on the subject.
• Treatment of constituent reactor network components as lumped elements introduces
errors where long bus sections, cables, or other distributed elements are present. Errors
will be even more significant when considering reignitions.
• Non-linear devices such as surge arresters, commonly applied in reactor network insulation
protection, are not easily handled by analytical methods.
Van Den Heuvel [26] has provided concise lumped model analytical solutions for load side
oscillations in grounded three phase reactors with various coupling forms. This work will be
very useful in consideration of networks where lumped modelling is sufficiently accurate and
non-linear elements need not be considered.
It would be useful to not only predict reactor switching transients, but also to consider the
influence of circuit breaker characteristics on those transients and judge how well a breaker
will perform in a specific reactor switching application. This requires consideration of breaker
current chopping and reignition characteristics in concert with the transients generated by
current chopping and reignitions. Analytical methods with their associated complexity, are not
well suited to this problem.
3.3.2 Computer Simulation Considerations
Usefulness of the EMTP in simulation of power system transients has long been established. For
the most part, EMTP accuracy is limited only by the validity of the network models to which
it is applied. As a result of various research efforts, [1], [26], [18], guidelines regarding necessary
modelling detail for digital computer simulation of reactor switching have been suggested.
Chapter 3. Switching Three Phase Reactor Networks 46
There are several advantages in using simulation facilities such as EMTP to study reactor
switching:
• Effects of altering the network in any way can usually be handled without completely
reformulating the problem.
• Reignitions and resulting transient effects can be incorporated.
• Successive phase interruptions need not be considered in separate steps.
Use of the EMTP in this context is however not without limitations and consideration
should be given to the following:
• Influence of different coupling types and grounding methods can only be confidently as
sessed by performing numerous simulations.
• Considerable care must be taken in assessing the required modelling detail. This may
not be easy, especially when dealing with the high frequency transients associated with
reignition.
• Influential parameters such as reactor core losses and bus impedances are frequency de
pendent and can be difficult to estimate.
• EMTP is constrained to use of a fixed time step for the full duration of a study. Since
reignition transients are much higher frequency than the breaker recovery voltage caus
ing reignition, a smaller time step must be used in simulating reignition than load side
oscillation. This requires separate simulation of load side oscillation to determine initial
conditions prior to reignition, followed by simulation of the reignition at a reduced time
step, incorporating the initial conditions. This process can be cumbersome.
Methods for incorporating time dependent circuit breaker characteristics which influence
switching transients and hence the likelihood of successful interruption into EMTP simulations,

Chapter 3. Switching Three Phase Reactor Networks 47
would help to make results more realistic. Circuit breaker characteristics relevant to reac
tor switching are presented in the following chapter. A technique for incorporating empirical
breaker characteristics into reactor switching computer simulations will be presented in Chapter
6 with emphasis on predicting circuit breaker performance.
Chapter 4
Breaker Characteristics Relevant to Reactor Switching
High voltage circuit interruption is a formidable task and ever increasing system voltage levels
and protection speeds have called for application of progressively more sophisticated circuit
breaker technologies. Today, available circuit breaker types include:
• Oi l devices up to 550 k V .
• A i r blast devices up to 1100 k V .
• Compressed gas (Sulphur Hexafluoride) devices up to 765 k V .
In considering circuit breaker performance, short circuit current breaking capacity, and
maximum interrupting capacity are often referred to. However, in the case of reactor switching
the following characteristics strongly influence the chances of successful interruption and the
resulting transient overvoltages to which equipment will be exposed:
• Current chopping capability and its dependence upon arcing time. Chopping levels control
overvoltages during load side oscillation and hence the maximum recovery voltage (TRV) .
• Withstand voltage of the opening contacts following interruption and its dependence on
arcing time. R R R V and maximum T R V must not exceed what the opening breaker
contacts are capable of withstanding or reignition results.
Considerable testing is required to determine breaker current chopping numbers and opening
contact recovery withstand voltage as functions of arcing time, but reactor switching perfor
mance may not be analysed in detail without these characteristics.
48
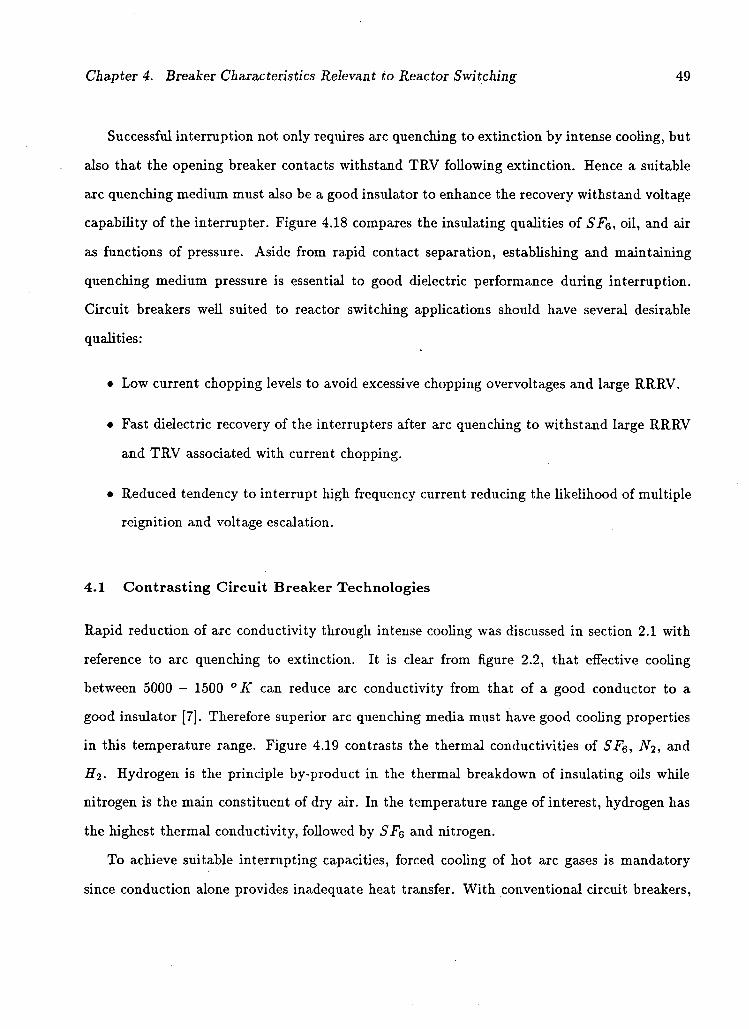
Chapter 4. Breaker Characteristics Relevant to Reactor Switching 49
Successful interruption not only requires arc quenching to extinction by intense cooling, but
also that the opening breaker contacts withstand TRV following extinction. Hence a suitable
arc quenching medium must also be a good insulator to enhance the recovery withstand voltage
capability of the interrupter. Figure 4.18 compares the insulating qualities of SFe, oil, and air
as functions of pressure. Aside from rapid contact separation, establishing and maintaining
quenching medium pressure is essential to good dielectric performance during interruption.
Circuit breakers well suited to reactor switching applications should have several desirable
qualities:
• Low current chopping levels to avoid excessive chopping overvoltages and large RRRV.
• Fast dielectric recovery of the interrupters after arc quenching to withstand large RRRV
and TRV associated with current chopping.
• Reduced tendency to interrupt high frequency current reducing the likelihood of multiple
reignition and voltage escalation.
4.1 Contrasting Circuit Breaker Technologies
Rapid reduction of arc conductivity through intense cooling was discussed in section 2.1 with
reference to arc quenching to extinction. It is clear from figure 2.2, that effective cooling
between 5000 - 1500 °K can reduce arc conductivity from that of a good conductor to a
good insulator [7]. Therefore superior arc quenching media must have good cooling properties
in this temperature range. Figure 4.19 contrasts the thermal conductivities of 5^6, iV2, and
H?. Hydrogen is the principle by-product in the thermal breakdown of insulating oils while
nitrogen is the main constituent of dry air. In the temperature range of interest, hydrogen has
the highest thermal conductivity, followed by SF& and nitrogen.
To achieve suitable interrupting capacities, forced cooling of hot arc gases is mandatory
since conduction alone provides inadequate heat transfer. With conventional circuit breakers,
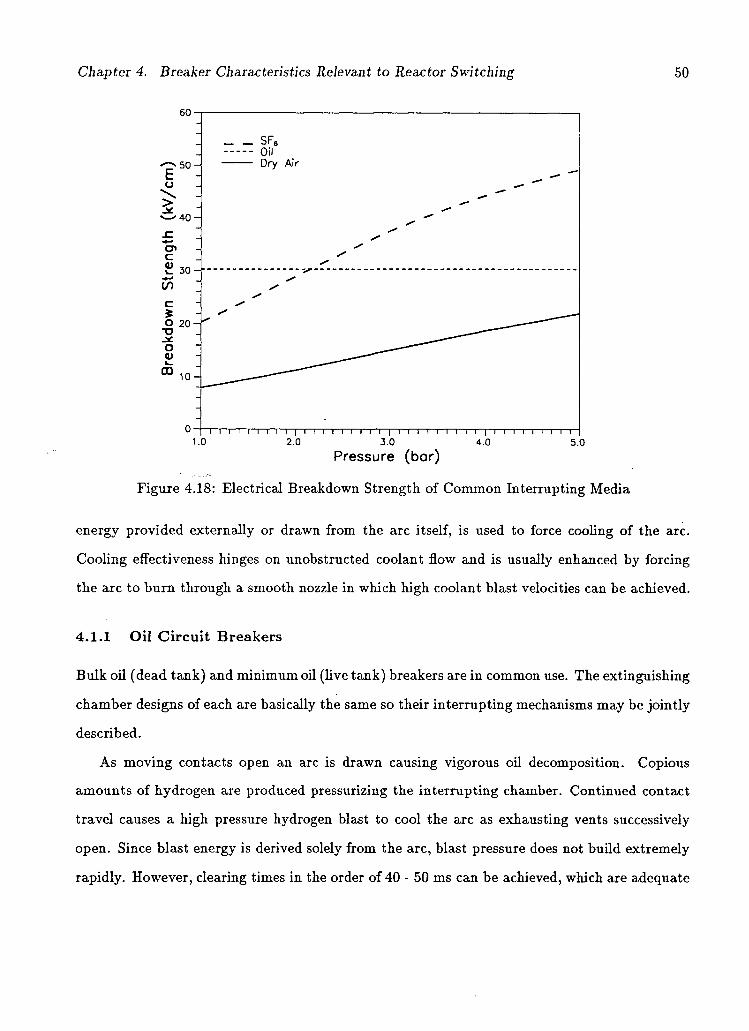
Chapter 4. Breaker Characteristics Relevant to Reactor Switching 50
Pressure (bar)
Figure 4.18: Electrical Breakdown Strength of Common Interrupting Media
energy provided externally or drawn from the arc itself, is used to force cooling of the arc.
Cooling effectiveness hinges on unobstructed coolant flow and is usually enhanced by forcing
the arc to burn through a smooth nozzle in which high coolant blast velocities can be achieved.
4.1.1 Oil Circuit Breakers
Bulk oil (dead tank) and minimum oil (live tank) breakers are in common use. The extinguishing
chamber designs of each are basically the same so their interrupting mechanisms may be jointly
described.
As moving contacts open an arc is drawn causing vigorous oil decomposition. Copious
amounts of hydrogen are produced pressurizing the interrupting chamber. Continued contact
travel causes a high pressure hydrogen blast to cool the arc as exhausting vents successively
open. Since blast energy is derived solely from the arc, blast pressure does not build extremely
rapidly. However, clearing times in the order of 40 - 50 ms can be achieved, which are adequate

Chapter 4. Breaker Characteristics Relevant to Reactor Switching 51
3-i 1
2-
10 3 10 4 10 5
Tempe ra tu r e ( °K ) Figure 4.19: Thermal Conductivities of Arc Quenching Gases
for many applications. Due to the high thermal conductivity of hydrogen in the critical tem
perature range, fairly high R R R V withstand capability can be achieved with oil interrupters.
Cooling blast intensities are lower than air blast breakers, and oil breaker chopping numbers
tend to be smaller as shown in table 4.1. This causes a desirable limiting of chopping overvolt
ages. Cooling blast intensity in oil interrupters is a function of arc current magnitude as oil
decomposes more rapidly at the higher arc power associated with elevated currents.
Oil breaker reactor switching experiments have shown good agreement with the theory
presented in Chapter 2. The work of Murano et al [17] for example, showed minimum oil
breaker current chopping was related to network capacitance as predicted by equation 2.10
with n « 0.47. This supports the validity of characterizing current chopping behavior of oil
breakers using the chopping number Ac/, as defined in section 2.1.2 [1],[17],[26] and [2].
Recovery voltage withstand strength following extinction in an oil interrupter is provided
by contact separation and the insulating qualities of the oil itself. Good dielectric performance
Chapter 4. Breaker Characteristics Relevant to Reactor Switching 52
requires rapid evacuation of gas bubbles and decomposition by-products following arc quench
ing. In modern oil breakers this is often achieved and hence the likelihood of reignition reduced
by:
• Increasing contact opening acceleration.
• Permanently pressurizing the interrupting chambers.
• Use of forced oil injection to flush decomposition by-products out of the interrupter as
they are produced.
Opening energy for an oil breaker is often provided by a spring which is pre-charged during
the previous closing stroke. Since arc quenching energy is produced by the arc itself, only
modest operating energy need be provided externally.
4 . 1 . 2 A i r B la s t C i r c u i t Breakers
Both operating and arc quenching energy is provided externally with compressed air in an air
blast breaker. Substation compressors maintain a constant supply of dry pressurized operating
air in a central reservoir. Supply lines are then routed to small dedicated storage tanks for each
air blast device.
At the start of and throughout the opening stroke, the moving contacts are accelerated
by high pressure air. A blast of high pressure air also cools and quenches the arc. Since air
is less thermally conductive than hydrogen or SFe in the critical temperature range (5000 -
1500 ° K), a higher air blast velocity must be used to dissipate an equivalent arc energy. Air
blast duration is usually more than five cycles following contact separation and catastrophic
failure is likely if arcing extends beyond this time. Modern air blast breakers use continuously
pressurized interrupters to enhance dielectric performance.
Due to their high short circuit current interrupting capacity, air blast breakers are in common
use. Breaking capacity in excess of 100,000 A rms is available at low voltages. Short breaking
Chapter 4. Breaker Characteristics Relevant to Reactor Switching 53
times, ( « 2 cycles at 60 Hz), also make air blast devices attractive where rapid fault clearing
is desirable.
Requirements for expensive and maintenance intensive compressor, air drying, and storages
systems are a general disadvantage of air blast breaker application. Where reactor switching is
involved, the following qualities are more of a concern:
• High blast intensities result in air blast breakers having a well documented higher current
chopping tendency than SF6 devices [1],[17],[7],[14]. This is largely due to the higher
thermal conductivity of air over 5i*6 between 5000 - 10,000 ° Ii as shown in figure 4.19.
Arc thermal time constant 9 is smaller with increased cooling, causing arc instability and
current chopping to occur at higher levels. Larger current chopping overvoltages result.
• Cooling in the critical range 5000 - 1500 ° K, where the arc must remain a good insulator
to ensure successful interruption, is not as effective with air as oil or SFQ. As a result, air
blast breakers have a higher sensitivity to RRRV and a correspondingly higher tendency
for dielectric reignition during reactor switching.
A common method of dealing with undesirable effects of high current chopping tendencies
in air blast breakers during reactor switching, is to use opening resistors. Opening resistors
are connected in parallel with the main interrupters and an auxiliary interrupter added to
break resistor current some time after main contacts have opened. RRRV and resulting TRV
across the breaker are reduced over those for an identical interrupter without opening resistors
because:
• Increased resistance lowers the current at which the arc becomes unstable hence reducing
chopping current.
• The new steady state load side voltage following current commutation to the opening
resistor, is smaller than and phase advanced with respect to the system voltage. This
results in a reduced RRRV when the resistor switch interrupts.
Chapter 4. Breaker Characteristics Relevant to Reactor Switching 54
These points are demonstrated analytically in Appendix E.
The delay between main interrupter contacts parting and parting of the associated resistor
switch is called insertion time. Insertion times in the order of 20 ms are commonly chosen
to exceed maximum anticipated main interrupter arcing times. Load side oscillation resulting
from interruption of the reference network of figure 2.9 with a 5000 fi opening resistor is shown
in figure 4.20. A 20 A resistor switch chopping level is assumed and the response calculated
using expressions derived in Appendix E. Results may be contrasted to 4.21 depicting the
same interruption with no opening resistor. Reduced load side overvoltages are apparent with
the opening resistor. Figure 4.22 shows the resulting circuit breaker recovery voltage without
resistor, compared to those with 2000 and 5000 fi resistors, where reduced maximum TRV
and RRRV are apparent. With an opening resistor inserted, source voltage lags the reactor
voltage phasor at the moment of interruption. This results in breaker TRV recovery peaks
occurring later, giving breaker contacts more time to establish withstand capability. For the
same reason, TRV suppression peaks are larger with an opening resistor even though absolute
suppression peak voltages with respect to ground are smaller. The increased risk of suppression
peak reignition is a small drawback contrasted to the advantages of reduced current chopping
overvoltages, RRRV and maximum breaker TRV. Air blast breakers expected to switch shunt
reactors are frequently equipped with opening resistors to reduce the severity of the interruption
duty. Another approach, is the use of metal oxide surge arresters in parallel with interrupter
contacts to limit breaker TRV [1]. This approach has been used successfully in SF6 circuit
breakers for 756 kV shunt reactor switching applications [21]. More commonly, reactor surge
arresters applied for insulation protection, assist the breaker by limiting chopping overvoltages,
with resulting limitation of breaker TRV [4]. Many B.C. Hydro shunt reactor compensated line
terminals use air blast breakers without opening resistors, which are frequently used for reactor
switching when the associated lines are out of service. Chopping overvoltages are exceptionally
severe in these cases, and surge arresters are essential to successful interruption and preventing
insulation damage.

Chapter 4. Breaker Characteristics Relevant to Reactor Switching
800-
600 H
-600H
-800-
Breaker Current Reactor Voltage
Main Contacts Part
Resistor Contacts Current Chop
" i — i — i — i — i — i — i — i — i — | — i — i — i — i — | — 10 20 30
n i | — i — i — i — i — | — i — i — i — r 40 50 60
Time (ms)
Figure 4.20: Interruption at 20 A Current Chopping with 5 left Opening Resistor
800-
600 H
-800-
Breaker Current Reactor Voltage
Moin Contocts Current Chop
"i i i i 1 i i i i | i i i i — | — i — i — i — i — | — i — i — i — i — | — i — i — i — r 0 10 20 30 40 50 60
Time (ms)
Figure 4.21: Interruption at 20 A Current Chopping with No Opening Resistor
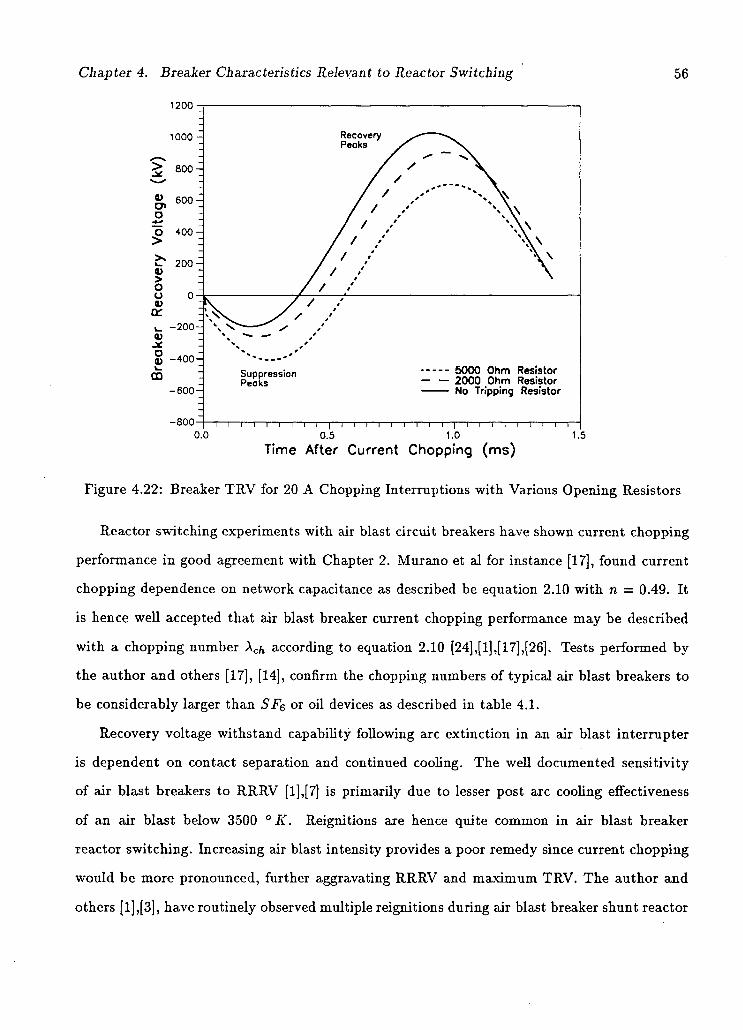
Chapter 4. Breaker Characteristics Relevant to Reactor Switching
1200 •
56
1000 •
o > l _
> o o d) or v o 9) k_
m
-800-
Recovery — Peoks
/ / / / / ' / ' ' ' '
/ / ''' / ' '' / ' V / ' '
/ / •' K / ' ' * 0 s s '
\ V . ^ * v *
Suppression Peaks ~"
- - 5000 Ohm Resistor — 2000 Ohm Resistor
— No Tripping Resistor
-i— i — i — i — i — i —r 0.0 0.5 1.0
Time After Current Chopping (ms) 1.5
Figure 4.22: Breaker TRV for 20 A Chopping Interruptions with Various Opening Resistors
Reactor switching experiments with air blast circuit breakers have shown current chopping
performance in good agreement with Chapter 2. Murano et al for instance [17], found current
chopping dependence on network capacitance as described be equation 2.10 with n = 0.49. It
is hence well accepted that air blast breaker current chopping performance may be described
with a chopping number Ac/, according to equation 2.10 [24],[1],[17],[26]. Tests performed by
the author and others [17], [14], confirm the chopping numbers of typical air blast breakers to
be considerably larger than SFQ or oil devices as described in table 4.1.
Recovery voltage withstand capability following arc extinction in an air blast interrupter
is dependent on contact separation and continued cooling. The well documented sensitivity
of air blast breakers to RRRV [1],[7] is primarily due to lesser post arc cooling effectiveness
of an air blast below 3500 ° K. Reignitions are hence quite common in air blast breaker
reactor switching. Increasing air blast intensity provides a poor remedy since current chopping
would be more pronounced, further aggravating RRRV and maximum TRV. The author and
others [1],[3], have routinely observed multiple reignitions during air blast breaker shunt reactor
Chapter 4. Breaker Characteristics Relevant to Reactor Switching 57
switching. This has also been attributed to the high thermal conductivity of air in the range
5000 - 10,000 ° K.
Due to higher current chopping capability and lesser RRRV tolerance, air blast breakers
frequently reignite prior to the load side oscillation suppression peak. This has the effect of
limiting load side overvoltages by reconnecting the interrupted reactor phase to the power sys
tem which is at a lower potential. Conversely, reignitions following the suppression peak where
breaker TRV approaches maximum values, may generate second parallel oscillation overvoltages
sufficient to invoke surge arrester operation. Both effects have been observed by the author and
will later be shown in field test results presented in Chapter 5.
4.1.3 S F 6 Gas C i r c u i t Breakers
Sulphur Hexafluoride (SF§) has 2.5 to 3 times the dielectric strength of dry air at the same
pressure as may be seen in figure 4.18. Figure 4.19 previously showed the superior thermal
conductivity of SF§ below 3000 ° K giving good arc quenching performance near and following
extinction. Further, SFQ exhibits exceptionally fast recombination of arc dissociation products
reforming SFe. The result is good dielectric performance in withstanding large RRRV making
reignitions much less common in SFQ versus air blast devices.
Available SF& circuit breaker types include:
• Two Pressure Blast
• Puffer
Two pressure blast function is similar to an air blast breaker. Interrupters are enclosed
within a second SF6 chamber at a pressure well below that of the interrupters themselves.
During interruption, SFQ is blasted across the arc at high pressure, venting into the outer low
pressure chamber where it is recovered and compressed for reuse. Operating energy is externally
supplied by compressed air or SFQ. Puffer 5^6 device operating energy is provided externally at first, and later from the arc
itself. As contacts part, an arc is drawn which rapidly dissociates the SF& gas. The opening
Chapter 4. Breaker Characteristics Relevant to Reactor Switching 58
moving contact also serves as a piston to compress fresh SFQ, and blow a quenching puff of
gas over the arc. While initial contact/piston movement is forced by an external mechanism,
pressure increase due to rapid gas dissociation later significantly assists the motion. As a result,
puff intensity is determined to a large extent by the arc current magnitude. Design of the vents
through which the SFQ puff is expelled can be used to control how abruptly the arc will be
quenched.
Two pressure blast devices are considerably complex, requiring expensive compressors and
gas storage facilities. Current chopping capability is higher than puffer devices due to higher
coolant velocity. Accordingly, chopping overvoltages during reactor switching with two pressure
blast SFs devices can be large. Kobayashi et al [14] tested 275 kV reactor switching with air
blast, gas blast and puffer devices. The air blast breaker tested was fitted with 15.8 kfi opening
resistors and produced 1.71 pu maximum chopping overvoltages. In contrast, the gas blast
device tested was not equipped with opening resistors and produced overvoltages up to 2.27 pu
switching the same reactor network.
Various research efforts have established 5i*6 device current chopping behavior to be in
accordance with equation 2.10. Murano et al [17] found in their SFQ gas blast breaker exper
iments, that equation 2.10 was satisfied for n=0.48. Kobayashi et al [14] deduced n=0.47 in
experiments with an SFQ puffer breaker. Both results support n=0.5 arrived at in Chapter
2 using arc stability criterion assuming a constant power arc characteristic (a = 1.0). Puffer
SF6 designs are known to provide very gentle reactor interruption characterized by low current
chopping levels [l],[17],[13],and [11]. Chopping overvoltages are accordingly lower than air blast
or SF6 blast devices and tripping resistors are not necessary to aid in the reactor switching
duty. Chopping numbers are significantly less for SFQ versus air blast devices due to the re
duced cooling effectiveness of SF& in the range 5000 - 10000 ° K compared to air. Murano et
al [17] measured chopping numbers in the order of 3 AF~h x i o 4 as opposed to 15 AF~h x i o 4 for
the air blast breaker tested. Kobayashi et al [14] measured in the order of 18 AF~h A ' i o 4 and
7.8 AF~h Xio* respectively for 5^6 blast and SF& puffer breakers switching the same network.
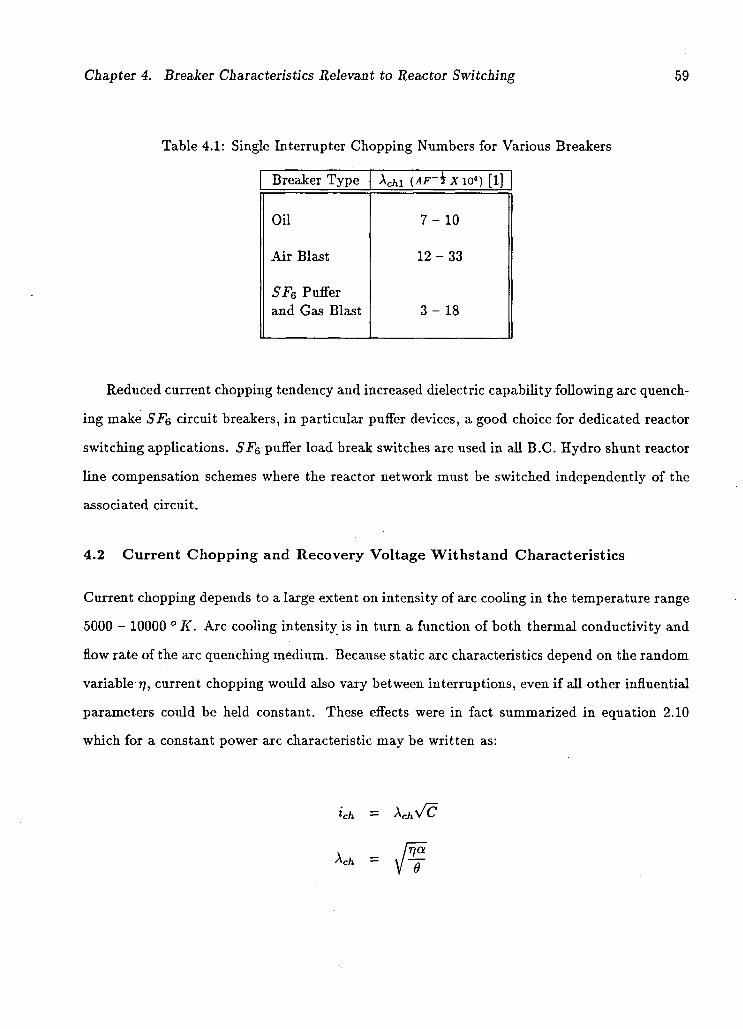
Chapter 4. Breaker Characteristics Relevant to Reactor Switching 59
Table 4.1: Single Interrupter Chopping Numbers for Various Breakers
Breaker Type Ada (AF-ix w*) [1]
Oil 7- 10
Air Blast 12 - 33
SFe Puffer and Gas Blast 3 - 18
Reduced current chopping tendency and increased dielectric capability following arc quench
ing make SFe circuit breakers, in particular puffer devices, a good choice for dedicated reactor
switching applications. SFe puffer load break switches are used in all B.C. Hydro shunt reactor
line compensation schemes where the reactor network must be switched independently of the
associated circuit.
4.2 Current Chopping and Recovery Voltage Withstand Characteristics
Current chopping depends to a large extent on intensity of arc cooling in the temperature range
5000 - 10000 ° K. Arc cooling intensity is in turn a function of both thermal conductivity and
flow rate of the arc quenching medium. Because static arc characteristics depend on the random
variable 77, current chopping would also vary between interruptions, even if all other influential
parameters could be held constant. These effects were in fact summarized in equation 2.10
which for a constant power arc characteristic may be written as:
ich = KhVC

Chapter 4. Breaker Characteristics Relevant to Reactor Switching 60
Since the thermal time constant 9 becomes smaller with increased cooling intensity, chop
ping number Ac/, is increased. Because maximum blast velocity cannot be instantaneously
established on trip initiation, thermal time constant and hence chopping number are arcing
time dependent. Because n is a random variable, chopping number will be normally distributed
for test interruptions with constant arcing time.
Recovery voltage withstand capability across opening breaker contacts depends on:
• Contact acceleration and final separation.
• Effective arc cooling below 5000 ° K.
• Establishing and maintaining interrupter insulating medium pressures.
• Rapid evacuation of conductive arc by-products or gas dissociation products.
To differing degrees, these factors are all functions of arcing time. However contact sep
aration changes the most profoundly during a tripping operation, and has the largest single
influence on recovery voltage withstand capability. Rizk found in his experiments with an air
blast circuit breaker [24] interrupting a 400 A arc, that within 100 us of arc quenching, with
stand voltage simply approached that of the increasing contact gap in dry air. Hermann and
Ragaller [12] suggest that within 100 us of arc quenching in an SFQ interrupter, breakdown
strength is determined solely by contact separation.
Variations in breaker recovery voltage withstand capability and current chopping are highly
likely between trip operations as complex interactions between arc, quenching medium, and
opening contacts are unlikely to be identically repeatable. Accordingly a full theoretical repre
sentation of the interacting factors affecting current chopping and recovery voltage withstand
would be extremely difficult. Circuit breaker design and development efforts hence rely exten
sively on empirical relationships derived through careful experiment.
Chapter 4. Breaker Characteristics Relevant to Reactor Switching 61
4.2.1 Measuring Current Chopping and Reignition Characteristics
Current chopping and reignition (recovery voltage withstand) characteristics in particular, can
and have been measured by the author and others using reasonably simple techniques. These
characteristics are essential to assessing the suitability of a device to reactor switching applica
tions.
To acquire these data, instrumentation must be applied to record breaker currents, load
and source side phase to ground voltages, and breaker tripping command as functions of time.
By having previously measured delays between trip application and phase interrupter contact
parting times, arcing time may be determined for each phase from interruption test traces.
Times between trip application and contact parting vary somewhat between operations due to
differing starting pressures and non-linearities in breaker actuating mechanisms. For 500 kV air
blast breakers tested by the author, these times were generally repeatable to within ± 0.5 ms.
Chopping currents may then be measured directly from current traces. Where network electrical
parameters have been accurately estimated, calculating chopping currents from suppression
peaks gives good agreement with direct measurement if reactor network interphase coupling is
small.
Current and voltage transformers used must have suitable frequency response to ensure
accurate capture of the phenomena of concern. This may be especially difficult when high
frequency events such as reignitions are to be studied. Instrument transformers provided for
normal operation of protective relaying and metering equipment perform well at system fre
quency but their response at higher frequencies can be unacceptable. Sophisticated reactor
switching tests in the substation environment may as a result require temporary installation of
higher quality instrument transformers. This is an expensive, time consuming step, and ben
efits must be weighed against use of existing devices which may give adequate results if lower
frequency events such as load side oscillations or current chopping are being studied.
Control facilities must be incorporated to allow predictable variation of the point on wave
of interrupter contact parting. By adjusting the point on wave at which the trip command is
Chapter 4. Breaker Characteristics Relevant to Reactor Switching 62
applied, arcing time is controlled and its influence on current chopping may be measured. Due
to uncertainty in estimating the instant of contact parting and the random nature of a device
chopping number, data are likely to be somewhat scattered as will be seen on presentation of
field measurements. If desired, curve fitting techniques may be applied to determine formulae
describing the current chopping characteristics with some specified degree of confidence.
Reignition (recovery voltage withstand) characteristics may be estimated in similar fashion,
through analysis of device reignitions. By measuring the arcing time and voltage across the
opening breaker contacts at the point of reignition, a reignition characteristic may be estimated.
The process is more difficult than measuring current chopping performance since:
• The test breaker may not reignite over a practical range of arcing times. SF& devices in
particular are likely to exhibit little or no reignition tendency during reactor switching
tests due to their superior dielectric characteristics and lower current chopping. Even
with air blast breakers, reignitions tend to occur for shorter arcing times at breaker TRV
less than 50 % of ultimate withstand levels.
• The test reactor network may not generate especially large TRV or RRRV even with
the larger current chopping levels associated with air blast breakers. Reignitions may
occur only for a limited range of small arcing times and data over a practical range
of arcing time may hence be unattainable using this method. Extrapolation between
measurements and rated ultimate withstand levels may be necessary to fill voids in the
reignition characteristic.
A laboratory test facility where load network parameters could be altered to control TRV
and RRRV would offer better chances of invoking circuit breaker reignitions over a full range
of arcing times. Performing such tests at full rated voltage requires unique facilities of which
only a few exist in the world. As a result, measurements of this type are commonly performed
at lower voltages using a reduced number of interrupters. Performance of the full scale device
is then extrapolated using statistical arguments. It is absolutely essential that laboratory tests

Chapter 4. Breaker Characteristics Relevant to Reactor Switching 63
duplicate within acceptable limits the interactions between network and circuit breaker which
will occur in a practical network. Damping and natural frequencies of the test network must
be carefully chosen to duplicate potential field conditions to which the circuit breaker may be
applied.
C h a p t e r 5
Reac to r S w i t c h i n g F i e l d Tests
In recent years B.C. Hydro experienced a number of interruption failures while switching out
500 kV 3x45 MVar shunt reactor banks with two different varieties of switchgear. A series of
reactor switching test programs were performed to explore the cause of the failures. A better
understanding of the reactor switching duty and circuit breaker performance was also sought.
Due to system load being concentrated in the southwest, and large hydro electric plants
located in the northern and eastern reaches of the province, 500 kV circuits are employed in the
B.C. Hydro system. Banks of 525 kV, three single phase 45 MVar reactors are used throughout
the system to compensate 60 - 65% of associated line shunt capacitance. These are usually
located in the line terminals as shown in the station one line diagram of figure 5.23. Dedicated
load circuit switchers are provided if the reactor is to be switched separately from the line
for voltage control flexibility. Although routinely used for reactor switching, circuit switchers
cannot interrupt fault current, and line breakers must be capable of reactor switching as well.
This chapter presents highlights of several field tests which the author initiated or was directly
involved with. Practical manifestations of previously described phenomena will be discussed
and the severity of the reactor switching duty highlighted. Strengths and shortcomings in the
reactor switching performance of several practical pieces of switchgear will be analysed and
outlined.
The site of the reactor switching failures and subsequent testing was Nicola substation
previously shown in figure 5.23. Nicola is a critical 500 kV transmission hub providing inter
connection between major generation, and central load centers in the B.C. Hydro network via
eight 500 kV fines. Five 135 MVar shunt reactor banks are provided at Nicola fine terminal
64
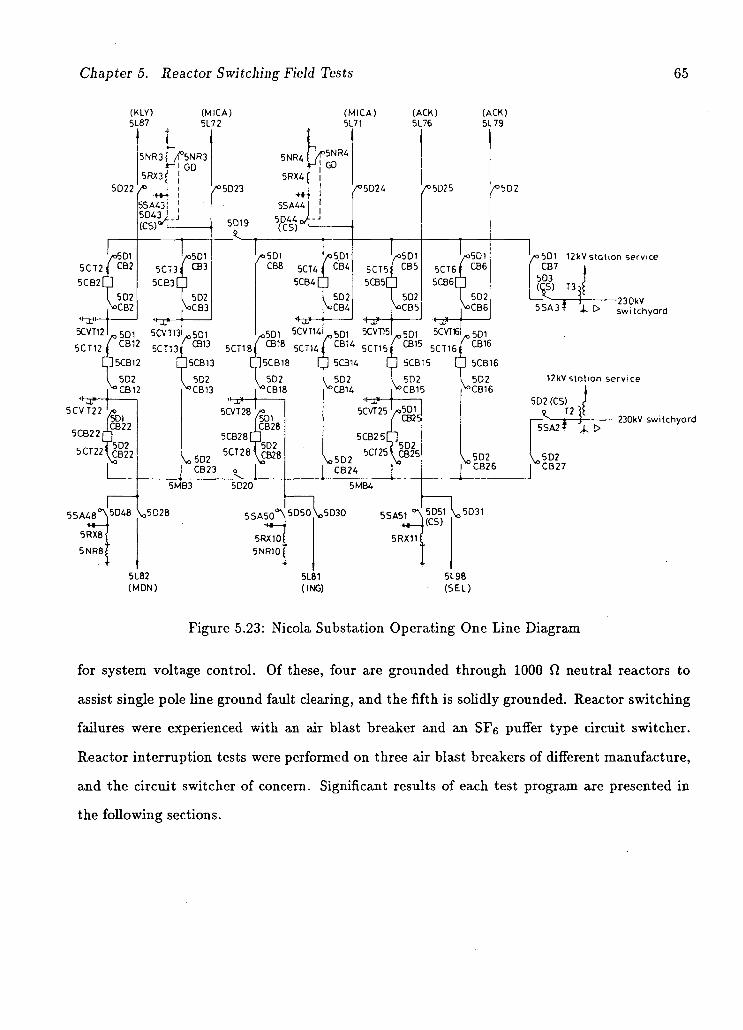
Chapter 5. Reactor Switching Field Tests 65
5CT12 i
05D1 5CVT13-501 C B 1 2 5 C T ^ 3 ^ C B , 3
• 5CB13
50, 5CVT14I 5 D 1 5CVT15 5 0, SCVTBI 5 D 1 ISTCBIS 5 C T M r C B K 5 C T , 5 £ C B 1 5 5 C T 1 6 r C B l 6 [J5CB18 • 5C314 • 5CB15 • 5CB16
/o5D1 1 2 k V s t a t i o n s e r v i c e CB7 i
503 J (^) T3 , f
—^—I—j — 2 3 0 k V 5 S A 3 ? ^ O s w i t c h y a r d
12kV s t a t i o n s e r v i c e
5 0 2 (CS)
-230kV s w i t c h y a r d
5L82 (MDN)
5L81 (ING)
Figure 5.23: Nicola Substation Operating One Line Diagram
for system voltage control. Of these, four are grounded through 1000 ft neutral reactors to
assist single pole line ground fault clearing, and the fifth is solidly grounded. Reactor switching
failures were experienced with an air blast breaker and an SF6 puffer type circuit switcher.
Reactor interruption tests were performed on three air blast breakers of different manufacture,
and the circuit switcher of concern. Significant results of each test program are presented in
the following sections.

Chapter 5. Reactor Switching Field Tests 66
5.1 Nicola 5CB25 Testing
5CB25 is a four interrupter air blast breaker with 400 ft opening resistors which also serve
as closing resistors. The ohmic value was selected for the suppression of energizing switching
surges. Main contacts open 20 ms after trip command application. Current then commutates to
the resistor switch whose contacts open 21 ms after main contact separation. Currents generally
interrupt within 2 cycles of resistor switch contact separation. While de-energizing 5RX11 with
5L98 out of service, 5CB25 experienced incidents of prolonged arcing and in one case a single
phase failed catastrophically.
5.1.1 5CB25 Test Instrumentation
A test program was arranged to monitor 5CB25 switching 5RX11 under controlled conditions.
A zero crossing detector was used to ensure consistent point on wave trip application. 5D51
was tripped each time as backup to avoid equipment damage in the event of 5CB25 failure. The
sequence of events consisting of zero crossing detector initiation, breaker and backup device trip
application, and start/stop of recording equipment was controlled by a desk top computer as
shown in figure 5.24. All signals were recorded on magnetic tape for later analysis and on light
beam chart recorders for immediate assessment. 5CVT25 voltages were monitored to observe
load side voltage as measured by a capacitive voltage transformer tuned for 60 Hz operation.
To ensure higher accuracy, load side voltage was also monitored on C phase by erecting a fast
capacitive voltage divider with 1 MHz frequency response, adjacent to 5CVT25. The voltage
divider signal was transmitted about 200 m to the station control room via optical fibre to
reduce noise. All instrument connections to current, voltage, and tripping signals were made
in protection and control cabinets in the station control room.
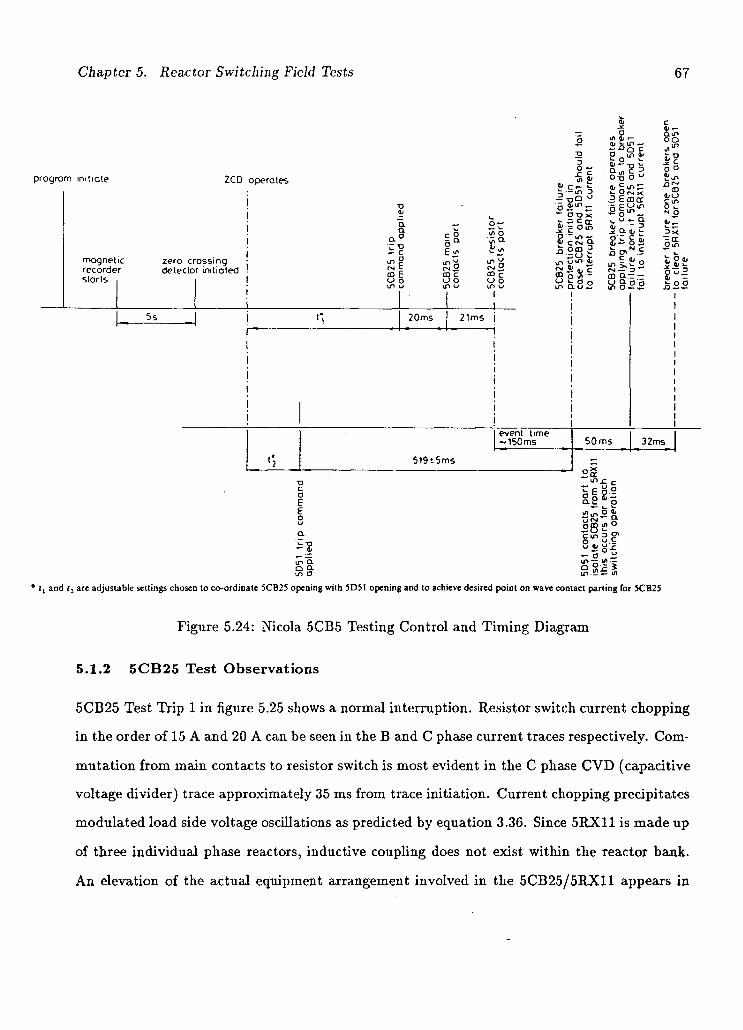
Chapter 5. Reactor Switching Field Tests 67
program initiate ZCD operates
magnetic recorder starts
zero crossing detector initiated
5s
in O. in O
a"
CM t CD £ U O 1/1 u
(SI ±2 as c o o in u
1/1 o £ >
N2 CD c l~> O in u
20ms 21ms
o
Ii i: —in 3
*" O T 3 X
8 C S Q. ^ uin
* o Sf-u o o in ci u I
i* a» •-4i m — - r > 0 c O m a* i- o S « § 3
J? £ cocr
£ O. (, i-g i g S
CD —
y 9- o 5 IT) O ^ j :
din oo
o o tin
CO
8-C N o
«, V <u 0
519t5ms
event time ~150ms 50ms 32ms
« X
Q.2 ™ o
g ^ S ?
' I, and r2 are adjustable settings chosen to co-ordinate 5CB25 opening with 5D51 opening and to achieve desired point on wave contact parting for 5CB25
Figure 5.24: Nicola 5CB5 Testing Control and Timing Diagram
5.1.2 5CB25 Test Observations
5CB25 Test Trip 1 in figure 5.25 shows a normal interruption. Resistor switch current chopping
in the order of 15 A and 20 A can be seen in the B and C phase current traces respectively. Com
mutation from main contacts to resistor switch is most evident in the C phase CVD (capacitive
voltage divider) trace approximately 35 ms from trace initiation. Current chopping precipitates
modulated load side voltage oscillations as predicted by equation 3.36. Since 5RX11 is made up
of three individual phase reactors, inductive coupling does not exist within the reactor bank.
An elevation of the actual equipment arrangement involved in the 5CB25/5RX11 appears in
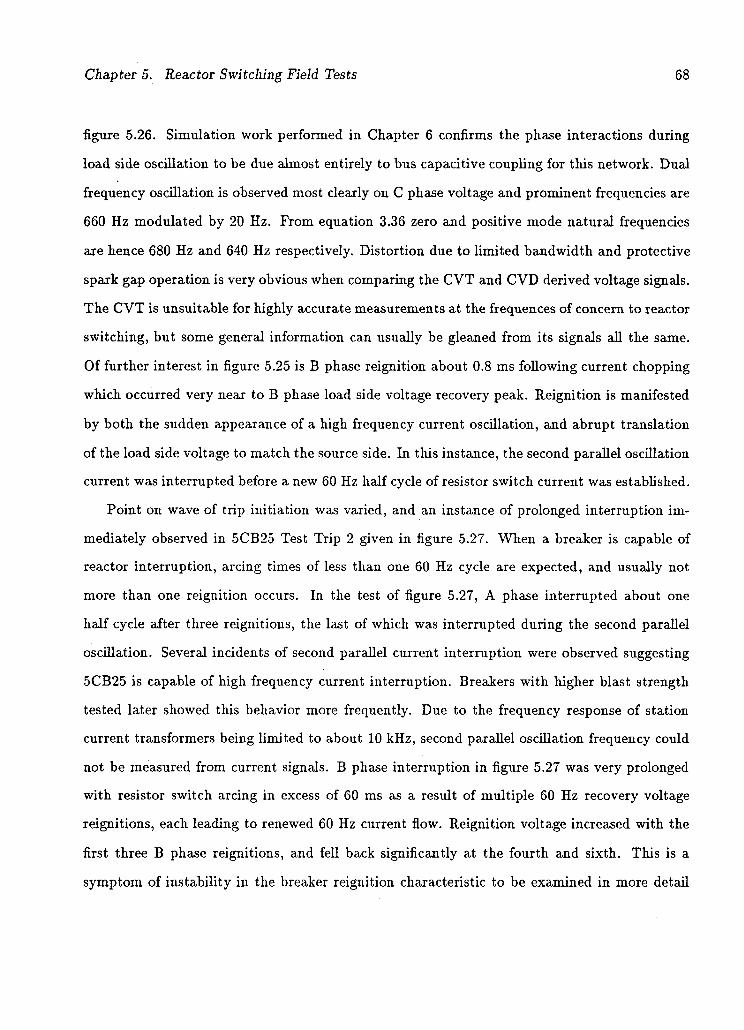
Chapter 5. Reactor Switching Field Tests 68
figure 5.26. Simulation work performed in Chapter 6 confirms the phase interactions during
load side oscillation to be due almost entirely to bus capacitive coupling for this network. Dual
frequency oscillation is observed most clearly on C phase voltage and prominent frequencies are
660 Hz modulated by 20 Hz. From equation 3.36 zero and positive mode natural frequencies
are hence 680 Hz and 640 Hz respectively. Distortion due to limited bandwidth and protective
spark gap operation is very obvious when comparing the CVT and CVD derived voltage signals.
The CVT is unsuitable for highly accurate measurements at the frequences of concern to reactor
switching, but some general information can usually be gleaned from its signals all the same.
Of further interest in figure 5.25 is B phase reignition about 0.8 ms following current chopping
which occurred very near to B phase load side voltage recovery peak. Reignition is manifested
by both the sudden appearance of a high frequency current oscillation, and abrupt translation
of the load side voltage to match the source side. In this instance, the second parallel oscillation
current was interrupted before a new 60 Hz half cycle of resistor switch current was established.
Point on wave of trip initiation was varied, and an instance of prolonged interruption im
mediately observed in 5CB25 Test Trip 2 given in figure 5.27. When a breaker is capable of
reactor interruption, arcing times of less than one 60 Hz cycle are expected, and usually not
more than one reignition occurs. In the test of figure 5.27, A phase interrupted about one
half cycle after three reignitions, the last of which was interrupted during the second parallel
oscillation. Several incidents of second parallel current interruption were observed suggesting
5CB25 is capable of high frequency current interruption. Breakers with higher blast strength
tested later showed this behavior more frequently. Due to the frequency response of station
current transformers being limited to about 10 kHz, second parallel oscillation frequency could
not be measured from current signals. B phase interruption in figure 5.27 was very prolonged
with resistor switch arcing in excess of 60 ms as a result of multiple 60 Hz recovery voltage
reignitions, each leading to renewed 60 Hz current flow. Reignition voltage increased with the
first three B phase reignitions, and fell back significantly at the fourth and sixth. This is a
symptom of instability in the breaker reignition characteristic to be examined in more detail
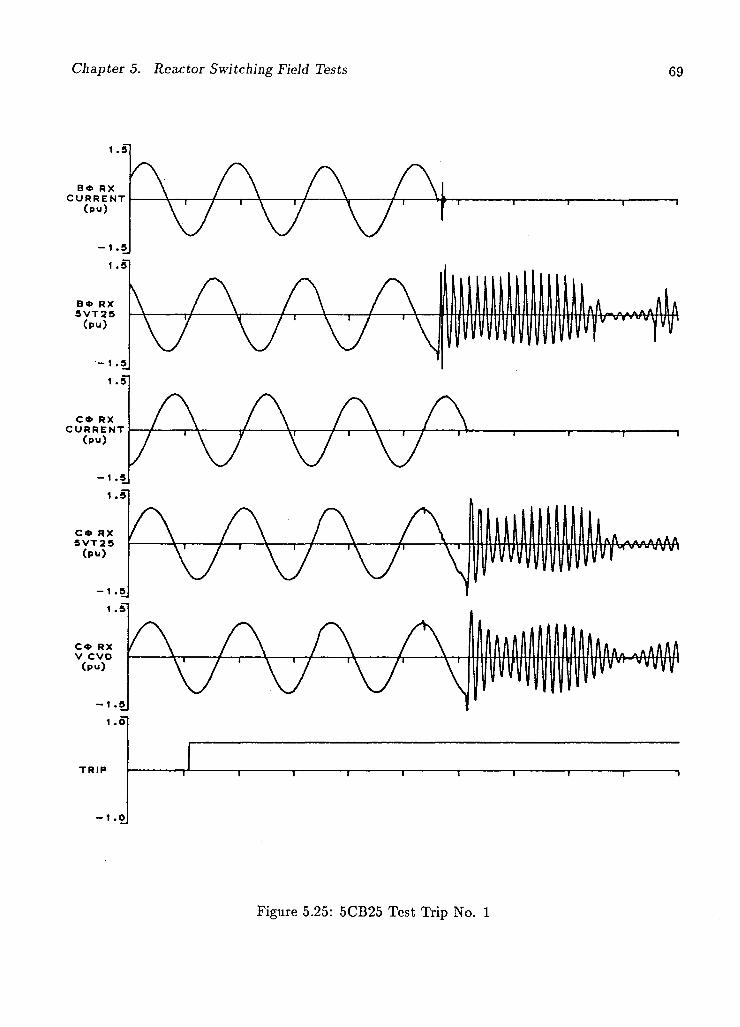
Chapter 5. Reactor Switching Field Tests 69
B * R X C U R R E N T
( p u )
C * R X C U R R E N T
( p u )
T R I P
•1 .0
Figure 5.25: 5CB25 Test Trip No. 1
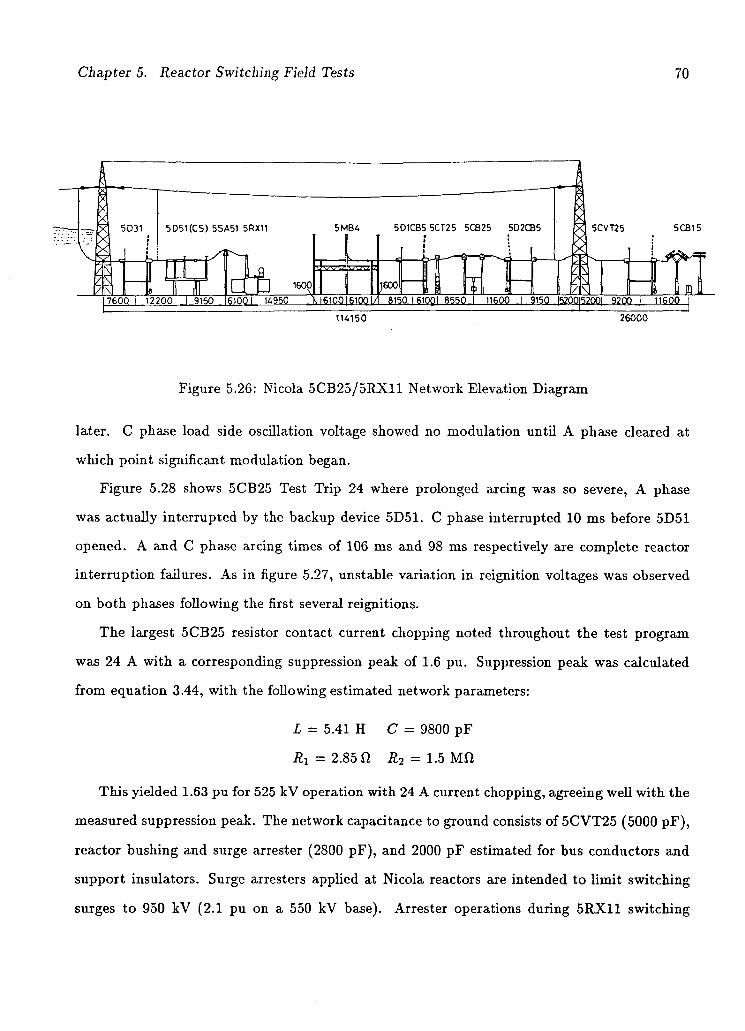
Chapter 5. Reactor Switching Field Tests 70
Figure 5.26: Nicola 5CB25/5RX11 Network Elevation Diagram
later. C phase load side oscillation voltage showed no modulation until A phase cleared at
which point significant modulation began.
Figure 5.28 shows 5CB25 Test Trip 24 where prolonged arcing was so severe, A phase
was actually interrupted by the backup device 5D51. C phase interrupted 10 ms before 5D51
opened. A and C phase arcing times of 106 ms and 98 ms respectively are complete reactor
interruption failures. As in figure 5.27, unstable variation in reignition voltages was observed
on both phases following the first several reignitions.
The largest 5CB25 resistor contact current chopping noted throughout the test program
was 24 A with a corresponding suppression peak of 1.6 pu. Suppression peak was calculated
from equation 3.44, with the following estimated network parameters:
L = 5.41 H C = 9800 pF
Rx = 2.85 ft R2 = 1.5 Mft
This yielded 1.63 pu for 525 kV operation with 24 A current chopping, agreeing well with the
measured suppression peak. The network capacitance to ground consists of 5CVT25 (5000 pF),
reactor bushing and surge arrester (2800 pF), and 2000 pF estimated for bus conductors and
support insulators. Surge arresters applied at Nicola reactors are intended to limit switching
surges to 950 kV (2.1 pu on a 550 kV base). Arrester operations during 5RX11 switching
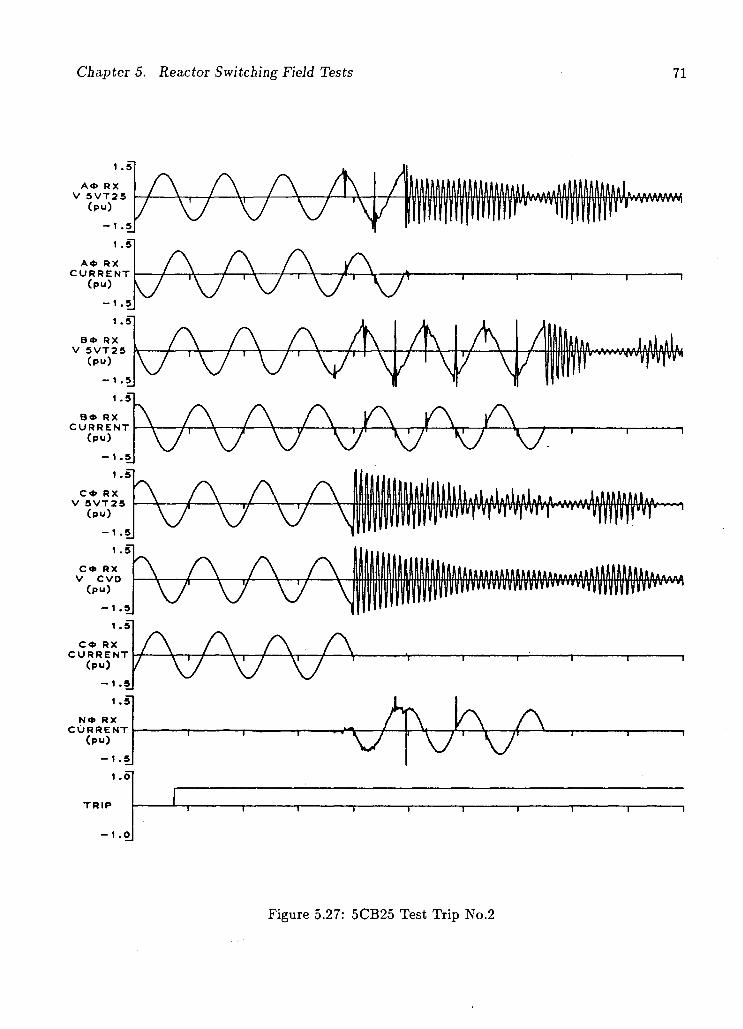
Chapter 5. Reactor Switching Field Tests 71
T R I P
Figure 5.27: 5CB25 Test Trip No.2
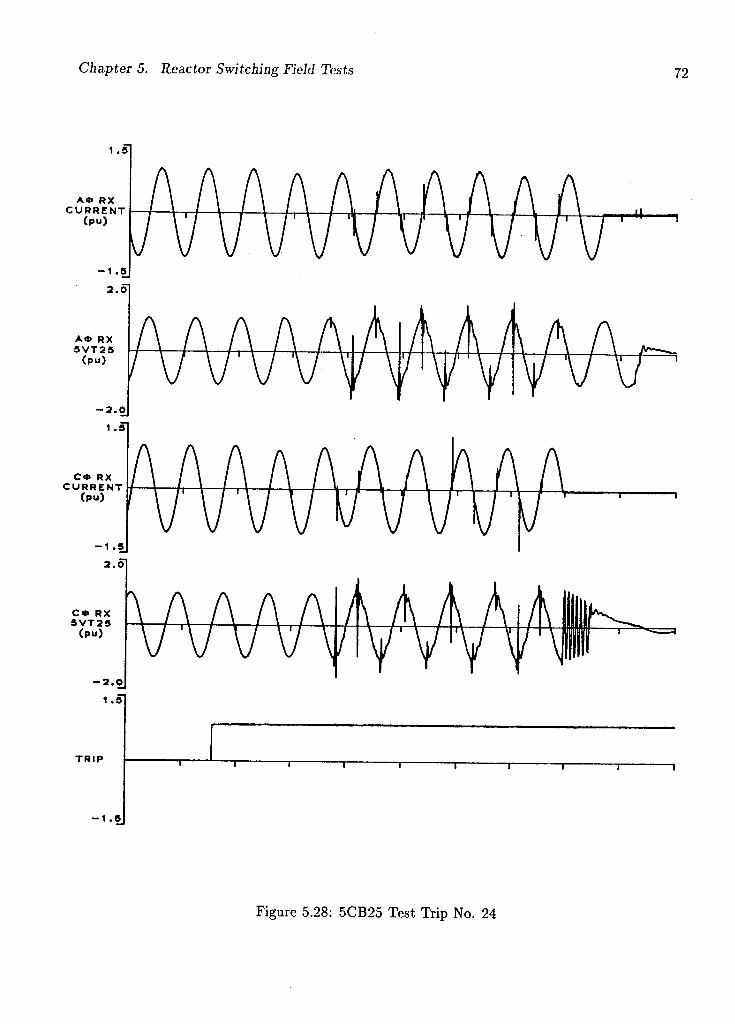
Chapter 5. Reactor Switching Field Tests 72
A * R X C U R R E N T
( p u )
C * R X C U R R E N T
<PU)
T R I P T r T 1 1 1 1 1
- 1 . S
Figure 5.28: 5CB25 Test Trip No. 24
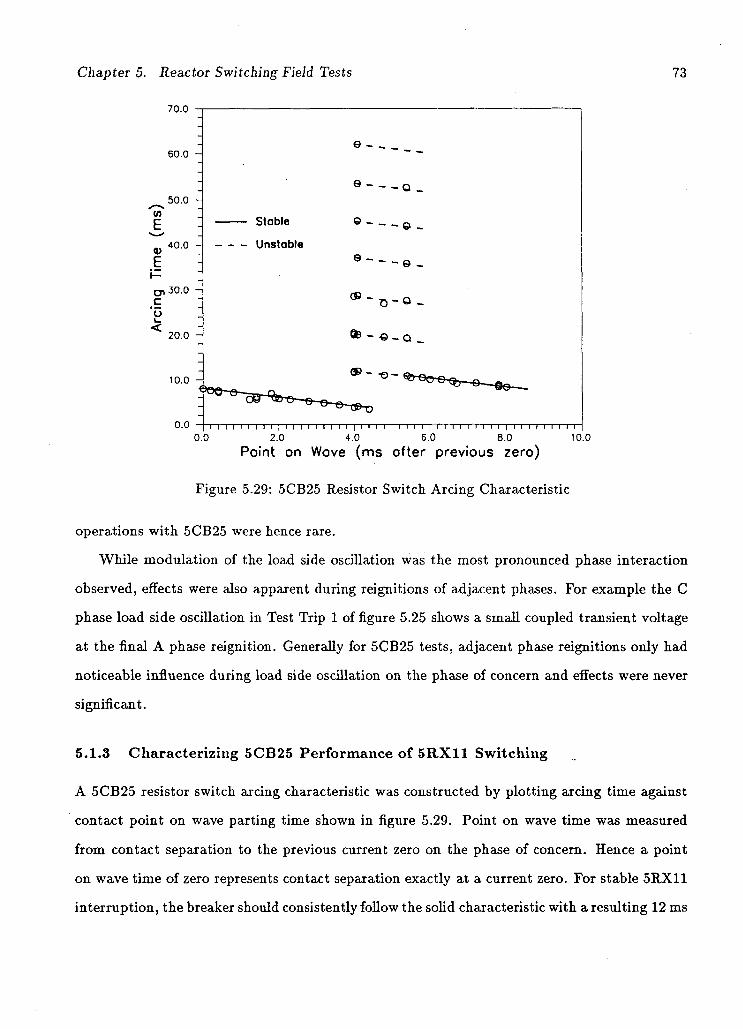
Chapter 5. Reactor Switching Field Tests 73
70.0
60.0 -
50.0 Vi
0)
E 40.0
'o <
30.0
20.0 -
10.0
Stable Unstable
e -
e ©
e - © -
0.0 | i i I I I I I I I | I I I I I I I I I | I I I i I I I I I | I I I I I I I I I | I I I I i I I I I 0.0 2.0 4.0 6.0 8.0 10.0
Point on Wove (ms ofter previous zero)
Figure 5.29: 5CB25 Resistor Switch Arcing Characteristic
operations with 5CB25 were hence rare.
While modulation of the load side oscillation was the most pronounced phase interaction
observed, effects were also apparent during reignitions of adjacent phases. For example the C
phase load side oscillation in Test Trip 1 of figure 5.25 shows a small coupled transient voltage
at the final A phase reignition. Generally for 5CB25 tests, adjacent phase reignitions only had
noticeable influence during load side oscillation on the phase of concern and effects were never
significant.
5.1.3 Characterizing 5CB25 Performance of 5RX11 Switching
A 5CB25 resistor switch arcing characteristic was constructed by plotting arcing time against
contact point on wave parting time shown in figure 5.29. Point on wave time was measured
from contact separation to the previous current zero on the phase of concern. Hence a point
on wave time of zero represents contact separation exactly at a current zero. For stable 5RX11
interruption, the breaker should consistently follow the solid characteristic with a resulting 12 ms
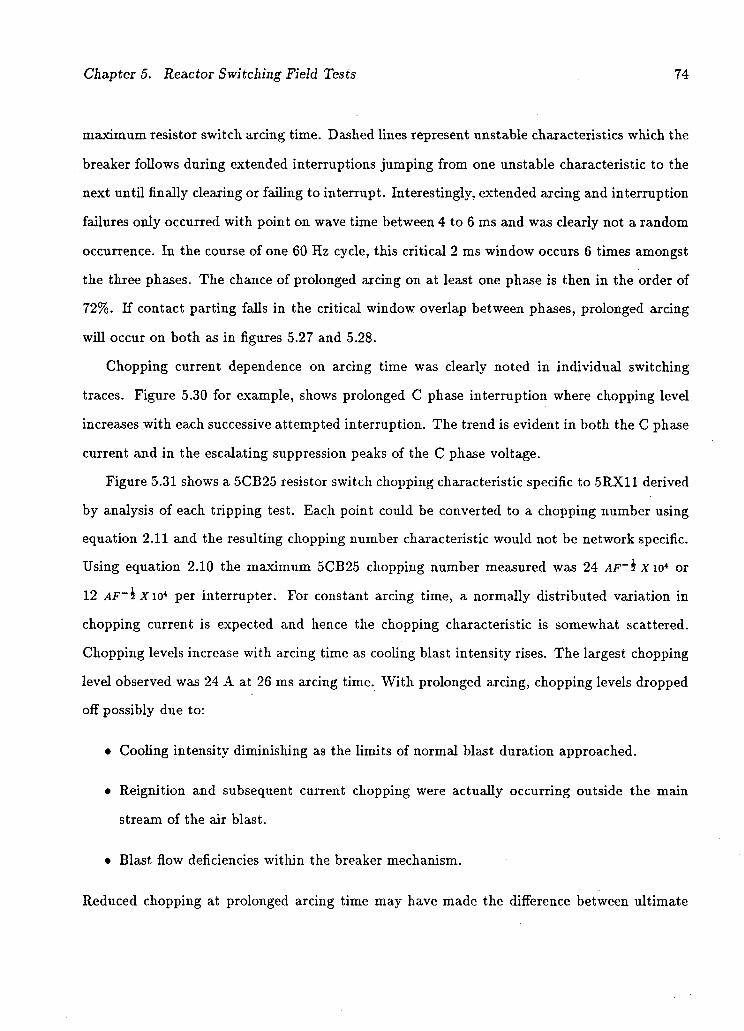
Chapter 5. Reactor Switching Field Tests 74
maximum resistor switch arcing time. Dashed lines represent unstable characteristics which the
breaker follows during extended interruptions jumping from one unstable characteristic to the
next until finally clearing or failing to interrupt. Interestingly, extended arcing and interruption
failures only occurred with point on wave time between 4 to 6 ms and was clearly not a random
occurrence. In the course of one 60 Hz cycle, this critical 2 ms window occurs 6 times amongst
the three phases. The chance of prolonged arcing on at least one phase is then in the order of
72%. Ii contact parting falls in the critical window overlap between phases, prolonged arcing
will occur on both as in figures 5.27 and 5.28.
Chopping current dependence on arcing time was clearly noted in individual switching
traces. Figure 5.30 for example, shows prolonged C phase interruption where chopping level
increases with each successive attempted interruption. The trend is evident in both the C phase
current and in the escalating suppression peaks of the C phase voltage.
Figure 5.31 shows a 5CB25 resistor switch chopping characteristic specific to 5RX11 derived
by analysis of each tripping test. Each point could be converted to a chopping number using
equation 2.11 and the resulting chopping number characteristic would not be network specific.
Using equation 2.10 the maximum 5CB25 chopping number measured was 24 AF~h xio4 or
12 AF~%xio* per interrupter. For constant arcing time, a normally distributed variation in
chopping current is expected and hence the chopping characteristic is somewhat scattered.
Chopping levels increase with arcing time as cooling blast intensity rises. The largest chopping
level observed was 24 A at 26 ms arcing time. With prolonged arcing, chopping levels dropped
off possibly due to:
• Cooling intensity diminishing as the limits of normal blast duration approached.
• Reignition and subsequent current chopping were actually occurring outside the main
stream of the air blast.
• Blast flow deficiencies within the breaker mechanism.
Reduced chopping at prolonged arcing time may have made the difference between ultimate
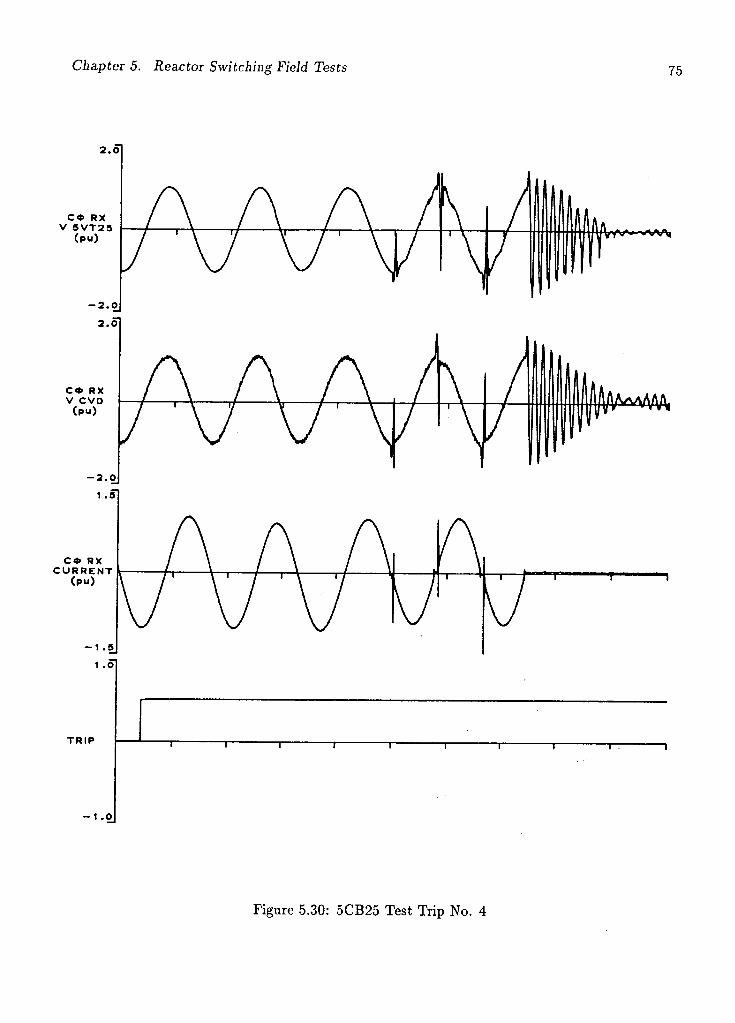
Chapter 5. Reactor Switching Field Tests 75
Figure 5.30: 5CB25 Test Trip No. 4
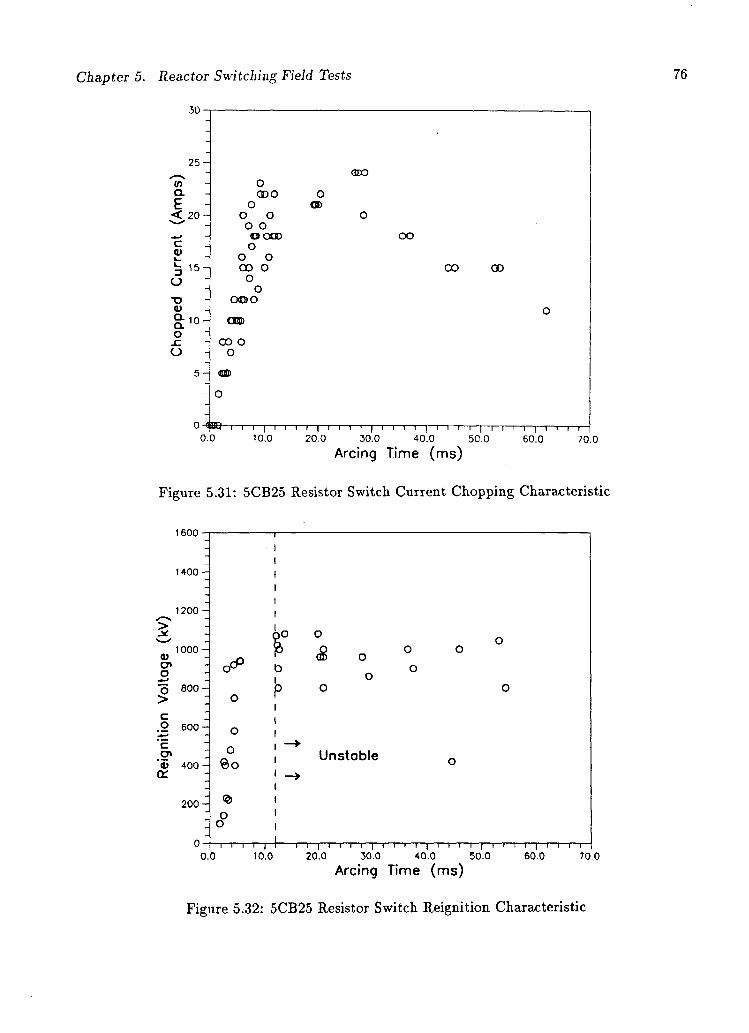
Chapter 5. Reactor Switching Field Tests
30-
2 5 -
• N CO
0 Q. mo E - o
< 2 0 - o o o o O OTJD C (U l_
o o o ^ 15- 00 o
O " o O " o TJ ooo 0J
GDI o
_c CO o o o
o GEO
OO
OO 0D
i i i | i i i i | i i i i | i i i i | i i i i | i i i i |—i i—i—r~ 0.0 10.0 20.0 30.0 40.0 50.0 60.0 70.0
Arcing Time (ms)
Figure 5.31: 5CB25 Resistor Switch Current Chopping Characteristic 1600
1400 -
1200 -
Cn O o > c o
1000
8 0 0 -
2 600 -
c
"flj or
400 -
2 0 0 -
0 — |— i— i— i— i— i— I— i — i— i— i— i— i— i— i — i— i— i— i— i— i— i — i— i— i— i— i— i— i — i— i— i— i— i— r 0.0 10.0 20.0 30.0 40.0 50.0 60.0 70.0
Arcing Time (ms)
Figure 5.32: 5CB25 Resistor Switch Reignition Characteristic
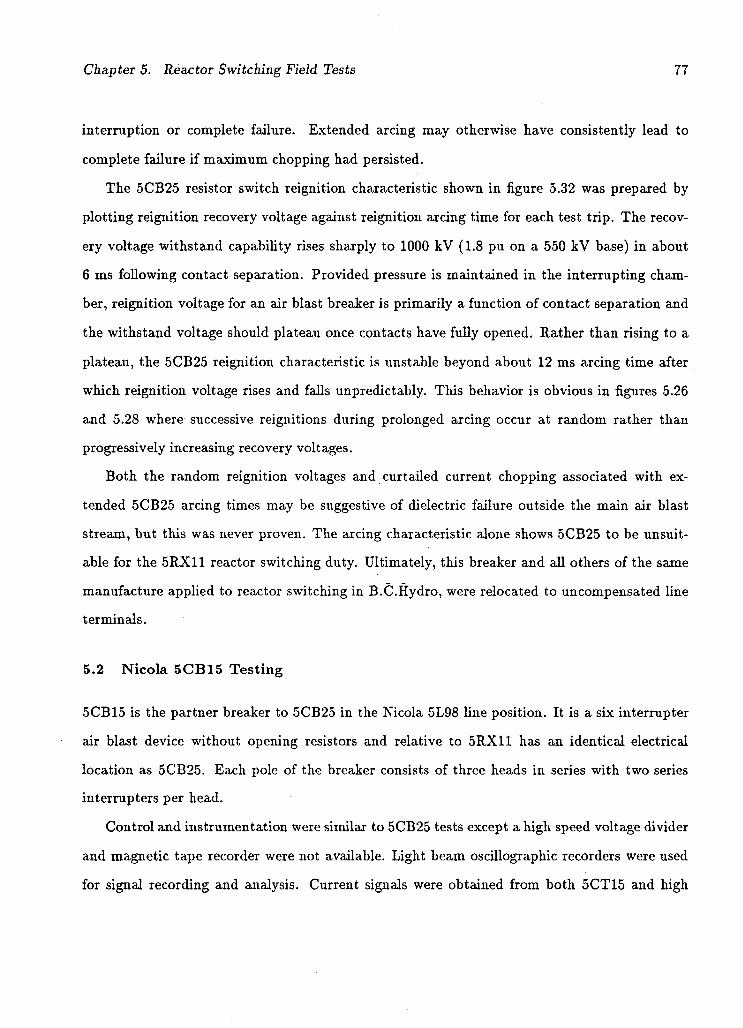
Chapter 5. Reactor Switching Field Tests 77
interruption or complete failure. Extended arcing may otherwise have consistently lead to
complete failure if maximum chopping had persisted.
The 5CB25 resistor switch reignition characteristic shown in figure 5.32 was prepared by
plotting reignition recovery voltage against reignition arcing time for each test trip. The recov
ery voltage withstand capability rises sharply to 1000 kV (1.8 pu on a 550 kV base) in about
6 ms following contact separation. Provided pressure is maintained in the interrupting cham
ber, reignition voltage for an air blast breaker is primarily a function of contact separation and
the withstand voltage should plateau once contacts have fully opened. Rather than rising to a
plateau, the 5CB25 reignition characteristic is unstable beyond about 12 ms arcing time after
which reignition voltage rises and falls unpredictably. This behavior is obvious in figures 5.26
and 5.28 where successive reignitions during prolonged arcing occur at random rather than
progressively increasing recovery voltages.
Both the random reignition voltages and curtailed current chopping associated with ex
tended 5CB25 arcing times may be suggestive of dielectric failure outside the main air blast
stream, but this was never proven. The arcing characteristic alone shows 5CB25 to be unsuit
able for the 5RX11 reactor switching duty. Ultimately, this breaker and all others of the same
manufacture applied to reactor switching in B.C.Hydro, were relocated to uncompensated line
terminals.
5.2 Nicola 5CB15 Testing
5CB15 is the partner breaker to 5CB25 in the Nicola 5L98 line position. It is a six interrupter
air blast device without opening resistors and relative to 5RX11 has an identical electrical
location as 5CB25. Each pole of the breaker consists of three heads in series with two series
interrupters per head.
Control and instrumentation were similar to 5CB25 tests except a high speed voltage divider
and magnetic tape recorder were not available. Light beam oscillographic recorders were used
for signal recording and analysis. Current signals were obtained from both 5CT15 and high

Chapter 5. Reactor Switching Field Tests 78
voltage bushing CT's of 5RX11 while load side voltages were recorded from 5CVT25.
5.2.1 5CB15 Test Observations
5CB15 chopped a maximum of 70 A during the test program exhibiting much higher chopping
numbers than 5CB25 (70.7 AF~h xw* overall or 28.9 AF~h xio* for a single interrupter). This
is due to the combination of higher air blast intensity and the absence of an opening resistor
switch. Surge arresters operated during each test and played an important role in successful
interruption. At 520 kV, the suppression peak calculated for 70 A chopping on 5RX11 inter
ruption is 3.93 pu. Such levels were never realized as 5RX11 surge arresters operated at 2 pu
or less.
Figure 5.33 is a typical 5CB15 interruption showing 5CT15 breaker phase currents (iUc,
IBC and, Ice), 5RX11 reactor currents [IAB, IBC and, ICA), and 5CVT25 voltages (VA, VB
and, Vc). Point wave time was sufficient to produce about 70 A current chopping on A phase.
The VA trace clearly shows immediate surge arrester operation and suppression peak is limited
to about 1.7 pu. The resulting breaker recovery voltage was hence not large enough to cause
reignition and interruption was successful. As the arrester operates, reactor energy discharges
as noted by the exponential decay of IAR- Without surge arresters, such high levels of current
chopping would most assuredly cause reignition. Phase B and C interruptions are somewhat
more eventful. B phase point on wave time is large enough that arcing time to the first zero is
too short for the opening contacts to withstand the suppression peak. Following 25 A current
chopping, suppression peak reignition occurs at 100 kV recovery voltage. The resulting second
parallel oscillation current is interrupted only to be followed by double recovery voltage reigni
tions at about 300 kV re-establishing 60 Hz current. B phase subsequently chopped about 65 A
causing surge arrester operation and thereby interrupting successfully. C phase interruption is
similar with arcing time to the first zero being even less. Initial current chopping of 5 A causes
a suppression peak reignition at 60 kV which is interrupted and followed by a single recovery
voltage reignition at 80 kV restoring 60 Hz current. The suppression peak reignition is a case of
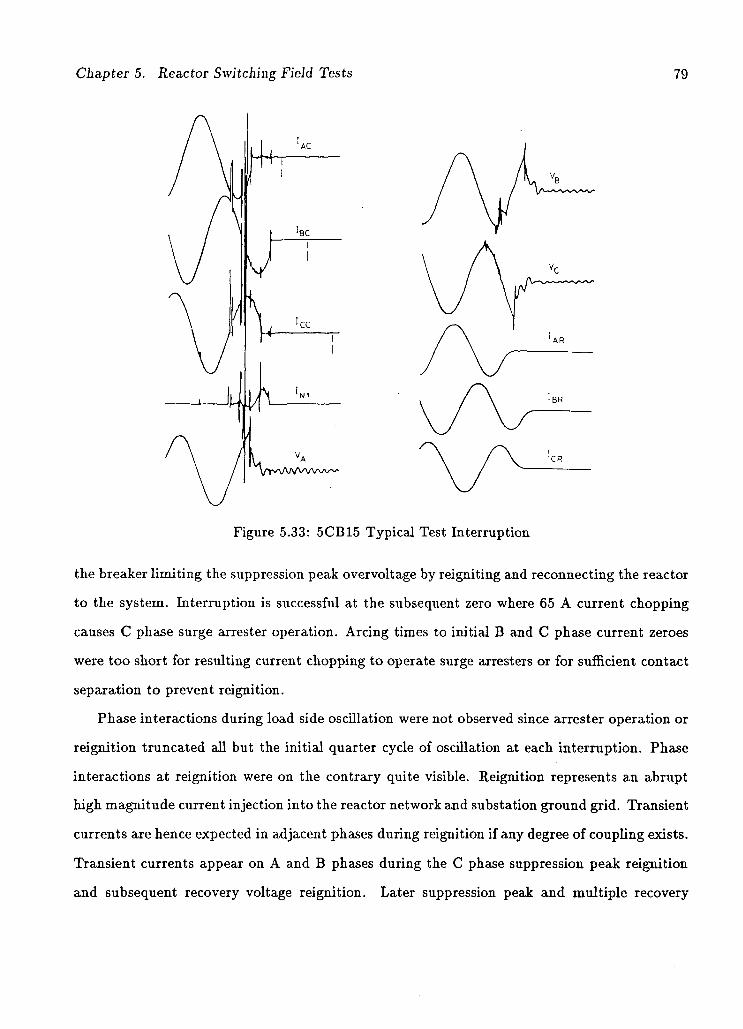
Chapter 5. Reactor Switching Field Tests 79
Figure 5.33: 5CB15 Typical Test Interruption
the breaker limiting the suppression peak overvoltage by reigniting and reconnecting the reactor
to the system. Interruption is successful at the subsequent zero where 65 A current chopping
causes C phase surge arrester operation. Arcing times to initial B and C phase current zeroes
were too short for resulting current chopping to operate surge arresters or for sufficient contact
separation to prevent reignition.
Phase interactions during load side oscillation were not observed since arrester operation or
reignition truncated all but the initial quarter cycle of oscillation at each interruption. Phase
interactions at reignition were on the contrary quite visible. Reignition represents an abrupt
high magnitude current injection into the reactor network and substation ground grid. Transient
currents are hence expected in adjacent phases during reignition if any degree of coupling exists.
Transient currents appear on A and B phases during the C phase suppression peak reignition
and subsequent recovery voltage reignition. Later suppression peak and multiple recovery
Chapter 5. Reactor Switching Field Tests 80
voltage reignitions on B phase couple sizable transient currents into A and C phases. These
transients do not appear in the measured reactor currents. Several factors must be considered
in interpreting these observations:
• Second parallel oscillation currents associated with reignition cannot flow appreciably in
the large reactor inductance but may be shunted past via bushing capacitance.
• Current flows in the ground mat directly beneath the reigniting breaker, elevating ground
potential and introducing high frequency currents into buried cables including those as
sociated with adjacent current transformers (5CT15).
• Absence of noise in the reactor current traces may in part be due to the the distance of
reactor cables from the reignition source. 5RX11 cable trenches are about 100 m from
5CB15 and run perpendicular to reactor busses over head.
• High frequency response of station current transformers is in the order of 10 kHz and
their transient response is completely unknown. They cannot be expected to accurately
reproduce the fast transient currents associated with reignition.
In summary the extent of interphase coupling at reignition cannot be concluded with confi
dence except to say it appears to be significant. Simulation work in Chapter 6 suggests coupled
currents during adjacent phase reignitions can in fact be substantial, especially when the breaker
does not have opening resistors.
5.2.2 Characterizing 5CB15 Performance During 5RX11 Switching
5CB15 arcing and current chopping characteristics plotted from point on wave, arcing time and
current chopping measurements are shown in figures 5.34 and 5.35. The arcing characteristic is
determined largely by whether the reactor network response to current chopping results in surge
arrester operation. Increasing from point on wave of 0 ms, arcing time is sufficient that resulting
chopping levels cause arrester operation leading to successful interruption. As point on wave

Chapter 5. Reactor Switching Field Tests
20.0
15.0 H tn
. § 10.0
*U <
5.0 H
0.0
Stable
Unstable
1 1 1 1—! 1 I I l I — n — i i i — i — i — r - i — i — i — *>*
t ) n . 0.0 2.0 4.0 6.0 8.0
Point on Wave (ms after previous zero)
Figure 5.34: 5CB15 Arcing Characteristic
10.0
Arcing Time (ms)
Figure 5.35: 5CB15 Current Chopping Characteristic
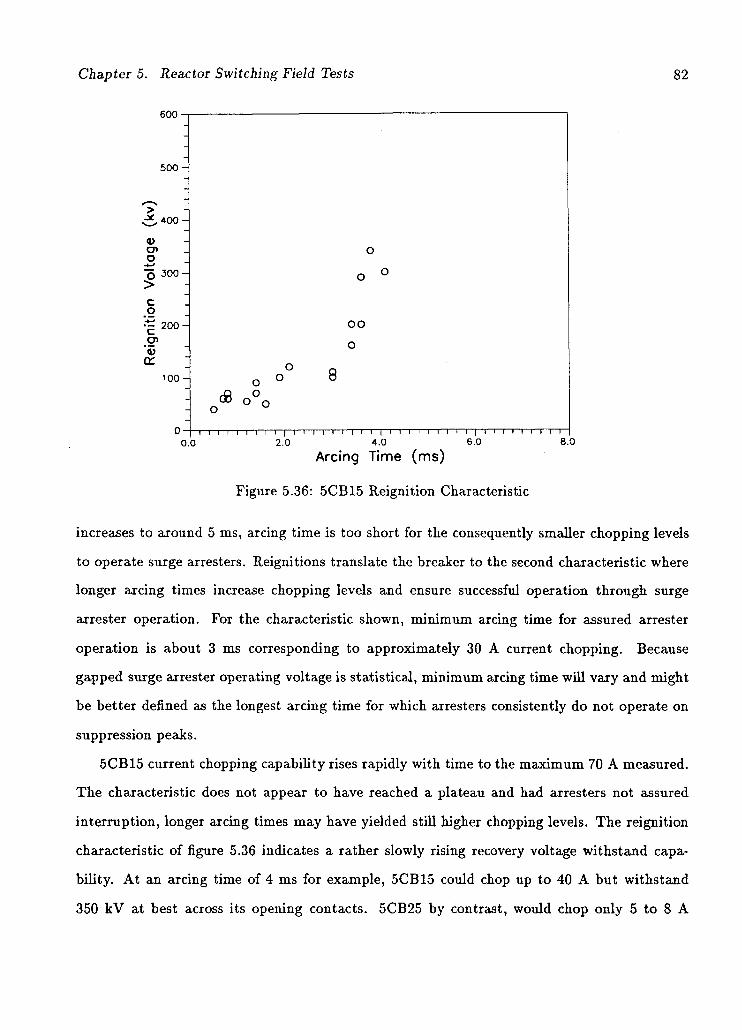
Chapter 5. Reactor Switching Field Tests 82
600
500 -
> J* ,400-
ID cn o
|S 300
C
•"j: 200
or 100 -
oo o
0 I i i i i i i i i i | i i i i i i i i i | i i i i i i i i i | i i i I i i i i 0.0 2.0 4.0 6.0 8.0
Arcing Time (ms)
Figure 5.36: 5CB15 Reignition Characteristic
increases to around 5 ms, arcing time is too short for the consequently smaller chopping levels
to operate surge arresters. Reignitions translate the breaker to the second characteristic where
longer arcing times increase chopping levels and ensure successful operation through surge
arrester operation. For the characteristic shown, minimum arcing time for assured arrester
operation is about 3 ms corresponding to approximately 30 A current chopping. Because
gapped surge arrester operating voltage is statistical, minimum arcing time will vary and might
be better defined as the longest arcing time for which arresters consistently do not operate on
suppression peaks.
5CB15 current chopping capability rises rapidly with time to the maximum 70 A measured.
The characteristic does not appear to have reached a plateau and had arresters not assured
interruption, longer arcing times may have yielded still higher chopping levels. The reignition
characteristic of figure 5.36 indicates a rather slowly rising recovery voltage withstand capa
bility. At an arcing time of 4 ms for example, 5CB15 could chop up to 40 A but withstand
350 kV at best across its opening contacts. 5CB25 by contrast, would chop only 5 to 8 A
Chapter 5. Reactor Switching Field Tests 83
and withstand at least 400 kV thus having a much higher chance of successful interruption.
This difference may be due to lower contact acceleration or an increased likelihood of timing
spread between the six 5CB15 series interrupters versus four in 5CB25. Either effect would
delay 5CB15 contacts reaching their maximum separation. High current chopping levels with
resulting arrester operations made it impossible to fix points on the reignition characteristic
beyond 4 ms. Surge arresters are mandatory in this 5CB15 reactor switching application not
only for insulation protection, but also to ensure expedient interruption. In the presence of
surge arresters, 5CB15 handles the 5RX11 switching duty easily.
5.3 Nicola 5CB3 Testing
5CB3 is a line breaker associated with 5L72 which is shunt compensated by 5RX3. An air
blast device, 5CB3 has six series interrupters per phase with each phase consisting of three dual
interrupter heads. Opening resistors are not incorporated in the design of this breaker. Though
of a different manufacture, the electrical location of 5CB3 relative to 5RX3, is identical to that
of 5CB25 relative to 5RX11. 5RX3 is a four reactor scheme with a 1000 Q neutral reactor, and
phase reactors identical to 5RX11. 5L72 line protection initiates single pole tripping for single
phase faults and 5RX3 must compensate phase to phase line capacitance to ensure successful
fault clearing.
Originally, this test program was initiated to investigate misoperation of a 5RX8 pressure
relief micro-switch causing false protection system tripping during a 5RX3 interruption with
5CB3. The study confirmed the misoperation was due to 5RX8 control cable transients during
5CB3 reignitions.
Control and instrumentation were the same as applied in 5CB15 testing as a magnetic tape
recorder and high frequency capacitive divider were unavailable. 5CT3 currents together with
5CVT12 and 5CVT13 voltages were monitored and recorded on light beam oscillographs.
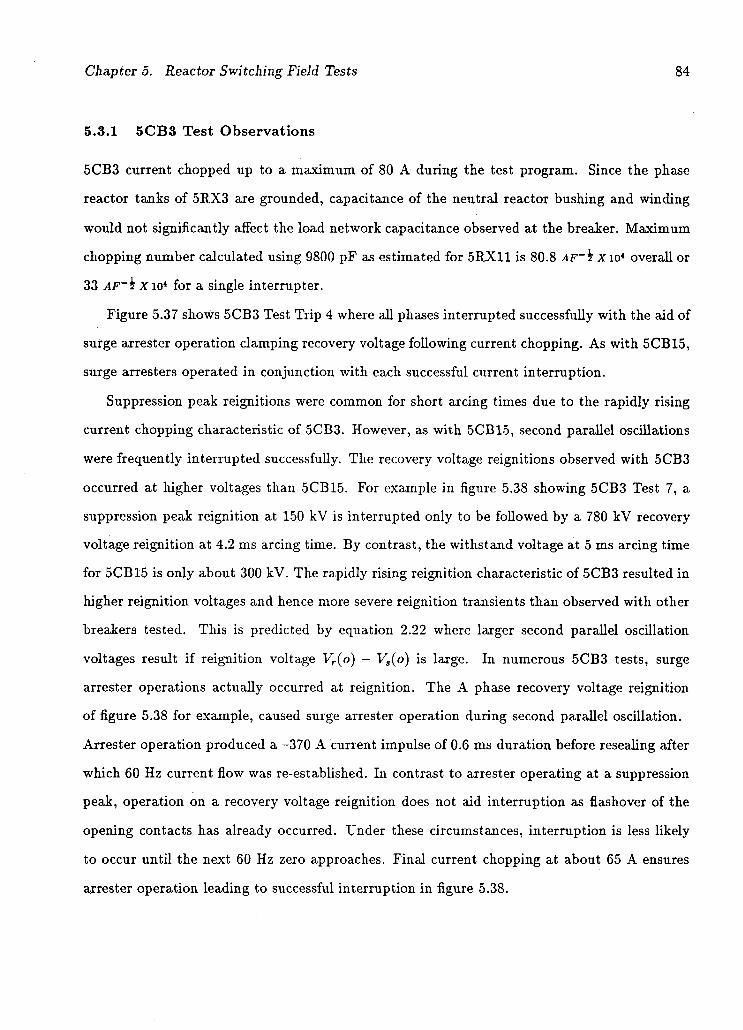
Chapter 5. Reactor Switching Field Tests 84
5.3.1 5CB3 Test Observations
5CB3 current chopped up to a maximum of 80 A during the test program. Since the phase
reactor tanks of 5RX3 are grounded, capacitance of the neutral reactor bushing and winding
would not significantly affect the load network capacitance observed at the breaker. Maximum
chopping number calculated using 9800 pF as estimated for 5RX11 is 80.8 AF~i Xio* overall or
33 A F ~ i x io4 for a single interrupter.
Figure 5.37 shows 5CB3 Test Trip 4 where all phases interrupted successfully with the aid of
surge arrester operation clamping recovery voltage following current chopping. As with 5CB15,
surge arresters operated in conjunction with each successful current interruption.
Suppression peak reignitions were common for short arcing times due to the rapidly rising
current chopping characteristic of 5CB3. However, as with 5CB15, second parallel oscillations
were frequently interrupted successfully. The recovery voltage reignitions observed with 5CB3
occurred at higher voltages than 5CB15. For example in figure 5.38 showing 5CB3 Test 7, a
suppression peak reignition at 150 kV is interrupted only to be followed by a 780 kV recovery
voltage reignition at 4.2 ms arcing time. By contrast, the withstand voltage at 5 ms arcing time
for 5CB15 is only about 300 kV. The rapidly rising reignition characteristic of 5CB3 resulted in
higher reignition voltages and hence more severe reignition transients than observed with other
breakers tested. This is predicted by equation 2.22 where larger second parallel oscillation
voltages result if reignition voltage Vr(o) — Vs(o) is large. In numerous 5CB3 tests, surge
arrester operations actually occurred at reignition. The A phase recovery voltage reignition
of figure 5.38 for example, caused surge arrester operation during second parallel oscillation.
Arrester operation produced a -370 A current impulse of 0.6 ms duration before resealing after
which 60 Hz current flow was re-established. In contrast to arrester operating at a suppression
peak, operation on a recovery voltage reignition does not aid interruption as flashover of the
opening contacts has already occurred. Under these circumstances, interruption is less likely
to occur until the next 60 Hz zero approaches. Final current chopping at about 65 A ensures
arrester operation leading to successful interruption in figure 5.38.
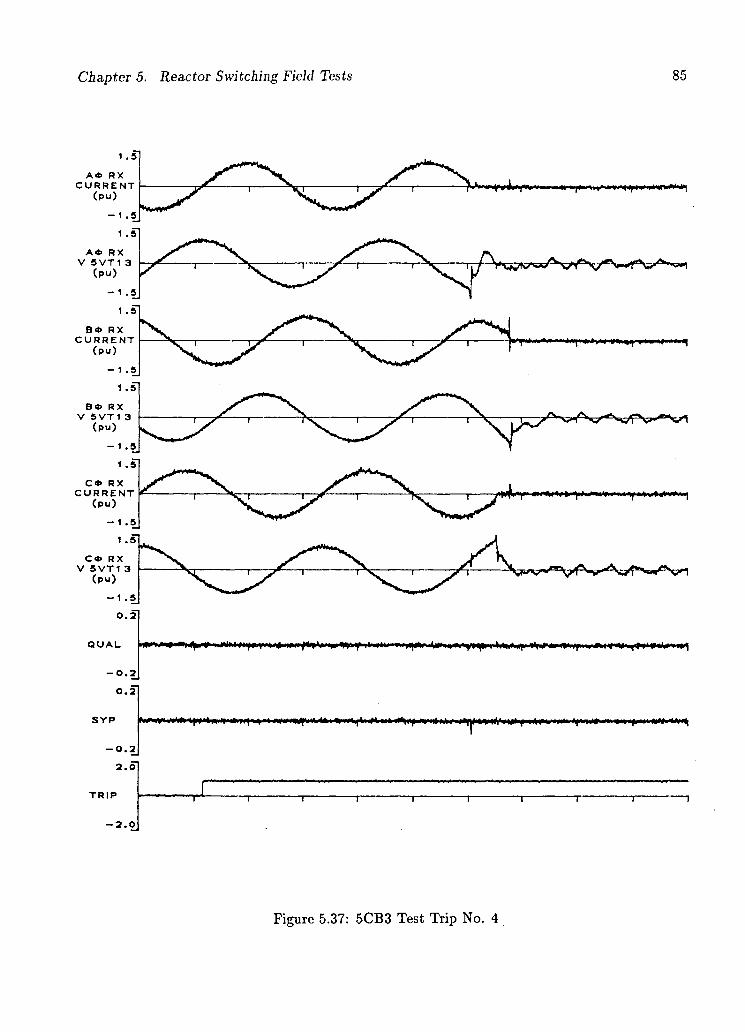
Chapter 5. Reactor Switching Field Tests 85
B * R X C U R R E N T
( p u )
Q U A L
-0.2 0.2
S Y P
-0.2 2.0
T R I P
-2.0
Figure 5.37: 5CB3 Test Trip No. 4
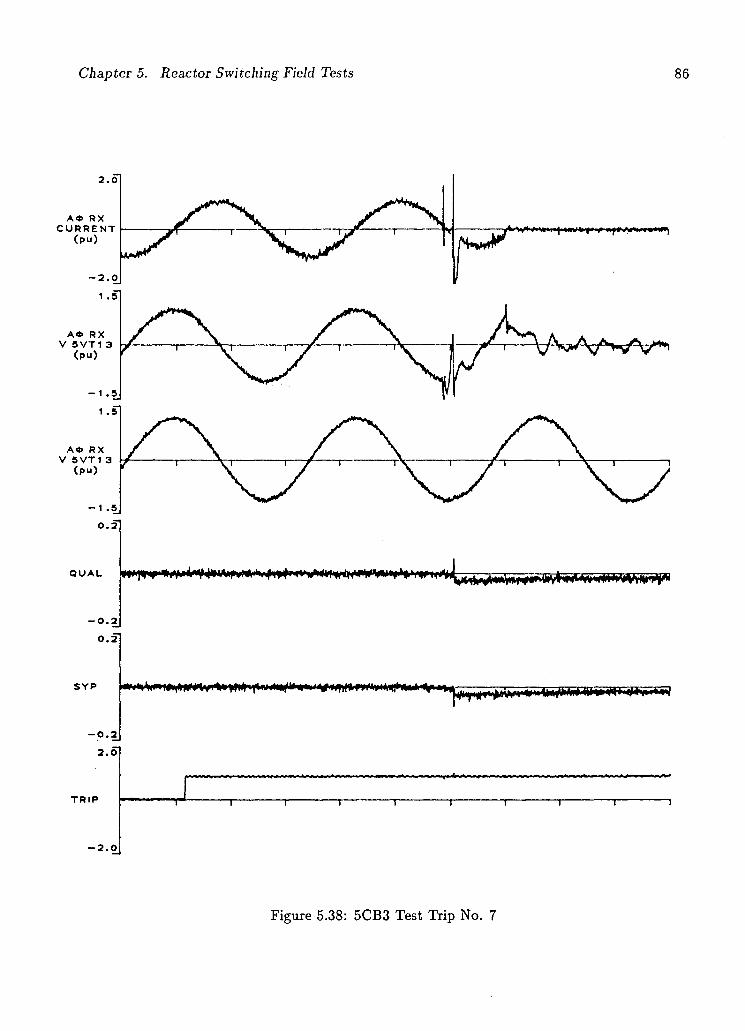
Chapter 5. Reactor Switching Field Tests 86
A * R X C U R R E N T
( p u )
A * R X V 5 V T 1 3
( p u )
A * R X V 5 V T 1 3
( p u )
Q U A L
-0.2 0.2
-0.2 2.0
T R I P
•2.0
~i 1 1 1 1 r ~i 1
Figure 5.38: 5CB3 Test Trip No. 7
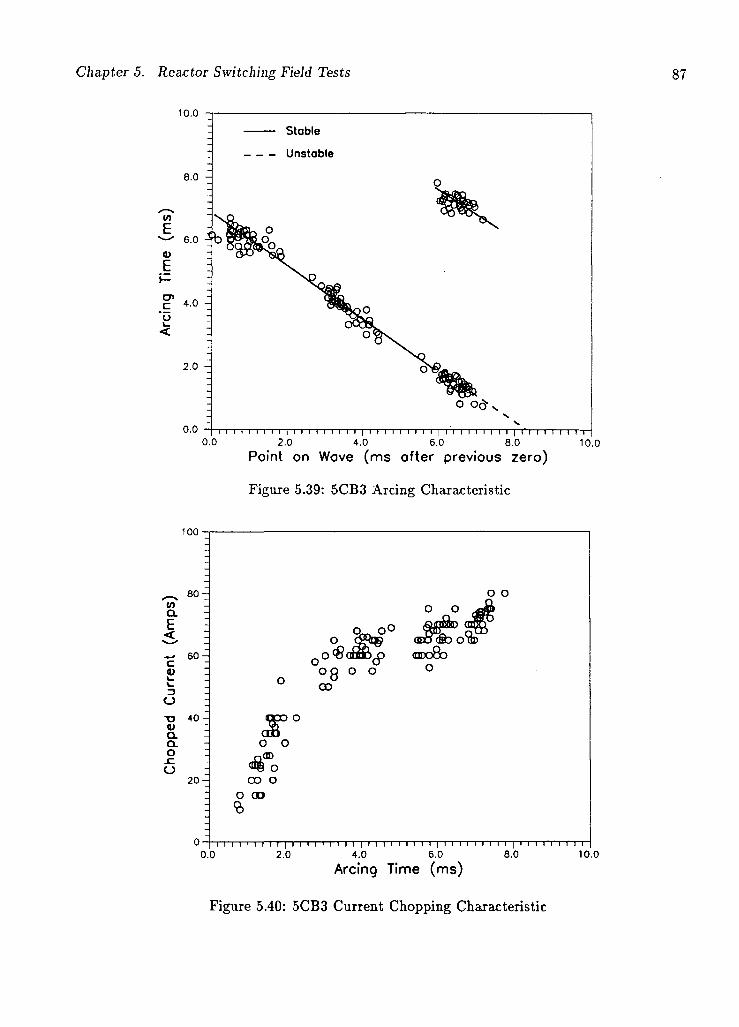
Chapter 5. Reactor Switching Field Tests 87
10.0
i i i i i i i i i i i i i i i i i i i i i i i I I i i i i i i i i i i i i i i i i' i i i i i i i i 0.0 2.0 4.0 6.0 8.0 10.0
Point on Wove (ms after previous zero)
Figure 5.39: 5CB3 Arcing Characteristic
100 -
^ SOOT CL E <,
— 60-C 9) t_ v .
o T> 40 • V CL CL O sz O
20-
o o ° ° _cfi$
o dMg» (BCMHfo 0 %
(•DO8O
o O Q O O o 00
« D O
aob o o
««8 o C O o
O CD 93
0.0 2.0 4.0 6.0 8.0 10.0
Arcing Time (ms)
Figure 5.40: 5CB3 Current Chopping Characteristic
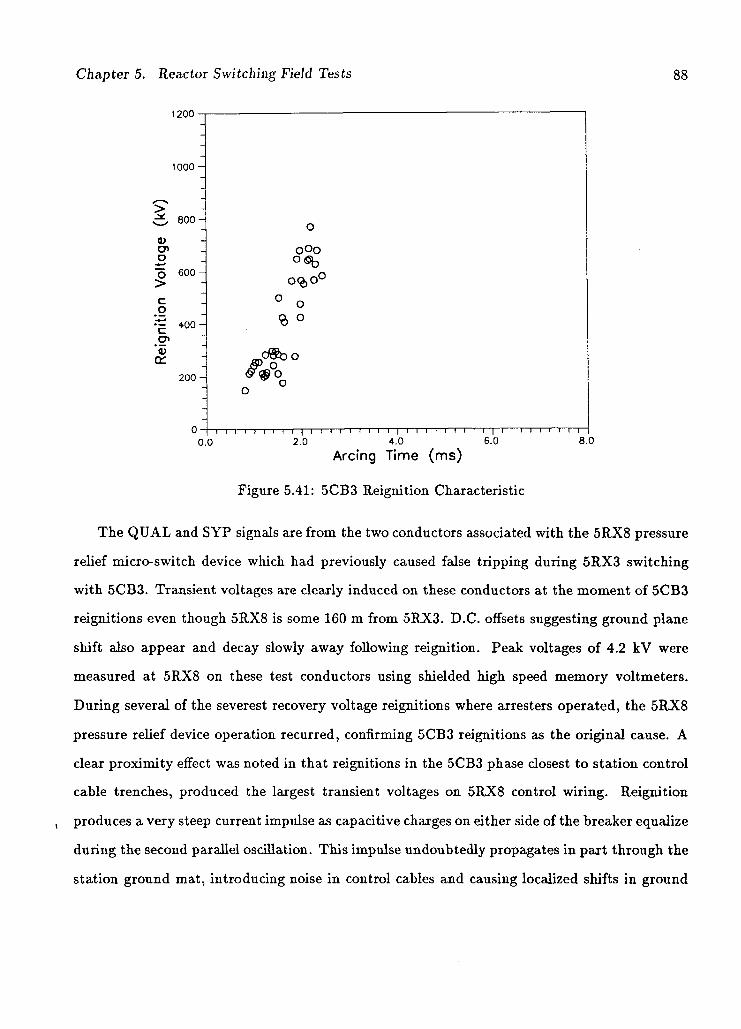
Chapter 5. Reactor Switching Field Tests 88
1 2 0 0
1 0 0 0 -(K
V)
8 0 0 - o
tage
- ooo ° « b
Voli
6 0 0 - 0<g)0°
igni
tion
4 0 0 -
° o °
Rei
_ o « b o 2 0 0 - &<$ o
o °
0 I i i i i i i i i I | I I I I I I I I I | I I I I I I I I i | I i ' i I i ' I I 0 . 0 2 . 0 4 . 0 6 . 0 8 . 0
Arcing Time (ms)
Figure 5.41: 5CB3 Reignition Characteristic
The QUAL and SYP signals are from the two conductors associated with the 5RX8 pressure
relief micro-switch device which had previously caused false tripping during 5RX3 switching
with 5CB3. Transient voltages are clearly induced on these conductors at the moment of 5CB3
reignitions even though 5RX8 is some 160 m from 5RX3. D.C. offsets suggesting ground plane
shift also appear and decay slowly away following reignition. Peak voltages of 4.2 kV were
measured at 5RX8 on these test conductors using shielded high speed memory voltmeters.
During several of the severest recovery voltage reignitions where arresters operated, the 5RX8
pressure relief device operation recurred, confirming 5CB3 reignitions as the original cause. A
clear proximity effect was noted in that reignitions in the 5CB3 phase closest to station control
cable trenches, produced the largest transient voltages on 5RX8 control wiring. Reignition
produces a very steep current impulse as capacitive charges on either side of the breaker equalize
during the second parallel oscillation. This impulse undoubtedly propagates in part through the
station ground mat, introducing noise in control cables and causing localized shifts in ground
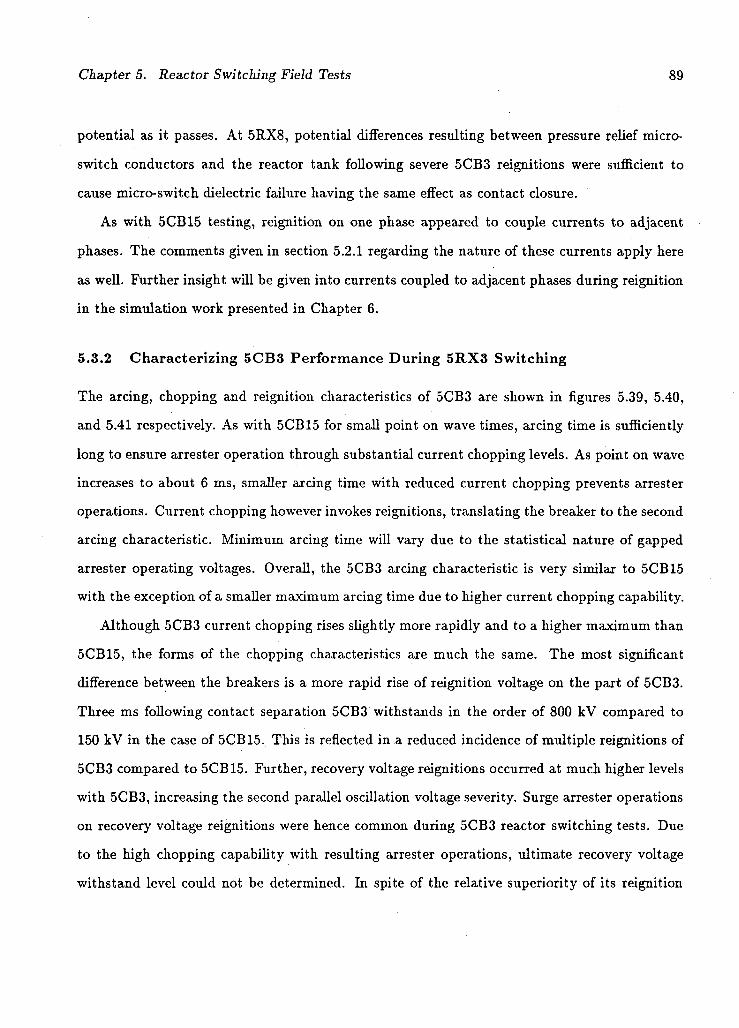
Chapter 5. Reactor Switching Field Tests 89
potential as it passes. At 5RX8, potential differences resulting between pressure relief micro-
switch conductors and the reactor tank following severe 5CB3 reignitions were sufficient to
cause micro-switch dielectric failure having the same effect as contact closure.
As with 5CB15 testing, reignition on one phase appeared to couple currents to adjacent
phases. The comments given in section 5.2.1 regarding the nature of these currents apply here
as well. Further insight will be given into currents coupled to adjacent phases during reignition
in the simulation work presented in Chapter 6.
5.3.2 Characterizing 5CB3 Performance During 5RX3 Switching
The arcing, chopping and reignition characteristics of 5CB3 are shown in figures 5.39, 5.40,
and 5.41 respectively. As with 5CB15 for small point on wave times, arcing time is sufficiently
long to ensure arrester operation through substantial current chopping levels. As point on wave
increases to about 6 ms, smaller arcing time with reduced current chopping prevents arrester
operations. Current chopping however invokes reignitions, translating the breaker to the second
arcing characteristic. Minimum arcing time will vary due to the statistical nature of gapped
arrester operating voltages. Overall, the 5CB3 arcing characteristic is very similar to 5CB15
with the exception of a smaller maximum arcing time due to higher current chopping capability.
Although 5CB3 current chopping rises slightly more rapidly and to a higher maximum than
5CB15, the forms of the chopping characteristics are much the same. The most significant
difference between the breakers is a more rapid rise of reignition voltage on the part of 5CB3.
Three ms following contact separation 5CB3 withstands in the order of 800 kV compared to
150 kV in the case of 5CB15. This is reflected in a reduced incidence of multiple reignitions of
5CB3 compared to 5CB15. Further, recovery voltage reignitions occurred at much higher levels
with 5CB3, increasing the second parallel oscillation voltage severity. Surge arrester operations
on recovery voltage reignitions were hence common during 5CB3 reactor switching tests. Due
to the high chopping capability with resulting arrester operations, ultimate recovery voltage
withstand level could not be determined. In spite of the relative superiority of its reignition
Chapter 5. Reactor Switching Field Tests 90
characteristic, 5CB3 in this application requires reactor surge arresters for both insulation
protection as well as reliable interruption.
5.4 Nicola 5D44 Testing
5D44 is one of five SF6 puffer type load interrupting switches applied at Nicola substation for
dedicated reactor switching. Each phase consists of two SFe interrupters and a series connected
disconnect switch. Within each interrupter are three contact sets in series, each consisting
of a main contact and parallel arcing contact. During interruption, the main contacts part,
transferring current to the arcing contacts where it is eventually quenched in an SFe puff and
interrupted.
Electrically, 5D44 is situated with respect to 5RX4 in identical fashion to 5D51 with respect
to 5RX11 in figure 5.26. Following a 5RX3 switching failure, the manufacturer confirmed 5D44
was not rated for switching four reactor schemes. This was resolved by adding a switch to auto
matically bypass the neutral reactor during 5RX3 switching. Earlier models of the SF6 switch
behaved somewhat erratically as shown in the arcing characteristic of figure 5.42. The device
operated primarily on characteristics (ii) and (iii) making arcing time quite unpredictable. The
fourth characteristic actually represents a complete failure which occurred during testing. This
unstable behavior was determined by the manufacturer to be due to an uneven division of
recovery voltage between the two series interrupters per phase. Once modified to correct the
unbalance, the device was tested on site to determine its suitability for three reactor grounded
bank switching duty. The neutral reactor 5NR4 was by-passed for the test program.
Individual phases of the load interrupter are coupled with drive shafts and gear reduction
units to actuate the entire assembly from a single motor drive. Timing spread between the
phases can be significant due to mechanical dead band in elements of the switch drive mech
anism. Arcing times can hence be difficult to deduce because time between trip command
application and contact parting varies significantly between operations. To overcome this prob
lem, B and C phases of the switch were fitted with opto-mechanical transducers providing
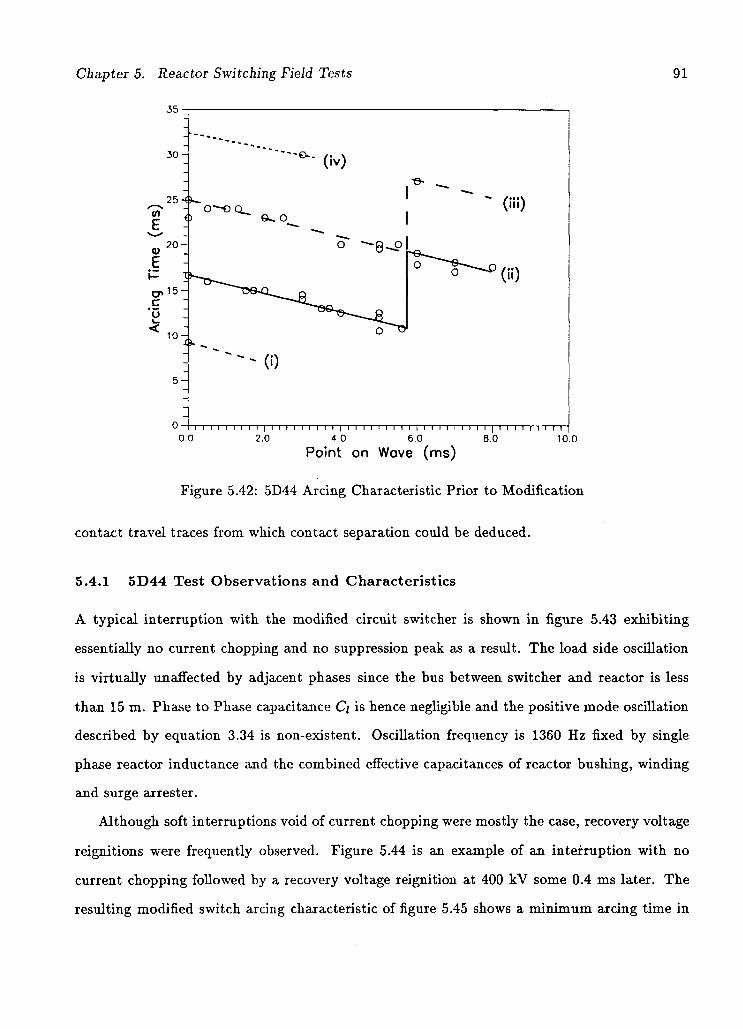
Chapter 5. Reactor Switching Field Tests 91
Figure 5.42: 5D44 Arcing Characteristic Prior to Modification
contact travel traces from which contact separation could be deduced.
5.4.1 5D44 Test Observations and Characteristics
A typical interruption with the modified circuit switcher is shown in figure 5.43 exhibiting
essentially no current chopping and no suppression peak as a result. The load side oscillation
is virtually unaffected by adjacent phases since the bus between switcher and reactor is less
than 15 m. Phase to Phase capacitance C\ is hence negligible and the positive mode oscillation
described by equation 3.34 is non-existent. Oscillation frequency is 1360 Hz fixed by single
phase reactor inductance and the combined effective capacitances of reactor bushing, winding
and surge arrester.
Although soft interruptions void of current chopping were mostly the case, recovery voltage
reignitions were frequently observed. Figure 5.44 is an example of an interruption with no
current chopping followed by a recovery voltage reignition at 400 kV some 0.4 ms later. The
resulting modified switch arcing characteristic of figure 5.45 shows a minimum arcing time in
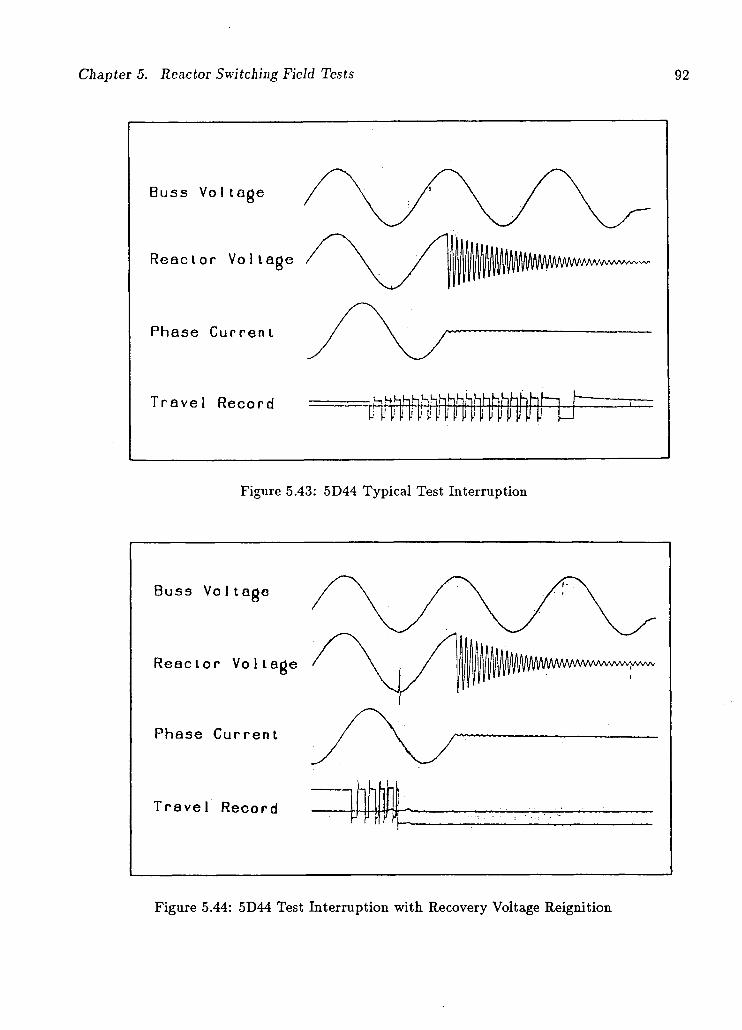
Chapter 5. Reactor Switching Field Tests 92
Figure 5.43: 5D44 Typical Test Interruption
Figure 5.44: 5D44 Test Interruption with Recovery Voltage Reignition
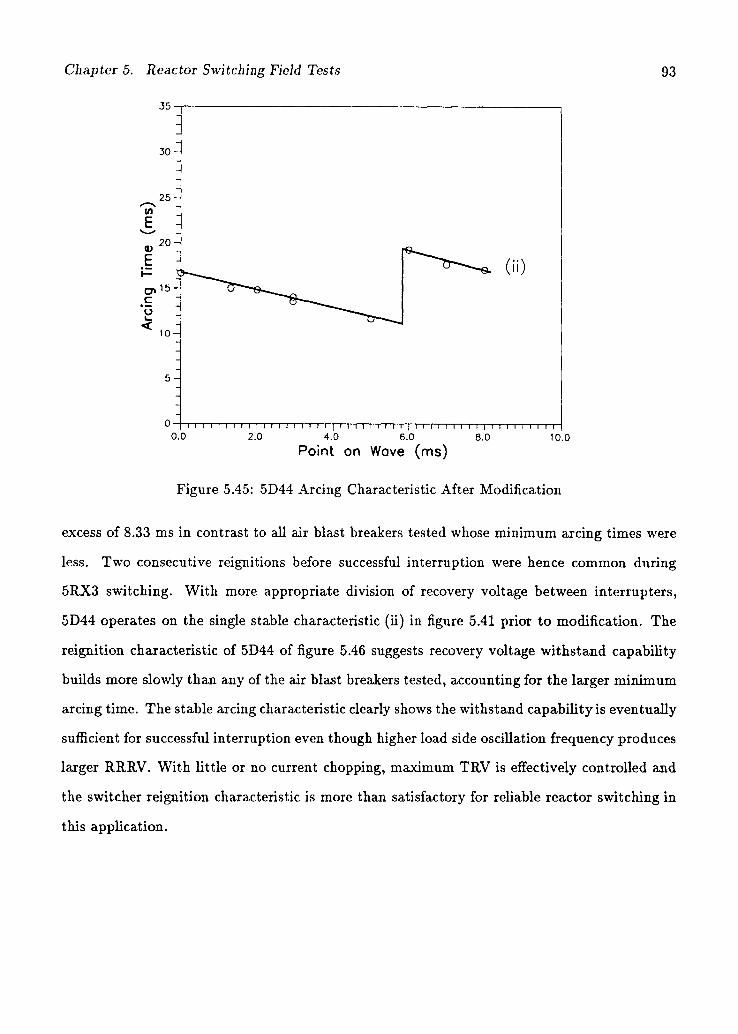
Chapter 5. Reactor Switching Field Tests 93
o | I I i I i i i i i | i i i i i i I i i | i i i i i i i i i | i i i i i i i i i | i i i I i i i i I 0.0 2.0 4.0 6.0 8.0 10.0
Point on Wove (ms)
Figure 5.45: 5D44 Arcing Characteristic After Modification
excess of 8.33 ms in contrast to all air blast breakers tested whose minimum arcing times were
less. Two consecutive reignitions before successful interruption were hence common during
5RX3 switching. With more appropriate division of recovery voltage between interrupters,
5D44 operates on the single stable characteristic (ii) in figure 5.41 prior to modification. The
reignition characteristic of 5D44 of figure 5.46 suggests recovery voltage withstand capability
builds more slowly than any of the air blast breakers tested, accounting for the larger minimum
arcing time. The stable arcing characteristic clearly shows the withstand capability is eventually
sufficient for successful interruption even though higher load side oscillation frequency produces
larger RRRV. With little or no current chopping, maximum TRV is effectively controlled and
the switcher reignition characteristic is more than satisfactory for reliable reactor switching in
this application.

Chapter 5. Reactor Switching Field Tests 94
1000
I I I I I I I I I I I I I I I I I I I I I I I | M I I I I I | I I I I I I I | I I I I I I I 1 I I 0.0 2.0 4.0 6.0 8.0 10.0 12.0
Arcing Time (ms) 14.0 16.0
Figure 5.46: 5D44 Reignition Characteristic After Modification
5.5 Switchgear Field Testing Summary
In presenting these test results, the transient phenomena of current chopping, load side oscilla
tion, reignition, and interaction of natural reactor network modes due to interphase coupling,
have been graphically demonstrated. While station current transformers were not fast enough
to show arc current instability oscillations, or the details of second parallel oscillation currents,
valuable information on air blast breaker current chopping behavior was derived.
To contrast current chopping ability, single unit maximum chopping numbers are listed in
table 5.2 for these tests and for tests by others. Maximum chopping numbers are of prime
concern since they govern worst case load side oscillation overvoltages and hence the likelihood
of reignition. The single unit chopping numbers measured for Nicola breakers are in line with
those published by others for breakers with and without opening resistors. 5CB25 resistor
switch chopping was markedly reduced over 5CB3 and 5CB15 as predicted theoretically in
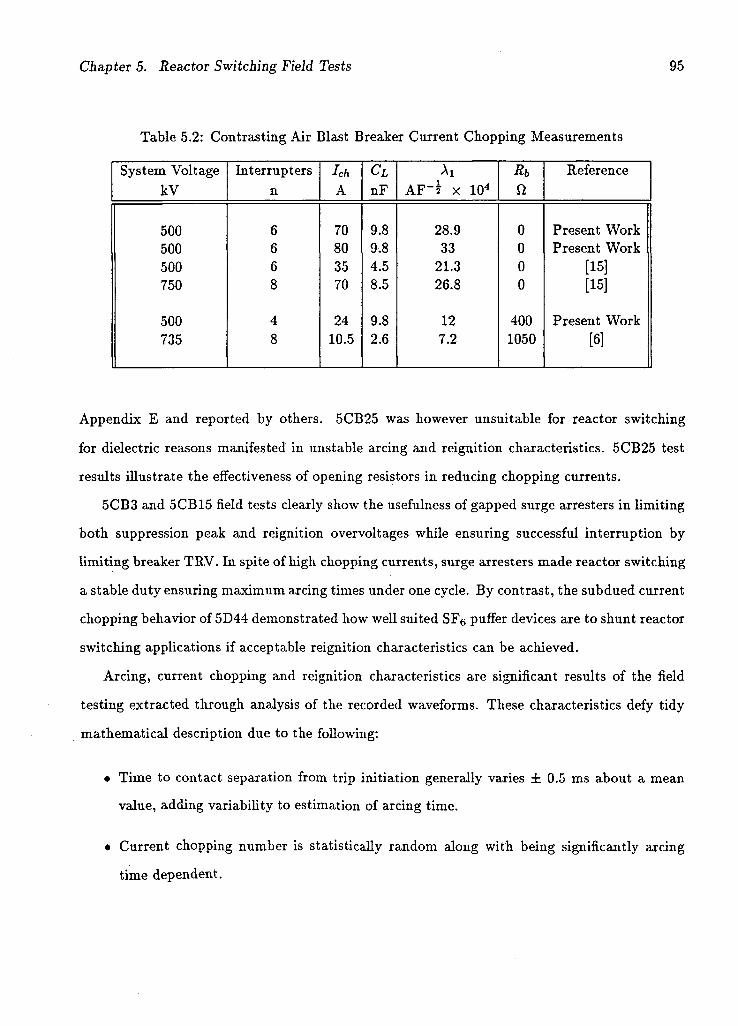
Chapter 5. Reactor Switching Field Tests 95
Table 5.2: Contrasting Air Blast Breaker Current Chopping Measurements
System Voltage Interrupters Ich CL Ai Rb Reference
kV n A nF AF"5 x 104 ft
500 6 70 9.8 28.9 0 Present Work 500 6 80 9.8 33 0 Present Work 500 6 35 4.5 21.3 0 [15] 750 8 70 8.5 26.8 0 [15]
500 4 24 9.8 12 400 Present Work 735 8 10.5 2.6 7.2 1050 [6]
Appendix E and reported by others. 5CB25 was however unsuitable for reactor switching
for dielectric reasons manifested in unstable arcing and reignition characteristics. 5CB25 test
results illustrate the effectiveness of opening resistors in reducing chopping currents.
5CB3 and 5CB15 field tests clearly show the usefulness of gapped surge arresters in limiting
both suppression peak and reignition overvoltages while ensuring successful interruption by
limiting breaker TRV. In spite of high chopping currents, surge arresters made reactor switching
a stable duty ensuring maximum arcing times under one cycle. By contrast, the subdued current
chopping behavior of 5D44 demonstrated how well suited SF§ puffer devices are to shunt reactor
switching applications if acceptable reignition characteristics can be achieved.
Arcing, current chopping and reignition characteristics are significant results of the field
testing extracted through analysis of the recorded waveforms. These characteristics defy tidy
mathematical description due to the following:
• Time to contact separation from trip initiation generally varies ± 0.5 ms about a mean
value, adding variability to estimation of arcing time.
• Current chopping number is statistically random along with being significantly arcing
time dependent.
Chapter 5. Reactor Switching Field Tests 96
• Flashover voltage of an opening contact air gap is statistically random.
• Air blast pressure and velocity and consequentially arc quenching effectiveness, will not
be precisely repeatable.
These characteristics will nevertheless be very useful in accounting for switchgear behavior in
computer simulation of reactor switching transients to be considered in the following chapter.
Arcing characteristics derived for each device show clearly the stability with which the
reactor network interruption duty is performed as well as the shortest and longest clearing
times which can be expected in the application studied.
Chapter 6
Simulating Reactor Switching to Predict Circuit Breaker Performance
This chapter examines some essential aspects of reactor switching simulation. Various ap
proaches are considered and chosen for studying the important transients associated with cur
rent chopping, load side oscillations and breaker reignitions. These are presented in the contexts
of:
1 . Studying reactor network transients during interruption.
2. Predicting circuit breaker performance during reactor interruption.
Cases chosen for simulation pertain directly to tests discussed in the previous chapter. In partic
ular, test interruptions will be reconstructed to verify a circuit breaker performance prediction
technique.
The analyses of load side oscillation in Appendix B and reignition in Appendix C, were
based on simple lumped reactor network models. While this gave general ideas of what may be
expected, the distributed nature of the reactor network and source side station busses can sig
nificantly alter lumped parameter results especially in the case of reignition. Where interphase
coupling is not negligible, analytical methods can be very difficult to apply. If the network
of concern can be modelled adequately, simulation will predict load side oscillation, breaker
recovery voltage, and reignition transients where lumped parameter analysis is cumbersome or
cannot be justified.
6.1 A Method for Predicting Breaker Performance During Reactor Interruption
In Chapter 4, a practical method of measuring circuit breaker current chopping and reignition
characteristics was outlined. By application to field test data, characteristics were derived in
97
Chapter 6. Simulating Reactor Switching to Predict Circuit Breaker Performance 98
Chapter 5 for four devices applied to 500 kV reactor switching in a B.C. Hydro substation.
Armed with these data, and a detailed knowledge of the reactor network, a simulation
facility such as EMTP may be used to estimate or predict breaker performance on reactor
interruption. First, the reactor network must be modelled to offer an accurate representation
at expected load sided oscillation frequencies. Performance for a particular contact parting
time (point on wave) may then be predicted as follows:
1. A.C. Voltage sources are shifted such that the start of the simulation correspond to the
instant of breaker contacts parting in order that study time is the simulated arcing time.
Currents at the start then correspond to the point on wave time to be studied.
2. The first phase current to approach zero in the simulation is superimposed on the breaker
current chopping characteristic, and intersection determines current chopping for the first
interruption. If the capacitance of the reactor network being considered is not the same as
where the chopping characteristic was measured, chopping levels must be adjusted using
equation 2.10.
3. Simulating the estimated first phase current chopping, resulting recovery voltage is su
perimposed on the breaker reignition characteristic. If intersection occurs, interruption
fails and reignition voltage can be estimated at the point of intersection.
4. Simulation continues with the first phase interrupted if successful or representing it's
reignition if indicated until the next phase current approaches zero. By superimposing on
the chopping characteristic as the second current approaches zero, the second interruption
chopping level is estimated.
5. Steps 2 through 4 are then repeated until all phases have successfully interrupted or one or
more phases have reignited several times. In the later case, interruption must be deemed
unsuccessful.
Chapter 6. Simulating Reactor Switching to Predict Circuit Breaker Performance 99
6. If the details of reignition are of interest, they should be simulated using a reactor repre
sentation suited to the high frequencies associated with second parallel oscillation. If only
the fact reignition has occurred is to be represented, the low frequency model is sufficient.
Ultimately, this approach should be useful in predicting expected transients and circuit
breaker performance if the reactor network were altered, or the same breaker applied else
where. Chapter 5 graphically demonstrated the very different results obtained switching the
same reactor network (5RX11) with two different breakers (5CB15 and 5CB25). Clearly, cir
cuit breaker characteristics must be incorporated into simulations if results are to reflect such
differences.
In simulating interruption to estimate breaker performance, reactor network and source
representations must be reasonably accurate at expected load side oscillation frequencies. Since
these are typically less than 5 kHz, fairly simple representations can be used [6]. Realistic
simulation of load side oscillation after current chopping is vital in order to:
1. Accurately predict reignition or successful interruption of a breaker pole.
2. Correctly invoke surge arrester operations at higher current chopping levels. Surge ar
resters can limit recovery voltage to levels which a breaker can comfortably withstand.
Failing to properly invoke surge arrester operation in interruption simulations can mean
the difference between correct and erroneous breaker performance prediction.
Accurately determining reignition transients in multi-phase reactor networks, requires signif
icant modelling detail. High frequency reactor and bus representation are mandatory as is
detailed representation of the substation on the source side of the breaker [1]. Fortunately,
such detail is not essential if the goal is simply predicting whether reignition occurs. Sev
eral approaches to modelling for load side oscillation and reignition study are discussed in the
following sections.
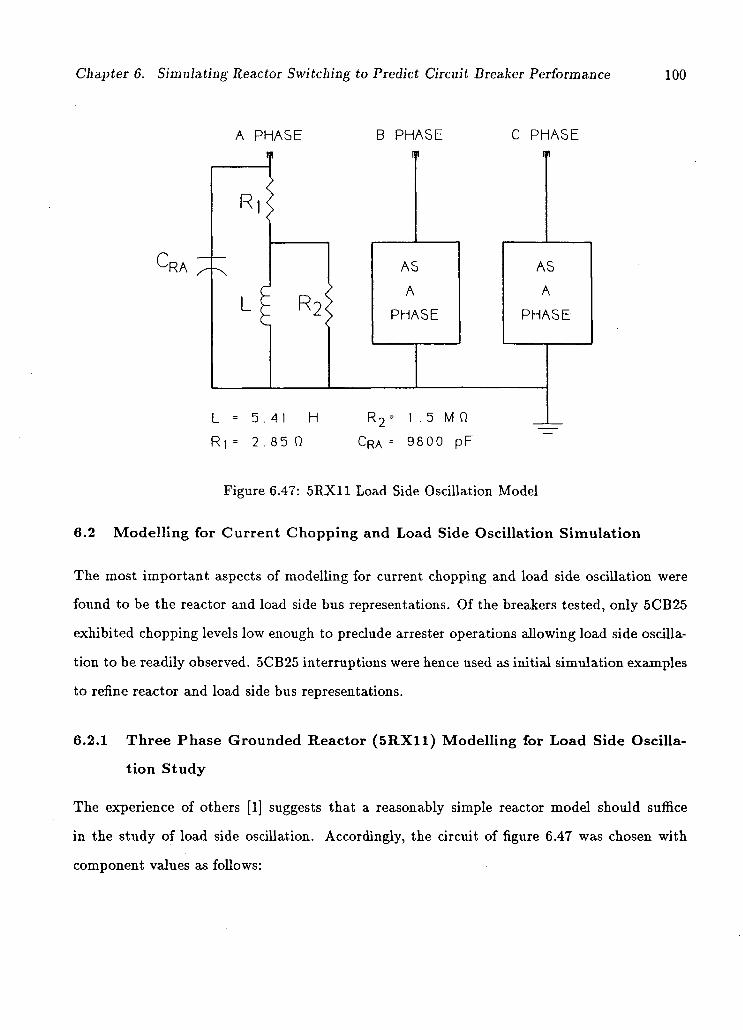
Chapter 6. Simulating Reactor Switching to Predict Circuit Breaker Performance 100
C RA
A PHASE
R"
L R2:
L = 5 .41 H R i - 2.85 Q
B PHASE B
AS A
PHASE
R 2 = 1.5 C R A = 9800 pF
C PHASE m
AS A
PHASE
Figure 6.47: 5RX11 Load Side Oscillation Model
6.2 Modelling for Current Chopping and Load Side Oscillation Simulation
The most important aspects of modelling for current chopping and load side oscillation were
found to be the reactor and load side bus representations. Of the breakers tested, only 5CB25
exhibited chopping levels low enough to preclude arrester operations allowing load side oscilla
tion to be readily observed. 5CB25 interruptions were hence used as initial simulation examples
to refine reactor and load side bus representations.
6.2.1 Three Phase Grounded Reactor (5RX11) Modelling for Load Side Oscilla
tion Study
The experience of others [1] suggests that a reasonably simple reactor model should suffice
in the study of load side oscillation. Accordingly, the circuit of figure 6.47 was chosen with
component values as follows:
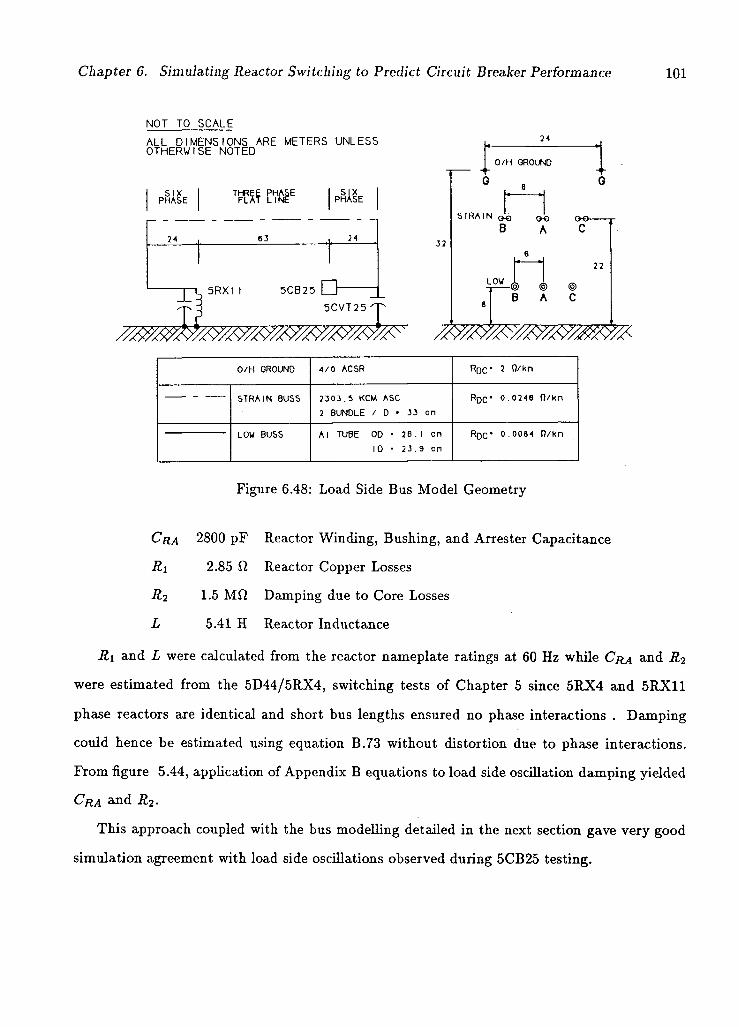
Chapter 6. Simulating Reactor Switching to Predict Circuit Breaker Performance 101
N O T T O S C A L E
A L L D I M E N S I O N S A R E M E T E R S U N L E S S O T H E R W I S E N O T E D
SIX PHASE
SIX PHASE
24 24
5RX1 I 5 C B 2 5 D-5 C V T 2 5 ' p
24
O/H GROUND
S T R A I N c x j , ^
B A oo-C
LOW
22
© ® ® B A C
O/H GROUND 4/0 ACSR RQC ' 2 0/kn
STRAIN BUSS 2 303.5 KCM ASC 2 BUNDLE / D • 33 on
RQC" 0.0248 Ovkn
LOW BUSS Al TUBE OD • 26.1 cn ID • 23.9 cn
RrjC" 0.0084 f)/kn
Figure 6.48: Load Side Bus Model Geometry
CRA 2800 pF Reactor Winding, Bushing, and Arrester Capacitance
.Ri 2.85 ft Reactor Copper Losses
R2 1.5 Mf2 Damping due to Core Losses
L 5.41 H Reactor Inductance
R\ and L were calculated from the reactor nameplate ratings at 60 Hz while CRA and R2
were estimated from the 5D44/5RX4, switching tests of Chapter 5 since 5RX4 and 5RX11
phase reactors are identical and short bus lengths ensured no phase interactions . Damping
could hence be estimated using equation B.73 without distortion due to phase interactions.
From figure 5.44, application of Appendix B equations to load side oscillation damping yielded
CRA and R2.
This approach coupled with the bus modelling detailed in the next section gave very good
simulation agreement with load side oscillations observed during 5CB25 testing.
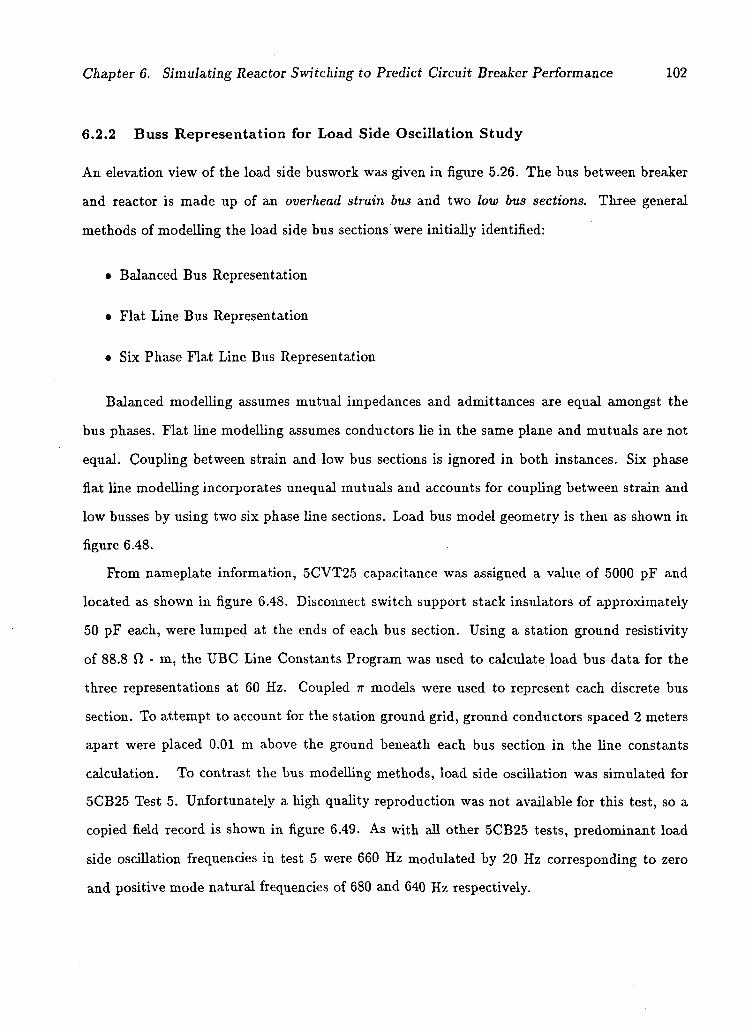
Chapter 6. Simulating Reactor Switching to Predict Circuit Breaker Performance 102
6.2.2 Buss Representation for Load Side Oscillation Study
An elevation view of the load side buswork was given in figure 5.26. The bus between breaker
and reactor is made up of an overhead strain bus and two low bus sections. Three general
methods of modelling the load side bus sections were initially identified:
• Balanced Bus Representation
• Flat Line Bus Representation
• Six Phase Flat Line Bus Representation
Balanced modelling assumes mutual impedances and admittances are equal amongst the
bus phases. Flat line modelling assumes conductors lie in the same plane and mutuals are not
equal. Coupling between strain and low bus sections is ignored in both instances. Six phase
flat line modelling incorporates unequal mutuals and accounts for coupling between strain and
low busses by using two six phase line sections. Load bus model geometry is then as shown in
figure 6.48.
From nameplate information, 5CVT25 capacitance was assigned a value of 5000 pF and
located as shown in figure 6.48. Disconnect switch support stack insulators of approximately
50 pF each, were lumped at the ends of each bus section. Using a station ground resistivity
of 88.8 fl - m, the UBC Line Constants Program was used to calculate load bus data for the
three representations at 60 Hz. Coupled 7T models were used to represent each discrete bus
section. To attempt to account for the station ground grid, ground conductors spaced 2 meters
apart were placed 0.01 m above the ground beneath each bus section in the line constants
calculation. To contrast the bus modelling methods, load side oscillation was simulated for
5CB25 Test 5. Unfortunately a high quality reproduction was not available for this test, so a
copied field record is shown in figure 6.49. As with all other 5CB25 tests, predominant load
side oscillation frequencies in test 5 were 660 Hz modulated by 20 Hz corresponding to zero
and positive mode natural frequencies of 680 and 640 Hz respectively.

Chapter 6. Simulating Reactor Switching to Predict Circuit Breaker Performance 103
Figure 6.49: 5CB25 Test 5: C Phase Load Side Oscillation Field Record
Figures 6.50, 6.51 and 6.52 respectively show C phase load side oscillation simulated using
each of the three bus modelling techniques. All yield natural frequencies of 660 Hz and 20 -
22 Hz as observed in field tests confirming network capacitances have been estimated quite
accurately. The six phase flat line model gave the strongest modulation and agreed most
closely with the field results in later simulations. Each method yielded the same suppression
and recovery peaks, so breaker TRV would not be significantly affected by the choice of bus
models for the solidly grounded case. Based on this comparison, six phase flat line load bus
modelling was applied for all subsequent load side oscillation simulations.
6.2.3 Source Representation for Load Side Oscillation Simulation
As expected, source representation for load side oscillation was not found to be critical. Begin
ning with fairly detailed transmission interconnections to adjacent stations, the source repre
sentation was progressively simplified to that shown in figure 6.53.
Use of the equivalent characteristic impedance of adjacent circuits in parallel with a 60 Hz

Chapter 6. Simulating Reactor Switching to Predict Circuit Breaker Performance 104
B.OD
6.00
4.00
2.00
0.0
-2.00
-4.00
-6.00
5CB25 TEST 5 : BALANCED LOAD BUSSES Voltages-, scale 10"(*5I
-8.00
I DROPC
0.0 0.10 0.20 0.30 0.40 Tme 10"(-l)
0.50 0.60
Figure 6.50: 5CB25 Test 5: C Phase Balanced Bus Simulation
8.00
5CB25 TEST 5 : UNBALANCED LOAD BUSSES Voltages: scale l0"(+5)
-6.00 -
-8.00 —I 1 1 1 1 1 1 1 1 1 • 1 . 1 1 1 1 • 1 r-0.0 0.10 0.20 0.30 0.40
Ti«e 10«(-1!
DROPC
0.50 0.60
Figure 6.51: 5CB25 Test 5: C Phase Flat Line Bus Simulation
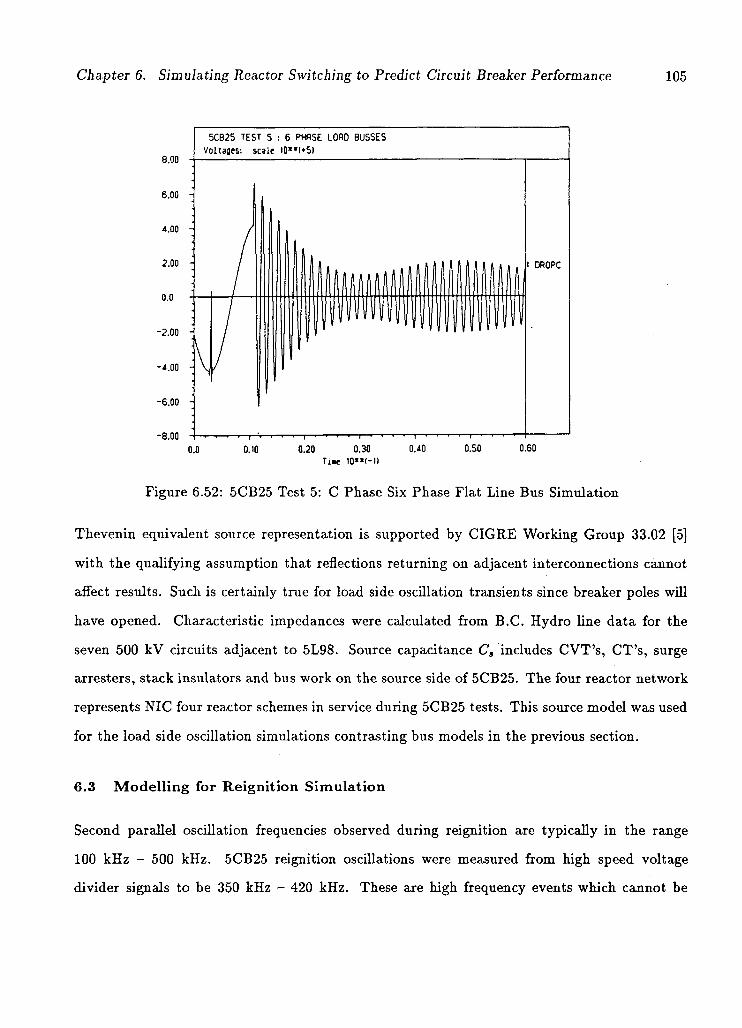
Chapter 6. Simulating Reactor Switching to Predict Circuit Breaker Performance 105
8.00
6.00 -
4.00 -
2.00
0.0
-2.00 -
-4.00
-6.00
5CB25 TEST 5 : 6 PHASE LORD BUSSES Vol tages: sca le I0 " ( *5 I
I DROPC
-8.00 I • • • • I ' 0.0 0.10 0.20 0.30 0.40 O.SO 0.60
Ti»e tO"(-1)
Figure 6.52: 5CB25 Test 5: C Phase Six Phase Flat Line Bus Simulation
Thevenin equivalent source representation is supported by CIGRE Working Group 33.02 [5]
with the qualifying assumption that reflections returning on adjacent interconnections cannot
affect results. Such is certainly true for load side oscillation transients since breaker poles will
have opened. Characteristic impedances were calculated from B.C. Hydro line data for the
seven 500 kV circuits adjacent to 5L98. Source capacitance C3 includes CVT's, CT's, surge
arresters, stack insulators and bus work on the source side of 5CB25. The four reactor network
represents NIC four reactor schemes in service during 5CB25 tests. This source model was used
for the load side oscillation simulations contrasting bus models in the previous section.
6.3 Modelling for Reignition Simulation
Second parallel oscillation frequencies observed during reignition are typically in the range
100 kHz - 500 kHz. 5CB25 reignition oscillations were measured from high speed voltage
divider signals to be 350 kHz - 420 kHz. These are high frequency events which cannot be
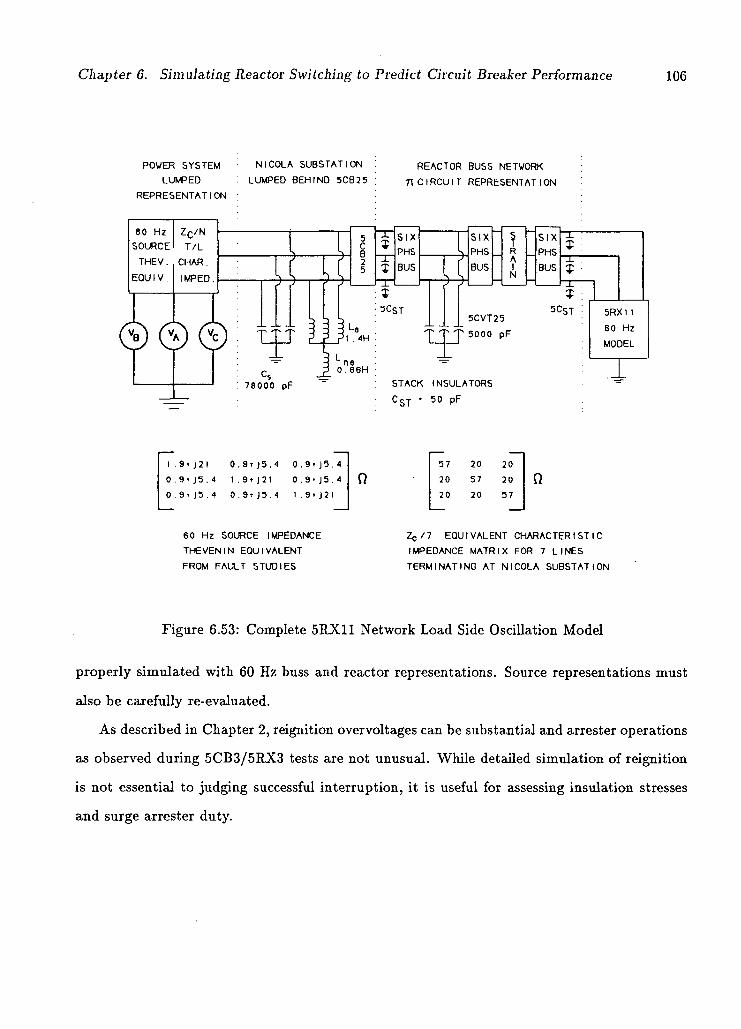
Chapter 6. Simulating Reactor Switching to Predict Circuit Breaker Performance 106
P O W E R S Y S T E M
L U M P E D
R E P R E S E N T A T I O N
6 0 H z Z C / N
S O U R C E T / L
T H E V . C H A R .
E Q U 1 V . 1 M P E D .
N I C O L A S U B S T A T I O N
L U M P E D B E H I N D 5 C B 2 5
7 8 0 0 0 p F
R E A C T O R B U S S N E T W O R K
7T C I R C U I T R E P R E S E N T A T I O N
T
5 C S T
S I X
P H S
B U S
S I X f S1 X P H S R P H S
B U S 1 N
B U S
-1
N
5 C V T 2 5
5 0 0 0 p F
S T A C K I N S U L A T O R S
C S T • 5 0 p F
5 C S T
1 . 9t J21 0 . 9 t J 5 . 4 0 .9 t J5 .4 57 20 20 0 . 9 » J5 .4 1 .9» J2I 0 . 9 ' J 5 . 4 0 20 57 20 n 0 9 r J 5 . 4 0 . 9 t J3 .4 1.9 ' J21 20 20 57
6 0 H z S O U R C E I M P E D A N C E
T H E V E N I N E Q U I V A L E N T
F R O M F A U L T S T U D I E S
Z c / 7 E Q U I V A L E N T C H A R A C T E R I S T I C
I M P E D A N C E M A T R I X F O R 7 L I N E S
T E R M I N A T I N G A T N I C O L A S U B S T A T I O N
Figure 6.53: Complete 5RX11 Network Load Side Oscillation Model
properly simulated with 60 Hz buss and reactor representations. Source representations must
also be carefully re-evaluated.
As described in Chapter 2, reignition overvoltages can be substantial and arrester operations
as observed during 5CB3/5RX3 tests are not unusual. While detailed simulation of reignition
is not essential to judging successful interruption, it is useful for assessing insulation stresses
and surge arrester duty.
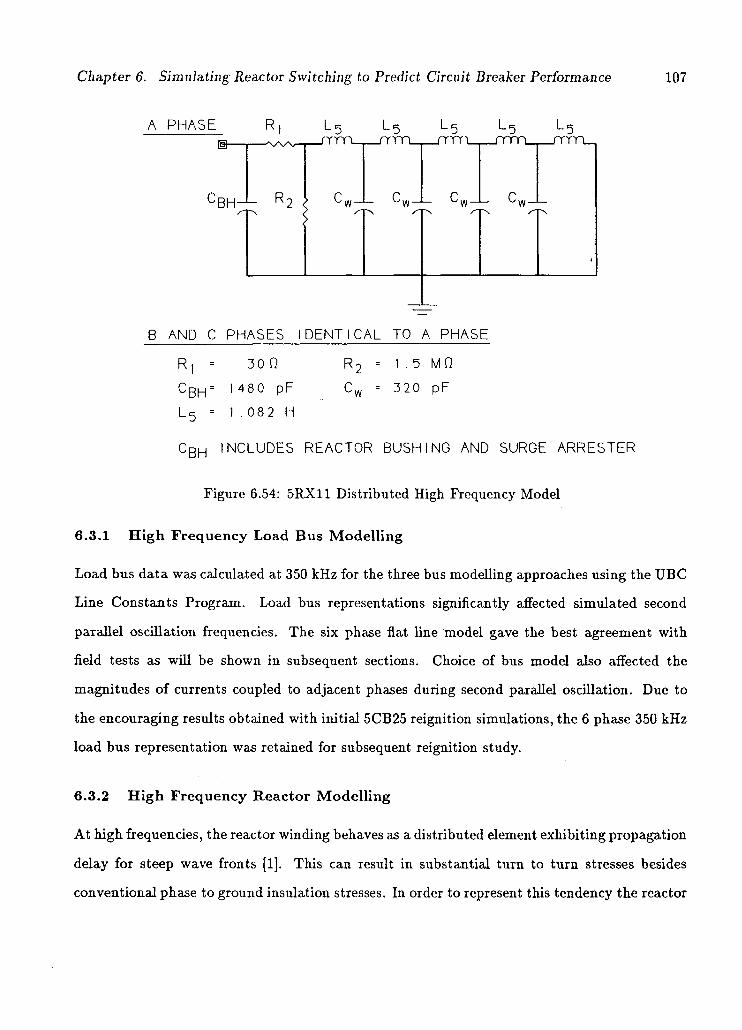
Chapter 6. Simulating Reactor Switching to Predict Circuit Breaker Performance 107
A PHASE
C BH- R 2 k Cw- C w —I— C,
B AND C PHASES IDENT ICAL TO A PHASE
R,
'BH =
Lc
30 0
1480 pF 1 .082 H
R- 1.5 MO 320 pF
C B H INCLUDES REACTOR BUSHING AND SURGE ARRESTER
Figure 6.54: 5RX11 Distributed High Frequency Model
6.3.1 High Frequency Load Bus Modelling
Load bus data was calculated at 350 kHz for the three bus modelling approaches using the UBC
Line Constants Program. Load bus representations significantly affected simulated second
parallel oscillation frequencies. The six phase flat line model gave the best agreement with
field tests as will be shown in subsequent sections. Choice of bus model also affected the
magnitudes of currents coupled to adjacent phases during second parallel oscillation. Due to
the encouraging results obtained with initial 5CB25 reignition simulations, the 6 phase 350 kHz
load bus representation was retained for subsequent reignition study.
6.3.2 High Frequency Reactor Modelling
At high frequencies, the reactor winding behaves as a distributed element exhibiting propagation
delay for steep wave fronts [1]. This can result in substantial turn to turn stresses besides
conventional phase to ground insulation stresses. In order to represent this tendency the reactor
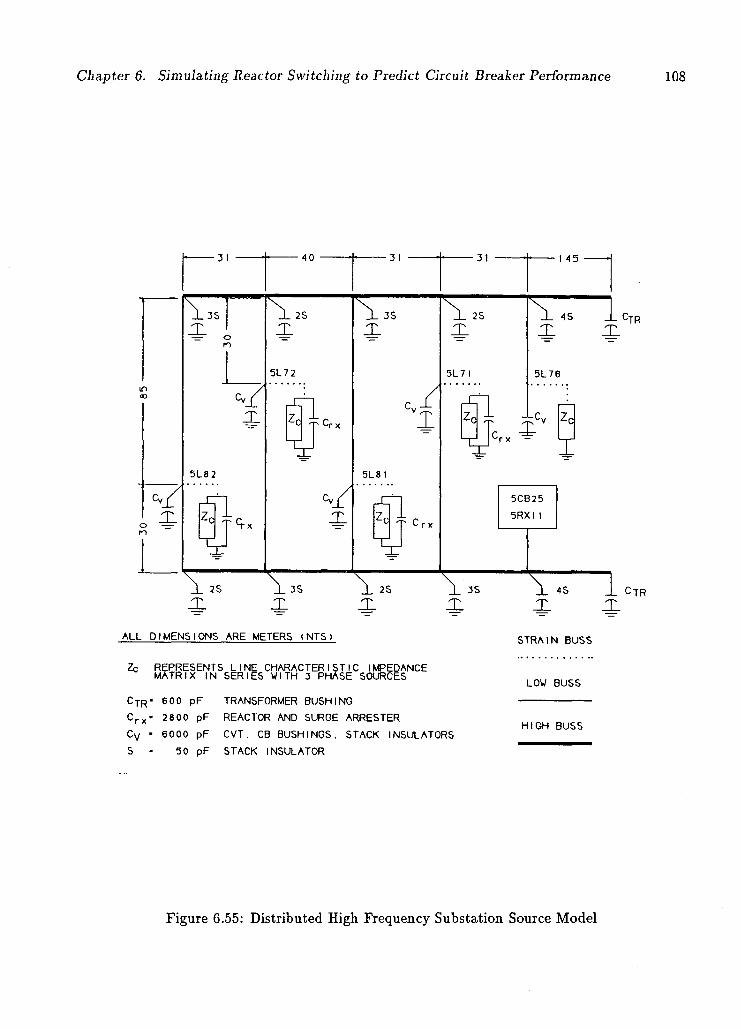
Chapter 6. Simulating Reactor Switching to Predict Circuit Breaker Performance 108
ALL DIMENSIONS ARE METERS (NTS) STRAIN BUSS
Zc REPRESENTS LINE CHARACTERISTIC IMPEDANCE MATRIX IN SERIES WITH 3 PHASE SOURCES
C T R - 600 pF TRANSFORMER BUSHING
C r x - 2800 pF REACTOR AND SURGE ARRESTER
C v - 6000 pF CVT. CB BUSHINGS. STACK INSULATORS
S • 50 pF STACK INSULATOR
LOW BUSS
HIGH BUSS
Figure 6.55: Distributed High Frequency Substation Source Model

Chapter 6. Simulating Reactor Switching to Predict Circuit Breaker Performance 109
winding inductance and capacitance were distributed as shown in the model of figure 6.54.
Incorporating the high frequency reactor model increased second parallel oscillation frequency
but did not affect the magnitudes of second parallel oscillation voltages or currents. This will
be demonstrated in subsequent sections during simulation of several field test reignitions .
6.3.3 High Frequency Distributed Source Representations
Reignition simulation by others suggests that distributed modelling of the substation network
behind the reigniting breaker is necessary [6]. To test this principle, the distributed source
model of figure 6.55 was used to represent the Nicola switch yard behind 5CB25. Low, high
and strain bus sections were treated as equivalent TT circuits with ground mat represented as in
section 6.2.2. The high bus conductor is identical to that previously described for low bus with
6 m phase spacing and 15 m elevation above ground.
Source side bus data was calculated using the UBC Line Constants Program at 350 kHz
and station ground resistivity of 88.8 fi - m. The following arguments were then applied to
complete the distributed station model:
• Line characteristic impedances were connected in series with sources at each line position
as returning reflections were not expected to influence reignition simulations of 50 ps
duration.
• Line shunt reactors were represented by winding, bushing and surge arrester capacitances
only as their inductances had no influence on reignition simulation results.
• Transformers were represented by bushing and surge arrester capacitances only.
• Source voltages at identical angles were used at each line position to avoid large bus
circulating currents during reignition simulation.
• Breaker bushing and disconnect switch stack insulator capacitances were lumped at each
line position.
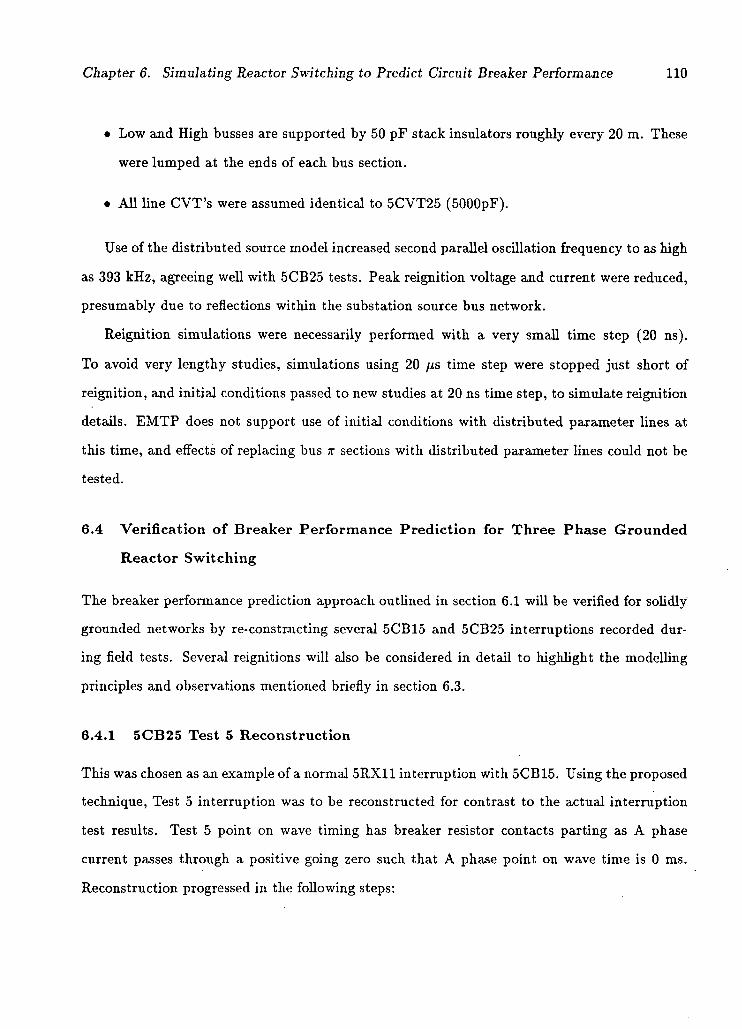
Chapter 6. Simulating Reactor Switching to Predict Circuit Breaker Performance 110
• Low and High busses are supported by 50 pF stack insulators roughly every 20 m. These
were lumped at the ends of each bus section.
• All line CVT's were assumed identical to 5CVT25 (5000pF).
Use of the distributed source model increased second parallel oscillation frequency to as high
as 393 kHz, agreeing well with 5CB25 tests. Peak reignition voltage and current were reduced,
presumably due to reflections within the substation source bus network.
Reignition simulations were necessarily performed with a very small time step (20 ns).
To avoid very lengthy studies, simulations using 20 ps time step were stopped just short of
reignition, and initial conditions passed to new studies at 20 ns time step, to simulate reignition
details. EMTP does not support use of initial conditions with distributed parameter lines at
this time, and effects of replacing bus TT sections with distributed parameter lines could not be
tested.
6.4 Ver i f i ca t i on o f B r e a k e r Per formance P r e d i c t i o n for T h r e e Phase G r o u n d e d
Reac to r S w i t c h i n g
The breaker performance prediction approach outlined in section 6.1 will be verified for solidly
grounded networks by re-constr.ucting several 5CB15 and 5CB25 interruptions recorded dur
ing field tests. Several reignitions will also be considered in detail to highlight the modelling
principles and observations mentioned briefly in section 6.3.
6.4.1 5 C B 2 5 Test 5 Recons t ruc t ion
This was chosen as an example of a normal 5RX11 interruption with 5CB15. Using the proposed
technique, Test 5 interruption was to be reconstructed for contrast to the actual interruption
test results. Test 5 point on wave timing has breaker resistor contacts parting as A phase
current passes through a positive going zero such that A phase point on wave time is 0 ms.
Reconstruction progressed in the following steps:
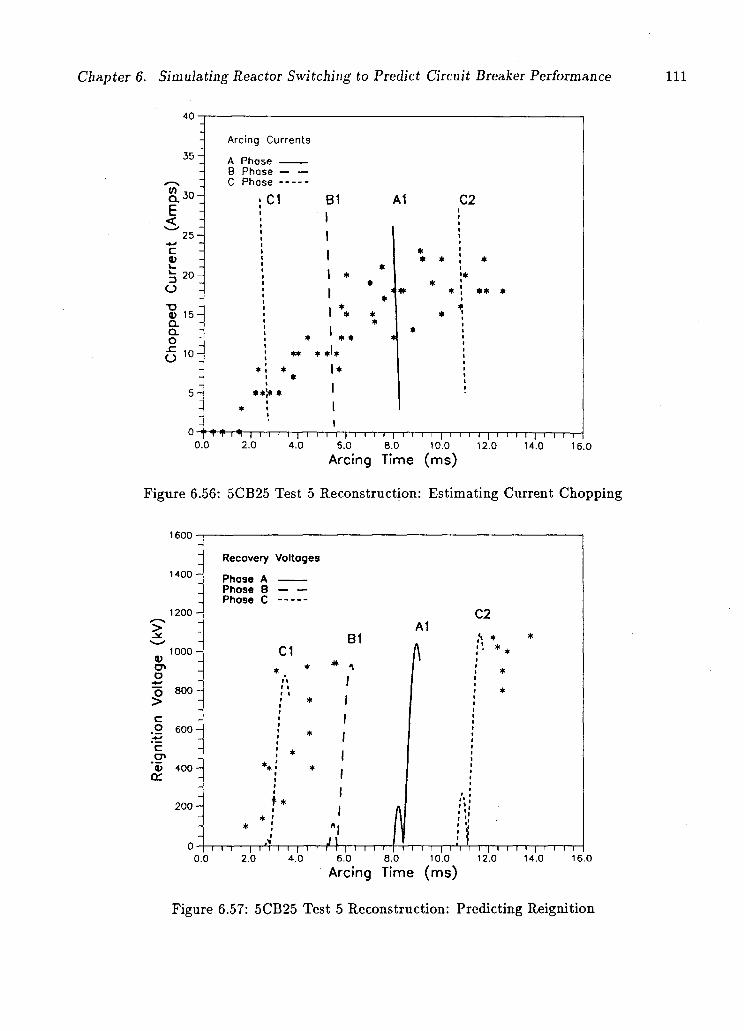
Chapter 6. Simulating Reactor Switching to Predict Circuit Breaker Performance 111
40-
3 5 -
Q . E <
30-
25-C V l_
zt O
20
X> tt) 15 a Q. o a 10'
Arcing Currents
A Phase B Phase — C Phase ---
C1 B1 A1 C2
* *
t t i t ~1 i i i i | i i i i | i r~i i | i i i i [ i i i r~| i i i i |—i—i—i—r 0.0 2.0 4.0 6.0 8.0 10.0 12.0 14.0 16.0
Arcing Time (ms)
Figure 6.56: 5CB25 Test 5 Reconstruction: Estimating Current Chopping
1600 -
1400 •
1200 -
> J *
V cn D
c
cr> "<u or
1000 •
800 -
600 -
400-
200-
Recovery Voltoges
Phase A Phase 8 Phose C
C1
t*
BI
i i i I i i i i I i i 4\
A1 C2
I i i i i 1 i i i i I i i a
0.0 2.0 4.0 6.0 8.0 10.0 12.0 I I I I | I I I I
14.0 16.0
Arcing Time (ms)
Figure 6.57: 5CB25 Test 5 Reconstruction: Predicting Reignition
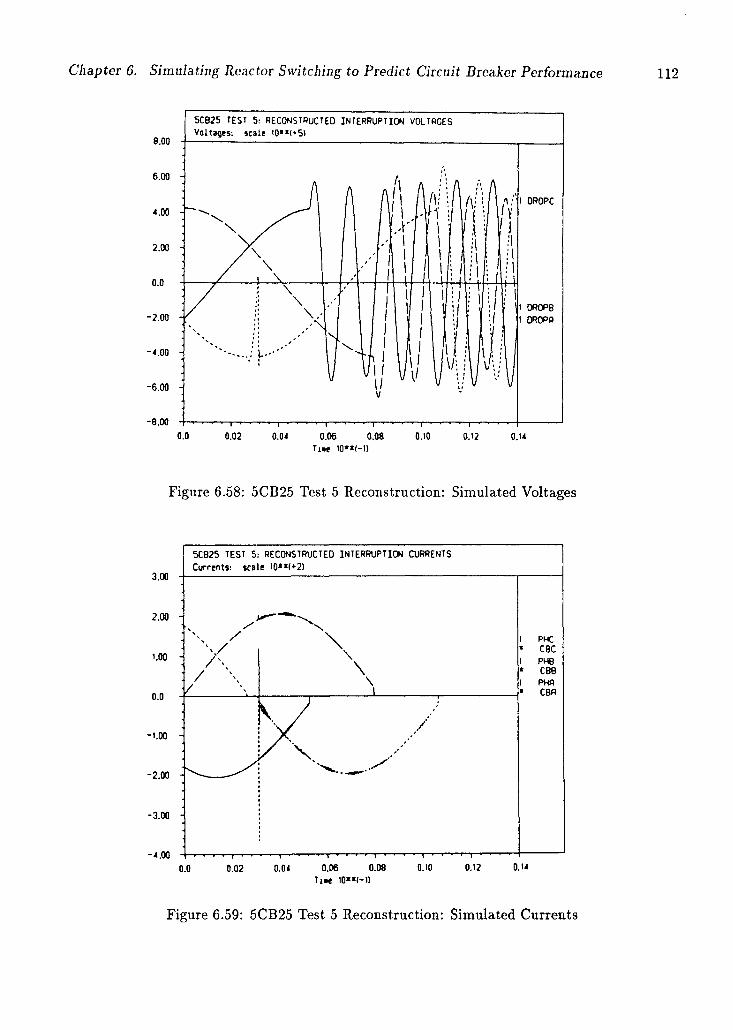
Chapter 6. Simulating Reactor Switching to Predict Circuit Breaker Performance 112
Figure 6.58: 5CB25 Test 5 Reconstruction: Simulated Voltages
5CB25 TEST S: RECONSTRUCTED INTERRUPTION CURRENTS Currents-, scale I 0 " ( * 2 )
J
/\ / \
/
\ \
\ \
1
1 PHC » CBC 1 PHB • CBB 1 PHfl « CBO
/ /
0.0 0.02 0.04 0.06 0.08 0.10 0.12 0.U
lit 10**4-1)
Figure 6.59: 5CB25 Test 5 Reconstruction: Simulated Currents
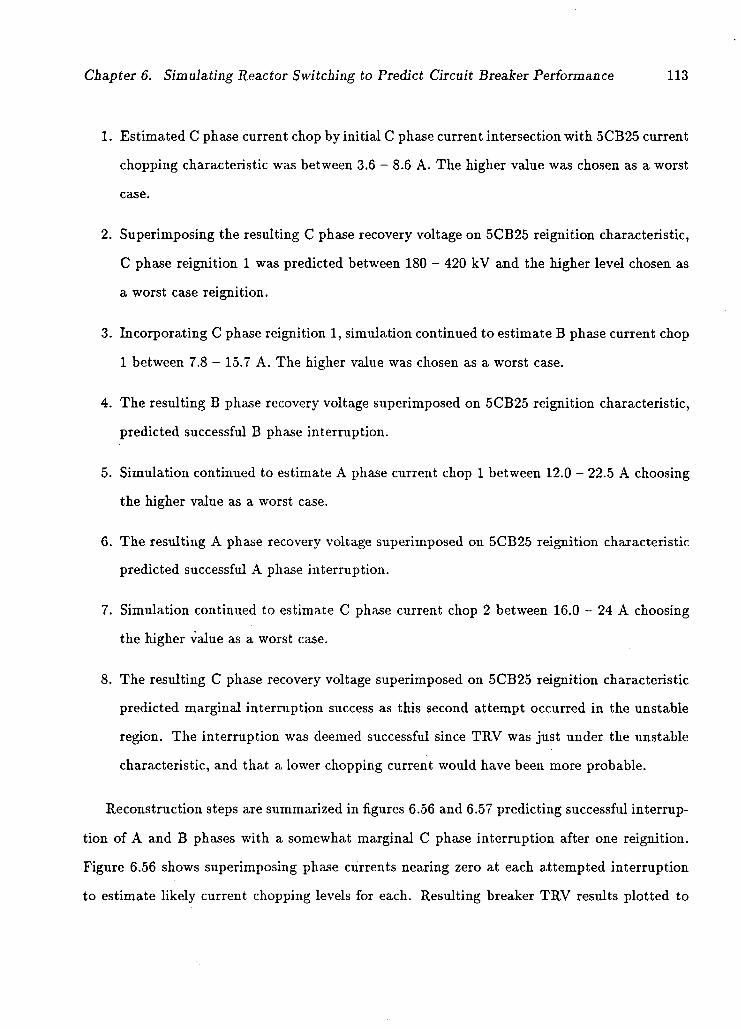
Chapter 6. Simulating Reactor Switching to Predict Circuit Breaker Performance 113
1. Estimated C phase current chop by initial C phase current intersection with 5CB25 current
chopping characteristic was between 3.6 - 8.6 A. The higher value was chosen as a worst
case.
2. Superimposing the resulting C phase recovery voltage on 5CB25 reignition characteristic,
C phase reignition 1 was predicted between 180 - 420 kV and the higher level chosen as
a worst case reignition.
3. Incorporating C phase reignition 1, simulation continued to estimate B phase current chop
1 between 7.8 - 15.7 A. The higher value was chosen as a worst case.
4. The resulting B phase recovery voltage superimposed on 5CB25 reignition characteristic,
predicted successful B phase interruption.
5. Simulation continued to estimate A phase current chop 1 between 12.0 - 22.5 A choosing
the higher value as a worst case.
6. The resulting A phase recovery voltage superimposed on 5CB25 reignition characteristic
predicted successful A phase interruption.
7. Simulation continued to estimate C phase current chop 2 between 16.0 - 24 A choosing
the higher value as a worst case.
8. The resulting C phase recovery voltage superimposed on 5CB25 reignition characteristic
predicted marginal interruption success as this second attempt occurred in the unstable
region. The interruption was deemed successful since TRV was just under the unstable
characteristic, and that a lower chopping current would have been more probable.
Reconstruction steps are summarized in figures 6.56 and 6.57 predicting successful interrup
tion of A and B phases with a somewhat marginal C phase interruption after one reignition.
Figure 6.56 shows superimposing phase currents nearing zero at each attempted interruption
to estimate likely current chopping levels for each. Resulting breaker TRV results plotted to
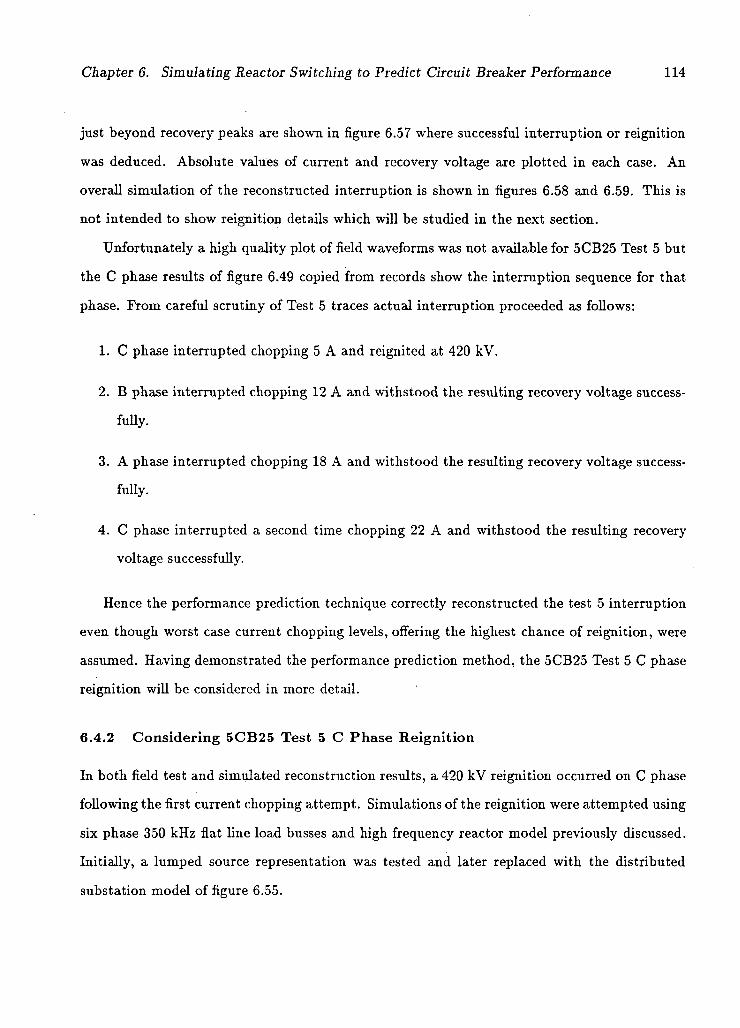
Chapter 6. Simulating Reactor Switching to Predict Circuit Breaker Performance 114
just beyond recovery peaks are shown in figure 6.57 where successful interruption or reignition
was deduced. Absolute values of current and recovery voltage are plotted in each case. An
overall simulation of the reconstructed interruption is shown in figures 6.58 and 6.59. This is
not intended to show reignition details which will be studied in the next section.
Unfortunately a high quality plot of field waveforms was not available for 5CB25 Test 5 but
the C phase results of figure 6.49 copied from records show the interruption sequence for that
phase. From careful scrutiny of Test 5 traces actual interruption proceeded as follows:
1. C phase interrupted chopping 5 A and reignited at 420 kV.
2. B phase interrupted chopping 12 A and withstood the resulting recovery voltage success
fully.
3. A phase interrupted chopping 18 A and withstood the resulting recovery voltage success-
fully.
4. C phase interrupted a second time chopping 22 A and withstood the resulting recovery
voltage successfully.
Hence the performance prediction technique correctly reconstructed the test 5 interruption
even though worst case current chopping levels, offering the highest chance of reignition, were
assumed. Having demonstrated the performance prediction method, the 5CB25 Test 5 C phase
reignition will be considered in more detail.
6.4.2 Considering 5CB25 Test 5 C Phase Reignition
In both field test and simulated reconstruction results, a 420 kV reignition occurred on C phase
following the first current chopping attempt. Simulations of the reignition were attempted using
six phase 350 kHz flat fine load busses and high frequency reactor model previously discussed.
Initially, a lumped source representation was tested and later replaced with the distributed
substation model of figure 6.55.
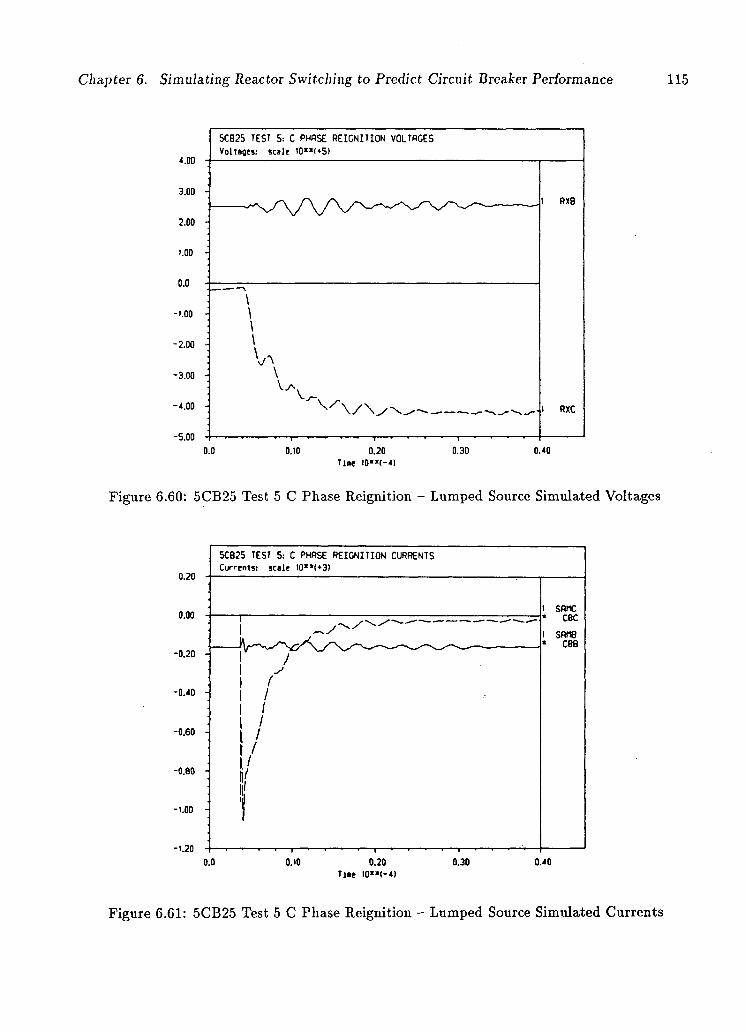
Chapter 6. Simulating Reactor Switching to Predict Circuit Breaker Performance
4.00
3.00
2.00
1.00
o.o
-1.00
-2.00
-3.00 -
-4.00
-s.oo
5C825 TEST S: C PHASE RE IGNIT ION VOLTRGES Voltages: scale I0"<*5>
1 RXB
\
1 RXC
0.0 0.10 0.20 Tine IO" (-4 ]
0.30 0.40
Figure 6.60: 5CB25 Test 5 C Phase Reignition - Lumped Source Simulated Voltages
0.20
o.oo
-0.20
-0.40
-0.60 -
-0.80 -
-1.00 -
SCB2S TEST 5: C PHASE RE IGNIT ION CURRENTS Currents: scale 10"<*3>
-1.20
1 SP.MC C8C
I SP.HB CBS
0.0 0.10 0.20 T i » e l0"*(-4)
0.30 0.40
Figure 6.61: 5CB25 Test 5 C Phase Reignition - Lumped Source Simulated Currents
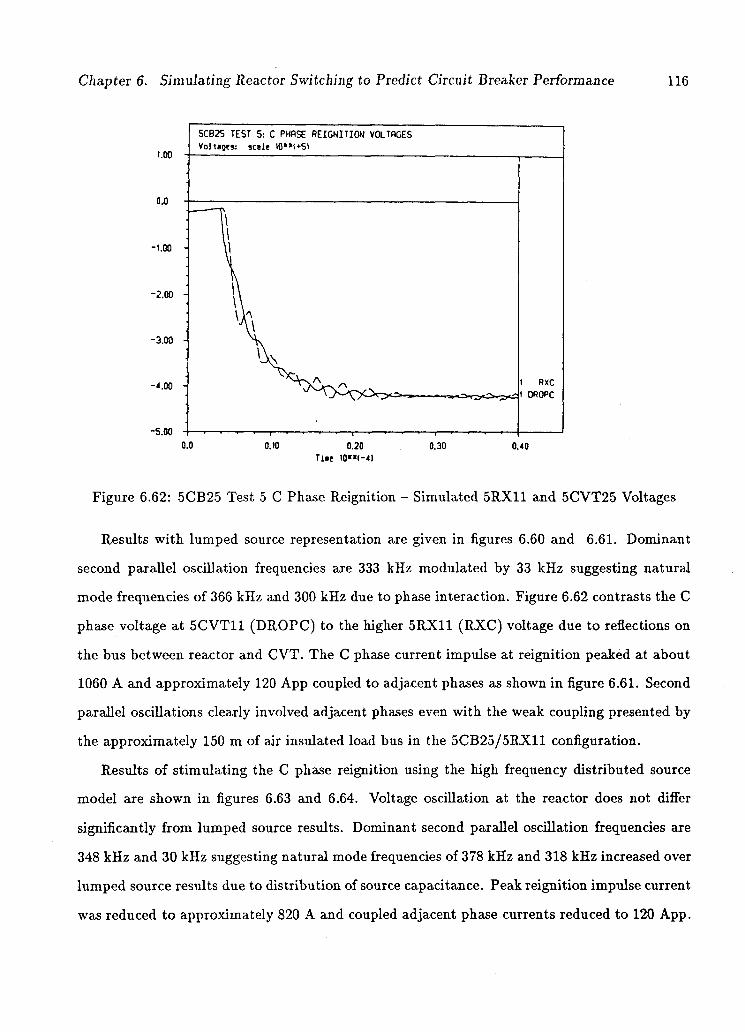
Chapter 6. Simulating .Reactor Switching to Predict Circuit Breaker Performance 116
5CB2S TEST 5: C PHASE RE IGNIT ION VOLTAGES V o l l s o t s : s o l f I0 " ( *5 I
-4.00 -
-3.00 -
-2.00 -
-1.00 -
1 RXC l OROPC
-5.00
0.0 0.10 0.20 T i . e 10"<-4)
0.30 0.40
Figure 6.62: 5CB25 Test 5 C Phase Reignition - Simulated 5RX11 and 5CVT25 Voltages
Results with lumped source representation are given in figures 6.60 and 6.61. Dominant
second parallel oscillation frequencies are 333 kHz modulated by 33 kHz suggesting natural
mode frequencies of 366 kHz and 300 kHz due to phase interaction. Figure 6.62 contrasts the C
phase voltage at 5CVT11 (DROPC) to the higher 5RX11 (RXC) voltage due to reflections on
the bus between reactor and CVT. The C phase current impulse at reignition peaked at about
1060 A and approximately 120 App coupled to adjacent phases as shown in figure 6.61. Second
parallel oscillations clearly involved adjacent phases even with the weak coupling presented by
the approximately 150 m of air insulated load bus in the 5CB25/5RX11 configuration.
Results of stimulating the C phase reignition using the high frequency distributed source
model are shown in figures 6.63 and 6.64. Voltage oscillation at the reactor does not differ
significantly from lumped source results. Dominant second parallel oscillation frequencies are
348 kHz and 30 kHz suggesting natural mode frequencies of 378 kHz and 318 kHz increased over
lumped source results due to distribution of source capacitance. Peak reignition impulse current
was reduced to approximately 820 A and coupled adjacent phase currents reduced to 120 App.
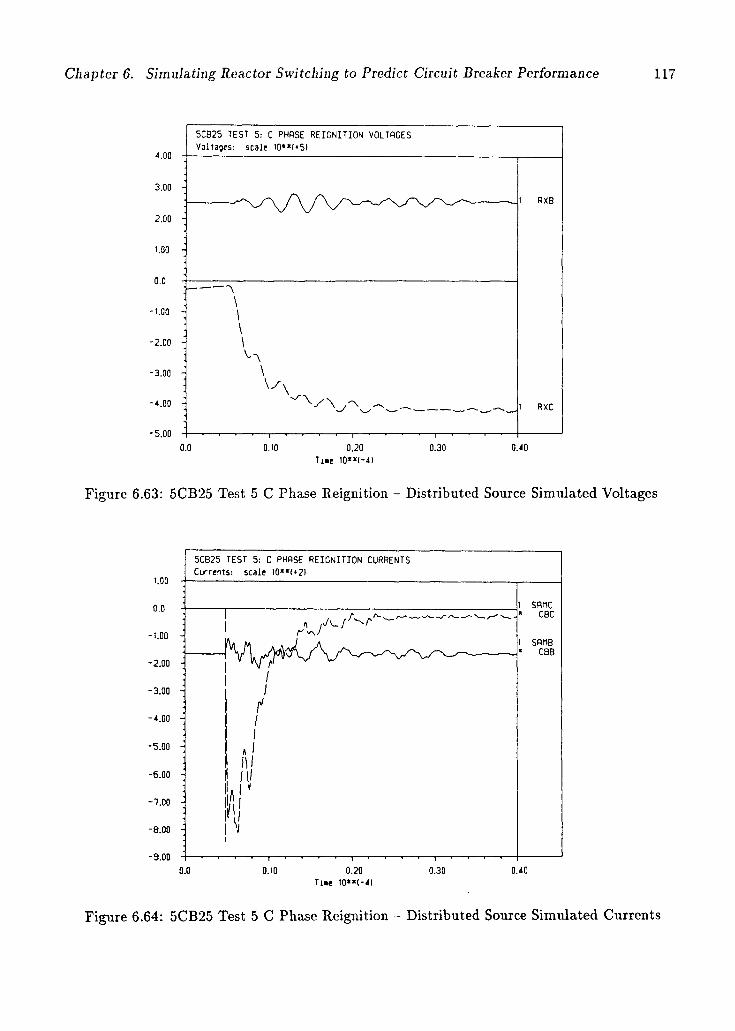
Chapter 6. Simulating Reactor Switching to Predict Circuit Breaker Performance 117
4.00
5C825 TEST 5: C PHASE REIGNITION VOLTAGES Voltages: scale I0"(*5)
3.00
2.00 -
1.00
0.0
-1.00
-2.00
-3.00
-4.00 -
-5.
—' \ ' > -
I RXB
t RXC
0.0 0.10 0.20 n . t 10**1-4]
0.30 0.40
Figure 6.63: 5CB25 Test 5 C Phase Reignition - Distributed Source Simulated Voltages
1.00
0.0
5CB25 TEST 5: C PHRSE REIGNITION CURRENTS Currents: scale !0"(*2)
-1.00 -
-2.00 :
-3.00 :
-4.00
-5.00 -|
-6.00
-"7.00
-8.00
-9.00
h I s
r1 V N /
sane CBC
1 SAfIB CBB
0.0 0.10 0.20 Ti«e t0**(-4l
0.30 0.40
Figure 6.64: 5CB25 Test 5 C Phase Reignition - Distributed Source Simulated Currents
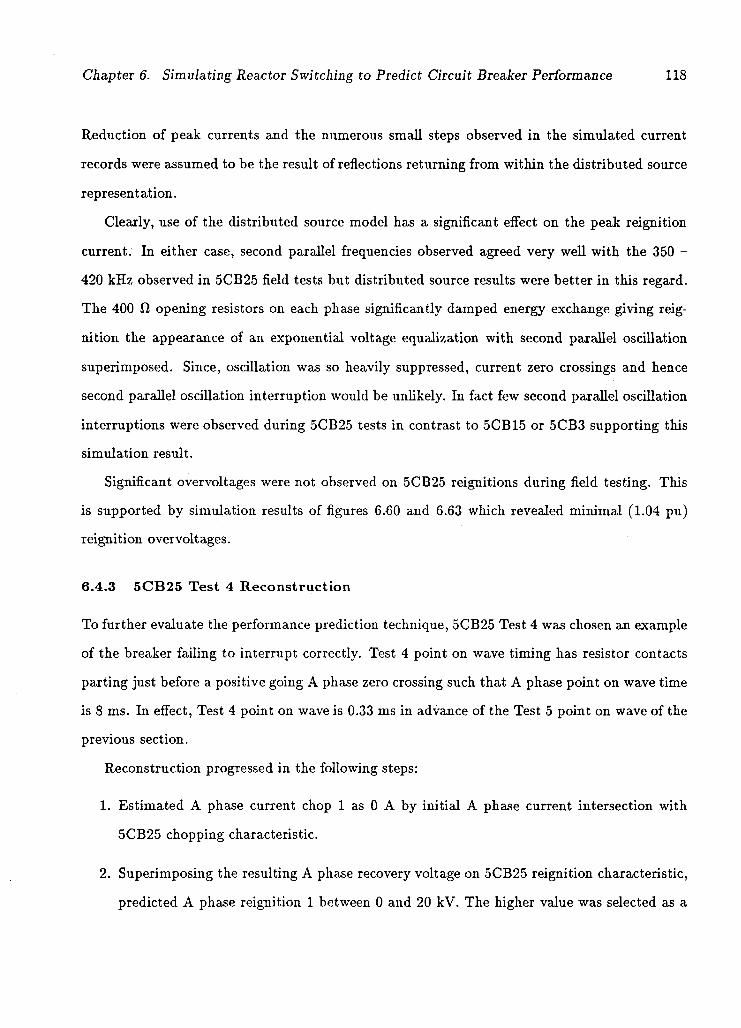
Chapter 6. Simulating Reactor Switching to Predict Circuit Breaker Performance 118
Reduction of peak currents and the numerous small steps observed in the simulated current
records were assumed to be the result of reflections returning from within the distributed source
representation.
Clearly, use of the distributed source model has a significant effect on the peak reignition
current. In either case, second parallel frequencies observed agreed very well with the 350 -
420 kHz observed in 5CB25 field tests but distributed source results were better in this regard.
The 400 ft opening resistors on each phase significantly damped energy exchange giving reig
nition the appearance of an exponential voltage equalization with second parallel oscillation
superimposed. Since, oscillation was so heavily suppressed, current zero crossings and hence
second parallel oscillation interruption would be unlikely. In fact few second parallel oscillation
interruptions were observed during 5CB25 tests in contrast to 5CB15 or 5CB3 supporting this
simulation result.
Significant overvoltages were not observed on 5CB25 reignitions during field testing. This
is supported by simulation results of figures 6.60 and 6.63 which revealed minimal (1.04 pu)
reignition overvoltages.
6.4.3 5CB25 Test 4 Reconstruction
To further evaluate the performance prediction technique, 5CB25 Test 4 was chosen an example
of the breaker failing to interrupt correctly. Test 4 point on wave timing has resistor contacts
parting just before a positive going A phase zero crossing such that A phase point on wave time
is 8 ms. In effect, Test 4 point on wave is 0.33 ms in advance of the Test 5 point on wave of the
previous section.
Reconstruction progressed in the following steps:
1. Estimated A phase current chop 1 as 0 A by initial A phase current intersection with
5CB25 chopping characteristic.
2. Superimposing the resulting A phase recovery voltage on 5CB25 reignition characteristic,
predicted A phase reignition 1 between 0 and 20 kV. The higher value was selected as a
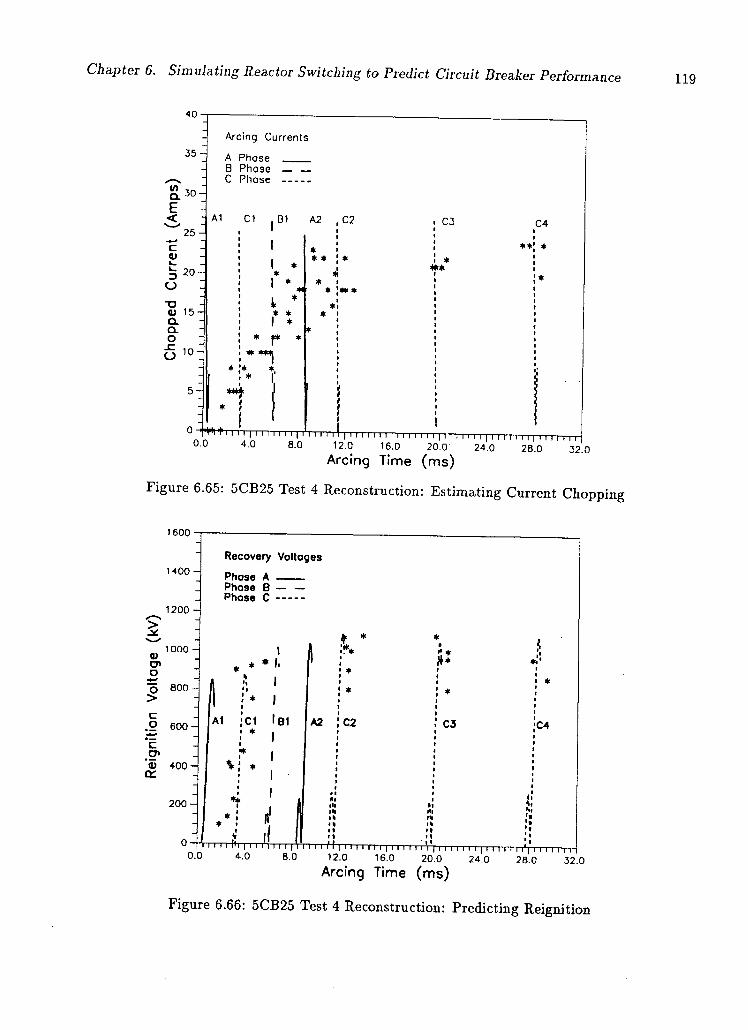
Chapter 6. Simulating Reactor Switching to Predict Circuit Breaker Performance 119
40
35
S.30 E
< 25 H
C V
5 20
o TJ V 1 5 H Q. CL O
JC O 'OH
5H
Arcing Currents
A Phase B Phase _ _ C Phase
A1 C1 | D1 A2 . C2
I I * * I * V *
«4 *
* *** * I
***
C3 C4
„ „ " " I " | I ' I i i i ii | i i i i n i | i i i i i H | i i | i i i i i i i I i u | | , , 0 0 4 ° 8-0 12.0 16.0 20.0 24.0 2B.0 32.0
Arcing Time (ms)
Figure 6.65: 5CB25 Test 4 Reconstruction: Estimating Current Chopping
1600 •
1400 H
1200 •
Recovery Voltages
Phase A Phase B — — Phose C
1000 •
800 H
.2 600 •
400 H
A1 :ci
200-
rrfr
B1 A2 I C2
* *
C3 :C4
0.0 I I I I j I I I I
4.0 B.O 'rn i i f f | M I I I I I | I I I I I I 'i | 1 M I I I I | I I I M I I11' I M I ITT
12.0 16.0 20.0 24.0
Arcing Time (ms) 2B.0 32.0
Figure 6.66: 5CB25 Test 4 Reconstruction: Predicting Reignition
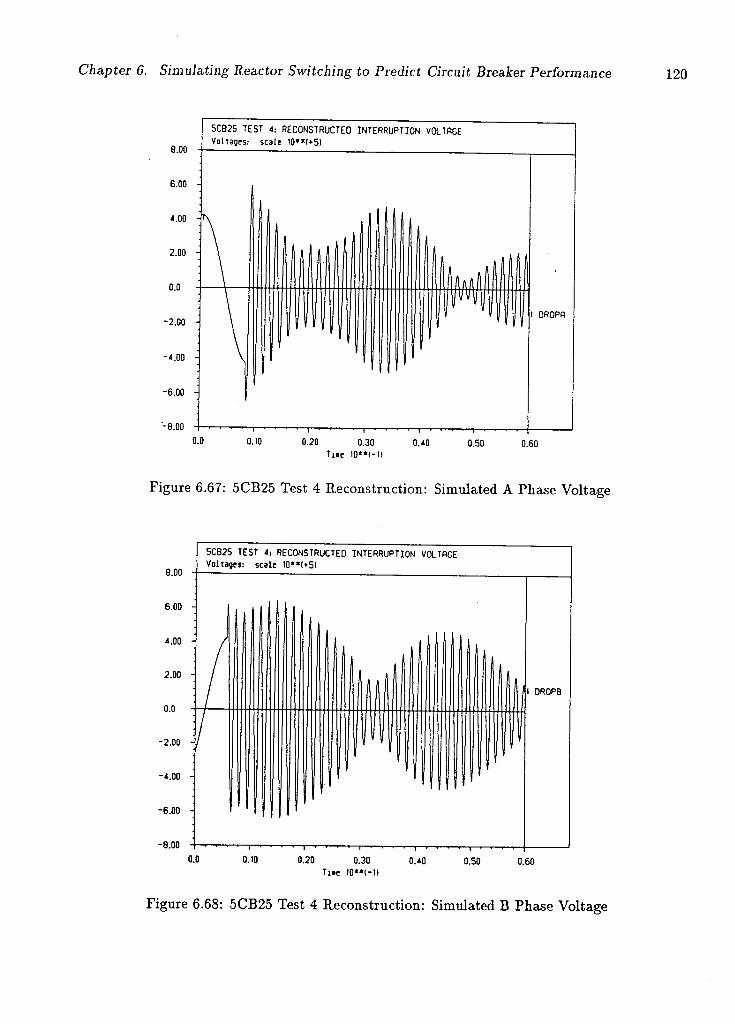
Chapter 6. Simulating Reactor Switching to Predict Circuit Breaker Performance 120
6.00 4
-4.00
OJO 0.20 0.30 0.40 Tint I0«*(-I) 0.50 0.60
Figure 6.67: 5CB25 Test 4 Reconstruction: Simulated A Phase Voltage
8.00
6.00
4.00
2.00 4
0.0
-2.00
-4.oo 4
-6.00 4
-8.00
Figure 6.68: 5CB25 Test 4 Reconstruction: Simulated B Phase Voltage
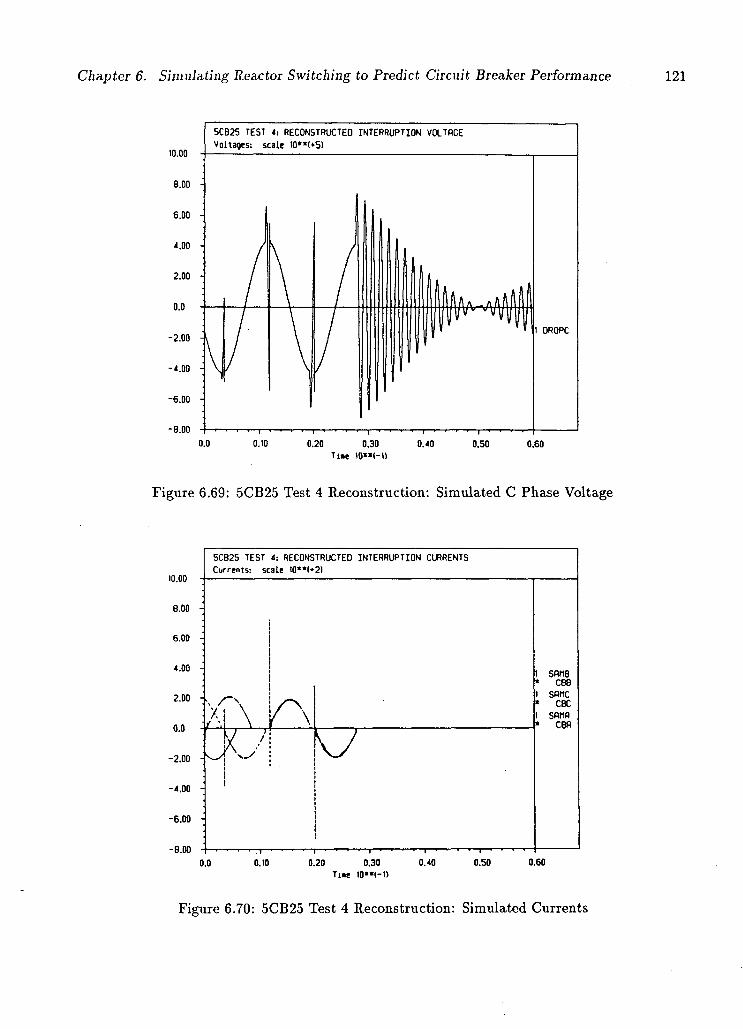
Chapter 6. Simulating Reactor Switching to Predict Circuit Breaker Performance 121
0.20 0.30 U«e )0"l-t>
0.50 0.60
Figure 6.69: 5CB25 Test 4 Reconstruction: Simulated C Phase Voltage
10.00
5CB25 TEST 4: RECONSTRUCTED INTERRUPTION CURRENTS Currents: scale 10"(*2I
8.00 -
6.00
4.00
2.00
0.0
-2.00 -
-4.00
-6.00 -
K7
-8.00 —i— 0.40
1 — I —
0.50
1 SflMB C88
1 SAflC CBC
1 SRrlfl CBfl
0.0 0.10 0.20 0.30 Ti«e I0"(-D
0.60
Figure 6.70: 5CB25 Test 4 Reconstruction: Simulated Currents
Chapter 6. Simulating Reactor Switching to Predict Circuit Breaker Performance 122
worst case.
3. Incorporating A phase reignition 1, simulation continued to estimate C phase current
chop 1 between 4.5 - 10 A. The higher value was selected as a worst case.
4. Superimposing the resulting C phase recovery voltage on the 5CB25 reignition character
istic, predicted C phase reignition 1 between 200 - 450 kV. The higher value was selected.
5. Incorporating C phase reignition 1, simulation continued to estimate B phase current chop
1 between 7.5 - 19 A. The higher value was selected as a worst case.
6. Superimposing the resulting B phase recovery voltage on the 5CB25 reignition character
istic predicted successful B phase interruption.
7. Simulation continued to estimate A phase current chop 2 between 12.5 - 22 A. The larger
value was chosen as a worst case.
8. Superimposing the resulting A phase recovery voltage on 5CB25 reignition characteristic
predicted successful interruption.
9. Simulation continued to estimate C phase current chop 2 between 16.5 and 24 A. The
higher value was selected as a worst case.
10. Superimposing the resulting C phase recovery voltage on 5CB25 reignition characteristic,
predicted C phase reignition 2 between 1000 - 1100 kV. The higher value was chosen.
This reignition occurred in the unstable region of the reignition characteristic indicating
strong likelihood of further failures.
11. Incorporating C phase reignition 2, simulation continued to estimate C phase current
chop 3 between 20 - 22 A. The higher value was selected as a worst case.
12. Resulting C phase recovery voltage superimposed on 5CB25 reignition characteristic pre
dicted C phase reignition 3 between 800 - 1050 kV. The higher value was selected.
Chapter 6. Simulating Reactor Switching to Predict Circuit Breaker Performance 123
13. Incorporating C phase reignition 3, simulation continued to estimate C phase current
chop 4 between 20 - 24 A. The higher value was selected as a worst case.
14. Resulting C phase recovery voltage superimposed on 5CB25 reignition characteristic pre
dicted C phase reignition between 850 - 1000 kV. Further simulation was pointless as
interruption failure was clearly predicted.
Reconstruction steps are shown in figures 6.65 and 6.66 demonstrating superimposition on
breaker characteristics to determine current chopping levels and predict successful interruption
versus reignition. Reconstruction correctly predicted failure to interrupt C phase as shown in
the actual test 4 waveforms of figure 5.30. A minor discrepancy is that C phase current chop
4 led to successful interruption in the field test. This was due to the actual chopping being
less than the 24 A chosen in the reconstruction, and that reignition voltages are difficult to
ascertain in the unstable region beyond 12 ms arcing time, [p]
Overall reconstruction assuming C phase survives the current chop 4 recovery voltage is
shown in figures 6.67, 6.68, 6.69 and 6.70. Aside from predicting C phase failure correctly,
the C phase load side oscillation following final clearing agrees very well with the test results
of figure 5.30. Predominant load side oscillation frequencies are 660 Hz and 20 Hz as observed
throughout 5CB25 testing. Chopping currents and reignition voltages selected in the recon
struction differed slightly from the actual test due to scatter in the breaker characteristics.
This in no way detracts from the accuracy of the overall performance prediction which was
reconstructed without regard to the actual test interruption. In practice there would be no
prior results to consult and the prediction method would provide a means of estimating worst
and best case circuit breaker performance.
6.4.4 5CB15 Test 4 Reconstruction
5CB15 Test 4, a typical 5CB15 interruption with surge arresters assisting due to extremely
high chopping levels, was given in figure 5.33. The reignition characteristic given in figure 5.36
shows 5CB15 recovery voltage withstand capability rises rather slowly. Together with high
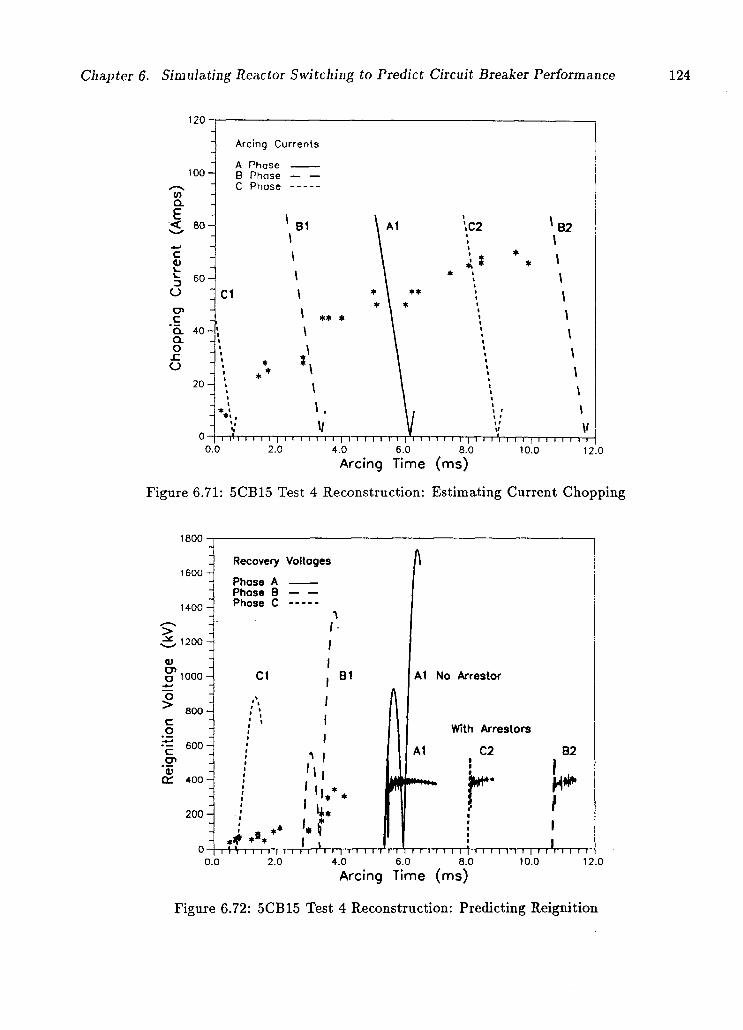
Chapter 6. Simulating Reactor Switching to Predict Circuit Breaker Performance 124
Arcing Currents
A Phase B Phase — — C Phose
B1
a ** *
I,
A1 \C2 B2
I'I i i i i I i i i i i i i i i i i i i i i i i i I i i i i | i i i ' i i i i | i i i i i i i 0.0 2.0 4.0 6.0 8.0
Arcing Time (ms) 10.0 12.0
Figure 6.71: 5CB15 Test 4 Reconstruction: Estimating Current Chopping
1800 •
1600
1400 •
> 1200 -
V
O 1000-
Recovery Voltages
8 0 0 -
o > c o •jE 600 • CP
ac 400 •
2 0 0 -
Phose A Phose 8 Phose C
CI B1 Al No Arrestor
With Arrestors
C2 B2
i *i i i i i i i i i i i i i i i i i i i i i i i i i i i i i ) i i i 0.0 2.0 4.0 6.0 8.0 Arcing Time (ms)
I ' M 10.0 12.0
Figure 6.72: 5CB15 Test 4 Reconstruction: Predicting Reignition
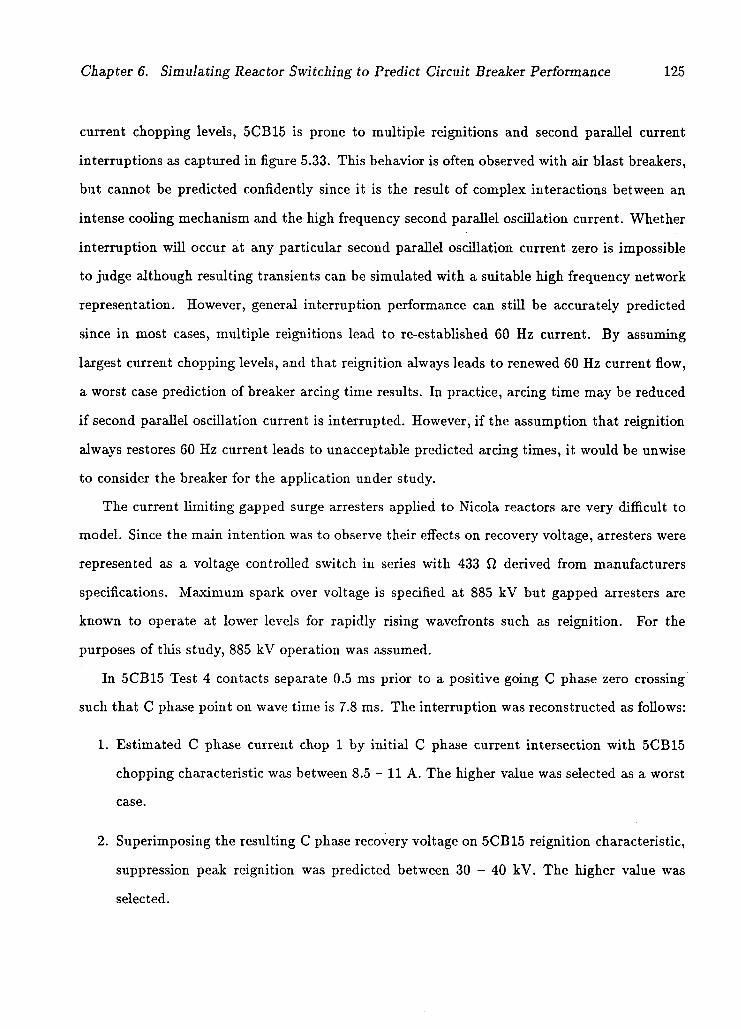
Chapter 6. Simulating Reactor Switching to Predict Circuit Breaker Performance 125
current chopping levels, 5CB15 is prone to multiple reignitions and second parallel current
interruptions as captured in figure 5.33. This behavior is often observed with air blast breakers,
but cannot be predicted confidently since it is the result of complex interactions between an
intense cooling mechanism and the high frequency second parallel oscillation current. Whether
interruption will occur at any particular second parallel oscillation current zero is impossible
to judge although resulting transients can be simulated with a suitable high frequency network
representation. However, general interruption performance can still be accurately predicted
since in most cases, multiple reignitions lead to re-established 60 Hz current. By assuming
largest current chopping levels, and that reignition always leads to renewed 60 Hz current flow,
a worst case prediction of breaker arcing time results. In practice, arcing time may be reduced
if second parallel oscillation current is interrupted. However, if the assumption that reignition
always restores 60 Hz current leads to unacceptable predicted arcing times, it would be unwise
to consider the breaker for the application under study.
The current limiting gapped surge arresters applied to Nicola reactors are very difficult to
model. Since the main intention was to observe their effects on recovery voltage, arresters were
represented as a voltage controlled switch in series with 433 Q. derived from manufacturers
specifications. Maximum spark over voltage is specified at 885 kV but gapped arresters are
known to operate at lower levels for rapidly rising wavefronts such as reignition. For the
purposes of this study, 885 kV operation was assumed.
In 5CB15 Test 4 contacts separate 0.5 ms prior to a positive going C phase zero crossing
such that C phase point on wave time is 7.8 ms. The interruption was reconstructed as follows:
1. Estimated C phase current chop 1 by initial C phase current intersection with 5CB15
chopping characteristic was between 8.5 - 11 A. The higher value was selected as a worst
case.
2. Superimposing the resulting C phase recovery voltage on 5CB15 reignition characteristic,
suppression peak reignition was predicted between 30 - 40 kV. The higher value was
selected.
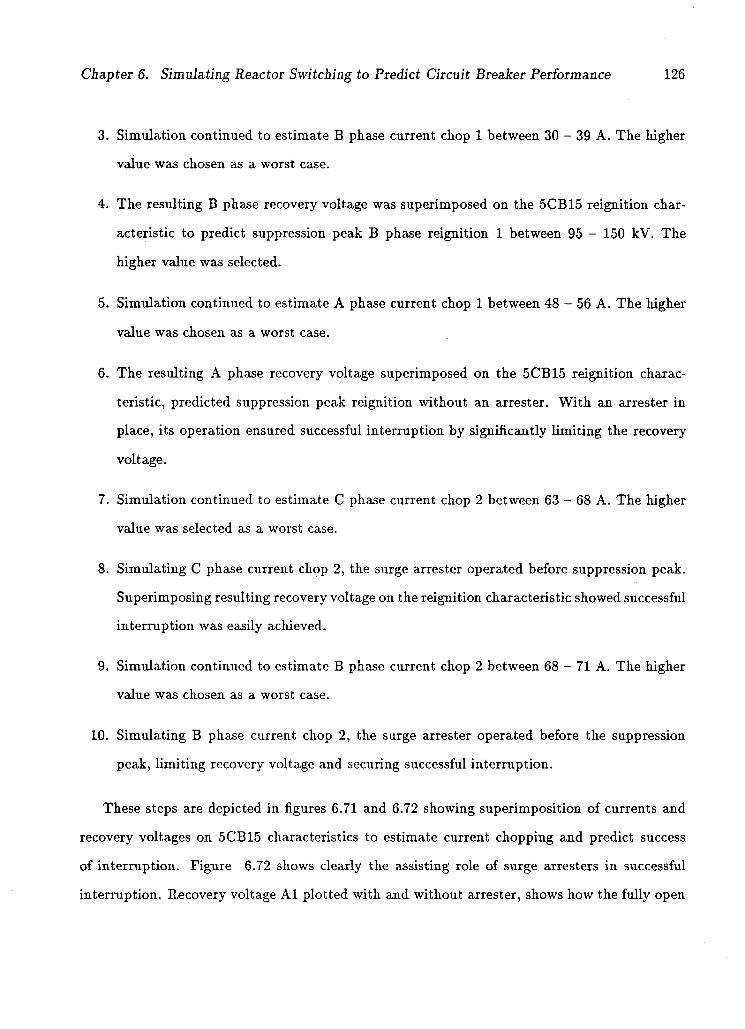
Chapter 6. Simulating Reactor Switching to Predict Circuit Breaker Performance 126
3. Simulation continued to estimate B phase current chop 1 between 30 - 39 A. The higher
value was chosen as a worst case.
4. The resulting B phase recovery voltage was superimposed on the 5CB15 reignition char
acteristic to predict suppression peak B phase reignition 1 between 95 - 150 kV. The
higher value was selected.
5. Simulation continued to estimate A phase current chop 1 between 48 - 56 A. The higher
value was chosen as a worst case.
6. The resulting A phase recovery voltage superimposed on the 5CB15 reignition charac
teristic, predicted suppression peak reignition without an arrester. With an arrester in
place, its operation ensured successful interruption by significantly limiting the recovery
voltage.
7. Simulation continued to estimate G phase current chop 2 between 63 - 68 A. The higher
value was selected as a worst case.
8. Simulating C phase current chop 2, the surge arrester operated before suppression peak.
Superimposing resulting recovery voltage on the reignition characteristic showed successful
interruption was easily achieved.
9. Simulation continued to estimate B phase current chop 2 between 68 - 71 A. The higher
value was chosen as a worst case.
10. Simulating B phase current chop 2, the surge arrester operated before the suppression
peak, limiting recovery voltage and securing successful interruption.
These steps are depicted in figures 6.71 and 6.72 showing superimposition of currents and
recovery voltages on 5CB15 characteristics to estimate current chopping and predict success
of interruption. Figure 6.72 shows clearly the assisting role of surge arresters in successful
interruption. Recovery voltage A l plotted with and without arrester, shows how the fully open
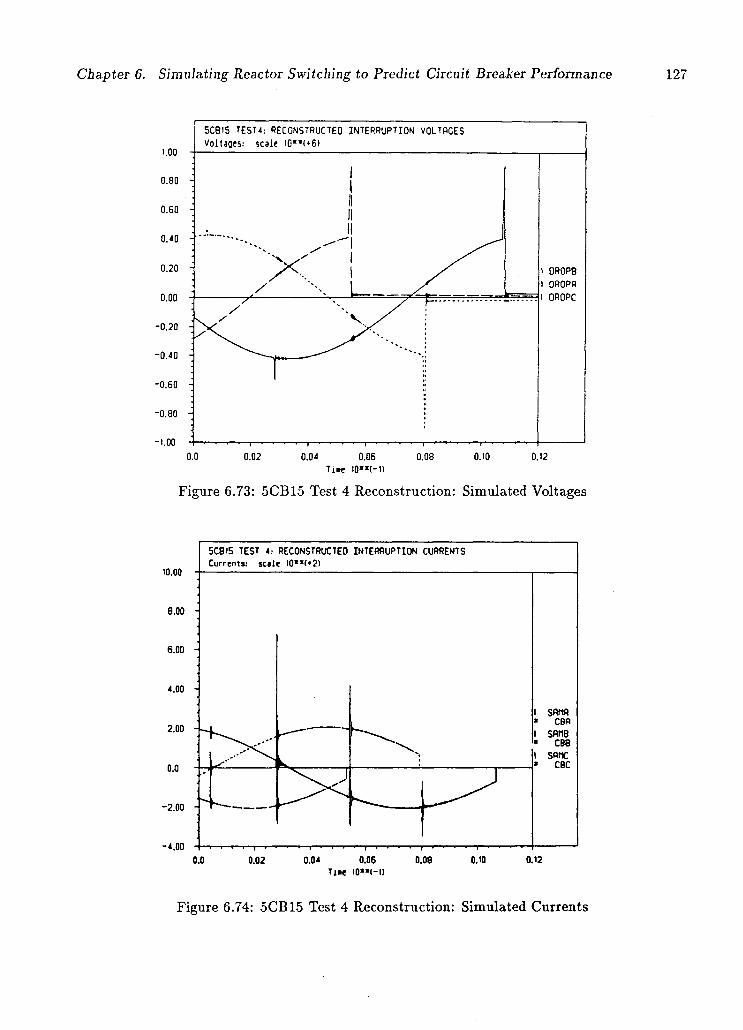
Chapter 6. Simulating Reactor Switching to Predict Circuit Breaker Performance 127
0.04 0.06 0.08 Tine t0"(-1)
Figure 6.73: 5CB15 Test 4 Reconstruction: Simulated Voltages
10.00
8.00 -
6.00 -
4.00
2.00
0.0
-2.00
-4.00
Figure 6.74: 5CB15 Test 4 Reconstruction: Simulated Currents
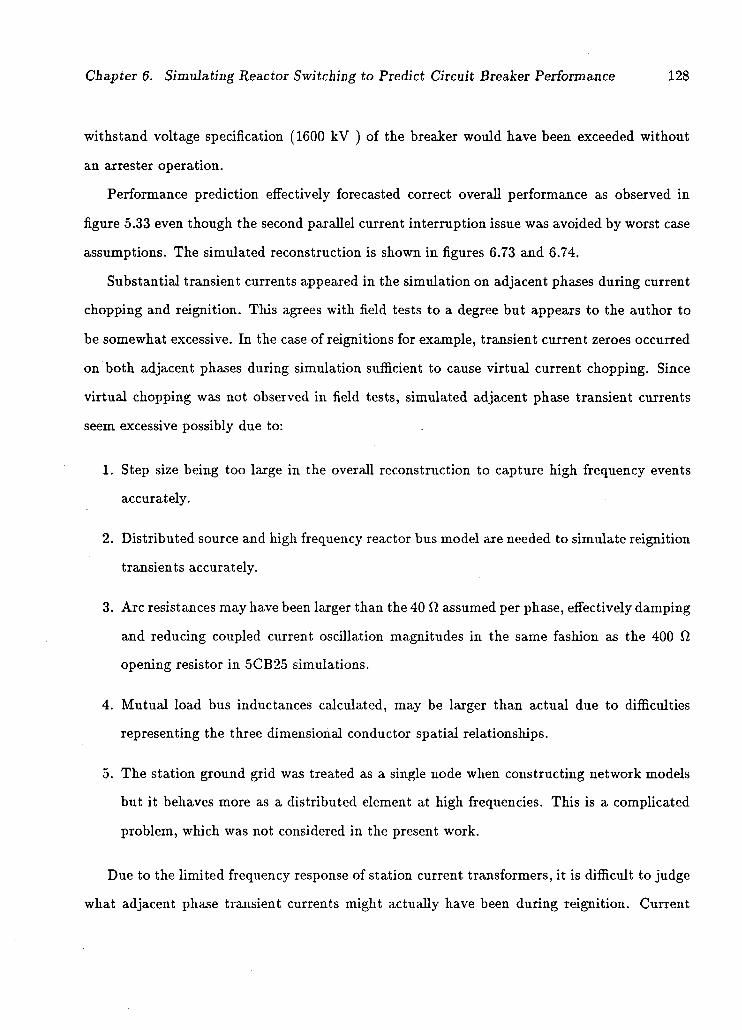
Chapter 6. Simulating Reactor Switching to Predict Circuit Breaker Performance 128
withstand voltage specification (1600 kV ) of the breaker would have been exceeded without
an arrester operation.
Performance prediction effectively forecasted correct overall performance as observed in
figure 5.33 even though the second parallel current interruption issue was avoided by worst case
assumptions. The simulated reconstruction is shown in figures 6.73 and 6.74.
Substantial transient currents appeared in the simulation on adjacent phases during current
chopping and reignition. This agrees with field tests to a degree but appears to the author to
be somewhat excessive. In the case of reignitions for example, transient current zeroes occurred
on both adjacent phases during simulation sufficient to cause virtual current chopping. Since
virtual chopping was not observed in field tests, simulated adjacent phase transient currents
seem excessive possibly due to:
1. Step size being too large in the overall reconstruction to capture high frequency events
accurately.
2. Distributed source and high frequency reactor bus model are needed to simulate reignition
transients accurately.
3. Arc resistances may have been larger than the 40 fl assumed per phase, effectively damping
and reducing coupled current oscillation magnitudes in the same fashion as the 400 fl
opening resistor in 5CB25 simulations.
4. Mutual load bus inductances calculated, may be larger than actual due to difficulties
representing the three dimensional conductor spatial relationships.
5. The station ground grid was treated as a single node when constructing network models
but it behaves more as a distributed element at high frequencies. This is a complicated
problem, which was not considered in the present work.
Due to the limited frequency response of station current transformers, it is difficult to judge
what adjacent phase transient currents might actually have been during reignition. Current
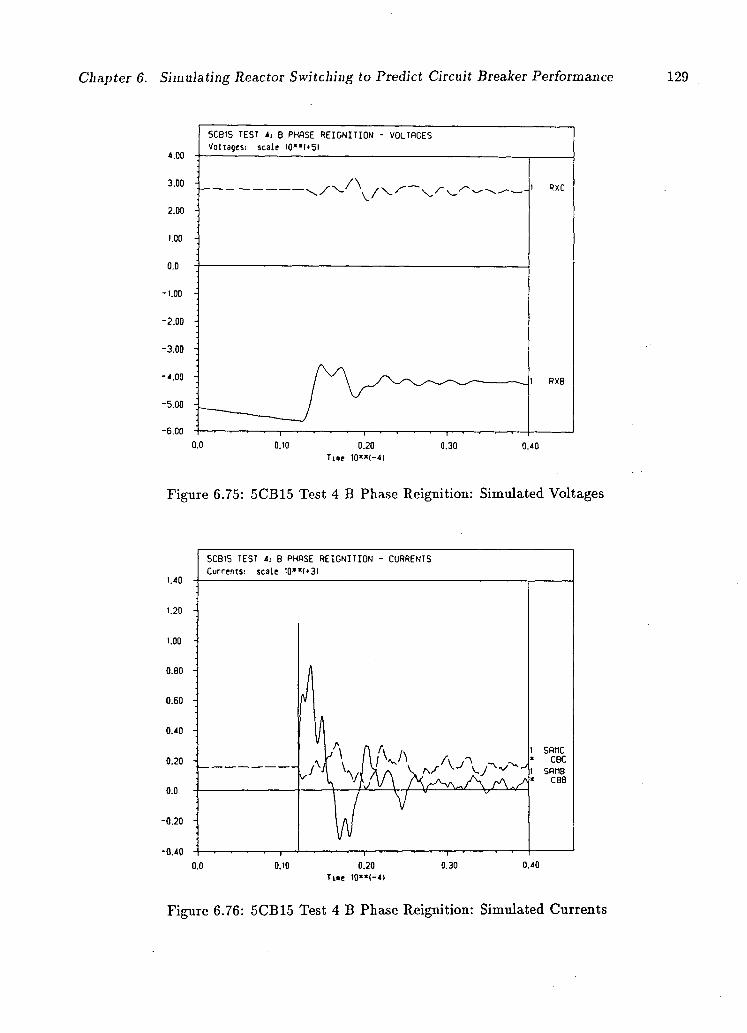
Chapter 6. Simulating Reactor Switching to Predict Circuit Breaker Performance
5CBI5 TEST 4: B PHASE RE IGNIT ION - VOLTAGES Voltages: sca le I 0 " ( » 5 I
1 RXC
I RXB
0.0 0.10 0.20 0.30 T u t 10"<-4)
0.40
Figure 6.75: 5CB15 Test 4 B Phase Reignition: Simulated Voltages
Figure 6.76: 5CB15 Test 4 B Phase Reignition: Simulated Currents
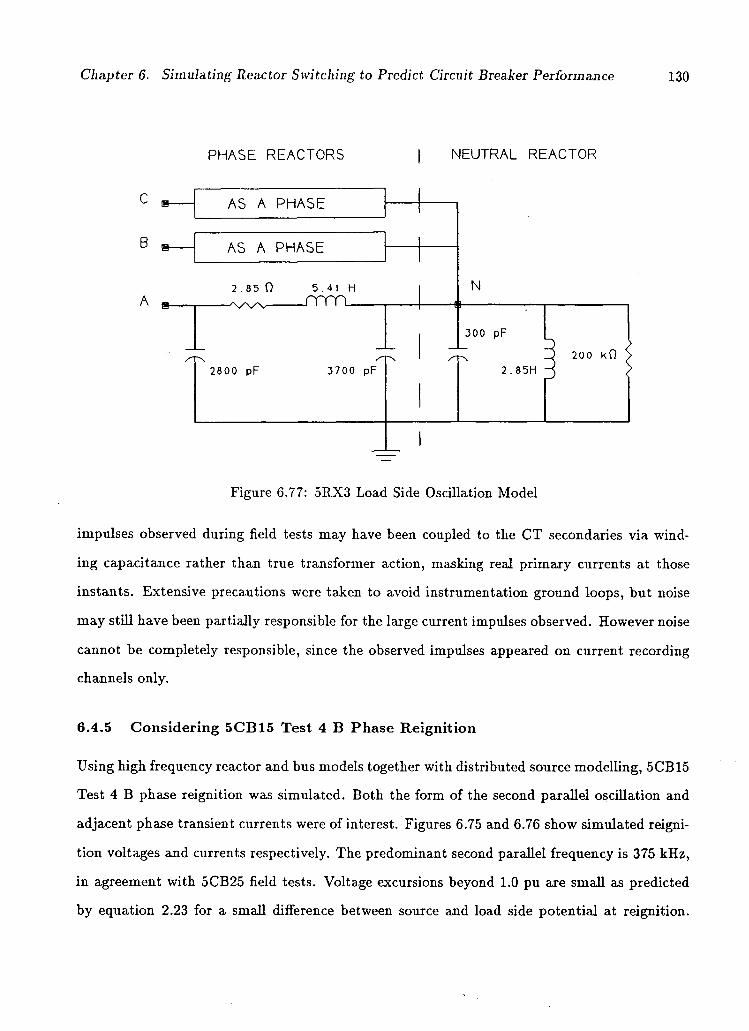
Chapter 6. Simulating Reactor Switching to Predict Circuit Breaker Performance 130
PHASE REACTORS | NEUTRAL REACTOR
B
Figure 6.77: 5RX3 Load Side Oscillation Model
impulses observed during field tests may have been coupled to the CT secondaries via wind
ing capacitance rather than true transformer action, masking real primary currents at those
instants. Extensive precautions were taken to avoid instrumentation ground loops, but noise
may still have been partially responsible for the large current impulses observed. However noise
cannot be completely responsible, since the observed impulses appeared on current recording
channels only.
6.4.5 Considering 5CB15 Test 4 B Phase Reignition
Using high frequency reactor and bus models together with distributed source modelling, 5CB15
Test 4 B phase reignition was simulated. Both the form of the second parallel oscillation and
adjacent phase transient currents were of interest. Figures 6.75 and 6.76 show simulated reigni
tion voltages and currents respectively. The predominant second parallel frequency is 375 kHz,
in agreement with 5CB25 field tests. Voltage excursions beyond 1.0 pu are small as predicted
by equation 2.23 for a small difference between source and load side potential at reignition.
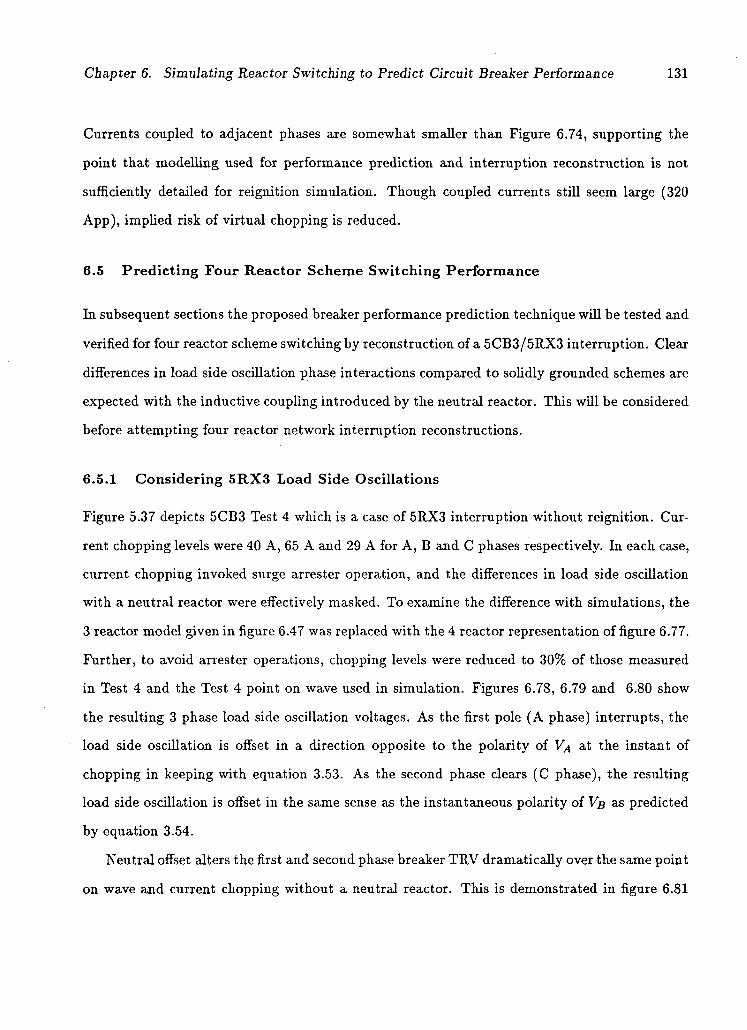
Chapter 6. Simulating Reactor Switching to Predict Circuit Breaker Performance 131
Currents coupled to adjacent phases are somewhat smaller than Figure 6.74, supporting the
point that modelling used for performance prediction and interruption reconstruction is not
sufficiently detailed for reignition simulation. Though coupled currents still seem large (320
App), implied risk of virtual chopping is reduced.
6.5 Predicting Four Reactor Scheme Switching Performance
In subsequent sections the proposed breaker performance prediction technique will be tested and
verified for four reactor scheme switching by reconstruction of a 5CB3/5RX3 interruption. Clear
differences in load side oscillation phase interactions compared to solidly grounded schemes are
expected with the inductive coupling introduced by the neutral reactor. This will be considered
before attempting four reactor network interruption reconstructions.
6.5.1 Considering 5RX3 Load Side Oscillations
Figure 5.37 depicts 5CB3 Test 4 which is a case of 5RX3 interruption without reignition. Cur
rent chopping levels were 40 A, 65 A and 29 A for A, B and C phases respectively. In each case,
current chopping invoked surge arrester operation, and the differences in load side oscillation
with a neutral reactor were effectively masked. To examine the difference with simulations, the
3 reactor model given in figure 6.47 was replaced with the 4 reactor representation of figure 6.77.
Further, to avoid arrester operations, chopping levels were reduced to 30% of those measured
in Test 4 and the Test 4 point on wave used in simulation. Figures 6.78, 6.79 and 6.80 show
the resulting 3 phase load side oscillation voltages. As the first pole (A phase) interrupts, the
load side oscillation is offset in a direction opposite to the polarity of VA at the instant of
chopping in keeping with equation 3.53. As the second phase clears (C phase), the resulting
load side oscillation is offset in the same sense as the instantaneous polarity of VB as predicted
by equation 3.54.
Neutral offset alters the first and second phase breaker TRV dramatically over the same point
on wave and current chopping without a neutral reactor. This is demonstrated in figure 6.81

ter 6. Simulating Reactor Switching to Predict Circuit Breaker Performance
10.00
-10.00
0.10 0.20 0.30 T i i e 10"<-1>
0.40 0.50 0.60
Figure 6.78: 5CB3 Test 4 Load Side Oscillation: Simulated A Phase Voltage
6.00
4.00 -\
2.00
0.0
-2.00 H
-4.00
-6.00
-8.00
0.10 0.20 0.30 0.40 0.50 T i n e 10"(-1>
0.60
Figure 6.79: 5CB3 Test 4 Load Side Oscillation: Simulated B Phase Voltage
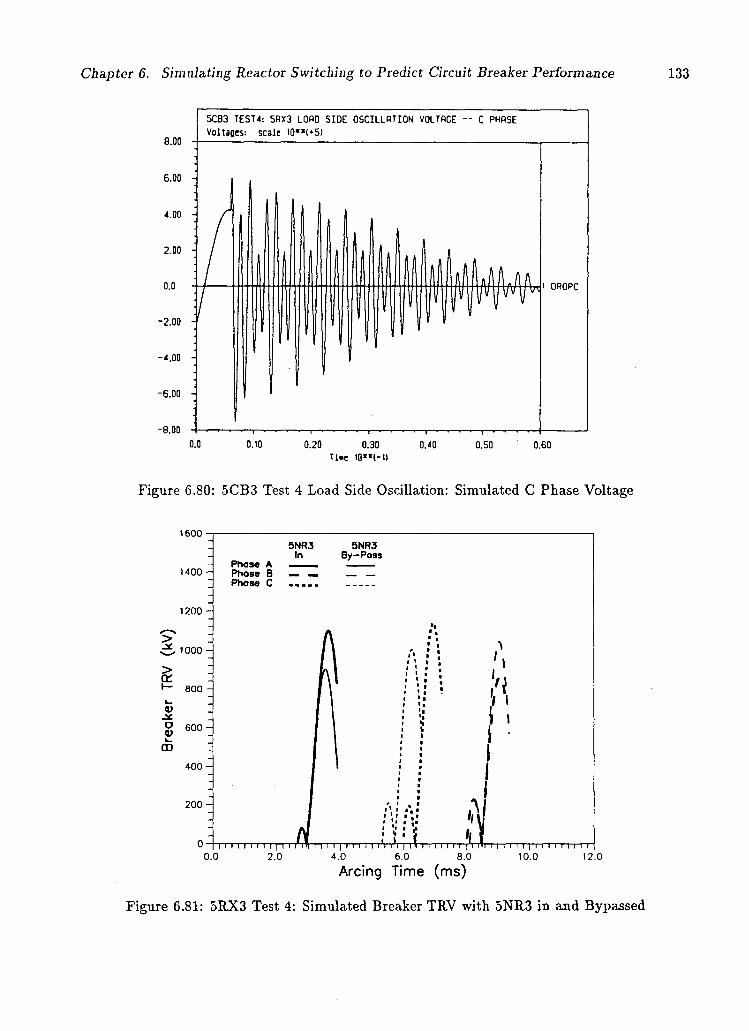
Chapter 6. Simulating Reactor Switching to Predict Circuit Breaker Performance
6.00 -
Figure 6.80: 5CB3 Test 4 Load Side Oscillation: Simulated C Phase Voltage
1600 •
1400 •
1200 -
> > or
o m
1000 -
800 -
600 -
400 -
200-
5 N R 3 In
Phose A Phase B Phose C . . . . .
5 N R 3 By-Poss
I I I I I I I I I | I I I Ml II I I | I I I I I II I'I | 11 I I I I I I I | I 111 I I I I I I | I I I I I I I I I A 0.0 2.0 4.0 6.0 8.0
Arcing Time (ms) 10.0 12.0
Figure 6.81: 5RX3 Test 4: Simulated Breaker TRV with 5NR3 in and Bypassed
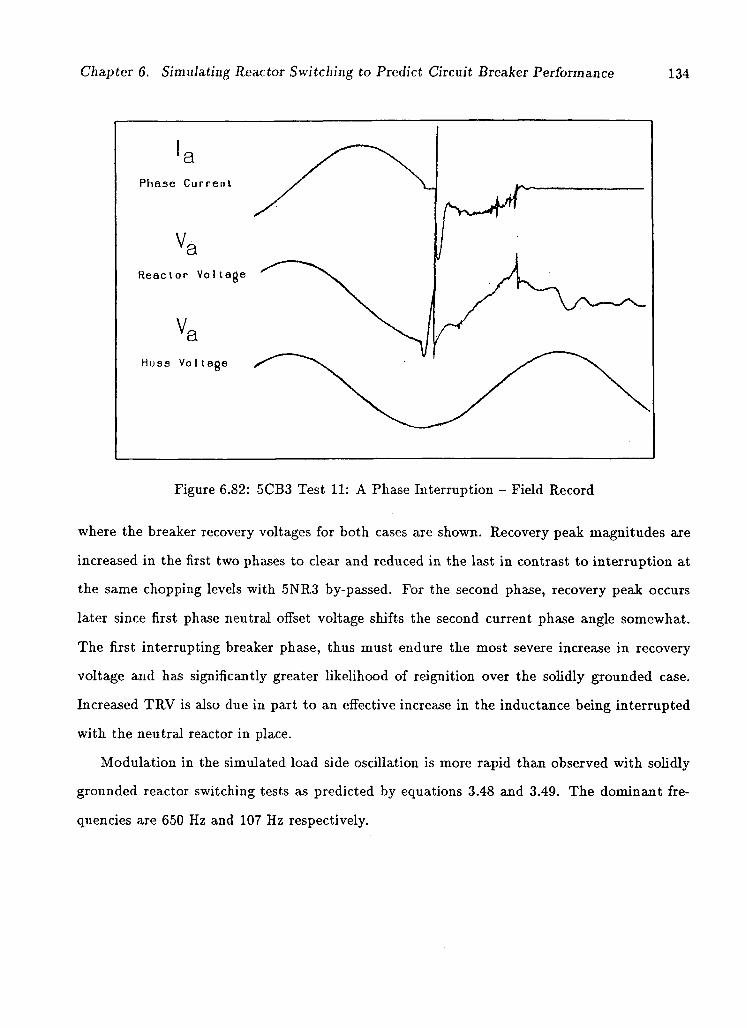
Chapter 6. Simulating Reactor Switching to Predict Circuit Breaker Performance 134
Phase Current / \ _
Reactor Voltage ^
Buss Voltage s^"^
Figure 6.82: 5CB3 Test 11: A Phase Interruption - Field Record
where the breaker recovery voltages for both cases are shown. Recovery peak magnitudes are
increased in the first two phases to clear and reduced in the last in contrast to interruption at
the same chopping levels with 5NR3 by-passed. For the second phase, recovery peak occurs
later since first phase neutral offset voltage shifts the second current phase angle somewhat.
The first interrupting breaker phase, thus must endure the most severe increase in recovery
voltage and has significantly greater likelihood of reignition over the solidly grounded case.
Increased TRV is also due in part to an effective increase in the inductance being interrupted
with the neutral reactor in place.
Modulation in the simulated load side oscillation is more rapid than observed with solidly
grounded reactor switching tests as predicted by equations 3.48 and 3.49. The dominant fre
quencies are 650 Hz and 107 Hz respectively.

Chapter 6. Simulating Reactor Switching to Predict Circuit Breaker Performance 135
6.5.2 5CB3 Test 11 Reconstruction
5CB3 Test 11 contact parting occurred 1.83 ms before a negative going A phase zero crossing
such that point on wave time for A phase was 6.2 ms. This represents contact separation about
0.3 ms sooner than Test 7 shown in figure 5.38. Since a high quality plot of Test 11 was not
available, a copy of A phase current and voltage light beam oscillograph traces are shown in
figure 6.82. The two interruptions are very similar in that both lead to a surge arrester operation
on recovery voltage reignition. Test 11 was chosen as more unique since the breaker withstood
the suppression peak on initial A phase chopping, then reignited as load side oscillation voltage
rose towards recovery peak. Reconstructing this interruption was hence a good test of both
network modelling and how discerning the breaker performance prediction could be regarding
reignitions.
5CB3 Test 11 was reconstructed as follows:
1. Estimated A phase current chop 1 by initial A phase current intersection with 5CB3
current chopping characteristic between 18 - 34 A. The lowest value was selected to test
whether the technique could discern suppression peak survival in the best case.
2. Resulting A phase recovery voltage superimposed on the 5CB3 reignition characteristic
suggested the breaker would easily withstand the suppression peak but recovery voltage
reignition would occur between 500 - 800 kV. Choosing 34 A chopping as a worst case
predicted suppression peak reignition. This illustrates the need to consider both best and
worst cases if using the technique to predict breaker performance in practice. Best and
worst case interruption scenarios could then be predicted for a range of point on wave
times. Arrester operation at reignition was purposely not simulated in the reconstruction,
as it would be studied in more detail later.
3. Incorporating A phase reignition 1, simulation continued to estimate C phase current
chop 1 between 53 - 67 A. The higher value was chosen as a worst case.
4. C phase arrester operated before the simulated suppression peak ensuring successful C
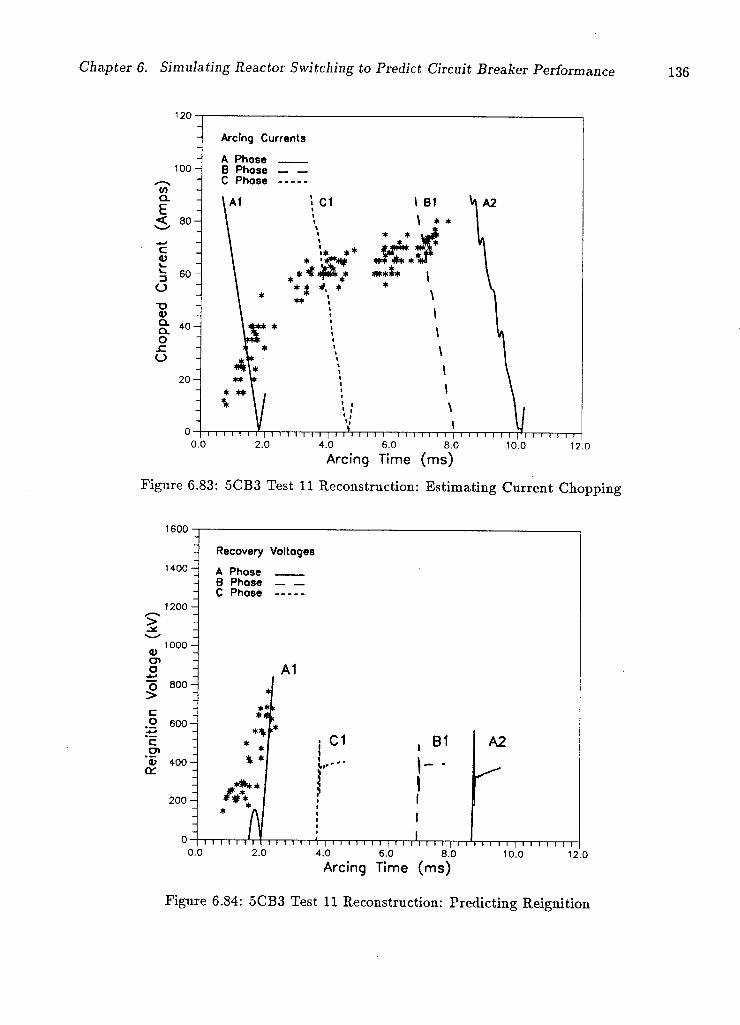
Chapter 6. Simulating Reactor Switching to Predict Circuit Breaker Performance 136
-| Arcing Currents
A Phose B Phose — _ C Phase
i A1 C1 I BI
\ * *
* * * > • *
4$*
41
A2
o.o i < i i i i i i i i i i I i i i i i i i I i i i i i i i | i i i i i M ; ' i i i i i i i
2.0 4.0 6.0 8.0 10.0 12.0 Arcing Time (ms)
Figure 6.83: 5CB3 Test 11 Reconstruction: Estimating Current Chopping
Recovery Voltages
A Phose B Phose — — C Phase
C1 i i
B1 I-
A2
i i i i i i i i i i i i 11 i i i i i i i i ( i i i i I I i i i i i i i i i i i i o.o 2.0 4.0 6.0 8.0 10.0
Arcing Time (ms) 12.0
Figure 6.84: 5CB3 Test 11 Reconstruction: Predicting Reignition
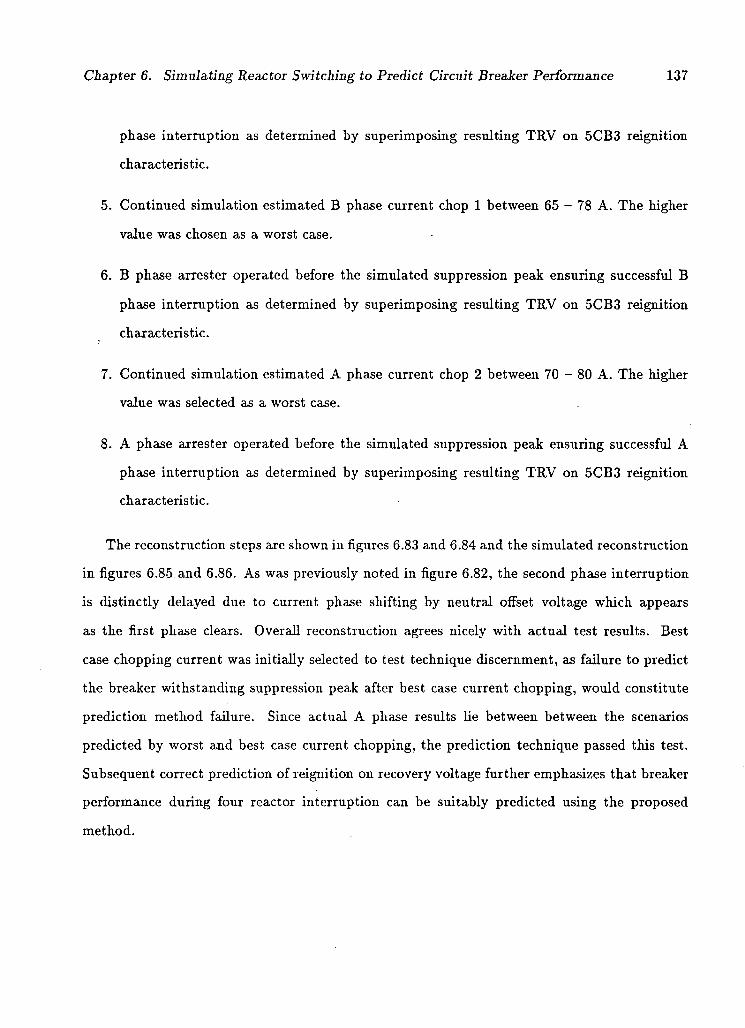
Chapter 6. Simulating Reactor Switching to Predict Circuit Breaker Performance 137
phase interruption as determined by superimposing resulting TRV on 5CB3 reignition
characteristic.
5. Continued simulation estimated B phase current chop 1 between 65 - 78 A. The higher
value was chosen as a worst case.
6. B phase arrester operated before the simulated suppression peak ensuring successful B
phase interruption as determined by superimposing resulting TRV on 5CB3 reignition
characteristic.
7. Continued simulation estimated A phase current chop 2 between 70 - 80 A. The higher
value was selected as a worst case.
8. A phase arrester operated before the simulated suppression peak ensuring successful A
phase interruption as determined by superimposing resulting TRV on 5CB3 reignition
characteristic.
The reconstruction steps are shown in figures 6.83 and 6.84 and the simulated reconstruction
in figures 6.85 and 6.86. As was previously noted in figure 6.82, the second phase interruption
is distinctly delayed due to current phase shifting by neutral offset voltage which appears
as the first phase clears. Overall reconstruction agrees nicely with actual test results. Best
case chopping current was initially selected to test technique discernment, as failure to predict
the breaker withstanding suppression peak after best case current chopping, would constitute
prediction method failure. Since actual A phase results lie between between the scenarios
predicted by worst and best case current chopping, the prediction technique passed this test.
Subsequent correct prediction of reignition on recovery voltage further emphasizes that breaker
performance during four reactor interruption can be suitably predicted using the proposed
method.
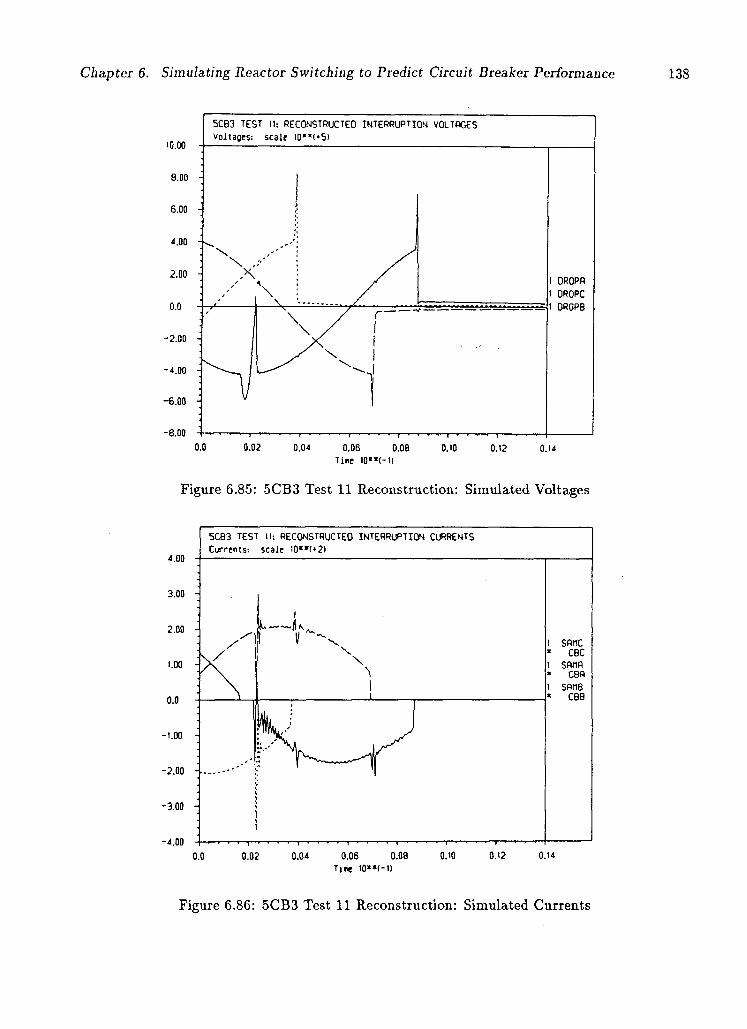
Chapter 6. Simulating Reactor Switching to Predict Circuit Breaker Performance 138
-1—1—'—1—1—r-0.02 0.04 0.06 0.08 0.10
T i r e I0**(-1) 0.12 0.14
Figure 6.85: 5CB3 Test 11 Reconstruction: Simulated Voltages
4.00
5 C B 3 TEST II: RECONSTRUCTED INTERRUPT ION CURRENTS C u r r t n t s : s ca l e 10**1*2)
3.00 -
2.00
1.00 y
0.0
-1.00 -
-2.00 -
-3.00
U JU i sonc * CBC 1 SOflfl * C8H l SRM8 * CBB
0.0 0.02 0.04 0.06 0.08 T ine I0**(-D
0.10 0.12 0.14
Figure 6.86: 5CB3 Test 11 Reconstruction: Simulated Currents
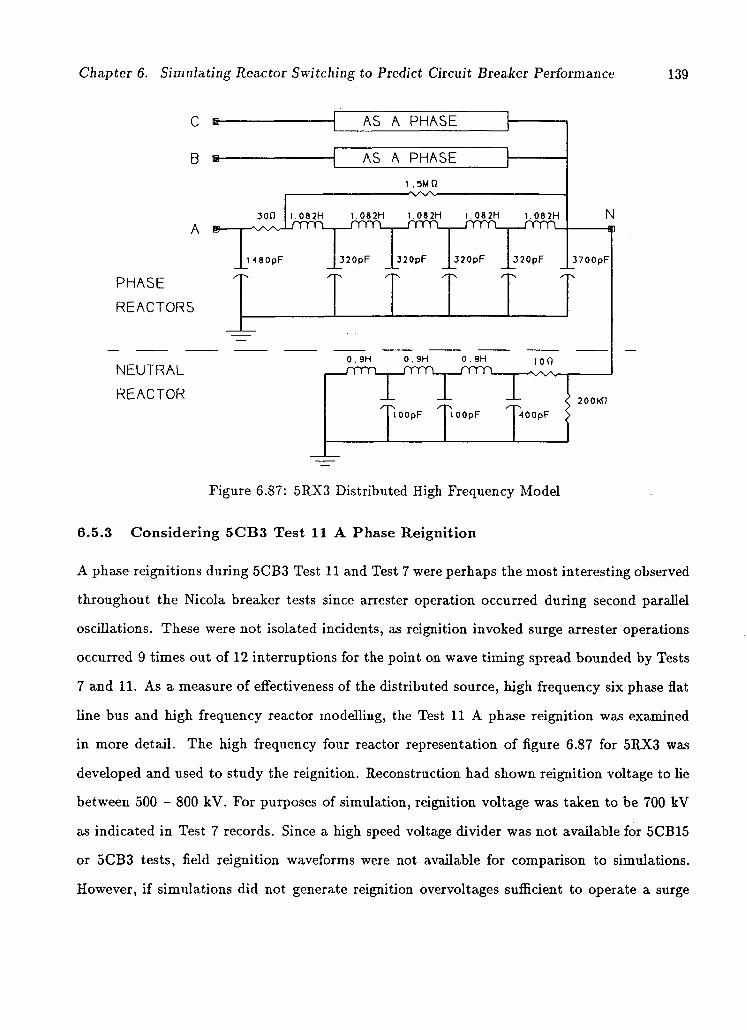
Chapter 6. Simulating Reactor Switching to Predict Circuit Breaker Performance 139
C B- A S A P H A S E
B BI
P H A S E
R E A C T 0 R 5
N E U T R A L
R E A C T O R
A S A P H A S E
I 5 M 0
300
1 4 8 0 p F
I. 082H I . 0 8 2 H
.rrrrx-3 2 0 p F
1 . 0 8 2 H _ r r r n _
3 2 0 p F
I . 0 8 2 H JTTTL
3 2 0 p F
I . 0 8 2 H
J T T T L .
3 2 0 p F
N
3 7 0 0 p F
0 . 9 H 0 . 9 H J T T T L
I
0 . 9 H J T Y T L
100
l O O p F l O O p F
200K0 4 0 0 p F
Figure 6.87: 5RX3 Distributed High Frequency Model
6.5.3 Considering 5CB3 Test 11 A Phase Reignition
A phase reignitions during 5CB3 Test 11 and Test 7 were perhaps the most interesting observed
throughout the Nicola breaker tests since arrester operation occurred during second parallel
oscillations. These were not isolated incidents, as reignition invoked surge arrester operations
occurred 9 times out of 12 interruptions for the point on wave timing spread bounded by Tests
7 and 11. As a measure of effectiveness of the distributed source, high frequency six phase flat
line bus and high frequency reactor modelling, the Test 11 A phase reignition was examined
in more detail. The high frequency four reactor representation of figure 6.87 for 5RX3 was
developed and used to study the reignition. Reconstruction had shown reignition voltage to he
between 500 - 800 kV. For purposes of simulation, reignition voltage was taken to be 700 kV
as indicated in Test 7 records. Since a high speed voltage divider was not available for 5CB15
or 5CB3 tests, field reignition waveforms were not available for comparison to simulations.
However, if simulations did not generate reignition overvoltages sufficient to operate a surge
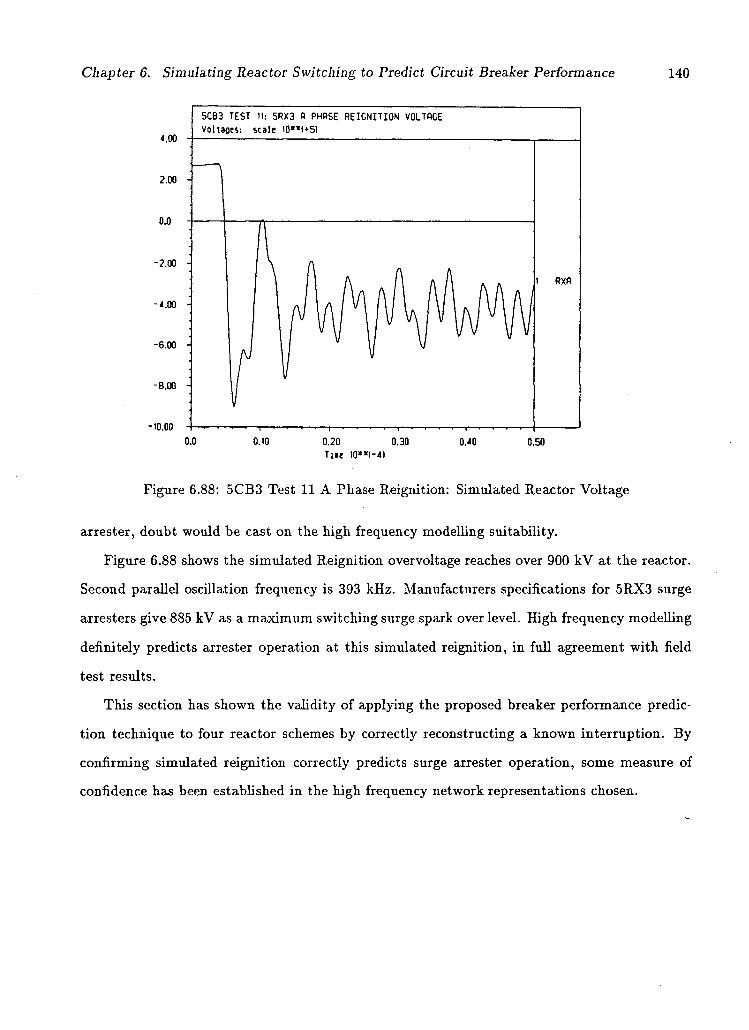
Chapter 6. Simulating Reactor Switching to Predict Circuit Breaker Performance 140
4.00
2.00 -
0.0
-2.00
-4.00
-6.00
-8.00 -
-10.00
0.10 0.20 0.30 T i i e 10**1-4)
Figure 6.88: 5CB3 Test 11 A Phase Reignition: Simulated Reactor Voltage
arrester, doubt would be cast on the high frequency modelling suitability.
Figure 6.88 shows the simulated Reignition overvoltage reaches over 900 kV at the reactor.
Second parallel oscillation frequency is 393 kHz. Manufacturers specifications for 5RX3 surge
arresters give 885 kV as a maximum switching surge spark over level. High frequency modelling
definitely predicts arrester operation at this simulated reignition, in full agreement with field
test results.
This section has shown the validity of applying the proposed breaker performance predic
tion technique to four reactor schemes by correctly reconstructing a known interruption. By
confirming simulated reignition correctly predicts surge arrester operation, some measure of
confidence has been established in the high frequency network representations chosen.
Chapter 7
Conclusions
In the early chapters, shunt reactor switching was shown to be an onerous circuit breaker
duty through analysis of the single phase case and extending principles to three phase reactor
switching. Large breaker RRRV is generated following interruption by load side oscillation
voltage whose frequency is typically 5-30 times that of the power system and is reactor network
dependent. Maximum breaker TRV depends on load side oscillation amplitude governed partly
by the reactor network, but more heavily by circuit breaker current chopping. For successful
interruption, circuit breaker contacts must withstand the large TRV associated with load side
oscillation suppression and recovery peaks. Otherwise reignition results, exposing the network
to potentially severe transient overvoltages and renewing 60 Hz current flow.
In the case of three phase reactors, breaker TRV is complicated by phase interactions arising
from capacitive and inductive coupling in the reactor network. Where capacitive and inductive
coupling are small, little error results in applying the single phase equations to prediction of
suppression peaks following current chopping. However, even small amounts of coupling can
generate a second oscillation mode, manifested by a modulated load side oscillation. Suppression
peaks may then no longer represent the largest phase to ground reactor network voltage stresses
during load side oscillation. As a result, single phase equations cannot be confidently applied
to predict suppression peaks or circuit breaker TRV in all but the simplest solidly grounded
cases. Natural load side oscillation modes are controlled by the reactor network parameters
and grounding method. Addition of a neutral reactor for example, was found to significantly
increase breaker TRV due to phase interactions during load side oscillation, and neutral offset
voltages due to staggered phase interruption. Analytical treatment of the three phase case
141
Chapter 7. Conclusions 142
is complex and was not covered except to highlight the origin of natural load side oscillation
modes.
Ideal reactor circuit breakers will have a subdued current chopping characteristic, and
rapidly rising reignition characteristic. Air blast breakers though commonly applied to reactor
switching, exhibit high current chopping levels and are prone to reignition. Opening resistors
can be added to reduce breaker TRV and effectively lower current chopping levels by enhancing
arc stability. Otherwise, reactor surge arresters must play a key role in successful reactor inter
ruption at typical air blast breaker chopping levels. This was confirmed by both field testing
and simulations of Nicola 5CB15 and 5CB3 reactor switching. Measured chopping numbers for
these devices were as large or larger than those published by others. SFQ breakers and puffer
types in particular, are well suited to reactor switching, providing virtually current chopping
free interruption as observed in Chapter 5. This is due to the dynamic cooling performance of
SF6, and its superior insulating qualities.
Analysis of field tests showed the usefulness of breaker arcing characteristics to summarize
device performance of a reactor switching duty. Current chopping and reignition characteristics
derived from these measurements, are essential to the realistic simulation of reactor interrup
tion with different circuit breakers. Further, these characteristics are central to the breaker
performance prediction technique proposed and tested. Through reconstruction of several field
test interruptions, the prediction technique was verified for solidly grounded and four reactor
schemes. This method could prove useful for assessing breaker suitability to particular reactor
switching applications and could serve as a design tool to assess reactor network alterations, or
breaker modifications such as the addition of opening resistors.
Though fairly simple lumped element representations of source and reactor were acceptable,
air insulated busses connecting breaker and reactor had to be modelled quite carefully to ob
tain the degree of load side oscillation phase interaction observed in field tests. In the author's
opinion, this would be even more important where cables or more tightly coupled busses are em
ployed. Careful modelling for load side oscillation simulation will ensure acceptable application
Chapter 7. Conclusions 143
of the performance prediction method suggested.
Reignition simulations with distributed models of reactors and the substation, and high
frequency representations of busses, gave good second parallel oscillation frequency agreement
with field tests. The distributed substation model substantially reduced simulated peak reigni
tion currents over those simulated using a lumped source model. The levels of transient current
coupled to adjacent phases during reignition simulation were excessive in the author's opinion.
Although various modelling refinements were attempted to address this problem, a solution was
not found. This is not a drawback in terms of predicting breaker performance but presents a
concern if three phase interactions at reignition are to be studied in detail.
7.1 Poss ib le Avenues for F u r t h e r Research
Other areas of study which could relate directly to the present work include:
1. Load side oscillation simulation and breaker performance prediction for ungrounded re
actor applications.
2. Methods of deducing multiple interrupter breaker current chopping and reignition char
acteristics from single interrupter laboratory tests.
3. Techniques for calculating substation bus electrical parameters incorporating the complex
geometries often encountered to confidently deduce adjacent phase coupling in particular.
4. Station ground grid modelling to better determine through simulation, the effects of
reignition on substation control cables and grounding networks.
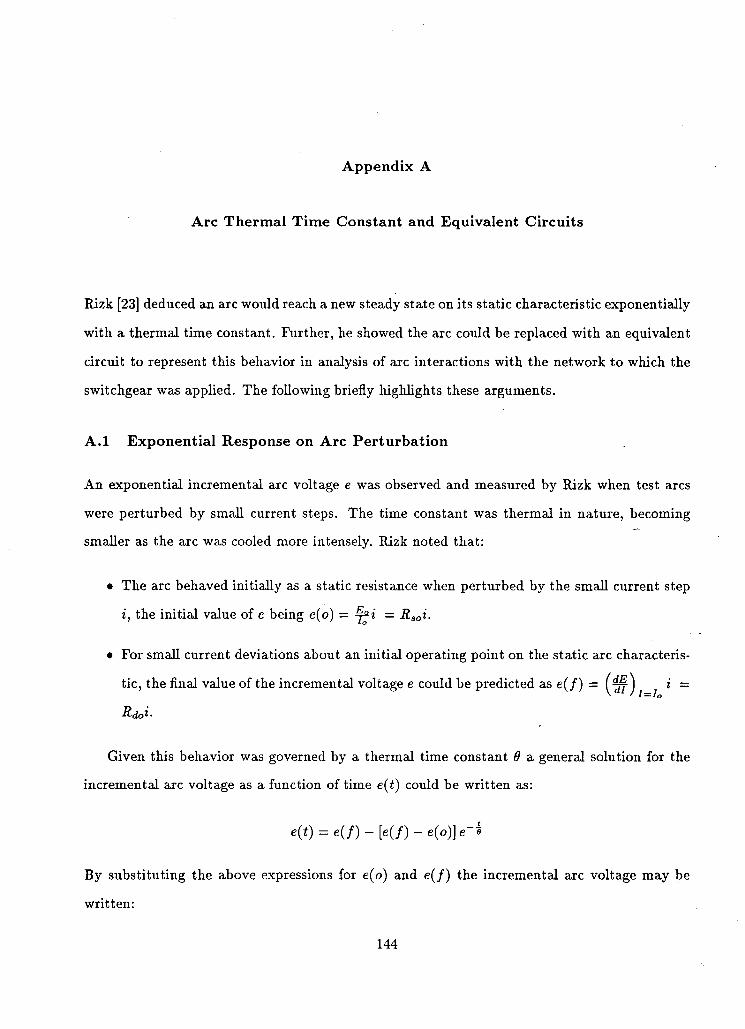
A p p e n d i x A
A r c T h e r m a l T i m e Cons tan t and Equ iva len t C i r c u i t s
Rizk [23] deduced an arc would reach a new steady state on its static characteristic exponentially
with a thermal time constant. Further, he showed the arc could be replaced with an equivalent
circuit to represent this behavior in analysis of arc interactions with the network to which the
switchgear was applied. The following briefly highlights these arguments.
A . l E x p o n e n t i a l Response on A r c P e r t u r b a t i o n
An exponential incremental arc voltage e was observed and measured by Rizk when test arcs
were perturbed by small current steps. The time constant was thermal in nature, becoming
smaller as the arc was cooled more intensely. Rizk noted that:
• The arc behaved initially as a static resistance when perturbed by the small current step
i, the initial value of e being e(o) = j^i = RBOi.
• For small current deviations about an initial operating point on the static arc characteris
tic, the final value of the incremental voltage e could be predicted as e(f) = (^f)^ / 1 =
Rdc-i-
Given this behavior was governed by a thermal time constant 9 a general solution for the
incremental arc voltage as a function of time e(t) could be written as:
c(*) = c(/)-[e(/)-e( 0)] C-i
By substituting the above expressions for e(o) and e(/) the incremental arc voltage may be
written:
144
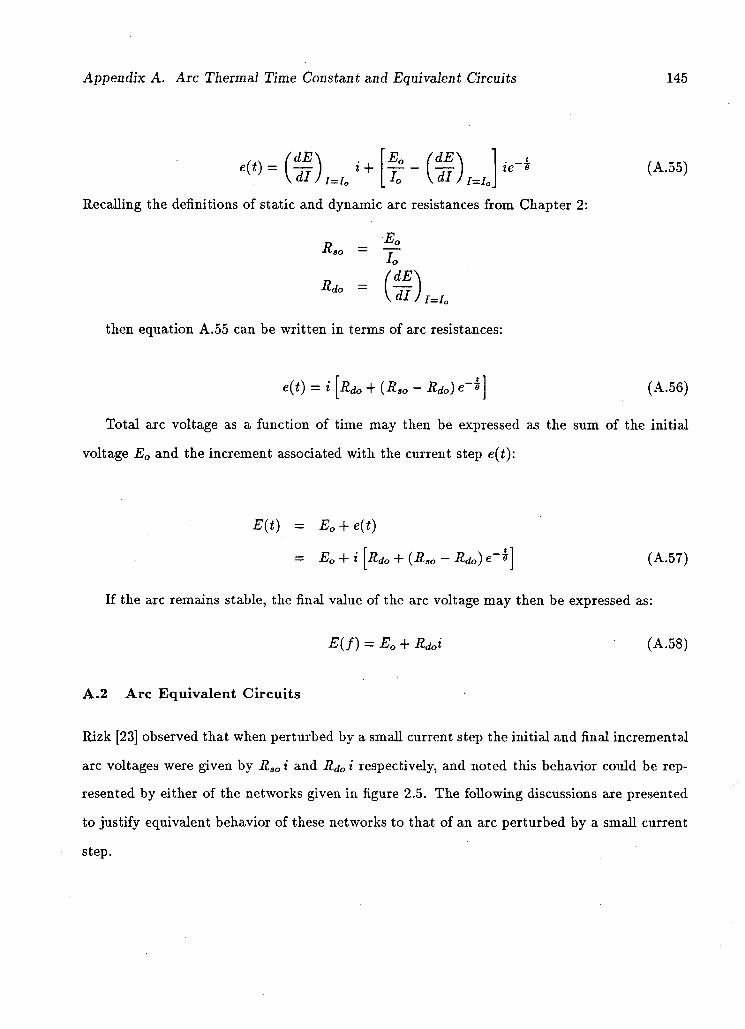
Appendix A. Arc Thermal Time Constant and Equivalent Circuits 145
(A.55)
Recalling the definitions of static and dynamic arc resistances from Chapter 2:
•so Eo
Io
Rdo =
then equation A.55 can be written in terms of arc resistances:
e(r) = i Rdo + (R30 - (A.56)
Total arc voltage as a function of time may then be expressed as the sum of the initial
voltage EQ and the increment associated with the current step e(i):
A.2 Arc Equivalent Circuits
Rizk [23] observed that when perturbed by a small current step the initial and final incremental
arc voltages were given by Rso i and Rdo i respectively, and noted this behavior could be rep
resented by either of the networks given in figure 2.5. The following discussions are presented
to justify equivalent behavior of these networks to that of an arc perturbed by a small current
step.
E(t) = E0 + e{t)
= E0 + i [Rdo + (Rao - Rdo) e -s] (A.57)
If the arc remains stable, the final value of the arc voltage may then be expressed as:
E{f) = E0 + Rdoi (A.58)
Appendix A. Arc Thermal Time Constant and Equivalent Circuits 146
A.2.1 P a r a l l e l A r c Equ iva len t N e t w o r k
Response of the parallel equivalent network to a small current step can be studied using the
circuit of figure A.89. If the switch closes at t = 0, i2 = 0 since current through L cannot
change instantaneously. The initial incremental arc voltage is then e(o) = iR\. Applying KCL;
i = k +i2
\ — 1 6 Ui + R2 +pLx.
\R2 + PLl + Ri 6 [ R!(R2 + pLi).
where p represents the differential operator jf-t. The final form of the differential equation
becomes;
+ e ( * l ± * 2 ) = i ^ ( A . 5 9 )
Assuming a homogeneous solution of the form e/,(r) = C\e e and a constant particular
solution ep = C2 yields via substitution;
9 =
C2 =
Ri + R2
iR\R2
R\ + R2
The total solution thus may be written as:
e(' ) = C i e ' U ^ % (A-60)
iR2
Applying the initial voltage condition e(o) = iRi yields C\ = ft1+R2 such that the final solution
is then given by: <t) = [i2ie-! + R2] (A.61)
By comparison to equation A.55, in order for the incremental voltage solutions to be equiv
alent:
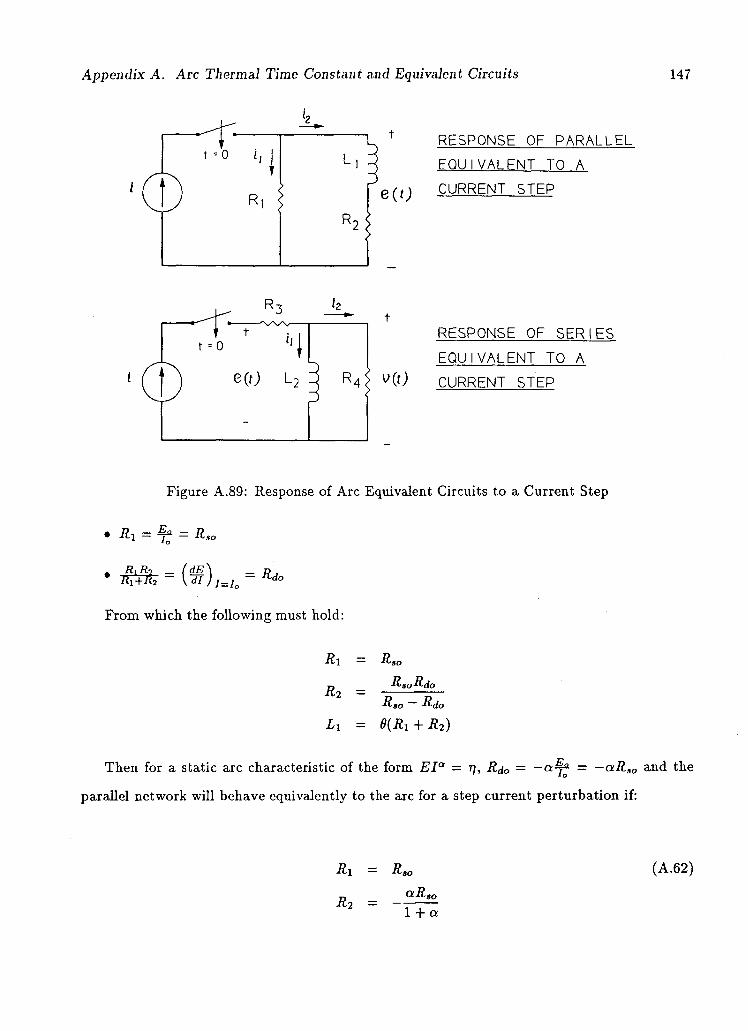
Appendix A. Arc Thermal Time Constant and Equivalent Circuits 147
RESPONSE OF P A R A L L E L EQU IVALENT TO A CURRENT STEP
RESPONSE OF S E R I E S EQU IVALENT TO A CURRENT STEP
Figure A.89: Response of Arc Equivalent Circuits to a Current Step
• Ri = = Rao
• £ * = ( # ) , . ! . = *••
From which the following must hold:
R\ = Rso
RsoRdo
Rso Rdo
Li = 6(R1 + R2)
Then for a static arc characteristic of the form EI a = n, Rdo = -of 2 = —aRso and the
parallel network will behave equivalently to the arc for a step current perturbation if:
Ri — R
R2 = -
so aRso 1 + a
(A.62)
Appendix A. Arc Thermal Time Constant and Equivalent Circuits 148
1 + a
A.2.2 Series A r c Equiva len t N e t w o r k
Response of the series arc equivalent network to a small perturbing current step can be studied
using the circuit of figure A.89. Since the current through L cannot change instantaneously,
the initial arc voltage assuming the switch closes at t = 0 is:
e(o) = i(R3 + R4)
By KVL, e(t) = iR3 + v(t) and using operational notation where p =
v(t) = i2R4
= pL2i\
= pL2(i - i2)
= pL2i -pL2v(t)
R4
RAPL2I R4 + pL2
hence,
This expression reduces to the following first order differential equation in e(i);
d-t + T2
e = i
de R4 .R3R4 (A.63)
Assuming homogenous and particular solutions of the form e/, = C\e » and ep — C2
respectively, yields;
e(i) = Cxe~i + iR3
L2
Appendix A. Arc Thermal Time Constant and Equivalent Circuits 149
which through application of the initial condition reduces to;
e(t) = R4ie-% + iR3 (A.64)
By comparison to equation A.55, in order for the series network to behave equivalently to
an arc, the following must hold:
• R4 = Rso — Rdo
• R3 = Rdo
• L2
= 8R2
Equivalent response to an arc perturbing current step for a static arc characteristic is then
satisfied if:
R3 = -aRao (A.65)
R4 = Rso(l +«)
L2 = 6R30(l + a)
(A.66)
The parallel and series arc equivalent networks proposed by Rizk have been used extensively
in various investigations [23],[22],[9], [1] and their validity is well accepted.
Appendix B
Reactor Load Side Oscillation Following Current Chopping
Load side oscillation on interruption of a single phase reactor may be considered analytically
using the network of figure 2.9. R\, R2 and L represent reactor winding resistance, reactor
damping (core losses) and reactor inductance. Prior to interruption, the load side voltage and
breaker current will be:
V{t) = Ksinu;,* (B.67)
ih(t) ~ 8 = sm(ijjat - e)
u>SL e ~ arctan ——
Ri
where: uis is power system frequency
Vs is system peak voltage
The approximation for ib(t) assumes current through load capacitance is negligible and R2 >
UJSL. In practice this is valid since reactor inductive reactance is at least one hundred times
larger than load network capacitive reactance and one hundred times smaller than R2 at power
system frequencies.
Consider the network of figure 2.9 to determine the load side transient voltage following
current chopping. Assuming current chopping occurs at time f = i c / , , i(o) ~ ich since capacitive
current is much smaller than the reactor current. V(o) = Vch can be calculated from a knowledge
of the chopping current itself:
150
Appendix B. Reactor Load Side Oscillation Following Current Chopping 151
Vch = V3 sin ustch (B.68)
ustch = arcsin + €
Using the p operator to denote differentiation with time, KCL may be applied to the network:
1 pC + V(t) = 0
which reduces to;
d 2V +
R\R2 + dV + RoV
dt2 [(Ri + R2)L C(Ri + R2)} dt LC(RX + R2)
Assuming solutions of the form Ke"'t yields the characteristic equation
7
2 + 2/37 + ul = 0
= 0 (B.69)
(B.70)
For practical reactor networks tested by the author and others [1] [17], the solution of
equation B.69 is a damped sinusoidal response. In terms of the characteristic equation, the
physical evidence implies /32 < u2, such that its roots are complex:
71,2 = -fi±]yjul-P (B.71)
R2
uz —
2 U i + R2\
R2 (JZi +. R2)LC
Ri 1 L R2C
The general solution of equation B.69 then takes the form:
V(t) = Kxe-&Lt cosudt + K2e~l*Lt sinudt (B.72)
Appendix B. Reactor Load Side Oscillation Following Current Chopping 152
where: u>d is the damped natural frequency of the load side oscillation.
PL is the damping constant as previously defined.
K\ and K2 are constants be fixed by initial conditions
at the moment of current chopping.
UJ0 is the undamped natural frequency of the network
The solution can be alternately expressed as;
V{t) = Re-M cos(udt - ij>) (B.73)
K = j i q + iq
* = a r c t a n £
Applying the initial voltage condition to equation B.72 yields V(o) = Vch = K\. Solving
for K2 requires consideration of initial current conditions. Noting that i(i) = —C equation
B.72 may used to derive a general solution for the current:
•TO = - C f (B.74)
= Ce'^1 [{pLR\ - udK2) cosojdt - (udR\ + /3LK2) smudt]
Initial current conditions may then be applied:
i(o) = ich (B.75)
= C{0LKx-udK2)
A 2 = Ud
Using equation B.73, a total solution for the load side voltage may then be written as:
V(t) = ^Vc\ + (i^sLJt^ e-<^cos(^r-V0 (B.76)
Appendix B. Reactor Load Side Oscillation Following Current Chopping 153
ij) = arctan VchPL ~ UdVch
where f3r, and CJJ are as previously defined. By inspection, it is clear the initial voltage peak
(suppression peak) occurs at a time tp where ujtp — ij) = 0. That is:
Vch0L ~ UdVch
The magnitude of the suppression peak voltage is then given by:
t„ = — arctan
VP = V(tp)
"dvch
Ud
(B.77)
(B.78)
In practical reactor networks the damped natural frequency uid is usually sufficiently larger
than the damping factor /?/_,, that it is acceptable to neglect damping in predicting the suppres
sion peak Vp [1], [17]. Neglecting damping is equivalent to simultaneously allowing Ri approach
zero and R2 to approach oo in equation B.71:
lim pL = 0 (B.79) Rl —0 v '
H2 —* oo
lim uj = R1 — o LL R2—00
Apphcation of these conditions to equation B.78 yields:
VP * \IVc\ + i2
ch^ (B.80)
~ + {ichudLY
Usually, current chopping occurs close enough to a natural current zero that Vch ^ Vs where
Vs is system peak voltage. Then equation B.80 may be used to define a per unit suppression
peak overvoltage factor:
Appendix B. Reactor Load Side Oscillation Following Current Chopping 154
P
The reactor current expression of equation B.74 may be manipulated into an alternate form:
»(*) = Ce-^yjDl + D\ cos(wrft + 6X) (B.82)
Di = {udK2-pKx)
D2 = (udKi+pK2)
D2 61 = arctan
Substituting the previously derived values of Kx and K2, Di and D2 reduce to :
Di = ^
2?2 _1 Ud L
ich
A complete current solution may then be written as:
• ' C O = ^ + e-fa» c o s ( ^ + g l ) (B.83)
#1 = arctan CwdVc/, fa/
ud ich
When studying breaker reignition, equations B.76 and B.83 may be used to deduce initial
reactor voltage and current conditions just prior to reignition.
Appendix C
Analysis of Reignition Oscillations
As described in chapter 2 the first parallel oscillation is a short lived high frequency transient.
A good general understanding of reignition phenomena may be obtained by neglecting the first
parallel oscillation and it will not be considered here.
C . l The Second Parallel Oscillation
Potentially the highest transient voltage at reignition will occur during the second parallel
oscillation during the oscillatory energy exchange between source and load side capacitances.
The currents in source and reactor inductances cannot change rapidly enough to influence the
second parallel oscillation and to a good approximations may be treated as constants. Treating
the reigniting breaker as simply a switch closing at t = 0, analysis can proceed using the
second parallel oscillation network of figure C.90 derived from figure 2.7. C3 and Cr represent
source and load side capacitances respectively while Lb and Rb represent the bus impedance
between the breaker load side capacitance. Rb can also incorporate arc and resistor switch
resistances where appropriate. Applying KCL to the network with operational notation p and
- to represent differentiation and integration with time;
P C» + Rb+PLb Rb+PLb
Vs i,(o)
Rb+pLb ? C r 1 Rb+pLb
Vr -ir(0)
Since the current through the breaker cannot change instantaneously, and VJ, = Rbib + Lbi'b,
initial conditions may be expressed as:
155
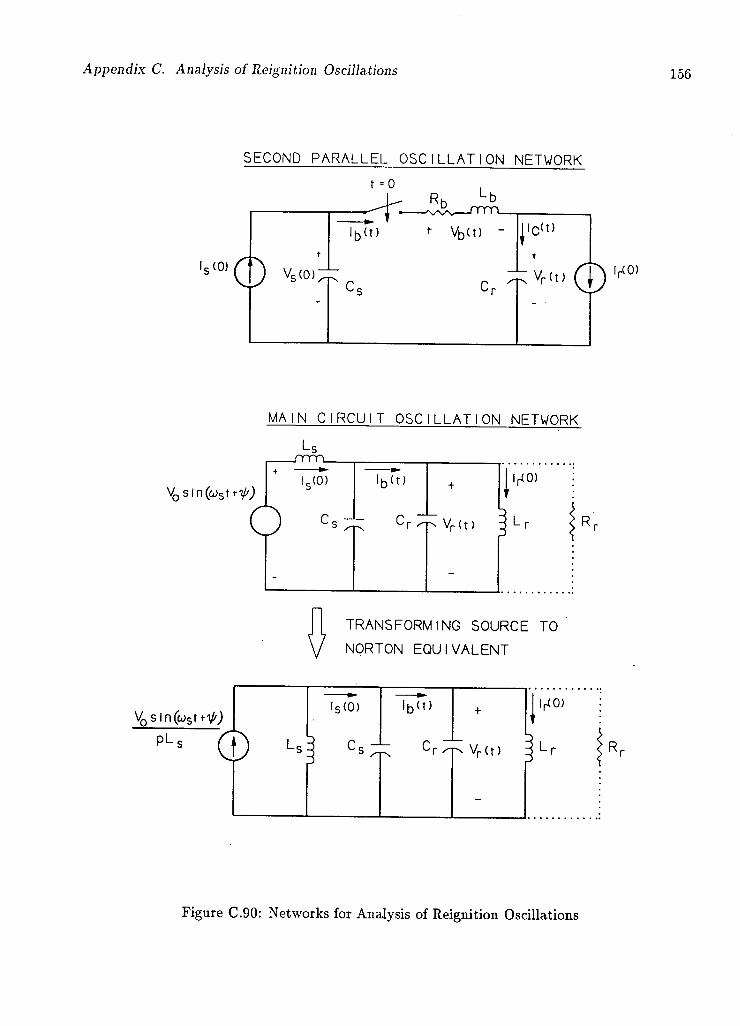
Appendix C. Analysis of Reignition Oscillations
SECOND P A R A L L E L O S C I L L A T I O N NETWORK
t =0
MAIN C I R C U I T O S C I L L A T I O N NETWORK
vQ smutty;
TRANSFORMING SOURCE TO \J NORTON EQUIVALENT
lS<0) l b ( t ) IptO)
Lc C r ^js V r (t ) 3 L i R
Figure C.90: Networks for Analysis of Reignition Oscillations
Appendix C. Analysis of Reignition Oscillations 157
ib(o) = 0
Vb(o) = Va(o)-Vr(o)
.,(o) = Vs{o)-Vr(o) Lb
Using Cramer's rule, V (f) and Vr(i) may be individually solved for to yield:
(C.84)
Va(t)
Vr(t)
Det A
Det A
where:
Det A =
Vb(t) = V.(t)-Vr(t)
_ ia(o)pCr + ir(o)pCs
Det A
1 Rb+pLb Rb+pLb
1 PCr + -^h
= P 2CsCr(Rb + pLb) + p(Cr + C.) Rb + pLb
Rb+pLb ~<~ Rb+pLb
Substituting for Det A and noting ib(t) - R^^Lb yields the following differential equation
in tb:
ib{t) Lb CaCrLb
is(o) ir(o) Cr J
_1_ Tb
(C.85)
Assuming a homogenous solution form of ibh = e~ X t, gives the characteristic equation
Rb , Cr + Ca
Lb CaCrLb
Roots for a damped oscillatory response are:
= 0
Ai,A 2 = -Pp ± JU>d2
Appendix C. Analysis of Reignition Oscillations 158
Rb
2Lb
2 Cr ~\~ C g U =
CsCrLb
Damping in reactor networks is typically light and assuming damped oscillatory response
is valid. With an opening resistor, damping will be much more significant but some degree of
oscillation can still be expected. The homogenous solution in general form is then given by:
ibh{t) = Ktf-h* cosud2t + K2e-^* s\nud2t (C.86)
Since the driving function is time invariant, a constant particular solution may be assumed,
ibp = K3 which on substitution into the differential equation gives:
K _ CTia(o) + Cgir(o)
Cr -\- Cs
The total solutions for ib and i'b may then be written as:
ib(t) = e ^ [A'i cosud2t + K2 sinud2t] + Cria(o) + Cgirjo) Cr + Cs
(C.87)
z'fc(0 = e 0 p t [(vd2K2 - PpKi) cosud2t - (KiOJd2 + PPK2) sinwd2t]
On substitution of the initial conditions given by equation C.84:
ifc(o) = Ii'i + Cris(o) + Cgir(o) Cr+Cs
Ki = -Cria(o) + Cgir(o)
C r + C g
i'b{o) = ud2K2 - PpKx
Appendix C. Analysis of Reignition Oscillations 159
Vs(o) - Vr{o)
Va(o) - Vr(0) - Rb(Cris(o) + Cair(o))] 2 Cs + Cr
The expression for K2 may be further simplified by noting that if Rb is small, then:
• Ud ~ u0
The term with coefficient may be neglected without much concern.
K~2 may then be written as:
I<2 CaCr
Lb(Cs + Cr)
A complete solution may hence be written as:
[Va(o)-Vr(o)}
CaCT
+
/ Lb(Ca + CT)
Cria(o) + Cair(o)
[Va{o) - Vr{o)} e-^ smud2t
[l - e~P p t cosud2t
(C.88)
Ca + Cr
Since damping is not large, the damped second parallel oscillation frequency is essentially:
Cr + Ca
/ p 2 ~ 27rV CrCaLb
Second parallel oscillation frequency is typically several hundred kHz. The current transient
damps quite quickly to a quasi-steady state value in a time td:
ib(td) -Cria(o) + Cair(o)
(C.89) Ca + Cr
which forms the initial current condition for the subsequent main circuit oscillation.
The load side voltage during the second parallel oscillation can become very large and it is
worth considering its general behavior. Load side voltage can be derived from the expression
for current. Recalling that because the second parallel oscillation is so fast, it is valid to assume
Appendix C. Analysis of Reignition Oscillations 160
reactor current remains constant at ir(o) for the duration. Then noting that ic(t) = i0(t) — ir(o)
and ic(t) = Cr^f the following may be written:
1 ft rv,(t) — / icdt = dVr= Vr(t)-Vr(o) Cr Jo JVr(o)
Substituting for ic(t), Vr(t) may be written as:
Vr(t) = Vr(o) - ^ + ib(t) dt (C.90)
After evaluating the integral and performing lengthy but straight forward algebraic manip
ulation, the load side voltage solution reduces to:
_ Vr(o)Cr + V3(o)C3
Vr{t) ~ c7Tca
+
ia(o) - ir(o) Cr + Cs
t (C.91)
+
+
Ca + CT
Cae-^ 1
Ca + Cr
\r ( \ ~r ( \ , Rb { C'ris(o) + Cair(o)\]
vr{o) - va(o) + — y—cr + ca )\COSUJd2t
Rb sinw^ 2ujpLb ujp
Normally, the bus between source and load side capacitance is short and Rb is small. Further,
the second parallel frequency being several hundred kHz, results in the term 2w\,b being small.
Through application of these conditions the load side voltage may be written:
Vr(t) VT{o)Cr + Va(o)Cs
+
Cr + C,
Ca+Cr
+ i,{o) - ir{o)'
Cr "f" Ca
[Vr(o) - Va{o)) COSUd2t
(C.92)
C a A~ CT Up\Ca ^ CT ) sinwd2*
Given that the second parallel breaker current damps quickly to a quasi-steady state as
described by equation C.89 in a time tj, the load side voltage at that time is then:
Appendix C. Analysis of Reignition Oscillations 161
i>(o) - ir(o) td (C.93)
Cr + Cs
Together with equation C.89, these form the initial conditions leading into the main circuit
oscillation. Provided the second parallel oscillation damps quickly, the ramp term will not
become large enough to have significant effect on the load side voltage solution.
The complexity of equations C.91 and C.92 at first glance masks the potential for large
overvoltages during the second parallel oscillation. Consider the case of a reignition occurring
at or near a recovery peak such that Vr(o) and Vs(o) « 1.0 pu. At the recovery peak, both
source and load side voltages will be approximately at their opposite peak values. Hence the
currents iT(o) and is(o) will be essentially zero. Further, it will typically be the case that
Ca > Cr- Imposing these conditions the load side voltage during second parallel oscillation
becomes;
Vr{t) « V,(o) + (Vr(o) - Vs{o))e-^ 1 cosud2t (C.94)
It is clear from this expression that beginning from VT(o) = 1.0 pu, within a half cycle of
oscillation the load side voltage may rise to a value in excess of 3 pu since (3P -C OJP and power
system frequency is much less than up. This simplified expression also demonstrates how the
load side voltage oscillates about and finally damps to a value essentially equal to the source
voltage at the start of reignition V„(o).
C.2 The Main Circuit Oscillation
In the event that interruption is not successful at a zero of the second parallel oscillation
current, the main circuit oscillation develops to involve all network elements in oscillatory
energy exchange. The assumptions used to analyze the second parallel oscillation led to a
quasi-steady state breaker current and associated voltage given in equations C.89 and C.93
which form the initial conditions of the main circuit oscillation.

Appendix C. Analysis of Reignition Oscillations 162
Since main circuit oscillation is a slower phenomenon, initial source and load side inductor
currents cannot be considered constant and ir(o) and is(o) must be treated as initial condi
tions. Since voltages on the source and load side of the breaker equalize during the second
parallel oscillation, the main circuit oscillation network of figure C.90 may be used for analysis.
A sinusoidal power system source voltage is assumed and reactor network damping initially
neglected. Using superposition, the zero input response (response to initial conditions with
sources removed) will be first evaluated. The forced zero state response (initial conditions set
to zero) will then be derived and added to the zero input response to give the complete main
circuit oscillation solution.
Using KCL and operational notation to represent differentiation and integration with time,
the zero input portion of the load side voltage Vr(t) may be expressed by the following differential
equation:
Vr ?(T3r)+'<c-+c'> 0
which reduces to:
Vr
2 , Lr + Ls
P + (C.95) LaLr(Ca + Cr).
The roots of the characteristic equation are clearly ztju}m where u>m is the main circuit
oscillation frequency given by:
Lr + La
Y LrLa(Cs + Cr)
The free response solution then has the following form:
Vr free = Fi COSLJmt + F2 SmUmt
with the coefficients to be determined by the network initial conditions. Then noting zj,(i)
CrVr'(t) + ir(t), the coefficients may be evaluated as follows:
Appendix C. Analysis of Reignition Oscillations 163
Fx = Vrfree(o)
= Vr(td)
t2 =
ib(o) - irjo)
-JmCr
-JmCr
Where i0(td) and Vr(td) are the second parallel oscillation quasi-steady state breaker current
and load side voltage which form the initial conditions leading into the main circuit oscillation
previously given in equations C.89 and C.93. On substitution for idtd), F2 reduces to !^0)Z'TS0^ v (Ct+Cr )uim
and the free response load voltage may thus be written as:
Vr free(t) = Vr(td) COSUmt + is(o) - ir(o)
sinumt (C.96)
The forced load voltage response (zero state response) may be evaluated by introducing the
source voltage and setting all initial conditions to zero in the network of C.90. Note that ip
represents the angle of the source voltage at the moment of reignition. Converting the source
to a Norton equivalent as in figure C.90 and repeating the application of KCL, the following
differential equation describing the forced response of the load side voltage results:
V forest) [P + ( C a + C r ) L a L r \ ~ L a ( C a + C r ) (C97)
Roots of the characteristic equation are ±ju;m as for the free response and the homogenous
part of the forced solution has the general form:
Vr forced h = Fx COS UJmt + E2 5inumt
Appendix C. Analysis of Reignition Oscillations 164
Assuming a particular solution of the form:
Vr forced p = E3 sin(w,< + lp) + E4 COs(uat + 1p)
and substituting into equation C.97 yields:
hi-X —
(ul-u])Lr + Ls
E4 = 0
The general form of the forced response may then be written as:
(jj2 V L
Vr forced(t) = Et cosumt + E2 smumt + m ° r sm(uat + rl>)
Through application of the zero state initial conditions associated with the forced response:
Vr forced{o) = 0
V (n\ - ~ « ' r ( ° ) Vr forced\°) — ~Q
= 0
the coefficients E\ and E2 reduce to:
K 2 -U?n)Lr + La
The free and forced responses may then be added to give the total load side voltage:
Appendix C. Analysis of Reignition Oscillations 165
Vr(t) =
+
U
(u]-Ljl)Lr + L3
,2 Vr{U) ~
V0 sm(u3t + rb)
L -V0sin^
+ LJ„
(ul-u>)Lr + L,
i,(o) - l'r(o) Us^m Lr
COS LJmt
14 COS if? sin Ljmt
(C.98)
C3 + Cr {Ul - Ul) Lr + Lt
This formidable expression can be simphfied by noting that:
• For shunt reactor network switching, L3 <C Lr and — 1-
• The main circuit oscillation is usually at least an order of magnitude larger then the power 2
system frequency such that ffi z ~ 1
Applying these assumptions, the load side voltage during the main circuit oscillation may
be expressed as:
Vr(t) ~ V0 sm(u3t + i>) + [Vr(td) - V0 sin ip] cosumt
'is(o) - ir(o)
(C.99)
1 + — Ca +Cr
- u3V0cosip s i n umt
Referring to figure C.90, and noting ir(t) — ir(o) = f^Vr dt, the breaker current during
the main circuit oscillation may be written:
ib(t) = crv;(t) + ir(t)
= CrV;(t) + ir(o) + l ^ d t JO L>r
Evaluating the above derivative and integral in Vr, the breaker current may be expressed
as:
Appendix C. Analysis of Reignition Oscillations 166
. , . Lrir(o) + L.i.(o) . ((ja \' *b(0 = r , r + 1 - ~ LS + LR \um)
'CrLru] - 1
VQcos xp
usLr
(C.100)
+ usLr
+ um[V0sini>-Vr(td)]
is{o) - ir{o)
VQ cos(wsi + xp)
CrLr — CsLa
smumt
+ Cs -j- Cr
ujgV0cosxp
Lr-rL3
CrLr — CaL Lr + Ls
COS Ulmt
Several simplifications can be made since for most practical reactor switching problems:
• < Lr and x^CT < X^XT
• te)2«1
On applying these simplifications to equation C.100, the breaker current during the main
circuit oscillation reduces to:
ib(t) ~ ir{o) + VoCosj> | /C r L r u 2 g - 1 V0cos(wst + Xp) (C.101)
+ u;mCr [V0 sin xp - Vr(td)] sin umt
Cr
+ [ig(o) - iT{o) - u3(Cg + Cr)V0cosxp] cosumt CT ~Y Cg
As a final point, since reactor networks are so lightly damped, there is little error introduced
by initially neglecting and later reintroducing damping. If the resistor Rr shown connected with
dashed lines in figure C.90 had been incorporated into the analysis, the differential equation
describing zero input response would have reduced to:
Appendix C. Analysis of Reignition Oscillations 167
= 0 (C.102)
On comparison to standard second order form the damping factor for the main circuit
oscillation is j3m = 2Rr(cr+c.) a n ^ n e t w o r k damping may be introduced to the main circuit
oscillation breaker current and load side voltage as follows:
Vr P2 + P + Lr + Ls
RJCs + Cr) LsLr(Ca + Cr).
Appendix C. Analysis of Reignition Oscillations 168
ib(t) CrLroj 2
3 - 1 uaLr
V0 cos(o;s< -f- if}) + ir(o) + V0 cos ij)
u>3Lr
(C.103)
+ umCr [V0 sin ij) - Vr(td)] e~ 0 m t smumt
Cr
+ Cr+C [is(o) - ir(o) - LJs(C, + CT)V0 cos V>] e / 3 m t cosa;mr
Vr{t) ~ V0sii\{LJst + ip) + [Vr(td) - V0sinf/>]e~ 0 m t cosumt (C.104)
+ — i3(o) - ir(o)
Ca + Cr
— o T- , cos ip ,-Pmt sincjmi
Noting that ( C r LJ$- 1) V0cos(ust + = j ( C r LJ$~ l) V0sin(w,r + V) and Ls < LT, the
first term in equations C.103 and C.104 are the steady state breaker current and load side
voltage to which the network will tend as the main circuit oscillation damps out. Since the
load and source side voltages practically equalize during the second parallel oscillation, the
term V^sin^ — Vr(td) will be small. It then appears from equation C.103, that the ratio c
c ^ c
dictates how large the oscillatory portion of the main circuit oscillation shall be. If this ratio
is small, the steady state sinusoidal current grows quickly enough that the cosa;mi and sinumt
terms cannot produce current zeroes. In such cases it will be impossible for the breaker to
interrupt during main circuit oscillation and a new half cycle of 60 Hz current will result. Main
circuit oscillation could in fact be essentially absent for C r < C,.
Appendix D
Effects of Introducing a Neutral (Grounding) Reactor
A neutral reactor is often applied where shunt compensation of transmission circuits protected
by single pole tripping protection schemes is desired. This facilitates clearing single phase faults
by compensating a portion of the distributed capacitive coupling from adjacent phases which
continues to drive fault current and hinders extinction. Considering the four reactor scheme of
figure D.91 which is grounded through a neutral reactor, a nodal formulation could be written
as follows:
1 (V
•t 0
0 0
1
0
0
J_ (LP + LN)
VA IA
VB IB
VC Ic
vN 0
where: LP is the phase reactor inductance
LN is the neutral reactor inductance
Rearranging the equation for Vjv yields:
V = (VA + VB + VC)LN
3LN + LP
By back substitution, the fourth equation may be eliminated to yield:
uLr
— ^ N
. .LN 3Lp]+Lip
2Lpj+LP
3Lni+Lp
3Lpi+Lp VA IA
VB = IB
VC Ic
(D.105)
169
Appendix D. Effects of Introducing a Neutral (Grounding) Reactor 170
FOUR REACTOR NETWORK SOL I P LY GROUNDED EQU IVALENT
'c c L P ^ J T T T l
N
A B ( 1 IB
JTTT1 nnnrL-
Figure D.91: Four Reactor Network and its Solidly Grounded Equivalent
The four reactor connection may be replaced with the solidly grounded equivalent network
of figure D.91 whose nodal formulation is:
_1 u
Lg + L, J_
L, Lg + L,
J_ L,
J_ 'L,
'L, J _ 1 j- JL
/4
V B =
Vc
(D.106)
where: Lg is the effective network inductance to ground
Li is the effective network phase to phase inductance
due to introduction of the neutral reactor.
In order for the networks to be equivalent, diagonal and off diagonal elements of the admit
tance matrices of equations D.105 and D.106 must be equal. Equating the entries accordingly

Appendix D. Effects of Introducing a Neutral (Grounding) Reactor 171
leads to:
(D.107)
LG = 3LN + LP
Introduction of a neutral reactor then has the following effects on the reactor network:
• Effective inductance to ground is increased over that of the phase reactor by 3L^.
• An effective inductance exceeding 3Lp appears between phases of the network.
As outlined in chapter 3, the first effect results in larger suppression peaks during load
side oscillation following current chopping. This results in larger TRV and hence a greater
likelihood of reignition than when switching the solidly grounded network. The second effect
results in the phases of the reactor network being strongly inductively coupled. Although this
intentionally results in more reliable single pole clearing during associated line faults, increased
phase interactions will occur during current chopping, load side oscillation and reignitions when
switching the reactor.
Li = Lp 3 + ^
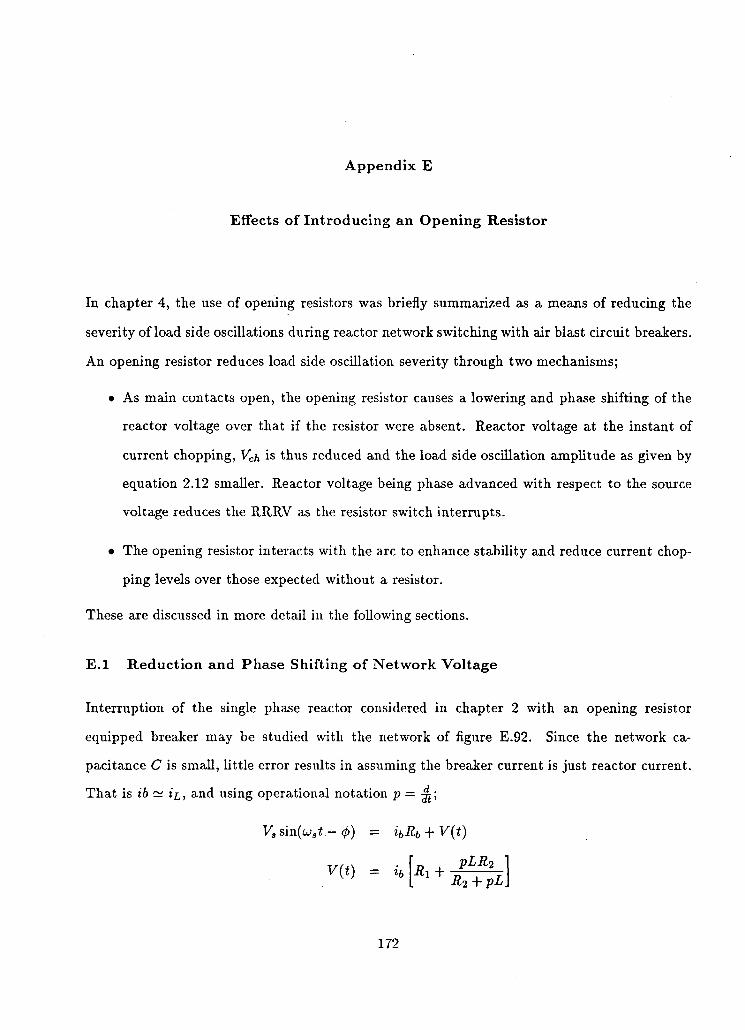
Appendix E
Effects of Introducing an Opening Resistor
In chapter 4, the use of opening resistors was briefly summarized as a means of reducing the
severity of load side oscillations during reactor network switching with air blast circuit breakers.
An opening resistor reduces load side oscillation severity through two mechanisms;
• As main contacts open, the opening resistor causes a lowering and phase shifting of the
reactor voltage over that if the resistor were absent. Reactor voltage at the instant of
current chopping, Vch is thus reduced and the load side oscillation amplitude as given by
equation 2.12 smaller. Reactor voltage being phase advanced with respect to the source
voltage reduces the RRRV as the resistor switch interrupts.
• The opening resistor interacts with the arc to enhance stability and reduce current chop
ping levels over those expected without a resistor.
These are discussed in more detail in the following sections.
E . l Reduction and Phase Shifting of Network Voltage
Interruption of the single phase reactor considered in chapter 2 with an opening resistor
equipped breaker may be studied with the network of figure E.92. Since the network ca
pacitance C is small, little error results in assuming the breaker current is just reactor current.
That is ib ~ ir,, and using operational notation p = 4-\
V,sin(wsr - <f>) = ibRb-rV{t)
V(t) = ib R\ + pLR2
R2 + pL\
172
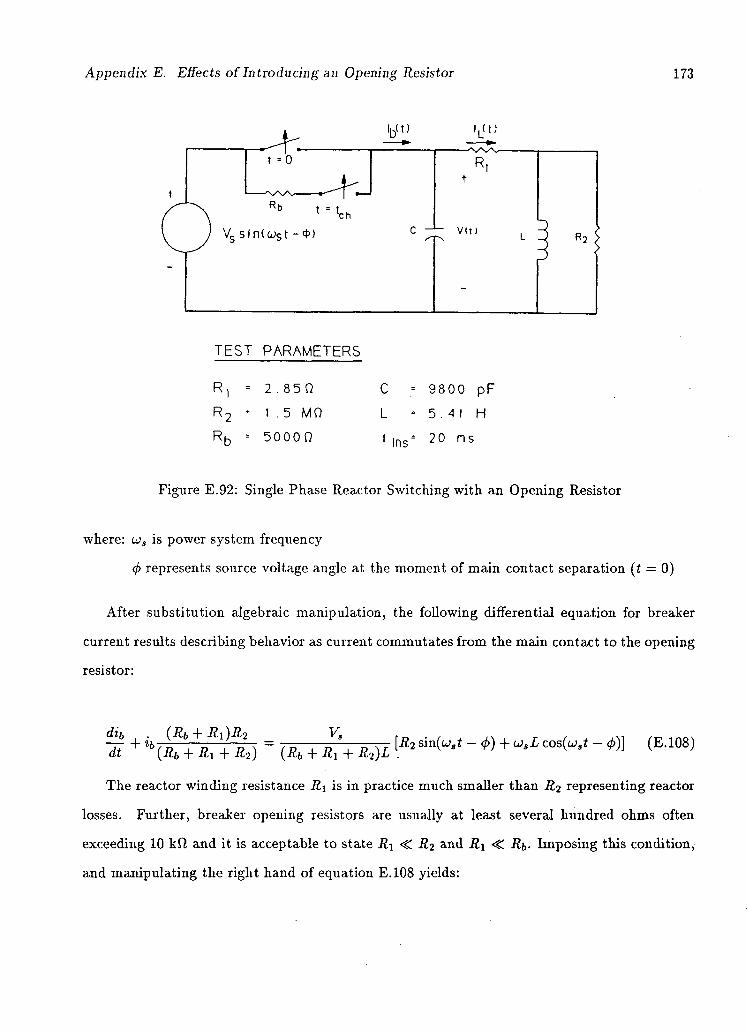
Appendix E. Effects of Introducing an Opening Resistor 173
Rb
V s sin(w st -<t>)
h<t)
t = t, ch
T E S T P A R A M E T E R S
R.
R -
Rh
2 . 85 n
1.5 Mi l 5 0 0 0 0
C
L
ins'
9800 pF 5.41 H 20 ns
Figure E.92: Single Phase Reactor Switching with an Opening Resistor
where: us is power system frequency
(f> represents source voltage angle at the moment of main contact separation (t = 0)
After substitution algebraic manipulation, the following differential equation for breaker
current results describing behavior as current commutates from the main contact to the opening
resistor:
£ + ^ R T I ) = LR> MU-' -*)+U-L COS("-' - *)] (E-108)
The reactor winding resistance R\ is in practice much smaller than R2 representing reactor
losses. Further, breaker opening resistors are usually at least several hundred ohms often
exceeding 10 kfi and it is acceptable to state R\ <C R2 and R\ <C Rb- Imposing this condition,
and manipulating the right hand of equation E.108 yields:
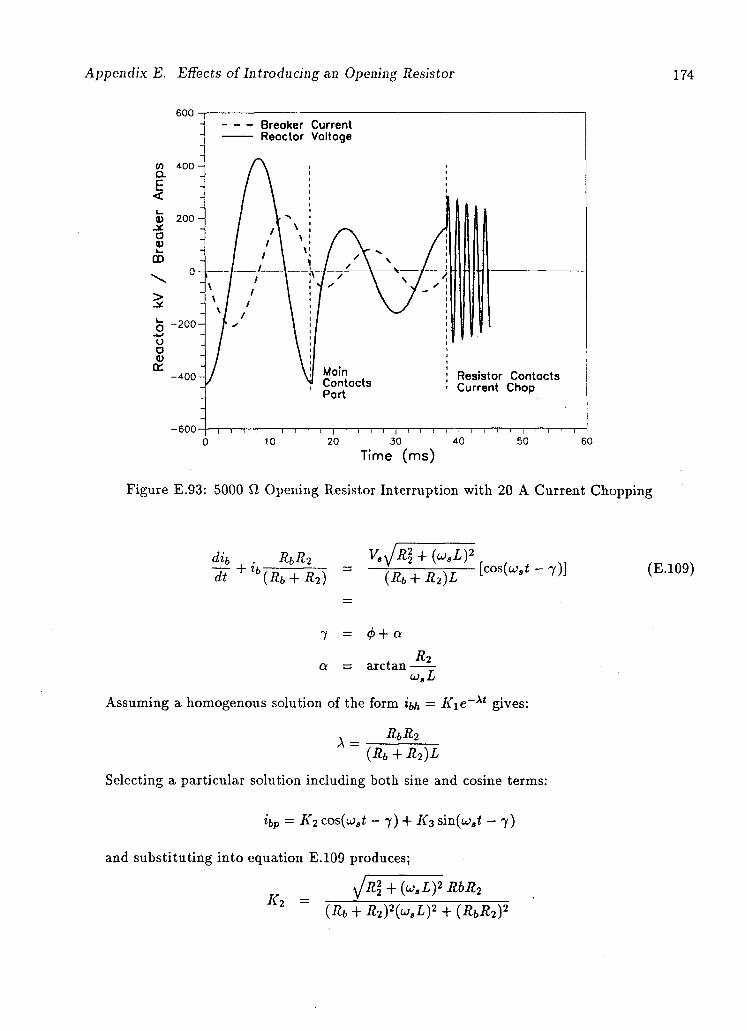
Appendix E. Effects of Introducing an Opening Resistor 174
600
400 -CL _ E _ < -
-a> 200 -
a 0) — m -
0 -
> -
o - 2 0 0 -
o o Cr; -
-400-
-600-
Breaker Current Reactor Voltage
Main Contacts Part
Resistor Contacts Current Chop
i — i — i — i — | — i — i — i — i — i — i — i — i — i — i — i — i — i — i — i — i — i — i — i — i — (0 20 30 40 50 60
Time (ms)
Figure E.93: 5000 fl Opening Resistor Interruption with 20 A Current Chopping
dib . RbR2 dt + t b(Rb + R2)
Va^R2
2 + (uaL)2
(Rb + R2)L
<f>+ a
[cos(u>at - 7)]
a = arctan RT_ UJ.L
Assuming a homogenous solution of the form ibh = K\e~ X t gives:
^ _ RbR2 ~ (Rb + R2)L
Selecting a particular solution including both sine and cosine terms:
hp = K2 cos(w8f. - 7) + K3 sin(w,r. - 7)
and substituting into equation E.109 produces;
yjR2 + (usL)- RbR2
K- = (Rb + R2)2(uaLf + (RbR2)2
(E.109)
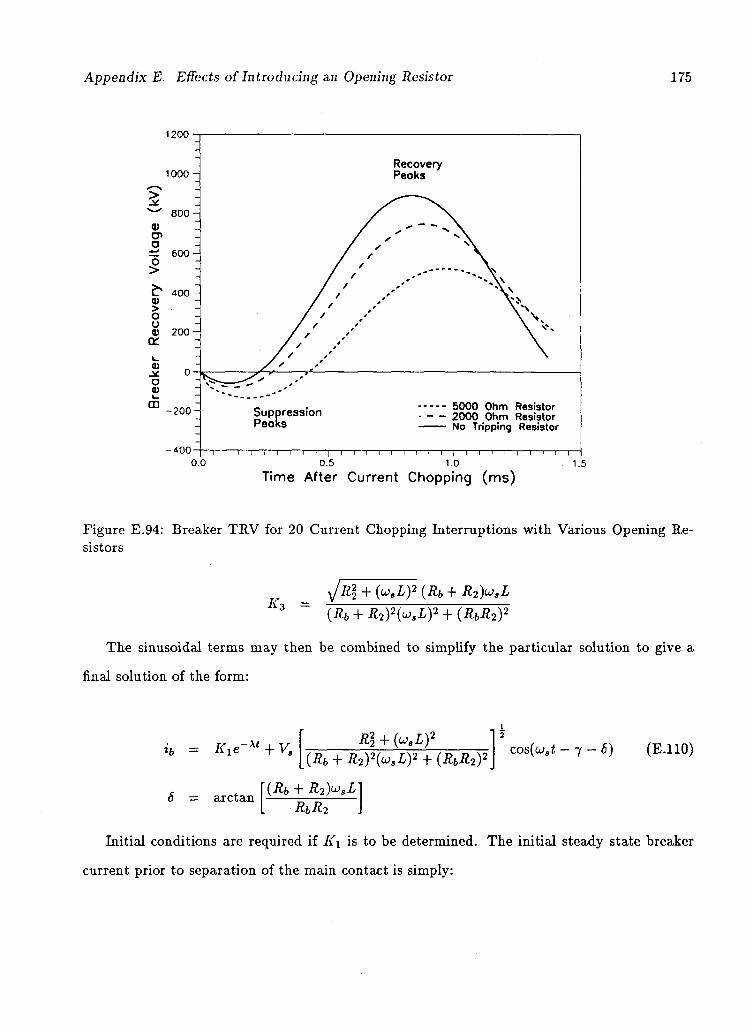
Appendix E. Effects of Introducing an Opening Resistor 175
1200 •
1000 •
-200-
-400-
R e c o v e r y P e e k s
Suppression Peoks
5 0 0 0 O h m Resistor 2 0 0 0 O h m Resistor No Tripping Resistor
- i — I — i — i — i — i — r ~i—i—i—i—r 0.0 0.5 1.0
Time After Current Chopping (ms) 1.5
Figure E.94: Breaker TRV for 20 Current Chopping Interruptions with Various Opening Resistors
K3
yjR\ + (u,Ly (Rb + R2)u3L (Rb + R2)2(usL¥ + (RbR2)2
The sinusoidal terms may then be combined to simplify the particular solution to give a
final solution of the form:
ib = Kie-X t + V,
6 = arctan
R\ + (usLf (Rb + R2)2(u3Ly + (RbR2)2
(Rb + R2)uaL
cos(ust - 7 - 8) (E.110)
RbR2
Initial conditions are required if K\ is to be determined. The initial steady state breaker
current prior to separation of the main contact is simply:
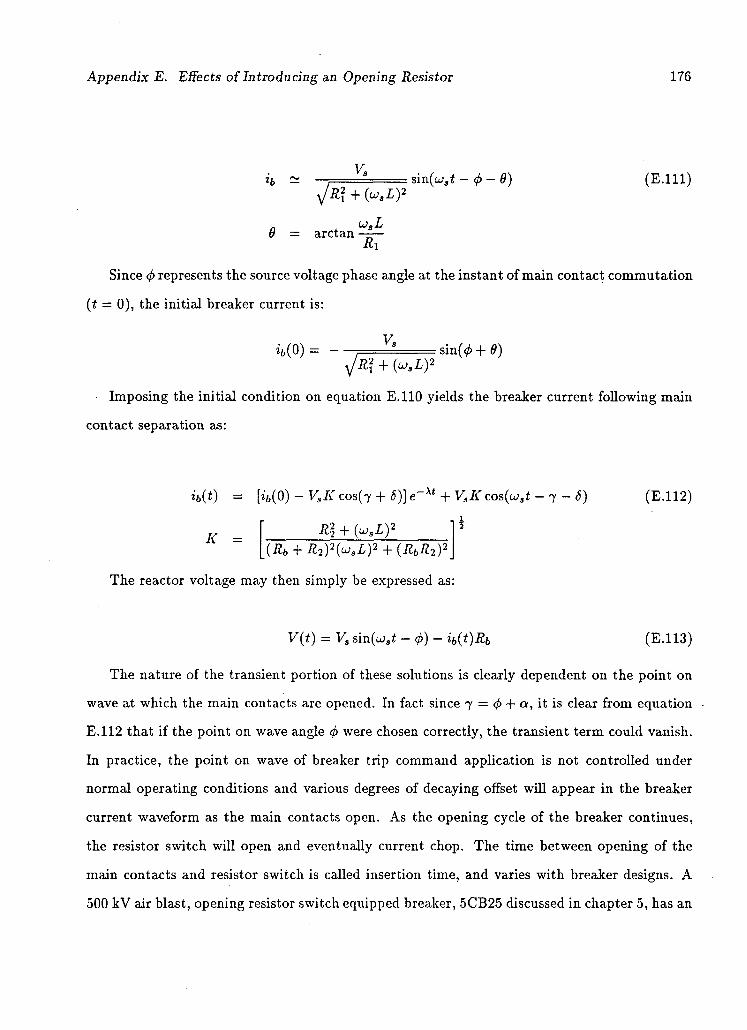
Appendix E. Effects of Introducing an Opening Resistor 176
ib ~
9 = arctan
jRl + (uaL)-
u.L
sin(cjs< — (j> — 9) (E.lll)
Since <j> represents the source voltage phase angle at the instant of main contact commutation
(t = 0), the initial breaker current is:
*b(0)= -V.
sin(0 + 9) y/R\ + (U3L)-
Imposing the initial condition on equation E.110 yields the breaker current following main
contact separation as:
»'&(*) = [t'b(0) - V,K cos(7 + 6)] e~ x t + VaK cos(uat - j - 6)
Rl + {"sLf
(E.112)
K = _(Rb + R2f{usL)- + (RbR2)
2
The reactor voltage may then simply be expressed as:
V(t) = Va sm(ojat -(j))- ib(t)Rb (E.113)
The nature of the transient portion of these solutions is clearly dependent on the point on
wave at which the main contacts are opened. In fact since 7 = <$> + a, it is clear from equation
E.112 that if the point on wave angle <p were chosen correctly, the transient term could vanish.
In practice, the point on wave of breaker trip command application is not controlled under
normal operating conditions and various degrees of decaying offset will appear in the breaker
current waveform as the main contacts open. As the opening cycle of the breaker continues,
the resistor switch will open and eventually current chop. The time between opening of the
main contacts and resistor switch is called insertion time, and varies with breaker designs. A
500 kV air blast, opening resistor switch equipped breaker, 5CB25 discussed in chapter 5, has an
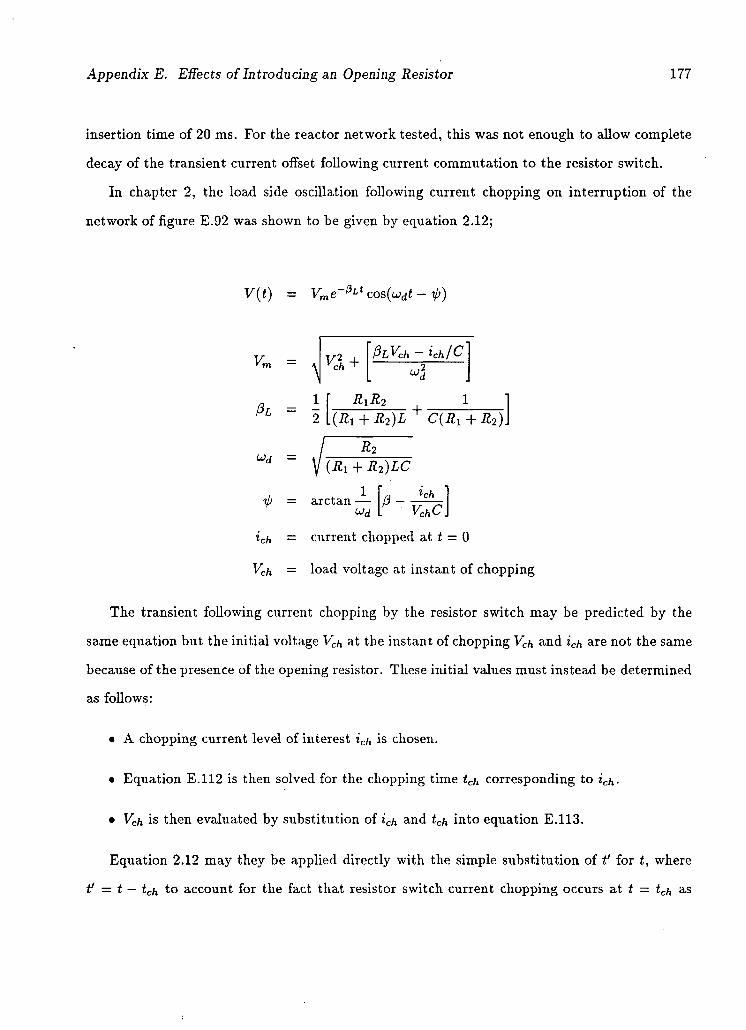
Appendix E. Effects of Introducing an Opening Resistor 177
insertion time of 20 ms. For the reactor network tested, this was not enough to allow complete
decay of the transient current offset following current commutation to the resistor switch.
In chapter 2, the load side oscillation following current chopping on interruption of the
network of figure E.92 was shown to be given by equation 2.12;
V(t) = Vme~^ x cos(udt - V>)
VM =
PL =
U)d =
PLVA - ich/C
RiR2 + (R1 + R2)L C(R! + R2)
R2 (Ri + R2)LC
ip = arctan ud
fi
lch VchC\
ich — current chopped at t = 0
Vch — load voltage at instant of chopping
The transient following current chopping by the resistor switch may be predicted by the
same equation but the initial voltage Vc/, at the instant of chopping Vch and ich are not the same
because of the presence of the opening resistor. These initial values must instead be determined
as follows:
• A chopping current level of interest icf, is chosen.
• Equation E.l 12 is then solved for the chopping time tch corresponding to ich-
• Vch is then evaluated by substitution of ich and tch into equation E.113.
Equation 2.12 may they be applied directly with the simple substitution of t' for t, where
t' = t — tch to account for the fact that resistor switch current chopping occurs at t = tch as
Appendix E. Effects of Introducing an Opening Resistor 178
opposed to t = 0 where main contacts separated. The presence of the opening resistor clearly
reduces the initial voltage condition Vch at current chopping. As will be demonstrated with
an example, this is due to phase shift between the system and reactor voltages caused by the
opening resistor.
By application of the above solutions to a specific network, the influence of the opening
resistor from main contact commutation through to load side oscillation on resistor switch
current chopping, may be studied. A computer program was written to calculate the above
solutions for the network and test parameters of figure E.92 to study the influence of an opening
resistor on switching transients and breaker TRV.
To allow valid comparison, a fixed chopping current current of 20 amps and main contact
commutation angle 4> of 90° were chosen and interruption transients calculated with opening
resistances of 2000, and 5000 £1 for contrast to interruption with no resistor. The results for
the 5000 resistor are shown in figure E.93. Current offset due to the exponential term in
equation E.112 is clearly visible. Phase shifting and reduction of reactor voltage relative to
source voltage, is also pronounced. The important intended effect is the successive reduction in
TRV and RRRV across the breaker contacts with increasing opening resistance as demonstrated
in figure E.94. It is clear from these results that in order to achieve significant TRV and RRRV
reduction, opening resistance must be reasonably large.
Note from figures E.93 and E.94, that even though the suppression peak voltage is reduced,
TRV at the suppression peak is actually larger with an opening resistor. This is because
reactor voltage just prior to chopping is phase advanced with respect to the source voltage.
The increased risk of suppression peak reignition is a small drawback when traded off against
the advantages of reduced current chopping overvoltages, RRRV and maximum TRV.
E.2 Reduced Chopping Levels Through Increased Stability
Another important effect of introducing an opening resistor may be demonstrated by considering
its effect on arc stability. Load and supply inductances are so large that to a small perturbing
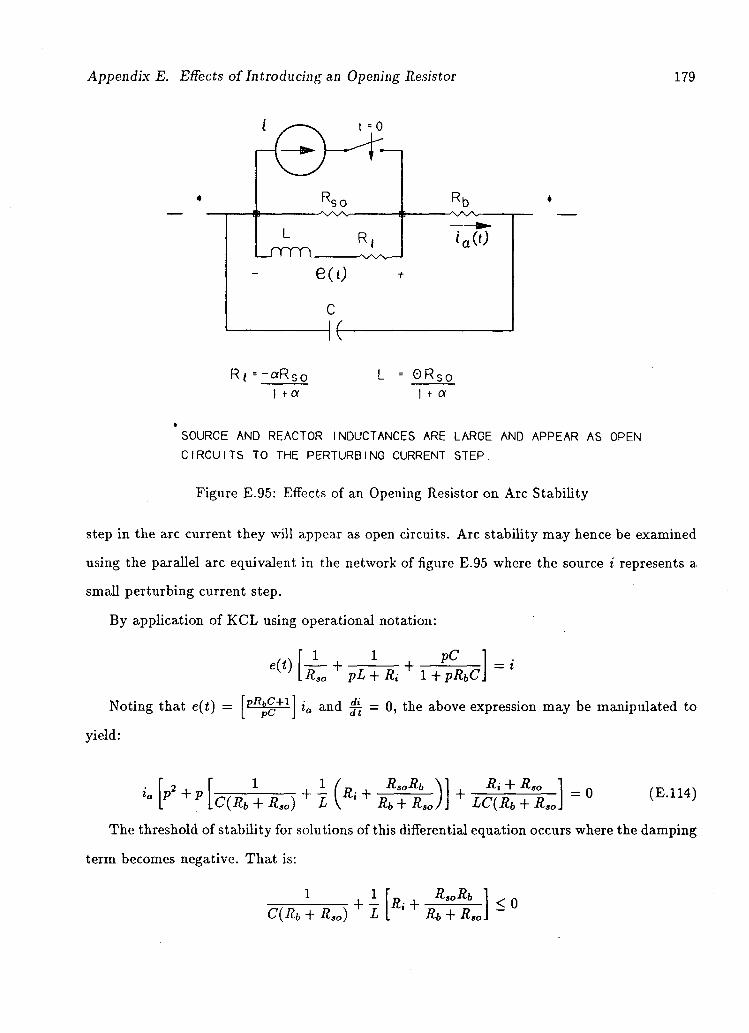
Appendix E. Effects of Introducing an Opening Resistor 179
t =0
R so
R, L / r m .
e(0 c
Rh
'a(0
R ( = - a R s o
t a 0 R so 1 t a
SOURCE AND REACTOR INDUCTANCES ARE LARGE AND APPEAR AS OPEN CIRCUITS TO THE PERTURBING CURRENT STEP.
Figure E.95: Effects of an Opening Resistor on Arc Stability
step in the arc current they will appear as open circuits. Arc stability may hence be examined
using the parallel arc equivalent in the network of figure E.95 where the source i represents a
small perturbing current step.
By application of KCL using operational notation:
Noting that e(t) =
yield:
e(t)
pftfcC+l
Pc
1 1 pC - i
R s o pL + Ri 1+pRbCl
ia and 7 = 0, the above expression may be manipulated to
P2 + P C(Rb
1 + I (R. + RsoRb \ + Rso) L \ Rb + Rso) +
Ri + Rs
LC(Rb + Rs
= 0 (E.114)
The threshold of stability for solutions of this differential equation occurs where the damping
term becomes negative. That is:
1 C(Rb + RSo) + L
Ri + RsoRb
Rb + Rs < 0
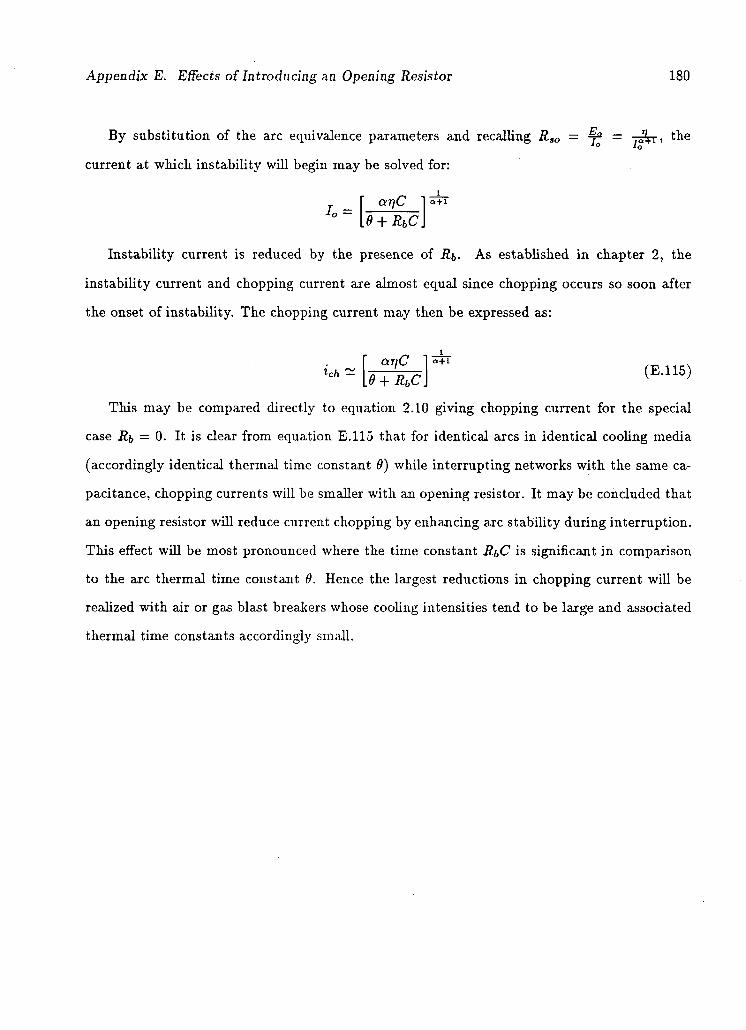
Appendix E. Effects of Introducing an Opening Resistor 180
By substitution of the arc equivalence parameters and recalling Rao = -f- = - T ^ T T , the
current at which instability will begin may be solved for:
anC i a + l
[9-rRbC\
Instability current is reduced by the presence of Rb- As established in chapter 2, the
instability current and chopping current are almost equal since chopping occurs so soon after
the onset of instability. The chopping current may then be expressed as:
arjC
This may be compared directly to equation 2.10 giving chopping current for the special
case Rb = 0. It is clear from equation E.115 that for identical arcs in identical cooling media
(accordingly identical thermal time constant 9) while interrupting networks with the same ca
pacitance, chopping currents will be smaller with an opening resistor. It may be concluded that
an opening resistor will reduce current chopping by enhancing arc stability during interruption.
This effect will be most pronounced where the time constant RbC is significant in comparison
to the arc thermal time constant 9. Hence the largest reductions in chopping current will be
realized with air or gas blast breakers whose cooling intensities tend to be large and associated
thermal time constants accordingly small.

Bibliography
[1] S. Berneryd et al (CIGRE WG 13.02), Interruption of Small Inductive Currents. Chapters
1,2,3, and 4. ELECTRA, No. 72, 1980.
[2] S. Berneryd, C.E. Solver, L. Ahlgren, R. Eriksson, Svjitching of Shunt Reactors - Com
parison Between Field and Laboratory Tests. CIGRE, International Conference on Large
High Voltage Electric Systems, 13-04, 1976.
[3] D. Braun, A. Ganz, P. Satyanarayana, Problems With Switching Overvoltages Solved by
the SFQ Self Extinguishing Circuit Breaker. Brown Boveri Review, No. 5, 1985.
[4] U. Burger, Lightning Arresters for Limiting Overvoltages on Disconnecting Shunt Reactors.
Brown Boveri Review, No. 4, 1975.
[5] CIGRE Working Group 33.02, Guide for Representation of Network Elements When Cal
culating Transients. CIGRE, 1987.
[6] G.Croteau, J.C. Bois-Clair, R. Jean Jean, Analysis of Reignition of Multiple Break Switch
Devices: Application to Shunt Reactor Current Interruption. IEEE Trans, PAS-103, pp
1377-1385, 1984.
[7] E. Eriksson, High Voltage Circuit Breakers. ASEA Power Division, Information Bulletin,
January 10, 1980.
[8] R. Eriksson, S. Berneryd and A. Ericsson, Laboratory and Field Tests With a 420 kV SFQ Puffer Breaker for a Gas Insulated Substation. IEE Conference on High Voltage Switchgear,
Publication 1982, pages 119-125, 1979.
[9] G.E. Gardner, and R.J. TJrwin, Arc Stability and Current Chopping in an Air Blast Inter
rupter. Proceedings IEE, Volume 124, No. 7, July 1977.
181
Bibliography 182
[10] G.E. Gardner and R.J. Irwin, Performance Testing of Multi-Unit Circuit Breakers Switch
ing Low Inductive Currents. Proc. IEE 125, pages 230-236, 1978.
[11] J.C. Henry, G. Perrissin, C. Rollier, The Behavior of SFQ Puffer Circuit Breakers Under
Exceptionally Severe Conditions. CIGRE, 13-08, 1978.
[12] W. Herman and K. Ragaller, Development Tests for Circuit Breakers. Brown Boveri Re
view, No. 4, 1979.
[13] H. Kavada, K. Goto, M. Hanamura, S. Yanabu, S. Nishiwaki, T. Ueda, Y. Murayama,
Switching Surge of Shunt Reactor Caused by SFQ Circuit Breaker Operation. IEEE, PES,
1987.
[14] A. Kobayashi, H. Ishizuka, S. Yanabu, K. TJehara, Interrupting Test of 275 kV Reactor
and its Evaluation in Three Kinds of Gas Blast Circuit Breakers. Toshiba Corporation,
IEEE, PES-1985.
[15] A.An. Komarov, V.S. Rashkes, N.V. Shinlin, EHV Shunt Reactor Inductive Currents
Switching Off. CIGRE, 13-08, 1978.
[16] J. Kopainsky and E. Ruoss, Interruption of Low Inductive and Capacitive Currents in High
Voltage Systems. Brown Boveri Review, No. 4, 1979.
[17] M. Murano, S. Yanabu, H. Ohashi, H. Ishizuka, and T. Okazaki, Current Chopping Phe
nomena of Medium Voltage Circuit Breakers. IEEE Trans., PAS-96, 1977.
[18] B.C. Papadias, N.D. Hatziagyriou, J.A. Bakopoulos, Switching of Reactor Loaded Trans
formers. Dept. of Electrical Engineering, National Technical University, Athens, Greece.
EMTP Review, 1988.
[19] D.F. Peelo, Report No. SP-158: Shunt Reactor Switching. B.C. Hydro Station Projects
Division, January 1985.
Bibliography 183
[20] D.F. Peelo, B.L. Avent, J.E. Drakos, B.C. Giudici, J.R. Irvine, Shunt Reactor Switching
Tests in B.C. Hydro's 500 kV System. IEE, Volume 135, Part C, No. 5, September 1988.
[21] J.G. Reckleff, A.K. McCabe, G. Mauthe, E. Rouss, Application of Metal Oxide Varistors
on an 800 kV Circuit Breaker Used for Shunt Reactor Switching. CIGRE, International
Conference on Large High Voltage Power Systems, 13-16, 1988.
[22] F.A.M. Rizk, Arc Instability and Time Constant in Air Blast Circuit Breakers. CIGRE,
No. 107, 1964.
[23] F.A.M. Rizk, Arc Responses to a Small Unit Step Current Pulse. ELTEKNIC, Volume 7, . Part 2, 1964.
[24] F.A.M. Rizk, Interruption of Small Inductive Currents With Air Blast Circuit Breakers.
Thesis, Goteborg, 1963.
[25] G.R. Slemon and A. Straughen, Electric Machines. Chapter 1, pages 20-26, Addison Wes
ley, October 1982.
[26] W. Van Den Heuvel and B. Papadias, Interaction Between Phases in Three Phase Reactor
Switching-Part 1: Grounded Reactors. ELECTRA, No. 91, 1983.
Related Documents