COMMON INDICATORS FOR MEASURING THE IMPACT OF EVENTS 1st Edition 2021 ASOIF ASSOCIATION OF SUMMER OLYMPIC INTERNATIONAL FEDERATIONS

Welcome message from author
This document is posted to help you gain knowledge. Please leave a comment to let me know what you think about it! Share it to your friends and learn new things together.
Transcript

COMMON INDICATORS FOR MEASURING THE IMPACT OF EVENTS
1st Edition 2021 ASOIF
ASSOCIATION OF SUMMER OLYMPICINTERNATIONAL FEDERATIONS


Contents
Foreword 04
Executive Summary 06
Chapter 1 – Introduction & Context 08
Chapter 2 – Impact Measurement Guidance & Framework Structure 14
Chapter 3 – Alignment with International Best Practice & UN SDGs 20
Chapter 4 – Practical Implementation of the Common Indicators 24
Chapter 5 – Economic Indicators 28
Chapter 6 – Image Indicators 42
Chapter 7 – Social Indicators 56
Chapter 8 – Sport Indicators 72
Chapter 9 – Environmental Indicators 80
Chapter 10 – Further Developments 92
Appendix – Summary tables of the recommended Common Indicators 94
03 A S O I F
MEASURING THE IMPACT OF EVENTS


ForewordThe Association of Summer Olympic International Federations (ASOIF) positions itself as a provider of added value to its members, the Summer Olympic International Federations (IFs), and for the Sport and Olympic Movement as a whole.
When the IFs pool their collective expertise and experience across many specialist areas they provide an unmatchable resource and one role of ASOIF is to facilitate access to this resource through our eight consultative and advisory groups. In the case of this report sincere thanks are due to the Commercial Advisory Group, chaired by Antony Scanlon, IGF Executive Director, supported by members Christian Volk, FIFA Director eFootball & Gaming, Frank Leenders, FIBA General Director (Media & Marketing), Michael Schmidt, WBSC Executive Director, Thierry Weil, FIH CEO and Thomas Lund, BWF Secretary General.
In 2017, ASOIF started a four-year partnership (2017-2020) with Sportcal, a sport market intelligence company based in UK, to provide an opportunity for ASOIF members to conduct an event impact evaluation as part of Sportcal’s Global Sports Impact (GSI) Studies Programme. As of February 2020, Sportcal had worked on projects with 16 ASOIF members and produced more than 20 reports since 2017. Through the GSI, we learn that there is a lack of strategic approach to IFs’ sporting event data collection and analysis.
We therefore commissioned Iain Edmondson to aggregate the perspectives of key players in the sporting event evaluation industry, including IFs, host cities and commercial entities. This report aims to establish a standard set of data points for event stakeholders to cost-effectively assess the value of events. We hope that this report could serve as a toolkit to demonstrate the return on investment of sporting events for stakeholders and to compare the value of elements of different sporting events.
ASOIF conducted three workshops respectively in July, September and October 2020 with more than 40 participants from IFs, city hosts, commercial entities and academic specialists. In May 2021, ASOIF signed a Memorandum of Understanding (MoU) with the International Association of Event Hosts (IAEH) to jointly endorse recommendations, guidance and tools to help their members implement the common event impact indicators. As a next step, both organisations will collaborate to obtain additional support from third-party organisations to enhance the tools available for sporting event impact evaluation. In addition, the CAG will continue working with Iain to discuss the potential follow-up steps in the future.
On behalf of ASOIF and its members I give special thanks to all the contributors of this report who freely gave their time and shared their experience and knowledge during the various workshops. Thanks also go to the project consultant, Iain Edmondson, for his work in delivering the project in close cooperation with the ASOIF staff who provided supporting research and helped to consolidate the mass of information that was collected in constructing this report.
Francesco Ricci Bitti President
05 A S O I F
MEASURING THE IMPACT OF EVENTS


Executive SummaryPartners investing in events are increasingly seeking to deliver on more than just financial objectives. This applies to both public authorities seeking to align events with policies which positively impact on the lives of local populations, and commercial sponsors seeking to deliver corporate social responsibility strategies.
The challenge has become how event owners and investing partners demonstrate the value of events against these wider objectives in a meaningful, and cost effective, way. Therefore, in order to address this challenge ASOIF commissioned work in March 2020 to consult with stakeholders involved in hosting events, and other industry specialists in research and evaluation, with the objective of establishing commonly agreed data points across all aspects of event impact.
This report is ASOIF’s first attempt to consolidate relevant and easily available data in a clear way to ensure consistency of data gathering and reporting between events, with the intent of helping the industry deliver, and demonstrate, true value to investors and policy makers. It is also being published at a time when it has never been more important for events to show their value, as communities start to recover from the Covid-19 pandemic.
This report is designed to educate event professionals and provide them with a practical tool for gathering relevant data and taking impactful decisions throughout the lifecycle of events. This includes a defined set of 30 “input”, 50 “output” and 10 “outcome” Key Performance Indicators from which rights owners and partners can gather data relevant to their own event objectives.
Using the Common Indicators and the guidance included in this report will benefit stakeholders involved in events of all sizes and characteristics because:
◥ Consistent data reporting can build trust amongst all stakeholders seeking to benefit from the staging of sports events, whether that be for tangible economic gain or less tangible benefits to society
◥ A wide range of industry representatives have shaped the guidance, from rights owners and event host organisations to research specialists and international institutions
◥ The indicators and guidance align with international best practice and intergovernmental work linked to the UN SDGs, and address the OECD recommendation to “set up rigorous criteria that enables comparison across different types of events in different geographic areas which should be set to monitor public expenditure and impact at all levels”1
◥ As more organisations use these Common Indicators, it will become easier to learn from past experience, become more cost effective to gather data and improve how events deliver, and report on, a return on investment for their investing partners
In May 2021, in a joint commitment to implementing the Common Indicators amongst both event host organisations and international rights owners, ASOIF signed a MoU with the IAEH to endorse the content of this report and support their members in implementing it.
The contributors to this report have also demonstrated an interest in building on this “first step” and details of possible further developments are included at the end of the report.
1 https://www.oecd.org/cfe/leed/global-events-recommendation.htm
07 A S O I F
MEASURING THE IMPACT OF EVENTS

Chapter
1

Introduction & ContextOver the past 30 years, there has been a huge rise in the number of sports events (particularly those sanctioned by International Federations of summer Olympic sports2). These events have host venues across the globe and have an increasing number of organisations investing money and resources to help deliver on their objectives.
With this growth of event hosting, it has become common practice for event owners and investing partners to produce evaluation reports to demonstrate how their events have provided a return on investment. With the exception of very large events, typically these evaluation reports have focused primarily on the economic impact from short term tourism expenditure.
However, partners investing in events are increasingly seeking to deliver on more than just financial objectives. This applies to both public authorities seeking to align events with policies which positively impact on the lives of local populations, and commercial sponsors using events to contribute towards corporate social responsibility strategies. As the following list relating to the Olympic Games demonstrates, the expected long-term benefits from events can be wide-reaching3;
◥ Organised sports development
◥ Social development through sport
◥ Human skills, networks and innovation
◥ Culture and creative development
◥ Urban development
◥ Environment enhancement
◥ Economic value and brand equity
2 Future of Global Sport, ASOIF 2019 (https://www.asoif.com/sites/default/files/download/future_of_global_sport.pdf) 3 IOC Legacy Strategic Approach, International Olympic Committee 2017 https://olympics.com/ioc/olympic-legacy
Figure 1: Relative importance of areas of impact in deciding to invest in events
Survey of members of International Association of Event Hosts
For events of all sizes, as Figure 1 shows, objectives are typically spread across areas related to economic, image, social and environmental impact.
The challenge has become how event owners and investing partners demonstrate the value of events against these wider objectives in a meaningful, and cost-effective, way. Measuring the impact of events against social and environmental objectives, in particular, is complex and has resulted in a general lack of useful data on which partners can make investment decisions.
Image/reputation
Other
SocialEconomic
Environmental
Economic
Image/ reputation
Social
Environmental
Other21%
10%
4%
35%
30%
09 A S O I F
MEASURING THE IMPACT OF EVENTS

Figure 2: Level of satisfaction of data available for each area of impact when investing in events
In order to address this challenge in March 2020 ASOIF commissioned work to consult with stakeholders involved in hosting events, and other industry specialists in research and evaluation, with the objective of establishing commonly agreed data points across all aspects of event impact.
In establishing the work, ASOIF recognised the challenge of ensuring any recommendations were implemented consistently across events. Therefore the recommendations would have to be inclusive and relevant to events of all sizes, host locations and ownership, whether or not they were sanctioned by the International Federations of summer Olympic sports.
Industry consultation and framework development
Between March 2020 and April 2021 ASOIF led a project consisting of the following key activities:
◥ Audit of existing research, data and guidance
◥ Consultation with rights-owners, event host organisations, commercial agencies, academics and other research providers
◥ Development of a framework and proposed set of key performance indicators (KPIs) alongside related work being carried out by other international institutions
◥ Testing and refining the framework with a pilot sample of rights-owners and event host organisations
Medium satisfaction (60%)
Low satisfaction (20% or below)
High satisfaction (80%)
XX
XX
XX
XX
Social
Environmental
Economic
Image/reputation
Survey of members of International Association of Event Hosts
MEASURING THE IMPACT OF EVENTS
10 A S O I F

Table 1: Organisations and individuals contributing to the development of the proposed framework and common Key Performance Indicators
Event Host Organisations Rights-Owners
Gothenburg & Co, Sweden BWF, Badminton World Federation
Sport Canada, Government of Canada Commonwealth Secretariat
Sports Events & Tourism Association, USA European Championships Management
Sports Metropolis Berlin, Germany FIBA, International Basketball Federation
Taiwan Ministry of Education FIH, International Hockey Federation
Thailand Convention & Exhibition Bureau IGF, International Golf Federation
Tourism & Events Queensland, Australia IOC, International Olympic Committee
UK Sport ITF, International Tennis Federation
Visit Düsseldorf, Germany World Athletics
Visit Stockholm, Sweden WBSC, World Baseball Softball Confederation
Wonderful Copenhagen, Denmark World Curling Federation
World Rugby
WT, World Taekwondo
Industry Suppliers Specialists
Burson Cohn & Wolfe Sport Prof Jean-Loup Chappelet, University of Lausanne
Deloitte Sport Business Group Dr Giovanni-Battista Derchi, AISTS Lausanne
Intelligent Research in Sponsoring Dr Chris Krekel, London School of Economics
Nielsen Sports Dr Erik Lundberg, University of Gothenburg
Portas Consulting Dr Egbert Oldenboom, Meerwaarde Open Onderzoek
Quantum Consultancy Dr Neil Ormerod, Leeds Beckett University
Rütter Soceco Dr Robert Pattersson, Mid Sweden University
SimetricaDr Girish Ramchandani and Richard Coleman, Sheffield Hallam University
The Sports Consultancy
Two Circles
YouGov Sport
11 A S O I F
MEASURING THE IMPACT OF EVENTS

In addition to one-on-one consultations, three workshops were jointly hosted digitally by ASOIF and the International Association of Event Hosts (IAEH). These workshops not only established feedback on the needs of industry decision makers, but also feedback on how data can and should be gathered to be useful and trusted when making decisions.
Below is a summary of the feedback from these workshops:
Establishing common indicators
◥ There was a consensus that establishing “consistent metrics” would be helpful
◥ Establishing metrics which demonstrate how events contribute to UN Sustainability Goals would also be helpful
◥ Simple processes and measures are easier to be adopted and understood
◥ Measures should recognise whole period of the event hosting cycle (i.e. before, during and after)
◥ Providing a “menu” of KPIs is helpful, particularly including social and environmental impacts where outcomes are more abstract
◥ Providing clear guidance for measuring the KPIs avoids bias and subjectivity
◥ International Federations or an independent body could provide “raw data” from past events which can then be applied to different hosts in future
◥ Host objectives differ between events but sharing data consistently will help rights-owners and hosts find “alignment” quicker
◥ The timing of the project is right, ready for the post-Covid “restart” of spectator events
Valuing intangible impacts
◥ It is becoming increasingly important to find an accepted method of valuing social impact, similar to how there is for economic impact
◥ The immediate building block for valuing social impact could be agreeing a “theory of change” for how events can lead to long-term outcomes
◥ There is value in providing qualitative case studies alongside quantitative data
◥ Sport events can learn lessons from public policy work valuing socio-economic benefits in other sectors
◥ Establishing trusted methodologies for attributing monetary value to “intangible impacts” requires ongoing transparency and challenge by peers
◥ Rights-owners of events should work alongside host organisations and international bodies to share data and create long-term research to help quantify “intangible impacts”
In order to address these issues, a framework was developed building on established basic principles of impact evaluation. The framework was designed to acknowledge all possible areas of impact and the activities carried out by event organisers and partners in contributing to these impacts. It was also designed to recognise the broadest definition of sustainability and, as much as possible, align with the work of other international organisations leading work on the measurement of impact of sport on sustainability objectives (further detail of which is contained in chapter 3).
A longlist of KPIs was then drawn up and mapped to all areas contained in the framework, based on the experience of the event rights-owners, event host organisations, academics, and commercial research and consulting providers.
MEASURING THE IMPACT OF EVENTS
12 A S O I F

Selection of recommended KPIs
There was a wide consensus amongst consultees that there should be a “core minimum” set of KPIs which could be applied to all events. Therefore the recommended shortlist should be simply defined and easily applied. In doing so, the recommendations would not focus on complex calculations of outcomes and long-term impacts but on basic data which event owners can make available as core data for such calculations.
However, in considering the selection of a “core minimum” set of KPIs there was also a recognition amongst consultees that not all events seek to address the same objectives, or actively address all the areas contained in the framework.
Therefore the recommended KPIs contained in this report were selected on the basis of:
◥ Common use within the industry
◥ Ease of understanding and data gathering
◥ Relevance to meaningful outcomes resulting from events
◥ A limited number covering all possible areas where events can make an impact (no more than two “input KPIs” and four “output KPIs” per area)
The framework and recommendations contained in this report make no attempt to attribute or prioritise the relative value of areas of impact. The actual or perceived value of any individual event should be based on the objectives of the event, and the difference the event has made to partner objectives.
As a result of this work this report now contains:
◥ clear explanation of the basic principles of impact evaluation
◥ explanation of a set of core KPIs across all aspects of event impact
◥ guidance for the practical application of the KPIs
13 A S O I F
MEASURING THE IMPACT OF EVENTS

Chapter
2

Impact Measurement Guidance & Framework StructureTo effectively communicate data related to the impact of events, event owners and partners should first have a basic understanding of the internationally recognised discipline of impact evaluation. As the OECD states “impact evaluation is an assessment of how the intervention being evaluated affects outcomes”4.
The International Association of Event Hosts (IAEH) has set out basic guidance for measuring the impact of events, including a glossary of terms used by industry experts, in its “Event Impact Standards”5. This guidance aligns with the “OECD Recommendation on Global Events and Local Development”, adopted by all 38 OECD member countries in 2018, which recognises the importance of measurement throughout all phases of an event, from pre-bidding, bidding and planning to delivery and beyond6.
This guidance acknowledges the challenge of putting in place cost-effective measurement and reporting in a timely manner. The following extract from the IAEH “Event Impact Standards” summarises this challenge and explains the use of inputs, outputs and outcomes:
“Major sporting and cultural events can have lasting impacts on communities that host them, and audiences watching them. To fully understand this impact can require detailed longitudinal research over a period extending long after the event has been held.
“In practice, this detailed analysis is too costly and time-consuming for most event hosts, rights-owners and other stakeholders. These hosts also need to understand, and communicate, the impact of events long before the full long-term impacts can be assessed. For example, host communities want to understand the value of an event while it is being held, as they do when a decision is being made to host the event long before it is held.
4 Outline of Principles of Impact Evaluation, OECD (http://www.oecd.org/dac/evaluation/dcdndep/37671602.pdf) 5 https://www.eventhosts.org/resources/event-impact-standards/ 6 https://www.oecd.org/cfe/leed/global-events-recommendation.htm
15 A S O I F
MEASURING THE IMPACT OF EVENTS

Figure 3: Figure 3: Timeline of event hosting
OUTCOMESINPUTS
Short-term impacts Long-term impactsForecasted impacts
Event held Post-eventHosting decision
“Therefore, as well as the forecasted or actual outcomes, both in the short and long term, impacts are often expressed in terms of inputs, the projects and resources put in place to deliver outputs at the event.”
Therefore, the framework developed for this report focuses on all the main inputs that events can contribute across the broad list of objectives highlighted in chapter 1.
Figure 4 shows typical desired long-term outcomes identified against each of the dimensions of impact – economic, image, social, sport and environmental, and lists 22 “input areas” for which KPIs have been identified. Neither the outcomes nor the input areas are intended to be exhaustive and many overlap, but the framework is designed to provide a relatively simple and clear structure from which meaningful KPIs could be created.
MEASURING THE IMPACT OF EVENTS
16 A S O I F

The KPIs developed for each of the dimensions and input areas recognised the three minimum guiding principles for impact measurement contained within the IAEH “Event Impact Standards”:
a. Objective-driven – the impacts of events are most effectively expressed in relation to the objectives of the organisations involved in hosting the event. For example, host organisations may support the staging of an event for health benefits to a specific segment of the population, such as inactive residents, or tourism benefits from specific target markets. Therefore, research should be tailored to understand the impacts on relevant audiences and the resulting benefits expressed in the context of these strategic aims.
b. Net additional benefit – benefits should only be reported where they are attributable to an event, and they should also take account of any negative impacts, whether economic, social or environmental. For example, not all expenditure by event spectators in a host economy can be regarded as ‘economic benefit’ when the expenditure from local spectators is not ‘new money’ for the economy. Or the positive social benefits from new infrastructure may come at a cost to some communities relocated or disrupted by the construction.
c. Evidence-based – calculations of impact should be based on robustly gathered input data. For forecasted calculations data should be referenced to demonstrate why it is applicable. Where primary research is used for actual calculations, random sampling or convenience sampling should be representative of target audiences and the quantity of surveys sufficient to be statistically significant. Where forecasts are made to justify the business case for future events, comparable post-event research should also be carried out to review the actual outcomes from the event.
Figure 4: Framework for Common Event Impact Measurement
Social Local citizenship
Volunteers Community Engagement
Activation Diversity & Inclusion
Outreach Skill Development
Economic Immediate tourism & trade
Image
Sport Sport Development Sport Participation
Future tourism & trade
Health & well-being
Spectators Organiser Expenditure
Participants Infrastructure
Spectators Organiser Expenditure
Social Media Event Experience
OUTCOMESINPUTS
Environmental Global citizenship
Promotion Energy
Transport Procurement
Waste Landscape & Biodiversity
17 A S O I F
MEASURING THE IMPACT OF EVENTS

Figure 5: Economic KPIs
Figure 6: Image KPIs
Economic impact from tourism & event expenditure
Infrastructure development
Direct economic impact, including:
• Total additional visitor expenditure
• Net organiser expenditure
GDP impact on host economy from hosting the event
Value of trade deals attributed to hosting the event
No. of event venues
No. of nations participating
No. of athletes participating
Total budgeted event expenditure
Proportion of event budget funded by the public sector
Total planned investment in infrastructure for long-term use
No. of visiting attendees who aren't athletes or spectators
Total bed nights by visiting “attendees”
Value of contracts to local suppliers
Proportion of event costs funded by commercial revenue
Money invested in venues & equipment for long-term use
Money invested in transport for long-term use
No. of event days No. of unique spectators from outside host economy
Average length of stay in the host economy
Total bed nights in paid accommo-dation by visiting spectators
ECONOMIC
Spectators
Organiser Expenditure
Participants
Infrastructure
OBJECTIVE INPUT KPI OUTPUT KPI SDGINPUT AREA
OUTCOME KPI/ CALCULATION
Economic
Enhance image of host destination
Grow customer base
Increase brand awareness
Increase in partner brand value
Value of new visitors as a result of the event
No. of international broadcast territories
No. of social media followers of the event/event owner (by channel)
No. of social media followers of event athletes (by channel)
Plan in place to promote the event to targeted audiences
Advertising Value Equivalent of media coverage
No. of impressions of event-related content (by channel)
No. of event-related posts (by channel)
Net Promoter Score of spectators
% likelihood to revisit (spectators)
% likelihood to visit (viewers)
No. of engagements of event-related content (by channel)
No. of accredited media reps attending the event
No. of new contacts due to the event
No. of event-related articles (by market)
% of articles with gendered content dedicated to females
No. of unique website users
% of attendees satisfied
Total TV household reach Digital broadcast views (by session)
% of broadcast hours with gendered content dedicated to females
% share of TV viewing audience (by market)
IMAGE
Broadcast
Press
Social Media
Event Experience
OBJECTIVE INPUT KPI OUTPUT KPI SDGINPUT AREA
OUTCOME KPI/ CALCULATION
Figures 5 to 9 show the KPIs which are explained in more detail in chapters 5 to 9, and also relevant links to the UN Sustainable Development Goals (see chapter 3).
MEASURING THE IMPACT OF EVENTS
18 A S O I F

Figure 7: Social KPIs
Figure 8: Sport KPIs
Economic
Positively benefit people’s well-being
Positively impact communities
Perceived benefit to local residents, expressed in financial terms
% change in community outcomes, e.g. reduction in crime rates during event
Planned no. of volunteers
Planned no. of attendees at free activity related to the event
Equal opportunity policy in place
Targeted skills development plan in place
Gender athlete pay ratio Male/Female
Public commitment to meeting international labour rights standards
Planned no. of participants in programmes
Local community groups benefiting from outreach activity
No. of volunteers from target segments of local population
Average no. of hours volunteering per person
No. of attendees from target segments of local population
No. of people trained in new skills
No. of people from target segments trained in new skills
Average no. of hours attending per person
No. of participants from target segments of local population
Average no. of hours participating per person
% participants from minority communities
Targeted local community engagement plan in place
No. of local residents viewed or followed the event
% of local residents proud
% local attendees more happy as a result of the event
SOCIAL
Community Engagement
Volunteers
Activation
Diversity & Inclusion
Outreach
Skills
% participants female
% participants disabled
OBJECTIVE INPUT KPI OUTPUT KPI SDGINPUT AREA
OUTCOME KPI/ CALCULATION
No. of new participants in physical activity as a result of the event
Quantified value of health benefits from new participation
Plan in place to promote sport & physical activity to targeted audiences
Plan in place to increase capacity of local sport organisations
Money invested in organisations delivering grassroots programmes
Money invested in sport & recreation space for long-term use
% residents inspired to do more sport/physical activity
SPORT
SportDevelopment
Sport Participation
OBJECTIVE INPUT KPI OUTPUT KPI SDGINPUT AREA
OUTCOME KPI/ CALCULATION
Figure 9: Environmental KPIs
Economic
Increase environmental awareness
Minimise negative impacts
Net event carbon footprint, inc:
-energy from renewable sources
-carbon offset
Measurement of carbon footprint in place
Strategy to encourage workforce, attendees and spectators to use sustainable transport
Sustainable Procurement Code in place for all products and services
Local environmental initiatives in place
Waste management plan in place
Renewable energy plan in place
% of spectators using public or sustainable transport
% of event waste diverted from landfill
% of energy used from renewable sources
% of contracts awarded that comply with sustainability standards
% of event food & drink ethically sourced
No. of initiatives delivered addressing local environments and biodiversity
Public commitment to environmental policies
ISO20121 accreditation
% of spectators reporting a positive change in behaviour
ENVIRONMENTAL
Environmental Promotion
Transport
Waste
Procurement
Energy
Landscape & Biodiversity
OBJECTIVE INPUT KPIINPUT AREA OUTPUT KPI SDG OUTCOME KPI/
CALCULATION
19A S O I F

Chapter
3

Alignment with International Best Practice & UN Sustainable Development GoalsWhilst the topic of sustainability has long been a focus for sport and sport events, in recent years the topic has become an increasing priority amongst international populations, and therefore political leaders.
Sustainability is defined as meeting the needs of the present without compromising the ability of future generations to meet their needs, recognising that we do not just consume natural resources but also social and economic resources.
In 2015 all United Nations Member States adopted the “2030 Agenda for Sustainable Development”7, which provides a shared blueprint for peace and prosperity for people and the planet, now and into the future. At its heart are the 17 Sustainable Development Goals8 (SDGs) which, building on decades of work, are an urgent call for action by all countries, both developed and developing, in a global partnership. They recognise that ending poverty and other deprivations go hand-in-hand with strategies that improve health and education, reduce inequality, and spur economic growth, whilst also tackling climate change and working to preserve our oceans and forests.
7 https://sdgs.un.org/2030agenda 8 https://sdgs.un.org/goals
21 A S O I F
MEASURING THE IMPACT OF EVENTS

The 17 SDGs are listed below and recognised by their pictograms shown in Figure 10:
◥ SDG 1: End poverty in all its forms everywhere
◥ SDG 2: End hunger, achieve food security and improved nutrition, and promote sustainable agriculture
◥ SDG 3: Ensure healthy lives and promote well-being for all at all ages
◥ SDG 4: Ensure inclusive and equitable quality education and promote lifelong learning opportunities for all
◥ SDG 5: Achieve gender equality and empower all women and girls
◥ SDG 6: Ensure availability and sustainable management of water and sanitation for all
◥ SDG 7: Ensure access to affordable, reliable, sustainable and modern energy for all
◥ SDG 8: Promote sustained, inclusive and sustainable economic growth, full and productive employment and decent work for all
◥ SDG 9: Build resilient infrastructure, promote inclusive and sustainable industrialization, and foster innovation
◥ SDG 10: Reduce income inequality within and among countries
◥ SDG 11: Make cities and human settlements inclusive, safe, resilient, and sustainable
◥ SDG 12: Ensure sustainable consumption and production patterns
◥ SDG 13: Take urgent action to combat climate change and its impacts by regulating emissions and promoting developments in renewable energy
The IOC have made sustainability a key element of its Agenda 2020+5 and in 2017 published its Sustainability Strategy aligning with the 2030 Agenda for Sustainable Development and the SDGs. In this strategy the IOC recognises its influence not only over its own organisation and Olympic Games, but also stakeholders involved in the Olympic Movement, including the International Federations of sport and the National Olympic Committees. In support of this the IOC have published a series of guides9 to help organisations understand the practical steps to deliver sustainability objectives.
Figure 10: UN Sustainable Development Goals
9 https://olympics.com/ioc/sustainability/essentials
◥ SDG 14: Conserve and sustainably use the oceans, seas and marine resources for sustainable development
◥ SDG 15: Protect, restore and promote sustainable use of terrestrial ecosystems, sustainably manage forests, combat desertification, and halt and reverse land degradation and halt biodiversity loss
◥ SDG 16: Promote peaceful and inclusive societies for sustainable development, provide access to justice for all and build effective, accountable and inclusive institutions at all levels
◥ SDG 17: Strengthen the means of implementation and revitalize the global partnership for sustainable development
MEASURING THE IMPACT OF EVENTS
22 A S O I F

10 https://www.oecd.org/cfe/leed/Implementing-the-OECD-Recommendation-on-Global-Events-Toolkit.pdf 11 https://en.unesco.org/mineps6/kazan-action-plan 12 https://thecommonwealth.org/measuring-contribution-sport-sustainable-development-goals 13 https://thecommonwealth.org/sites/default/files/inline/SDGs%20Toolkit%20version%204.0_0.pdf
Cross-references
The OECD’s Global Events Toolkit10 recommends a comprehensive approach to evaluation including evaluating events against the UN SDGs. Each SDG has individual targets and indicators which recognise specific priorities and milestones to achieve. These specific SDG targets are more relevant for demonstrating the significance of events in contributing towards global priorities, rather than the overarching SDG objective listed above. Therefore, the specific targets to which the recommended KPIs are linked are included in chapters 5 to 9.
In response to the UNESCO Kazan Action Plan11
following the Sixth International Conference of Ministers and Senior Officials Responsible for Physical Education and Sport (known as MINEPS VI), the Commonwealth Secretariat published a set of Indicators and Toolkit in 2020 for the measurement of the contribution of Sport to the SDGs12. This publication addressed the specific objective of the Action Plan to “develop common indicators for measuring the contribution of physical education, physical activity and sport to prioritized SDGs and targets” and includes indicators for sport as a whole rather than just sport events.
Where the KPIs included in this report directly correlate to those in the “Sport & SDG Indicator Toolkit”13 the reference has been included in the description contained in chapters 5 to 9.
23 A S O I F
MEASURING THE IMPACT OF EVENTS

Chapter
4

Practical Implementation of the Common IndicatorsAs the framework in chapter 2 shows, there are three types of KPIs described in this report, each relevant for different stages of the timeline of hosting an event:
◥ Input KPIs which can be measured at the initial planning phase of an event, and help inform the potential impact of the event depending on the activities put in place in the lead-up to, during, and potentially after the event
◥ Output KPIs which are measures of relevant actual activities linked to the event which need to be gathered, and often publicly shared, during or immediately after the event
◥ Outcome KPIs which are more complex calculations of tangible outcomes resulting from the event, usually involving external research and taking into account all the necessary external factors over time
Outcome KPIs are the most meaningful assessments of impact but, due to the cost, complexity and time required, many event owners or investing partners do not produce these calculations. Also, these KPIs are open to conscious or unconscious bias in data gathering therefore the OECD recommends third-party verification of findings to ensure transparency and independence.
Therefore, this report does not attempt to explain the calculation of the recommended Outcome KPIs in full detail, but are included to help event professionals understand how they should be used.
The Input KPIs and Output KPIs contained in this report are less complex to gather and guidance has been included for each KPI including how data is gathered, for example using a specific question and answer structure where surveys are required, and a graphical indication of when the data should be collected. Each recommended KPI has been given a code reference to make it easy for event professionals and research organisations to state the exact meaning of any reported data which aligns with the Common Event Impact Measurement Framework.
The Input and Output KPIs can also be used to contribute to Outcome calculations based on the application of a “theory of change”. Research specialists use “theory of change” to demonstrate how an activity contributes to an outcome, recognising other factors involved in attributing an input to an outcome. A brief explanation of the relevant theory of change has been included in the introduction to each area, and much more detail is included in the Sport & SDG Indicator Toolkit14.
14 https://thecommonwealth.org/sites/default/files/inline/SDGs%20Toolkit%20version%204.0_0.pdf
25 A S O I F
MEASURING THE IMPACT OF EVENTS

Figure 11: Application of recommended KPIs in the event timeline Timeline of event hosting
INPUT KPIs Put objectives & research in place
OUTPUT KPIs Report to public &
partners consistently
OUTCOME KPIs Transparent long-term
impact evaluation
OUTCOMESINPUTS
Short-term impacts Long-term impactsForecasted impacts
Event held Post-eventHosting decision
Process for selecting relevant KPIs
The purpose of this report is not to recommend that every event measures all KPIs. As the first guiding principle of the IAEH Event Impact Standards states, measurement should be objective-driven.
The following steps are recommended for gathering and reporting the common KPIs:
1. State event objectives relevant to all stakeholders to which you expect to report, whether public or private, and whether they are formally contracted or not
2. Identify target markets and segments of the local population for whom the event is intended to make an impact so data gathering can be tailored to address these targets, recognising priorities which might be relevant if it is too costly to gather all the data desired
3. Select relevant KPIs from the recommended KPIs, excluding areas which are not relevant to the event, but including KPIs which might be useful as baseline measures for future events and any other measures that might be relevant to your specific event
4. Use data to drive decisions and actions by using the selected KPIs to commission data gathering data before, during and after the event rather than just collecting Output KPI data during the event when it is too late to influence successful outcomes
5. Share key data to demonstrate aggregated impact and support future research thereby sharing lessons and providing opportunities for continuous improvement, without having to share any commercially sensitive data
In addition to explanations of each individual KPI, chapters 5 to 9 include some insights from events held over recent years, both quantitative data and qualitative case studies. These insights were drawn from a sample of 45 events of different sizes and characteristics, whether owned by International Federations, IF-sanctioned events, private leagues or local annual events.
MEASURING THE IMPACT OF EVENTS
26 A S O I F

Table 2: Recent events used to provide insights
2015 FIFA Women's World Cup, Canada
2018 Berlin Marathon 2019 Taipei Open, BWF Super 300
2015 World Canoe Slalom Championships
2018 Volvo Ocean Race, Gothenburg 2019 WBSC Premier12, Taichung City
2015 IPC World Swimming Championships
2019 UEFA Champions League Final 2019 Gold Coast Marathon
2015 EuroHockey Championships 2019 World Taekwondo Championships 2019 Die Finals, German Championships
2016 EHF Women's European Handball Championships
2019 BWF World Championships 2019 Sweden Horse Show
2016 European Aquatics Championships 2019 BWF Sudirman Cup 2019 Global Champions Tour, Stockholm
2016 World Triathlon Series, Leeds 2019 BWF World Tour Finals 2019 Stockholm Open, ATP Tennis
2017 World Athletics Championships 2019 World Athletics Relays 2019 Stockholm Marathon
2017 FEI Equestrian European Championships
2019 FIH Hockey Pro League 2019 Stockholm Swim Open
2018 World Athletics Indoor Championships
2019 World Men’s Curling Championships
2019 Gothenburg Horse Show
2018 World Half Marathon Championships
2019 Men's Softball World Championships
2019 Göteborgsvarvet half marathon
2018 World Athletics U20 Championships
2019 U18 Baseball World Cup 2019 Gothia Cup, football
2018 Women's Hockey World Cup 2019 WBSC Premier12 2019 Partille Cup, handball
2018 Men's Hockey World Cup 2019 UCI Track World Cup, Brisbane 2020 Tour De Taiwan
2018 European Athletics Championships 2019 Cairns IRONMAN 2020 Taipei Marathon
27 A S O I F
MEASURING THE IMPACT OF EVENTS

Chapter
5

Economic IndicatorsThe ‘economic impact’ of a major event refers to the total amount of additional money injected into a defined area, as a consequence of staging the event. Economic Impact studies seek to establish the net change in a host economy – in other words, money inflows and outflows within a defined geographical area measured to establish the resulting net outcome.
This chapter comprises four input areas – Spectators, Participants, Organiser Expenditure and Infrastructure – with input and output KPIs under each area.
The specific KPIs in this chapter are linked to UN SDGs 8, 11 and 17.
Economic KPIs
Economic impact from tourism & event expenditure
Infrastructure development
Direct economic impact, including:
• Total additional visitor expenditure
• Net organiser expenditure
GDP impact on host economy from hosting the event
Value of trade deals attributed to hosting the event
No. of event venues
No. of nations participating
No. of athletes participating
Total budgeted event expenditure
Proportion of event budget funded by the public sector
Total planned investment in infrastructure for long-term use
No. of visiting attendees who aren't athletes or spectators
Total bed nights by visiting “attendees”
Value of contracts to local suppliers
Proportion of event costs funded by commercial revenue
Money invested in venues & equipment for long-term use
Money invested in transport for long-term use
No. of event days No. of unique spectators from outside host economy
Average length of stay in the host economy
Total bed nights in paid accommo-dation by visiting spectators
ECONOMIC
Spectators
Organiser Expenditure
Participants
Infrastructure
OBJECTIVE INPUT KPI OUTPUT KPI SDGINPUT AREA
OUTCOME KPI/ CALCULATION
◥ SDG 8 - Promote sustained, inclusive and sustainable economic growth, full and productive employment and decent work for all
◥ SDG 11 - Make cities and human settlements inclusive, safe, resilient and sustainable
◥ SDG 17 - Strengthen the means of implementation and revitalize the global partnership for sustainable development
29 A S O I F
MEASURING THE IMPACT OF EVENTS

Reference KPI name Unit Sport for SDG reference
Input/Output/Outcome
EC-OUTCOME1 Direct economic impact, made up of: Currency
NA OutcomeEC-OUTCOME1a Total additional visiting spectator expenditure Currency
EC-OUTCOME1b Total additional visiting “attendee” expenditure Currency
EC-OUTCOME1c Net organiser expenditure Currency
Explanation
The ‘direct economic impact’ of an event refers to the total amount of additional expenditure generated within a defined area, as a direct consequence of staging the event.
Total additional visitor expenditure is a calculation of expenditure attributable to the event from both spectators and other attendees, such as athletes, organisers, officials and media. Calculations are based on survey data considering visitors from outside the host economy and discounting ‘deadweight’ e.g. casual visitors attending for other reasons. Examples of type of expenditure include money spent on accommodation, food and drink, retail, local attractions and local transport.
The net organiser expenditure refers to the additional spending in preparation for the event excluding any money invested from within the host economy.
(Ref: eventimpacts.com15)
ImportantSpecialist calculation
Calculations of economic benefit are typically carried out by external specialists using established industry-recognised methodologies.
The ‘Additionality’ of the expenditure resulting from the event is calculated by subtracting factors such as ‘deadweight’ (economic activity that would have occurred regardless of an event being held in the host economy), ‘displacement’ (the volume of normal activity displaced by an event) and ‘leakages’ (event-related activity that results in money being expatriated from the defined host economy) from the gross new expenditure.
(Ref: IAEH, Event Impact Standards16)
Data gathering – Timing Timeline of event hosting
OUTCOMESINPUTS
Short-term impacts Long-term impactsForecasted impacts
Event held Post-eventHosting decision
Economic Outcome KPIs
15 https://www.eventimpacts.com 16 https://www.eventhosts.org/resources/event-impact-standards/economic-impacts-2/
MEASURING THE IMPACT OF EVENTS
30 A S O I F

Explanation
The calculation of Gross Domestic Product (GDP) impact is a function of Direct Economic Impact that can be estimated applying relevant multipliers and input-output tables. In some countries it is commonplace to calculate Gross Value Added (GVA) rather than GDP.
Multipliers are numeric factors used to assess the knock-on impacts of the first round of visitor and organisational spending in the host economy. See Event Impact Standards for further details.
Input-output tables are a means of presenting a detailed numerical analysis of the process of production and the use of goods and services and the income generated in that production. Tables are specific to industry sectors and hosts economies and usually provided by national statistical agencies.
Events can also be used as a platform for strengthening the local economy from cross-boundary trade. The value of trade deals attributed to hosting the event can be used to determine the value added to the host economy, based on an assessment of the proportion of influence the event had in securing the deals.
(Ref: IAEH/Event Impact Standards17)
Reference KPI name Unit Sport for SDG reference
Input/Output/Outcome
EC-OUTCOME2 GDP impact of hosting an event Currency S8.13 Outcome
EC-OUTCOME3Value of trade deals attributed to hosting the event
Currency S8.14 Outcome
Contributing towards:
◥ SDG TARGET 8.1 - Sustain per capita economicgrowth in accordance with national circumstances
◥ SDG TARGET 8.3 - Promote development-orientedpolicies that support productive activities, decent jobcreation, entrepreneurship, creativity and innovation,and encourage the formalization and growth ofmicro-, small- and medium-sized enterprises
◥ SDG INDICATOR 8.3.1 - Proportion of informalemployment in non-agriculture employment, by sex
◥ SDG TARGET 17.17 - Encourage and promoteeffective public, public-private and civil societypartnerships, building on the experience andresourcing strategies of partnerships
◥ SDG INDICATOR 17.1.1 - Amount of UnitedStates dollars committed to public-private andcivil society partnerships
ImportantData gathering
Economic Impact studies seek to establish the net change in a host economy – in other words, cash inflows and outflows are measured to establish the net outcome (Ref: eventimpacts.com). Some economists prefer to use calculations of Cost Benefit Analysis as the basis for investment rather than GDP impact.
Host economy17 is the geographical area under consideration for economic impact assessment. The boundary of the host economy will usually be determined by the organisation responsible for commissioning the research. It can be a country, region, city or even a district.
17 https://www.eventhosts.org/resources/event-impact-standards/economic-impacts-2/
31A S O I F
MEASURING THE IMPACT OF EVENTS

Data gathering – Timing Timeline of event hosting
Introduction and “theory of change”
The calculation of spectators and their expenditure broken down by geographic origin is a significant factor in assessing economic impact, calculated for different boundaries of ‘host economy’, for example a city, region or country.
Explanation
Number of days counting the total calendar duration of the event, including gap days (days with no event activity).
Number of event venues excluding other required facilities (such as training and administration facilities). Many events will only have one venue, but understanding when multiple venues are used helps with gathering data for other input areas.
Reference KPI name Unit Sport for SDG reference
Input/Output/Outcome
EC-S1.1 No. of event days Days NA Input
EC-S1.2 No. of event venues Venues NA Input
Spectators
OUTCOMESINPUTS
Short-term impacts Long-term impactsForecasted impacts
Event held Post-eventHosting decision
Contributing towards:
◥ SDG TARGET 8.9 - By 2030, devise and implement policies to promote sustainable tourism that creates jobs and promotes local culture and products
MEASURING THE IMPACT OF EVENTS
32 A S O I F

Reference KPI name Unit Sport for SDG reference
Input/Output/Outcome
EC-S2.1No. of unique spectators from outside host economy
People NA Output
- No. of unique spectators People NA Output
- Total attendance Visits NA Output
Data gathering – Timing
Timeline of event hosting
Explanation
Total attendance is the total number of event participants and spectators (cumulative across all days and/or sessions of the event) whether that be in-venue or free side-events.
The number of unique spectators is the number of individuals (‘locals’ and visitors) spectating at an event, deduplicating repeat spectators from the overall total attendance figure. This calculation is typically based on sample data taken from event surveys.
Unique spectators from outside the host economy are referred to as “visiting spectators”. This calculation is fundamental for economic impact assessment and is based on survey data using a standard question (discounting “casual” visitors in the area for other reasons and whose primary reason for visiting is not for attending the event).
Understanding audience profile data can also influence other elements of impact evaluation, such as the extent of participation by specific target groups. Researchers typically gather population data by sex, age, social grade, disability, ethnicity, educational attainment, employment status, among others.
(Ref: IAEH/Event Impact Standards18)
For multi-day events, the number of unique spectators is typically 30-60% of total attendance
ImportantData gathering
Calculating attendance for ticketed events can be relatively easy using ticket data. However, for multi-day or multi-session events a calculation needs to be made to take account of repeat spectators over the period of the event. Allowances may also need to be made for the variance between tickets sold and actual attendance at the venue.
Calculating attendance for free non-ticketed events is much harder to produce accurate data, and at risk of producing exaggerated estimates leading to exaggerated estimates of benefit. See links to guidance on estimating crowd size at non-ticketed events at Event Impact Standards.
Host economy19 is the geographical area under consideration for economic impact assessment. The boundary of the host economy will usually be determined by the organisation responsible for commissioning the research. It can be a country, region, city or even a district.
OUTCOMESINPUTS
Short-term impacts Long-term impactsForecasted impacts
Event held Post-eventHosting decision
18 https://www.eventhosts.org/resources/event-impact-standards/audience-measurement-2/#ta 19 https://www.eventimpacts.com/impact-types/attendance/content/calculating-attendance-numbers
33A S O I F
MEASURING THE IMPACT OF EVENTS

ImportantData gathering
Difference between room nights and bed nights: some event impact studies consider the number of room nights in commercial accommodation (such as hotels) used by event-related guests (spectators or attendees). An allowance for the average number of occupied beds per room would need to be made to translate bed nights to room nights.
(Ref: IAEH/Event Impact Standards20)
Reference KPI name Unit Sport for SDG reference
Input/Output/Outcome/Impact
EC-S2.2 Average length of stay in the host economy Days NA Output
EC-S2.3Total bed nights in paid accommodation by visiting spectators
Nights S8.9a Output
-No. of visiting spectators staying in paid accommodation
People NA Output
Explanation
The average number of days spent in the host economy is a calculation based on survey data of the number of days unique visiting spectators spent in the host economy.
Proportion of visiting spectators staying in paid accommodation is typically not more than 60% of totalspectators is typically 30-60% of total attendance
Total bed nights by visiting spectators is a calculation based on survey data of those unique visiting spectators staying in paid accommodation aggregated across the period of the event. This excludes nights spent by visitors staying with friends and family, for example.
Average length of stay of a visiting spectator is typically 2-4 days
Data gathering – Timing Timeline of event hosting
OUTCOMESINPUTS
Short-term impacts Long-term impactsForecasted impacts
Event held Post-eventHosting decision
20 http://www.eventhosts.org/resources/event-impact-standards/economic-impacts-2/#room
MEASURING THE IMPACT OF EVENTS
34 A S O I F


Explanation
The planned (predicted) number of nations participating in the event.
The planned number of athletes participating in the event ideally split between gender, age-group, ability/disability and ethnicity (defined in a way which is specific to the local market).
Introduction and “theory of change”
Participants are all of those who attend the event for purposes other than spectating. These can be athletes/performers, staff/contractors, coaches/officials, VIPs (such as board members, stakeholder guests and sponsors), and accredited media.
Attendance does not necessarily mean the numbers of spectators or audience alone. Categorising attendees in this way can help when measuring other impacts that assess the behaviour of different groups at the event. (Ref: eventimpacts.com21)
The following set of KPIs is relevant to assessing the economic impact brought by event participants.
Contributing towards:
◥ SDG TARGET 8.9 - By 2030, devise and implement policies to promote sustainable tourism that creates jobs and promotes local culture and products
Reference KPI name Unit Sport for SDG reference
Input/Output/Outcome
EC-P1.1 Planned no. of nations participating Nations NA Input
EC-P1.2 Planned no. of athletes participating People NA Input
Participants
Data gathering – Timing Timeline of event hosting
OUTCOMESINPUTS
Short-term impacts Long-term impactsForecasted impacts
Event held Post-eventHosting decision
21 https://www.eventimpacts.com
MEASURING THE IMPACT OF EVENTS
36 A S O I F

ImportantData gathering
Difference between room nights and bed nights: some event impact studies consider the number of room nights in commercial accommodation (such as hotels) used by event-related guests (spectators or attendees). An allowance for the average number of occupied beds per room would need to be made to translate bed nights to room nights.
(Ref: IAEH/Event Impact Standards22)
Reference KPI name Unit Sport for SDG reference
Input/Output/Outcome/Impact
EC-P2.1No. of visiting attendees who are not athletes or spectators
People NA Output
EC-P2.2
Total bed nights by visiting “attendees”
• not paid by organiser
• paid by event organiser
Nights S8.9b Output
Explanation
Number of other attendees who are not athletes or spectators, split between staff/contractors, coaches/officials, VIPs such as board members, stakeholder guests and sponsors, and accredited media (for example based on accreditation data), excluding those based in the host economy.
Total bed nights by visiting “attendees” (excluding spectators) is a calculation based on organiser or survey data.
Typically accommodation paid for by the event organiser is reported separately to avoid double-counting alongside other Organiser Expenditure (see next section).
Data gathering – Timing
Timeline of event hosting
OUTCOMESINPUTS
Short-term impacts Long-term impactsForecasted impacts
Event held Post-eventHosting decision
22 http://www.eventhosts.org/resources/event-impact-standards/economic-impacts-2/#room
37A S O I F
MEASURING THE IMPACT OF EVENTS

Introduction and “theory of change”
Organiser expenditure is relevant for an accurate measurement of direct economic impact (net increase in spending) as a result of the event. For most events, especially those using pre-existing infrastructure, spending by visitors in the local area is the biggest factor in generating economic impact; however, spending by event organisers can be a significant consideration. (Ref: eventimpacts.com23)
Contributing towards:
◥ SDG TARGET 8.1 - Sustain per capita economic growth in accordance with national circumstances
◥ SDG TARGET 8.3 - Promote development-oriented policies that support productive activities, decent job creation, entrepreneurship, creativity and innovation, and encourage the formalization and growth of micro-, small- and medium-sized enterprises
◥ SDG TARGET 17.17 - Encourage and promote effective public, public-private and civil society partnerships, building on the experience and resourcing strategies of partnerships
Organiser Expenditure
23 https://www.eventimpacts.com
MEASURING THE IMPACT OF EVENTS
38 A S O I F

Explanation
The value of contracts to suppliers and contractors based in the host economy. Businesses that have presence outside as well as within the host economy could be considered if the money stays in the local branch.
The proportion of the total event costs funded by commercial revenue should be based on the final accounts of the event, identifying the different sources of actual funding.
Reference KPI name Unit Sport for SDG reference
Input/Output/Outcome
EC-OE2.1 Value of contracts to local suppliers Currency S8.16 Output
EC-OE2.2Proportion of event costs funded by commercial revenue
% S17.12 Output
Reference KPI name Unit Sport for SDG reference
Input/Output/Outcome
EC-OE1.1 Total budgeted event expenditure Currency NA Input
EC-OE1.2Proportion of event budget funded by the public sector
% S17.15 Input
Explanation
Total budgeted expenditure to be made on all event-related activity, including by the organisation or organisations delivering the activity.
The proportion of the total event budget funded by the public sector is a measure based on the planned split of contributions towards the forecasted expenditure.
Data gathering – Timing
Timeline of event hosting
OUTCOMESINPUTS
Short-term impacts Long-term impactsForecasted impacts
Event held Post-eventHosting decision
Data gathering – Timing
Timeline of event hosting
OUTCOMESINPUTS
Short-term impacts Long-term impactsForecasted impacts
Event held Post-eventHosting decision
39A S O I F
MEASURING THE IMPACT OF EVENTS

Reference KPI name Unit Sport for SDG reference
Input/Output/Outcome
EC-IN1.1Total planned investment in infrastructure for long-term use
Currency S11.10 Input
EC-IN2.1Money invested in venues & equipment for long-term use
Currency S8.15 Output
EC-IN2.2 Money invested in transport for long-term use Currency S11.11 Output
Explanation
Total planned investment in infrastructure for long-term use after the event should include all related infrastructure (from equipment and recreation facilities to housing and transport) and ideally details on how and by whom the infrastructure is going to be used, e.g. access by local communities. The infrastructure expenditure should be as a direct result of the event, or may already be planned but “brought forward” by the event, in which case it is identified separately.
The measures of money invested in transport or venues and equipment remaining in the host economy for long-term use after the event are output measures of the monetary value of actual, rather than budgeted, expenditure.
Note: These measures will not be relevant to events with no investment in new infrastructure.
Introduction and “theory of change”
For large events, there may be a long-term economic impact resulting from expenditure on new, or brought-forward, infrastructure such as new or improved venues, transport improvements or housing. Monitoring the investment made in permanent infrastructure by hosts or organisers can contribute to measurement of long-term impacts of events.
(Ref: IAEH/Event Impact Standards24)
Contributing towards:
◥ SDG TARGET 11.2 - By 2030, provide accessto safe, affordable, accessible and sustainabletransport systems for all
Infrastructure
Data gathering – Timing
Timeline of event hosting
OUTCOMESINPUTS
Short-term impacts Long-term impactsForecasted impacts
Event held Post-eventHosting decision
24 http://www.eventhosts.org/resources/event-impact-standards/economic-impacts-2/#room
MEASURING THE IMPACT OF EVENTS
40 A S O I F

Example from 2019 WBSC Premier 12
As part of the 2019 edition of the WBSC Premier 12 baseball tournament, $3 million was invested in venues and equipment for long-term use across the six host venues in four different countries.
This included improvements at the Taichung Intercontinental Stadium in Taiwan, where the security fences and outfield fence padding were renewed, and grass areas were
adopted. All pitching mounds, including bullpen and practise ones, were entirely renewed and the home plate area was replaced.
It also included improvement at the Estadio de Béisbol Charros de Jalisco near Guadalajara, Mexico, which received investment in a new lighting system and part replacement of the turf field and new maintenance equipment.
MEASURING THE IMPACT OF EVENTS

Chapter
6

Image IndicatorsStudying the image events is relevant for hosts and organisers seeking the highest possible economic and social impact, for example large audiences from ‘out of town’ who may become visitors in future, or local viewing audiences may be inspired to make positive changes to their behaviour in future, potentially benefiting both public and private organisations investing in events.
This chapter comprises four input areas – Broadcast, Social Media, Press and Event Experience.
The specific KPIs in this chapter are linked to UN SDGs 5, 8 and 17.
Image KPIs
◥ SDG 5 - Achieve gender equalityand empower all women and girls
◥ SDG 8 - Promote sustained, inclusiveand sustainable economic growth,full and productive employment anddecent work for all
◥ SDG 17 - Strengthen the means ofimplementation and revitalize theglobal partnership for sustainabledevelopment
Economic
Enhance image of host destination
Grow customer base
Increase brand awareness
Increase in partner brand value
Value of new visitors as a result of the event
No. of international broadcast territories
No. of social media followers of the event/event owner (by channel)
No. of social media followers of event athletes (by channel)
Plan in place to promote the event to targeted audiences
Advertising Value Equivalent of media coverage
No. of impressions of event-related content (by channel)
No. of event-related posts (by channel)
Net Promoter Score of spectators
% likelihood to revisit (spectators)
% likelihood to visit (viewers)
No. of engagements of event-related content (by channel)
No. of accredited media reps attending the event
No. of new contacts due to the event
No. of event-related articles (by market)
% of articles with gendered content dedicated to females
No. of unique website users
% of attendees satisfied
Total TV household reach Digital broadcast views (by session)
% of broadcast hours with gendered content dedicated to females
% share of TV viewing audience (by market)
IMAGE
Broadcast
Press
Social Media
Event Experience
OBJECTIVE INPUT KPI OUTPUT KPI SDGINPUT AREA
OUTCOME KPI/ CALCULATION
43 A S O I F
MEASURING THE IMPACT OF EVENTS

OUTCOMESINPUTS
Short-term impacts Long-term impactsForecasted impacts
Event held Post-eventHosting decision
Reference KPI name Unit Sport for SDG reference
Input/Output/Outcome
IM-OUTCOME1Increase in partner brand value as a result of the event
Currency NA Outcome
IM-OUTCOME2 Value of new visitors as a result of the event Currency NA Outcome
Explanation
Brand value is a financial measure often used in the private sector and therefore potentially relevant to corporate sponsors of, or investors in, events. The principles can also be applied to non-profit organisations, for example tourism organisations.
The value of new visitors as a result of the event can be calculated through specialist analysis of research conducted in the host economy some time after the event, e.g. two years.
Contributing towards:
◥ SDG TARGET 8.1 - Sustain per capita economic growth in accordance with national circumstances
◥ SDG TARGET 17.17 - Encourage and promote effective public, public-private and civil society partnerships, building on the experience and resourcing strategies of partnerships
◥ SDG INDICATOR 17.1.1 - Amount of United States dollars committed to public-private and civil society partnerships
Data gathering – Timing Timeline of event hosting
Image Outcome KPIs
MEASURING THE IMPACT OF EVENTS
44 A S O I F

OUTCOMESINPUTS
Short-term impacts Long-term impactsForecasted impacts
Event held Post-eventHosting decision
Explanation
The total potential TV household reach is a measure based on potential reach data provided by broadcasters reflecting the total number of homes who have access to the event broadcast. The actual number of households viewing event content are a proportion of this number.
The number of international broadcasters includes broadcasters distributing live, delayed, repeat and highlights of the event.
The number of international broadcast territories counts the individual countries where any sort of event related broadcast content has been distributed, recognising that content from some broadcasters can be viewed from different countries.
ImportantData gathering
Household reach does not provide data of actual viewership and can be misleading. Actual TV audiences are typically much lower and influenced by factors such as the time of day that the content is shown.
The relevance of any TV data also depends on the extent to which partners feature within the TV broadcast, whether commercial sponsors or host destinations, either through on site branding, graphics or associated TV advertising linked to the broadcast.
Data gathering – Timing
Timeline of event hosting
Broadcast
Introduction and “theory of change”
The analysis of the broadcast coverage of an event, both through traditional TV or digital channels, is a key to measure an event’s audience reach and particularly important for the promotion of the host destinations and commercial partners nationally and internationally. The volume of coverage can influence the behaviour of consumers relevant to areas of impact such as future tourism and social impact.
Contributing towards:
◥ SDG TARGET 5.1 - End all forms of discriminationagainst all women and girls everywhere
◥ SDG TARGET 8.1 - Sustain per capita economicgrowth in accordance with national circumstances
Reference KPI name Unit Sport for SDG reference
Input/Output/Outcome
IM-B1.1 Total potential TV household reach Households NA Input
- No. of international broadcasters Broadcasters NA Input
IM-B1.2No. of planned international broadcast territories
Nations NA Input
45 A S O I F
MEASURING THE IMPACT OF EVENTS

OUTCOMESINPUTS
Short-term impacts Long-term impactsForecasted impacts
Event held Post-eventHosting decision
Reference KPI name Unit Sport for SDG reference
Input/Output/Outcome
IM-B2.1 Digital broadcast views (by session) Views NA Output
IM-B2.2% of broadcast hours with gendered content dedicated to females
% S5.6 Output
Explanation
The digital broadcast views by session accounts for views of full live event content on digital platforms, such as Facebook Live, YouTube and Twitch, split by individual session. For comparison between events, where an event has more than one broadcast, an estimation of unique individuals could be made by allowing for multiple views made by one individual.
Counting of the proportion of gendered content dedicated to females assesses the gender balance of sports broadcasting. The percentage is calculated as a proportion of the total time showing single gender content, excluding non-gender specific content. Important
Data gathering
Different platforms use different standards for classifying “views”. YouTube classify a view when a user has watched the content for at least 30 seconds, whereas Facebook and other platforms count content that has been viewed for 3 seconds.
Data gathering – Timing
Timeline of event hosting
MEASURING THE IMPACT OF EVENTS
46 A S O I F

OUTCOMESINPUTS
Short-term impacts Long-term impactsForecasted impacts
Event held Post-eventHosting decision
Reference KPI name Unit Sport for SDG reference
Input/Output/Outcome
IM-B2.3 % share of TV viewing audience (by market) % NA Output
IM-B2.4Advertising Value Equivalent of broadcast media coverage
Currency S8.6 Output
- Total no. of TV broadcast hours (by market) People NA Output
- Total no. of TV broadcast hours (by market) Hours NA Output
-Total no. of TV broadcast viewer hours (by market)
People NA Output
Explanation
The total number of unique TV viewers by market takes into account viewers of multiple sessions and split between each major country. This data can be very complex and costly to gather, depending on the number of individual broadcasts across different territories.
Data on the number of TV broadcast hours can be gathered using recognised industry methodologies and include live, delayed, repeat and highlights. The measure of TV broadcast viewer hours multiplies the time of each broadcast by the viewing audience at that time, and is therefore a more sophisticated measure of the value of TV broadcast of an event.
Audience share is a measure of the proportion of TV viewing audience provided by broadcasters and can be a cheaper way of assessing the size audiences in key markets.
Advertising Value Equivalent is the value of media time or space for a distinguishable image or name (e.g. brand logo or venue) expressed in monetary value based on the equivalent cost of buying that time or space on each media channel.
ImportantSpecialist calculation
There are well-established methods for measuring TV audiences used by the broadcasting industry. However, much of this is tailored to the commercial advertising industry. In many countries, there is an official source of data which produces audited results. When reported on a global level the data can be aggregated in a way than can be misinterpreted. Sophisticated TV audience data can also be costly to gather and therefore may not be relevant to all events.
(Ref: IAEH/Event Impact Standards25)
Data gathering – Timing
Timeline of event hosting
25 http://www.eventhosts.org/resources/event-impact-standards/audience-measurement-2/
47 A S O I F
MEASURING THE IMPACT OF EVENTS

Explanation
One measure of an event’s potential ‘reach’ at any one point in time is the number of followers and connections gained by an event or event brand’s social media accounts, for example Facebook fans, Twitter followers and Instagram followers. The total figure across different platforms will include some individuals who are following across more than one platform. In selecting data to gather, allowance should also be made to the changes in popularity of platforms over time and between countries.
In many cases, individual athletes have a larger following than specific events, therefore a further indication of reach is the following of athletes competing at the event.
Social Media
Introduction and “theory of change”
Social media is an increasingly relevant factor in generating audiences of events and influencing attitudes and behaviours of individuals.
Social media platforms (including global platforms such as Facebook, Twitter, Instagram and other platforms relevant to individual countries) report data of social media activity and digital tools are available to analyse and aggregate activity.
The measures included in this section are not exhaustive but a guide to basic social media metrics relevant to events.
Reference KPI name Unit Sport for SDG reference
Input/Output/Outcome
IM-SM1.1
No. of social media followers of the event/event owner (by channel)
• Other (specified, e.g. TikTok, Weibo)
Followers NA Input
IM-SM1.2
No. of social media followers of event athletes (by channel)
• Other (specified, e.g. TikTok, Weibo)
Followers NA Input
Data gathering – Timing
Timeline of event hosting
OUTCOMESINPUTS
Short-term impacts Long-term impactsForecasted impacts
Event held Post-eventHosting decision
MEASURING THE IMPACT OF EVENTS
48 A S O I F

Data gathering – Timing
Timeline of event hosting
OUTCOMESINPUTS
Short-term impacts Long-term impactsForecasted impacts
Event held Post-eventHosting decision
Explanation
Social media impressions are the number of times content is displayed on individual social media news feeds, irrespective of whether or not it has been viewed.
Social media impressions are the aggregate possible views of content and, due to the multiple content and multiple channels, impressions cannot be deduplicated to establish a unique audience figure and therefore typically result in very large numbers.
Data for the number of event-related posts by channel should ideally also report on content relevant to event partners, both private and public, and cover the full period in the lead up to, and after, the event (e.g. four weeks).
The measure of video views in this section differs from “digital broadcast views” as it relates to all video content on social media platforms, not the live coverage of the event.
Reference KPI name Unit Sport for SDG reference
Input/Output/Outcome
IM-SM2.1No. of impressions of event-related content (by channel)
Impressions NA Output
IM-SM2.2 No. of event-related posts (by channel) Posts NA Output
- No. of video views (by channel) Views NA Output
49A S O I F
MEASURING THE IMPACT OF EVENTS

Across three BWF social media accounts on Facebook, Twitter and Instagram, 1,006 posts were recorded over August 2019, the month of the event. The posts generated close to 1.7 million engagements. The accounts also attained 67,060 new followers over the one-month period.
On Facebook 376 posts were published generating 883,138
engagements, while the account saw its follower count grow by 42,123 people. As part of this Facebook activity the BWF posted 233 videos, which achieved 43 million views before, during and after the event.
BWF officially launched its Instagram account on 13 August 2019 to coincide with the start of the event. The
BWF’s Instagram account saw 9,565 engagements from 420 posts. On Twitter 210 posts were published, generating 801,654 engagements.
BWF’s social media activity has contributed towards its 2nd place position on the #SportOnSocial 2021 ranking of social media performance amongst Olympic International Federations.
Example from 2019 TOTAL BWF World Championships
MEASURING THE IMPACT OF EVENTS

Data gathering – Timing
Timeline of event hosting
OUTCOMESINPUTS
Short-term impacts Long-term impactsForecasted impacts
Event held Post-eventHosting decision
Explanation
Social media engagement is the action taken by social media users resulting from viewing posts, such as ‘like’, comment, share or click to open a link or picture.
Social media engagement measures provide deeper insights into the actual involvement of social media audiences. These can include engagement rate measuring the proportion of followers who ‘like’ or ‘share’ specific posts or click-through rate measuring the proportion of message recipients following links to other content.
The number of new followers of social media accounts is measured from date of launch to a date (e.g. one month) after the event, split by each organisation (e.g. event owner, commercial sponsor, host organisation).
The number of new contacts counts number of new customer contacts, either email or other digital addresses, gathered through the event’s activity which provides the event owner, or specific partners, with the ability for ongoing contact, split by organisation.
Reference KPI name Unit Sport for SDG reference
Input/Output/Outcome
IM-SM2.3No. of engagements of event-related content (by channel)
Engagements NA Output
IM-SM2.4
No. of new followers due to the event (by channel)
Followers NA Output-
No. of new contacts due to the event Contacts NA Output
ImportantData gathering
Access to engagement data can be limited by the policies and legislation put in place by the media platforms and account owners. Therefore, full analysis may only be available on your own accounts.
51A S O I F
MEASURING THE IMPACT OF EVENTS

Explanation
A plan to promote the event to key target audiences requires the clear identification of these audiences, for example local residents in addition to core fans, prior to the event and a structured plan including planned activities with specific budgets and milestones.
The number of accredited media representatives attending the event can be assessed through internal accreditation data, and should ideally be split between media representatives’ countries and type of media (e.g. print, digital, radio, TV).
Press
Introduction and “theory of change”
Measurement of the press coverage of an event is another relevant part of the total volume of coverage of an event. Similarly to broadcast, press coverage can be measured, in general, through established industry methodology applied by specialists.
The measures in this section address accredited media representatives, printed and online articles about the event and athletes, and website views and users.
Contributing towards:
◥ SDG TARGET 5.1 - End all forms of discriminationagainst all women and girls everywhere
Reference KPI name Unit Sport for SDG reference
Input/Output/Outcome
IM-P1.1Plan in place to promote the event to targeted audiences
Yes/No NA Input
IM-P2.1No. of accredited media representatives attending the event
People NA Output
Data gathering – Timing
Timeline of event hosting
OUTCOMESINPUTS
Short-term impacts Long-term impactsForecasted impacts
Event held Post-eventHosting decision
Reference KPI name Unit Sport for SDG reference
Input/Output/Outcome
IM-P2.2 No. of event-related articles (by market) Articles NA Output
IM-P2.3% of articles with gendered content dedicated to females
% S5.5 Output
-Total no. of views of event-related online articles
Views NA Output
MEASURING THE IMPACT OF EVENTS
52 A S O I F

Data gathering – Timing
Timeline of event hosting
OUTCOMESINPUTS
Short-term impacts Long-term impactsForecasted impacts
Event held Post-eventHosting decision
Data gathering – Timing
Timeline of event hosting
OUTCOMESINPUTS
Short-term impacts Long-term impactsForecasted impacts
Event held Post-eventHosting decision
Explanation
The number of event-related articles published can be gathered in each key market, using media methodologies.
Counting of the percentage of articles with gendered content dedicated to females is relevant to assess the balance of media reporting. The increase in female related content is expected to increase the awareness and interest of and for women sports and to promote gender equality as well as the empowerment for women in sports (Sport and SDG Indicator Protocol Sheets Category 2 Indicators).
The total number of views of event-related online articles is estimated using recognised industry methodology and specialist analysis.
Explanation
The number of event website views can be assessed through internal monitoring of the event’s website data over a defined period before and after event (e.g. from official “launch” to one month after).
Unique users are individuals visiting the website, taking into account (deduplicating) repeat visits and visits to more than one page.
Unique users are typically 10-25% of total event website views
Reference KPI name Unit Sport for SDG reference
Input/Output/Outcome
IM-P2.4 No. of unique website users People NA Output
- No. of event website views Views NA Output
ImportantConcept
Page views represent each individual time a page on your website is loaded by a user. A single session can include many page views, if a user navigates to any other web pages on your website without leaving (Google Analytics).
53A S O I F
MEASURING THE IMPACT OF EVENTS

Explanation
The percentage of spectators satisfied with the event is calculated based on a satisfaction survey conducted during or immediately after the event with answers using a 5-point Likert scale (see example box). The percentage is calculated based on the sum of “satisfied” and “very satisfied” responses.
Net Promoter Score (NPS) is a calculation based on customers rating their likelihood to recommend a company, a product, or a service to a friend or colleague. The NPS is the percentage of “promoters” (people who rate 9 or 10) minus the percentage of “detractors” (people who rate between 0 and 6).
Event Experience
Introduction and “theory of change”
The experience and perception of event spectators can influence their behaviour and consumption and contribute to the event’s image and that of event partners and the host destination. A positive event experience underpins positive event economic and social outcomes.
The measures in this section can be measured through surveys applied to attending and viewing spectators during and after the event.
Data gathering – Timing
Timeline of event hosting
OUTCOMESINPUTS
Short-term impacts Long-term impactsForecasted impacts
Event held Post-eventHosting decision
Reference KPI name Unit Sport for SDG reference
Input/Output/Outcome
IM-EE2.1 % of spectators satisfied % NA Output
IM-EE2.2 Net Promoter Score of spectators Score NA Output
ExampleData gathering
Example question – satisfaction: Overall, how satisfied were you with [the event]?
Net Promoter Score – Standard question: On a scale from 0 to 10, how likely are you to recommend [the event] to a friend or colleague?
Very Unsatisfied Unsatisfied Neutral Satisfied
Very Satisfied
MEASURING THE IMPACT OF EVENTS
54 A S O I F

Data gathering – Timing Timeline of event hosting
OUTCOMESINPUTS
Short-term impacts Long-term impactsForecasted impacts
Event held Post-eventHosting decision
Explanation
The percentage of spectators or viewers likely to revisit can be calculated based on survey data with answers on a 5-point Likert scale (see example box). The percentage likelihood to revisit corresponds to the sum of those who answered “likely” or “very likely”.
When surveying spectators and viewers, random sampling or convenience sampling should be representative of each target audiences and the quantity of surveys sufficient to be statistically significant.
Some host destinations also use events as part of a strategy to attract people to invest in their destination for work or education, therefore a similar survey question could be used.
% likelihood to visit is typically much lower for viewers surveyed, than the likelihood to revisit is for attending spectators surveyed
Reference KPI name Unit Sport for SDG reference
Input/Output/Outcome
IM-EE2.3 % likelihood to revisit (spectators) % NA Output
IM-EE2.4 % likelihood to visit (viewers) % NA Output
-% likelihood to relocate to work or study (viewers)
% NA Output
ExampleData gathering
Example question: How likely are you to visit [destination] over the next two years as a result of [the event]?
Very Likely
Likely
Neutral
Not Likely
Very Unlikely
55 A S O I F
MEASURING THE IMPACT OF EVENTS

Chapter
7

Social IndicatorsMeaningful social impacts attributable to an event are unlikely to happen by chance and must be managed if they are to occur. The starting point in delivering specific social impacts is for an event to have clearly stated objectives, target audiences they want to influence and describe the delivery mechanisms by which the planned impacts will occur, prior to the event taking place.
This chapter comprises six input areas of Community Engagement, Volunteers, Activation, Outreach, Diversity & Inclusion and Skills Development.
The specific KPIs in this chapter are linked to UN SDGs 3, 4, 5, 10, 16 and 17:
Social KPIs
◥ SDG 5 - Achieve gender equality and empower all women and girls
◥ SDG 10 - Reduce inequality within and among countries
◥ SDG 16 - Promote peaceful and inclusive societies for sustainable development, provide access to justice for all and build effective, accountable and inclusive institutions at all levels
◥ SDG 17 - Strengthen the means of implementation and revitalize the global partnership for sustainable development.
Economic
Positively benefit people’s well-being
Positively impact communities
Perceived benefit to local residents, expressed in financial terms
% change in community outcomes, e.g. reduction in crime rates during event
Planned no. of volunteers
Planned no. of attendees at free activity related to the event
Equal opportunity policy in place
Targeted skills development plan in place
Gender athlete pay ratio Male/Female
Public commitment to meeting international labour rights standards
Planned no. of participants in programmes
Local community groups benefiting from outreach activity
No. of volunteers from target segments of local population
Average no. of hours volunteering per person
No. of attendees from target segments of local population
No. of people trained in new skills
No. of people from target segments trained in new skills
Average no. of hours attending per person
No. of participants from target segments of local population
Average no. of hours participating per person
% participants from minority communities
Targeted local community engagement plan in place
No. of local residents viewed or followed the event
% of local residents proud
% local attendees more happy as a result of the event
SOCIAL
Community Engagement
Volunteers
Activation
Diversity & Inclusion
Outreach
Skills
% participants female
% participants disabled
OBJECTIVE INPUT KPI OUTPUT KPI SDGINPUT AREA
OUTCOME KPI/ CALCULATION
◥ SDG 3 - Ensure healthy lives and promote well-being for all at all ages
◥ SDG 4 - Ensure inclusive and equitable quality education and promote lifelong learning opportunities for all
MEASURING THE IMPACT OF EVENTS

Reference KPI name Unit Sport for SDG reference
Input/Output/Outcome
SO-OUTCOME1Perceived benefit to local residents, expressed in financial terms
Currency NA Outcome
SO-OUTCOME2% change in community outcomes, e.g. reduction in crime rates during event
% S16.9 Outcome
Explanation
Perceived benefit expressed in financial terms is a calculation based on academic methodologies of “willingness to pay”, using primary research of local residents.
The change in community outcomes is a calculation based on comparison of available data compared to a pre-event base year.
Contributing towards:
◥ SDG TARGET 3.4 - By 2030, reduce by one-third premature mortality from non-communicable diseases through prevention and treatment and promote mental health and well-being
◥ SDG TARGET 16.1 - Significantly reduce all forms of violence and related death rates everywhere
◥ SDG INDICATOR 16.1.4 - Proportion of population that feel safe walking alone around the area they live
ImportantSpecialist calculation
These calculations should be done by external specialists using established methods and available data. There may be different approaches to calculations and specialist advice is required to define the appropriate method.
Data gathering – Timing Timeline of event hosting
OUTCOMESINPUTS
Short-term impacts Long-term impactsForecasted impacts
Event held Post-eventHosting decision
Social Outcome KPIs
MEASURING THE IMPACT OF EVENTS
58 A S O I F

Community Engagement
Introduction and “theory of change”
Events are often cited by event organisers and promoters as catalysts for improving local residents’ self-image of the community in which they live and for making a positive contribution to their quality of life. (Ref: eventimpacts.com26)
Contributing towards:
◥ SDG TARGET 3.4 - By 2030, reduce by one-third premature mortality from non-communicable diseases through prevention and treatment and promote mental health and well-being
◥ SDG TARGET 16.1 - Significantly reduce all forms of violence and related death rates everywhere
◥ INDICATOR 16.1.4 - Proportion of population that feel safe walking alone around the area they live
26 http://www.eventimpacts.com/impact-types/social/content/identity-and-image/basic-measures
59 A S O I F
MEASURING THE IMPACT OF EVENTS
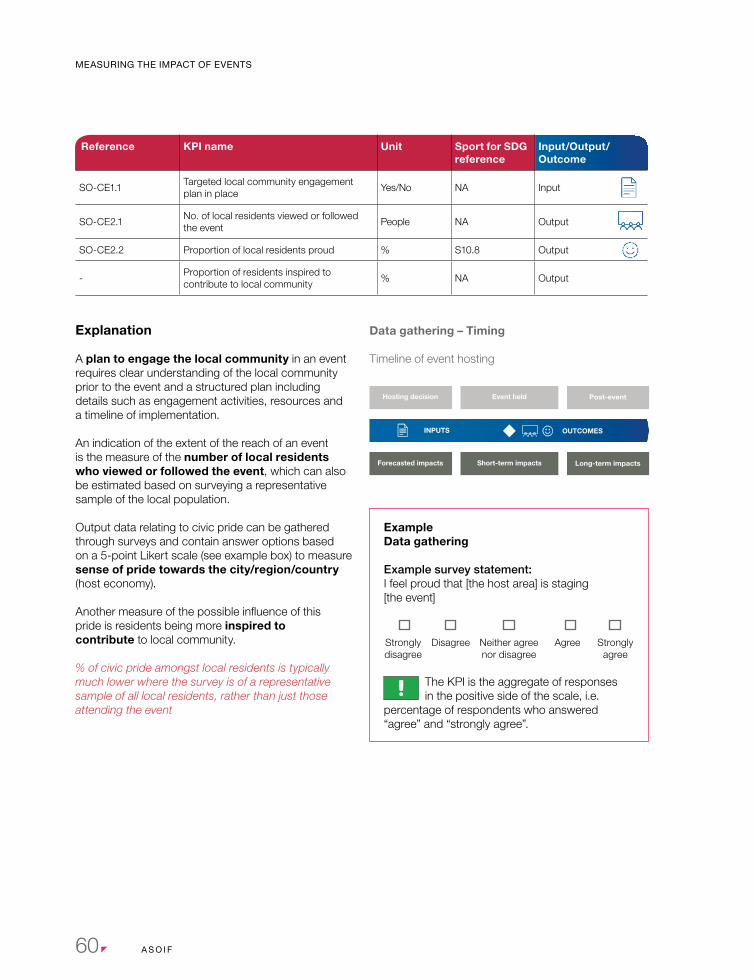
ExampleData gathering
Example survey statement: I feel proud that [the host area] is staging [the event]
The KPI is the aggregate of responses in the positive side of the scale, i.e.
percentage of respondents who answered “agree” and “strongly agree”.
Strongly disagree
Disagree Strongly agree
Neither agree nor disagree
Agree
Explanation
A plan to engage the local community in an event requires clear understanding of the local community prior to the event and a structured plan including details such as engagement activities, resources and a timeline of implementation.
An indication of the extent of the reach of an event is the measure of the number of local residents who viewed or followed the event, which can also be estimated based on surveying a representative sample of the local population.
Output data relating to civic pride can be gathered through surveys and contain answer options based on a 5-point Likert scale (see example box) to measure sense of pride towards the city/region/country (host economy).
Another measure of the possible influence of this pride is residents being more inspired to contribute to local community.
% of civic pride amongst local residents is typically much lower where the survey is of a representative sample of all local residents, rather than just those attending the event
Reference KPI name Unit Sport for SDG reference
Input/Output/Outcome
SO-CE1.1Targeted local community engagement plan in place
Yes/No NA Input
SO-CE2.1No. of local residents viewed or followed the event
People NA Output
SO-CE2.2 Proportion of local residents proud % S10.8 Output
-Proportion of residents inspired to contribute to local community
% NA Output
Data gathering – Timing Timeline of event hosting
OUTCOMESINPUTS
Short-term impacts Long-term impactsForecasted impacts
Event held Post-eventHosting decision
MEASURING THE IMPACT OF EVENTS
60 A S O I F

Reference KPI name Unit Sport for SDG reference
Input/Output/Outcome
SO-CE2.3Proportion of local attendees more happy as a result of the event
% NA Output
Explanation
The percentage of local attendees feeling happier as a result of attending the event is a calculation based on external survey data using a standard question (see example box).
The results of this measure only apply to the estimated number of local residents attending the event, not to the whole resident population.
Data gathering – Timing Timeline of event hosting
OUTCOMESINPUTS
Short-term impacts Long-term impactsForecasted impacts
Event held Post-eventHosting decision
ExampleData gathering
Example survey statement: I feel happier (i.e. experiencing joy, excitement, feeling optimistic) as a result of attending [the event]
Strongly disagree
Disagree
Neither agree nor disagree
Agree
Strongly agree
In the UK, the Office of National Statistics uses four survey questions to measure personal well-being covering life satisfaction, feeling worthwhile, happiness and anxiety on a scale of 1 to 10. Therefore, results from asking these questions during the event could be compared with results from the regular “omnibus” survey.
(Ref: Office of National Statistics27)
27 http://www.ons.gov.uk
61 A S O I F
MEASURING THE IMPACT OF EVENTS

Introduction and “theory of change”
The successful delivery of many sporting events relies on the support of volunteers. In addition to short-term satisfaction and well-being, volunteering can help people develop skills which can enable them find work or improve their career prospects. (Ref: IAEH, Event Impact Standards28)
The impact of the volunteers needed for an event can be maximised by considering the host objectives in recruiting specific target segments of the local population (e.g. disadvantaged people and under-represented groups).
Contributing towards:
◥ SDG TARGET 3.4 - By 2030, empower and promote the social, economic and political inclusion of all, irrespective of age, sex, disability, race, ethnicity, origin, religion or economic or other status
◥ SDG TARGET 10.3 - Ensure equal opportunity and reduce inequalities of outcome including by eliminating discriminatory laws, policies and practices and promoting appropriate legislation, policies and action in this regard
◥ SDG INDICATOR 10.3.1 - Proportion of the population reporting having personally felt discriminated against or harassed within the previous 12 months on the basis of a ground of discrimination prohibited under international human rights law
Volunteers
28 http://www.eventhosts.org/resources/event-impact-standards/social-impacts-2/
MEASURING THE IMPACT OF EVENTS
62 A S O I F

Explanation
The planned number of volunteers is an input measure illustrating potential social impact.
The actual number of volunteers can be assessed at the event and should be split between target segments of the population, e.g. gender, age-group, income-level & ethnicity (specific to the local market).
To have a greater understanding of the depth of involvement the average number of hours attending per person can also be split between pre-defined target segments of the local population.
Total number of volunteers typically ranges between 100 and 500, with over 1,000 for very large events and over 3,000 for large mass participation events
Data gathering – Timing Timeline of event hosting
OUTCOMESINPUTS
Short-term impacts Long-term impactsForecasted impacts
Event held Post-eventHosting decision
Reference KPI name Unit Sport for SDG reference
Input/Output/Outcome
SO-V1.1 Total planned no. of volunteers People NA Input
- Actual no. of volunteers People S10.9a Output
SO-V2.1No. of volunteers from target segments of local population
People NA Output
SO-V2.2 Average no. of hours volunteering per person Hours NA Output
ImportantData gathering
Prior to the event: Plan the number of volunteers needed for an event and identify host social objectives to define recruitment criteria.
63 A S O I F
MEASURING THE IMPACT OF EVENTS

Introduction and “theory of change”
Event experiences such as free activity during the period of the event provide opportunities for event organisers and partner organisations to engage with ticket holders and the wider public to achieve their impact objectives.
Contributing towards:
◥ SDG TARGET 10.2 - By 2030, empower and promote the social, economic and political inclusion of all, irrespective of age, sex, disability, race, ethnicity, origin, religion or economic or other status
◥ SDG TARGET 10.3 - Ensure equal opportunity and reduce inequalities of outcome including by eliminating discriminatory laws, policies and practices and promoting appropriate legislation, policies and action in this regard
◥ SDG INDICATOR 10.3.1 - Proportion of the population reporting having personally felt discriminated against or harassed within the previous 12 months on the basis of a ground of discrimination prohibited under international human rights law
Explanation
The planned number of attendees at free activity related to the event, such as “taster” sessions or sponsor exhibitions, is an input measure and the measure of actual individual attendees at the event an output measure.
The number of actual attendees from target segments of the local population is relevant to assess the impact of the proposed activation activities on local communities.
It is also possible to assess the depth of involvement and impact of the activation by measuring the amount of time participating per person.
Data gathering – Timing Timeline of event hosting
OUTCOMESINPUTS
Short-term impacts Long-term impactsForecasted impacts
Event held Post-eventHosting decision
Reference KPI name Unit Sport for SDG reference
Input/Output/Outcome
SO-A1.1Planned no. of attendees at free activity related to the event
People NA Input
-Actual no. of attendees at free activity related to the event
People Cat1.24 Output
SO-A2.1No. of attendees from target segments of local population
People NA Output
SO-A2.2Average no. of hours attending per person
People NA Output
Activation
MEASURING THE IMPACT OF EVENTS
64 A S O I F

In addition to the event venue at the Ullevi stadium, the city also arranged the open Heden Arena, which served both as an inviting place to mingle and enjoy the party and as a venue for some of the equestrian competition. There was no entrance fee and the area was open throughout the championships. Heden Arena was the championship hub for the Driving and Para-Equestrian
Dressage disciplines, but it was also the starting point for the Driving marathon – one of the more spectacular events of the championships staged in the city centre.
At Heden there was an exhibition centre and the Heden Shopping Village by EuroHorse, with approximately 100 exhibitors selling anything related to equestrian and riding equipment. Other activities at Heden during the championship included:
free pony riding every day; Hobby Horse Championship; demonstrations of horse breed; equestrian technical innovations; and shows including Agility, Mounted Games, Vaulting, Western, Riding, Driving, Dressage, Pony Gallop.
Over the course of the event 150,000 people attended the Heden Arena, the Slottskogen City Park and the Opening Ceremony – all free of charge.
Example from 2017 FEI European Equestrian Championships, Gothenburg
65 A S O I F

Introduction and “theory of change”
For many events, organisers and public authorities design and deliver programmes of “outreach” activity to encourage changes in behaviour of target groups to generate long-term health benefits. These may be education sessions to encourage long-lasting participation in sport amongst young people or segments of the population who are historically less involved (e.g. socially disadvantaged). (Ref: IAEH/Event Impact Standards29)
Contributing towards:
◥ SDG TARGET 17.17 - Encourage and promote effective public, public-private and civil society partnerships, building on the experience and resourcing strategies of partnerships, data monitoring and accountability
Explanation
Three main goals of an outreach programme are to improve learning, promoting civic engagement, and strengthening communities by addressing their societal needs.
Through internal monitoring of planned activities it is possible to identify the number of participants (target and actual) and the different community groups benefiting from these activities.
The average number of hours participating per person is relevant to illustrate the extent of the engagement of participants.
Data gathering – Timing Timeline of event hosting
OUTCOMESINPUTS
Short-term impacts Long-term impactsForecasted impacts
Event held Post-eventHosting decision
Reference KPI name Unit Sport for SDG reference
Input/Output/Outcome
SO-O1.1Planned no. of participants in outreach programmes
People NA Input
SO-O1.2Local community groups benefiting from outreach activity
Yes/NoNA Input
-Actual no. of participants in outreach programmes
People NA Output
SO-O2.1No. of participants from target segments of local population
People NA Output
SO-O2.2Average no. of hours participating per person
People NA Output
Outreach
29 http://www.eventhosts.org/resources/event-impact-standards/social-impacts-2/
MEASURING THE IMPACT OF EVENTS
66 A S O I F

FIFA’s “Football for Hope” programme provided opportunities for 5,390 young people, athletes and volunteers across Edmonton, Ottawa and Rankin Inlet.
The programme aims to improve the lives and prospects
of young people around the world by offering funding, equipment and training to existing football-based community projects and their beneficiaries.
FIFA Women’s World Cup Canada 2015, together with
Canada Soccer’s Provincial and Territorial members, collaborated with Motivate Canada and the United Nations in Canada in the delivery of soccer and leadership development programming to Aboriginal communities in Canada.
Example from 2015 FIFA Women’s World Cup Canada
67 A S O I F

Introduction and “theory of change”
The most basic element of sport is people coming together to play. Sport can create a feeling of inclusion in society, no matter what age; sexual orientation; gender expression; whether you are disabled or not; religion; ethnicity or socio-economic status you are or hold (sportanddev.org). Sporting events can therefore be used as platforms to promote diversity and inclusion both on and off the playing field.
Contributing towards:
◥ SDG TARGET 5.1 - End all forms of discrimination against all women and girls everywhere
◥ SDG TARGET 5.5 - Ensure women’s full and effective participation and equal opportunities for leadership at all levels of decision-making in political, economic and public life
◥ SDG INDICATOR 5.5.2 - Proportion of women in managerial positions
◥ SDG TARGET 10.2 - By 2030, empower and promote the social, economic and political inclusion of all, irrespective of age, sex, disability, race, ethnicity, origin, religion or economic or other status
◥ SDG TARGET 10.3 - Ensure equal opportunity and reduce inequalities of outcomeincluding by eliminating discriminatory laws, policies and practices and promoting appropriate legislation, policies and action in this regard
◥ SDG INDICATOR 10.3.1 - Proportion of the population reporting having personally felt discriminated against or harassed within the previous 12 months on the basis of a ground of discrimination prohibited under international human rights law
Explanation
An equal opportunities policy is a formal manifesto that sets out an organisation’s commitment to fairness. It also lays down guidelines on how it will deal with issues that contravene these guidelines. As an example, in the UK, The Equality Act 2010 has specified nine areas that are termed in the legislation as protected characteristics. These include (in no particular order): Age; Sex; Race; Disability; Pregnancy; Marital status; Sexual orientation; Gender reassignment; and Religious background (Definition of Equal Opportunities Under The Equality Act 2010, UK).
Athlete gender pay ratio is relevant for events where prize-money or pay is made to participants.
Data gathering – Timing Timeline of event hosting
OUTCOMESINPUTS
Short-term impacts Long-term impactsForecasted impacts
Event held Post-eventHosting decision
Reference KPI name Unit Sport for SDG reference
Input/Output/Outcome
SO-DI1.1 Equal opportunity policy in place Yes/No S10.2 Input
SO-DI1.2 Athlete gender pay ratio M/F %/% NA Input
- % organising committee board representation % Cat1.15 Input
Another possible indicator of diversity and inclusion is organising committee board representation. The percentage of female board members, for example, can also be assessed and compared with national and international recommendations.
Diversity & Inclusion
MEASURING THE IMPACT OF EVENTS
68 A S O I F

Explanation
These measures focus on assessing the percentage of athlete participants who are female, the percentage from minority communities and the percentage of disabled.
Minority communities should be defined locally. For example, in the UK, organisations often identify ethnically diverse communities as Black, Asian and Minority Ethnic.
The proportion of participants disabled should be calculated based on national or international classification of different types of impairments and disabilities.
% female participation is typically 43 to 54%, excluding single gender events and mass participation events, which typically have between 29 and 38% female participation
Data gathering – Timing Timeline of event hosting
OUTCOMESINPUTS
Short-term impacts Long-term impactsForecasted impacts
Event held Post-eventHosting decision
Reference KPI name Unit Sport for SDG reference
Input/Output/Outcome
SO-DI2.1 % participants female % NA Output
SO-DI2.2 % participants from minority communities % NA Output
SO-DI2.3 % participants disabled % Cat1.16 Output
ExampleDefinitions
Resources to be considered in addressing measures related to minority and disabled participants include:
◥ WHO’s International Classification of Functioning, Disability and Health (ICF) which provides a standard language and framework for the description of health and health-related states.
◥ The United Nations/Human Rights refers to minorities as based on national or ethnic, cultural, religious and linguistic identity, and provides that States should protect their existence. There is no internationally agreed definition as to which groups constitute minorities. It is often stressed that the existence of a minority is a question of fact and that any definition must include both objective and subjective factors.
69 A S O I F
MEASURING THE IMPACT OF EVENTS

Introduction and “theory of change”
Large scale events are opportunities for providing training and skill development for workers involved in all event-related activities. These opportunities, if targeted at the local communities and addressing their specific needs, can leave a long lasting positive social impact.
Contributing towards:
◥ SDG TARGET 4.4 - By 2030, substantially increase the number of youth and adults who have relevant skills, including technical and vocational skills, for employment, decent jobs and entrepreneurship
Explanation
A Skills Development Plan should describe the resources available for skill development and outline strategies to assess the effectiveness of such a plan. It is crucial to determine the targets and realistic opportunities the event may offer to skills development of people, such as staff and volunteers.
To assess the effectiveness of the plan, count the number of people trained in new skills as result of the event’s formal programmes and specify each “new skill”, separately identifying target segments of the population that are relevant to the objectives of host organisations, e.g. gender, age-group, income-level & ethnicity (specific to the local market).
In order to help prevent abuses of workers’ rights in the preparation of the event, events can also make open commitments to meeting international standards as set out in the International Labour Organization’s Declaration on the Fundamental Principles and Rights at Work30.
Data gathering – Timing Timeline of event hosting
OUTCOMESINPUTS
Short-term impacts Long-term impactsForecasted impacts
Event held Post-eventHosting decision
Reference KPI name Unit Sport for SDG reference
Input/Output/Outcome
SO-SD1.1 Targeted skills development plan in place Yes/No NA Input
SO-SD1.2Public commitment to meeting international labour rights standards
Yes/NoNA Input
SO-SD2.1 No. of people trained in new skills People NA Output
SO-SD2.2No. of people from target segments trained in new skills
People NA Output
Skills Development
30 https://www.ilo.org/declaration/thedeclaration/textdeclaration/lang--en/index.htm
MEASURING THE IMPACT OF EVENTS
70 A S O I F

In the 2020 Tour de Taiwan, 200 staff were trained in the pre-event seminars to learn new skills and knowledge required to carry out the logistics of the event. In addition, 500 traffic officers
across Taipei, Taoyuan, Hsinchu, Miaoli, Taichung, Pingtung and Kaohsiung were gathered and trained on how to maintain traffic security and safety in an international event of such scale.
Example from 2020 Tour de Taiwan, UCI Asia Tour
MEASURING THE IMPACT OF EVENTS

Chapter
8

Sport IndicatorsSome objectives for hosting sporting events are focused on increasing the capacity and effectiveness of organisations that exist to deliver sport. The resources used to deliver events can help deliver more sport and the net benefits of more sport, for example health and well-being.
This chapter includes two input areas of Sport Development and Sport Participation.
The specific KPIs in this chapter are linked to UN SDGs 3 and 17.
Sport KPIs
◥ SDG 3 - Ensure healthy lives and promote well-being for all at all ages
◥ SDG 17 - Strengthen the means of implementation and revitalize the global partnership for sustainable development
No. of new participants in physical activity as a result of the event
Quantified value of health benefits from new participation
Plan in place to promote sport & physical activity to targeted audiences
Plan in place to increase capacity of local sport organisations
Money invested in organisations delivering grassroots programmes
Money invested in sport & recreation space for long-term use
% residents inspired to do more sport/physical activity
SPORT
SportDevelopment
Sport Participation
OBJECTIVE INPUT KPI OUTPUT KPI SDGINPUT AREA
OUTCOME KPI/ CALCULATION
73 A S O I F
MEASURING THE IMPACT OF EVENTS

Reference KPI name Unit Sport for SDG reference
Input/Output/Outcome
SP-OUTCOME1No. of new participants in physical activity as a result of the event
People NA Outcome
SP-OUTCOME2Quantified value of health benefits resulting from new participation
Currency NA Outcome
Explanation
Assessing the number of new participants in sport or physical activity as a result of an event requires long-term tracking over time, e.g. from a baseline point in time to one year after the event, and an assessment of the regularity of the new participation, e.g. meeting World Health Organisation guidelines.
The financial value of new participation, e.g. health care cost savings from a reduction in disease, will depend on the background of the individual involved. For example, there is likely to be greater financial benefit from regular participation from someone from a disadvantaged segment of the local population.
Contributing towards:
◥ SDG TARGET 3.4 - By 2030, reduce by one-third premature mortality from non-communicable diseases through prevention and treatment and promote mental health and well-being
ImportantSpecialist calculation
These calculations should be done by external specialists using established methods. There are different approaches to calculation and specialist advice is required to define the appropriate method.
Tracking the long-term behaviour of event attendees requires research surveying the same individuals over time. This is more challenging than carrying out anonymous surveys to measure the attitudes to visiting or revisiting a destination at the time of the event.
Data gathering – Timing Timeline of event hosting
OUTCOMESINPUTS
Short-term impacts Long-term impactsForecasted impacts
Event held Post-eventHosting decision
Sport Outcome KPIs
MEASURING THE IMPACT OF EVENTS
74 A S O I F


Sport Development
Introduction and “theory of change”
By planning ahead, events can be a catalyst for strengthening the work of local and national sport organisations. There are several different ways of leveraging events for capacity building. Therefore, the specific needs of local and national sport organisations should be considered in developing and implementing activities.
Contributing towards:
◥ SDG TARGET 3.4 - By 2030, provide universal access to safe, inclusive and accessible, green and public spaces, in particular for women and children, older persons and persons with disabilities
◥ SDG TARGET 17.17 - Encourage and promote effective public, public-private and civil society partnerships, building on the experience and resourcing strategies of partnerships, data monitoring and accountability
◥ SDG INDICATOR 17.17.1 - Amount of United States dollars committed to public-private and civil society partnerships
MEASURING THE IMPACT OF EVENTS
76 A S O I F

Reference KPI name Unit Sport for SDG reference
Input/Output/Outcome
SP-SD1.1Plan in place to increase capacity of local or national sport organisations
Yes/No NA Input
SP-SD2.1 Money invested in grassroots programmes Currency NA Output
SP-SD2.2Money invested in sport & recreation space for long-term use
Currency S11.7 Output
Explanation
A plan for increasing the capacity of local or national sport organisations should outline key targets, resources and specify activities.
Programmes delivering grassroots sport can result in people living healthier lives and also be the foundation for high performance sport. In order to deliver on its potential, grassroots sport needs to be adequately supported and resourced. Measuring the investment made by the specific event should only include actual money invested based on formal links to the event.
In quantifying actual specific investment made in sport and recreation space for long-term use after the event it is important to identify to whom these spaces are open, e.g. general public or private members. Long-term usage data can also be used to demonstrate impact.
Data gathering – Timing Timeline of event hosting
OUTCOMESINPUTS
Short-term impacts Long-term impactsForecasted impacts
Event held Post-eventHosting decision
77 A S O I F
MEASURING THE IMPACT OF EVENTS

Explanation
A plan to promote sport & physical activity to targeted local, national or international audiences should include details on the target segments of the population, specific activity developed and planned strategies to assess the effectiveness of these activities.
The percentage of residents inspired to do more sport/physical activity as a consequence of the event can be assessed through an external survey of a representative sample of the local population immediately after the event. The survey should include answer options on a 5-point Likert scale (see example box) with the percentage equating to the sum of the “agree” and “strongly agree” answers.
It is also possible to use different survey questions to assess residents future intentions, e.g. more frequently, higher intensity and longer duration.
Data gathering - Timing Timeline of event hosting
OUTCOMESINPUTS
Short-term impacts Long-term impactsForecasted impacts
Event held Post-eventHosting decision
Sport Participation
Introduction and “theory of change”
“It is an extremely powerful idea that experiencing the performance of a world-leading athlete can directly and positively impact on people’s inclination towards their own participation in sporting activity.” (Ref: The Inspirational Effect of Major Sporting Events31)
Sport participation is key for the continued growth of any sport and sporting events are highly visible opportunities to inspire participation.
Contributing towards:
◥ SDG TARGET 3.4 - By 2030, reduce by one-third premature mortality from non-communicable diseases through prevention and treatment and promote mental health and well-being
Reference KPI name Unit Sport for SDG reference
Input/Output/Outcome
SP-SP1.1Plan in place to promote sport & physical activity to targeted audiences
Yes/No NA Input
SP-SP2.1% residents inspired to do more sport/physical activity
% S3.9 Output
ExampleData gathering
Example statement: I have been inspired to do more sport or physical activity as a result of [the event].
Strongly disagree
Disagree Strongly agree
Neither agree nor disagree
Agree
31 https://www.sportsthinktank.com/uploads/the-inspirational-impact-of-major-sporting-events.pdf
MEASURING THE IMPACT OF EVENTS
78 A S O I F

Example from London 2017 World Athletics Championships
As part of its commitment to hosting the World Athletics Championships and World Para Athletics Championships during 2017, London and UK hosting partners designed and committed a total of £1.9 million funding to a range of projects and programmes targeted at
increasing participation in physical activity and athletics around the events.
The “Summer of World Athletics” included a programme of 11 separate projects in the UK, plus two international programmes. In the UK the projects were
targeted at volunteers, disabled people, and communities and schools around London. The two international programmes were targeted at encouraging greater participation by women and children in athletics, particularly in countries where there has been less international success at the elite level.
MEASURING THE IMPACT OF EVENTS

Chapter
9

Environmental IndicatorsEvents use resources from activities such as venue construction, energy use and transport of spectators and participants, which in turn impact on major environmental issues such as climate change and the reduction in natural resources (Ref: IAEH/Event Impact Standards). But also, given the significant media attention associated with events, there are opportunities for events to demonstrate leadership of environmental best practice and standards, such as waste recycling, which may be adopted more widely by individuals and organisations after the event.
Decisions made at the early planning stage can significantly influence the types of environmental impacts that arise from the event. This chapter includes six key input areas of how events can influence environmental impacts – Environmental Promotion, Transport, Waste, Energy, Procurement and Landscape & Biodiversity.
The specific KPIs in this chapter are linked to UN SDGs 7, 11, 12, 13 and 15.
Environmental KPIs
◥ SDG 7 - Ensure access to affordable,reliable, sustainable and modernenergy for all
◥ SDG 11 - Make cities and humansettlements inclusive, safe, resilientand sustainable
◥ SDG 12 - Ensure sustainableconsumption and production patterns
◥ SDG 13 - Take urgent action tocombat climate change and its impacts
◥ SDG 15 - Protect, restore andpromote sustainable use of terrestrialecosystems, sustainably manageforests, combat desertification, andhalt and reverse land degradationand halt biodiversity loss
Economic
Increase environmental awareness
Minimise negative impacts
Measurement of carbon footprint in place
Strategy to encourage workforce, attendees and spectators to use sustainable transport
Sustainable Procurement Code in place for all products and services
Local environmental initiatives in place
Waste management plan in place
Renewable energy plan in place
% of spectators using public or sustainable transport
% of event waste diverted from landfill
% of energy used from renewable sources
% of contracts awarded that comply with sustainability standards
% of event food & drink ethically sourced
No. of initiatives delivered addressing local environments and biodiversity
Public commitment to environmental policies
ISO20121 accreditation
% of spectators reporting a positive change in behaviour
ENVIRONMENTAL
Environmental Promotion
Transport
Waste
Procurement
Energy
Landscape & Biodiversity
OBJECTIVE INPUT KPIINPUT AREA OUTPUT KPI SDG OUTCOME KPI/
CALCULATION
81 A S O I F
MEASURING THE IMPACT OF EVENTS
Net event carbon footprint, inc:
-energy from renewable sources
-carbon offset

Reference KPI name Unit Sport for SDG reference
Input/Output/Outcome
EN-OUTCOME1
Net event carbon footprint, including
• energy from renewable sources
• carbon offset
CO2 equivalent (tonnes)
S12.11 Outcome
Explanation
Many environmentally responsible organisations focus on achieving “net neutral” carbon dioxide emissions, through a combination of reducing consumption, using renewable energy, such as hydro, wind, geothermal or solar power, or by investing in “carbon offsetting”.
Measuring the net carbon footprint of the event should start from the earliest stages of planning and identify how much the carbon reduction has been achieved through carbon offsetting.
Contributing towards:
◥ SDG TARGET 13.2 - Integrate climatechange measures into national policies,strategies and planning
ImportantSpecialist calculation
This calculation should be done by external specialists using established methods. There may be different approaches to calculating and specialist advice is required to define the appropriate method.
Data gathering – Timing
Timeline of event hosting
OUTCOMESINPUTS
Short-term impacts Long-term impactsForecasted impacts
Event held Post-eventHosting decision
Environmental Outcome KPIs
MEASURING THE IMPACT OF EVENTS
82 A S O I F

Environmental Promotion
Introduction and “theory of change”
Sport in general, and major sport events in particular, have a special role to play in promoting and supporting sustainability. The Sports for Climate Action Framework was launched in 2018 to “drive emission reductions of sports operations and tap the popularity and passion of sport to engage millions of fans in the effort”.
(Ref: How Sport Events are Joining the Sustainability Challenge32)
Event organisers can put in place activities and commitments to promote environmental responsibility by both the organisation and fans who engage with events.
Contributing towards:
◥ SDG TARGET 12.8 - By 2030, ensure thatpeople everywhere have the relevant informationand awareness for sustainable development andlifestyles in harmony with nature
◥ SDG TARGET 13.2 - Integrate climate changemeasures into national policies, strategiesand planning
◥ SDG TARGET 13.3 - Improve education,awareness-raising and human and institutionalcapacity on climate change mitigation, adaptation,impact reduction and early warning
32 https://www.solarimpulse.com/news/faster-higher-stronger-greener-how-sports-events-are-joining-the-sustainability-challenge
83A S O I F
MEASURING THE IMPACT OF EVENTS

Explanation
A formal, public commitment to environmental policies sets the event’s intentions to follow best practice to minimise the impact on the environment. That needs to be done prior to the event taking place, in the planning phase, and based on evidence on meeting core requirements of recognised national or international guidance.
Ensuring the measurement of an event’s carbon footprint is in place is an input measure prior to the event, and can be carried out by specialist experts or using basic online tools.
ISO 20121 is a management system standard designed to help organisations in the events industry improve the sustainability of their event related activities, products and services. Organisations that successfully implement the standard are able to seek independent recognition of their achievement through a process called ‘certification’.
Through an spectator survey it is possible to assess the percentage of spectators reporting a positive change in their behaviour as consequence of positive environmental practices of the event, such as avoiding the use of single use plastic and actively recycling waste.
40% of events stated they had public commitments to environmental policies
Data gathering – Timing
Timeline of event hosting
OUTCOMESINPUTS
Short-term impacts Long-term impactsForecasted impacts
Event held Post-eventHosting decision
Reference KPI name Unit Sport for SDG reference
Input/Output/Outcome
EN-EP1.1 Public commitment to environmental policies Yes/No NA Input
EN-EP1.2 Measurement of carbon footprint in place Yes/No NA Input
EN-EP2.1 ISO20121 accreditation Yes/No S13.1 Output
EN-EP2.2% of spectators reporting a positive change in behaviour
% S12.12 Output
ExampleData gathering
Example statement: I have been inspired to act more environmentally responsible (e.g. avoiding single-use plastic, recycling waste) as a result of [the event]
Strongly disagree
Disagree
Neither agree nor disagree
Agree
Strongly agree
MEASURING THE IMPACT OF EVENTS
84 A S O I F

Explanation
A formal strategy in place to encourage spectators to use sustainable transport such as public transportation and bicycles, walking and electric cars or bikes. This strategy should be documented during the event’s planning phase and made available for audit.
Spectator surveys can be used to calculate the percentage of spectators using public or sustainable transport for the majority of their journey.
Data gathering – Timing
Timeline of event hosting
OUTCOMESINPUTS
Short-term impacts Long-term impactsForecasted impacts
Event held Post-eventHosting decision
Transport
Introduction and “theory of change”
Transport, by event workforce, participants and spectators, can be a large contributor to costs, greenhouse gas emissions, and reduced air quality. Encouraging people to use more sustainable transport modes to get to and from events can reduce greenhouse gas emissions, traffic congestion, travel time and parking issues.
To mitigate this specific environmental impact event organisers can encourage the use of sustainable transport through specific action in collaboration with local authorities.
Contributing towards:
◥ SDG TARGET 3.4 - By 2030, provide accessto safe, affordable, accessible and sustainabletransport systems for all, improving road safety,notably by expanding public transport, withspecial attention to the needs of those invulnerable situations, women, children,persons with disabilities and older persons
◥ SDG INDICATOR 11.2.1 - Proportion ofpopulation that has convenient access topublic transport, by sex, age and personswith disabilities
Reference KPI name Unit Sport for SDG reference
Input/Output/Outcome
EN-T1.1Strategy in place to encourage workforce, attendees and spectators to use sustainable transport
Yes/No NA Input
EN-T2.1% of spectators using public or sustainable transport
% S11.9 Output
85A S O I F
MEASURING THE IMPACT OF EVENTS

Explanation
A waste management plan is a documented plan that details the expected amount and type of waste that will be produced by the event and how it will be reused, recycled or disposed of. The assessment of this measure can be based on evidence on meeting core requirements of recognised national or international guidance.
The calculation of the percentage of event waste diverted from landfill or incinerators (eg recycled or composted) should be based on data collected during the event and is relevant to assess whether the event has achieved “zero waste” status. According to the Zero Waste International Alliance, “zero waste events” must have a waste diversion rate of 90% or more.
(Ref: Zero Waste International Alliance33)
Data gathering – Timing Timeline of event hosting
OUTCOMESINPUTS
Short-term impacts Long-term impactsForecasted impacts
Event held Post-eventHosting decision
Waste
Introduction and “theory of change”
Due to their temporary nature, waste is a significant environmental impact arising from events. Therefore, organisers and host venues need to proactively put in place measures to mitigate negative impacts, and in doing so, can demonstrate leadership for ongoing good practice by organisations and individuals after events have finished.
Contributing towards:
◥ SDG TARGET 12.5 - By 2030, substantially reduce waste generation through prevention, reduction, recycling and reuse
◥ SDG INDICATOR 12.5.1 - National recycling rate, tons of material recycled
Reference KPI name Unit Sport for SDG reference
Input/Output/Outcome
EN-W1.1 Waste management plan in place Yes/No S12.1 Input
EN-W2.1 % of event waste diverted from landfill % NA Output
33 https://www.zwia.org/policies/
MEASURING THE IMPACT OF EVENTS
86 A S O I F

Example from Göteborgsvarvet Half Marathon
Göteborgsvarvet continually works towards improving the way it handles waste products during the week of the Half Marathon and try to recycle as much as possible. Every year the percentage that is recycled increases and what is not recycled is sent to an energy-from-waste facility where renewable energy or district heating is produced. Conveniently placed in the event
area are recycling stations and bins for cans and plastic bottles. In 2019, they also had volunteers helping them increase the amounts recycled. Volunteers at three drink stations recycle all the paper cups used in the event. Their goal is to increase the number of stations that recycle papers mugs every year. All of the clothes that are left behind at the start and finish line after the race are donated to charity.
Göteborgsvarvet Half Marathon first became environmentally certified in 2013 by the City of Gothenburg. In order to further develop and improve their efforts as well as incorporate all three dimensions of sustainable development, they decided to aim for the ISO 20121 certification in 2015 which they achieved during the spring of 2016.
MEASURING THE IMPACT OF EVENTS

Explanation
A renewable energy plan is an action plan that provides details on a set of measures planned to ensure that the event meets a renewable energy use target (defined according to the specific location). The assessment of this measure can be done based on evidence on the plan meeting core requirements of recognised national or international guidance on renewable energy.
To assess whether or not the plan has been implemented successfully a basic measure is the calculation of the percentage of the energy used that was generated from natural and renewable resources that can be replenished, as opposed to being generated by finite resources such as oil and coal.
Data gathering – Timing Timeline of event hosting
OUTCOMESINPUTS
Short-term impacts Long-term impactsForecasted impacts
Event held Post-eventHosting decision
Energy
Introduction and “theory of change”
Energy use during the preparation and delivery of a major events takes different forms, whether from the construction of venues, energy consumed by spectators travelling to an event, or energy used in running event venues. Event organisers can minimise negative environmental impacts by minimising the proportion of this energy developed through the use of fossil fuels which create contribute towards climate change from greenhouse gas emissions.
Contributing towards:
◥ SDG TARGET 7.2 - By 2030, increase substantially the share of renewable energy in the global energy mix
◥ SDG TARGET 13.2 - Integrate climate change measures into national policies, strategies and planning
Reference KPI name Unit Sport for SDG reference
Input/Output/Outcome
EN-E1.1 Renewable energy plan in place Yes/No NA Input
EN-E2.1 % of energy used from renewable sources % S12.9 Output
MEASURING THE IMPACT OF EVENTS
88 A S O I F

Explanation
A Sustainable Procurement Code outlines the expectations and requirements on suppliers and contractors, and their supply chains, when undertaking work on behalf of the event. It can include expectations for complying with local laws and regulations, respecting internationally recognised human and labour rights and also applying values and standards for wider aspects of sustainability and fairness.
Monitoring the percentage of contracts awarded that comply with sustainability standards is an output measure assessing the effective implementation of local or national requirements, such as those set out in a Sustainable Procurement Code.
A specific area of procurement visible to the spectators is the supply of food and drink. Therefore, another output measure is the proportion of food and drink ethically sourced, e.g. seasonal catering, local and regional suppliers and eco-labelled or organic products.
Data gathering – Timing Timeline of event hosting
OUTCOMESINPUTS
Short-term impacts Long-term impactsForecasted impacts
Event held Post-eventHosting decision
Procurement
Introduction and “theory of change”
Having a sustainable procurement code in place for all products and services required for the planning and delivery of an event is important to showcase the event owner’s and stakeholders’ commitment to resource efficiency, environmental stewardship and corporate responsibility.
Contributing towards:
◥ SDG TARGET 12.6 - Encourage companies, especially large and transnational companies, to adopt sustainable practices and to integrate sustainability information into their reporting cycle
◥ SDG TARGET 12.7 - Promote public procurement practices that are sustainable, in accordance with national policies and priorities
◥ SDG INDICATOR 12.6.1 - Number of companies publishing sustainability reports
Reference KPI name Unit Sport for SDG reference
Input/Output/Outcome
EN-P1.1Sustainable Procurement Code in place for all products and services
Yes/No S12.2 Input
EN-P2.1% of contracts awarded that comply with sustainability standards
% S12.10 Output
EN-P2.2 % of event food & drink ethically sourced % NA Output
ExampleDefinitions
The IOC has published guidance34 on Sustainable Sourcing in Sport and it includes a template for a Sustainable Procurement Code on page 78 of this guidance.
34 http://stillmed.olympics.com/media/Document%20Library/OlympicOrg/IOC/What-We-Do/celebrate-olympic-games/Sustainability/
sustainability-essentials/SUSTAINABILITY-ESSENTIALS-ISSUE-3-final.pdf
89 A S O I F
MEASURING THE IMPACT OF EVENTS

Explanation
Local environmental initiatives in place relate to the activity formally linked to the event addressing local or national environmental issues or objectives. There may be initiatives in place to maintain (or increase) biodiversity and preserve the ecological landscape. Event organisers may be able to align with these initiatives and positively contribute to related objectives.
The number of initiatives delivered addressing local environments and biodiversity is an output measure indicating the level of involvement of event organisers in preserving and positively impacting local environments.
Data gathering – Timing
Timeline of event hosting
OUTCOMESINPUTS
Short-term impacts Long-term impactsForecasted impacts
Event held Post-eventHosting decision
Landscape & Biodiversity
Introduction and “theory of change”
Many sporting events are held within the natural environment, rather than just purpose-built stadia. From the planning phase, events should seek to protect ecosystems and minimise negative environmental impacts to landscape and biodiversity. Open spaces created as part of new construction for major events can have a significant impact on local ecosystems. Healthy ecosystems provide numerous benefits, such as amenity, mitigation against urban heat island effects, flood alleviation, soil stability, improved air quality and soundscape, and food production.
Contributing towards:
◥ SDG TARGET 15.5 - Take urgent and significantaction to reduce the degradation of natural habitats,halt the loss of biodiversity and protect and preventthe extinction of threatened species
Reference KPI name Unit Sport for SDG reference
Input/Output/Outcome
EN-LB1.1 Local environmental initiatives in place Yes/No NA Input
EN-LB2.1No. of initiatives delivered addressing local environments & biodiversity
Initiatives NA Output
MEASURING THE IMPACT OF EVENTS
90 A S O I F


Chapter
10

Further DevelopmentsThe Common Indicators and guidance included in this report are intended to apply to events of all sizes and characteristics. As Chapter 4 describes, the Input and Output KPIs are core basic data which professionals can use to produce more detailed analysis, such as the Outcome KPIs.
The value of the Common Indicators will become clearer as more events gather and report data for these Common Indicators. As part of the consultation process the events rights owners, host organisations and evaluation specialists provided the following feedback to help consistently implement the Common Indicators:
◥ Adopting the common KPIs should be voluntary but it is important that major organisations show leadership to the project
◥ A simple “toolkit” to help National Associations and local stakeholders implement them would be welcomed, and could be included in Host Contract documentation
◥ There is interest in data from “core KPIs” being made available for all rights owners and event hosts via a central database which is a collaboration of both sides
◥ There is interest in possible official certification, similar to ISO, to establish universal acceptance of the common KPIs
In addition, to help build on this work and move towards a commonly adopted methodology for valuing “intangible” social impacts, the academic specialists consulted in the project recommend the following:
◥ For measuring social value it is important to focus on core outcome objectives (e.g. improving residents’ quality of life) and have theory of change which demonstrates how events contribute to outcomes
◥ There should be established measures at local community level consistently gathered over time, to understand the causal effect of events
◥ Technology could be used to cost effectively gather data
◥ Academic institutions could support future longitudinal research, e.g. with funded PhD research
◥ An “open source” structure would help allow transparency and challenge for research into possible approaches for valuing social impact
◥ It could be beneficial for rights owners and event hosts to co-fund future development, possibly through an independent body
ASOIF and the project consultees and now considering possible next steps to build on the work contained in this report, such as periodically updating the content, reporting aggregated data and further collaboration with international bodies on research to provide the industry with practical benchmarks and independent validation of data for use in Outcome calculations of “intangible” impacts.
93 A S O I F
MEASURING THE IMPACT OF EVENTS

Appendix

Summary tables of the recommended Common Indicators
Reference KPI name Unit Sport for SDG reference
Input/Output/Outcome indicator
EC-OUTCOME1a Total additional visiting spectator expenditure Currency NA Outcome
EC-OUTCOME1b Total additional visiting “attendee” expenditure Currency NA Outcome
EC-OUTCOME1c Net organiser expenditure Currency NA Outcome
EC-OUTCOME2 GDP impact of hosting an event Currency S8.13 Outcome
EC-OUTCOME3Value of trade deals attributed to hosting the event
Currency S8.14 Outcome
EC-S1.1 No. of event days Days NA Input
EC-S1.2 No. of event venues Venues NA Input
EC-S2.1No. of unique spectators from outside host economy
People NA Output
EC-S2.2 Average length of stay in the host economy Days NA Output
EC-S2.3Total bed nights in paid accommodation by visiting spectators
Nights S8.9a Output
EC-P1.1 Planned no. of nations participating Nations NA Input
EC-P1.2 Planned no. of athletes participating People NA Input
EC-P2.1No. of visiting attendees who are not athletes or spectators
People NA Output
EC-P2.2 Total bed nights by visiting “attendees” Nights S8.9b Output
EC-OE1.1 Total budgeted event expenditure Currency NA Input
EC-OE1.2Proportion of event budget funded by the public sector
% S17.15 Input
EC-OE2.1 Value of contracts to local suppliers Currency S8.16 Output
EC-OE2.2Proportion of event costs funded by commercial revenue
Currency S17.12 Output
EC-IN1.1Total planned investment in infrastructure for long-term use
Currency S11.10 Input
EC-IN2.1Money invested in venues & equipment for long-term use
Currency S8.15 Output
EC-IN2.2 Money invested in transport for long-term use Currency S11.11 Output
95A S O I F
MEASURING THE IMPACT OF EVENTS

Reference KPI name Unit Sport for SDG reference
Input/Output/Outcome indicator
IM-OUTCOME1Increase in partner brand value as a result of the event
Currency NA Outcome
IM-OUTCOME2 Value of new visitors as a result of the event Currency NA Outcome
IM-B1.1 Total potential TV household reach Households NA Input
IM-B1.2No. of planned international broadcast territories
Nations NA Input
IM-B2.1 Digital broadcast views (by session) Views NA Output
IM-B2.2% of broadcast hours with gendered content dedicated to females
% S5.6 Output
IM-B2.3 % share of TV viewing audience (by market) % NA Output
IM-B2.4Advertising Value Equivalent of broadcast media coverage
Currency S8.6 Output
IM-SM1.1No. of social followers of the event/event-owner (by channel)
Followers NA Input
IM-SM1.2No. of social media followers of event athletes (by channel)
Followers NA Input
IM-SM2.1No. of impressions of event-related content (by channel)
Impressions NA Output
IM-SM2.2 No. of event-related posts (by channel) Posts NA Output
IM-SM2.3No. of engagements of event-related content (by channel)
Engagements NA Output
IM-SM2.4 No. of new contacts due to the event Contacts NA Output
IM-P1.1Plan in place to promote the event to targeted audiences
Yes/No NA Input
IM-P2.1No. of accredited media representatives attending the event
People NA Output
IM-P2.2 No. of event-related articles (by market) Articles NA Output
IM-P2.3% of articles with gendered content dedicted to females
% S5.5 Output
IM-P2.4 No. of unique website users People NA Output
IM-EE2.1 % of spectators satisfied % NA
IM-EE2.2 Net Promoter Score of spectators Score NA Output
IM-EE2.3 % likelihood to revisit (spectators) % NA Output
IM-EE2.4 % likelihood to visit (viewers) % NA Output
MEASURING THE IMPACT OF EVENTS
96 A S O I F
Output

Reference KPI name Unit Sport for SDG reference
Input/Output/Outcome indicator
SO-OUTCOME1Perceived benefit by local residents, expressed in financial terms
Currency NA Outcome
SO-OUTCOME2% change in community outcomes, e.g. reduction in crime rates during event
% S16.9 Outcome
SO-CE1.1Targeted local community engagement plan in place
Yes/No NA Input
SO-CE2.1No. of local residents viewed or followed the event
People NA Output
SO-CE2.2 Proportion of local residents proud % S10.8 Output
SO-CE2.3Proportion of local attendees more happy as a result of the event
% NA Output
SO-V1.1 Total planned no. of volunteers People NA Input
SO-V2.1No. of volunteers from target segments of local population
People NA Output
SO-V2.2Average no. of hours volunteering per person
Hours NA Output
SO-A1.1Planned no. of attendees at free activity related to the event
People NA Input
SO-A2.1No. of attendees from target segments of local population
People NA Output
SO-A2.2 Average no. of hours attending per person Hours NA Output
SO-O1.1Planned no. of participants in outreach programmes
People NA Input
SO-O1.2Local community groups benefiting from outreach activity
Yes/No NA Input
SO-O2.1No. of participants from target segments of local population
People NA Output
SO-O2.2Average no. of hours participating per person
Hours NA Output
SO-DI1.1 Equal opportunity policy in place Yes/No S10.2 Input
SO-DI1.2 Athlete gender pay ratio M/F %/% NA Input
SO-DI2.1 % participants female % NA Output
SO-DI2.2 % participants from minority communities % NA Output
SO-DI2.3 % participants disabled % Cat 1.16 Output
SO-SD1.1 Targeted skills development plan in place Yes/No NA Input
SO-SD1.2Public commitment to meeting international labour rights standards
Yes/No NA Input
SO-SD2.1 No. of people trained in new skills People NA Output
SO-SD2.2No. of people from target segments trained in new skills
People NA Output
97A S O I F
MEASURING THE IMPACT OF EVENTS

Reference KPI name Unit Sport for SDG reference
Input/Output/Outcome indicator
SP-OUTCOME1No. of new participants in activity as a result of the event
People NA Outcome
SP-OUTCOME2Quantified value of health benefits resulting from new participation
Currency NA Outcome
SP-SD1.1Plan in place to increase capacity of local or national sports organisations
Yes/No NA Input
SP-SD2.1 Money invested in grassroots programmes Currency NA Output
SP-SD2.2Money invested in sport & recreation space for long-term use
Currency S11.7 Output
SP-SP1.1Plan in place to promote sport & physical activity to targeted audiences
Yes/No NA Input
SP-SP2.1% residents inspired to do more sport/physical activity
% S3.9 Output
EN-OUTCOME1Net event carbon footprint (split renewable & offset)
CO2 S12.11 Outcome
EN-EP1.1 Public commitment to environmental policies Yes/No NA Input
EN-EP1.2 Measurement of carbon footprint in place Yes/No NA Input
EN-EP2.1 ISO20121 accreditation Yes/No S13.1 Output
EN-EP2.2% of spectators reporting a positive change in behaviour
% S12.12 Output
EN-T1.1Strategy in place to encourage attendees to use sustainable transport
Yes/No NA Input
EN-T2.1% of spectators using public or sustainable transport
% S11.9 Output
EN-W1.1 Waste management plan in place Yes/No S12.1 Input
EN-W2.1 % of event waste diverted from landfill % NA Output
EN-E1.1 Renewable energy plan in place Yes/No NA Input
EN-E2.1 % of energy used from renewable sources % S12.9 Output
EN-P1.1Sustainable Procurement Code in place for all products and services
Yes/No S12.2 Input
EN-P2.1% of contracts awarded that comply with sustainability standards
% S12.10 Output
EN-P2.2 % of event food & drink ethically sourced % NA Output
EN-LB1.1 Local environmental initiatives in place Yes/No NA Input
EN-LB2.1No. of initatives delivered addressing local environments & biodiversity
Initiatives NA Output
MEASURING THE IMPACT OF EVENTS
98 A S O I F

Photos:
IAAF/AL-Bank World Half Marathon Championships 2014, Copenhagen, Denmark. Image shared by IAEH member Sport Event Denmark.
World Curling Men’s Championship, Canada. Image shared by World Curling Federation.
World Athletics Championships 2017, London, UK. Image shared by World Athletics.
The Gold Coast Marathon. Image shared by IAEH member Tourism & Events Queensland.
Total BWF – Badminton World Championships 2019 in Basel, Switzerland. Image shared by Badmintonphoto/BWF.
Sweden Horse Show. Image shared by IAEH member Visit Stockholm.
World Athletics Championships 2017, London, UK. Image shared by World Athletics.
Volvo Ocean Race 2018 in Gothenburg, Sweden. Photo by Dino Soldin. Image shared by IAEH member Göteborg & Co.
The 2019 Solheim Cup at Gleneagles. Photo by Stewart Attwood. Image shared by IAEH member VisitScotland.
Gothia Cup Opening Ceremony in Gothenburg, Sweden. Image shared by IAEH member Göteborg & Co.
Women’s Hockey World Cup 2018, London, UK. Image shared by IAEH member UK Sport.
Die Finals, Berlin, 2019. Copyright: P. Becerra – SenInnDS. Image shared by IAEH member Sports Metropolis Berlin.
World Athletics Championships 2017, London, UK. Image shared by IAEH member UK Sport.
2020 Tour de Taiwan, Chinese Taipei Cycling Association. Image shared by IAEH member The Sports Administration, Ministry of Education, R.O.C. (Taiwan).
Göteborgsvarvet Annual Half Marathon 2019, Gothenburg, Sweden. Photo by Glenn T Unger. Image shared by IAEH member Göteborg & Co.
Tokyo 2020 Olympic Games, Image shared by the International Olympic Committee.
Getty Images
Shutterstock
Design:
Touchline (www.touchline.com)

ASOIF
Association of Summer Olympic International FederationsMaison du Sport International Av. de Rhodanie 54, 1007 Lausanne - Switzerland
Tel.: +41 21 601 48 88 Fax: +41 21 601 48 89 Email: [email protected] www.asoif.com
Related Documents