G. N. Pontikakis G. S. Konstantas A. M. Stamatelos 1 e-mail: [email protected] Mechanical and Industrial Engineering Department, University of Thessaly, 383 34 Volos, Greece Three-Way Catalytic Converter Modeling as a Modern Engineering Design Tool The competition to deliver ultra low emitting vehicles at a reasonable cost is driving the automotive industry to invest significant manpower and test lab resources in the design optimiza tion of increa singly complex exhaust aftertr eatment systems. Optimization can no longer be based on traditional approaches, which are intensive in hardware use and lab testing. This paper discusses the extents and limitations of applicability of state-of-the-art mathematical models of catalytic converter performance. In-house software from the au- thors’ lab, already in use during the last decade in design optimization studies, updated with recent, important model improvements, is employed as a reference in this discussion. Emphasis is on the engineeri ng methodo logy of the computa tional tools and their appli- cati on, whi ch covers qua lity assu rance of inpu t dat a, adva nced para met er esti mat ion proce dures, and a suggested performa nce measur e that drives the paramete r estimati on code to optimum results and also allows a less subjective assessment of model prediction accuracy. Extensive comparisons between measured and computed instantaneous emis- sions over full cycles are presented, aiming to give a good picture of the capabilities of state of the art engineering models of automotive catalytic converter systems. DOI: 10.1115/1.1787506 Introduction The catalytic converter has been in use for the past 30 years as an efficient and economic solution for the reduction of pollutants emi tted by the internal combustion engine, the latter bein g the powertrain for almost all vehicles in use today. The widespread use of the catalytic converter was the response of the automotive indust ry to the legi slat ion of develop ed countri es, which pos es limits to the most important gaseous pollutants emitted by both gasoline and diesel engines. Since the concern about the environmental impact of the emis- sions of the vehicles fleet is steadily growing—espe cially in urban areas, where air pollution has become a major issue—emission legisla tion becomes gradually stricter . Accordingly , this has led to continuous efforts of the automotive industry to improve the effi- ciency of the catalytic converter 1. Today’s emission standards have been lowered so much that the catalytic converter technol- ogy has been pushed to its limits and it became apparent that, in order to build vehicles that comply with the legislation, automo- tive engineers should tune the whole system of engine, piping, and catalyti c convert er 2. Thus there emerged the need to view the catalytic converter as a component of an integrated exhaust after- treatment system that should be designed very accurately. In this context, the role of modeling of the components of ex- haust aftertreatment systems is becoming increasingly important, especia lly as regards the cata lyti c converter, which is the mos t crucial device of such systems. Since the introduction of catalytic converters in product ion vehicles, catalytic converte r models have been appearing in the literature in parallel with the development of new catalytic converter technologies. Nevertheless, the accu- racy, reliability, and application range of catalytic converter mod- els is still questioned. The number of modeling applications in the automotive industry remains limited, especially when contrasted to the plethora of models that appear in the literature 3–15. It seems that a complica ted landscape of approach es and method olo- gies has been created, causing an uncertainty as regards their va- lidity and applicab ility . Most probably , this adversely affects their applica tion in ever yday prac tice , alth ough modern mod eling methodologies have been greatly improved and, in many cases, they have been success fully incorpor ated in the process of exhaus t aftertr eatment systems design 16–20. In what follows, we attempt to inverse this situation, first by sketching an overvie w of modeling approaches that could help the navigation through the complicated landscape of this field of re- sea rch. Subseq uently , we pre sent our choice of mod eling ap- proaches along with some supporting tools, in order to compile a complete methodology that provides the required high accuracy levels for the current state-of-the-art exhaust aftertreatment sys- tems design. This methodology combines a significantly updated version of the CATRAN 21 modeling code with optimiza tion tools tailored to the computer-aided estimation of the model’s chemical kinetics parameters. The first steps of the developed optimization methodology have already been presented elsewhere 22. Here we update and enhance it by incorporating recent improvements of the catalytic converter model and better integration with the supporting tools. Navigation in the Modeling Landscape A great number of models have been presen ted unt il toda y, featuring a multitude of approaches and levels of modeling detail. The diversity of published works on the field indicates that no definite answers have been given to the catalytic converter mod- eling problem 23. There are several reasons for this situation: • Modeling objectives and application range . Not all published works share common objectives and applicati on range, varying from fast, approximate models to very detailed, computationally intensive models. Fundamental research models formulation usu- ally attempts to des crib e phe nomena as accu rate ly as possible, require a lot of input data and usually can be tested only in ex- tremely simplified catalyst behavior scenarios. For application- oriente d models , for mul ation depe nds on the system or device where modeling is applied as well as the design parameters under investigation. In this case, accuracy may be sacrificed because of constraints such as simplicity or flexibility. 1 Author to whom correspondence should be addressed. Contributed by the Internal Combustion Engine Division of T HE AMERICAN SO- CIETY OF MECHANICAL ENGINEERS for publication in the ASME JOURNAL OF ENGINEERING FOR GAS TURBINES AND POWER. Manuscript received by the ICE Division, December 1, 2002; final revision received September 1, 2003. Associate Editor: D. Assanis. 906 Õ Vol. 126, OCTOBER 2004 Copyright © 2004 by ASME Transactions of the ASME

Welcome message from author
This document is posted to help you gain knowledge. Please leave a comment to let me know what you think about it! Share it to your friends and learn new things together.
Transcript
8/14/2019 ASME_Oct04.pdf
http://slidepdf.com/reader/full/asmeoct04pdf 1/18
G. N. Pontikakis
G. S. Konstantas
A. M. Stamatelos1
e-mail: [email protected]
Mechanical and Industrial Engineering
Department,
University of Thessaly,
383 34 Volos, Greece
Three-Way Catalytic ConverterModeling as a ModernEngineering Design ToolThe competition to deliver ultra low emitting vehicles at a reasonable cost is driving the
automotive industry to invest significant manpower and test lab resources in the designoptimization of increasingly complex exhaust aftertreatment systems. Optimization can nolonger be based on traditional approaches, which are intensive in hardware use and labtesting. This paper discusses the extents and limitations of applicability of state-of-the-art mathematical models of catalytic converter performance. In-house software from the au-thors’ lab, already in use during the last decade in design optimization studies, updated with recent, important model improvements, is employed as a reference in this discussion.
Emphasis is on the engineering methodology of the computational tools and their appli-cation, which covers quality assurance of input data, advanced parameter estimation
procedures, and a suggested performance measure that drives the parameter estimationcode to optimum results and also allows a less subjective assessment of model predictionaccuracy. Extensive comparisons between measured and computed instantaneous emis-sions over full cycles are presented, aiming to give a good picture of the capabilities of state of the art engineering models of automotive catalytic converter systems.DOI: 10.1115/1.1787506
Introduction
The catalytic converter has been in use for the past 30 years as
an efficient and economic solution for the reduction of pollutants
emitted by the internal combustion engine, the latter being the
powertrain for almost all vehicles in use today. The widespread
use of the catalytic converter was the response of the automotive
industry to the legislation of developed countries, which poses
limits to the most important gaseous pollutants emitted by both
gasoline and diesel engines.
Since the concern about the environmental impact of the emis-
sions of the vehicles fleet is steadily growing—especially in urban
areas, where air pollution has become a major issue—emission
legislation becomes gradually stricter. Accordingly, this has led to
continuous efforts of the automotive industry to improve the effi-
ciency of the catalytic converter 1. Today’s emission standards
have been lowered so much that the catalytic converter technol-
ogy has been pushed to its limits and it became apparent that, in
order to build vehicles that comply with the legislation, automo-
tive engineers should tune the whole system of engine, piping, and
catalytic converter 2. Thus there emerged the need to view the
catalytic converter as a component of an integrated exhaust after-
treatment system that should be designed very accurately.
In this context, the role of modeling of the components of ex-
haust aftertreatment systems is becoming increasingly important,
especially as regards the catalytic converter, which is the most
crucial device of such systems. Since the introduction of catalytic
converters in production vehicles, catalytic converter models havebeen appearing in the literature in parallel with the development
of new catalytic converter technologies. Nevertheless, the accu-
racy, reliability, and application range of catalytic converter mod-
els is still questioned. The number of modeling applications in the
automotive industry remains limited, especially when contrasted
to the plethora of models that appear in the literature 3–15. It
seems that a complicated landscape of approaches and methodolo-gies has been created, causing an uncertainty as regards their va-lidity and applicability. Most probably, this adversely affects theirapplication in everyday practice, although modern modelingmethodologies have been greatly improved and, in many cases,they have been successfully incorporated in the process of exhaustaftertreatment systems design 16–20.
In what follows, we attempt to inverse this situation, first bysketching an overview of modeling approaches that could help thenavigation through the complicated landscape of this field of re-search. Subsequently, we present our choice of modeling ap-proaches along with some supporting tools, in order to compile a
complete methodology that provides the required high accuracylevels for the current state-of-the-art exhaust aftertreatment sys-tems design. This methodology combines a significantly updatedversion of the CATRAN 21 modeling code with optimization toolstailored to the computer-aided estimation of the model’s chemicalkinetics parameters. The first steps of the developed optimizationmethodology have already been presented elsewhere 22. Herewe update and enhance it by incorporating recent improvementsof the catalytic converter model and better integration with thesupporting tools.
Navigation in the Modeling Landscape
A great number of models have been presented until today,featuring a multitude of approaches and levels of modeling detail.The diversity of published works on the field indicates that no
definite answers have been given to the catalytic converter mod-eling problem 23. There are several reasons for this situation:• Modeling objectives and application range. Not all published
works share common objectives and application range, varyingfrom fast, approximate models to very detailed, computationallyintensive models. Fundamental research models formulation usu-ally attempts to describe phenomena as accurately as possible,require a lot of input data and usually can be tested only in ex-tremely simplified catalyst behavior scenarios. For application-oriented models, formulation depends on the system or devicewhere modeling is applied as well as the design parameters underinvestigation. In this case, accuracy may be sacrificed because of constraints such as simplicity or flexibility.
1Author to whom correspondence should be addressed.
Contributed by the Internal Combustion Engine Division of THE AMERICAN SO-CIETY OF MECHANICAL ENGINEERS for publication in the ASME J OURNAL OF
ENGINEERING FOR G AS TURBINES AND POWER. Manuscript received by the ICE
Division, December 1, 2002; final revision received September 1, 2003. Associate
Editor: D. Assanis.
906 Õ Vol. 126, OCTOBER 2004 Copyright © 2004 by ASME Transactions of the ASME

8/14/2019 ASME_Oct04.pdf
http://slidepdf.com/reader/full/asmeoct04pdf 2/18

8/14/2019 ASME_Oct04.pdf
http://slidepdf.com/reader/full/asmeoct04pdf 3/18
cycles are supposed to create repeatable emission measurement
conditions and, at the same time, simulate a real driving condition
of a given application.
Consequently, the primary objective of the automotive industry
is to build cost-effective exhaust lines that will enable the vehicle
to succeed in the legislated driving cycle tests. Because of the
increasingly stringent emission standards, we observe a trend to-
wards more complicated exhaust lines. For successful design, the
engineer must consider not only the catalytic converter but, in-
stead, the exhaust line engine settings and control–exhaust
piping–catalytic converter as a system—an exhaust aftertreat-
ment system. This progressively makes the experimental testing of the exhaust line more difficult and more expensive, requiring
more time and experimental data to tune it appropriately.
In order to decrease cost and design time for development,
modeling of the whole exhaust aftertreatment system would be
extremely helpful. If fast, reliable models were available to the
industry, new exhaust line configurations could be tested rapidly
and at a reasonable cost; additionally, optimization of the exhaust
line components could be aided by numerical optimization proce-
dures to achieve improved configurations and lower overall emis-
sions. The underlying notion is the incorporation of computer-
aided engineering CAE practices in the design of exhaust lines,
which is currently under way in the automotive industry.
Consequently, the targets for the exhaust line modeling are set
by the industry. Currently, an indicative wish list for an idealmodeling tool of the kind is the following:
• Reliability. It should be cross checked and validated thor-
oughly in real-world case studies before conclusions and design
decisions can be drawn using it.
• Speed . It should run reasonably fast that is, faster than real
time, with common computer equipment so that it can be tested,
adjusted, and used within the time and cost constraints of the
automotive industry.
• Versatility. It should be easy to modify and apply to different
system configurations, in order to enable their assessment and
tuning.
• Ease of use. It should be easy to validate and use by automo-
tive engineers who are not modeling experts.
• Minimum input data. It should require input data that may be
acquired by routine experiments, in order to keep cost low and toprevent input data uncertainty and errors.
• Simplicity. It should follow the fundamental engineering rule
of thumb to keep complexity low. In this way, engineers–users
can easily have control over their modeling tools and easily gain
insight to model behavior and results.
Traditionally, modeling tools and CAE procedures in general
are used in many areas of automobile design. The modeling of the
catalytic converter proved to be a very complex problem, though,
and this area resisted the extensive application of modeling. As of
today, such modeling tools are not fully accepted in the field of
catalytic converter optimization, let alone the CAE-driven design
of the whole exhaust line.
Nevertheless, progress on this field of research is fast. The au-
tomotive industry clearly identifies the importance of modeling
tools and recent improvements of catalytic converter models are aresponse to this trend. Below, we present some work in this direc-
tion. We employ an updated version of a catalytic converter mod-
eling code, which has been continuously developed since 1996
10 and has been employed on various design projects. The soft-
ware is combined with the development of a performance measure
for the assessment of modeling quality, which is utilized within a
genetic algorithm optimization procedure for the computer-aided
estimation of reaction kinetics parameters. Our purpose is to pro-
vide a demonstration of the role and applicability of current mod-
eling software in the design process of modern exhaust aftertreat-
ment systems.
Model Description
Below, we present an updated version of the CATRAN catalyticconverter model. The model’s design concept is the minimizationof degrees of freedom and the elimination of any superfluouscomplexity in general. The main features of the model are thefollowing:
• transient, one-dimensional temperature profile for the solidphase of the converter reactor level modeling;
• quasisteady, 1D computation of temperature and concentrationaxial distributions for the gaseous phase channel level modeling;
• simplified reaction scheme featuring a minimum set of redox
reactions and an oxygen storage submodel washcoat level mod-eling.
Below, the detailed description of model formulation is givenfor each modeling level.
Washcoat Level Modeling. The first task of washcoat mod-eling is to define how the simultaneous phenomena of diffusionand reaction in the washcoat will be taken into account. What willbe adopted in this work is the ‘‘film model’’ approach, which isthe simplest and most widely used one e.g., Refs. 9, 11. Thefilm model approximates the washcoat with a solid–gas interface,where it is assumed that all reactions occur. This approximationessentially neglects diffusion effects completely, and assumes thatall catalytically active cites are directly available to gaseous-phasespecies at this solid–gas interface.
This has been questioned by Zygourakis and Aris 24 andHayes and Kolaczkowski 29. They provide evidence that con-centration gradients in the washcoat are present and may signifi-cantly affect the operation of the monolithic converter, especiallyin high temperatures. Nevertheless, significant complexity is in-troduced in the models in order to explicitly consider diffusion inthe washcoat. Therefore washcoat diffusion is not implementedhere and its effect is lumped into the kinetic parameters of themodel.
The approximation for the solid–gas interface states that allspecies that diffuse to it through the boundary layer are removedfrom the gas phase due to reactions:
g
M gk m, jS c jc j ,s R j . (1)
The left-hand side of the above equation describes mass transferthrough the boundary layer of the gas flow. Parameter k m is themass transfer coefficient in the boundary layer, c j denotes speciesconcentration at the gaseous phase, and c s , j is corresponding con-centration at the gas–solid interface. S is the geometrical surfacearea of the washcoat, i.e., channel wall area per channel volume.For a channel with hydraulic diameter d h , we readily find: S 4/ d h .
On the right-hand side of Eq. 1, the rate R j refers to theproduction or consumption of each species at the solid–gas inter-face. For N R reactions, each taking place with a rate r k , the rateof consumption or production of a species j is
R rea, j S k 1
N R
a j, k r k , (2)
where a j ,k is the stoichiometric coefficient of species j in reactionk , is the washcoat thickness, and is the specific catalyst area,i.e., catalytically active area per washcoat volume.
The second task of washcoat modeling is to choose a reactionscheme and the appropriate expressions for the reaction rates r k .We opt for overall reactions, because they provide the user with amore compact and comprehensible reaction scheme and they arecomputationally less expensive. Here, the three-way catalytic con-verter 3WCC will be considered, which is designed for spark-ignition engines exhaust. Below, we briefly discuss what wechoose to implement in this case.
908 Õ Vol. 126, OCTOBER 2004 Transactions of the ASME
8/14/2019 ASME_Oct04.pdf
http://slidepdf.com/reader/full/asmeoct04pdf 4/18

8/14/2019 ASME_Oct04.pdf
http://slidepdf.com/reader/full/asmeoct04pdf 5/18
• The axial diffusion of mass and heat in the gas phase is neg-ligible.
• The mass and heat accumulation in the gas phase is negligible.This comprises the assumption for the quasi-steady-state natureof the problem.
The first assumption is generally accepted and is employed inmost models, e.g., those of Chen et al. 11 and Siemund et al.
9. Only the boundary layer effect on mass transfer is accountedfor, using a mass transfer coefficient k m , which is a function of the Sherwood number. Bulk flow is approximated with plug flowwith uniform temperature T g and species concentrations c j . The
velocity of the flow readily results from the mass flow rate: u z4m / ( d h
2) .
The second assumption is more controversial and both thequasi-steady and the transient approach have been tested in theliterature. Shamim et al. 15 have presented a model that incor-porates transient terms at channel level modeling. On the otherhand, Young and Finlayson 8 and Oh and Cavendish 3 argueabout the validity of the quasi-steady approximation. They pro-vide justification on the basis of the large ratio of thermal to masstime constants of the problem. Following this line of thought, thequasi-steady approach is used here as well, for simplicity and lowcomputational cost.
In order to write the mass balance for the exhaust gas, a meanbulk value c j is employed for the gas–phase concentration of eachspecies. Likewise, a value c s , j is considered for the concentrationof each species at the solid–gas interface. Using the quasi-steady-state approximation and neglecting diffusion and accumulationterms, the mass balance for the gas phase becomes
gu z
c j z
z gk m , jS c j z c s, j z . (5)
Similarly to the above, a mean bulk value T g is used for theexhaust gas temperature, and a solid phase temperature T s is in-troduced for the monolith and the solid–gas interface. Energy istransferred to and from the exhaust gas only due to convectionwith the channel walls. Thus the energy balance for the gas phasebecomes
sc pu z
T g z
z hS T s z T g z . (6)
Parameter h is the heat-transfer coefficient and is calculated as afunction of the Nusselt dimensionless number.
Finally, the boundary conditions for the temperature, mass flowrate, and concentrations are given from measurement at the con-verter’s inlet:
c j t , z0 c j ,in t ,
T g t , z0 T g,in t , (7)
m t , z0 m in t .
The species that are considered in the exhaust gas flow are thefollowing: jCO, O2 , H2 , HCfast, HCslow, NO x , N2 .
Reactor Level Modeling. At the reactor level modeling, heattransfer between channels and between the reactor and its sur-rounding are modeled. The principal issue here is to decide if one-, two-, or three-dimensional modeling of the heat transfershould be employed.
The reactor model presented in this work is a one-dimensionalheat-transfer model for the transient heat conduction in the mono-lith. Heat losses to the environment via convection and radiationare also taken into account. Its primary assumptions are the fol-lowing:
• Heat losses from the front and the rear face of the monolithare neglected. To our knowledge, this is the case with all modelsthat have appeared in the literature.
• Since the catalytic converter is always insulated, simpler mod-els approximate the convert as adiabatic. Heat losses to the sur-rounding are taken into account but, owing to the model’s 1Dnature, they are inevitably distributed uniformly in each mono-lith’s cross section.
• Flow rate and temperature profiles of the exhaust gas at theinlet of the filter are considered uniform. An average value forflow rate and temperature is measured, and gas flow is distributeduniformly to each channel.
The temperature field in the converter is described by the equa-tion of transient heat conduction in one dimension, with heat
sources being convection from the exhaust gas, the enthalpy re-leased from the reactions, and convection to ambient air,
sc p ,s
T s
t k s , z
2T s
z2 hS T gT s
k 1
N R
H k r k Qamb .
(8)
Finally, the boundary condition needed for the solution of the heatconduction equation refers to the heat losses to ambient air:
QambS monhambT sT amb T s4T amb
4 . (9)
Two- and three-dimensional reactor models have also appeared inthe literature, e.g., the models of Heck et al. 34, Chen et al. 11,Zygourakis 35, and Jahn et al. 36. These models are indispens-able if the exhaust gas at the converter inlet exhibits a severelynonuniform flow profile but also require mass flow rate and tem-
perature profiles at the inlet of the catalytic converter. Such dataare not usually available in routine engine-bench or driving cycleconverter tests, which are the main application field for our model.Therefore the 1D approach is preferred, since its modeling detailmatches routine input data quality, provides sufficient accuracy,and has low computational power requirements.
Tuning Procedure
General. The kinetics submodel introduces into the catalyticconverter model a set of parameters that have to be estimated withreference to a set of experimental data. The introduction of tun-able parameters is inevitable regardless of the formulation of thereaction scheme. Tunable parameters take into account the reac-tivity of the specific washcoat formulation as well as any other
aspect of catalytic converter operation that is not included in themodel explicitly.
In the present model, the tunable parameters are the activationenergy E k and the preexponential factor A k that are included in thereaction rate r k of each reaction k . In total, there is a maximumnumber of 20 tunable parameters, however, the values of activa-tion energies are more or less known from Arrhenius plots andthus only the pre-exponential factors are tuned ten tunable pa-rameters. Apart from reaction activity, tunable parameters valuesinclude the approximations that have been done during modelformulation. Among them, the most important are:
• effect of reaction scheme and rate expressions simplifications;• effect of exhaust gas input data uncertainty;• effect of neglection of diffusion in the washcoat;• effect of 1D reactor model approximation.
Since i the rate expressions of the model are empirical and iieffects of model approximations are lumped into the tunable pa-rameters, the latter do not correspond to real kinetic parameters.Rather, they should be viewed as fitting parameters of the model.
The traditional method to tune a model was to manually adjustthe parameters by a trial-and-error procedure, starting from a setof realistic values known from previous experience and modify-ing them gradually, so that the model results compare well withthe measured ones. The usual method for computation versusmeasurement comparison is inspection of plotted results. Thusmanual tuning introduces human intuition and experience in orderto i assess model performance, and ii fit the model to the givenexperimental data. This is a questionable practice because
910 Õ Vol. 126, OCTOBER 2004 Transactions of the ASME

8/14/2019 ASME_Oct04.pdf
http://slidepdf.com/reader/full/asmeoct04pdf 6/18
• inspection is dependent on the scale that results are viewedand it may therefore be misleading;
• there is considerable difficulty to compare the performance of different models that are presented in the literature;
• it does not provide any confidence about the quality of thetuning.
The above drawbacks of manual performance assessment andparameter tuning have led to efforts for the development of acorresponding computer-aided procedure. Since model tuning isessentially a parameter-fitting problem, the underlying idea of allattempts has been to express the problem mathematically as an
optimization problem. This involves the introduction of an itera-tive optimization method, which maximizes or minimizes an ob- jective function that indicates goodness of fit. The objective func-tion required by the optimization procedure is thus a performancemeasure of the model, i.e., a mathematical measure that assesses amodel’s performance in a quantitative manner.
A few attempts for the development of a complete computer-aided tuning methodology have been presented in the past. Mon-treuil et al. 12 were the first to present a systematic attempt forthe tuning of the parameters of their steady-state three-way cata-lytic converter model. Dubien and Schweich 37 also published amethodology to determine the pre-exponential factor and the ac-tivation energy of simple rate expressions from light-off experi-ments. Pontikakis and Stamatelos 7,38 introduced a computer-aided tuning procedure for the determination of kinetic parametersof a three-way catalytic converter model from driving cycle testsbased on the conjugate gradients method. Glielmo and Santini39 presented a simplified three-way catalytic converter modeloriented to the design and test of warm-up control strategies andtuned it using a genetic algorithm.
All of the above efforts used a performance measure based onthe least-squares error 40 between measured and computed re-sults. Except for Glielmo and Santini, all other works are based ongradient-based methods for the optimization of the performancemeasure 41. Gradient methods are faster, more accurate, andmay be used as black-box methods, but assume that the optimiza-tion space is unimodal i.e., it contains a single extremum. Ge-netic algorithms, used by Glielmo and Santini, are better suited tomulti-modal optimization but they are slower, less accurate, andhave to be appropriately adapted to the target problem.
In the present work, we present recent progress that has been
made in the field of computer-aided parameter estimation. It is acontinuation of the work of Pontikakis and Stamatelos 7 andupdates both performance measure definition and optimizationmethodology. In the following sections the requirements that aperformance measure should comply with are presented, and aperformance measure that satisfies these requirements is defined.Finally, a genetic algorithm is applied as an optimization method-ology 23.
Formulation of the Performance Measure. The perfor-mance measure that is formulated below exploits the informationof species concentrations measurements at the inlet and the outletof the catalytic converter. Specifically, it is based on the conver-sion efficiency E j for a pollutant j . Herein, we take into accountthe three legislated pollutants, thus jCO, HC, NO x .
To account for the goodness of computation results comparedwith a measurement that spans over a certain time period, an errore for each time instance must be defined. The latter should givethe deviation between computation and measurement for the con-version efficiency E . Summation over time should then be per-formed to calculate an overall error value for the whole extent of the measurement. Here, the error is defined as
e E E ˆ . (10)
Absolute values are taken to ensure error positiveness. This errordefinition also ensures that 0e1, since it is based on conver-sion efficiency.
The error between computation and measurement is a functionof time and the tunable paremeter vector: ee( t ; ), where isthe formed by the pre-exponential factor and activation energy of each reaction of the model:
A1 , E 1 , A2 , E 2 , . . . , A N P, E N P
T . (11)
We name performance function f (t ; ) f „e(t ; )… a function of the error e, which is subsequently summed over some time period to give the performance measure F . Here, the performance func-tion is defined as
f t n ; e t n ; e max t n
. (12)
Time t take discrete values, t nnt , with t being the discreti-zation interval which corresponds to the frequency data measured.The quantity e max is the maximum error between computation andmeasurement, and it is defined as
emax t nmax E ˆ t n,1 E ˆ t n. (13)
The performance measure can be subsequently formed using somefunction of the sum of the performance function over time:
F F n0
N
f t n ; , N / t . (14)
In this work, we define the performance measure F as the meanvalue of the performance function over the time period of interest:
F 1
N n0
N
f t n ; 1
N n0
N e t n ;
emax t n . (15)
The performance measure defined in Eq. 15 is used for the as-sessment of the performance of each of the three pollutants CO,HC, NO x . The total performance measure is computed as themean of these three values:
F F COF HCF NO x
3 . (16)
The above performance measure presents advantageous featurescompared to the classical least-squares performance measure:
• It ranges between two, previously known, finite extreme val-ues. Extremes correspond to zero and maximum deviation be-tween calculation and experiment.
• The extrema of the performance measure are the same for allphysical quantities that may be used and all different measure-ments where the performance measure may be applied. That is,the performance measure is normalized so that its extrema do notdepend on the either the measured quantities or the experimentalprotocol.
Furthermore, out of the different versions of performance mea-sure tested within the specific genetic algorithm optimization pro-cedure, the specific one gave us the best convergence, without theneed to rely on empirical weight factors 23.
Optimization Procedure. Having defined the performancemeasure for the model, the problem of tunable parameter estima-tion reduces in finding a tunable parameter vector that maxi-mizes F .
The parameter vector is not used directly in the optimizationprocedure. Instead, we perform parameter reparametrization forthe pre-exponential factor A, defined as
A10 A˜ ⇔ A˜ log A (17)
and the transformed tunable parameters vector becomes
˜ A˜ 1 , E 1 , A˜ 2 , E 2 , . . . , A˜ N P
, E N PT . (18)
Then, the problem of tunable parameter estimation is expressed as
Journal of Engineering for Gas Turbines and Power OCTOBER 2004, Vol. 126 Õ 911

8/14/2019 ASME_Oct04.pdf
http://slidepdf.com/reader/full/asmeoct04pdf 7/18
Maximize F ˜ 1F ˜
1
3 N jCO,HC,NO x
n0
N e j t n ; ˜
e j ,max t n , N / t .
(19)
This is a constraint maximization problem, since the componentsof vector are allowed to vary between two extreme values, i.e., i ,min i i,max . Previous experience 7 has shown that the pa-rameter space that results from this problem formulation is multi-modal. Thus an appropriate optimization procedure should beused. Here, a genetic algorithm has been employed for the maxi-mization of Eq. 19. A brief description of the genetic algorithms
operation concept and the main features of the implementationused herein are presented below.
A genetic algorithm is a kind of artificial evolution. Whatevolves is a population of solutions to a problem; each solution isan individual of the population. Individuals are born, mate, repro-duce, are mutated, and die analogously to nature’s paradigm. Thecornerstone of this evolution process is that more fit individualsare given more advantage to live longer and propagate their ge-netic material to the next generations.
The main steps taken by the algorithm are the following:i Initialization. A set of points in the optimization space is
chosen at random. This is the initial population of the geneticalgorithm, with each point corresponding to an individual of thepopulation.
ii Encoding. Each individual is encoded to a finite binary
string chromosome. In brief, each real interval ˜
i,min , ˜
i,max ismapped to the integer interval 0,2 and subsequently transformfrom integer to binary. Then, the chromosome is built by concat-enating the binary strings that correspond to the value of eachparameter i . This encoding is called ‘‘concatenated, multipa-rameter, mapped, fixed-point coding’’ 42.
iii Fitness calculation. The fitness of each individual in thepopulation is computed using Eq. 19. It should be noticed thatfitness calculation requires that the model be called for each indi-vidual, i.e., as many times as the population size.
iv Selection. Random pairs of individuals are subject to tour-nament, that is, mutual comparison of their fitnesses 43. Tour-nament winners are promoted for recombination.
v Recombination (mating). The one-point crossover operator42 is applied to the couples of individuals that are selected for
recombination parents. One-point crossover works on the chro-mosomes binary encodings of the individuals. The resultingchromosomes children are inserted to the population replacingtheir parents and they are decoded to produce their correspondingreal parameter vector.
vi Mutation. A small part of the population is randomly mu-tated, i.e., random bits of the chromosomes change value.
vii Steps iii–vii are repeated for a fixed number of gen-erations or until acceptably fit individual has been produced.
The randomized nature of the genetic algorithm enables it toavoid local extrema of the parameter space and converge towardsthe optimum or a near-optimum solution. It should be noted,though, that this feature does not guarantee convergence to the
global optimum. This behavior is common to all multimodal op-timization techniques and not a specific genetic algorithm charac-teristic.
The implementation of the genetic algorithm that was describedabove is not the only one possible. There are a number of designdecisions and parameters that influence the operation, efficiency,and speed of the genetic algorithm. The present implementation isclassical, though. Its characteristics are summarized in Table 2.
Application Examples
The model’s predictive ability is going to be demonstrated in anumber of typical applications. The first step is to tune the modelfor a specific catalyst configuration in typical driving cycle testand the estimate the kinetic parameters of the model. Successfultuning in this phase implies that i the model incorporates theappropriate degrees of freedom in order to match the measure-ment, ii the tuning methodology is able to tackle the parameterestimation optimization problem successfully, and iii experimen-tal data are in a certain level of accuracy and has been processedthrough a quality assurance procedure 44.
First, a MVEG test is considered, European test cycle. Athree-way catalytic with a 2.4-l volume, two beds, 400 cpsi, 6.5-mil wall thickness, underfloor converter with 50 g/ft3 Pt:Rh 7:1precious metal loading is installed on a passenger car with 2-lengine displacement. The measured catalyst’s performance on thiscar is presented in Fig. 1, by means of the measured instantaneous
CO, HC, and NO x emissions at converter inlet and exit, over the1180-sec duration of the cycle.
Obviously, the specific converter attains a significant overallefficiency: The emissions at catalyst’s exit are diminished after thecold start phase. However, the emissions standards themselves arequite low: Thus the model should not only accurately predict cata-lyst light-off, but it should also be capable of matching the cata-lyst’s breakthrough during accelerations, decelerations and espe-cially in the extra-urban, high-speed part of the cycle.
In order to match this catalyst’s behavior, the model was tunedusing the genetic algorithm. The measured emissions during thefull NEDC were employed as a reference period for parameterestimation 1180 s in Eq. 19. CPU time of the order of 48 hwas required for the computation of 135 generations 100 indi-viduals each on a Pentium IV 2.4-GHz PC. However, if one
needs faster execution time, a part of the cycle containing the coldstart and some hot operation could equally do with just one-thirdof the time.
The tuning process resulted to the kinetics parameters of Table3. The evolution of the most important kinetics parameters valuesof the individuals as determined by the genetic algorithm duringthe 135 generations is presented in Fig. 2. It may be observed thatthe genetic algorithm converges to specific values for these pa-rameters. This behavior is not observed for all kinetics parameters,and this is taken into account for improvements in the kineticsscheme 22. The computed results which are produced when themodel is fed with the frequency factors determined by the 135thgeneration of the genetic algorithm, are summarized in the formof cumulative CO, HC, and NO x emissions at catalyst’s exit, com-pared to the corresponding measured curves in Fig. 3. The error in
the prediction of cumulative emissions does not generally exceed5% during the cycle for any species.Also, it is useful to mention that although the specific genetic
algorithm matures after about 120 generations, the convergence isclear even from the 20th generation: This means that we couldcompute good kinetics parameters even with 8 h CPU time. Thusthe genetic algorithm approach can no more be considered asforbidding due to excessive computation time. For comparisonpurposes, it should be mentioned that the tuning process is themost critical part of the modeling job, and it could take severalworking days from experienced engineers. Moreover, its resultwas not guaranteed. With the new developments, whenever thegenetic algorithm fails to converge, is an indication that the qual-
Table 2 Parameters of the genetic algorithm
Encoding type binaryCrossover operator one-point crossoverMutation operator binary mutationPopulation size 100Crossover probability 0.6Mutation probability 0.03Encoding resolution 10 bit 10Limits 1007
A i1023
912 Õ Vol. 126, OCTOBER 2004 Transactions of the ASME

8/14/2019 ASME_Oct04.pdf
http://slidepdf.com/reader/full/asmeoct04pdf 8/18
ity of the test data employed in the tuning process is questionable.Thus the tuning effort with the specific data is stopped and thequality assurance team must examine and possibly reject the testdata 44.
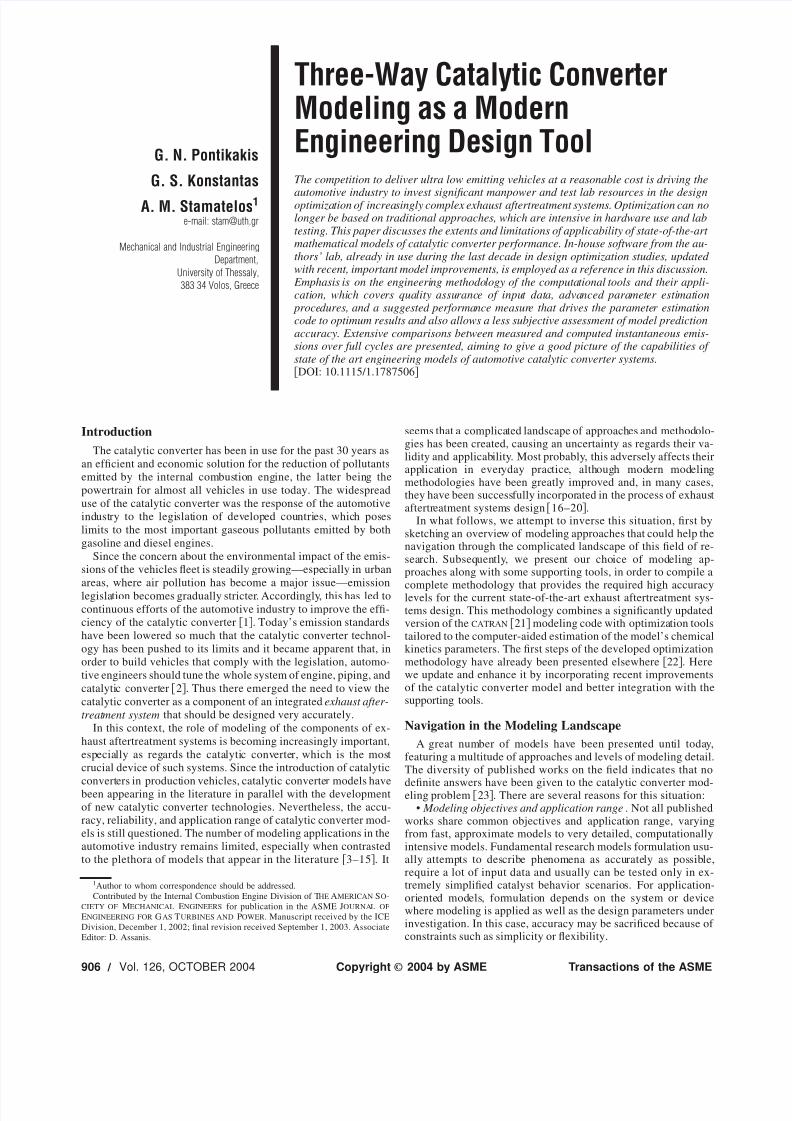
In addition, computed and measured temperatures at the con-verter’s exit are compared in Fig. 4. Apparently, the model iscapable of matching the catalyst’s behavior with a remarkableaccuracy, allowing the performance of design optimization stud-ies.
Since one of the objectives of this paper is to quantify the
attainable accuracy, we proceed to a more detailed comparison of model predictions and measurements in the form of instantaneousCO, HC, and NO x emissions. Prediction of instantaneous emis-sions over the full extent of a real legislative cycle is a significantchallenge to any catalytic converter model.
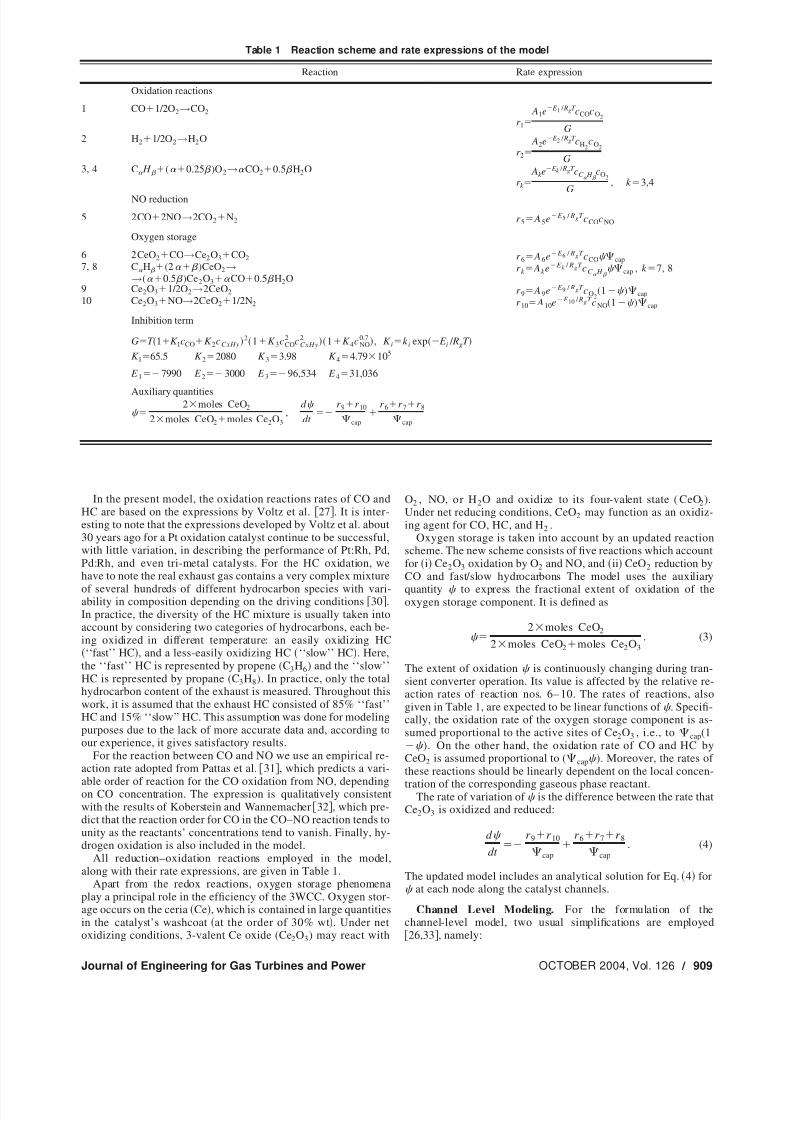
Figure 5 presents the computed and measured instantaneous COemissions at converter inlet and exit during the first 600 sec of NEDC: Apparently, the model successfully matches light-off be-havior of the catalyst, as well as subsequent breakthrough duringacceleration. The role of oxygen storage and release reactions inmatching the CO breakthough behavior is better assessed by in-cluding in the graph the computed degree of filling of the total
washcoat’s oxygen storage capacity. See, for example, the small
breakthroughs, which are of the order of 200 ppm, with maximum
peaks of the order of 1000 ppm, that are accurately matched by
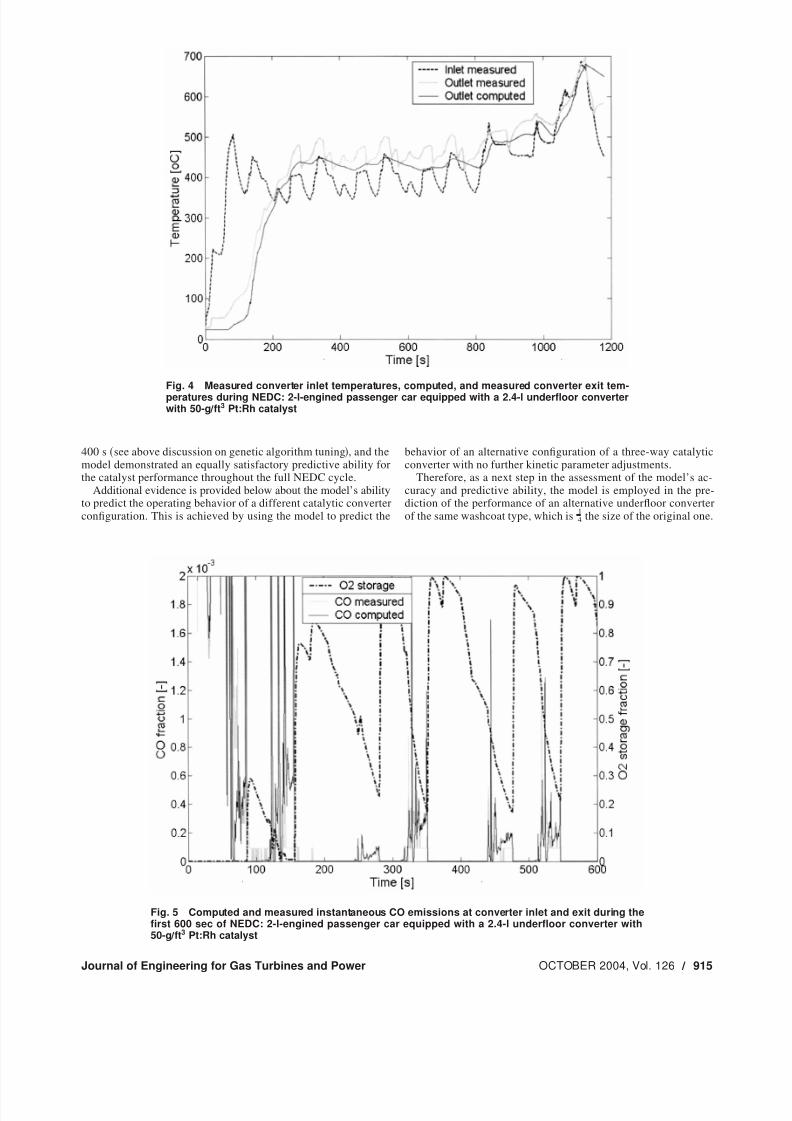
the computation.A comparison of computed and measured CO emissions for the
cycle part from 600 to 1180 s is given in Fig. 6. In the extra-urban
part of the cycle, the efficiency of the converter is reduced due to
high flowrates. Again, the breakthroughs are observed when the
oxygen stored in the washcoat is gradually depleted. The predic-
tion of the model is remarkably good, especially when the order of
magnitude of the breakthroughs is considered. This successfulprediction indicates that the oxygen storage reactions that are
implemented in the model are capable of modeling the phenom-
enon with high accuracy. An exception to this good behavior is
observed only in the interval between 930 and 980 sec. Here there
exists room for further improvement of the storage submodel and
reaction scheme.
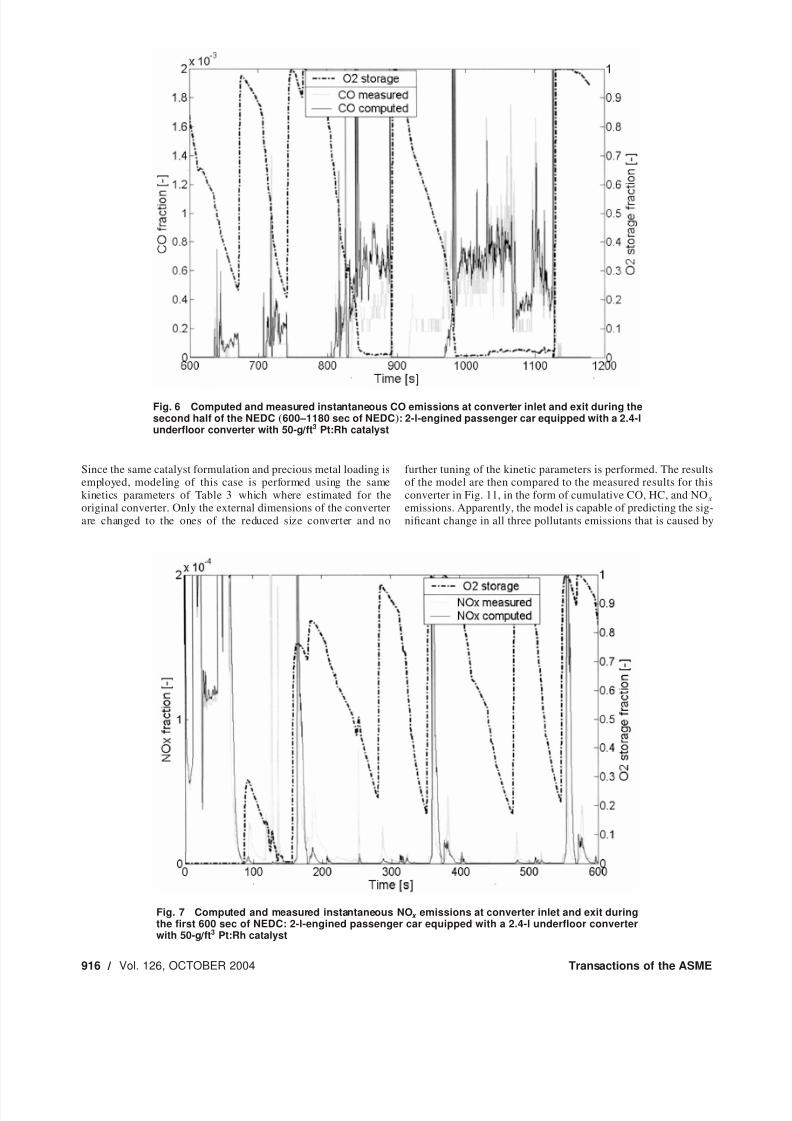
Figures 7 and 8 present the computed and measured instanta-
neous NO x emissions at converter inlet and exit during the two
halves of the NEDC: Apparently, the model successfully matches
light-off behavior of the catalyst, as well as subsequent NO x
breakthrough behavior during accelerations. Oxygen storage is
critical also here. The prediction accuracy is remarkable when one
notes that the breakthroughs are of the order of a few ppm. A
weak point of the model is spotted in the comparison of computed
and measured behavior between 980 and 1100 sec. Again, this isthe subject for future improvements in the oxygen storage sub-
model.
The situation appears equally good in Figs. 9 and 10 where the
computed and measured instantaneous HC emissions at converter
inlet and exit during the first 600 s and the rest of NEDC are
given. The connection between HC breakthroughs and oxygen
storage phenomena in the washcoat is apparent also in this case.
The model results are of comparable quality as the previous fig-
ures, since the model predicts the events HC breakthroughs of
the extra-urban part of the cycle, not only qualitatively, but also
quantitatively, in a certain extent. HC light-off behavior is also
Fig. 1 Measured instantaneous CO, HC, and NOx
emissions at converter inlet and exit, over the 1180-sec duration of the cycle:2-l-engined passenger car equipped with a 2.4-l underfloor converter with 50-g Õft3 Pt:Rh catalyst
Table 3 Kinetics parameters tuned to the Pt:Rh catalyst
Reaction A E
1 CO1/2O2→CO2 2.000 E 20 90,0002 H21/2O2→H2O 2.000 E 19 90,0003, 4 C H ( 0.25 )O2→ CO20.5 H2O 1.800 E 20 95,000
2.710 E 19 120,000NO reduction
5 2CO2NO→2CO2N2 3.403 E 09 90,000Oxygen storage
6 2CeO2CO→Ce2O3CO2 7.832 E 09 85,0007, 8 C H (2 )CeO2→ 1.283 E 10 85,000
→( 0.5 )Ce2O3 CO0.5 H2O 3.631 E 13 85,0009 Ce2O31/2O2→2CeO2 2.553 E 09 90,00010 Ce2O3NO→2CeO21/2 N 2 4.118 E 10 90,000
Journal of Engineering for Gas Turbines and Power OCTOBER 2004, Vol. 126 Õ 913

8/14/2019 ASME_Oct04.pdf
http://slidepdf.com/reader/full/asmeoct04pdf 9/18
matched with a very good accuracy, taking into account the com-plexity of the hydrocarbons composition that is modeled only bytwo representative components.
The overall performance of the specific model prediction’s canbe quantitatively assessed by means of evaluating the performancemeasure which is defined in Eqs. 15 and 16. The performance
measure takes the value: F 0.959.
The above results indicate that the model formulation has the
capability to match typical measurements of a three-way catalytic
converter, and that the tuning methodology may be used success-fully to fit the model to the measured data. Another important
finding is that the model is capable of predicting the catalyst’sperformance outside the region where it has been tuned. That is, if we tested carrying out the tuning process based only on the first
Fig. 2 Evolution of the values of three selected kinetics parameters in the 100 individuals of the population
during 135 generations. The convergence to the final values is apparent even from the 40th generation.
Fig. 3 Computed and measured cumulative CO, HC, and NOx
emissions at converter exit during NEDC:2-l-engined passenger car equipped with a 2.4-l underfloor converter with 50-g Õft3 Pt:Rh catalyst
914 Õ Vol. 126, OCTOBER 2004 Transactions of the ASME
8/14/2019 ASME_Oct04.pdf
http://slidepdf.com/reader/full/asmeoct04pdf 10/18
400 s see above discussion on genetic algorithm tuning, and themodel demonstrated an equally satisfactory predictive ability forthe catalyst performance throughout the full NEDC cycle.
Additional evidence is provided below about the model’s abilityto predict the operating behavior of a different catalytic converterconfiguration. This is achieved by using the model to predict the
behavior of an alternative configuration of a three-way catalyticconverter with no further kinetic parameter adjustments.
Therefore, as a next step in the assessment of the model’s ac-curacy and predictive ability, the model is employed in the pre-diction of the performance of an alternative underfloor converterof the same washcoat type, which is
14 the size of the original one.
Fig. 4 Measured converter inlet temperatures, computed, and measured converter exit tem-peratures during NEDC: 2-l-engined passenger car equipped with a 2.4-l underfloor converterwith 50-g Õft3 Pt:Rh catalyst
Fig. 5 Computed and measured instantaneous CO emissions at converter inlet and exit during thefirst 600 sec of NEDC: 2-l-engined passenger car equipped with a 2.4-l underfloor converter with50-g Õft3 Pt:Rh catalyst
Journal of Engineering for Gas Turbines and Power OCTOBER 2004, Vol. 126 Õ 915
8/14/2019 ASME_Oct04.pdf
http://slidepdf.com/reader/full/asmeoct04pdf 11/18
Since the same catalyst formulation and precious metal loading isemployed, modeling of this case is performed using the samekinetics parameters of Table 3 which where estimated for theoriginal converter. Only the external dimensions of the converterare changed to the ones of the reduced size converter and no
further tuning of the kinetic parameters is performed. The resultsof the model are then compared to the measured results for thisconverter in Fig. 11, in the form of cumulative CO, HC, and NO x
emissions. Apparently, the model is capable of predicting the sig-nificant change in all three pollutants emissions that is caused by
Fig. 6 Computed and measured instantaneous CO emissions at converter inlet and exit during thesecond half of the NEDC „600–1180 sec of NEDC…: 2-l-engined passenger car equipped with a 2.4-lunderfloor converter with 50-g Õft3 Pt:Rh catalyst
Fig. 7 Computed and measured instantaneous NOx
emissions at converter inlet and exit duringthe first 600 sec of NEDC: 2-l-engined passenger car equipped with a 2.4-l underfloor converterwith 50-g Õft3 Pt:Rh catalyst
916 Õ Vol. 126, OCTOBER 2004 Transactions of the ASME
8/14/2019 ASME_Oct04.pdf
http://slidepdf.com/reader/full/asmeoct04pdf 12/18
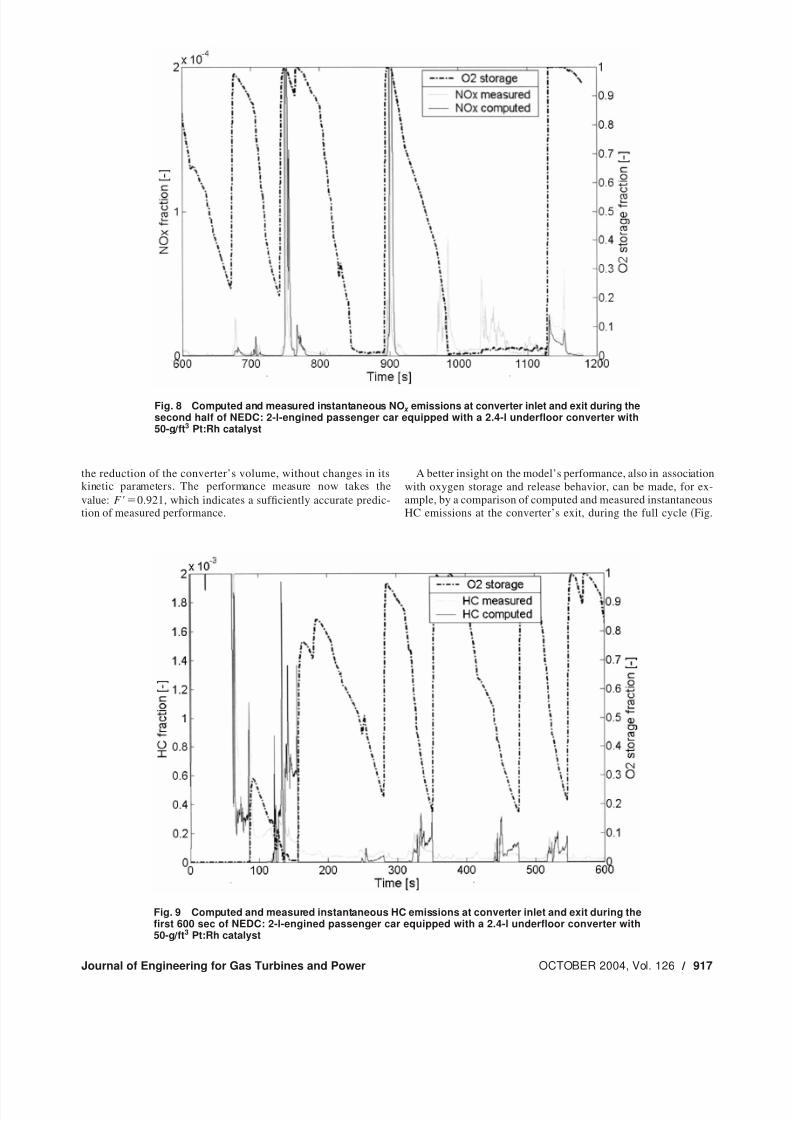
the reduction of the converter’s volume, without changes in itskinetic parameters. The performance measure now takes the
value: F 0.921, which indicates a sufficiently accurate predic-tion of measured performance.
A better insight on the model’s performance, also in association
with oxygen storage and release behavior, can be made, for ex-
ample, by a comparison of computed and measured instantaneous
HC emissions at the converter’s exit, during the full cycle Fig.
Fig. 8 Computed and measured instantaneous NOx
emissions at converter inlet and exit during thesecond half of NEDC: 2-l-engined passenger car equipped with a 2.4-l underfloor converter with50-g Õft3 Pt:Rh catalyst
Fig. 9 Computed and measured instantaneous HC emissions at converter inlet and exit during thefirst 600 sec of NEDC: 2-l-engined passenger car equipped with a 2.4-l underfloor converter with50-g Õft3 Pt:Rh catalyst
Journal of Engineering for Gas Turbines and Power OCTOBER 2004, Vol. 126 Õ 917

8/14/2019 ASME_Oct04.pdf
http://slidepdf.com/reader/full/asmeoct04pdf 13/18
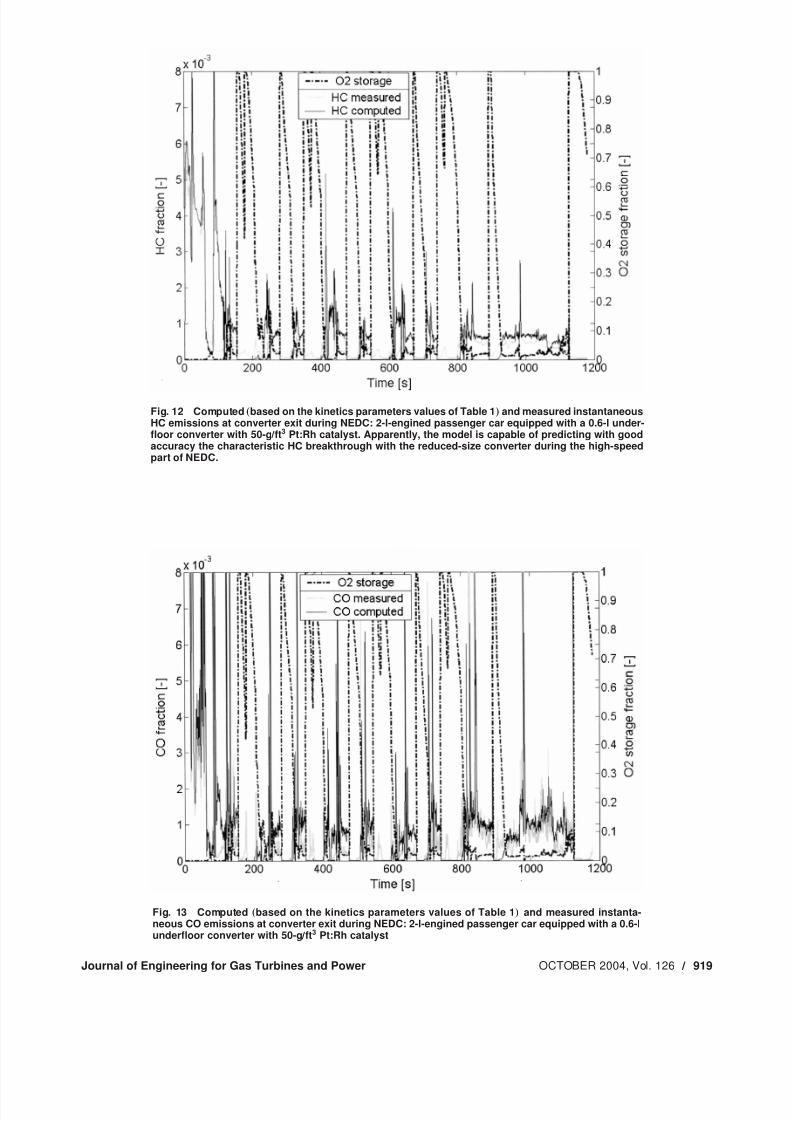
12. Here, the model demonstrates the capacity of taking intoaccount the change in total oxygen storage capacity, to accuratelypredict the effect of size reduction. The same good behavior isdemonstrated with CO in Fig. 13, and NO x not shown here.
As a next step, we check the model’s predictive ability with adifferent catalyst type, namely, a Pd:Rh 14:1, 150 gr/ft3, 0.8-lvolume converter, which is now fitted in a close-coupled positionon a 2.2-l engined car. Again, the converter is a standard 400-cpsi,
Fig. 10 Computed and measured instantaneous HC emissions at converter inlet and exit during thesecond half of NEDC: 2-l-engined passenger car equipped with a 2.4-l underfloor converter with50-g Õft3 Pt:Rh catalyst
Fig. 11 Computed „based on the kinetics parameters values of Table 1… and measured cumulative CO, HC, andNO
x emissions at converter exit during NEDC. 2-l-engined passenger car equipped with a 0.6-l underfloor
converter with 50-g Õft3 Pt:Rh catalyst. Apparently, the model is capable of predicting the significant differencein CO, HC, and NO
x emissions at the exit of the reduced-size converter.
918 Õ Vol. 126, OCTOBER 2004 Transactions of the ASME
8/14/2019 ASME_Oct04.pdf
http://slidepdf.com/reader/full/asmeoct04pdf 14/18
Fig. 12 Computed „based on the kinetics parameters values of Table 1… and measured instantaneousHC emissions at converter exit during NEDC: 2-l-engined passenger car equipped with a 0.6-l under-floor converter with 50-g Õft3 Pt:Rh catalyst. Apparently, the model is capable of predicting with goodaccuracy the characteristic HC breakthrough with the reduced-size converter during the high-speedpart of NEDC.
Fig. 13 Computed „based on the kinetics parameters values of Table 1… and measured instanta-neous CO emissions at converter exit during NEDC: 2-l-engined passenger car equipped with a 0.6-lunderfloor converter with 50-g Õft3 Pt:Rh catalyst
Journal of Engineering for Gas Turbines and Power OCTOBER 2004, Vol. 126 Õ 919

8/14/2019 ASME_Oct04.pdf
http://slidepdf.com/reader/full/asmeoct04pdf 15/18
6.5-mil substrate. The test now is according to the U.S. FTP-75procedure, which is considered as a more demanding test proce-dure for modeling catalytic converter behavior, because of theextensively transient nature of its driving cycle.
In this case, a new kinetic tuning is required, because we shiftto a different type of catalyst and washcoat formulation. The ge-netic algorithm optimized the kinetic parameters of the model forthe reference period of the first 600 s of the FTP cycle. This partboldly corresponds to the cold-start phase of the cycle. Thisphase is followed by the transient phase 505–1369 s and thehot-start phase 1369–1874 s, the latter starting after the engine
is stopped for 10 min. The values of the kinetic parameters re-sulting from the tuning procedure are listed in Table 4.
The computed results are summarized in the form of cumula-tive CO, HC, and NO x emissions at the catalyst’s exit, comparedto the corresponding measured curves in Fig. 14. The performancemeasure takes the value of F0.955. In addition, computed andmeasured temperatures at converter’s exit are compared in Fig.15. Apparently, also in this case, the model is capable of matchingthe catalyst’s behavior with very good accuracy, allowing the per-formance of design optimization studies.
The model’s accuracy can be assessed in more detail, by meansof instantaneous emissions comparison. As an example, Fig. 16
presents the computed and measured instantaneous HC emissionsat converter inlet and exit during the first 600 sec of FTP-75:Apparently, the model successfully matches light-off behavior of the catalyst, as well as subsequent breakthrough during the sig-nificant accelerations of FTP cycle. Again, the role of oxygenstorage and release reactions in matching the HC breakthroughbehavior is very well assessed by including in the graph, the com-puted degree of filling of the total washcoat’s oxygen storage ca-pacity.
The above indicative results can be considered to support aclear demonstration of the attainable accuracy and predictive abil-
ity of this category of models. Of course, these results have beenachieved by continuous development and improvements of thespecific model based on its extensive application in standard ex-haust aftertreatment system design case studies during the last sixyears.
Moreover, the demonstrated model’s capacity to predict thecombined effect of the precious metal and Ceria kinetics on thetransient converter’s performance, allows us to support the com-plex optimization tasks of great interest to the emissions controlengineer 45. For example, a specific catalyst-washcoat designneeds to be tailored to address specific converter’s performancerequirements, based on the raw emissions, exhaust temperaturelevels, and exhaust mass flowrate behavior of each different typeof engine-vehicle-exhaust system combination.
Concluding RemarksThis paper aims to contribute towards a more clear definition of
the state of the art in engineering design tools in automotive cata-lytic converter systems.
A model developed and continuously improved in the authors’lab, based on the experience from involvement in engineeringdesign tasks during the last six years, is described in detail, in itscurrent status of development, in comparison with other modelsexisting in the literature, and employed in demonstration casestudies with Pt:Rh and Pd:Rh catalysts.
A kinetic parameter estimation methodology that has been re-cently developed specifically to support this type of modeling is
Table 4 Kinetics parameters tuned to the Pd:Rh catalyst
Reaction A E
1 CO1/2O2→CO2 1.10 E 18 90,0002 H21/2O2→H2O 1.10 E 18 90,0003, 4 C H ( 0.25 )O2→ CO20.5 H2O 2.00 E 15 70,000
1.00 E 16 105,000NO reduction
5 2CO2NO→2CO2N2 1.20 E 13 90,000Oxygen storage
6 2CeO2CO→Ce2O3CO2 1.00 E 09 85,0007, 8 C H (2 )CeO2→ 7.00 E 09 85,000
→( 0.5 )Ce2O3 CO0.5 H2O 7.00 E 09 85,000
9 Ce2O31/2O2→
2CeO2 1.00 E 11 90,00010 Ce2O3 N O→2CeO21/2N2 2.00 E 11 90,000
Fig. 14 Computed and measured cumulative CO, HC, and NOx
emissions at converter exit during FTP-75:2.2-l-engined passenger car equipped with a 0.8-l close-coupled converter with 150-g Õft3 Pd:Rh catalyst
920 Õ Vol. 126, OCTOBER 2004 Transactions of the ASME

8/14/2019 ASME_Oct04.pdf
http://slidepdf.com/reader/full/asmeoct04pdf 16/18
briefly presented and demonstrated in the case studies. This meth-odology is based on a combination of a genetic algorithm ap-proach and a customized performance measure. The methodologyproves quite successful in finding the parameters for the best fit of the model to the tuning data.
The model’s predictions are compared to the respective experi-mental results, to enable an objective assessment of attainableaccuracy. The comparison of measurements and computations ismade in terms of cumulative CO, HC, and NO x emissions at theconverter exit, exhaust temperatures at the converter exit, as well
Fig. 15 Computed and measured converter exit temperatures during the first 600 sec ofFTP-75 test cycle: 2.2-l-engined passenger car equipped with a 0.8-l close-coupled converterwith 150-g Õft3 Pd:Rh catalyst. Converter inlet temperature recording is also shown.
Fig. 16 Computed and measured instantaneous HC emissions at converter exit during the first 600sec of FTP-75 test cycle: 2.2-l-engined passenger car equipped with a 0.8-l close-coupled converterwith 150-g Õft3 Pd:Rh catalyst
Journal of Engineering for Gas Turbines and Power OCTOBER 2004, Vol. 126 Õ 921

8/14/2019 ASME_Oct04.pdf
http://slidepdf.com/reader/full/asmeoct04pdf 17/18

8/14/2019 ASME_Oct04.pdf
http://slidepdf.com/reader/full/asmeoct04pdf 18/18
20 Stamatelos, A. M., Koltsakis, G. C., and Kandylas, I. P., 1999, ‘‘Computerg-estutzte Entwurf von Abgasnachbehandlungsystemen. Teil I. Ottomotor,’’ Mo-
tortech. Z., MTZ 602, pp. 116–124.
21 LTTE-University of Thessaly: CATRAN Catalytic Converter Modeling Soft-
ware, User’s Guide, Version v4r2f. Volos, June 2003.22 Pontikakis, G. N., and Stamatelos, A. M., 2002, ‘‘Catalytic Converter Model-
ing: Computer-Aided Parameter Estimation by use of Genetic Algorithms’’Proc. Inst. Mech. Eng., Part D: J. Automob. Eng., accepted for publication.
23 Pontikakis, G., 2003, ‘‘Modeling, Reaction Schemes and Kinetic Parameter
Estimation in Automotive Catalytic Converters and Diesel Particulate Filters,’’
Ph.D. thesis, Mechanical & Industrial Engineering Department, University of
Thessaly, June 2003. http://www.mie.uth.gr/labs/ltte/pubs/PhDGPont.pdf 24 Zygourakis, K., and Aris, R., 1983, ‘‘Multiple Oxidation Reactions and Diffu-
sion in the Catalytic Layer of Monolith Reactors,’’ Chem. Eng. Sci., 385, pp.
733–744.25 Hoebink, J. H. B. J., van Gemert, R. A., van den Tillaart, J. A. A., and Marin,
G. B., 2000, ‘‘Competing Reactions in Three-Way Catalytic Converters: Mod-
eling of the NOx Conversion Maximum in the Light-off Curves Under NetOxidizing Conditions,’’ Chem. Eng. Sci., 559, pp. 1573–1581.
26 Keren, I., and Sheintuch, M., 2000, ‘‘Modeling andAnalysis of Spatiotemporal
Oscillatory Patterns During CO Oxidation in the Catalytic Converter,’’ Chem.
Eng. Sci., 55 , pp. 1461–1475.27 Voltz, S. E., Morgan, C. R., Liederman, D., and Jacob, S. M., 1973, ‘‘Kinetic
Study of Carbon Monoxide and Propylene Oxidation on Platinum Catalysts,’’Ind. Eng. Chem. Prod. Res. Dev., 12 , pp. 294–301.
28 Young, L. C., and Finlayson, B. A., 1976, ‘‘Mathematical Models of the
Monolithic Catalytic Converter: Part I. Development of Model and Application
of Orthogonal Collocation,’’ AIChE J., 222, pp. 337–343.29 Hayes, R. E., and Kolaczkowski, S. T., 1994, ‘‘Mass and Heat Transfer Effects
in Catalytic Monolith Reactors,’’ Chem. Eng. Sci., 4621, pp. 3587–3599.30 Tanaka, M., Tsujimoto, Y., Miyazaki, T., Warashina, M., and Wakamatsu, S.,
2001, ‘‘Pecularities of Volatile Hydrocarbons Emissions From Several Types
of Vehicles in Japan,’’ Chemosphere-Global Change Science, 32, pp. 185–
197.31 Pattas, K. N., Stamatelos, A. M., Pistikopoulos, P. K., Koltsakis, G. C., Kon-
stantinidis, P. A., Volpi, E., and Leveroni, E., 1994, ‘‘Transient Modeling of 3-Way Catalytic Converters,’’ SAE paper 940934, SAE Trans., 103, pp. 565–
578.
32 Koberstein, E., and Wannemacher, G., 1987, ‘‘The A/F Window With Three-
Way Catalysts. Kinetic and Surface Investigations,’’ CAPOC, International
Congress on Catalysis and Automotive Pollution Control, Brussels.
33 Siemund, S., Leclerc, J. P., Schweich, D., Prigent, M., and Castagna, F., 1996,
‘‘Three Way Monolithic Converter: Simulations Versus Experiments,’’ Chem.
Eng. Sci., 5115, pp. 3709–3720.
34 Heck, R. H., Wei, J., and Katzer, J. R., 1976, ‘‘Mathematical Modeling of
Monolithic Catalysts,’’ AIChE J., 223, pp. 477–484.
35 Zygourakis, K., 1989, ‘‘Transient Operation of Monolith Catalytic Converters:
A Two-Dimensional Reactor Model and the Effects of Radially Nonuniform
Flow Distributions,’’ Chem. Eng. Sci., 44 , pp. 2075–2086.
36 Jahn, R., Snita, D., Kubicek, M., and Marek, M., 1997, ‘‘3-D Modeling of
Monolith Reactors,’’ Catal. Today, 38, pp. 39–46.
37 Dubien, C., and Schweich, D., 1997, ‘‘Three Way Catalytic Converter Model-
ing. Numerical Determination of Kinetic Data,’’ in CAPOC IV, Fourth Inter-
national Congress on Catalysis and Automotive Pollution Control, Brussels.
38 Pontikakis, G. N., Papadimitriou, C., and Stamatelos, A. M., 2004, ‘‘Kinetic
Parameter Estimation by Standard Optimization Methods in Catalytic Con-
verter Modeling,’’ Chem. Eng. Commun., 91 , pp. 3–29.
39 Glielmo, L., and Santini, S., 2001, ‘‘A Two-Time-Scale Infinite Adsorption
Model of Three-Way Catalytic Converters During the Warm-Up Phase,’’
ASME J. Dyn. Syst., Meas., Control, 123, pp. 62–70.
40 Bates, D. M., and Watts, D. G., 1988, Nonlinear Regression Analysis and its
Applications, Wiley, New York.
41 Luenberger, D. G., 1989, Linear and Nonlinear Programming, Second Edition,
Addison-Wesley, Reading, MA.
42 Goldberg, D. E., 1989, Genetic Algorithms in Search Optimization, and Ma-
chine Learning, Addison-Wesley, Reading, MA.
43 Emanuel Falkenauer, 1998, Genetic Algorithms and Grouping Problems,
Wiley, New York.
44 Konstantas, G., and Stamatelos, A., 2004, ‘‘Quality Assurance of Exhaust
Emissions Test Data,’’ Proc. Inst. Mech. Eng., Part D: J. Automob. Eng., , 218,
pp. 901–914.
45 Votsmeier, M., Bog, T., Lindner, D., Gieshoff, J., Lox, E. S., and Kreuzer, T.,
2002, ‘‘A Systematic Approach Towards Low Precious Metal Three-Way
Catalyst Application,’’ SAE paper 2002-01-0345.
Journal of Engineering for Gas Turbines and Power OCTOBER 2004 Vol 126 Õ 923
Related Documents

![H20youryou[2] · 2020. 9. 1. · 65 pdf pdf xml xsd jpgis pdf ( ) pdf ( ) txt pdf jmp2.0 pdf xml xsd jpgis pdf ( ) pdf pdf ( ) pdf ( ) txt pdf pdf jmp2.0 jmp2.0 pdf xml xsd](https://static.cupdf.com/doc/110x72/60af39aebf2201127e590ef7/h20youryou2-2020-9-1-65-pdf-pdf-xml-xsd-jpgis-pdf-pdf-txt-pdf-jmp20.jpg)


