Asian Economies Sisira Jayasuriya Department of Economics

Asian Economies Sisira Jayasuriya Department of Economics.
Dec 26, 2015
Welcome message from author
This document is posted to help you gain knowledge. Please leave a comment to let me know what you think about it! Share it to your friends and learn new things together.
Transcript
Asian Economies
Sisira JayasuriyaDepartment of Economics
skj/asianeconomies/1 2
This subject aims to give you a general understanding of the following topics:
• A picture of the structure of Asian economies and historical experiences influencing policies
• The debates about the role of state and market, and process of economic policy reforms
• Nature of trade and investment links between Asian economies, and between Asia and the rest of the world
• Changing international trading and investment framework: issues facing Asian economies– Implications for Asian business environment
and business firms
skj/asianeconomies/1 3
Globalisation: implications and issues
• Markets are opening: trade in goods and services increasing
• Larger role for markets• Foreign investment: inward-outward FDI,
portfolio• International economic and political context
– Political, legal, institutional and economic volatility
skj/asianeconomies/1 4
Asian economies
• Regional identity and diversity: economic, political, historical, cultural
skj/asianeconomies/1 5
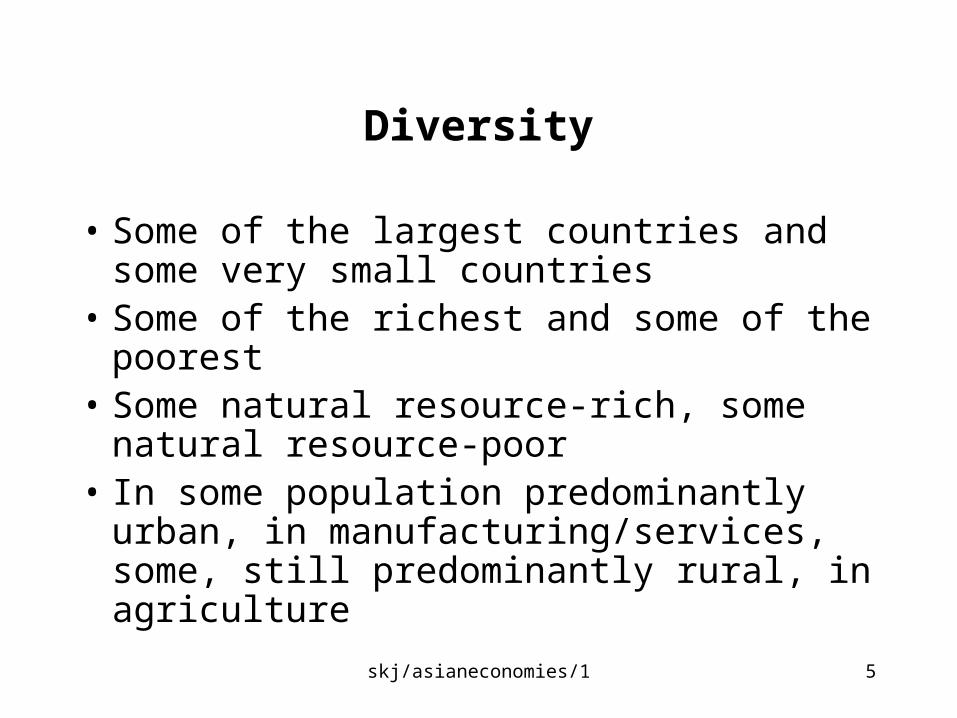
Diversity
• Some of the largest countries and some very small countries
• Some of the richest and some of the poorest• Some natural resource-rich, some natural
resource-poor• In some population predominantly urban, in
manufacturing/services, some, still predominantly rural, in agriculture
skj/asianeconomies/1 6
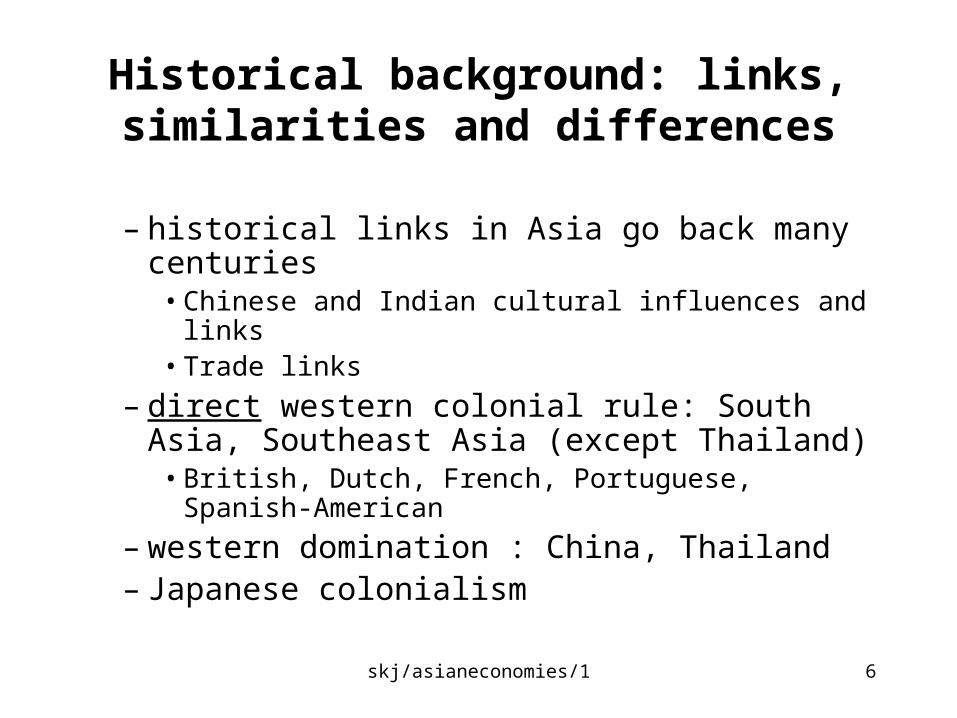
Historical background: links, similarities and differences
– historical links in Asia go back many centuries• Chinese and Indian cultural influences and links• Trade links
– direct western colonial rule: South Asia, Southeast Asia (except Thailand)
• British, Dutch, French, Portuguese, Spanish-American
– western domination : China, Thailand– Japanese colonialism
skj/asianeconomies/1 7
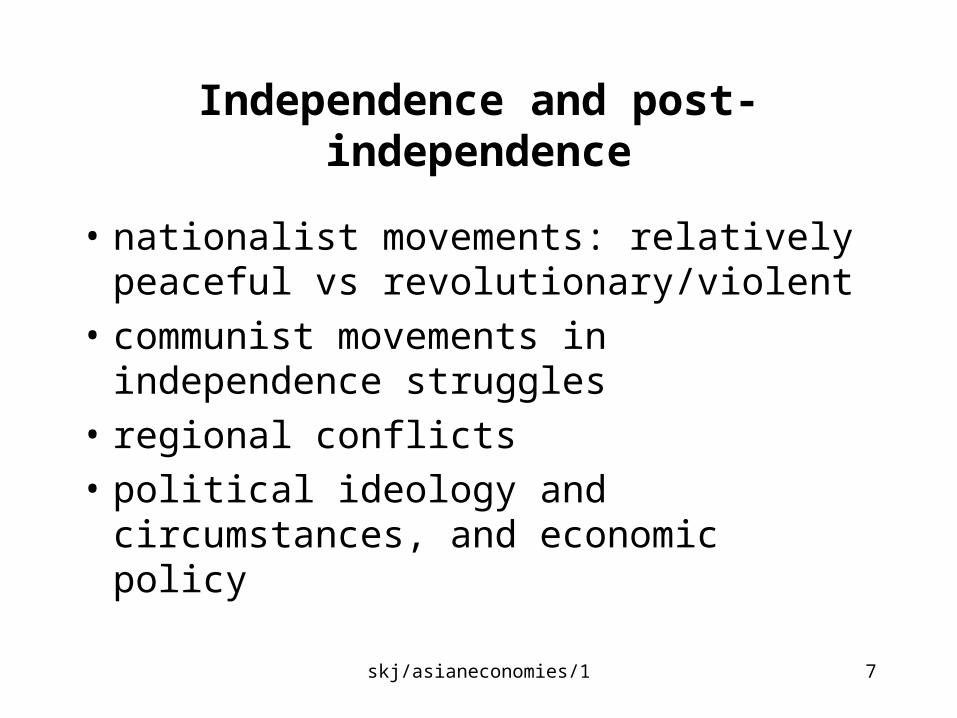
Independence and post-independence
• nationalist movements: relatively peaceful vs revolutionary/violent
• communist movements in independence struggles
• regional conflicts
• political ideology and circumstances, and economic policy
skj/asianeconomies/1 8
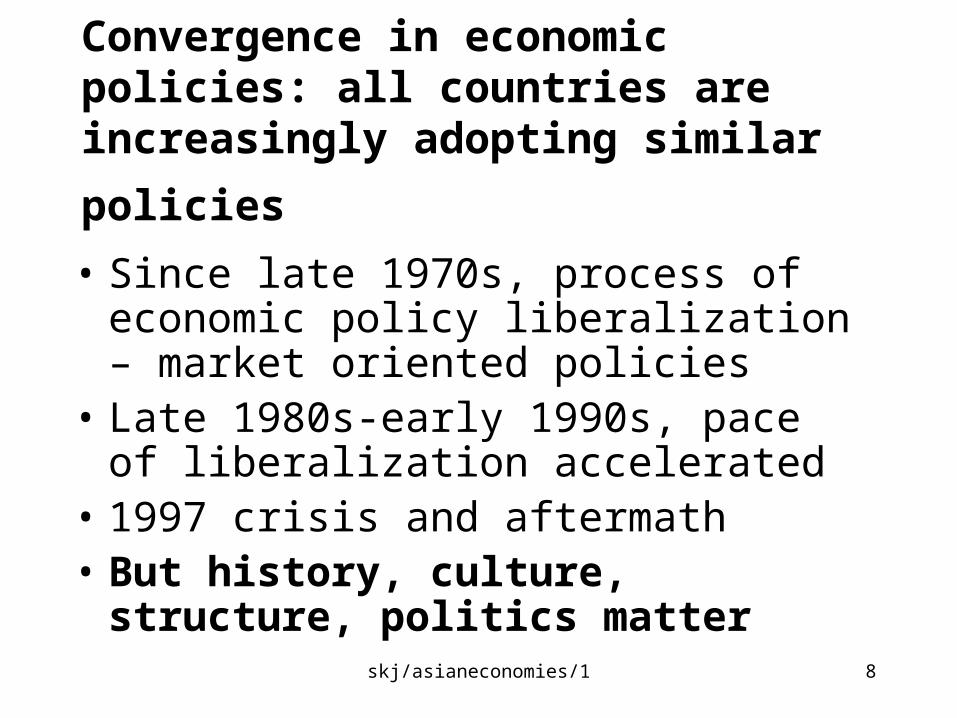
Convergence in economic policies: all countries are increasingly adopting similar
policies
• Since late 1970s, process of economic policy liberalization – market oriented policies
• Late 1980s-early 1990s, pace of liberalization accelerated
• 1997 crisis and aftermath• But history, culture, structure, politics
matter
skj/asianeconomies/1 9
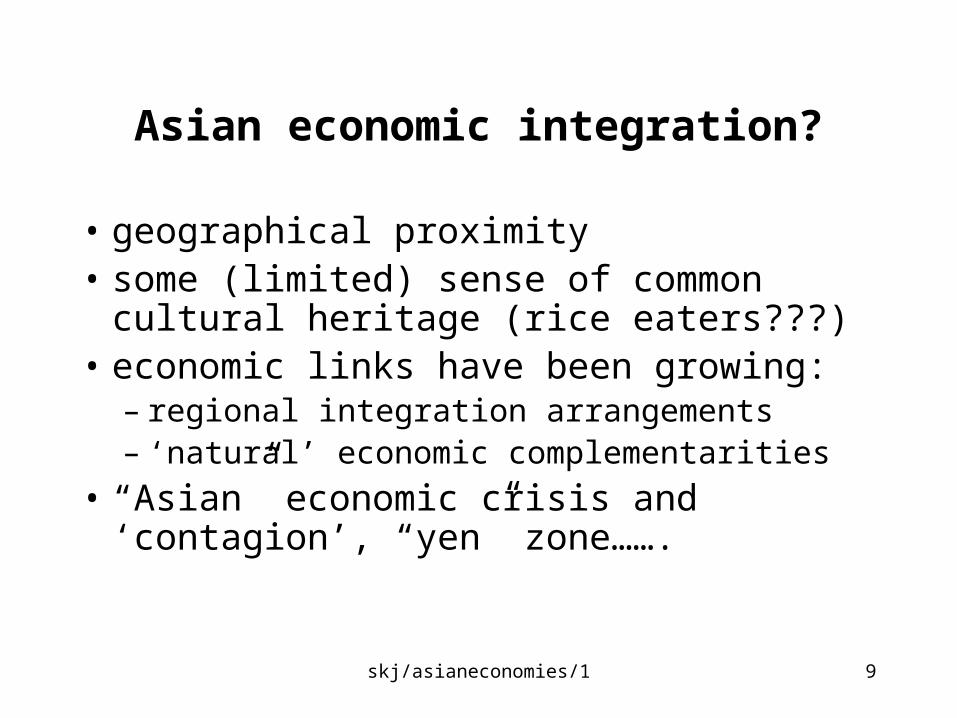
Asian economic integration?
• geographical proximity• some (limited) sense of common cultural
heritage (rice eaters???)• economic links have been growing:
– regional integration arrangements – ‘natural’ economic complementarities
• “Asian” economic crisis and ‘contagion’, “yen” zone…….
skj/asianeconomies/1 10
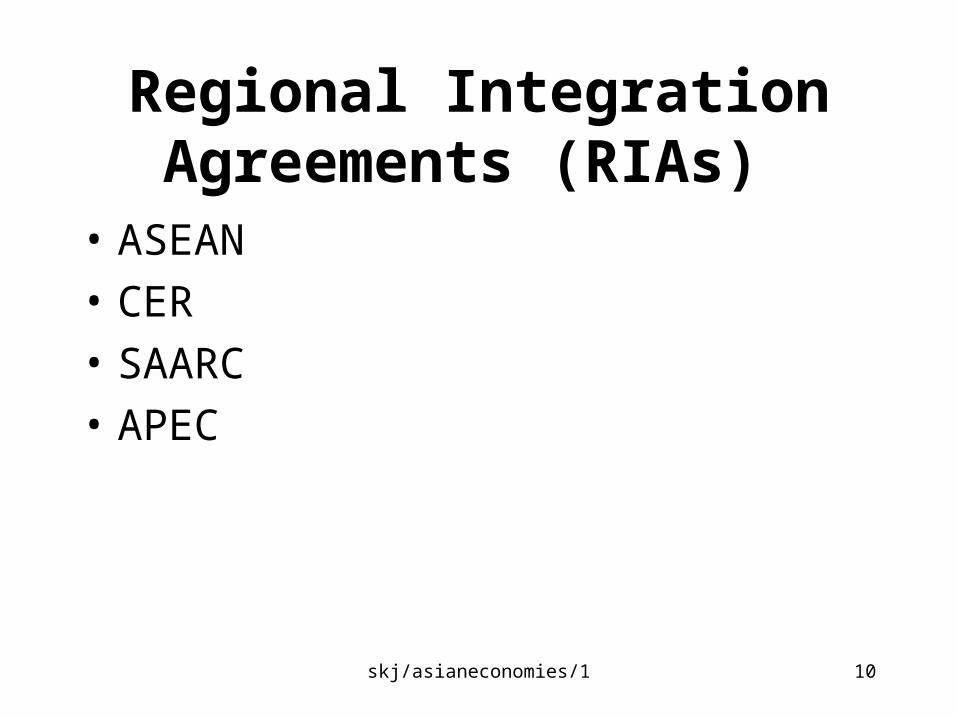
Regional Integration Agreements (RIAs)
• ASEAN
• CER
• SAARC
• APEC
skj/asianeconomies/1 11
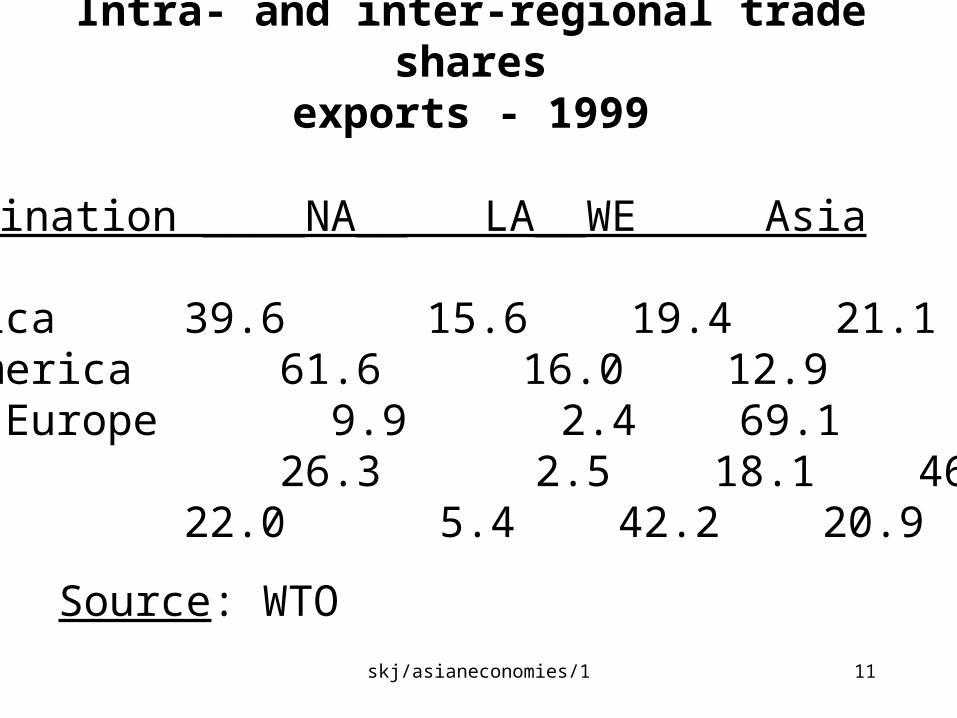
Intra- and inter-regional trade sharesexports - 1999
Destination ____NA__ LA__WE AsiaOrigin N. America 39.6 15.6 19.4 21.1Latin America 61.6 16.0 12.9 6.0Western Europe 9.9 2.4 69.1 7.5Asia 26.3 2.5 18.1 46.6World 22.0 5.4 42.2 20.9
Source: WTO
skj/asianeconomies/1 12
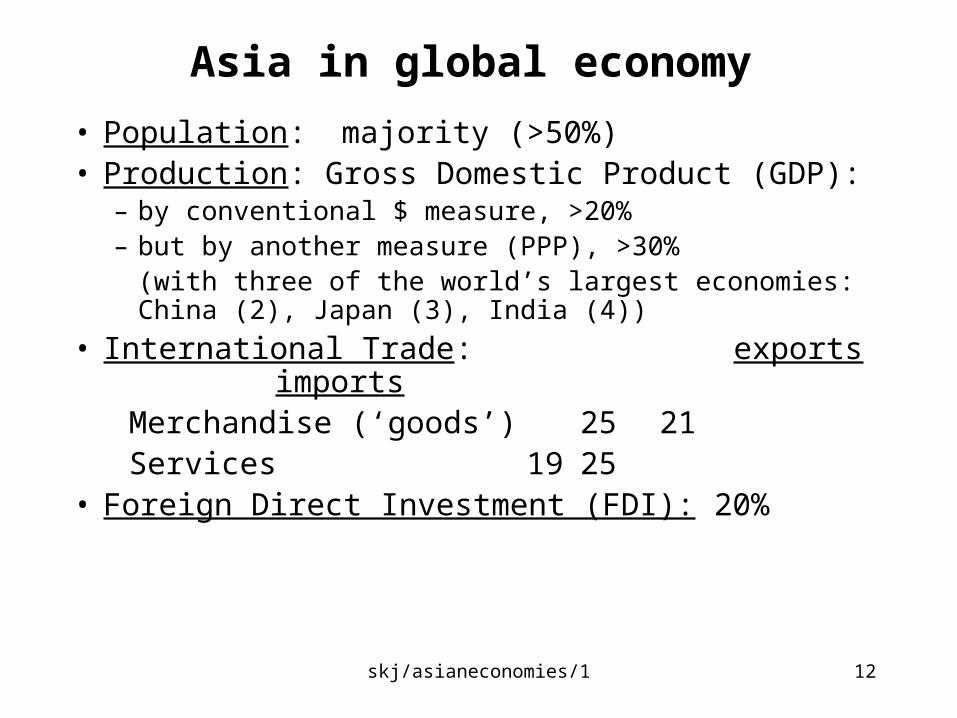
Asia in global economy
• Population: majority (>50%)• Production: Gross Domestic Product (GDP):
– by conventional $ measure, >20%– but by another measure (PPP), >30%
(with three of the world’s largest economies: China (2), Japan (3), India (4))
• International Trade: exports imports
Merchandise (‘goods’) 25 21 Services 19 25• Foreign Direct Investment (FDI): 20%

skj/asianeconomies/1 13
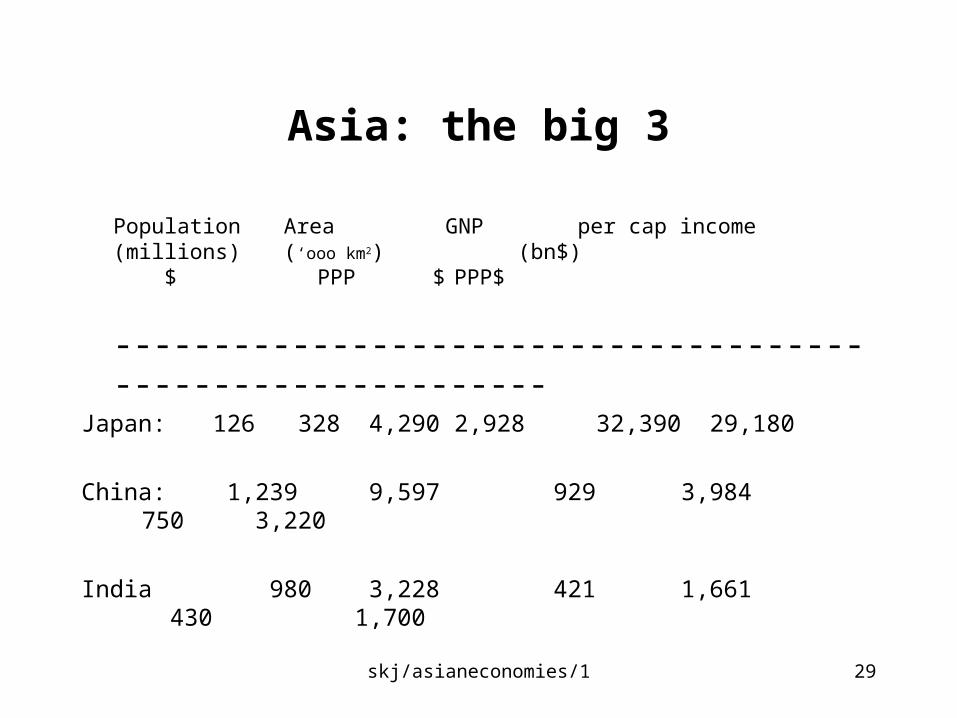
Asia: the big 3
Population Area GNP per cap income(millions) (‘ooo km2) (bn$)
$ PPP $PPP$
------------------------------------------------------------Japan: 126 328 4,290 2,928 32,390 29,180
China: 1,239 9,597 929 3,984 750 3,220
India 980 3,228 421 1,661 430 1,700
skj/asianeconomies/1 14
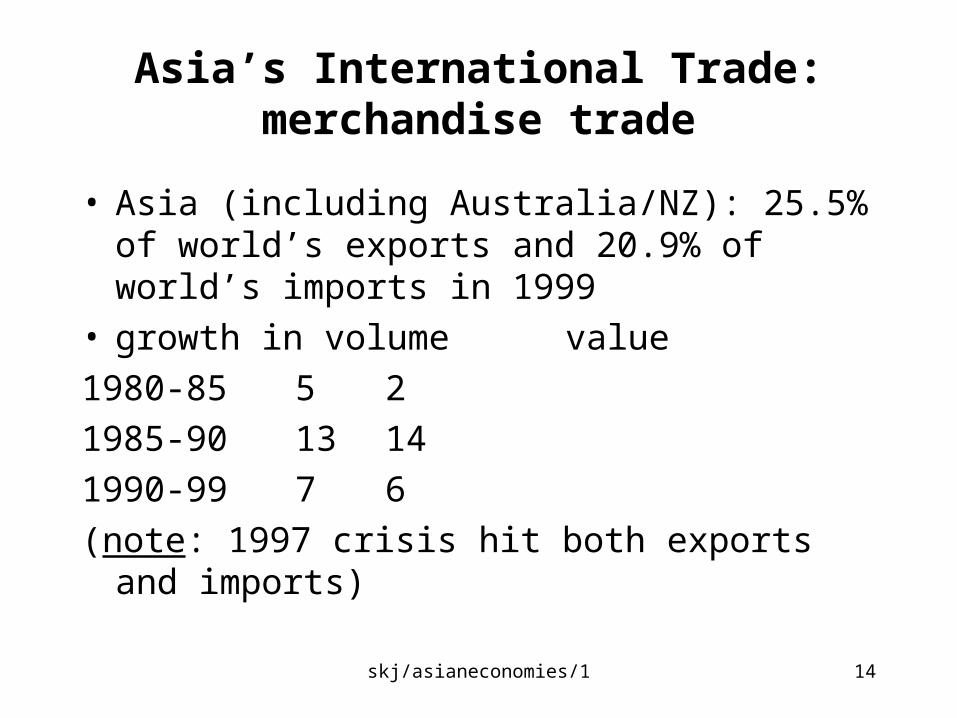
Asia’s International Trade: merchandise trade
• Asia (including Australia/NZ): 25.5% of world’s exports and 20.9% of world’s imports in 1999
• growth in volume value
1980-85 5 2
1985-90 13 14
1990-99 7 6
(note: 1997 crisis hit both exports and imports)
skj/asianeconomies/1 15
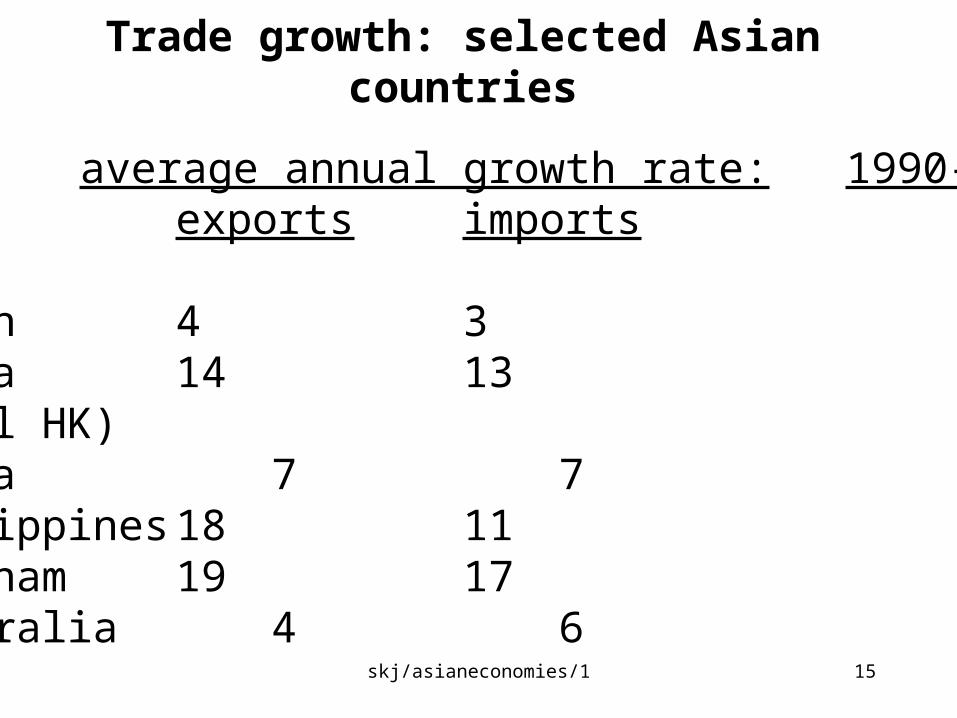
Trade growth: selected Asian countries
average annual growth rate:1990-99exports imports
Japan 4 3China 14 13(excl HK)India 7 7Philippines 18 11Vietnam 19 17Australia 4 6
skj/asianeconomies/1 16
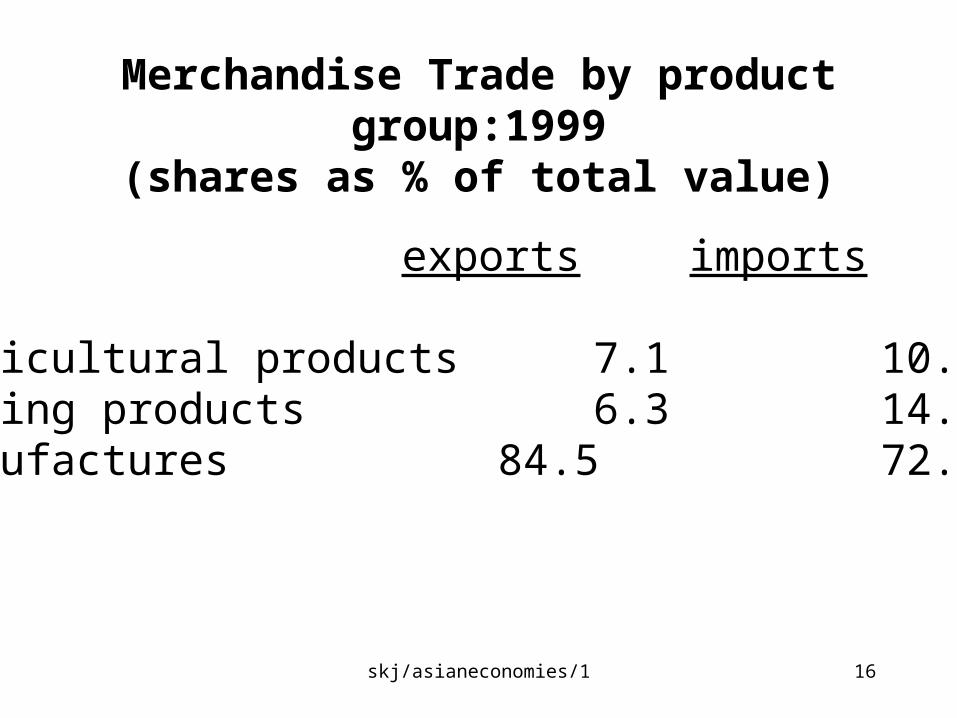
Merchandise Trade by product group:1999(shares as % of total value)
exports imports
Agricultural products 7.1 10.6Mining products 6.3 14.5Manufactures 84.5 72.5
skj/asianeconomies/1 17
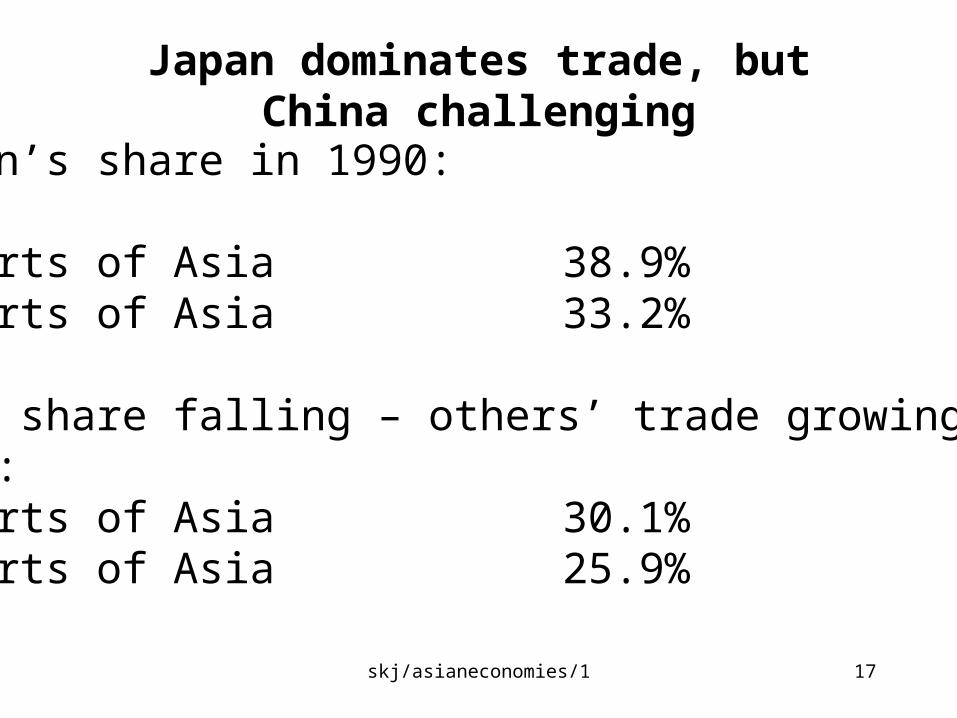
Japan dominates trade, but China challenging
Japan’s share in 1990:
Exports of Asia 38.9%Imports of Asia 33.2%
But, share falling – others’ trade growing faster1999:Exports of Asia 30.1%Imports of Asia 25.9%
skj/asianeconomies/1 18
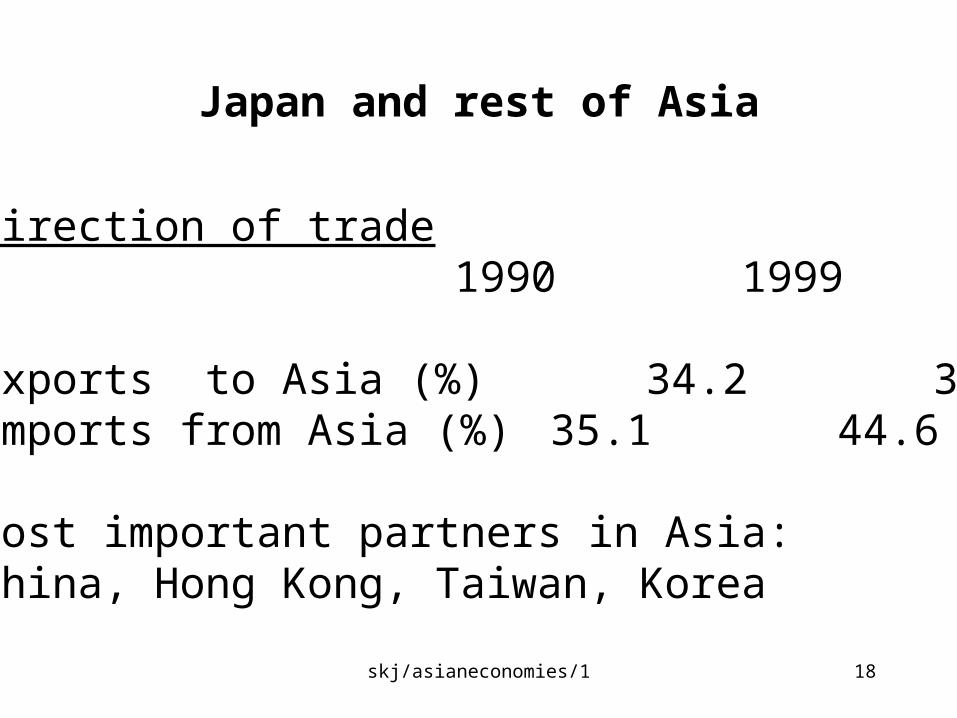
Japan and rest of Asia
Direction of trade 1990 1999
exports to Asia (%) 34.2 39.7imports from Asia (%) 35.1 44.6
most important partners in Asia: China, Hong Kong, Taiwan, Korea
skj/asianeconomies/1 19
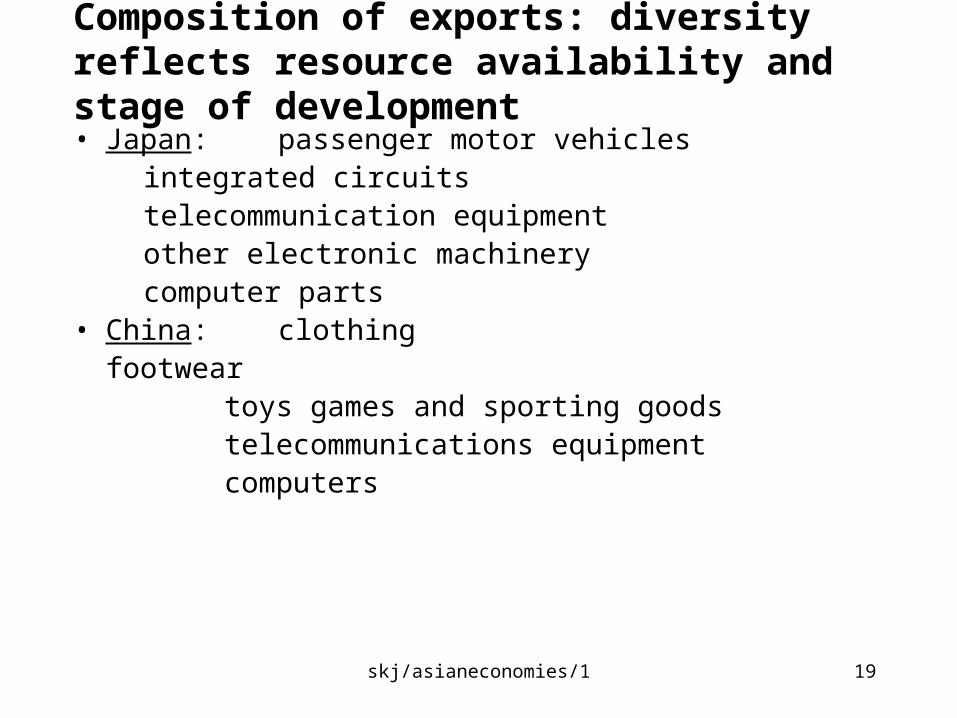
Composition of exports: diversity reflects resource availability and stage of development
• Japan: passenger motor vehiclesintegrated circuitstelecommunication equipmentother electronic machinerycomputer parts
• China: clothingfootwear
toys games and sporting goodstelecommunications equipmentcomputers
skj/asianeconomies/1 20
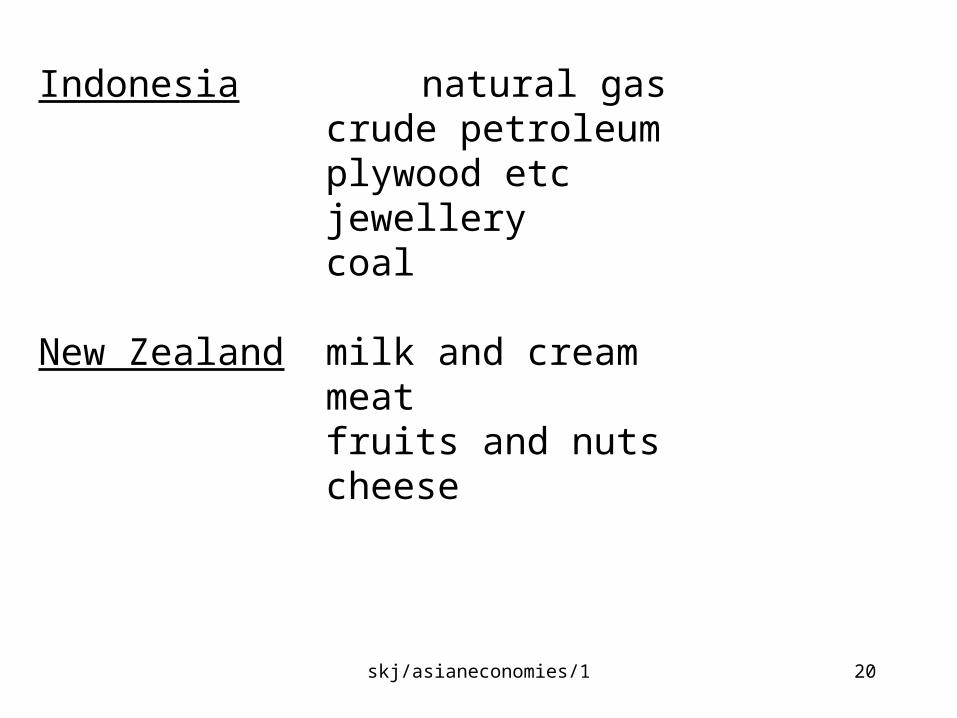
Indonesia natural gascrude petroleumplywood etcjewellerycoal
New Zealand milk and creammeatfruits and nutscheese
skj/asianeconomies/1 21
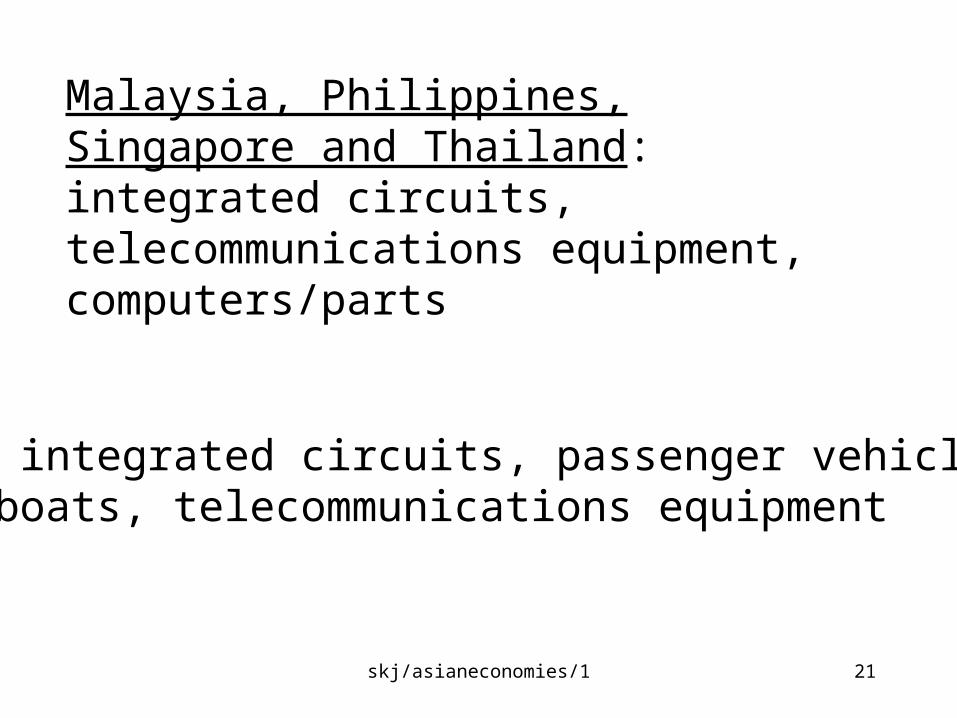
Malaysia, Philippines, Singapore and Thailand: integrated circuits, telecommunications equipment, computers/parts
Korea: integrated circuits, passenger vehicles,ships/boats, telecommunications equipment
skj/asianeconomies/1 22
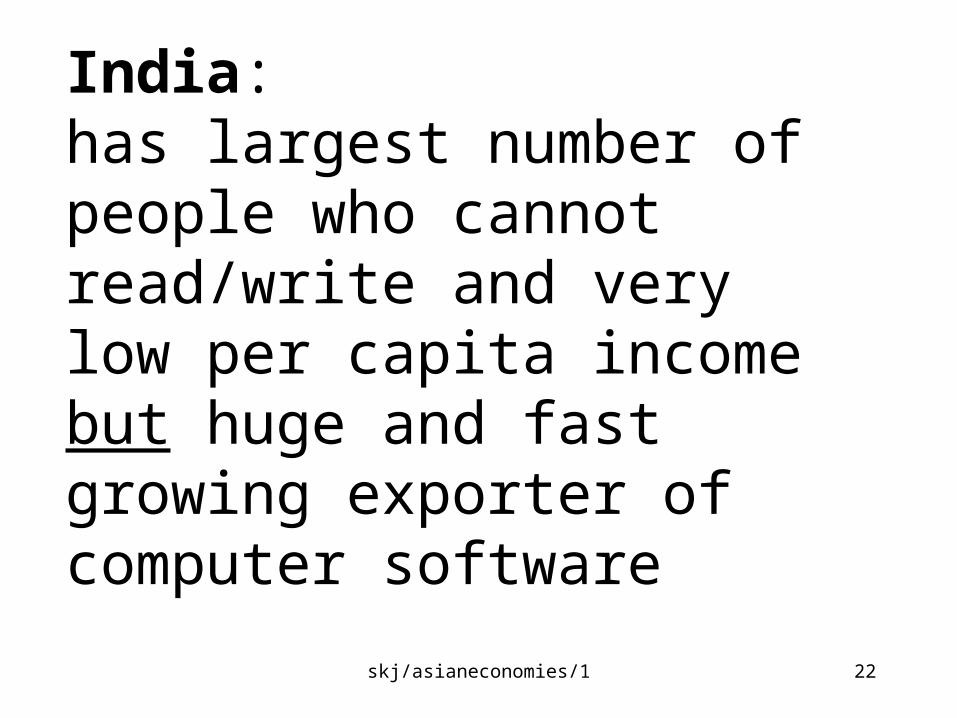
India: has largest number of people who cannot read/write and very low per capita income but huge and fast growing exporter of computer software
skj/asianeconomies/1 23
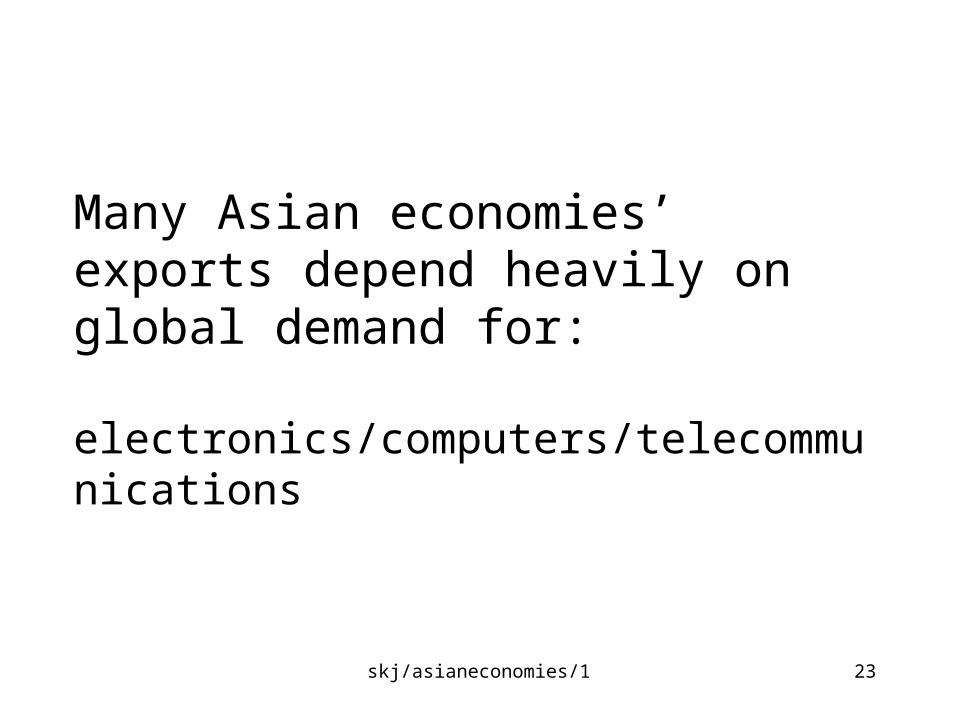
Many Asian economies’ exports depend heavily on global demand for:
electronics/computers/telecommunications
skj/asianeconomies/1 24
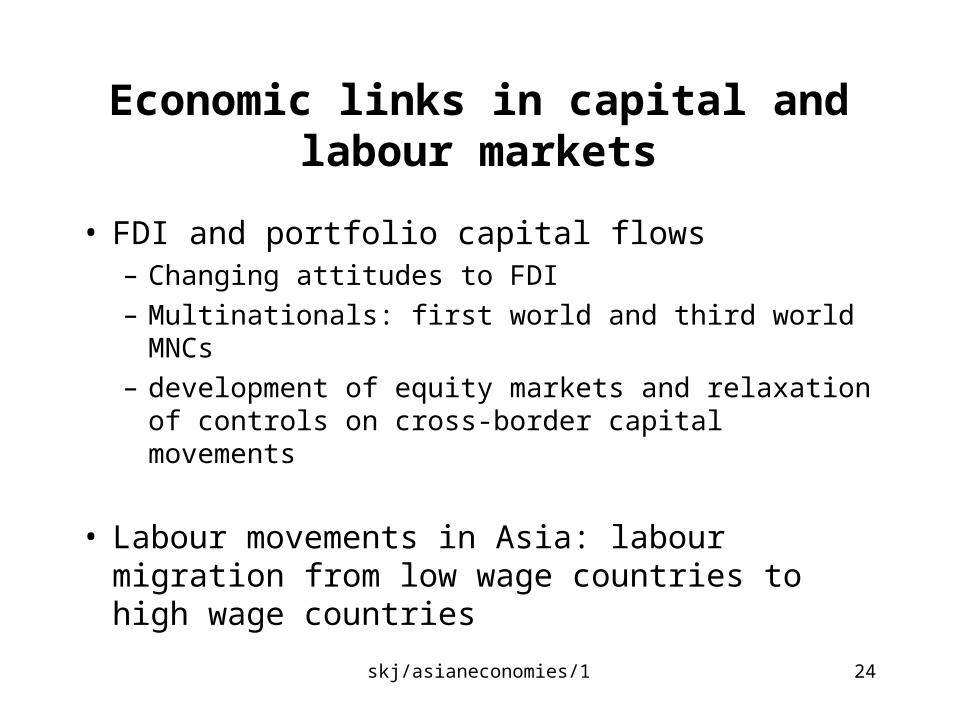
Economic links in capital and labour markets
• FDI and portfolio capital flows– Changing attitudes to FDI
– Multinationals: first world and third world MNCs
– development of equity markets and relaxation of controls on cross-border capital movements
• Labour movements in Asia: labour migration from low wage countries to high wage countries
skj/asianeconomies/1 25
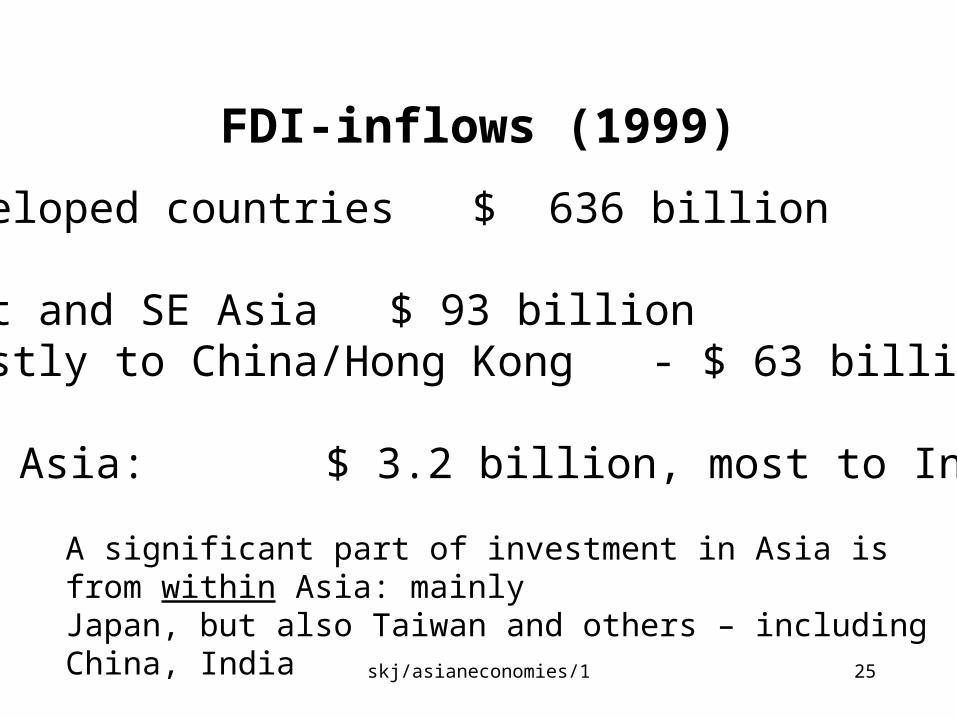
FDI-inflows (1999)
Developed countries $ 636 billion
East and SE Asia $ 93 billion(mostly to China/Hong Kong - $ 63 billion)
South Asia: $ 3.2 billion, most to India
A significant part of investment in Asia is from within Asia: mainlyJapan, but also Taiwan and others – including China, India
skj/asianeconomies/1 26
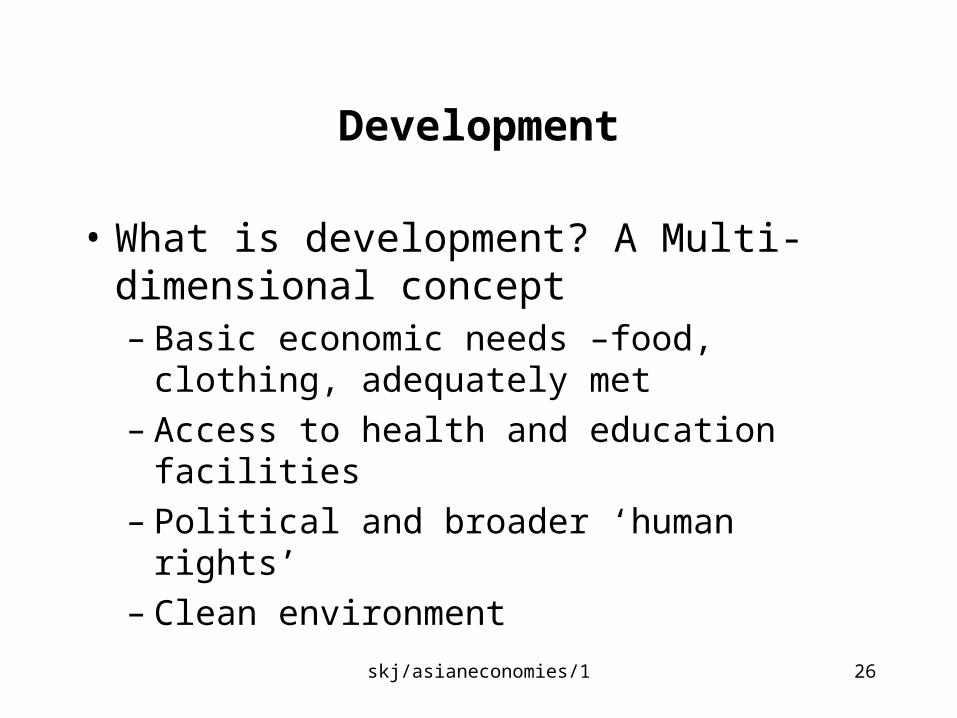
Development
• What is development? A Multi-dimensional concept– Basic economic needs –food, clothing,
adequately met– Access to health and education facilities– Political and broader ‘human rights’– Clean environment
skj/asianeconomies/1 27
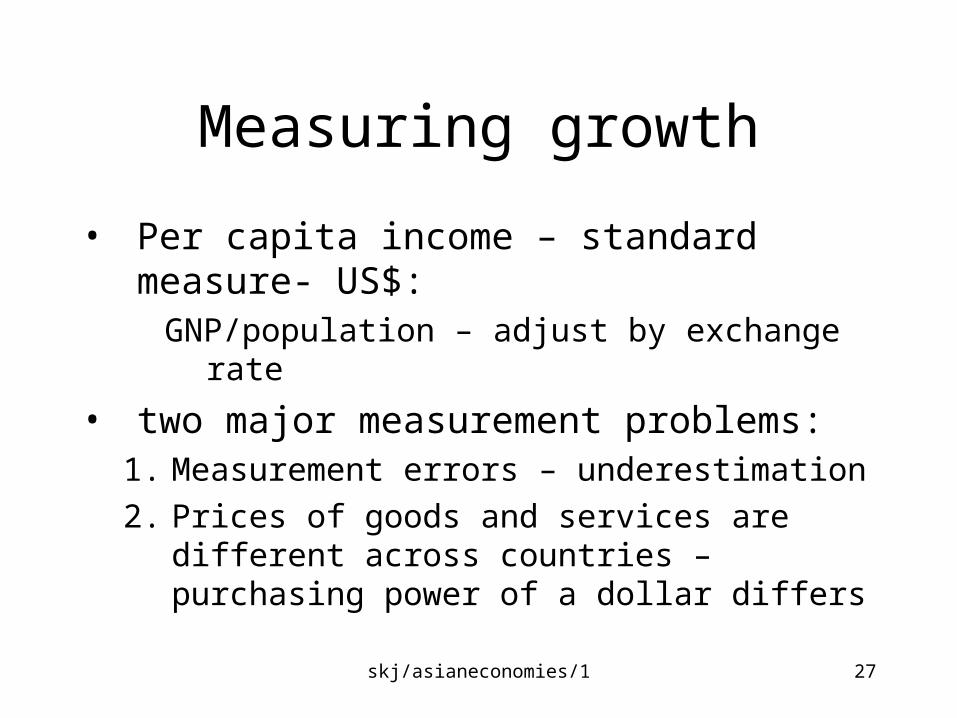
Measuring growth
• Per capita income – standard measure- US$:
GNP/population – adjust by exchange rate
• two major measurement problems:1. Measurement errors – underestimation
2. Prices of goods and services are different across countries – purchasing power of a dollar differs
skj/asianeconomies/1 28
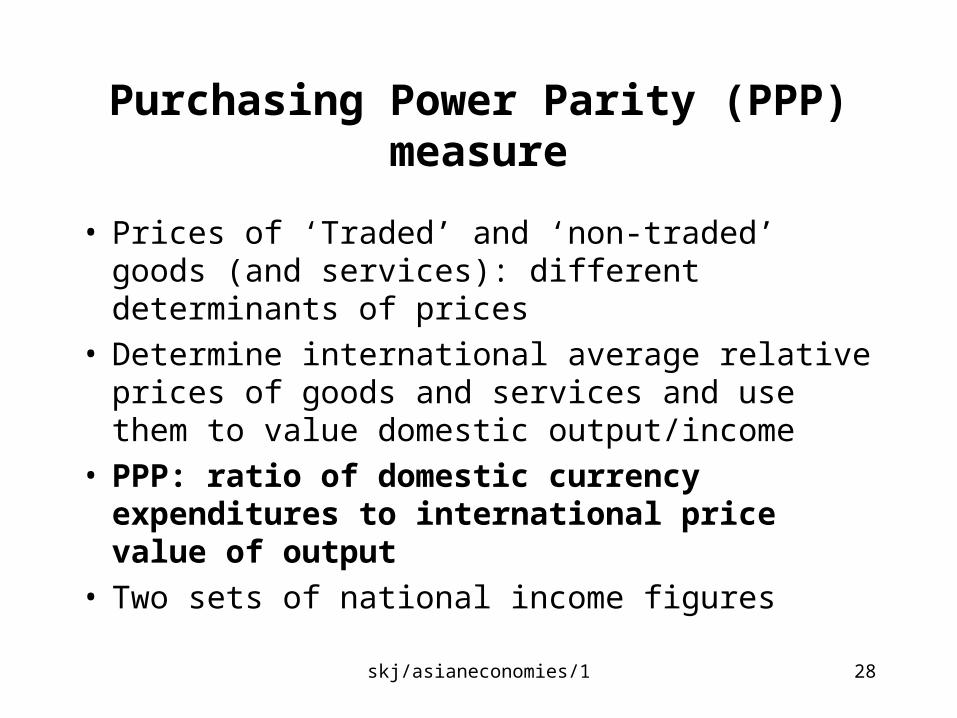
Purchasing Power Parity (PPP) measure
• Prices of ‘Traded’ and ‘non-traded’ goods (and services): different determinants of prices
• Determine international average relative prices of goods and services and use them to value domestic output/income
• PPP: ratio of domestic currency expenditures to international price value of output
• Two sets of national income figures
skj/asianeconomies/1 29
Asia: the big 3
Population Area GNP per cap income(millions)(‘ooo km2) (bn$)
$ PPP $ PPP$
------------------------------------------------------------Japan: 126 328 4,290 2,928 32,390 29,180
China: 1,239 9,597 929 3,984 750 3,220
India 980 3,228 421 1,661 430 1,700
skj/asianeconomies/1 30
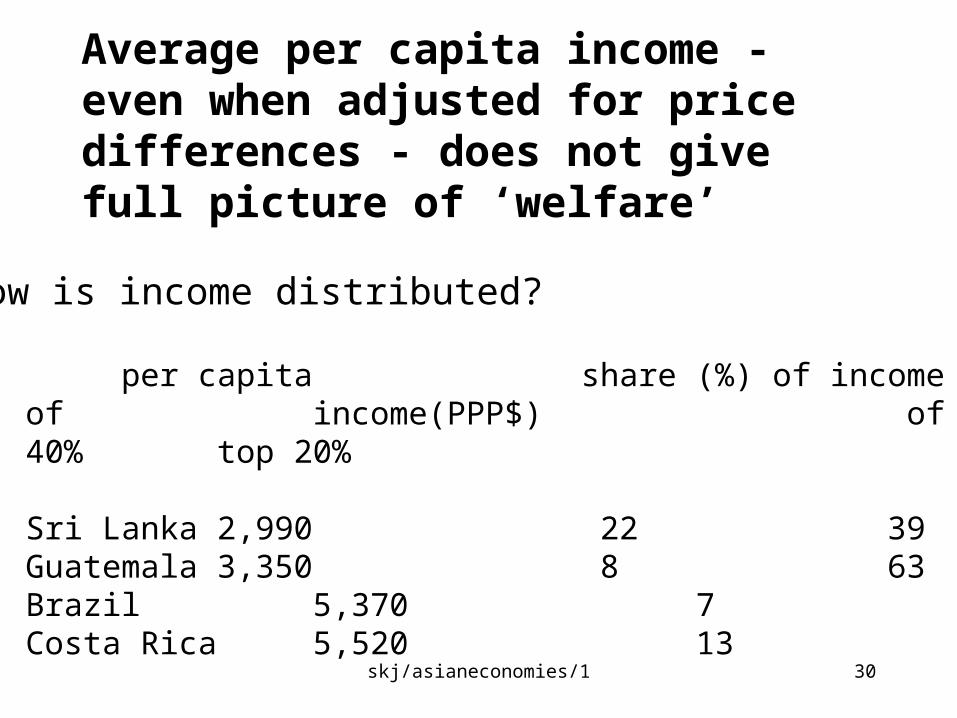
Average per capita income - even when adjusted for price differences - does not give full picture of ‘welfare’
per capita share (%) of income share of income(PPP$) of bottom 40% top 20%
Sri Lanka 2,990 22 39Guatemala 3,350 8 63Brazil 5,370 7 65Costa Rica 5,520 13 50
How is income distributed?
skj/asianeconomies/1 31
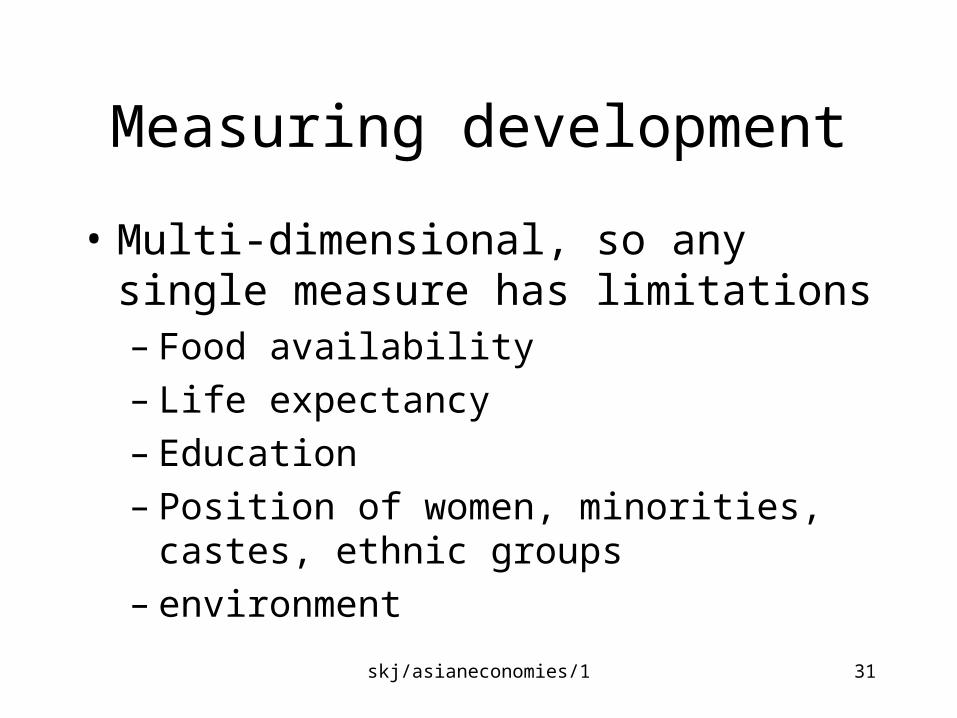
Measuring development
• Multi-dimensional, so any single measure has limitations– Food availability– Life expectancy– Education– Position of women, minorities, castes, ethnic
groups– environment
skj/asianeconomies/1 32
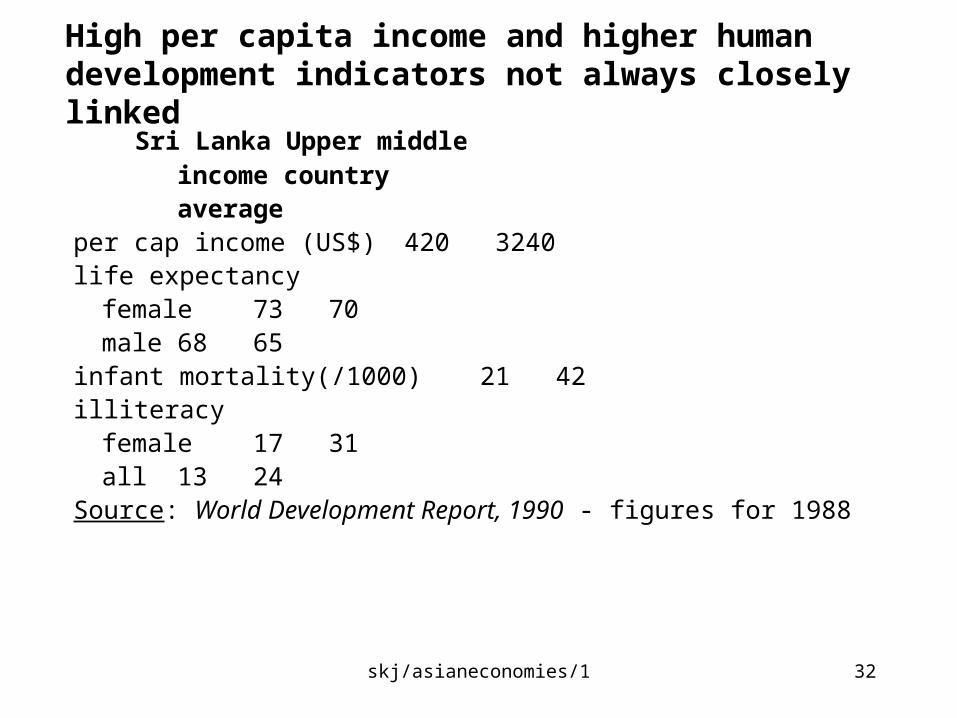
High per capita income and higher human development indicators not always closely linked
Sri Lanka Upper middle income country average
per cap income (US$) 420 3240 life expectancy
female 73 70male 68 65
infant mortality(/1000) 21 42illiteracy
female 17 31all 13 24
Source: World Development Report, 1990 - figures for 1988
skj/asianeconomies/1 33
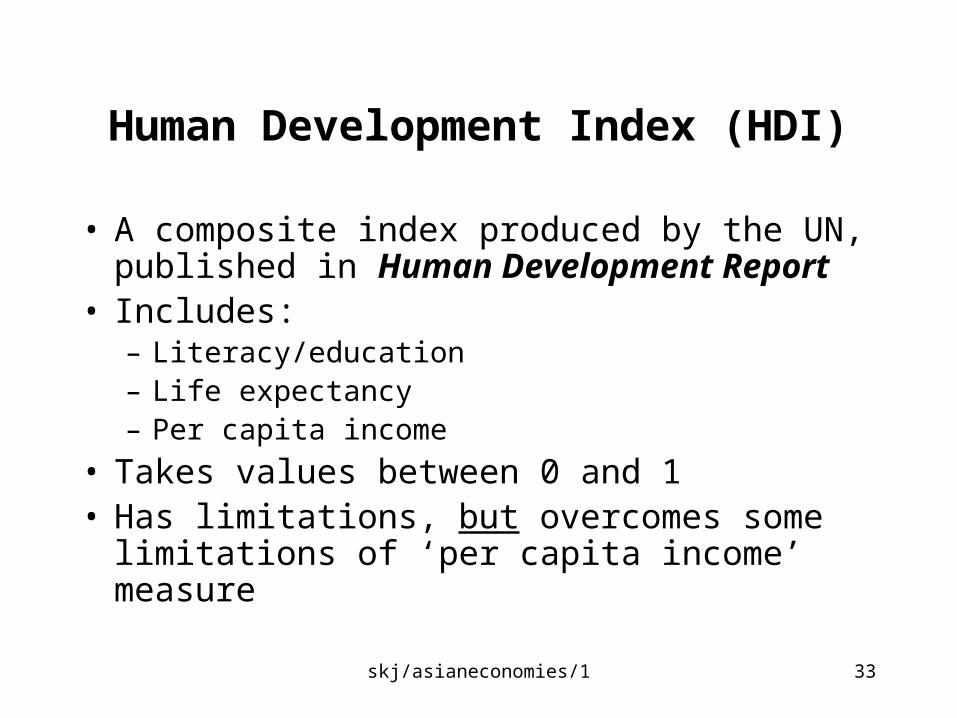
Human Development Index (HDI)
• A composite index produced by the UN, published in Human Development Report
• Includes:– Literacy/education– Life expectancy– Per capita income
• Takes values between 0 and 1• Has limitations, but overcomes some limitations
of ‘per capita income’ measure
Related Documents


