www.research.hsbc.com Disclosures & Disclaimer: This report must be read with the disclosures and the analyst certifications in the Disclosure appendix, and with the Disclaimer, which forms part of it. Economics Asia Q4 2019 By: Frederic Neumann and Qu Hongbin Asian Economics Bending, not breaking Trade tensions and wobbly local demand are weighing on growth in China and elsewhere in Asia But further policy easing, both fiscal and monetary, will strengthen resilience across the region… …even if it may take a little while longer for growth to swing back

Welcome message from author
This document is posted to help you gain knowledge. Please leave a comment to let me know what you think about it! Share it to your friends and learn new things together.
Transcript
www.research.hsbc.com
Disclosures & Disclaimer: This report must be read with the disclosures and the analyst certifications inthe Disclosure appendix, and with the Disclaimer, which forms part of it.
Q4 2019
Economics | A
siaA
sian Economics
EconomicsAsia
Q4 2019By: Frederic Neumann and Qu Hongbin
Asian EconomicsBending, not breaking
Trade tensions and wobbly local demand are weighing on growth in China and elsewhere in Asia
But further policy easing, both fiscal and monetary, will strengthen resilience across the region…
…even if it may take a little while longer for growth to swing back
1
Economics ● Asia Q4 2019
Things have been a little bumpier than expected across Asia, but the
region is firmly holding on to growth. Exports, the main fuel of Asia’s
economic engine, have dried up, with shipments falling for several
months. Trade tensions between the US and China are only partly to
blame: wobbly demand across developed and even many emerging
markets, as well as a tired electronics cycle, have equally weighed on
shipments. Hesitant easing in mainland China has further curtailed
growth, not only domestically, but more broadly across the region.
And yet, all considered, overall demand in Asia is ticking along at a
decent enough pace. To prevent a further slowdown, however, extra
easing, both monetary and fiscal, will be required. Even then, given
continued global headwinds, it will take a little while longer before
Asia swings back with its customary panache.
Not this time
Yes, things feel soggy. Look closely, however, and the region’s economies have arguably held up
better than many others, notably in the West. And yet, without extra stimulus, Asia, too, is bound
to slip further. Good news, then, that there is more easing in the pipeline.
That said, mainland China is not about to pull out the massive reflation investors got accustomed
to over previous cycles. It’s more about fine-tuning the stance, rather than pulling out all the stops:
incremental monetary and fiscal easing will have to do. As a result, HSBC’s Chief China Economist,
Qu Hongbin, expects growth to slow to 5.8% in 2020 from 6.2% this year.
That means that downward pressures on regional, if not global, trade will persist for a while, even
if trade tensions were to ease, say, because of a potential mini-deal between the US and China in
the coming weeks or months.
Further afield, the outlook for demand still looks shaky as well. As HSBC’s Group Chief Economist
Janet Henry and Global Economist James Pomeroy detail in a recent report: while there are lots
of attempts to ‘pump the air’ back into the global economy, growth in developed markets looks set
to slip further (see Global Economics Quarterly: putting the air back in, 26 September, 2019).
Which brings us back to the need for more stimulus. Almost all economies across Asia are
expected to ease monetary policy again in the coming months. Fiscal policy, meanwhile, has
turned more supportive as well, delivering an extra kick to growth from Korea to India, and the
Philippines to Singapore.
Executive summary
Economics ● Asia Q4 2019
2
As a result, growth in emerging Asia, excluding China, is expected to tick up from 4.1% in 2019 to
4.4% in 2020. This, of course, is still a disappointing pace by past standards, but it still highlights
the region’s resilience amid the global trade malaise.
The regional average naturally masks nuances. In Greater China, Hong Kong may pick up a little
steam after a sharp dip in growth this year, while Taiwan may slow at the margin given the continued
headwinds for global trade.
Japan faces a tougher outlook than many others in the region, with the latest VAT hike likely pushing
the economy into a mild recession and the Bank of Japan having less room to offer a cushion.
In Korea, another generous fiscal package should help offset the external drag, leaving growth
broadly unchanged.
Australia’s economy has lost a bit of steam this year, even as the labour market remains surprisingly
resilient and there are signs that housing demand is stabilising. With the RBA delivering swift cuts,
growth may tick up again next year. In New Zealand, too, the rapid pace of monetary loosening
should help lift growth at the margin in 2020.
Growth in India stumbled over the first half of 2019, partly due to election-related uncertainty, partly
as a result of earlier disruptions in credit transmission. However, a big tax cut and easing by the
Reserve Bank are expected to push growth back, even if at a still disappointing pace. Growth in
Sri Lanka is expected to trough this year, even if the recovery will be gradual, while Bangladesh
may top the region again in 2020.
Amid all the global turbulence, ASEAN continues to impress with its resilience. Indonesia’s growth
should hold at 5%, helped by some extra fiscal spending, while in the Philippines rebounding
infrastructure outlays should push growth again above 6% in 2020. However, the economies in
Thailand and Malaysia are expected to cool, amid a continued challenging outlook for exports and
a fading fiscal impulse. Singapore, too, will continue to be buffeted by global headwinds, but it has
the fiscal room to cushion the impact. And Vietnam, despite its surging competitiveness may slow
a little as global demand for its goods struggles to rebound.
…well, at least we’re still swinging, folks.
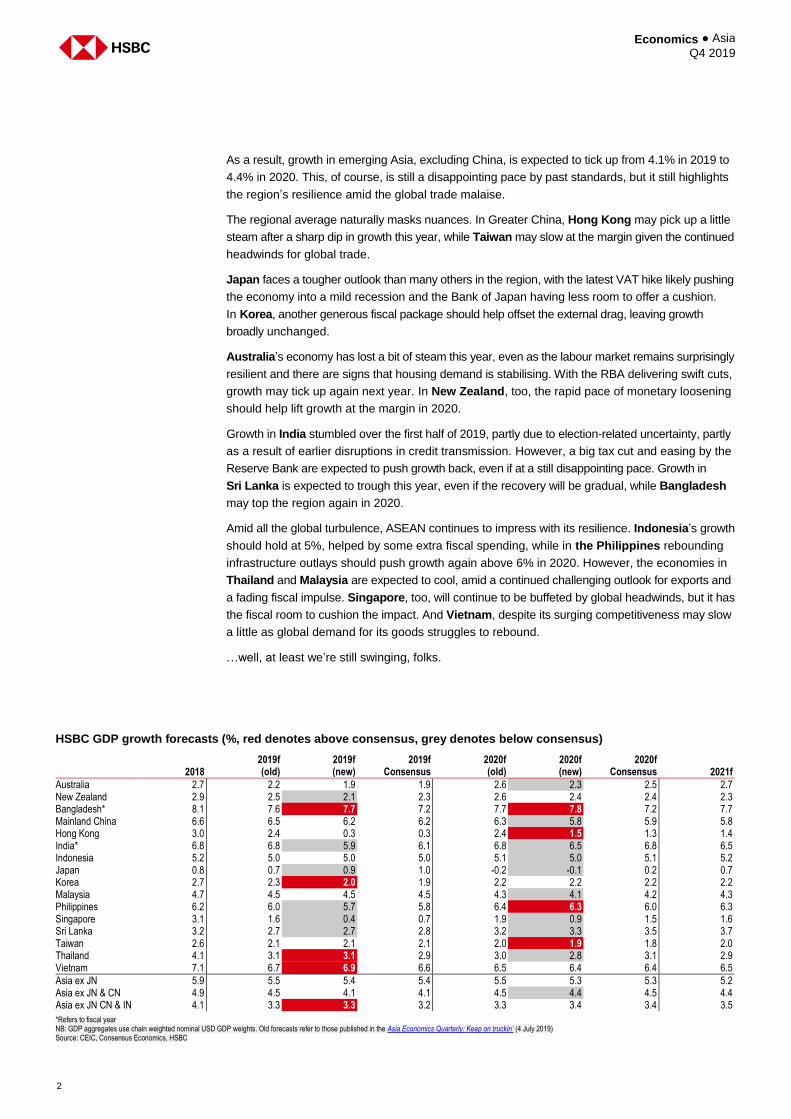
HSBC GDP growth forecasts (%, red denotes above consensus, grey denotes below consensus)
2018
2019f (old)
2019f (new)
2019f Consensus
2020f (old)
2020f (new)
2020f Consensus 2021f
Australia 2.7 2.2 1.9 1.9 2.6 2.3 2.5 2.7 New Zealand 2.9 2.5 2.1 2.3 2.6 2.4 2.4 2.3 Bangladesh* 8.1 7.6 7.7 7.2 7.7 7.8 7.2 7.7 Mainland China 6.6 6.5 6.2 6.2 6.3 5.8 5.9 5.8 Hong Kong 3.0 2.4 0.3 0.3 2.4 1.5 1.3 1.4 India* 6.8 6.8 5.9 6.1 6.8 6.5 6.8 6.5 Indonesia 5.2 5.0 5.0 5.0 5.1 5.0 5.1 5.2 Japan 0.8 0.7 0.9 1.0 -0.2 -0.1 0.2 0.7 Korea 2.7 2.3 2.0 1.9 2.2 2.2 2.2 2.2 Malaysia 4.7 4.5 4.5 4.5 4.3 4.1 4.2 4.3 Philippines 6.2 6.0 5.7 5.8 6.4 6.3 6.0 6.3 Singapore 3.1 1.6 0.4 0.7 1.9 0.9 1.5 1.6 Sri Lanka 3.2 2.7 2.7 2.8 3.2 3.3 3.5 3.7 Taiwan 2.6 2.1 2.1 2.1 2.0 1.9 1.8 2.0 Thailand 4.1 3.1 3.1 2.9 3.0 2.8 3.1 2.9 Vietnam 7.1 6.7 6.9 6.6 6.5 6.4 6.4 6.5
Asia ex JN 5.9 5.5 5.4 5.4 5.5 5.3 5.3 5.2 Asia ex JN & CN 4.9 4.5 4.1 4.1 4.5 4.4 4.5 4.4 Asia ex JN CN & IN 4.1 3.3 3.3 3.2 3.3 3.4 3.4 3.5
*Refers to fiscal year NB: GDP aggregates use chain weighted nominal USD GDP weights. Old forecasts refer to those published in the Asia Economics Quarterly: Keep on truckin’ (4 July 2019) Source: CEIC, Consensus Economics, HSBC
3
Economics ● Asia Q4 2019
Executive summary 1
Key forecasts 4
Monetary policy assumptions 5
Still slippin’ 6
Mainland China: Moderate
stimulus, slower growth 20
Indicators 27
GDP 28
Inflation 29
Industrial production & unemployment 30
Consumption & saving 31
Investment 32
Trade 33
Economy profiles 35
Australia 36
Bangladesh 40
Mainland China 44
Hong Kong 48
India 52
Indonesia 56
Japan 60
South Korea 64
Malaysia 68
New Zealand 72
Philippines 76
Singapore 80
Sri Lanka 84
Taiwan 88
Thailand 92
Vietnam 96
Disclosure appendix 101
Disclaimer 104
Contents
Economics ● Asia Q4 2019
4
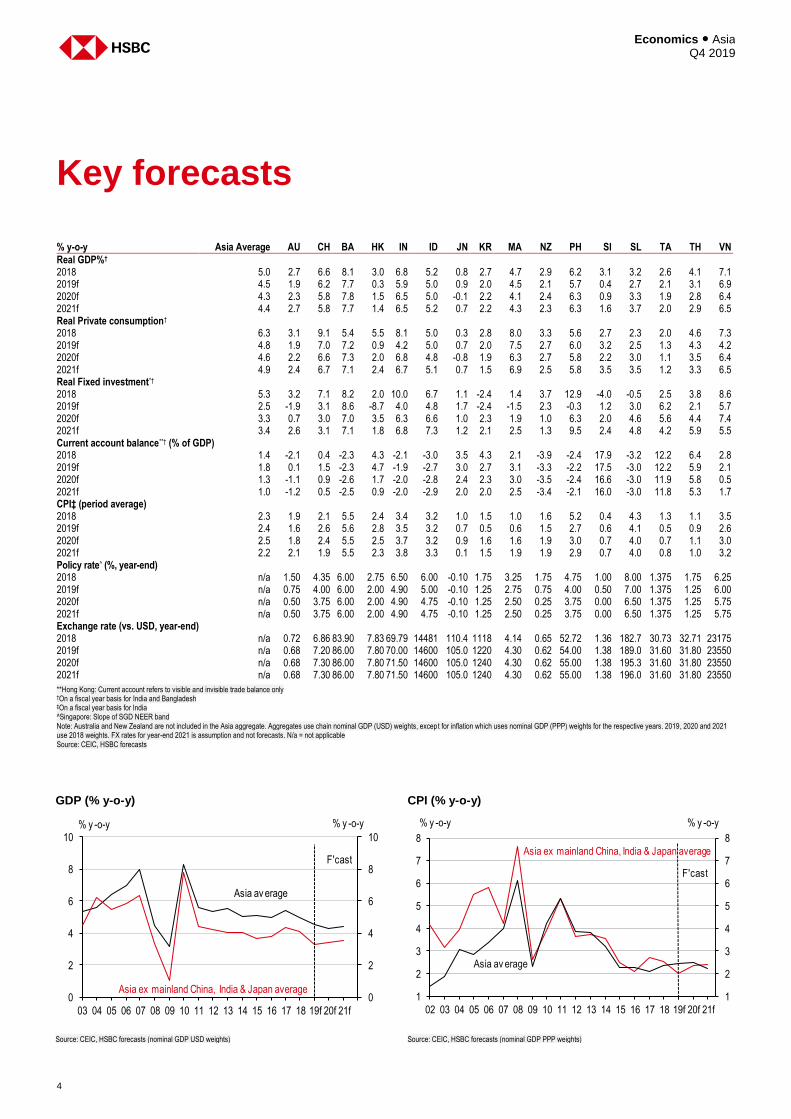
Key forecasts
% y-o-y Asia Average AU CH BA HK IN ID JN KR MA NZ PH SI SL TA TH VN
Real GDP%† 2018 5.0 2.7 6.6 8.1 3.0 6.8 5.2 0.8 2.7 4.7 2.9 6.2 3.1 3.2 2.6 4.1 7.1 2019f 4.5 1.9 6.2 7.7 0.3 5.9 5.0 0.9 2.0 4.5 2.1 5.7 0.4 2.7 2.1 3.1 6.9 2020f 4.3 2.3 5.8 7.8 1.5 6.5 5.0 -0.1 2.2 4.1 2.4 6.3 0.9 3.3 1.9 2.8 6.4 2021f 4.4 2.7 5.8 7.7 1.4 6.5 5.2 0.7 2.2 4.3 2.3 6.3 1.6 3.7 2.0 2.9 6.5 Real Private consumption† 2018 6.3 3.1 9.1 5.4 5.5 8.1 5.0 0.3 2.8 8.0 3.3 5.6 2.7 2.3 2.0 4.6 7.3 2019f 4.8 1.9 7.0 7.2 0.9 4.2 5.0 0.7 2.0 7.5 2.7 6.0 3.2 2.5 1.3 4.3 4.2 2020f 4.6 2.2 6.6 7.3 2.0 6.8 4.8 -0.8 1.9 6.3 2.7 5.8 2.2 3.0 1.1 3.5 6.4 2021f 4.9 2.4 6.7 7.1 2.4 6.7 5.1 0.7 1.5 6.9 2.5 5.8 3.5 3.5 1.2 3.3 6.5 Real Fixed investment*† 2018 5.3 3.2 7.1 8.2 2.0 10.0 6.7 1.1 -2.4 1.4 3.7 12.9 -4.0 -0.5 2.5 3.8 8.6 2019f 2.5 -1.9 3.1 8.6 -8.7 4.0 4.8 1.7 -2.4 -1.5 2.3 -0.3 1.2 3.0 6.2 2.1 5.7 2020f 3.3 0.7 3.0 7.0 3.5 6.3 6.6 1.0 2.3 1.9 1.0 6.3 2.0 4.6 5.6 4.4 7.4 2021f 3.4 2.6 3.1 7.1 1.8 6.8 7.3 1.2 2.1 2.5 1.3 9.5 2.4 4.8 4.2 5.9 5.5 Current account balance**† (% of GDP) 2018 1.4 -2.1 0.4 -2.3 4.3 -2.1 -3.0 3.5 4.3 2.1 -3.9 -2.4 17.9 -3.2 12.2 6.4 2.8 2019f 1.8 0.1 1.5 -2.3 4.7 -1.9 -2.7 3.0 2.7 3.1 -3.3 -2.2 17.5 -3.0 12.2 5.9 2.1 2020f 1.3 -1.1 0.9 -2.6 1.7 -2.0 -2.8 2.4 2.3 3.0 -3.5 -2.4 16.6 -3.0 11.9 5.8 0.5 2021f 1.0 -1.2 0.5 -2.5 0.9 -2.0 -2.9 2.0 2.0 2.5 -3.4 -2.1 16.0 -3.0 11.8 5.3 1.7 CPI‡ (period average) 2018 2.3 1.9 2.1 5.5 2.4 3.4 3.2 1.0 1.5 1.0 1.6 5.2 0.4 4.3 1.3 1.1 3.5 2019f 2.4 1.6 2.6 5.6 2.8 3.5 3.2 0.7 0.5 0.6 1.5 2.7 0.6 4.1 0.5 0.9 2.6 2020f 2.5 1.8 2.4 5.5 2.5 3.7 3.2 0.9 1.6 1.6 1.9 3.0 0.7 4.0 0.7 1.1 3.0 2021f 2.2 2.1 1.9 5.5 2.3 3.8 3.3 0.1 1.5 1.9 1.9 2.9 0.7 4.0 0.8 1.0 3.2 Policy rate^ (%, year-end) 2018 n/a 1.50 4.35 6.00 2.75 6.50 6.00 -0.10 1.75 3.25 1.75 4.75 1.00 8.00 1.375 1.75 6.25 2019f n/a 0.75 4.00 6.00 2.00 4.90 5.00 -0.10 1.25 2.75 0.75 4.00 0.50 7.00 1.375 1.25 6.00 2020f n/a 0.50 3.75 6.00 2.00 4.90 4.75 -0.10 1.25 2.50 0.25 3.75 0.00 6.50 1.375 1.25 5.75 2021f n/a 0.50 3.75 6.00 2.00 4.90 4.75 -0.10 1.25 2.50 0.25 3.75 0.00 6.50 1.375 1.25 5.75 Exchange rate (vs. USD, year-end) 2018 n/a 0.72 6.86 83.90 7.83 69.79 14481 110.4 1118 4.14 0.65 52.72 1.36 182.7 30.73 32.71 23175 2019f n/a 0.68 7.20 86.00 7.80 70.00 14600 105.0 1220 4.30 0.62 54.00 1.38 189.0 31.60 31.80 23550 2020f n/a 0.68 7.30 86.00 7.80 71.50 14600 105.0 1240 4.30 0.62 55.00 1.38 195.3 31.60 31.80 23550 2021f n/a 0.68 7.30 86.00 7.80 71.50 14600 105.0 1240 4.30 0.62 55.00 1.38 196.0 31.60 31.80 23550
**Hong Kong: Current account refers to visible and invisible trade balance only †On a fiscal year basis for India and Bangladesh ‡On a fiscal year basis for India ^Singapore: Slope of SGD NEER band Note: Australia and New Zealand are not included in the Asia aggregate. Aggregates use chain nominal GDP (USD) weights, except for inflation which uses nominal GDP (PPP) weights for the respective years. 2019, 2020 and 2021 use 2018 weights. FX rates for year-end 2021 is assumption and not forecasts. N/a = not applicable Source: CEIC, HSBC forecasts
GDP (% y-o-y) CPI (% y-o-y)
Source: CEIC, HSBC forecasts (nominal GDP USD weights) Source: CEIC, HSBC forecasts (nominal GDP PPP weights)
0
2
4
6
8
10
0
2
4
6
8
10
03 04 05 06 07 08 09 10 11 12 13 14 15 16 17 18 19f 20f 21f
Asia av erage
Asia ex mainland China, India & Japan average
F'cast
% y -o-y % y -o-y
1
2
3
4
5
6
7
8
1
2
3
4
5
6
7
8
02 03 04 05 06 07 08 09 10 11 12 13 14 15 16 17 18 19f 20f 21f
% y -o-y % y -o-y
Asia ex mainland China, India & Japan average
Asia av erage
F'cast
5
Economics ● Asia Q4 2019
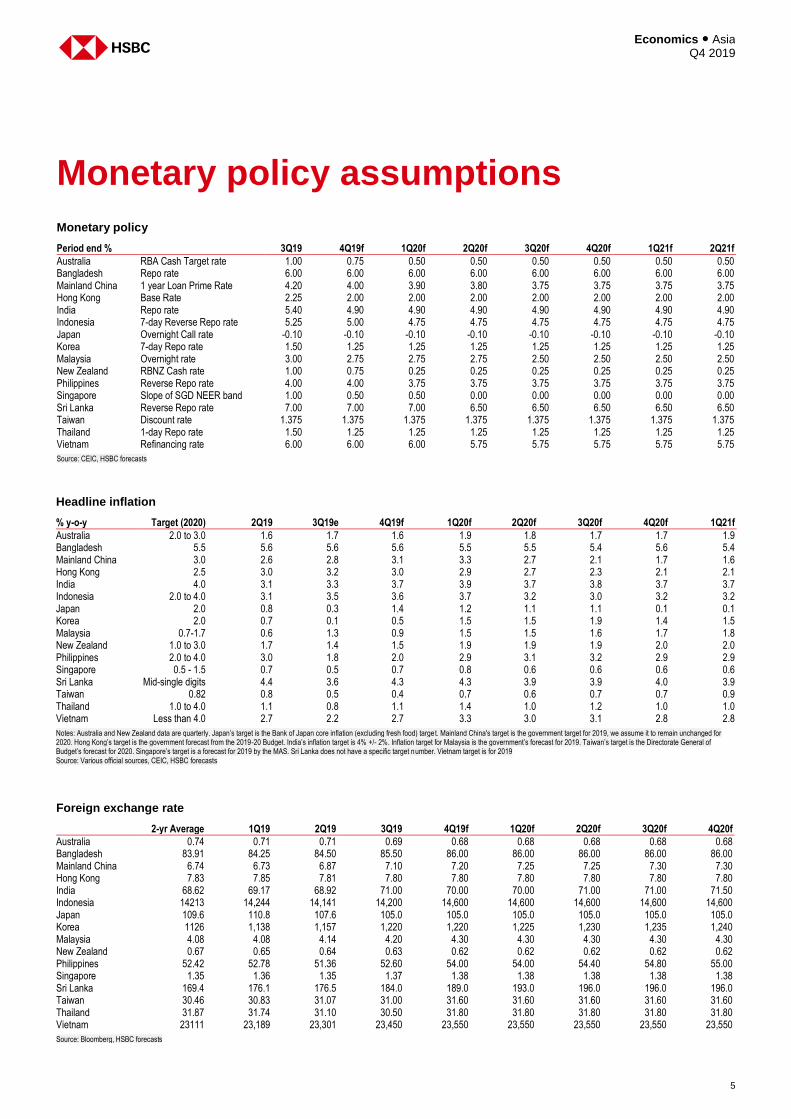
Monetary policy assumptions Monetary policy
Period end % 3Q19 4Q19f 1Q20f 2Q20f 3Q20f 4Q20f 1Q21f 2Q21f
Australia RBA Cash Target rate 1.00 0.75 0.50 0.50 0.50 0.50 0.50 0.50 Bangladesh Repo rate 6.00 6.00 6.00 6.00 6.00 6.00 6.00 6.00 Mainland China 1 year Loan Prime Rate 4.20 4.00 3.90 3.80 3.75 3.75 3.75 3.75 Hong Kong Base Rate 2.25 2.00 2.00 2.00 2.00 2.00 2.00 2.00 India Repo rate 5.40 4.90 4.90 4.90 4.90 4.90 4.90 4.90 Indonesia 7-day Reverse Repo rate 5.25 5.00 4.75 4.75 4.75 4.75 4.75 4.75 Japan Overnight Call rate -0.10 -0.10 -0.10 -0.10 -0.10 -0.10 -0.10 -0.10 Korea 7-day Repo rate 1.50 1.25 1.25 1.25 1.25 1.25 1.25 1.25 Malaysia Overnight rate 3.00 2.75 2.75 2.75 2.50 2.50 2.50 2.50 New Zealand RBNZ Cash rate 1.00 0.75 0.25 0.25 0.25 0.25 0.25 0.25 Philippines Reverse Repo rate 4.00 4.00 3.75 3.75 3.75 3.75 3.75 3.75 Singapore Slope of SGD NEER band 1.00 0.50 0.50 0.00 0.00 0.00 0.00 0.00 Sri Lanka Reverse Repo rate 7.00 7.00 7.00 6.50 6.50 6.50 6.50 6.50 Taiwan Discount rate 1.375 1.375 1.375 1.375 1.375 1.375 1.375 1.375 Thailand 1-day Repo rate 1.50 1.25 1.25 1.25 1.25 1.25 1.25 1.25 Vietnam Refinancing rate 6.00 6.00 6.00 5.75 5.75 5.75 5.75 5.75
Source: CEIC, HSBC forecasts
Headline inflation
% y-o-y Target (2020) 2Q19 3Q19e 4Q19f 1Q20f 2Q20f 3Q20f 4Q20f 1Q21f
Australia 2.0 to 3.0 1.6 1.7 1.6 1.9 1.8 1.7 1.7 1.9 Bangladesh 5.5 5.6 5.6 5.6 5.5 5.5 5.4 5.6 5.4 Mainland China 3.0 2.6 2.8 3.1 3.3 2.7 2.1 1.7 1.6 Hong Kong 2.5 3.0 3.2 3.0 2.9 2.7 2.3 2.1 2.1 India 4.0 3.1 3.3 3.7 3.9 3.7 3.8 3.7 3.7 Indonesia 2.0 to 4.0 3.1 3.5 3.6 3.7 3.2 3.0 3.2 3.2 Japan 2.0 0.8 0.3 1.4 1.2 1.1 1.1 0.1 0.1 Korea 2.0 0.7 0.1 0.5 1.5 1.5 1.9 1.4 1.5 Malaysia 0.7-1.7 0.6 1.3 0.9 1.5 1.5 1.6 1.7 1.8 New Zealand 1.0 to 3.0 1.7 1.4 1.5 1.9 1.9 1.9 2.0 2.0 Philippines 2.0 to 4.0 3.0 1.8 2.0 2.9 3.1 3.2 2.9 2.9 Singapore 0.5 - 1.5 0.7 0.5 0.7 0.8 0.6 0.6 0.6 0.6 Sri Lanka Mid-single digits 4.4 3.6 4.3 4.3 3.9 3.9 4.0 3.9 Taiwan 0.82 0.8 0.5 0.4 0.7 0.6 0.7 0.7 0.9 Thailand 1.0 to 4.0 1.1 0.8 1.1 1.4 1.0 1.2 1.0 1.0 Vietnam Less than 4.0 2.7 2.2 2.7 3.3 3.0 3.1 2.8 2.8
Notes: Australia and New Zealand data are quarterly. Japan’s target is the Bank of Japan core inflation (excluding fresh food) targe t. Mainland China's target is the government target for 2019, we assume it to remain unchanged for 2020. Hong Kong’s target is the government forecast from the 2019-20 Budget. India’s inflation target is 4% +/- 2%. Inflation target for Malaysia is the government’s forecast for 2019. Taiwan’s target is the Directorate General of Budget’s forecast for 2020. Singapore’s target is a forecast for 2019 by the MAS. Sri Lanka does not have a specific target number. Vietnam target is for 2019 Source: Various official sources, CEIC, HSBC forecasts
Foreign exchange rate
2-yr Average 1Q19 2Q19 3Q19 4Q19f 1Q20f 2Q20f 3Q20f 4Q20f
Australia 0.74 0.71 0.71 0.69 0.68 0.68 0.68 0.68 0.68 Bangladesh 83.91 84.25 84.50 85.50 86.00 86.00 86.00 86.00 86.00 Mainland China 6.74 6.73 6.87 7.10 7.20 7.25 7.25 7.30 7.30 Hong Kong 7.83 7.85 7.81 7.80 7.80 7.80 7.80 7.80 7.80 India 68.62 69.17 68.92 71.00 70.00 70.00 71.00 71.00 71.50 Indonesia 14213 14,244 14,141 14,200 14,600 14,600 14,600 14,600 14,600 Japan 109.6 110.8 107.6 105.0 105.0 105.0 105.0 105.0 105.0 Korea 1126 1,138 1,157 1,220 1,220 1,225 1,230 1,235 1,240 Malaysia 4.08 4.08 4.14 4.20 4.30 4.30 4.30 4.30 4.30 New Zealand 0.67 0.65 0.64 0.63 0.62 0.62 0.62 0.62 0.62 Philippines 52.42 52.78 51.36 52.60 54.00 54.00 54.40 54.80 55.00 Singapore 1.35 1.36 1.35 1.37 1.38 1.38 1.38 1.38 1.38 Sri Lanka 169.4 176.1 176.5 184.0 189.0 193.0 196.0 196.0 196.0 Taiwan 30.46 30.83 31.07 31.00 31.60 31.60 31.60 31.60 31.60 Thailand 31.87 31.74 31.10 30.50 31.80 31.80 31.80 31.80 31.80 Vietnam 23111 23,189 23,301 23,450 23,550 23,550 23,550 23,550 23,550
Source: Bloomberg, HSBC forecasts
Economics ● Asia Q4 2019
6
Some steadier than others
Rough summer. The headlines came hard and fast. The customary seasonal lull that investors
and policymakers once enjoyed seems now part of a cherished past. Tariff tensions escalated
in a matter of days before easing once again; financial markets, not surprisingly, gyrated in a
correspondingly ferocious manner; and the broadly darkening flow of economic data was fitfully
interrupted by tender green shoots.
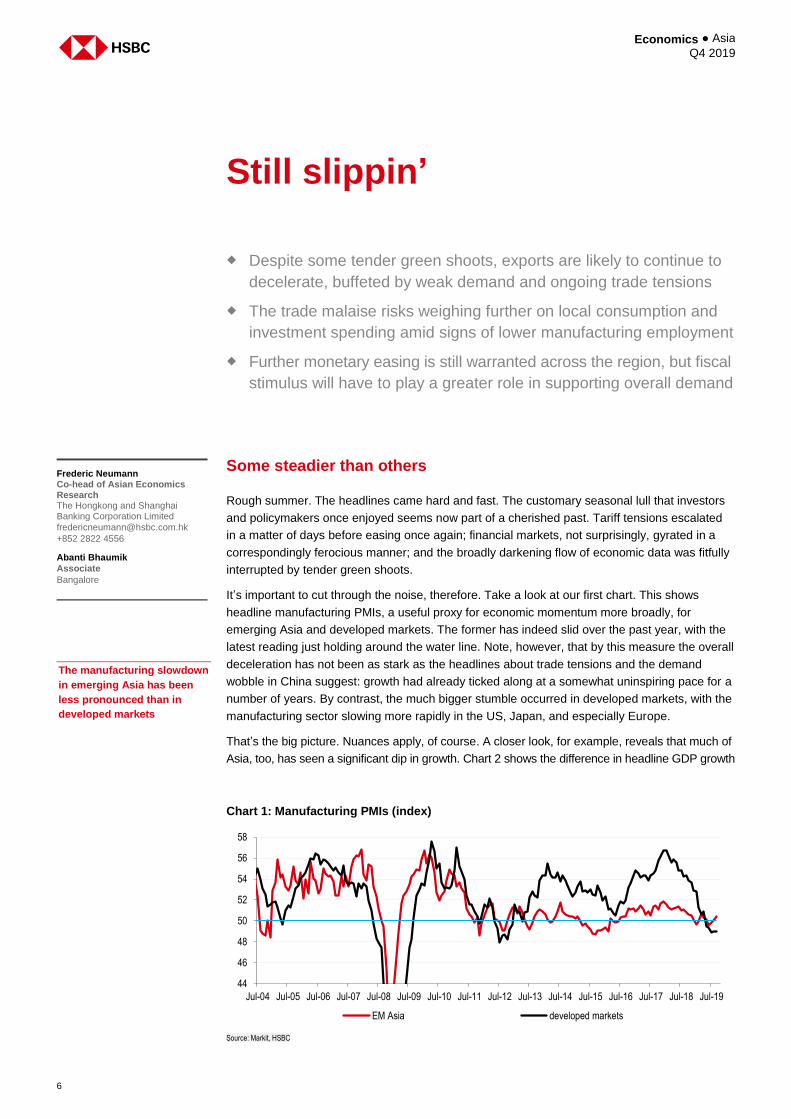
It’s important to cut through the noise, therefore. Take a look at our first chart. This shows
headline manufacturing PMIs, a useful proxy for economic momentum more broadly, for
emerging Asia and developed markets. The former has indeed slid over the past year, with the
latest reading just holding around the water line. Note, however, that by this measure the overall
deceleration has not been as stark as the headlines about trade tensions and the demand
wobble in China suggest: growth had already ticked along at a somewhat uninspiring pace for a
number of years. By contrast, the much bigger stumble occurred in developed markets, with the
manufacturing sector slowing more rapidly in the US, Japan, and especially Europe.
That’s the big picture. Nuances apply, of course. A closer look, for example, reveals that much of
Asia, too, has seen a significant dip in growth. Chart 2 shows the difference in headline GDP growth
Still slippin’
Despite some tender green shoots, exports are likely to continue to
decelerate, buffeted by weak demand and ongoing trade tensions
The trade malaise risks weighing further on local consumption and
investment spending amid signs of lower manufacturing employment
Further monetary easing is still warranted across the region, but fiscal
stimulus will have to play a greater role in supporting overall demand
Chart 1: Manufacturing PMIs (index)
Source: Markit, HSBC
Frederic Neumann Co-head of Asian Economics Research The Hongkong and Shanghai Banking Corporation Limited
+852 2822 4556
Abanti Bhaumik
Associate
Bangalore
The manufacturing slowdown
in emerging Asia has been
less pronounced than in
developed markets
44
46
48
50
52
54
56
58
Jul-04 Jul-05 Jul-06 Jul-07 Jul-08 Jul-09 Jul-10 Jul-11 Jul-12 Jul-13 Jul-14 Jul-15 Jul-16 Jul-17 Jul-18 Jul-19
EM Asia developed markets

7
Economics ● Asia Q4 2019
between the second quarter of this year and the last quarter of 2018 (in % y-o-y terms). Almost
all economies across the region have decelerated (further) over the first half of 2019, with India,
Thailand, Singapore, and Korea slipping the most. By contrast, New Zealand, Malaysia, Taiwan, and
Japan picked up a little steam. In the latter, this reflects a divergence: while the manufacturing sector
is buffeted by weak exports, local demand has been surprisingly robust. Taiwan, meanwhile, is
bucking the trend partly because of supply chain tweaks that prompted the move of some production
and, thus, investment, back onshore.
All about exports
Much of the growth deceleration, though not all, can be traced to the global trade malaise -- although,
again, not all economies have been hit equally hard. Chart 3 shows average nominal export growth
for the fourth quarter of last year and the latest available three months. Note the drop in shipments in
Korea, Indonesia, Singapore, Hong Kong, Japan, Malaysia, New Zealand, and Thailand. By contrast,
Australia and Vietnam continued to see solid gains, followed by Sri Lanka and the Philippines.
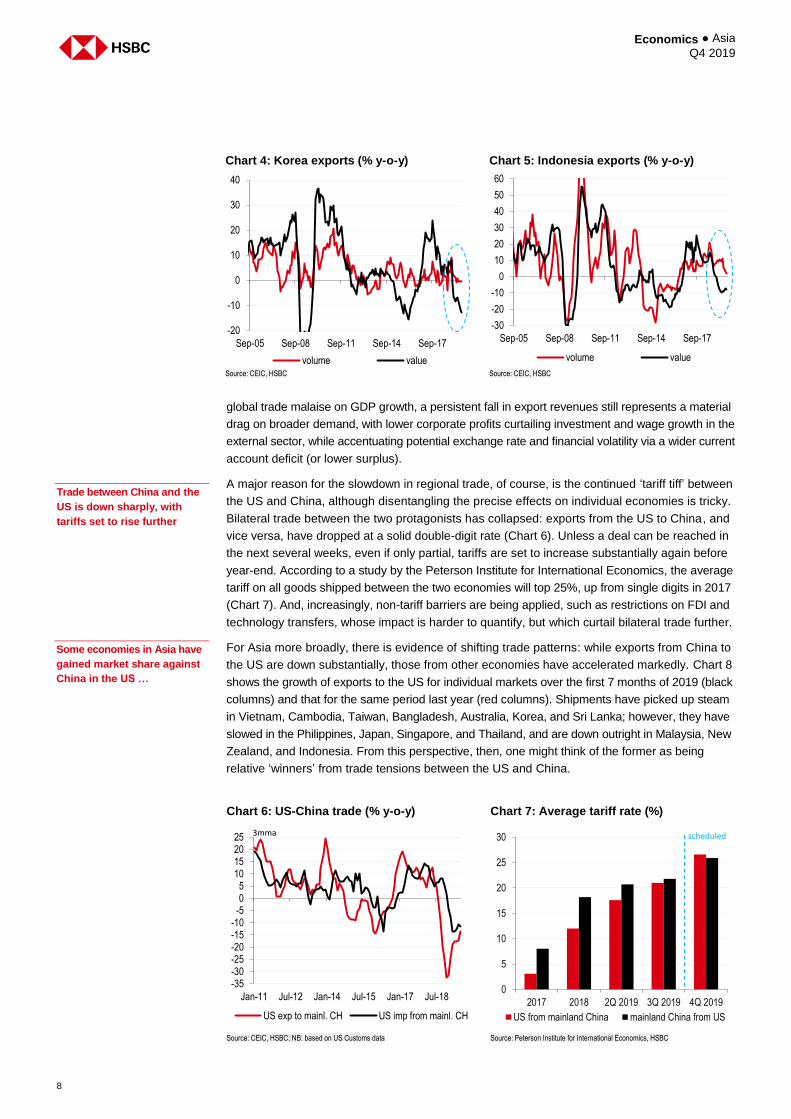
The fall in shipment values partly reflects price declines, with volumes often holding up much better.
In Korea, for instance, the fall in semiconductor prices has pulled down headline export growth,
while underlying shipments are roughly flat on the year (chart 4). In Indonesia, too, the drop in coal
and palm oil prices has depressed export earnings even as volumes have remained positive so
far (chart 5). While the relative resilience of shipment volumes blunts the immediate impact of the
Chart 2: Difference between 2Q 2019 and 4Q 2018 real GDP growth (ppt, y-o-y terms)
Source: CEIC, HSBC; NB: CH refers to mainland China
Chart 3: Nominal export growth (% y-o-y)
Source: CEIC, HSBC; NB: CH refers to mainland China
Nominal exports have fallen
in most economies
-2.0
-1.5
-1.0
-0.5
0.0
0.5
1.0
IN TH SI KR PH AU HK VN SL CH ID NZ MA TA JN
-15
-10
-5
0
5
10
15
KR ID SI HK JN MA NZ TH IN CH TA PH SL VN AU
2018 4Q avg latest 3mma
Economics ● Asia Q4 2019
8
global trade malaise on GDP growth, a persistent fall in export revenues still represents a material
drag on broader demand, with lower corporate profits curtailing investment and wage growth in the
external sector, while accentuating potential exchange rate and financial volatility via a wider current
account deficit (or lower surplus).
A major reason for the slowdown in regional trade, of course, is the continued ‘tariff tiff’ between
the US and China, although disentangling the precise effects on individual economies is tricky.
Bilateral trade between the two protagonists has collapsed: exports from the US to China, and
vice versa, have dropped at a solid double-digit rate (Chart 6). Unless a deal can be reached in
the next several weeks, even if only partial, tariffs are set to increase substantially again before
year-end. According to a study by the Peterson Institute for International Economics, the average
tariff on all goods shipped between the two economies will top 25%, up from single digits in 2017
(Chart 7). And, increasingly, non-tariff barriers are being applied, such as restrictions on FDI and
technology transfers, whose impact is harder to quantify, but which curtail bilateral trade further.
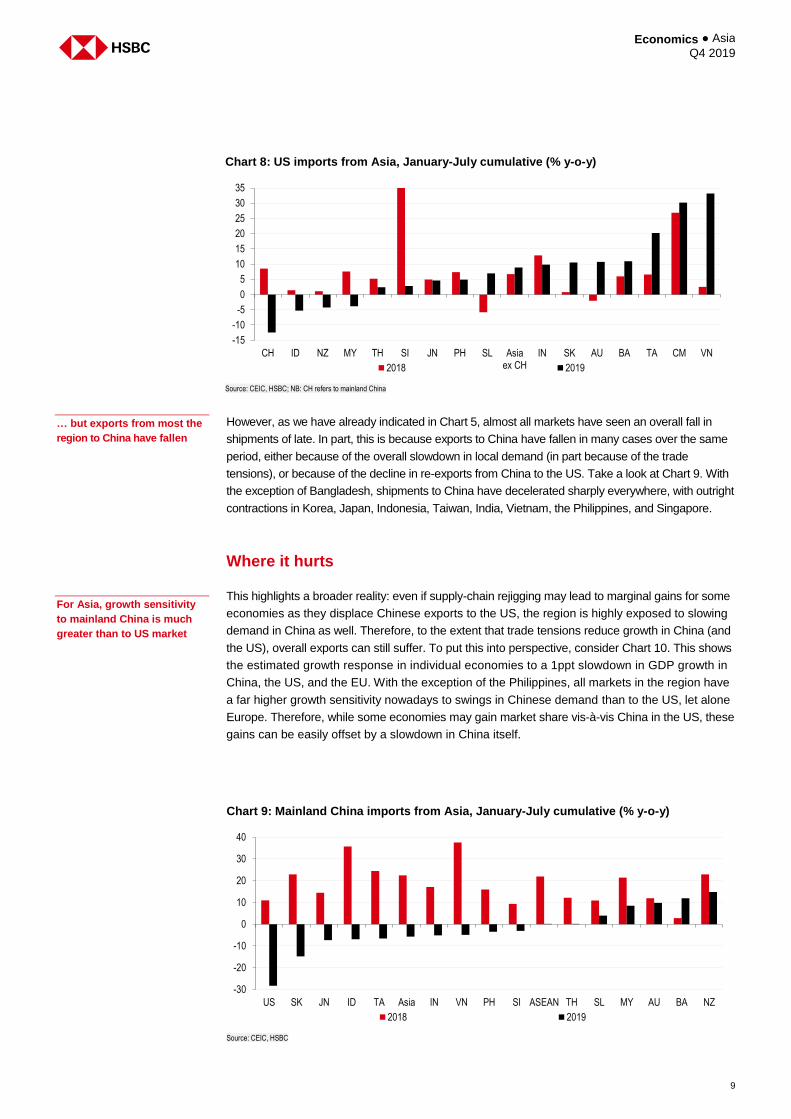
For Asia more broadly, there is evidence of shifting trade patterns: while exports from China to
the US are down substantially, those from other economies have accelerated markedly. Chart 8
shows the growth of exports to the US for individual markets over the first 7 months of 2019 (black
columns) and that for the same period last year (red columns). Shipments have picked up steam
in Vietnam, Cambodia, Taiwan, Bangladesh, Australia, Korea, and Sri Lanka; however, they have
slowed in the Philippines, Japan, Singapore, and Thailand, and are down outright in Malaysia, New
Zealand, and Indonesia. From this perspective, then, one might think of the former as being
relative ‘winners’ from trade tensions between the US and China.
Chart 4: Korea exports (% y-o-y) Chart 5: Indonesia exports (% y-o-y)
Source: CEIC, HSBC Source: CEIC, HSBC
Trade between China and the
US is down sharply, with
tariffs set to rise further
Chart 6: US-China trade (% y-o-y) Chart 7: Average tariff rate (%)
Source: CEIC, HSBC; NB: based on US Customs data Source: Peterson Institute for International Economics, HSBC
Some economies in Asia have
gained market share against
China in the US …
-20
-10
0
10
20
30
40
Sep-05 Sep-08 Sep-11 Sep-14 Sep-17
volume value
-30
-20
-10
0
10
20
30
40
50
60
Sep-05 Sep-08 Sep-11 Sep-14 Sep-17
volume value
-35-30-25-20-15-10-505
10152025
Jan-11 Jul-12 Jan-14 Jul-15 Jan-17 Jul-18
US exp to mainl. CH US imp from mainl. CH
3mma
0
5
10
15
20
25
30
2017 2018 2Q 2019 3Q 2019 4Q 2019
US from mainland China mainland China from US
scheduled
9
Economics ● Asia Q4 2019
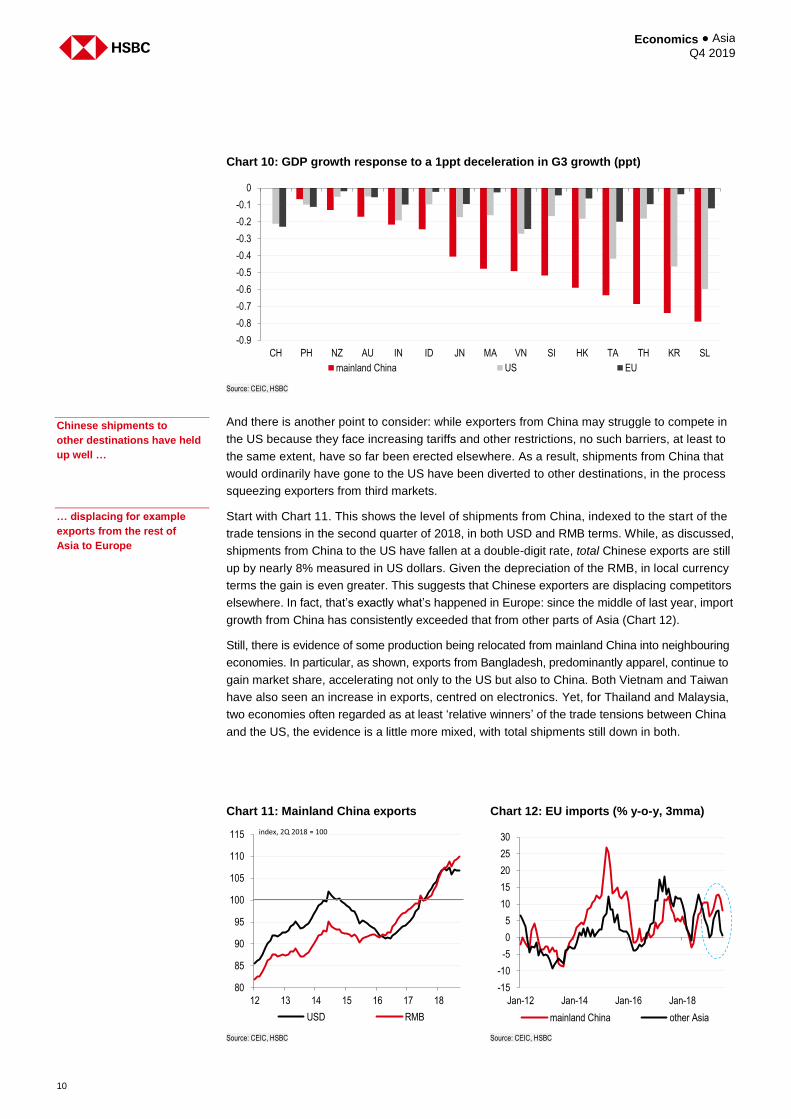
However, as we have already indicated in Chart 5, almost all markets have seen an overall fall in
shipments of late. In part, this is because exports to China have fallen in many cases over the same
period, either because of the overall slowdown in local demand (in part because of the trade
tensions), or because of the decline in re-exports from China to the US. Take a look at Chart 9. With
the exception of Bangladesh, shipments to China have decelerated sharply everywhere, with outright
contractions in Korea, Japan, Indonesia, Taiwan, India, Vietnam, the Philippines, and Singapore.
Where it hurts
This highlights a broader reality: even if supply-chain rejigging may lead to marginal gains for some
economies as they displace Chinese exports to the US, the region is highly exposed to slowing
demand in China as well. Therefore, to the extent that trade tensions reduce growth in China (and
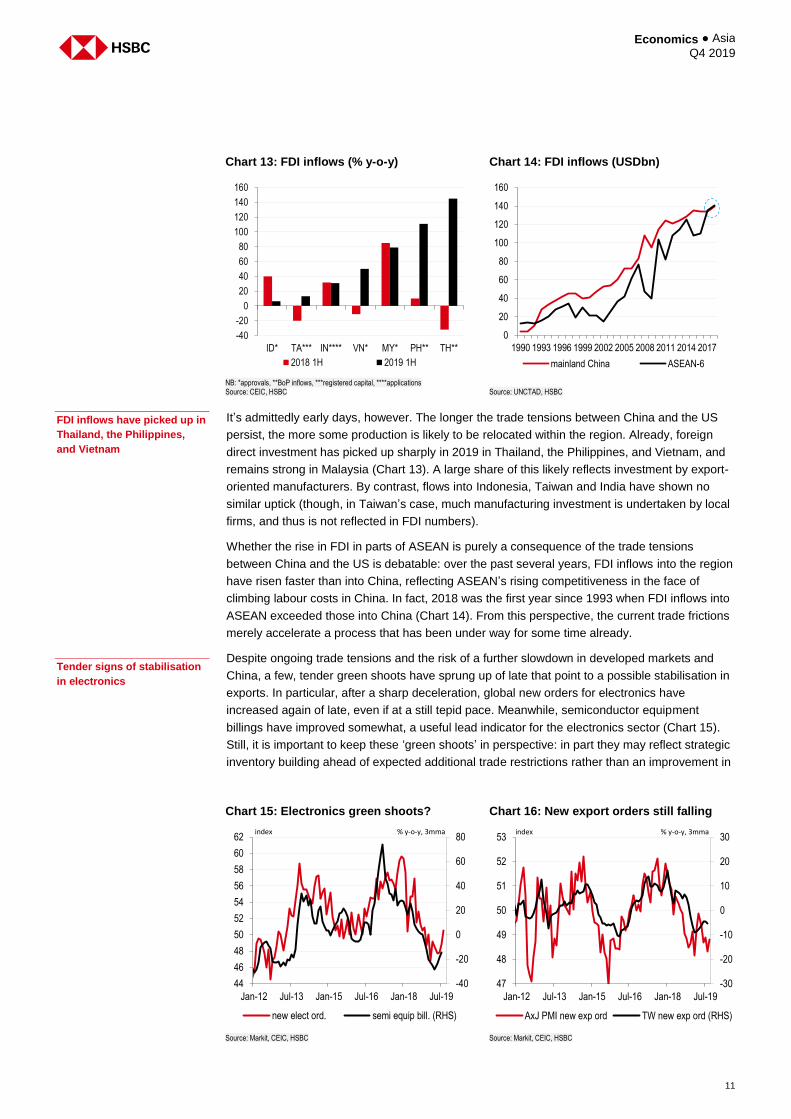
the US), overall exports can still suffer. To put this into perspective, consider Chart 10. This shows
the estimated growth response in individual economies to a 1ppt slowdown in GDP growth in
China, the US, and the EU. With the exception of the Philippines, all markets in the region have
a far higher growth sensitivity nowadays to swings in Chinese demand than to the US, let alone
Europe. Therefore, while some economies may gain market share vis-à-vis China in the US, these
gains can be easily offset by a slowdown in China itself.
Chart 8: US imports from Asia, January-July cumulative (% y-o-y)
Source: CEIC, HSBC; NB: CH refers to mainland China
… but exports from most the
region to China have fallen
Chart 9: Mainland China imports from Asia, January-July cumulative (% y-o-y)
Source: CEIC, HSBC
For Asia, growth sensitivity
to mainland China is much
greater than to US market
-15
-10
-5
0
5
10
15
20
25
30
35
CH ID NZ MY TH SI JN PH SL Asiaex CH
IN SK AU BA TA CM VN
2018 2019
-30
-20
-10
0
10
20
30
40
US SK JN ID TA Asia IN VN PH SI ASEAN TH SL MY AU BA NZ
2018 2019
Economics ● Asia Q4 2019
10
And there is another point to consider: while exporters from China may struggle to compete in
the US because they face increasing tariffs and other restrictions, no such barriers, at least to
the same extent, have so far been erected elsewhere. As a result, shipments from China that
would ordinarily have gone to the US have been diverted to other destinations, in the process
squeezing exporters from third markets.
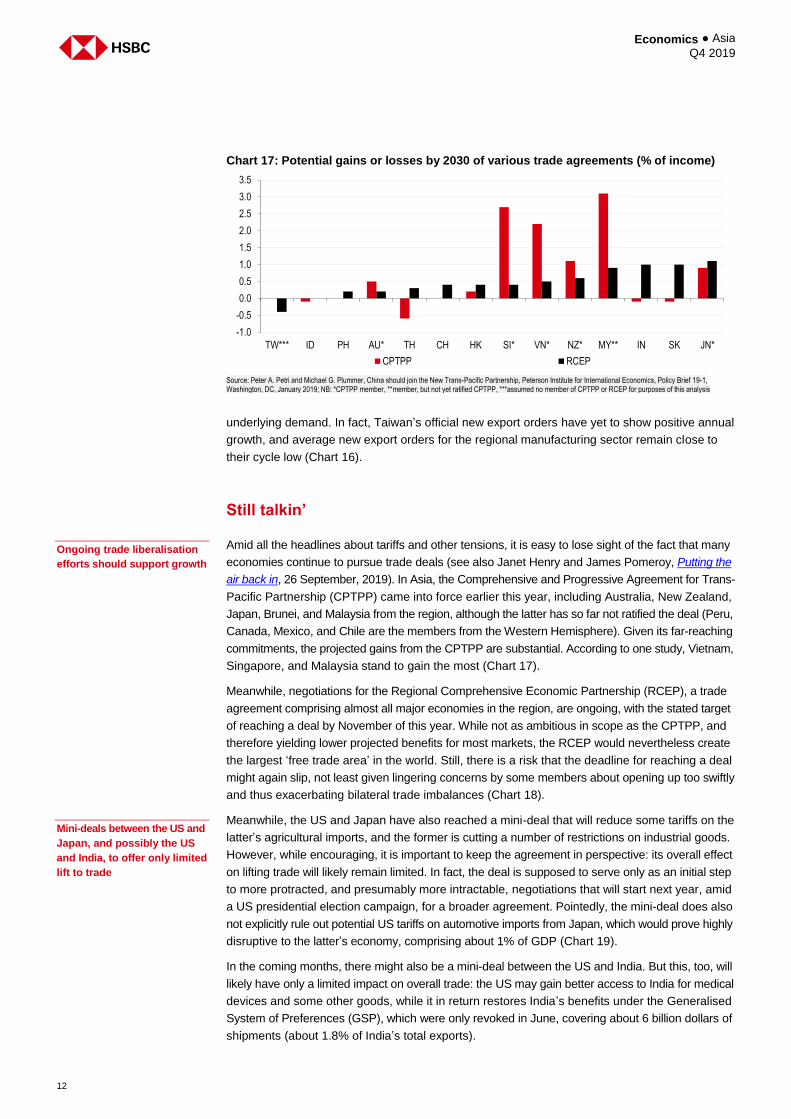
Start with Chart 11. This shows the level of shipments from China, indexed to the start of the
trade tensions in the second quarter of 2018, in both USD and RMB terms. While, as discussed,
shipments from China to the US have fallen at a double-digit rate, total Chinese exports are still
up by nearly 8% measured in US dollars. Given the depreciation of the RMB, in local currency
terms the gain is even greater. This suggests that Chinese exporters are displacing competitors
elsewhere. In fact, that’s exactly what’s happened in Europe: since the middle of last year, import
growth from China has consistently exceeded that from other parts of Asia (Chart 12).
Still, there is evidence of some production being relocated from mainland China into neighbouring
economies. In particular, as shown, exports from Bangladesh, predominantly apparel, continue to
gain market share, accelerating not only to the US but also to China. Both Vietnam and Taiwan
have also seen an increase in exports, centred on electronics. Yet, for Thailand and Malaysia,
two economies often regarded as at least ‘relative winners’ of the trade tensions between China
and the US, the evidence is a little more mixed, with total shipments still down in both.
Chart 10: GDP growth response to a 1ppt deceleration in G3 growth (ppt)
Source: CEIC, HSBC
Chinese shipments to
other destinations have held
up well …
Chart 11: Mainland China exports Chart 12: EU imports (% y-o-y, 3mma)
Source: CEIC, HSBC Source: CEIC, HSBC
… displacing for example
exports from the rest of
Asia to Europe
-0.9
-0.8
-0.7
-0.6
-0.5
-0.4
-0.3
-0.2
-0.1
0
CH PH NZ AU IN ID JN MA VN SI HK TA TH KR SL
mainland China US EU
80
85
90
95
100
105
110
115
12 13 14 15 16 17 18
USD RMB
index, 2Q 2018 = 100
-15
-10
-5
0
5
10
15
20
25
30
Jan-12 Jan-14 Jan-16 Jan-18
mainland China other Asia
11
Economics ● Asia Q4 2019
It’s admittedly early days, however. The longer the trade tensions between China and the US
persist, the more some production is likely to be relocated within the region. Already, foreign
direct investment has picked up sharply in 2019 in Thailand, the Philippines, and Vietnam, and
remains strong in Malaysia (Chart 13). A large share of this likely reflects investment by export-
oriented manufacturers. By contrast, flows into Indonesia, Taiwan and India have shown no
similar uptick (though, in Taiwan’s case, much manufacturing investment is undertaken by local
firms, and thus is not reflected in FDI numbers).
Whether the rise in FDI in parts of ASEAN is purely a consequence of the trade tensions
between China and the US is debatable: over the past several years, FDI inflows into the region
have risen faster than into China, reflecting ASEAN’s rising competitiveness in the face of
climbing labour costs in China. In fact, 2018 was the first year since 1993 when FDI inflows into
ASEAN exceeded those into China (Chart 14). From this perspective, the current trade frictions
merely accelerate a process that has been under way for some time already.
Despite ongoing trade tensions and the risk of a further slowdown in developed markets and
China, a few, tender green shoots have sprung up of late that point to a possible stabilisation in
exports. In particular, after a sharp deceleration, global new orders for electronics have
increased again of late, even if at a still tepid pace. Meanwhile, semiconductor equipment
billings have improved somewhat, a useful lead indicator for the electronics sector (Chart 15).
Still, it is important to keep these ‘green shoots’ in perspective: in part they may reflect strategic
inventory building ahead of expected additional trade restrictions rather than an improvement in
Chart 13: FDI inflows (% y-o-y) Chart 14: FDI inflows (USDbn)
NB: *approvals, **BoP inflows, ***registered capital, ****applications Source: CEIC, HSBC
Source: UNCTAD, HSBC
FDI inflows have picked up in
Thailand, the Philippines,
and Vietnam
Chart 15: Electronics green shoots? Chart 16: New export orders still falling
Source: Markit, CEIC, HSBC Source: Markit, CEIC, HSBC
Tender signs of stabilisation
in electronics
-40
-20
0
20
40
60
80
100
120
140
160
ID* TA*** IN**** VN* MY* PH** TH**
2018 1H 2019 1H
0
20
40
60
80
100
120
140
160
1990 1993 1996 1999 2002 2005 2008 2011 2014 2017
Tho
usan
ds
mainland China ASEAN-6
-40
-20
0
20
40
60
80
44
46
48
50
52
54
56
58
60
62
Jan-12 Jul-13 Jan-15 Jul-16 Jan-18 Jul-19
new elect ord. semi equip bill. (RHS)
index % y-o-y, 3mma
-30
-20
-10
0
10
20
30
47
48
49
50
51
52
53
Jan-12 Jul-13 Jan-15 Jul-16 Jan-18 Jul-19
AxJ PMI new exp ord TW new exp ord (RHS)
index % y-o-y, 3mma
Economics ● Asia Q4 2019
12
underlying demand. In fact, Taiwan’s official new export orders have yet to show positive annual
growth, and average new export orders for the regional manufacturing sector remain close to
their cycle low (Chart 16).
Still talkin’
Amid all the headlines about tariffs and other tensions, it is easy to lose sight of the fact that many
economies continue to pursue trade deals (see also Janet Henry and James Pomeroy, Putting the
air back in, 26 September, 2019). In Asia, the Comprehensive and Progressive Agreement for Trans-
Pacific Partnership (CPTPP) came into force earlier this year, including Australia, New Zealand,
Japan, Brunei, and Malaysia from the region, although the latter has so far not ratified the deal (Peru,
Canada, Mexico, and Chile are the members from the Western Hemisphere). Given its far-reaching
commitments, the projected gains from the CPTPP are substantial. According to one study, Vietnam,
Singapore, and Malaysia stand to gain the most (Chart 17).
Meanwhile, negotiations for the Regional Comprehensive Economic Partnership (RCEP), a trade
agreement comprising almost all major economies in the region, are ongoing, with the stated target
of reaching a deal by November of this year. While not as ambitious in scope as the CPTPP, and
therefore yielding lower projected benefits for most markets, the RCEP would nevertheless create
the largest ‘free trade area’ in the world. Still, there is a risk that the deadline for reaching a deal
might again slip, not least given lingering concerns by some members about opening up too swiftly
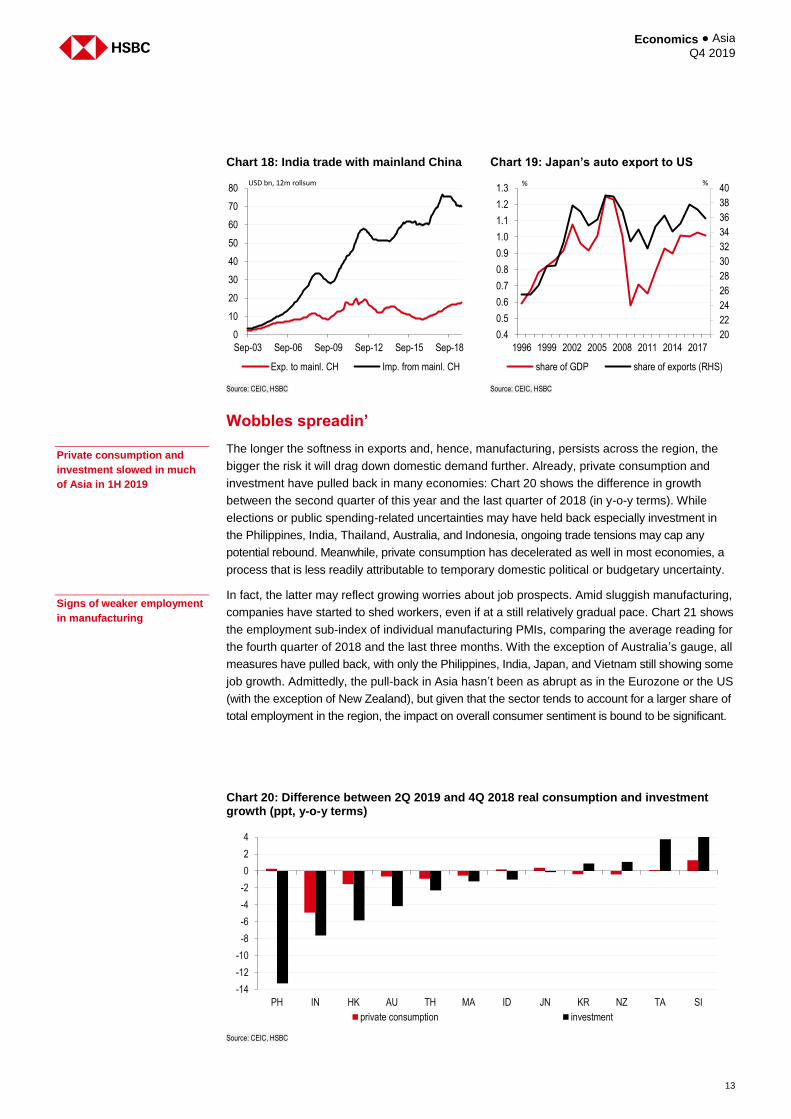
and thus exacerbating bilateral trade imbalances (Chart 18).
Meanwhile, the US and Japan have also reached a mini-deal that will reduce some tariffs on the
latter’s agricultural imports, and the former is cutting a number of restrictions on industrial goods.
However, while encouraging, it is important to keep the agreement in perspective: its overall effect
on lifting trade will likely remain limited. In fact, the deal is supposed to serve only as an initial step
to more protracted, and presumably more intractable, negotiations that will start next year, amid
a US presidential election campaign, for a broader agreement. Pointedly, the mini-deal does also
not explicitly rule out potential US tariffs on automotive imports from Japan, which would prove highly
disruptive to the latter’s economy, comprising about 1% of GDP (Chart 19).
In the coming months, there might also be a mini-deal between the US and India. But this, too, will
likely have only a limited impact on overall trade: the US may gain better access to India for medical
devices and some other goods, while it in return restores India’s benefits under the Generalised
System of Preferences (GSP), which were only revoked in June, covering about 6 billion dollars of
shipments (about 1.8% of India’s total exports).
Chart 17: Potential gains or losses by 2030 of various trade agreements (% of income)
Source: Peter A. Petri and Michael G. Plummer, China should join the New Trans-Pacific Partnership, Peterson Institute for International Economics, Policy Brief 19-1, Washington, DC, January 2019; NB: *CPTPP member, **member, but not yet ratified CPTPP, ***assumed no member of CPTPP or RCEP for purposes of this analysis
Ongoing trade liberalisation
efforts should support growth
Mini-deals between the US and
Japan, and possibly the US
and India, to offer only limited
lift to trade
-1.0
-0.5
0.0
0.5
1.0
1.5
2.0
2.5
3.0
3.5
TW*** ID PH AU* TH CH HK SI* VN* NZ* MY** IN SK JN*
CPTPP RCEP
13
Economics ● Asia Q4 2019
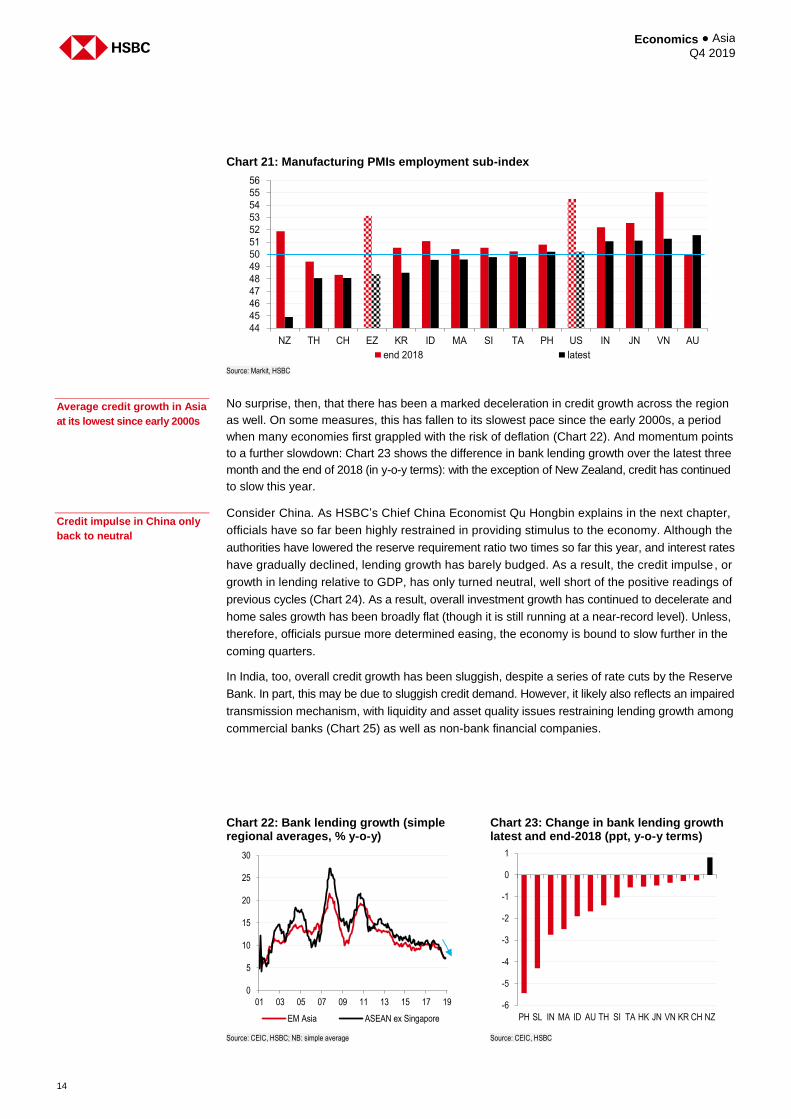
Wobbles spreadin’
The longer the softness in exports and, hence, manufacturing, persists across the region, the
bigger the risk it will drag down domestic demand further. Already, private consumption and
investment have pulled back in many economies: Chart 20 shows the difference in growth
between the second quarter of this year and the last quarter of 2018 (in y-o-y terms). While
elections or public spending-related uncertainties may have held back especially investment in
the Philippines, India, Thailand, Australia, and Indonesia, ongoing trade tensions may cap any
potential rebound. Meanwhile, private consumption has decelerated as well in most economies, a
process that is less readily attributable to temporary domestic political or budgetary uncertainty.
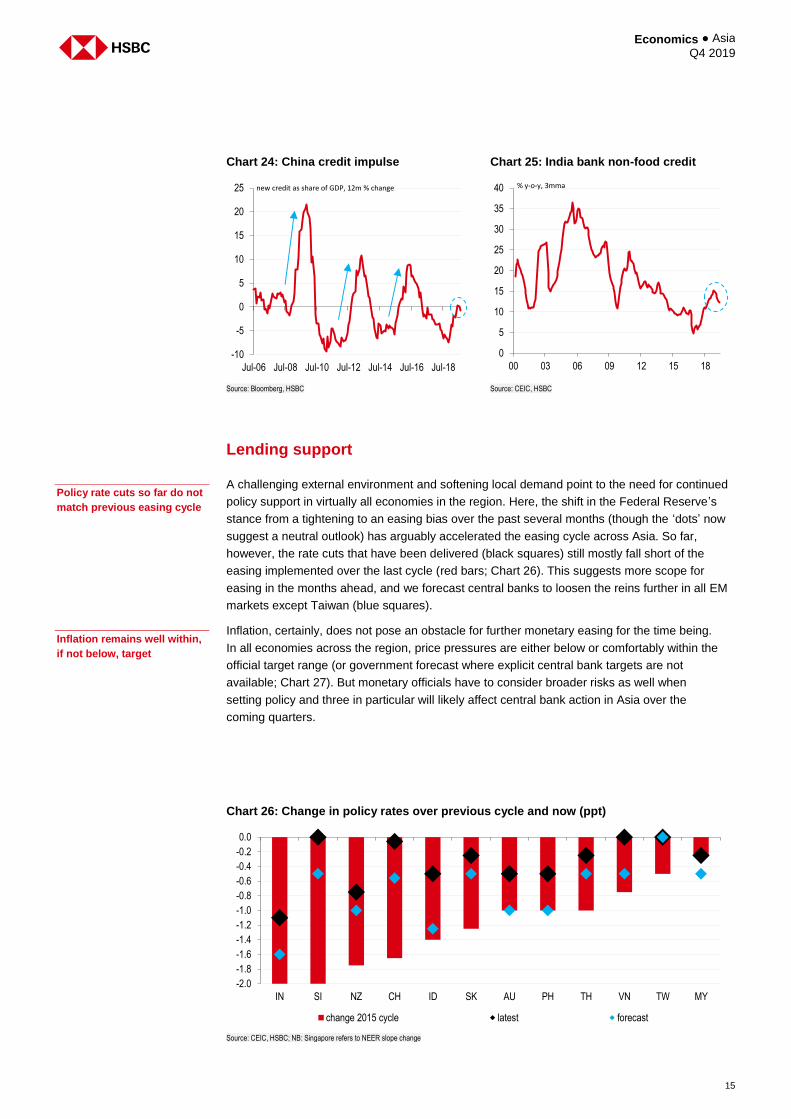
In fact, the latter may reflect growing worries about job prospects. Amid sluggish manufacturing,
companies have started to shed workers, even if at a still relatively gradual pace. Chart 21 shows
the employment sub-index of individual manufacturing PMIs, comparing the average reading for
the fourth quarter of 2018 and the last three months. With the exception of Australia’s gauge, all
measures have pulled back, with only the Philippines, India, Japan, and Vietnam still showing some
job growth. Admittedly, the pull-back in Asia hasn’t been as abrupt as in the Eurozone or the US
(with the exception of New Zealand), but given that the sector tends to account for a larger share of
total employment in the region, the impact on overall consumer sentiment is bound to be significant.
Chart 20: Difference between 2Q 2019 and 4Q 2018 real consumption and investment growth (ppt, y-o-y terms)
Source: CEIC, HSBC
Signs of weaker employment
in manufacturing
Private consumption and
investment slowed in much
of Asia in 1H 2019
Chart 18: India trade with mainland China Chart 19: Japan’s auto export to US
Source: CEIC, HSBC Source: CEIC, HSBC
-14
-12
-10
-8
-6
-4
-2
0
2
4
PH IN HK AU TH MA ID JN KR NZ TA SI
private consumption investment
0
10
20
30
40
50
60
70
80
Sep-03 Sep-06 Sep-09 Sep-12 Sep-15 Sep-18
Tho
usan
ds
Exp. to mainl. CH Imp. from mainl. CH
USD bn, 12m rollsum
20
22
24
26
28
30
32
34
36
38
40
0.4
0.5
0.6
0.7
0.8
0.9
1.0
1.1
1.2
1.3
1996 1999 2002 2005 2008 2011 2014 2017
share of GDP share of exports (RHS)
% %
Economics ● Asia Q4 2019
14
No surprise, then, that there has been a marked deceleration in credit growth across the region
as well. On some measures, this has fallen to its slowest pace since the early 2000s, a period
when many economies first grappled with the risk of deflation (Chart 22). And momentum points
to a further slowdown: Chart 23 shows the difference in bank lending growth over the latest three
month and the end of 2018 (in y-o-y terms): with the exception of New Zealand, credit has continued
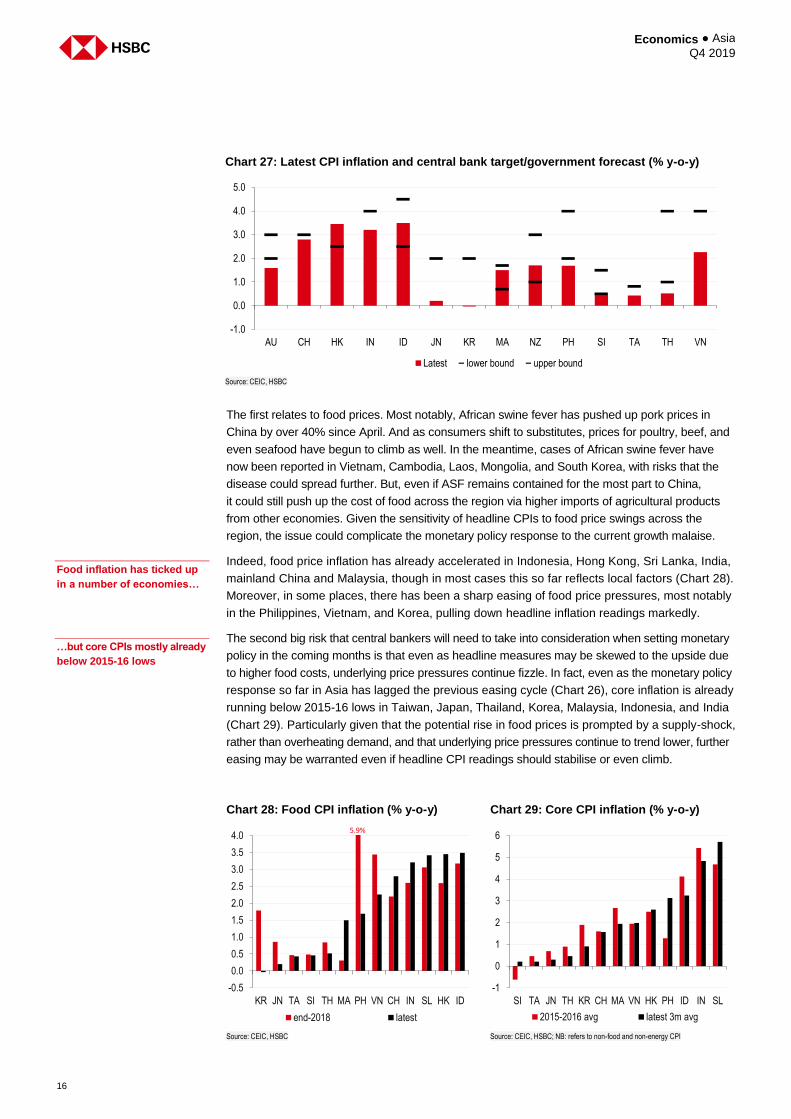
to slow this year. Consider China. As HSBC’s Chief China Economist Qu Hongbin explains in the next chapter,
officials have so far been highly restrained in providing stimulus to the economy. Although the
authorities have lowered the reserve requirement ratio two times so far this year, and interest rates
have gradually declined, lending growth has barely budged. As a result, the credit impulse, or
growth in lending relative to GDP, has only turned neutral, well short of the positive readings of
previous cycles (Chart 24). As a result, overall investment growth has continued to decelerate and
home sales growth has been broadly flat (though it is still running at a near-record level). Unless,
therefore, officials pursue more determined easing, the economy is bound to slow further in the
coming quarters.
In India, too, overall credit growth has been sluggish, despite a series of rate cuts by the Reserve
Bank. In part, this may be due to sluggish credit demand. However, it likely also reflects an impaired
transmission mechanism, with liquidity and asset quality issues restraining lending growth among
commercial banks (Chart 25) as well as non-bank financial companies.
Chart 21: Manufacturing PMIs employment sub-index
Source: Markit, HSBC
Average credit growth in Asia
at its lowest since early 2000s
Chart 22: Bank lending growth (simple regional averages, % y-o-y)
Chart 23: Change in bank lending growth latest and end-2018 (ppt, y-o-y terms)
Source: CEIC, HSBC; NB: simple average Source: CEIC, HSBC
Credit impulse in China only
back to neutral
44
45
46
47
48
49
50
51
52
53
54
55
56
NZ TH CH EZ KR ID MA SI TA PH US IN JN VN AU
end 2018 latest
0
5
10
15
20
25
30
01 03 05 07 09 11 13 15 17 19
EM Asia ASEAN ex Singapore
-6
-5
-4
-3
-2
-1
0
1
PH SL IN MA ID AU TH SI TA HK JN VN KR CH NZ
15
Economics ● Asia Q4 2019
Lending support
A challenging external environment and softening local demand point to the need for continued
policy support in virtually all economies in the region. Here, the shift in the Federal Reserve’s
stance from a tightening to an easing bias over the past several months (though the ‘dots’ now
suggest a neutral outlook) has arguably accelerated the easing cycle across Asia. So far,
however, the rate cuts that have been delivered (black squares) still mostly fall short of the
easing implemented over the last cycle (red bars; Chart 26). This suggests more scope for
easing in the months ahead, and we forecast central banks to loosen the reins further in all EM
markets except Taiwan (blue squares).
Inflation, certainly, does not pose an obstacle for further monetary easing for the time being.
In all economies across the region, price pressures are either below or comfortably within the
official target range (or government forecast where explicit central bank targets are not
available; Chart 27). But monetary officials have to consider broader risks as well when
setting policy and three in particular will likely affect central bank action in Asia over the
coming quarters.
Chart 24: China credit impulse Chart 25: India bank non-food credit
Source: Bloomberg, HSBC Source: CEIC, HSBC
Policy rate cuts so far do not
match previous easing cycle
Inflation remains well within,
if not below, target
Chart 26: Change in policy rates over previous cycle and now (ppt)
Source: CEIC, HSBC; NB: Singapore refers to NEER slope change
-10
-5
0
5
10
15
20
25
Jul-06 Jul-08 Jul-10 Jul-12 Jul-14 Jul-16 Jul-18
new credit as share of GDP, 12m % change
0
5
10
15
20
25
30
35
40
00 03 06 09 12 15 18
% y-o-y, 3mma
-2.0
-1.8
-1.6
-1.4
-1.2
-1.0
-0.8
-0.6
-0.4
-0.2
0.0
IN SI NZ CH ID SK AU PH TH VN TW MY
change 2015 cycle latest forecast
Economics ● Asia Q4 2019
16
The first relates to food prices. Most notably, African swine fever has pushed up pork prices in
China by over 40% since April. And as consumers shift to substitutes, prices for poultry, beef, and
even seafood have begun to climb as well. In the meantime, cases of African swine fever have
now been reported in Vietnam, Cambodia, Laos, Mongolia, and South Korea, with risks that the
disease could spread further. But, even if ASF remains contained for the most part to China,
it could still push up the cost of food across the region via higher imports of agricultural products
from other economies. Given the sensitivity of headline CPIs to food price swings across the
region, the issue could complicate the monetary policy response to the current growth malaise.
Indeed, food price inflation has already accelerated in Indonesia, Hong Kong, Sri Lanka, India,
mainland China and Malaysia, though in most cases this so far reflects local factors (Chart 28).
Moreover, in some places, there has been a sharp easing of food price pressures, most notably
in the Philippines, Vietnam, and Korea, pulling down headline inflation readings markedly.
The second big risk that central bankers will need to take into consideration when setting monetary
policy in the coming months is that even as headline measures may be skewed to the upside due
to higher food costs, underlying price pressures continue fizzle. In fact, even as the monetary policy
response so far in Asia has lagged the previous easing cycle (Chart 26), core inflation is already
running below 2015-16 lows in Taiwan, Japan, Thailand, Korea, Malaysia, Indonesia, and India
(Chart 29). Particularly given that the potential rise in food prices is prompted by a supply-shock,
rather than overheating demand, and that underlying price pressures continue to trend lower, further
easing may be warranted even if headline CPI readings should stabilise or even climb.
Chart 27: Latest CPI inflation and central bank target/government forecast (% y-o-y)
Source: CEIC, HSBC
Food inflation has ticked up
in a number of economies…
…but core CPIs mostly already
below 2015-16 lows
Chart 28: Food CPI inflation (% y-o-y) Chart 29: Core CPI inflation (% y-o-y)
Source: CEIC, HSBC Source: CEIC, HSBC; NB: refers to non-food and non-energy CPI
-1.0
0.0
1.0
2.0
3.0
4.0
5.0
AU CH HK IN ID JN KR MA NZ PH SI TA TH VN
Latest lower bound upper bound
-0.5
0.0
0.5
1.0
1.5
2.0
2.5
3.0
3.5
4.0
KR JN TA SI TH MA PH VN CH IN SL HK ID
end-2018 latest
5.9%
-1
0
1
2
3
4
5
6
SI TA JN TH KR CH MA VN HK PH ID IN SL
2015-2016 avg latest 3m avg
17
Economics ● Asia Q4 2019
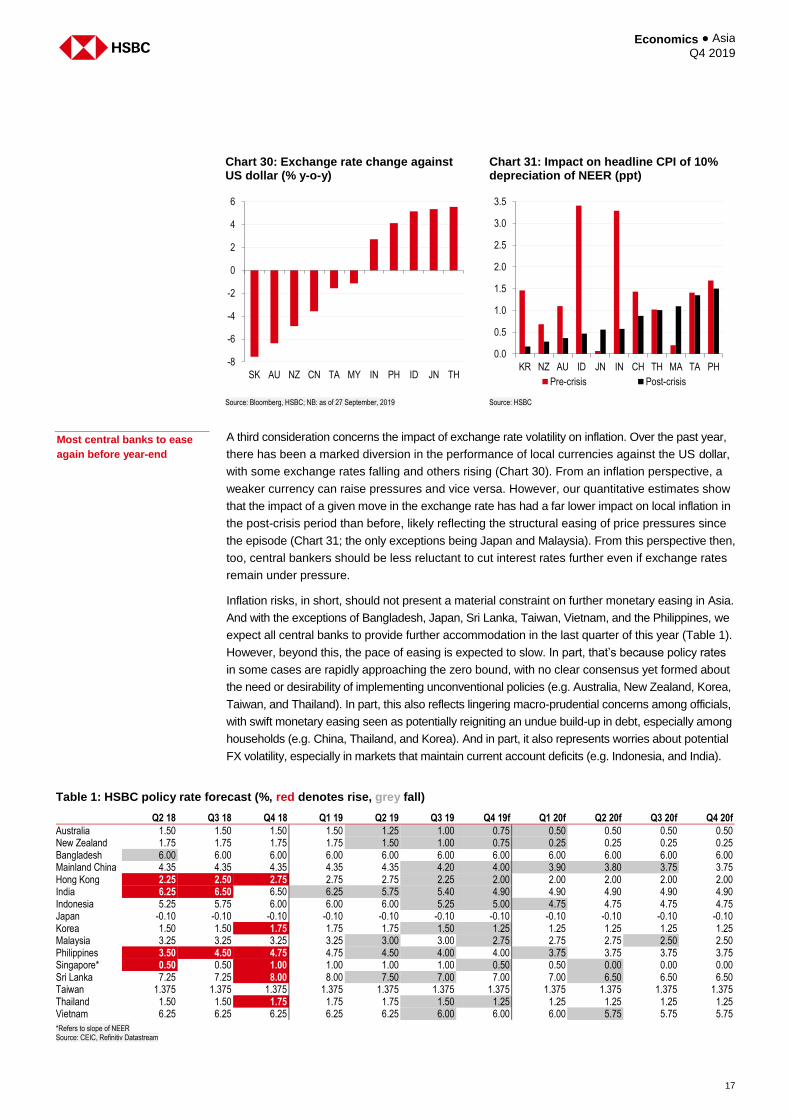
A third consideration concerns the impact of exchange rate volatility on inflation. Over the past year,
there has been a marked diversion in the performance of local currencies against the US dollar,
with some exchange rates falling and others rising (Chart 30). From an inflation perspective, a
weaker currency can raise pressures and vice versa. However, our quantitative estimates show
that the impact of a given move in the exchange rate has had a far lower impact on local inflation in
the post-crisis period than before, likely reflecting the structural easing of price pressures since
the episode (Chart 31; the only exceptions being Japan and Malaysia). From this perspective then,
too, central bankers should be less reluctant to cut interest rates further even if exchange rates
remain under pressure.
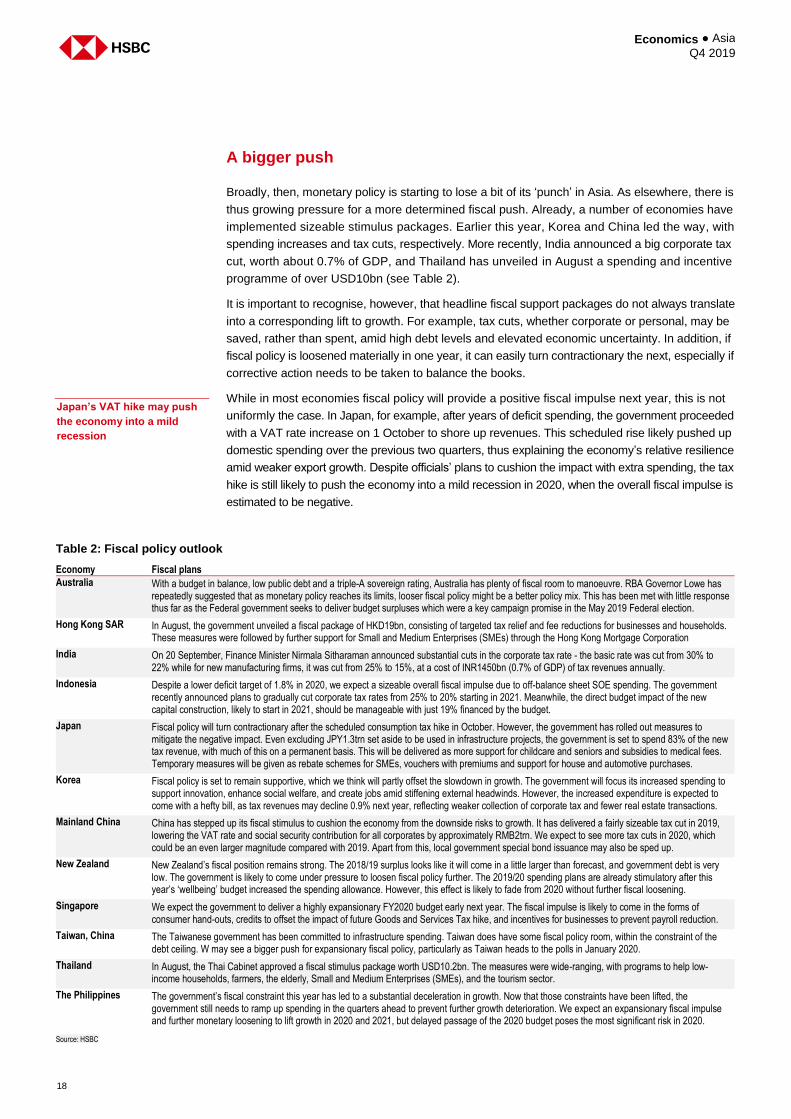
Inflation risks, in short, should not present a material constraint on further monetary easing in Asia.
And with the exceptions of Bangladesh, Japan, Sri Lanka, Taiwan, Vietnam, and the Philippines, we
expect all central banks to provide further accommodation in the last quarter of this year (Table 1).
However, beyond this, the pace of easing is expected to slow. In part, that’s because policy rates
in some cases are rapidly approaching the zero bound, with no clear consensus yet formed about
the need or desirability of implementing unconventional policies (e.g. Australia, New Zealand, Korea,
Taiwan, and Thailand). In part, this also reflects lingering macro-prudential concerns among officials,
with swift monetary easing seen as potentially reigniting an undue build-up in debt, especially among
households (e.g. China, Thailand, and Korea). And in part, it also represents worries about potential
FX volatility, especially in markets that maintain current account deficits (e.g. Indonesia, and India).
Chart 30: Exchange rate change against US dollar (% y-o-y)
Chart 31: Impact on headline CPI of 10% depreciation of NEER (ppt)
Source: Bloomberg, HSBC; NB: as of 27 September, 2019 Source: HSBC
Most central banks to ease
again before year-end
Table 1: HSBC policy rate forecast (%, red denotes rise, grey fall)
Q2 18 Q3 18 Q4 18 Q1 19 Q2 19 Q3 19 Q4 19f Q1 20f Q2 20f Q3 20f Q4 20f
Australia 1.50 1.50 1.50 1.50 1.25 1.00 0.75 0.50 0.50 0.50 0.50 New Zealand 1.75 1.75 1.75 1.75 1.50 1.00 0.75 0.25 0.25 0.25 0.25 Bangladesh 6.00 6.00 6.00 6.00 6.00 6.00 6.00 6.00 6.00 6.00 6.00 Mainland China 4.35 4.35 4.35 4.35 4.35 4.20 4.00 3.90 3.80 3.75 3.75 Hong Kong 2.25 2.50 2.75 2.75 2.75 2.25 2.00 2.00 2.00 2.00 2.00 India 6.25 6.50 6.50 6.25 5.75 5.40 4.90 4.90 4.90 4.90 4.90 Indonesia 5.25 5.75 6.00 6.00 6.00 5.25 5.00 4.75 4.75 4.75 4.75 Japan -0.10 -0.10 -0.10 -0.10 -0.10 -0.10 -0.10 -0.10 -0.10 -0.10 -0.10 Korea 1.50 1.50 1.75 1.75 1.75 1.50 1.25 1.25 1.25 1.25 1.25 Malaysia 3.25 3.25 3.25 3.25 3.00 3.00 2.75 2.75 2.75 2.50 2.50 Philippines 3.50 4.50 4.75 4.75 4.50 4.00 4.00 3.75 3.75 3.75 3.75 Singapore* 0.50 0.50 1.00 1.00 1.00 1.00 0.50 0.50 0.00 0.00 0.00 Sri Lanka 7.25 7.25 8.00 8.00 7.50 7.00 7.00 7.00 6.50 6.50 6.50 Taiwan 1.375 1.375 1.375 1.375 1.375 1.375 1.375 1.375 1.375 1.375 1.375 Thailand 1.50 1.50 1.75 1.75 1.75 1.50 1.25 1.25 1.25 1.25 1.25 Vietnam 6.25 6.25 6.25 6.25 6.25 6.00 6.00 6.00 5.75 5.75 5.75
*Refers to slope of NEER Source: CEIC, Refinitiv Datastream
-8
-6
-4
-2
0
2
4
6
SK AU NZ CN TA MY IN PH ID JN TH
0.0
0.5
1.0
1.5
2.0
2.5
3.0
3.5
KR NZ AU ID JN IN CH TH MA TA PH
Pre-crisis Post-crisis
Economics ● Asia Q4 2019
18
A bigger push
Broadly, then, monetary policy is starting to lose a bit of its ‘punch’ in Asia. As elsewhere, there is
thus growing pressure for a more determined fiscal push. Already, a number of economies have
implemented sizeable stimulus packages. Earlier this year, Korea and China led the way, with
spending increases and tax cuts, respectively. More recently, India announced a big corporate tax
cut, worth about 0.7% of GDP, and Thailand has unveiled in August a spending and incentive
programme of over USD10bn (see Table 2).
It is important to recognise, however, that headline fiscal support packages do not always translate
into a corresponding lift to growth. For example, tax cuts, whether corporate or personal, may be
saved, rather than spent, amid high debt levels and elevated economic uncertainty. In addition, if
fiscal policy is loosened materially in one year, it can easily turn contractionary the next, especially if
corrective action needs to be taken to balance the books.
While in most economies fiscal policy will provide a positive fiscal impulse next year, this is not
uniformly the case. In Japan, for example, after years of deficit spending, the government proceeded
with a VAT rate increase on 1 October to shore up revenues. This scheduled rise likely pushed up
domestic spending over the previous two quarters, thus explaining the economy’s relative resilience
amid weaker export growth. Despite officials’ plans to cushion the impact with extra spending, the tax
hike is still likely to push the economy into a mild recession in 2020, when the overall fiscal impulse is
estimated to be negative.
Japan’s VAT hike may push
the economy into a mild
recession
Table 2: Fiscal policy outlook
Economy Fiscal plans
Australia With a budget in balance, low public debt and a triple-A sovereign rating, Australia has plenty of fiscal room to manoeuvre. RBA Governor Lowe has repeatedly suggested that as monetary policy reaches its limits, looser fiscal policy might be a better policy mix. This has been met with little response thus far as the Federal government seeks to deliver budget surpluses which were a key campaign promise in the May 2019 Federal election.
Hong Kong SAR In August, the government unveiled a fiscal package of HKD19bn, consisting of targeted tax relief and fee reductions for businesses and households. These measures were followed by further support for Small and Medium Enterprises (SMEs) through the Hong Kong Mortgage Corporation
India On 20 September, Finance Minister Nirmala Sitharaman announced substantial cuts in the corporate tax rate - the basic rate was cut from 30% to 22% while for new manufacturing firms, it was cut from 25% to 15%, at a cost of INR1450bn (0.7% of GDP) of tax revenues annually.
Indonesia Despite a lower deficit target of 1.8% in 2020, we expect a sizeable overall fiscal impulse due to off-balance sheet SOE spending. The government recently announced plans to gradually cut corporate tax rates from 25% to 20% starting in 2021. Meanwhile, the direct budget impact of the new capital construction, likely to start in 2021, should be manageable with just 19% financed by the budget.
Japan Fiscal policy will turn contractionary after the scheduled consumption tax hike in October. However, the government has rolled out measures to mitigate the negative impact. Even excluding JPY1.3trn set aside to be used in infrastructure projects, the government is set to spend 83% of the new tax revenue, with much of this on a permanent basis. This will be delivered as more support for childcare and seniors and subsidies to medical fees. Temporary measures will be given as rebate schemes for SMEs, vouchers with premiums and support for house and automotive purchases.
Korea Fiscal policy is set to remain supportive, which we think will partly offset the slowdown in growth. The government will focus its increased spending to support innovation, enhance social welfare, and create jobs amid stiffening external headwinds. However, the increased expenditure is expected to come with a hefty bill, as tax revenues may decline 0.9% next year, reflecting weaker collection of corporate tax and fewer real estate transactions.
Mainland China China has stepped up its fiscal stimulus to cushion the economy from the downside risks to growth. It has delivered a fairly sizeable tax cut in 2019, lowering the VAT rate and social security contribution for all corporates by approximately RMB2trn. We expect to see more tax cuts in 2020, which could be an even larger magnitude compared with 2019. Apart from this, local government special bond issuance may also be sped up.
New Zealand New Zealand’s fiscal position remains strong. The 2018/19 surplus looks like it will come in a little larger than forecast, and government debt is very low. The government is likely to come under pressure to loosen fiscal policy further. The 2019/20 spending plans are already stimulatory after this year’s ‘wellbeing’ budget increased the spending allowance. However, this effect is likely to fade from 2020 without further fiscal loosening.
Singapore We expect the government to deliver a highly expansionary FY2020 budget early next year. The fiscal impulse is likely to come in the forms of consumer hand-outs, credits to offset the impact of future Goods and Services Tax hike, and incentives for businesses to prevent payroll reduction.
Taiwan, China The Taiwanese government has been committed to infrastructure spending. Taiwan does have some fiscal policy room, within the constraint of the debt ceiling. W may see a bigger push for expansionary fiscal policy, particularly as Taiwan heads to the polls in January 2020.
Thailand In August, the Thai Cabinet approved a fiscal stimulus package worth USD10.2bn. The measures were wide-ranging, with programs to help low-income households, farmers, the elderly, Small and Medium Enterprises (SMEs), and the tourism sector.
The Philippines The government’s fiscal constraint this year has led to a substantial deceleration in growth. Now that those constraints have been lifted, the government still needs to ramp up spending in the quarters ahead to prevent further growth deterioration. We expect an expansionary fiscal impulse and further monetary loosening to lift growth in 2020 and 2021, but delayed passage of the 2020 budget poses the most significant risk in 2020.
Source: HSBC
19
Economics ● Asia Q4 2019
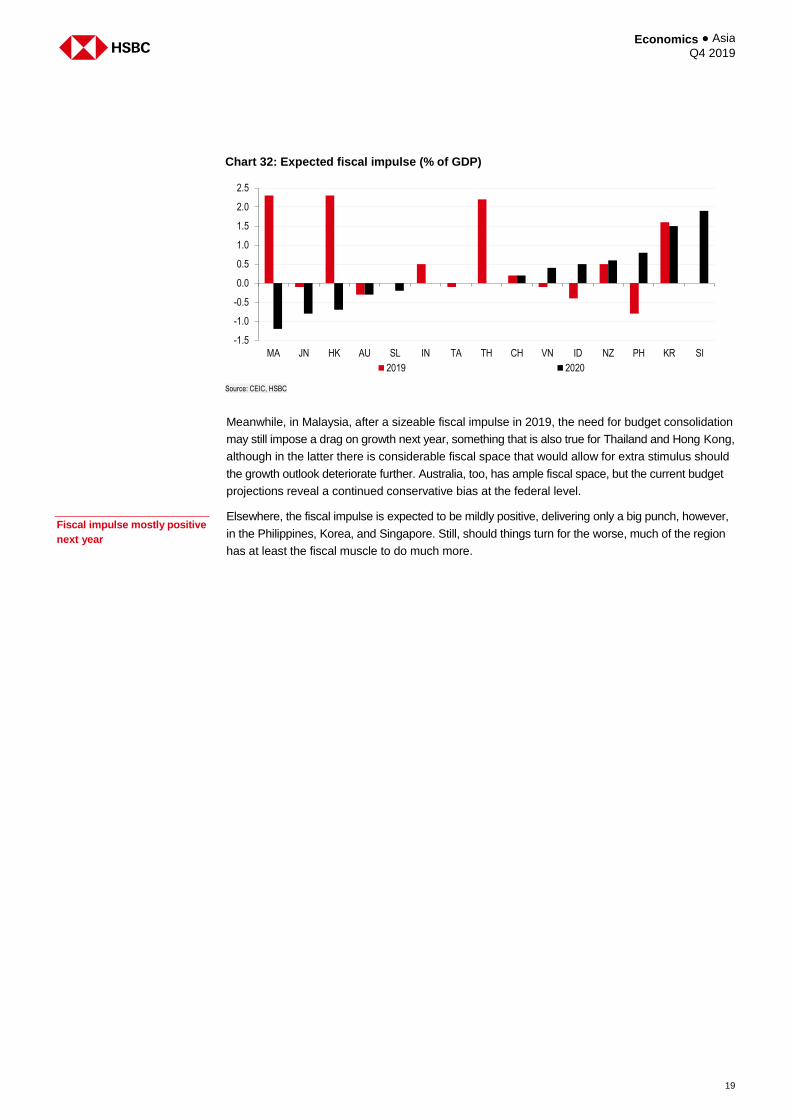
Meanwhile, in Malaysia, after a sizeable fiscal impulse in 2019, the need for budget consolidation
may still impose a drag on growth next year, something that is also true for Thailand and Hong Kong,
although in the latter there is considerable fiscal space that would allow for extra stimulus should
the growth outlook deteriorate further. Australia, too, has ample fiscal space, but the current budget
projections reveal a continued conservative bias at the federal level.
Elsewhere, the fiscal impulse is expected to be mildly positive, delivering only a big punch, however,
in the Philippines, Korea, and Singapore. Still, should things turn for the worse, much of the region
has at least the fiscal muscle to do much more.
Chart 32: Expected fiscal impulse (% of GDP)
Source: CEIC, HSBC
Fiscal impulse mostly positive
next year
-1.5
-1.0
-0.5
0.0
0.5
1.0
1.5
2.0
2.5
MA JN HK AU SL IN TA TH CH VN ID NZ PH KR SI
2019 2020
Economics ● Asia Q4 2019
20
Growing headwinds
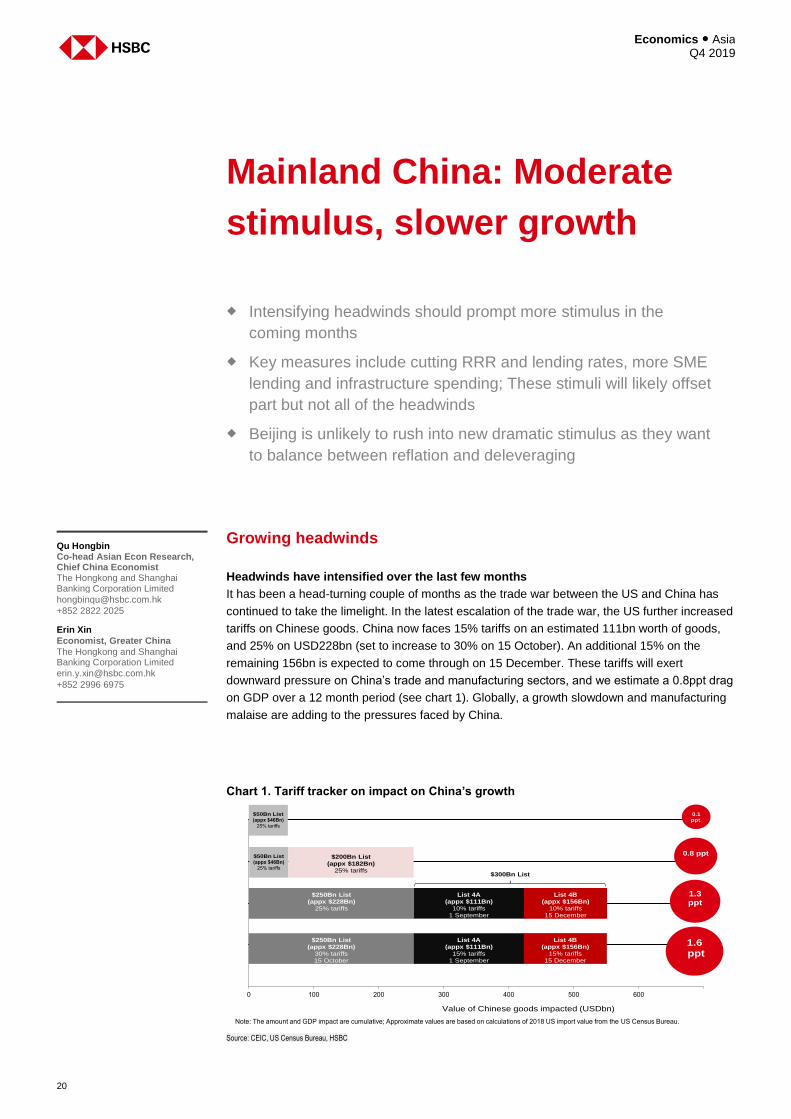
Headwinds have intensified over the last few months
It has been a head-turning couple of months as the trade war between the US and China has
continued to take the limelight. In the latest escalation of the trade war, the US further increased
tariffs on Chinese goods. China now faces 15% tariffs on an estimated 111bn worth of goods,
and 25% on USD228bn (set to increase to 30% on 15 October). An additional 15% on the
remaining 156bn is expected to come through on 15 December. These tariffs will exert
downward pressure on China’s trade and manufacturing sectors, and we estimate a 0.8ppt drag
on GDP over a 12 month period (see chart 1). Globally, a growth slowdown and manufacturing
malaise are adding to the pressures faced by China.
Mainland China: Moderate
stimulus, slower growth
Intensifying headwinds should prompt more stimulus in the
coming months
Key measures include cutting RRR and lending rates, more SME
lending and infrastructure spending; These stimuli will likely offset
part but not all of the headwinds
Beijing is unlikely to rush into new dramatic stimulus as they want
to balance between reflation and deleveraging
Qu Hongbin Co-head Asian Econ Research, Chief China Economist The Hongkong and Shanghai Banking Corporation Limited
+852 2822 2025
Erin Xin
Economist, Greater China
The Hongkong and Shanghai Banking Corporation Limited
+852 2996 6975
Chart 1. Tariff tracker on impact on China’s growth
Source: CEIC, US Census Bureau, HSBC
0 100 200 300 400 500 600
Value of Chinese goods impacted (USDbn)
$50Bn List(appx $46Bn)
25% tariffs
$200Bn List(appx $182Bn)
25% tariffs
List 4A(appx $111Bn)
10% tariffs1 September
$250Bn List(appx $228Bn)
25% tariffs
$50Bn List(appx $46Bn)
25% tariffs
List 4B (appx $156Bn)
10% tariffs15 December
List 4A (appx $111Bn)
15% tariffs1 September
$250Bn List(appx $228Bn)
30% tariffs15 October
List 4B (appx $156Bn)
15% tariffs15 December
Note: The amount and GDP impact are cumulative; Approximate values are based on calculations of 2018 US import value from the US Census Bureau.
$300Bn List
0.1 ppt.
0.8 ppt
1.3ppt
1.6ppt
21
Economics ● Asia Q4 2019
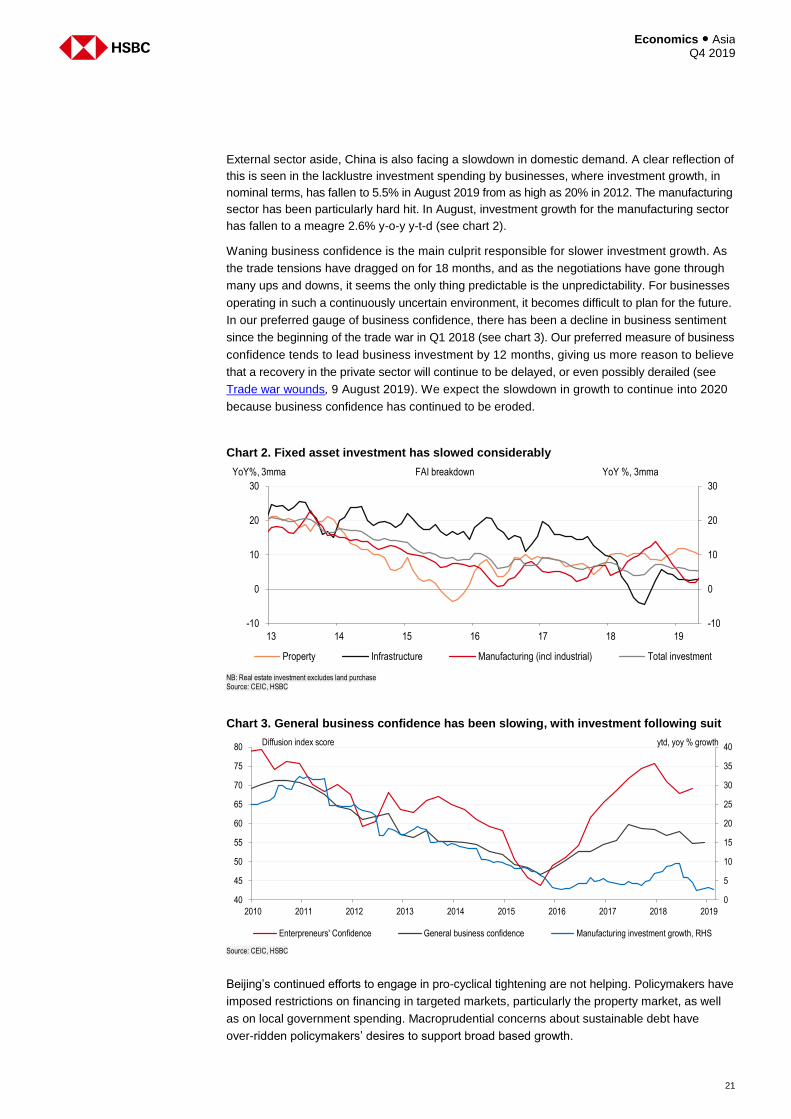
External sector aside, China is also facing a slowdown in domestic demand. A clear reflection of
this is seen in the lacklustre investment spending by businesses, where investment growth, in
nominal terms, has fallen to 5.5% in August 2019 from as high as 20% in 2012. The manufacturing
sector has been particularly hard hit. In August, investment growth for the manufacturing sector
has fallen to a meagre 2.6% y-o-y y-t-d (see chart 2).
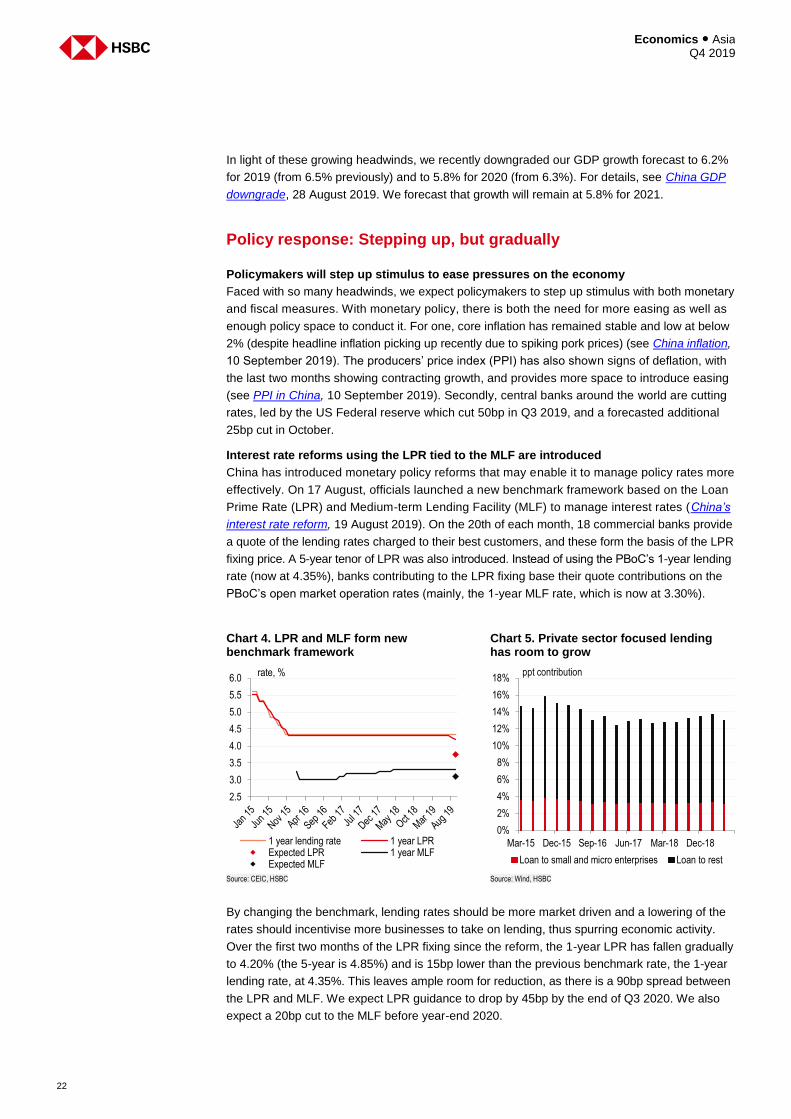
Waning business confidence is the main culprit responsible for slower investment growth. As
the trade tensions have dragged on for 18 months, and as the negotiations have gone through
many ups and downs, it seems the only thing predictable is the unpredictability. For businesses
operating in such a continuously uncertain environment, it becomes difficult to plan for the future.
In our preferred gauge of business confidence, there has been a decline in business sentiment
since the beginning of the trade war in Q1 2018 (see chart 3). Our preferred measure of business
confidence tends to lead business investment by 12 months, giving us more reason to believe
that a recovery in the private sector will continue to be delayed, or even possibly derailed (see
Trade war wounds, 9 August 2019). We expect the slowdown in growth to continue into 2020
because business confidence has continued to be eroded.
Chart 2. Fixed asset investment has slowed considerably
NB: Real estate investment excludes land purchase Source: CEIC, HSBC
Chart 3. General business confidence has been slowing, with investment following suit
Source: CEIC, HSBC
Beijing’s continued efforts to engage in pro-cyclical tightening are not helping. Policymakers have
imposed restrictions on financing in targeted markets, particularly the property market, as well
as on local government spending. Macroprudential concerns about sustainable debt have
over-ridden policymakers’ desires to support broad based growth.
-10
0
10
20
30
13 14 15 16 17 18 19
-10
0
10
20
30
YoY %, 3mmaYoY%, 3mma FAI breakdown
Property Infrastructure Manufacturing (incl industrial) Total investment
0
5
10
15
20
25
30
35
40
40
45
50
55
60
65
70
75
80
2010 2011 2012 2013 2014 2015 2016 2017 2018 2019
ytd, yoy % growthDiffusion index score
Enterpreneurs' Confidence General business confidence Manufacturing investment growth, RHS
Economics ● Asia Q4 2019
22
In light of these growing headwinds, we recently downgraded our GDP growth forecast to 6.2%
for 2019 (from 6.5% previously) and to 5.8% for 2020 (from 6.3%). For details, see China GDP
downgrade, 28 August 2019. We forecast that growth will remain at 5.8% for 2021.
Policy response: Stepping up, but gradually
Policymakers will step up stimulus to ease pressures on the economy
Faced with so many headwinds, we expect policymakers to step up stimulus with both monetary
and fiscal measures. With monetary policy, there is both the need for more easing as well as
enough policy space to conduct it. For one, core inflation has remained stable and low at below
2% (despite headline inflation picking up recently due to spiking pork prices) (see China inflation,
10 September 2019). The producers’ price index (PPI) has also shown signs of deflation, with
the last two months showing contracting growth, and provides more space to introduce easing
(see PPI in China, 10 September 2019). Secondly, central banks around the world are cutting
rates, led by the US Federal reserve which cut 50bp in Q3 2019, and a forecasted additional
25bp cut in October.
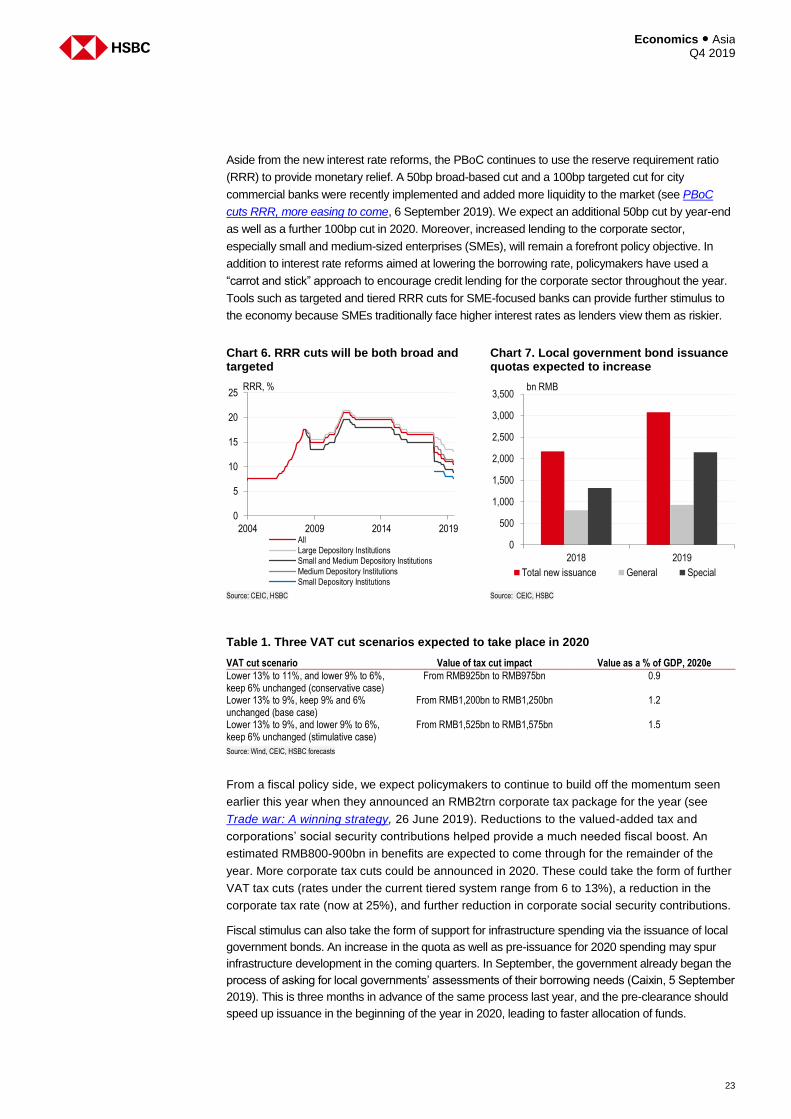
Interest rate reforms using the LPR tied to the MLF are introduced
China has introduced monetary policy reforms that may enable it to manage policy rates more
effectively. On 17 August, officials launched a new benchmark framework based on the Loan
Prime Rate (LPR) and Medium-term Lending Facility (MLF) to manage interest rates (China’s
interest rate reform, 19 August 2019). On the 20th of each month, 18 commercial banks provide
a quote of the lending rates charged to their best customers, and these form the basis of the LPR
fixing price. A 5-year tenor of LPR was also introduced. Instead of using the PBoC’s 1-year lending
rate (now at 4.35%), banks contributing to the LPR fixing base their quote contributions on the
PBoC’s open market operation rates (mainly, the 1-year MLF rate, which is now at 3.30%).
Chart 4. LPR and MLF form new benchmark framework
Chart 5. Private sector focused lending has room to grow
Source: CEIC, HSBC Source: Wind, HSBC
By changing the benchmark, lending rates should be more market driven and a lowering of the
rates should incentivise more businesses to take on lending, thus spurring economic activity.
Over the first two months of the LPR fixing since the reform, the 1-year LPR has fallen gradually
to 4.20% (the 5-year is 4.85%) and is 15bp lower than the previous benchmark rate, the 1-year
lending rate, at 4.35%. This leaves ample room for reduction, as there is a 90bp spread between
the LPR and MLF. We expect LPR guidance to drop by 45bp by the end of Q3 2020. We also
expect a 20bp cut to the MLF before year-end 2020.
2.5
3.0
3.5
4.0
4.5
5.0
5.5
6.0rate, %
1 year lending rate 1 year LPRExpected LPR 1 year MLFExpected MLF
0%
2%
4%
6%
8%
10%
12%
14%
16%
18%
Mar-15 Dec-15 Sep-16 Jun-17 Mar-18 Dec-18
ppt contribution
Loan to small and micro enterprises Loan to rest
23
Economics ● Asia Q4 2019
Aside from the new interest rate reforms, the PBoC continues to use the reserve requirement ratio
(RRR) to provide monetary relief. A 50bp broad-based cut and a 100bp targeted cut for city
commercial banks were recently implemented and added more liquidity to the market (see PBoC
cuts RRR, more easing to come, 6 September 2019). We expect an additional 50bp cut by year-end
as well as a further 100bp cut in 2020. Moreover, increased lending to the corporate sector,
especially small and medium-sized enterprises (SMEs), will remain a forefront policy objective. In
addition to interest rate reforms aimed at lowering the borrowing rate, policymakers have used a
“carrot and stick” approach to encourage credit lending for the corporate sector throughout the year.
Tools such as targeted and tiered RRR cuts for SME-focused banks can provide further stimulus to
the economy because SMEs traditionally face higher interest rates as lenders view them as riskier.
Table 1. Three VAT cut scenarios expected to take place in 2020
VAT cut scenario Value of tax cut impact Value as a % of GDP, 2020e
Lower 13% to 11%, and lower 9% to 6%, keep 6% unchanged (conservative case)
From RMB925bn to RMB975bn 0.9
Lower 13% to 9%, keep 9% and 6% unchanged (base case)
From RMB1,200bn to RMB1,250bn 1.2
Lower 13% to 9%, and lower 9% to 6%, keep 6% unchanged (stimulative case)
From RMB1,525bn to RMB1,575bn 1.5
Source: Wind, CEIC, HSBC forecasts
From a fiscal policy side, we expect policymakers to continue to build off the momentum seen
earlier this year when they announced an RMB2trn corporate tax package for the year (see
Trade war: A winning strategy, 26 June 2019). Reductions to the valued-added tax and
corporations’ social security contributions helped provide a much needed fiscal boost. An
estimated RMB800-900bn in benefits are expected to come through for the remainder of the
year. More corporate tax cuts could be announced in 2020. These could take the form of further
VAT tax cuts (rates under the current tiered system range from 6 to 13%), a reduction in the
corporate tax rate (now at 25%), and further reduction in corporate social security contributions.
Fiscal stimulus can also take the form of support for infrastructure spending via the issuance of local
government bonds. An increase in the quota as well as pre-issuance for 2020 spending may spur
infrastructure development in the coming quarters. In September, the government already began the
process of asking for local governments’ assessments of their borrowing needs (Caixin, 5 September
2019). This is three months in advance of the same process last year, and the pre-clearance should
speed up issuance in the beginning of the year in 2020, leading to faster allocation of funds.
Chart 6. RRR cuts will be both broad and targeted
Chart 7. Local government bond issuance quotas expected to increase
Source: CEIC, HSBC Source: CEIC, HSBC
0
5
10
15
20
25
2004 2009 2014 2019
RRR, %
All
Large Depository Institutions
Small and Medium Depository Institutions
Medium Depository Institutions
Small Depository Institutions
0
500
1,000
1,500
2,000
2,500
3,000
3,500
2018 2019
Tho
usa
nd
s
bn RMB
Total new issuance General Special
Economics ● Asia Q4 2019
24
To restore confidence, more stimulus is needed
Slowing growth unlikely to be reversed through gradual stimulus
Policy easing has been trickling in for most of the year. But, in spite of the large tax cuts for the
corporate sector and better credit conditions for SMEs that have been pushed through, we have
yet to see a rebound in growth. It seems that the headwinds are overwhelming the effect of the
stimulus measures. While we expect a step-up in stimulus in the coming months, which may
offset some of the downward pressure on growth, the gradual policies will not be enough to
completely reverse the impact of the growing headwinds. Thus, if policy continues at the current
pace, we expect the slowdown in growth to continue into 2020 as business sentiment may fail to
pick up again.
Restoring business confidence needs a more dramatic approach
Like starting a car engine, confidence needs to be jump-started to get going again. Only then
can it reverse course and return to a stable growth path. Instead of gradual easing, a super-
stimulus package is needed to restore business confidence. A more concerted effort to step up
broad-based easing, and all at once, would not only give businesses the direct benefits of the
stimulus measures, but also provide a positive signal that policy will remain accommodative to
help restore confidence.
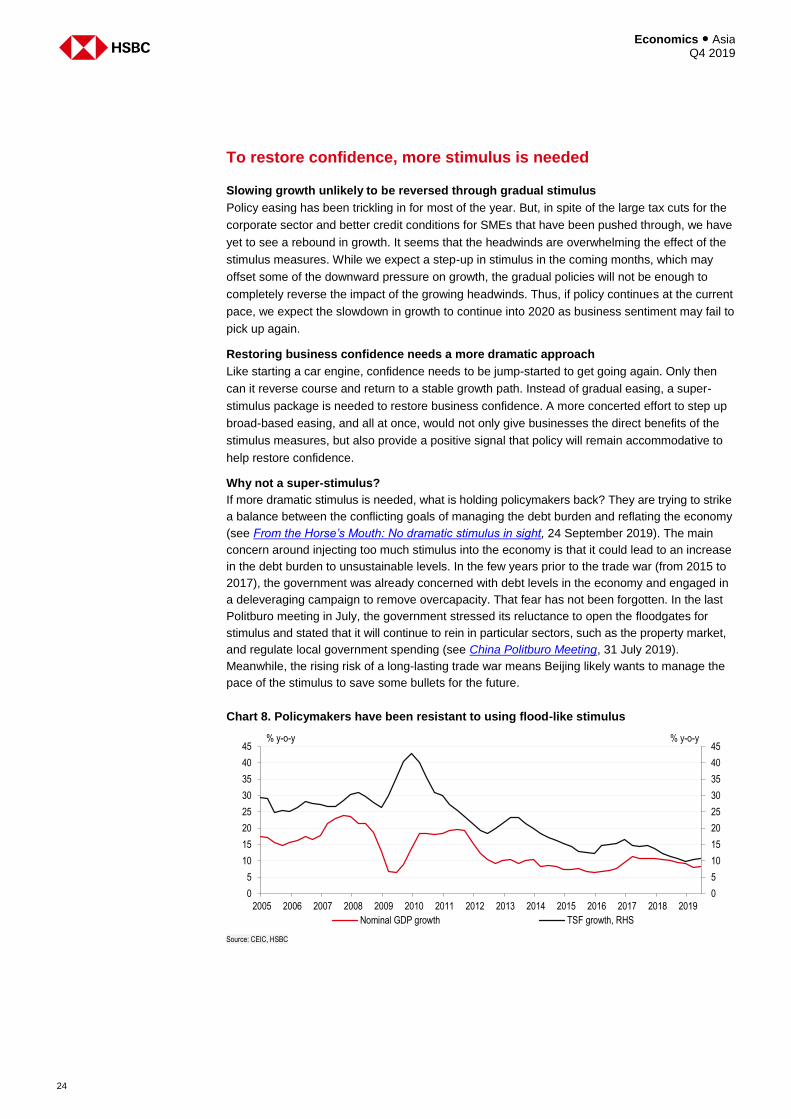
Why not a super-stimulus?
If more dramatic stimulus is needed, what is holding policymakers back? They are trying to strike
a balance between the conflicting goals of managing the debt burden and reflating the economy
(see From the Horse’s Mouth: No dramatic stimulus in sight, 24 September 2019). The main
concern around injecting too much stimulus into the economy is that it could lead to an increase
in the debt burden to unsustainable levels. In the few years prior to the trade war (from 2015 to
2017), the government was already concerned with debt levels in the economy and engaged in
a deleveraging campaign to remove overcapacity. That fear has not been forgotten. In the last
Politburo meeting in July, the government stressed its reluctance to open the floodgates for
stimulus and stated that it will continue to rein in particular sectors, such as the property market,
and regulate local government spending (see China Politburo Meeting, 31 July 2019).
Meanwhile, the rising risk of a long-lasting trade war means Beijing likely wants to manage the
pace of the stimulus to save some bullets for the future.
Chart 8. Policymakers have been resistant to using flood-like stimulus
Source: CEIC, HSBC
0
5
10
15
20
25
30
35
40
45
0
5
10
15
20
25
30
35
40
45
2005 2006 2007 2008 2009 2010 2011 2012 2013 2014 2015 2016 2017 2018 2019
% y-o-y% y-o-y
Nominal GDP growth TSF growth, RHS
25
Economics ● Asia Q4 2019
For the property market, the government has emphasised that real estate “should not be used
for speculation”, and is effectively excluded from using the best rate for lending (the 1-year
LPR). In addition, at the beginning of the year, policymakers introduced regulations to curb
inefficient local government spending and to stop the issuance of “hidden” debt. Special local
government bonds are restricted from being used for land reserves and real estate
development. These restrictions on the property market and local government spending are not
likely to let up anytime soon. At the same time, growing deflationary pressures have emerged, as
PPI has contracted for two months in a row, putting a further onus on Beijing to reflate the economy
(PPI in China, 10 September 2019).
Conclusion
In light of intensifying headwinds, policymakers will likely continue to step up easing in the coming
months with a mix of monetary (RRR cuts, cuts to the lending rate, increased lending to SMEs)
and fiscal policies (corporate tax cuts and local government bond issuance). However, the pace
of policy stimulus is too gradual to stabilise growth. More dramatic stimulus is needed to restore
business confidence, the main drag on growth. However, macroprudential concerns still hold
policymakers back, and the likelihood of a super-stimulus package coming through are reduced.
Gradual policy easing can offset some of the headwinds, but not enough to slow the slowdown.
Thus, our outlook for the coming quarters is one of subdued growth. At the end of August, we
adjusted our GDP growth forecast lower to 5.8% in 2020.

Economics ● Asia Q4 2019
26
This page has been left blank intentionally
27
Economics ● Asia Q4 2019
Indicators
Economics ● Asia Q4 2019
28
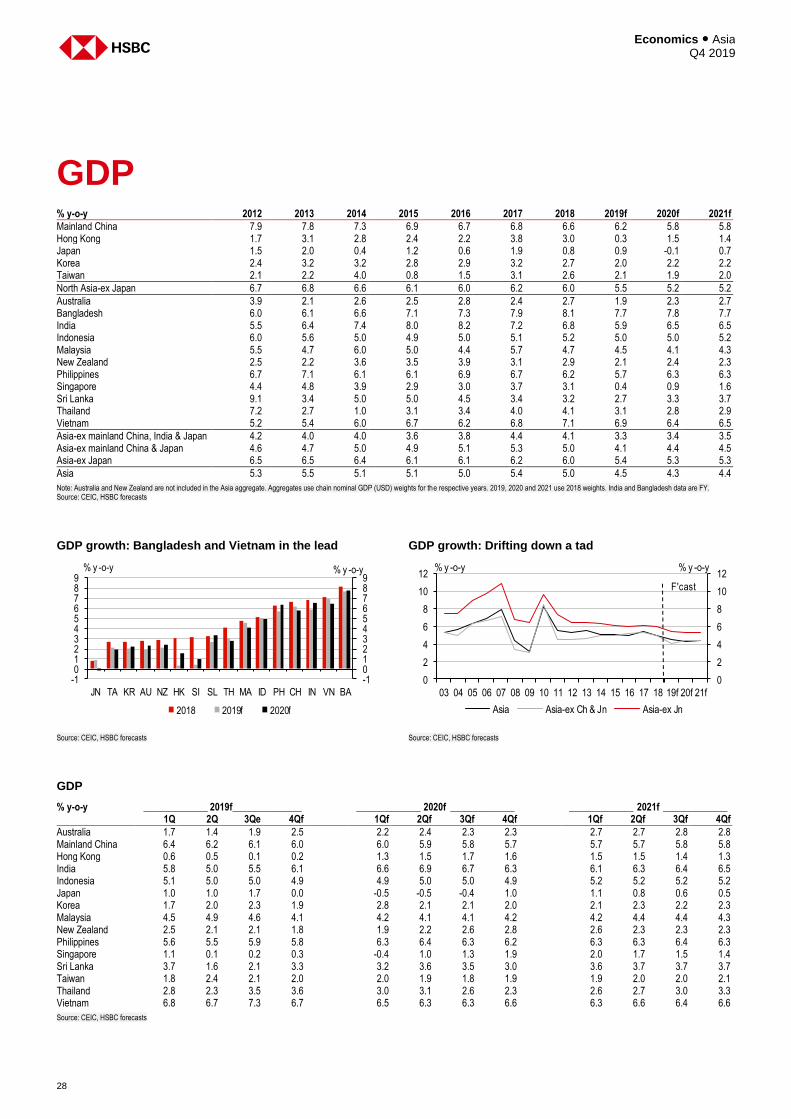
GDP % y-o-y 2012 2013 2014 2015 2016 2017 2018 2019f 2020f 2021f
Mainland China 7.9 7.8 7.3 6.9 6.7 6.8 6.6 6.2 5.8 5.8 Hong Kong 1.7 3.1 2.8 2.4 2.2 3.8 3.0 0.3 1.5 1.4 Japan 1.5 2.0 0.4 1.2 0.6 1.9 0.8 0.9 -0.1 0.7 Korea 2.4 3.2 3.2 2.8 2.9 3.2 2.7 2.0 2.2 2.2 Taiwan 2.1 2.2 4.0 0.8 1.5 3.1 2.6 2.1 1.9 2.0
North Asia-ex Japan 6.7 6.8 6.6 6.1 6.0 6.2 6.0 5.5 5.2 5.2
Australia 3.9 2.1 2.6 2.5 2.8 2.4 2.7 1.9 2.3 2.7 Bangladesh 6.0 6.1 6.6 7.1 7.3 7.9 8.1 7.7 7.8 7.7 India 5.5 6.4 7.4 8.0 8.2 7.2 6.8 5.9 6.5 6.5 Indonesia 6.0 5.6 5.0 4.9 5.0 5.1 5.2 5.0 5.0 5.2 Malaysia 5.5 4.7 6.0 5.0 4.4 5.7 4.7 4.5 4.1 4.3 New Zealand 2.5 2.2 3.6 3.5 3.9 3.1 2.9 2.1 2.4 2.3 Philippines 6.7 7.1 6.1 6.1 6.9 6.7 6.2 5.7 6.3 6.3 Singapore 4.4 4.8 3.9 2.9 3.0 3.7 3.1 0.4 0.9 1.6 Sri Lanka 9.1 3.4 5.0 5.0 4.5 3.4 3.2 2.7 3.3 3.7 Thailand 7.2 2.7 1.0 3.1 3.4 4.0 4.1 3.1 2.8 2.9 Vietnam 5.2 5.4 6.0 6.7 6.2 6.8 7.1 6.9 6.4 6.5
Asia-ex mainland China, India & Japan 4.2 4.0 4.0 3.6 3.8 4.4 4.1 3.3 3.4 3.5 Asia-ex mainland China & Japan 4.6 4.7 5.0 4.9 5.1 5.3 5.0 4.1 4.4 4.5 Asia-ex Japan 6.5 6.5 6.4 6.1 6.1 6.2 6.0 5.4 5.3 5.3
Asia 5.3 5.5 5.1 5.1 5.0 5.4 5.0 4.5 4.3 4.4
Note: Australia and New Zealand are not included in the Asia aggregate. Aggregates use chain nominal GDP (USD) weights for the respective years. 2019, 2020 and 2021 use 2018 weights. India and Bangladesh data are FY. Source: CEIC, HSBC forecasts
GDP growth: Bangladesh and Vietnam in the lead GDP growth: Drifting down a tad
Source: CEIC, HSBC forecasts Source: CEIC, HSBC forecasts
GDP
% y-o-y _____________ 2019f ______________ _____________ 2020f _____________ _____________ 2021f _____________ 1Q 2Q 3Qe 4Qf 1Qf 2Qf 3Qf 4Qf 1Qf 2Qf 3Qf 4Qf
Australia 1.7 1.4 1.9 2.5 2.2 2.4 2.3 2.3 2.7 2.7 2.8 2.8 Mainland China 6.4 6.2 6.1 6.0 6.0 5.9 5.8 5.7 5.7 5.7 5.8 5.8 Hong Kong 0.6 0.5 0.1 0.2 1.3 1.5 1.7 1.6 1.5 1.5 1.4 1.3 India 5.8 5.0 5.5 6.1 6.6 6.9 6.7 6.3 6.1 6.3 6.4 6.5 Indonesia 5.1 5.0 5.0 4.9 4.9 5.0 5.0 4.9 5.2 5.2 5.2 5.2 Japan 1.0 1.0 1.7 0.0 -0.5 -0.5 -0.4 1.0 1.1 0.8 0.6 0.5 Korea 1.7 2.0 2.3 1.9 2.8 2.1 2.1 2.0 2.1 2.3 2.2 2.3 Malaysia 4.5 4.9 4.6 4.1 4.2 4.1 4.1 4.2 4.2 4.4 4.4 4.3 New Zealand 2.5 2.1 2.1 1.8 1.9 2.2 2.6 2.8 2.6 2.3 2.3 2.3 Philippines 5.6 5.5 5.9 5.8 6.3 6.4 6.3 6.2 6.3 6.3 6.4 6.3 Singapore 1.1 0.1 0.2 0.3 -0.4 1.0 1.3 1.9 2.0 1.7 1.5 1.4 Sri Lanka 3.7 1.6 2.1 3.3 3.2 3.6 3.5 3.0 3.6 3.7 3.7 3.7 Taiwan 1.8 2.4 2.1 2.0 2.0 1.9 1.8 1.9 1.9 2.0 2.0 2.1 Thailand 2.8 2.3 3.5 3.6 3.0 3.1 2.6 2.3 2.6 2.7 3.0 3.3 Vietnam 6.8 6.7 7.3 6.7 6.5 6.3 6.3 6.6 6.3 6.6 6.4 6.6
Source: CEIC, HSBC forecasts
-10123456789
-10123456789
JN TA KR AU NZ HK SI SL TH MA ID PH CH IN VN BA
2018 2019f 2020f
% y -o-y % y -o-y
0
2
4
6
8
10
12
0
2
4
6
8
10
12
03 04 05 06 07 08 09 10 11 12 13 14 15 16 17 18 19f 20f 21f
F'cast
Asia Asia-ex Ch & Jn Asia-ex Jn
% y -o-y % y -o-y
29
Economics ● Asia Q4 2019
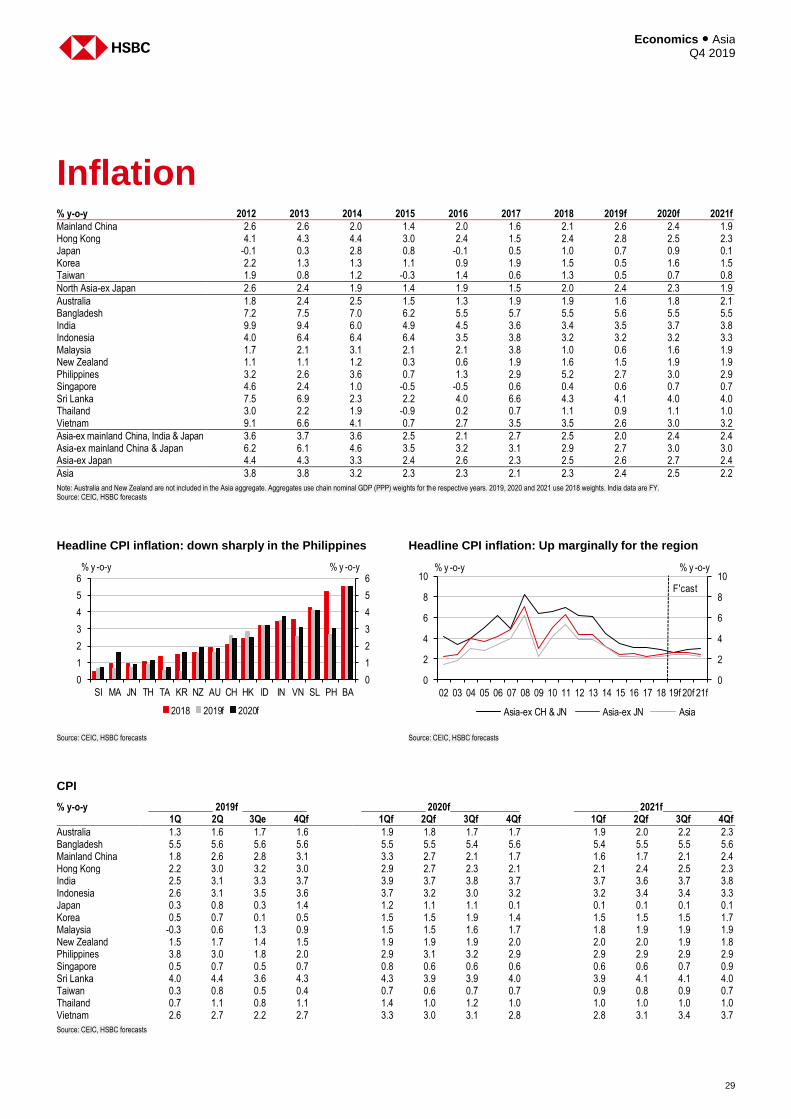
Inflation % y-o-y 2012 2013 2014 2015 2016 2017 2018 2019f 2020f 2021f
Mainland China 2.6 2.6 2.0 1.4 2.0 1.6 2.1 2.6 2.4 1.9 Hong Kong 4.1 4.3 4.4 3.0 2.4 1.5 2.4 2.8 2.5 2.3 Japan -0.1 0.3 2.8 0.8 -0.1 0.5 1.0 0.7 0.9 0.1 Korea 2.2 1.3 1.3 1.1 0.9 1.9 1.5 0.5 1.6 1.5 Taiwan 1.9 0.8 1.2 -0.3 1.4 0.6 1.3 0.5 0.7 0.8
North Asia-ex Japan 2.6 2.4 1.9 1.4 1.9 1.5 2.0 2.4 2.3 1.9
Australia 1.8 2.4 2.5 1.5 1.3 1.9 1.9 1.6 1.8 2.1 Bangladesh 7.2 7.5 7.0 6.2 5.5 5.7 5.5 5.6 5.5 5.5 India 9.9 9.4 6.0 4.9 4.5 3.6 3.4 3.5 3.7 3.8 Indonesia 4.0 6.4 6.4 6.4 3.5 3.8 3.2 3.2 3.2 3.3 Malaysia 1.7 2.1 3.1 2.1 2.1 3.8 1.0 0.6 1.6 1.9 New Zealand 1.1 1.1 1.2 0.3 0.6 1.9 1.6 1.5 1.9 1.9 Philippines 3.2 2.6 3.6 0.7 1.3 2.9 5.2 2.7 3.0 2.9 Singapore 4.6 2.4 1.0 -0.5 -0.5 0.6 0.4 0.6 0.7 0.7 Sri Lanka 7.5 6.9 2.3 2.2 4.0 6.6 4.3 4.1 4.0 4.0 Thailand 3.0 2.2 1.9 -0.9 0.2 0.7 1.1 0.9 1.1 1.0 Vietnam 9.1 6.6 4.1 0.7 2.7 3.5 3.5 2.6 3.0 3.2
Asia-ex mainland China, India & Japan 3.6 3.7 3.6 2.5 2.1 2.7 2.5 2.0 2.4 2.4 Asia-ex mainland China & Japan 6.2 6.1 4.6 3.5 3.2 3.1 2.9 2.7 3.0 3.0 Asia-ex Japan 4.4 4.3 3.3 2.4 2.6 2.3 2.5 2.6 2.7 2.4
Asia 3.8 3.8 3.2 2.3 2.3 2.1 2.3 2.4 2.5 2.2
Note: Australia and New Zealand are not included in the Asia aggregate. Aggregates use chain nominal GDP (PPP) weights for the respective years. 2019, 2020 and 2021 use 2018 weights. India data are FY. Source: CEIC, HSBC forecasts
Headline CPI inflation: down sharply in the Philippines Headline CPI inflation: Up marginally for the region
Source: CEIC, HSBC forecasts Source: CEIC, HSBC forecasts
CPI
% y-o-y _____________ 2019f _____________ _____________ 2020f ______________ _____________ 2021f ______________ 1Q 2Q 3Qe 4Qf 1Qf 2Qf 3Qf 4Qf 1Qf 2Qf 3Qf 4Qf
Australia 1.3 1.6 1.7 1.6 1.9 1.8 1.7 1.7 1.9 2.0 2.2 2.3 Bangladesh 5.5 5.6 5.6 5.6 5.5 5.5 5.4 5.6 5.4 5.5 5.5 5.6 Mainland China 1.8 2.6 2.8 3.1 3.3 2.7 2.1 1.7 1.6 1.7 2.1 2.4 Hong Kong 2.2 3.0 3.2 3.0 2.9 2.7 2.3 2.1 2.1 2.4 2.5 2.3 India 2.5 3.1 3.3 3.7 3.9 3.7 3.8 3.7 3.7 3.6 3.7 3.8 Indonesia 2.6 3.1 3.5 3.6 3.7 3.2 3.0 3.2 3.2 3.4 3.4 3.3 Japan 0.3 0.8 0.3 1.4 1.2 1.1 1.1 0.1 0.1 0.1 0.1 0.1 Korea 0.5 0.7 0.1 0.5 1.5 1.5 1.9 1.4 1.5 1.5 1.5 1.7 Malaysia -0.3 0.6 1.3 0.9 1.5 1.5 1.6 1.7 1.8 1.9 1.9 1.9 New Zealand 1.5 1.7 1.4 1.5 1.9 1.9 1.9 2.0 2.0 2.0 1.9 1.8 Philippines 3.8 3.0 1.8 2.0 2.9 3.1 3.2 2.9 2.9 2.9 2.9 2.9 Singapore 0.5 0.7 0.5 0.7 0.8 0.6 0.6 0.6 0.6 0.6 0.7 0.9 Sri Lanka 4.0 4.4 3.6 4.3 4.3 3.9 3.9 4.0 3.9 4.1 4.1 4.0 Taiwan 0.3 0.8 0.5 0.4 0.7 0.6 0.7 0.7 0.9 0.8 0.9 0.7 Thailand 0.7 1.1 0.8 1.1 1.4 1.0 1.2 1.0 1.0 1.0 1.0 1.0 Vietnam 2.6 2.7 2.2 2.7 3.3 3.0 3.1 2.8 2.8 3.1 3.4 3.7
Source: CEIC, HSBC forecasts
0
1
2
3
4
5
6
0
1
2
3
4
5
6
SI MA JN TH TA KR NZ AU CH HK ID IN VN SL PH BA
2018 2019f 2020f
% y -o-y % y -o-y
0
2
4
6
8
10
0
2
4
6
8
10
02 03 04 05 06 07 08 09 10 11 12 13 14 15 16 17 18 19f 20f 21f
F'cast
Asia-ex CH & JN Asia-ex JN Asia
% y -o-y % y -o-y
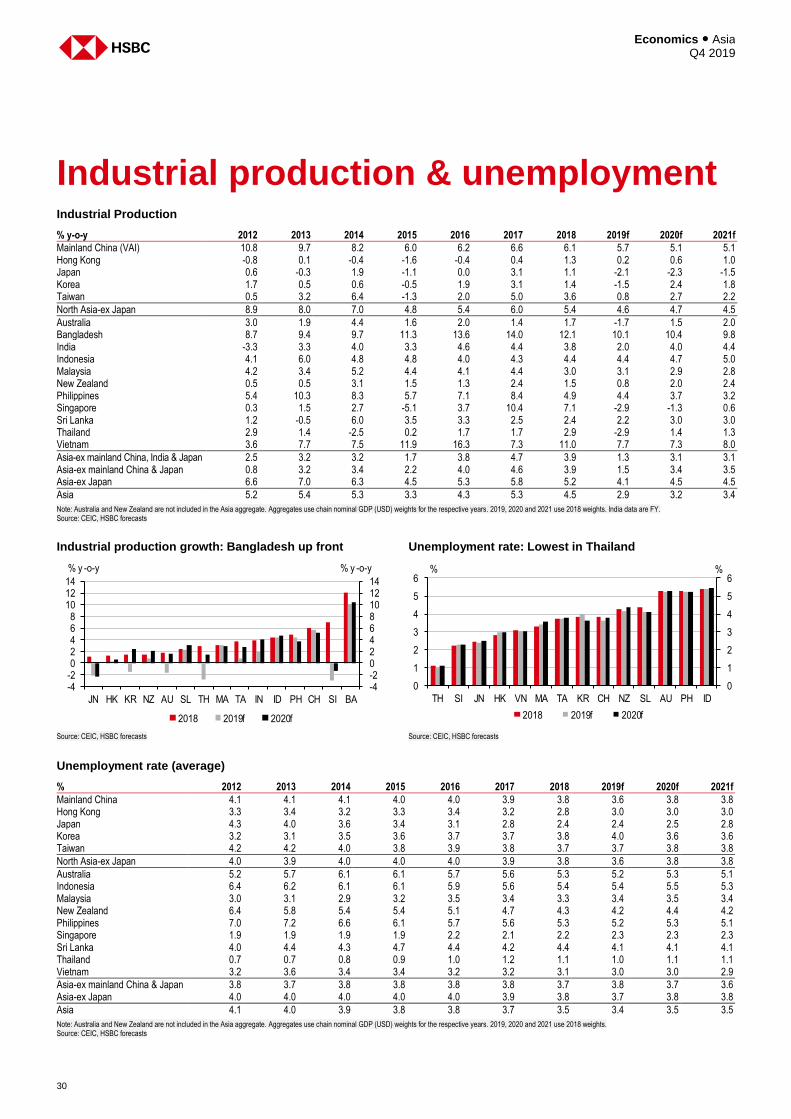
Economics ● Asia Q4 2019
30
Industrial production & unemployment Industrial Production
% y-o-y 2012 2013 2014 2015 2016 2017 2018 2019f 2020f 2021f
Mainland China (VAI) 10.8 9.7 8.2 6.0 6.2 6.6 6.1 5.7 5.1 5.1 Hong Kong -0.8 0.1 -0.4 -1.6 -0.4 0.4 1.3 0.2 0.6 1.0 Japan 0.6 -0.3 1.9 -1.1 0.0 3.1 1.1 -2.1 -2.3 -1.5 Korea 1.7 0.5 0.6 -0.5 1.9 3.1 1.4 -1.5 2.4 1.8 Taiwan 0.5 3.2 6.4 -1.3 2.0 5.0 3.6 0.8 2.7 2.2
North Asia-ex Japan 8.9 8.0 7.0 4.8 5.4 6.0 5.4 4.6 4.7 4.5
Australia 3.0 1.9 4.4 1.6 2.0 1.4 1.7 -1.7 1.5 2.0 Bangladesh 8.7 9.4 9.7 11.3 13.6 14.0 12.1 10.1 10.4 9.8 India -3.3 3.3 4.0 3.3 4.6 4.4 3.8 2.0 4.0 4.4 Indonesia 4.1 6.0 4.8 4.8 4.0 4.3 4.4 4.4 4.7 5.0 Malaysia 4.2 3.4 5.2 4.4 4.1 4.4 3.0 3.1 2.9 2.8 New Zealand 0.5 0.5 3.1 1.5 1.3 2.4 1.5 0.8 2.0 2.4 Philippines 5.4 10.3 8.3 5.7 7.1 8.4 4.9 4.4 3.7 3.2 Singapore 0.3 1.5 2.7 -5.1 3.7 10.4 7.1 -2.9 -1.3 0.6 Sri Lanka 1.2 -0.5 6.0 3.5 3.3 2.5 2.4 2.2 3.0 3.0 Thailand 2.9 1.4 -2.5 0.2 1.7 1.7 2.9 -2.9 1.4 1.3 Vietnam 3.6 7.7 7.5 11.9 16.3 7.3 11.0 7.7 7.3 8.0
Asia-ex mainland China, India & Japan 2.5 3.2 3.2 1.7 3.8 4.7 3.9 1.3 3.1 3.1 Asia-ex mainland China & Japan 0.8 3.2 3.4 2.2 4.0 4.6 3.9 1.5 3.4 3.5 Asia-ex Japan 6.6 7.0 6.3 4.5 5.3 5.8 5.2 4.1 4.5 4.5
Asia 5.2 5.4 5.3 3.3 4.3 5.3 4.5 2.9 3.2 3.4
Note: Australia and New Zealand are not included in the Asia aggregate. Aggregates use chain nominal GDP (USD) weights for the respective years. 2019, 2020 and 2021 use 2018 weights. India data are FY. Source: CEIC, HSBC forecasts
Industrial production growth: Bangladesh up front Unemployment rate: Lowest in Thailand
Source: CEIC, HSBC forecasts Source: CEIC, HSBC forecasts
Unemployment rate (average)
% 2012 2013 2014 2015 2016 2017 2018 2019f 2020f 2021f
Mainland China 4.1 4.1 4.1 4.0 4.0 3.9 3.8 3.6 3.8 3.8 Hong Kong 3.3 3.4 3.2 3.3 3.4 3.2 2.8 3.0 3.0 3.0 Japan 4.3 4.0 3.6 3.4 3.1 2.8 2.4 2.4 2.5 2.8 Korea 3.2 3.1 3.5 3.6 3.7 3.7 3.8 4.0 3.6 3.6 Taiwan 4.2 4.2 4.0 3.8 3.9 3.8 3.7 3.7 3.8 3.8
North Asia-ex Japan 4.0 3.9 4.0 4.0 4.0 3.9 3.8 3.6 3.8 3.8
Australia 5.2 5.7 6.1 6.1 5.7 5.6 5.3 5.2 5.3 5.1 Indonesia 6.4 6.2 6.1 6.1 5.9 5.6 5.4 5.4 5.5 5.3 Malaysia 3.0 3.1 2.9 3.2 3.5 3.4 3.3 3.4 3.5 3.4 New Zealand 6.4 5.8 5.4 5.4 5.1 4.7 4.3 4.2 4.4 4.2 Philippines 7.0 7.2 6.6 6.1 5.7 5.6 5.3 5.2 5.3 5.1 Singapore 1.9 1.9 1.9 1.9 2.2 2.1 2.2 2.3 2.3 2.3 Sri Lanka 4.0 4.4 4.3 4.7 4.4 4.2 4.4 4.1 4.1 4.1 Thailand 0.7 0.7 0.8 0.9 1.0 1.2 1.1 1.0 1.1 1.1 Vietnam 3.2 3.6 3.4 3.4 3.2 3.2 3.1 3.0 3.0 2.9
Asia-ex mainland China & Japan 3.8 3.7 3.8 3.8 3.8 3.8 3.7 3.8 3.7 3.6 Asia-ex Japan 4.0 4.0 4.0 4.0 4.0 3.9 3.8 3.7 3.8 3.8
Asia 4.1 4.0 3.9 3.8 3.8 3.7 3.5 3.4 3.5 3.5
Note: Australia and New Zealand are not included in the Asia aggregate. Aggregates use chain nominal GDP (USD) weights for the respective years. 2019, 2020 and 2021 use 2018 weights. Source: CEIC, HSBC forecasts
-4-202468101214
-4-202468
101214
JN HK KR NZ AU SL TH MA TA IN ID PH CH SI BA
2018 2019f 2020f
% y -o-y % y -o-y
0
1
2
3
4
5
6
0
1
2
3
4
5
6
TH SI JN HK VN MA TA KR CH NZ SL AU PH ID
2018 2019f 2020f
% %
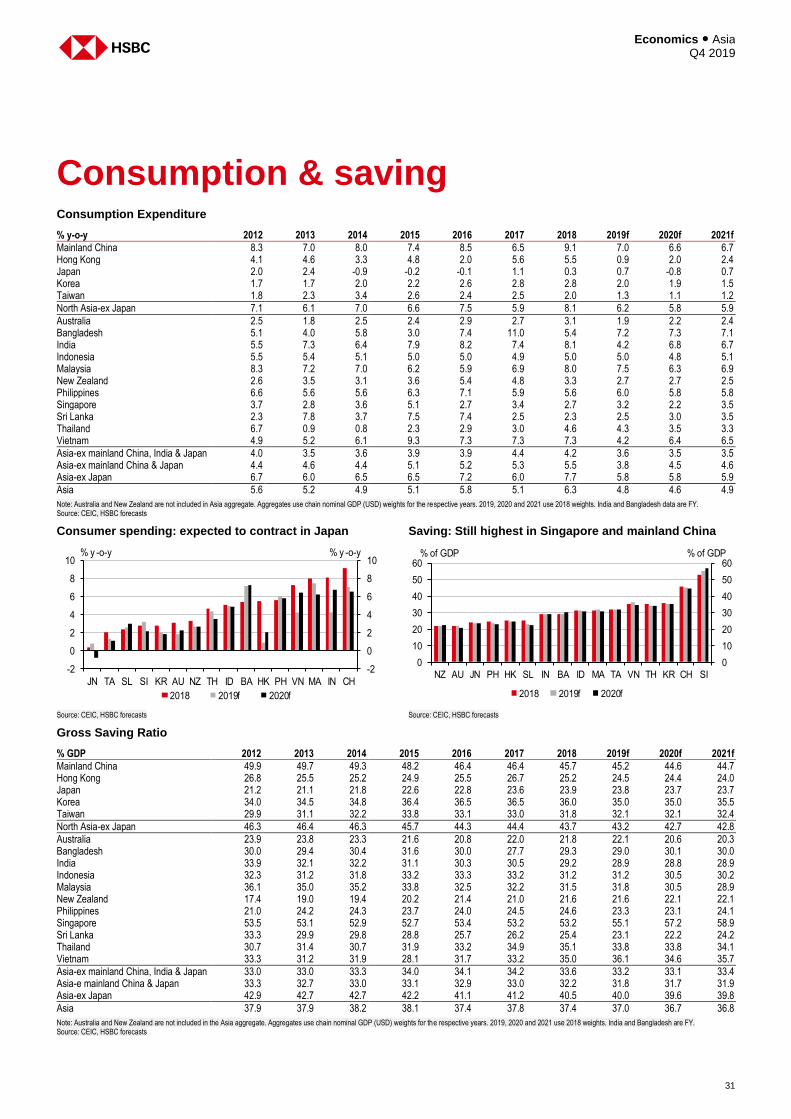
31
Economics ● Asia Q4 2019
Consumption & saving Consumption Expenditure
% y-o-y 2012 2013 2014 2015 2016 2017 2018 2019f 2020f 2021f
Mainland China 8.3 7.0 8.0 7.4 8.5 6.5 9.1 7.0 6.6 6.7 Hong Kong 4.1 4.6 3.3 4.8 2.0 5.6 5.5 0.9 2.0 2.4 Japan 2.0 2.4 -0.9 -0.2 -0.1 1.1 0.3 0.7 -0.8 0.7 Korea 1.7 1.7 2.0 2.2 2.6 2.8 2.8 2.0 1.9 1.5 Taiwan 1.8 2.3 3.4 2.6 2.4 2.5 2.0 1.3 1.1 1.2
North Asia-ex Japan 7.1 6.1 7.0 6.6 7.5 5.9 8.1 6.2 5.8 5.9
Australia 2.5 1.8 2.5 2.4 2.9 2.7 3.1 1.9 2.2 2.4 Bangladesh 5.1 4.0 5.8 3.0 7.4 11.0 5.4 7.2 7.3 7.1 India 5.5 7.3 6.4 7.9 8.2 7.4 8.1 4.2 6.8 6.7 Indonesia 5.5 5.4 5.1 5.0 5.0 4.9 5.0 5.0 4.8 5.1 Malaysia 8.3 7.2 7.0 6.2 5.9 6.9 8.0 7.5 6.3 6.9 New Zealand 2.6 3.5 3.1 3.6 5.4 4.8 3.3 2.7 2.7 2.5 Philippines 6.6 5.6 5.6 6.3 7.1 5.9 5.6 6.0 5.8 5.8 Singapore 3.7 2.8 3.6 5.1 2.7 3.4 2.7 3.2 2.2 3.5 Sri Lanka 2.3 7.8 3.7 7.5 7.4 2.5 2.3 2.5 3.0 3.5 Thailand 6.7 0.9 0.8 2.3 2.9 3.0 4.6 4.3 3.5 3.3 Vietnam 4.9 5.2 6.1 9.3 7.3 7.3 7.3 4.2 6.4 6.5
Asia-ex mainland China, India & Japan 4.0 3.5 3.6 3.9 3.9 4.4 4.2 3.6 3.5 3.5 Asia-ex mainland China & Japan 4.4 4.6 4.4 5.1 5.2 5.3 5.5 3.8 4.5 4.6 Asia-ex Japan 6.7 6.0 6.5 6.5 7.2 6.0 7.7 5.8 5.8 5.9
Asia 5.6 5.2 4.9 5.1 5.8 5.1 6.3 4.8 4.6 4.9
Note: Australia and New Zealand are not included in Asia aggregate. Aggregates use chain nominal GDP (USD) weights for the respective years. 2019, 2020 and 2021 use 2018 weights. India and Bangladesh data are FY. Source: CEIC, HSBC forecasts Consumer spending: expected to contract in Japan Saving: Still highest in Singapore and mainland China
Source: CEIC, HSBC forecasts Source: CEIC, HSBC forecasts Gross Saving Ratio
% GDP 2012 2013 2014 2015 2016 2017 2018 2019f 2020f 2021f
Mainland China 49.9 49.7 49.3 48.2 46.4 46.4 45.7 45.2 44.6 44.7 Hong Kong 26.8 25.5 25.2 24.9 25.5 26.7 25.2 24.5 24.4 24.0 Japan 21.2 21.1 21.8 22.6 22.8 23.6 23.9 23.8 23.7 23.7 Korea 34.0 34.5 34.8 36.4 36.5 36.5 36.0 35.0 35.0 35.5 Taiwan 29.9 31.1 32.2 33.8 33.1 33.0 31.8 32.1 32.1 32.4
North Asia-ex Japan 46.3 46.4 46.3 45.7 44.3 44.4 43.7 43.2 42.7 42.8
Australia 23.9 23.8 23.3 21.6 20.8 22.0 21.8 22.1 20.6 20.3 Bangladesh 30.0 29.4 30.4 31.6 30.0 27.7 29.3 29.0 30.1 30.0 India 33.9 32.1 32.2 31.1 30.3 30.5 29.2 28.9 28.8 28.9 Indonesia 32.3 31.2 31.8 33.2 33.3 33.2 31.2 31.2 30.5 30.2 Malaysia 36.1 35.0 35.2 33.8 32.5 32.2 31.5 31.8 30.5 28.9 New Zealand 17.4 19.0 19.4 20.2 21.4 21.0 21.6 21.6 22.1 22.1 Philippines 21.0 24.2 24.3 23.7 24.0 24.5 24.6 23.3 23.1 24.1 Singapore 53.5 53.1 52.9 52.7 53.4 53.2 53.2 55.1 57.2 58.9 Sri Lanka 33.3 29.9 29.8 28.8 25.7 26.2 25.4 23.1 22.2 24.2 Thailand 30.7 31.4 30.7 31.9 33.2 34.9 35.1 33.8 33.8 34.1 Vietnam 33.3 31.2 31.9 28.1 31.7 33.2 35.0 36.1 34.6 35.7
Asia-ex mainland China, India & Japan 33.0 33.0 33.3 34.0 34.1 34.2 33.6 33.2 33.1 33.4 Asia-e mainland China & Japan 33.3 32.7 33.0 33.1 32.9 33.0 32.2 31.8 31.7 31.9 Asia-ex Japan 42.9 42.7 42.7 42.2 41.1 41.2 40.5 40.0 39.6 39.8
Asia 37.9 37.9 38.2 38.1 37.4 37.8 37.4 37.0 36.7 36.8
Note: Australia and New Zealand are not included in the Asia aggregate. Aggregates use chain nominal GDP (USD) weights for the respective years. 2019, 2020 and 2021 use 2018 weights. India and Bangladesh are FY. Source: CEIC, HSBC forecasts
-2
0
2
4
6
8
10
-2
0
2
4
6
8
10
JN TA SL SI KR AU NZ TH ID BA HK PH VN MA IN CH
2018 2019f 2020f
% y -o-y % y -o-y
0
10
20
30
40
50
60
0
10
20
30
40
50
60
NZ AU JN PH HK SL IN BA ID MA TA VN TH KR CH SI
2018 2019f 2020f
% of GDP % of GDP
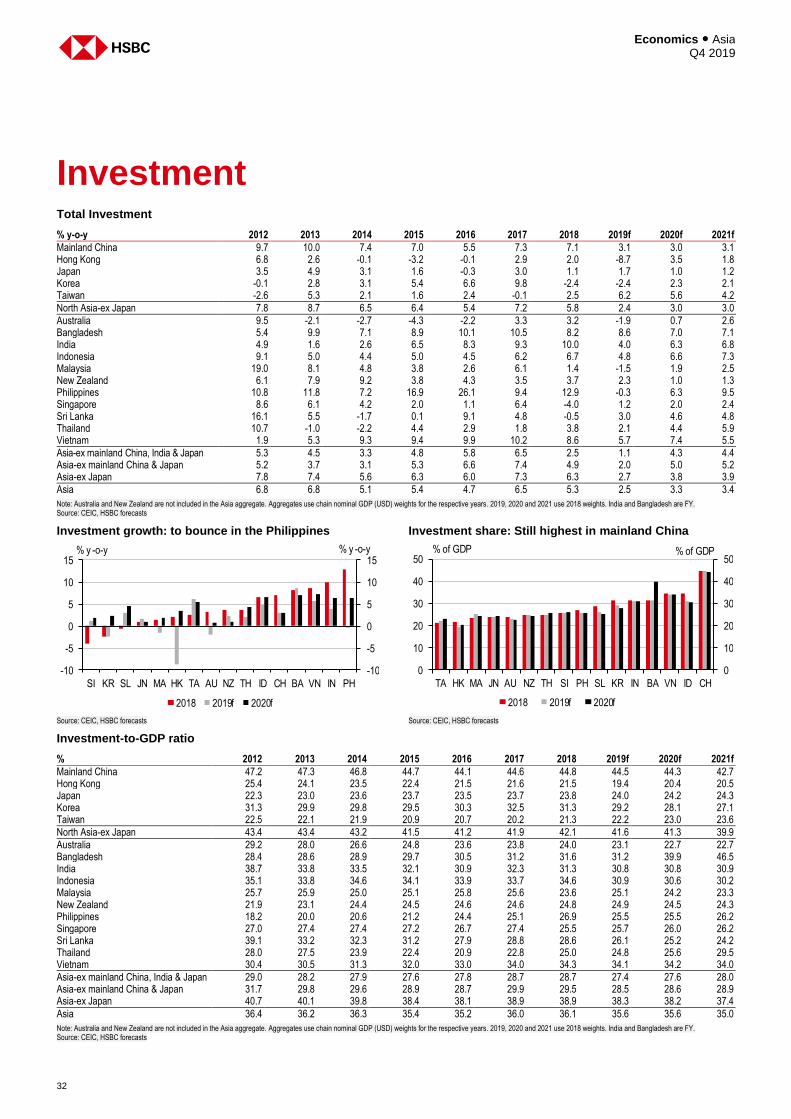
Economics ● Asia Q4 2019
32
Investment Total Investment
% y-o-y 2012 2013 2014 2015 2016 2017 2018 2019f 2020f 2021f
Mainland China 9.7 10.0 7.4 7.0 5.5 7.3 7.1 3.1 3.0 3.1 Hong Kong 6.8 2.6 -0.1 -3.2 -0.1 2.9 2.0 -8.7 3.5 1.8 Japan 3.5 4.9 3.1 1.6 -0.3 3.0 1.1 1.7 1.0 1.2 Korea -0.1 2.8 3.1 5.4 6.6 9.8 -2.4 -2.4 2.3 2.1 Taiwan -2.6 5.3 2.1 1.6 2.4 -0.1 2.5 6.2 5.6 4.2
North Asia-ex Japan 7.8 8.7 6.5 6.4 5.4 7.2 5.8 2.4 3.0 3.0
Australia 9.5 -2.1 -2.7 -4.3 -2.2 3.3 3.2 -1.9 0.7 2.6 Bangladesh 5.4 9.9 7.1 8.9 10.1 10.5 8.2 8.6 7.0 7.1 India 4.9 1.6 2.6 6.5 8.3 9.3 10.0 4.0 6.3 6.8 Indonesia 9.1 5.0 4.4 5.0 4.5 6.2 6.7 4.8 6.6 7.3 Malaysia 19.0 8.1 4.8 3.8 2.6 6.1 1.4 -1.5 1.9 2.5 New Zealand 6.1 7.9 9.2 3.8 4.3 3.5 3.7 2.3 1.0 1.3 Philippines 10.8 11.8 7.2 16.9 26.1 9.4 12.9 -0.3 6.3 9.5 Singapore 8.6 6.1 4.2 2.0 1.1 6.4 -4.0 1.2 2.0 2.4 Sri Lanka 16.1 5.5 -1.7 0.1 9.1 4.8 -0.5 3.0 4.6 4.8 Thailand 10.7 -1.0 -2.2 4.4 2.9 1.8 3.8 2.1 4.4 5.9 Vietnam 1.9 5.3 9.3 9.4 9.9 10.2 8.6 5.7 7.4 5.5
Asia-ex mainland China, India & Japan 5.3 4.5 3.3 4.8 5.8 6.5 2.5 1.1 4.3 4.4 Asia-ex mainland China & Japan 5.2 3.7 3.1 5.3 6.6 7.4 4.9 2.0 5.0 5.2 Asia-ex Japan 7.8 7.4 5.6 6.3 6.0 7.3 6.3 2.7 3.8 3.9
Asia 6.8 6.8 5.1 5.4 4.7 6.5 5.3 2.5 3.3 3.4
Note: Australia and New Zealand are not included in the Asia aggregate. Aggregates use chain nominal GDP (USD) weights for the respective years. 2019, 2020 and 2021 use 2018 weights. India and Bangladesh are FY. Source: CEIC, HSBC forecasts Investment growth: to bounce in the Philippines Investment share: Still highest in mainland China
Source: CEIC, HSBC forecasts Source: CEIC, HSBC forecasts Investment-to-GDP ratio
% 2012 2013 2014 2015 2016 2017 2018 2019f 2020f 2021f
Mainland China 47.2 47.3 46.8 44.7 44.1 44.6 44.8 44.5 44.3 42.7 Hong Kong 25.4 24.1 23.5 22.4 21.5 21.6 21.5 19.4 20.4 20.5 Japan 22.3 23.0 23.6 23.7 23.5 23.7 23.8 24.0 24.2 24.3 Korea 31.3 29.9 29.8 29.5 30.3 32.5 31.3 29.2 28.1 27.1 Taiwan 22.5 22.1 21.9 20.9 20.7 20.2 21.3 22.2 23.0 23.6
North Asia-ex Japan 43.4 43.4 43.2 41.5 41.2 41.9 42.1 41.6 41.3 39.9
Australia 29.2 28.0 26.6 24.8 23.6 23.8 24.0 23.1 22.7 22.7 Bangladesh 28.4 28.6 28.9 29.7 30.5 31.2 31.6 31.2 39.9 46.5 India 38.7 33.8 33.5 32.1 30.9 32.3 31.3 30.8 30.8 30.9 Indonesia 35.1 33.8 34.6 34.1 33.9 33.7 34.6 30.9 30.6 30.2 Malaysia 25.7 25.9 25.0 25.1 25.8 25.6 23.6 25.1 24.2 23.3 New Zealand 21.9 23.1 24.4 24.5 24.6 24.6 24.8 24.9 24.5 24.3 Philippines 18.2 20.0 20.6 21.2 24.4 25.1 26.9 25.5 25.5 26.2 Singapore 27.0 27.4 27.4 27.2 26.7 27.4 25.5 25.7 26.0 26.2 Sri Lanka 39.1 33.2 32.3 31.2 27.9 28.8 28.6 26.1 25.2 24.2 Thailand 28.0 27.5 23.9 22.4 20.9 22.8 25.0 24.8 25.6 29.5 Vietnam 30.4 30.5 31.3 32.0 33.0 34.0 34.3 34.1 34.2 34.0
Asia-ex mainland China, India & Japan 29.0 28.2 27.9 27.6 27.8 28.7 28.7 27.4 27.6 28.0 Asia-ex mainland China & Japan 31.7 29.8 29.6 28.9 28.7 29.9 29.5 28.5 28.6 28.9 Asia-ex Japan 40.7 40.1 39.8 38.4 38.1 38.9 38.9 38.3 38.2 37.4
Asia 36.4 36.2 36.3 35.4 35.2 36.0 36.1 35.6 35.6 35.0
Note: Australia and New Zealand are not included in the Asia aggregate. Aggregates use chain nominal GDP (USD) weights for the respective years. 2019, 2020 and 2021 use 2018 weights. India and Bangladesh are FY. Source: CEIC, HSBC forecasts
-10
-5
0
5
10
15
-10
-5
0
5
10
15
SI KR SL JN MA HK TA AU NZ TH ID CH BA VN IN PH
2018 2019f 2020f
% y -o-y % y -o-y
0
10
20
30
40
50
0
10
20
30
40
50
TA HK MA JN AU NZ TH SI PH SL KR IN BA VN ID CH
2018 2019f 2020f
% of GDP % of GDP
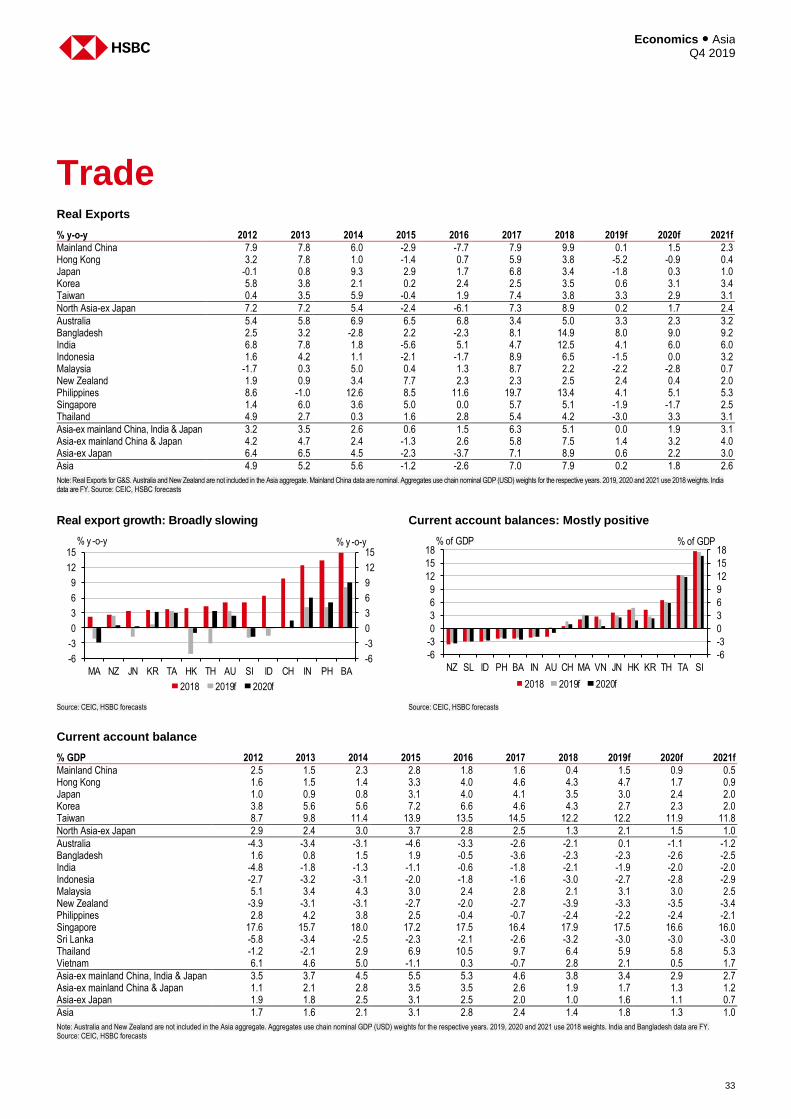
33
Economics ● Asia Q4 2019
Trade Real Exports
% y-o-y 2012 2013 2014 2015 2016 2017 2018 2019f 2020f 2021f
Mainland China 7.9 7.8 6.0 -2.9 -7.7 7.9 9.9 0.1 1.5 2.3 Hong Kong 3.2 7.8 1.0 -1.4 0.7 5.9 3.8 -5.2 -0.9 0.4 Japan -0.1 0.8 9.3 2.9 1.7 6.8 3.4 -1.8 0.3 1.0 Korea 5.8 3.8 2.1 0.2 2.4 2.5 3.5 0.6 3.1 3.4 Taiwan 0.4 3.5 5.9 -0.4 1.9 7.4 3.8 3.3 2.9 3.1
North Asia-ex Japan 7.2 7.2 5.4 -2.4 -6.1 7.3 8.9 0.2 1.7 2.4
Australia 5.4 5.8 6.9 6.5 6.8 3.4 5.0 3.3 2.3 3.2 Bangladesh 2.5 3.2 -2.8 2.2 -2.3 8.1 14.9 8.0 9.0 9.2 India 6.8 7.8 1.8 -5.6 5.1 4.7 12.5 4.1 6.0 6.0 Indonesia 1.6 4.2 1.1 -2.1 -1.7 8.9 6.5 -1.5 0.0 3.2 Malaysia -1.7 0.3 5.0 0.4 1.3 8.7 2.2 -2.2 -2.8 0.7 New Zealand 1.9 0.9 3.4 7.7 2.3 2.3 2.5 2.4 0.4 2.0 Philippines 8.6 -1.0 12.6 8.5 11.6 19.7 13.4 4.1 5.1 5.3 Singapore 1.4 6.0 3.6 5.0 0.0 5.7 5.1 -1.9 -1.7 2.5 Thailand 4.9 2.7 0.3 1.6 2.8 5.4 4.2 -3.0 3.3 3.1
Asia-ex mainland China, India & Japan 3.2 3.5 2.6 0.6 1.5 6.3 5.1 0.0 1.9 3.1 Asia-ex mainland China & Japan 4.2 4.7 2.4 -1.3 2.6 5.8 7.5 1.4 3.2 4.0 Asia-ex Japan 6.4 6.5 4.5 -2.3 -3.7 7.1 8.9 0.6 2.2 3.0
Asia 4.9 5.2 5.6 -1.2 -2.6 7.0 7.9 0.2 1.8 2.6
Note: Real Exports for G&S. Australia and New Zealand are not included in the Asia aggregate. Mainland China data are nominal. Aggregates use chain nominal GDP (USD) weights for the respective years. 2019, 2020 and 2021 use 2018 weights. India data are FY. Source: CEIC, HSBC forecasts
Real export growth: Broadly slowing Current account balances: Mostly positive
Source: CEIC, HSBC forecasts Source: CEIC, HSBC forecasts
Current account balance
% GDP 2012 2013 2014 2015 2016 2017 2018 2019f 2020f 2021f
Mainland China 2.5 1.5 2.3 2.8 1.8 1.6 0.4 1.5 0.9 0.5 Hong Kong 1.6 1.5 1.4 3.3 4.0 4.6 4.3 4.7 1.7 0.9 Japan 1.0 0.9 0.8 3.1 4.0 4.1 3.5 3.0 2.4 2.0 Korea 3.8 5.6 5.6 7.2 6.6 4.6 4.3 2.7 2.3 2.0 Taiwan 8.7 9.8 11.4 13.9 13.5 14.5 12.2 12.2 11.9 11.8
North Asia-ex Japan 2.9 2.4 3.0 3.7 2.8 2.5 1.3 2.1 1.5 1.0
Australia -4.3 -3.4 -3.1 -4.6 -3.3 -2.6 -2.1 0.1 -1.1 -1.2 Bangladesh 1.6 0.8 1.5 1.9 -0.5 -3.6 -2.3 -2.3 -2.6 -2.5 India -4.8 -1.8 -1.3 -1.1 -0.6 -1.8 -2.1 -1.9 -2.0 -2.0 Indonesia -2.7 -3.2 -3.1 -2.0 -1.8 -1.6 -3.0 -2.7 -2.8 -2.9 Malaysia 5.1 3.4 4.3 3.0 2.4 2.8 2.1 3.1 3.0 2.5 New Zealand -3.9 -3.1 -3.1 -2.7 -2.0 -2.7 -3.9 -3.3 -3.5 -3.4 Philippines 2.8 4.2 3.8 2.5 -0.4 -0.7 -2.4 -2.2 -2.4 -2.1 Singapore 17.6 15.7 18.0 17.2 17.5 16.4 17.9 17.5 16.6 16.0 Sri Lanka -5.8 -3.4 -2.5 -2.3 -2.1 -2.6 -3.2 -3.0 -3.0 -3.0 Thailand -1.2 -2.1 2.9 6.9 10.5 9.7 6.4 5.9 5.8 5.3 Vietnam 6.1 4.6 5.0 -1.1 0.3 -0.7 2.8 2.1 0.5 1.7
Asia-ex mainland China, India & Japan 3.5 3.7 4.5 5.5 5.3 4.6 3.8 3.4 2.9 2.7 Asia-ex mainland China & Japan 1.1 2.1 2.8 3.5 3.5 2.6 1.9 1.7 1.3 1.2 Asia-ex Japan 1.9 1.8 2.5 3.1 2.5 2.0 1.0 1.6 1.1 0.7
Asia 1.7 1.6 2.1 3.1 2.8 2.4 1.4 1.8 1.3 1.0
Note: Australia and New Zealand are not included in the Asia aggregate. Aggregates use chain nominal GDP (USD) weights for the respective years. 2019, 2020 and 2021 use 2018 weights. India and Bangladesh data are FY. Source: CEIC, HSBC forecasts
-6
-3
0
3
6
9
12
15
-6
-3
0
3
6
9
12
15
MA NZ JN KR TA HK TH AU SI ID CH IN PH BA
2018 2019f 2020f
% y -o-y % y -o-y
-6
-3
0
3
6
9
12
15
18
-6
-3
0
3
6
9
12
15
18
NZ SL ID PH BA IN AU CH MA VN JN HK KR TH TA SI
2018 2019f 2020f
% of GDP % of GDP

Economics ● Asia Q4 2019
34
This page has been left blank intentionally
35
Economics ● Asia Q4 2019
Economy profiles
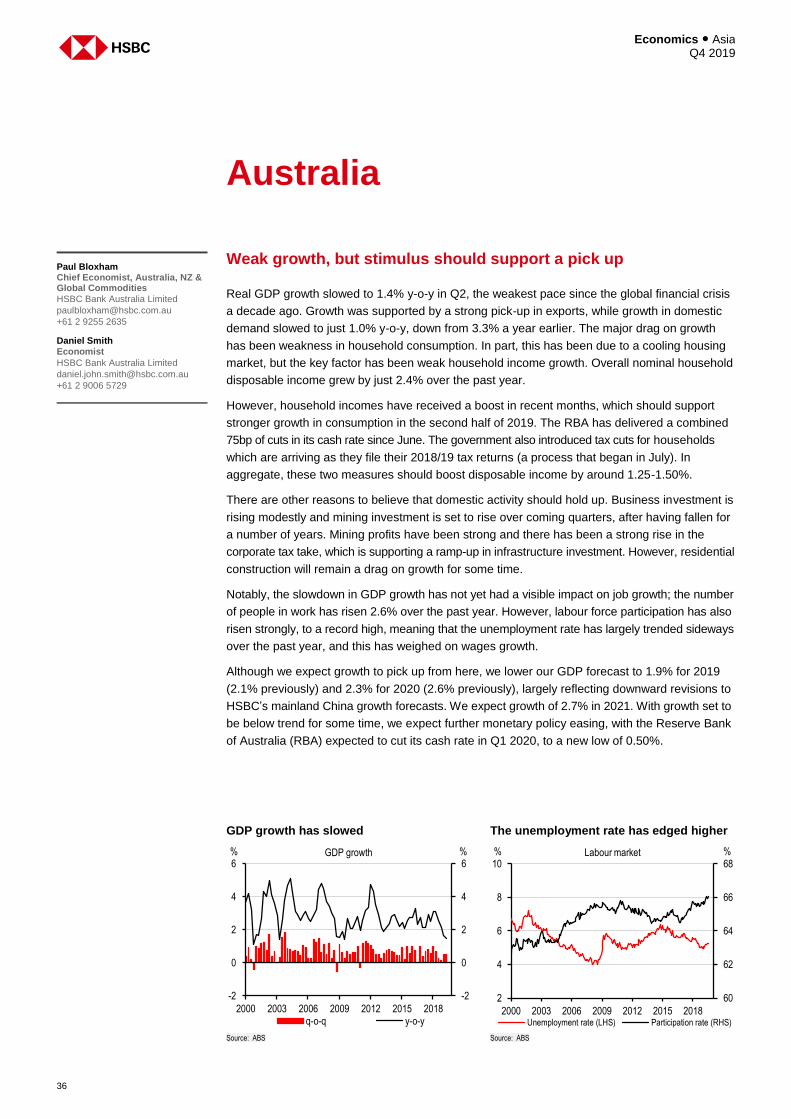
Economics ● Asia Q4 2019
36
Australia
Weak growth, but stimulus should support a pick up
Real GDP growth slowed to 1.4% y-o-y in Q2, the weakest pace since the global financial crisis
a decade ago. Growth was supported by a strong pick-up in exports, while growth in domestic
demand slowed to just 1.0% y-o-y, down from 3.3% a year earlier. The major drag on growth
has been weakness in household consumption. In part, this has been due to a cooling housing
market, but the key factor has been weak household income growth. Overall nominal household
disposable income grew by just 2.4% over the past year.
However, household incomes have received a boost in recent months, which should support
stronger growth in consumption in the second half of 2019. The RBA has delivered a combined
75bp of cuts in its cash rate since June. The government also introduced tax cuts for households
which are arriving as they file their 2018/19 tax returns (a process that began in July). In
aggregate, these two measures should boost disposable income by around 1.25-1.50%.
There are other reasons to believe that domestic activity should hold up. Business investment is
rising modestly and mining investment is set to rise over coming quarters, after having fallen for
a number of years. Mining profits have been strong and there has been a strong rise in the
corporate tax take, which is supporting a ramp-up in infrastructure investment. However, residential
construction will remain a drag on growth for some time.
Notably, the slowdown in GDP growth has not yet had a visible impact on job growth; the number
of people in work has risen 2.6% over the past year. However, labour force participation has also
risen strongly, to a record high, meaning that the unemployment rate has largely trended sideways
over the past year, and this has weighed on wages growth.
Although we expect growth to pick up from here, we lower our GDP forecast to 1.9% for 2019
(2.1% previously) and 2.3% for 2020 (2.6% previously), largely reflecting downward revisions to
HSBC’s mainland China growth forecasts. We expect growth of 2.7% in 2021. With growth set to
be below trend for some time, we expect further monetary policy easing, with the Reserve Bank
of Australia (RBA) expected to cut its cash rate in Q1 2020, to a new low of 0.50%.
GDP growth has slowed The unemployment rate has edged higher
Source: ABS Source: ABS
Paul Bloxham Chief Economist, Australia, NZ & Global Commodities
HSBC Bank Australia Limited
+61 2 9255 2635
Daniel Smith Economist
HSBC Bank Australia Limited
+61 2 9006 5729
-2
0
2
4
6
-2
0
2
4
6
2000 2003 2006 2009 2012 2015 2018q-o-q y-o-y
% %GDP growth
60
62
64
66
68
2
4
6
8
10
2000 2003 2006 2009 2012 2015 2018Unemployment rate (LHS) Participation rate (RHS)
% %Labour market
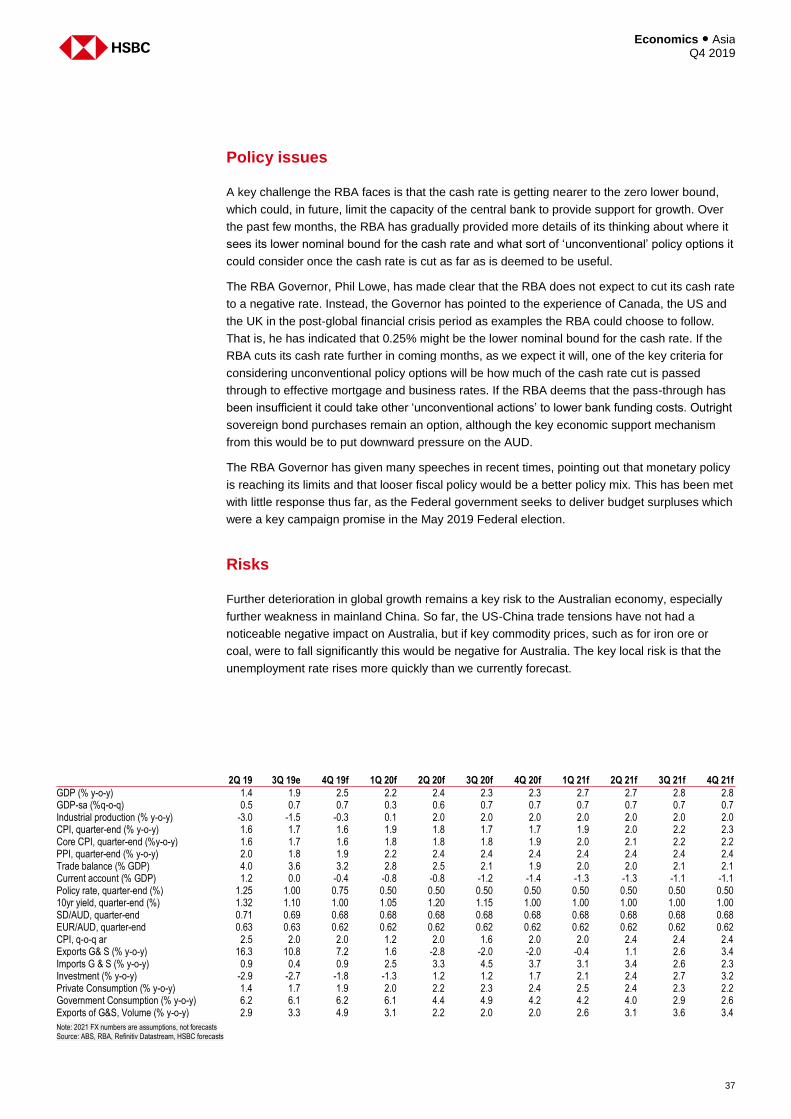
37
Economics ● Asia Q4 2019
Policy issues
A key challenge the RBA faces is that the cash rate is getting nearer to the zero lower bound,
which could, in future, limit the capacity of the central bank to provide support for growth. Over
the past few months, the RBA has gradually provided more details of its thinking about where it
sees its lower nominal bound for the cash rate and what sort of ‘unconventional’ policy options it
could consider once the cash rate is cut as far as is deemed to be useful.
The RBA Governor, Phil Lowe, has made clear that the RBA does not expect to cut its cash rate
to a negative rate. Instead, the Governor has pointed to the experience of Canada, the US and
the UK in the post-global financial crisis period as examples the RBA could choose to follow.
That is, he has indicated that 0.25% might be the lower nominal bound for the cash rate. If the
RBA cuts its cash rate further in coming months, as we expect it will, one of the key criteria for
considering unconventional policy options will be how much of the cash rate cut is passed
through to effective mortgage and business rates. If the RBA deems that the pass-through has
been insufficient it could take other ‘unconventional actions’ to lower bank funding costs. Outright
sovereign bond purchases remain an option, although the key economic support mechanism
from this would be to put downward pressure on the AUD.
The RBA Governor has given many speeches in recent times, pointing out that monetary policy
is reaching its limits and that looser fiscal policy would be a better policy mix. This has been met
with little response thus far, as the Federal government seeks to deliver budget surpluses which
were a key campaign promise in the May 2019 Federal election.
Risks
Further deterioration in global growth remains a key risk to the Australian economy, especially
further weakness in mainland China. So far, the US-China trade tensions have not had a
noticeable negative impact on Australia, but if key commodity prices, such as for iron ore or
coal, were to fall significantly this would be negative for Australia. The key local risk is that the
unemployment rate rises more quickly than we currently forecast.
2Q 19 3Q 19e 4Q 19f 1Q 20f 2Q 20f 3Q 20f 4Q 20f 1Q 21f 2Q 21f 3Q 21f 4Q 21f
GDP (% y-o-y) 1.4 1.9 2.5 2.2 2.4 2.3 2.3 2.7 2.7 2.8 2.8 GDP-sa (%q-o-q) 0.5 0.7 0.7 0.3 0.6 0.7 0.7 0.7 0.7 0.7 0.7 Industrial production (% y-o-y) -3.0 -1.5 -0.3 0.1 2.0 2.0 2.0 2.0 2.0 2.0 2.0 CPI, quarter-end (% y-o-y) 1.6 1.7 1.6 1.9 1.8 1.7 1.7 1.9 2.0 2.2 2.3 Core CPI, quarter-end (%y-o-y) 1.6 1.7 1.6 1.8 1.8 1.8 1.9 2.0 2.1 2.2 2.2 PPI, quarter-end (% y-o-y) 2.0 1.8 1.9 2.2 2.4 2.4 2.4 2.4 2.4 2.4 2.4 Trade balance (% GDP) 4.0 3.6 3.2 2.8 2.5 2.1 1.9 2.0 2.0 2.1 2.1 Current account (% GDP) 1.2 0.0 -0.4 -0.8 -0.8 -1.2 -1.4 -1.3 -1.3 -1.1 -1.1 Policy rate, quarter-end (%) 1.25 1.00 0.75 0.50 0.50 0.50 0.50 0.50 0.50 0.50 0.50 10yr yield, quarter-end (%) 1.32 1.10 1.00 1.05 1.20 1.15 1.00 1.00 1.00 1.00 1.00 SD/AUD, quarter-end 0.71 0.69 0.68 0.68 0.68 0.68 0.68 0.68 0.68 0.68 0.68 EUR/AUD, quarter-end 0.63 0.63 0.62 0.62 0.62 0.62 0.62 0.62 0.62 0.62 0.62 CPI, q-o-q ar 2.5 2.0 2.0 1.2 2.0 1.6 2.0 2.0 2.4 2.4 2.4 Exports G& S (% y-o-y) 16.3 10.8 7.2 1.6 -2.8 -2.0 -2.0 -0.4 1.1 2.6 3.4 Imports G & S (% y-o-y) 0.9 0.4 0.9 2.5 3.3 4.5 3.7 3.1 3.4 2.6 2.3 Investment (% y-o-y) -2.9 -2.7 -1.8 -1.3 1.2 1.2 1.7 2.1 2.4 2.7 3.2 Private Consumption (% y-o-y) 1.4 1.7 1.9 2.0 2.2 2.3 2.4 2.5 2.4 2.3 2.2 Government Consumption (% y-o-y) 6.2 6.1 6.2 6.1 4.4 4.9 4.2 4.2 4.0 2.9 2.6 Exports of G&S, Volume (% y-o-y) 2.9 3.3 4.9 3.1 2.2 2.0 2.0 2.6 3.1 3.6 3.4
Note: 2021 FX numbers are assumptions, not forecasts Source: ABS, RBA, Refinitiv Datastream, HSBC forecasts
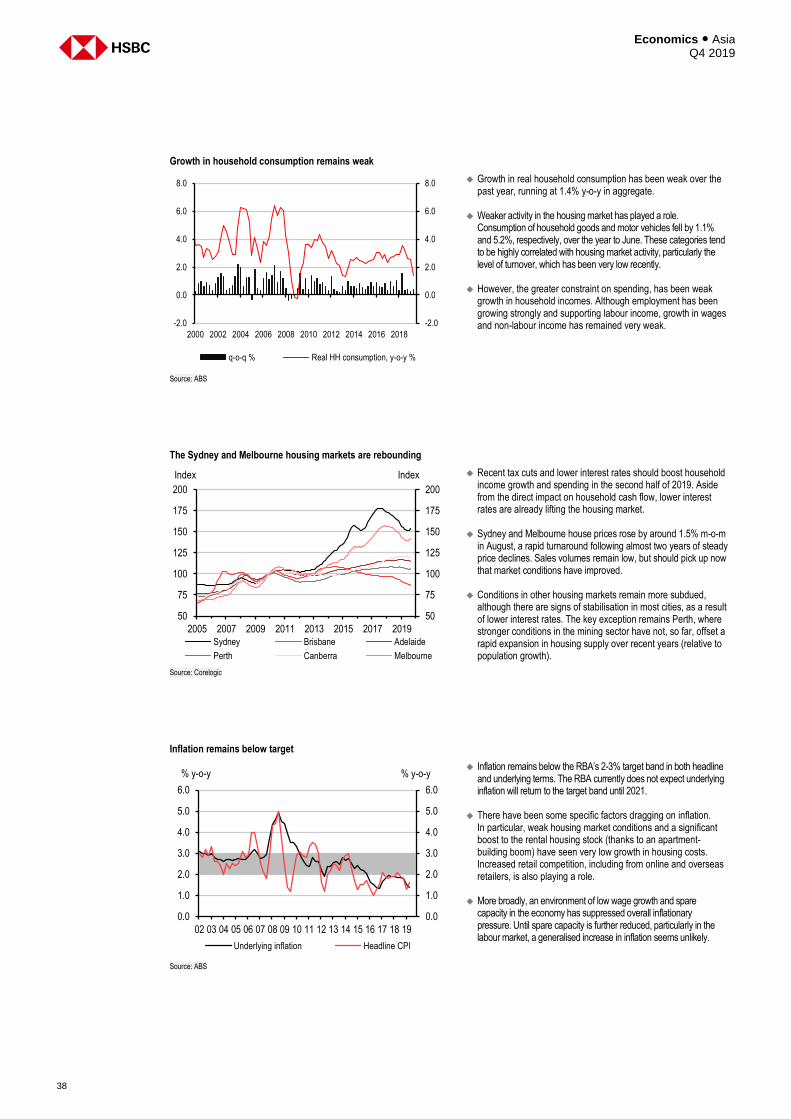
Economics ● Asia Q4 2019
38
Growth in household consumption remains weak
Growth in real household consumption has been weak over the past year, running at 1.4% y-o-y in aggregate.
Weaker activity in the housing market has played a role.
Consumption of household goods and motor vehicles fell by 1.1% and 5.2%, respectively, over the year to June. These categories tend to be highly correlated with housing market activity, particularly the level of turnover, which has been very low recently.
However, the greater constraint on spending, has been weak growth in household incomes. Although employment has been growing strongly and supporting labour income, growth in wages and non-labour income has remained very weak.
Source: ABS
The Sydney and Melbourne housing markets are rebounding
Recent tax cuts and lower interest rates should boost household income growth and spending in the second half of 2019. Aside from the direct impact on household cash flow, lower interest rates are already lifting the housing market.
Sydney and Melbourne house prices rose by around 1.5% m-o-m in August, a rapid turnaround following almost two years of steady price declines. Sales volumes remain low, but should pick up now that market conditions have improved.
Conditions in other housing markets remain more subdued,
although there are signs of stabilisation in most cities, as a result of lower interest rates. The key exception remains Perth, where stronger conditions in the mining sector have not, so far, offset a rapid expansion in housing supply over recent years (relative to population growth).
Source: Corelogic
Inflation remains below target
Inflation remains below the RBA’s 2-3% target band in both headline and underlying terms. The RBA currently does not expect underlying inflation will return to the target band until 2021.
There have been some specific factors dragging on inflation.
In particular, weak housing market conditions and a significant boost to the rental housing stock (thanks to an apartment-building boom) have seen very low growth in housing costs. Increased retail competition, including from online and overseas retailers, is also playing a role.
More broadly, an environment of low wage growth and spare
capacity in the economy has suppressed overall inflationary pressure. Until spare capacity is further reduced, particularly in the labour market, a generalised increase in inflation seems unlikely.
Source: ABS
-2.0
0.0
2.0
4.0
6.0
8.0
-2.0
0.0
2.0
4.0
6.0
8.0
2000 2002 2004 2006 2008 2010 2012 2014 2016 2018
q-o-q % Real HH consumption, y-o-y %
50
75
100
125
150
175
200
50
75
100
125
150
175
200
2005 2007 2009 2011 2013 2015 2017 2019
IndexIndex
Sydney Brisbane Adelaide
Perth Canberra Melbourne
0.0
1.0
2.0
3.0
4.0
5.0
6.0
0.0
1.0
2.0
3.0
4.0
5.0
6.0
02 03 04 05 06 07 08 09 10 11 12 13 14 15 16 17 18 19
Underlying inflation Headline CPI
% y-o-y % y-o-y
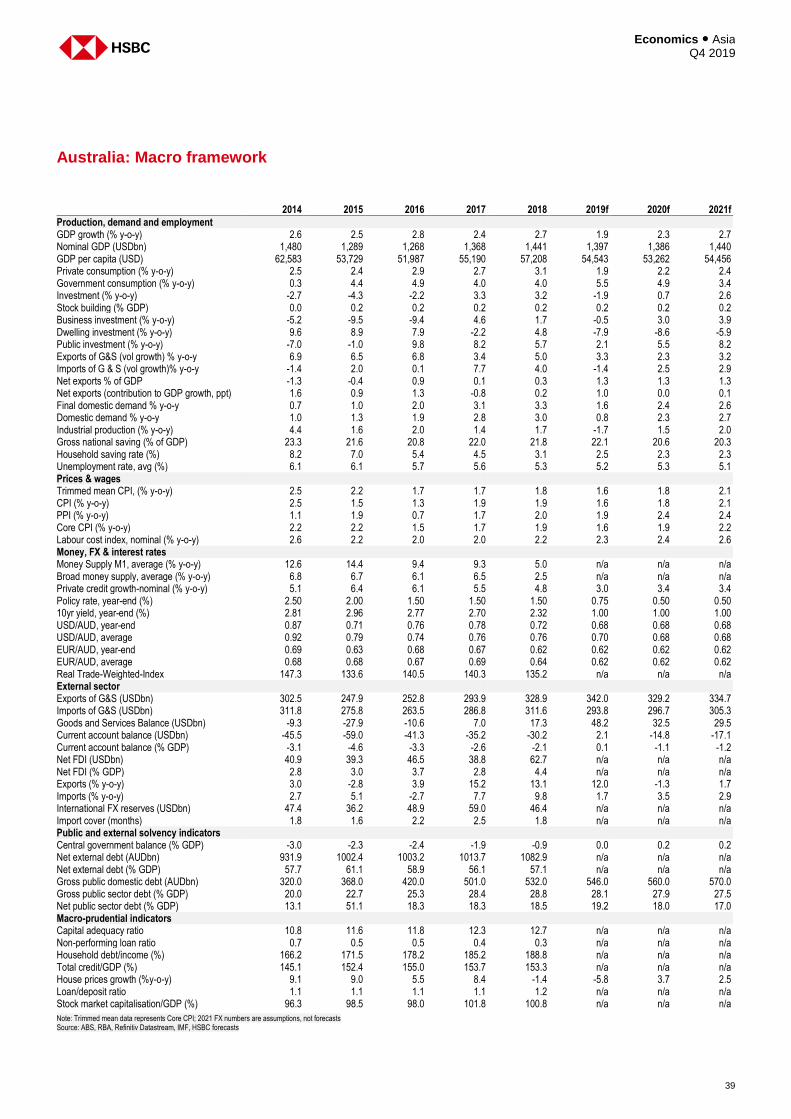
39
Economics ● Asia Q4 2019
Australia: Macro framework
2014 2015 2016 2017 2018 2019f 2020f 2021f
Production, demand and employment GDP growth (% y-o-y) 2.6 2.5 2.8 2.4 2.7 1.9 2.3 2.7 Nominal GDP (USDbn) 1,480 1,289 1,268 1,368 1,441 1,397 1,386 1,440 GDP per capita (USD) 62,583 53,729 51,987 55,190 57,208 54,543 53,262 54,456 Private consumption (% y-o-y) 2.5 2.4 2.9 2.7 3.1 1.9 2.2 2.4 Government consumption (% y-o-y) 0.3 4.4 4.9 4.0 4.0 5.5 4.9 3.4 Investment (% y-o-y) -2.7 -4.3 -2.2 3.3 3.2 -1.9 0.7 2.6 Stock building (% GDP) 0.0 0.2 0.2 0.2 0.2 0.2 0.2 0.2 Business investment (% y-o-y) -5.2 -9.5 -9.4 4.6 1.7 -0.5 3.0 3.9 Dwelling investment (% y-o-y) 9.6 8.9 7.9 -2.2 4.8 -7.9 -8.6 -5.9 Public investment (% y-o-y) -7.0 -1.0 9.8 8.2 5.7 2.1 5.5 8.2 Exports of G&S (vol growth) % y-o-y 6.9 6.5 6.8 3.4 5.0 3.3 2.3 3.2 Imports of G & S (vol growth)% y-o-y -1.4 2.0 0.1 7.7 4.0 -1.4 2.5 2.9 Net exports % of GDP -1.3 -0.4 0.9 0.1 0.3 1.3 1.3 1.3 Net exports (contribution to GDP growth, ppt) 1.6 0.9 1.3 -0.8 0.2 1.0 0.0 0.1 Final domestic demand % y-o-y 0.7 1.0 2.0 3.1 3.3 1.6 2.4 2.6 Domestic demand % y-o-y 1.0 1.3 1.9 2.8 3.0 0.8 2.3 2.7 Industrial production (% y-o-y) 4.4 1.6 2.0 1.4 1.7 -1.7 1.5 2.0 Gross national saving (% of GDP) 23.3 21.6 20.8 22.0 21.8 22.1 20.6 20.3 Household saving rate (%) 8.2 7.0 5.4 4.5 3.1 2.5 2.3 2.3 Unemployment rate, avg (%) 6.1 6.1 5.7 5.6 5.3 5.2 5.3 5.1 Prices & wages Trimmed mean CPI, (% y-o-y) 2.5 2.2 1.7 1.7 1.8 1.6 1.8 2.1 CPI (% y-o-y) 2.5 1.5 1.3 1.9 1.9 1.6 1.8 2.1 PPI (% y-o-y) 1.1 1.9 0.7 1.7 2.0 1.9 2.4 2.4 Core CPI (% y-o-y) 2.2 2.2 1.5 1.7 1.9 1.6 1.9 2.2 Labour cost index, nominal (% y-o-y) 2.6 2.2 2.0 2.0 2.2 2.3 2.4 2.6 Money, FX & interest rates Money Supply M1, average (% y-o-y) 12.6 14.4 9.4 9.3 5.0 n/a n/a n/a Broad money supply, average (% y-o-y) 6.8 6.7 6.1 6.5 2.5 n/a n/a n/a Private credit growth-nominal (% y-o-y) 5.1 6.4 6.1 5.5 4.8 3.0 3.4 3.4 Policy rate, year-end (%) 2.50 2.00 1.50 1.50 1.50 0.75 0.50 0.50 10yr yield, year-end (%) 2.81 2.96 2.77 2.70 2.32 1.00 1.00 1.00 USD/AUD, year-end 0.87 0.71 0.76 0.78 0.72 0.68 0.68 0.68 USD/AUD, average 0.92 0.79 0.74 0.76 0.76 0.70 0.68 0.68 EUR/AUD, year-end 0.69 0.63 0.68 0.67 0.62 0.62 0.62 0.62 EUR/AUD, average 0.68 0.68 0.67 0.69 0.64 0.62 0.62 0.62 Real Trade-Weighted-Index 147.3 133.6 140.5 140.3 135.2 n/a n/a n/a External sector Exports of G&S (USDbn) 302.5 247.9 252.8 293.9 328.9 342.0 329.2 334.7 Imports of G&S (USDbn) 311.8 275.8 263.5 286.8 311.6 293.8 296.7 305.3 Goods and Services Balance (USDbn) -9.3 -27.9 -10.6 7.0 17.3 48.2 32.5 29.5 Current account balance (USDbn) -45.5 -59.0 -41.3 -35.2 -30.2 2.1 -14.8 -17.1 Current account balance (% GDP) -3.1 -4.6 -3.3 -2.6 -2.1 0.1 -1.1 -1.2 Net FDI (USDbn) 40.9 39.3 46.5 38.8 62.7 n/a n/a n/a Net FDI (% GDP) 2.8 3.0 3.7 2.8 4.4 n/a n/a n/a Exports (% y-o-y) 3.0 -2.8 3.9 15.2 13.1 12.0 -1.3 1.7 Imports (% y-o-y) 2.7 5.1 -2.7 7.7 9.8 1.7 3.5 2.9 International FX reserves (USDbn) 47.4 36.2 48.9 59.0 46.4 n/a n/a n/a Import cover (months) 1.8 1.6 2.2 2.5 1.8 n/a n/a n/a Public and external solvency indicators Central government balance (% GDP) -3.0 -2.3 -2.4 -1.9 -0.9 0.0 0.2 0.2 Net external debt (AUDbn) 931.9 1002.4 1003.2 1013.7 1082.9 n/a n/a n/a Net external debt (% GDP) 57.7 61.1 58.9 56.1 57.1 n/a n/a n/a Gross public domestic debt (AUDbn) 320.0 368.0 420.0 501.0 532.0 546.0 560.0 570.0 Gross public sector debt (% GDP) 20.0 22.7 25.3 28.4 28.8 28.1 27.9 27.5 Net public sector debt (% GDP) 13.1 51.1 18.3 18.3 18.5 19.2 18.0 17.0 Macro-prudential indicators Capital adequacy ratio 10.8 11.6 11.8 12.3 12.7 n/a n/a n/a Non-performing loan ratio 0.7 0.5 0.5 0.4 0.3 n/a n/a n/a Household debt/income (%) 166.2 171.5 178.2 185.2 188.8 n/a n/a n/a Total credit/GDP (%) 145.1 152.4 155.0 153.7 153.3 n/a n/a n/a House prices growth (%y-o-y) 9.1 9.0 5.5 8.4 -1.4 -5.8 3.7 2.5 Loan/deposit ratio 1.1 1.1 1.1 1.1 1.2 n/a n/a n/a Stock market capitalisation/GDP (%) 96.3 98.5 98.0 101.8 100.8 n/a n/a n/a
Note: Trimmed mean data represents Core CPI; 2021 FX numbers are assumptions, not forecasts Source: ABS, RBA, Refinitiv Datastream, IMF, HSBC forecasts
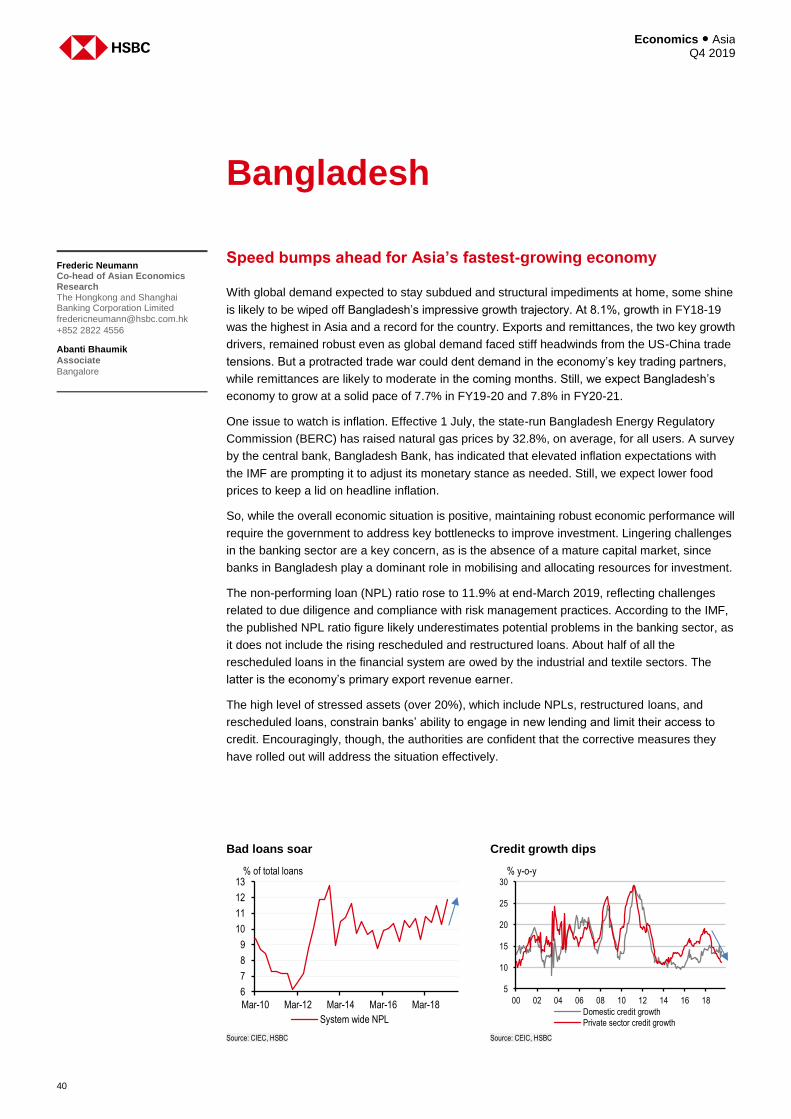
Economics ● Asia Q4 2019
40
Bangladesh
Speed bumps ahead for Asia’s fastest-growing economy
With global demand expected to stay subdued and structural impediments at home, some shine
is likely to be wiped off Bangladesh’s impressive growth trajectory. At 8.1%, growth in FY18-19
was the highest in Asia and a record for the country. Exports and remittances, the two key growth
drivers, remained robust even as global demand faced stiff headwinds from the US-China trade
tensions. But a protracted trade war could dent demand in the economy’s key trading partners,
while remittances are likely to moderate in the coming months. Still, we expect Bangladesh’s
economy to grow at a solid pace of 7.7% in FY19-20 and 7.8% in FY20-21.
One issue to watch is inflation. Effective 1 July, the state-run Bangladesh Energy Regulatory
Commission (BERC) has raised natural gas prices by 32.8%, on average, for all users. A survey
by the central bank, Bangladesh Bank, has indicated that elevated inflation expectations with
the IMF are prompting it to adjust its monetary stance as needed. Still, we expect lower food
prices to keep a lid on headline inflation.
So, while the overall economic situation is positive, maintaining robust economic performance will
require the government to address key bottlenecks to improve investment. Lingering challenges
in the banking sector are a key concern, as is the absence of a mature capital market, since
banks in Bangladesh play a dominant role in mobilising and allocating resources for investment.
The non-performing loan (NPL) ratio rose to 11.9% at end-March 2019, reflecting challenges
related to due diligence and compliance with risk management practices. According to the IMF,
the published NPL ratio figure likely underestimates potential problems in the banking sector, as
it does not include the rising rescheduled and restructured loans. About half of all the
rescheduled loans in the financial system are owed by the industrial and textile sectors. The
latter is the economy’s primary export revenue earner.
The high level of stressed assets (over 20%), which include NPLs, restructured loans, and
rescheduled loans, constrain banks’ ability to engage in new lending and limit their access to
credit. Encouragingly, though, the authorities are confident that the corrective measures they
have rolled out will address the situation effectively.
Frederic Neumann Co-head of Asian Economics Research The Hongkong and Shanghai Banking Corporation Limited
+852 2822 4556
Abanti Bhaumik
Associate
Bangalore
Bad loans soar Credit growth dips
Source: CIEC, HSBC Source: CEIC, HSBC
6
7
8
9
10
11
12
13
Mar-10 Mar-12 Mar-14 Mar-16 Mar-18
System wide NPL
% of total loans
5
10
15
20
25
30
00 02 04 06 08 10 12 14 16 18
Domestic credit growth
Private sector credit growth
% y-o-y
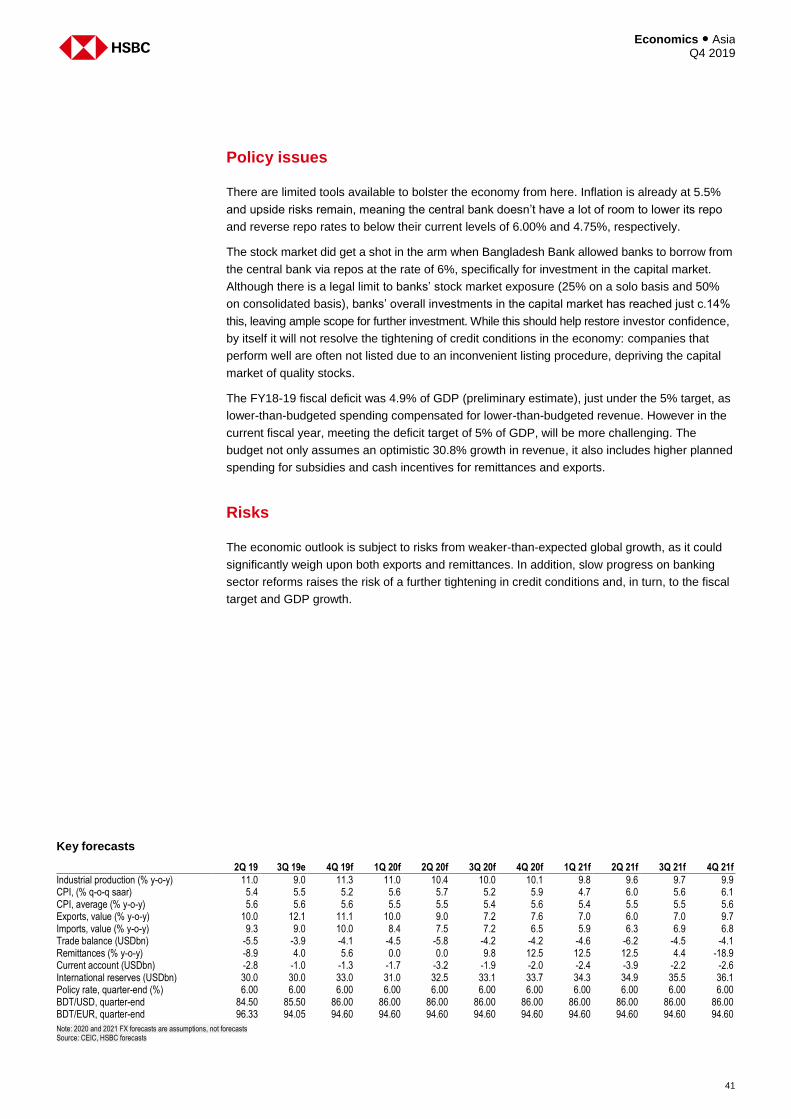
41
Economics ● Asia Q4 2019
Policy issues
There are limited tools available to bolster the economy from here. Inflation is already at 5.5%
and upside risks remain, meaning the central bank doesn’t have a lot of room to lower its repo
and reverse repo rates to below their current levels of 6.00% and 4.75%, respectively.
The stock market did get a shot in the arm when Bangladesh Bank allowed banks to borrow from
the central bank via repos at the rate of 6%, specifically for investment in the capital market.
Although there is a legal limit to banks’ stock market exposure (25% on a solo basis and 50%
on consolidated basis), banks’ overall investments in the capital market has reached just c.14%
this, leaving ample scope for further investment. While this should help restore investor confidence,
by itself it will not resolve the tightening of credit conditions in the economy: companies that
perform well are often not listed due to an inconvenient listing procedure, depriving the capital
market of quality stocks.
The FY18-19 fiscal deficit was 4.9% of GDP (preliminary estimate), just under the 5% target, as
lower-than-budgeted spending compensated for lower-than-budgeted revenue. However in the
current fiscal year, meeting the deficit target of 5% of GDP, will be more challenging. The
budget not only assumes an optimistic 30.8% growth in revenue, it also includes higher planned
spending for subsidies and cash incentives for remittances and exports.
Risks
The economic outlook is subject to risks from weaker-than-expected global growth, as it could
significantly weigh upon both exports and remittances. In addition, slow progress on banking
sector reforms raises the risk of a further tightening in credit conditions and, in turn, to the fiscal
target and GDP growth.
Key forecasts
2Q 19 3Q 19e 4Q 19f 1Q 20f 2Q 20f 3Q 20f 4Q 20f 1Q 21f 2Q 21f 3Q 21f 4Q 21f
Industrial production (% y-o-y) 11.0 9.0 11.3 11.0 10.4 10.0 10.1 9.8 9.6 9.7 9.9 CPI, (% q-o-q saar) 5.4 5.5 5.2 5.6 5.7 5.2 5.9 4.7 6.0 5.6 6.1 CPI, average (% y-o-y) 5.6 5.6 5.6 5.5 5.5 5.4 5.6 5.4 5.5 5.5 5.6 Exports, value (% y-o-y) 10.0 12.1 11.1 10.0 9.0 7.2 7.6 7.0 6.0 7.0 9.7 Imports, value (% y-o-y) 9.3 9.0 10.0 8.4 7.5 7.2 6.5 5.9 6.3 6.9 6.8 Trade balance (USDbn) -5.5 -3.9 -4.1 -4.5 -5.8 -4.2 -4.2 -4.6 -6.2 -4.5 -4.1 Remittances (% y-o-y) -8.9 4.0 5.6 0.0 0.0 9.8 12.5 12.5 12.5 4.4 -18.9 Current account (USDbn) -2.8 -1.0 -1.3 -1.7 -3.2 -1.9 -2.0 -2.4 -3.9 -2.2 -2.6 International reserves (USDbn) 30.0 30.0 33.0 31.0 32.5 33.1 33.7 34.3 34.9 35.5 36.1 Policy rate, quarter-end (%) 6.00 6.00 6.00 6.00 6.00 6.00 6.00 6.00 6.00 6.00 6.00 BDT/USD, quarter-end 84.50 85.50 86.00 86.00 86.00 86.00 86.00 86.00 86.00 86.00 86.00 BDT/EUR, quarter-end 96.33 94.05 94.60 94.60 94.60 94.60 94.60 94.60 94.60 94.60 94.60
Note: 2020 and 2021 FX forecasts are assumptions, not forecasts Source: CEIC, HSBC forecasts
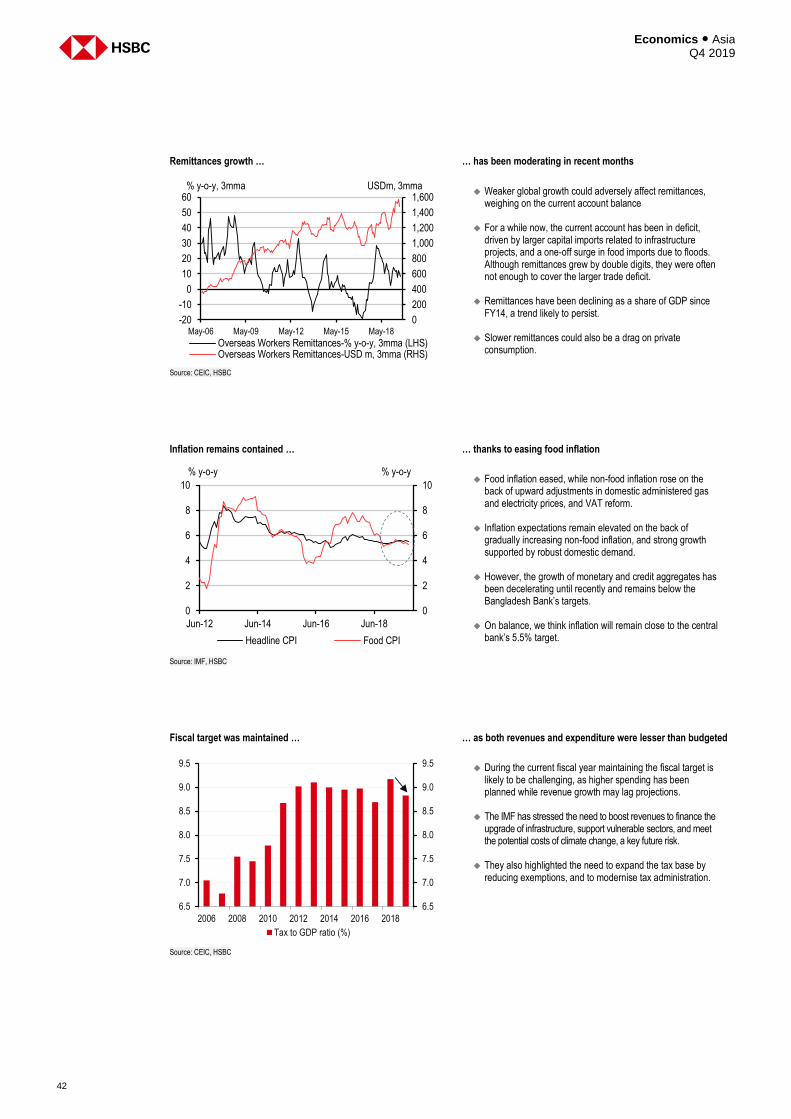
Economics ● Asia Q4 2019
42
Remittances growth … … has been moderating in recent months
Weaker global growth could adversely affect remittances,
weighing on the current account balance For a while now, the current account has been in deficit,
driven by larger capital imports related to infrastructure projects, and a one-off surge in food imports due to floods. Although remittances grew by double digits, they were often not enough to cover the larger trade deficit.
Remittances have been declining as a share of GDP since
FY14, a trend likely to persist. Slower remittances could also be a drag on private
consumption.
Source: CEIC, HSBC
Inflation remains contained … … thanks to easing food inflation
Food inflation eased, while non-food inflation rose on the
back of upward adjustments in domestic administered gas and electricity prices, and VAT reform.
Inflation expectations remain elevated on the back of
gradually increasing non-food inflation, and strong growth supported by robust domestic demand.
However, the growth of monetary and credit aggregates has
been decelerating until recently and remains below the Bangladesh Bank’s targets.
On balance, we think inflation will remain close to the central
bank’s 5.5% target.
Source: IMF, HSBC
Fiscal target was maintained … … as both revenues and expenditure were lesser than budgeted
During the current fiscal year maintaining the fiscal target is
likely to be challenging, as higher spending has been planned while revenue growth may lag projections.
The IMF has stressed the need to boost revenues to finance the upgrade of infrastructure, support vulnerable sectors, and meet the potential costs of climate change, a key future risk.
They also highlighted the need to expand the tax base by reducing exemptions, and to modernise tax administration.
Source: CEIC, HSBC
0
200
400
600
800
1,000
1,200
1,400
1,600
-20
-10
0
10
20
30
40
50
60
May-06 May-09 May-12 May-15 May-18
Overseas Workers Remittances-% y-o-y, 3mma (LHS)Overseas Workers Remittances-USD m, 3mma (RHS)
% y-o-y, 3mma USDm, 3mma
0
2
4
6
8
10
0
2
4
6
8
10
Jun-12 Jun-14 Jun-16 Jun-18
Headline CPI Food CPI
% y-o-y % y-o-y
6.5
7.0
7.5
8.0
8.5
9.0
9.5
6.5
7.0
7.5
8.0
8.5
9.0
9.5
2006 2008 2010 2012 2014 2016 2018
Tax to GDP ratio (%)
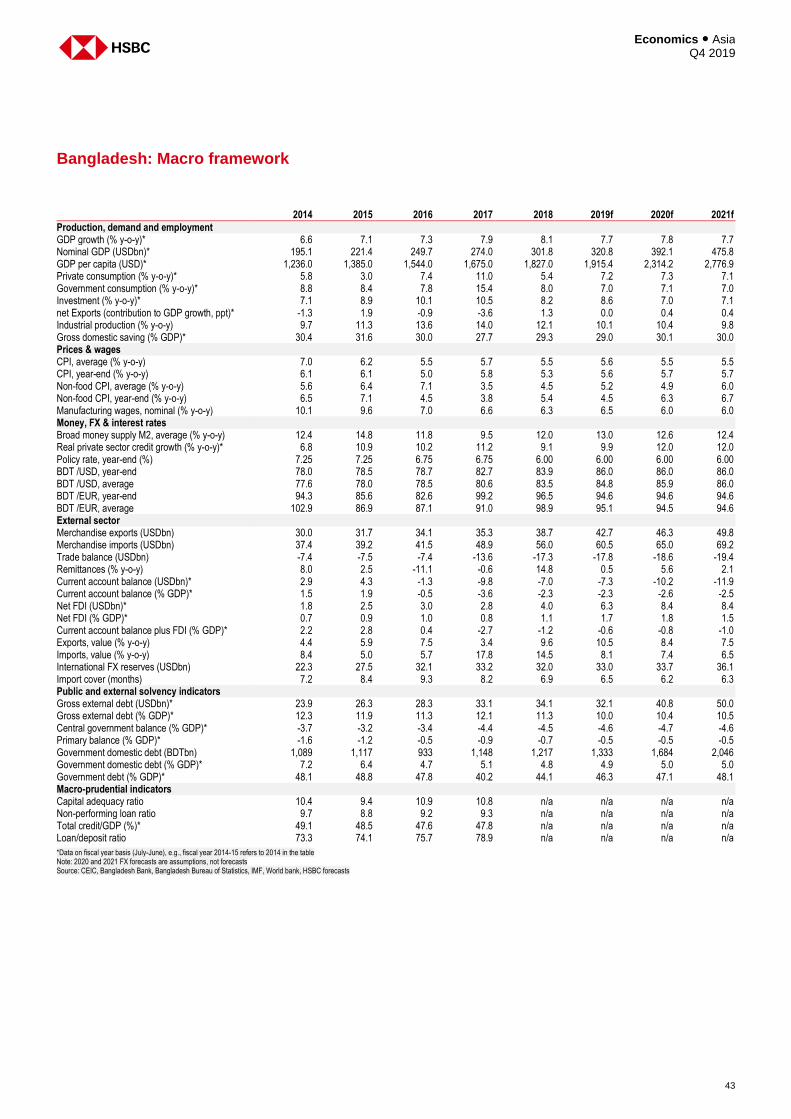
43
Economics ● Asia Q4 2019
Bangladesh: Macro framework
2014 2015 2016 2017 2018 2019f 2020f 2021f
Production, demand and employment GDP growth (% y-o-y)* 6.6 7.1 7.3 7.9 8.1 7.7 7.8 7.7 Nominal GDP (USDbn)* 195.1 221.4 249.7 274.0 301.8 320.8 392.1 475.8 GDP per capita (USD)* 1,236.0 1,385.0 1,544.0 1,675.0 1,827.0 1,915.4 2,314.2 2,776.9 Private consumption (% y-o-y)* 5.8 3.0 7.4 11.0 5.4 7.2 7.3 7.1 Government consumption (% y-o-y)* 8.8 8.4 7.8 15.4 8.0 7.0 7.1 7.0 Investment (% y-o-y)* 7.1 8.9 10.1 10.5 8.2 8.6 7.0 7.1 net Exports (contribution to GDP growth, ppt)* -1.3 1.9 -0.9 -3.6 1.3 0.0 0.4 0.4 Industrial production (% y-o-y) 9.7 11.3 13.6 14.0 12.1 10.1 10.4 9.8 Gross domestic saving (% GDP)* 30.4 31.6 30.0 27.7 29.3 29.0 30.1 30.0 Prices & wages CPI, average (% y-o-y) 7.0 6.2 5.5 5.7 5.5 5.6 5.5 5.5 CPI, year-end (% y-o-y) 6.1 6.1 5.0 5.8 5.3 5.6 5.7 5.7 Non-food CPI, average (% y-o-y) 5.6 6.4 7.1 3.5 4.5 5.2 4.9 6.0 Non-food CPI, year-end (% y-o-y) 6.5 7.1 4.5 3.8 5.4 4.5 6.3 6.7 Manufacturing wages, nominal (% y-o-y) 10.1 9.6 7.0 6.6 6.3 6.5 6.0 6.0 Money, FX & interest rates Broad money supply M2, average (% y-o-y) 12.4 14.8 11.8 9.5 12.0 13.0 12.6 12.4 Real private sector credit growth (% y-o-y)* 6.8 10.9 10.2 11.2 9.1 9.9 12.0 12.0 Policy rate, year-end (%) 7.25 7.25 6.75 6.75 6.00 6.00 6.00 6.00 BDT /USD, year-end 78.0 78.5 78.7 82.7 83.9 86.0 86.0 86.0 BDT /USD, average 77.6 78.0 78.5 80.6 83.5 84.8 85.9 86.0 BDT /EUR, year-end 94.3 85.6 82.6 99.2 96.5 94.6 94.6 94.6 BDT /EUR, average 102.9 86.9 87.1 91.0 98.9 95.1 94.5 94.6 External sector Merchandise exports (USDbn) 30.0 31.7 34.1 35.3 38.7 42.7 46.3 49.8 Merchandise imports (USDbn) 37.4 39.2 41.5 48.9 56.0 60.5 65.0 69.2 Trade balance (USDbn) -7.4 -7.5 -7.4 -13.6 -17.3 -17.8 -18.6 -19.4 Remittances (% y-o-y) 8.0 2.5 -11.1 -0.6 14.8 0.5 5.6 2.1 Current account balance (USDbn)* 2.9 4.3 -1.3 -9.8 -7.0 -7.3 -10.2 -11.9 Current account balance (% GDP)* 1.5 1.9 -0.5 -3.6 -2.3 -2.3 -2.6 -2.5 Net FDI (USDbn)* 1.8 2.5 3.0 2.8 4.0 6.3 8.4 8.4 Net FDI (% GDP)* 0.7 0.9 1.0 0.8 1.1 1.7 1.8 1.5 Current account balance plus FDI (% GDP)* 2.2 2.8 0.4 -2.7 -1.2 -0.6 -0.8 -1.0 Exports, value (% y-o-y) 4.4 5.9 7.5 3.4 9.6 10.5 8.4 7.5 Imports, value (% y-o-y) 8.4 5.0 5.7 17.8 14.5 8.1 7.4 6.5 International FX reserves (USDbn) 22.3 27.5 32.1 33.2 32.0 33.0 33.7 36.1 Import cover (months) 7.2 8.4 9.3 8.2 6.9 6.5 6.2 6.3 Public and external solvency indicators Gross external debt (USDbn)* 23.9 26.3 28.3 33.1 34.1 32.1 40.8 50.0 Gross external debt (% GDP)* 12.3 11.9 11.3 12.1 11.3 10.0 10.4 10.5 Central government balance (% GDP)* -3.7 -3.2 -3.4 -4.4 -4.5 -4.6 -4.7 -4.6 Primary balance (% GDP)* -1.6 -1.2 -0.5 -0.9 -0.7 -0.5 -0.5 -0.5 Government domestic debt (BDTbn) 1,089 1,117 933 1,148 1,217 1,333 1,684 2,046 Government domestic debt (% GDP)* 7.2 6.4 4.7 5.1 4.8 4.9 5.0 5.0 Government debt (% GDP)* 48.1 48.8 47.8 40.2 44.1 46.3 47.1 48.1 Macro-prudential indicators Capital adequacy ratio 10.4 9.4 10.9 10.8 n/a n/a n/a n/a Non-performing loan ratio 9.7 8.8 9.2 9.3 n/a n/a n/a n/a Total credit/GDP (%)* 49.1 48.5 47.6 47.8 n/a n/a n/a n/a Loan/deposit ratio 73.3 74.1 75.7 78.9 n/a n/a n/a n/a
*Data on fiscal year basis (July-June), e.g., fiscal year 2014-15 refers to 2014 in the table Note: 2020 and 2021 FX forecasts are assumptions, not forecasts Source: CEIC, Bangladesh Bank, Bangladesh Bureau of Statistics, IMF, World bank, HSBC forecasts
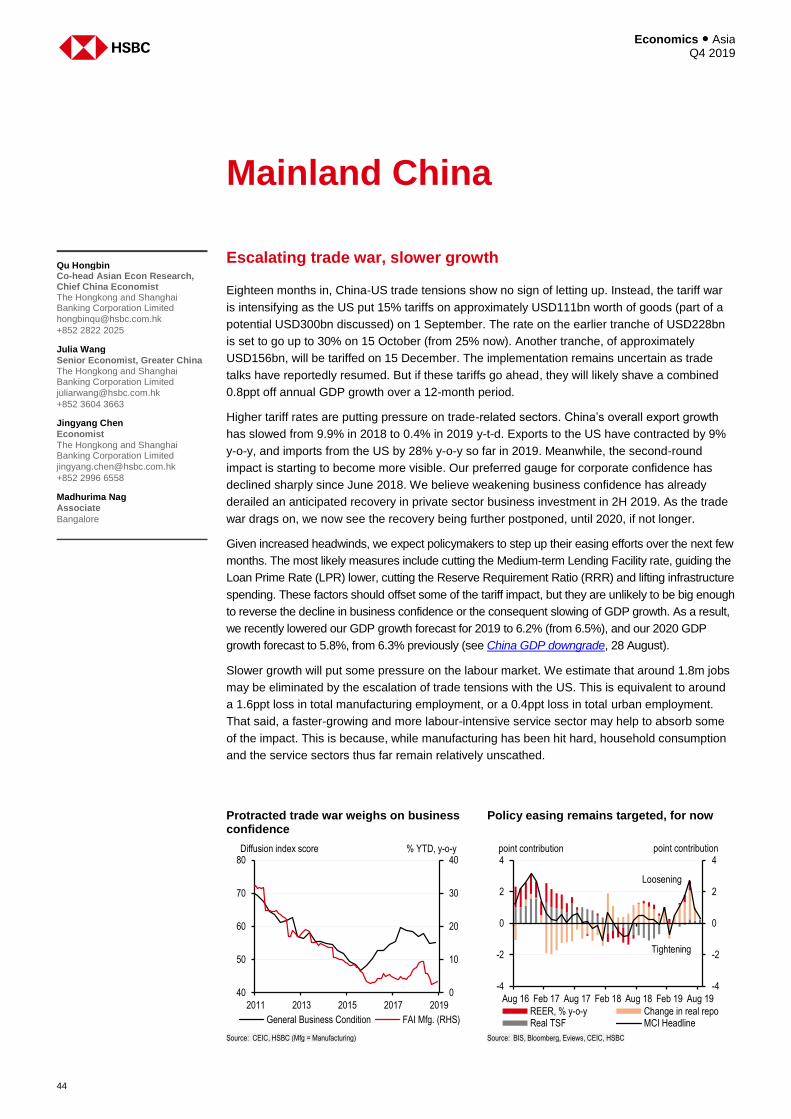
Economics ● Asia Q4 2019
44
Mainland China
Escalating trade war, slower growth
Eighteen months in, China-US trade tensions show no sign of letting up. Instead, the tariff war
is intensifying as the US put 15% tariffs on approximately USD111bn worth of goods (part of a
potential USD300bn discussed) on 1 September. The rate on the earlier tranche of USD228bn
is set to go up to 30% on 15 October (from 25% now). Another tranche, of approximately
USD156bn, will be tariffed on 15 December. The implementation remains uncertain as trade
talks have reportedly resumed. But if these tariffs go ahead, they will likely shave a combined
0.8ppt off annual GDP growth over a 12-month period.
Higher tariff rates are putting pressure on trade-related sectors. China’s overall export growth
has slowed from 9.9% in 2018 to 0.4% in 2019 y-t-d. Exports to the US have contracted by 9%
y-o-y, and imports from the US by 28% y-o-y so far in 2019. Meanwhile, the second-round
impact is starting to become more visible. Our preferred gauge for corporate confidence has
declined sharply since June 2018. We believe weakening business confidence has already
derailed an anticipated recovery in private sector business investment in 2H 2019. As the trade
war drags on, we now see the recovery being further postponed, until 2020, if not longer.
Given increased headwinds, we expect policymakers to step up their easing efforts over the next few
months. The most likely measures include cutting the Medium-term Lending Facility rate, guiding the
Loan Prime Rate (LPR) lower, cutting the Reserve Requirement Ratio (RRR) and lifting infrastructure
spending. These factors should offset some of the tariff impact, but they are unlikely to be big enough
to reverse the decline in business confidence or the consequent slowing of GDP growth. As a result,
we recently lowered our GDP growth forecast for 2019 to 6.2% (from 6.5%), and our 2020 GDP
growth forecast to 5.8%, from 6.3% previously (see China GDP downgrade, 28 August).
Slower growth will put some pressure on the labour market. We estimate that around 1.8m jobs
may be eliminated by the escalation of trade tensions with the US. This is equivalent to around
a 1.6ppt loss in total manufacturing employment, or a 0.4ppt loss in total urban employment.
That said, a faster-growing and more labour-intensive service sector may help to absorb some
of the impact. This is because, while manufacturing has been hit hard, household consumption
and the service sectors thus far remain relatively unscathed.
Qu Hongbin Co-head Asian Econ Research, Chief China Economist The Hongkong and Shanghai Banking Corporation Limited
+852 2822 2025
Julia Wang
Senior Economist, Greater China The Hongkong and Shanghai Banking Corporation Limited
+852 3604 3663
Jingyang Chen
Economist
The Hongkong and Shanghai Banking Corporation Limited
+852 2996 6558
Madhurima Nag
Associate
Bangalore
Protracted trade war weighs on business confidence
Policy easing remains targeted, for now
Source: CEIC, HSBC (Mfg = Manufacturing) Source: BIS, Bloomberg, Eviews, CEIC, HSBC
0
10
20
30
40
40
50
60
70
80
2011 2013 2015 2017 2019
% YTD, y-o-yDiffusion index score
General Business Condition FAI Mfg. (RHS)
Aug 16 Feb 17 Aug 17 Feb 18 Aug 18 Feb 19 Aug 19
-4
-2
0
2
4
-4
-2
0
2
4point contributionpoint contribution
REER, % y-o-y Change in real repoReal TSF MCI Headline
Loosening
Tightening
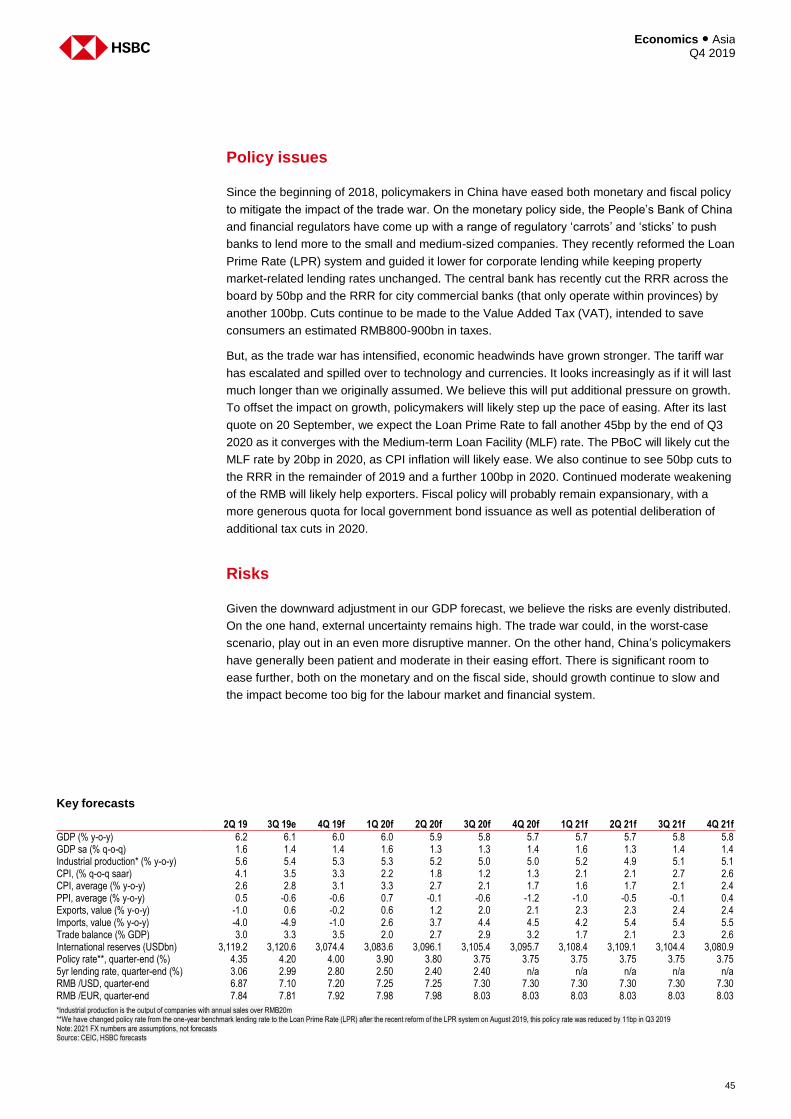
45
Economics ● Asia Q4 2019
Policy issues
Since the beginning of 2018, policymakers in China have eased both monetary and fiscal policy
to mitigate the impact of the trade war. On the monetary policy side, the People’s Bank of China
and financial regulators have come up with a range of regulatory ‘carrots’ and ‘sticks’ to push
banks to lend more to the small and medium-sized companies. They recently reformed the Loan
Prime Rate (LPR) system and guided it lower for corporate lending while keeping property
market-related lending rates unchanged. The central bank has recently cut the RRR across the
board by 50bp and the RRR for city commercial banks (that only operate within provinces) by
another 100bp. Cuts continue to be made to the Value Added Tax (VAT), intended to save
consumers an estimated RMB800-900bn in taxes.
But, as the trade war has intensified, economic headwinds have grown stronger. The tariff war
has escalated and spilled over to technology and currencies. It looks increasingly as if it will last
much longer than we originally assumed. We believe this will put additional pressure on growth.
To offset the impact on growth, policymakers will likely step up the pace of easing. After its last
quote on 20 September, we expect the Loan Prime Rate to fall another 45bp by the end of Q3
2020 as it converges with the Medium-term Loan Facility (MLF) rate. The PBoC will likely cut the
MLF rate by 20bp in 2020, as CPI inflation will likely ease. We also continue to see 50bp cuts to
the RRR in the remainder of 2019 and a further 100bp in 2020. Continued moderate weakening
of the RMB will likely help exporters. Fiscal policy will probably remain expansionary, with a
more generous quota for local government bond issuance as well as potential deliberation of
additional tax cuts in 2020.
Risks
Given the downward adjustment in our GDP forecast, we believe the risks are evenly distributed.
On the one hand, external uncertainty remains high. The trade war could, in the worst-case
scenario, play out in an even more disruptive manner. On the other hand, China’s policymakers
have generally been patient and moderate in their easing effort. There is significant room to
ease further, both on the monetary and on the fiscal side, should growth continue to slow and
the impact become too big for the labour market and financial system.
Key forecasts
2Q 19 3Q 19e 4Q 19f 1Q 20f 2Q 20f 3Q 20f 4Q 20f 1Q 21f 2Q 21f 3Q 21f 4Q 21f
GDP (% y-o-y) 6.2 6.1 6.0 6.0 5.9 5.8 5.7 5.7 5.7 5.8 5.8 GDP sa (% q-o-q) 1.6 1.4 1.4 1.6 1.3 1.3 1.4 1.6 1.3 1.4 1.4 Industrial production* (% y-o-y) 5.6 5.4 5.3 5.3 5.2 5.0 5.0 5.2 4.9 5.1 5.1 CPI, (% q-o-q saar) 4.1 3.5 3.3 2.2 1.8 1.2 1.3 2.1 2.1 2.7 2.6 CPI, average (% y-o-y) 2.6 2.8 3.1 3.3 2.7 2.1 1.7 1.6 1.7 2.1 2.4 PPI, average (% y-o-y) 0.5 -0.6 -0.6 0.7 -0.1 -0.6 -1.2 -1.0 -0.5 -0.1 0.4 Exports, value (% y-o-y) -1.0 0.6 -0.2 0.6 1.2 2.0 2.1 2.3 2.3 2.4 2.4 Imports, value (% y-o-y) -4.0 -4.9 -1.0 2.6 3.7 4.4 4.5 4.2 5.4 5.4 5.5 Trade balance (% GDP) 3.0 3.3 3.5 2.0 2.7 2.9 3.2 1.7 2.1 2.3 2.6 International reserves (USDbn) 3,119.2 3,120.6 3,074.4 3,083.6 3,096.1 3,105.4 3,095.7 3,108.4 3,109.1 3,104.4 3,080.9 Policy rate**, quarter-end (%) 4.35 4.20 4.00 3.90 3.80 3.75 3.75 3.75 3.75 3.75 3.75 5yr lending rate, quarter-end (%) 3.06 2.99 2.80 2.50 2.40 2.40 n/a n/a n/a n/a n/a RMB /USD, quarter-end 6.87 7.10 7.20 7.25 7.25 7.30 7.30 7.30 7.30 7.30 7.30 RMB /EUR, quarter-end 7.84 7.81 7.92 7.98 7.98 8.03 8.03 8.03 8.03 8.03 8.03
*Industrial production is the output of companies with annual sales over RMB20m **We have changed policy rate from the one-year benchmark lending rate to the Loan Prime Rate (LPR) after the recent reform of the LPR system on August 2019, this policy rate was reduced by 11bp in Q3 2019 Note: 2021 FX numbers are assumptions, not forecasts Source: CEIC, HSBC forecasts
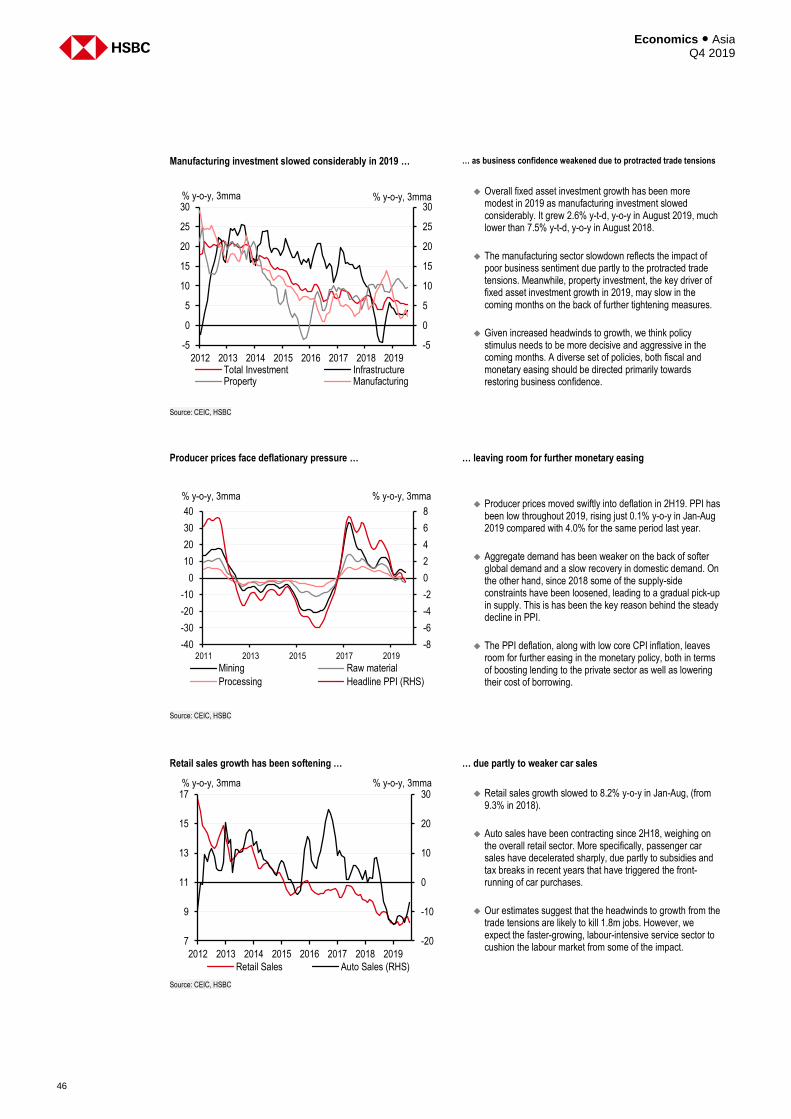
Economics ● Asia Q4 2019
46
Manufacturing investment slowed considerably in 2019 … … as business confidence weakened due to protracted trade tensions
Overall fixed asset investment growth has been more
modest in 2019 as manufacturing investment slowed considerably. It grew 2.6% y-t-d, y-o-y in August 2019, much lower than 7.5% y-t-d, y-o-y in August 2018.
The manufacturing sector slowdown reflects the impact of poor business sentiment due partly to the protracted trade tensions. Meanwhile, property investment, the key driver of fixed asset investment growth in 2019, may slow in the coming months on the back of further tightening measures.
Given increased headwinds to growth, we think policy stimulus needs to be more decisive and aggressive in the coming months. A diverse set of policies, both fiscal and monetary easing should be directed primarily towards restoring business confidence.
Source: CEIC, HSBC
Producer prices face deflationary pressure … … leaving room for further monetary easing
Producer prices moved swiftly into deflation in 2H19. PPI has been low throughout 2019, rising just 0.1% y-o-y in Jan-Aug 2019 compared with 4.0% for the same period last year.
Aggregate demand has been weaker on the back of softer global demand and a slow recovery in domestic demand. On the other hand, since 2018 some of the supply-side constraints have been loosened, leading to a gradual pick-up in supply. This is has been the key reason behind the steady decline in PPI.
The PPI deflation, along with low core CPI inflation, leaves room for further easing in the monetary policy, both in terms of boosting lending to the private sector as well as lowering their cost of borrowing.
Source: CEIC, HSBC
Retail sales growth has been softening …
… due partly to weaker car sales
Retail sales growth slowed to 8.2% y-o-y in Jan-Aug, (from
9.3% in 2018).
Auto sales have been contracting since 2H18, weighing on the overall retail sector. More specifically, passenger car sales have decelerated sharply, due partly to subsidies and tax breaks in recent years that have triggered the front-running of car purchases.
Our estimates suggest that the headwinds to growth from the trade tensions are likely to kill 1.8m jobs. However, we expect the faster-growing, labour-intensive service sector to cushion the labour market from some of the impact.
Source: CEIC, HSBC
2012 2013 2014 2015 2016 2017 2018 2019
-5
0
5
10
15
20
25
30
-5
0
5
10
15
20
25
30% y-o-y, 3mma% y-o-y, 3mma
Total Investment InfrastructureProperty Manufacturing
-8
-6
-4
-2
0
2
4
6
8
2011 2013 2015 2017 2019
-40
-30
-20
-10
0
10
20
30
40
% y-o-y, 3mma% y-o-y, 3mma
Mining Raw material
Processing Headline PPI (RHS)
-20
-10
0
10
20
30
7
9
11
13
15
17
2012 2013 2014 2015 2016 2017 2018 2019
% y-o-y, 3mma% y-o-y, 3mma
Retail Sales Auto Sales (RHS)
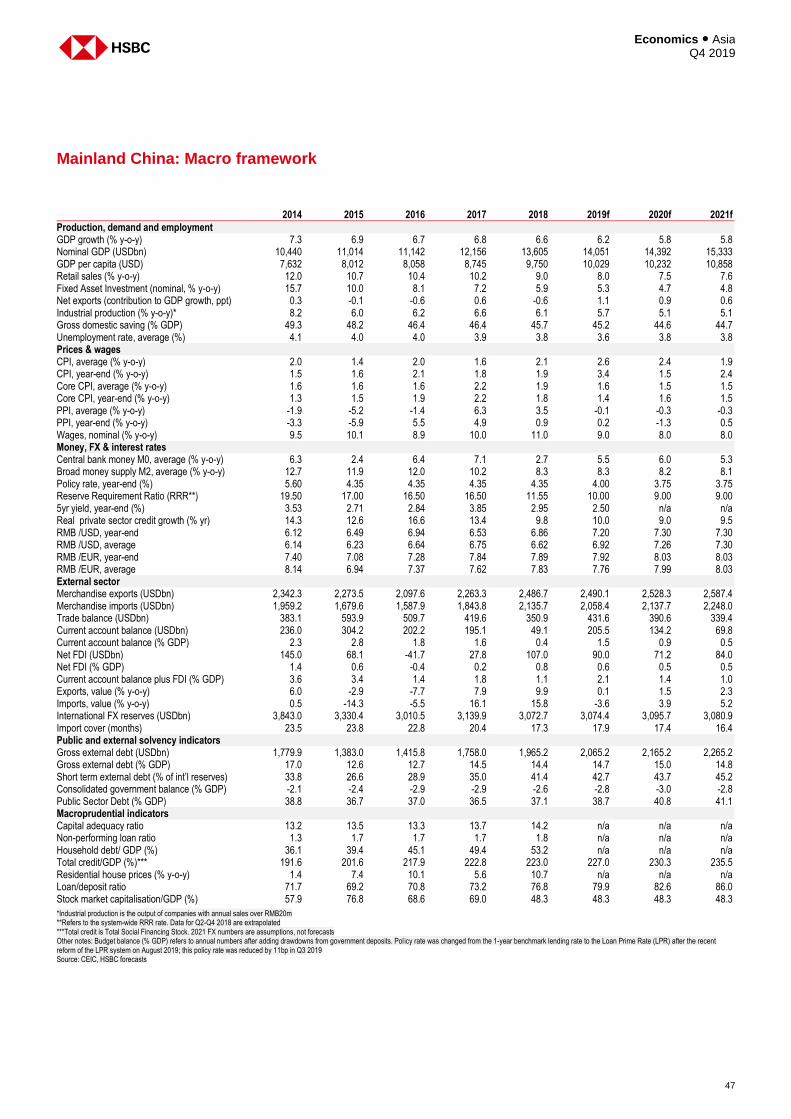
47
Economics ● Asia Q4 2019
Mainland China: Macro framework
2014 2015 2016 2017 2018 2019f 2020f 2021f
Production, demand and employment GDP growth (% y-o-y) 7.3 6.9 6.7 6.8 6.6 6.2 5.8 5.8 Nominal GDP (USDbn) 10,440 11,014 11,142 12,156 13,605 14,051 14,392 15,333 GDP per capita (USD) 7,632 8,012 8,058 8,745 9,750 10,029 10,232 10,858 Retail sales (% y-o-y) 12.0 10.7 10.4 10.2 9.0 8.0 7.5 7.6 Fixed Asset Investment (nominal, % y-o-y) 15.7 10.0 8.1 7.2 5.9 5.3 4.7 4.8 Net exports (contribution to GDP growth, ppt) 0.3 -0.1 -0.6 0.6 -0.6 1.1 0.9 0.6 Industrial production (% y-o-y)* 8.2 6.0 6.2 6.6 6.1 5.7 5.1 5.1 Gross domestic saving (% GDP) 49.3 48.2 46.4 46.4 45.7 45.2 44.6 44.7 Unemployment rate, average (%) 4.1 4.0 4.0 3.9 3.8 3.6 3.8 3.8 Prices & wages CPI, average (% y-o-y) 2.0 1.4 2.0 1.6 2.1 2.6 2.4 1.9 CPI, year-end (% y-o-y) 1.5 1.6 2.1 1.8 1.9 3.4 1.5 2.4 Core CPI, average (% y-o-y) 1.6 1.6 1.6 2.2 1.9 1.6 1.5 1.5 Core CPI, year-end (% y-o-y) 1.3 1.5 1.9 2.2 1.8 1.4 1.6 1.5 PPI, average (% y-o-y) -1.9 -5.2 -1.4 6.3 3.5 -0.1 -0.3 -0.3 PPI, year-end (% y-o-y) -3.3 -5.9 5.5 4.9 0.9 0.2 -1.3 0.5 Wages, nominal (% y-o-y) 9.5 10.1 8.9 10.0 11.0 9.0 8.0 8.0 Money, FX & interest rates Central bank money M0, average (% y-o-y) 6.3 2.4 6.4 7.1 2.7 5.5 6.0 5.3 Broad money supply M2, average (% y-o-y) 12.7 11.9 12.0 10.2 8.3 8.3 8.2 8.1 Policy rate, year-end (%) 5.60 4.35 4.35 4.35 4.35 4.00 3.75 3.75 Reserve Requirement Ratio (RRR**) 19.50 17.00 16.50 16.50 11.55 10.00 9.00 9.00 5yr yield, year-end (%) 3.53 2.71 2.84 3.85 2.95 2.50 n/a n/a Real private sector credit growth (% yr) 14.3 12.6 16.6 13.4 9.8 10.0 9.0 9.5 RMB /USD, year-end 6.12 6.49 6.94 6.53 6.86 7.20 7.30 7.30 RMB /USD, average 6.14 6.23 6.64 6.75 6.62 6.92 7.26 7.30 RMB /EUR, year-end 7.40 7.08 7.28 7.84 7.89 7.92 8.03 8.03 RMB /EUR, average 8.14 6.94 7.37 7.62 7.83 7.76 7.99 8.03 External sector Merchandise exports (USDbn) 2,342.3 2,273.5 2,097.6 2,263.3 2,486.7 2,490.1 2,528.3 2,587.4 Merchandise imports (USDbn) 1,959.2 1,679.6 1,587.9 1,843.8 2,135.7 2,058.4 2,137.7 2,248.0 Trade balance (USDbn) 383.1 593.9 509.7 419.6 350.9 431.6 390.6 339.4 Current account balance (USDbn) 236.0 304.2 202.2 195.1 49.1 205.5 134.2 69.8 Current account balance (% GDP) 2.3 2.8 1.8 1.6 0.4 1.5 0.9 0.5 Net FDI (USDbn) 145.0 68.1 -41.7 27.8 107.0 90.0 71.2 84.0 Net FDI (% GDP) 1.4 0.6 -0.4 0.2 0.8 0.6 0.5 0.5 Current account balance plus FDI (% GDP) 3.6 3.4 1.4 1.8 1.1 2.1 1.4 1.0 Exports, value (% y-o-y) 6.0 -2.9 -7.7 7.9 9.9 0.1 1.5 2.3 Imports, value (% y-o-y) 0.5 -14.3 -5.5 16.1 15.8 -3.6 3.9 5.2 International FX reserves (USDbn) 3,843.0 3,330.4 3,010.5 3,139.9 3,072.7 3,074.4 3,095.7 3,080.9 Import cover (months) 23.5 23.8 22.8 20.4 17.3 17.9 17.4 16.4 Public and external solvency indicators Gross external debt (USDbn) 1,779.9 1,383.0 1,415.8 1,758.0 1,965.2 2,065.2 2,165.2 2,265.2 Gross external debt (% GDP) 17.0 12.6 12.7 14.5 14.4 14.7 15.0 14.8 Short term external debt (% of int’l reserves) 33.8 26.6 28.9 35.0 41.4 42.7 43.7 45.2 Consolidated government balance (% GDP) -2.1 -2.4 -2.9 -2.9 -2.6 -2.8 -3.0 -2.8 Public Sector Debt (% GDP) 38.8 36.7 37.0 36.5 37.1 38.7 40.8 41.1 Macroprudential indicators Capital adequacy ratio 13.2 13.5 13.3 13.7 14.2 n/a n/a n/a Non-performing loan ratio 1.3 1.7 1.7 1.7 1.8 n/a n/a n/a Household debt/ GDP (%) 36.1 39.4 45.1 49.4 53.2 n/a n/a n/a Total credit/GDP (%)*** 191.6 201.6 217.9 222.8 223.0 227.0 230.3 235.5 Residential house prices (% y-o-y) 1.4 7.4 10.1 5.6 10.7 n/a n/a n/a Loan/deposit ratio 71.7 69.2 70.8 73.2 76.8 79.9 82.6 86.0 Stock market capitalisation/GDP (%) 57.9 76.8 68.6 69.0 48.3 48.3 48.3 48.3
*Industrial production is the output of companies with annual sales over RMB20m **Refers to the system-wide RRR rate. Data for Q2-Q4 2018 are extrapolated ***Total credit is Total Social Financing Stock. 2021 FX numbers are assumptions, not forecasts Other notes: Budget balance (% GDP) refers to annual numbers after adding drawdowns from government deposits. Policy rate was changed from the 1-year benchmark lending rate to the Loan Prime Rate (LPR) after the recent reform of the LPR system on August 2019; this policy rate was reduced by 11bp in Q3 2019 Source: CEIC, HSBC forecasts
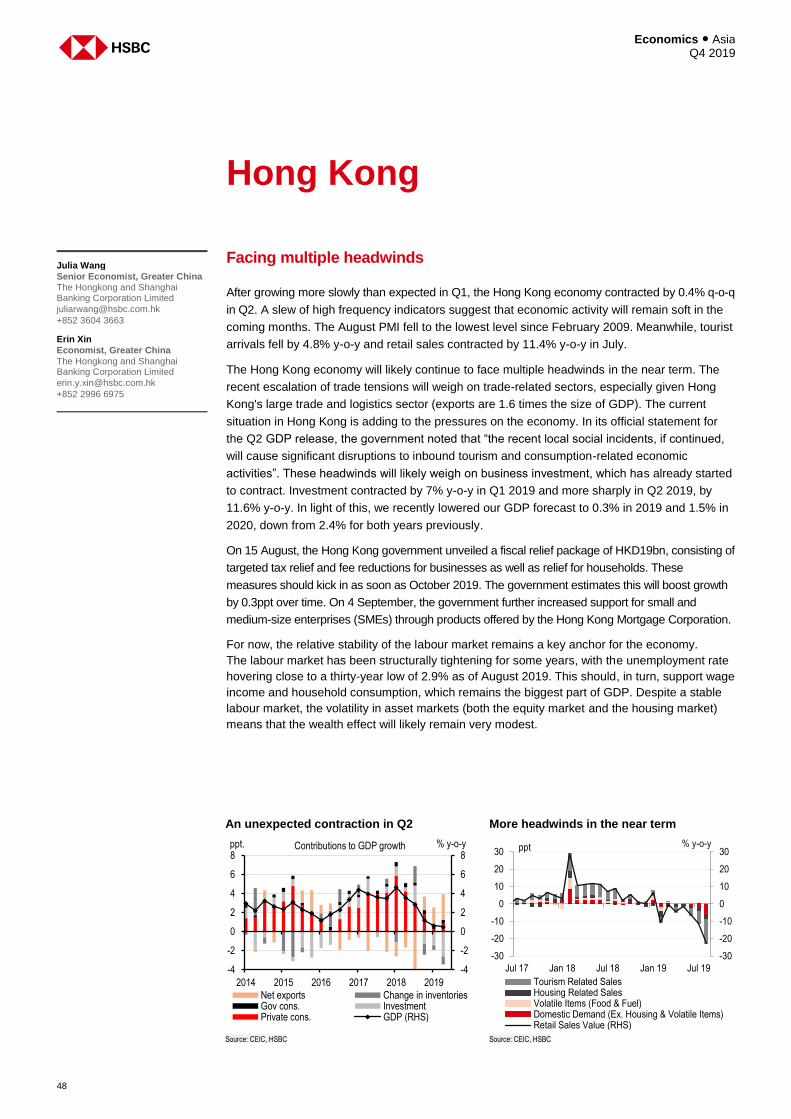
Economics ● Asia Q4 2019
48
Hong Kong
Facing multiple headwinds
After growing more slowly than expected in Q1, the Hong Kong economy contracted by 0.4% q-o-q
in Q2. A slew of high frequency indicators suggest that economic activity will remain soft in the
coming months. The August PMI fell to the lowest level since February 2009. Meanwhile, tourist
arrivals fell by 4.8% y-o-y and retail sales contracted by 11.4% y-o-y in July.
The Hong Kong economy will likely continue to face multiple headwinds in the near term. The
recent escalation of trade tensions will weigh on trade-related sectors, especially given Hong
Kong's large trade and logistics sector (exports are 1.6 times the size of GDP). The current
situation in Hong Kong is adding to the pressures on the economy. In its official statement for
the Q2 GDP release, the government noted that “the recent local social incidents, if continued,
will cause significant disruptions to inbound tourism and consumption-related economic
activities”. These headwinds will likely weigh on business investment, which has already started
to contract. Investment contracted by 7% y-o-y in Q1 2019 and more sharply in Q2 2019, by
11.6% y-o-y. In light of this, we recently lowered our GDP forecast to 0.3% in 2019 and 1.5% in
2020, down from 2.4% for both years previously.
On 15 August, the Hong Kong government unveiled a fiscal relief package of HKD19bn, consisting of
targeted tax relief and fee reductions for businesses as well as relief for households. These
measures should kick in as soon as October 2019. The government estimates this will boost growth
by 0.3ppt over time. On 4 September, the government further increased support for small and
medium-size enterprises (SMEs) through products offered by the Hong Kong Mortgage Corporation.
For now, the relative stability of the labour market remains a key anchor for the economy.
The labour market has been structurally tightening for some years, with the unemployment rate
hovering close to a thirty-year low of 2.9% as of August 2019. This should, in turn, support wage
income and household consumption, which remains the biggest part of GDP. Despite a stable
labour market, the volatility in asset markets (both the equity market and the housing market)
means that the wealth effect will likely remain very modest.
Julia Wang
Senior Economist, Greater China The Hongkong and Shanghai Banking Corporation Limited
+852 3604 3663
Erin Xin
Economist, Greater China
The Hongkong and Shanghai Banking Corporation Limited
+852 2996 6975
An unexpected contraction in Q2 More headwinds in the near term
Source: CEIC, HSBC Source: CEIC, HSBC
2014 2015 2016 2017 2018 2019
-4
-2
0
2
4
6
8
-4
-2
0
2
4
6
8% y-o-yppt.
Net exports Change in inventoriesGov cons. InvestmentPrivate cons. GDP (RHS)
Contributions to GDP growth
-30
-20
-10
0
10
20
30
-30
-20
-10
0
10
20
30
Jul 17 Jan 18 Jul 18 Jan 19 Jul 19
% y-o-yppt
Tourism Related SalesHousing Related SalesVolatile Items (Food & Fuel)Domestic Demand (Ex. Housing & Volatile Items)Retail Sales Value (RHS)
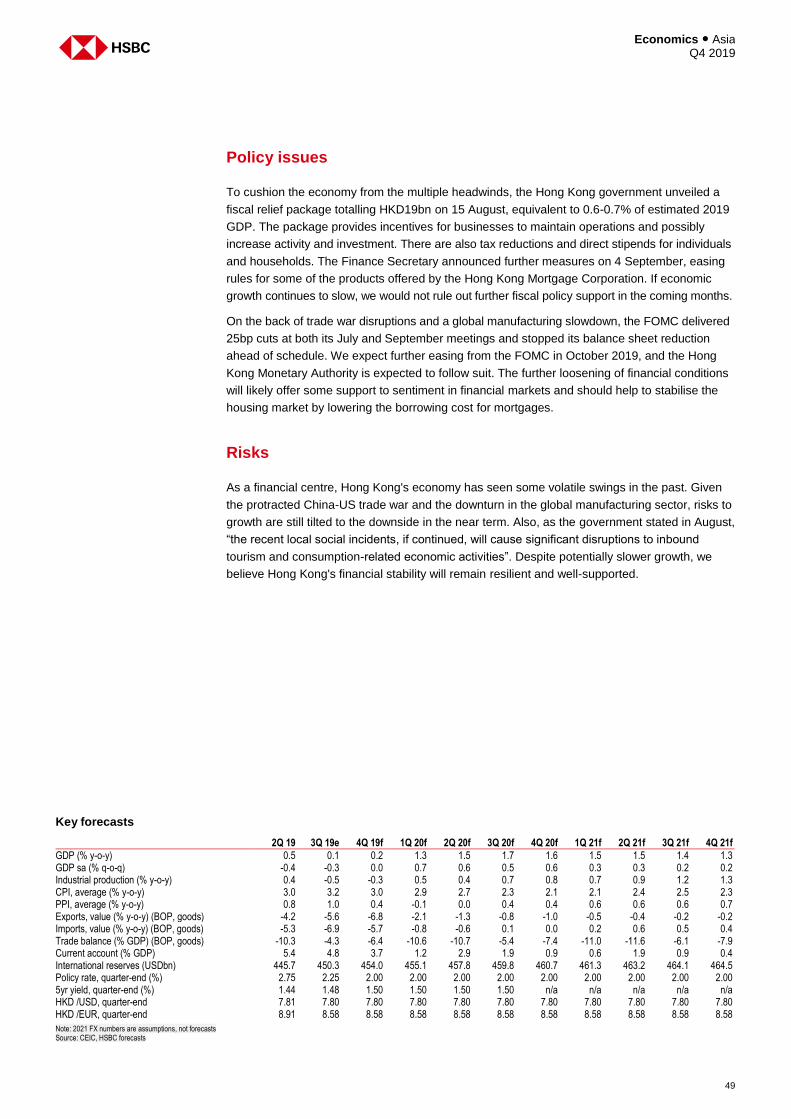
49
Economics ● Asia Q4 2019
Policy issues
To cushion the economy from the multiple headwinds, the Hong Kong government unveiled a
fiscal relief package totalling HKD19bn on 15 August, equivalent to 0.6-0.7% of estimated 2019
GDP. The package provides incentives for businesses to maintain operations and possibly
increase activity and investment. There are also tax reductions and direct stipends for individuals
and households. The Finance Secretary announced further measures on 4 September, easing
rules for some of the products offered by the Hong Kong Mortgage Corporation. If economic
growth continues to slow, we would not rule out further fiscal policy support in the coming months.
On the back of trade war disruptions and a global manufacturing slowdown, the FOMC delivered
25bp cuts at both its July and September meetings and stopped its balance sheet reduction
ahead of schedule. We expect further easing from the FOMC in October 2019, and the Hong
Kong Monetary Authority is expected to follow suit. The further loosening of financial conditions
will likely offer some support to sentiment in financial markets and should help to stabilise the
housing market by lowering the borrowing cost for mortgages.
Risks
As a financial centre, Hong Kong's economy has seen some volatile swings in the past. Given
the protracted China-US trade war and the downturn in the global manufacturing sector, risks to
growth are still tilted to the downside in the near term. Also, as the government stated in August,
“the recent local social incidents, if continued, will cause significant disruptions to inbound
tourism and consumption-related economic activities”. Despite potentially slower growth, we
believe Hong Kong's financial stability will remain resilient and well-supported.
Key forecasts
2Q 19 3Q 19e 4Q 19f 1Q 20f 2Q 20f 3Q 20f 4Q 20f 1Q 21f 2Q 21f 3Q 21f 4Q 21f
GDP (% y-o-y) 0.5 0.1 0.2 1.3 1.5 1.7 1.6 1.5 1.5 1.4 1.3 GDP sa (% q-o-q) -0.4 -0.3 0.0 0.7 0.6 0.5 0.6 0.3 0.3 0.2 0.2 Industrial production (% y-o-y) 0.4 -0.5 -0.3 0.5 0.4 0.7 0.8 0.7 0.9 1.2 1.3 CPI, average (% y-o-y) 3.0 3.2 3.0 2.9 2.7 2.3 2.1 2.1 2.4 2.5 2.3 PPI, average (% y-o-y) 0.8 1.0 0.4 -0.1 0.0 0.4 0.4 0.6 0.6 0.6 0.7 Exports, value (% y-o-y) (BOP, goods) -4.2 -5.6 -6.8 -2.1 -1.3 -0.8 -1.0 -0.5 -0.4 -0.2 -0.2 Imports, value (% y-o-y) (BOP, goods) -5.3 -6.9 -5.7 -0.8 -0.6 0.1 0.0 0.2 0.6 0.5 0.4 Trade balance (% GDP) (BOP, goods) -10.3 -4.3 -6.4 -10.6 -10.7 -5.4 -7.4 -11.0 -11.6 -6.1 -7.9 Current account (% GDP) 5.4 4.8 3.7 1.2 2.9 1.9 0.9 0.6 1.9 0.9 0.4 International reserves (USDbn) 445.7 450.3 454.0 455.1 457.8 459.8 460.7 461.3 463.2 464.1 464.5 Policy rate, quarter-end (%) 2.75 2.25 2.00 2.00 2.00 2.00 2.00 2.00 2.00 2.00 2.00 5yr yield, quarter-end (%) 1.44 1.48 1.50 1.50 1.50 1.50 n/a n/a n/a n/a n/a HKD /USD, quarter-end 7.81 7.80 7.80 7.80 7.80 7.80 7.80 7.80 7.80 7.80 7.80 HKD /EUR, quarter-end 8.91 8.58 8.58 8.58 8.58 8.58 8.58 8.58 8.58 8.58 8.58
Note: 2021 FX numbers are assumptions, not forecasts Source: CEIC, HSBC forecasts
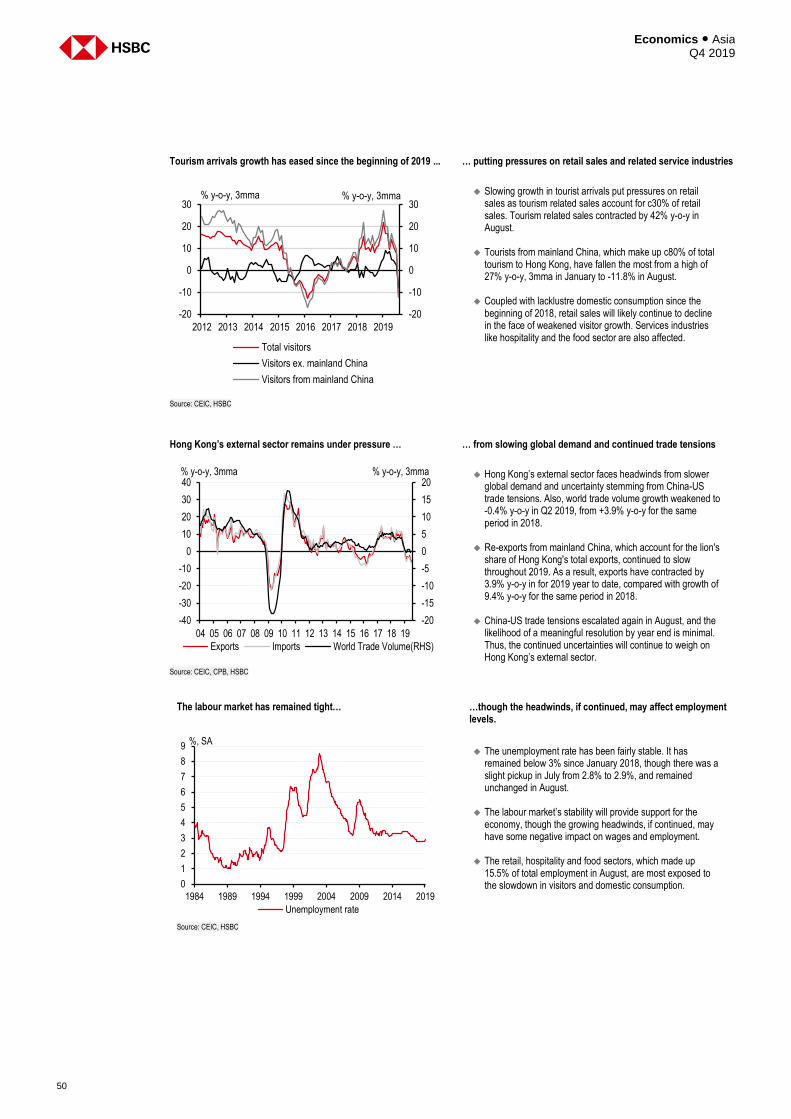
Economics ● Asia Q4 2019
50
Tourism arrivals growth has eased since the beginning of 2019 ... … putting pressures on retail sales and related service industries
Slowing growth in tourist arrivals put pressures on retail
sales as tourism related sales account for c30% of retail sales. Tourism related sales contracted by 42% y-o-y in August.
Tourists from mainland China, which make up c80% of total
tourism to Hong Kong, have fallen the most from a high of 27% y-o-y, 3mma in January to -11.8% in August.
Coupled with lacklustre domestic consumption since the
beginning of 2018, retail sales will likely continue to decline in the face of weakened visitor growth. Services industries like hospitality and the food sector are also affected.
Source: CEIC, HSBC
Hong Kong’s external sector remains under pressure … … from slowing global demand and continued trade tensions
Hong Kong’s external sector faces headwinds from slower
global demand and uncertainty stemming from China-US trade tensions. Also, world trade volume growth weakened to -0.4% y-o-y in Q2 2019, from +3.9% y-o-y for the same period in 2018.
Re-exports from mainland China, which account for the lion's
share of Hong Kong's total exports, continued to slow throughout 2019. As a result, exports have contracted by 3.9% y-o-y in for 2019 year to date, compared with growth of 9.4% y-o-y for the same period in 2018.
China-US trade tensions escalated again in August, and the
likelihood of a meaningful resolution by year end is minimal. Thus, the continued uncertainties will continue to weigh on Hong Kong’s external sector.
Source: CEIC, CPB, HSBC
The labour market has remained tight… …though the headwinds, if continued, may affect employment levels.
The unemployment rate has been fairly stable. It has remained below 3% since January 2018, though there was a slight pickup in July from 2.8% to 2.9%, and remained unchanged in August.
The labour market’s stability will provide support for the economy, though the growing headwinds, if continued, may have some negative impact on wages and employment.
The retail, hospitality and food sectors, which made up
15.5% of total employment in August, are most exposed to the slowdown in visitors and domestic consumption.
Source: CEIC, HSBC
2012 2013 2014 2015 2016 2017 2018 2019
-20
-10
0
10
20
30
-20
-10
0
10
20
30% y-o-y, 3mma% y-o-y, 3mma
Total visitors
Visitors ex. mainland China
Visitors from mainland China
04 05 06 07 08 09 10 11 12 13 14 15 16 17 18 19
-20
-15
-10
-5
0
5
10
15
20
-40
-30
-20
-10
0
10
20
30
40% y-o-y, 3mma% y-o-y, 3mma
Exports Imports World Trade Volume(RHS)
0
1
2
3
4
5
6
7
8
9
1984 1989 1994 1999 2004 2009 2014 2019
%, SA
Unemployment rate
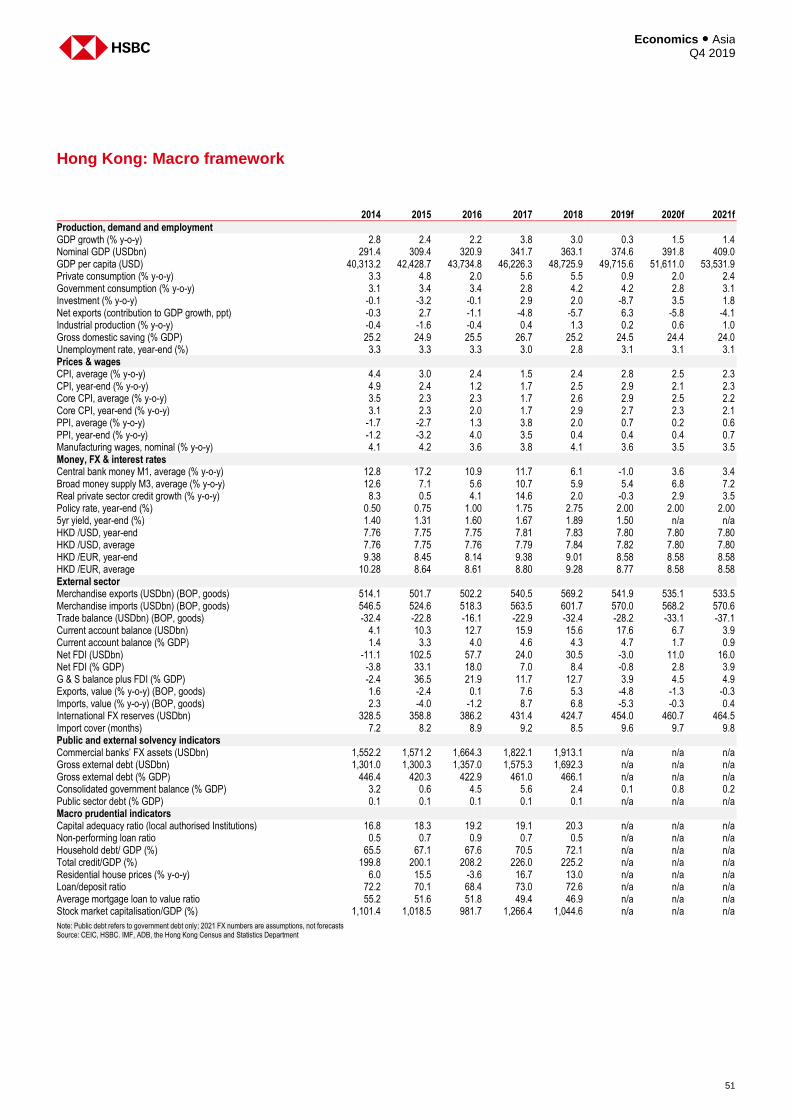
51
Economics ● Asia Q4 2019
Hong Kong: Macro framework
2014 2015 2016 2017 2018 2019f 2020f 2021f
Production, demand and employment GDP growth (% y-o-y) 2.8 2.4 2.2 3.8 3.0 0.3 1.5 1.4 Nominal GDP (USDbn) 291.4 309.4 320.9 341.7 363.1 374.6 391.8 409.0 GDP per capita (USD) 40,313.2 42,428.7 43,734.8 46,226.3 48,725.9 49,715.6 51,611.0 53,531.9 Private consumption (% y-o-y) 3.3 4.8 2.0 5.6 5.5 0.9 2.0 2.4 Government consumption (% y-o-y) 3.1 3.4 3.4 2.8 4.2 4.2 2.8 3.1 Investment (% y-o-y) -0.1 -3.2 -0.1 2.9 2.0 -8.7 3.5 1.8 Net exports (contribution to GDP growth, ppt) -0.3 2.7 -1.1 -4.8 -5.7 6.3 -5.8 -4.1 Industrial production (% y-o-y) -0.4 -1.6 -0.4 0.4 1.3 0.2 0.6 1.0 Gross domestic saving (% GDP) 25.2 24.9 25.5 26.7 25.2 24.5 24.4 24.0 Unemployment rate, year-end (%) 3.3 3.3 3.3 3.0 2.8 3.1 3.1 3.1 Prices & wages CPI, average (% y-o-y) 4.4 3.0 2.4 1.5 2.4 2.8 2.5 2.3 CPI, year-end (% y-o-y) 4.9 2.4 1.2 1.7 2.5 2.9 2.1 2.3 Core CPI, average (% y-o-y) 3.5 2.3 2.3 1.7 2.6 2.9 2.5 2.2 Core CPI, year-end (% y-o-y) 3.1 2.3 2.0 1.7 2.9 2.7 2.3 2.1 PPI, average (% y-o-y) -1.7 -2.7 1.3 3.8 2.0 0.7 0.2 0.6 PPI, year-end (% y-o-y) -1.2 -3.2 4.0 3.5 0.4 0.4 0.4 0.7 Manufacturing wages, nominal (% y-o-y) 4.1 4.2 3.6 3.8 4.1 3.6 3.5 3.5 Money, FX & interest rates Central bank money M1, average (% y-o-y) 12.8 17.2 10.9 11.7 6.1 -1.0 3.6 3.4 Broad money supply M3, average (% y-o-y) 12.6 7.1 5.6 10.7 5.9 5.4 6.8 7.2 Real private sector credit growth (% y-o-y) 8.3 0.5 4.1 14.6 2.0 -0.3 2.9 3.5 Policy rate, year-end (%) 0.50 0.75 1.00 1.75 2.75 2.00 2.00 2.00 5yr yield, year-end (%) 1.40 1.31 1.60 1.67 1.89 1.50 n/a n/a HKD /USD, year-end 7.76 7.75 7.75 7.81 7.83 7.80 7.80 7.80 HKD /USD, average 7.76 7.75 7.76 7.79 7.84 7.82 7.80 7.80 HKD /EUR, year-end 9.38 8.45 8.14 9.38 9.01 8.58 8.58 8.58 HKD /EUR, average 10.28 8.64 8.61 8.80 9.28 8.77 8.58 8.58 External sector Merchandise exports (USDbn) (BOP, goods) 514.1 501.7 502.2 540.5 569.2 541.9 535.1 533.5 Merchandise imports (USDbn) (BOP, goods) 546.5 524.6 518.3 563.5 601.7 570.0 568.2 570.6 Trade balance (USDbn) (BOP, goods) -32.4 -22.8 -16.1 -22.9 -32.4 -28.2 -33.1 -37.1 Current account balance (USDbn) 4.1 10.3 12.7 15.9 15.6 17.6 6.7 3.9 Current account balance (% GDP) 1.4 3.3 4.0 4.6 4.3 4.7 1.7 0.9 Net FDI (USDbn) -11.1 102.5 57.7 24.0 30.5 -3.0 11.0 16.0 Net FDI (% GDP) -3.8 33.1 18.0 7.0 8.4 -0.8 2.8 3.9 G & S balance plus FDI (% GDP) -2.4 36.5 21.9 11.7 12.7 3.9 4.5 4.9 Exports, value (% y-o-y) (BOP, goods) 1.6 -2.4 0.1 7.6 5.3 -4.8 -1.3 -0.3 Imports, value (% y-o-y) (BOP, goods) 2.3 -4.0 -1.2 8.7 6.8 -5.3 -0.3 0.4 International FX reserves (USDbn) 328.5 358.8 386.2 431.4 424.7 454.0 460.7 464.5 Import cover (months) 7.2 8.2 8.9 9.2 8.5 9.6 9.7 9.8 Public and external solvency indicators Commercial banks’ FX assets (USDbn) 1,552.2 1,571.2 1,664.3 1,822.1 1,913.1 n/a n/a n/a Gross external debt (USDbn) 1,301.0 1,300.3 1,357.0 1,575.3 1,692.3 n/a n/a n/a Gross external debt (% GDP) 446.4 420.3 422.9 461.0 466.1 n/a n/a n/a Consolidated government balance (% GDP) 3.2 0.6 4.5 5.6 2.4 0.1 0.8 0.2 Public sector debt (% GDP) 0.1 0.1 0.1 0.1 0.1 n/a n/a n/a Macro prudential indicators Capital adequacy ratio (local authorised Institutions) 16.8 18.3 19.2 19.1 20.3 n/a n/a n/a Non-performing loan ratio 0.5 0.7 0.9 0.7 0.5 n/a n/a n/a Household debt/ GDP (%) 65.5 67.1 67.6 70.5 72.1 n/a n/a n/a Total credit/GDP (%) 199.8 200.1 208.2 226.0 225.2 n/a n/a n/a Residential house prices (% y-o-y) 6.0 15.5 -3.6 16.7 13.0 n/a n/a n/a Loan/deposit ratio 72.2 70.1 68.4 73.0 72.6 n/a n/a n/a Average mortgage loan to value ratio 55.2 51.6 51.8 49.4 46.9 n/a n/a n/a Stock market capitalisation/GDP (%) 1,101.4 1,018.5 981.7 1,266.4 1,044.6 n/a n/a n/a
Note: Public debt refers to government debt only; 2021 FX numbers are assumptions, not forecasts Source: CEIC, HSBC. IMF, ADB, the Hong Kong Census and Statistics Department
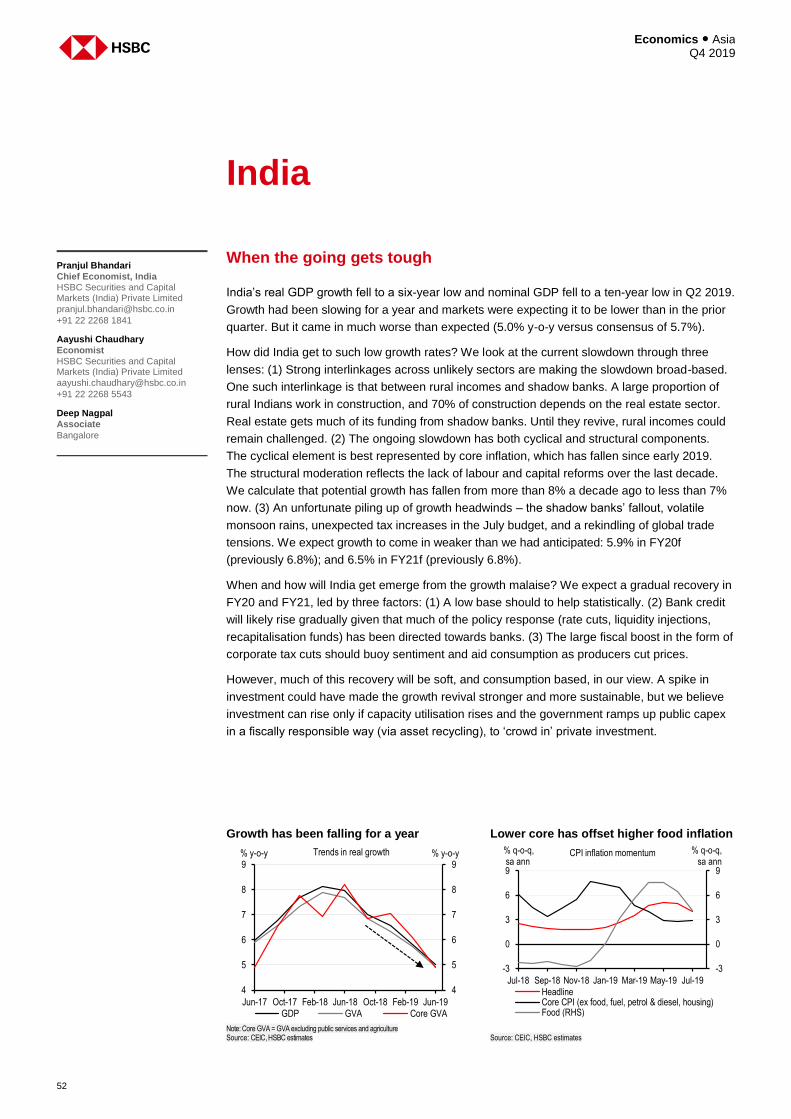
Economics ● Asia Q4 2019
52
India
When the going gets tough
India’s real GDP growth fell to a six-year low and nominal GDP fell to a ten-year low in Q2 2019.
Growth had been slowing for a year and markets were expecting it to be lower than in the prior
quarter. But it came in much worse than expected (5.0% y-o-y versus consensus of 5.7%).
How did India get to such low growth rates? We look at the current slowdown through three
lenses: (1) Strong interlinkages across unlikely sectors are making the slowdown broad-based.
One such interlinkage is that between rural incomes and shadow banks. A large proportion of
rural Indians work in construction, and 70% of construction depends on the real estate sector.
Real estate gets much of its funding from shadow banks. Until they revive, rural incomes could
remain challenged. (2) The ongoing slowdown has both cyclical and structural components.
The cyclical element is best represented by core inflation, which has fallen since early 2019.
The structural moderation reflects the lack of labour and capital reforms over the last decade.
We calculate that potential growth has fallen from more than 8% a decade ago to less than 7%
now. (3) An unfortunate piling up of growth headwinds – the shadow banks’ fallout, volatile
monsoon rains, unexpected tax increases in the July budget, and a rekindling of global trade
tensions. We expect growth to come in weaker than we had anticipated: 5.9% in FY20f
(previously 6.8%); and 6.5% in FY21f (previously 6.8%).
When and how will India get emerge from the growth malaise? We expect a gradual recovery in
FY20 and FY21, led by three factors: (1) A low base should to help statistically. (2) Bank credit
will likely rise gradually given that much of the policy response (rate cuts, liquidity injections,
recapitalisation funds) has been directed towards banks. (3) The large fiscal boost in the form of
corporate tax cuts should buoy sentiment and aid consumption as producers cut prices.
However, much of this recovery will be soft, and consumption based, in our view. A spike in
investment could have made the growth revival stronger and more sustainable, but we believe
investment can rise only if capacity utilisation rises and the government ramps up public capex
in a fiscally responsible way (via asset recycling), to ‘crowd in’ private investment.
Pranjul Bhandari
Chief Economist, India HSBC Securities and Capital Markets (India) Private Limited
+91 22 2268 1841
Aayushi Chaudhary
Economist
HSBC Securities and Capital Markets (India) Private Limited
+91 22 2268 5543
Deep Nagpal
Associate
Bangalore
Growth has been falling for a year Lower core has offset higher food inflation
Note: Core GVA = GVA excluding public services and agriculture Source: CEIC, HSBC estimates
Source: CEIC, HSBC estimates
4
5
6
7
8
9
4
5
6
7
8
9
Jun-17 Oct-17 Feb-18 Jun-18 Oct-18 Feb-19 Jun-19
% y-o-y % y-o-yTrends in real growth
GDP GVA Core GVA
Jul-18 Sep-18 Nov-18 Jan-19 Mar-19 May-19 Jul-19
-3
0
3
6
9
-3
0
3
6
9
CPI inflation momentum
HeadlineCore CPI (ex food, fuel, petrol & diesel, housing)Food (RHS)
% q-o-q,sa ann
% q-o-q,sa ann
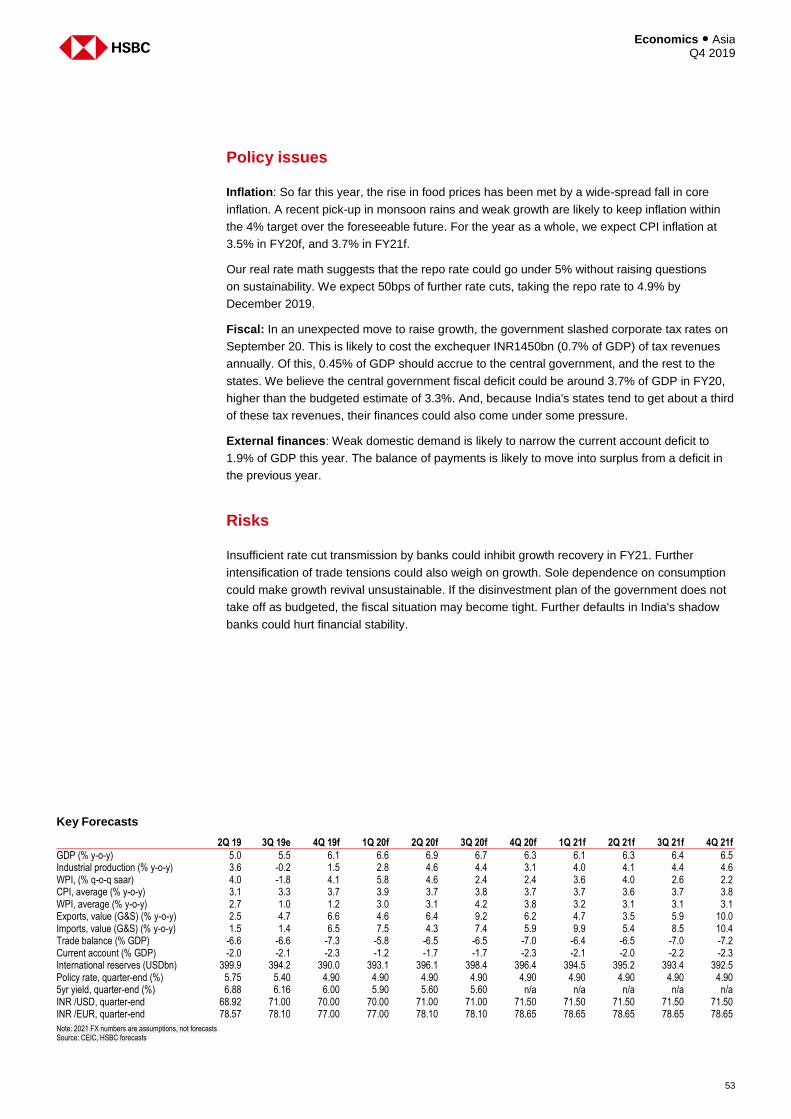
53
Economics ● Asia Q4 2019
Policy issues
Inflation: So far this year, the rise in food prices has been met by a wide-spread fall in core
inflation. A recent pick-up in monsoon rains and weak growth are likely to keep inflation within
the 4% target over the foreseeable future. For the year as a whole, we expect CPI inflation at
3.5% in FY20f, and 3.7% in FY21f.
Our real rate math suggests that the repo rate could go under 5% without raising questions
on sustainability. We expect 50bps of further rate cuts, taking the repo rate to 4.9% by
December 2019.
Fiscal: In an unexpected move to raise growth, the government slashed corporate tax rates on
September 20. This is likely to cost the exchequer INR1450bn (0.7% of GDP) of tax revenues
annually. Of this, 0.45% of GDP should accrue to the central government, and the rest to the
states. We believe the central government fiscal deficit could be around 3.7% of GDP in FY20,
higher than the budgeted estimate of 3.3%. And, because India's states tend to get about a third
of these tax revenues, their finances could also come under some pressure.
External finances: Weak domestic demand is likely to narrow the current account deficit to
1.9% of GDP this year. The balance of payments is likely to move into surplus from a deficit in
the previous year.
Risks
Insufficient rate cut transmission by banks could inhibit growth recovery in FY21. Further
intensification of trade tensions could also weigh on growth. Sole dependence on consumption
could make growth revival unsustainable. If the disinvestment plan of the government does not
take off as budgeted, the fiscal situation may become tight. Further defaults in India's shadow
banks could hurt financial stability.
Key Forecasts
2Q 19 3Q 19e 4Q 19f 1Q 20f 2Q 20f 3Q 20f 4Q 20f 1Q 21f 2Q 21f 3Q 21f 4Q 21f
GDP (% y-o-y) 5.0 5.5 6.1 6.6 6.9 6.7 6.3 6.1 6.3 6.4 6.5 Industrial production (% y-o-y) 3.6 -0.2 1.5 2.8 4.6 4.4 3.1 4.0 4.1 4.4 4.6 WPI, (% q-o-q saar) 4.0 -1.8 4.1 5.8 4.6 2.4 2.4 3.6 4.0 2.6 2.2 CPI, average (% y-o-y) 3.1 3.3 3.7 3.9 3.7 3.8 3.7 3.7 3.6 3.7 3.8 WPI, average (% y-o-y) 2.7 1.0 1.2 3.0 3.1 4.2 3.8 3.2 3.1 3.1 3.1 Exports, value (G&S) (% y-o-y) 2.5 4.7 6.6 4.6 6.4 9.2 6.2 4.7 3.5 5.9 10.0 Imports, value (G&S) (% y-o-y) 1.5 1.4 6.5 7.5 4.3 7.4 5.9 9.9 5.4 8.5 10.4 Trade balance (% GDP) -6.6 -6.6 -7.3 -5.8 -6.5 -6.5 -7.0 -6.4 -6.5 -7.0 -7.2 Current account (% GDP) -2.0 -2.1 -2.3 -1.2 -1.7 -1.7 -2.3 -2.1 -2.0 -2.2 -2.3 International reserves (USDbn) 399.9 394.2 390.0 393.1 396.1 398.4 396.4 394.5 395.2 393.4 392.5 Policy rate, quarter-end (%) 5.75 5.40 4.90 4.90 4.90 4.90 4.90 4.90 4.90 4.90 4.90 5yr yield, quarter-end (%) 6.88 6.16 6.00 5.90 5.60 5.60 n/a n/a n/a n/a n/a INR /USD, quarter-end 68.92 71.00 70.00 70.00 71.00 71.00 71.50 71.50 71.50 71.50 71.50 INR /EUR, quarter-end 78.57 78.10 77.00 77.00 78.10 78.10 78.65 78.65 78.65 78.65 78.65
Note: 2021 FX numbers are assumptions, not forecasts Source: CEIC, HSBC forecasts
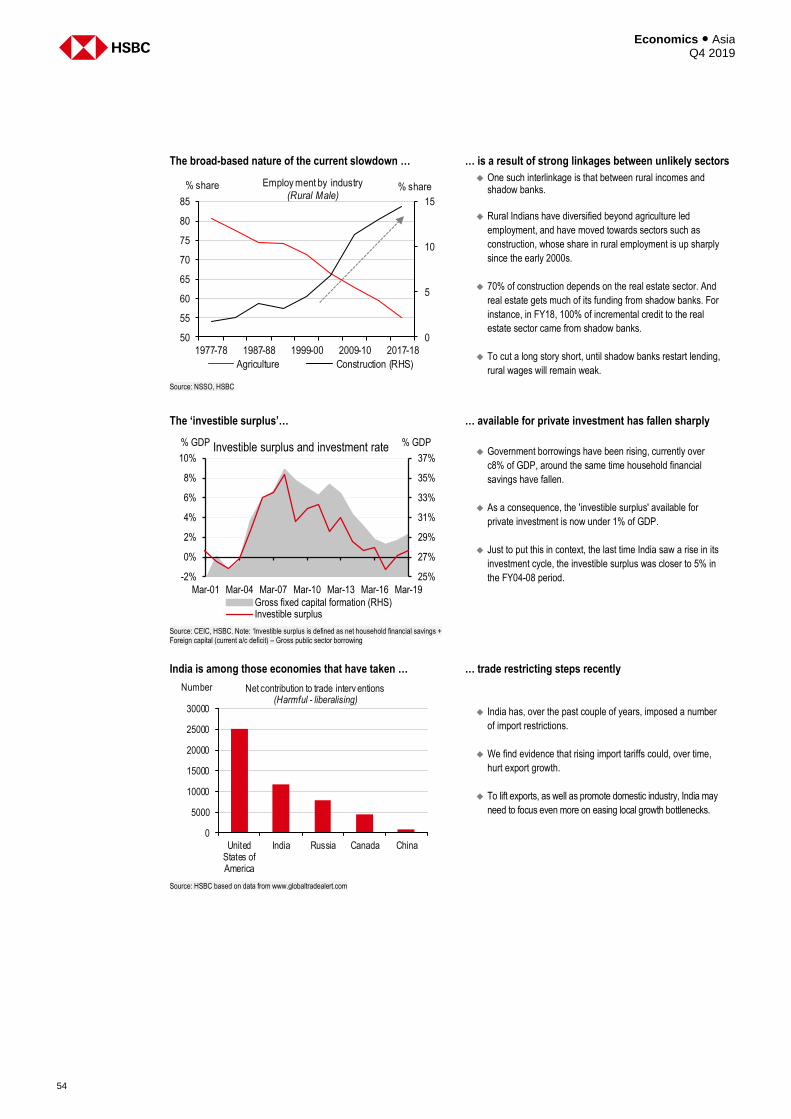
Economics ● Asia Q4 2019
54
The broad-based nature of the current slowdown … … is a result of strong linkages between unlikely sectors
One such interlinkage is that between rural incomes and shadow banks.
Rural Indians have diversified beyond agriculture led
employment, and have moved towards sectors such as
construction, whose share in rural employment is up sharply
since the early 2000s.
70% of construction depends on the real estate sector. And
real estate gets much of its funding from shadow banks. For
instance, in FY18, 100% of incremental credit to the real
estate sector came from shadow banks.
To cut a long story short, until shadow banks restart lending,
rural wages will remain weak.
Source: NSSO, HSBC
The ‘investible surplus’… … available for private investment has fallen sharply
Government borrowings have been rising, currently over
c8% of GDP, around the same time household financial
savings have fallen.
As a consequence, the 'investible surplus' available for
private investment is now under 1% of GDP.
Just to put this in context, the last time India saw a rise in its
investment cycle, the investible surplus was closer to 5% in
the FY04-08 period.
Source: CEIC, HSBC. Note: ‘Investible surplus is defined as net household financial savings + Foreign capital (current a/c deficit) – Gross public sector borrowing
India is among those economies that have taken … … trade restricting steps recently
India has, over the past couple of years, imposed a number
of import restrictions.
We find evidence that rising import tariffs could, over time,
hurt export growth.
To lift exports, as well as promote domestic industry, India may
need to focus even more on easing local growth bottlenecks.
Source: HSBC based on data from www.globaltradealert.com
0
5
10
15
50
55
60
65
70
75
80
85
1977-78 1987-88 1999-00 2009-10 2017-18
% share% share Employ ment by industry
(Rural Male)
Agriculture Construction (RHS)
25%
27%
29%
31%
33%
35%
37%
-2%
0%
2%
4%
6%
8%
10%
Mar-01 Mar-04 Mar-07 Mar-10 Mar-13 Mar-16 Mar-19
% GDP% GDP Investible surplus and investment rate
Gross fixed capital formation (RHS)Investible surplus
0
5000
10000
15000
20000
25000
30000
UnitedStates ofAmerica
India Russia Canada China
Number Net contribution to trade interv entions (Harmful - liberalising)
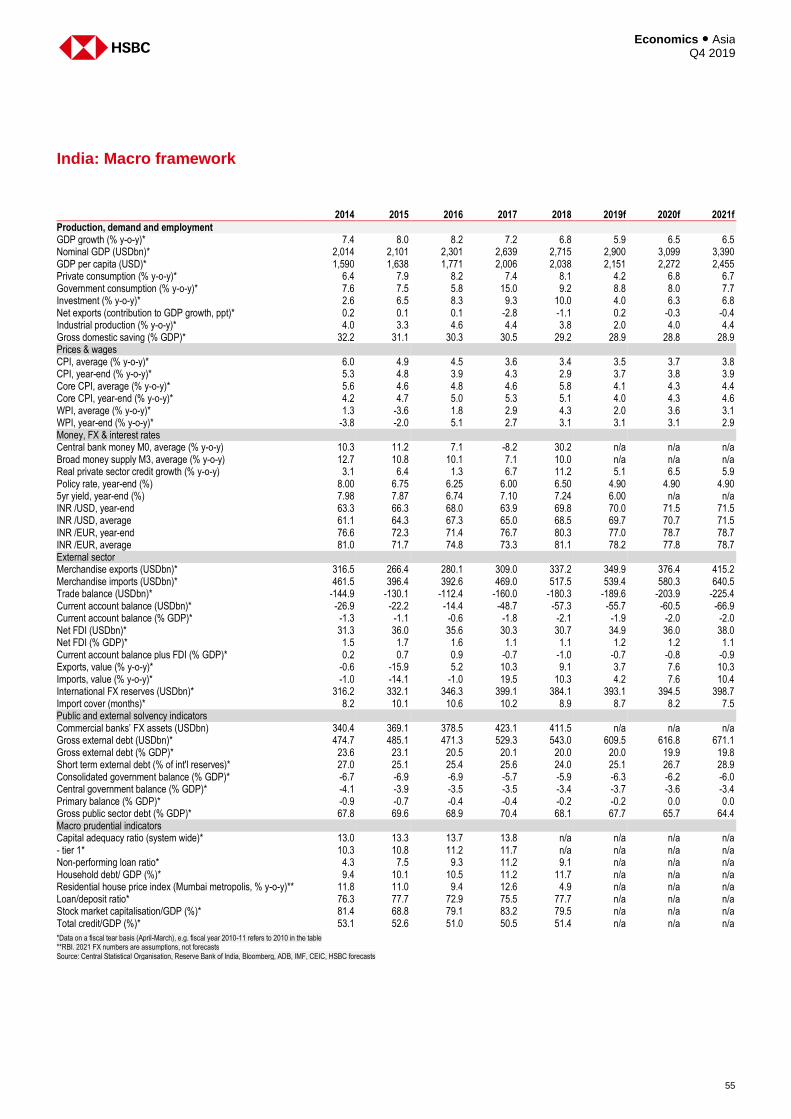
55
Economics ● Asia Q4 2019
India: Macro framework
2014 2015 2016 2017 2018 2019f 2020f 2021f
Production, demand and employment GDP growth (% y-o-y)* 7.4 8.0 8.2 7.2 6.8 5.9 6.5 6.5 Nominal GDP (USDbn)* 2,014 2,101 2,301 2,639 2,715 2,900 3,099 3,390 GDP per capita (USD)* 1,590 1,638 1,771 2,006 2,038 2,151 2,272 2,455 Private consumption (% y-o-y)* 6.4 7.9 8.2 7.4 8.1 4.2 6.8 6.7 Government consumption (% y-o-y)* 7.6 7.5 5.8 15.0 9.2 8.8 8.0 7.7 Investment (% y-o-y)* 2.6 6.5 8.3 9.3 10.0 4.0 6.3 6.8 Net exports (contribution to GDP growth, ppt)* 0.2 0.1 0.1 -2.8 -1.1 0.2 -0.3 -0.4 Industrial production (% y-o-y)* 4.0 3.3 4.6 4.4 3.8 2.0 4.0 4.4 Gross domestic saving (% GDP)* 32.2 31.1 30.3 30.5 29.2 28.9 28.8 28.9 Prices & wages CPI, average (% y-o-y)* 6.0 4.9 4.5 3.6 3.4 3.5 3.7 3.8 CPI, year-end (% y-o-y)* 5.3 4.8 3.9 4.3 2.9 3.7 3.8 3.9 Core CPI, average (% y-o-y)* 5.6 4.6 4.8 4.6 5.8 4.1 4.3 4.4 Core CPI, year-end (% y-o-y)* 4.2 4.7 5.0 5.3 5.1 4.0 4.3 4.6 WPI, average (% y-o-y)* 1.3 -3.6 1.8 2.9 4.3 2.0 3.6 3.1 WPI, year-end (% y-o-y)* -3.8 -2.0 5.1 2.7 3.1 3.1 3.1 2.9 Money, FX & interest rates Central bank money M0, average (% y-o-y) 10.3 11.2 7.1 -8.2 30.2 n/a n/a n/a Broad money supply M3, average (% y-o-y) 12.7 10.8 10.1 7.1 10.0 n/a n/a n/a Real private sector credit growth (% y-o-y) 3.1 6.4 1.3 6.7 11.2 5.1 6.5 5.9 Policy rate, year-end (%) 8.00 6.75 6.25 6.00 6.50 4.90 4.90 4.90 5yr yield, year-end (%) 7.98 7.87 6.74 7.10 7.24 6.00 n/a n/a INR /USD, year-end 63.3 66.3 68.0 63.9 69.8 70.0 71.5 71.5 INR /USD, average 61.1 64.3 67.3 65.0 68.5 69.7 70.7 71.5 INR /EUR, year-end 76.6 72.3 71.4 76.7 80.3 77.0 78.7 78.7 INR /EUR, average 81.0 71.7 74.8 73.3 81.1 78.2 77.8 78.7 External sector Merchandise exports (USDbn)* 316.5 266.4 280.1 309.0 337.2 349.9 376.4 415.2 Merchandise imports (USDbn)* 461.5 396.4 392.6 469.0 517.5 539.4 580.3 640.5 Trade balance (USDbn)* -144.9 -130.1 -112.4 -160.0 -180.3 -189.6 -203.9 -225.4 Current account balance (USDbn)* -26.9 -22.2 -14.4 -48.7 -57.3 -55.7 -60.5 -66.9 Current account balance (% GDP)* -1.3 -1.1 -0.6 -1.8 -2.1 -1.9 -2.0 -2.0 Net FDI (USDbn)* 31.3 36.0 35.6 30.3 30.7 34.9 36.0 38.0 Net FDI (% GDP)* 1.5 1.7 1.6 1.1 1.1 1.2 1.2 1.1 Current account balance plus FDI (% GDP)* 0.2 0.7 0.9 -0.7 -1.0 -0.7 -0.8 -0.9 Exports, value (% y-o-y)* -0.6 -15.9 5.2 10.3 9.1 3.7 7.6 10.3 Imports, value (% y-o-y)* -1.0 -14.1 -1.0 19.5 10.3 4.2 7.6 10.4 International FX reserves (USDbn)* 316.2 332.1 346.3 399.1 384.1 393.1 394.5 398.7 Import cover (months)* 8.2 10.1 10.6 10.2 8.9 8.7 8.2 7.5 Public and external solvency indicators Commercial banks’ FX assets (USDbn) 340.4 369.1 378.5 423.1 411.5 n/a n/a n/a Gross external debt (USDbn)* 474.7 485.1 471.3 529.3 543.0 609.5 616.8 671.1 Gross external debt (% GDP)* 23.6 23.1 20.5 20.1 20.0 20.0 19.9 19.8 Short term external debt (% of int'l reserves)* 27.0 25.1 25.4 25.6 24.0 25.1 26.7 28.9 Consolidated government balance (% GDP)* -6.7 -6.9 -6.9 -5.7 -5.9 -6.3 -6.2 -6.0 Central government balance (% GDP)* -4.1 -3.9 -3.5 -3.5 -3.4 -3.7 -3.6 -3.4 Primary balance (% GDP)* -0.9 -0.7 -0.4 -0.4 -0.2 -0.2 0.0 0.0 Gross public sector debt (% GDP)* 67.8 69.6 68.9 70.4 68.1 67.7 65.7 64.4 Macro prudential indicators Capital adequacy ratio (system wide)* 13.0 13.3 13.7 13.8 n/a n/a n/a n/a - tier 1* 10.3 10.8 11.2 11.7 n/a n/a n/a n/a Non-performing loan ratio* 4.3 7.5 9.3 11.2 9.1 n/a n/a n/a Household debt/ GDP (%)* 9.4 10.1 10.5 11.2 11.7 n/a n/a n/a Residential house price index (Mumbai metropolis, % y-o-y)** 11.8 11.0 9.4 12.6 4.9 n/a n/a n/a Loan/deposit ratio* 76.3 77.7 72.9 75.5 77.7 n/a n/a n/a Stock market capitalisation/GDP (%)* 81.4 68.8 79.1 83.2 79.5 n/a n/a n/a Total credit/GDP (%)* 53.1 52.6 51.0 50.5 51.4 n/a n/a n/a
*Data on a fiscal tear basis (April-March), e.g. fiscal year 2010-11 refers to 2010 in the table **RBI. 2021 FX numbers are assumptions, not forecasts Source: Central Statistical Organisation, Reserve Bank of India, Bloomberg, ADB, IMF, CEIC, HSBC forecasts
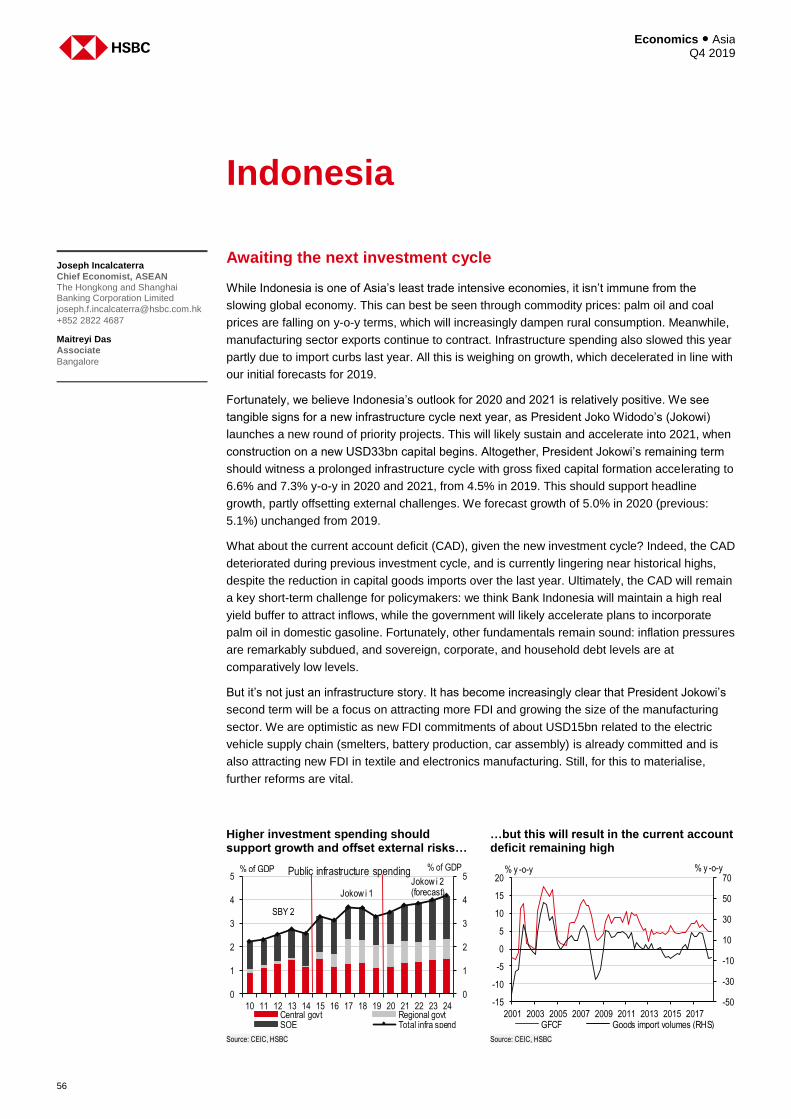
Economics ● Asia Q4 2019
56
Indonesia
Awaiting the next investment cycle
While Indonesia is one of Asia’s least trade intensive economies, it isn’t immune from the
slowing global economy. This can best be seen through commodity prices: palm oil and coal
prices are falling on y-o-y terms, which will increasingly dampen rural consumption. Meanwhile,
manufacturing sector exports continue to contract. Infrastructure spending also slowed this year
partly due to import curbs last year. All this is weighing on growth, which decelerated in line with
our initial forecasts for 2019.
Fortunately, we believe Indonesia’s outlook for 2020 and 2021 is relatively positive. We see
tangible signs for a new infrastructure cycle next year, as President Joko Widodo’s (Jokowi)
launches a new round of priority projects. This will likely sustain and accelerate into 2021, when
construction on a new USD33bn capital begins. Altogether, President Jokowi’s remaining term
should witness a prolonged infrastructure cycle with gross fixed capital formation accelerating to
6.6% and 7.3% y-o-y in 2020 and 2021, from 4.5% in 2019. This should support headline
growth, partly offsetting external challenges. We forecast growth of 5.0% in 2020 (previous:
5.1%) unchanged from 2019.
What about the current account deficit (CAD), given the new investment cycle? Indeed, the CAD
deteriorated during previous investment cycle, and is currently lingering near historical highs,
despite the reduction in capital goods imports over the last year. Ultimately, the CAD will remain
a key short-term challenge for policymakers: we think Bank Indonesia will maintain a high real
yield buffer to attract inflows, while the government will likely accelerate plans to incorporate
palm oil in domestic gasoline. Fortunately, other fundamentals remain sound: inflation pressures
are remarkably subdued, and sovereign, corporate, and household debt levels are at
comparatively low levels.
But it’s not just an infrastructure story. It has become increasingly clear that President Jokowi’s
second term will be a focus on attracting more FDI and growing the size of the manufacturing
sector. We are optimistic as new FDI commitments of about USD15bn related to the electric
vehicle supply chain (smelters, battery production, car assembly) is already committed and is
also attracting new FDI in textile and electronics manufacturing. Still, for this to materialise,
further reforms are vital.
Joseph Incalcaterra
Chief Economist, ASEAN The Hongkong and Shanghai Banking Corporation Limited
+852 2822 4687
Maitreyi Das
Associate
Bangalore
Higher investment spending should support growth and offset external risks…
…but this will result in the current account deficit remaining high
Source: CEIC, HSBC Source: CEIC, HSBC
0
1
2
3
4
5
0
1
2
3
4
5
10 11 12 13 14 15 16 17 18 19 20 21 22 23 24
% of GDPPublic infrastructure spending
Central govt Regional govtSOE Total infra spend
% of GDP
SBY 2
Jokow i 1
Jokow i 2(forecast)
-50
-30
-10
10
30
50
70
-15
-10
-5
0
5
10
15
20
2001 2003 2005 2007 2009 2011 2013 2015 2017
% y -o-y
GFCF Goods import volumes (RHS)
% y -o-y
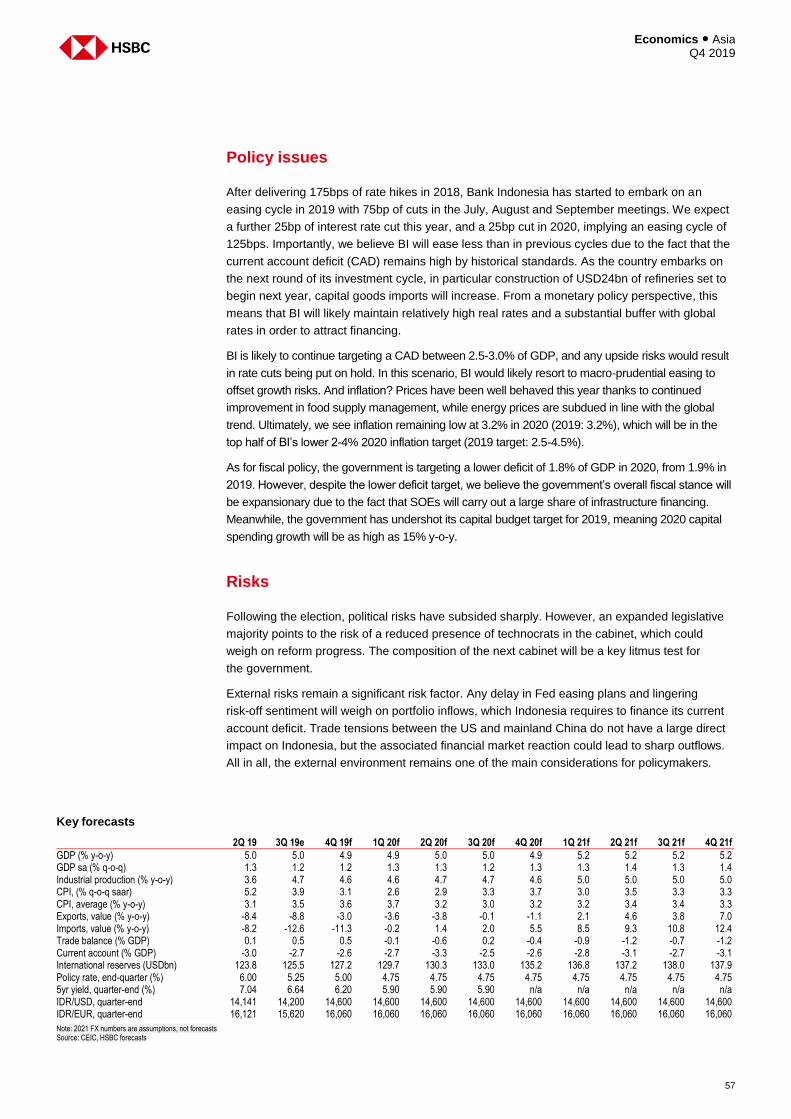
57
Economics ● Asia Q4 2019
Policy issues
After delivering 175bps of rate hikes in 2018, Bank Indonesia has started to embark on an
easing cycle in 2019 with 75bp of cuts in the July, August and September meetings. We expect
a further 25bp of interest rate cut this year, and a 25bp cut in 2020, implying an easing cycle of
125bps. Importantly, we believe BI will ease less than in previous cycles due to the fact that the
current account deficit (CAD) remains high by historical standards. As the country embarks on
the next round of its investment cycle, in particular construction of USD24bn of refineries set to
begin next year, capital goods imports will increase. From a monetary policy perspective, this
means that BI will likely maintain relatively high real rates and a substantial buffer with global
rates in order to attract financing.
BI is likely to continue targeting a CAD between 2.5-3.0% of GDP, and any upside risks would result
in rate cuts being put on hold. In this scenario, BI would likely resort to macro-prudential easing to
offset growth risks. And inflation? Prices have been well behaved this year thanks to continued
improvement in food supply management, while energy prices are subdued in line with the global
trend. Ultimately, we see inflation remaining low at 3.2% in 2020 (2019: 3.2%), which will be in the
top half of BI’s lower 2-4% 2020 inflation target (2019 target: 2.5-4.5%).
As for fiscal policy, the government is targeting a lower deficit of 1.8% of GDP in 2020, from 1.9% in
2019. However, despite the lower deficit target, we believe the government’s overall fiscal stance will
be expansionary due to the fact that SOEs will carry out a large share of infrastructure financing.
Meanwhile, the government has undershot its capital budget target for 2019, meaning 2020 capital
spending growth will be as high as 15% y-o-y.
Risks
Following the election, political risks have subsided sharply. However, an expanded legislative
majority points to the risk of a reduced presence of technocrats in the cabinet, which could
weigh on reform progress. The composition of the next cabinet will be a key litmus test for
the government.
External risks remain a significant risk factor. Any delay in Fed easing plans and lingering
risk-off sentiment will weigh on portfolio inflows, which Indonesia requires to finance its current
account deficit. Trade tensions between the US and mainland China do not have a large direct
impact on Indonesia, but the associated financial market reaction could lead to sharp outflows.
All in all, the external environment remains one of the main considerations for policymakers.
Key forecasts
2Q 19 3Q 19e 4Q 19f 1Q 20f 2Q 20f 3Q 20f 4Q 20f 1Q 21f 2Q 21f 3Q 21f 4Q 21f
GDP (% y-o-y) 5.0 5.0 4.9 4.9 5.0 5.0 4.9 5.2 5.2 5.2 5.2 GDP sa (% q-o-q) 1.3 1.2 1.2 1.3 1.3 1.2 1.3 1.3 1.4 1.3 1.4 Industrial production (% y-o-y) 3.6 4.7 4.6 4.6 4.7 4.7 4.6 5.0 5.0 5.0 5.0 CPI, (% q-o-q saar) 5.2 3.9 3.1 2.6 2.9 3.3 3.7 3.0 3.5 3.3 3.3 CPI, average (% y-o-y) 3.1 3.5 3.6 3.7 3.2 3.0 3.2 3.2 3.4 3.4 3.3 Exports, value (% y-o-y) -8.4 -8.8 -3.0 -3.6 -3.8 -0.1 -1.1 2.1 4.6 3.8 7.0 Imports, value (% y-o-y) -8.2 -12.6 -11.3 -0.2 1.4 2.0 5.5 8.5 9.3 10.8 12.4 Trade balance (% GDP) 0.1 0.5 0.5 -0.1 -0.6 0.2 -0.4 -0.9 -1.2 -0.7 -1.2 Current account (% GDP) -3.0 -2.7 -2.6 -2.7 -3.3 -2.5 -2.6 -2.8 -3.1 -2.7 -3.1 International reserves (USDbn) 123.8 125.5 127.2 129.7 130.3 133.0 135.2 136.8 137.2 138.0 137.9 Policy rate, end-quarter (%) 6.00 5.25 5.00 4.75 4.75 4.75 4.75 4.75 4.75 4.75 4.75 5yr yield, quarter-end (%) 7.04 6.64 6.20 5.90 5.90 5.90 n/a n/a n/a n/a n/a IDR/USD, quarter-end 14,141 14,200 14,600 14,600 14,600 14,600 14,600 14,600 14,600 14,600 14,600 IDR/EUR, quarter-end 16,121 15,620 16,060 16,060 16,060 16,060 16,060 16,060 16,060 16,060 16,060
Note: 2021 FX numbers are assumptions, not forecasts Source: CEIC, HSBC forecasts
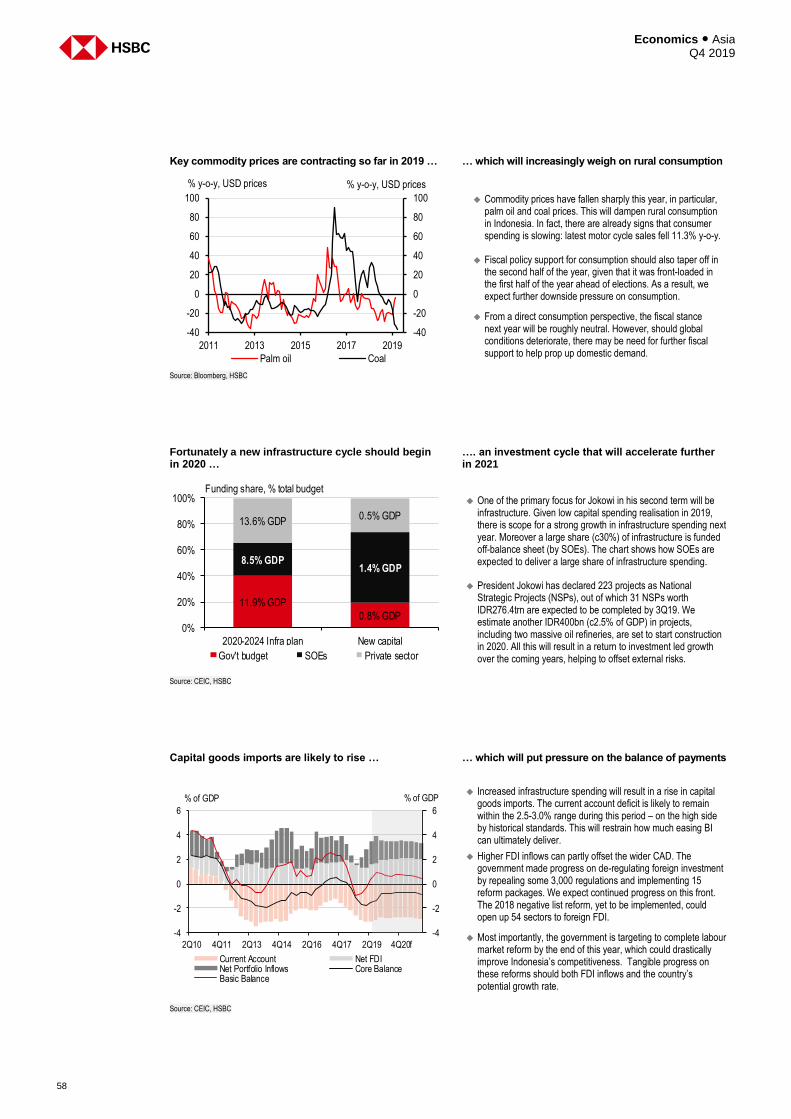
Economics ● Asia Q4 2019
58
Key commodity prices are contracting so far in 2019 … … which will increasingly weigh on rural consumption
Commodity prices have fallen sharply this year, in particular, palm oil and coal prices. This will dampen rural consumption in Indonesia. In fact, there are already signs that consumer spending is slowing: latest motor cycle sales fell 11.3% y-o-y.
Fiscal policy support for consumption should also taper off in the second half of the year, given that it was front-loaded in the first half of the year ahead of elections. As a result, we expect further downside pressure on consumption.
From a direct consumption perspective, the fiscal stance next year will be roughly neutral. However, should global conditions deteriorate, there may be need for further fiscal support to help prop up domestic demand.
Source: Bloomberg, HSBC
Fortunately a new infrastructure cycle should begin in 2020 …
…. an investment cycle that will accelerate further in 2021
One of the primary focus for Jokowi in his second term will be infrastructure. Given low capital spending realisation in 2019, there is scope for a strong growth in infrastructure spending next year. Moreover a large share (c30%) of infrastructure is funded off-balance sheet (by SOEs). The chart shows how SOEs are expected to deliver a large share of infrastructure spending.
President Jokowi has declared 223 projects as National Strategic Projects (NSPs), out of which 31 NSPs worth IDR276.4trn are expected to be completed by 3Q19. We estimate another IDR400bn (c2.5% of GDP) in projects, including two massive oil refineries, are set to start construction in 2020. All this will result in a return to investment led growth over the coming years, helping to offset external risks.
Source: CEIC, HSBC
Capital goods imports are likely to rise … … which will put pressure on the balance of payments
Increased infrastructure spending will result in a rise in capital
goods imports. The current account deficit is likely to remain within the 2.5-3.0% range during this period – on the high side by historical standards. This will restrain how much easing BI can ultimately deliver.
Higher FDI inflows can partly offset the wider CAD. The government made progress on de-regulating foreign investment by repealing some 3,000 regulations and implementing 15 reform packages. We expect continued progress on this front. The 2018 negative list reform, yet to be implemented, could open up 54 sectors to foreign FDI.
Most importantly, the government is targeting to complete labour market reform by the end of this year, which could drastically improve Indonesia’s competitiveness. Tangible progress on these reforms should both FDI inflows and the country’s potential growth rate.
Source: CEIC, HSBC
-40
-20
0
20
40
60
80
100
-40
-20
0
20
40
60
80
100
2011 2013 2015 2017 2019
% y-o-y, USD prices% y-o-y, USD prices
Palm oil Coal
11.9% GDP
0.8% GDP
8.5% GDP1.4% GDP
13.6% GDP0.5% GDP
0%
20%
40%
60%
80%
100%
2020-2024 Infra plan New capital
Gov't budget SOEs Private sector
Funding share, % total budget
-4
-2
0
2
4
6
-4
-2
0
2
4
6
2Q10 4Q11 2Q13 4Q14 2Q16 4Q17 2Q19 4Q20f
% of GDP% of GDP
Current Account Net FDINet Portfolio Inflows Core BalanceBasic Balance
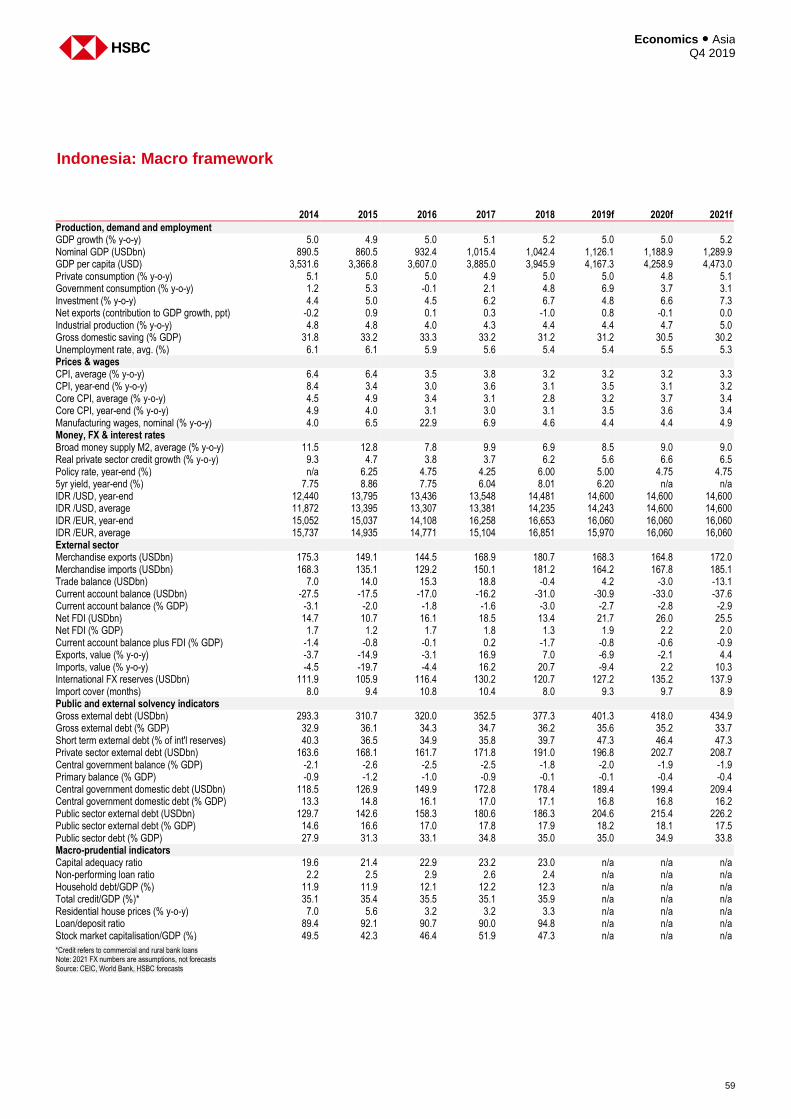
59
Economics ● Asia Q4 2019
Indonesia: Macro framework
2014 2015 2016 2017 2018 2019f 2020f 2021f
Production, demand and employment GDP growth (% y-o-y) 5.0 4.9 5.0 5.1 5.2 5.0 5.0 5.2 Nominal GDP (USDbn) 890.5 860.5 932.4 1,015.4 1,042.4 1,126.1 1,188.9 1,289.9 GDP per capita (USD) 3,531.6 3,366.8 3,607.0 3,885.0 3,945.9 4,167.3 4,258.9 4,473.0 Private consumption (% y-o-y) 5.1 5.0 5.0 4.9 5.0 5.0 4.8 5.1 Government consumption (% y-o-y) 1.2 5.3 -0.1 2.1 4.8 6.9 3.7 3.1 Investment (% y-o-y) 4.4 5.0 4.5 6.2 6.7 4.8 6.6 7.3 Net exports (contribution to GDP growth, ppt) -0.2 0.9 0.1 0.3 -1.0 0.8 -0.1 0.0 Industrial production (% y-o-y) 4.8 4.8 4.0 4.3 4.4 4.4 4.7 5.0 Gross domestic saving (% GDP) 31.8 33.2 33.3 33.2 31.2 31.2 30.5 30.2 Unemployment rate, avg. (%) 6.1 6.1 5.9 5.6 5.4 5.4 5.5 5.3 Prices & wages CPI, average (% y-o-y) 6.4 6.4 3.5 3.8 3.2 3.2 3.2 3.3 CPI, year-end (% y-o-y) 8.4 3.4 3.0 3.6 3.1 3.5 3.1 3.2 Core CPI, average (% y-o-y) 4.5 4.9 3.4 3.1 2.8 3.2 3.7 3.4 Core CPI, year-end (% y-o-y) 4.9 4.0 3.1 3.0 3.1 3.5 3.6 3.4 Manufacturing wages, nominal (% y-o-y) 4.0 6.5 22.9 6.9 4.6 4.4 4.4 4.9 Money, FX & interest rates Broad money supply M2, average (% y-o-y) 11.5 12.8 7.8 9.9 6.9 8.5 9.0 9.0 Real private sector credit growth (% y-o-y) 9.3 4.7 3.8 3.7 6.2 5.6 6.6 6.5 Policy rate, year-end (%) n/a 6.25 4.75 4.25 6.00 5.00 4.75 4.75 5yr yield, year-end (%) 7.75 8.86 7.75 6.04 8.01 6.20 n/a n/a IDR /USD, year-end 12,440 13,795 13,436 13,548 14,481 14,600 14,600 14,600 IDR /USD, average 11,872 13,395 13,307 13,381 14,235 14,243 14,600 14,600 IDR /EUR, year-end 15,052 15,037 14,108 16,258 16,653 16,060 16,060 16,060 IDR /EUR, average 15,737 14,935 14,771 15,104 16,851 15,970 16,060 16,060 External sector Merchandise exports (USDbn) 175.3 149.1 144.5 168.9 180.7 168.3 164.8 172.0 Merchandise imports (USDbn) 168.3 135.1 129.2 150.1 181.2 164.2 167.8 185.1 Trade balance (USDbn) 7.0 14.0 15.3 18.8 -0.4 4.2 -3.0 -13.1 Current account balance (USDbn) -27.5 -17.5 -17.0 -16.2 -31.0 -30.9 -33.0 -37.6 Current account balance (% GDP) -3.1 -2.0 -1.8 -1.6 -3.0 -2.7 -2.8 -2.9 Net FDI (USDbn) 14.7 10.7 16.1 18.5 13.4 21.7 26.0 25.5 Net FDI (% GDP) 1.7 1.2 1.7 1.8 1.3 1.9 2.2 2.0 Current account balance plus FDI (% GDP) -1.4 -0.8 -0.1 0.2 -1.7 -0.8 -0.6 -0.9 Exports, value (% y-o-y) -3.7 -14.9 -3.1 16.9 7.0 -6.9 -2.1 4.4 Imports, value (% y-o-y) -4.5 -19.7 -4.4 16.2 20.7 -9.4 2.2 10.3 International FX reserves (USDbn) 111.9 105.9 116.4 130.2 120.7 127.2 135.2 137.9 Import cover (months) 8.0 9.4 10.8 10.4 8.0 9.3 9.7 8.9 Public and external solvency indicators Gross external debt (USDbn) 293.3 310.7 320.0 352.5 377.3 401.3 418.0 434.9 Gross external debt (% GDP) 32.9 36.1 34.3 34.7 36.2 35.6 35.2 33.7 Short term external debt (% of int'l reserves) 40.3 36.5 34.9 35.8 39.7 47.3 46.4 47.3 Private sector external debt (USDbn) 163.6 168.1 161.7 171.8 191.0 196.8 202.7 208.7 Central government balance (% GDP) -2.1 -2.6 -2.5 -2.5 -1.8 -2.0 -1.9 -1.9 Primary balance (% GDP) -0.9 -1.2 -1.0 -0.9 -0.1 -0.1 -0.4 -0.4 Central government domestic debt (USDbn) 118.5 126.9 149.9 172.8 178.4 189.4 199.4 209.4 Central government domestic debt (% GDP) 13.3 14.8 16.1 17.0 17.1 16.8 16.8 16.2 Public sector external debt (USDbn) 129.7 142.6 158.3 180.6 186.3 204.6 215.4 226.2 Public sector external debt (% GDP) 14.6 16.6 17.0 17.8 17.9 18.2 18.1 17.5 Public sector debt (% GDP) 27.9 31.3 33.1 34.8 35.0 35.0 34.9 33.8 Macro-prudential indicators Capital adequacy ratio 19.6 21.4 22.9 23.2 23.0 n/a n/a n/a Non-performing loan ratio 2.2 2.5 2.9 2.6 2.4 n/a n/a n/a Household debt/GDP (%) 11.9 11.9 12.1 12.2 12.3 n/a n/a n/a Total credit/GDP (%)* 35.1 35.4 35.5 35.1 35.9 n/a n/a n/a Residential house prices (% y-o-y) 7.0 5.6 3.2 3.2 3.3 n/a n/a n/a Loan/deposit ratio 89.4 92.1 90.7 90.0 94.8 n/a n/a n/a Stock market capitalisation/GDP (%) 49.5 42.3 46.4 51.9 47.3 n/a n/a n/a
*Credit refers to commercial and rural bank loans Note: 2021 FX numbers are assumptions, not forecasts Source: CEIC, World Bank, HSBC forecasts
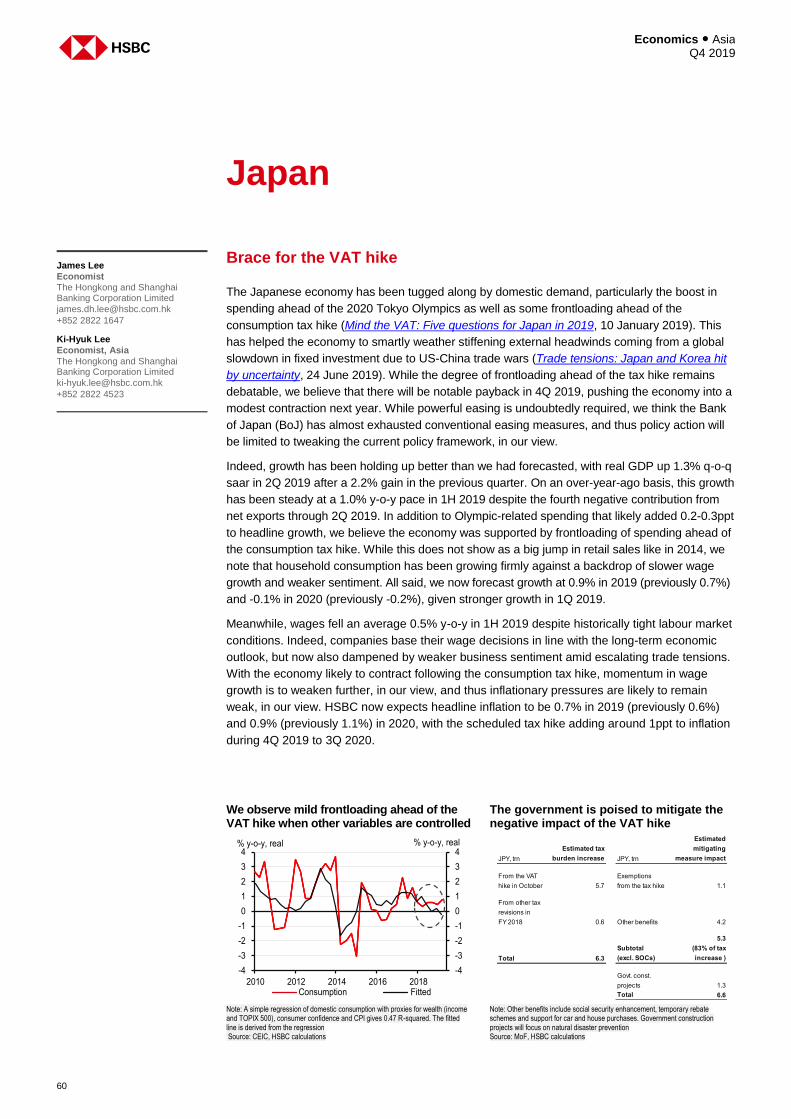
Economics ● Asia Q4 2019
60
Japan
Brace for the VAT hike
The Japanese economy has been tugged along by domestic demand, particularly the boost in
spending ahead of the 2020 Tokyo Olympics as well as some frontloading ahead of the
consumption tax hike (Mind the VAT: Five questions for Japan in 2019, 10 January 2019). This
has helped the economy to smartly weather stiffening external headwinds coming from a global
slowdown in fixed investment due to US-China trade wars (Trade tensions: Japan and Korea hit
by uncertainty, 24 June 2019). While the degree of frontloading ahead of the tax hike remains
debatable, we believe that there will be notable payback in 4Q 2019, pushing the economy into a
modest contraction next year. While powerful easing is undoubtedly required, we think the Bank
of Japan (BoJ) has almost exhausted conventional easing measures, and thus policy action will
be limited to tweaking the current policy framework, in our view.
Indeed, growth has been holding up better than we had forecasted, with real GDP up 1.3% q-o-q
saar in 2Q 2019 after a 2.2% gain in the previous quarter. On an over-year-ago basis, this growth
has been steady at a 1.0% y-o-y pace in 1H 2019 despite the fourth negative contribution from
net exports through 2Q 2019. In addition to Olympic-related spending that likely added 0.2-0.3ppt
to headline growth, we believe the economy was supported by frontloading of spending ahead of
the consumption tax hike. While this does not show as a big jump in retail sales like in 2014, we
note that household consumption has been growing firmly against a backdrop of slower wage
growth and weaker sentiment. All said, we now forecast growth at 0.9% in 2019 (previously 0.7%)
and -0.1% in 2020 (previously -0.2%), given stronger growth in 1Q 2019.
Meanwhile, wages fell an average 0.5% y-o-y in 1H 2019 despite historically tight labour market
conditions. Indeed, companies base their wage decisions in line with the long-term economic
outlook, but now also dampened by weaker business sentiment amid escalating trade tensions.
With the economy likely to contract following the consumption tax hike, momentum in wage
growth is to weaken further, in our view, and thus inflationary pressures are likely to remain
weak, in our view. HSBC now expects headline inflation to be 0.7% in 2019 (previously 0.6%)
and 0.9% (previously 1.1%) in 2020, with the scheduled tax hike adding around 1ppt to inflation
during 4Q 2019 to 3Q 2020.
We observe mild frontloading ahead of the VAT hike when other variables are controlled
The government is poised to mitigate the negative impact of the VAT hike
Note: A simple regression of domestic consumption with proxies for wealth (income and TOPIX 500), consumer confidence and CPI gives 0.47 R-squared. The fitted line is derived from the regression Source: CEIC, HSBC calculations
Note: Other benefits include social security enhancement, temporary rebate schemes and support for car and house purchases. Government construction projects will focus on natural disaster prevention Source: MoF, HSBC calculations
James Lee
Economist The Hongkong and Shanghai Banking Corporation Limited
+852 2822 1647
Ki-Hyuk Lee
Economist, Asia
The Hongkong and Shanghai Banking Corporation Limited
+852 2822 4523
-4
-3
-2
-1
0
1
2
3
4
-4
-3
-2
-1
0
1
2
3
4
2010 2012 2014 2016 2018
% y-o-y, real
Consumption Fitted
% y-o-y, real
JPY, trn
Estimated tax
burden increase JPY, trn
Estimated
mitigating
measure impact
From the VAT
hike in October 5.7
Exemptions
from the tax hike 1.1
From other tax
revisions in
FY 2018 0.6 Other benefits 4.2
Total 6.3
Subtotal
(excl. SOCs)
5.3
(83% of tax
increase )
Govt. const.
projects 1.3
Total 6.6
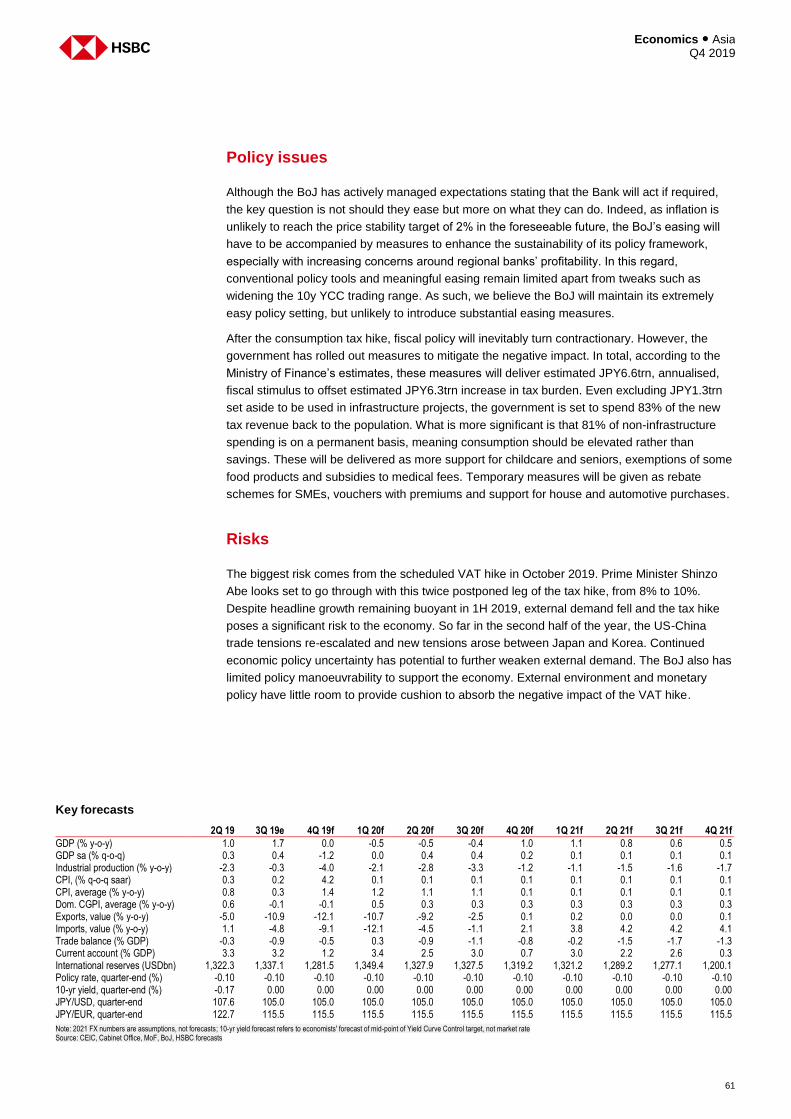
61
Economics ● Asia Q4 2019
Policy issues
Although the BoJ has actively managed expectations stating that the Bank will act if required,
the key question is not should they ease but more on what they can do. Indeed, as inflation is
unlikely to reach the price stability target of 2% in the foreseeable future, the BoJ’s easing will
have to be accompanied by measures to enhance the sustainability of its policy framework,
especially with increasing concerns around regional banks’ profitability. In this regard,
conventional policy tools and meaningful easing remain limited apart from tweaks such as
widening the 10y YCC trading range. As such, we believe the BoJ will maintain its extremely
easy policy setting, but unlikely to introduce substantial easing measures.
After the consumption tax hike, fiscal policy will inevitably turn contractionary. However, the
government has rolled out measures to mitigate the negative impact. In total, according to the
Ministry of Finance’s estimates, these measures will deliver estimated JPY6.6trn, annualised,
fiscal stimulus to offset estimated JPY6.3trn increase in tax burden. Even excluding JPY1.3trn
set aside to be used in infrastructure projects, the government is set to spend 83% of the new
tax revenue back to the population. What is more significant is that 81% of non-infrastructure
spending is on a permanent basis, meaning consumption should be elevated rather than
savings. These will be delivered as more support for childcare and seniors, exemptions of some
food products and subsidies to medical fees. Temporary measures will be given as rebate
schemes for SMEs, vouchers with premiums and support for house and automotive purchases.
Risks
The biggest risk comes from the scheduled VAT hike in October 2019. Prime Minister Shinzo
Abe looks set to go through with this twice postponed leg of the tax hike, from 8% to 10%.
Despite headline growth remaining buoyant in 1H 2019, external demand fell and the tax hike
poses a significant risk to the economy. So far in the second half of the year, the US-China
trade tensions re-escalated and new tensions arose between Japan and Korea. Continued
economic policy uncertainty has potential to further weaken external demand. The BoJ also has
limited policy manoeuvrability to support the economy. External environment and monetary
policy have little room to provide cushion to absorb the negative impact of the VAT hike.
Key forecasts
2Q 19 3Q 19e 4Q 19f 1Q 20f 2Q 20f 3Q 20f 4Q 20f 1Q 21f 2Q 21f 3Q 21f 4Q 21f
GDP (% y-o-y) 1.0 1.7 0.0 -0.5 -0.5 -0.4 1.0 1.1 0.8 0.6 0.5 GDP sa (% q-o-q) 0.3 0.4 -1.2 0.0 0.4 0.4 0.2 0.1 0.1 0.1 0.1 Industrial production (% y-o-y) -2.3 -0.3 -4.0 -2.1 -2.8 -3.3 -1.2 -1.1 -1.5 -1.6 -1.7 CPI, (% q-o-q saar) 0.3 0.2 4.2 0.1 0.1 0.1 0.1 0.1 0.1 0.1 0.1 CPI, average (% y-o-y) 0.8 0.3 1.4 1.2 1.1 1.1 0.1 0.1 0.1 0.1 0.1 Dom. CGPI, average (% y-o-y) 0.6 -0.1 -0.1 0.5 0.3 0.3 0.3 0.3 0.3 0.3 0.3 Exports, value (% y-o-y) -5.0 -10.9 -12.1 -10.7 .-9.2 -2.5 0.1 0.2 0.0 0.0 0.1 Imports, value (% y-o-y) 1.1 -4.8 -9.1 -12.1 -4.5 -1.1 2.1 3.8 4.2 4.2 4.1 Trade balance (% GDP) -0.3 -0.9 -0.5 0.3 -0.9 -1.1 -0.8 -0.2 -1.5 -1.7 -1.3 Current account (% GDP) 3.3 3.2 1.2 3.4 2.5 3.0 0.7 3.0 2.2 2.6 0.3 International reserves (USDbn) 1,322.3 1,337.1 1,281.5 1,349.4 1,327.9 1,327.5 1,319.2 1,321.2 1,289.2 1,277.1 1,200.1 Policy rate, quarter-end (%) -0.10 -0.10 -0.10 -0.10 -0.10 -0.10 -0.10 -0.10 -0.10 -0.10 -0.10 10-yr yield, quarter-end (%) -0.17 0.00 0.00 0.00 0.00 0.00 0.00 0.00 0.00 0.00 0.00 JPY/USD, quarter-end 107.6 105.0 105.0 105.0 105.0 105.0 105.0 105.0 105.0 105.0 105.0 JPY/EUR, quarter-end 122.7 115.5 115.5 115.5 115.5 115.5 115.5 115.5 115.5 115.5 115.5
Note: 2021 FX numbers are assumptions, not forecasts; 10-yr yield forecast refers to economists' forecast of mid-point of Yield Curve Control target, not market rate Source: CEIC, Cabinet Office, MoF, BoJ, HSBC forecasts
17
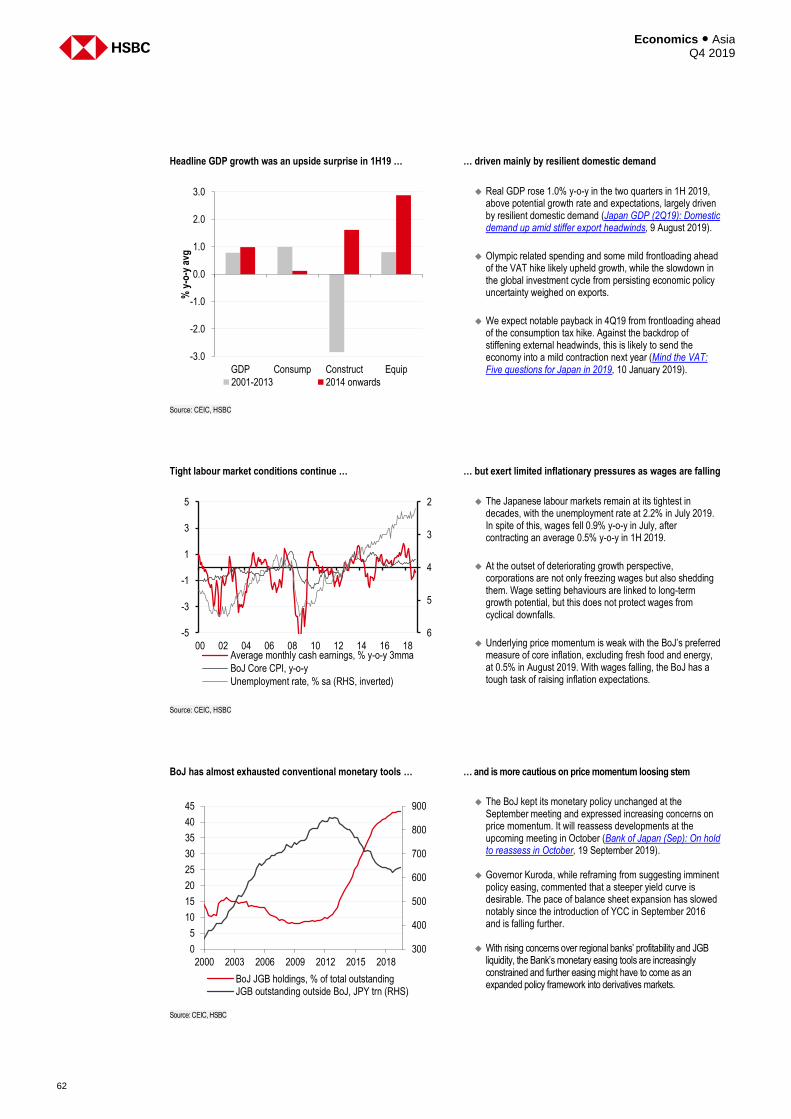
Economics ● Asia Q4 2019
62
Headline GDP growth was an upside surprise in 1H19 … … driven mainly by resilient domestic demand
Real GDP rose 1.0% y-o-y in the two quarters in 1H 2019,
above potential growth rate and expectations, largely driven by resilient domestic demand (Japan GDP (2Q19): Domestic demand up amid stiffer export headwinds, 9 August 2019).
Olympic related spending and some mild frontloading ahead of the VAT hike likely upheld growth, while the slowdown in the global investment cycle from persisting economic policy uncertainty weighed on exports.
We expect notable payback in 4Q19 from frontloading ahead of the consumption tax hike. Against the backdrop of stiffening external headwinds, this is likely to send the economy into a mild contraction next year (Mind the VAT: Five questions for Japan in 2019, 10 January 2019).
Source: CEIC, HSBC
Tight labour market conditions continue … … but exert limited inflationary pressures as wages are falling
The Japanese labour markets remain at its tightest in
decades, with the unemployment rate at 2.2% in July 2019. In spite of this, wages fell 0.9% y-o-y in July, after contracting an average 0.5% y-o-y in 1H 2019.
At the outset of deteriorating growth perspective, corporations are not only freezing wages but also shedding them. Wage setting behaviours are linked to long-term growth potential, but this does not protect wages from cyclical downfalls.
Underlying price momentum is weak with the BoJ’s preferred measure of core inflation, excluding fresh food and energy, at 0.5% in August 2019. With wages falling, the BoJ has a tough task of raising inflation expectations.
Source: CEIC, HSBC
BoJ has almost exhausted conventional monetary tools … … and is more cautious on price momentum loosing stem
The BoJ kept its monetary policy unchanged at the
September meeting and expressed increasing concerns on price momentum. It will reassess developments at the upcoming meeting in October (Bank of Japan (Sep): On hold to reassess in October, 19 September 2019).
Governor Kuroda, while reframing from suggesting imminent
policy easing, commented that a steeper yield curve is desirable. The pace of balance sheet expansion has slowed notably since the introduction of YCC in September 2016 and is falling further.
With rising concerns over regional banks’ profitability and JGB liquidity, the Bank’s monetary easing tools are increasingly constrained and further easing might have to come as an expanded policy framework into derivatives markets.
Source: CEIC, HSBC
-3.0
-2.0
-1.0
0.0
1.0
2.0
3.0
GDP Consump Construct Equip
% y
-o-y
avg
2001-2013 2014 onwards
2
3
4
5
6-5
-3
-1
1
3
5
00 02 04 06 08 10 12 14 16 18Average monthly cash earnings, % y-o-y 3mma
BoJ Core CPI, y-o-y
Unemployment rate, % sa (RHS, inverted)
300
400
500
600
700
800
900
0
5
10
15
20
25
30
35
40
45
2000 2003 2006 2009 2012 2015 2018
BoJ JGB holdings, % of total outstandingJGB outstanding outside BoJ, JPY trn (RHS)
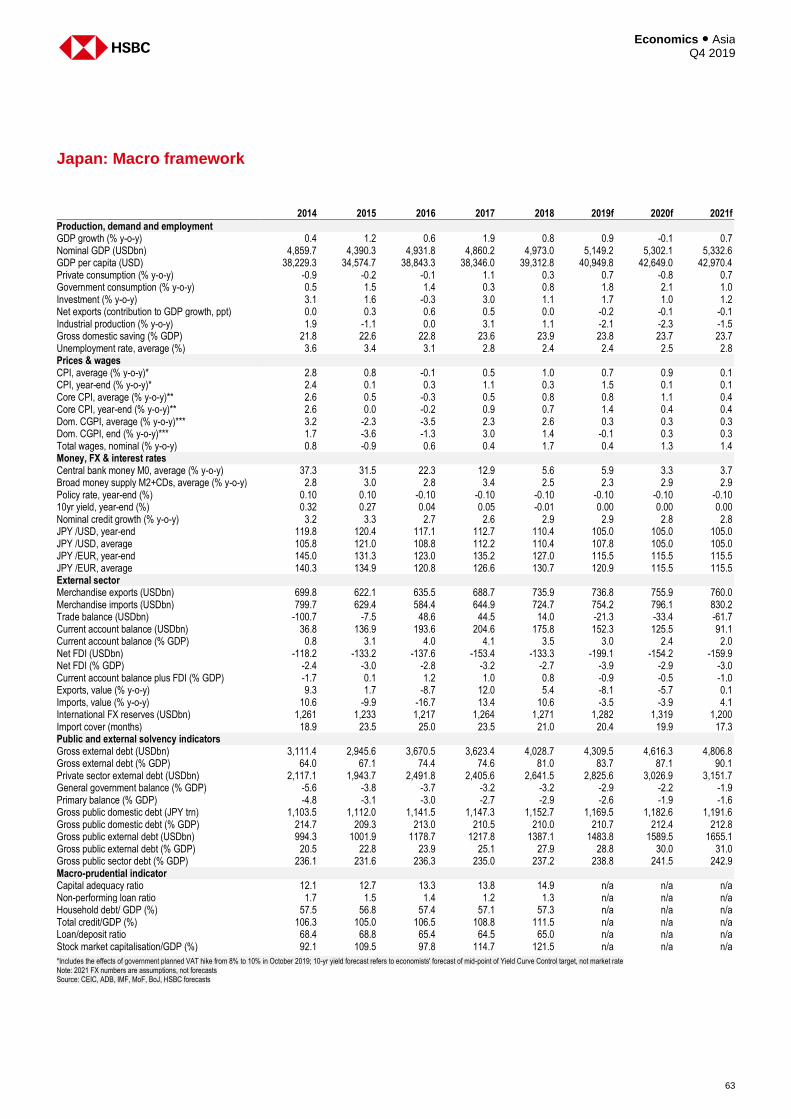
63
Economics ● Asia Q4 2019
Japan: Macro framework
2014 2015 2016 2017 2018 2019f 2020f 2021f
Production, demand and employment GDP growth (% y-o-y) 0.4 1.2 0.6 1.9 0.8 0.9 -0.1 0.7 Nominal GDP (USDbn) 4,859.7 4,390.3 4,931.8 4,860.2 4,973.0 5,149.2 5,302.1 5,332.6 GDP per capita (USD) 38,229.3 34,574.7 38,843.3 38,346.0 39,312.8 40,949.8 42,649.0 42,970.4 Private consumption (% y-o-y) -0.9 -0.2 -0.1 1.1 0.3 0.7 -0.8 0.7 Government consumption (% y-o-y) 0.5 1.5 1.4 0.3 0.8 1.8 2.1 1.0 Investment (% y-o-y) 3.1 1.6 -0.3 3.0 1.1 1.7 1.0 1.2 Net exports (contribution to GDP growth, ppt) 0.0 0.3 0.6 0.5 0.0 -0.2 -0.1 -0.1 Industrial production (% y-o-y) 1.9 -1.1 0.0 3.1 1.1 -2.1 -2.3 -1.5 Gross domestic saving (% GDP) 21.8 22.6 22.8 23.6 23.9 23.8 23.7 23.7 Unemployment rate, average (%) 3.6 3.4 3.1 2.8 2.4 2.4 2.5 2.8 Prices & wages CPI, average (% y-o-y)* 2.8 0.8 -0.1 0.5 1.0 0.7 0.9 0.1 CPI, year-end (% y-o-y)* 2.4 0.1 0.3 1.1 0.3 1.5 0.1 0.1 Core CPI, average (% y-o-y)** 2.6 0.5 -0.3 0.5 0.8 0.8 1.1 0.4 Core CPI, year-end (% y-o-y)** 2.6 0.0 -0.2 0.9 0.7 1.4 0.4 0.4 Dom. CGPI, average (% y-o-y)*** 3.2 -2.3 -3.5 2.3 2.6 0.3 0.3 0.3 Dom. CGPI, end (% y-o-y)*** 1.7 -3.6 -1.3 3.0 1.4 -0.1 0.3 0.3 Total wages, nominal (% y-o-y) 0.8 -0.9 0.6 0.4 1.7 0.4 1.3 1.4 Money, FX & interest rates Central bank money M0, average (% y-o-y) 37.3 31.5 22.3 12.9 5.6 5.9 3.3 3.7 Broad money supply M2+CDs, average (% y-o-y) 2.8 3.0 2.8 3.4 2.5 2.3 2.9 2.9 Policy rate, year-end (%) 0.10 0.10 -0.10 -0.10 -0.10 -0.10 -0.10 -0.10 10yr yield, year-end (%) 0.32 0.27 0.04 0.05 -0.01 0.00 0.00 0.00 Nominal credit growth (% y-o-y) 3.2 3.3 2.7 2.6 2.9 2.9 2.8 2.8 JPY /USD, year-end 119.8 120.4 117.1 112.7 110.4 105.0 105.0 105.0 JPY /USD, average 105.8 121.0 108.8 112.2 110.4 107.8 105.0 105.0 JPY /EUR, year-end 145.0 131.3 123.0 135.2 127.0 115.5 115.5 115.5 JPY /EUR, average 140.3 134.9 120.8 126.6 130.7 120.9 115.5 115.5 External sector Merchandise exports (USDbn) 699.8 622.1 635.5 688.7 735.9 736.8 755.9 760.0 Merchandise imports (USDbn) 799.7 629.4 584.4 644.9 724.7 754.2 796.1 830.2 Trade balance (USDbn) -100.7 -7.5 48.6 44.5 14.0 -21.3 -33.4 -61.7 Current account balance (USDbn) 36.8 136.9 193.6 204.6 175.8 152.3 125.5 91.1 Current account balance (% GDP) 0.8 3.1 4.0 4.1 3.5 3.0 2.4 2.0 Net FDI (USDbn) -118.2 -133.2 -137.6 -153.4 -133.3 -199.1 -154.2 -159.9 Net FDI (% GDP) -2.4 -3.0 -2.8 -3.2 -2.7 -3.9 -2.9 -3.0 Current account balance plus FDI (% GDP) -1.7 0.1 1.2 1.0 0.8 -0.9 -0.5 -1.0 Exports, value (% y-o-y) 9.3 1.7 -8.7 12.0 5.4 -8.1 -5.7 0.1 Imports, value (% y-o-y) 10.6 -9.9 -16.7 13.4 10.6 -3.5 -3.9 4.1 International FX reserves (USDbn) 1,261 1,233 1,217 1,264 1,271 1,282 1,319 1,200 Import cover (months) 18.9 23.5 25.0 23.5 21.0 20.4 19.9 17.3 Public and external solvency indicators Gross external debt (USDbn) 3,111.4 2,945.6 3,670.5 3,623.4 4,028.7 4,309.5 4,616.3 4,806.8 Gross external debt (% GDP) 64.0 67.1 74.4 74.6 81.0 83.7 87.1 90.1 Private sector external debt (USDbn) 2,117.1 1,943.7 2,491.8 2,405.6 2,641.5 2,825.6 3,026.9 3,151.7 General government balance (% GDP) -5.6 -3.8 -3.7 -3.2 -3.2 -2.9 -2.2 -1.9 Primary balance (% GDP) -4.8 -3.1 -3.0 -2.7 -2.9 -2.6 -1.9 -1.6 Gross public domestic debt (JPY trn) 1,103.5 1,112.0 1,141.5 1,147.3 1,152.7 1,169.5 1,182.6 1,191.6 Gross public domestic debt (% GDP) 214.7 209.3 213.0 210.5 210.0 210.7 212.4 212.8 Gross public external debt (USDbn) 994.3 1001.9 1178.7 1217.8 1387.1 1483.8 1589.5 1655.1 Gross public external debt (% GDP) 20.5 22.8 23.9 25.1 27.9 28.8 30.0 31.0 Gross public sector debt (% GDP) 236.1 231.6 236.3 235.0 237.2 238.8 241.5 242.9 Macro-prudential indicator Capital adequacy ratio 12.1 12.7 13.3 13.8 14.9 n/a n/a n/a Non-performing loan ratio 1.7 1.5 1.4 1.2 1.3 n/a n/a n/a Household debt/ GDP (%) 57.5 56.8 57.4 57.1 57.3 n/a n/a n/a Total credit/GDP (%) 106.3 105.0 106.5 108.8 111.5 n/a n/a n/a Loan/deposit ratio 68.4 68.8 65.4 64.5 65.0 n/a n/a n/a Stock market capitalisation/GDP (%) 92.1 109.5 97.8 114.7 121.5 n/a n/a n/a
*Includes the effects of government planned VAT hike from 8% to 10% in October 2019; 10-yr yield forecast refers to economists' forecast of mid-point of Yield Curve Control target, not market rate Note: 2021 FX numbers are assumptions, not forecasts Source: CEIC, ADB, IMF, MoF, BoJ, HSBC forecasts
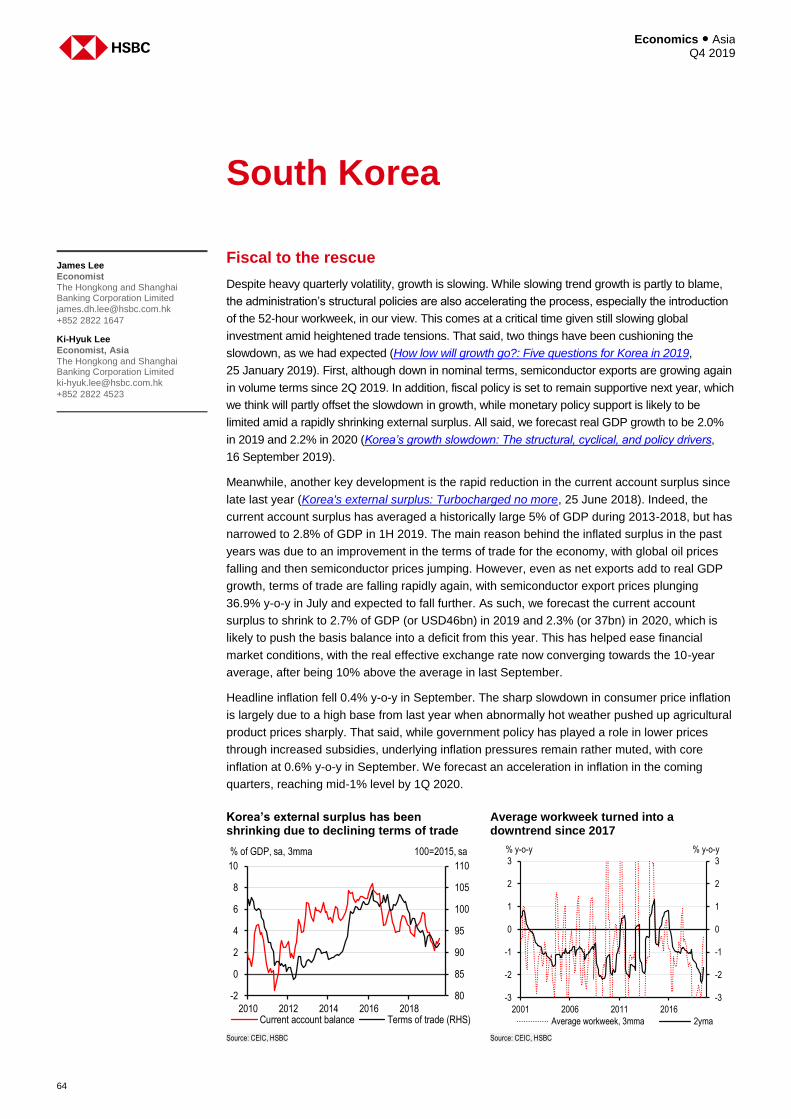
Economics ● Asia Q4 2019
64
South Korea
Fiscal to the rescue
Despite heavy quarterly volatility, growth is slowing. While slowing trend growth is partly to blame,
the administration’s structural policies are also accelerating the process, especially the introduction
of the 52-hour workweek, in our view. This comes at a critical time given still slowing global
investment amid heightened trade tensions. That said, two things have been cushioning the
slowdown, as we had expected (How low will growth go?: Five questions for Korea in 2019,
25 January 2019). First, although down in nominal terms, semiconductor exports are growing again
in volume terms since 2Q 2019. In addition, fiscal policy is set to remain supportive next year, which
we think will partly offset the slowdown in growth, while monetary policy support is likely to be
limited amid a rapidly shrinking external surplus. All said, we forecast real GDP growth to be 2.0%
in 2019 and 2.2% in 2020 (Korea’s growth slowdown: The structural, cyclical, and policy drivers,
16 September 2019).
Meanwhile, another key development is the rapid reduction in the current account surplus since
late last year (Korea's external surplus: Turbocharged no more, 25 June 2018). Indeed, the
current account surplus has averaged a historically large 5% of GDP during 2013-2018, but has
narrowed to 2.8% of GDP in 1H 2019. The main reason behind the inflated surplus in the past
years was due to an improvement in the terms of trade for the economy, with global oil prices
falling and then semiconductor prices jumping. However, even as net exports add to real GDP
growth, terms of trade are falling rapidly again, with semiconductor export prices plunging
36.9% y-o-y in July and expected to fall further. As such, we forecast the current account
surplus to shrink to 2.7% of GDP (or USD46bn) in 2019 and 2.3% (or 37bn) in 2020, which is
likely to push the basis balance into a deficit from this year. This has helped ease financial
market conditions, with the real effective exchange rate now converging towards the 10-year
average, after being 10% above the average in last September.
Headline inflation fell 0.4% y-o-y in September. The sharp slowdown in consumer price inflation
is largely due to a high base from last year when abnormally hot weather pushed up agricultural
product prices sharply. That said, while government policy has played a role in lower prices
through increased subsidies, underlying inflation pressures remain rather muted, with core
inflation at 0.6% y-o-y in September. We forecast an acceleration in inflation in the coming
quarters, reaching mid-1% level by 1Q 2020.
James Lee
Economist The Hongkong and Shanghai Banking Corporation Limited
+852 2822 1647
Ki-Hyuk Lee
Economist, Asia
The Hongkong and Shanghai Banking Corporation Limited
+852 2822 4523
Korea’s external surplus has been shrinking due to declining terms of trade
Average workweek turned into a downtrend since 2017
Source: CEIC, HSBC Source: CEIC, HSBC
80
85
90
95
100
105
110
-2
0
2
4
6
8
10
2010 2012 2014 2016 2018Current account balance Terms of trade (RHS)
% of GDP, sa, 3mma 100=2015, sa
-3
-2
-1
0
1
2
3
-3
-2
-1
0
1
2
3
2001 2006 2011 2016
% y-o-y% y-o-y
Average workweek, 3mma 2yma
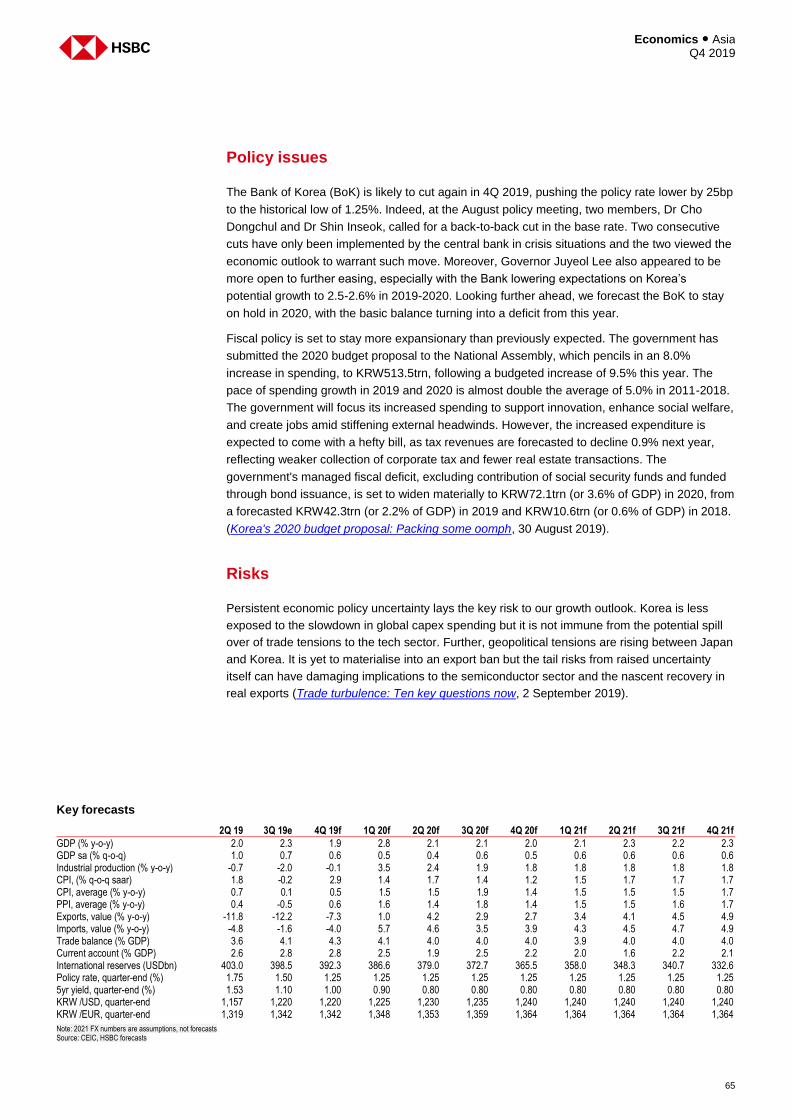
65
Economics ● Asia Q4 2019
Policy issues
The Bank of Korea (BoK) is likely to cut again in 4Q 2019, pushing the policy rate lower by 25bp
to the historical low of 1.25%. Indeed, at the August policy meeting, two members, Dr Cho
Dongchul and Dr Shin Inseok, called for a back-to-back cut in the base rate. Two consecutive
cuts have only been implemented by the central bank in crisis situations and the two viewed the
economic outlook to warrant such move. Moreover, Governor Juyeol Lee also appeared to be
more open to further easing, especially with the Bank lowering expectations on Korea’s
potential growth to 2.5-2.6% in 2019-2020. Looking further ahead, we forecast the BoK to stay
on hold in 2020, with the basic balance turning into a deficit from this year.
Fiscal policy is set to stay more expansionary than previously expected. The government has
submitted the 2020 budget proposal to the National Assembly, which pencils in an 8.0%
increase in spending, to KRW513.5trn, following a budgeted increase of 9.5% this year. The
pace of spending growth in 2019 and 2020 is almost double the average of 5.0% in 2011-2018.
The government will focus its increased spending to support innovation, enhance social welfare,
and create jobs amid stiffening external headwinds. However, the increased expenditure is
expected to come with a hefty bill, as tax revenues are forecasted to decline 0.9% next year,
reflecting weaker collection of corporate tax and fewer real estate transactions. The
government's managed fiscal deficit, excluding contribution of social security funds and funded
through bond issuance, is set to widen materially to KRW72.1trn (or 3.6% of GDP) in 2020, from
a forecasted KRW42.3trn (or 2.2% of GDP) in 2019 and KRW10.6trn (or 0.6% of GDP) in 2018.
(Korea's 2020 budget proposal: Packing some oomph, 30 August 2019).
Risks
Persistent economic policy uncertainty lays the key risk to our growth outlook. Korea is less
exposed to the slowdown in global capex spending but it is not immune from the potential spill
over of trade tensions to the tech sector. Further, geopolitical tensions are rising between Japan
and Korea. It is yet to materialise into an export ban but the tail risks from raised uncertainty
itself can have damaging implications to the semiconductor sector and the nascent recovery in
real exports (Trade turbulence: Ten key questions now, 2 September 2019).
Key forecasts
2Q 19 3Q 19e 4Q 19f 1Q 20f 2Q 20f 3Q 20f 4Q 20f 1Q 21f 2Q 21f 3Q 21f 4Q 21f
GDP (% y-o-y) 2.0 2.3 1.9 2.8 2.1 2.1 2.0 2.1 2.3 2.2 2.3 GDP sa (% q-o-q) 1.0 0.7 0.6 0.5 0.4 0.6 0.5 0.6 0.6 0.6 0.6 Industrial production (% y-o-y) -0.7 -2.0 -0.1 3.5 2.4 1.9 1.8 1.8 1.8 1.8 1.8 CPI, (% q-o-q saar) 1.8 -0.2 2.9 1.4 1.7 1.4 1.2 1.5 1.7 1.7 1.7 CPI, average (% y-o-y) 0.7 0.1 0.5 1.5 1.5 1.9 1.4 1.5 1.5 1.5 1.7 PPI, average (% y-o-y) 0.4 -0.5 0.6 1.6 1.4 1.8 1.4 1.5 1.5 1.6 1.7 Exports, value (% y-o-y) -11.8 -12.2 -7.3 1.0 4.2 2.9 2.7 3.4 4.1 4.5 4.9 Imports, value (% y-o-y) -4.8 -1.6 -4.0 5.7 4.6 3.5 3.9 4.3 4.5 4.7 4.9 Trade balance (% GDP) 3.6 4.1 4.3 4.1 4.0 4.0 4.0 3.9 4.0 4.0 4.0 Current account (% GDP) 2.6 2.8 2.8 2.5 1.9 2.5 2.2 2.0 1.6 2.2 2.1 International reserves (USDbn) 403.0 398.5 392.3 386.6 379.0 372.7 365.5 358.0 348.3 340.7 332.6 Policy rate, quarter-end (%) 1.75 1.50 1.25 1.25 1.25 1.25 1.25 1.25 1.25 1.25 1.25 5yr yield, quarter-end (%) 1.53 1.10 1.00 0.90 0.80 0.80 0.80 0.80 0.80 0.80 0.80 KRW /USD, quarter-end 1,157 1,220 1,220 1,225 1,230 1,235 1,240 1,240 1,240 1,240 1,240 KRW /EUR, quarter-end 1,319 1,342 1,342 1,348 1,353 1,359 1,364 1,364 1,364 1,364 1,364
Note: 2021 FX numbers are assumptions, not forecasts Source: CEIC, HSBC forecasts
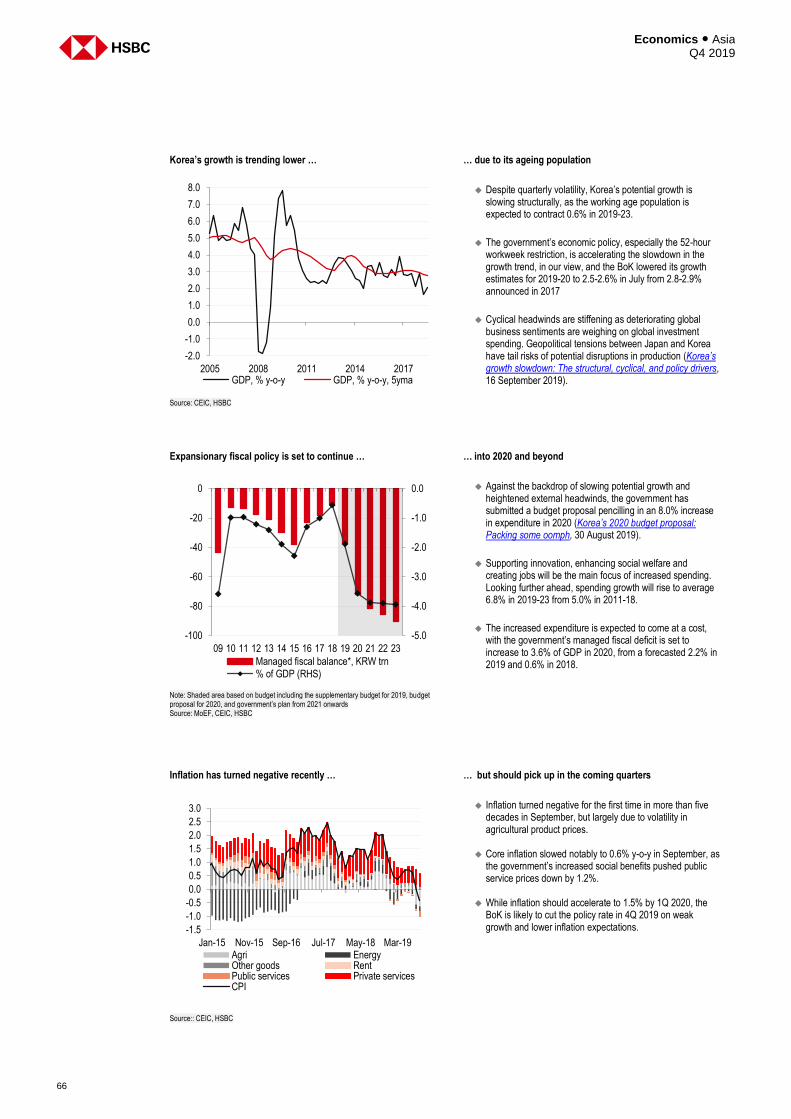
Economics ● Asia Q4 2019
66
Korea’s growth is trending lower … … due to its ageing population
Despite quarterly volatility, Korea’s potential growth is
slowing structurally, as the working age population is expected to contract 0.6% in 2019-23.
The government’s economic policy, especially the 52-hour workweek restriction, is accelerating the slowdown in the growth trend, in our view, and the BoK lowered its growth estimates for 2019-20 to 2.5-2.6% in July from 2.8-2.9% announced in 2017
Cyclical headwinds are stiffening as deteriorating global business sentiments are weighing on global investment spending. Geopolitical tensions between Japan and Korea have tail risks of potential disruptions in production (Korea’s growth slowdown: The structural, cyclical, and policy drivers, 16 September 2019).
Source: CEIC, HSBC
Expansionary fiscal policy is set to continue … … into 2020 and beyond
Against the backdrop of slowing potential growth and
heightened external headwinds, the government has submitted a budget proposal pencilling in an 8.0% increase in expenditure in 2020 (Korea’s 2020 budget proposal: Packing some oomph, 30 August 2019).
Supporting innovation, enhancing social welfare and creating jobs will be the main focus of increased spending. Looking further ahead, spending growth will rise to average 6.8% in 2019-23 from 5.0% in 2011-18.
The increased expenditure is expected to come at a cost, with the government’s managed fiscal deficit is set to increase to 3.6% of GDP in 2020, from a forecasted 2.2% in 2019 and 0.6% in 2018.
Note: Shaded area based on budget including the supplementary budget for 2019, budget proposal for 2020, and government’s plan from 2021 onwards Source: MoEF, CEIC, HSBC
Inflation has turned negative recently … … but should pick up in the coming quarters
Inflation turned negative for the first time in more than five
decades in September, but largely due to volatility in agricultural product prices.
Core inflation slowed notably to 0.6% y-o-y in September, as the government’s increased social benefits pushed public service prices down by 1.2%.
While inflation should accelerate to 1.5% by 1Q 2020, the BoK is likely to cut the policy rate in 4Q 2019 on weak growth and lower inflation expectations.
Source:: CEIC, HSBC
-2.0
-1.0
0.0
1.0
2.0
3.0
4.0
5.0
6.0
7.0
8.0
2005 2008 2011 2014 2017GDP, % y-o-y GDP, % y-o-y, 5yma
-5.0
-4.0
-3.0
-2.0
-1.0
0.0
-100
-80
-60
-40
-20
0
09 10 11 12 13 14 15 16 17 18 19 20 21 22 23
Managed fiscal balance*, KRW trn% of GDP (RHS)
-1.5
-1.0
-0.5
0.0
0.5
1.0
1.5
2.0
2.5
3.0
Jan-15 Nov-15 Sep-16 Jul-17 May-18 Mar-19Agri EnergyOther goods RentPublic services Private servicesCPI
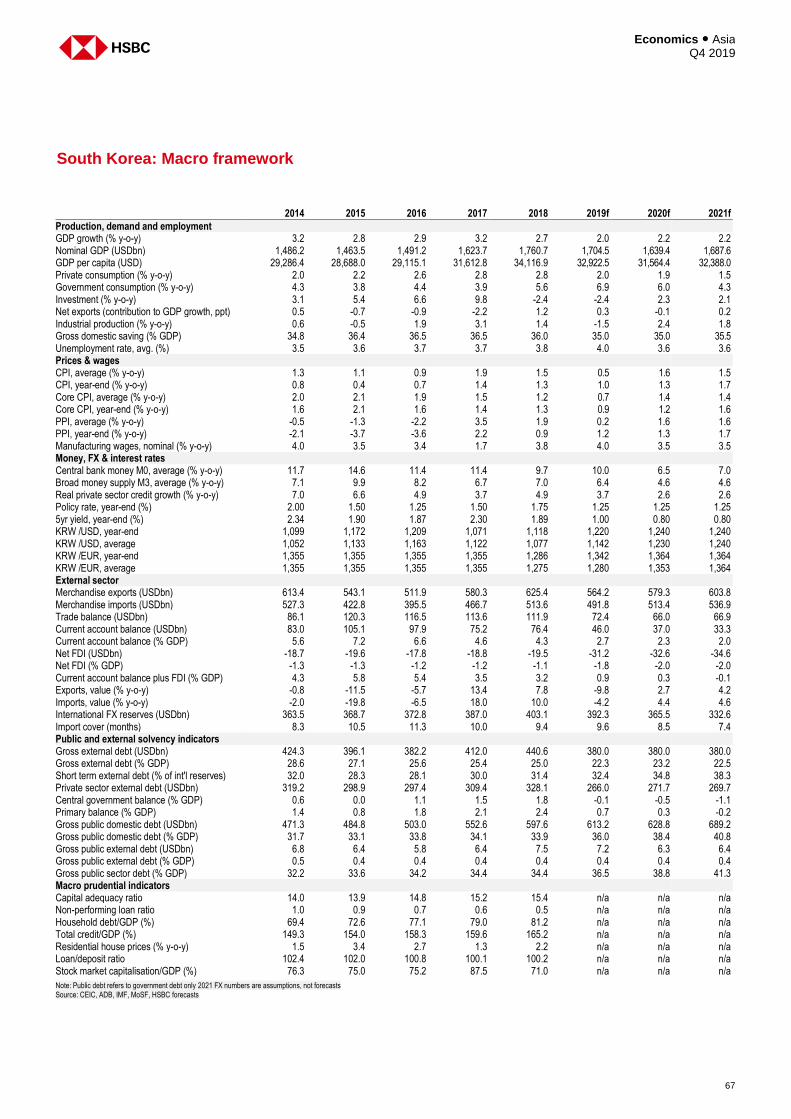
67
Economics ● Asia Q4 2019
South Korea: Macro framework
2014 2015 2016 2017 2018 2019f 2020f 2021f
Production, demand and employment GDP growth (% y-o-y) 3.2 2.8 2.9 3.2 2.7 2.0 2.2 2.2 Nominal GDP (USDbn) 1,486.2 1,463.5 1,491.2 1,623.7 1,760.7 1,704.5 1,639.4 1,687.6 GDP per capita (USD) 29,286.4 28,688.0 29,115.1 31,612.8 34,116.9 32,922.5 31,564.4 32,388.0 Private consumption (% y-o-y) 2.0 2.2 2.6 2.8 2.8 2.0 1.9 1.5 Government consumption (% y-o-y) 4.3 3.8 4.4 3.9 5.6 6.9 6.0 4.3 Investment (% y-o-y) 3.1 5.4 6.6 9.8 -2.4 -2.4 2.3 2.1 Net exports (contribution to GDP growth, ppt) 0.5 -0.7 -0.9 -2.2 1.2 0.3 -0.1 0.2 Industrial production (% y-o-y) 0.6 -0.5 1.9 3.1 1.4 -1.5 2.4 1.8 Gross domestic saving (% GDP) 34.8 36.4 36.5 36.5 36.0 35.0 35.0 35.5 Unemployment rate, avg. (%) 3.5 3.6 3.7 3.7 3.8 4.0 3.6 3.6 Prices & wages CPI, average (% y-o-y) 1.3 1.1 0.9 1.9 1.5 0.5 1.6 1.5 CPI, year-end (% y-o-y) 0.8 0.4 0.7 1.4 1.3 1.0 1.3 1.7 Core CPI, average (% y-o-y) 2.0 2.1 1.9 1.5 1.2 0.7 1.4 1.4 Core CPI, year-end (% y-o-y) 1.6 2.1 1.6 1.4 1.3 0.9 1.2 1.6 PPI, average (% y-o-y) -0.5 -1.3 -2.2 3.5 1.9 0.2 1.6 1.6 PPI, year-end (% y-o-y) -2.1 -3.7 -3.6 2.2 0.9 1.2 1.3 1.7 Manufacturing wages, nominal (% y-o-y) 4.0 3.5 3.4 1.7 3.8 4.0 3.5 3.5 Money, FX & interest rates Central bank money M0, average (% y-o-y) 11.7 14.6 11.4 11.4 9.7 10.0 6.5 7.0 Broad money supply M3, average (% y-o-y) 7.1 9.9 8.2 6.7 7.0 6.4 4.6 4.6 Real private sector credit growth (% y-o-y) 7.0 6.6 4.9 3.7 4.9 3.7 2.6 2.6 Policy rate, year-end (%) 2.00 1.50 1.25 1.50 1.75 1.25 1.25 1.25 5yr yield, year-end (%) 2.34 1.90 1.87 2.30 1.89 1.00 0.80 0.80 KRW /USD, year-end 1,099 1,172 1,209 1,071 1,118 1,220 1,240 1,240 KRW /USD, average 1,052 1,133 1,163 1,122 1,077 1,142 1,230 1,240 KRW /EUR, year-end 1,355 1,355 1,355 1,355 1,286 1,342 1,364 1,364 KRW /EUR, average 1,355 1,355 1,355 1,355 1,275 1,280 1,353 1,364 External sector Merchandise exports (USDbn) 613.4 543.1 511.9 580.3 625.4 564.2 579.3 603.8 Merchandise imports (USDbn) 527.3 422.8 395.5 466.7 513.6 491.8 513.4 536.9 Trade balance (USDbn) 86.1 120.3 116.5 113.6 111.9 72.4 66.0 66.9 Current account balance (USDbn) 83.0 105.1 97.9 75.2 76.4 46.0 37.0 33.3 Current account balance (% GDP) 5.6 7.2 6.6 4.6 4.3 2.7 2.3 2.0 Net FDI (USDbn) -18.7 -19.6 -17.8 -18.8 -19.5 -31.2 -32.6 -34.6 Net FDI (% GDP) -1.3 -1.3 -1.2 -1.2 -1.1 -1.8 -2.0 -2.0 Current account balance plus FDI (% GDP) 4.3 5.8 5.4 3.5 3.2 0.9 0.3 -0.1 Exports, value (% y-o-y) -0.8 -11.5 -5.7 13.4 7.8 -9.8 2.7 4.2 Imports, value (% y-o-y) -2.0 -19.8 -6.5 18.0 10.0 -4.2 4.4 4.6 International FX reserves (USDbn) 363.5 368.7 372.8 387.0 403.1 392.3 365.5 332.6 Import cover (months) 8.3 10.5 11.3 10.0 9.4 9.6 8.5 7.4 Public and external solvency indicators Gross external debt (USDbn) 424.3 396.1 382.2 412.0 440.6 380.0 380.0 380.0 Gross external debt (% GDP) 28.6 27.1 25.6 25.4 25.0 22.3 23.2 22.5 Short term external debt (% of int'l reserves) 32.0 28.3 28.1 30.0 31.4 32.4 34.8 38.3 Private sector external debt (USDbn) 319.2 298.9 297.4 309.4 328.1 266.0 271.7 269.7 Central government balance (% GDP) 0.6 0.0 1.1 1.5 1.8 -0.1 -0.5 -1.1 Primary balance (% GDP) 1.4 0.8 1.8 2.1 2.4 0.7 0.3 -0.2 Gross public domestic debt (USDbn) 471.3 484.8 503.0 552.6 597.6 613.2 628.8 689.2 Gross public domestic debt (% GDP) 31.7 33.1 33.8 34.1 33.9 36.0 38.4 40.8 Gross public external debt (USDbn) 6.8 6.4 5.8 6.4 7.5 7.2 6.3 6.4 Gross public external debt (% GDP) 0.5 0.4 0.4 0.4 0.4 0.4 0.4 0.4 Gross public sector debt (% GDP) 32.2 33.6 34.2 34.4 34.4 36.5 38.8 41.3 Macro prudential indicators Capital adequacy ratio 14.0 13.9 14.8 15.2 15.4 n/a n/a n/a Non-performing loan ratio 1.0 0.9 0.7 0.6 0.5 n/a n/a n/a Household debt/GDP (%) 69.4 72.6 77.1 79.0 81.2 n/a n/a n/a Total credit/GDP (%) 149.3 154.0 158.3 159.6 165.2 n/a n/a n/a Residential house prices (% y-o-y) 1.5 3.4 2.7 1.3 2.2 n/a n/a n/a Loan/deposit ratio 102.4 102.0 100.8 100.1 100.2 n/a n/a n/a Stock market capitalisation/GDP (%) 76.3 75.0 75.2 87.5 71.0 n/a n/a n/a
Note: Public debt refers to government debt only 2021 FX numbers are assumptions, not forecasts Source: CEIC, ADB, IMF, MoSF, HSBC forecasts
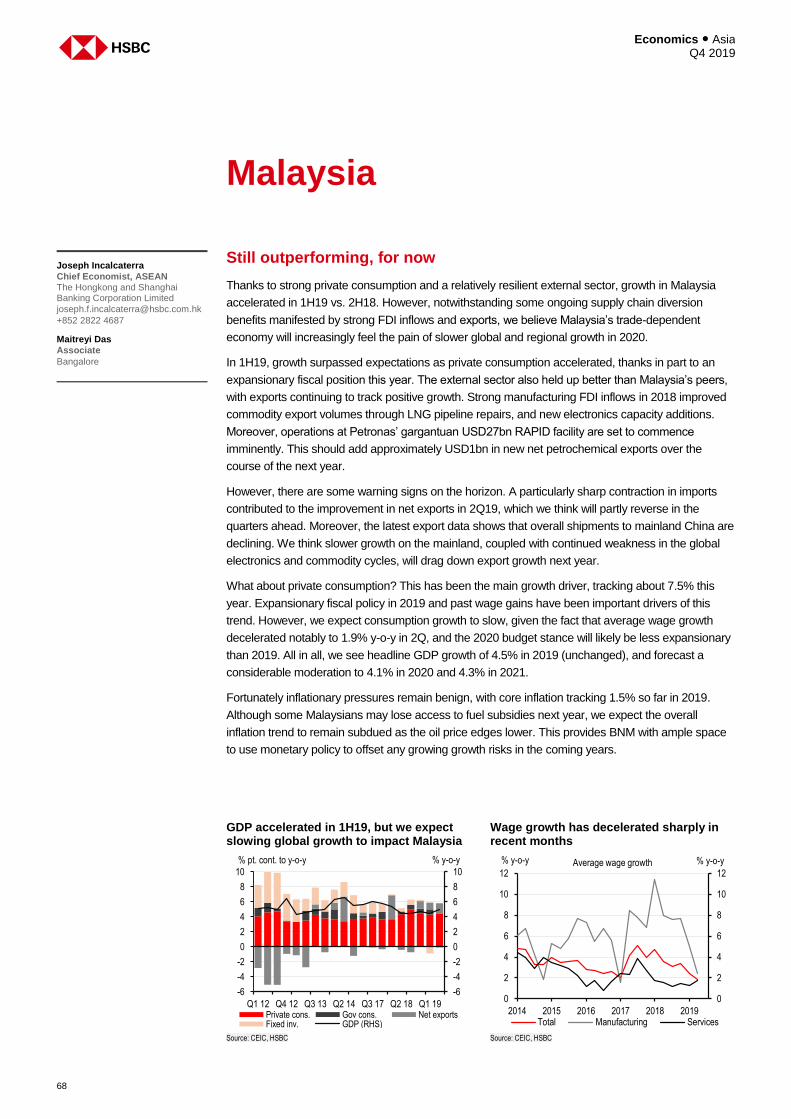
Economics ● Asia Q4 2019
68
Malaysia
Still outperforming, for now
Thanks to strong private consumption and a relatively resilient external sector, growth in Malaysia
accelerated in 1H19 vs. 2H18. However, notwithstanding some ongoing supply chain diversion
benefits manifested by strong FDI inflows and exports, we believe Malaysia’s trade-dependent
economy will increasingly feel the pain of slower global and regional growth in 2020.
In 1H19, growth surpassed expectations as private consumption accelerated, thanks in part to an
expansionary fiscal position this year. The external sector also held up better than Malaysia’s peers,
with exports continuing to track positive growth. Strong manufacturing FDI inflows in 2018 improved
commodity export volumes through LNG pipeline repairs, and new electronics capacity additions.
Moreover, operations at Petronas’ gargantuan USD27bn RAPID facility are set to commence
imminently. This should add approximately USD1bn in new net petrochemical exports over the
course of the next year.
However, there are some warning signs on the horizon. A particularly sharp contraction in imports
contributed to the improvement in net exports in 2Q19, which we think will partly reverse in the
quarters ahead. Moreover, the latest export data shows that overall shipments to mainland China are
declining. We think slower growth on the mainland, coupled with continued weakness in the global
electronics and commodity cycles, will drag down export growth next year.
What about private consumption? This has been the main growth driver, tracking about 7.5% this
year. Expansionary fiscal policy in 2019 and past wage gains have been important drivers of this
trend. However, we expect consumption growth to slow, given the fact that average wage growth
decelerated notably to 1.9% y-o-y in 2Q, and the 2020 budget stance will likely be less expansionary
than 2019. All in all, we see headline GDP growth of 4.5% in 2019 (unchanged), and forecast a
considerable moderation to 4.1% in 2020 and 4.3% in 2021.
Fortunately inflationary pressures remain benign, with core inflation tracking 1.5% so far in 2019.
Although some Malaysians may lose access to fuel subsidies next year, we expect the overall
inflation trend to remain subdued as the oil price edges lower. This provides BNM with ample space
to use monetary policy to offset any growing growth risks in the coming years.
Joseph Incalcaterra
Chief Economist, ASEAN The Hongkong and Shanghai Banking Corporation Limited
+852 2822 4687
Maitreyi Das
Associate
Bangalore
GDP accelerated in 1H19, but we expect slowing global growth to impact Malaysia
Wage growth has decelerated sharply in recent months
Source: CEIC, HSBC Source: CEIC, HSBC
-6
-4
-2
0
2
4
6
8
10
-6
-4
-2
0
2
4
6
8
10
Q1 12 Q4 12 Q3 13 Q2 14 Q3 17 Q2 18 Q1 19
% y-o-y% pt. cont. to y-o-y
Private cons. Gov cons. Net exportsFixed inv. GDP (RHS)
0
2
4
6
8
10
12
0
2
4
6
8
10
12
2014 2015 2016 2017 2018 2019
% y-o-y% y-o-y
Total Manufacturing Services
Average wage growth
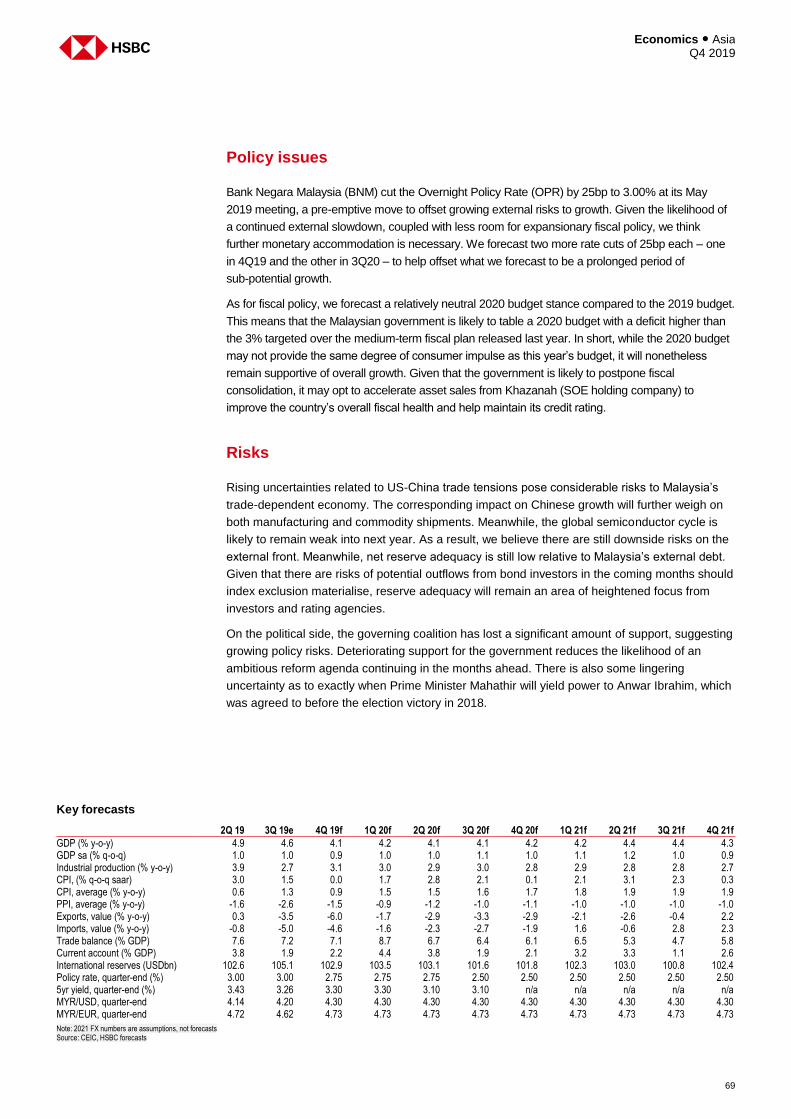
69
Economics ● Asia Q4 2019
Policy issues
Bank Negara Malaysia (BNM) cut the Overnight Policy Rate (OPR) by 25bp to 3.00% at its May
2019 meeting, a pre-emptive move to offset growing external risks to growth. Given the likelihood of
a continued external slowdown, coupled with less room for expansionary fiscal policy, we think
further monetary accommodation is necessary. We forecast two more rate cuts of 25bp each – one
in 4Q19 and the other in 3Q20 – to help offset what we forecast to be a prolonged period of
sub-potential growth.
As for fiscal policy, we forecast a relatively neutral 2020 budget stance compared to the 2019 budget.
This means that the Malaysian government is likely to table a 2020 budget with a deficit higher than
the 3% targeted over the medium-term fiscal plan released last year. In short, while the 2020 budget
may not provide the same degree of consumer impulse as this year’s budget, it will nonetheless
remain supportive of overall growth. Given that the government is likely to postpone fiscal
consolidation, it may opt to accelerate asset sales from Khazanah (SOE holding company) to
improve the country’s overall fiscal health and help maintain its credit rating.
Risks
Rising uncertainties related to US-China trade tensions pose considerable risks to Malaysia’s
trade-dependent economy. The corresponding impact on Chinese growth will further weigh on
both manufacturing and commodity shipments. Meanwhile, the global semiconductor cycle is
likely to remain weak into next year. As a result, we believe there are still downside risks on the
external front. Meanwhile, net reserve adequacy is still low relative to Malaysia’s external debt.
Given that there are risks of potential outflows from bond investors in the coming months should
index exclusion materialise, reserve adequacy will remain an area of heightened focus from
investors and rating agencies.
On the political side, the governing coalition has lost a significant amount of support, suggesting
growing policy risks. Deteriorating support for the government reduces the likelihood of an
ambitious reform agenda continuing in the months ahead. There is also some lingering
uncertainty as to exactly when Prime Minister Mahathir will yield power to Anwar Ibrahim, which
was agreed to before the election victory in 2018.
Key forecasts
2Q 19 3Q 19e 4Q 19f 1Q 20f 2Q 20f 3Q 20f 4Q 20f 1Q 21f 2Q 21f 3Q 21f 4Q 21f
GDP (% y-o-y) 4.9 4.6 4.1 4.2 4.1 4.1 4.2 4.2 4.4 4.4 4.3 GDP sa (% q-o-q) 1.0 1.0 0.9 1.0 1.0 1.1 1.0 1.1 1.2 1.0 0.9 Industrial production (% y-o-y) 3.9 2.7 3.1 3.0 2.9 3.0 2.8 2.9 2.8 2.8 2.7 CPI, (% q-o-q saar) 3.0 1.5 0.0 1.7 2.8 2.1 0.1 2.1 3.1 2.3 0.3 CPI, average (% y-o-y) 0.6 1.3 0.9 1.5 1.5 1.6 1.7 1.8 1.9 1.9 1.9 PPI, average (% y-o-y) -1.6 -2.6 -1.5 -0.9 -1.2 -1.0 -1.1 -1.0 -1.0 -1.0 -1.0 Exports, value (% y-o-y) 0.3 -3.5 -6.0 -1.7 -2.9 -3.3 -2.9 -2.1 -2.6 -0.4 2.2 Imports, value (% y-o-y) -0.8 -5.0 -4.6 -1.6 -2.3 -2.7 -1.9 1.6 -0.6 2.8 2.3 Trade balance (% GDP) 7.6 7.2 7.1 8.7 6.7 6.4 6.1 6.5 5.3 4.7 5.8 Current account (% GDP) 3.8 1.9 2.2 4.4 3.8 1.9 2.1 3.2 3.3 1.1 2.6 International reserves (USDbn) 102.6 105.1 102.9 103.5 103.1 101.6 101.8 102.3 103.0 100.8 102.4 Policy rate, quarter-end (%) 3.00 3.00 2.75 2.75 2.75 2.50 2.50 2.50 2.50 2.50 2.50 5yr yield, quarter-end (%) 3.43 3.26 3.30 3.30 3.10 3.10 n/a n/a n/a n/a n/a MYR/USD, quarter-end 4.14 4.20 4.30 4.30 4.30 4.30 4.30 4.30 4.30 4.30 4.30 MYR/EUR, quarter-end 4.72 4.62 4.73 4.73 4.73 4.73 4.73 4.73 4.73 4.73 4.73
Note: 2021 FX numbers are assumptions, not forecasts Source: CEIC, HSBC forecasts
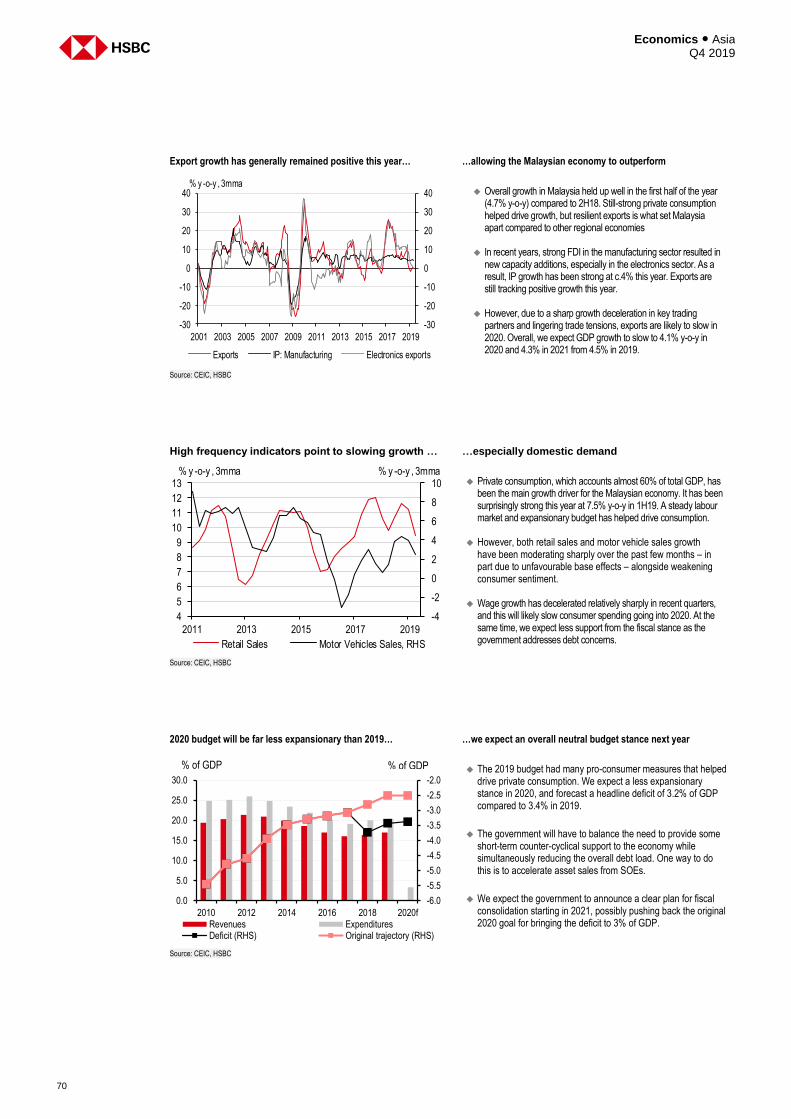
Economics ● Asia Q4 2019
70
Export growth has generally remained positive this year… …allowing the Malaysian economy to outperform
Overall growth in Malaysia held up well in the first half of the year
(4.7% y-o-y) compared to 2H18. Still-strong private consumption helped drive growth, but resilient exports is what set Malaysia apart compared to other regional economies
In recent years, strong FDI in the manufacturing sector resulted in
new capacity additions, especially in the electronics sector. As a result, IP growth has been strong at c.4% this year. Exports are still tracking positive growth this year.
However, due to a sharp growth deceleration in key trading
partners and lingering trade tensions, exports are likely to slow in 2020. Overall, we expect GDP growth to slow to 4.1% y-o-y in 2020 and 4.3% in 2021 from 4.5% in 2019.
Source: CEIC, HSBC
High frequency indicators point to slowing growth … …especially domestic demand
Private consumption, which accounts almost 60% of total GDP, has
been the main growth driver for the Malaysian economy. It has been surprisingly strong this year at 7.5% y-o-y in 1H19. A steady labour market and expansionary budget has helped drive consumption.
However, both retail sales and motor vehicle sales growth have been moderating sharply over the past few months – in part due to unfavourable base effects – alongside weakening consumer sentiment.
Wage growth has decelerated relatively sharply in recent quarters,
and this will likely slow consumer spending going into 2020. At the same time, we expect less support from the fiscal stance as the government addresses debt concerns.
Source: CEIC, HSBC
2020 budget will be far less expansionary than 2019… …we expect an overall neutral budget stance next year
The 2019 budget had many pro-consumer measures that helped
drive private consumption. We expect a less expansionary stance in 2020, and forecast a headline deficit of 3.2% of GDP compared to 3.4% in 2019.
The government will have to balance the need to provide some short-term counter-cyclical support to the economy while simultaneously reducing the overall debt load. One way to do this is to accelerate asset sales from SOEs.
We expect the government to announce a clear plan for fiscal consolidation starting in 2021, possibly pushing back the original 2020 goal for bringing the deficit to 3% of GDP.
Source: CEIC, HSBC
-30
-20
-10
0
10
20
30
40
-30
-20
-10
0
10
20
30
40
2001 2003 2005 2007 2009 2011 2013 2015 2017 2019
% y -o-y , 3mma
Exports IP: Manufacturing Electronics exports
-4
-2
0
2
4
6
8
10
4
5
6
7
8
9
10
11
12
13
2011 2013 2015 2017 2019
% y -o-y , 3mma% y -o-y , 3mma
Retail Sales Motor Vehicles Sales, RHS
-6.0
-5.5
-5.0
-4.5
-4.0
-3.5
-3.0
-2.5
-2.0
0.0
5.0
10.0
15.0
20.0
25.0
30.0
2010 2012 2014 2016 2018 2020fRevenues ExpendituresDeficit (RHS) Original trajectory (RHS)
% of GDP% of GDP

71
Economics ● Asia Q4 2019
Malaysia: Macro framework
2014 2015 2016 2017 2018 2019f 2020f 2021f
Production, demand and employment GDP growth (% y-o-y) 6.0 5.0 4.4 5.7 4.7 4.5 4.1 4.3 Nominal GDP (USDbn) 343.0 301.5 301.8 319.1 358.8 364.9 373.3 396.0 GDP per capita (USD) 11,014.1 9,515.5 9,397.3 9,832.6 10,948.5 11,113.4 11,199.9 11,592.5 Private consumption (% y-o-y) 7.0 6.2 5.9 6.9 8.0 7.5 6.3 6.9 Government consumption (% y-o-y) 4.4 4.4 1.1 5.5 3.3 1.8 1.4 1.8 Investment (% y-o-y) 4.8 3.8 2.6 6.1 1.4 -1.5 1.9 2.5 Net exports (contribution to GDP growth, ppt) 1.1 -0.2 0.0 -0.3 0.8 0.7 -0.1 -0.4 Industrial production (% y-o-y) 5.2 4.4 4.1 4.4 3.0 3.1 2.9 2.8 Gross domestic saving (% GDP) 35.2 33.8 32.5 32.2 31.5 31.8 30.5 28.9 Unemployment rate, year-end (%) 2.8 3.2 3.5 3.4 3.3 3.5 3.6 3.3 Prices & wages CPI, average (% y-o-y) 3.1 2.1 2.1 3.8 1.0 0.6 1.6 1.9 CPI, year-end (% y-o-y) 2.7 2.7 1.7 3.5 0.2 0.9 1.7 2.0 Core CPI, average (% y-o-y) n/a n/a 2.5 2.3 0.8 1.0 1.2 1.5 Core CPI, year-end (% y-o-y) n/a n/a 2.0 2.2 0.4 1.0 1.3 1.6 PPI, average (% y-o-y) 1.2 -4.8 -1.1 6.7 -1.1 -2.0 -1.0 -1.0 PPI, year-end (% y-o-y) -4.5 -2.5 6.5 0.3 -3.7 0.2 -1.0 -1.0 Manufacturing wages, nominal (% y-o-y) 4.7 5.9 6.3 6.1 8.6 3.2 2.8 3.1 Money, FX & interest rates Central bank money M0, year-end (% y-o-y) 7.7 10.1 2.9 4.3 5.5 3.8 3.6 4.6 Broad money supply M3, average (% y-o-y) 6.1 5.4 2.5 4.9 7.3 4.1 3.8 4.8 Real private sector credit growth (% y-o-y) 6.8 5.5 4.3 0.3 6.9 3.5 2.4 3.2 Policy rate, year-end (%) 3.25 3.25 3.00 3.00 3.25 2.75 2.50 2.50 5yr yield, year-end (%) 3.84 3.47 3.70 3.56 3.78 3.30 n/a n/a MYR/USD, year-end 3.50 4.29 4.49 4.06 4.14 4.30 4.30 4.30 MYR/USD, average 3.27 3.90 4.14 4.30 4.03 4.16 4.30 4.30 MYR/EUR, year-end 4.23 4.68 4.71 4.87 4.76 4.73 4.73 4.73 MYR/EUR, average 4.34 4.35 4.60 4.85 4.77 4.67 4.73 4.73 External sector Merchandise exports (USDbn) 207.5 174.5 165.9 186.4 206.5 195.1 183.8 182.5 Merchandise imports (USDbn) 172.9 146.5 141.2 159.2 177.0 166.7 158.0 160.4 Trade balance (USDbn) 34.6 28.0 24.6 27.2 29.6 28.4 25.8 22.2 Current account balance (USDbn) 14.8 9.0 7.2 8.9 7.6 11.2 11.2 10.1 Current account balance (% GDP) 4.3 3.0 2.4 2.8 2.1 3.1 3.0 2.5 Net FDI (USDbn) -5.5 -0.5 3.3 3.8 2.8 4.0 3.0 2.6 Net FDI (% GDP) -1.6 -0.2 1.1 1.2 0.8 1.1 0.8 0.7 Current account balance plus FDI (% GDP) 2.7 2.8 3.5 4.0 2.9 4.2 3.8 3.2 Exports, value (% y-o-y) 6.5 0.4 0.8 16.7 3.9 -2.5 -2.7 -0.7 Imports, value (% y-o-y) 4.5 1.2 2.2 17.0 4.3 -2.7 -2.1 1.5 International FX reserves (USDbn) 120.5 95.5 98.2 99.7 100.6 102.9 101.8 102.4 Import cover (months) 8.4 7.8 8.3 7.5 6.8 7.4 7.7 7.7 Public and external solvency indicators Gross external debt (USDbn) 228.6 214.4 220.8 205.9 229.4 233.2 237.1 249.0 Gross external debt (% GDP) 67.6 72.2 74.3 65.4 64.7 63.9 63.5 62.9 Short term external debt (% of int'l reserves) 92.3 94.4 93.0 82.1 99.9 99.3 102.1 106.6 Private sector external debt (USDbn) 177.2 163.8 170.1 158.8 n/a n/a n/a n/a Central government balance (% GDP) -3.3 -3.2 -3.1 -2.9 -3.7 -3.4 -3.2 -3.0 Primary balance (% GDP) -1.3 -1.1 -1.0 -0.9 -1.6 -0.9 -0.7 -0.6 Government domestic debt (MYRbn) 414.7 433.1 438.2 484.1 562.2 552.2 586.5 586.5 Government domestic debt (% GDP) 37.5 37.4 35.6 35.8 39.3 36.3 36.5 34.4 Government external debt (USDbn) 51.4 50.6 50.8 47.2 44.3 56.8 58.5 58.5 Government external debt (% GDP) 15.2 17.0 17.1 15.0 12.5 15.6 15.7 14.8 Government debt (% GDP) 52.7 54.4 52.7 50.7 51.8 51.9 52.2 49.2 Macro-prudential indicators Capital adequacy ratio 15.9 16.7 17.0 17.8 18.1 n/a n/a n/a Non-performing loan ratio 6.6 5.9 5.6 5.1 4.4 n/a n/a n/a Household debt/GDP (%) 86.1 88.4 87.8 83.8 83.0 n/a n/a n/a Total credit/GDP (%)* 119.1 122.9 121.8 115.5 116.4 n/a n/a n/a Residential house prices (% y-o-y) 9.4 7.4 7.0 6.5 3.3 n/a n/a n/a Loan/deposit ratio 80.1 84.6 87.6 87.7 85.6 n/a n/a n/a Stock market capitalisation/GDP (%) 142.5 137.7 123.2 133.4 111.9 n/a n/a n/a
*Credit refers to Banking System loans Note: 2021 FX numbers are assumptions, not forecasts Source: CEIC, ADB, BNM, HSBC forecasts
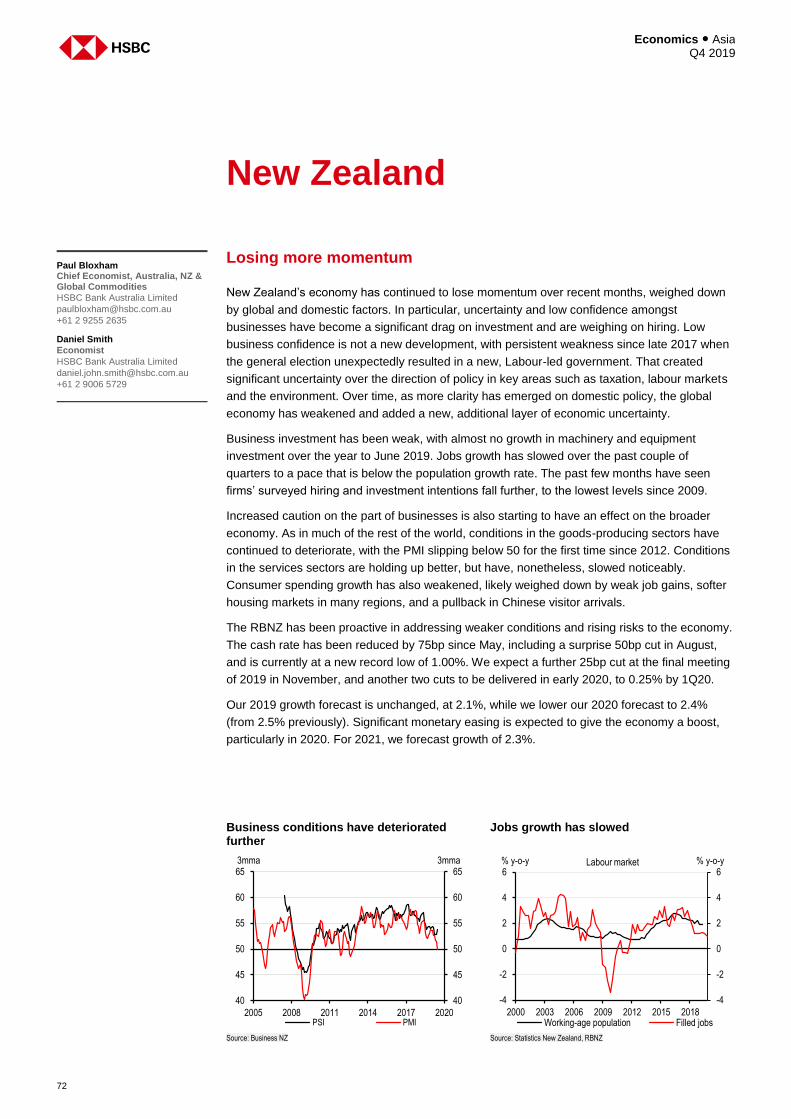
Economics ● Asia Q4 2019
72
New Zealand
Losing more momentum
New Zealand’s economy has continued to lose momentum over recent months, weighed down
by global and domestic factors. In particular, uncertainty and low confidence amongst
businesses have become a significant drag on investment and are weighing on hiring. Low
business confidence is not a new development, with persistent weakness since late 2017 when
the general election unexpectedly resulted in a new, Labour-led government. That created
significant uncertainty over the direction of policy in key areas such as taxation, labour markets
and the environment. Over time, as more clarity has emerged on domestic policy, the global
economy has weakened and added a new, additional layer of economic uncertainty.
Business investment has been weak, with almost no growth in machinery and equipment
investment over the year to June 2019. Jobs growth has slowed over the past couple of
quarters to a pace that is below the population growth rate. The past few months have seen
firms’ surveyed hiring and investment intentions fall further, to the lowest levels since 2009.
Increased caution on the part of businesses is also starting to have an effect on the broader
economy. As in much of the rest of the world, conditions in the goods-producing sectors have
continued to deteriorate, with the PMI slipping below 50 for the first time since 2012. Conditions
in the services sectors are holding up better, but have, nonetheless, slowed noticeably.
Consumer spending growth has also weakened, likely weighed down by weak job gains, softer
housing markets in many regions, and a pullback in Chinese visitor arrivals.
The RBNZ has been proactive in addressing weaker conditions and rising risks to the economy.
The cash rate has been reduced by 75bp since May, including a surprise 50bp cut in August,
and is currently at a new record low of 1.00%. We expect a further 25bp cut at the final meeting
of 2019 in November, and another two cuts to be delivered in early 2020, to 0.25% by 1Q20.
Our 2019 growth forecast is unchanged, at 2.1%, while we lower our 2020 forecast to 2.4%
(from 2.5% previously). Significant monetary easing is expected to give the economy a boost,
particularly in 2020. For 2021, we forecast growth of 2.3%.
Paul Bloxham Chief Economist, Australia, NZ & Global Commodities
HSBC Bank Australia Limited
+61 2 9255 2635
Daniel Smith
Economist
HSBC Bank Australia Limited
+61 2 9006 5729
Business conditions have deteriorated further
Jobs growth has slowed
Source: Business NZ Source: Statistics New Zealand, RBNZ
40
45
50
55
60
65
40
45
50
55
60
65
2005 2008 2011 2014 2017 2020
3mma 3mma
PSI PMI
-4
-2
0
2
4
6
-4
-2
0
2
4
6
2000 2003 2006 2009 2012 2015 2018
% y-o-y% y-o-y
Working-age population Filled jobs
Labour market
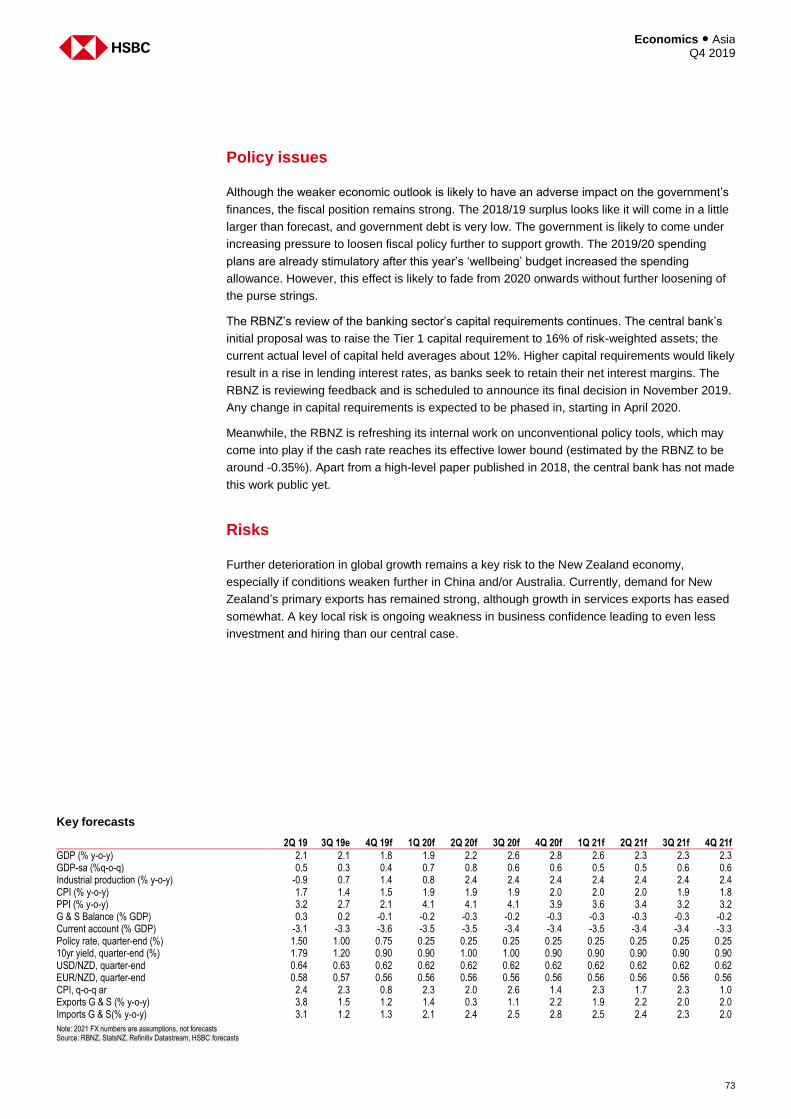
73
Economics ● Asia Q4 2019
Policy issues
Although the weaker economic outlook is likely to have an adverse impact on the government’s
finances, the fiscal position remains strong. The 2018/19 surplus looks like it will come in a little
larger than forecast, and government debt is very low. The government is likely to come under
increasing pressure to loosen fiscal policy further to support growth. The 2019/20 spending
plans are already stimulatory after this year’s ‘wellbeing’ budget increased the spending
allowance. However, this effect is likely to fade from 2020 onwards without further loosening of
the purse strings.
The RBNZ’s review of the banking sector’s capital requirements continues. The central bank’s
initial proposal was to raise the Tier 1 capital requirement to 16% of risk-weighted assets; the
current actual level of capital held averages about 12%. Higher capital requirements would likely
result in a rise in lending interest rates, as banks seek to retain their net interest margins. The
RBNZ is reviewing feedback and is scheduled to announce its final decision in November 2019.
Any change in capital requirements is expected to be phased in, starting in April 2020.
Meanwhile, the RBNZ is refreshing its internal work on unconventional policy tools, which may
come into play if the cash rate reaches its effective lower bound (estimated by the RBNZ to be
around -0.35%). Apart from a high-level paper published in 2018, the central bank has not made
this work public yet.
Risks
Further deterioration in global growth remains a key risk to the New Zealand economy,
especially if conditions weaken further in China and/or Australia. Currently, demand for New
Zealand’s primary exports has remained strong, although growth in services exports has eased
somewhat. A key local risk is ongoing weakness in business confidence leading to even less
investment and hiring than our central case.
Key forecasts
2Q 19 3Q 19e 4Q 19f 1Q 20f 2Q 20f 3Q 20f 4Q 20f 1Q 21f 2Q 21f 3Q 21f 4Q 21f
GDP (% y-o-y) 2.1 2.1 1.8 1.9 2.2 2.6 2.8 2.6 2.3 2.3 2.3 GDP-sa (%q-o-q) 0.5 0.3 0.4 0.7 0.8 0.6 0.6 0.5 0.5 0.6 0.6 Industrial production (% y-o-y) -0.9 0.7 1.4 0.8 2.4 2.4 2.4 2.4 2.4 2.4 2.4 CPI (% y-o-y) 1.7 1.4 1.5 1.9 1.9 1.9 2.0 2.0 2.0 1.9 1.8 PPI (% y-o-y) 3.2 2.7 2.1 4.1 4.1 4.1 3.9 3.6 3.4 3.2 3.2 G & S Balance (% GDP) 0.3 0.2 -0.1 -0.2 -0.3 -0.2 -0.3 -0.3 -0.3 -0.3 -0.2 Current account (% GDP) -3.1 -3.3 -3.6 -3.5 -3.5 -3.4 -3.4 -3.5 -3.4 -3.4 -3.3 Policy rate, quarter-end (%) 1.50 1.00 0.75 0.25 0.25 0.25 0.25 0.25 0.25 0.25 0.25 10yr yield, quarter-end (%) 1.79 1.20 0.90 0.90 1.00 1.00 0.90 0.90 0.90 0.90 0.90 USD/NZD, quarter-end 0.64 0.63 0.62 0.62 0.62 0.62 0.62 0.62 0.62 0.62 0.62 EUR/NZD, quarter-end 0.58 0.57 0.56 0.56 0.56 0.56 0.56 0.56 0.56 0.56 0.56 CPI, q-o-q ar 2.4 2.3 0.8 2.3 2.0 2.6 1.4 2.3 1.7 2.3 1.0 Exports G & S (% y-o-y) 3.8 1.5 1.2 1.4 0.3 1.1 2.2 1.9 2.2 2.0 2.0 Imports G & S(% y-o-y) 3.1 1.2 1.3 2.1 2.4 2.5 2.8 2.5 2.4 2.3 2.0
Note: 2021 FX numbers are assumptions, not forecasts Source: RBNZ, StatsNZ, Refinitiv Datastream, HSBC forecasts
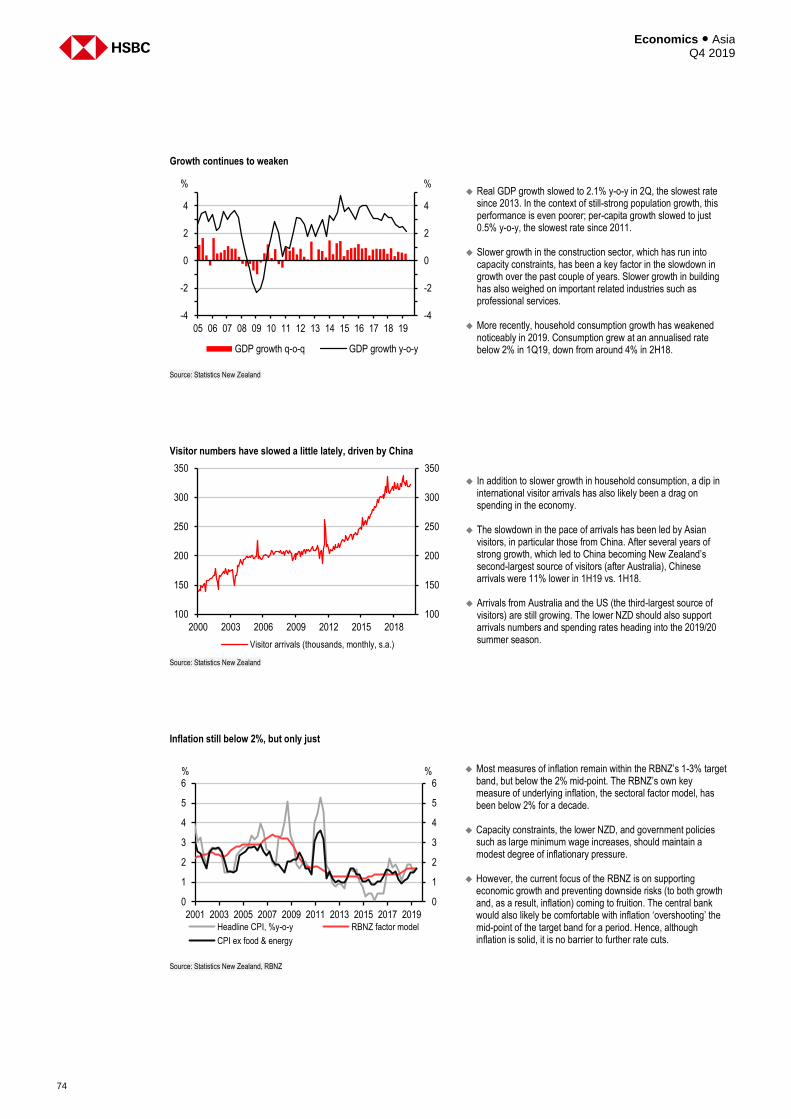
Economics ● Asia Q4 2019
74
Growth continues to weaken
Real GDP growth slowed to 2.1% y-o-y in 2Q, the slowest rate
since 2013. In the context of still-strong population growth, this performance is even poorer; per-capita growth slowed to just 0.5% y-o-y, the slowest rate since 2011.
Slower growth in the construction sector, which has run into
capacity constraints, has been a key factor in the slowdown in growth over the past couple of years. Slower growth in building has also weighed on important related industries such as professional services.
More recently, household consumption growth has weakened
noticeably in 2019. Consumption grew at an annualised rate below 2% in 1Q19, down from around 4% in 2H18.
Source: Statistics New Zealand
Visitor numbers have slowed a little lately, driven by China
In addition to slower growth in household consumption, a dip in
international visitor arrivals has also likely been a drag on spending in the economy.
The slowdown in the pace of arrivals has been led by Asian
visitors, in particular those from China. After several years of strong growth, which led to China becoming New Zealand’s second-largest source of visitors (after Australia), Chinese arrivals were 11% lower in 1H19 vs. 1H18.
Arrivals from Australia and the US (the third-largest source of
visitors) are still growing. The lower NZD should also support arrivals numbers and spending rates heading into the 2019/20 summer season.
Source: Statistics New Zealand
Inflation still below 2%, but only just
Most measures of inflation remain within the RBNZ’s 1-3% target
band, but below the 2% mid-point. The RBNZ’s own key measure of underlying inflation, the sectoral factor model, has been below 2% for a decade.
Capacity constraints, the lower NZD, and government policies
such as large minimum wage increases, should maintain a modest degree of inflationary pressure.
However, the current focus of the RBNZ is on supporting
economic growth and preventing downside risks (to both growth and, as a result, inflation) coming to fruition. The central bank would also likely be comfortable with inflation ‘overshooting’ the mid-point of the target band for a period. Hence, although inflation is solid, it is no barrier to further rate cuts.
Source: Statistics New Zealand, RBNZ
-4
-2
0
2
4
-4
-2
0
2
4
05 06 07 08 09 10 11 12 13 14 15 16 17 18 19
GDP growth q-o-q GDP growth y-o-y
% %
100
150
200
250
300
350
100
150
200
250
300
350
2000 2003 2006 2009 2012 2015 2018
Tho
usan
ds
Tho
usan
ds
Visitor arrivals (thousands, monthly, s.a.)
0
1
2
3
4
5
6
0
1
2
3
4
5
6
2001 2003 2005 2007 2009 2011 2013 2015 2017 2019Headline CPI, %y-o-y RBNZ factor model
CPI ex food & energy
% %
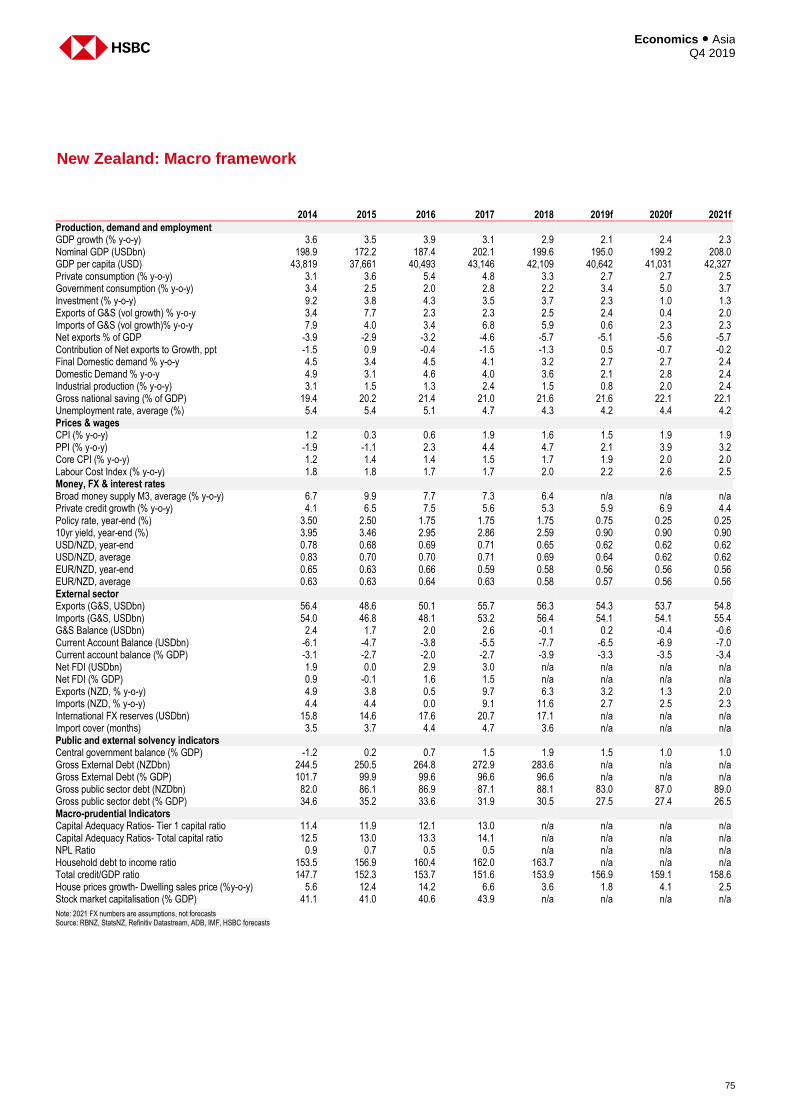
75
Economics ● Asia Q4 2019
New Zealand: Macro framework
2014 2015 2016 2017 2018 2019f 2020f 2021f
Production, demand and employment GDP growth (% y-o-y) 3.6 3.5 3.9 3.1 2.9 2.1 2.4 2.3 Nominal GDP (USDbn) 198.9 172.2 187.4 202.1 199.6 195.0 199.2 208.0 GDP per capita (USD) 43,819 37,661 40,493 43,146 42,109 40,642 41,031 42,327 Private consumption (% y-o-y) 3.1 3.6 5.4 4.8 3.3 2.7 2.7 2.5 Government consumption (% y-o-y) 3.4 2.5 2.0 2.8 2.2 3.4 5.0 3.7 Investment (% y-o-y) 9.2 3.8 4.3 3.5 3.7 2.3 1.0 1.3 Exports of G&S (vol growth) % y-o-y 3.4 7.7 2.3 2.3 2.5 2.4 0.4 2.0 Imports of G&S (vol growth)% y-o-y 7.9 4.0 3.4 6.8 5.9 0.6 2.3 2.3 Net exports % of GDP -3.9 -2.9 -3.2 -4.6 -5.7 -5.1 -5.6 -5.7 Contribution of Net exports to Growth, ppt -1.5 0.9 -0.4 -1.5 -1.3 0.5 -0.7 -0.2 Final Domestic demand % y-o-y 4.5 3.4 4.5 4.1 3.2 2.7 2.7 2.4 Domestic Demand % y-o-y 4.9 3.1 4.6 4.0 3.6 2.1 2.8 2.4 Industrial production (% y-o-y) 3.1 1.5 1.3 2.4 1.5 0.8 2.0 2.4 Gross national saving (% of GDP) 19.4 20.2 21.4 21.0 21.6 21.6 22.1 22.1 Unemployment rate, average (%) 5.4 5.4 5.1 4.7 4.3 4.2 4.4 4.2 Prices & wages CPI (% y-o-y) 1.2 0.3 0.6 1.9 1.6 1.5 1.9 1.9 PPI (% y-o-y) -1.9 -1.1 2.3 4.4 4.7 2.1 3.9 3.2 Core CPI (% y-o-y) 1.2 1.4 1.4 1.5 1.7 1.9 2.0 2.0 Labour Cost Index (% y-o-y) 1.8 1.8 1.7 1.7 2.0 2.2 2.6 2.5 Money, FX & interest rates Broad money supply M3, average (% y-o-y) 6.7 9.9 7.7 7.3 6.4 n/a n/a n/a Private credit growth (% y-o-y) 4.1 6.5 7.5 5.6 5.3 5.9 6.9 4.4 Policy rate, year-end (%) 3.50 2.50 1.75 1.75 1.75 0.75 0.25 0.25 10yr yield, year-end (%) 3.95 3.46 2.95 2.86 2.59 0.90 0.90 0.90 USD/NZD, year-end 0.78 0.68 0.69 0.71 0.65 0.62 0.62 0.62 USD/NZD, average 0.83 0.70 0.70 0.71 0.69 0.64 0.62 0.62 EUR/NZD, year-end 0.65 0.63 0.66 0.59 0.58 0.56 0.56 0.56 EUR/NZD, average 0.63 0.63 0.64 0.63 0.58 0.57 0.56 0.56 External sector Exports (G&S, USDbn) 56.4 48.6 50.1 55.7 56.3 54.3 53.7 54.8 Imports (G&S, USDbn) 54.0 46.8 48.1 53.2 56.4 54.1 54.1 55.4 G&S Balance (USDbn) 2.4 1.7 2.0 2.6 -0.1 0.2 -0.4 -0.6 Current Account Balance (USDbn) -6.1 -4.7 -3.8 -5.5 -7.7 -6.5 -6.9 -7.0 Current account balance (% GDP) -3.1 -2.7 -2.0 -2.7 -3.9 -3.3 -3.5 -3.4 Net FDI (USDbn) 1.9 0.0 2.9 3.0 n/a n/a n/a n/a Net FDI (% GDP) 0.9 -0.1 1.6 1.5 n/a n/a n/a n/a Exports (NZD, % y-o-y) 4.9 3.8 0.5 9.7 6.3 3.2 1.3 2.0 Imports (NZD, % y-o-y) 4.4 4.4 0.0 9.1 11.6 2.7 2.5 2.3 International FX reserves (USDbn) 15.8 14.6 17.6 20.7 17.1 n/a n/a n/a Import cover (months) 3.5 3.7 4.4 4.7 3.6 n/a n/a n/a Public and external solvency indicators Central government balance (% GDP) -1.2 0.2 0.7 1.5 1.9 1.5 1.0 1.0 Gross External Debt (NZDbn) 244.5 250.5 264.8 272.9 283.6 n/a n/a n/a Gross External Debt (% GDP) 101.7 99.9 99.6 96.6 96.6 n/a n/a n/a Gross public sector debt (NZDbn) 82.0 86.1 86.9 87.1 88.1 83.0 87.0 89.0 Gross public sector debt (% GDP) 34.6 35.2 33.6 31.9 30.5 27.5 27.4 26.5 Macro-prudential Indicators Capital Adequacy Ratios- Tier 1 capital ratio 11.4 11.9 12.1 13.0 n/a n/a n/a n/a Capital Adequacy Ratios- Total capital ratio 12.5 13.0 13.3 14.1 n/a n/a n/a n/a NPL Ratio 0.9 0.7 0.5 0.5 n/a n/a n/a n/a Household debt to income ratio 153.5 156.9 160.4 162.0 163.7 n/a n/a n/a Total credit/GDP ratio 147.7 152.3 153.7 151.6 153.9 156.9 159.1 158.6 House prices growth- Dwelling sales price (%y-o-y) 5.6 12.4 14.2 6.6 3.6 1.8 4.1 2.5 Stock market capitalisation (% GDP) 41.1 41.0 40.6 43.9 n/a n/a n/a n/a
Note: 2021 FX numbers are assumptions, not forecasts Source: RBNZ, StatsNZ, Refinitiv Datastream, ADB, IMF, HSBC forecasts
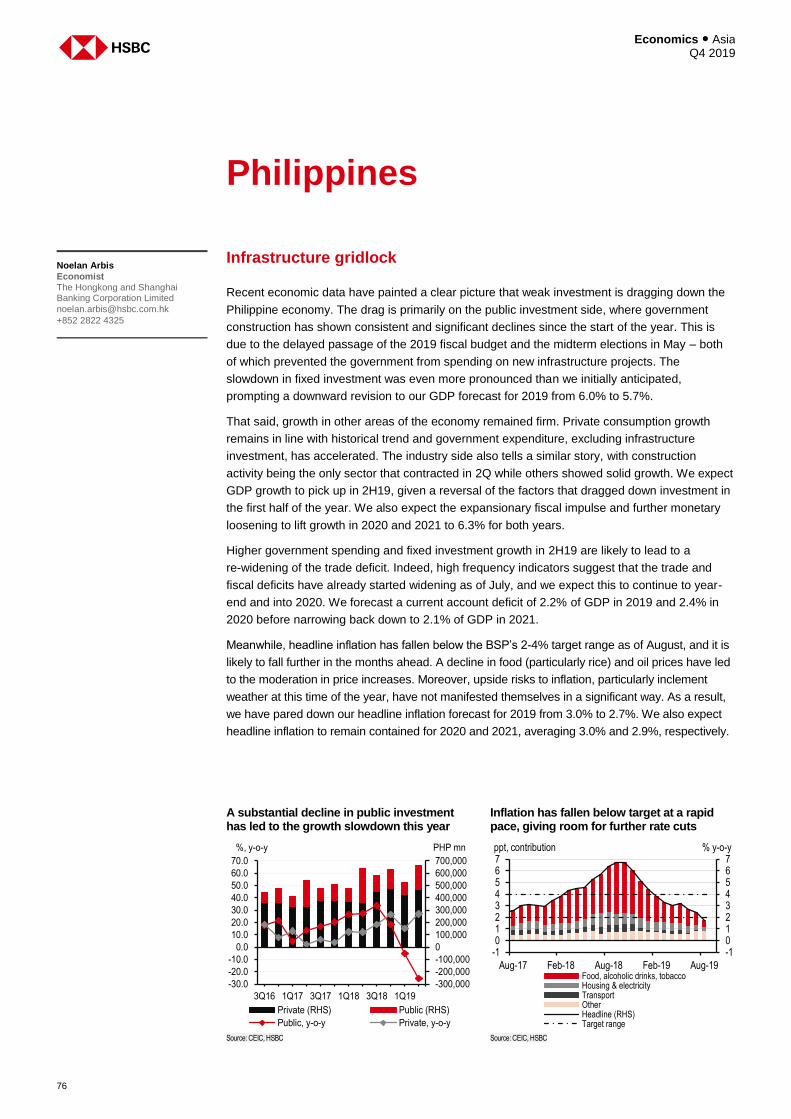
Economics ● Asia Q4 2019
76
Philippines
Infrastructure gridlock
Recent economic data have painted a clear picture that weak investment is dragging down the
Philippine economy. The drag is primarily on the public investment side, where government
construction has shown consistent and significant declines since the start of the year. This is
due to the delayed passage of the 2019 fiscal budget and the midterm elections in May – both
of which prevented the government from spending on new infrastructure projects. The
slowdown in fixed investment was even more pronounced than we initially anticipated,
prompting a downward revision to our GDP forecast for 2019 from 6.0% to 5.7%.
That said, growth in other areas of the economy remained firm. Private consumption growth
remains in line with historical trend and government expenditure, excluding infrastructure
investment, has accelerated. The industry side also tells a similar story, with construction
activity being the only sector that contracted in 2Q while others showed solid growth. We expect
GDP growth to pick up in 2H19, given a reversal of the factors that dragged down investment in
the first half of the year. We also expect the expansionary fiscal impulse and further monetary
loosening to lift growth in 2020 and 2021 to 6.3% for both years.
Higher government spending and fixed investment growth in 2H19 are likely to lead to a
re-widening of the trade deficit. Indeed, high frequency indicators suggest that the trade and
fiscal deficits have already started widening as of July, and we expect this to continue to year-
end and into 2020. We forecast a current account deficit of 2.2% of GDP in 2019 and 2.4% in
2020 before narrowing back down to 2.1% of GDP in 2021.
Meanwhile, headline inflation has fallen below the BSP’s 2-4% target range as of August, and it is
likely to fall further in the months ahead. A decline in food (particularly rice) and oil prices have led
to the moderation in price increases. Moreover, upside risks to inflation, particularly inclement
weather at this time of the year, have not manifested themselves in a significant way. As a result,
we have pared down our headline inflation forecast for 2019 from 3.0% to 2.7%. We also expect
headline inflation to remain contained for 2020 and 2021, averaging 3.0% and 2.9%, respectively.
Noelan Arbis
Economist The Hongkong and Shanghai Banking Corporation Limited
+852 2822 4325
A substantial decline in public investment has led to the growth slowdown this year
Inflation has fallen below target at a rapid pace, giving room for further rate cuts
Source: CEIC, HSBC Source: CEIC, HSBC
-300,000
-200,000
-100,000
0
100,000
200,000
300,000
400,000
500,000
600,000
700,000
-30.0
-20.0
-10.0
0.0
10.0
20.0
30.0
40.0
50.0
60.0
70.0
3Q16 1Q17 3Q17 1Q18 3Q18 1Q19
Private (RHS) Public (RHS)
Public, y-o-y Private, y-o-y
%, y-o-y PHP mn
-101234567
-101234567
Aug-17 Feb-18 Aug-18 Feb-19 Aug-19Food, alcoholic drinks, tobaccoHousing & electricityTransportOtherHeadline (RHS)Target range
% y-o-yppt, contribution
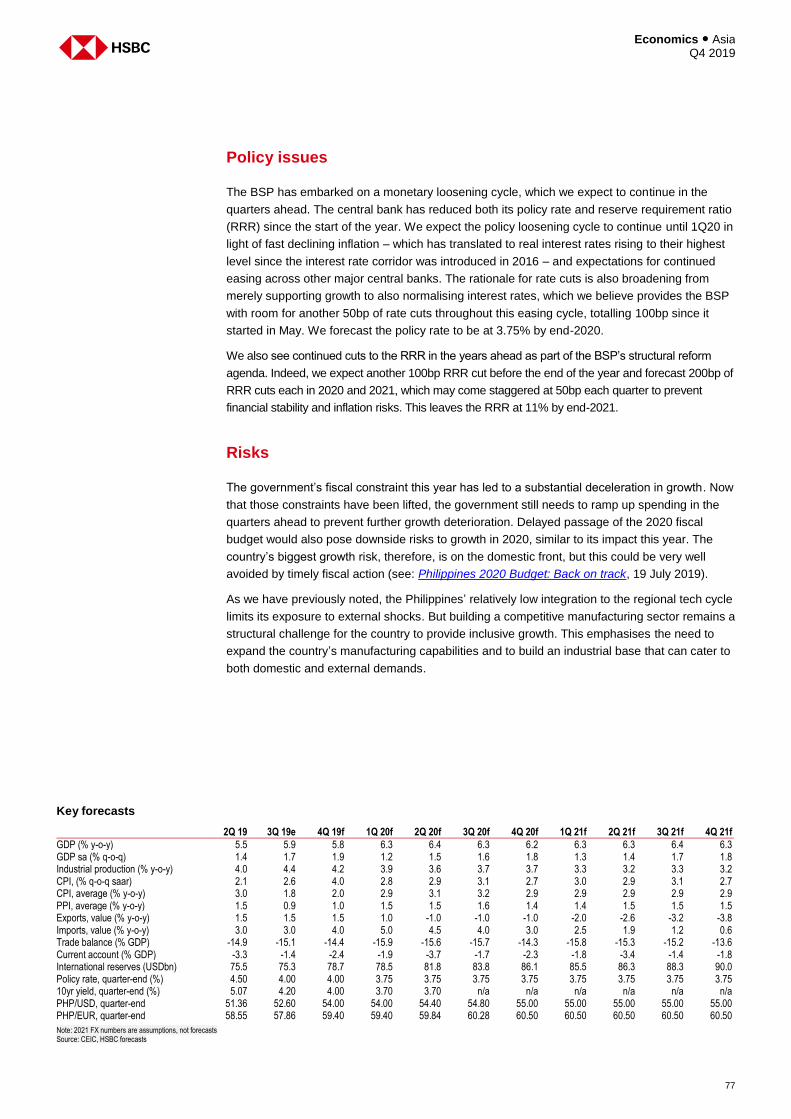
77
Economics ● Asia Q4 2019
Policy issues
The BSP has embarked on a monetary loosening cycle, which we expect to continue in the
quarters ahead. The central bank has reduced both its policy rate and reserve requirement ratio
(RRR) since the start of the year. We expect the policy loosening cycle to continue until 1Q20 in
light of fast declining inflation – which has translated to real interest rates rising to their highest
level since the interest rate corridor was introduced in 2016 – and expectations for continued
easing across other major central banks. The rationale for rate cuts is also broadening from
merely supporting growth to also normalising interest rates, which we believe provides the BSP
with room for another 50bp of rate cuts throughout this easing cycle, totalling 100bp since it
started in May. We forecast the policy rate to be at 3.75% by end-2020.
We also see continued cuts to the RRR in the years ahead as part of the BSP’s structural reform
agenda. Indeed, we expect another 100bp RRR cut before the end of the year and forecast 200bp of
RRR cuts each in 2020 and 2021, which may come staggered at 50bp each quarter to prevent
financial stability and inflation risks. This leaves the RRR at 11% by end-2021.
Risks
The government’s fiscal constraint this year has led to a substantial deceleration in growth. Now
that those constraints have been lifted, the government still needs to ramp up spending in the
quarters ahead to prevent further growth deterioration. Delayed passage of the 2020 fiscal
budget would also pose downside risks to growth in 2020, similar to its impact this year. The
country’s biggest growth risk, therefore, is on the domestic front, but this could be very well
avoided by timely fiscal action (see: Philippines 2020 Budget: Back on track, 19 July 2019).
As we have previously noted, the Philippines’ relatively low integration to the regional tech cycle
limits its exposure to external shocks. But building a competitive manufacturing sector remains a
structural challenge for the country to provide inclusive growth. This emphasises the need to
expand the country’s manufacturing capabilities and to build an industrial base that can cater to
both domestic and external demands.
Key forecasts
2Q 19 3Q 19e 4Q 19f 1Q 20f 2Q 20f 3Q 20f 4Q 20f 1Q 21f 2Q 21f 3Q 21f 4Q 21f
GDP (% y-o-y) 5.5 5.9 5.8 6.3 6.4 6.3 6.2 6.3 6.3 6.4 6.3 GDP sa (% q-o-q) 1.4 1.7 1.9 1.2 1.5 1.6 1.8 1.3 1.4 1.7 1.8 Industrial production (% y-o-y) 4.0 4.4 4.2 3.9 3.6 3.7 3.7 3.3 3.2 3.3 3.2 CPI, (% q-o-q saar) 2.1 2.6 4.0 2.8 2.9 3.1 2.7 3.0 2.9 3.1 2.7 CPI, average (% y-o-y) 3.0 1.8 2.0 2.9 3.1 3.2 2.9 2.9 2.9 2.9 2.9 PPI, average (% y-o-y) 1.5 0.9 1.0 1.5 1.5 1.6 1.4 1.4 1.5 1.5 1.5 Exports, value (% y-o-y) 1.5 1.5 1.5 1.0 -1.0 -1.0 -1.0 -2.0 -2.6 -3.2 -3.8 Imports, value (% y-o-y) 3.0 3.0 4.0 5.0 4.5 4.0 3.0 2.5 1.9 1.2 0.6 Trade balance (% GDP) -14.9 -15.1 -14.4 -15.9 -15.6 -15.7 -14.3 -15.8 -15.3 -15.2 -13.6 Current account (% GDP) -3.3 -1.4 -2.4 -1.9 -3.7 -1.7 -2.3 -1.8 -3.4 -1.4 -1.8 International reserves (USDbn) 75.5 75.3 78.7 78.5 81.8 83.8 86.1 85.5 86.3 88.3 90.0 Policy rate, quarter-end (%) 4.50 4.00 4.00 3.75 3.75 3.75 3.75 3.75 3.75 3.75 3.75 10yr yield, quarter-end (%) 5.07 4.20 4.00 3.70 3.70 n/a n/a n/a n/a n/a n/a PHP/USD, quarter-end 51.36 52.60 54.00 54.00 54.40 54.80 55.00 55.00 55.00 55.00 55.00 PHP/EUR, quarter-end 58.55 57.86 59.40 59.40 59.84 60.28 60.50 60.50 60.50 60.50 60.50
Note: 2021 FX numbers are assumptions, not forecasts Source: CEIC, HSBC forecasts
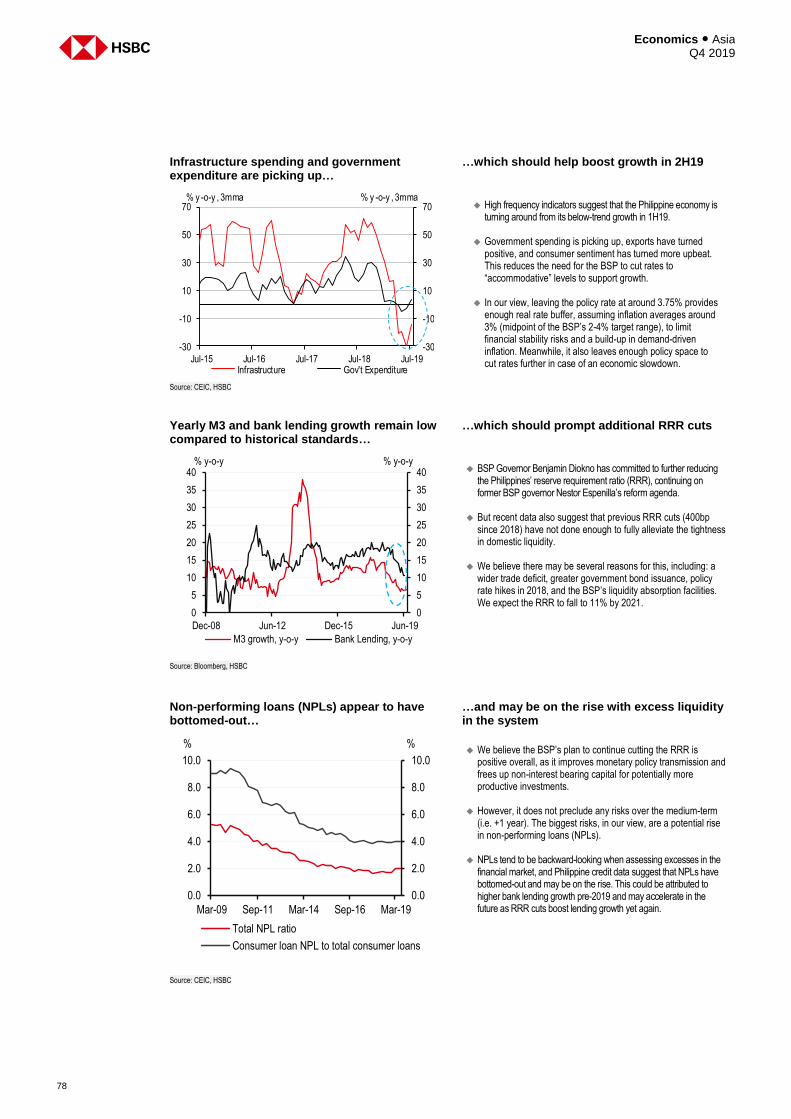
Economics ● Asia Q4 2019
78
Infrastructure spending and government expenditure are picking up…
…which should help boost growth in 2H19
High frequency indicators suggest that the Philippine economy is
turning around from its below-trend growth in 1H19.
Government spending is picking up, exports have turned positive, and consumer sentiment has turned more upbeat. This reduces the need for the BSP to cut rates to “accommodative” levels to support growth.
In our view, leaving the policy rate at around 3.75% provides enough real rate buffer, assuming inflation averages around 3% (midpoint of the BSP’s 2-4% target range), to limit financial stability risks and a build-up in demand-driven inflation. Meanwhile, it also leaves enough policy space to cut rates further in case of an economic slowdown.
Source: CEIC, HSBC
Yearly M3 and bank lending growth remain low compared to historical standards…
…which should prompt additional RRR cuts
BSP Governor Benjamin Diokno has committed to further reducing
the Philippines’ reserve requirement ratio (RRR), continuing on former BSP governor Nestor Espenilla’s reform agenda.
But recent data also suggest that previous RRR cuts (400bp since 2018) have not done enough to fully alleviate the tightness in domestic liquidity.
We believe there may be several reasons for this, including: a
wider trade deficit, greater government bond issuance, policy rate hikes in 2018, and the BSP’s liquidity absorption facilities. We expect the RRR to fall to 11% by 2021.
Source: Bloomberg, HSBC
Non-performing loans (NPLs) appear to have bottomed-out…
…and may be on the rise with excess liquidity in the system
We believe the BSP’s plan to continue cutting the RRR is
positive overall, as it improves monetary policy transmission and frees up non-interest bearing capital for potentially more productive investments.
However, it does not preclude any risks over the medium-term
(i.e. +1 year). The biggest risks, in our view, are a potential rise in non-performing loans (NPLs).
NPLs tend to be backward-looking when assessing excesses in the financial market, and Philippine credit data suggest that NPLs have bottomed-out and may be on the rise. This could be attributed to higher bank lending growth pre-2019 and may accelerate in the future as RRR cuts boost lending growth yet again.
Source: CEIC, HSBC
-30
-10
10
30
50
70
-30
-10
10
30
50
70
Jul-15 Jul-16 Jul-17 Jul-18 Jul-19Infrastructure Gov't Expenditure
% y -o-y , 3mma % y -o-y , 3mma
0
5
10
15
20
25
30
35
40
0
5
10
15
20
25
30
35
40
Dec-08 Jun-12 Dec-15 Jun-19
M3 growth, y-o-y Bank Lending, y-o-y
% y-o-y% y-o-y
0.0
2.0
4.0
6.0
8.0
10.0
0.0
2.0
4.0
6.0
8.0
10.0
Mar-09 Sep-11 Mar-14 Sep-16 Mar-19
Total NPL ratio
Consumer loan NPL to total consumer loans
% %
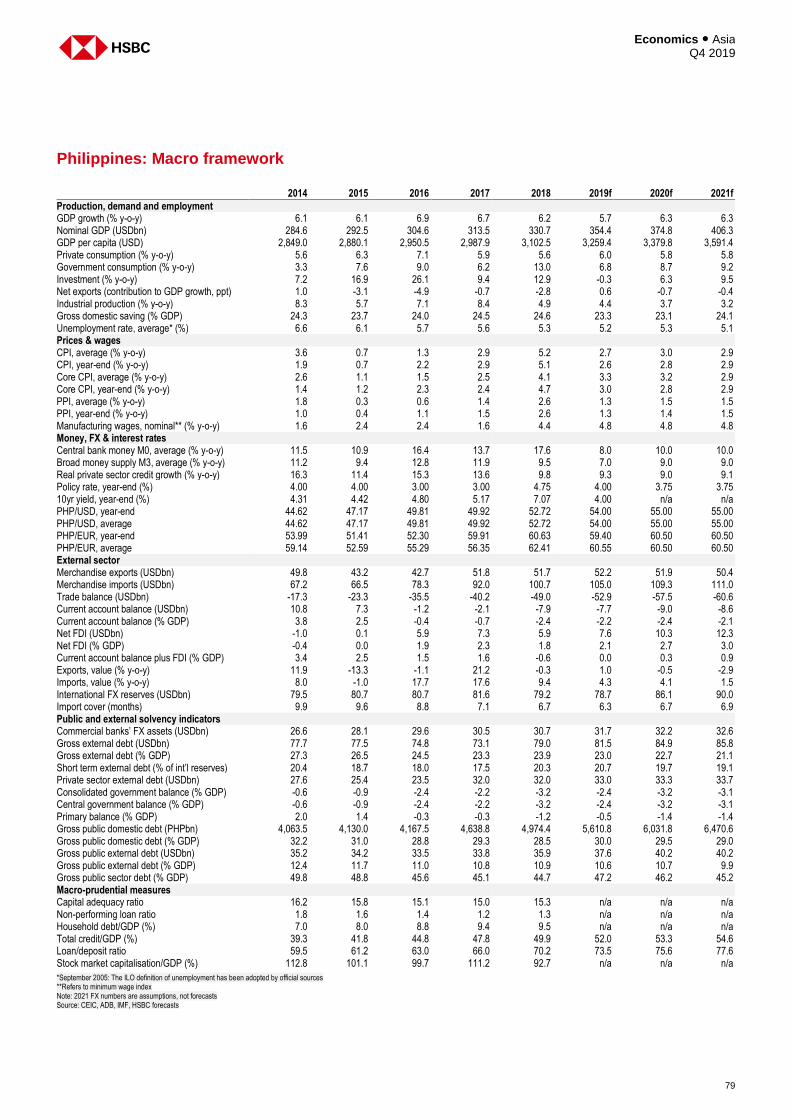
79
Economics ● Asia Q4 2019
Philippines: Macro framework
2014 2015 2016 2017 2018 2019f 2020f 2021f
Production, demand and employment GDP growth (% y-o-y) 6.1 6.1 6.9 6.7 6.2 5.7 6.3 6.3 Nominal GDP (USDbn) 284.6 292.5 304.6 313.5 330.7 354.4 374.8 406.3 GDP per capita (USD) 2,849.0 2,880.1 2,950.5 2,987.9 3,102.5 3,259.4 3,379.8 3,591.4 Private consumption (% y-o-y) 5.6 6.3 7.1 5.9 5.6 6.0 5.8 5.8 Government consumption (% y-o-y) 3.3 7.6 9.0 6.2 13.0 6.8 8.7 9.2 Investment (% y-o-y) 7.2 16.9 26.1 9.4 12.9 -0.3 6.3 9.5 Net exports (contribution to GDP growth, ppt) 1.0 -3.1 -4.9 -0.7 -2.8 0.6 -0.7 -0.4 Industrial production (% y-o-y) 8.3 5.7 7.1 8.4 4.9 4.4 3.7 3.2 Gross domestic saving (% GDP) 24.3 23.7 24.0 24.5 24.6 23.3 23.1 24.1 Unemployment rate, average* (%) 6.6 6.1 5.7 5.6 5.3 5.2 5.3 5.1 Prices & wages CPI, average (% y-o-y) 3.6 0.7 1.3 2.9 5.2 2.7 3.0 2.9 CPI, year-end (% y-o-y) 1.9 0.7 2.2 2.9 5.1 2.6 2.8 2.9 Core CPI, average (% y-o-y) 2.6 1.1 1.5 2.5 4.1 3.3 3.2 2.9 Core CPI, year-end (% y-o-y) 1.4 1.2 2.3 2.4 4.7 3.0 2.8 2.9 PPI, average (% y-o-y) 1.8 0.3 0.6 1.4 2.6 1.3 1.5 1.5 PPI, year-end (% y-o-y) 1.0 0.4 1.1 1.5 2.6 1.3 1.4 1.5 Manufacturing wages, nominal** (% y-o-y) 1.6 2.4 2.4 1.6 4.4 4.8 4.8 4.8 Money, FX & interest rates Central bank money M0, average (% y-o-y) 11.5 10.9 16.4 13.7 17.6 8.0 10.0 10.0 Broad money supply M3, average (% y-o-y) 11.2 9.4 12.8 11.9 9.5 7.0 9.0 9.0 Real private sector credit growth (% y-o-y) 16.3 11.4 15.3 13.6 9.8 9.3 9.0 9.1 Policy rate, year-end (%) 4.00 4.00 3.00 3.00 4.75 4.00 3.75 3.75 10yr yield, year-end (%) 4.31 4.42 4.80 5.17 7.07 4.00 n/a n/a PHP/USD, year-end 44.62 47.17 49.81 49.92 52.72 54.00 55.00 55.00 PHP/USD, average 44.62 47.17 49.81 49.92 52.72 54.00 55.00 55.00 PHP/EUR, year-end 53.99 51.41 52.30 59.91 60.63 59.40 60.50 60.50 PHP/EUR, average 59.14 52.59 55.29 56.35 62.41 60.55 60.50 60.50 External sector Merchandise exports (USDbn) 49.8 43.2 42.7 51.8 51.7 52.2 51.9 50.4 Merchandise imports (USDbn) 67.2 66.5 78.3 92.0 100.7 105.0 109.3 111.0 Trade balance (USDbn) -17.3 -23.3 -35.5 -40.2 -49.0 -52.9 -57.5 -60.6 Current account balance (USDbn) 10.8 7.3 -1.2 -2.1 -7.9 -7.7 -9.0 -8.6 Current account balance (% GDP) 3.8 2.5 -0.4 -0.7 -2.4 -2.2 -2.4 -2.1 Net FDI (USDbn) -1.0 0.1 5.9 7.3 5.9 7.6 10.3 12.3 Net FDI (% GDP) -0.4 0.0 1.9 2.3 1.8 2.1 2.7 3.0 Current account balance plus FDI (% GDP) 3.4 2.5 1.5 1.6 -0.6 0.0 0.3 0.9 Exports, value (% y-o-y) 11.9 -13.3 -1.1 21.2 -0.3 1.0 -0.5 -2.9 Imports, value (% y-o-y) 8.0 -1.0 17.7 17.6 9.4 4.3 4.1 1.5 International FX reserves (USDbn) 79.5 80.7 80.7 81.6 79.2 78.7 86.1 90.0 Import cover (months) 9.9 9.6 8.8 7.1 6.7 6.3 6.7 6.9 Public and external solvency indicators Commercial banks’ FX assets (USDbn) 26.6 28.1 29.6 30.5 30.7 31.7 32.2 32.6 Gross external debt (USDbn) 77.7 77.5 74.8 73.1 79.0 81.5 84.9 85.8 Gross external debt (% GDP) 27.3 26.5 24.5 23.3 23.9 23.0 22.7 21.1 Short term external debt (% of int’l reserves) 20.4 18.7 18.0 17.5 20.3 20.7 19.7 19.1 Private sector external debt (USDbn) 27.6 25.4 23.5 32.0 32.0 33.0 33.3 33.7 Consolidated government balance (% GDP) -0.6 -0.9 -2.4 -2.2 -3.2 -2.4 -3.2 -3.1 Central government balance (% GDP) -0.6 -0.9 -2.4 -2.2 -3.2 -2.4 -3.2 -3.1 Primary balance (% GDP) 2.0 1.4 -0.3 -0.3 -1.2 -0.5 -1.4 -1.4 Gross public domestic debt (PHPbn) 4,063.5 4,130.0 4,167.5 4,638.8 4,974.4 5,610.8 6,031.8 6,470.6 Gross public domestic debt (% GDP) 32.2 31.0 28.8 29.3 28.5 30.0 29.5 29.0 Gross public external debt (USDbn) 35.2 34.2 33.5 33.8 35.9 37.6 40.2 40.2 Gross public external debt (% GDP) 12.4 11.7 11.0 10.8 10.9 10.6 10.7 9.9 Gross public sector debt (% GDP) 49.8 48.8 45.6 45.1 44.7 47.2 46.2 45.2 Macro-prudential measures Capital adequacy ratio 16.2 15.8 15.1 15.0 15.3 n/a n/a n/a Non-performing loan ratio 1.8 1.6 1.4 1.2 1.3 n/a n/a n/a Household debt/GDP (%) 7.0 8.0 8.8 9.4 9.5 n/a n/a n/a Total credit/GDP (%) 39.3 41.8 44.8 47.8 49.9 52.0 53.3 54.6 Loan/deposit ratio 59.5 61.2 63.0 66.0 70.2 73.5 75.6 77.6 Stock market capitalisation/GDP (%) 112.8 101.1 99.7 111.2 92.7 n/a n/a n/a
*September 2005: The ILO definition of unemployment has been adopted by official sources **Refers to minimum wage index Note: 2021 FX numbers are assumptions, not forecasts Source: CEIC, ADB, IMF, HSBC forecasts
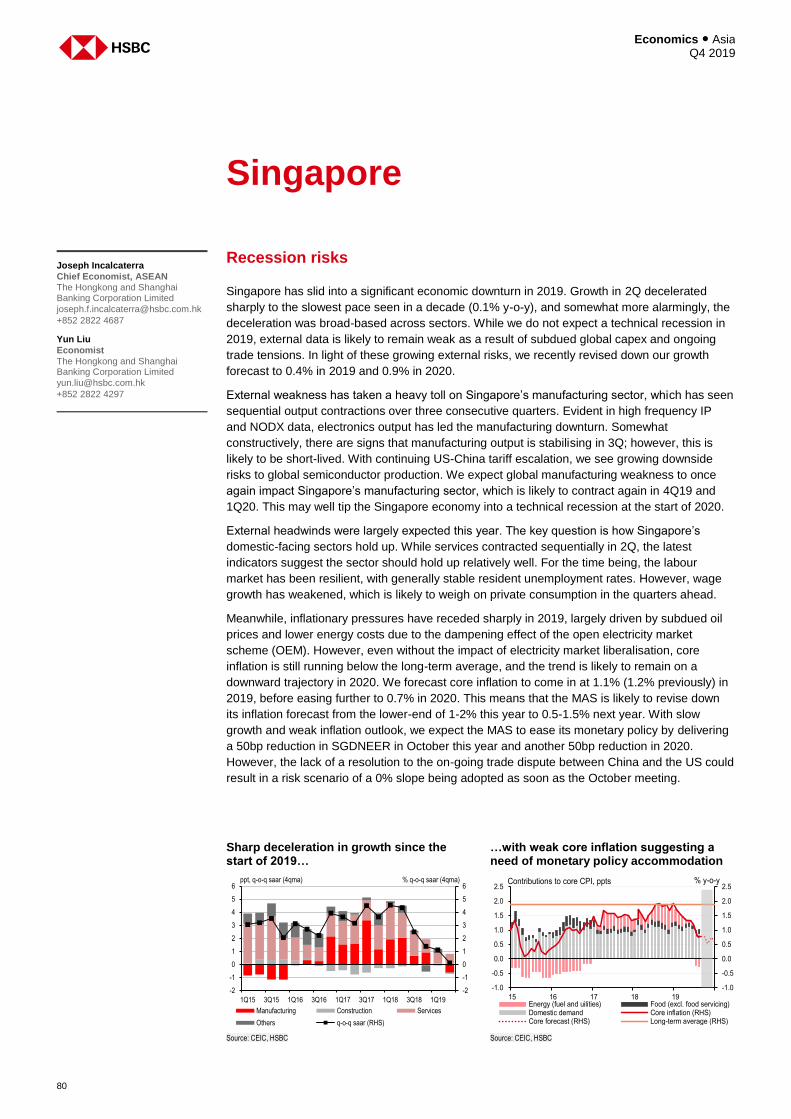
Economics ● Asia Q4 2019
80
Singapore
Recession risks
Singapore has slid into a significant economic downturn in 2019. Growth in 2Q decelerated
sharply to the slowest pace seen in a decade (0.1% y-o-y), and somewhat more alarmingly, the
deceleration was broad-based across sectors. While we do not expect a technical recession in
2019, external data is likely to remain weak as a result of subdued global capex and ongoing
trade tensions. In light of these growing external risks, we recently revised down our growth
forecast to 0.4% in 2019 and 0.9% in 2020.
External weakness has taken a heavy toll on Singapore’s manufacturing sector, which has seen
sequential output contractions over three consecutive quarters. Evident in high frequency IP
and NODX data, electronics output has led the manufacturing downturn. Somewhat
constructively, there are signs that manufacturing output is stabilising in 3Q; however, this is
likely to be short-lived. With continuing US-China tariff escalation, we see growing downside
risks to global semiconductor production. We expect global manufacturing weakness to once
again impact Singapore’s manufacturing sector, which is likely to contract again in 4Q19 and
1Q20. This may well tip the Singapore economy into a technical recession at the start of 2020.
External headwinds were largely expected this year. The key question is how Singapore’s
domestic-facing sectors hold up. While services contracted sequentially in 2Q, the latest
indicators suggest the sector should hold up relatively well. For the time being, the labour
market has been resilient, with generally stable resident unemployment rates. However, wage
growth has weakened, which is likely to weigh on private consumption in the quarters ahead.
Meanwhile, inflationary pressures have receded sharply in 2019, largely driven by subdued oil
prices and lower energy costs due to the dampening effect of the open electricity market
scheme (OEM). However, even without the impact of electricity market liberalisation, core
inflation is still running below the long-term average, and the trend is likely to remain on a
downward trajectory in 2020. We forecast core inflation to come in at 1.1% (1.2% previously) in
2019, before easing further to 0.7% in 2020. This means that the MAS is likely to revise down
its inflation forecast from the lower-end of 1-2% this year to 0.5-1.5% next year. With slow
growth and weak inflation outlook, we expect the MAS to ease its monetary policy by delivering
a 50bp reduction in SGDNEER in October this year and another 50bp reduction in 2020.
However, the lack of a resolution to the on-going trade dispute between China and the US could
result in a risk scenario of a 0% slope being adopted as soon as the October meeting.
Joseph Incalcaterra
Chief Economist, ASEAN The Hongkong and Shanghai Banking Corporation Limited
+852 2822 4687
Yun Liu
Economist
The Hongkong and Shanghai Banking Corporation Limited
+852 2822 4297
Sharp deceleration in growth since the start of 2019…
…with weak core inflation suggesting a need of monetary policy accommodation
Source: CEIC, HSBC Source: CEIC, HSBC
-2
-1
0
1
2
3
4
5
6
-2
-1
0
1
2
3
4
5
6
1Q15 3Q15 1Q16 3Q16 1Q17 3Q17 1Q18 3Q18 1Q19
Manufacturing Construction Services
Others q-o-q saar (RHS)
ppt, q-o-q saar (4qma) % q-o-q saar (4qma)
-1.0
-0.5
0.0
0.5
1.0
1.5
2.0
2.5
-1.0
-0.5
0.0
0.5
1.0
1.5
2.0
2.5
15 16 17 18 19Energy (fuel and uilities) Food (excl. food servicing)Domestic demand Core inflation (RHS)Core forecast (RHS) Long-term average (RHS)
% y-o-yContributions to core CPI, ppts
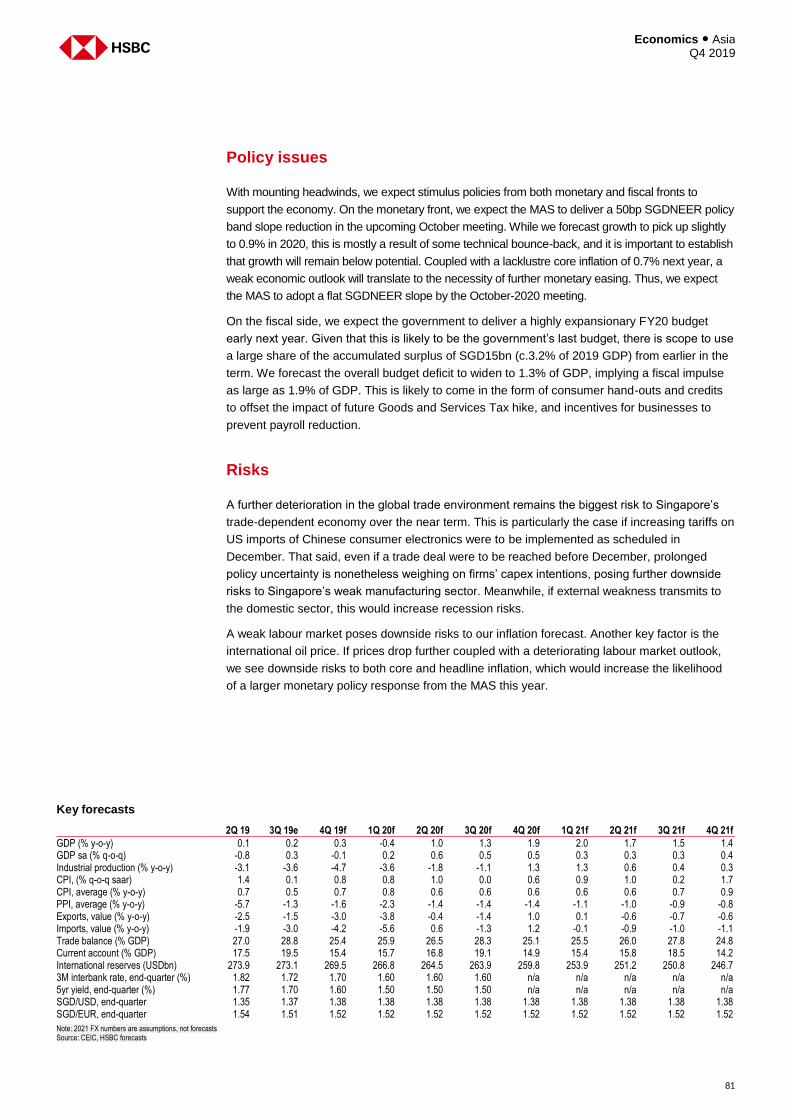
81
Economics ● Asia Q4 2019
Policy issues
With mounting headwinds, we expect stimulus policies from both monetary and fiscal fronts to
support the economy. On the monetary front, we expect the MAS to deliver a 50bp SGDNEER policy
band slope reduction in the upcoming October meeting. While we forecast growth to pick up slightly
to 0.9% in 2020, this is mostly a result of some technical bounce-back, and it is important to establish
that growth will remain below potential. Coupled with a lacklustre core inflation of 0.7% next year, a
weak economic outlook will translate to the necessity of further monetary easing. Thus, we expect
the MAS to adopt a flat SGDNEER slope by the October-2020 meeting.
On the fiscal side, we expect the government to deliver a highly expansionary FY20 budget
early next year. Given that this is likely to be the government’s last budget, there is scope to use
a large share of the accumulated surplus of SGD15bn (c.3.2% of 2019 GDP) from earlier in the
term. We forecast the overall budget deficit to widen to 1.3% of GDP, implying a fiscal impulse
as large as 1.9% of GDP. This is likely to come in the form of consumer hand-outs and credits
to offset the impact of future Goods and Services Tax hike, and incentives for businesses to
prevent payroll reduction.
Risks
A further deterioration in the global trade environment remains the biggest risk to Singapore’s
trade-dependent economy over the near term. This is particularly the case if increasing tariffs on
US imports of Chinese consumer electronics were to be implemented as scheduled in
December. That said, even if a trade deal were to be reached before December, prolonged
policy uncertainty is nonetheless weighing on firms’ capex intentions, posing further downside
risks to Singapore’s weak manufacturing sector. Meanwhile, if external weakness transmits to
the domestic sector, this would increase recession risks.
A weak labour market poses downside risks to our inflation forecast. Another key factor is the
international oil price. If prices drop further coupled with a deteriorating labour market outlook,
we see downside risks to both core and headline inflation, which would increase the likelihood
of a larger monetary policy response from the MAS this year.
Key forecasts
2Q 19 3Q 19e 4Q 19f 1Q 20f 2Q 20f 3Q 20f 4Q 20f 1Q 21f 2Q 21f 3Q 21f 4Q 21f
GDP (% y-o-y) 0.1 0.2 0.3 -0.4 1.0 1.3 1.9 2.0 1.7 1.5 1.4 GDP sa (% q-o-q) -0.8 0.3 -0.1 0.2 0.6 0.5 0.5 0.3 0.3 0.3 0.4 Industrial production (% y-o-y) -3.1 -3.6 -4.7 -3.6 -1.8 -1.1 1.3 1.3 0.6 0.4 0.3 CPI, (% q-o-q saar) 1.4 0.1 0.8 0.8 1.0 0.0 0.6 0.9 1.0 0.2 1.7 CPI, average (% y-o-y) 0.7 0.5 0.7 0.8 0.6 0.6 0.6 0.6 0.6 0.7 0.9 PPI, average (% y-o-y) -5.7 -1.3 -1.6 -2.3 -1.4 -1.4 -1.4 -1.1 -1.0 -0.9 -0.8 Exports, value (% y-o-y) -2.5 -1.5 -3.0 -3.8 -0.4 -1.4 1.0 0.1 -0.6 -0.7 -0.6 Imports, value (% y-o-y) -1.9 -3.0 -4.2 -5.6 0.6 -1.3 1.2 -0.1 -0.9 -1.0 -1.1 Trade balance (% GDP) 27.0 28.8 25.4 25.9 26.5 28.3 25.1 25.5 26.0 27.8 24.8 Current account (% GDP) 17.5 19.5 15.4 15.7 16.8 19.1 14.9 15.4 15.8 18.5 14.2 International reserves (USDbn) 273.9 273.1 269.5 266.8 264.5 263.9 259.8 253.9 251.2 250.8 246.7 3M interbank rate, end-quarter (%) 1.82 1.72 1.70 1.60 1.60 1.60 n/a n/a n/a n/a n/a 5yr yield, end-quarter (%) 1.77 1.70 1.60 1.50 1.50 1.50 n/a n/a n/a n/a n/a SGD/USD, end-quarter 1.35 1.37 1.38 1.38 1.38 1.38 1.38 1.38 1.38 1.38 1.38 SGD/EUR, end-quarter 1.54 1.51 1.52 1.52 1.52 1.52 1.52 1.52 1.52 1.52 1.52
Note: 2021 FX numbers are assumptions, not forecasts Source: CEIC, HSBC forecasts
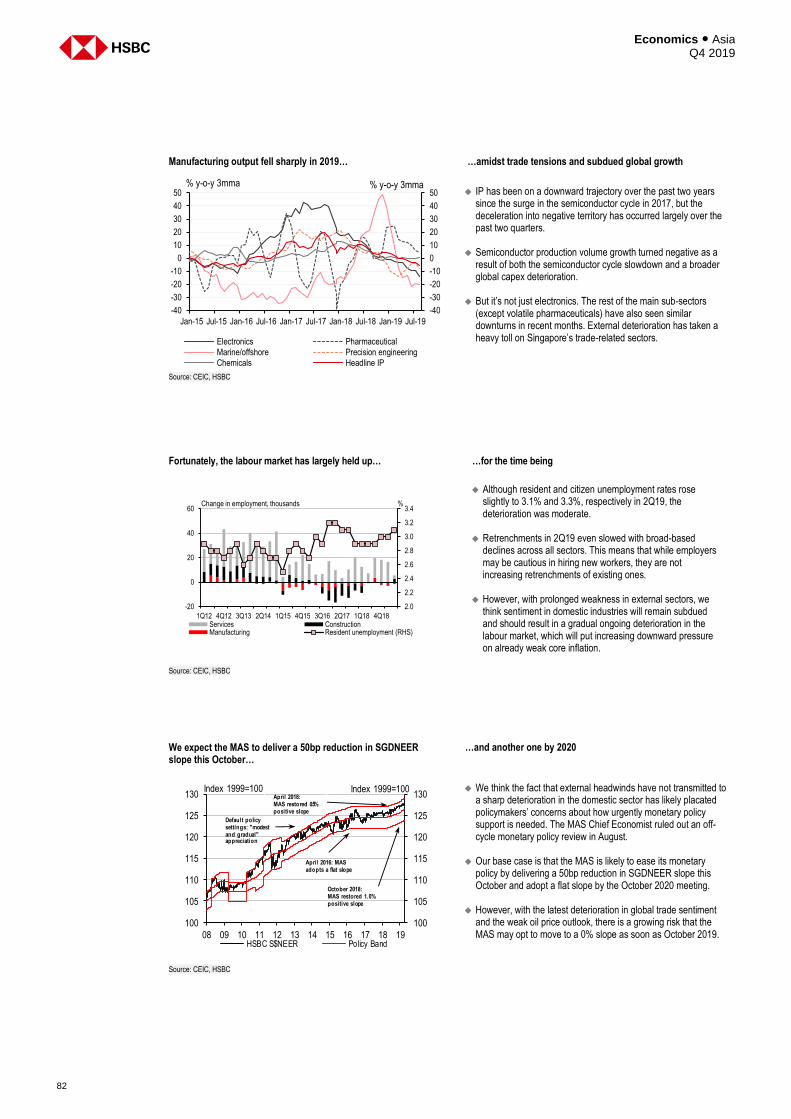
Economics ● Asia Q4 2019
82
Manufacturing output fell sharply in 2019… …amidst trade tensions and subdued global growth
IP has been on a downward trajectory over the past two years
since the surge in the semiconductor cycle in 2017, but the deceleration into negative territory has occurred largely over the past two quarters.
Semiconductor production volume growth turned negative as a result of both the semiconductor cycle slowdown and a broader global capex deterioration.
But it’s not just electronics. The rest of the main sub-sectors (except volatile pharmaceuticals) have also seen similar downturns in recent months. External deterioration has taken a heavy toll on Singapore’s trade-related sectors.
Source: CEIC, HSBC
Fortunately, the labour market has largely held up… …for the time being
Although resident and citizen unemployment rates rose
slightly to 3.1% and 3.3%, respectively in 2Q19, the deterioration was moderate.
Retrenchments in 2Q19 even slowed with broad-based declines across all sectors. This means that while employers may be cautious in hiring new workers, they are not increasing retrenchments of existing ones.
However, with prolonged weakness in external sectors, we think sentiment in domestic industries will remain subdued and should result in a gradual ongoing deterioration in the labour market, which will put increasing downward pressure on already weak core inflation.
Source: CEIC, HSBC
We expect the MAS to deliver a 50bp reduction in SGDNEER slope this October…
…and another one by 2020
We think the fact that external headwinds have not transmitted to
a sharp deterioration in the domestic sector has likely placated policymakers’ concerns about how urgently monetary policy support is needed. The MAS Chief Economist ruled out an off-cycle monetary policy review in August.
Our base case is that the MAS is likely to ease its monetary
policy by delivering a 50bp reduction in SGDNEER slope this October and adopt a flat slope by the October 2020 meeting.
However, with the latest deterioration in global trade sentiment
and the weak oil price outlook, there is a growing risk that the MAS may opt to move to a 0% slope as soon as October 2019.
Source: CEIC, HSBC
-40
-30
-20
-10
0
10
20
30
40
50
-40
-30
-20
-10
0
10
20
30
40
50
Jan-15 Jul-15 Jan-16 Jul-16 Jan-17 Jul-17 Jan-18 Jul-18 Jan-19 Jul-19
Electronics PharmaceuticalMarine/offshore Precision engineeringChemicals Headline IP
% y-o-y 3mma % y-o-y 3mma
1Q12 4Q12 3Q13 2Q14 1Q15 4Q15 3Q16 2Q17 1Q18 4Q18
2.0
2.2
2.4
2.6
2.8
3.0
3.2
3.4
-20
0
20
40
60
Services ConstructionManufacturing Resident unemployment (RHS)
Change in employment, thousands %
100
105
110
115
120
125
130
100
105
110
115
120
125
130
08 09 10 11 12 13 14 15 16 17 18 19HSBC S$NEER Policy Band
Index 1999=100 Index 1999=100
April 2016: MAS adopts a flat slope
Default policy settings: "modest and gradual" appreciation
April 2018:MAS restored 0.5% positive slope
October 2018:MAS restored 1.0% positive slope
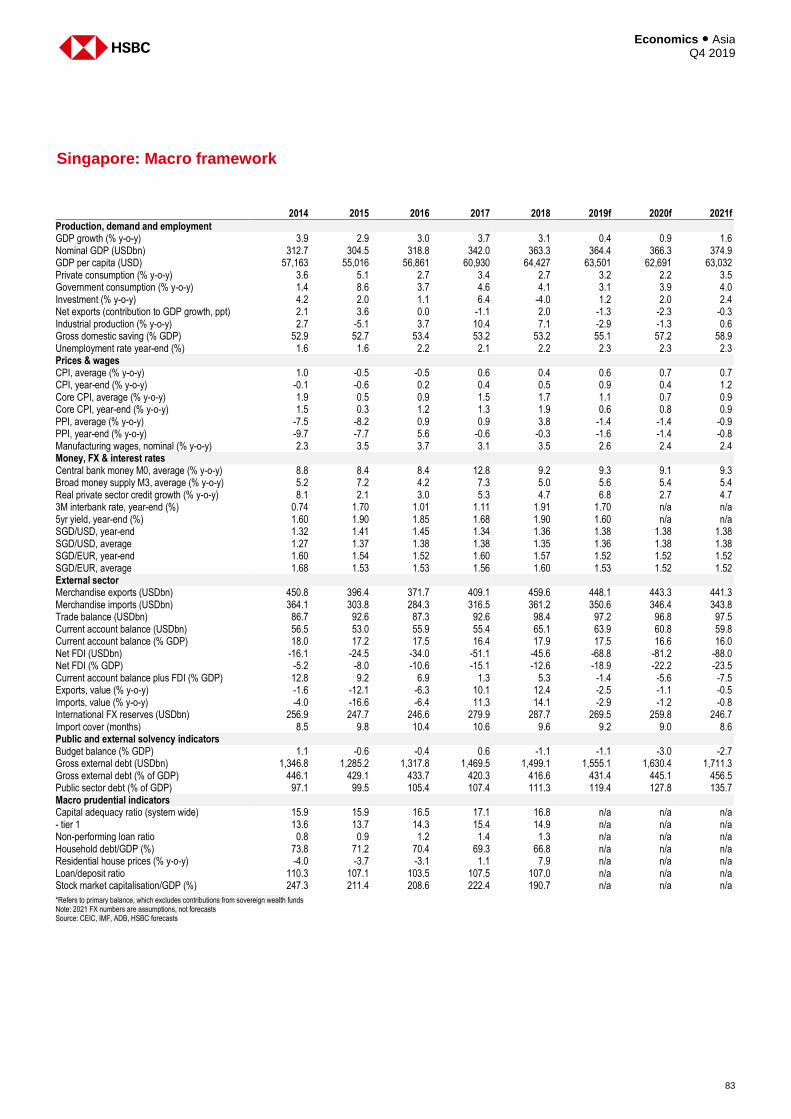
83
Economics ● Asia Q4 2019
Singapore: Macro framework
2014 2015 2016 2017 2018 2019f 2020f 2021f
Production, demand and employment GDP growth (% y-o-y) 3.9 2.9 3.0 3.7 3.1 0.4 0.9 1.6 Nominal GDP (USDbn) 312.7 304.5 318.8 342.0 363.3 364.4 366.3 374.9 GDP per capita (USD) 57,163 55,016 56,861 60,930 64,427 63,501 62,691 63,032 Private consumption (% y-o-y) 3.6 5.1 2.7 3.4 2.7 3.2 2.2 3.5 Government consumption (% y-o-y) 1.4 8.6 3.7 4.6 4.1 3.1 3.9 4.0 Investment (% y-o-y) 4.2 2.0 1.1 6.4 -4.0 1.2 2.0 2.4 Net exports (contribution to GDP growth, ppt) 2.1 3.6 0.0 -1.1 2.0 -1.3 -2.3 -0.3 Industrial production (% y-o-y) 2.7 -5.1 3.7 10.4 7.1 -2.9 -1.3 0.6 Gross domestic saving (% GDP) 52.9 52.7 53.4 53.2 53.2 55.1 57.2 58.9 Unemployment rate year-end (%) 1.6 1.6 2.2 2.1 2.2 2.3 2.3 2.3 Prices & wages CPI, average (% y-o-y) 1.0 -0.5 -0.5 0.6 0.4 0.6 0.7 0.7 CPI, year-end (% y-o-y) -0.1 -0.6 0.2 0.4 0.5 0.9 0.4 1.2 Core CPI, average (% y-o-y) 1.9 0.5 0.9 1.5 1.7 1.1 0.7 0.9 Core CPI, year-end (% y-o-y) 1.5 0.3 1.2 1.3 1.9 0.6 0.8 0.9 PPI, average (% y-o-y) -7.5 -8.2 0.9 0.9 3.8 -1.4 -1.4 -0.9 PPI, year-end (% y-o-y) -9.7 -7.7 5.6 -0.6 -0.3 -1.6 -1.4 -0.8 Manufacturing wages, nominal (% y-o-y) 2.3 3.5 3.7 3.1 3.5 2.6 2.4 2.4 Money, FX & interest rates Central bank money M0, average (% y-o-y) 8.8 8.4 8.4 12.8 9.2 9.3 9.1 9.3 Broad money supply M3, average (% y-o-y) 5.2 7.2 4.2 7.3 5.0 5.6 5.4 5.4 Real private sector credit growth (% y-o-y) 8.1 2.1 3.0 5.3 4.7 6.8 2.7 4.7 3M interbank rate, year-end (%) 0.74 1.70 1.01 1.11 1.91 1.70 n/a n/a 5yr yield, year-end (%) 1.60 1.90 1.85 1.68 1.90 1.60 n/a n/a SGD/USD, year-end 1.32 1.41 1.45 1.34 1.36 1.38 1.38 1.38 SGD/USD, average 1.27 1.37 1.38 1.38 1.35 1.36 1.38 1.38 SGD/EUR, year-end 1.60 1.54 1.52 1.60 1.57 1.52 1.52 1.52 SGD/EUR, average 1.68 1.53 1.53 1.56 1.60 1.53 1.52 1.52 External sector Merchandise exports (USDbn) 450.8 396.4 371.7 409.1 459.6 448.1 443.3 441.3 Merchandise imports (USDbn) 364.1 303.8 284.3 316.5 361.2 350.6 346.4 343.8 Trade balance (USDbn) 86.7 92.6 87.3 92.6 98.4 97.2 96.8 97.5 Current account balance (USDbn) 56.5 53.0 55.9 55.4 65.1 63.9 60.8 59.8 Current account balance (% GDP) 18.0 17.2 17.5 16.4 17.9 17.5 16.6 16.0 Net FDI (USDbn) -16.1 -24.5 -34.0 -51.1 -45.6 -68.8 -81.2 -88.0 Net FDI (% GDP) -5.2 -8.0 -10.6 -15.1 -12.6 -18.9 -22.2 -23.5 Current account balance plus FDI (% GDP) 12.8 9.2 6.9 1.3 5.3 -1.4 -5.6 -7.5 Exports, value (% y-o-y) -1.6 -12.1 -6.3 10.1 12.4 -2.5 -1.1 -0.5 Imports, value (% y-o-y) -4.0 -16.6 -6.4 11.3 14.1 -2.9 -1.2 -0.8 International FX reserves (USDbn) 256.9 247.7 246.6 279.9 287.7 269.5 259.8 246.7 Import cover (months) 8.5 9.8 10.4 10.6 9.6 9.2 9.0 8.6 Public and external solvency indicators Budget balance (% GDP) 1.1 -0.6 -0.4 0.6 -1.1 -1.1 -3.0 -2.7 Gross external debt (USDbn) 1,346.8 1,285.2 1,317.8 1,469.5 1,499.1 1,555.1 1,630.4 1,711.3 Gross external debt (% of GDP) 446.1 429.1 433.7 420.3 416.6 431.4 445.1 456.5 Public sector debt (% of GDP) 97.1 99.5 105.4 107.4 111.3 119.4 127.8 135.7 Macro prudential indicators Capital adequacy ratio (system wide) 15.9 15.9 16.5 17.1 16.8 n/a n/a n/a - tier 1 13.6 13.7 14.3 15.4 14.9 n/a n/a n/a Non-performing loan ratio 0.8 0.9 1.2 1.4 1.3 n/a n/a n/a Household debt/GDP (%) 73.8 71.2 70.4 69.3 66.8 n/a n/a n/a Residential house prices (% y-o-y) -4.0 -3.7 -3.1 1.1 7.9 n/a n/a n/a Loan/deposit ratio 110.3 107.1 103.5 107.5 107.0 n/a n/a n/a Stock market capitalisation/GDP (%) 247.3 211.4 208.6 222.4 190.7 n/a n/a n/a
*Refers to primary balance, which excludes contributions from sovereign wealth funds Note: 2021 FX numbers are assumptions, not forecasts Source: CEIC, IMF, ADB, HSBC forecasts
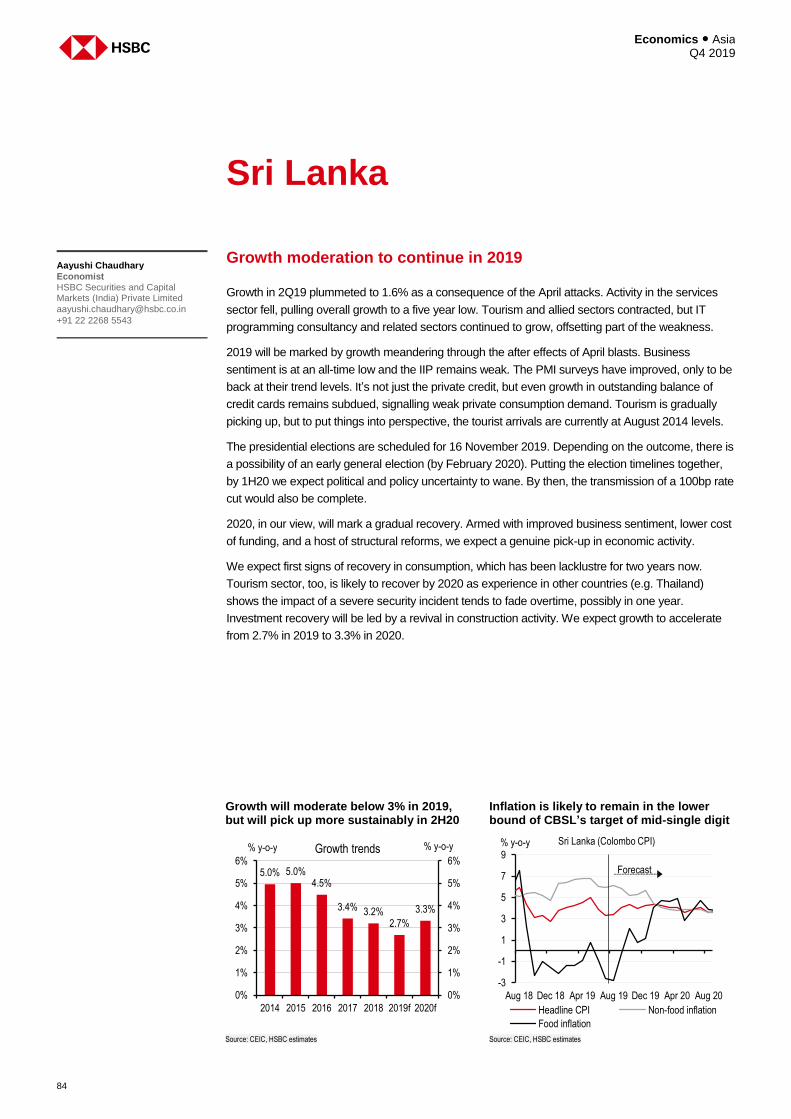
Economics ● Asia Q4 2019
84
Sri Lanka
Growth moderation to continue in 2019
Growth in 2Q19 plummeted to 1.6% as a consequence of the April attacks. Activity in the services
sector fell, pulling overall growth to a five year low. Tourism and allied sectors contracted, but IT
programming consultancy and related sectors continued to grow, offsetting part of the weakness.
2019 will be marked by growth meandering through the after effects of April blasts. Business
sentiment is at an all-time low and the IIP remains weak. The PMI surveys have improved, only to be
back at their trend levels. It’s not just the private credit, but even growth in outstanding balance of
credit cards remains subdued, signalling weak private consumption demand. Tourism is gradually
picking up, but to put things into perspective, the tourist arrivals are currently at August 2014 levels.
The presidential elections are scheduled for 16 November 2019. Depending on the outcome, there is
a possibility of an early general election (by February 2020). Putting the election timelines together,
by 1H20 we expect political and policy uncertainty to wane. By then, the transmission of a 100bp rate
cut would also be complete.
2020, in our view, will mark a gradual recovery. Armed with improved business sentiment, lower cost
of funding, and a host of structural reforms, we expect a genuine pick-up in economic activity.
We expect first signs of recovery in consumption, which has been lacklustre for two years now.
Tourism sector, too, is likely to recover by 2020 as experience in other countries (e.g. Thailand)
shows the impact of a severe security incident tends to fade overtime, possibly in one year.
Investment recovery will be led by a revival in construction activity. We expect growth to accelerate
from 2.7% in 2019 to 3.3% in 2020.
Aayushi Chaudhary
Economist HSBC Securities and Capital Markets (India) Private Limited
+91 22 2268 5543
Growth will moderate below 3% in 2019, but will pick up more sustainably in 2H20
Inflation is likely to remain in the lower bound of CBSL’s target of mid-single digit
Source: CEIC, HSBC estimates Source: CEIC, HSBC estimates
5.0% 5.0%4.5%
3.4% 3.2%2.7%
3.3%
0%
1%
2%
3%
4%
5%
6%
0%
1%
2%
3%
4%
5%
6%
2014 2015 2016 2017 2018 2019f 2020f
% y-o-y% y-o-y Growth trends
-3
-1
1
3
5
7
9
Aug 18 Dec 18 Apr 19 Aug 19 Dec 19 Apr 20 Aug 20
% y-o-y Sri Lanka (Colombo CPI)
Headline CPI Non-food inflation
Food inflation
Forecast
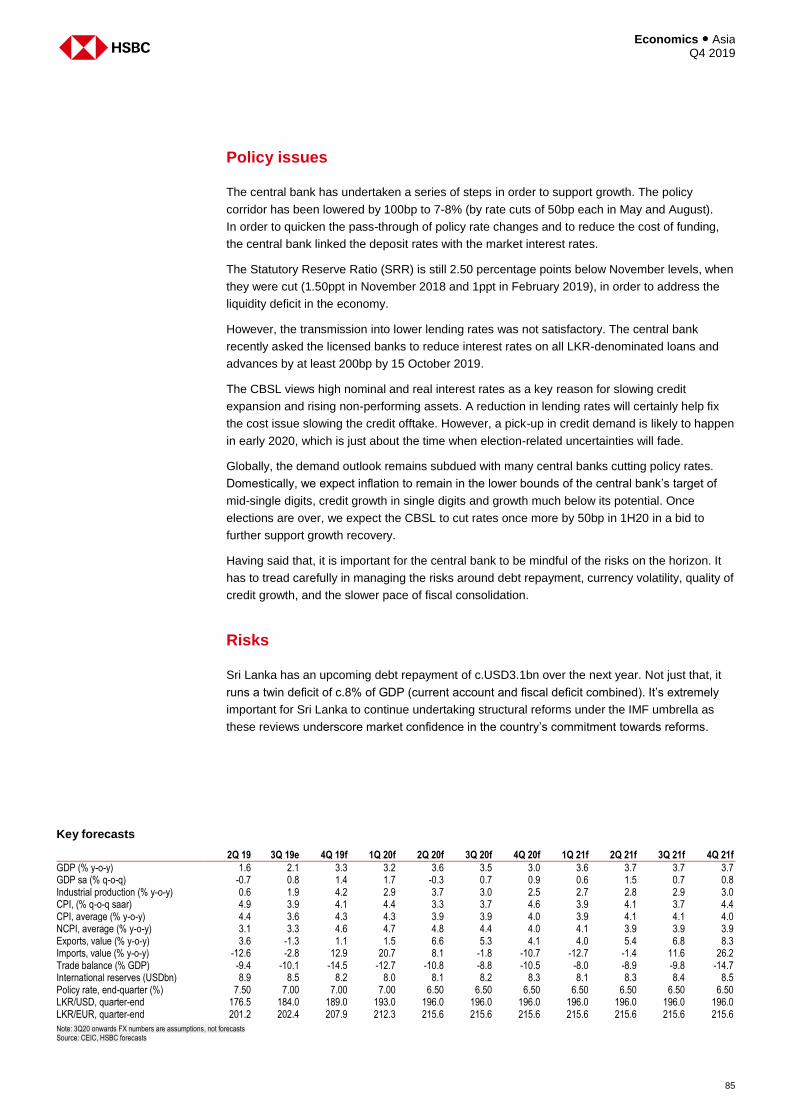
85
Economics ● Asia Q4 2019
Policy issues
The central bank has undertaken a series of steps in order to support growth. The policy
corridor has been lowered by 100bp to 7-8% (by rate cuts of 50bp each in May and August).
In order to quicken the pass-through of policy rate changes and to reduce the cost of funding,
the central bank linked the deposit rates with the market interest rates.
The Statutory Reserve Ratio (SRR) is still 2.50 percentage points below November levels, when
they were cut (1.50ppt in November 2018 and 1ppt in February 2019), in order to address the
liquidity deficit in the economy.
However, the transmission into lower lending rates was not satisfactory. The central bank
recently asked the licensed banks to reduce interest rates on all LKR-denominated loans and
advances by at least 200bp by 15 October 2019.
The CBSL views high nominal and real interest rates as a key reason for slowing credit
expansion and rising non-performing assets. A reduction in lending rates will certainly help fix
the cost issue slowing the credit offtake. However, a pick-up in credit demand is likely to happen
in early 2020, which is just about the time when election-related uncertainties will fade.
Globally, the demand outlook remains subdued with many central banks cutting policy rates.
Domestically, we expect inflation to remain in the lower bounds of the central bank’s target of
mid-single digits, credit growth in single digits and growth much below its potential. Once
elections are over, we expect the CBSL to cut rates once more by 50bp in 1H20 in a bid to
further support growth recovery.
Having said that, it is important for the central bank to be mindful of the risks on the horizon. It
has to tread carefully in managing the risks around debt repayment, currency volatility, quality of
credit growth, and the slower pace of fiscal consolidation.
Risks
Sri Lanka has an upcoming debt repayment of c.USD3.1bn over the next year. Not just that, it
runs a twin deficit of c.8% of GDP (current account and fiscal deficit combined). It’s extremely
important for Sri Lanka to continue undertaking structural reforms under the IMF umbrella as
these reviews underscore market confidence in the country’s commitment towards reforms.
Key forecasts
2Q 19 3Q 19e 4Q 19f 1Q 20f 2Q 20f 3Q 20f 4Q 20f 1Q 21f 2Q 21f 3Q 21f 4Q 21f
GDP (% y-o-y) 1.6 2.1 3.3 3.2 3.6 3.5 3.0 3.6 3.7 3.7 3.7 GDP sa (% q-o-q) -0.7 0.8 1.4 1.7 -0.3 0.7 0.9 0.6 1.5 0.7 0.8 Industrial production (% y-o-y) 0.6 1.9 4.2 2.9 3.7 3.0 2.5 2.7 2.8 2.9 3.0 CPI, (% q-o-q saar) 4.9 3.9 4.1 4.4 3.3 3.7 4.6 3.9 4.1 3.7 4.4 CPI, average (% y-o-y) 4.4 3.6 4.3 4.3 3.9 3.9 4.0 3.9 4.1 4.1 4.0 NCPI, average (% y-o-y) 3.1 3.3 4.6 4.7 4.8 4.4 4.0 4.1 3.9 3.9 3.9 Exports, value (% y-o-y) 3.6 -1.3 1.1 1.5 6.6 5.3 4.1 4.0 5.4 6.8 8.3 Imports, value (% y-o-y) -12.6 -2.8 12.9 20.7 8.1 -1.8 -10.7 -12.7 -1.4 11.6 26.2 Trade balance (% GDP) -9.4 -10.1 -14.5 -12.7 -10.8 -8.8 -10.5 -8.0 -8.9 -9.8 -14.7 International reserves (USDbn) 8.9 8.5 8.2 8.0 8.1 8.2 8.3 8.1 8.3 8.4 8.5 Policy rate, end-quarter (%) 7.50 7.00 7.00 7.00 6.50 6.50 6.50 6.50 6.50 6.50 6.50 LKR/USD, quarter-end 176.5 184.0 189.0 193.0 196.0 196.0 196.0 196.0 196.0 196.0 196.0 LKR/EUR, quarter-end 201.2 202.4 207.9 212.3 215.6 215.6 215.6 215.6 215.6 215.6 215.6
Note: 3Q20 onwards FX numbers are assumptions, not forecasts Source: CEIC, HSBC forecasts
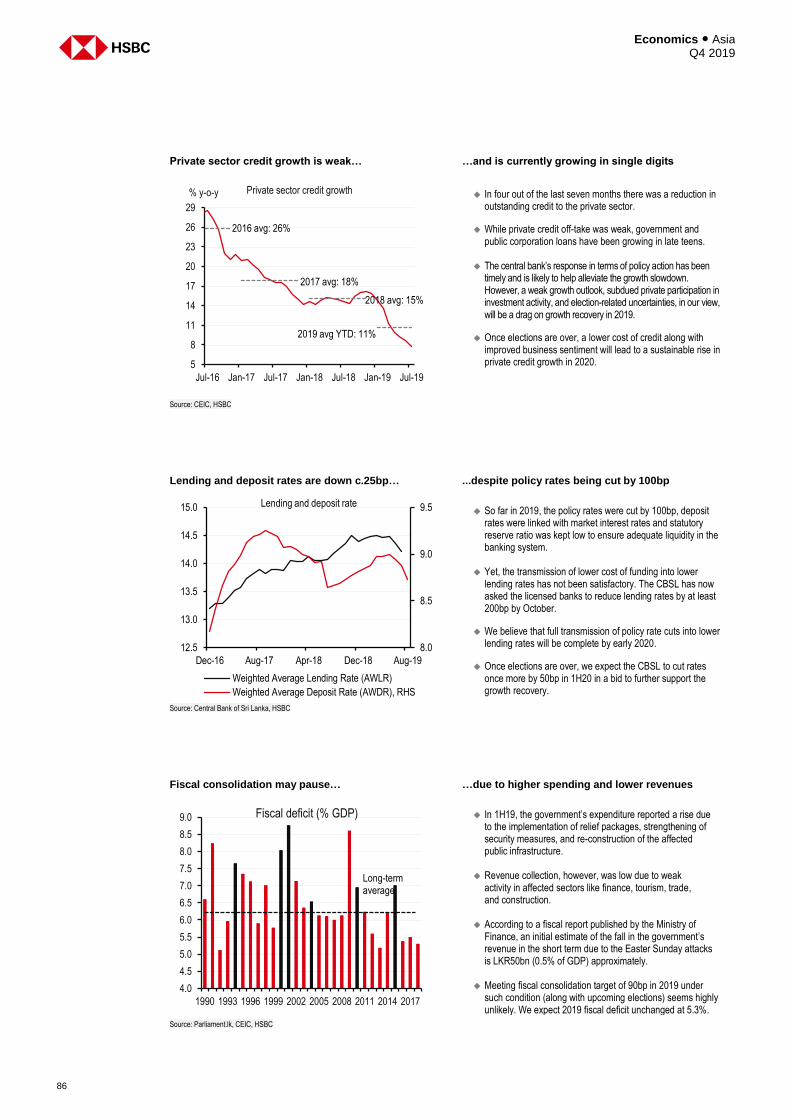
Economics ● Asia Q4 2019
86
Private sector credit growth is weak… …and is currently growing in single digits
In four out of the last seven months there was a reduction in
outstanding credit to the private sector.
While private credit off-take was weak, government and public corporation loans have been growing in late teens.
The central bank’s response in terms of policy action has been timely and is likely to help alleviate the growth slowdown. However, a weak growth outlook, subdued private participation in investment activity, and election-related uncertainties, in our view, will be a drag on growth recovery in 2019.
Once elections are over, a lower cost of credit along with improved business sentiment will lead to a sustainable rise in private credit growth in 2020.
Source: CEIC, HSBC
Lending and deposit rates are down c.25bp… ...despite policy rates being cut by 100bp
So far in 2019, the policy rates were cut by 100bp, deposit
rates were linked with market interest rates and statutory reserve ratio was kept low to ensure adequate liquidity in the banking system.
Yet, the transmission of lower cost of funding into lower lending rates has not been satisfactory. The CBSL has now asked the licensed banks to reduce lending rates by at least 200bp by October.
We believe that full transmission of policy rate cuts into lower lending rates will be complete by early 2020.
Once elections are over, we expect the CBSL to cut rates once more by 50bp in 1H20 in a bid to further support the growth recovery.
Source: Central Bank of Sri Lanka, HSBC
Fiscal consolidation may pause… …due to higher spending and lower revenues
In 1H19, the government’s expenditure reported a rise due
to the implementation of relief packages, strengthening of security measures, and re-construction of the affected public infrastructure.
Revenue collection, however, was low due to weak activity in affected sectors like finance, tourism, trade, and construction.
According to a fiscal report published by the Ministry of Finance, an initial estimate of the fall in the government’s revenue in the short term due to the Easter Sunday attacks is LKR50bn (0.5% of GDP) approximately.
Meeting fiscal consolidation target of 90bp in 2019 under such condition (along with upcoming elections) seems highly unlikely. We expect 2019 fiscal deficit unchanged at 5.3%.
Source: Parliament.lk, CEIC, HSBC
5
8
11
14
17
20
23
26
29
Jul-16 Jan-17 Jul-17 Jan-18 Jul-18 Jan-19 Jul-19
% y-o-y Private sector credit growth
2018 avg: 15%
2016 avg: 26%
2017 avg: 18%
2019 avg YTD: 11%
8.0
8.5
9.0
9.5
12.5
13.0
13.5
14.0
14.5
15.0
Dec-16 Aug-17 Apr-18 Dec-18 Aug-19
Lending and deposit rate
Weighted Average Lending Rate (AWLR)
Weighted Average Deposit Rate (AWDR), RHS
4.0
4.5
5.0
5.5
6.0
6.5
7.0
7.5
8.0
8.5
9.0
1990 1993 1996 1999 2002 2005 2008 2011 2014 2017
Fiscal deficit (% GDP)
Long-term average
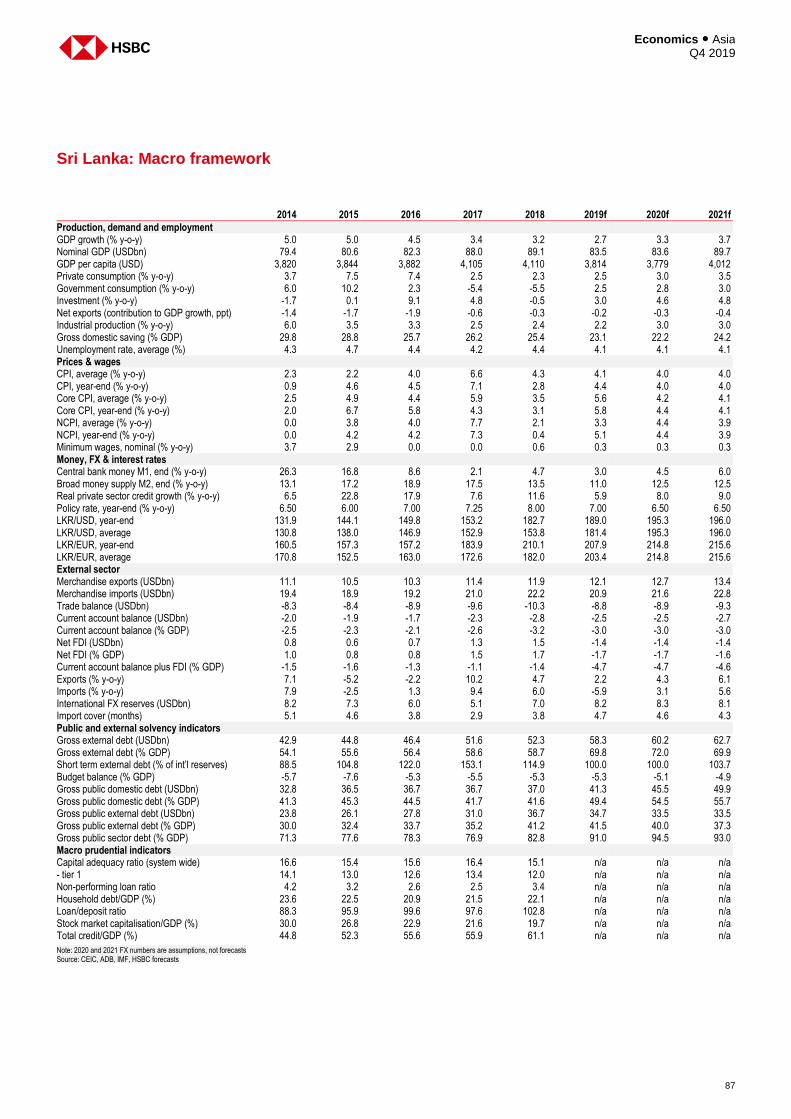
87
Economics ● Asia Q4 2019
Sri Lanka: Macro framework
2014 2015 2016 2017 2018 2019f 2020f 2021f
Production, demand and employment GDP growth (% y-o-y) 5.0 5.0 4.5 3.4 3.2 2.7 3.3 3.7 Nominal GDP (USDbn) 79.4 80.6 82.3 88.0 89.1 83.5 83.6 89.7 GDP per capita (USD) 3,820 3,844 3,882 4,105 4,110 3,814 3,779 4,012 Private consumption (% y-o-y) 3.7 7.5 7.4 2.5 2.3 2.5 3.0 3.5 Government consumption (% y-o-y) 6.0 10.2 2.3 -5.4 -5.5 2.5 2.8 3.0 Investment (% y-o-y) -1.7 0.1 9.1 4.8 -0.5 3.0 4.6 4.8 Net exports (contribution to GDP growth, ppt) -1.4 -1.7 -1.9 -0.6 -0.3 -0.2 -0.3 -0.4 Industrial production (% y-o-y) 6.0 3.5 3.3 2.5 2.4 2.2 3.0 3.0 Gross domestic saving (% GDP) 29.8 28.8 25.7 26.2 25.4 23.1 22.2 24.2 Unemployment rate, average (%) 4.3 4.7 4.4 4.2 4.4 4.1 4.1 4.1 Prices & wages CPI, average (% y-o-y) 2.3 2.2 4.0 6.6 4.3 4.1 4.0 4.0 CPI, year-end (% y-o-y) 0.9 4.6 4.5 7.1 2.8 4.4 4.0 4.0 Core CPI, average (% y-o-y) 2.5 4.9 4.4 5.9 3.5 5.6 4.2 4.1 Core CPI, year-end (% y-o-y) 2.0 6.7 5.8 4.3 3.1 5.8 4.4 4.1 NCPI, average (% y-o-y) 0.0 3.8 4.0 7.7 2.1 3.3 4.4 3.9 NCPI, year-end (% y-o-y) 0.0 4.2 4.2 7.3 0.4 5.1 4.4 3.9 Minimum wages, nominal (% y-o-y) 3.7 2.9 0.0 0.0 0.6 0.3 0.3 0.3 Money, FX & interest rates Central bank money M1, end (% y-o-y) 26.3 16.8 8.6 2.1 4.7 3.0 4.5 6.0 Broad money supply M2, end (% y-o-y) 13.1 17.2 18.9 17.5 13.5 11.0 12.5 12.5 Real private sector credit growth (% y-o-y) 6.5 22.8 17.9 7.6 11.6 5.9 8.0 9.0 Policy rate, year-end (% y-o-y) 6.50 6.00 7.00 7.25 8.00 7.00 6.50 6.50 LKR/USD, year-end 131.9 144.1 149.8 153.2 182.7 189.0 195.3 196.0 LKR/USD, average 130.8 138.0 146.9 152.9 153.8 181.4 195.3 196.0 LKR/EUR, year-end 160.5 157.3 157.2 183.9 210.1 207.9 214.8 215.6 LKR/EUR, average 170.8 152.5 163.0 172.6 182.0 203.4 214.8 215.6 External sector Merchandise exports (USDbn) 11.1 10.5 10.3 11.4 11.9 12.1 12.7 13.4 Merchandise imports (USDbn) 19.4 18.9 19.2 21.0 22.2 20.9 21.6 22.8 Trade balance (USDbn) -8.3 -8.4 -8.9 -9.6 -10.3 -8.8 -8.9 -9.3 Current account balance (USDbn) -2.0 -1.9 -1.7 -2.3 -2.8 -2.5 -2.5 -2.7 Current account balance (% GDP) -2.5 -2.3 -2.1 -2.6 -3.2 -3.0 -3.0 -3.0 Net FDI (USDbn) 0.8 0.6 0.7 1.3 1.5 -1.4 -1.4 -1.4 Net FDI (% GDP) 1.0 0.8 0.8 1.5 1.7 -1.7 -1.7 -1.6 Current account balance plus FDI (% GDP) -1.5 -1.6 -1.3 -1.1 -1.4 -4.7 -4.7 -4.6 Exports (% y-o-y) 7.1 -5.2 -2.2 10.2 4.7 2.2 4.3 6.1 Imports (% y-o-y) 7.9 -2.5 1.3 9.4 6.0 -5.9 3.1 5.6 International FX reserves (USDbn) 8.2 7.3 6.0 5.1 7.0 8.2 8.3 8.1 Import cover (months) 5.1 4.6 3.8 2.9 3.8 4.7 4.6 4.3 Public and external solvency indicators Gross external debt (USDbn) 42.9 44.8 46.4 51.6 52.3 58.3 60.2 62.7 Gross external debt (% GDP) 54.1 55.6 56.4 58.6 58.7 69.8 72.0 69.9 Short term external debt (% of int’l reserves) 88.5 104.8 122.0 153.1 114.9 100.0 100.0 103.7 Budget balance (% GDP) -5.7 -7.6 -5.3 -5.5 -5.3 -5.3 -5.1 -4.9 Gross public domestic debt (USDbn) 32.8 36.5 36.7 36.7 37.0 41.3 45.5 49.9 Gross public domestic debt (% GDP) 41.3 45.3 44.5 41.7 41.6 49.4 54.5 55.7 Gross public external debt (USDbn) 23.8 26.1 27.8 31.0 36.7 34.7 33.5 33.5 Gross public external debt (% GDP) 30.0 32.4 33.7 35.2 41.2 41.5 40.0 37.3 Gross public sector debt (% GDP) 71.3 77.6 78.3 76.9 82.8 91.0 94.5 93.0 Macro prudential indicators Capital adequacy ratio (system wide) 16.6 15.4 15.6 16.4 15.1 n/a n/a n/a - tier 1 14.1 13.0 12.6 13.4 12.0 n/a n/a n/a Non-performing loan ratio 4.2 3.2 2.6 2.5 3.4 n/a n/a n/a Household debt/GDP (%) 23.6 22.5 20.9 21.5 22.1 n/a n/a n/a Loan/deposit ratio 88.3 95.9 99.6 97.6 102.8 n/a n/a n/a Stock market capitalisation/GDP (%) 30.0 26.8 22.9 21.6 19.7 n/a n/a n/a Total credit/GDP (%) 44.8 52.3 55.6 55.9 61.1 n/a n/a n/a
Note: 2020 and 2021 FX numbers are assumptions, not forecasts Source: CEIC, ADB, IMF, HSBC forecasts
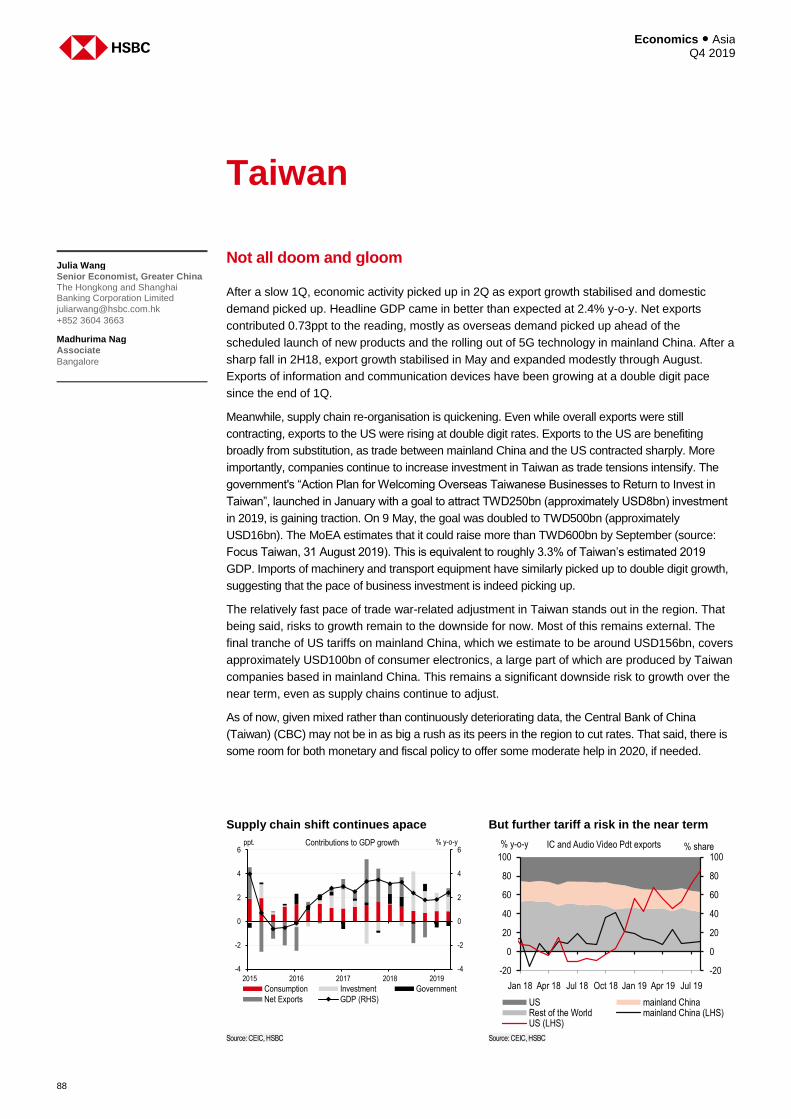
Economics ● Asia Q4 2019
88
Taiwan
Not all doom and gloom
After a slow 1Q, economic activity picked up in 2Q as export growth stabilised and domestic
demand picked up. Headline GDP came in better than expected at 2.4% y-o-y. Net exports
contributed 0.73ppt to the reading, mostly as overseas demand picked up ahead of the
scheduled launch of new products and the rolling out of 5G technology in mainland China. After a
sharp fall in 2H18, export growth stabilised in May and expanded modestly through August.
Exports of information and communication devices have been growing at a double digit pace
since the end of 1Q.
Meanwhile, supply chain re-organisation is quickening. Even while overall exports were still
contracting, exports to the US were rising at double digit rates. Exports to the US are benefiting
broadly from substitution, as trade between mainland China and the US contracted sharply. More
importantly, companies continue to increase investment in Taiwan as trade tensions intensify. The
government's “Action Plan for Welcoming Overseas Taiwanese Businesses to Return to Invest in
Taiwan”, launched in January with a goal to attract TWD250bn (approximately USD8bn) investment
in 2019, is gaining traction. On 9 May, the goal was doubled to TWD500bn (approximately
USD16bn). The MoEA estimates that it could raise more than TWD600bn by September (source:
Focus Taiwan, 31 August 2019). This is equivalent to roughly 3.3% of Taiwan’s estimated 2019
GDP. Imports of machinery and transport equipment have similarly picked up to double digit growth,
suggesting that the pace of business investment is indeed picking up.
The relatively fast pace of trade war-related adjustment in Taiwan stands out in the region. That
being said, risks to growth remain to the downside for now. Most of this remains external. The
final tranche of US tariffs on mainland China, which we estimate to be around USD156bn, covers
approximately USD100bn of consumer electronics, a large part of which are produced by Taiwan
companies based in mainland China. This remains a significant downside risk to growth over the
near term, even as supply chains continue to adjust.
As of now, given mixed rather than continuously deteriorating data, the Central Bank of China
(Taiwan) (CBC) may not be in as big a rush as its peers in the region to cut rates. That said, there is
some room for both monetary and fiscal policy to offer some moderate help in 2020, if needed.
Julia Wang
Senior Economist, Greater China The Hongkong and Shanghai Banking Corporation Limited
+852 3604 3663
Madhurima Nag
Associate
Bangalore
Supply chain shift continues apace But further tariff a risk in the near term
Source: CEIC, HSBC Source: CEIC, HSBC
2015 2016 2017 2018 2019
-4
-2
0
2
4
6
-4
-2
0
2
4
6% y-o-yppt. Contributions to GDP growth
Consumption Investment Government
Net Exports GDP (RHS)
Jan 18 Apr 18 Jul 18 Oct 18 Jan 19 Apr 19 Jul 19
-20
0
20
40
60
80
100
-20
0
20
40
60
80
100% share% y-o-y IC and Audio Video Pdt exports
US mainland ChinaRest of the World mainland China (LHS)US (LHS)

89
Economics ● Asia Q4 2019
Policy issues
The Central Bank of China (Taiwan) (CBC) remained on hold at its latest monetary policy meeting on
19 September. This was widely expected. As has been the case for some time, the overall tone
remains cautious. Despite further escalation of the tariff war over the past few months, economic
activity continues to be mixed. On one hand, the external sector is clearly still under pressure from
the global manufacturing sector slowdown and trade policy uncertainty. On the other hand, domestic
demand has held up relatively better, due to a pickup in investment growth as part of the supply
chain shift. Other indicators, from the labour market to inflation and consumption growth also remain
fairly stable. In light of this, the central bank has been able to remain patient. But further escalation of
the trade war could still tip the balance and compel the central bank to deliver more easing.
Apart from monetary policy, Taiwan also has some fiscal policy room, within the constraint of the
debt ceiling. If economic activity slows, we could have a bigger push from a moderate expansionary
fiscal policy, particularly as Taiwan heads to the polls in January 2020.
Risks
As has been the case for some time, the key risk to the near-term growth outlook is still the
external sector and what happens next in the trade war. If tensions continue to escalate, more
products are tariffed and the trade war spills over in a disorderly manner, growth could slow
further than we currently forecast. Conversely, domestic investment is picking up at a fairly
robust pace. If more infrastructure investment and policy support is committed, this could lend a
bigger boost to the economy.
Key forecasts
2Q 19 3Q 19e 4Q 19f 1Q 20f 2Q 20f 3Q 20f 4Q 20f 1Q 21f 2Q 21f 3Q 21f 4Q 21f
GDP (% y-o-y) 2.4 2.1 2.0 2.0 1.9 1.8 1.9 1.9 2.0 2.0 2.1 GDP sa (% q-o-q) 0.7 0.4 0.4 0.5 0.5 0.4 0.4 0.5 0.5 0.5 0.5 Industrial production (% y-o-y) -0.6 3.7 4.1 4.8 2.6 1.6 2.2 4.7 1.6 1.2 1.5 CPI, average (% y-o-y) 0.8 0.5 0.4 0.7 0.6 0.7 0.7 0.9 0.8 0.9 0.7 WPI, average (% y-o-y) -0.6 0.6 1.1 1.0 1.0 0.7 0.9 0.9 0.7 0.8 0.9 Exports, value (% y-o-y) -7.4 -0.6 2.9 2.8 2.8 3.5 3.9 3.6 4.0 3.9 4.5 Imports, value (% y-o-y) -5.9 -4.6 -0.1 -2.7 -2.0 2.6 3.3 2.6 2.8 2.7 3.3 Trade balance (% GDP) 9.4 11.7 13.0 11.4 12.3 12.7 13.7 12.1 13.2 13.5 14.8 Current account (% GDP) 12.4 10.4 14.0 12.1 11.1 10.9 13.4 12.5 11.6 9.6 13.4 International reserves (USDbn) 467.0 470.2 473.3 476.3 479.1 481.9 484.7 487.6 490.5 493.4 496.3 Policy rate, end-quarter (%) 1.375 1.375 1.375 1.375 1.375 1.375 1.375 1.375 1.375 1.375 1.375 5yr yield, end-quarter (%) 0.59 0.63 0.60 0.60 0.60 0.60 n/a n/a n/a n/a n/a TWD/USD, end-quarter 31.07 31.00 31.60 31.60 31.60 31.60 31.60 31.60 31.60 31.60 31.60 TWD/EUR, end-quarter 35.42 34.10 34.76 34.76 34.76 34.76 34.76 34.76 34.76 34.76 34.76
Note: 2021 FX numbers are assumptions, not forecasts Source: CEIC, HSBC forecasts
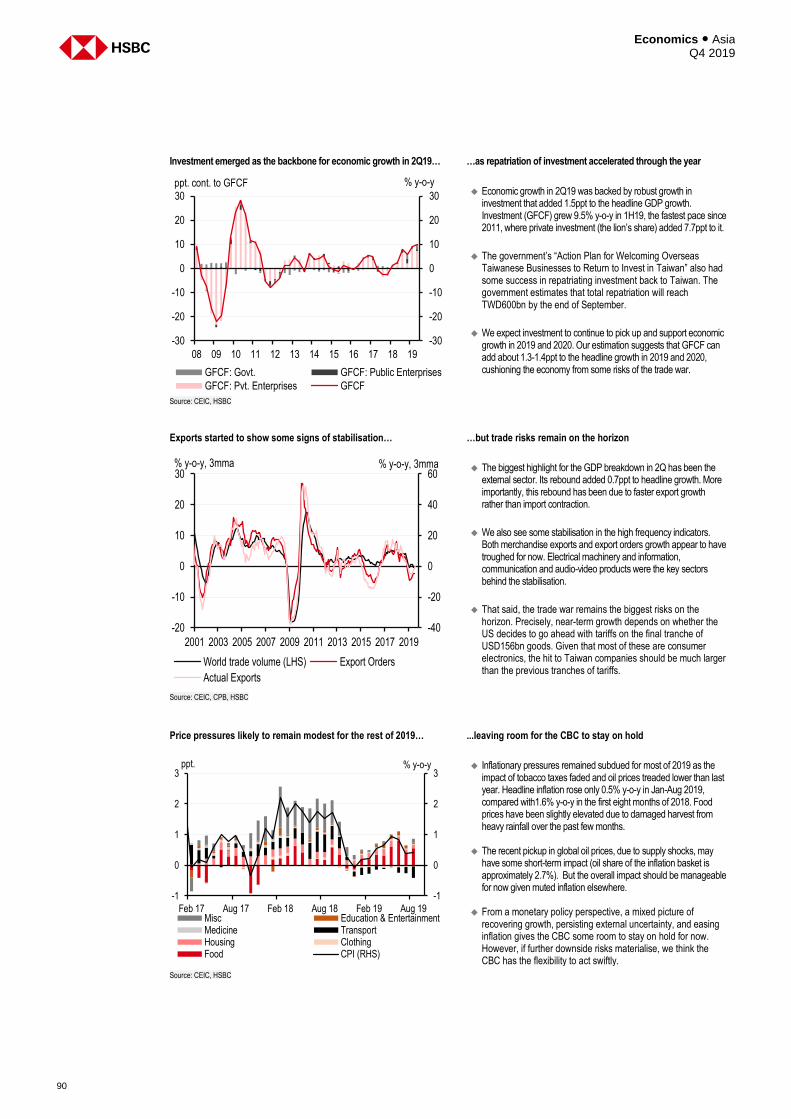
Economics ● Asia Q4 2019
90
Investment emerged as the backbone for economic growth in 2Q19… …as repatriation of investment accelerated through the year
Economic growth in 2Q19 was backed by robust growth in
investment that added 1.5ppt to the headline GDP growth. Investment (GFCF) grew 9.5% y-o-y in 1H19, the fastest pace since 2011, where private investment (the lion’s share) added 7.7ppt to it.
The government’s “Action Plan for Welcoming Overseas Taiwanese Businesses to Return to Invest in Taiwan” also had some success in repatriating investment back to Taiwan. The government estimates that total repatriation will reach TWD600bn by the end of September.
We expect investment to continue to pick up and support economic growth in 2019 and 2020. Our estimation suggests that GFCF can add about 1.3-1.4ppt to the headline growth in 2019 and 2020, cushioning the economy from some risks of the trade war.
Source: CEIC, HSBC
Exports started to show some signs of stabilisation… …but trade risks remain on the horizon
The biggest highlight for the GDP breakdown in 2Q has been the
external sector. Its rebound added 0.7ppt to headline growth. More importantly, this rebound has been due to faster export growth rather than import contraction.
We also see some stabilisation in the high frequency indicators. Both merchandise exports and export orders growth appear to have troughed for now. Electrical machinery and information, communication and audio-video products were the key sectors behind the stabilisation.
That said, the trade war remains the biggest risks on the horizon. Precisely, near-term growth depends on whether the US decides to go ahead with tariffs on the final tranche of USD156bn goods. Given that most of these are consumer electronics, the hit to Taiwan companies should be much larger than the previous tranches of tariffs.
Source: CEIC, CPB, HSBC
Price pressures likely to remain modest for the rest of 2019… ...leaving room for the CBC to stay on hold
Inflationary pressures remained subdued for most of 2019 as the
impact of tobacco taxes faded and oil prices treaded lower than last year. Headline inflation rose only 0.5% y-o-y in Jan-Aug 2019, compared with1.6% y-o-y in the first eight months of 2018. Food prices have been slightly elevated due to damaged harvest from heavy rainfall over the past few months.
The recent pickup in global oil prices, due to supply shocks, may
have some short-term impact (oil share of the inflation basket is approximately 2.7%). But the overall impact should be manageable for now given muted inflation elsewhere.
From a monetary policy perspective, a mixed picture of
recovering growth, persisting external uncertainty, and easing inflation gives the CBC some room to stay on hold for now. However, if further downside risks materialise, we think the CBC has the flexibility to act swiftly.
Source: CEIC, HSBC
-30
-20
-10
0
10
20
30
-30
-20
-10
0
10
20
30
08 09 10 11 12 13 14 15 16 17 18 19
% y-o-yppt. cont. to GFCF
GFCF: Govt. GFCF: Public Enterprises
GFCF: Pvt. Enterprises GFCF
-40
-20
0
20
40
60
-20
-10
0
10
20
30
2001 2003 2005 2007 2009 2011 2013 2015 2017 2019
% y-o-y, 3mma% y-o-y, 3mma
World trade volume (LHS) Export Orders
Actual Exports
Feb 17 Aug 17 Feb 18 Aug 18 Feb 19 Aug 19
-1
0
1
2
3
-1
0
1
2
3
Misc Education & EntertainmentMedicine TransportHousing ClothingFood CPI (RHS)
% y-o-yppt.
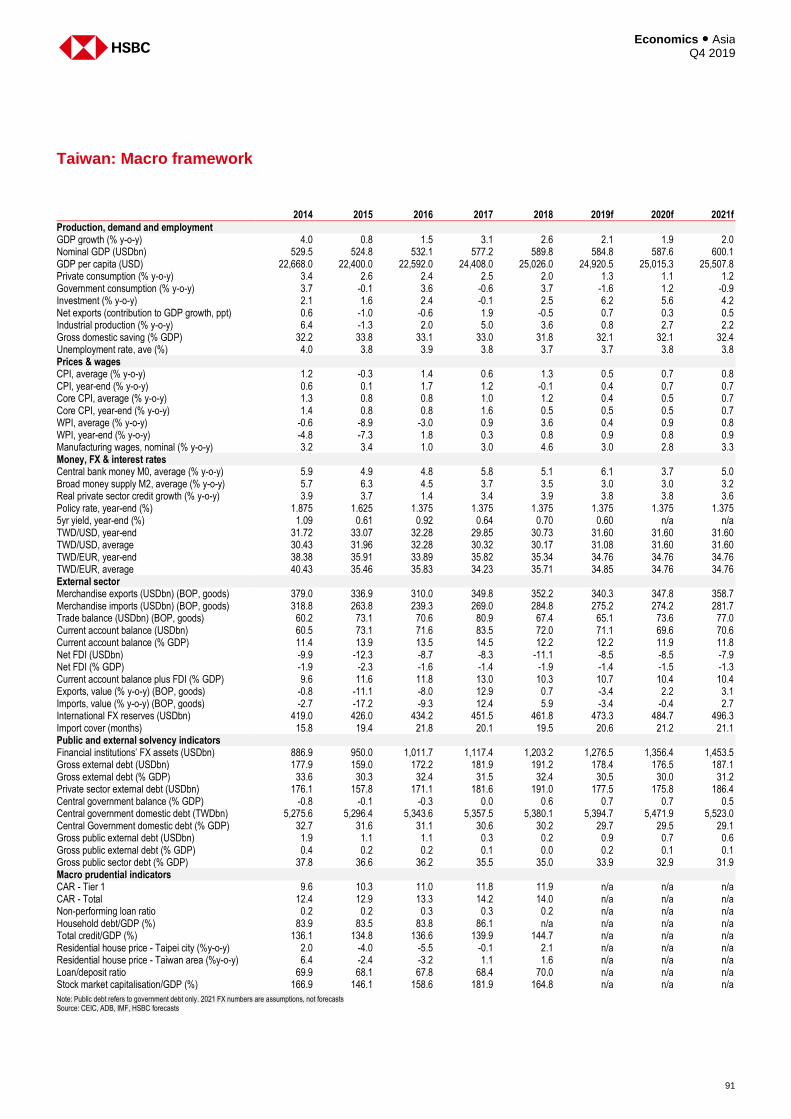
91
Economics ● Asia Q4 2019
Taiwan: Macro framework
2014 2015 2016 2017 2018 2019f 2020f 2021f
Production, demand and employment GDP growth (% y-o-y) 4.0 0.8 1.5 3.1 2.6 2.1 1.9 2.0 Nominal GDP (USDbn) 529.5 524.8 532.1 577.2 589.8 584.8 587.6 600.1 GDP per capita (USD) 22,668.0 22,400.0 22,592.0 24,408.0 25,026.0 24,920.5 25,015.3 25,507.8 Private consumption (% y-o-y) 3.4 2.6 2.4 2.5 2.0 1.3 1.1 1.2 Government consumption (% y-o-y) 3.7 -0.1 3.6 -0.6 3.7 -1.6 1.2 -0.9 Investment (% y-o-y) 2.1 1.6 2.4 -0.1 2.5 6.2 5.6 4.2 Net exports (contribution to GDP growth, ppt) 0.6 -1.0 -0.6 1.9 -0.5 0.7 0.3 0.5 Industrial production (% y-o-y) 6.4 -1.3 2.0 5.0 3.6 0.8 2.7 2.2 Gross domestic saving (% GDP) 32.2 33.8 33.1 33.0 31.8 32.1 32.1 32.4 Unemployment rate, ave (%) 4.0 3.8 3.9 3.8 3.7 3.7 3.8 3.8 Prices & wages CPI, average (% y-o-y) 1.2 -0.3 1.4 0.6 1.3 0.5 0.7 0.8 CPI, year-end (% y-o-y) 0.6 0.1 1.7 1.2 -0.1 0.4 0.7 0.7 Core CPI, average (% y-o-y) 1.3 0.8 0.8 1.0 1.2 0.4 0.5 0.7 Core CPI, year-end (% y-o-y) 1.4 0.8 0.8 1.6 0.5 0.5 0.5 0.7 WPI, average (% y-o-y) -0.6 -8.9 -3.0 0.9 3.6 0.4 0.9 0.8 WPI, year-end (% y-o-y) -4.8 -7.3 1.8 0.3 0.8 0.9 0.8 0.9 Manufacturing wages, nominal (% y-o-y) 3.2 3.4 1.0 3.0 4.6 3.0 2.8 3.3 Money, FX & interest rates Central bank money M0, average (% y-o-y) 5.9 4.9 4.8 5.8 5.1 6.1 3.7 5.0 Broad money supply M2, average (% y-o-y) 5.7 6.3 4.5 3.7 3.5 3.0 3.0 3.2 Real private sector credit growth (% y-o-y) 3.9 3.7 1.4 3.4 3.9 3.8 3.8 3.6 Policy rate, year-end (%) 1.875 1.625 1.375 1.375 1.375 1.375 1.375 1.375 5yr yield, year-end (%) 1.09 0.61 0.92 0.64 0.70 0.60 n/a n/a TWD/USD, year-end 31.72 33.07 32.28 29.85 30.73 31.60 31.60 31.60 TWD/USD, average 30.43 31.96 32.28 30.32 30.17 31.08 31.60 31.60 TWD/EUR, year-end 38.38 35.91 33.89 35.82 35.34 34.76 34.76 34.76 TWD/EUR, average 40.43 35.46 35.83 34.23 35.71 34.85 34.76 34.76 External sector Merchandise exports (USDbn) (BOP, goods) 379.0 336.9 310.0 349.8 352.2 340.3 347.8 358.7 Merchandise imports (USDbn) (BOP, goods) 318.8 263.8 239.3 269.0 284.8 275.2 274.2 281.7 Trade balance (USDbn) (BOP, goods) 60.2 73.1 70.6 80.9 67.4 65.1 73.6 77.0 Current account balance (USDbn) 60.5 73.1 71.6 83.5 72.0 71.1 69.6 70.6 Current account balance (% GDP) 11.4 13.9 13.5 14.5 12.2 12.2 11.9 11.8 Net FDI (USDbn) -9.9 -12.3 -8.7 -8.3 -11.1 -8.5 -8.5 -7.9 Net FDI (% GDP) -1.9 -2.3 -1.6 -1.4 -1.9 -1.4 -1.5 -1.3 Current account balance plus FDI (% GDP) 9.6 11.6 11.8 13.0 10.3 10.7 10.4 10.4 Exports, value (% y-o-y) (BOP, goods) -0.8 -11.1 -8.0 12.9 0.7 -3.4 2.2 3.1 Imports, value (% y-o-y) (BOP, goods) -2.7 -17.2 -9.3 12.4 5.9 -3.4 -0.4 2.7 International FX reserves (USDbn) 419.0 426.0 434.2 451.5 461.8 473.3 484.7 496.3 Import cover (months) 15.8 19.4 21.8 20.1 19.5 20.6 21.2 21.1 Public and external solvency indicators Financial institutions’ FX assets (USDbn) 886.9 950.0 1,011.7 1,117.4 1,203.2 1,276.5 1,356.4 1,453.5 Gross external debt (USDbn) 177.9 159.0 172.2 181.9 191.2 178.4 176.5 187.1 Gross external debt (% GDP) 33.6 30.3 32.4 31.5 32.4 30.5 30.0 31.2 Private sector external debt (USDbn) 176.1 157.8 171.1 181.6 191.0 177.5 175.8 186.4 Central government balance (% GDP) -0.8 -0.1 -0.3 0.0 0.6 0.7 0.7 0.5 Central government domestic debt (TWDbn) 5,275.6 5,296.4 5,343.6 5,357.5 5,380.1 5,394.7 5,471.9 5,523.0 Central Government domestic debt (% GDP) 32.7 31.6 31.1 30.6 30.2 29.7 29.5 29.1 Gross public external debt (USDbn) 1.9 1.1 1.1 0.3 0.2 0.9 0.7 0.6 Gross public external debt (% GDP) 0.4 0.2 0.2 0.1 0.0 0.2 0.1 0.1 Gross public sector debt (% GDP) 37.8 36.6 36.2 35.5 35.0 33.9 32.9 31.9 Macro prudential indicators CAR - Tier 1 9.6 10.3 11.0 11.8 11.9 n/a n/a n/a CAR - Total 12.4 12.9 13.3 14.2 14.0 n/a n/a n/a Non-performing loan ratio 0.2 0.2 0.3 0.3 0.2 n/a n/a n/a Household debt/GDP (%) 83.9 83.5 83.8 86.1 n/a n/a n/a n/a Total credit/GDP (%) 136.1 134.8 136.6 139.9 144.7 n/a n/a n/a Residential house price - Taipei city (%y-o-y) 2.0 -4.0 -5.5 -0.1 2.1 n/a n/a n/a Residential house price - Taiwan area (%y-o-y) 6.4 -2.4 -3.2 1.1 1.6 n/a n/a n/a Loan/deposit ratio 69.9 68.1 67.8 68.4 70.0 n/a n/a n/a Stock market capitalisation/GDP (%) 166.9 146.1 158.6 181.9 164.8 n/a n/a n/a
Note: Public debt refers to government debt only. 2021 FX numbers are assumptions, not forecasts Source: CEIC, ADB, IMF, HSBC forecasts
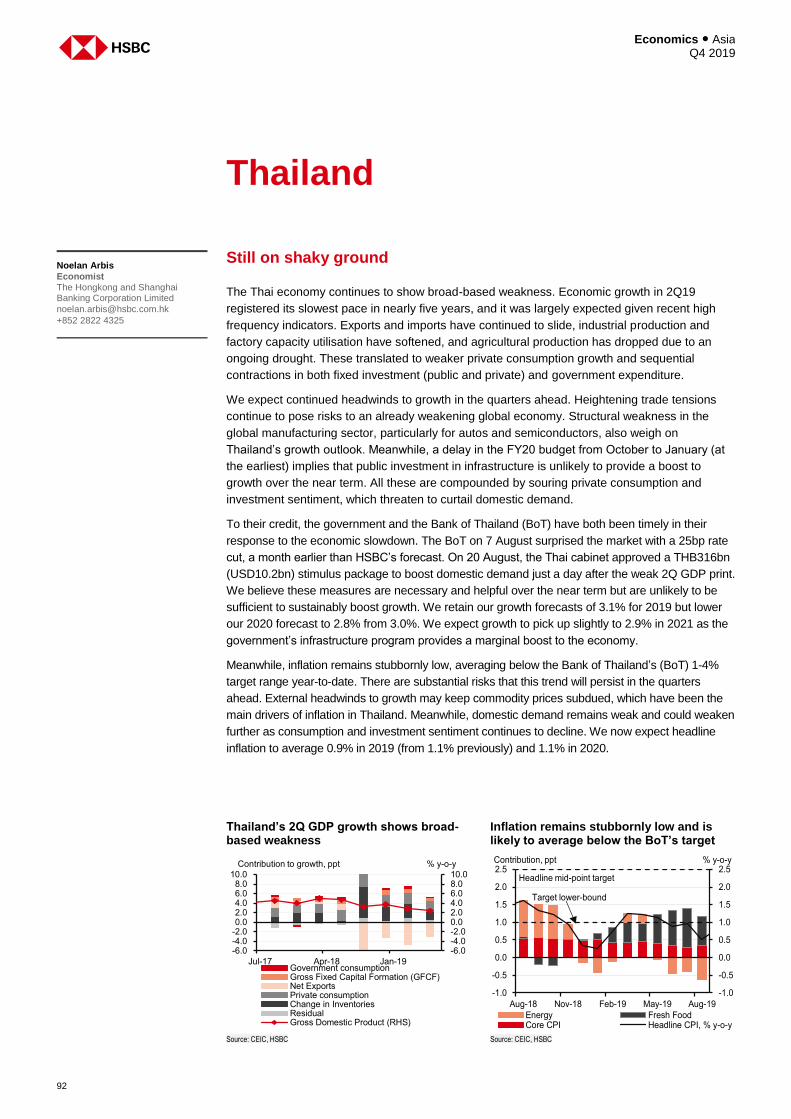
Economics ● Asia Q4 2019
92
Thailand
Still on shaky ground
The Thai economy continues to show broad-based weakness. Economic growth in 2Q19
registered its slowest pace in nearly five years, and it was largely expected given recent high
frequency indicators. Exports and imports have continued to slide, industrial production and
factory capacity utilisation have softened, and agricultural production has dropped due to an
ongoing drought. These translated to weaker private consumption growth and sequential
contractions in both fixed investment (public and private) and government expenditure.
We expect continued headwinds to growth in the quarters ahead. Heightening trade tensions
continue to pose risks to an already weakening global economy. Structural weakness in the
global manufacturing sector, particularly for autos and semiconductors, also weigh on
Thailand’s growth outlook. Meanwhile, a delay in the FY20 budget from October to January (at
the earliest) implies that public investment in infrastructure is unlikely to provide a boost to
growth over the near term. All these are compounded by souring private consumption and
investment sentiment, which threaten to curtail domestic demand.
To their credit, the government and the Bank of Thailand (BoT) have both been timely in their
response to the economic slowdown. The BoT on 7 August surprised the market with a 25bp rate
cut, a month earlier than HSBC’s forecast. On 20 August, the Thai cabinet approved a THB316bn
(USD10.2bn) stimulus package to boost domestic demand just a day after the weak 2Q GDP print.
We believe these measures are necessary and helpful over the near term but are unlikely to be
sufficient to sustainably boost growth. We retain our growth forecasts of 3.1% for 2019 but lower
our 2020 forecast to 2.8% from 3.0%. We expect growth to pick up slightly to 2.9% in 2021 as the
government’s infrastructure program provides a marginal boost to the economy.
Meanwhile, inflation remains stubbornly low, averaging below the Bank of Thailand’s (BoT) 1-4%
target range year-to-date. There are substantial risks that this trend will persist in the quarters
ahead. External headwinds to growth may keep commodity prices subdued, which have been the
main drivers of inflation in Thailand. Meanwhile, domestic demand remains weak and could weaken
further as consumption and investment sentiment continues to decline. We now expect headline
inflation to average 0.9% in 2019 (from 1.1% previously) and 1.1% in 2020.
Noelan Arbis
Economist The Hongkong and Shanghai Banking Corporation Limited
+852 2822 4325
Thailand’s 2Q GDP growth shows broad-based weakness
Inflation remains stubbornly low and is likely to average below the BoT’s target
Source: CEIC, HSBC Source: CEIC, HSBC
-6.0-4.0-2.00.02.04.06.08.010.0
-6.0-4.0-2.00.02.04.06.08.0
10.0
Jul-17 Apr-18 Jan-19Government consumptionGross Fixed Capital Formation (GFCF)Net ExportsPrivate consumptionChange in InventoriesResidualGross Domestic Product (RHS)
Contribution to growth, ppt % y-o-y
-1.0
-0.5
0.0
0.5
1.0
1.5
2.0
2.5
-1.0
-0.5
0.0
0.5
1.0
1.5
2.0
2.5
Aug-18 Nov-18 Feb-19 May-19 Aug-19
Energy Fresh FoodCore CPI Headline CPI, % y-o-y
Headline mid-point target
Target lower-bound
Contribution, ppt % y-o-y

93
Economics ● Asia Q4 2019
Policy issues
Stubbornly low inflation and slowing growth should prompt additional monetary loosening from the
BoT. We believe the BoT’s rate cut in August was necessary given slowing global and domestic
growth, stubbornly low inflation, a persistently strong THB, and monetary easing from other major
central banks. But these compounding factors also mean that one rate cut alone is likely to be
insufficient. Further downside risks to growth have manifested themselves in the form of heightening
trade tensions and a delay in the FY20 fiscal budget. We expect another 25bp policy rate cut by
year-end, bringing the benchmark rate back down to its historical low of 1.25%. We also pencil in an
additional 25bp cut in 1Q20 on the assumption that global growth will continue to deteriorate, posing
further external risks to Thailand’s growth.
The BoT’s concerns about financial stability risks are likely to remain throughout the current easing
cycle, which we believe will prevent that BoT from engaging in a super aggressive easing cycle,
unless we see an outright recession. Household debt remains a concern at nearly 80% of GDP. That
said, the BoT is likely to prioritise growth over the near term as financial stability risks could be further
amplified if growth slows further and threatens the country’s most financially vulnerable.
Meanwhile, we believe the government’s USD10.2bn stimulus program is enough to boost domestic
demand for 2H19, but its impact is likely to be short-lived (see: Thailand stimulus: Fiscal to the
rescue, 21 August 2019). The impacts of the pro-consumer measures announced are likely to fade
by year-end, given the terms and conditions of the government’s additional allowance program.
Meanwhile, some of the pro-SME measures should help lift private investment growth, but its impact
is likely to be more drawn out and less pronounced than big-ticket infrastructure projects.
Risks
External headwinds remain the biggest threat to Thailand’s economy. Exports and imports
remained in contraction as of 2Q19 as a result of looming trade tensions and a cyclical
downswing in the automobile and semiconductor sectors. These factors, on balance, are likely
to weigh on Thailand’s growth despite evidence of trade and FDI diversion, which has enabled
the country to raise exports to the US. High frequency indicators also suggest a deterioration in
domestic demand as reflected in declining consumer and investment sentiment. Additional fiscal
and monetary support in 2020 could be necessary if growth continues to face headwinds.
Key forecasts
2Q 19 3Q 19e 4Q 19f 1Q 20f 2Q 20f 3Q 20f 4Q 20f 1Q 21f 2Q 21f 3Q 21f 4Q 21f
GDP (% y-o-y) 2.3 3.5 3.6 3.0 3.1 2.6 2.3 2.6 2.7 3.0 3.3 GDP sa (% q-o-q) 0.6 1.0 0.9 0.5 0.7 0.5 0.6 0.9 0.8 0.8 0.8 Industrial production (% y-o-y) -5.4 -1.5 -2.2 1.7 1.7 1.4 0.7 1.4 1.3 1.2 1.2 CPI, (% q-o-q saar) 1.9 0.2 1.6 1.8 0.5 0.9 0.8 1.8 0.4 0.9 0.8 CPI, average (% y-o-y) 1.1 0.8 1.1 1.4 1.0 1.2 1.0 1.0 1.0 1.0 1.0 PPI, average (% y-o-y) -1.1 0.2 0.3 0.2 0.0 0.1 0.1 0.1 0.2 0.1 0.0 Exports, value (% y-o-y) -4.2 -1.0 -1.0 0.7 1.0 2.2 2.3 2.5 2.4 2.4 2.3 Imports, value (% y-o-y) -3.4 -2.0 -2.0 2.5 3.0 3.0 3.0 5.8 5.8 5.8 5.8 Trade balance (% GDP) 4.4 3.5 3.7 3.9 3.5 3.2 3.5 2.7 2.1 1.6 2.0 Current account (% GDP) 3.8 5.4 5.1 7.5 4.0 5.8 5.6 7.0 3.3 5.4 5.5 International reserves (USDbn) 206.6 206.8 207.3 212.0 210.9 211.7 212.7 217.0 215.2 215.8 217.0 Policy rate, end-quarter (%) 1.75 1.50 1.25 1.25 1.25 1.25 1.25 1.25 1.25 1.25 1.25 5yr yield, end-quarter (%) 1.91 1.37 1.10 1.10 1.10 1.10 n/a n/a n/a n/a n/a THB/USD, end-quarter 31.10 30.50 31.80 31.80 31.80 31.80 31.80 31.80 31.80 31.80 31.80 THB/EUR, end-quarter 35.46 33.55 34.98 34.98 34.98 34.98 34.98 34.98 34.98 34.98 34.98
Note: 2021 FX numbers are assumptions, not forecasts Source: CEIC, HSBC forecasts
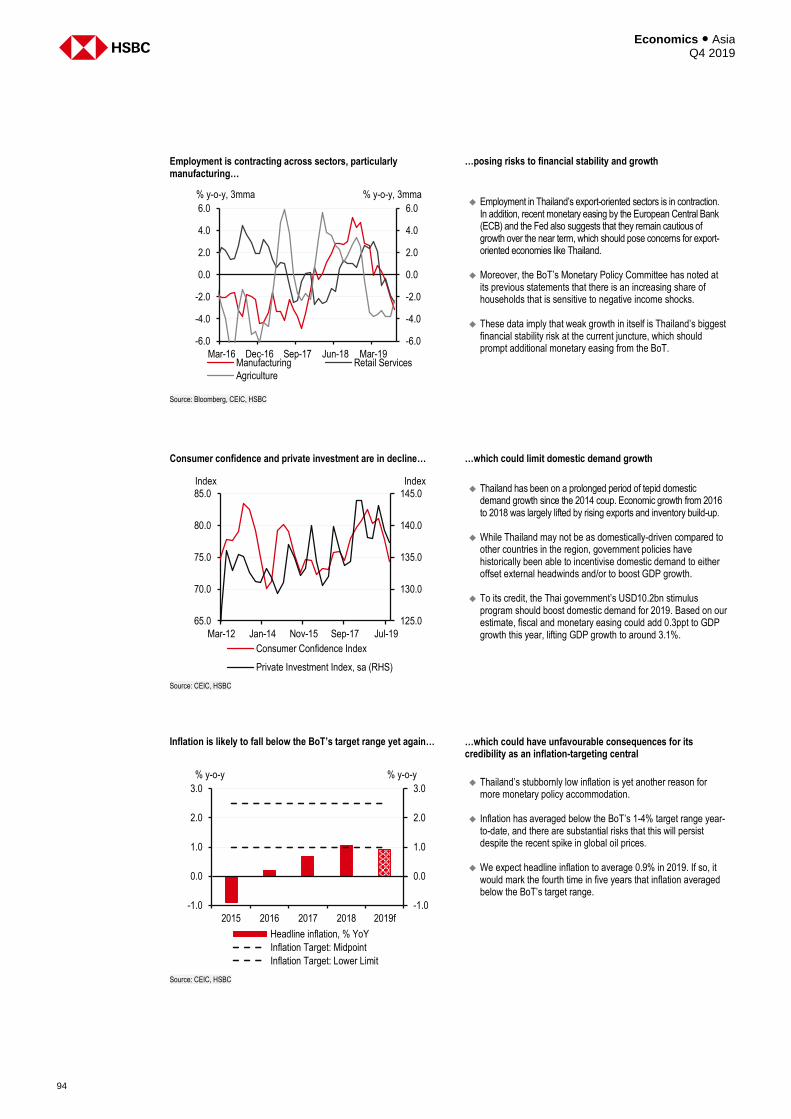
Economics ● Asia Q4 2019
94
Employment is contracting across sectors, particularly manufacturing…
…posing risks to financial stability and growth
Employment in Thailand’s export-oriented sectors is in contraction.
In addition, recent monetary easing by the European Central Bank (ECB) and the Fed also suggests that they remain cautious of growth over the near term, which should pose concerns for export-oriented economies like Thailand.
Moreover, the BoT’s Monetary Policy Committee has noted at its previous statements that there is an increasing share of households that is sensitive to negative income shocks.
These data imply that weak growth in itself is Thailand’s biggest financial stability risk at the current juncture, which should prompt additional monetary easing from the BoT.
Source: Bloomberg, CEIC, HSBC
Consumer confidence and private investment are in decline… …which could limit domestic demand growth
Thailand has been on a prolonged period of tepid domestic
demand growth since the 2014 coup. Economic growth from 2016 to 2018 was largely lifted by rising exports and inventory build-up.
While Thailand may not be as domestically-driven compared to other countries in the region, government policies have historically been able to incentivise domestic demand to either offset external headwinds and/or to boost GDP growth.
To its credit, the Thai government’s USD10.2bn stimulus program should boost domestic demand for 2019. Based on our estimate, fiscal and monetary easing could add 0.3ppt to GDP growth this year, lifting GDP growth to around 3.1%.
Source: CEIC, HSBC
Inflation is likely to fall below the BoT’s target range yet again… …which could have unfavourable consequences for its credibility as an inflation-targeting central
Thailand’s stubbornly low inflation is yet another reason for
more monetary policy accommodation.
Inflation has averaged below the BoT’s 1-4% target range year-to-date, and there are substantial risks that this will persist despite the recent spike in global oil prices.
We expect headline inflation to average 0.9% in 2019. If so, it would mark the fourth time in five years that inflation averaged below the BoT’s target range.
Source: CEIC, HSBC
-6.0
-4.0
-2.0
0.0
2.0
4.0
6.0
-6.0
-4.0
-2.0
0.0
2.0
4.0
6.0
Mar-16 Dec-16 Sep-17 Jun-18 Mar-19Manufacturing Retail Services
Agriculture
% y-o-y, 3mma % y-o-y, 3mma
125.0
130.0
135.0
140.0
145.0
65.0
70.0
75.0
80.0
85.0
Mar-12 Jan-14 Nov-15 Sep-17 Jul-19
Consumer Confidence Index
Private Investment Index, sa (RHS)
Index Index
-1.0
0.0
1.0
2.0
3.0
-1.0
0.0
1.0
2.0
3.0
2015 2016 2017 2018 2019f
Headline inflation, % YoY
Inflation Target: Midpoint
Inflation Target: Lower Limit
% y-o-y % y-o-y
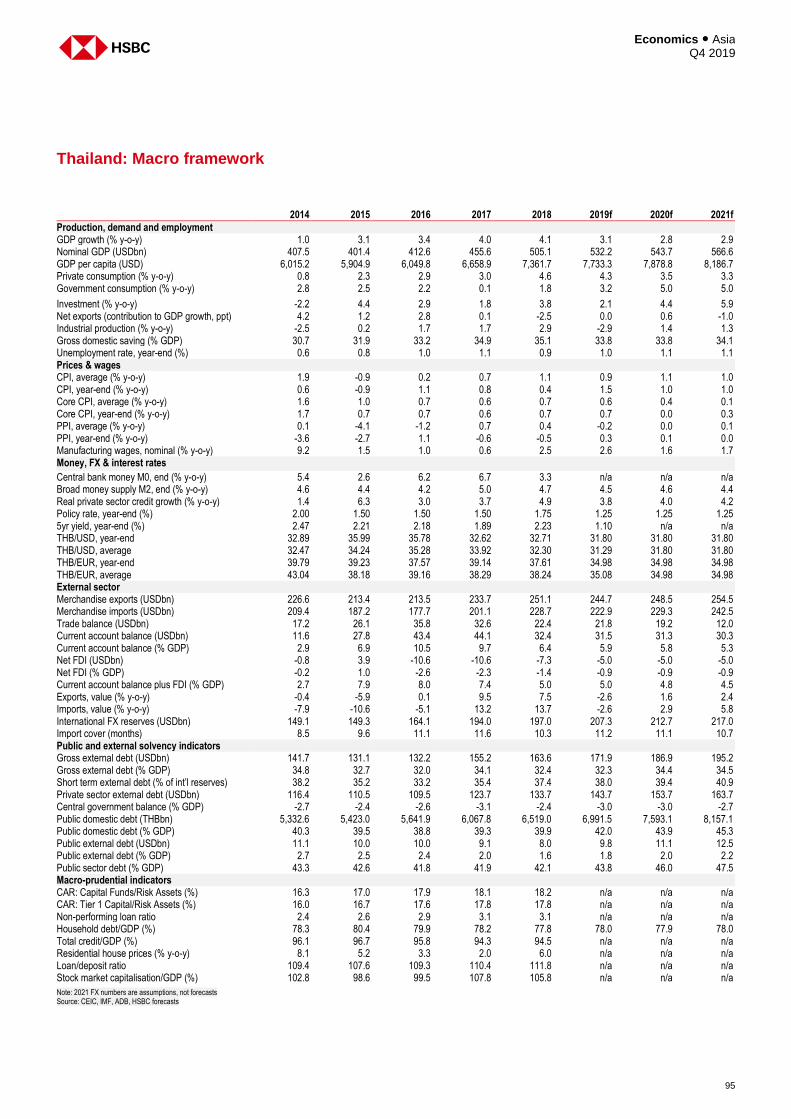
95
Economics ● Asia Q4 2019
Thailand: Macro framework
2014 2015 2016 2017 2018 2019f 2020f 2021f
Production, demand and employment GDP growth (% y-o-y) 1.0 3.1 3.4 4.0 4.1 3.1 2.8 2.9 Nominal GDP (USDbn) 407.5 401.4 412.6 455.6 505.1 532.2 543.7 566.6 GDP per capita (USD) 6,015.2 5,904.9 6,049.8 6,658.9 7,361.7 7,733.3 7,878.8 8,186.7 Private consumption (% y-o-y) 0.8 2.3 2.9 3.0 4.6 4.3 3.5 3.3 Government consumption (% y-o-y) 2.8 2.5 2.2 0.1 1.8 3.2 5.0 5.0
Investment (% y-o-y) -2.2 4.4 2.9 1.8 3.8 2.1 4.4 5.9 Net exports (contribution to GDP growth, ppt) 4.2 1.2 2.8 0.1 -2.5 0.0 0.6 -1.0 Industrial production (% y-o-y) -2.5 0.2 1.7 1.7 2.9 -2.9 1.4 1.3 Gross domestic saving (% GDP) 30.7 31.9 33.2 34.9 35.1 33.8 33.8 34.1 Unemployment rate, year-end (%) 0.6 0.8 1.0 1.1 0.9 1.0 1.1 1.1 Prices & wages CPI, average (% y-o-y) 1.9 -0.9 0.2 0.7 1.1 0.9 1.1 1.0 CPI, year-end (% y-o-y) 0.6 -0.9 1.1 0.8 0.4 1.5 1.0 1.0 Core CPI, average (% y-o-y) 1.6 1.0 0.7 0.6 0.7 0.6 0.4 0.1 Core CPI, year-end (% y-o-y) 1.7 0.7 0.7 0.6 0.7 0.7 0.0 0.3 PPI, average (% y-o-y) 0.1 -4.1 -1.2 0.7 0.4 -0.2 0.0 0.1 PPI, year-end (% y-o-y) -3.6 -2.7 1.1 -0.6 -0.5 0.3 0.1 0.0 Manufacturing wages, nominal (% y-o-y) 9.2 1.5 1.0 0.6 2.5 2.6 1.6 1.7 Money, FX & interest rates
Central bank money M0, end (% y-o-y) 5.4 2.6 6.2 6.7 3.3 n/a n/a n/a Broad money supply M2, end (% y-o-y) 4.6 4.4 4.2 5.0 4.7 4.5 4.6 4.4 Real private sector credit growth (% y-o-y) 1.4 6.3 3.0 3.7 4.9 3.8 4.0 4.2 Policy rate, year-end (%) 2.00 1.50 1.50 1.50 1.75 1.25 1.25 1.25 5yr yield, year-end (%) 2.47 2.21 2.18 1.89 2.23 1.10 n/a n/a THB/USD, year-end 32.89 35.99 35.78 32.62 32.71 31.80 31.80 31.80 THB/USD, average 32.47 34.24 35.28 33.92 32.30 31.29 31.80 31.80 THB/EUR, year-end 39.79 39.23 37.57 39.14 37.61 34.98 34.98 34.98 THB/EUR, average 43.04 38.18 39.16 38.29 38.24 35.08 34.98 34.98 External sector Merchandise exports (USDbn) 226.6 213.4 213.5 233.7 251.1 244.7 248.5 254.5 Merchandise imports (USDbn) 209.4 187.2 177.7 201.1 228.7 222.9 229.3 242.5 Trade balance (USDbn) 17.2 26.1 35.8 32.6 22.4 21.8 19.2 12.0 Current account balance (USDbn) 11.6 27.8 43.4 44.1 32.4 31.5 31.3 30.3 Current account balance (% GDP) 2.9 6.9 10.5 9.7 6.4 5.9 5.8 5.3 Net FDI (USDbn) -0.8 3.9 -10.6 -10.6 -7.3 -5.0 -5.0 -5.0 Net FDI (% GDP) -0.2 1.0 -2.6 -2.3 -1.4 -0.9 -0.9 -0.9 Current account balance plus FDI (% GDP) 2.7 7.9 8.0 7.4 5.0 5.0 4.8 4.5 Exports, value (% y-o-y) -0.4 -5.9 0.1 9.5 7.5 -2.6 1.6 2.4 Imports, value (% y-o-y) -7.9 -10.6 -5.1 13.2 13.7 -2.6 2.9 5.8 International FX reserves (USDbn) 149.1 149.3 164.1 194.0 197.0 207.3 212.7 217.0 Import cover (months) 8.5 9.6 11.1 11.6 10.3 11.2 11.1 10.7 Public and external solvency indicators Gross external debt (USDbn) 141.7 131.1 132.2 155.2 163.6 171.9 186.9 195.2 Gross external debt (% GDP) 34.8 32.7 32.0 34.1 32.4 32.3 34.4 34.5 Short term external debt (% of int’l reserves) 38.2 35.2 33.2 35.4 37.4 38.0 39.4 40.9 Private sector external debt (USDbn) 116.4 110.5 109.5 123.7 133.7 143.7 153.7 163.7 Central government balance (% GDP) -2.7 -2.4 -2.6 -3.1 -2.4 -3.0 -3.0 -2.7 Public domestic debt (THBbn) 5,332.6 5,423.0 5,641.9 6,067.8 6,519.0 6,991.5 7,593.1 8,157.1 Public domestic debt (% GDP) 40.3 39.5 38.8 39.3 39.9 42.0 43.9 45.3 Public external debt (USDbn) 11.1 10.0 10.0 9.1 8.0 9.8 11.1 12.5 Public external debt (% GDP) 2.7 2.5 2.4 2.0 1.6 1.8 2.0 2.2 Public sector debt (% GDP) 43.3 42.6 41.8 41.9 42.1 43.8 46.0 47.5 Macro-prudential indicators CAR: Capital Funds/Risk Assets (%) 16.3 17.0 17.9 18.1 18.2 n/a n/a n/a CAR: Tier 1 Capital/Risk Assets (%) 16.0 16.7 17.6 17.8 17.8 n/a n/a n/a Non-performing loan ratio 2.4 2.6 2.9 3.1 3.1 n/a n/a n/a Household debt/GDP (%) 78.3 80.4 79.9 78.2 77.8 78.0 77.9 78.0 Total credit/GDP (%) 96.1 96.7 95.8 94.3 94.5 n/a n/a n/a Residential house prices (% y-o-y) 8.1 5.2 3.3 2.0 6.0 n/a n/a n/a Loan/deposit ratio 109.4 107.6 109.3 110.4 111.8 n/a n/a n/a Stock market capitalisation/GDP (%) 102.8 98.6 99.5 107.8 105.8 n/a n/a n/a
Note: 2021 FX numbers are assumptions, not forecasts Source: CEIC, IMF, ADB, HSBC forecasts
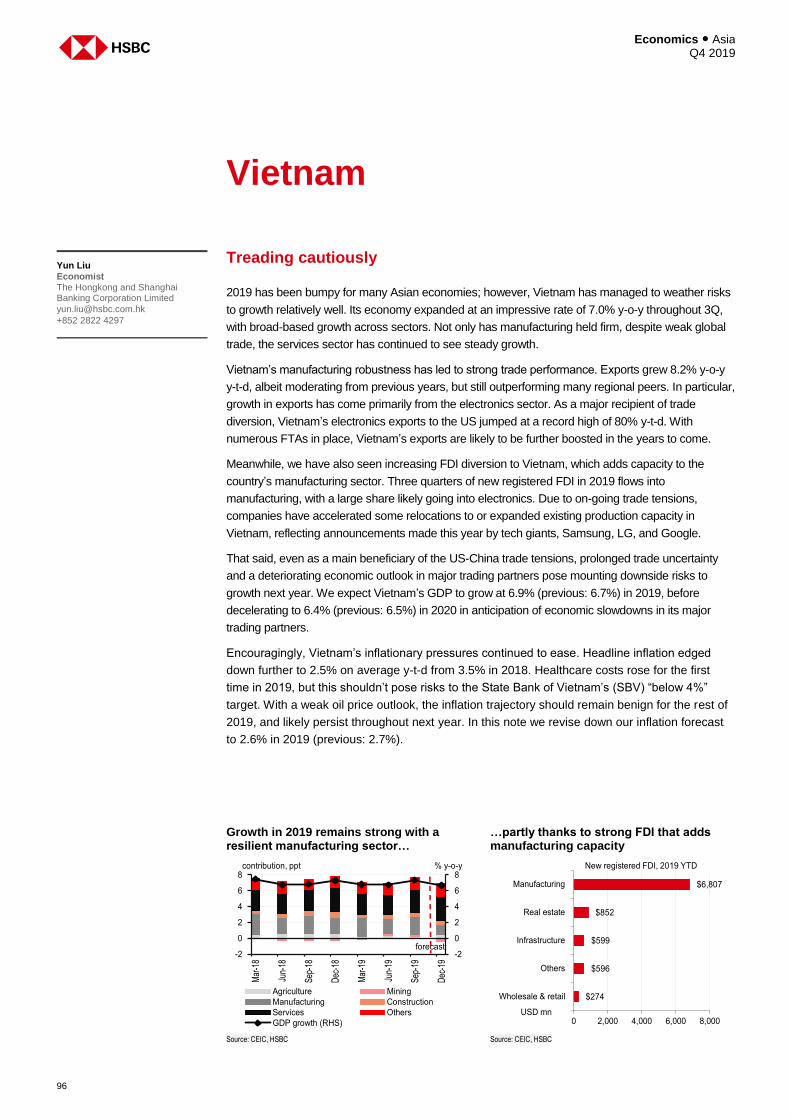
Economics ● Asia Q4 2019
96
Vietnam
Treading cautiously
2019 has been bumpy for many Asian economies; however, Vietnam has managed to weather risks
to growth relatively well. Its economy expanded at an impressive rate of 7.0% y-o-y throughout 3Q,
with broad-based growth across sectors. Not only has manufacturing held firm, despite weak global
trade, the services sector has continued to see steady growth.
Vietnam’s manufacturing robustness has led to strong trade performance. Exports grew 8.2% y-o-y
y-t-d, albeit moderating from previous years, but still outperforming many regional peers. In particular,
growth in exports has come primarily from the electronics sector. As a major recipient of trade
diversion, Vietnam’s electronics exports to the US jumped at a record high of 80% y-t-d. With
numerous FTAs in place, Vietnam’s exports are likely to be further boosted in the years to come.
Meanwhile, we have also seen increasing FDI diversion to Vietnam, which adds capacity to the
country’s manufacturing sector. Three quarters of new registered FDI in 2019 flows into
manufacturing, with a large share likely going into electronics. Due to on-going trade tensions,
companies have accelerated some relocations to or expanded existing production capacity in
Vietnam, reflecting announcements made this year by tech giants, Samsung, LG, and Google.
That said, even as a main beneficiary of the US-China trade tensions, prolonged trade uncertainty
and a deteriorating economic outlook in major trading partners pose mounting downside risks to
growth next year. We expect Vietnam’s GDP to grow at 6.9% (previous: 6.7%) in 2019, before
decelerating to 6.4% (previous: 6.5%) in 2020 in anticipation of economic slowdowns in its major
trading partners.
Encouragingly, Vietnam’s inflationary pressures continued to ease. Headline inflation edged
down further to 2.5% on average y-t-d from 3.5% in 2018. Healthcare costs rose for the first
time in 2019, but this shouldn’t pose risks to the State Bank of Vietnam’s (SBV) “below 4%”
target. With a weak oil price outlook, the inflation trajectory should remain benign for the rest of
2019, and likely persist throughout next year. In this note we revise down our inflation forecast
to 2.6% in 2019 (previous: 2.7%).
Yun Liu
Economist The Hongkong and Shanghai Banking Corporation Limited
+852 2822 4297
Growth in 2019 remains strong with a resilient manufacturing sector…
…partly thanks to strong FDI that adds manufacturing capacity
Source: CEIC, HSBC Source: CEIC, HSBC
-2
0
2
4
6
8
-2
0
2
4
6
8
Mar
-18
Jun-
18
Sep
-18
Dec
-18
Mar
-19
Jun-
19
Sep
-19
Dec
-19
Agriculture Mining
Manufacturing Construction
Services Others
GDP growth (RHS)
contribution, ppt % y-o-y
forecast
$274
$596
$599
$852
$6,807
0 2,000 4,000 6,000 8,000
Wholesale & retail
Others
Infrastructure
Real estate
Manufacturing
USD mn
New registered FDI, 2019 YTD
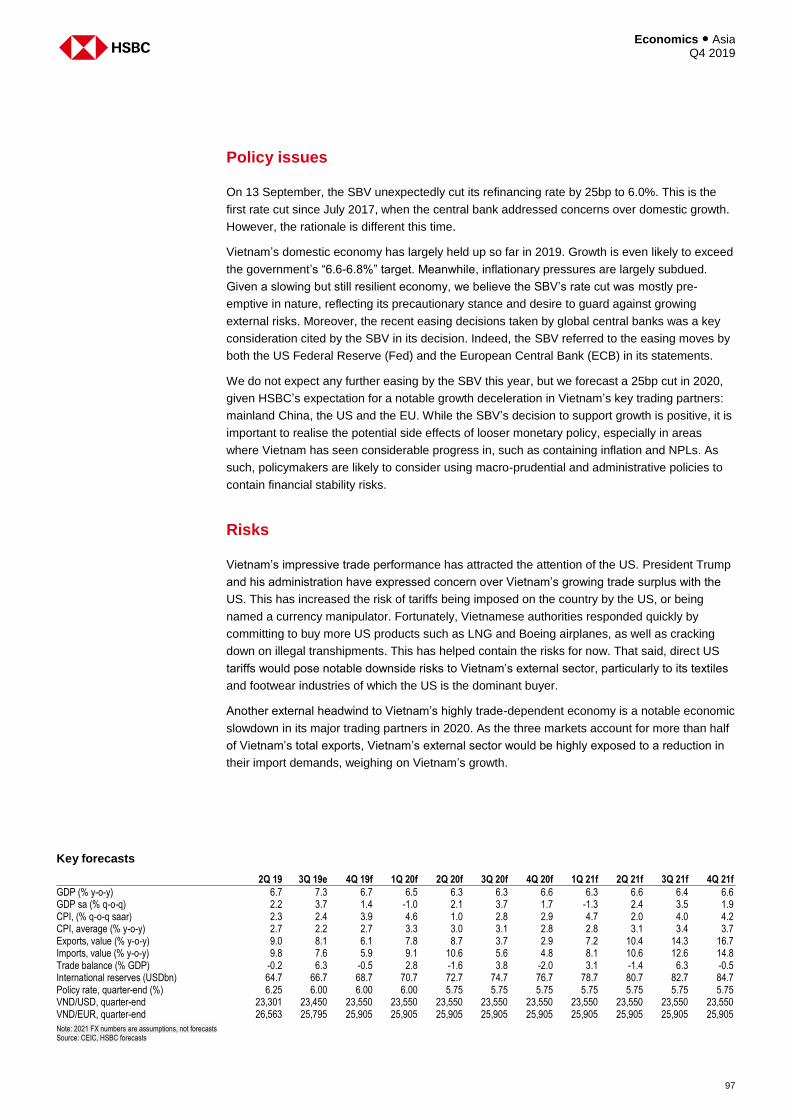
97
Economics ● Asia Q4 2019
Policy issues
On 13 September, the SBV unexpectedly cut its refinancing rate by 25bp to 6.0%. This is the
first rate cut since July 2017, when the central bank addressed concerns over domestic growth.
However, the rationale is different this time.
Vietnam’s domestic economy has largely held up so far in 2019. Growth is even likely to exceed
the government’s “6.6-6.8%” target. Meanwhile, inflationary pressures are largely subdued.
Given a slowing but still resilient economy, we believe the SBV’s rate cut was mostly pre-
emptive in nature, reflecting its precautionary stance and desire to guard against growing
external risks. Moreover, the recent easing decisions taken by global central banks was a key
consideration cited by the SBV in its decision. Indeed, the SBV referred to the easing moves by
both the US Federal Reserve (Fed) and the European Central Bank (ECB) in its statements.
We do not expect any further easing by the SBV this year, but we forecast a 25bp cut in 2020,
given HSBC’s expectation for a notable growth deceleration in Vietnam’s key trading partners:
mainland China, the US and the EU. While the SBV’s decision to support growth is positive, it is
important to realise the potential side effects of looser monetary policy, especially in areas
where Vietnam has seen considerable progress in, such as containing inflation and NPLs. As
such, policymakers are likely to consider using macro-prudential and administrative policies to
contain financial stability risks.
Risks
Vietnam’s impressive trade performance has attracted the attention of the US. President Trump
and his administration have expressed concern over Vietnam’s growing trade surplus with the
US. This has increased the risk of tariffs being imposed on the country by the US, or being
named a currency manipulator. Fortunately, Vietnamese authorities responded quickly by
committing to buy more US products such as LNG and Boeing airplanes, as well as cracking
down on illegal transhipments. This has helped contain the risks for now. That said, direct US
tariffs would pose notable downside risks to Vietnam’s external sector, particularly to its textiles
and footwear industries of which the US is the dominant buyer.
Another external headwind to Vietnam’s highly trade-dependent economy is a notable economic
slowdown in its major trading partners in 2020. As the three markets account for more than half
of Vietnam’s total exports, Vietnam’s external sector would be highly exposed to a reduction in
their import demands, weighing on Vietnam’s growth.
Key forecasts
2Q 19 3Q 19e 4Q 19f 1Q 20f 2Q 20f 3Q 20f 4Q 20f 1Q 21f 2Q 21f 3Q 21f 4Q 21f
GDP (% y-o-y) 6.7 7.3 6.7 6.5 6.3 6.3 6.6 6.3 6.6 6.4 6.6 GDP sa (% q-o-q) 2.2 3.7 1.4 -1.0 2.1 3.7 1.7 -1.3 2.4 3.5 1.9 CPI, (% q-o-q saar) 2.3 2.4 3.9 4.6 1.0 2.8 2.9 4.7 2.0 4.0 4.2 CPI, average (% y-o-y) 2.7 2.2 2.7 3.3 3.0 3.1 2.8 2.8 3.1 3.4 3.7 Exports, value (% y-o-y) 9.0 8.1 6.1 7.8 8.7 3.7 2.9 7.2 10.4 14.3 16.7 Imports, value (% y-o-y) 9.8 7.6 5.9 9.1 10.6 5.6 4.8 8.1 10.6 12.6 14.8 Trade balance (% GDP) -0.2 6.3 -0.5 2.8 -1.6 3.8 -2.0 3.1 -1.4 6.3 -0.5 International reserves (USDbn) 64.7 66.7 68.7 70.7 72.7 74.7 76.7 78.7 80.7 82.7 84.7 Policy rate, quarter-end (%) 6.25 6.00 6.00 6.00 5.75 5.75 5.75 5.75 5.75 5.75 5.75 VND/USD, quarter-end 23,301 23,450 23,550 23,550 23,550 23,550 23,550 23,550 23,550 23,550 23,550 VND/EUR, quarter-end 26,563 25,795 25,905 25,905 25,905 25,905 25,905 25,905 25,905 25,905 25,905
Note: 2021 FX numbers are assumptions, not forecasts Source: CEIC, HSBC forecasts
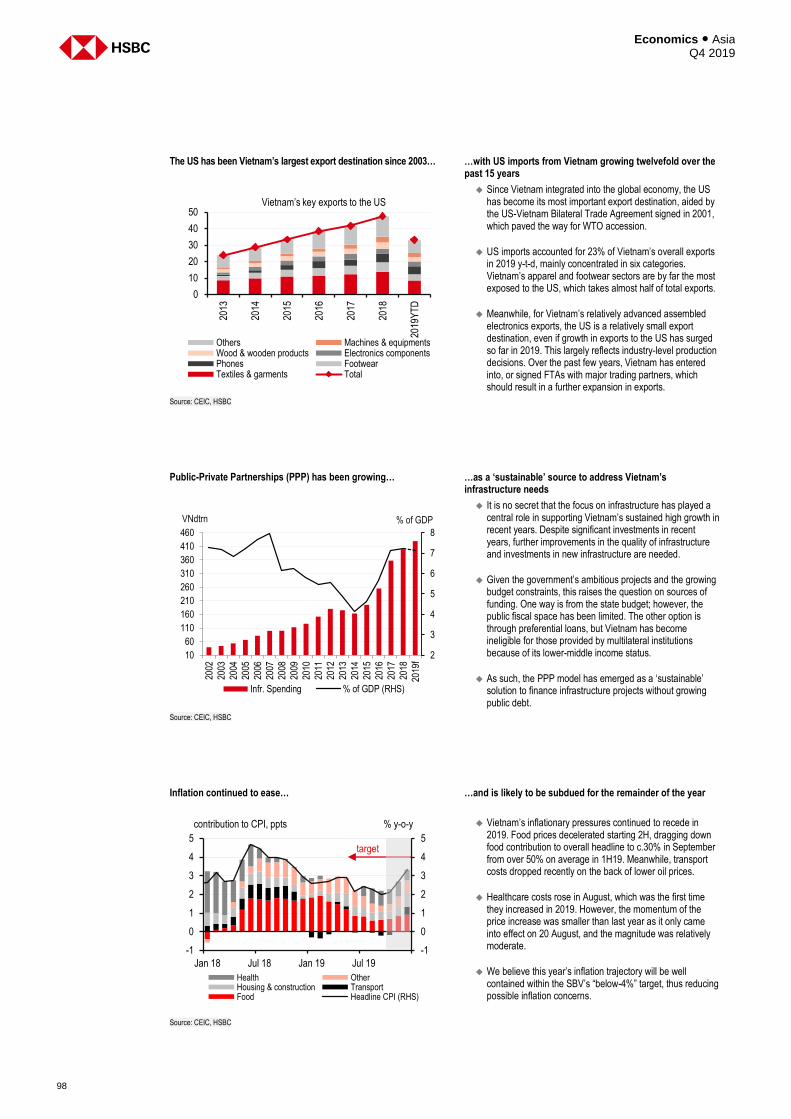
Economics ● Asia Q4 2019
98
The US has been Vietnam’s largest export destination since 2003… …with US imports from Vietnam growing twelvefold over the
past 15 years
Since Vietnam integrated into the global economy, the US has become its most important export destination, aided by the US-Vietnam Bilateral Trade Agreement signed in 2001, which paved the way for WTO accession.
US imports accounted for 23% of Vietnam’s overall exports in 2019 y-t-d, mainly concentrated in six categories. Vietnam’s apparel and footwear sectors are by far the most exposed to the US, which takes almost half of total exports.
Meanwhile, for Vietnam’s relatively advanced assembled electronics exports, the US is a relatively small export destination, even if growth in exports to the US has surged so far in 2019. This largely reflects industry-level production decisions. Over the past few years, Vietnam has entered into, or signed FTAs with major trading partners, which should result in a further expansion in exports.
Source: CEIC, HSBC
Public-Private Partnerships (PPP) has been growing… …as a ‘sustainable’ source to address Vietnam’s infrastructure needs
It is no secret that the focus on infrastructure has played a central role in supporting Vietnam’s sustained high growth in recent years. Despite significant investments in recent years, further improvements in the quality of infrastructure and investments in new infrastructure are needed.
Given the government’s ambitious projects and the growing budget constraints, this raises the question on sources of funding. One way is from the state budget; however, the public fiscal space has been limited. The other option is through preferential loans, but Vietnam has become ineligible for those provided by multilateral institutions because of its lower-middle income status.
As such, the PPP model has emerged as a ‘sustainable’ solution to finance infrastructure projects without growing public debt.
Source: CEIC, HSBC
Inflation continued to ease… …and is likely to be subdued for the remainder of the year
Vietnam’s inflationary pressures continued to recede in
2019. Food prices decelerated starting 2H, dragging down food contribution to overall headline to c.30% in September from over 50% on average in 1H19. Meanwhile, transport costs dropped recently on the back of lower oil prices.
Healthcare costs rose in August, which was the first time they increased in 2019. However, the momentum of the price increase was smaller than last year as it only came into effect on 20 August, and the magnitude was relatively moderate.
We believe this year’s inflation trajectory will be well contained within the SBV’s “below-4%” target, thus reducing possible inflation concerns.
Source: CEIC, HSBC
0
10
20
30
40
5020
13
2014
2015
2016
2017
2018
2019
YT
D
Vietnam’s key exports to the US
Others Machines & equipmentsWood & wooden products Electronics componentsPhones FootwearTextiles & garments Total
2
3
4
5
6
7
8
10
60
110
160
210
260
310
360
410
460
2002
2003
2004
2005
2006
2007
2008
2009
2010
2011
2012
2013
2014
2015
2016
2017
2018
2019
f
% of GDPVNdtrn
Tho
usa
nd
s
Infr. Spending % of GDP (RHS)
-1
0
1
2
3
4
5
-1
0
1
2
3
4
5
Jan 18 Jul 18 Jan 19 Jul 19
Health OtherHousing & construction TransportFood Headline CPI (RHS)
contribution to CPI, ppts
target
% y-o-y
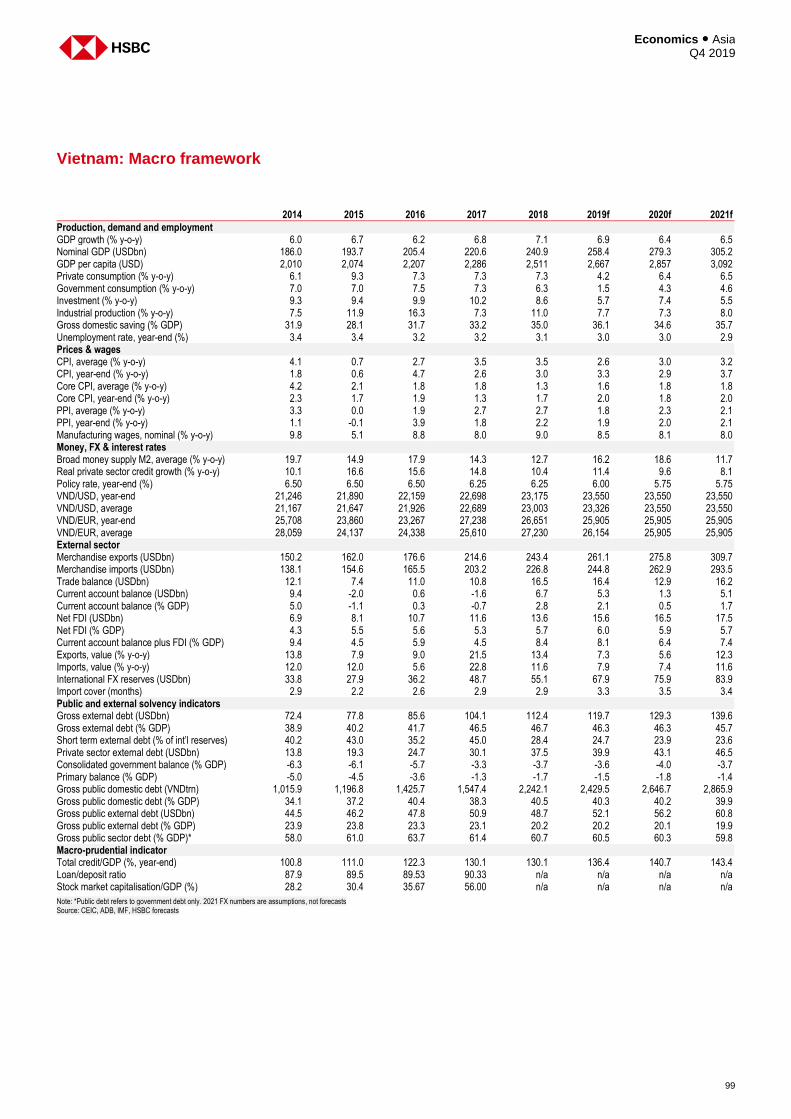
99
Economics ● Asia Q4 2019
Vietnam: Macro framework
2014 2015 2016 2017 2018 2019f 2020f 2021f
Production, demand and employment GDP growth (% y-o-y) 6.0 6.7 6.2 6.8 7.1 6.9 6.4 6.5 Nominal GDP (USDbn) 186.0 193.7 205.4 220.6 240.9 258.4 279.3 305.2 GDP per capita (USD) 2,010 2,074 2,207 2,286 2,511 2,667 2,857 3,092 Private consumption (% y-o-y) 6.1 9.3 7.3 7.3 7.3 4.2 6.4 6.5 Government consumption (% y-o-y) 7.0 7.0 7.5 7.3 6.3 1.5 4.3 4.6 Investment (% y-o-y) 9.3 9.4 9.9 10.2 8.6 5.7 7.4 5.5 Industrial production (% y-o-y) 7.5 11.9 16.3 7.3 11.0 7.7 7.3 8.0 Gross domestic saving (% GDP) 31.9 28.1 31.7 33.2 35.0 36.1 34.6 35.7 Unemployment rate, year-end (%) 3.4 3.4 3.2 3.2 3.1 3.0 3.0 2.9 Prices & wages CPI, average (% y-o-y) 4.1 0.7 2.7 3.5 3.5 2.6 3.0 3.2 CPI, year-end (% y-o-y) 1.8 0.6 4.7 2.6 3.0 3.3 2.9 3.7 Core CPI, average (% y-o-y) 4.2 2.1 1.8 1.8 1.3 1.6 1.8 1.8 Core CPI, year-end (% y-o-y) 2.3 1.7 1.9 1.3 1.7 2.0 1.8 2.0 PPI, average (% y-o-y) 3.3 0.0 1.9 2.7 2.7 1.8 2.3 2.1 PPI, year-end (% y-o-y) 1.1 -0.1 3.9 1.8 2.2 1.9 2.0 2.1 Manufacturing wages, nominal (% y-o-y) 9.8 5.1 8.8 8.0 9.0 8.5 8.1 8.0 Money, FX & interest rates Broad money supply M2, average (% y-o-y) 19.7 14.9 17.9 14.3 12.7 16.2 18.6 11.7 Real private sector credit growth (% y-o-y) 10.1 16.6 15.6 14.8 10.4 11.4 9.6 8.1 Policy rate, year-end (%) 6.50 6.50 6.50 6.25 6.25 6.00 5.75 5.75 VND/USD, year-end 21,246 21,890 22,159 22,698 23,175 23,550 23,550 23,550 VND/USD, average 21,167 21,647 21,926 22,689 23,003 23,326 23,550 23,550 VND/EUR, year-end 25,708 23,860 23,267 27,238 26,651 25,905 25,905 25,905 VND/EUR, average 28,059 24,137 24,338 25,610 27,230 26,154 25,905 25,905 External sector Merchandise exports (USDbn) 150.2 162.0 176.6 214.6 243.4 261.1 275.8 309.7 Merchandise imports (USDbn) 138.1 154.6 165.5 203.2 226.8 244.8 262.9 293.5 Trade balance (USDbn) 12.1 7.4 11.0 10.8 16.5 16.4 12.9 16.2 Current account balance (USDbn) 9.4 -2.0 0.6 -1.6 6.7 5.3 1.3 5.1 Current account balance (% GDP) 5.0 -1.1 0.3 -0.7 2.8 2.1 0.5 1.7 Net FDI (USDbn) 6.9 8.1 10.7 11.6 13.6 15.6 16.5 17.5 Net FDI (% GDP) 4.3 5.5 5.6 5.3 5.7 6.0 5.9 5.7 Current account balance plus FDI (% GDP) 9.4 4.5 5.9 4.5 8.4 8.1 6.4 7.4 Exports, value (% y-o-y) 13.8 7.9 9.0 21.5 13.4 7.3 5.6 12.3 Imports, value (% y-o-y) 12.0 12.0 5.6 22.8 11.6 7.9 7.4 11.6 International FX reserves (USDbn) 33.8 27.9 36.2 48.7 55.1 67.9 75.9 83.9 Import cover (months) 2.9 2.2 2.6 2.9 2.9 3.3 3.5 3.4 Public and external solvency indicators Gross external debt (USDbn) 72.4 77.8 85.6 104.1 112.4 119.7 129.3 139.6 Gross external debt (% GDP) 38.9 40.2 41.7 46.5 46.7 46.3 46.3 45.7 Short term external debt (% of int’l reserves) 40.2 43.0 35.2 45.0 28.4 24.7 23.9 23.6 Private sector external debt (USDbn) 13.8 19.3 24.7 30.1 37.5 39.9 43.1 46.5 Consolidated government balance (% GDP) -6.3 -6.1 -5.7 -3.3 -3.7 -3.6 -4.0 -3.7 Primary balance (% GDP) -5.0 -4.5 -3.6 -1.3 -1.7 -1.5 -1.8 -1.4 Gross public domestic debt (VNDtrn) 1,015.9 1,196.8 1,425.7 1,547.4 2,242.1 2,429.5 2,646.7 2,865.9 Gross public domestic debt (% GDP) 34.1 37.2 40.4 38.3 40.5 40.3 40.2 39.9 Gross public external debt (USDbn) 44.5 46.2 47.8 50.9 48.7 52.1 56.2 60.8 Gross public external debt (% GDP) 23.9 23.8 23.3 23.1 20.2 20.2 20.1 19.9 Gross public sector debt (% GDP)* 58.0 61.0 63.7 61.4 60.7 60.5 60.3 59.8 Macro-prudential indicator Total credit/GDP (%, year-end) 100.8 111.0 122.3 130.1 130.1 136.4 140.7 143.4 Loan/deposit ratio 87.9 89.5 89.53 90.33 n/a n/a n/a n/a Stock market capitalisation/GDP (%) 28.2 30.4 35.67 56.00 n/a n/a n/a n/a
Note: *Public debt refers to government debt only. 2021 FX numbers are assumptions, not forecasts Source: CEIC, ADB, IMF, HSBC forecasts

Economics ● Asia Q4 2019
100
Notes

101
Economics ● Asia Q4 2019
Notes
Economics ● Asia Q4 2019
102
Disclosure appendix
Analyst Certification
The following analyst(s), economist(s), or strategist(s) who is(are) primarily responsible for this report, including any analyst(s)
whose name(s) appear(s) as author of an individual section or sections of the report and any analyst(s) named as the covering
analyst(s) of a subsidiary company in a sum-of-the-parts valuation certifies(y) that the opinion(s) on the subject security(ies) or
issuer(s), any views or forecasts expressed in the section(s) of which such individual(s) is(are) named as author(s), and any other
views or forecasts expressed herein, including any views expressed on the back page of the research report, accurately reflect
their personal view(s) and that no part of their compensation was, is or will be directly or indirectly related to the specific
recommendation(s) or views contained in this research report: Frederic Neumann, Qu Hongbin, Joseph Incalcaterra, Noelan
Arbis, Paul Bloxham, Aayushi Chaudhary, Pranjul Bhandari, Daniel Smith, Julia Wang, James Lee, Jingyang Chen, Erin Xin,
Shanshan Song, Yun Liu and Ki-Hyuk Lee
Important disclosures
This document has been prepared and is being distributed by the Research Department of HSBC and is intended solely for the
clients of HSBC and is not for publication to other persons, whether through the press or by other means.
This document is for information purposes only and it should not be regarded as an offer to sell or as a solicitation of an offer to
buy the securities or other investment products mentioned in it or to participate in any trading strategy. Advice in this document is
general and should not be construed as personal advice, given it has been prepared without taking account of the objectives,
financial situation or needs of any particular investor. Accordingly, investors should, before acting on the advice, consider the
appropriateness of the advice, having regard to their objectives, financial situation and needs. If necessary, seek professional
investment and tax advice.
Certain investment products mentioned in this document may not be eligible for sale in some states or countries, and they may
not be suitable for all types of investors. Investors should consult with their HSBC representative regarding the suitability of the
investment products mentioned in this document and take into account their specific investment objectives, financial situation or
particular needs before making a commitment to purchase investment products.
The value of and the income produced by the investment products mentioned in this document may fluctuate, so that an investor
may get back less than originally invested. Certain high-volatility investments can be subject to sudden and large falls in value
that could equal or exceed the amount invested. Value and income from investment products may be adversely affected by
exchange rates, interest rates, or other factors. Past performance of a particular investment product is not indicative of future
results.
HSBC and its affiliates will from time to time sell to and buy from customers the securities/instruments, both equity and debt
(including derivatives) of companies covered in HSBC Research on a principal or agency basis or act as a market maker or
liquidity provider in the securities/instruments mentioned in this report.
Analysts, economists, and strategists are paid in part by reference to the profitability of HSBC which includes investment banking,
sales & trading, and principal trading revenue.
Whether, or in what time frame, an update of this analysis will be published is not determined in advance.
For disclosures in respect of any company mentioned in this report, please see the most recently published report on that company
available at www.hsbcnet.com/research. HSBC Private Banking clients should contact their Relationship Manager for queries
regarding other research reports. In order to find out more about the proprietary models used to produce this report, please contact
the authoring analyst.
103
Economics ● Asia Q4 2019
Additional disclosures
1 This report is dated as at 3 October 2019.
2 All market data included in this report are dated as at close 2 October 2019, unless a different date or a specific time of
day is indicated in the report.
3 HSBC has procedures in place to identify and manage any potential conflicts of interest that arise in connection with its
Research business. HSBC’s analysts and its other staff who are involved in the preparation and dissemination of
Research operate and have a management reporting line independent of HSBC’s Investment Banking business.
Information Barrier procedures are in place between the Investment Banking, Principal Trading, and Research businesses
to ensure that any confidential or price sensitive information is handled in an appropriate manner.
4 You are not permitted to use, for reference, any data in this document for the purpose of (1) determining the interest
payable, or other sums due, under loan agreements or under other financial contracts or instruments, (2) determining the
price at which a financial instrument may be bought or sold or traded or redeemed, or the value of a financial instrument,
or (3) measuring the performance of a financial instrument.
Economics ● Asia Q4 2019
104
Disclaimer
Legal entities as at 30 November 2017
‘UAE’ HSBC Bank Middle East Limited, Dubai; ‘HK’ The Hongkong and Shanghai Banking Corporation Limited, Hong Kong;
‘TW’ HSBC Securities (Taiwan) Corporation Limited; ‘CA’ HSBC Securities (Canada) Inc.; HSBC Bank, Paris Branch; HSBC
France; ‘DE’ HSBC Trinkaus & Burkhardt AG, Düsseldorf; 000 HSBC Bank (RR), Moscow; ‘IN’ HSBC Securities and Capital
Markets (India) Private Limited, Mumbai; ‘JP’ HSBC Securities (Japan) Limited, Tokyo; ‘EG’ HSBC Securities Egypt SAE,
Cairo; ‘CN’ HSBC Investment Bank Asia Limited, Beijing Representative Office; The Hongkong and Shanghai Banking
Corporation Limited, Singapore Branch; The Hongkong and Shanghai Banking Corporation Limited, Seoul Securities
Branch; The Hongkong and Shanghai Banking Corporation Limited, Seoul Branch; HSBC Securities (South Africa) (Pty) Ltd,
Johannesburg; HSBC Bank plc, London, Madrid, Milan, Stockholm, Tel Aviv; ‘US’ HSBC Securities (USA) Inc, New York;
HSBC Yatirim Menkul Degerler AS, Istanbul; HSBC México, SA, Institución de Banca Múltiple, Grupo Financiero HSBC;
HSBC Bank Australia Limited; HSBC Bank Argentina SA; HSBC Saudi Arabia Limited; The Hongkong and Shanghai Banking
Corporation Limited, New Zealand Branch incorporated in Hong Kong SAR; The Hongkong and Shanghai Banking
Corporation Limited, Bangkok Branch; PT Bank HSBC Indonesia; HSBC Qianhai Securities Limited
Issuer of report
The Hongkong and Shanghai Banking Corporation
Limited
Level 19, 1 Queen’s Road Central
Hong Kong SAR
Telephone: +852 2843 9111
Fax: +852 2801 4138
Website: www.research.hsbc.com
The Hongkong and Shanghai Banking Corporation Limited (“HSBC”) has issued this research material. The Hongkong and Shanghai Banking Corporation Limited is regulated by the Hong Kong
Monetary Authority. This material is distributed in the United Kingdom by HSBC Bank plc. In Australia, this publication has been distributed by The Hongkong and Shanghai Banking Corporation
Limited (ABN 65 117 925 970, AFSL 301737) for the general information of its “wholesale” customers (as defined in the Corporations Act 2001). Where distributed to retail customers, this research
is distributed by HSBC Bank Australia Limited (ABN 48 006 434 162, AFSL No. 232595). These respective entities make no representations that the products or services mentioned in this
document are available to persons in Australia or are necessarily suitable for any particular person or appropriate in accordance with local law. No consideration has been given to the particular
investment objectives, financial situation or particular needs of any recipient.
This publication is distributed in New Zealand by The Hongkong and Shanghai Banking Corporation Limited, New Zealand Branch incorporated in Hong Kong SAR.
This material is distributed in Japan by HSBC Securities (Japan) Limited. HSBC Securities (USA) Inc. accepts responsibility for the content of this research report prepared by its non-US foreign
affiliate. All US persons receiving or accessing this report and intending to effect transactions in any security discussed herein should do so with HSBC Securities (USA) Inc. in the United States
and not with its non-US foreign affiliate, the issuer of this report. In Korea, this publication is distributed by either The Hongkong and Shanghai Banking Corporation Limited, Seoul Securities Branch
(“HBAP SLS”) or The Hongkong and Shanghai Banking Corporation Limited, Seoul Branch (“HBAP SEL”) for the general information of professional investors specified in Article 9 of the Financial
Investment Services and Capital Markets Act (“FSCMA”). This publication is not a prospectus as defined in the FSCMA. It may not be further distributed in whole or in part for any purpose. Both
HBAP SLS and HBAP SEL are regulated by the Financial Services Commission and the Financial Supervisory Service of Korea. In Singapore, this publication is distributed by The Hongkong and
Shanghai Banking Corporation Limited, Singapore Branch for the general information of institutional investors or other persons specified in Sections 274 and 304 of the Securities and Futures Act
(Chapter 289) (“SFA”) and accredited investors and other persons in accordance with the conditions specified in Sections 275 and 305 of the SFA. Only Economics or Currencies reports are
intended for distribution to a person who is not an Accredited Investor, Expert Investor or Institutional Investor as defined in SFA. The Hongkong and Shanghai Banking Corporation Limited,
Singapore Branch accepts legal responsibility for the contents of reports pursuant to Regulation 32C(1)(d) of the Financial Advisers Regulations. This publication is not a prospectus as defined in
the SFA. This publication is not a prospectus as defined in the SFA. It may not be further distributed in whole or in part for any purpose. The Hongkong and Shanghai Banking Corporation Limited
Singapore Branch is regulated by the Monetary Authority of Singapore. Recipients in Singapore should contact a “Hongkong and Shanghai Banking Corporation Limited, Singapore Branch”
representative in respect of any matters arising from, or in connection with this report. Please refer to The Hongkong and Shanghai Banking Corporation Limited Singapore Branch’s website at
www.business.hsbc.com.sg for contact details. In the UK this material may only be distributed to institutional and professional customers and is not intended for private customers. It is not to be
distributed or passed on, directly or indirectly, to any other person. HSBC México, S.A., Institución de Banca Múltiple, Grupo Financiero HSBC is authorised and regulated by Secretaría de
Hacienda y Crédito Público and Comisión Nacional Bancaria y de Valores (CNBV).
Any recommendations contained in it are intended for the professional investors to whom it is distributed. This material is not and should not be construed as an offer to sell or the solicitation of an
offer to purchase or subscribe for any investment. HSBC has based this document on information obtained from sources it believes to be reliable but which it has not independently verified; HSBC
makes no guarantee, representation or warranty and accepts no responsibility or liability as to its accuracy or completeness. Expressions of opinion are those of HSBC only and are subject to
change without notice. From time to time research analysts conduct site visits of covered issuers. HSBC policies prohibit research analysts from accepting payment or reimbursement for travel
expenses from the issuer for such visits. The decision and responsibility on whether or not to invest must be taken by the reader. HSBC and its affiliates or their officers, directors and employees
may have positions in any securities mentioned in this document (or in any related investment) and may from time to time add to or dispose of any such securities (or investment). HSBC and its
affiliates may act as market maker or have assumed an underwriting commitment in the securities of any companies discussed in this document (or in related investments), may sell them to or
buy them from customers on a principal basis and may also perform or seek to perform banking or underwriting services for or relating to those companies. This material may not be further
distributed in whole or in part for any purpose. No consideration has been given to the particular investment objectives, financial situation or particular needs of any recipient. (070905)
In Canada, this document has been distributed by HSBC Securities (Canada) Inc. (member IIROC), or its affiliates. The information contained herein is under no circumstances to be construed as
investment advice in any province or territory of Canada and is not tailored to the needs of the recipient. No securities commission or similar regulatory authority in Canada has reviewed or in any
way passed judgment upon these materials, the information contained herein or the merits of the securities described herein, and any representation to the contrary is an offense.
If you are an HSBC Private Banking (“PB”) customer with approval for receipt of relevant research publications by an applicable HSBC legal entity, you are eligible to receive this publication. To
be eligible to receive such publications, you must have agreed to the applicable HSBC entity’s terms and conditions (“KRC Terms”) for access to the KRC, and the terms and conditions of any
other internet banking service offered by that HSBC entity through which you will access research publications using the KRC. Distribution of this publication is the sole responsibility of the HSBC
entity with whom you have agreed the KRC Terms.
If you do not meet the aforementioned eligibility requirements please disregard this publication and, if you are a customer of PB, please notify your Relationship Manager. Receipt of research
publications is strictly subject to the KRC Terms, which can be found at https://research.privatebank.hsbc.com/ – we draw your attention also to the provisions contained in the Important Notes
section therein.
© Copyright 2019, The Hongkong and Shanghai Banking Corporation Limited, ALL RIGHTS RESERVED. No part of this publication may be reproduced, stored in a retrieval system, or transmitted,
on any form or by any means, electronic, mechanical, photocopying, recording, or otherwise, without the prior written permission of The Hongkong and Shanghai Banking Corporation Limited.
MCI (P) 065/01/2019, MCI (P) 008/02/2019
[1130112]
Global
Global Chief Economist Janet Henry +44 20 7991 6711 [email protected]
Global Economist James Pomeroy +44 20 7991 6714 [email protected]
Chief Trade Economist Douglas Lippoldt +44 20 7992 0375 [email protected]
Trade Economist Shanella Rajanayagam +44 20 3268 4118 [email protected]
Edward Parker +44 20 3359 7563 [email protected]
Europe
Chief European Economist Simon Wells +44 20 7991 6718 [email protected]
European Economist Fabio Balboni +44 20 7992 0374 [email protected]
Economist Chris Hare +44 20 7991 2995 [email protected]
United Kingdom
Economist Elizabeth Martins +44 20 7991 2170 [email protected]
Germany
Stefan Schilbe +49 211910 3137 [email protected]
Rainer Sartoris +49 211910 2470 [email protected]
France
Olivier Vigna +33 1 4070 3266 [email protected]
Chantana Sam +33 1 4070 7795 [email protected]
North America
US
Ryan Wang +1 212 525 3181 [email protected]
Canada
David G Watt +1 416 868 8130 [email protected]
Asia Pacific
Managing Director, Co-head Asian Economics Research and Chief Economist Greater China Qu Hongbin +852 2822 2025 [email protected]
Managing Director, Co-head Asian Economics Research Frederic Neumann +852 2822 4556 [email protected]
Managing Director, Chief Economist, Australia, New Zealand and Global Commodities Paul Bloxham +612 9255 2635 [email protected]
Chief Economist, India Pranjul Bhandari +91 22 2268 1841 [email protected]
Joseph Incalcaterra +852 2822 4687 [email protected]
Jingyang Chen +852 2996 6558 [email protected]
Julia Wang +852 3604 3663 [email protected]
Daniel John Smith +612 9006 5729 [email protected]
James Lee +852 2822 1647 [email protected]
Noelan Arbis +852 2822 4325 [email protected]
Yun Liu + 852 2822 4297 [email protected]
Aayushi Chaudhary +91 22 2268 5543 [email protected]
Erin Xin +852 2996 6975 [email protected]
Ki-Hyuk Lee + 852 2822 4523 [email protected]
Shanshan Song +86 10 5999 8234 [email protected]
CEEMEA
Chief Economist, CEEMEA Simon Williams +44 20 7718 9563 [email protected]
Economist, Russia and CIS Artem Biryukov +7 495 721 1515 [email protected]
Economist, CEE Agata Urbanska-Giner +44 20 7992 2774 [email protected]
Chief Economist, Turkey Melis Metiner +44 20 3359 2636 [email protected]
Economist, South Africa David Faulkner +27 11 676 4569 [email protected]
Economist, South Africa Thato Mosadi +27 11 676 4476 [email protected]
Argentina
Senior Economist Jorge Morgenstern +54 11 4130 9229 [email protected]
Mexico
Chief Economist, Mexico Alexis Milo +52 55 5721 2172 [email protected]
Jose Carlos Sanchez +52 55 5721 5623 [email protected]
Global Economics Research Team

Q4 2019
Economics | A
siaA
sian Economics
Issuer of report: The Hongkong and Shanghai Banking Corporation Limited
Level 19, 1 Queen’s Road CentralHong Kong SAR
Telephone: +852 2843 9111Fax: +852 2596 0200
Main contributors
Our multi-channel research
HSBC Global Research app:www.research.hsbc.com
Main contributorsFrederic NeumannCo-head of Asian Economics ResearchThe Hongkong and Shanghai Banking Corporation [email protected]+852 2822 4556
Daniel SmithEconomistHSBC Bank Australia [email protected]+612 9006 5729
Qu HongbinCo-head of Asian Economics Research and Chief China EconomistThe Hongkong and Shanghai Banking Corporation [email protected]+852 2822 2025
Noelan ArbisEconomistThe Hongkong and Shanghai Banking Corporation [email protected]+852 2822 4325
Paul BloxhamChief Economist, Australia, NZ & Global CommoditiesHSBC Bank Australia [email protected]+612 9255 2635
Jingyang ChenEconomistThe Hongkong and Shanghai Banking Corporation [email protected]+852 2996 6558
Pranjul BhandariChief Economist, IndiaHSBC Securities and Capital Markets (India) Private [email protected]+91 22 2268 1841
James LeeEconomistThe Hongkong and Shanghai Banking Corporation [email protected]+852 2822 1647
Joseph IncalcaterraChief Economist, ASEANThe Hongkong and Shanghai Banking Corporation [email protected]+852 2822 4687
Julia WangSenior Economist, Greater ChinaThe Hongkong and Shanghai Banking Corporation [email protected]+852 3604 3663
Aayushi ChaudharyEconomistHSBC Securities and Capital Markets (India) Private [email protected]+91 22 2268 5543
Yun LiuEconomistThe Hongkong and Shanghai Banking Corporation [email protected]+852 2822 4297
Erin XinEconomistThe Hongkong and Shanghai Banking Corporation [email protected]+852 2996 6975
Ki-Hyuk LeeEconomistThe Hongkong and Shanghai Banking Corporation [email protected]+852 2822 4523
Related Documents