Cross-border Investment 03

Welcome message from author
This document is posted to help you gain knowledge. Please leave a comment to let me know what you think about it! Share it to your friends and learn new things together.
Transcript

Cross-border Investment
03

Asian Economic Integration Report 201726 Cross-border Investment 27
Cross-border Investment
Trends and Patterns of FDI in AsiaAsia is increasingly a magnet for foreign direct investment and a prominent global investor.
Over the past two decades, the benefits of increased trade and investment rewarded many Asian economies with strong economic growth
and rising incomes. The proliferation of cross-border production networks created opportunities for even lower-income countries in the region to attract export-oriented multinationals.
Asia’s share of global inward foreign direct investment (FDI) has been rising.12 In 2016, almost 30% of global FDI went to Asia, up from less than 20% in 2000–2005. At the same time, better finance and structural changes to production created opportunities for major Asian firms to invest abroad, particularly within the region. In 2000–2005, Asia’s share of global outward FDI ranged from 10% to 15%. In 2016, Asia’s share rose to more than 30%—with more than a third originating from the People’s Republic of China (PRC). Outward FDI from Asia have been growing since 2010, slightly interrupted in 2012 and 2015, but regaining strong momentum in 2016.
Updates on Global Inward FDI to Asia
Global inward FDI fell slightly in 2016, with inward FDI to Asia falling 6.4% to $492 billion.
Based on standard balance of payments (BOP) data, global inward FDI totaled $1.75 trillion in 2016,
12 Unless otherwise specified, FDI is a flow.
down slightly from $1.77 trillion in 2015 (Figure 3.1). The uncertain global economic environment and geopolitical shocks may have helped dampen the 2015 growth rebound.
Inward FDI to Europe and developing Asia fell, while North America, transition economies and other advanced economies attracted more FDI. In Asia, the PRC; Hong Kong, China; Australia; Singapore; and India remained the main recipients (Table 3.1). Although Asia attracted 28% of global inward FDI, they were $34 billion below the 2015 level.
A steep decline in cross-border mergers and acquisitions—especially in services—was largely behind the overall drop in Asia’s inward FDI in 2016.
Based on firms’ investment activity data—which provides information on mode of entry13 and ultimate
13 Investments can either be greenfield (building new assets) or merger and acquisition (acquiring existing ones).
Figure 3.1: Total Inward FDI ($ trillion)
FDI = foreign direct investment.Source: ADB calculations using data from United Nations Conference on Trade and Development. Bilateral FDI Statistics. http://unctad.org/en/Pages/DIAE/FDI%20Statistics/FDI-Statistics-Bilateral.aspx (accessed July 2017).
0
0.5
1.0
1.5
2.0
2.5
2001 2004 2007 2010 2013 2016
FDI inflows to Asia FDI inflows to the rest of the world
Asian Economic Integration Report 201726 Cross-border Investment 27
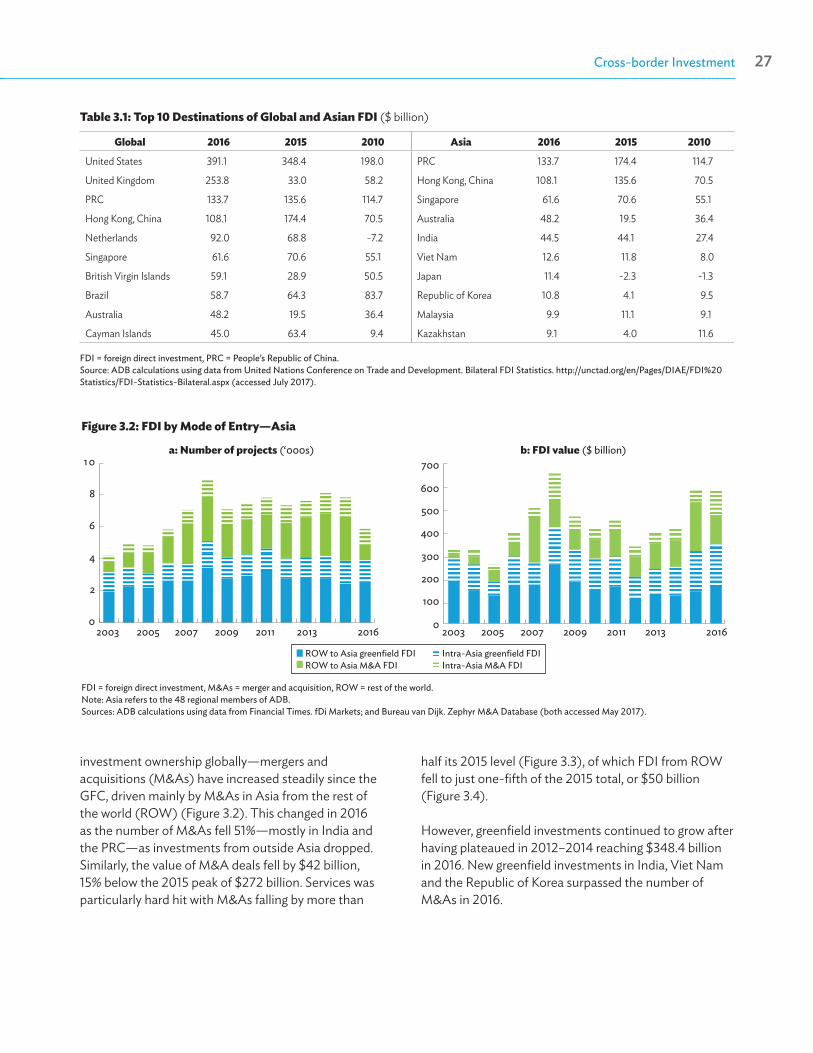
Table 3.1: Top 10 Destinations of Global and Asian FDI ($ billion)
Global 2016 2015 2010 Asia 2016 2015 2010
United States 391.1 348.4 198.0 PRC 133.7 174.4 114.7
United Kingdom 253.8 33.0 58.2 Hong Kong, China 108.1 135.6 70.5
PRC 133.7 135.6 114.7 Singapore 61.6 70.6 55.1
Hong Kong, China 108.1 174.4 70.5 Australia 48.2 19.5 36.4
Netherlands 92.0 68.8 -7.2 India 44.5 44.1 27.4
Singapore 61.6 70.6 55.1 Viet Nam 12.6 11.8 8.0
British Virgin Islands 59.1 28.9 50.5 Japan 11.4 -2.3 -1.3
Brazil 58.7 64.3 83.7 Republic of Korea 10.8 4.1 9.5
Australia 48.2 19.5 36.4 Malaysia 9.9 11.1 9.1
Cayman Islands 45.0 63.4 9.4 Kazakhstan 9.1 4.0 11.6
FDI = foreign direct investment, PRC = People’s Republic of China. Source: ADB calculations using data from United Nations Conference on Trade and Development. Bilateral FDI Statistics. http://unctad.org/en/Pages/DIAE/FDI%20Statistics/FDI-Statistics-Bilateral.aspx (accessed July 2017).
investment ownership globally—mergers and acquisitions (M&As) have increased steadily since the GFC, driven mainly by M&As in Asia from the rest of the world (ROW) (Figure 3.2). This changed in 2016 as the number of M&As fell 51%—mostly in India and the PRC—as investments from outside Asia dropped. Similarly, the value of M&A deals fell by $42 billion, 15% below the 2015 peak of $272 billion. Services was particularly hard hit with M&As falling by more than
Figure 3.2: FDI by Mode of Entry—Asia
FDI = foreign direct investment, M&As = merger and acquisition, ROW = rest of the world.Note: Asia refers to the 48 regional members of ADB.Sources: ADB calculations using data from Financial Times. fDi Markets; and Bureau van Dijk. Zephyr M&A Database (both accessed May 2017).
2003 2005 2007 2009 2011 2013 2016 2003 2005 2007 2009 2011 2013 2016
ROW to Asia greenfield FDI Intra-Asia greenfield FDIROW to Asia M&A FDI Intra-Asia M&A FDI
0
100
200
300
400
500
600
700a: Number of projects (‘000s) b: FDI value ($ billion)
0
2
4
6
8
10
half its 2015 level (Figure 3.3), of which FDI from ROW fell to just one-fifth of the 2015 total, or $50 billion (Figure 3.4).
However, greenfield investments continued to grow after having plateaued in 2012–2014 reaching $348.4 billion in 2016. New greenfield investments in India, Viet Nam and the Republic of Korea surpassed the number of M&As in 2016.
Asian Economic Integration Report 201728 Cross-border Investment 29
0
100
200
300
400
500
2003 2005 2007 2009 2011 2013 2016
a: Greenfield FDI
0
100
200
300
400
500
2003 2005 2007 2009 2011 2013 2016
b: M&As
Manufacturing Primary Services
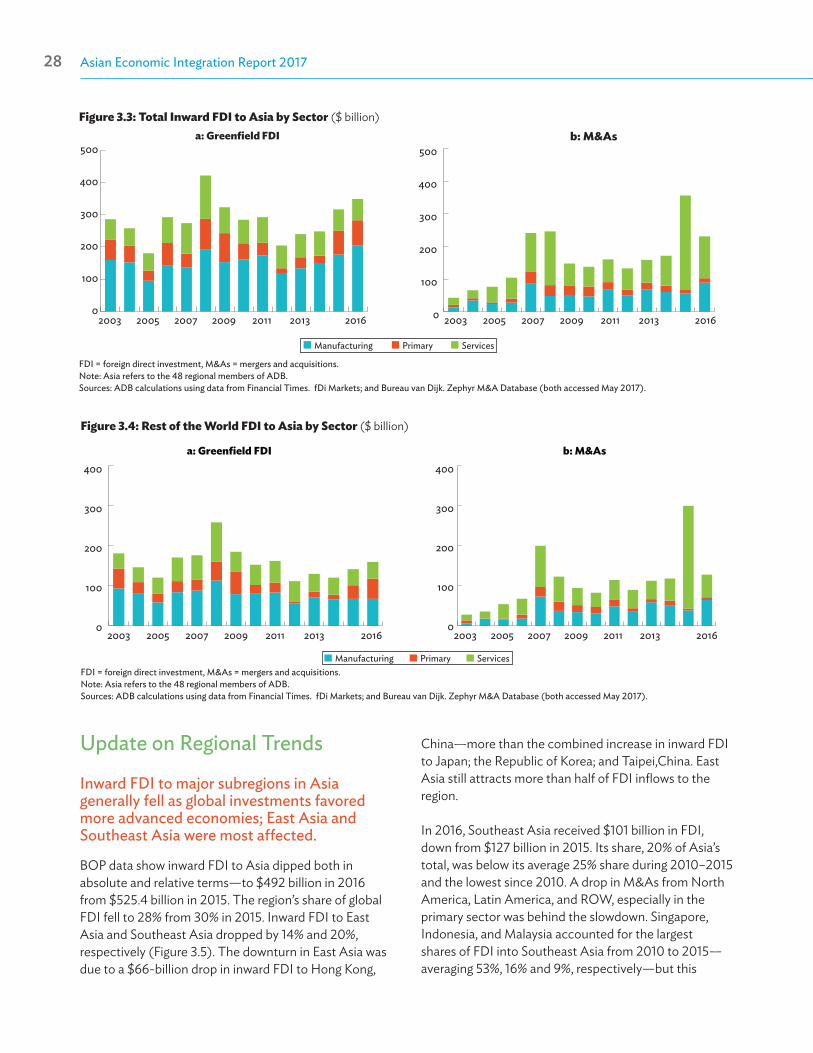
Figure 3.3: Total Inward FDI to Asia by Sector ($ billion)
FDI = foreign direct investment, M&As = mergers and acquisitions.Note: Asia refers to the 48 regional members of ADB. Sources: ADB calculations using data from Financial Times. fDi Markets; and Bureau van Dijk. Zephyr M&A Database (both accessed May 2017).
0
100
200
300
400
2003 2005 2007 2009 2011 2013 2016
a: Greenfield FDI
0
100
200
300
400
2003 2005 2007 2009 2011 2013 2016
b: M&As
Manufacturing Primary Services
Figure 3.4: Rest of the World FDI to Asia by Sector ($ billion)
FDI = foreign direct investment, M&As = mergers and acquisitions.Note: Asia refers to the 48 regional members of ADB. Sources: ADB calculations using data from Financial Times. fDi Markets; and Bureau van Dijk. Zephyr M&A Database (both accessed May 2017).
Update on Regional Trends
Inward FDI to major subregions in Asia generally fell as global investments favored more advanced economies; East Asia and Southeast Asia were most affected.
BOP data show inward FDI to Asia dipped both in absolute and relative terms—to $492 billion in 2016 from $525.4 billion in 2015. The region’s share of global FDI fell to 28% from 30% in 2015. Inward FDI to East Asia and Southeast Asia dropped by 14% and 20%, respectively (Figure 3.5). The downturn in East Asia was due to a $66-billion drop in inward FDI to Hong Kong,
China—more than the combined increase in inward FDI to Japan; the Republic of Korea; and Taipei,China. East Asia still attracts more than half of FDI inflows to the region.
In 2016, Southeast Asia received $101 billion in FDI, down from $127 billion in 2015. Its share, 20% of Asia’s total, was below its average 25% share during 2010–2015 and the lowest since 2010. A drop in M&As from North America, Latin America, and ROW, especially in the primary sector was behind the slowdown. Singapore, Indonesia, and Malaysia accounted for the largest shares of FDI into Southeast Asia from 2010 to 2015—averaging 53%, 16% and 9%, respectively—but this

Asian Economic Integration Report 201728 Cross-border Investment 29
-100
0
100
200
300
400
500
600
2001 2004 2007 2010 2013 2016
East Asia South Asia Southeast AsiaThe Pacific and Oceania Central Asia
Figure 3.5: Global Inward FDI to Asia by Subregion ($ billion)
FDI = foreign direct investment.Source: ADB calculations using data from United Nations Conference on Trade and Development. Bilateral FDI Statistics. http://unctad.org/en/Pages/DIAE/FDI%20Statistics/FDI-Statistics-Bilateral.aspx (accessed July 2017).
changed in 2016. Indonesia’s share fell 10 percentage points—inward FDI dropped to $2.7 billion in 2016 from a high of $16.6 billion in 2015. Among other Southeast Asian economies, inward FDI to the Philippines jumped to $7.9 billion (up 60% from 2015). M&As—such as the $802-million deal between Mitsubishi UFJ Financial Group and Security Bank—were behind the increase.
South Asia saw a marginal increase (3%) in inward FDI to $50.4 billion—with all economies above 2015 levels except Afghanistan and Bhutan. Mauritius, Singapore, and Japan were the top three sources accounting for 90% of FDI in India. Inward FDI to Pakistan, Sri Lanka, and Bangladesh grew 56%, 32%, and 4%, respectively.
Central Asia attracted $5.1 billion more FDI in 2016. Around 40% went to Kazakhstan ($9.1 billion), Turkmenistan ($4.5 billion), and Azerbaijan ($4.5 billion). Among top sources of FDI to Central Asia were the Netherlands, Switzerland, the PRC, and the United States (US) (around 60%). Inward FDI to Australia grew 147% in 2016, to $48 billion, ranking ninth worldwide. In the Pacific, only Kiribati and Vanuatu attracted investment flows, keeping the subregion’s share at less than 1% of Asia-bound FDI.
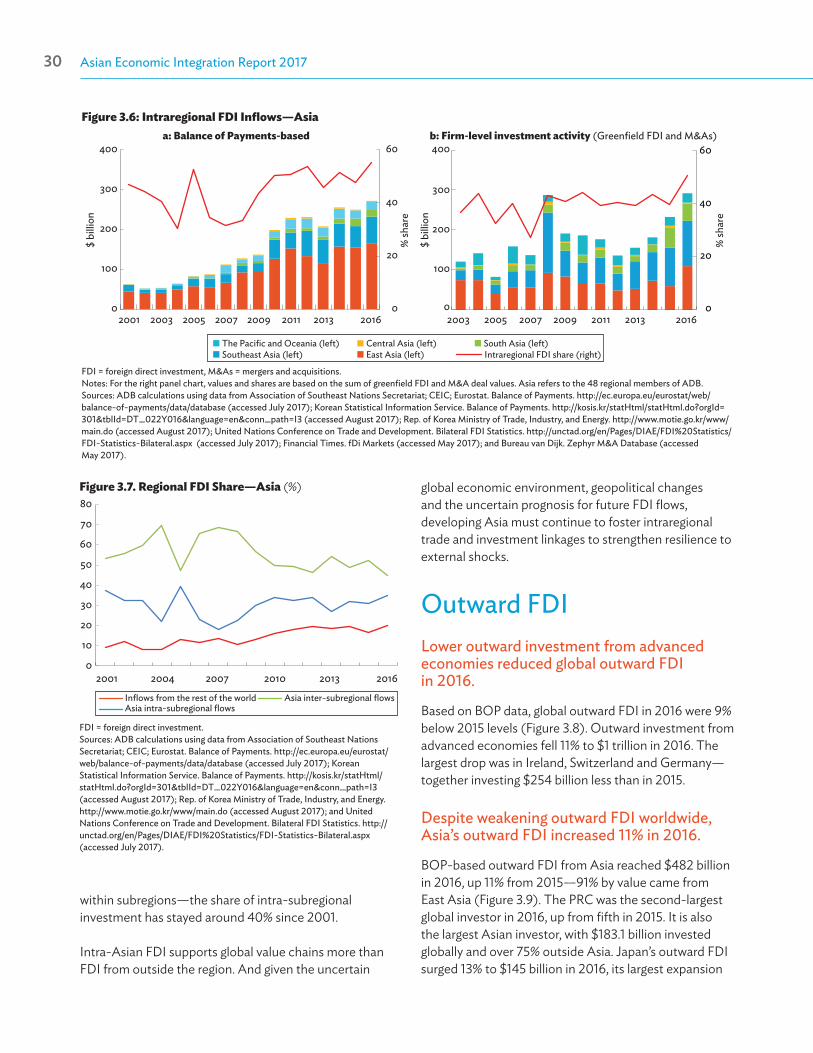
Despite the slowdown in inward FDI worldwide, intraregional investment continues to strengthen—the intraregional share of inward FDI to Asia increased from 32% in 2007 to 55% in 2016 (from $112 billion to $272 billion).
Buying into Asia-based enterprises has been notable among emerging Asian investors. The PRC, Japan, and Singapore continue to diversify their international portfolios in developing Asian economies (such as in Indonesia and India, and from others into the PRC) to gain competitive advantage in broadening manufacturing networks, securing export markets and driving innovation.
During 2010–2015, about half of inward FDI to Asia based on BOP data were intraregional (Figure 3.6a). In 2016, despite the drop in inward FDI worldwide, intraregional inflows in Asia increased by 9 percentage points. FDI from Hong Kong, China accounted for the lion’s share of intra-Asian FDI (nearly 37%), followed by Singapore (16%), Japan (16%), and the PRC (16%).
Using firm-level data to trace ultimate investment ownership—BOP data do not—the increase in intraregional FDI was even more substantial, from $232 billion in 2015 to $292 billion in 2016 (Figure 3.6b). The share of intraregional FDI to East Asia was lower than indicated by BOP data, and Southeast Asia ranked highest based on the firm-level data. This suggests that BOP may inflate intraregional inward FDI to East Asia, possibly due to transshipments and round-tripping. Except for East Asia, all subregions showed higher intraregional inward FDI based on firm-level data, indicating that a portion of intra-Asian flows were routed from outside the region, which BOP fails to record.
From both BOP data and firm level activity, FDI links both within and across subregions are strengthening, although integration levels vary by subregion (Figure 3.7). Over 2001–2016, BOP data show the share of inter-subregional investment to total inward FDI gradually grew from 9% to 20%, mainly at the expense of FDI from the ROW. This trend accompanied the strengthening of trade linkages between subregions, highlighting the complementarity of trade and investment in the context of cross-border production networks between subregions. However, most intraregional FDI occurs
Asian Economic Integration Report 201730 Cross-border Investment 31
The Pacific and Oceania (left) Central Asia (left) South Asia (left)Southeast Asia (left) East Asia (left) Intraregional FDI share (right)
0
20
40
60
0
100
200
300
400
2003 2005 2007 2009 2011 2013 2016
b: Firm-level investment activity (Greenfield FDI and M&As)
$ bi
llion
% sh
are
a: Balance of Payments-based
0
20
40
60
0
100
200
300
400
$ bi
llion
% sh
are
2001 2003 2005 2007 2009 2011 2013 2016
Figure 3.6: Intraregional FDI Inflows—Asia
FDI = foreign direct investment, M&As = mergers and acquisitions.Notes: For the right panel chart, values and shares are based on the sum of greenfield FDI and M&A deal values. Asia refers to the 48 regional members of ADB. Sources: ADB calculations using data from Association of Southeast Nations Secretariat; CEIC; Eurostat. Balance of Payments. http://ec.europa.eu/eurostat/web/balance-of-payments/data/database (accessed July 2017); Korean Statistical Information Service. Balance of Payments. http://kosis.kr/statHtml/statHtml.do?orgId=301&tblId=DT_022Y016&language=en&conn_path=I3 (accessed August 2017); Rep. of Korea Ministry of Trade, Industry, and Energy. http://www.motie.go.kr/www/main.do (accessed August 2017); United Nations Conference on Trade and Development. Bilateral FDI Statistics. http://unctad.org/en/Pages/DIAE/FDI%20Statistics/FDI-Statistics-Bilateral.aspx (accessed July 2017); Financial Times. fDi Markets (accessed May 2017); and Bureau van Dijk. Zephyr M&A Database (accessed May 2017).
Inflows from the rest of the world Asia inter-subregional flowsAsia intra-subregional flows
2001 2004 2007 2010 2013 20160
10
20
30
40
50
60
70
80Figure 3.7. Regional FDI Share—Asia (%)
FDI = foreign direct investment.Sources: ADB calculations using data from Association of Southeast Nations Secretariat; CEIC; Eurostat. Balance of Payments. http://ec.europa.eu/eurostat/web/balance-of-payments/data/database (accessed July 2017); Korean Statistical Information Service. Balance of Payments. http://kosis.kr/statHtml/statHtml.do?orgId=301&tblId=DT_022Y016&language=en&conn_path=I3 (accessed August 2017); Rep. of Korea Ministry of Trade, Industry, and Energy. http://www.motie.go.kr/www/main.do (accessed August 2017); and United Nations Conference on Trade and Development. Bilateral FDI Statistics. http://unctad.org/en/Pages/DIAE/FDI%20Statistics/FDI-Statistics-Bilateral.aspx (accessed July 2017).
within subregions—the share of intra-subregional investment has stayed around 40% since 2001.
Intra-Asian FDI supports global value chains more than FDI from outside the region. And given the uncertain
global economic environment, geopolitical changes and the uncertain prognosis for future FDI flows, developing Asia must continue to foster intraregional trade and investment linkages to strengthen resilience to external shocks.
Outward FDI Lower outward investment from advanced economies reduced global outward FDI in 2016.
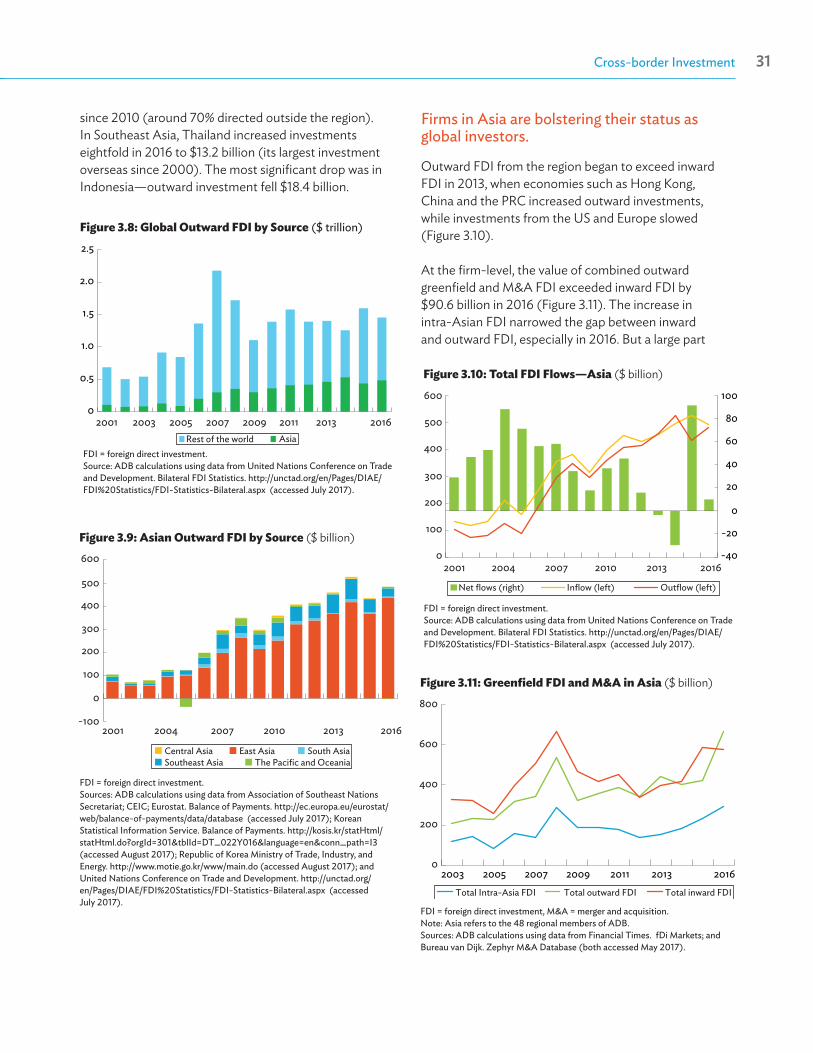
Based on BOP data, global outward FDI in 2016 were 9% below 2015 levels (Figure 3.8). Outward investment from advanced economies fell 11% to $1 trillion in 2016. The largest drop was in Ireland, Switzerland and Germany—together investing $254 billion less than in 2015.
Despite weakening outward FDI worldwide, Asia’s outward FDI increased 11% in 2016.
BOP-based outward FDI from Asia reached $482 billion in 2016, up 11% from 2015—91% by value came from East Asia (Figure 3.9). The PRC was the second-largest global investor in 2016, up from fifth in 2015. It is also the largest Asian investor, with $183.1 billion invested globally and over 75% outside Asia. Japan’s outward FDI surged 13% to $145 billion in 2016, its largest expansion
Asian Economic Integration Report 201730 Cross-border Investment 31
0
0.5
1.0
1.5
2.0
2.5
2001 2003 2005 2007 2009 2011 2013 2016Rest of the world Asia
Figure 3.8: Global Outward FDI by Source ($ trillion)
FDI = foreign direct investment.Source: ADB calculations using data from United Nations Conference on Trade and Development. Bilateral FDI Statistics. http://unctad.org/en/Pages/DIAE/FDI%20Statistics/FDI-Statistics-Bilateral.aspx (accessed July 2017).
Figure 3.9: Asian Outward FDI by Source ($ billion)
FDI = foreign direct investment.Sources: ADB calculations using data from Association of Southeast Nations Secretariat; CEIC; Eurostat. Balance of Payments. http://ec.europa.eu/eurostat/web/balance-of-payments/data/database (accessed July 2017); Korean Statistical Information Service. Balance of Payments. http://kosis.kr/statHtml/statHtml.do?orgId=301&tblId=DT_022Y016&language=en&conn_path=I3 (accessed August 2017); Republic of Korea Ministry of Trade, Industry, and Energy. http://www.motie.go.kr/www/main.do (accessed August 2017); and United Nations Conference on Trade and Development. http://unctad.org/en/Pages/DIAE/FDI%20Statistics/FDI-Statistics-Bilateral.aspx (accessed July 2017).
-100
0
100
200
300
400
500
600
2001 2004 2007 2010 2013 2016
East Asia South AsiaSoutheast Asia The Pacific and OceaniaCentral Asia
Figure 3.10: Total FDI Flows—Asia ($ billion)
FDI = foreign direct investment.Source: ADB calculations using data from United Nations Conference on Trade and Development. Bilateral FDI Statistics. http://unctad.org/en/Pages/DIAE/FDI%20Statistics/FDI-Statistics-Bilateral.aspx (accessed July 2017).
-40
-20
0
20
40
60
80
100
0
100
200
300
400
500
600
2001 2004 2007 2010 2013 2016
Net flows (right) Inflow (left) Outflow (left)
Firms in Asia are bolstering their status as global investors.
Outward FDI from the region began to exceed inward FDI in 2013, when economies such as Hong Kong, China and the PRC increased outward investments, while investments from the US and Europe slowed (Figure 3.10).
At the firm-level, the value of combined outward greenfield and M&A FDI exceeded inward FDI by $90.6 billion in 2016 (Figure 3.11). The increase in intra-Asian FDI narrowed the gap between inward and outward FDI, especially in 2016. But a large part
Figure 3.11: Greenfield FDI and M&A in Asia ($ billion)
FDI = foreign direct investment, M&A = merger and acquisition.Note: Asia refers to the 48 regional members of ADB. Sources: ADB calculations using data from Financial Times. fDi Markets; and Bureau van Dijk. Zephyr M&A Database (both accessed May 2017).
Total outward FDI
0
200
400
600
800
2003 2005 2007 2009 2011 2013 2016Total Intra-Asia FDI Total inward FDI
since 2010 (around 70% directed outside the region). In Southeast Asia, Thailand increased investments eightfold in 2016 to $13.2 billion (its largest investment overseas since 2000). The most significant drop was in Indonesia—outward investment fell $18.4 billion.

Asian Economic Integration Report 201732 Cross-border Investment 33
of greenfield investments and M&A deals still are targeted outside Asia. In particular, Asian investors are increasingly investing outside the region through M&As—$250 billion in 2016 compared with just over $100 billion in 2015. For instance, PRC investments in the US (both greenfield and M&As) reached $46 billion in 2003–2015 (36% in real estate and financial services).
A large part of intraregional FDI is greenfield investment, mainly in manufacturing, while M&As are more dominant for FDI going outside the region.
Aggregating greenfield investments and M&As show almost 50% of Asia’s investments are intraregional, followed by the European Union (EU)-28 (19%) and North America (15%). Intra-Asian greenfield investments ($189 billion) are almost twice as large as M&As (Figure 3.12). This is expected as a substantial amount of intra-Asian FDI is linked to global value chains, which generally take the greenfield mode of entry. Most intraregional greenfield investments are in manufacturing, which rapidly increased since 2012 to reach $139 billion (73% of the total) in 2016. In contrast, intraregional M&As are mostly in services—$72 billion (or 70% of total) in 2016. There was a jump in intra-Asia M&As in manufacturing between 2015 and 2016, due to an influx of manufacturing M&As in Thailand; Viet Nam; and Hong Kong, China.
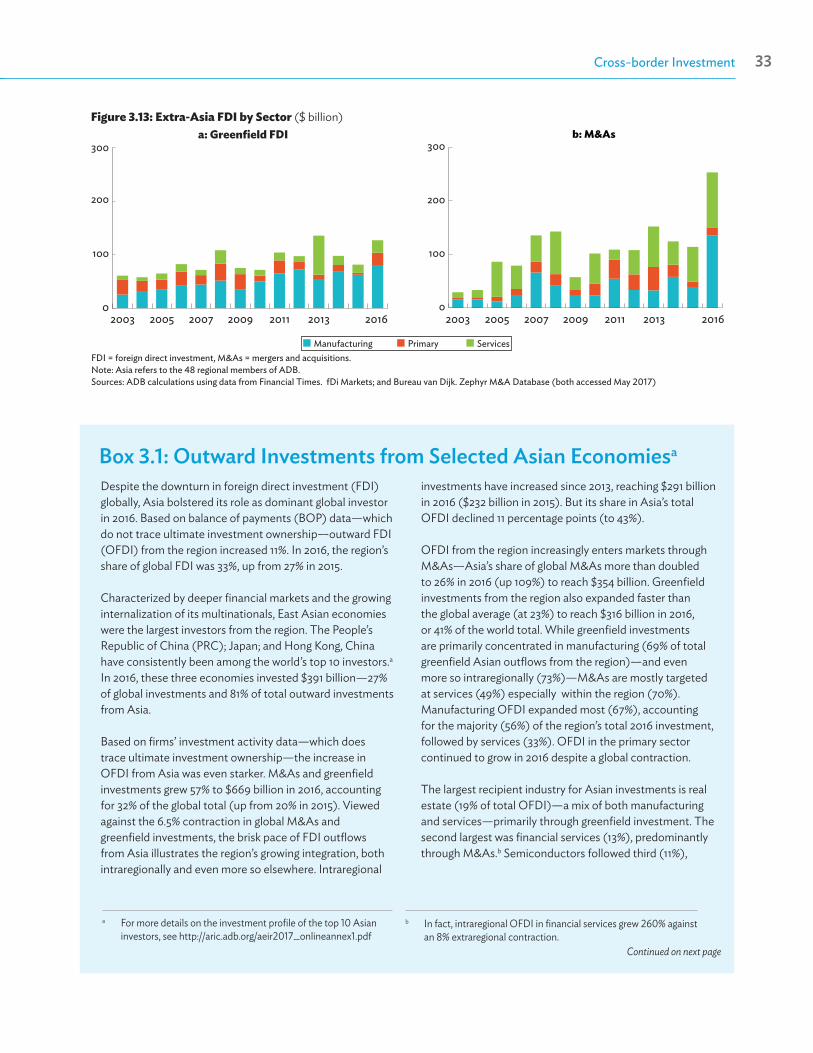
In contrast, Asian investments outside the region were mostly in M&As, far exceeding greenfield
investments—$254 billion in M&As versus $127 billion in greenfield investments. This suggests extraregional FDI remains mostly market-seeking (Figure 3.13). Manufacturing accounted for almost two-third ($81 billion) of the total greenfield investment. While Asia’s investments in services comprise a much larger share of M&As outside the region, manufacturing M&As more than tripled to reach $135 billion in 2016.
Asia’s emerging role as a global investor could further increase the intraregional share of inward FDI, and allow the region to leverage its own trade and investment linkages to achieve more inclusive and sustainable growth.
Asia has been and will continue to be a major driver of world growth—Asia accounted for more than half of global growth in gross domestic product and has been steadily increasing its share since at least 2012. Its stable share of global inward FDI (at least 25% since 2008) underscores the region’s reliability as an investment platform. In addition, the recent growth in outward investment from emerging Asian investors highlights the growing internationalization of Asia’s multinationals, which are increasing their global presence especially within the region. This is an encouraging sign for the region’s capacity to create jobs, promote small and medium enterprises and innovation, and advance income opportunities toward more inclusive and sustainable growth regardless of the external economic environment.
Figure 3.12: Intra-Asia FDI by Sector ($ billion)
FDI = foreign direct investment, M&As = mergers and acquisitions.Note: Asia refers to the 48 regional members of ADB.Sources: ADB calculations using data from Financial Times. fDi Markets; and Bureau van Dijk. Zephyr M&A Database (both accessed May 2017).
0
50
100
150
200
2003 2005 2007 2009 2011 2013 2016
a: Greenfield FDI
0
50
100
150
200
2003 2005 2007 2009 2011 2013 2016
b: M&As
Manufacturing Primary Services
Asian Economic Integration Report 201732 Cross-border Investment 33
Figure 3.13: Extra-Asia FDI by Sector ($ billion)
FDI = foreign direct investment, M&As = mergers and acquisitions.Note: Asia refers to the 48 regional members of ADB.Sources: ADB calculations using data from Financial Times. fDi Markets; and Bureau van Dijk. Zephyr M&A Database (both accessed May 2017)
0
100
200
300
2003 2005 2007 2009 2011 2013 2016
a: Greenfield FDI
2003 2005 2007 2009 2011 2013 20160
100
200
300b: M&As
Manufacturing Primary Services
Box 3.1: Outward Investments from Selected Asian Economiesa
Continued on next page
a For more details on the investment profile of the top 10 Asian investors, see http://aric.adb.org/aeir2017_onlineannex1.pdf
b In fact, intraregional OFDI in financial services grew 260% against an 8% extraregional contraction.
Despite the downturn in foreign direct investment (FDI) globally, Asia bolstered its role as dominant global investor in 2016. Based on balance of payments (BOP) data—which do not trace ultimate investment ownership—outward FDI (OFDI) from the region increased 11%. In 2016, the region’s share of global FDI was 33%, up from 27% in 2015.
Characterized by deeper financial markets and the growing internalization of its multinationals, East Asian economies were the largest investors from the region. The People’s Republic of China (PRC); Japan; and Hong Kong, China have consistently been among the world’s top 10 investors.a In 2016, these three economies invested $391 billion—27% of global investments and 81% of total outward investments from Asia.
Based on firms’ investment activity data—which does trace ultimate investment ownership—the increase in OFDI from Asia was even starker. M&As and greenfield investments grew 57% to $669 billion in 2016, accounting for 32% of the global total (up from 20% in 2015). Viewedagainst the 6.5% contraction in global M&As and greenfield investments, the brisk pace of FDI outflows from Asia illustrates the region’s growing integration, both intraregionally and even more so elsewhere. Intraregional
investments have increased since 2013, reaching $291 billion in 2016 ($232 billion in 2015). But its share in Asia’s total OFDI declined 11 percentage points (to 43%).
OFDI from the region increasingly enters markets through M&As—Asia’s share of global M&As more than doubled to 26% in 2016 (up 109%) to reach $354 billion. Greenfield investments from the region also expanded faster than the global average (at 23%) to reach $316 billion in 2016, or 41% of the world total. While greenfield investments are primarily concentrated in manufacturing (69% of total greenfield Asian outflows from the region)—and even more so intraregionally (73%)—M&As are mostly targeted at services (49%) especially within the region (70%). Manufacturing OFDI expanded most (67%), accounting for the majority (56%) of the region’s total 2016 investment, followed by services (33%). OFDI in the primary sector continued to grow in 2016 despite a global contraction.
The largest recipient industry for Asian investments is real estate (19% of total OFDI)—a mix of both manufacturing and services—primarily through greenfield investment. The second largest was financial services (13%), predominantly through M&As.b Semiconductors followed third (11%),

Asian Economic Integration Report 201734 Cross-border Investment 35
Box 3.1 continued
c Hong Kong, China is the only top-10 source economy with outflows overestimated, rather than underestimated, by BOP data.
with the vast majority also via M&As. Asian investments in real estate and financial services were mostly intraregional (24% and 20% of total intra-Asian FDI, respectively). Semiconductors were the fastest growing, with Asian investments increasing more than eight times to $76 billion, almost entirely through M&As outside the region.
The PRC emerged as the largest Asian investor in 2016. Prior to the global financial crisis (GFC), Japan’s OFDI was, on average, five times the size of PRC investments. Since then, the PRC has grown to become dominant investor in all sectors, but particularly in services, accounting for 45% of total Asian OFDI. As the PRC moves away from export-oriented manufacturing toward more domestic consumption demand, the character of PRC investment has changed as well. In 2016, services accounted for 67% of M&As by the PRC, and more than tripled in value ($88 billion)—with intraregional M&As spiking tenfold (to $50 billion)—mainly in real estate and financial services in the United States (US) and Hong Kong, China. In contrast, most Japanese investments are in manufacturing, with semiconductors the largest recipient industry. Most of Japan’s OFDI (73%) is targeted outside the region, while its most popular destination in Asia is the PRC.
Hong Kong, China is the third-largest Asian investor based on BOP data, but firm-level data show investment activity is $20 billion lower than indicated by BOP.c This suggests the economy is a conduit for investments originating elsewhere. Hong Kong, China’s investments abroad reached $40.2 billion in 2016, based on firm-level data, mainly directed to non-Asian countries. The top recipients within Asia, Thailand and the PRC, each accounted for about 14% of its total outbound FDI. Its investment portfolio favors business and real estate services, mainly through cross-border M&As, while the majority of its manufacturing investments are in consumer products.
Most of the increase in the Republic of Korea’s foreign investments in 2016 was in the primary sector—especially coal, oil and natural gas (almost a quarter of OFDI)—but greenfield investments in manufacturing continued to make up the lion’s share. In a marked reversal from 2015, only 50% of OFDI from the Republic of Korea was intraregional (74% in 2015), with Viet Nam and Islamic Republic of Iran as first
and third largest destination, respectively. Multinationals from the Republic of Korea also invested considerably in alternative and renewable energy, mainly in the US.
In sharp contrast with other East Asian economies, investments from Taipei,China were mostly intraregional (83% in 2016)—the highest in the region. M&As in developing Asia drove much of its OFDI, which quadrupled from $3.7 billion in 2010 to $14.8 billion in 2016. Taipei,China’s investments are primarily concentrated in labor-intensive manufacturing such as electronic components and consumer electronics, as well as services such as financial services. Partner firms in the PRC accounted for almost half (46.1%) of Taipei,China’s OFDI, followed by Viet Nam (13.1%). Low labor costs, among other factors, attract export-oriented multinationals from Taipei,China.
Outside East Asia, Singapore is the dominant investor, with its OFDI mostly heading to the US (56.1%), followed by the PRC (7.8%) and India (7.4%). Since 2003, Singapore’s outward investments have been mostly in services. But recently it has shifted into manufacturing, with semiconductors accounting for almost half of all Singaporean investments in 2016.
In addition to Taipei,China; Thailand; Malaysia; and India were among source economies with an intraregional share of OFDI above 50%. Since 2000, Malaysia and India have emerged as prominent Asian investors. While interrupted by the GFC, Malaysia’s OFDI returned to growth in 2011, increasing 6% during 2010–2016 to $28.7 billion. In 2016, Malaysian OFDI grew fastest among Asian economies (164%). Traditionally, Malaysian investments have been in the primary sector (especially coal, oil and natural gas), but shifted markedly toward services, particularly financial services, in 2016. By contrast, India’s OFDI slowed from the GFC to 2015, before recovering 17.0% in 2016 to $21.1 billion—still less than half its 2007 peak. While India’s emergence as a notable investor was driven by services—software, information technology and financial services to the United Kingdom (UK) and the US—the 2016 recovery was largely from greenfield investments in coal, oil and natural gas (Australia attracted about 20% of the total). India’s multinationals also invested in pharmaceuticals in Bangladesh.
Unlike Malaysia and India, Thailand’s OFDI have been consistently increasing despite the GFC, expanding from $2.3 billion in 2007 to $17.2 in 2016 (84% intraregional). The spike since 2011 has been driven mainly by greenfield real-
Asian Economic Integration Report 201734 Cross-border Investment 35
estate investments in the manufacturing sectors of neighboring economies, with Viet Nam attracting almost a third of the total in 2016.
Among the top Asian investors, Australia’s investment fell 30% in 2016. A majority were greenfield investments in manufacturing and services, and mainly in non-Asian and advanced economies, primarily the UK.
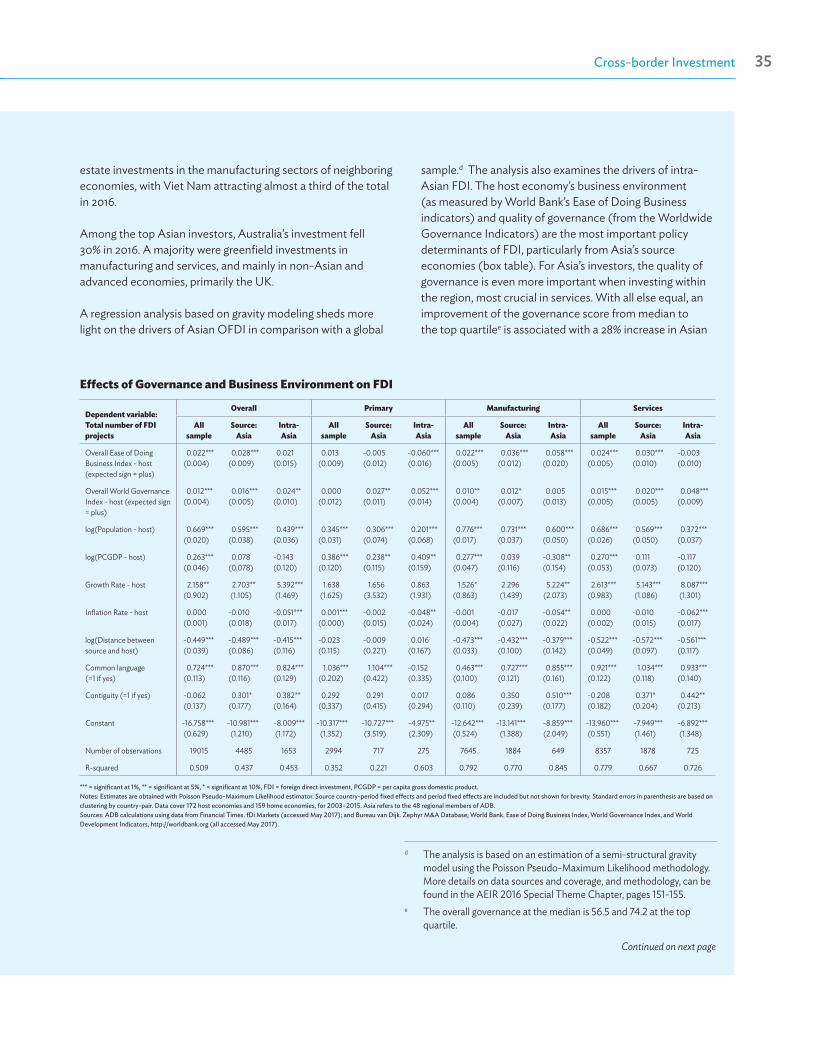
A regression analysis based on gravity modeling sheds more light on the drivers of Asian OFDI in comparison with a global
sample.d The analysis also examines the drivers of intra-Asian FDI. The host economy’s business environment (as measured by World Bank’s Ease of Doing Business indicators) and quality of governance (from the Worldwide Governance Indicators) are the most important policy determinants of FDI, particularly from Asia’s source economies (box table). For Asia’s investors, the quality of governance is even more important when investing within the region, most crucial in services. With all else equal, an improvement of the governance score from median to the top quartilee is associated with a 28% increase in Asian
d The analysis is based on an estimation of a semi-structural gravity model using the Poisson Pseudo-Maximum Likelihood methodology. More details on data sources and coverage, and methodology, can be found in the AEIR 2016 Special Theme Chapter, pages 151-155.
e The overall governance at the median is 56.5 and 74.2 at the top quartile.
Continued on next page
Effects of Governance and Business Environment on FDI
Dependent variable: Total number of FDI projects
Overall Primary Manufacturing Services
All sample
Source: Asia
Intra-Asia
All sample
Source: Asia
Intra-Asia
All sample
Source: Asia
Intra-Asia
All sample
Source: Asia
Intra-Asia
Overall Ease of Doing Business Index - host (expected sign = plus)
0.022***(0.004)
0.028***(0.009)
0.021(0.015)
0.013(0.009)
-0.005(0.012)
-0.060***(0.016)
0.022***(0.005)
0.036***(0.012)
0.058***(0.020)
0.024***(0.005)
0.030***(0.010)
-0.003(0.010)
Overall World Governance Index - host (expected sign = plus)
0.012***(0.004)
0.016***(0.005)
0.024**(0.010)
0.000(0.012)
0.027**(0.011)
0.052***(0.014)
0.010**(0.004)
0.012*(0.007)
0.005(0.013)
0.015***(0.005)
0.020***(0.005)
0.048***(0.009)
log(Population - host) 0.669***(0.020)
0.595***(0.038)
0.439***(0.036)
0.345***(0.031)
0.306***(0.074)
0.201***(0.068)
0.776***(0.017)
0.731***(0.037)
0.600***(0.050)
0.686***(0.026)
0.569***(0.050)
0.372***(0.037)
log(PCGDP - host) 0.263***(0.046)
0.078(0.078)
-0.143(0.120)
0.386***(0.120)
0.238**(0.115)
0.409**(0.159)
0.277***(0.047)
0.039(0.116)
-0.308**(0.154)
0.270***(0.053)
0.111(0.073)
-0.117(0.120)
Growth Rate - host 2.158**(0.902)
2.703**(1.105)
5.392***(1.469)
1.638(1.625)
1.656(3.532)
0.863(1.931)
1.526*(0.863)
2.296(1.439)
5.224**(2.073)
2.613***(0.983)
5.143***(1.086)
8.087***(1.301)
Inflation Rate - host 0.000(0.001)
-0.010(0.018)
-0.051***(0.017)
0.001***(0.000)
-0.002(0.015)
-0.048**(0.024)
-0.001(0.004)
-0.017(0.027)
-0.054**(0.022)
0.000(0.002)
-0.010(0.015)
-0.062***(0.017)
log(Distance between source and host)
-0.449***(0.039)
-0.489***(0.086)
-0.415***(0.116)
-0.023(0.115)
-0.009(0.221)
0.016(0.167)
-0.473***(0.033)
-0.432***(0.100)
-0.379***(0.142)
-0.522***(0.049)
-0.572***(0.097)
-0.561***(0.117)
Common language (=1 if yes)
0.724***(0.113)
0.870***(0.116)
0.824***(0.129)
1.036***(0.202)
1.104***(0.422)
-0.152(0.335)
0.463***(0.100)
0.727***(0.121)
0.855***(0.161)
0.921***(0.122)
1.034***(0.118)
0.933***(0.140)
Contiguity (=1 if yes) -0.062(0.137)
0.301*(0.177)
0.382**(0.164)
0.292(0.337)
0.291(0.415)
0.017(0.294)
0.086(0.110)
0.350(0.239)
0.510***(0.177)
-0.208(0.182)
0.371*(0.204)
0.442**(0.213)
Constant -16.758***(0.629)
-10.981***(1.210)
-8.009***(1.172)
-10.317***(1.352)
-10.727***(3.519)
-4.975**(2.309)
-12.642***(0.524)
-13.141***(1.388)
-8.859***(2.049)
-13.960***(0.551)
-7.949***(1.461)
-6.892***(1.348)
Number of observations 19015 4485 1653 2994 717 275 7645 1884 649 8357 1878 725
R-squared 0.509 0.437 0.453 0.352 0.221 0.603 0.792 0.770 0.845 0.779 0.667 0.726
*** = significant at 1%, ** = significant at 5%, * = significant at 10%, FDI = foreign direct investment, PCGDP = per capita gross domestic product.Notes: Estimates are obtained with Poisson Pseudo-Maximum Likelihood estimator. Source country-period fixed effects and period fixed effects are included but not shown for brevity. Standard errors in parenthesis are based on clustering by country-pair. Data cover 172 host economies and 159 home economies, for 2003–2015. Asia refers to the 48 regional members of ADB.Sources: ADB calculations using data from Financial Times. fDi Markets (accessed May 2017); and Bureau van Dijk. Zephyr M&A Database; World Bank. Ease of Doing Business Index, World Governance Index, and World Development Indicators, http://worldbank.org (all accessed May 2017).
Asian Economic Integration Report 201736 Cross-border Investment PB
investment projects, and 42% when the host economy is also Asian. In the services sector, the corresponding marginal impact is 35% and 85%, respectively. The growth rate of the host economy also matters significantly more for attracting intra-Asian OFDI in both manufacturing and services.
There are some interesting differences between the global and Asian sample. Results suggest that Asia’s multinationals are motivated by efficiency-seeking considerations (such as lower labor costs) when investing in manufacturing within the region. This reinforces the view that intra-Asian investments are tied to regional value chains (more so for greenfield investments). This contrasts with the global sample where per capita gross domestic product of the host economy is positively associated with the number of FDI projects. Asia’s investors are even more likely to invest in manufacturing in economies sharing a border, pointing to a high level of intra-subregional investment integration. Asian manufacturing investments in economies sharing a border are 67% higher, whereas there is no similar positive association between contiguity and FDI in the global sample.
Despite the increasingly inward-oriented policies in certain advanced economies, recent trends in Asia’s OFDI and the findings of the regression analysis are encouraging for the region’s developing economies. Improving governance will help these economies to continue attracting export-oriented multinationals from the region, despite the uncertain global economic environment.
Box 3.1 continued ReferencesADB. 2016. Asian Economic Integration Report 2016: What Drives
Foreign Direct Investments in Asia and the Pacific. Manila
Association of Southeast Nations Secretariat. ASEANstats Database. https://data.aseanstats.org/ (accessed July 2017).
Eurostat. Balance of Payments. http://ec.europa.eu/eurostat/web/balance-of-payments/data/database (accessed July 2017).
Korean Statistical Information Service. Balance of Payments. http://kosis.kr/statHtml/statHtml.do?orgId=301&tblId=DT_022Y016&language=en&conn_path=I3 (accessed August 2017).
Government of the Republic of Korea. Ministry of Trade, Industry, and Energy. FDI Arrival. http://www.motie.go.kr/www/main.do (accessed August 2017).
World Bank. 2017. Doing Business 2017: Equal Opportunity for All. http://www.doingbusiness.org/ (accessed September 2017).
_____. World Development Indicators. http://databank.worldbank.org/data/reports.aspx?source=world-development-indicators (accessed September 2017).
_____. Worldwide Governance Indicators. http://info.worldbank.org/governance/wgi/#home (accessed September 2017).
United Nations Conference on Trade and Development. Bilateral FDI Statistics. http://unctad.org/en/Pages/DIAE/FDI%20Statistics/FDI-Statistics-Bilateral.aspx (accessed July 2017).
Related Documents