Foreword oreword oreword oreword oreword iii T he Asian Development Outlook 2000 is the 12th in a series of annual economic reports on the devel- oping member countries of the Asian Development Bank. The Outlook provides a comprehensive analy- sis of salient macroeconomic and development issues in individual countries as well as at the regional level, from both positive and normative perspectives. In 1999 the world economy finally shook off the effects of the 1997 Asian crisis and the economic dis- turbances in Russia and Brazil that followed. Within Asia a moderate to strong upswing replaced negative growth in several countries; interest rates decreased and exchange rates stabilized. Domestic demand and export growth improved. Increased confidence in the region’s economic prospects is evident from strength- ened capital inflows from overseas investors, increased vitality of equity markets, and revived consumer con- fidence. All of the countries that were directly affected by the crisis and experienced negative economic growth in 1998 — Indonesia, Republic of Korea, Malaysia, Philippines, and Thailand — recovered to positive growth. The strength of the rebound varied from a strong recovery in the Republic of Korea to a more modest revival in Indonesia. The People’s Republic of China (PRC) and South Asia were insu- lated from the crisis to a certain extent and as a result fared better. In 1999 growth slowed slightly in the PRC, while accelerating by a similar margin in South Asia. Growth in Central Asia showed a strong increase as the effect of the Russian crisis dissipated, and the per- formance of the Pacific economies improved from the previous year. To sustain and further reinvigorate the growth process, developing Asia will have to continue with its agenda of reforms and institutional innovations in areas that are considered weak and vulnerable. In particular the crisis has exposed weaknesses in the banking system, capital markets, and corporate sectors of the affected countries. The scale and complexities of the issues involved are enormous. The crisis has rendered a large part of the banking and corporate sectors financially insolvent. In the immediate after- math of the crisis, the ADB cooperated with other donors in providing emergency financial assistance to stabilize the affected economies and to support urgent structural reforms. On its part, the ADB focused on a structural agenda that included restructuring insolvent financial institutions, improving corporate gover- nance, and deregulating and opening domestic mar- kets. In this regard, the ADB provided loans to assist Indonesia, Korea, and Thailand in implementing financial sector reforms. The crisis countries have made significant progress in bank and corporate sec- tor restructuring and have created new organizational entities to deal with these issues. While much progress has been made, much remains to be done. However, given the willingness and dedication of the governments to address this unfinished agenda of reform and restructuring, we are confident that the results of these structural reforms and review of policies

Welcome message from author
This document is posted to help you gain knowledge. Please leave a comment to let me know what you think about it! Share it to your friends and learn new things together.
Transcript

iiiFOREWORD
FFFFForewordorewordorewordorewordoreword
iii
TTTTThe Asian Development Outlook 2000 is the 12th ina series of annual economic reports on the devel-
oping member countries of the Asian DevelopmentBank. The Outlook provides a comprehensive analy-sis of salient macroeconomic and development issuesin individual countries as well as at the regional level,from both positive and normative perspectives.
In 1999 the world economy finally shook off theeffects of the 1997 Asian crisis and the economic dis-turbances in Russia and Brazil that followed. WithinAsia a moderate to strong upswing replaced negativegrowth in several countries; interest rates decreasedand exchange rates stabilized. Domestic demand andexport growth improved. Increased confidence in theregion’s economic prospects is evident from strength-ened capital inflows from overseas investors, increasedvitality of equity markets, and revived consumer con-fidence. All of the countries that were directly affectedby the crisis and experienced negative economicgrowth in 1998 — Indonesia, Republic of Korea,Malaysia, Philippines, and Thailand — recovered topositive growth. The strength of the rebound variedfrom a strong recovery in the Republic of Korea to amore modest revival in Indonesia. The People’sRepublic of China (PRC) and South Asia were insu-lated from the crisis to a certain extent and as a resultfared better. In 1999 growth slowed slightly in the PRC,while accelerating by a similar margin in South Asia.Growth in Central Asia showed a strong increase asthe effect of the Russian crisis dissipated, and the per-
formance of the Pacific economies improved from theprevious year.
To sustain and further reinvigorate the growthprocess, developing Asia will have to continue withits agenda of reforms and institutional innovations inareas that are considered weak and vulnerable. Inparticular the crisis has exposed weaknesses in thebanking system, capital markets, and corporate sectorsof the affected countries. The scale and complexitiesof the issues involved are enormous. The crisis hasrendered a large part of the banking and corporatesectors financially insolvent. In the immediate after-math of the crisis, the ADB cooperated with otherdonors in providing emergency financial assistance tostabilize the affected economies and to support urgentstructural reforms. On its part, the ADB focused on astructural agenda that included restructuring insolventfinancial institutions, improving corporate gover-nance, and deregulating and opening domestic mar-kets. In this regard, the ADB provided loans to assistIndonesia, Korea, and Thailand in implementingfinancial sector reforms. The crisis countries havemade significant progress in bank and corporate sec-tor restructuring and have created new organizationalentities to deal with these issues. While much progresshas been made, much remains to be done.
However, given the willingness and dedicationof the governments to address this unfinished agendaof reform and restructuring, we are confident that theresults of these structural reforms and review of policies

ASIAN DEVELOPMENT OUTLOOK 2000iv
and institutions will result in improved economic effi-ciency, greater transparency, better governance, andimproved social equity. The region will emerge stron-ger and more able to fulfill its potential for sustainedeconomic growth and development.
Part I of this year’s Outlook comprises two chap-ters. The first chapter provides a comprehensive re-view of economic developments in the Asian andPacific region against a background of developmentsin the world economy. In the second chapter, theOutlook presents a progress report on financial andcorporate restructuring in the countries most affectedby the crisis. This chapter develops elements of sucha strategy, as well as an agenda for strengthening on-going reforms, improving governance, reducing fiscalimbalances, and developing financial markets.
Part II discusses the recent economic perfor-mance and short-term prospects for each of the37 developing member countries of the ADB.It also reviews and assesses economic managementand policy and development issues from a medium-term perspective.
Part III discusses the social challenges the Asianregion faces as it moves into the new millennium. Itreviews the record of social achievement, analyzessalient factors behind the social challenge, and rec-ommends policies for change. In addition to poverty,this challenge has many dimensions: low literacy, un-satisfactory education, poor health and nutrition, en-vironmental degradation, income and wealthdisparities, and discrimination. Several conclusionsfollow from the analysis, including the importance of
openness and market orientation in sustaining vibranteconomic growth that includes the poor and disad-vantaged. For growth to be inclusive, renewed andmore focused efforts to invest in human resources andphysical infrastructure are crucial. The ability and willof governments to address social issues through thepolitical process and good governance must bestrengthened. Finally, national governments shouldcreate a fiscally prudent social safety net to safeguardthe nonpoor from a sudden push into poverty, andthe poor from a descent into extreme poverty. Whiledeveloping an agenda to address social issues isprimarily the task of national governments, the inter-national community can assist by increasing foreignassistance (which has declined sharply in recent years);providing international public goods, such as researchon tropical diseases and tropical agriculture, whichconcern the majority of the poor; and improving theglobal trading environment, which remains encum-bered by many restrictions in areas of interests to poorcountries.
The ADB has recently adopted poverty reduc-tion as its overarching objective. This Asian Develop-ment Outlook 2000 provides a useful addition to ourstock of knowledge on both the location and dimen-sions of the poverty problem, as well as specific policiesto address this crucial social challenge in individualcountries.
TADAO CHINOPresident
15SOUTH ASIA
Acronyms and AbbreviationsAcronyms and AbbreviationsAcronyms and AbbreviationsAcronyms and AbbreviationsAcronyms and Abbreviations
xv
ADB Asian Development BankAMC Asset management companyAPEC Asia-Pacific Economic CooperationEU European UnionFDI Foreign direct investmentGDP Gross domestic productGEM Growth Enterprise MarketGNP Gross national productIBRA Indonesian Bank Restructuring AgencyILO International Labour OrganizationIMF International Monetary FundINDRA Indonesian Debt Restructuring AgencyIT Information technologyMENA Middle East-North AfricaNASDAQ National Association of Securities Dealers Automated QuotationsNGO Nongovernmental organizationNPL Nonperforming loanNPRT Nauru Phosphate Royalties TrustOECD Organisation for Economic Co-operation and DevelopmentOPEC Organization of Petroleum Exporting CountriesRERF Reserve Equalization Reserve FundSME Small and medium-size enterpriseSOE State-owned enterpriseUNCTAD United Nations Conference on Trade and DevelopmentWHO World Health OrganizationWTO World Trade Organization

DefinitionsDefinitionsDefinitionsDefinitionsDefinitions
xvi
The classification of economies by major analyticor geographic groupings such as industrial coun-
tries, developing countries, Africa, Latin America,Middle East, Europe, and transitional countries followsthe classification adopted by the InternationalMonetary Fund. Latin America, however, is referredto as developing countries in the Western Hemispherein the IMF classification. Transitional economies inAsia include Kazakhstan, Kyrgyz Republic, Mongolia,Tajikistan, and Uzbekistan.
For purposes of this Outlook the following apply:
! Developing Asia refers to the 37 developingmember countries of the Asian Development Bankdiscussed in this Outlook.
! Newly industrialized economies (NIEs) com-prise Hong Kong, China; Republic of Korea;Singapore; and Taipei,China.
! South Asia comprises Bangladesh, Bhutan, India,Maldives, Nepal, Pakistan, and Sri Lanka.
! Southeast Asia comprises Cambodia, Indonesia,Lao People’s Democratic Republic, Malaysia,Myanmar, Philippines, Thailand, and Viet Nam.
! Central Asian republics comprise Kazakhstan,Kyrgyz Republic, Tajikistan, and Uzbekistan.
! The Pacific comprises Cook Islands, Fiji Islands,Kiribati, Marshall Islands, Federated States ofMicronesia, Nauru, Papua New Guinea, Samoa,Solomon Islands, Tonga, Tuvalu, and Vanuatu.
! East Asia comprises the NIEs, the People’sRepublic of China, and Mongolia.
! Crisis-affected countries comprise Indonesia,Republic of Korea, Malaysia, Philippines, andThailand.
! G7 comprises Canada, France, Germany, Italy,Japan, United Kingdom, and United States.
! Other non-Asian developing economies referto Argentina, Brazil, Chile, Colombia, Egypt, Mexico,Morocco, Turkey, and Venezuela.
Unless otherwise specified, the symbol $ meansUS dollars.
This Outlook is based on data available up to 8 March2000.
3ECONOMIC DEVELOPMENTS AND PROSPECTS
Economic DevelopmentsEconomic DevelopmentsEconomic DevelopmentsEconomic DevelopmentsEconomic Developmentsand Prospectsand Prospectsand Prospectsand Prospectsand Prospects
The year 1999 saw the resolution of the financial crisis in developing Asia and acceleration of globalgrowth, propelled primarily by a buoyant US economy. Led by the newly industrialized economies(NIEs) and the People’s Republic of China (PRC), Asia posted strong growth that meant almosttripling the growth rate from the previous year. Prospects for further acceleration of growth in theregion in the next two years depend on the sustainability of domestic demand, favorable global economicconditions, and progress in corporate and financial sector reforms in the crisis-affected economies.
IIIIIn the fall of 1998, many economies in Asia were inrecession, capital flows had turned negative, Russia
had just defaulted on its official debt, and the outlookfor the region and the world economy were generallypessimistic. Stock markets were languishing and therewas a very real fear that the world economy would tipinto recession. The sharp decline in worldwide eco-nomic growth had brought commodity prices to his-torical lows, with oil prices plummeting by 30 percent.The contagion effect from the Asian crisis was threat-ening Latin America, where the Brazilian currency,the real, was under siege. European banks, curren-cies, and stock markets were badly affected by theRussian devaluation and subsequent default duringJuly and August, and the euro currency area appearedto be faltering. In its fall issue of the 1998 WorldEconomic Outlook, the International Monetary Fund(IMF) slashed its forecast for 1999 world growth from3.7 percent to 2.5 percent, stating, “The risks to thisprojection, however, are predominantly on the down-side. Indeed a significantly worse outcome is clearlypossible.” The IMF would later downgrade its worldgrowth forecast even further, to 2.3 percent.
A year and a half later the outlook for the worldeconomy is, however, much more bullish. The year1999 turned out to be much better than anyone hadexpected. The sharp rebound in global growth has nowgenerated the fear of excess growth and inflation. Howwas such a turnaround possible?
The turning point was probably October 1998,when the Federal Reserve lowered the discount ratefor the second time in two weeks. This sent a strongmessage to the world financial community that theUnited States (US) was ready to take whatever mea-sures necessary to stem the threat. Markets respondedquickly and enthusiastically. At about the same time,the Japanese government passed legislation to dealwith bad loans in the banking system, and a monthlater, passed a stimulus package that worked to bringabout positive growth the coming year. BetweenNovember 1998 and April 1999, the European CentralBank also lowered interest rates in tandem with USrates. Lower interest rates in industrial countries werematched by a further relaxation of monetary policyand fiscal policy in the countries that had been hit bythe crisis in Asia.
ASIAN DEVELOPMENT OUTLOOK 20004
These coordinated efforts on the part of boththe industrial world and the crisis-affected developingcountries in Asia were largely responsible for the up-turn of the world economy in 1999, as it finally shookoff the effects of the 1997 Asian crisis and the eco-nomic disturbances in Russia and Brazil that followed.Growth resumed in some countries and acceleratedin others. The US continued to be the primary engineof growth among industrial countries and showed nosigns of a deceleration in growth, as equity marketscontinued to surge while unemployment and infla-tion remained low. The misery index—the combina-tion of the unemployment rate and the inflationrate—continued to fall (see figure 1.1).
Strong US growth also helped drive the rest ofthe North American Free Trade Area, with Canadaand Mexico also performing well. Europe ended theyear on an increasingly positive note, with Germanyand France providing much of the impetus for growthin the region. Some countries in Asia moved to ahigher growth path while others emerged fromrecession. Eastern and Central Europe made a modestrecovery, supported by improved conditions in Russia,Poland, and the Czech Republic. The result was ro-bust growth in the world economy and a low inflationrate for both industrial and developing economies.
Despite widespread economic success in 1999,there remained reasons for concern. The current ac-count deficit of the United States remains large andthe Japanese internal public debt has increaseddramatically the past few years. There is also the issueof how long the “new industrial revolution,” born ofthe development of the Internet, information tech-nology, and e-commerce, can continue to increaseproductivity and boost equity prices without causinginflation (see box 1.1).
In contrast to the 19th century industrial revo-lution, which featured numerous innovations in manu-facturing, today’s revolution seems to permeate a widersegment of the economy. However, traditional indus-tries are not benefiting much from these innovationsas reflected in a growing disparity in equity marketsbetween the new and older sectors of the economy.
It is difficult to gauge the overall long-run impactof the productivity gains from the new industrial revo-lution on global growth. In the short run, however, itis probably reasonable to assume that advances in
computer and information technology will help drivegrowth in industrial countries. The positive synergiesfrom globalization and new technologies should alsospread to the more progressive developing countries.
THE WORLD ECONOMYTHE WORLD ECONOMYTHE WORLD ECONOMYTHE WORLD ECONOMYTHE WORLD ECONOMY
World GDP growth increased to 3 percent in 1999 andit is likely to improve further, to about 3.5 percent in2000. World trade volume also increased slightly to4 percent in 1999, compared with the downturn of1998 when trade growth moderated to 3.6 percentfrom 9.9 percent the previous year. World trade vol-ume is projected to grow further, to nearly 6 percentin 2000. In 1999, world inflation declined to its lowestlevel in 40 years. This exemplary record reflects theintensified commitment among monetary authoritiesto focus on price stability.
Industrial CountriesIndustrial CountriesIndustrial CountriesIndustrial CountriesIndustrial Countries
GDP growth in the industrial economies reboundedto 2.6 percent in 1999 from 2.4 percent in 1998. TheUnited States and Canada continued to performstrongly in 1999, supported by buoyant domesticdemand. Overall growth in GDP in the euro areadeclined to 2.1 percent in 1999 from 2.8 percent theprevious year. In Japan, stimulative macroeconomicpolicies and the rebound in the Asian economies un-derpinned a modest economic recovery.
Inflation in the industrial economies was1.3 percent in 1999, close to the decade low of1.2 percent the previous year. Productivity increasesexerted downward pressure on prices of final goods.Prices of services, which are primarily determined bylabor costs, also remained low, because real wage in-creases lagged behind productivity growth. Inflationin 2000 may escalate to 1.7 percent, largely due to higheroil prices in the first quarter of the year and somemodest upward pressure on wages as labor marketstighten further.
While interest rates bounced back in the latterpart of 1999 from the crisis-depressed lows of late 1998,equity markets enjoyed stellar performance due to thevigor of output and earnings growth. The tighteningof monetary policy by the major industrial economiesin 1999 caused nominal bond yields to rise.

5ECONOMIC DEVELOPMENTS AND PROSPECTS
In 1999 there was a net outflow of capital fromEurope into Japan (particularly into the equity mar-ket) and the US. The US attracted inflows of $85 bil-lion in direct investment and $241 billion in portfolioinvestment. Direct investment was primarily used forforeign acquisition of US companies. These twosources of inflows, net of outflows, financed the UScurrent account deficit of $316 billion (3.5 percent ofGDP) in 1999. Much of the net capital outflow fromthe European Union (EU) was spent on foreign merg-ers and acquisitions and liabilities issued internation-ally by regional banks. Record levels of foreigninvestment in Japanese equities took place in 1999 aseconomic growth prospects brightened. This helpedsupport the yen and contributed to the buoyancy ofthe Japanese stock market.
The outlook for industrial countries suggests atrend toward convergence of economic growth.Growth in the euro area and in Japan is expected tobe higher and US growth similar to that in 1999.Growth convergence within industrial countries willhelp maintain overall macroeconomic stability withinthe global economy. Nevertheless, policymakersneed to address imbalances in foreign trade amongthe major regions.
TransitionTransitionTransitionTransitionTransition EconomiesEconomiesEconomiesEconomiesEconomies
The transition economies showed clear signs of revivalin 1999 as growth of nearly 1 percent was recordedfollowing a slight contraction in 1998. Industrial out-put was particularly strong in Hungary and Poland, asEastern European countries benefited from the eco-nomic strength of the EU, which replaced Russia asthe major trading partner of many countries in thisregion. Countries that have undertaken structuralreforms, such as Hungary, were well positioned to takeadvantage of improved trade linkages and growingimport demand from the EU. For example, the CzechRepublic, Hungary, and Poland sent a third of theirexports to Germany and two thirds to WesternEurope. Hungary and Poland led the region in growthperformance in 1999, while in the Czech Republic,strong exports to Germany offset the effect of a strongkrona to halt economic deceleration. Boosted byhigher oil prices and the 75 percent depreciation ofthe ruble in the fall of 1998, Russia reported the stron-gest growth in industrial output in seven years as over-all GDP grew by 1.7 percent. The improvedperformance of the region led to large capital inflowsand boosted currency and equity markets. Greater sta-
ASIAN DEVELOPMENT OUTLOOK 20006
bility in Russia, along with increased import demandfrom the EU, improved current account balances inthe region. Inflation also dropped in most countries.
Growth is likely to strengthen further to 2.8 per-cent in 2000, fueled by accelerating export growth tothe EU. The downward trend in inflation and nomi-nal interest rates is likely to continue as risk premi-ums in these countries decline. Entry negotiations intothe EU will continue to dominate the policy agendafor some countries. The political situation in EasternEurope should continue to improve, which will boostbusiness confidence and foreign investment.
THE DEVELTHE DEVELTHE DEVELTHE DEVELTHE DEVELOPING ECONOMIESOPING ECONOMIESOPING ECONOMIESOPING ECONOMIESOPING ECONOMIES
Growth in the developing regions of the world im-proved from 3.2 percent in 1998 to 3.5 percent in 1999.
This was underpinned by the strong rebound indeveloping Asia, where GDP expanded by 6.2 per-cent from 2.3 percent in 1998 on the back of strongexport growth and a revival of domestic demand.Greater strength in the global economy and thedissipation of the contagion effects of the Asian crisisalso contributed to the improved performance ofdeveloping countries.
In growth, the NIEs, the PRC, and South Asianeconomies were the strongest performers among de-veloping countries. Aside from a few countries suchas Mexico, growth in Latin America was modest aspolitical uncertainty dampened economic perfor-mance and market expectations. In Africa, growthvaried substantially. Performance improved in severalsmaller countries that adopted structural reforms,while growth in the larger countries remained modest.
Box 1.1Box 1.1Box 1.1Box 1.1Box 1.1 New Economy: Much Ado about Nothing? New Economy: Much Ado about Nothing? New Economy: Much Ado about Nothing? New Economy: Much Ado about Nothing? New Economy: Much Ado about Nothing?
The New Economy doctrine—sometimes grandiosely labeled asthe New Economy paradigm—holdsthe view that informationtechnology, in conjunction withglobalization, has led to apermanent upsurge in productivityof US workers. This has in turnpushed up the growth rate the USeconomy can achieve withoutrunning up against capacity limits.The conventional view, which isbased on economic theory andhistorical evidence, holds that theUS economy has a “speed limit” ofaround 2-2.5 percent growth. Theproponents of the new economybelieve that the growth potential ofthe US economy has now beenpushed to the range of 3-4 percent,stemming from productivity andefficiency gains arising frominformation technology andglobalization.
What do data tell us aboutproductivity growth in the UnitedStates? It is clear from historical
analysis that productivity growthcomes primarily from technology andnot from improved workforce qualityor equipment per worker. Using amethod that isolates technology fromthe other two sources, the evidencesuggests that the technologycomponent of US productivity sloweddown after 1973 and never reallypicked up again. There were surgesfor short periods (1977-1978, 1983-1986, and 1990-1992), but they allfollowed recessions. The currentproductivity boom began in 1996, butwhat differentiates it from the othersurges is that it did not follow arecession, and it has not reversedafter a few years.
Is the current surge inproductivity permanent? Are we inthe middle of a new industrialrevolution created by the computer,information technology, and theInternet? Several issues must beresolved before we can answer thesequestions with any certainty. First,the computer has been in use for
many years but productivity didn’taccelerate until the early 1990s. Whywas there such a lag? It could bebecause computers were not nearly asproductive until they were linkedtogether, either in local area networksor through the Internet, and thisinterconnectedness took time todevelop and to be “sold” to thepublic. Second, even if the lag can beexplained, how has the productivityin a small sector of the economy hadsuch a beneficial effect on the entireeconomy? Third, and perhaps notquite as important, can thecontributions of these threecomponents of the new industrialrevolution—the computer,information technology, and theInternet—be separated and analyzedindividually?
As we try to answer thesequestions, we acquire a betterunderstanding of whether this isactually in a “new economy,” and ifso, precisely what is raisingproductivity. A plausible answer to
Source: http://www.brookings.org.

7ECONOMIC DEVELOPMENTS AND PROSPECTS
TheTheTheTheThe Non-AsianNon-AsianNon-AsianNon-AsianNon-Asian DevelopingDevelopingDevelopingDevelopingDeveloping EconomiesEconomiesEconomiesEconomiesEconomies
GDP growth in Africa in 1999 was slightly lower at3.1 percent, down from 3.4 percent the previous year.In the Middle East, GDP growth slowed to 1.8 per-cent from 3.2 percent in 1998 because of lower oiloutput. In 1999, growth in Latin America expandedby 0.1 percent as most countries in the region, exceptMexico and Peru, experienced recession.
Africa. Growth performance varied across the region,with many of the smaller countries—Cameroon, Côted’ Ivoire, Ghana, Mozambique, Sudan, Tanzania,Tunisia, and Uganda—performing remarkably well,with growth of 3.9-7 percent. Implementing appro-priate macroeconomic policies and favorable weatherconditions contributed to this relatively strong ex-
pansion. Algeria implemented an extensive set ofstructural reforms over the past five years, and in Tu-nisia consistently strong growth was underpinned byhealthy export performance supported by fiscal con-solidation and a flexible exchange rate policy.
However, growth in three of the largest Africaneconomies was modest. Growth in South Africa re-covered to 0.7 percent in 1999, only a slight improve-ment over 0.5 percent in 1998. Renewed financialmarket confidence; much lower interest rates; andimproved prospects for exports, particularly to Asia,contributed to this recovery. Despite rising oil pricesfollowing the reduction in Organization of PetroleumExporting Countries (OPEC) quotas in the second halfof 1999, lower oil prices in 1998 and early 1999—andthe subsequent reductions in oil production in com-pliance with lower OPEC quotas—reduced GDP
the first question, why the computeris only now so affecting the economy,is provided by a look at history.Economic historian Paul Davidargues that it takes decades for newtechnology to spread to the rest ofthe economy. His research showsthat it took several decades for thetechnology of the electric dynamo todiffuse sufficiently to raise industrialproductivity significantly. The samecould be true for computer use inbusiness, reinforced by the newinformation technology and theInternet.
To look for an answer to thesecond question regarding howproductivity gains may have spilledover from the computer andinformation technology sections,consider inventory control, moreefficient sourcing of inputs bycanvassing suppliers, and Internetretailing. Certainly inventory controlhas been improved by the use ofcomputers, but the cost savings arenot great. Input sourcing andInternet retailing may yieldproductivity advances in the future,
but the savings up to now are small.Instead, it may be that theacceleration in productivity in the1990s results from productivity gainsin the computer industry alone.There is no doubt that a genuineproductivity miracle has occurred inthis industry, and some evidencesuggests that it could have beenresponsible for the small overallacceleration in productivity in theentire economy. This suggests thatthere has been very little measurablediffusion of technology beyondcomputers.
The third question regardinghow much each of the three factorshave contributed individually togrowth may be answered by the sheerstrength in productivity in thecomputer industry. So far, whateverproductivity gains have been madeprobably result primarily from thetechnology revolution in the computerindustry alone and less from theInternet or information technology.
However, it is also plausible thatthe increased productivity has notbeen responsible for the reduced
inflation and unemployment andhigher growth. The InternationalMonetary Fund (IMF), in its latestWorld Economic Outlook 2000 suggeststhat a strong dollar and lower importcosts reduced consumer priceinflation between 1996 and 1998,masking the signs of overheating.Moreover, the IMF argues that thefinancial crisis in 1997-1998 helpedboost capital inflows, which in turnhelped lower interest rates andstrengthen the dollar despite thewidening trade deficit, thereby raisingdemand. The IMF also increased itsestimates of trend productivity,suggesting that the surge inproductivity in the past few years isnot as significant as previouslyestimated.
Whether the US economy hasmoved to a higher and seeminglysustainable growth rate, maintainingfull employment without inflation, istherefore still debatable. Only timewill tell whether the present upsurgein productivity heralded the arrival ofthe New Economy, or just anotherspike in the productivity chart.

ASIAN DEVELOPMENT OUTLOOK 20008
growth in Nigeria to 0.5 percent in 1999. This was ac-companied by rising budget and current account defi-cits. Morocco also grew slowly, as the economy wasadversely affected by a drought that decreasedagricultural output.
The implementation of structural reforms inAfrica has been constrained by the economic difficul-ties brought about by depressed non-oil commodityprices in recent years, and this continued in 1999.However, increased attention to privatization efforts,public sector reforms, and other structural measureshave in part been instrumental in improving thebusiness and investment environment in somecountries. Positive developments in trade and politi-cal cooperation have included the common externaltariff implemented by the West African Economic andMonetary Union, bilateral trade agreements betweenthe EU and some African economies, and plans forfree-trade areas in Eastern and Southern Africa.
Latin America. Many of the countries in this regionexperienced negative growth in 1999 following the1998 Brazilian currency crisis. The recession and de-valuation in Brazil—a major export market for therest of the region—combined with political instabilityin some countries to cause regional GDP growth toslow in 1999 to 0.1 percent from 2.2 percent in 1998.The three big Latin American countries, Argentina,Brazil, and Mexico, faced varying economic situations.Mexico enjoyed relatively robust growth of 3 percent,while Argentina and Brazil were in a recession, withnegative growth rates of 3 and 1 percent, respectively.All three faced difficult conditions in internationalfinancial markets: credit conditions hardened, anddebt-market access was more difficult following theBrady bond default in Ecuador and the consequentpossibility of involving private creditors in restructur-ing. The region weathered the storm largely throughforced adjustment of exchange rate, fiscal policy, orboth. Mexico had essentially separated itself from therest of the region through its strong trade dependenceon the US, which accounts for more than four fifthsof its exports. Besides Mexico, Peru is the only othercountry in the region that achieved growth. It tookadvantage of the recovery in the global demand forindustrial materials to expand production and increaserevenue in its primary and mining sectors.
Investors’ demand for a greater risk premium inview of exchange rate volatility and political instabil-ity, have kept real interest rates at extremely high lev-els in the region. Following the Brazilian devaluationin January 1999, secondary market spreads increasedfor most of the major developing country borrowers,including Latin America. However, there was apartial recovery later in the year as spreads fell some-what. The high-risk premium has curbed net capitalinflows that are needed to finance domesticinvestment. Foreign fund flows into local equity andmoney markets are being deterred because of poorgrowth prospects and exchange rate risk.
Much of the volatility in the region’s currencyand equity markets in 1999 resulted from the elec-tions in Argentina, the chance of debt default inArgentina and Mexico, and slow or negative growththrough much of the region. The recession in LatinAmerica and large public sector debt service worsenedthe region’s public finances in 1999. Even Chile, whichhad fiscal surpluses in the past five years, incurred adeficit. Despite the difficult environment, every ma-jor Latin American country achieved a primarysurplus in 1999.
The Middle East. Many countries in this regionemerged from the global financial crisis relatively un-scathed. The use of foreign exchange reserves andexternal portfolios to finance the fiscal deficits andtrade balances in the short term were used to avertthe contagion effects from other financial markets. Incountries with tighter financing constraints,contractionary expenditure policy, exchange rate de-valuation, and rescheduling of external debt were usedto regain stability.
Saudi Arabia, the main driver of growth in theArabian Peninsula and the Gulf, did not adjust itsspending to the fall in oil prices in 1998, and its gov-ernment was forced to draw on its substantial overseasassets to meet budgeted spending commitments. Fiscalausterity measures were implemented in 1999 andgrowth is expected to resume in 2000. Egypt continuedto drive growth in the Eastern Mediterranean area.Despite a change in the cabinet in 1999, progress ineconomic reform and liberalization propelled GDPgrowth to 6 percent. Growth also increased in Israel,due to greater foreign investment and political stabil-

9ECONOMIC DEVELOPMENTS AND PROSPECTS
ity. Foreign direct investment (FDI) in the Middle Eastand the North Africa (MENA) region continued tolag behind other emerging markets because of the lowlevel of integration with global capital markets. Whileglobal FDI inflow rose by 38.7 percent in 1998 to $643.9billion, inflows into the MENA region fell by 6 percentto $7.2 billion and accounted for only 1.1 percent ofglobal levels, down from 1.7 percent in 1997.
The Asian and PThe Asian and PThe Asian and PThe Asian and PThe Asian and PacificacificacificacificacificDeveloping EconomiesDeveloping EconomiesDeveloping EconomiesDeveloping EconomiesDeveloping Economies
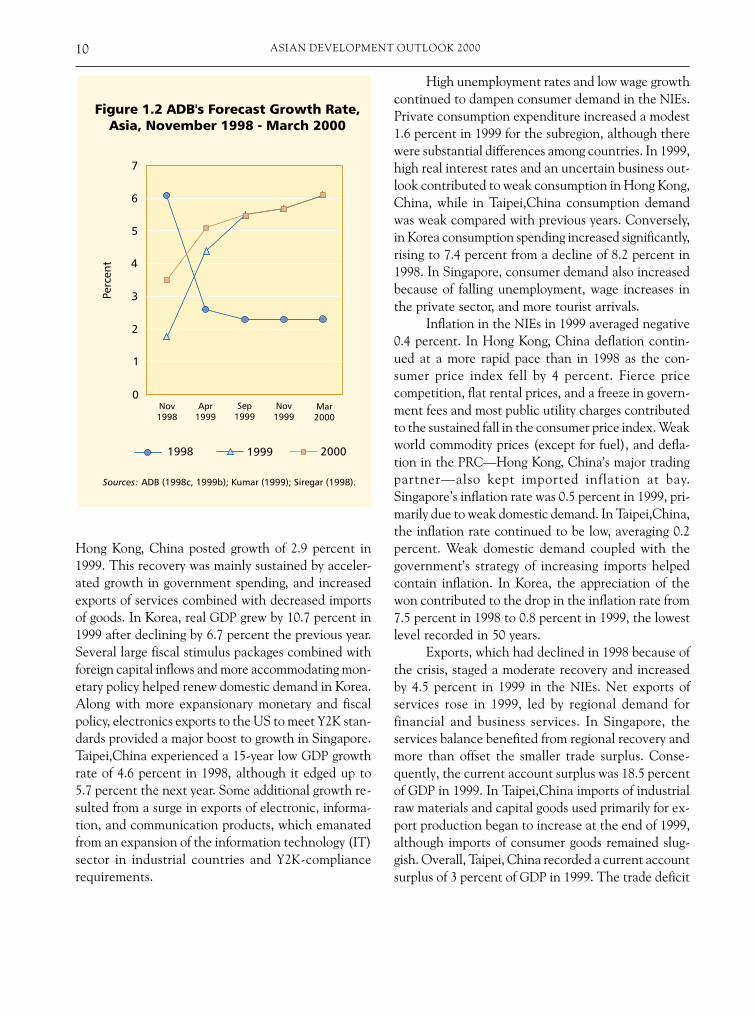
The Asian economic outlook changed dramaticallyin 1999 (figure 1.2). In the fall of 1998, several econo-mies were in recession, capital flows had turned nega-tive, and the outlook was generally pessimistic. Inearly 1999, an average annual growth of 4.4 percentwas forecast for the region. This was revised to 5.7percent in the fourth quarter of 1999, and the actualoutcomes for the year have exceeded 6 percent.
The recovery has been uneven across develop-ing Asia. Growth in the Republic of Korea (hence-forth referred to as Korea) was particularly strong,along with the PRC and India. In tandem with theeconomic recovery in Russia in 1999, most countriesin Central Asia experienced higher rates of growth,although inflation and external imbalances continuedto be relatively high.
The faster-than-expected recovery in the firsthalf of 1999 in most of the crisis-affected countries—Korea, Malaysia, Philippines, and Thailand—resultedfrom stimulative monetary and fiscal policy and in-creased exports, led by a surge in worldwide demandfor electronics. Consumer sentiment also improved,bolstering domestic demand and economic growth. Inthe second half of 1999, the recovery was supportedby continued expansionary policies and progress onimplementing structural reforms to deal with thefinancial crisis.
In the NIEs and in Southeast Asia, either aresumption of growth or increased growth, combinedwith generally buoyant equity markets, helped improveaggregate demand and consumer confidence. Con-sumers began to spend after two years of belt-tighten-ing. A decrease in consumer goods prices in somecountries further increased purchasing power, partlyoffsetting selective wage cuts and high unemployment.
Korea, one of the countries most affected by thefinancial crisis, led the region with double-digiteconomic growth in 1999. Stock rebuilding, increasesin private consumption and investment, and increasedexports boosted Korean production to above precrisislevels. Among the other crisis-affected countriesgrowth ranged from 0.2 to 5.4 percent, as thesecountries also experienced a stronger-than-expectedrecovery from the crisis. Growth in the PRC slowedfrom 7.8 percent in 1998 to 7.1 percent in 1999, as itspump priming of the economy through expansionaryfiscal policy weakened and export growth remainedmodest. South Asia continued to be a strongly per-forming region with an aggregate growth rate accel-eration of 5.5 percent in 1999. Growth in India, thelargest economy in the region, was robust at 5.9 per-cent. A strong increase in industry sector activity waspartially offset by weak agriculture output growth.Other countries in the region, including Bangladeshand Sri Lanka, also did reasonably well.
Currency markets in Asia stabilized in 1999 be-cause of structural reforms, interest rate cuts in mostof the industrial countries, positive expectations aboutthe Japanese economy, and increased financialcommitments from the international community. Con-sequently, foreign capital started returning to Asia.Private capital flows returned to five crisis-affectedcountries—Indonesia, Korea, Malaysia, Philippines,and Thailand—with net private inflows of $5.1 billionin 1999, as opposed to a net outflow of $38.6 billion in1998. In the PRC, net private flows slowed from about$40 billion in 1998 to around $27 billion in 1999, asFDI eased and debts were repaid. At 6.2 percent,growth in the Asian region is expected to remain vir-tually unchanged in 2000. Slower growth in the NIEsand the PRC will be offset by more rapid growth inSoutheast Asia, South Asia, and the Central Asianrepublics.
The Newly Industrialized Economies. The NIEsrebounded strongly in 1999. GDP growth was 7.0 per-cent compared with a contraction of 1.9 percent in1998. There was slight deflationary pressure as the ag-gregate price level fell by 0.4 percent.
Despite the overall revival of the NIEs, economicperformance varied significantly among countries.After a severe recession in 1998, the economy of
ASIAN DEVELOPMENT OUTLOOK 200010
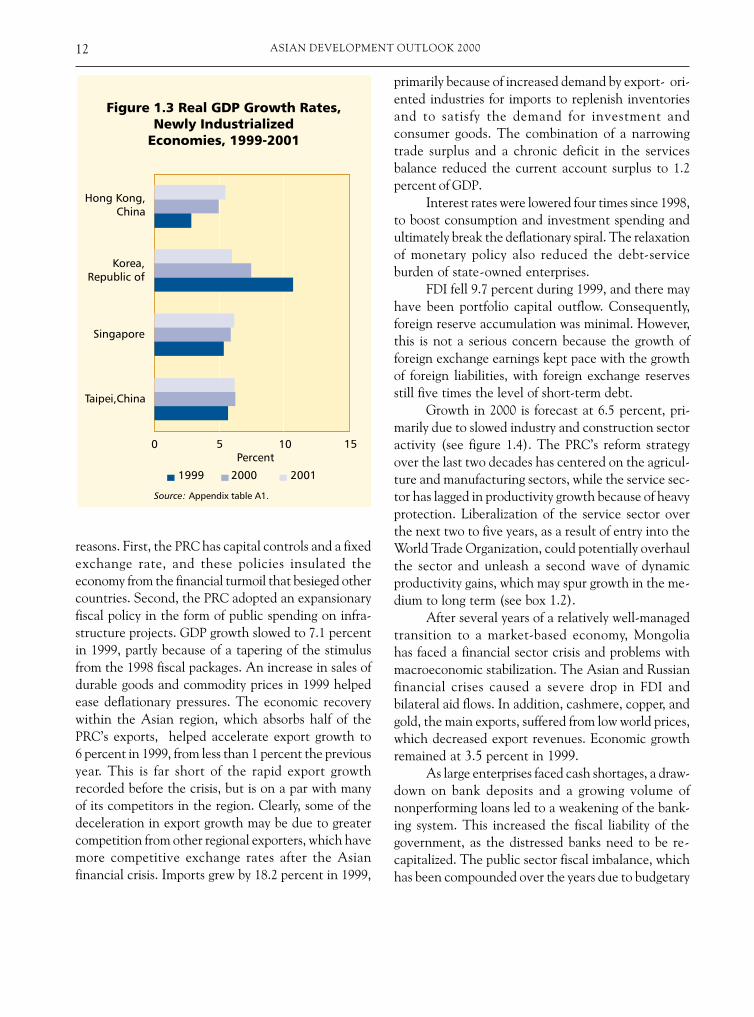
Hong Kong, China posted growth of 2.9 percent in1999. This recovery was mainly sustained by acceler-ated growth in government spending, and increasedexports of services combined with decreased importsof goods. In Korea, real GDP grew by 10.7 percent in1999 after declining by 6.7 percent the previous year.Several large fiscal stimulus packages combined withforeign capital inflows and more accommodating mon-etary policy helped renew domestic demand in Korea.Along with more expansionary monetary and fiscalpolicy, electronics exports to the US to meet Y2K stan-dards provided a major boost to growth in Singapore.Taipei,China experienced a 15-year low GDP growthrate of 4.6 percent in 1998, although it edged up to5.7 percent the next year. Some additional growth re-sulted from a surge in exports of electronic, informa-tion, and communication products, which emanatedfrom an expansion of the information technology (IT)sector in industrial countries and Y2K-compliancerequirements.
High unemployment rates and low wage growthcontinued to dampen consumer demand in the NIEs.Private consumption expenditure increased a modest1.6 percent in 1999 for the subregion, although therewere substantial differences among countries. In 1999,high real interest rates and an uncertain business out-look contributed to weak consumption in Hong Kong,China, while in Taipei,China consumption demandwas weak compared with previous years. Conversely,in Korea consumption spending increased significantly,rising to 7.4 percent from a decline of 8.2 percent in1998. In Singapore, consumer demand also increasedbecause of falling unemployment, wage increases inthe private sector, and more tourist arrivals.
Inflation in the NIEs in 1999 averaged negative0.4 percent. In Hong Kong, China deflation contin-ued at a more rapid pace than in 1998 as the con-sumer price index fell by 4 percent. Fierce pricecompetition, flat rental prices, and a freeze in govern-ment fees and most public utility charges contributedto the sustained fall in the consumer price index. Weakworld commodity prices (except for fuel), and defla-tion in the PRC—Hong Kong, China’s major tradingpartner—also kept imported inflation at bay.Singapore’s inflation rate was 0.5 percent in 1999, pri-marily due to weak domestic demand. In Taipei,China,the inflation rate continued to be low, averaging 0.2percent. Weak domestic demand coupled with thegovernment’s strategy of increasing imports helpedcontain inflation. In Korea, the appreciation of thewon contributed to the drop in the inflation rate from7.5 percent in 1998 to 0.8 percent in 1999, the lowestlevel recorded in 50 years.
Exports, which had declined in 1998 because ofthe crisis, staged a moderate recovery and increasedby 4.5 percent in 1999 in the NIEs. Net exports ofservices rose in 1999, led by regional demand forfinancial and business services. In Singapore, theservices balance benefited from regional recovery andmore than offset the smaller trade surplus. Conse-quently, the current account surplus was 18.5 percentof GDP in 1999. In Taipei,China imports of industrialraw materials and capital goods used primarily for ex-port production began to increase at the end of 1999,although imports of consumer goods remained slug-gish. Overall, Taipei, China recorded a current accountsurplus of 3 percent of GDP in 1999. The trade deficit

11ECONOMIC DEVELOPMENTS AND PROSPECTS
TTTTTable 1.1 able 1.1 able 1.1 able 1.1 able 1.1 Selected Economic Indicators, Developing Asia, 1997-2001Selected Economic Indicators, Developing Asia, 1997-2001Selected Economic Indicators, Developing Asia, 1997-2001Selected Economic Indicators, Developing Asia, 1997-2001Selected Economic Indicators, Developing Asia, 1997-2001(percent)
1997 1998 1999 2000 2001
Gross domestic product (annual change)Developing Asia 6.0 2.3 6.2 6.2 6.0
Newly industrialized economies 5.7 -1.9 7.0 6.5 6.0PRC and Mongolia 8.7 7.8 7.1 6.5 6.0Central Asian republics 3.3 0.8 2.8 3.0 3.6Southeast Asia 3.7 -7.5 3.2 4.6 5.0South Asia 4.7 6.2 5.5 6.4 6.6The Pacific -3.2 1.2 4.4 — —
Inflation (change in CPI)Developing Asia 4.3 5.5 1.6 3.0 3.3
Newly industrialized economies 3.5 3.9 -0.4 1.8 2.6PRC and Mongolia 2.8 -0.8 -1.4 1.8 2.0Central Asian republics 21.4 11.4 21.9 15.1 10.7Southeast Asia 5.5 21.3 7.4 4.7 4.6South Asia 5.6 7.1 4.1 5.0 5.4The Pacific 3.9 9.9 10.4 — —
Current account balance/GDPDeveloping Asia 0.5 4.1 3.8 1.5 0.5
Newly industrialized economies 1.6 9.3 6.4 3.7 2.4PRC and Mongolia 3.3 3.0 1.2 -0.4 -0.9Central Asian republics -4.0 -4.5 -2.0 -2.4 -2.3Southeast Asia -3.4 7.0 7.6 3.3 0.8South Asia -1.4 -1.9 -2.2 -3.9 -3.0The Pacific -0.9 1.8 — — —
— Not available.CPI consumer price index.
Sources: Appendix tables.
narrowed, as there was a significant rebound in re-exports to and from Asia, especially Indonesia, Japan,Korea, and Singapore. In Hong Kong, China exportsrecovered but growth was still negative in 1999. InKorea, export growth recovered strongly to more than10 percent from a 4.7 percent deficit in 1998, as a resultof stronger competitiveness vis-a-vis Japan and re-covery in Asian markets.
Future economic expansion in the region willbe driven by growth in domestic demand, efficiencygains resulting from progress in structural reforms andIT-related exports. GDP growth in 2000 is forecast tobe 6.5 percent for the NIEs (see figure 1.3). This growthrate, while quite robust, is still somewhat lower thanin 1999, primarily because of a decline in Korea’s growth,
where double-digit growth is not expected to be sus-tained. Export growth in the NIEs is projected to in-crease more, to 8.9 percent in 2000. This would be thehighest growth rate in exports since 1995, but it fallsshort of the average of nearly 15 percent between 1992and 1995. A large-scale restructuring of capacities andpolicy measures to regain competitiveness may be re-quired before the NIEs regain such export dynamism.Import demand will recover sharply as growth returnsand the increased exports in turn drive up demand forraw materials and components.
PRC and Mongolia. Despite the Asian financial crisis,the PRC maintained a robust growth rate of 7.8 per-cent in 1998, and did not fall into recession for two
ASIAN DEVELOPMENT OUTLOOK 200012
reasons. First, the PRC has capital controls and a fixedexchange rate, and these policies insulated theeconomy from the financial turmoil that besieged othercountries. Second, the PRC adopted an expansionaryfiscal policy in the form of public spending on infra-structure projects. GDP growth slowed to 7.1 percentin 1999, partly because of a tapering of the stimulusfrom the 1998 fiscal packages. An increase in sales ofdurable goods and commodity prices in 1999 helpedease deflationary pressures. The economic recoverywithin the Asian region, which absorbs half of thePRC’s exports, helped accelerate export growth to6 percent in 1999, from less than 1 percent the previousyear. This is far short of the rapid export growthrecorded before the crisis, but is on a par with manyof its competitors in the region. Clearly, some of thedeceleration in export growth may be due to greatercompetition from other regional exporters, which havemore competitive exchange rates after the Asianfinancial crisis. Imports grew by 18.2 percent in 1999,
primarily because of increased demand by export- ori-ented industries for imports to replenish inventoriesand to satisfy the demand for investment andconsumer goods. The combination of a narrowingtrade surplus and a chronic deficit in the servicesbalance reduced the current account surplus to 1.2percent of GDP.
Interest rates were lowered four times since 1998,to boost consumption and investment spending andultimately break the deflationary spiral. The relaxationof monetary policy also reduced the debt-serviceburden of state-owned enterprises.
FDI fell 9.7 percent during 1999, and there mayhave been portfolio capital outflow. Consequently,foreign reserve accumulation was minimal. However,this is not a serious concern because the growth offoreign exchange earnings kept pace with the growthof foreign liabilities, with foreign exchange reservesstill five times the level of short-term debt.
Growth in 2000 is forecast at 6.5 percent, pri-marily due to slowed industry and construction sectoractivity (see figure 1.4). The PRC’s reform strategyover the last two decades has centered on the agricul-ture and manufacturing sectors, while the service sec-tor has lagged in productivity growth because of heavyprotection. Liberalization of the service sector overthe next two to five years, as a result of entry into theWorld Trade Organization, could potentially overhaulthe sector and unleash a second wave of dynamicproductivity gains, which may spur growth in the me-dium to long term (see box 1.2).
After several years of a relatively well-managedtransition to a market-based economy, Mongoliahas faced a financial sector crisis and problems withmacroeconomic stabilization. The Asian and Russianfinancial crises caused a severe drop in FDI andbilateral aid flows. In addition, cashmere, copper, andgold, the main exports, suffered from low world prices,which decreased export revenues. Economic growthremained at 3.5 percent in 1999.
As large enterprises faced cash shortages, a draw-down on bank deposits and a growing volume ofnonperforming loans led to a weakening of the bank-ing system. This increased the fiscal liability of thegovernment, as the distressed banks need to be re-capitalized. The public sector fiscal imbalance, whichhas been compounded over the years due to budgetary

13ECONOMIC DEVELOPMENTS AND PROSPECTS
mismanagement, has begun to threaten thegovernment’s ability to complete ongoing reforms.
Mongolia’s short- to medium-term prospectsdepend on the success of banking sector reforms,whether fiscal imbalances are addressed, and thestrength of export performance. GDP growth in 2000is forecast at 4 percent, with the main sources of growthexpected to be mining and manufacturing. Reformsin the agriculture sector, promotion of small-scale in-dustries, and escalating private sector activity (whichconstituted 60 percent of GDP in 1998) are expectedto stimulate growth.
The Central Asian Republics. The economies ofCentral Asia grew at 2.8 percent in 1999, up from theprevious year’s 0.8 percent. Kazakhstan implementedmajor policy adjustments, including floating its cur-rency, the tenge. Stabilization of commodity prices andprudent fiscal policy provided breathing space forimplementing reforms, which helped the economygrow to 1.7 percent in 1999, compared with a 1.9 per-
cent contraction the previous year. The KyrgyzRepublic’s economy was in the middle of a major fis-cal and financial adjustment process, but the GDPgrowth rate in 1999 was 3.6 percent, up from 2.1 per-cent in 1998. The engine of growth was the agricul-ture sector, which grew by 8.7 percent. Tajikistan madesubstantial progress in macroeconomic stabilizationand its transition to a market economy in 1998. Itsthree-year IMF reform program is largely on track.However, GDP growth was only 3.7 percent in 1999,considerably lower than the 1998 rate of 5.3 percent,reflecting stagnant growth in both agriculture andindustry. Uzbekistan, the country with the largestpopulation in Central Asia, is following its own gradualreform program. Foreign exchange controls, thecountry’s policy of self-sufficiency, and rudimentaryfinancial markets all impede more rapid economicprogress. GDP growth in 1999, at 4.4 percent, was thesame rate recorded in 1998.
Future economic performance in the CentralAsian republics will depend on Russia’s continuedeconomic recovery and improvement in internationalcommodity prices (see figure 1.5). The extent to whichthe respective countries are affected by these two fac-tors varies considerably. Political stability will also playa role in the future development of these formerSoviet republics.
The Southeast Asian Economies. The V-shapedrecovery in the crisis countries in this region can beviewed partly as a snapback given the sharp negativegrowth the previous year. Nevertheless, various posi-tive factors, both domestic and external, contributedto the recovery, including increased consumption,stock rebuilding, massive fiscal stimulus, and loosemonetary policy. New policy measures to address cor-porate and financial sector problems also supportedthe recovery, and helped contain and even reduce thelevel of nonperforming loans. The recovery was stimu-lated also by the strengthened Japanese economy andincreased financial resource flows from the interna-tional community, which resulted in improvedbalance-of-payments position in most of thesubregion. Together with inflows of foreign aid andprogress on foreign debt rollovers, capital flows werestabilized, and confidence in these countries was re-stored. The availability of fiscal surpluses, a legacy of
ASIAN DEVELOPMENT OUTLOOK 200014
Source: Institute for International Economics (1999).
past prudent policies, and a favorable external envi-ronment permitted the easing of fiscal and monetarypolicy and reduced interest rates without causing vola-tility in foreign exchange market.
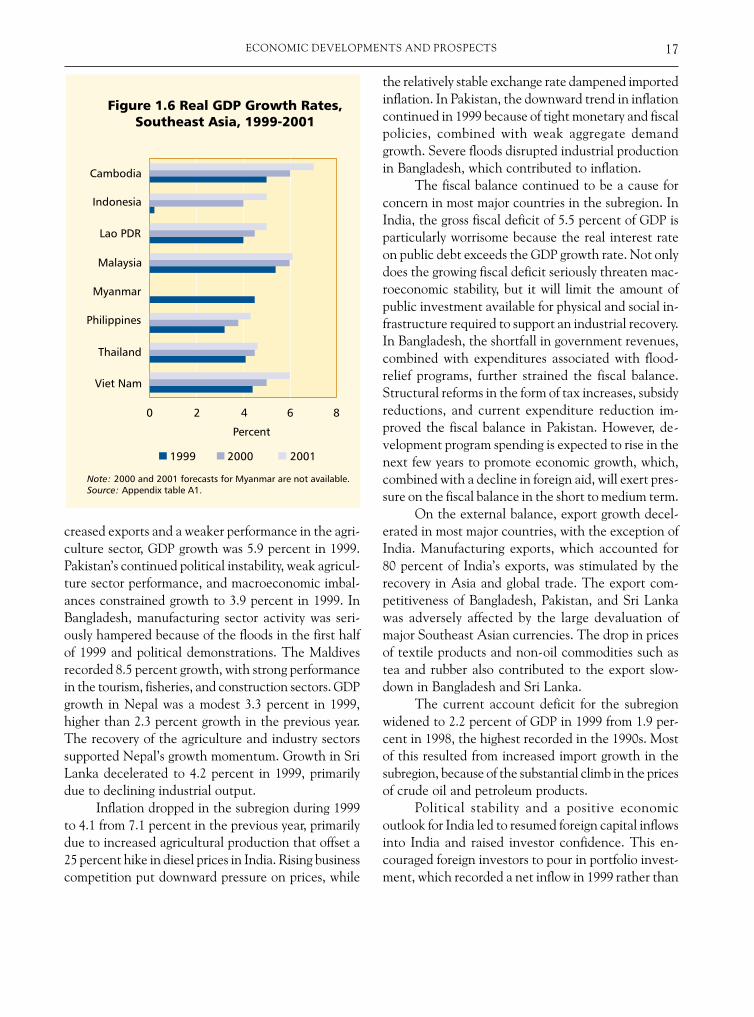
After an initially tenuous start, Southeast Asia’srecovery has proved more rapid and broad-based thananticipated. All the countries in the subregion regis-tered growth in 1999 (see figure 1.6). The GDP growthrate for the subregion was 3.2 percent in 1999, in sharp
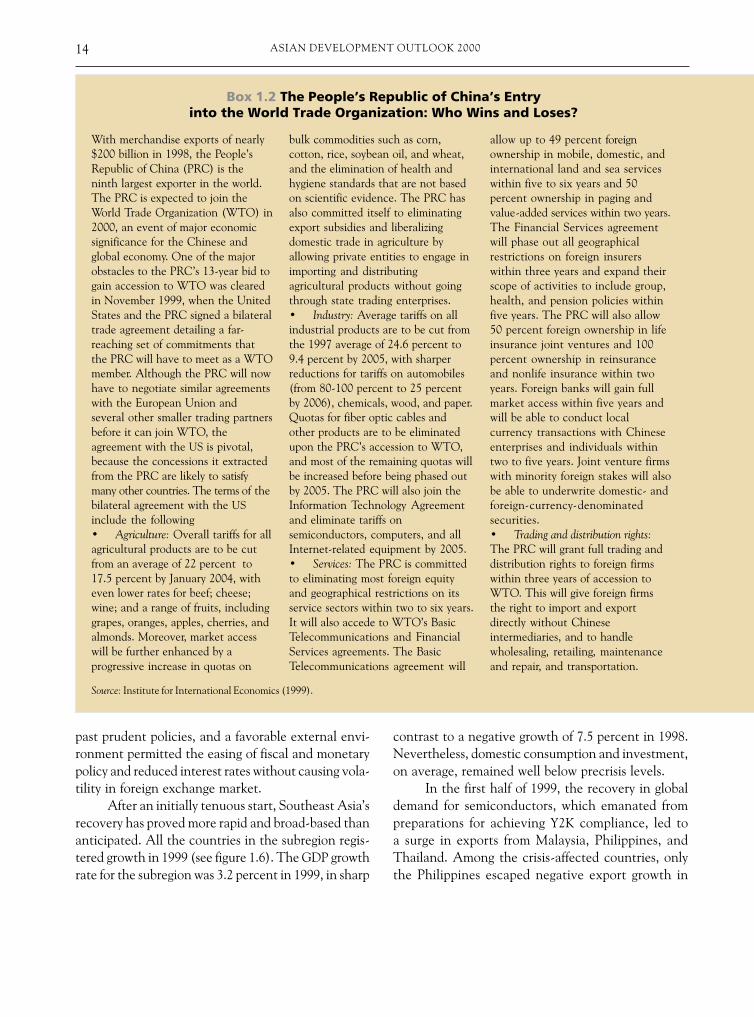
With merchandise exports of nearly$200 billion in 1998, the People’sRepublic of China (PRC) is theninth largest exporter in the world.The PRC is expected to join theWorld Trade Organization (WTO) in2000, an event of major economicsignificance for the Chinese andglobal economy. One of the majorobstacles to the PRC’s 13-year bid togain accession to WTO was clearedin November 1999, when the UnitedStates and the PRC signed a bilateraltrade agreement detailing a far-reaching set of commitments thatthe PRC will have to meet as a WTOmember. Although the PRC will nowhave to negotiate similar agreementswith the European Union andseveral other smaller trading partnersbefore it can join WTO, theagreement with the US is pivotal,because the concessions it extractedfrom the PRC are likely to satisfymany other countries. The terms of thebilateral agreement with the USinclude the following• Agriculture: Overall tariffs for allagricultural products are to be cutfrom an average of 22 percent to17.5 percent by January 2004, witheven lower rates for beef; cheese;wine; and a range of fruits, includinggrapes, oranges, apples, cherries, andalmonds. Moreover, market accesswill be further enhanced by aprogressive increase in quotas on
bulk commodities such as corn,cotton, rice, soybean oil, and wheat,and the elimination of health andhygiene standards that are not basedon scientific evidence. The PRC hasalso committed itself to eliminatingexport subsidies and liberalizingdomestic trade in agriculture byallowing private entities to engage inimporting and distributingagricultural products without goingthrough state trading enterprises.• Industry: Average tariffs on allindustrial products are to be cut fromthe 1997 average of 24.6 percent to9.4 percent by 2005, with sharperreductions for tariffs on automobiles(from 80-100 percent to 25 percentby 2006), chemicals, wood, and paper.Quotas for fiber optic cables andother products are to be eliminatedupon the PRC’s accession to WTO,and most of the remaining quotas willbe increased before being phased outby 2005. The PRC will also join theInformation Technology Agreementand eliminate tariffs onsemiconductors, computers, and allInternet-related equipment by 2005.• Services: The PRC is committedto eliminating most foreign equityand geographical restrictions on itsservice sectors within two to six years.It will also accede to WTO’s BasicTelecommunications and FinancialServices agreements. The BasicTelecommunications agreement will
allow up to 49 percent foreignownership in mobile, domestic, andinternational land and sea serviceswithin five to six years and 50percent ownership in paging andvalue-added services within two years.The Financial Services agreementwill phase out all geographicalrestrictions on foreign insurerswithin three years and expand theirscope of activities to include group,health, and pension policies withinfive years. The PRC will also allow50 percent foreign ownership in lifeinsurance joint ventures and 100percent ownership in reinsuranceand nonlife insurance within twoyears. Foreign banks will gain fullmarket access within five years andwill be able to conduct localcurrency transactions with Chineseenterprises and individuals withintwo to five years. Joint venture firmswith minority foreign stakes will alsobe able to underwrite domestic- andforeign-currency-denominatedsecurities.• Trading and distribution rights:The PRC will grant full trading anddistribution rights to foreign firmswithin three years of accession toWTO. This will give foreign firmsthe right to import and exportdirectly without Chineseintermediaries, and to handlewholesaling, retailing, maintenanceand repair, and transportation.
Box 1.2 The People’s Republic of China’s Entryinto the World Trade Organization: Who Wins and Loses?
contrast to a negative growth of 7.5 percent in 1998.Nevertheless, domestic consumption and investment,on average, remained well below precrisis levels.
In the first half of 1999, the recovery in globaldemand for semiconductors, which emanated frompreparations for achieving Y2K compliance, led toa surge in exports from Malaysia, Philippines, andThailand. Among the crisis-affected countries, onlythe Philippines escaped negative export growth in

15ECONOMIC DEVELOPMENTS AND PROSPECTS
Foreign firms will also be able toengage in such auxiliary services asleasing, air courier, warehousing,packaging, and advertising.
These sweeping reforms arelikely to have far-reaching domesticand international implications. Inthe short term, many analysts expectthe reforms to lead to a considerableloss of output and a sharp increase inunemployment. For instance, infarming, cuts in tariffs and increasesin tariff quotas will probably result ina substantial increase in wheatimports, as domestic prices remainfar above world market prices. Thiswill bring about a sharp reduction inoutput and an increase inunemployment. The auto industrywill probably experience a similarsharp reduction in output and jobs,as the new WTO regime slashestariffs and allows foreign carmakersto provide financial assistance tobuyers. This may causerationalization of the fragmented andinefficient car industry that currentlyhas more than 100 manufacturers ofvehicles and components. Manydomestic vehicle makers will notsurvive the cost cutting needed toremain competitive.
WTO membership also willbring far-reaching changes to thefinancial sector. As foreign banks willeventually be allowed to conductlocal currency business with bothChinese firms and individuals,competition within the domesticfinancial sector is certain to intensify.
Domestic banks will need to improvetheir banking practices andstrengthen their balance sheets.Otherwise, they could face a loss ofdeposits to foreign banks that havefewer nonperforming loans and can,therefore, offer higher interest ratesto depositors.
However, over time theefficiency gains from reallocatingboth capital and labor to morecompetitive sectors within theChinese economy should more thanoffset these short-term losses. Thisshould result in increasedproductivity, profitability, investment,and employment. Accession to WTOwould then deepen and accelerateChinese liberalization and help lockin the tenuous domestic reform process.
What will be the probableimpact on the rest of the world whenthe PRC joins WTO? Apart fromincreased access to the PRC’sinternal market, WTO membershipwould make all investors who use thePRC as a production and exportplatform feel more secure aboutaccess to third markets as well as thedomestic market. Foreign retailersand distributors will also be able tosell products and services directly toChinese consumers for the first time.This will give Chinese consumersgreater choice at lower prices.Regional economies are likely to beamong the main beneficiaries of thePRC’s liberalization measures.Established producers of qualityconsumer durable goods, including
Japan; Republic of Korea; andTaipei,China, could gain significantlyfrom better access to the region’ssecond-largest market. SoutheastAsian exporters of natural resourcessuch as Indonesia and agriculturalproducers such as Thailand couldgain from greater access to the PRCmarkets, while Indian pharmaceuticalmanufacturers could potentially gainaccess to the PRC’s highly protectedpharmaceutical market. On theexport side, the PRC’s accession toWTO will make it an even moreformidable competitor in labor-intensive products in the worldmarket such as shoes, toys, bags, andtextiles. Some regional economieswill lose export markets to the PRC inthe textile and apparel sector whenthe Multi-Fibre Agreement quotasare phased out by 2005. Finally, giventhat the PRC’s accession commitmentsto WTO are considerably more liberalthan the commitments of a number ofregional member countries, this couldprompt a further round ofcompetitive liberalization within theregion, as the PRC begins toimplement its WTO commitments.
The PRC’s accession to WTOshould not be seen as a zero sum gamewhere one side loses and the othergains. Although there may be short-term costs for both sides, the long-term benefits from an expansion andliberalization of the world tradingsystem from the PRC’s membershipwould no doubt far outweigh theseshort-term costs.
the past two years, achieving an export growth rate of16.9 percent in 1998 and 18.8 percent in 1999. It wasless constrained by the crisis, as it had undergone amajor restructuring in the 1980s. Its exports also weremore geared to the US market, which remained buoyant.
Consumer spending began to recover in the firsthalf of 1999. In the four crisis-affected countries, con-sumer confidence indicators stabilized and are improv-ing. Even Indonesia, which lags behind the other
countries in the region in terms of consumer confi-dence, registered a private consumption growth rateof 2 percent in 1999, while the Philippines andThailand registered 2.5 percent. Nevertheless, the 1999level of private consumption expenditures remainedbelow precrisis levels.
Pump priming of the regional economies throughlarge fiscal stimulus packages was used extensively in1998 and 1999, causing concern that fiscal imbalances

ASIAN DEVELOPMENT OUTLOOK 200016
were getting out of hand. Assuming a recovery of 50-60 percent of nonperforming loans in these econo-mies, the cost of fiscal support for bank recapitalizationwas expected to be about 15 percent of GDP inMalaysia and more than 30 percent in Indonesia andThailand. Actual recovery rates in 1999 were, how-ever substantially lower.
The improvement in economic performance,combined with the return of portfolio capital to theregion, resulted in a surge in the equity market pricesby 25.4 percent in dollar terms during 1999. This wassignificantly above the 6.7 percent and 4.5 percentrecorded in the US and world stock markets, respec-tively. This boosted confidence in domestic marketsand stimulated consumption spending.
Price stability continued to improve in the re-gion. In Cambodia, Lao People’s Democratic Republic,Philippines, Thailand, and Viet Nam, inflation fell in1999, reflecting lower food prices. Indonesia displayeda dramatic decline in its inflation rate, from 58.5 per-cent in 1998 to around 20.5 percent in 1999, because of
lower food prices and unused industrial capacity. Amore stable political environment and increased for-eign capital inflows also helped stabilize prices, par-ticularly during the second half of the year.
Short-term nominal interest rates across the re-gion remained below precrisis averages, with theexception of Indonesia. Thailand’s three-monthinterest rate of 4.00-4.25 percent in December 1999 issignificantly below the 10.7 percent recorded for1991-1996. The interest rate declines result from im-provements in the balance of payments combined withan expansionary monetary policy. Central banks inthe region kept short-term interest rates low to keepfinancial sector reforms on track and bolster demand.
On the external balance, the substantial currentaccount surpluses that accompanied the initial collapsein economic activity lifted foreign exchange reservesto record levels in Malaysia and the Philippines during1998. Combined with the announcement of structuralreforms and macroeconomic stabilization programs,this led to a resumption of foreign capital inflows andboosted investor sentiment. Strong FDI offset the lowlevel of domestic investment somewhat. Import growthtended to outstrip export growth by a large margin inseveral countries because of rising demand from in-creased industry sector activity. However, imports con-tinued to decline in Indonesia, so the trade and currentaccount balances in the region’s totals changed onlyslightly compared with 1998.
Growth in 1999 emanated from continued im-provement in domestic demand that arose from ex-pansionary macroeconomic policies, combined withimproved external demand that resulted fromexpanded world and intraregional trade. The 2000forecast for Southeast Asia is for a modest strength-ening of growth to 4.6 percent. This upward trendshould be supported by the boom in the electronicsindustry, continued economic growth in the US, likelyupturn in euro area, and the possible continued re-covery of the Japanese economy.
South Asia. South Asia continues to be a strong per-former, largely because of the strength of the Indianeconomy. Growth in the subregion was 6.2 and 5.5percent in 1998 and 1999, respectively. In India, theindustry sector showed signs of an increase after threeyears of sluggish performance. Combined with in-
17ECONOMIC DEVELOPMENTS AND PROSPECTS
creased exports and a weaker performance in the agri-culture sector, GDP growth was 5.9 percent in 1999.Pakistan’s continued political instability, weak agricul-ture sector performance, and macroeconomic imbal-ances constrained growth to 3.9 percent in 1999. InBangladesh, manufacturing sector activity was seri-ously hampered because of the floods in the first halfof 1999 and political demonstrations. The Maldivesrecorded 8.5 percent growth, with strong performancein the tourism, fisheries, and construction sectors. GDPgrowth in Nepal was a modest 3.3 percent in 1999,higher than 2.3 percent growth in the previous year.The recovery of the agriculture and industry sectorssupported Nepal’s growth momentum. Growth in SriLanka decelerated to 4.2 percent in 1999, primarilydue to declining industrial output.
Inflation dropped in the subregion during 1999to 4.1 from 7.1 percent in the previous year, primarilydue to increased agricultural production that offset a25 percent hike in diesel prices in India. Rising businesscompetition put downward pressure on prices, while
the relatively stable exchange rate dampened importedinflation. In Pakistan, the downward trend in inflationcontinued in 1999 because of tight monetary and fiscalpolicies, combined with weak aggregate demandgrowth. Severe floods disrupted industrial productionin Bangladesh, which contributed to inflation.
The fiscal balance continued to be a cause forconcern in most major countries in the subregion. InIndia, the gross fiscal deficit of 5.5 percent of GDP isparticularly worrisome because the real interest rateon public debt exceeds the GDP growth rate. Not onlydoes the growing fiscal deficit seriously threaten mac-roeconomic stability, but it will limit the amount ofpublic investment available for physical and social in-frastructure required to support an industrial recovery.In Bangladesh, the shortfall in government revenues,combined with expenditures associated with flood-relief programs, further strained the fiscal balance.Structural reforms in the form of tax increases, subsidyreductions, and current expenditure reduction im-proved the fiscal balance in Pakistan. However, de-velopment program spending is expected to rise in thenext few years to promote economic growth, which,combined with a decline in foreign aid, will exert pres-sure on the fiscal balance in the short to medium term.
On the external balance, export growth decel-erated in most major countries, with the exception ofIndia. Manufacturing exports, which accounted for80 percent of India’s exports, was stimulated by therecovery in Asia and global trade. The export com-petitiveness of Bangladesh, Pakistan, and Sri Lankawas adversely affected by the large devaluation ofmajor Southeast Asian currencies. The drop in pricesof textile products and non-oil commodities such astea and rubber also contributed to the export slow-down in Bangladesh and Sri Lanka.
The current account deficit for the subregionwidened to 2.2 percent of GDP in 1999 from 1.9 per-cent in 1998, the highest recorded in the 1990s. Mostof this resulted from increased import growth in thesubregion, because of the substantial climb in the pricesof crude oil and petroleum products.
Political stability and a positive economicoutlook for India led to resumed foreign capital inflowsinto India and raised investor confidence. This en-couraged foreign investors to pour in portfolio invest-ment, which recorded a net inflow in 1999 rather than

ASIAN DEVELOPMENT OUTLOOK 200018
a net outflow as in 1998. However, a deterioration ofthe political environment in Pakistan and Sri Lankaslowed the inflow of foreign capital into these coun-tries. FDI decreased to $225 million in Bangladesh in1999 from $317 million in 1998. Most of the inflowswere to the natural gas and power sectors, which ac-count for 60 percent of total FDI.
Aggregate growth in South Asia for 2000 is fore-cast at 6.4 percent (see figure 1.7). Growth in Indiawill increase slightly, with industry and service sectorgrowth remaining strong. Political stability in the re-gion will be essential in determining the course of eco-nomic policy in the subregion and the prospects forreaching the per capita income levels attained in theNIEs and Southeast Asia. The opening of domesticcapital markets and integration with international fi-nancial markets will increase net capital inflows andimprove the access to international financial markets.These synergies will help alleviate the negative effectsof chronic fiscal deficits, which otherwise would havecrowded out private sector investment in a relativelyclosed economy.
The Pacific. The Pacific subregion as a whole grew by4.4 percent in 1999, compared with 1.2 percent in1998. Sound macroeconomic management and tightmonetary policy in those countries that have their owncurrency contributed to the improved economicperformance in most of the subregion. Papua NewGuinea, the subregion’s largest economy, experiencedan acceleration in real GDP growth of 3.9 percent in1999, despite intensified macroeconomic instability.Faster growth resulted from higher commodity pricesand increased exports. With the exception of Kiribati,Tuvalu, and Vanuatu, all the economies registeredfaster growth in 1999, including the Fiji Islands, wherethe recovery in agricultural production and growth ingarment manufacturing contributed to a 1999 GDPgrowth of 7.8 percent. Inflation in the subregion roseto 10.4 percent in 1999, mostly because inflation inPapua New Guinea rose to 16 percent. The govern-ment failed to secure external funding to finance fis-cal imbalances, and had to rely on domestic financingof the budget deficit and accumulation of arrears ondebt-service payments.
The economic prospects in the short to mediumterm will depend on the success of public sectorreforms, sustained macroeconomic stabilization, andprivate sector development. The potential of this sub-region will not be realized unless macroeconomic sta-bility is sustained and improvements made in theeconomic policy environment. In some countries, eco-nomic policy continues to be characterized by lack oftransparency and predictability that discourages pros-pects for both domestic and foreign investments.
RISKS AND UNCERTRISKS AND UNCERTRISKS AND UNCERTRISKS AND UNCERTRISKS AND UNCERTAINTIESAINTIESAINTIESAINTIESAINTIES
Recovery in Asia was robust during 1999. The trans-formation of developing Asia from financial crisis in1997 and 1998 to the world’s fastest-growing regionhas exceeded all expectations. It took developing Asialess than two years to return to the precrisis level ofindustrial production. Prospects for 2000 depend onsustainability of domestic demand growth, not onlythrough growth in consumption, but also an upturnin investment demand and favorable global economicconditions. Investment may have to rise as capacityutilization rates go up and capacity restructuring oc-curs in response to technological advance and com-

19ECONOMIC DEVELOPMENTS AND PROSPECTS
petitive pressures. However, this is predicated on anupturn in credit growth, which is still uncertain be-cause bank lending remains weak.
Rapid growth in intraregional trade feeding intoincreased domestic demand and higher real incomesis also expected. For these effects to prevail in theAsian subregion, the external environment will alsohave to be favorable. The continued expansion in glo-bal GDP and the expected rise in international tradevolumes, combined with continued firmness in com-modity prices, are crucial in maintaining export growthmomentum. The major concern will be the nature ofcorrection in asset prices in the US, the strength ofthe cyclical upswing in the euro area, and the prospectsfor Japanese recovery. A favorable external environ-ment requires a soft landing for the US economy as afurther tightening of monetary policy accomplishes asmooth transition to slower growth. It also requires astrengthening of the cyclical upswing in the euro areadespite more monetary policy tightening by theEuropean Central Bank and a continuation of theJapanese recovery.
Even as domestic demand conditions in theworld economy improved, OPEC decided in April 1999to cut back production. Unless oil prices moderate,another oil shock could derail Asia’s recovery as wellas the rest of the world economy (see box 1.3).
From a domestic aggregate demand perspective,expansionary domestic policies and rallies in equitymarkets in developing Asia have helped to improvebusiness and consumer sentiment, and have had a salu-tary effect on consumption. These factors seem to beoffsetting the constraints on domestic consumptionimposed by high unemployment rates, slow wagegrowth, and reluctance of banks to lend. The fiscalexpenditures required to fund financial sector bail-outs, combined with ongoing development and recur-ring expenditures, will put additional pressure ongovernment budgets throughout the subregion. Thecost of financing these expenditures will increasebudget deficits further, pushing up prices and interestrates. Unless handled prudently, these pressures coulddampen growth prospects for the Asian region, par-ticularly in the crisis-affected countries where bailoutsare the most costly.
It is worth noting that domestic demand and thestabilization of savings ratios are two sides of the same
coin. Where savings ratios fell in 1999, noticeably inIndonesia, Korea, Singapore, and probably Thailand,domestic demand rallied. However, during 2000, thestrength of that rally may moderate in these countries,unless asset markets continue their upward trend. Inthose countries where 1999 saw little or no saving ratedecline—Hong Kong, China; Malaysia; Philippines;and Taipei,China—domestic demand is likely to bebetter supported in 2000.
Another concern is the continued large exter-nal imbalance in the US. Some of the funding for theUS deficit has come from those seeking a safe havenduring the financial crisis. But with the restoration ofgrowth, these funds are beginning to return to Asiaand other countries. Convergence of growth betweenthe US and the euro area in the next few years mayhelp raise US exports to that area and cut the deficit.However, if US interest rates must be raised to sustainthe capital inflows required to service this debt, it willhave a depressing effect not only on the US economy,but also on the rest of the world. It would result inupward pressure on interest rates in Asia and threatenthe strength of the economic recovery.
Continued commitment to and speedy imple-mentation of structural reforms is necessary in thecrisis-affected countries in developing Asia. In mostof the crisis-affected countries, progress in establish-ing a modern legal and regulatory framework hasoccurred, but there is more to be accomplished. Pub-lic administration reforms are required to improve bu-reaucratic and corruption-prone administrativeprocedures. Corporate governance reforms for chang-ing ownership structure of large business groups andadoption of modern financial management techniquesremain a priority. The region still has an extensiveagenda for restructuring the banking and corporatesectors and making business transactions more trans-parent and accountable. Progress in implementingthese will ensure efficiency in resource allocation andhelp stimulate investment spending. (The next chap-ter of this Outlook addresses these topics in depth.)
In the case of the Central Asian republics andMongolia, risks are related to the success of policymeasures aimed at completing the transition to amarket-based economy and building the necessaryinstitutional structures. Higher energy and primarycommodity prices in 2000 and the emergence of a

ASIAN DEVELOPMENT OUTLOOK 200020
Box 1.3 A Crude Reminder: Will Oil End the Boom?
Does the sharp increase in crude oilprices from $10 a barrel in 1998 tomore than $30 a barrel by March2000 mean the possible return to thebad old days of stagflation?Simulation exercises for industrialcountries reported by theOrganisation for EconomicCo-operation and Development(OECD) suggest that doubling the oilprice from $10 a barrel to $20 abarrel raises inflation by less than 1percent after one year. The OECDsimulations also suggest thateconomic growth can be slowed bybetween 0.2 and 0.4 percent. Theimpact will be larger on Japan thanthe United States and the EuropeanUnion, because Japan is moredependent on imported oil andexports much less to theOrganisation of Petroleum ExportingCountries (OPEC).
So far the actual effect of the oilprice increase has yet to be felt onthe general level of consumer prices,which are still remarkably steady inthe industrial economies. The impacton growth is more difficult todetermine but there apparently hasbeen no appreciable growth slumpwithin the OECD in the past fewmonths. One difficulty withestimating the effects of an oil priceincrease on growth or the generalprice level is the lag between theincrease in prices and the feed-through to the rest of the economy.
A more worrisome possibility isthe secondary effect that higher oil
prices might have on policy. Inprevious oil shocks the increase inprices accelerated inflation, whichwas then followed by contractionarymonetary policy and recession. Theeffect on oil-importing developingcountries was also quite severe.
Is such a scenario likely toreoccur? This will depend on severalfactors, including pass-through toinflation, the actions of oil suppliers,and the response in demand.
The pass-through to inflationwill be lower than during the earliertwo oil shocks simply because the oileconomy is dramatically smaller.
On the supply side, oil pricesincreased primarily because OPEClowered quotas in April 1999, andmost members have stuck to thequotas. The response of non-OPECmembers to higher prices has beenand can be expected to remainmarginal. First, putting new capacityinto operation takes time and second,the scope for increased supply bynonmembers is limited, even in thelong run. Compared with previous oilshocks, there is very little scope foradditional non-OPEC supply. Thereare no more untapped sources suchas Alaska and the North Seas onceprovided. Also, industrial countriesare putting enormous pressure onOPEC to increase supply. OPECprobably prefers to avoid theexperience that followed the secondoil shock, when longer-runadjustments to demand resulted inunusually low oil prices for a decade.
This was reflected in the March 2000meeting when nine of the 11 OPECoil ministers agreed to raiseproduction by about 7 percent fromcurrent levels. Following thisannouncement, oil prices declinedand are in the range of $25 per barrelas this Outlook goes to press.
Is more oil price volatility likely?In the short run, supply factorsprobably will not change quickly,because the lag between increasedpumping and delivery of the newoutput to the local service station isstill several months. Current pricesprobably reflect these delays.
Aside from the influence of theweather, demand factors are notvery significant in determining pricein the short run. Milder weather inEurope and North America with theend of winter tends to moderatedemand. Otherwise, the reduction indemand will be insignificant as a fewpeople buy smaller cars, driveless frequently, or turn down theirthermostats.
In conclusion it is unlikely thatoil prices will start back up, given thehigher production quotas recentlyagreed upon, continued leverageexerted on OPEC and the memoriesof two previous recessions caused byoil shocks. In addition policymakerspresumably have learned fromexperience, and will be able to adoptmacroeconomic policies that dealwith the potential inflationary effectsof higher oil prices without tippingthe world economy into recession.
Source: OECD (1999).
recovery in Russia, if realized, will affect these econo-mies positively.
Increased investments and innovative policiesare required to raise productivity levels and enhancethe international competitiveness of the region.Raising labor productivity would entail investmentsin human resources in education, knowledge, and
skills. Raising the international competitiveness ofAsia’s developing economies would require adoptingand generating new and innovative technologies,which would, in turn, require greater investments inresearch and development as well as a conducive en-vironment that fosters greater creativity andinnovativeness.

21CORPORATE AND FINANCIAL SECTOR REFORM
Corporate and FinancialCorporate and FinancialCorporate and FinancialCorporate and FinancialCorporate and FinancialSector Reform:Sector Reform:Sector Reform:Sector Reform:Sector Reform:
Progress and ProspectsProgress and ProspectsProgress and ProspectsProgress and ProspectsProgress and ProspectsThis chapter examines and appraises the corporate and financial sector reforms undertaken so far inthe crisis-affected economies in Southeast Asia and East Asia. It considers what must be done—bothin the short and medium term—to create vibrant and healthy corporate and financial sectors. Thechapter concludes that sustainability of the region’s short-term recovery, as well as its long-termeconomic prospects, depends largely on how effectively and comprehensively the corporate and financialsectors are restructured.
TTTTThe 1997-1998 Asian financial crisis was thebiggest economic and social shock to befall the
region since the Great Depression. After decades ofrapid growth, output plummeted. In little over ayear, the five crisis countries—Indonesia, Republic ofKorea (henceforth referred to as Korea), Malaysia,Philippines, and Thailand—saw their combined eco-nomic loss reach approximately 30 percent of grossdomestic product (GDP). As a result, once again, theunemployment and poverty problems came to the fore.In Korea, for instance, where unemployment andpoverty were almost nonexistent before the crisis, theunemployment rate almost tripled in 1998, while urbanpoverty incidence more than doubled at the peak ofthe crisis. Such a devastating economic shock, inturn, precipitated substantial social turmoil. The crisis-affected countries experienced food riots andlabor unrest, and in Indonesia a dramatic politicalupheaval occurred.
Fortunately, 1999 brought a clear shift from crisistoward recovery. As current account balances im-proved while inflation remained subdued, investorconfidence returned. This allowed the region’s cur-rencies to stabilize and interest rates to fall, which inturn fueled recovery in output. Estimates indicate thatall the crisis countries except Indonesia saw substantialGDP growth in 1999, ranging from 3.2 percent in thePhilippines to around 10.7 percent in Korea.
The improvement in financial market conditionshas been particularly impressive. Most of the region’scurrencies have appreciated dramatically. TheIndonesian rupiah and the Korean won, for instance,strengthened by 35 and 25 percent, respectively,against the dollar between early 1998 and the end of1999 (see figure 1.8). Malaysia, which introduced capi-tal controls in September 1998 and maintains a fixedexchange rate, is the exception. Yield spreads oninternational bonds issued by the crisis countries have

ASIAN DEVELOPMENT OUTLOOK 200022
fallen sharply (see box 1.4). Domestic short-terminterest rates have also fallen. With the exception ofIndonesia, where higher inflation and greater politi-cal uncertainty have kept rates high, interest rates incrisis countries are in line with their precrisis aver-ages. Stock markets have soared. Since the fourthquarter of 1998, stock prices in these countries haveincreased, on average, by 50 percent in local currencyterms. With currencies also appreciating, the rise hasbeen even larger in dollar terms (see figure 1.9).Market capitalization in most crisis countries is nowapproaching or even exceeding its precrisis level.
This recovery, while impressive, masks sub-stantial problems, particularly in the corporate andfinancial sectors. Distress in the financial sector andrestructuring costs have proved far larger than anti-cipated. One estimate suggests that total financialrestructuring costs for the four worst-hit countrieswill reach 58 percent of GDP in Indonesia, 16 percent
in Korea, 10 percent in Malaysia, and 32 percentin Thailand.
The main problem is the overhang of corporatedebt. Burdened with an enormous stock of nonper-forming loans (NPLs), banks are undercapitalized andreluctant to lend. Saddled with heavy debt burdens,many firms are technically insolvent. Private sectorfinancial analysts estimate that as many as 60-85 per-cent of loans in Indonesia are nonperforming, com-pared with 20-30 percent in Korea and Malaysia and50-70 percent in Thailand (see table 1.2). Compari-sons between countries must be made cautiously, be-cause the definition and measurement of NPLs differconsiderably. Official estimates of the share of NPLsare much lower, but even these indicate a dramaticincrease since the onset of the financial crisis.
Overall, the sheer size of NPLs reflects the poorhealth of the corporate sector. However, all firms didnot suffer equally. In general, export-oriented

23CORPORATE AND FINANCIAL SECTOR REFORM
The yield spread of a government bond is thedifference between the yield on that bond and theyield on a “safe” instrument of similar maturity(usually US Treasury notes). The size of the yieldspread represents the degree of internationalinvestor confidence in a country’s economy: thehigher the yield spread, the lower the investorconfidence. Tracking yield spreads over time istherefore a useful gauge of how investor confidenceshifts. Yield spreads tend to have an inverserelationship with GDP growth, so lower yieldspreads suggest an improved economic outlook.
The government of the Republic of Koreaissued two foreign currency bonds in April 1997 tomobilize foreign exchange: a five-year $1 billionbond and a ten-year $3 billion bond. At that timethe spreads of these bonds over US Treasury notes ofthe same maturity were 3.35 percent and 3.55percent per year, respectively. The yield spreadsreached a peak of 7.2 percent in the third quarter of1998 following Russia’s debt moratorium.
Since then, the Republic of Korea’s yieldspreads have been on a broad downward trend. Thesame pattern is true for sovereign bonds in othercrisis countries. Yield spreads peaked in the thirdquarter of 1998—16 percent for Indonesia, and 7percent for both Philippines and Thailand—but havedropped significantly since. In the fourth quarter of1999, yield spreads over comparable US Treasury notesfor the Republic of Korea and Thailand were around1.8 percent, while those for the Philippines andIndonesia stood at 3.1 and 5.5 percent, respectively.
Box 1.4 Improved International Confidence in Crisis Countries
companies fared better than those that producenontraded goods and services, and, except in Korea,small firms were hit harder than large firms. InMalaysia, for instance, about 75 percent of the NPLsare to firms in the nontradable sector. In Thailand,small firms and households account for 50 percent ofthe NPLs.
Each of the crisis countries has embarked oncomprehensive restructuring strategies to deal withthis financial and corporate distress. While consider-able progress has been made, the magnitude of NPLssuggests that much remains to be done. The risk isthat economic recovery will dull the momentum for
restructuring. A variety of vested interests, includingfinancial institutions, business corporations, laborunions, and politicians have exerted pressure to slowand limit structural reform.
FINANCIAL AND CORPORAFINANCIAL AND CORPORAFINANCIAL AND CORPORAFINANCIAL AND CORPORAFINANCIAL AND CORPORATETETETETERESTRUCTURINGRESTRUCTURINGRESTRUCTURINGRESTRUCTURINGRESTRUCTURING
Plummeting currencies, collapsing confidence, andfinancial system paralysis characterized the early phaseof the financial crisis. Uncertainties about the likelybehavior of depositors and foreign creditors and fearsabout the financial health of borrowers led banks vir-

ASIAN DEVELOPMENT OUTLOOK 200024
tually to stop lending. To prevent a complete collapsein bank intermediation, financial reform strategiesinitially focused on measures to restore market confi-dence and attract capital inflows. The most popularmethod was government guarantees, and in the earlystages of the crisis, governments gave broad guaran-tees both to foreign creditors and depositors.
As the crisis deepened and the extent of corpo-rate and financial insolvency became clear, the reformstrategy shifted toward restructuring in the financialand corporate sectors. The goals were twofold: toescape from the crisis and to address the structuralweaknesses that had helped trigger the financial col-lapse. The focus was on restructuring insolvent finan-cial institutions by closure, merger, or recapitalization;improving corporate governance; reducing labor mar-ket rigidities; and deregulating domestic markets.
In all the crisis countries, three broad principlesgoverned financial restructuring: (a) minimizing therisk of moral hazard associated with using public money
for bank recapitalization by ensuring that governmentownership increase commensurately with the infusionof public recapitalization; (b) maximizing the partici-pation of the private sector by providing fiscal andadministrative incentives; and (c) ensuring that therestructuring process was comprehensive and coveredthe institutional, legal, and regulatory aspects of thebanking sector as well as its financial health. Bankswere mandated to meet international standards ofcapital adequacy, loan classification, loan-lossprovisioning, accounting, and disclosure.
Similar goals drove corporate restructuring ef-forts. It was necessary to find quick and effective waysof allocating losses and facilitating asset mobility toremove the paralyzing debt overhang that stymied thecorporate sector. Developing an efficient bankruptcyregime and modernizing corporate governance werealso critical.
Again, strategies were broadly similar across thecrisis countries. All countries developed new out-of-

25CORPORATE AND FINANCIAL SECTOR REFORM
TTTTTable 1.2able 1.2able 1.2able 1.2able 1.2 Nonperforming Loan Ratios and Fiscal Costs Nonperforming Loan Ratios and Fiscal Costs Nonperforming Loan Ratios and Fiscal Costs Nonperforming Loan Ratios and Fiscal Costs Nonperforming Loan Ratios and Fiscal Costsof Restructuring, Crisis Countriesof Restructuring, Crisis Countriesof Restructuring, Crisis Countriesof Restructuring, Crisis Countriesof Restructuring, Crisis Countries
(percent)
Share of nonperforming loans to total loans
Official estimate Unofficial Fiscal costs ofestimate, restructuring as
Country End of 1997 End of 1998 September 1999 peak level share of GDP
Indonesia — — — 60-85 58
Korea — 7.6 6.6 20-30 16
Malaysia — 18.9 17.8 20-30 10
Philippines 5.4 11.0 13.4 15-25 —
Thailand 19.8 45.0 44.7 50-70 32
— Not available.
Note: NPLs are measured on a three-month basis, and the unofficial estimate includes assets carved out for sale by the asset managementcompanies.
Sources: Central banks and financial supervisory agencies; World Bank (1999a); Deutsche Bank (1999); J.P. Morgan (1999); Bank of America(1999); staff estimates.
court systems to restructure the debts of large firms,variants of the London approach to corporate restruc-turing (see box 1.5). Indonesia set up the JakartaInitiative, Korea and Malaysia set up corporate debtrestructuring committees, and Thailand used acorporate debt-restructuring advisory committee. Taxincentives encouraged out-of-court workouts, whileregulatory obstacles that hindered mergers and debt-equity swaps were removed. Simultaneously, the crisiscountries strengthened domestic bankruptcy laws toaccelerate resolving bankruptcy cases, protect credi-tors’ rights, and discipline managers. Policies to im-prove corporate governance included attempts to reduceownership concentration, increase market competition,reduce government monopolies, strengthen the rightsof minority shareholders, and increase the transpar-ency of financial reports and transactions.
An Individual Look at Crisis CountriesAn Individual Look at Crisis CountriesAn Individual Look at Crisis CountriesAn Individual Look at Crisis CountriesAn Individual Look at Crisis Countries
Though the broad principles of financial and corpo-rate restructuring have been similar in the crisis coun-tries, the details and rates of progress have variedconsiderably. Korea and Malaysia have gone furthest
in restructuring their corporate and financial sectors,but with different approaches. Korea adopted tightmacroeconomic policies under an InternationalMonetary Fund (IMF) program and aggressivelyclosed, merged, or suspended insolvent financial in-stitutions. Malaysia declined an IMF rescue plan, opt-ing for capital controls, and closed no financialinstitutions. After dramatically downsizing the finan-cial sector by closing virtually all its finance compa-nies, Thailand adopted a more gradual, market-basedapproach to restructuring, with banks allowed to raiseequity capital over a long period through phased-inrequirements for loan provisioning. Indonesia lagsbehind the other three countries, and has only re-cently taken steps to deal with banking problems andcorporate distress. As a less severely affected economy,the Philippines adopted a market-led reform process,with the government and the central bank focusingon reforming the supervisory systems.
Indonesia. Indonesia’s first step toward structural re-form in the financial sector was to create new institu-tions. The Indonesian Bank Restructuring Agency wasformed in January 1998 as an independent body to

ASIAN DEVELOPMENT OUTLOOK 200026
restructure troubled banks and their assets. Withinthis agency, a specific Asset Management Unit wascreated in April 1998 to acquire NPLs from troubledbanks. By the end of 1999, it held around two thirdsof all NPLs. So far, however, the Indonesian BankRestructuring Agency has done little to recover theseassets, although the legal, organizational, and regula-tory framework is in place.
Greatest progress has been made in restructur-ing private banks. At the end of July 1997, before theonset of the crisis, Indonesia had 160 private banks.In September 1998, all private banks were classifiedinto categories of A, B, or C, based on their capitaladequacy. All group C banks and nonviable group Bbanks were closed in March 1999. In the span of oneyear, 66 banks were closed and 12 taken over by thestate. Consequently, the state banking system accountsfor 75 percent of the liabilities of Indonesia’s banking
system and 90 percent of its negative net worth.Unfortunately, the restructuring of these state bankshas just begun. By some estimates, around 80 percentof all outstanding loans are nonperforming. As a re-sult, most Indonesian financial institutions remain in-solvent or undercapitalized, and lending operationsare severely curtailed.
One of the major causes of the collapse of thebanking system was the absence of an effective banksupervision system. Realizing this weakness, Indonesiahas taken steps to improve prudential regulations, banksupervision, and enforcement capabilities. Never-theless, bank supervision remains limited because ofweak enforcement capacity and a lack of trained staff.
As in the financial sector, Indonesia’s efforts atcorporate reform initially focused on creating newinstitutions and improving legislation. First, the gov-ernment set up the Indonesian Debt Restructuring
There are three popular approaches tocorporate sector restructuring:centralized, decentralized, and theLondon approach.
In the centralized approach, thegovernment plays a leading role. Thisis effective when the size ofproblematic debts is small, corporatestructure is simple, and thegovernment enjoys high levels ofconfidence. Sweden in the early 1990sand Hungary in the mid-1990s used acentralized approach to corporaterestructuring.
At the other extreme, interestedparties use a decentralized approachto reach voluntary restructuringagreements. This is considered moreuseful than the centralized approachif the bad debts are large and thecorporate structure is complex.Corporate restructuring in the UnitedStates tends to follow this model.
The London approach evolvedin the United Kingdom whennumerous firms faced bankruptcy inthe recession of the early 1990s.
During this period, more than160 British companies used theLondon approach, in which creditorfinancial institutions and indebtedfirms work under the closecoordination of a governmentinstitution (in the British case, theBank of England), but outside theformal judiciary process. The Londonapproach includes• Full information sharing between
all parties involved in a workout• Collective decision making
among creditor banks on whetherand on what terms a companyshould be given a financial lifeline
• Standardized agreements betweendebtors and creditors and amongcreditors themselves
• A clear timetable to achievetimely resolution
• Binding agreements betweenbanks and firms to participate inand honor the restructuringagreements
• The principle of “shared pain” inthe allocation of losses, meaning
equal treatment for all creditors ofa single category
• The possibility of penalties if theagreements are not adhered to.To be successful, this approach
demands strong confidence in theofficial mediating institution. In theBritish case, the parties concernedheld the Bank of England in highregard, a crucial ingredient forsuccess.
Superficially, the corporate debtworkouts under governmentcoordination in Indonesia, Korea,and Thailand resemble the Londonapproach. However, the Asiancountries lacked the equivalent of theBank of England, a governmentinstitution with high credibility. Theyalso suffered a lack of mutual trustand confidence between financialinstitutions. This process is nowgradually changing, as both financialinstitutions and corporations becomemore confident in the ability ofgovernment to oversee corporatedebt restructuring.
Box 1.5 Models of Corporate Restructuring
27CORPORATE AND FINANCIAL SECTOR REFORM
Agency in July 1998 to help restructure foreign debt.This agency allows debtors and creditors to insurethemselves against exchange risks, once they havereached rescheduling agreements. Indonesia thencreated the Jakarta Initiative for out-of-court corpo-rate settlements, following the example of the Londonapproach to corporate workouts. Legislation to im-prove corporate governance included new bankruptcyand anticorruption laws. In August 1998 a new bank-ruptcy law was introduced, which modernized the legalinfrastructure for bankruptcy and facilitated the rapidresolution of commercial disputes. In 1999 a lawagainst corruption, collusion, and nepotism was passed.
Despite this comprehensive legal and institu-tional framework, the progress of corporate restruc-turing has been disappointing. The Indonesian DebtRestructuring Agency has registered little debt. By theend of June 1999, only 80 bankruptcy cases had beenregistered, although almost half of Indonesian corpo-rations were insolvent and experiencing increased dif-ficulties in meeting debt service obligations. One ofthe biggest constraints on the speed of corporate debtrestructuring has been the lack of financial systemreform. Weak undercapitalized banks lack the re-sources or technical skills to resolve corporate debtswithin the framework of the Jakarta Initiative. Anotherconstraint is the enormity of Indonesia’s foreign debt.Without relief from foreign creditors, including Japan,Indonesia probably cannot service this debt, in par-ticular the $36 billion owed to foreign banks.
Korea. Korea’s financial sector strategy initially focusedon restoring market confidence with governmentguarantees to prevent a run on the banks. However,once the situation stabilized, priority shifted to re-structuring or closing insolvent financial institutionsand rehabilitating viable ones. At the same time,adoption of international standards of regulationand supervision was emphasized, as well as capitalmarket development.
In December 1997, the Korean Parliamentpassed 13 financial reform bills, and streamlined bank-ruptcy law. In January 1998, the government, corpo-rations, and unions agreed on a national council todiscuss economic restructuring. A legal framework forcorporate sector restructuring was created in February1998. In April 1998 the powerful Financial Supervisory
Commission was created to monitor and superviseall financial institutions. During the crisis, however, itfocused on financial and corporate restructuring, ac-celerating the reform process.
In early 1998, two of Korea’s largest banks, KoreaFirst Bank and Seoul Bank, were recapitalized withpublic funds and effectively nationalized. Korea FirstBank was subsequently sold to a foreign consortium.On 29 June 1998, the Financial Supervisory Commis-sion announced that five insolvent commercial bankswould be closed and absorbed by healthier banks.Mergers involving the five largest banks have beencompleted. Two years after the crisis, the number ofbanks has been reduced from 33 to 23 through clo-sures and mergers. The government has also closeddown or suspended 21 of 30 merchant banks, and 22other financial institutions.
The public sector contribution to this restructuringhas been huge. At the beginning of the crisis, the govern-ment earmarked W64 trillion ($53.3 billion) in publicfunds to support financial sector restructuring. By theend of 1999, the government had used the entire allo-cation of funds to purchase W20.5 trillion ($17.1 billion)in NPLs from banks and secondary financial institutionsthrough the Korea Asset Management Corporation.It also provided W43.5 trillion ($36.2 billion) in recapi-talization and deposit repayment support through theKorea Deposit Insurance Corporation.
Korea has taken a three-pronged approach toreforming the corporate sector. First, the four largestchaebols (conglomerates of corporations), known asthe Big Four, were restructured through specific plansto improve capital structure. These required the fourchaebols to reduce their debt-equity ratios to below200 percent by the end of 1999, remove existing cross-guarantees between subsidiaries in different lines ofbusiness, and consolidate businesses by exchangingnoncore businesses with other chaebols, a processknown as “Big Deals.”
Second, the mid-ranking chaebols and otherlarge corporations have been subject to out-of-courtworkouts with their designated lead creditor banks,based on the London approach.
Third, the restructuring of small- and medium-size enterprises (SMEs) has been left to the creditorbanks and largely postponed. To prevent insolvencyand preserve employment, these firms were allowed

ASIAN DEVELOPMENT OUTLOOK 200028
easy access to working capital loans. In Korea, com-pared with other crisis countries, SMEs account for arelatively small fraction of outstanding bank loans.While this justifies the delay in restructuring SMEs, acomprehensive program to work out these debts isurgently needed.
The restructuring of the Big Four and out-of-court workouts of other large corporations have hadmixed results. The lead banks have been accused ofincluding firms that should have been immediately liq-uidated. Given their financial fragility, the banks havebeen reluctant to absorb losses, and are trying to keepmany troubled firms on their balance sheets that infact are unlikely to survive the crisis. The lead bankshave also been unable to devise a comprehensive setof workout criteria involving debt-equity swaps, debtwrite-downs, and debt rescheduling. The absence ofcomprehensive criteria has raised concerns about thefairness and effectiveness of using differential mea-sures to support different firms in various industries.Disagreements over loan-loss provisioning, disputesover asset valuation, and managers’ resistance to los-ing control all have further complicated the process.Consequently, many firms are likely to fail to meettheir obligations to their lead banks.
The restructuring impact of the Big Deals is alsomixed. Whether or not the excess capacity problemsthat plagued Korea’s chaebols have been solved is notclear. Evidence is also mixed on whether the Big Fourhas fulfilled its commitments to improve corporategovernance and slim down to a few core businesses.
Most of the banks, including restructured ones,have seen substantial improvement in the quality oftheir assets and profitability of their operations. Theirlending capacity also has increased, supporting theongoing economic recovery. However, financial re-structuring is far from over. The Financial SupervisoryCommission has been struggling to restructure thethree largest investment trust companies, which holdmany corporate bonds issued by corporations engagedin out-of-court workouts. Many nonbank financialinstitutions, including life insurance companies, alsoneed rehabilitation.
The banks have faced major losses from the cor-porate workouts. For instance, the restructuring ofDaewoo, Korea’s second-largest chaebol until domes-tic creditors decided on a debt-rescheduling program
for its subsidiaries, caused bank losses estimated at$10.4 billion. The requirement that the Big Four re-duce their debt-equity ratio to less than 200 percentby the end of 1999 also led to debt write-downs anddebt-equity swaps that cut the earnings of major com-mercial banks.
These costs made it difficult for Korean banksto build the capital and loan-loss provisioning neededto absorb the losses from further corporaterestructuring. Some progress has been made, however.The average capital adequacy ratio of the commer-cial banks reached 10.5 percent by the end of 1999.Nonetheless, estimates suggest that the Korean gov-ernment will need additional public funds besides theW64 trillion ($53.3 billion) already used for reformingthe financial sector.
Malaysia. Malaysia’s experience of financial restruc-turing differed from the other crisis countries in twocrucial aspects. First, Malaysia began with a strongerfinancial sector. Before the crisis it had developed moreeffective bankruptcy and foreclosure laws, as well as astronger supervisory capacity. The banking sector wasalso well capitalized, with capital-asset ratios exceed-ing 10 percent. Second, Malaysia altered its macro-economic course in September 1998, choosing toimpose capital controls rather than accept an IMFrescue package.
However, like the other countries, Malaysiabegan its financial and corporate restructuring effortby creating new institutions. In June 1998, the authori-ties set up Danaharta, an asset management company(AMC) to acquire nonperforming bank loans. InAugust 1998, Danamodal was created to recapitalizefinancial institutions whose capital adequacy ratiosfell below 9 percent. In the same month the CorporateDebt Restructuring Committee was established tofacilitate the out-of-court restructuring of corporatedebt.
Both Danaharta and Danamodal made signifi-cant progress in restructuring banks. Danamodalinjected $1.6 billion into ten financial institutions,while Danaharta purchased 50 percent of outstand-ing NPLs, about the same ratio as Korea. The level ofNPLs appears to have peaked in mid-1999 at over20 percent of total loans. The total fiscal cost of therestructuring is estimated at around 10 percent of GDP.
29CORPORATE AND FINANCIAL SECTOR REFORM
In an effort to accelerate the rationalization andconsolidation of the banking system, instead of closingaffected institutions as in Korea and Thailand,Malaysia continued to encourage financial institutionsto merge and consolidate. The central bank approvedthe formation of ten banking groups and the selectionof the anchor banks and their respective partners inJanuary 2000. Accordingly, 54 domestic banking in-stitutions—reduced from 88 at the end of 1997—willbe further consolidated. With a relatively sound legalsystem and a good institutional framework for finan-cial restructuring, the prospects for Malaysia success-fully restructuring its financial system seem bright.
Before the crisis, Malaysia’s corporations wereless heavily indebted than firms in other crisis coun-tries in East Asia. Consequently, corporate distress inMalaysia was less acute than elsewhere, although firmswere hit hard by the rise in interest rates because ofheavy dependence on bank financing. Malaysia’stroubled firms are concentrated in the real estate, con-struction, and infrastructure sectors.
Nonetheless, debt workouts and operational re-structuring through the Corporate Debt RestructuringCommittee have been slow, partly because of a lackof adequately trained staff. To address the problem,the government has established agencies to deal withcorporate restructuring: the Loan Monitoring Unit ofthe central bank assists small corporate borrowers inrestructuring, a rehabilitation fund helps viable SMEsrestructure, and the Finance Committee on Corpo-rate Governance works on reforming corporate gov-ernance practices.
Philippines. While the Philippines was affected bythe Asian crisis, it suffered significantly less than theother four crisis economies. No broad banking crisisoccurred and no emergency rescue assistance from theIMF was needed. The country was resilient because ithad virtually no short-term foreign currency borrow-ing, its banks were well-capitalized after two decadesof financial sector reform, and its manufacturing sectorwas smaller and less leveraged than the other economies.
The mildness of the Philippines’ crisis affectedthe scope and nature of the country’s financial andcorporate reforms. Compared with the four worst-hitcrisis economies, the Philippines followed a market-led reform process with less government involvement.
Its major reform elements included (a) strengtheningthe prudential and supervisory systems overseeing thefinancial sector, (b) adopting an early interventionsystem to deal effectively with problem banks and keepthe banking system sound, (c) strengthening andmodernizing state banks through privatization,(d) reducing the intermediation costs of financialinstitutions, and (e) improving the legal and regula-tory framework.
To improve the supervisory framework, thecentral bank required banks to set up 2 percent generalloan-loss provisions, as well as increasing specificloan-loss provision on individual loans, which reached2 percent by 1 October 1999. The central bank alsolimited banks’ exposure to the real estate sector to20 percent of total loans, and reduced the allowableloan value of real estate security from 70 to 60 per-cent. It imposed a 30 percent liquid cover on all foreignexchange liabilities from foreign currency deposits.
To deal more effectively with problem banks, thecentral bank adopted an early warning system thatincluded formalizing sanctions on undercapitalizedbanks. To strengthen and modernize state banks, thegovernment concentrated on selling shares to privateinvestors. Statutory reserve requirements were re-duced from 10 to 8 percent in May 1998 to reduce thecosts of financial intermediation.
Regulatory improvements have been significant.The central bank has proposed major revisions to keybanking laws to (a) limit the ability of universal andcommercial banks to invest in firms; (b) redefine thefunctions, authority, and minimum capitalization oftrust entities; (c) adopt the Basle Capital Accords, aset of standards for measuring capital adequacy;(d) strengthen provisions to guard against bank over-exposure to risky assets; (e) guard against creditconcentration among borrowers; (f) grant the centralbank the right to examine banks once a year; and(g) authorize the central bank to issue regulationsrequiring bank subsidiaries and affiliates to maintaina balanced position in foreign exchange transactions.
These reforms contributed to the early recoveryof financial markets. Nonetheless, problems remain.First, many of the new prudential norms and interna-tional standards are poorly implemented. Second,banks still hold many real estate NPLs, which con-tinue to curtail banking sector operations and stall

ASIAN DEVELOPMENT OUTLOOK 200030
overall economic activity. The illiquidity of propertymarkets also means that loan-loss provisioning maynot reflect all real losses. Informal loan-for-propertyswaps without formal legal foreclosure proceedingspose an additional problem.
Thailand. Like other crisis countries, Thailand beganstructural reform in the financial sector by creatingnew institutions. In October 1997, three months afterthe onset of the financial crisis, the governmentestablished the Financial Sector RestructuringAuthority to organize the workout of failed financecompanies, and the Asset Management Company tobuy nonperforming assets and recover them. InDecember 1997, the Financial Sector RestructuringAuthority closed 56 of 58 suspended finance compa-nies, and since then has been disposing of their assets.The Asset Management Company purchased its firstNPLs at a Financial Sector Restructuring Authorityauction in March 1999.
After closing the finance companies, to help re-gain investor confidence the government adopted amarket-based approach to restructuring and recapi-talizing the remaining financial institutions. By gradu-ally introducing stricter loan classification andloan-loss provisioning requirements, the Thai authori-ties hoped to give private investors the incentive—and time—to provide fresh capital.
However, this strategy did not succeed becauseprivate investors had little incentive to invest in thosebanks and in other financial institutions that wereamassing large numbers of NPLs because of continu-ing recession. The government shifted to a more in-terventionist approach in August 1998, announcing anew comprehensive financial restructuring package.This package allowed viable financial institutions torecapitalize using public funds under clear safeguards.It offered incentives for accelerating corporate debtrestructuring and promoting new lending to the privatesector. It also created a legal basis for establishingprivate AMCs and clear resolution strategies for fi-nancial institutions in line with the government’s long-term objective of strengthening the financial system.
Even this interventionist approach faced prob-lems. Thai bank owners remain as reluctant to takeadvantage of public funds as they were determined tomaintain ownership and control of their institutions.
By January 2000, only four banks had accepted thegovernment’s recapitalization scheme, and most bankslimited new lending and resorted to complex privatearrangements to raise capital. The level of NPLs incommercial banks is so high—as much as 50 percentof total loans or more—that for banks to recapitalizethrough normal business operations seems impossible.
Thailand’s strategy for corporate restructuring,like that of the other countries, consisted of new in-stitutions, better incentives, and improvements in thelegal framework. In August 1998, the government cre-ated the Corporate Debt Restructuring AdvisoryCommittee. It also endeavored to create an effectivelegal framework for recovering debt through bank-ruptcy legislation, and provided tax and other incen-tives to encourage corporations and banks torestructure bad debt.
Progress has been made, and the results of thecorporate restructuring account for about 25 percentof NPLs. The growth of NPLs has outpaced the rate ofcorporate restructuring completion. SMEs account formore than two thirds of this aggregate corporatedebt, which makes restructuring complex: transactionsare small, costly, and diffuse, with firms scatteredover the country. Banks have also been reluctantto deal with the debts of SMEs, preferring to scaleback lending.
Thailand has made greater progress in im-proving the supervisory and regulatory frameworksurrounding the financial sector. The authorities areenforcing new loan classifications and provisioningrequirements, and the supervisory functions of theBank of Thailand are being strengthened. All finan-cial institutions have signed a memorandum ofunderstanding that describes their plans to raisecapital. The more stringent provisioning requirementsfor nonperforming assets are being phased in from thesecond half of 1998 until the end of 2000. The Bankof Thailand also began implementing a moderniza-tion program aimed at redesigning the bank’s organi-zational structure, streamlining work processes, andimproving corporate governance. As part of theseefforts, experts from some central banks of industrialcountries have offered recommendations onstrengthening central banking and bank supervision.The Bank of Thailand has also set up a school forbank examiners.
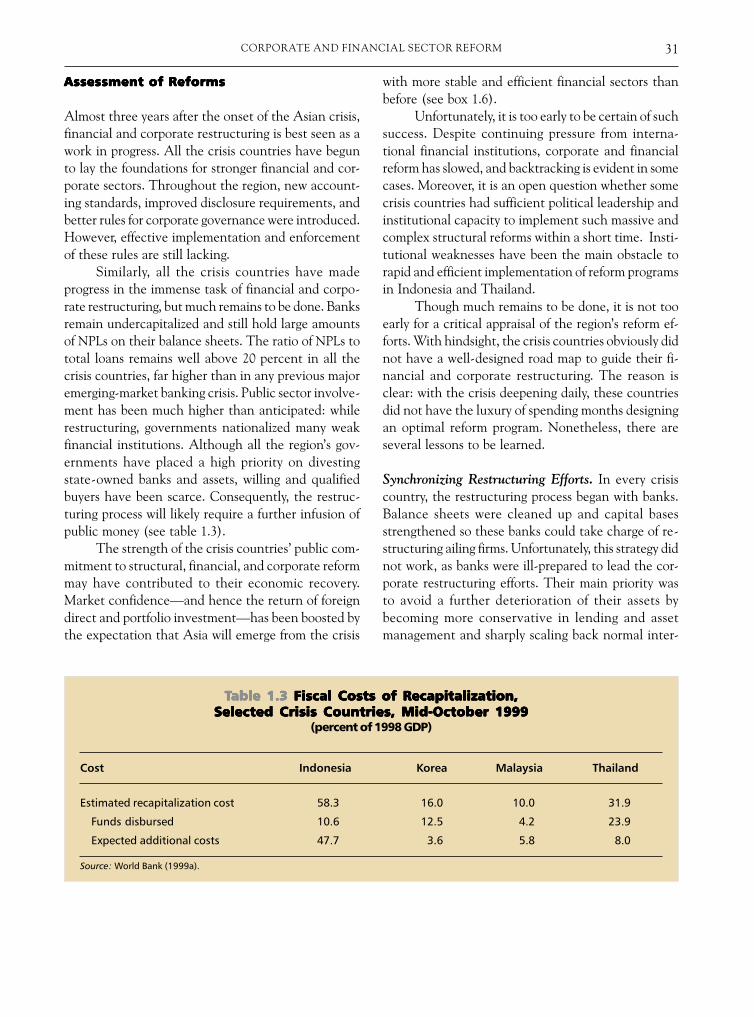
31CORPORATE AND FINANCIAL SECTOR REFORM
Assessment of ReformsAssessment of ReformsAssessment of ReformsAssessment of ReformsAssessment of Reforms
Almost three years after the onset of the Asian crisis,financial and corporate restructuring is best seen as awork in progress. All the crisis countries have begunto lay the foundations for stronger financial and cor-porate sectors. Throughout the region, new account-ing standards, improved disclosure requirements, andbetter rules for corporate governance were introduced.However, effective implementation and enforcementof these rules are still lacking.
Similarly, all the crisis countries have madeprogress in the immense task of financial and corpo-rate restructuring, but much remains to be done. Banksremain undercapitalized and still hold large amountsof NPLs on their balance sheets. The ratio of NPLs tototal loans remains well above 20 percent in all thecrisis countries, far higher than in any previous majoremerging-market banking crisis. Public sector involve-ment has been much higher than anticipated: whilerestructuring, governments nationalized many weakfinancial institutions. Although all the region’s gov-ernments have placed a high priority on divestingstate-owned banks and assets, willing and qualifiedbuyers have been scarce. Consequently, the restruc-turing process will likely require a further infusion ofpublic money (see table 1.3).
The strength of the crisis countries’ public com-mitment to structural, financial, and corporate reformmay have contributed to their economic recovery.Market confidence—and hence the return of foreigndirect and portfolio investment—has been boosted bythe expectation that Asia will emerge from the crisis
with more stable and efficient financial sectors thanbefore (see box 1.6).
Unfortunately, it is too early to be certain of suchsuccess. Despite continuing pressure from interna-tional financial institutions, corporate and financialreform has slowed, and backtracking is evident in somecases. Moreover, it is an open question whether somecrisis countries had sufficient political leadership andinstitutional capacity to implement such massive andcomplex structural reforms within a short time. Insti-tutional weaknesses have been the main obstacle torapid and efficient implementation of reform programsin Indonesia and Thailand.
Though much remains to be done, it is not tooearly for a critical appraisal of the region’s reform ef-forts. With hindsight, the crisis countries obviously didnot have a well-designed road map to guide their fi-nancial and corporate restructuring. The reason isclear: with the crisis deepening daily, these countriesdid not have the luxury of spending months designingan optimal reform program. Nonetheless, there areseveral lessons to be learned.
Synchronizing Restructuring Efforts. In every crisiscountry, the restructuring process began with banks.Balance sheets were cleaned up and capital basesstrengthened so these banks could take charge of re-structuring ailing firms. Unfortunately, this strategy didnot work, as banks were ill-prepared to lead the cor-porate restructuring efforts. Their main priority wasto avoid a further deterioration of their assets bybecoming more conservative in lending and assetmanagement and sharply scaling back normal inter-
TTTTTable 1.3 able 1.3 able 1.3 able 1.3 able 1.3 Fiscal Costs of Recapitalization,Fiscal Costs of Recapitalization,Fiscal Costs of Recapitalization,Fiscal Costs of Recapitalization,Fiscal Costs of Recapitalization,Selected Crisis Countries, Mid-October 1999Selected Crisis Countries, Mid-October 1999Selected Crisis Countries, Mid-October 1999Selected Crisis Countries, Mid-October 1999Selected Crisis Countries, Mid-October 1999
(percent of 1998 GDP)
Cost Indonesia Korea Malaysia Thailand
Estimated recapitalization cost 58.3 16.0 10.0 31.9
Funds disbursed 10.6 12.5 4.2 23.9
Expected additional costs 47.7 3.6 5.8 8.0
Source: World Bank (1999a).
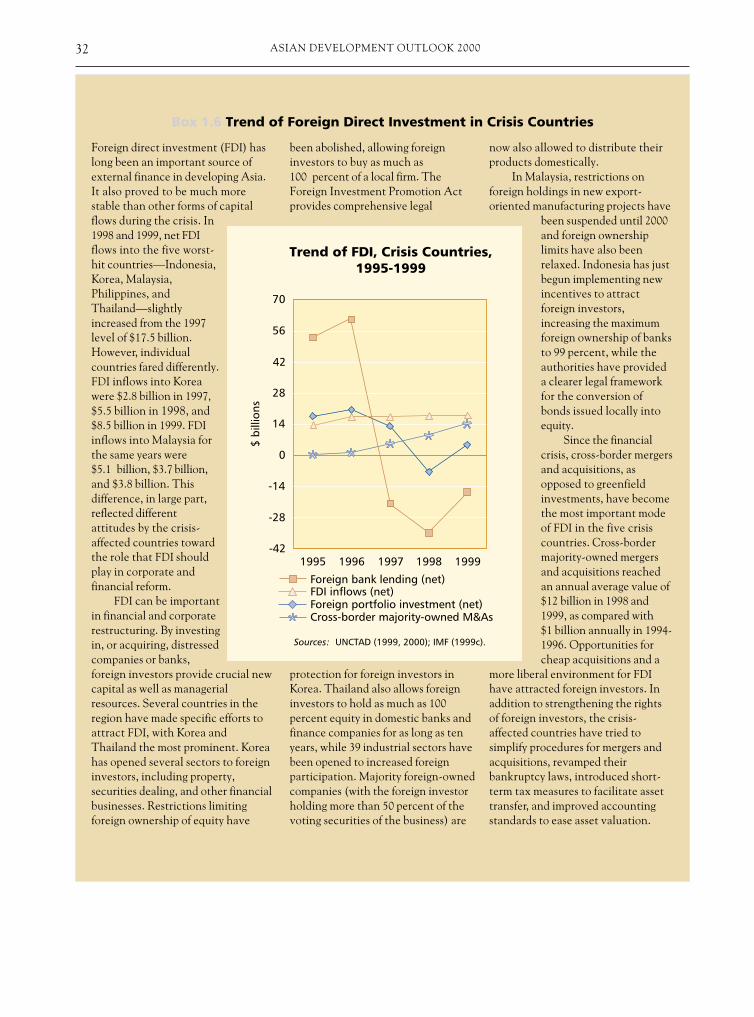
ASIAN DEVELOPMENT OUTLOOK 200032
Foreign direct investment (FDI) haslong been an important source ofexternal finance in developing Asia.It also proved to be much morestable than other forms of capitalflows during the crisis. In1998 and 1999, net FDIflows into the five worst-hit countries—Indonesia,Korea, Malaysia,Philippines, andThailand—slightlyincreased from the 1997level of $17.5 billion.However, individualcountries fared differently.FDI inflows into Koreawere $2.8 billion in 1997,$5.5 billion in 1998, and$8.5 billion in 1999. FDIinflows into Malaysia forthe same years were$5.1 billion, $3.7 billion,and $3.8 billion. Thisdifference, in large part,reflected differentattitudes by the crisis-affected countries towardthe role that FDI shouldplay in corporate andfinancial reform.
FDI can be importantin financial and corporaterestructuring. By investingin, or acquiring, distressedcompanies or banks,foreign investors provide crucial newcapital as well as managerialresources. Several countries in theregion have made specific efforts toattract FDI, with Korea andThailand the most prominent. Koreahas opened several sectors to foreigninvestors, including property,securities dealing, and other financialbusinesses. Restrictions limitingforeign ownership of equity have
been abolished, allowing foreigninvestors to buy as much as100 percent of a local firm. TheForeign Investment Promotion Actprovides comprehensive legal
protection for foreign investors inKorea. Thailand also allows foreigninvestors to hold as much as 100percent equity in domestic banks andfinance companies for as long as tenyears, while 39 industrial sectors havebeen opened to increased foreignparticipation. Majority foreign-ownedcompanies (with the foreign investorholding more than 50 percent of thevoting securities of the business) are
Box 1.6 Trend of Foreign Direct Investment in Crisis Countries
now also allowed to distribute theirproducts domestically.
In Malaysia, restrictions onforeign holdings in new export-oriented manufacturing projects have
been suspended until 2000and foreign ownershiplimits have also beenrelaxed. Indonesia has justbegun implementing newincentives to attractforeign investors,increasing the maximumforeign ownership of banksto 99 percent, while theauthorities have provideda clearer legal frameworkfor the conversion ofbonds issued locally intoequity.
Since the financialcrisis, cross-border mergersand acquisitions, asopposed to greenfieldinvestments, have becomethe most important modeof FDI in the five crisiscountries. Cross-bordermajority-owned mergersand acquisitions reachedan annual average value of$12 billion in 1998 and1999, as compared with$1 billion annually in 1994-1996. Opportunities forcheap acquisitions and a
more liberal environment for FDIhave attracted foreign investors. Inaddition to strengthening the rightsof foreign investors, the crisis-affected countries have tried tosimplify procedures for mergers andacquisitions, revamped theirbankruptcy laws, introduced short-term tax measures to facilitate assettransfer, and improved accountingstandards to ease asset valuation.

33CORPORATE AND FINANCIAL SECTOR REFORM
mediary operations. This retrenchment created a vi-cious circle in which heavily indebted but viable firmscould not get credit. This, in turn, led to still more NPLs.
In some countries stricter regulatory and super-visory standards made matters even worse. InThailand, for instance, banks became even more re-luctant to lend as regulatory standards were tightened.This exacerbated the credit crunch, creating morebusiness failures and deepening the recession. Regu-latory changes in equity markets worsened the prob-lem. Thailand’s stock exchange introduced stringentrequirements for new entrants, such as a minimumnumber of shareholders and minimum profits for sev-eral consecutive years, which most SMEs were un-able to meet. Simultaneously, access to commercialbanks and finance companies was drastically reduced.
Not only did the failure to synchronize the re-structuring of banks and corporations worsen theregion’s recession, but it also left banks extremely frag-ile. The balance sheets of recapitalized banks couldeasily deteriorate again, depending on the outcomeof corporate workouts. Although identifying alltroubled firms and accurately forecasting how manywill be able to survive the crisis are difficult, a com-prehensive restructuring strategy based on a clear as-sessment of the corporate and financial sectors wouldavoid the costs of repeated bank restructuring.
Articulating Methods and Goals. While financial sec-tor restructuring efforts benefited from a clear bodyof international experience, few precedents wereavailable for corporate restructuring of the scale andtype necessary. As a result, the process was confused.Policymakers did not understand why the so-calledLondon approach was deemed appropriate for work-ing out corporate debt, why it was so critical to re-duce debt-equity ratios in the short term, or whycertain corporate structures were considered supe-rior. For instance, the breakup of the chaebols wasdeemed desirable, but reformers could not recom-mend what industrial organization should replaceKorea’s chaebol-dominated system.
Minimizing Damage to Credit System. A properlyfunctioning credit system is the nerve system of aneconomy. It contains the most important financial andindustrial information of the private sector. Once de-
stroyed, this information is difficult to recreate. Simi-larly, corporations embody organizational and socialcapital that is also difficult to recreate quickly. Thus,to the extent possible, it is important to avoid dam-age to the credit system during bank restructuring andto minimize the erosion of social capital during cor-porate restructuring. Mergers and acquisitions arepreferable to outright bank closure, and workouts arebetter than outright insolvency.
The crisis countries, however, did not adhereto these principles. Many financial institutions wereclosed in the early months of the crisis without ad-equate thought about how this would affect the creditsystem. Similarly, institutional and supervisory im-provements, although well intentioned, further en-dangered the credit system by making it more difficultfor banks to function. The countries did not, for in-stance, follow reform policies that would encouragemergers by liberalizing domestic laws to make foreigntakeovers easier. In several cases, reform efforts un-dermined the rights of secured creditors.
Considering Local Circumstances. All the crisis coun-tries relied heavily on voluntary, out-of-court settle-ments for corporate restructuring, the hallmark of theLondon approach. Given the absence of well-functioning bankruptcy courts, this was perhaps in-evitable. Within this framework, however, thegovernment was expected to play the role of mediator,facilitating an orderly resolution, while banks, ascreditors, managed the workout. Given theirundercapitalization and the heavy burden of NPLs,banks did not play their part, particularly in Indonesiaand Thailand. The large role played by foreign-basedaccounting firms, consulting agencies, and investmentbanks also complicated matters. Naturally, these firmsfollowed international standards for accountancy anddue diligence, which were often more stringent thantraditional local standards. The new and toughercriteria made it difficult for the lead banks andcorporations to reach agreement on debt workouts.As a result, the London approach had only mixedsuccess, and corporate reform has been slow.
Using Intermediary Institutions. The crisis countrieshad few intermediary institutions, such as investmentbanks, to facilitate mergers and acquisitions. Instead

ASIAN DEVELOPMENT OUTLOOK 200034
commercial banks, which specialized in providingshort-term working capital, led the corporate restruc-turing effort. Not surprisingly, results were disappoint-ing. Instead of evaluating project viability anddebt-service capability, commercial banks were moreinclined to recover as much of their loans as possible,if necessary by foreclosing on assets clients had pledgedas collateral. If they could not recover collateral, thecommercial banks kept the NPLs on their books andcontinued to provide short-term emergency financ-ing to avoid further losses.
Participating in Reform. Beyond these specific les-sons for financial and corporate restructuring, broaderlessons for reform can be learned. Perhaps the mostimportant is the need for reforms to be “owned” bycountries themselves. Only when a country owns areform program does it act in a cost-effective mannerthat bears results. Korea stands out as a country whosereform program bore the hallmarks of ownership: com-mitted and strong political leadership, inclusiveness,broad participation, and democratic decisionmaking.
THE NEXT STEPS:THE NEXT STEPS:THE NEXT STEPS:THE NEXT STEPS:THE NEXT STEPS:SHORT–TERM TSHORT–TERM TSHORT–TERM TSHORT–TERM TSHORT–TERM TASKSASKSASKSASKSASKS
The crisis countries have made significant, if inter-mittent, progress toward financial and corporate re-form. However, there is much more to be done. Thebiggest risk facing the region is complacency. As mar-kets recover and foreign investors return, the momen-tum for further reform is weakened. With the growingopposition from vested interests, the risks of backtrack-ing are high.
Slowing or halting the reform process would haveserious consequences: it would erode investor confi-dence, waste the enormous resources already ex-pended, lose an invaluable opportunity to modernizeAsia’s financial and corporate sectors, and reduce theregion’s growth potential. The region has much to do,including strengthening the ongoing reforms and im-proving the governance process.
Strengthen Ongoing ReformsStrengthen Ongoing ReformsStrengthen Ongoing ReformsStrengthen Ongoing ReformsStrengthen Ongoing Reforms
The focus of the restructuring effort so far has beenon resolving NPLs and recapitalizing weak financial
institutions. Little attention, however, has been paidto disposing of those bad assets that were bought byor transferred to AMCs. The short-term reform agendaneeds to focus on AMCs and disposing of their assets.It also needs to foster further improvements in therelated regulatory environment.
All the crisis economies except Thailand estab-lished centralized government-supported AMCs, towhich NPLs were transferred. By the end of 1999, twothirds of NPLs in Indonesia had been transferred toits Asset Management Unit. In Korea and Malaysia,the share was 50 percent. However, the proportion ofNPLs actually resolved or disposed of is far lower (seetable 1.4). In Korea less than 5 percent of NPLs heldby the Korea Asset Management Corporation havebeen resolved, and the share is less than 1 percent inIndonesia and Malaysia. The vast majority of the NPLsare still carried on the government’s books, at sub-stantial fiscal cost.
Improving the regulatory framework can speedthe resolution of the AMCs’ portfolios. The purchase,transfer, management, and sale of assets must be easier.In particular, rules surrounding transfer taxes andrecognizing losses from the sale need improvement.A second approach is to increase private sector parti-cipation in restructuring. This helps reduce thegovernment’s fiscal obligation and ensure that theAMCs are as commercial as possible. At the very least,operations need to be market-driven, efficient, and
TTTTTable 1.4 able 1.4 able 1.4 able 1.4 able 1.4 Operations of AssetOperations of AssetOperations of AssetOperations of AssetOperations of AssetManagement Companies, SelectedManagement Companies, SelectedManagement Companies, SelectedManagement Companies, SelectedManagement Companies, Selected
Crisis Countries, January 2000Crisis Countries, January 2000Crisis Countries, January 2000Crisis Countries, January 2000Crisis Countries, January 2000
NPLs to AMCs % NPLs disposed of
Country % total % GDP by AMC
Indonesia 66 35 0.7
Korea 50 20 4.7
Malaysia 50 14 0.1
AMC Asset management company.NPL Nonperforming loan.
Source: Staff estimates.

35CORPORATE AND FINANCIAL SECTOR REFORM
transparent. Encouraging direct private participationin AMCs would also be useful. All the AMCs increas-ingly are employing the expertise of private firms tovalue assets and develop disposal strategies. Malaysiais considering contracting out a proportion of itsnonperforming assets to private management. In 1999,the Korean Asset Management Corporationannounced plans to establish joint ventures with for-eign investors to dispose of nonperforming assets. Eachjoint venture has about W300 billion in assets, withthe foreign share at 65 percent. However, even withthis foreign participation, asset disposal has beenextremely slow.
Many aspects of the region’s regulatory frame-work need further improvement. The most crucial isproviding mechanisms that give early warning of pend-ing trouble in financial institutions. Laws should re-quire supervisory agencies to provide effective earlywarning mechanisms and take prompt corrective ac-tions to minimize the risk of financial crisis. For ex-ample, when a bank’s capital adequacy ratio declines,the bank should automatically fall under greater regu-latory scrutiny with tight restrictions on its activities.
More broadly, prudential standards need im-provement because they are well below internationalnorms. Bankruptcy and foreclosure laws need to beamended to facilitate seizing debtors’ assets and re-duce the need to resort to the judicial process. Banksecrecy laws may need loosening to increase financialtransparency and discourage the flow of corrupt fundsinto the region’s financial centers. Given that finan-cial and corporate activities are increasingly interre-lated, an integrated approach to supervisory functionsis needed.
Improve GovernanceImprove GovernanceImprove GovernanceImprove GovernanceImprove Governance
It is now widely recognized that poor governance wasa major weakness in the region’s financial and corpo-rate sectors. Symptoms include intricate formal andinformal relationships between governments, financialinstitutions, and corporations; inadequate disclosurerequirements; and widespread corruption and favor-itism. A major focus of the reform effort has beenstrengthening governance by improving market disci-pline and corporate governance, as well as introduc-ing anticorruption and competition policies. Such
reforms take time, however, as their goal is an entirelynew corporate framework and culture.
With the assistance of multilateral financial in-stitutions, notably the Asian Development Bank, theIMF, and the World Bank, the crisis countries havefocused reform actions on increasing the transparencyof economic and financial data, strengthening corpo-rate disclosure requirements, increasing accountabil-ity to shareholders, strengthening competition laws,privatizing state-owned enterprises, dismantling state-supported monopolies and cartels, and restructuringopaque corporate relations.
The crisis countries have made significantprogress toward improving corporate and financialgovernance. Rights of minority shareholders andbroader stakeholders are better protected, and share-holders, including minority ones, are treated morefairly. Active cooperation between stakeholders andcorporations is encouraged. Emphasis has been re-newed on the responsibility of the board to give stra-tegic guidance, monitor management effectively, andprovide accountability to stakeholders. Disclosure ofinformation, for instance, on a firm’s financial status,performance, and ownership structure is now quickerand more accurate. In Korea, firms must provide con-solidated financial statements. In Malaysia, individu-als are restricted to a maximum of ten directorships inpublicly listed companies, and firms are required toprovide quarterly financial statements.
Despite this progress, more efforts are neededto establish a modern legal and regulatory framework,reduce the risk of bureaucratic and corruption-proneadministrative procedures, reform the ownershipstructure of large business groups, adopt modern finan-cial management techniques, and reduce corruption.
Corruption is a serious systemic problem in somecountries. It can involve either monopolistic “cronycapitalist” firms or the rent-seeking bureaucracies thatextract bribes, called rents, in return for licensing privi-leges. Crony capitalist firms are best addressed througha well-designed privatization program. Therent-seeking corruption is more entrenched and moredifficult to eradicate, and ill-planned efforts to do socould increase inefficiency. To mitigate these risks, gov-ernance reforms should be carefully formulated andimplemented. Reforms must take into account acountry’s individual circumstances—its legal, judiciary,

ASIAN DEVELOPMENT OUTLOOK 200036
and civil service systems; regulatory standards; cor-porate governance; and industrial organization—aswell as its capacity to implement changes.
SOLSOLSOLSOLSOLVING PROBLEMS:VING PROBLEMS:VING PROBLEMS:VING PROBLEMS:VING PROBLEMS:THE LTHE LTHE LTHE LTHE LONGER-ONGER-ONGER-ONGER-ONGER-TERM TTERM TTERM TTERM TTERM TASKSASKSASKSASKSASKS
Before the onset of the financial crisis, the region’seconomies enjoyed strong fiscal positions, and budgetsurpluses were the norm. When the crisis first hit, fis-cal policies were kept tight, but that has changed. Allthe crisis-affected countries have spent massive fiscalresources on financial restructuring, including buyingNPLs, recapitalizing insolvent banks, and protectingdepositors and creditors. Public spending also has in-creased to stimulate economic recovery and providesocial safety nets for the poor and vulnerable. Fiscaldeficits have risen substantially and public debt hasaccumulated (see table 1.5 and box 1.7).
Reduce Fiscal ImbalancesReduce Fiscal ImbalancesReduce Fiscal ImbalancesReduce Fiscal ImbalancesReduce Fiscal Imbalances
Debt accumulation was greater in Indonesia,Korea, and Malaysia, where the financial restructuringwas government-led, than in Thailand, which adopteda market-based approach. Indonesia and Thailand,where restructuring is still at a relatively early stage,are likely to suffer large fiscal deficits in 2000 com-pared with precrisis levels. In Korea, Malaysia, and
Philippines, deficits are unlikely to deteriorate furtherif domestic interest rates remain low and economicrecovery continues.
Nonetheless, existing fiscal imbalance must beremedied over the medium term. Otherwise, economicrecovery will be stymied as private investment iscrowded out and debt-servicing requirements impedethe public sector’s infrastructure development. Thus,the countries should place high priority on reducingfiscal imbalances as soon as possible. They could gen-erate additional revenues by privatizing nationalizedbanks and state-owned enterprises, and selling finan-cial assets in the publicly owned AMCs. Attractingmore domestic and foreign private investment intothe ailing financial and corporate sectors also will helpalleviate the fiscal burden. So, too, will more consis-tent efforts to recover defaulted bank loans throughsystematic investigations into corporations’ uses ofsuch loans.
To ensure equitable distribution of therestructuring burden, costs should be allocated toreflect the division of responsibility for the problem.If a financial institution’s problems are due largely togovernment intervention in directing credit toparticular borrowers, then the government should beara larger part of the costs. If, however, banks’ losses arelargely due to their own commercial mistakes, bankshareholders and managers should absorb most ofthe costs.
TTTTTable 1.5 able 1.5 able 1.5 able 1.5 able 1.5 Fiscal Balance Before and After the Crisis:Fiscal Balance Before and After the Crisis:Fiscal Balance Before and After the Crisis:Fiscal Balance Before and After the Crisis:Fiscal Balance Before and After the Crisis:Crisis Countries, 1994-2000Crisis Countries, 1994-2000Crisis Countries, 1994-2000Crisis Countries, 1994-2000Crisis Countries, 1994-2000
(percentage of GDP)
Country 1994 1995 1996 1997 1998 1999 2000
Indonesia 0.4 0.6 0.2 0.0 -3.7 -2.3 -5.0
Korea 0.4 0.3 0.3 -1.5 -4.2 -2.9 -2.8
Malaysia 2.3 0.8 0.7 2.6 -1.5 -3.8 -2.0
Philippines 1.0 0.6 0.3 0.1 -1.8 -3.6 -1.8
Thailand 1.9 3.0 2.4 -0.9 -3.4 -3.0 -3.0
Note: Figures for 1999 and 2000 are staff estimates.
Source: Statistical Appendix.
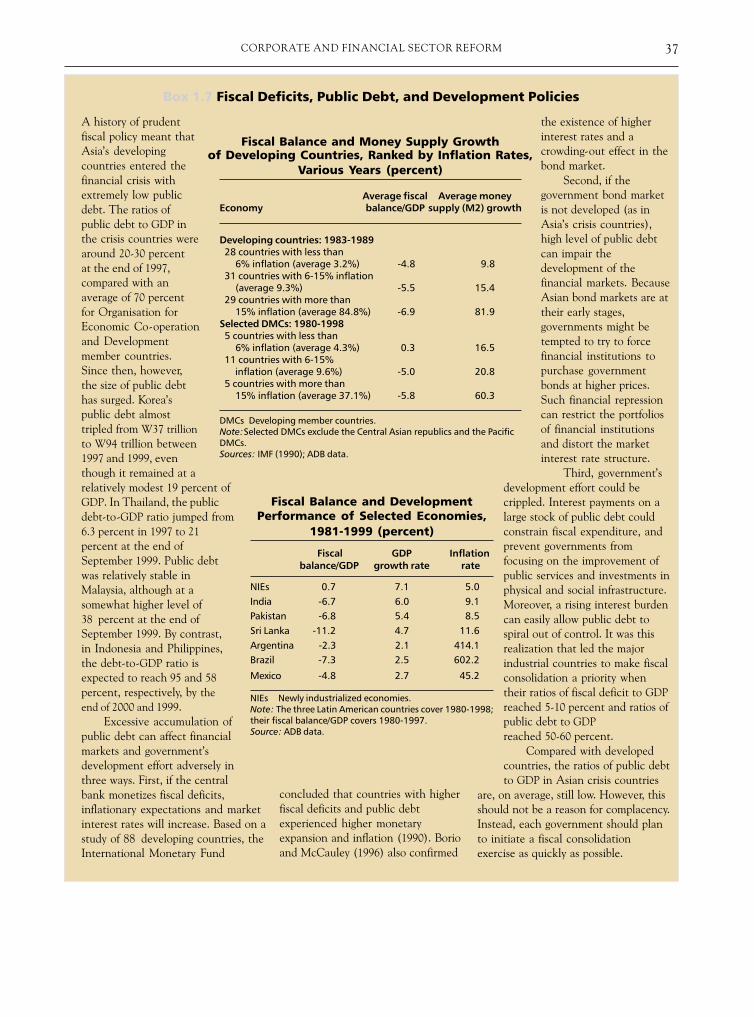
37CORPORATE AND FINANCIAL SECTOR REFORM
A history of prudentfiscal policy meant thatAsia’s developingcountries entered thefinancial crisis withextremely low publicdebt. The ratios ofpublic debt to GDP inthe crisis countries werearound 20-30 percentat the end of 1997,compared with anaverage of 70 percentfor Organisation forEconomic Co-operationand Developmentmember countries.Since then, however,the size of public debthas surged. Korea’spublic debt almosttripled from W37 trillionto W94 trillion between1997 and 1999, eventhough it remained at arelatively modest 19 percent ofGDP. In Thailand, the publicdebt-to-GDP ratio jumped from6.3 percent in 1997 to 21percent at the end ofSeptember 1999. Public debtwas relatively stable inMalaysia, although at asomewhat higher level of38 percent at the end ofSeptember 1999. By contrast,in Indonesia and Philippines,the debt-to-GDP ratio isexpected to reach 95 and 58percent, respectively, by theend of 2000 and 1999.
Excessive accumulation ofpublic debt can affect financialmarkets and government’sdevelopment effort adversely inthree ways. First, if the centralbank monetizes fiscal deficits,inflationary expectations and marketinterest rates will increase. Based on astudy of 88 developing countries, theInternational Monetary Fund
Box 1.7 Fiscal Deficits, Public Debt, and Development Policies
the existence of higherinterest rates and acrowding-out effect in thebond market.
Second, if thegovernment bond marketis not developed (as inAsia’s crisis countries),high level of public debtcan impair thedevelopment of thefinancial markets. BecauseAsian bond markets are attheir early stages,governments might betempted to try to forcefinancial institutions topurchase governmentbonds at higher prices.Such financial repressioncan restrict the portfoliosof financial institutionsand distort the marketinterest rate structure.
Third, government’sdevelopment effort could becrippled. Interest payments on alarge stock of public debt couldconstrain fiscal expenditure, andprevent governments fromfocusing on the improvement ofpublic services and investments inphysical and social infrastructure.Moreover, a rising interest burdencan easily allow public debt tospiral out of control. It was thisrealization that led the majorindustrial countries to make fiscalconsolidation a priority whentheir ratios of fiscal deficit to GDPreached 5-10 percent and ratios ofpublic debt to GDPreached 50-60 percent.
Compared with developedcountries, the ratios of public debtto GDP in Asian crisis countries
are, on average, still low. However, thisshould not be a reason for complacency.Instead, each government should planto initiate a fiscal consolidationexercise as quickly as possible.
concluded that countries with higherfiscal deficits and public debtexperienced higher monetaryexpansion and inflation (1990). Borioand McCauley (1996) also confirmed
Fiscal Balance and Money Supply Growthof Developing Countries, Ranked by Inflation Rates,
Various Years (percent)
Average fiscal Average moneyEconomy balance/GDP supply (M2) growth
Developing countries: 1983-198928 countries with less than 6% inflation (average 3.2%) -4.8 9.831 countries with 6-15% inflation (average 9.3%) -5.5 15.429 countries with more than 15% inflation (average 84.8%) -6.9 81.9
Selected DMCs: 1980-19985 countries with less than 6% inflation (average 4.3%) 0.3 16.511 countries with 6-15% inflation (average 9.6%) -5.0 20.85 countries with more than 15% inflation (average 37.1%) -5.8 60.3
DMCs Developing member countries.Note:Selected DMCs exclude the Central Asian republics and the PacificDMCs.Sources: IMF (1990); ADB data.
Fiscal Balance and DevelopmentPerformance of Selected Economies,
1981-1999 (percent)
Fiscal GDP Inflationbalance/GDP growth rate rate
NIEs 0.7 7.1 5.0India -6.7 6.0 9.1Pakistan -6.8 5.4 8.5Sri Lanka -11.2 4.7 11.6Argentina -2.3 2.1 414.1Brazil -7.3 2.5 602.2
Mexico -4.8 2.7 45.2
NIEs Newly industrialized economies.Note: The three Latin American countries cover 1980-1998;their fiscal balance/GDP covers 1980-1997.Source: ADB data.

ASIAN DEVELOPMENT OUTLOOK 200038
DevelopDevelopDevelopDevelopDevelop FinancialFinancialFinancialFinancialFinancial MarketsMarketsMarketsMarketsMarkets
It is generally agreed that one of the major causes ofthe region’s financial crisis was excessive reliance onshort-term bank loans from abroad to facilitate long-term investments at home and abroad. Asian financehas traditionally been overwhelmingly bank-based,and that must change (see figure 1.10). An importantlesson from the crisis is that it is urgent to developdomestic financial markets that can efficiently allo-cate domestic savings to long-term projects. There-fore, the crisis countries need to modernize anddevelop their capital markets, particularly bond mar-kets, and maximize the efficiency with which long-term savings are channeled into profitable industrialand infrastructure projects.
A financial sector development strategy is a use-ful way to prepare for this kind of fundamental change.The strategy should aim to ensure greater diversifica-
tion and market orientation in the financial sector byincreasing operational efficiency, developing humanresources, maximizing synergy between various sub-sectors, and facilitating resource mobilization. It shouldcover the banking sector, nonbank credit institutions,insurance sector, capital markets, and newer financialinstitutions such as venture capital entities. Thailandhas begun working on a long-term blueprint for thestructure of the overall financial sector.
All types of long-term financial markets—equity, bond, and insurance—need to be fostered.However, bond markets deserve particular attentionbecause they have long been neglected, while effortsat developing equity markets began long before thecrisis. Bond markets were underdeveloped for severalreasons: persistent government surpluses meant thatthe region’s countries had little, if any, outstandinggovernment debt. Therefore, there was no benchmarkyield curve of returns on safe government debt, mak-
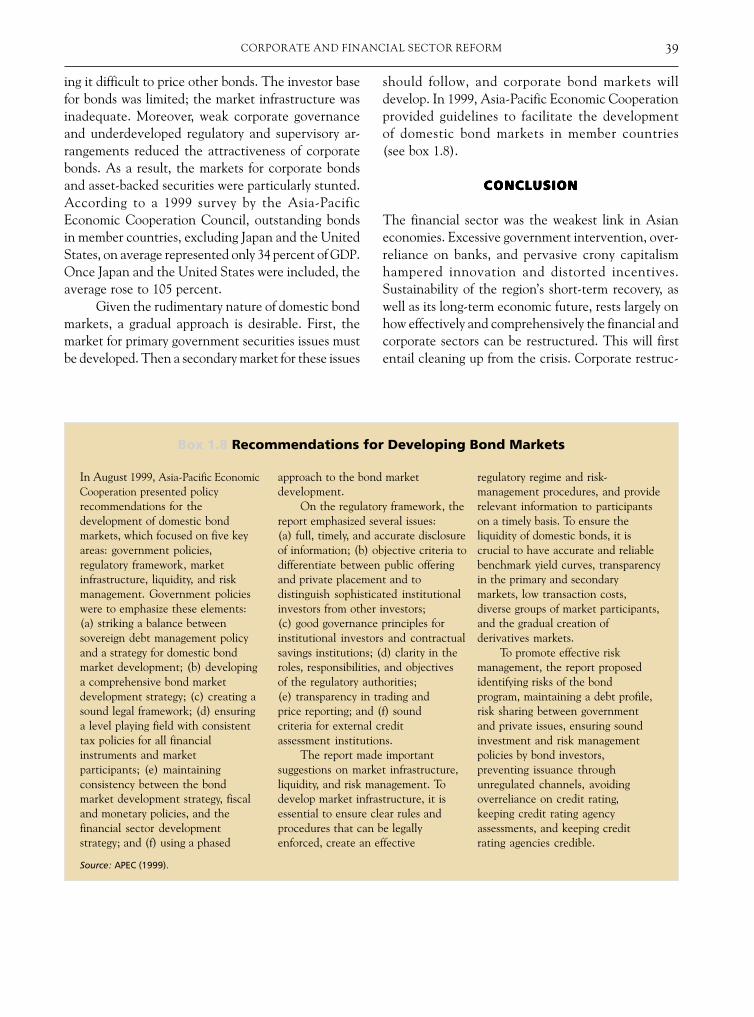
39CORPORATE AND FINANCIAL SECTOR REFORM
In August 1999, Asia-Pacific EconomicCooperation presented policyrecommendations for thedevelopment of domestic bondmarkets, which focused on five keyareas: government policies,regulatory framework, marketinfrastructure, liquidity, and riskmanagement. Government policieswere to emphasize these elements:(a) striking a balance betweensovereign debt management policyand a strategy for domestic bondmarket development; (b) developinga comprehensive bond marketdevelopment strategy; (c) creating asound legal framework; (d) ensuringa level playing field with consistenttax policies for all financialinstruments and marketparticipants; (e) maintainingconsistency between the bondmarket development strategy, fiscaland monetary policies, and thefinancial sector developmentstrategy; and (f) using a phased
approach to the bond marketdevelopment.
On the regulatory framework, thereport emphasized several issues:(a) full, timely, and accurate disclosureof information; (b) objective criteria todifferentiate between public offeringand private placement and todistinguish sophisticated institutionalinvestors from other investors;(c) good governance principles forinstitutional investors and contractualsavings institutions; (d) clarity in theroles, responsibilities, and objectivesof the regulatory authorities;(e) transparency in trading andprice reporting; and (f) soundcriteria for external creditassessment institutions.
The report made importantsuggestions on market infrastructure,liquidity, and risk management. Todevelop market infrastructure, it isessential to ensure clear rules andprocedures that can be legallyenforced, create an effective
regulatory regime and risk-management procedures, and providerelevant information to participantson a timely basis. To ensure theliquidity of domestic bonds, it iscrucial to have accurate and reliablebenchmark yield curves, transparencyin the primary and secondarymarkets, low transaction costs,diverse groups of market participants,and the gradual creation ofderivatives markets.
To promote effective riskmanagement, the report proposedidentifying risks of the bondprogram, maintaining a debt profile,risk sharing between governmentand private issues, ensuring soundinvestment and risk managementpolicies by bond investors,preventing issuance throughunregulated channels, avoidingoverreliance on credit rating,keeping credit rating agencyassessments, and keeping creditrating agencies credible.
Box 1.8 Recommendations for Developing Bond Markets
Source: APEC (1999).
ing it difficult to price other bonds. The investor basefor bonds was limited; the market infrastructure wasinadequate. Moreover, weak corporate governanceand underdeveloped regulatory and supervisory ar-rangements reduced the attractiveness of corporatebonds. As a result, the markets for corporate bondsand asset-backed securities were particularly stunted.According to a 1999 survey by the Asia-PacificEconomic Cooperation Council, outstanding bondsin member countries, excluding Japan and the UnitedStates, on average represented only 34 percent of GDP.Once Japan and the United States were included, theaverage rose to 105 percent.
Given the rudimentary nature of domestic bondmarkets, a gradual approach is desirable. First, themarket for primary government securities issues mustbe developed. Then a secondary market for these issues
should follow, and corporate bond markets willdevelop. In 1999, Asia-Pacific Economic Cooperationprovided guidelines to facilitate the developmentof domestic bond markets in member countries(see box 1.8).
CONCLCONCLCONCLCONCLCONCLUSIONUSIONUSIONUSIONUSION
The financial sector was the weakest link in Asianeconomies. Excessive government intervention, over-reliance on banks, and pervasive crony capitalismhampered innovation and distorted incentives.Sustainability of the region’s short-term recovery, aswell as its long-term economic future, rests largely onhow effectively and comprehensively the financial andcorporate sectors can be restructured. This will firstentail cleaning up from the crisis. Corporate restruc-

ASIAN DEVELOPMENT OUTLOOK 200040
turing, especially, must be accelerated, whilenonperforming assets must be disposed of. At the sametime, the crisis countries must pay more attention tothe foundations of their future financial system. A 21stcentury financial system requires a different role forgovernment. The public sector can and must play animportant role in overcoming coordination failures and
setting regulatory standards, but it should not becomedirectly involved in allocating capital. A diverse andlargely private financial system within a well-constructed regulatory and supervisory frameworkallocates resources most efficiently and safely. Theregion’s prosperity depends on how quickly and effec-tively such a financial system can be created.

43NEWLY INDUSTRIALIZED ECONOMIES
Hong KHong KHong KHong KHong Kong, Chinaong, Chinaong, Chinaong, Chinaong, China
The economy of Hong Kong, China has begun to recover from its severest recession in recent decades.It must now focus on meeting new challenges, including stimulating investment, cleaning up theenvironment, and shifting resources into the information technology industry.
RECENT TRENDS AND PROSPECTSRECENT TRENDS AND PROSPECTSRECENT TRENDS AND PROSPECTSRECENT TRENDS AND PROSPECTSRECENT TRENDS AND PROSPECTS
AAAAA fter contracting by 5.1 percent in 1998, theHong Kong, China economy grew at 2.9 percent
in real terms in 1999. Increased private consumption,higher government spending, and increased exportscontributed to this growth. Domestic investment, how-ever, was even weaker than in 1998, a result of highreal interest rates and an uncertain business outlook.Prices continued to fall and the composite consumerprice index registered a decline of 4 percent in 1999.Fierce price competition, flat rental prices, and a freezein government fees and most public utility chargescontributed to the sustained fall in the consumer priceindex. Other contributors were weak world commod-ity prices (except for fuel), a strong US dollar, and de-flation in the People’s Republic of China (PRC), all ofwhich kept imported inflation at bay.
Hong Kong, China’s economic recovery startedin the second quarter of 1999, after six consecutivequarters of decline. Increased private consumption andan improved trade balance contributed to the turn-around. The recovery was reinforced by clear signs of
economic revival in neighboring economies, whichalso contributed to a recovery in local asset markets.Total stock market capitalization increased by77.6 percent during 1999 and the Hang Seng Indexreached a postcrisis peak level of around 17,000 inlate December 1999, almost 2.5 times the level justbefore the government’s stock market intervention inAugust 1998.
Recovery in the property market was mainly re-flected in the increased volume of spending duringthe first half of the year. This can be attributed to theannouncement of favorable fiscal measures; resump-tion of land auctions with good results; and relaxationof banks’ mortgage policies, including decreased in-terest rates. The surge, however, was partly reversedby the rise in nominal interest rates in August, follow-ing a rise in US rates. Property prices themselves endedup about 50 percent lower than their peak levels be-fore the 1997 crisis.
In external accounts, the merchandise tradedeficit continued to narrow and the services surpluscontinued to expand. Total merchandise exports de-clined marginally by 0.1 percent in US dollar terms,

ASIAN DEVELOPMENT OUTLOOK 200044
TTTTTable 2.1 able 2.1 able 2.1 able 2.1 able 2.1 Major Economic Indicators, Hong K Major Economic Indicators, Hong K Major Economic Indicators, Hong K Major Economic Indicators, Hong K Major Economic Indicators, Hong Kong, China, 1997-2001ong, China, 1997-2001ong, China, 1997-2001ong, China, 1997-2001ong, China, 1997-2001(percent)
Item 1997 1998 1999 2000 2001
Gross domestic product growth 5.0 -5.1 2.9 5.0 5.5
Gross domestic investment/GDP 34.6 29.7 25.4 27.3 34.0
Gross domestic savings/GDP 31.1 30.2 29.8 30.7 32.0
Inflation rate 5.8 2.8 -4.0 -1.0 3.1
Central government budget 6.6 -1.8 -0.1 -0.5 1.0
Money supply (M2) growth 8.3 11.8 8.1 12.0 15.0
Merchandise exports growth 4.0 -7.5 -0.1 9.1 10.0
Merchandise imports growth 5.1 -11.6 -2.7 10.7 11.0
Service exports growth 0.6 -10.4 2.6 9.1 9.7
Service imports growth 5.4 -2.1 -1.6 6.0 8.1
Sources: Government of Hong Kong Special Administrative Region; staff estimates.
while total merchandise imports declined by 2.7 per-cent in 1999, and the trade deficit fell to HK$46.5billion (US$6 billion) from HK$84.8 billion (US$10.9billion) in 1998. Estimates indicate that in 1999 theservices surplus in current prices was aroundHK$100.7 billion (US$13 billion), an increase ofHK$9.8 billion (US$1.3 billion) over the previous year.The major impetus for the rebound in export perfor-mance was re-exports to other Asian countries, es-pecially Indonesia, Japan, Korea, and Singapore,where import demand strengthened as the region’seconomies revived. However, domestic exports re-mained sluggish in the face of stiff price competition.
Following the increase in export growth in thePRC in the third quarter, re-exports rose 7 percentand 12 percent, respectively, in the third and finalquarters of 1999. The export of services, which sufferedseverely in 1998, rebounded by 2.6 percent in US dol-lar terms in 1999. Tourism rebounded, with 11.5 per-cent more arrivals. Visitors from the PRC andTaipei,China continued to be the most importantsources of tourism growth, accounting for almost 50percent of arrivals. The number of visitors from otherAsian countries also increased, especially from South-east Asia, including Japan, whose tourist numbers had
decreased sharply in 1998 because of the financialcrisis. However, despite the increased volume of busi-ness, total receipts suffered a mild decline as a resultof the fall in prices.
Stronger deflationary pressures partly reversedsome of the stimulating effects of nominal interest ratecuts, which returned to precrisis levels. Domestic in-vestment, particularly in the private sector, contractedmore sharply in 1999 than in 1998, and investment inplants and machinery declined more than investmentin building and construction. Completion of some ma-jor public projects also contributed to the lack of acompensating rise in public sector investment.
With an uncertain business outlook and highreal interest rates, total loan demand continued to beweak. Moreover, the banking sector experienced prob-lem loans, partly because of exposure to some troubledPRC enterprises, such as Guangdong InternationalTrust and Investment Corporation. Largely reflectinga decline in total loans, the ratio of classified loans tototal loans rose to 10 percent. This prompted somebanks to increase provisions for bad loans, which af-fected profitability, and to adopt a more cautious lend-ing stance. Nevertheless, banks’ asset quality stabilizedin the third quarter of 1999 and the sector’s capital

45NEWLY INDUSTRIALIZED ECONOMIES
adequacy ratio remained at a healthy level, averaging20.1 percent.
Reducing unemployment is another challengefor policymakers. Although the unemployment ratestabilized around 6 percent, it was high compared witha precrisis level of 3 percent, and was exacerbated bythe continued strong growth of the labor force. For1999, total employment increased 1.8 percent. How-ever, the labor force rose 3.5 percent because of strongimmigration, particularly from the PRC, and an in-crease in the number of women in the labor force.
Nevertheless, the prospects for employmentshould improve as economic recovery broadens in2000. GDP growth is forecast to rise to 5 percent in2000 and 5.5 percent in 2001. The external sectorshould continue to improve along with the region’seconomies. This will be aided, to some extent, by ad-ditional tourist revenue from a planned Disney themepark. With more infrastructure projects planned, do-mestic fixed capital formation will start to increase inthe next two years. The conventional measures of realinterest rates are expected to peak in mid-2000, withthe easing of deflationary pressures. Imports will in-crease as well, with the visible trade deficit worseningin the coming years.
The prospects of Hong Kong, China as anentrepot for the PRC may wane as the PRC developsits own container and port facilities. However, theprojected entry of the PRC into the World TradeOrganization in the near future is expected to presentnew opportunities, including stronger re-exports fromthe PRC as well as closer trade linkages.
ISISISISISSUES IN ECONOMIC MANAGEMENTSUES IN ECONOMIC MANAGEMENTSUES IN ECONOMIC MANAGEMENTSUES IN ECONOMIC MANAGEMENTSUES IN ECONOMIC MANAGEMENT
A severely contracting economy combined withmeasures aimed at stimulating spending led to fiscaldeficits of 1.8 percent and 0.1 percent of GDP in 1998and 1999, respectively. A deficit is also expected for2000. Authorities maintain that the budget will becyclically balanced, with a surplus expected in 2001.A number of infrastructure projects with total outlayof more than HK$65 billion (US$8.4 billion) are sched-uled to start in 2000. Therefore, whether the govern-ment can return its budget to a surplus will depend onits success in finding new ways to raise revenues, asidefrom the natural increase as the economy recovers.
The government has accumulated huge fiscal reservesover the years. Even with the deficits recorded in thelast two years, these reserves stood at HK$390 billion(US$50.3 billion) at the end of 1999, and give authori-ties some latitude in fiscal matters.
High real interest rates have been of greaterconcern. While nominal interest rates declined formuch of 1999 and were well below the peaks reachedin 1998, observers have blamed falling prices for push-ing real interest rates to their highest levels in morethan a decade. Moreover, because the linked exchangerate system forces nominal interest rates to followclosely those in the United States, an anticipated tight-ening of the US Federal Reserve’s monetary policy maykeep private investment at its currently subdued lev-els and hamper the pace of economic recovery.
To some extent, the concern regarding high realinterest rates results from how they are typically com-puted, by adjusting nominal interest rates using ac-tual rates of inflation, rather than the conceptuallysuperior expected rate of inflation. However, the pro-cess of deflation is not a downward spiral of pricesand production, but rather part of an adjustment pro-cess required to make an economy that uses a fixedexchange rate more competitive. Therefore true realinterest rates are probably not as high as conventionalmeasures suggest. While prices have been falling, theyshould cease to do so during the first half of 2000, andinvestors will take this into account.
Moreover, with the region registering a sustainedrecovery, business confidence is likely to return to morerobust levels. How robust a recovery the economycan stage, however, will depend on how well it canrestructure itself to enhance competitiveness as a fi-nancial and business center to the PRC, and to theregion as a whole.
To facilitate this restructuring, the governmenthas focused its policies not just on macroeconomicmanagement, but also on microeconomic reforms. Inparticular, the government has taken steps to removeexisting barriers to entry and price controls in the tele-communications and banking sectors. Liberalizing theinternational calls market in January 1999 and imple-menting mobile phone number portability in March1999 saw an increased number of suppliers and fiercecompetition for market shares through better orcheaper services.

ASIAN DEVELOPMENT OUTLOOK 200046
Following the completion of the Banking Sec-tor Consultancy Study in December 1998 and consid-ering the views expressed during a public consultationin early 1999, the Hong Kong Monetary Authoritydeveloped a coherent package of policy initiatives toreform and further develop the banking sector. Re-forms involve deregulating the remaining interest raterules, relaxing the one-branch policy, implementing aformalized risk-based supervisory approach, simplify-ing the three-tier licensing system, conducting a fullstudy on deposit protection, and evaluating the feasi-bility of a credit register for commercial enterprises.The July 1999 announcement allowed foreign bankslicensed after 1978 to open as many as three branches.The first phase of interest rate deregulation is sched-uled for July 2000, while the review of local bank li-censing requirements will be undertaken toward thesecond half of 2001. Consolidation, in the form ofmergers and acquisitions, is also being encouraged toenhance efficiency through exploiting economies ofscale, eliminating redundancies, and using joint fund-ing for investments in new technology.
With the advent of the digital age and the rapidglobal expansion of the Internet, electronic bankingoffers new products and services, such as multipur-pose stored-value cards and banking services via mo-bile phone or the Internet. However, while theseelectronic commercial channels offer more conve-nience, they also pose new risks, such as theft, fraud,or alteration of information by unauthorized accessvia digital means. Law enforcement is particularly dif-ficult in cases involving cross-border activities. Exist-ing legislation must be amended quickly to provide aprudential supervisory framework for these new finan-cial activities.
In view of the overdependence on the local eq-uity market and banking sector for long-term fund-ing, the Hong Kong Monetary Authority also steppedup its efforts to enhance capital market development.These include developing mortgage-backed securitiessince 1997 and listing Exchange Fund Notes on thelocal stock exchange in August 1999. In addition, themerger of the Hong Kong Stock and Futures exchangesand the implementation of the Mandatory ProvidentFund will occur in 2000. Thus, the financial sector isexpected to expand in 2000-2001, after almost threeyears of consolidation. Successfully implementing
these financial sector reforms will be critical in main-taining Hong Kong, China as a major regional finan-cial center, especially as reforms are also under way inother Asian cities such as Singapore and Shanghai.
POLICY AND DEVELPOLICY AND DEVELPOLICY AND DEVELPOLICY AND DEVELPOLICY AND DEVELOPMENT ISOPMENT ISOPMENT ISOPMENT ISOPMENT ISSUESSUESSUESSUESSUES
The continued relocation of manufacturing industriesto the PRC and the slowdown in major service sectorsbecause of the Asian financial turmoil prompted thegovernment to take more initiatives to develophigh-value-added and high-tech industries. A stringof projects and research funding have emerged. Be-sides the Science Park currently under construction,other ambitious projects include a HK$13 billionCyberport and the HK$9.3 billion Silicon Harbor, bothto be jointly developed with private sector initiativeand involvement. The government’s assistance willinvolve providing research funding and housing sub-sidies for overseas staff, and granting land at asubsidized rate.
While in the past high-tech industries were con-sidered unduly risky due to their high overhead costs,uncertain demand, and long gestation periods, em-phasis on the information technology (IT) industry isbeing embraced more widely. This is because the ITindustry could complement traditional areas ofstrength, such as finance and trade services. Conse-quently, banks, property developers, real estate agents,and trading companies are among the first to endorsean IT-based industrial policy.
Development of the IT industry is also being em-braced more readily because telecommunications, thebasic infrastructure for IT, is well developed and amongthe best in the world. For example, in terms of tele-phone lines per household, mobile phones per per-son, and Internet penetration rates, Hong Kong, Chinais among the most advanced in the region.
The establishment of the Growth EnterpriseMarket (GEM) is in line with such industrial develop-ment. The strong performance of Internet stocks inthe United States, especially on the NASDAQ, pro-vided the incentive for technology ventures to attemptto list in Hong Kong, China. Technology companiesdominated the first listings on the GEM in November.Most of these startups were small and medium-sizeenterprises that lacked the good track record or

47NEWLY INDUSTRIALIZED ECONOMIES
substantial assets necessary to obtain funds from banksor list on the main board of the stock market. Thegovernment set up the Special Finance Scheme forthese enterprises in August, and had committedaround HK$4.8 billion.
However, the GEM is a more attractive sourceof funding as it provides a bigger investor base andstronger growth potential. The smaller size of theseGEM stock issues, however, will imply higher risk ofprice fluctuations, and hence of speculation. The an-nouncement that some big US technology stocks maybe listed on the GEM in 2000 has further boostedlocal confidence in this new second board. In addi-tion, some larger local enterprises are setting up sub-sidiaries to capture this rising wave of positivesentiment. Although the results are not yet clear, theavailability of such channels for funding and expan-sion is a strong incentive for developing companieswith strong IT connections.
With hardware manufacturing centered in thePRC, Hong Kong, China’s IT industries will need tofocus on the design, marketing, and application of thelatest technological tools for the production, distri-bution, and consumption of information. To succeed,a steady supply of highly skilled workers will need tobe ensured. This can be achieved through improvingand extending tertiary education facilities. While ap-propriate investment in education is critical, keepingHong Kong, China attractive for professionals fromthe PRC and elsewhere will also be important.
To this end, Hong Kong, China needs to improvethe overall living environment, which will necessitatea more comprehensive and effective environmentalpolicy. Not only will this help attract the best profes-sionals from around the world, but it is also of vitalinterest to the local populace. The worsening of vari-ous forms of pollution in recent years has generatedincreasing concern regarding health risks. This has far-reaching implications for rising public health costs aswell as lower productivity. The negative impact ontourism serves as a good warning. With the global trend
toward greater demand for better environmental stan-dards, it is critical to incorporate environmental is-sues into any long-term development strategy.
The first significant environmental policy wasformed in 1989 with a ten-year plan to fight air,water, noise, and waste pollution. In 1998, theEnvironmental Impact Assessment Ordinance wasimplemented to give more legislative power to theEnvironmental Protection Department. In addition,separate ordinances govern air and water pollutioncontrol, noise control, and waste disposal. The au-thorities have undertaken various forms of control,including requiring licenses and permits for industrialpollution. In 1990, the Hong Kong-GuangdongEnvironmental Protection Liaison Group was estab-lished to facilitate regional pollution control. A jointstudy of air pollution in the Pearl River Delta wasundertaken with the Guangdong authorities and willbe completed in 2000. However, most of the problemlies in enforcement, which is hindered by low penaltyrates for offenders.
The launching of an air pollution index in 1995improved public awareness of air pollution levels, andhigh levels of this index prompted the government torequire all diesel-powered taxis to change to liquidpetroleum gas by 2005. Improper waste disposal alsohas worsened as the dumping of household garbageand construction waste has increased, resulting in ris-ing collection and disposal costs for the government.The recycling industry has seen limited success be-cause of high land costs, low profit margins, and thelack of community cooperation.
Eventually the private sector will develop theIT industry, and market forces will shape it. Butbecause of the substantial long-term benefits of aneffective environmental protection policy, it is criticalthat the government spend more resources inenforcement and education to maintain competitive-ness as a regional commercial hub and an interna-tional city.

ASIAN DEVELOPMENT OUTLOOK 200048
Republic of KRepublic of KRepublic of KRepublic of KRepublic of Koreaoreaoreaoreaorea
Economic recovery and financial stabilization in the Republic of Korea (henceforth referred to asKorea) in 1999 were remarkable. Mitigating the adverse impacts of these changes on the fiscal posi-tion and labor market, however, is an essential challenge for stable and sustainable economic growth.
RECENT TRENDS AND PROSPECTSRECENT TRENDS AND PROSPECTSRECENT TRENDS AND PROSPECTSRECENT TRENDS AND PROSPECTSRECENT TRENDS AND PROSPECTS
AAAAAfter resorting to a rescue package led by theInternational Monetary Fund, Korea recovered
at a brisk pace in 1999. Aided by ongoing financialand corporate sector restructuring and a favorableexport environment, the GDP growth rate reached10.7 percent. It stood in sharp contrast with –6.7 per-cent in 1998, and was the highest recorded growthsince 1988.
On the production side, the manufacturing sec-tor led the recovery of the economy. On the demandside, the rapid rebounding of private consumption andmachinery and equipment investment contributed tothe recovery, along with a slower pace of inventoryreduction. However, construction continued to con-tract and net exports slowed economic growth. Ow-ing to the economic recovery, the unemployment ratedeclined to 4.8 percent by December 1999, after peak-ing at 8.6 percent in February 1999.
Despite expansionary economic policy and rapideconomic recovery, prices were extremely stable. Theinflation rate dropped from 7.5 percent in 1998 to
0.8 percent in 1999, the lowest level in recent history.The appreciation of the won has significantly contrib-uted to this price stability.
The financial conditions of the economy haveimproved dramatically. First, the level of foreign ex-change reserves increased rapidly. In 1998 domesticdemand abruptly collapsed as interest rates increasedand the current account recorded a $41 billion sur-plus. This surplus greatly contributed to the rapidaccumulation of foreign exchange reserves, from lessthan $10 billion at the end of 1997 to more than$74 billion at the end of 1999. As foreign exchangereserves increased, the exchange rate stabilized toaround W1,150 to the dollar by December 1999.
Aided by the appreciation of the Japanese yenand the recovery in Asian markets, export perfor-mance improved in 1999. Heavy and chemical indus-tries, particularly electronics, led the export recovery.While exports increased by 10 percent, imports grewmore rapidly by 29 percent because of a recovery indomestic demand. This led to the decline in the tradeaccount surplus from $42 billion in 1998 to $29 billionin 1999, or 7 percent of GDP.

49NEWLY INDUSTRIALIZED ECONOMIES
TTTTTable 2.2able 2.2able 2.2able 2.2able 2.2 Major Economic Indicators, Republic of KMajor Economic Indicators, Republic of KMajor Economic Indicators, Republic of KMajor Economic Indicators, Republic of KMajor Economic Indicators, Republic of Korea, 1997-2001orea, 1997-2001orea, 1997-2001orea, 1997-2001orea, 1997-2001(percent)
Item 1997 1998 1999 2000 2001
GDP growth 5.0 -6.7 10.7 7.5 6.0
Gross domestic investment/GDP 34.2 21.2 26.8 28.5 27.2
Gross domestic savings/GDP 32.5 33.9 33.0 30.9 27.9
Inflation rate (consumer price index) 4.5 7.5 0.8 3.2 3.2
Money supply (M2) growth 14.1 27.0 27.3 24.8 21.5
Fiscal balance/GDP -1.5 -4.2 -2.9 -2.8 -2.6
Merchandise exports growth 6.7 -4.7 10.1 10.0 7.4
Merchandise imports growth -2.2 -36.2 29.0 23.1 14.3
Current account balance/GDP -1.7 12.8 6.1 2.4 0.8
Sources: National Statistical Office (1999); Bank of Korea; Korea Development Institute; Ministry of Finance and Economy; staff estimates.
In addition to the decline in the trade surplus,the deficit in the nontrade account, including suchitems as service and interest payments, widened from$1 billion in 1998 to around $4 billion in 1999. Con-sequently, the current account surplus decreased from$41 billion in 1998 (13 percent of GDP) to $25 billionin 1999 (6 percent of GDP). The capital accountshowed a surplus of $0.6 billion, despite the repay-ment of the International Monetary Fund emergencyloan of $11 billion. Thus, there was a large net surplusin private sector inflows. Korea had net inflow fornondebt instruments such as foreign direct investmentand equity investment in 1999, a likely result of thepolicy that pushed the large conglomerates (chaebols)to reduce their debt-to-equity ratios.
The government maintained the expansionarymacroeconomic policies it adopted in mid-1998 tostimulate the economy. The government expendituresin 1999 were initially planned to increase by 5-6 per-cent from 1998, with the expectation of an overallfiscal deficit of 5 percent of GDP. Actual governmentexpenditures increased 10 percent above the 1998level, which had already risen by 13.5 percent from1997. Nevertheless, the rapid recovery and growingtax revenues enabled the government to reduce thefiscal deficit to less than 3 percent of GDP.
To aid economic recovery, the central bank low-ered short-term interest rates until May 1999. By thenthe economy had begun to gather considerable mo-mentum and the central bank decided to halt lower-ing of interest rates. The call rate was kept below 5percent for the rest of the year.
Despite the remarkable recovery in 1999, sus-tainable economic growth for the years to come willrequire significant economic restructuring, particularlyin the financial and corporate sectors. Economicgrowth in 2000 is projected to be 7.5 percent. Fixedinvestment will provide the major stimulus, while thecontribution of consumption and foreign trade will de-cline somewhat. Continued economic recovery shouldprovide a favorable environment for business invest-ment. In tandem with continued economic recovery,labor market conditions are expected to tightenslightly. The unemployment rate is projected to fall to5 percent, down from 6.3 percent in 1999.
Despite strong price stability in 1999, the rapideconomic recovery and increased liquidity arising fromfinancial restructuring are likely to trigger inflation-ary pressure in the second half of 2000. Consequently,somewhat tighter monetary policy will be called for,and short-term interest rates are likely to be increased.However, the monetary authorities will be cautious in

ASIAN DEVELOPMENT OUTLOOK 200050
raising short-term interest rates because of concernabout adverse consequences of higher rates on theDaewoo crisis and on the liquidity shortages of in-vestment trust companies. On the supply side, nomi-nal wage growth accelerated in 1999, while domesticcurrency appreciation was minimal. Given these de-velopments, consumer price inflation is projected toaccelerate to 3.2 percent in 2000 and 2001.
Exports will continue to grow in 2000 as worldeconomic growth is expected to increase in terms ofboth output and trade. Import prices will continue torise more rapidly than export prices because of higheroil prices and the yen appreciation. Therefore, im-port growth in dollar terms will expand faster thanexports and the current account surplus will shrinkfurther.
ISISISISISSUES IN ECONOMIC MANAGEMENTSUES IN ECONOMIC MANAGEMENTSUES IN ECONOMIC MANAGEMENTSUES IN ECONOMIC MANAGEMENTSUES IN ECONOMIC MANAGEMENT
Until the outbreak of the crisis in 1997, the govern-ment had long maintained a balanced budget tradi-tion. Operating from this foundation of fiscalprudence, the government could play a pivotal role inhelping the economy recover from the crisis. In par-ticular, the government allocated funds for financialrestructuring and recapitalization, strengthened socialsafety nets, and boosted the economy. Because of thegovernment’s active involvement in restructuring, sta-bility of the financial system has been restored andthe economy is recovering.
The cost of this intervention has increased gov-ernment debt. The central government debt was lessthan W50 trillion (around 11 percent of GDP) beforethe crisis. However, with a budget deficit of aroundW15 trillion for two consecutive years, governmentdebt nearly doubled to around W94 trillion by the endof 1999. The government also will have to pay inter-est for W64 trillion in government-guaranteed publicbonds issued to underwrite the financial sector restruc-turing. This will result in interest payments that willamount to 4.5 percent of the consolidated current ex-penditures from 1999 onward.
Faced with the explosive increase of debt burden,in January 1999 the government announced a medium-term fiscal plan for a balanced budget. According tothis plan, the consolidated budget balance is expectedto be restored by 2004.
However, fiscal consolidation faces manyobstacles. First, the interest payment for the govern-ment’s own and guaranteed debts will reach W8 tril-lion to W10 trillion (almost 7 percent of governmentexpenditure) in 2001-2002. Another serious constraintis the sharp increase in the social welfare budget. Inparticular, the newly enacted Law for Basic LifeProtection will substantially reduce the flexibility ofgovernment expenditure. This law, which will takeeffect in October 2000, allows any poor person toclaim payments from the government, regardless ofability to work. The deficit in the pension fund forgovernment officials will inevitably increase. Accord-ing to some projections, this fund will be depleted in2001, and the deficit will increase substantially. Tominimize the subsidy for the fund, reforms need tobe instituted promptly to improve the fund manage-ment and strike a balance between burden and benefitfor subscribers.
Perhaps last, but not least, an important obstacleto fiscal consolidation is the laxity of fiscal discipline.As Korea went through the crisis, its balanced budgettradition was compromised, and it may be difficult torestore. Both policymakers and the public may nowtake having a budget deficit for granted. Therefore,achieving a strong consensus on the importance ofgovernment budget consolidation is critical.
POLICY AND DEVELPOLICY AND DEVELPOLICY AND DEVELPOLICY AND DEVELPOLICY AND DEVELOPMENT ISOPMENT ISOPMENT ISOPMENT ISOPMENT ISSUESSUESSUESSUESSUES
Unemployment, which grew substantially during thecrisis, requires new policy initiatives. The unemploy-ment rate jumped from 2.6 percent in 1997 to 6.8 per-cent in 1998, and peaked at 8.6 percent in February1999. Although it slowly settled to below 5 percent bythe end of 1999, the rate was still high compared withthe precrisis level. This can be explained not only bymacroeconomic factors such as severe postcrisis re-cession and massive corporate bankruptcies, but alsoby structural changes in the labor market.
Indeed, Korea’s postcrisis reform package in-cludes measures to improve labor market flexibilitywhile expanding the social safety net. In particular,layoffs due to managerial prerogatives were legally in-stituted in the new labor law in 1998, while the un-employment insurance system was extended to covermore workers and increase the amount and duration
51NEWLY INDUSTRIALIZED ECONOMIES
of unemployment benefits. Improved corporategovernance and strengthened risk management in thefinancial sector discourage reckless business expan-sion and tend to lower potential economic excesses.Furthermore, economic liberalization and opening upthe economy will significantly enhance competitionin both product and factor markets. In the short run,the move away from a lifetime employment systemmay exacerbate unemployment, but the long-termeffects on economic efficiency and labor market flex-ibility should be beneficial.
The composition of unemployment changedduring 1998-1999 as economic restructuring tookplace. Despite a continuous decline in the unemploy-ment rate in 1999, long-term displaced workers (thosejobless for more than one year) accounted for morethan 15 percent of total unemployment, up from 11percent in 1998. Unskilled production and construc-tion workers with little education also accounted fora substantial number of displaced workers during thesetwo years. Without effective vocational training, theseworkers will have difficulty re-entering the labor mar-ket. The ratio of regular workers to temporary anddaily workers, however, changed from 55:45 in the firstquarter of 1998 to 47:53 in the fourth quarter of 1999,indicating improved labor market flexibility.
These projections imply that increased structuralunemployment must be addressed not only at theactive labor policy level, but also at the institutionallevel. Several policy measures can ease structuralunemployment.
First, labor market flexibility needs furtherimprovement. Although layoffs were legally institutedin 1998, new and more flexible labor practices maytake time to implement fully, as Korea has a longhistory of lifetime employment. The government
should continue to reinforce market principles bystrictly enforcing legal standards for disruptive laborpractices, including strikes. On an institutional level,adjustable working hours can provide greater employ-ment flexibility and reduce overtime payments. Thiscould cut labor costs and expand employment.
Second, product market competition needs tobe promoted to make the factor market more com-petitive. Comprehensive deregulation was pursuedafter the crisis by eliminating or relaxing about half ofcentral government regulations. This should be ac-celerated, focusing on barriers to entry and regula-tions that limit price competition.
Third, labor force skills need to be enhanced.This is particularly important because growth poten-tial should stem more from productivity growth basedon knowledge than factor input expansion. To ac-complish this, an improved educational system,stronger vocational training, and expanded invest-ment in technology and innovation are needed. Thebudget plan for 2000 has allocated a substantiallyincreased amount of fiscal resources for publicresearch, development investment, and venturebusinesses support.
Finally, the social welfare system needs over-hauling to provide an effective safety net for workerswhile strengthening work incentives. Both the leveland duration of unemployment benefits haveincreased significantly since the crisis. However, theyare still far less satisfactory than those of advancedOrganisation for Economic Co-operation and Devel-opment member countries. Measures to strengthenwork incentives for the unemployed have not keptpace with improved unemployment benefits, and theeligibility test for unemployment benefits also needsto be strengthened.

ASIAN DEVELOPMENT OUTLOOK 200052
SingaporeSingaporeSingaporeSingaporeSingapore
Singapore’s institutional strengths and flexible economic management enabled it to rebound stronglyin 1999 from economic stagnation in the previous year. However, adjustments to the realities of thepostcrisis environment will be more challenging and will require further changes in institutional andproduction structures to retain competitiveness. Long-term prospects for the economy remain bright.
RECENT TRENDS AND PROSPECTSRECENT TRENDS AND PROSPECTSRECENT TRENDS AND PROSPECTSRECENT TRENDS AND PROSPECTSRECENT TRENDS AND PROSPECTS
TTTTThe economy of Singapore rebounded strongly froma near-stagnant level in 1998 to register GDP
growth of 5.4 percent in 1999. The manufacturing sec-tor accounted for much of the growth, reflecting strongexternal demand for telecommunications equipment,semiconductors, computer peripherals, and comput-ers. The nonelectronic segment of manufacturing alsoperformed well, and chemical output rose sharply, re-flecting increased regional demand for industrialchemicals and pharmaceuticals. The construction sec-tor, however, continued to decline, mainly because ofa sharp drop in private construction activity. Devel-opers remained cautious because of excess capacity inboth residential and nonresidential markets. The ser-vice sector also staged a recovery, with increased re-gional trade flows. Tourist arrivals boosted growth inthe transportation and communications sectors, whileincreased domestic demand led to a sharp rise in theretail and wholesale sectors. The financial services sec-tor also benefited from improved investor sentiment
toward regional equity markets and improved regionaldemand for insurance and investment advice.
Despite the strong rebound in economic activ-ity and increased investment commitments in the sec-ond half of the year, overall growth in fixed investmentby both private and public sectors remained below itshistorical rate before the crisis (see figure 2.1). Thiswas due to insufficient credit expansion and indus-trial overcapacity. Bank lending, other than for hous-ing, remained weak and lagged behind the recoveryin industrial production. Lending for housing rose andproperty transactions increased, however, as pricesremained low and banks offered attractive mortgagefinancing packages. Fiscal policy provided less of astimulus to the economy than originally envisaged.The original budget for fiscal year 1999 ending31 March had predicted a budget deficit of S$5.1 bil-lion (3.4 percent of GDP). However, considerablyfaster-than-expected revenue growth, combined withlower operating and development expenditure, led toa budget surplus. Although a rise in interbank ratesreflected the rise in US interest rates that began in
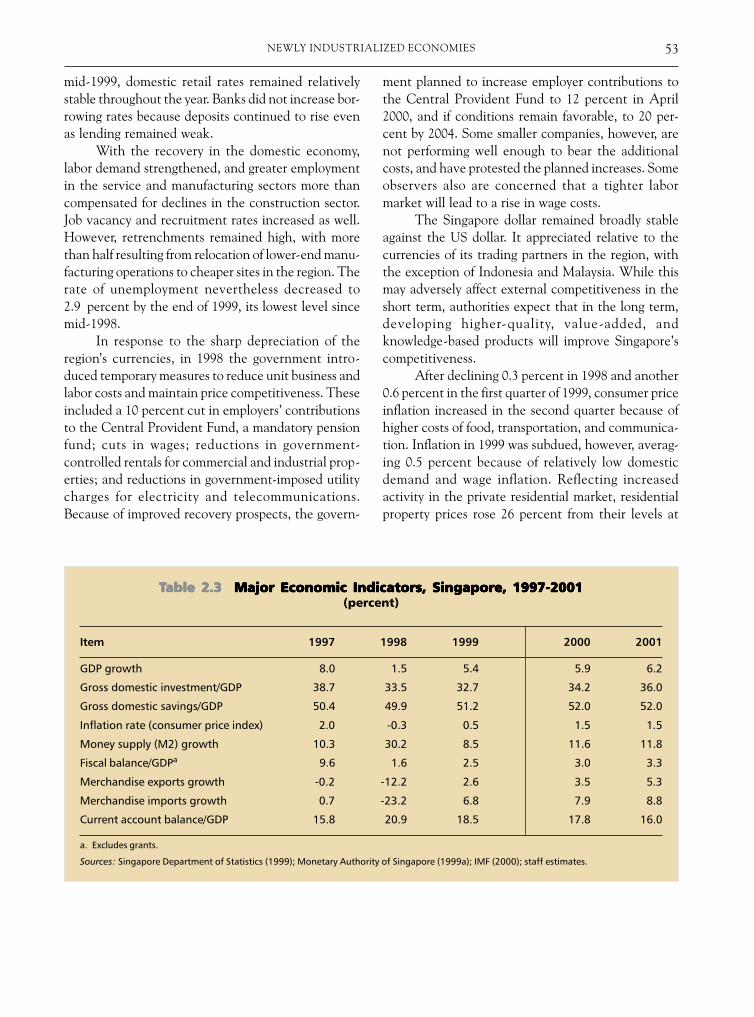
53NEWLY INDUSTRIALIZED ECONOMIES
mid-1999, domestic retail rates remained relativelystable throughout the year. Banks did not increase bor-rowing rates because deposits continued to rise evenas lending remained weak.
With the recovery in the domestic economy,labor demand strengthened, and greater employmentin the service and manufacturing sectors more thancompensated for declines in the construction sector.Job vacancy and recruitment rates increased as well.However, retrenchments remained high, with morethan half resulting from relocation of lower-end manu-facturing operations to cheaper sites in the region. Therate of unemployment nevertheless decreased to2.9 percent by the end of 1999, its lowest level sincemid-1998.
In response to the sharp depreciation of theregion’s currencies, in 1998 the government intro-duced temporary measures to reduce unit business andlabor costs and maintain price competitiveness. Theseincluded a 10 percent cut in employers’ contributionsto the Central Provident Fund, a mandatory pensionfund; cuts in wages; reductions in government-controlled rentals for commercial and industrial prop-erties; and reductions in government-imposed utilitycharges for electricity and telecommunications.Because of improved recovery prospects, the govern-
ment planned to increase employer contributions tothe Central Provident Fund to 12 percent in April2000, and if conditions remain favorable, to 20 per-cent by 2004. Some smaller companies, however, arenot performing well enough to bear the additionalcosts, and have protested the planned increases. Someobservers also are concerned that a tighter labormarket will lead to a rise in wage costs.
The Singapore dollar remained broadly stableagainst the US dollar. It appreciated relative to thecurrencies of its trading partners in the region, withthe exception of Indonesia and Malaysia. While thismay adversely affect external competitiveness in theshort term, authorities expect that in the long term,developing higher-quality, value-added, andknowledge-based products will improve Singapore’scompetitiveness.
After declining 0.3 percent in 1998 and another0.6 percent in the first quarter of 1999, consumer priceinflation increased in the second quarter because ofhigher costs of food, transportation, and communica-tion. Inflation in 1999 was subdued, however, averag-ing 0.5 percent because of relatively low domesticdemand and wage inflation. Reflecting increasedactivity in the private residential market, residentialproperty prices rose 26 percent from their levels at
TTTTTable 2.3able 2.3able 2.3able 2.3able 2.3 Major Economic Indicators, Singapore, 1997-2001Major Economic Indicators, Singapore, 1997-2001Major Economic Indicators, Singapore, 1997-2001Major Economic Indicators, Singapore, 1997-2001Major Economic Indicators, Singapore, 1997-2001(percent)
Item 1997 1998 1999 2000 2001
GDP growth 8.0 1.5 5.4 5.9 6.2
Gross domestic investment/GDP 38.7 33.5 32.7 34.2 36.0
Gross domestic savings/GDP 50.4 49.9 51.2 52.0 52.0
Inflation rate (consumer price index) 2.0 -0.3 0.5 1.5 1.5
Money supply (M2) growth 10.3 30.2 8.5 11.6 11.8
Fiscal balance/GDPa 9.6 1.6 2.5 3.0 3.3
Merchandise exports growth -0.2 -12.2 2.6 3.5 5.3
Merchandise imports growth 0.7 -23.2 6.8 7.9 8.8
Current account balance/GDP 15.8 20.9 18.5 17.8 16.0
a. Excludes grants.
Sources: Singapore Department of Statistics (1999); Monetary Authority of Singapore (1999a); IMF (2000); staff estimates.
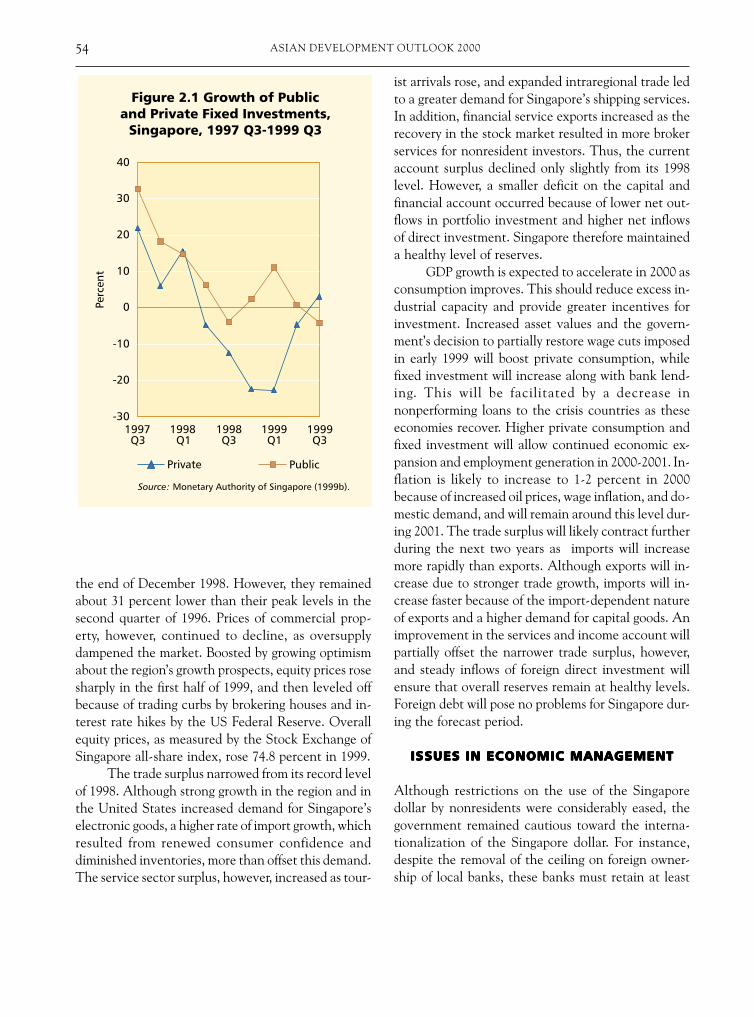
ASIAN DEVELOPMENT OUTLOOK 200054
the end of December 1998. However, they remainedabout 31 percent lower than their peak levels in thesecond quarter of 1996. Prices of commercial prop-erty, however, continued to decline, as oversupplydampened the market. Boosted by growing optimismabout the region’s growth prospects, equity prices rosesharply in the first half of 1999, and then leveled offbecause of trading curbs by brokering houses and in-terest rate hikes by the US Federal Reserve. Overallequity prices, as measured by the Stock Exchange ofSingapore all-share index, rose 74.8 percent in 1999.
The trade surplus narrowed from its record levelof 1998. Although strong growth in the region and inthe United States increased demand for Singapore’selectronic goods, a higher rate of import growth, whichresulted from renewed consumer confidence anddiminished inventories, more than offset this demand.The service sector surplus, however, increased as tour-
ist arrivals rose, and expanded intraregional trade ledto a greater demand for Singapore’s shipping services.In addition, financial service exports increased as therecovery in the stock market resulted in more brokerservices for nonresident investors. Thus, the currentaccount surplus declined only slightly from its 1998level. However, a smaller deficit on the capital andfinancial account occurred because of lower net out-flows in portfolio investment and higher net inflowsof direct investment. Singapore therefore maintaineda healthy level of reserves.
GDP growth is expected to accelerate in 2000 asconsumption improves. This should reduce excess in-dustrial capacity and provide greater incentives forinvestment. Increased asset values and the govern-ment’s decision to partially restore wage cuts imposedin early 1999 will boost private consumption, whilefixed investment will increase along with bank lend-ing. This will be facilitated by a decrease innonperforming loans to the crisis countries as theseeconomies recover. Higher private consumption andfixed investment will allow continued economic ex-pansion and employment generation in 2000-2001. In-flation is likely to increase to 1-2 percent in 2000because of increased oil prices, wage inflation, and do-mestic demand, and will remain around this level dur-ing 2001. The trade surplus will likely contract furtherduring the next two years as imports will increasemore rapidly than exports. Although exports will in-crease due to stronger trade growth, imports will in-crease faster because of the import-dependent natureof exports and a higher demand for capital goods. Animprovement in the services and income account willpartially offset the narrower trade surplus, however,and steady inflows of foreign direct investment willensure that overall reserves remain at healthy levels.Foreign debt will pose no problems for Singapore dur-ing the forecast period.
ISISISISISSUES IN ECONOMIC MANAGEMENTSUES IN ECONOMIC MANAGEMENTSUES IN ECONOMIC MANAGEMENTSUES IN ECONOMIC MANAGEMENTSUES IN ECONOMIC MANAGEMENT
Although restrictions on the use of the Singaporedollar by nonresidents were considerably eased, thegovernment remained cautious toward the interna-tionalization of the Singapore dollar. For instance,despite the removal of the ceiling on foreign owner-ship of local banks, these banks must retain at least

55NEWLY INDUSTRIALIZED ECONOMIES
50 percent of residents’ deposits so that the MonetaryAuthority of Singapore can control Singapore dollartransactions. These restrictions were based on con-cern that a large offshore market in Singapore dollarscould destabilize domestic exchange and interest rates.If, however, Singapore is to become a major interna-tional financial center, the authorities will likely haveto contend with the inevitable internationalization ofthe Singapore dollar.
POLICY AND DEVELPOLICY AND DEVELPOLICY AND DEVELPOLICY AND DEVELPOLICY AND DEVELOPMENT ISOPMENT ISOPMENT ISOPMENT ISOPMENT ISSUESSUESSUESSUESSUES
Singapore’s strong institutions and flexible approachto macroeconomic management have allowed it toemerge quickly from the Asian crisis with few socialdisruptions. However, adjusting to the realities of thepostcrisis environment will be more challenging andwill require further changes to institutional and pro-duction structures to remain competitive.
The Committee on Singapore’s Competitivenesshas called for a knowledge-based economy to helpimprove long-term competitiveness. To this end, thegovernment has been developing an institutionalstructure that will provide appropriate support. TheMinistry of Communications and InformationTechnology was created, and the existing NationalComputer Board and the Telecommunications Boardof Singapore were merged into the Info-Communica-tions Development Authority. This group was giventhe task of preparing a master plan to develop theinformation and communications industry. The gov-ernment has also initiated measures to provide incen-tives for entrepreneurs entering high-tech industries,and to train people in skills related to information tech-nology. For example, the government has increasedthe skills development levy paid by employers to fundapproved training courses for lower-paid workers.However, there is no certainty that retraining willenable workers with limited skills and education toqualify for jobs being created in the semiconductorand chemical industries. Although the government’spast interventions in industrial development have beenbeneficial, there is some concern that continued
interventions on this scale could impede necessary cor-porate restructuring as market conditions change.
A sound and well-regulated banking sectorhelped Singapore weather the Asian crisis. However,many other challenges remain. The domestic bank-ing sector, which is overregulated and characterizedby high cost and low liquidity, needs to be improved.To help develop the economy as a regional financialcenter, the Monetary Authority of Singapore (the defacto central bank) introduced a series of wide-ranging measures in 1998 and 1999 aimed at liberaliz-ing financial markets. These include the merger of theStock Exchange of Singapore and the SingaporeInternational Monetary Exchange into the SingaporeExchange in December 1999, the first fully integratedfinancial market in Asia.
The government also liberalized entry into theSingapore Exchange by gradually lifting the restric-tions on the number of foreign brokers who can par-ticipate and on the value of their trades. In addition,the government is developing a risk-based method ofcalculating capital requirements for brokers and willallow more Singapore dollar-denominated interest ratederivatives to be traded on the exchange. Beginningin 2001, freely negotiated broker commissions will re-place the system of fixed commissions, which authori-ties expect will lower transaction costs. Bank disclosurerules were strengthened by measures recommendedby the Committee on Banking Disclosure in May 1998.The Monetary Authority of Singapore also scrappedthe 40 percent ceiling on foreign ownership of local banksand granted licenses to four foreign banking groups,which will allow them to open additional branchesand run automatic teller machines off-premises.
These liberalization measures have led to afundamental change in emphasis from regulationto risk-focused supervision and increased disclosure.The authorities expect this to help reduce risks of con-tagion, broaden and deepen the capital market, de-crease costs, and improve efficiency. This change willalso boost Singapore’s standing as a regional finan-cial center and its competitiveness in relation toHong Kong, China.

ASIAN DEVELOPMENT OUTLOOK 200056
TTTTTaipei,Chinaaipei,Chinaaipei,Chinaaipei,Chinaaipei,China
A massive earthquake struck Taipei,China in 1999, causing serious damage to infrastructure.Reconstruction work was swift and resulted in only a marginal decline of GDP growth in 1999compared with government targets. A recovering global economy boosted exports, and better economicgrowth is projected for 2000.
RECENT TRENDS AND PROSPECTSRECENT TRENDS AND PROSPECTSRECENT TRENDS AND PROSPECTSRECENT TRENDS AND PROSPECTSRECENT TRENDS AND PROSPECTS
EEEEEconomic performance strengthened in the firsthalf of 1999 as the economy began to recover from
a modest growth slowdown following the Asian finan-cial crisis. However, a massive earthquake struck on21 September 1999, causing considerable damage tothe productive capacity of the economy, particularlyto physical infrastructure. For example, the micro-chip makers at the high-tech industrial park in Hsin-Chu City suffered an estimated $320 million inproduction losses because of power supply interrup-tions. Despite this setback, real GDP growth in 1999was 5.7 percent, only marginally lower than the targetof 5.8 percent, and more than 1 percent higher thangrowth in 1998.
Strong performance of the external sector wasan important factor in the recovery. The trade bal-ance for 1999 amounted to $15.1 billion, a sharpincrease of 46 percent from 1998. While exports de-clined 9.5 percent in 1998, in 1999 they grew 6.8 per-cent, led by semiconductors and notebook computersales. Exports also benefited from the recovery in Asia
and strong import demand from the United States.Merchandise imports grew by 2.8 percent in 1999, incontrast to a 7.4 percent decline in 1998. Machineryand electrical equipment made up the largest share ofimports. Japan was the largest source country, account-ing for 25.7 percent of total imports.
The growth rate of the industry sector rose to4.3 percent in 1999 from 2.7 percent in 1998. Thiswas largely propelled by growth in the electronics in-dustry, which benefited from the recovery of the glo-bal economy, higher prices, and a boost in Y2K-relateddemand. Growth in the service sector was modest at6.3 percent, slightly higher than the previous year.Good weather contributed to the recovery of the ag-riculture sector from a 6.6 percent decline in 1998 toa 2.9 percent growth in 1999.
Investments grew by 2.1 percent in 1999, lessthan the 10.4 percent growth the previous year be-cause of a sluggish housing market, fewer large com-mercial airplane purchases, and a sharp decelerationin the investment growth rate. Consumption expen-diture also decelerated, growing by only 4.2 percentin 1999 compared with 7.8 percent in 1998. The only
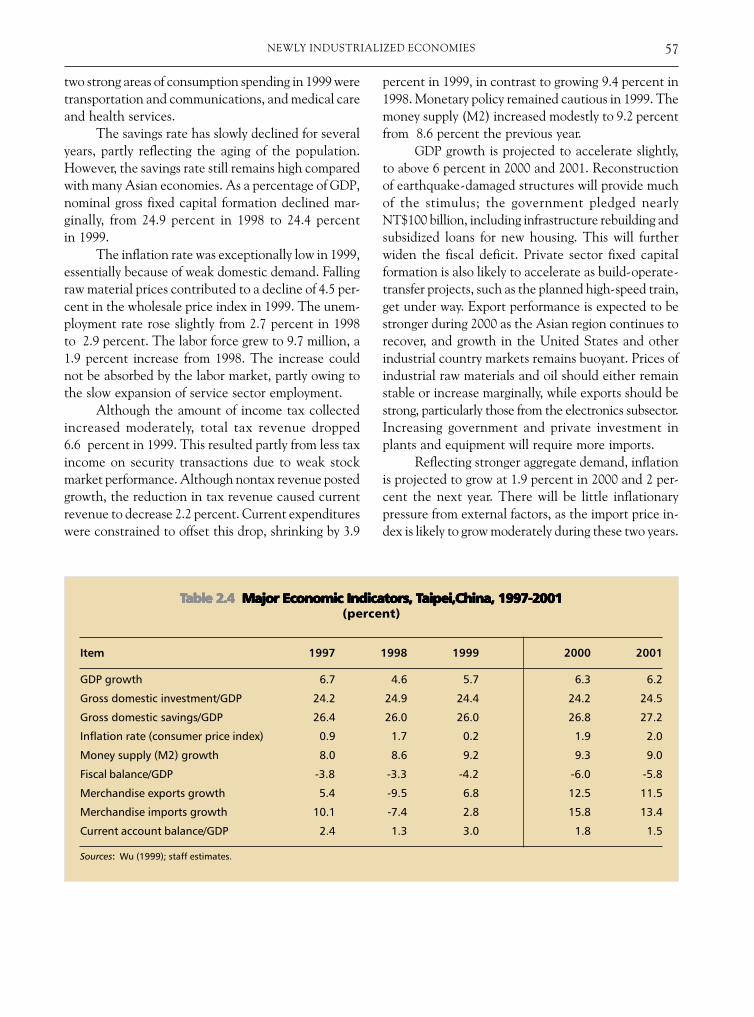
57NEWLY INDUSTRIALIZED ECONOMIES
two strong areas of consumption spending in 1999 weretransportation and communications, and medical careand health services.
The savings rate has slowly declined for severalyears, partly reflecting the aging of the population.However, the savings rate still remains high comparedwith many Asian economies. As a percentage of GDP,nominal gross fixed capital formation declined mar-ginally, from 24.9 percent in 1998 to 24.4 percentin 1999.
The inflation rate was exceptionally low in 1999,essentially because of weak domestic demand. Fallingraw material prices contributed to a decline of 4.5 per-cent in the wholesale price index in 1999. The unem-ployment rate rose slightly from 2.7 percent in 1998to 2.9 percent. The labor force grew to 9.7 million, a1.9 percent increase from 1998. The increase couldnot be absorbed by the labor market, partly owing tothe slow expansion of service sector employment.
Although the amount of income tax collectedincreased moderately, total tax revenue dropped6.6 percent in 1999. This resulted partly from less taxincome on security transactions due to weak stockmarket performance. Although nontax revenue postedgrowth, the reduction in tax revenue caused currentrevenue to decrease 2.2 percent. Current expenditureswere constrained to offset this drop, shrinking by 3.9
percent in 1999, in contrast to growing 9.4 percent in1998. Monetary policy remained cautious in 1999. Themoney supply (M2) increased modestly to 9.2 percentfrom 8.6 percent the previous year.
GDP growth is projected to accelerate slightly,to above 6 percent in 2000 and 2001. Reconstructionof earthquake-damaged structures will provide muchof the stimulus; the government pledged nearlyNT$100 billion, including infrastructure rebuilding andsubsidized loans for new housing. This will furtherwiden the fiscal deficit. Private sector fixed capitalformation is also likely to accelerate as build-operate-transfer projects, such as the planned high-speed train,get under way. Export performance is expected to bestronger during 2000 as the Asian region continues torecover, and growth in the United States and otherindustrial country markets remains buoyant. Prices ofindustrial raw materials and oil should either remainstable or increase marginally, while exports should bestrong, particularly those from the electronics subsector.Increasing government and private investment inplants and equipment will require more imports.
Reflecting stronger aggregate demand, inflationis projected to grow at 1.9 percent in 2000 and 2 per-cent the next year. There will be little inflationarypressure from external factors, as the import price in-dex is likely to grow moderately during these two years.
TTTTTable 2.4able 2.4able 2.4able 2.4able 2.4 Major Economic Indicators, T Major Economic Indicators, T Major Economic Indicators, T Major Economic Indicators, T Major Economic Indicators, Taipei,China, 1997-2001aipei,China, 1997-2001aipei,China, 1997-2001aipei,China, 1997-2001aipei,China, 1997-2001(percent)
Item 1997 1998 1999 2000 2001
GDP growth 6.7 4.6 5.7 6.3 6.2
Gross domestic investment/GDP 24.2 24.9 24.4 24.2 24.5
Gross domestic savings/GDP 26.4 26.0 26.0 26.8 27.2
Inflation rate (consumer price index) 0.9 1.7 0.2 1.9 2.0
Money supply (M2) growth 8.0 8.6 9.2 9.3 9.0
Fiscal balance/GDP -3.8 -3.3 -4.2 -6.0 -5.8
Merchandise exports growth 5.4 -9.5 6.8 12.5 11.5
Merchandise imports growth 10.1 -7.4 2.8 15.8 13.4
Current account balance/GDP 2.4 1.3 3.0 1.8 1.5
Sources: Wu (1999); staff estimates.
ASIAN DEVELOPMENT OUTLOOK 200058
Further recovery of domestic demand is expected toincrease the growth rate of goods and services importsto 15.8 percent and 13.4 percent in 2000 and 2001,respectively. Consequently, the current accountbalance is projected to be $5.7 billion in 2000, and$5.3 billion in 2001.
ISISISISISSUES IN ECONOMIC MANAGEMENTSUES IN ECONOMIC MANAGEMENTSUES IN ECONOMIC MANAGEMENTSUES IN ECONOMIC MANAGEMENTSUES IN ECONOMIC MANAGEMENT
Taipei,China managed its macroeconomy wellthroughout the Asian crisis, benefiting from its largeforeign exchange reserves and minimal foreign debt.The nonperforming loan ratio was low and the capi-tal adequacy ratio of most banks remained above the8 percent stipulated by the Bank for InternationalSettlements. In addition, a 9.7 percent rate of returnon net investment invigorated the financial sector.
The industrial structure was another importantfactor behind the macroeconomic resilience. Small andmedium-size enterprises, which contribute approxi-mately 50 percent of total export revenues, dominatethis sector. Since the early 1990s, semiconductor andelectronics have replaced the construction industryas the principal engine of growth, providing extrastrength and dynamism to the economy. The govern-ment also effectively used monetary policy to main-tain liquidity and moderate interest rates during thefinancial crisis.
These export-oriented companies have demon-strated their ability to adjust quickly to a rapidlychanging external environment. Government policyshould encourage them to maintain their internationalcompetitiveness. These corporations need to be in-creasingly agile, flexible, and pragmatic in reacting tothe changing demands of international markets.
POLICY AND DEVELPOLICY AND DEVELPOLICY AND DEVELPOLICY AND DEVELPOLICY AND DEVELOPMENT ISOPMENT ISOPMENT ISOPMENT ISOPMENT ISSUESSUESSUESSUESSUES
Taipei,China is expected to enter the World TradeOrganization (WTO) in mid-2000. In preparation,policymakers will reduce tariffs to improve marketaccess. For instance, the average nominal tariff rateof 8.3 percent will be reduced to 7.6 percent uponWTO entry. Government procurement procedureshave been streamlined to be compatible with the WTOnorms. Nontariff barriers in agriculture were substan-tially dismantled and the barriers on 18 products
marked for elimination. Entering the WTO shouldprovide manufacturing benefits, but will also probablydisrupt the agriculture sector. The economy seems tohave lost competitiveness in the agriculture sector, buthas gained significant advantage in high-tech and elec-tronics products. Loss of comparative advantage in ag-riculture should not be seen as negative, but as a stagein the economy’s evolution to a fully industrializedstatus. Therefore, policymakers should not yield topressure to protect the agriculture sector.
The reconstruction process after the earthquakeconsumed funds originally intended for stimulating do-mestic demand and strengthening infrastructure. Theconstruction of the high-speed railway system betweenKeelum and Kowshon may be delayed. To bridge theinvestment gap that will ensue from the budget real-location, the private sector can be called on to sup-port the government. Infrastructure projects initiallycan be financed by the private sector through build-operate-transfer or build-operate-own projects. Co-operation between the government and the privatesector could reduce the government’s financial bur-den, promote private investment, and increase op-erational efficiency. However, because of lack ofexperience in these operations, the government andfinancial institutions are moving slowly.
Since the late 1980s, the traditional sectors ofthe economy have languished. The economy has de-veloped a dualistic character, with a traditional sectorco-existing with a modern high-tech export-orientedgroup of industries. In the traditional sector,nonperforming loans have increased and profitabilityand investment have decreased. These industries, par-ticularly the small and medium-size ones, need to berestructured. Their technology is not being upgradedand production modes are inflexible. The governmenthas provided loans for upgrading technology, laborskills, and marketing endeavors. The impact so far,however, has been small because of limited funds. Ef-forts in this area need to be intensified and more re-sources committed to assisting small and medium-sizeenterprises, particularly in the traditional sectors.
WTO membership and the associated financialliberalization are sure to usher in financial inter-nationalization and enhance competition in thedomestic financial markets. To increase competitive-ness in the banking and financial sectors, the govern-

59NEWLY INDUSTRIALIZED ECONOMIES
ment needs to promote consolidation through merg-ers and acquisitions. Initial efforts are being made inthis direction, but more definitive measures are needed.
Gender differences in earnings persist. Thefemale-to-male earnings ratio averaged 64 percentduring 1988-1993 and edged up 67 percent during1993-1997. Earnings gaps within occupations grewover time. Despite the Labor Standards Law, womendo not receive equal pay for work of equal value, andthe equal pay law must be better enforced. Employ-ment redistribution can be a viable policy option, be-cause the within-occupation pay inequality generallyresults from gender segregation across enterprises.Hence, equal pay for equal work within a firm willhave little effect on the overall gender earnings gapunless the segregation issue is addressed.
Taipei,China is one of the few developing econo-mies that succeeded in attaining progress with incomeequality. Although the Gini coefficient (a measure ofinequality) began to rise after 1984—increasing from
0.29 that year to 0.32 in 1993—inequality has re-mained low for the past four decades. Rapid export-oriented growth created a large demand for bothlow-skilled and highly skilled labor. Brisk and timelydevelopment of the agriculture and industry sectorsensured participation of farmers and industrial labor-ers in the economy, which reduced income inequal-ity. A rapidly growing labor demand resulted in highincreases in wages, particularly for young and low-skilledworkers. This trend helped narrow wage disparities.
However, since the early 1990s, the rise of adynamic and skill-oriented export sector has resultedin a widening of differentials as traditional industrieshave grown more slowly. Upward movement in thestock market during that period favored the wealthiersegments of the society and reinforced this trend.Adopting more progressive taxation and restructur-ing traditional sectors should help stop the trendtoward disparities in income and increases in incomeinequality.
61PEOPLE’S REPUBLIC OF CHINA AND MONGOLIA
People’s Republic of ChinaPeople’s Republic of ChinaPeople’s Republic of ChinaPeople’s Republic of ChinaPeople’s Republic of China
Prudent macroeconomic policy aided the People’s Republic of China (PRC) in adjusting to the Asiancrisis. In 1999, growth slowed slightly and prospects are that a rate lower than the trend in the 1990scan be sustained in the medium term. The challenge will be to continue the reform process of openingthe economy, improving efficiency in the state sector, addressing unemployment issues, and developinga legal and regulatory framework essential for efficient functioning of a market economy.
RECENT TRENDS AND PROSPECTSRECENT TRENDS AND PROSPECTSRECENT TRENDS AND PROSPECTSRECENT TRENDS AND PROSPECTSRECENT TRENDS AND PROSPECTS
TTTTT he economy of the PRC began to decelerate inthe fourth quarter of 1998 and continued through
the second quarter of 1999. In response, the govern-ment cut interest rates in June and announced a fiscalstimulus package in August. These measures wereeffective, as growth for the year exceeded 7 percent.
Fixed investment grew 5.2 percent in 1999, downfrom 14 percent in 1998. Private investment, whichconstitutes about one fourth of total investment inthe economy, has been slowing since 1996. The March1999 constitutional amendment to officially recognizethe private sector’s role in the economy should im-prove prospects for private investment. However, thesignificant excess capacities in many sectors will dis-courage any large increase in private investment overthe medium term.
Consumer demand also remains weak partlybecause of the increased unemployment from layingoff redundant workers from state-owned enterprises(SOEs), and partly because of the uncertainties
inherent in reform measures in housing, pension, andother social welfare provisions.
Domestic prices continued to decline becauseof the weak aggregate demand and the overall defla-tionary trends in Asia. After falling by 0.8 percent in1998, the consumer price index declined another1.4 percent in 1999. The fall in retail prices was evensharper, amounting to 3 percent.
To counteract deflationary trends and maintainrobust economic growth, the People’s Bank of Chinalowered interest rates in 1999, reducing the bench-mark one-year lending rate for banks from 6.39 to5.85 percent, and the benchmark one-year depositrate from 3.78 to 2.25 percent. Simultaneously, thePeople’s Bank of China took measures to stabilize theyuan-dollar exchange rate at around Y8.3 per dollar.Other measures to control the illegal outflow of for-eign exchange included (a) strengthening supervisionof export receipt remittances, (b) tightening scrutinyof processing trade, (c) curbing offshore renminbitrading, and (d) prohibiting prepayment of foreigncurrency loans.

ASIAN DEVELOPMENT OUTLOOK 200062
TTTTTable 2.5able 2.5able 2.5able 2.5able 2.5 Major Economic Indicators, People's Republic of China, 1997-2001Major Economic Indicators, People's Republic of China, 1997-2001Major Economic Indicators, People's Republic of China, 1997-2001Major Economic Indicators, People's Republic of China, 1997-2001Major Economic Indicators, People's Republic of China, 1997-2001(percent)
Item 1997 1998 1999 2000 2001
GDP growth 8.8 7.8 7.1 6.5 6.0
Gross domestic investment/GDP 38.1 37.8 37.8 37.8 37.3
Gross domestic savings/GDP 41.5 40.9 39.0 37.4 36.4
Inflation rate (consumer price index) 2.8 -0.8 -1.4 1.8 2.0
Money supply (M2) growth 17.3 15.3 14.7 16.0 16.0
Fiscal balance/GDP -1.8 -3.0 -4.0 -3.0 -3.0
Merchandise exports growtha 21.0 0.5 6.0 5.0 5.0
Merchandise imports growtha 2.5 -1.5 18.2 10.0 8.0
Current account balance/GDP 3.3 3.1 1.2 -0.4 -0.9
External debt/GDP 14.6 15.2 15.7 16.2 16.7
a. Based on customs data.
Sources: National Bureau of Statistics; staff estimates.
With the August fiscal stimulus, the 1999 fiscaldeficit increased from Y260 billion (about 3 percentof GDP) in 1998 to Y346 billion (4 percent of GDP).To complement the fiscal stimulus package, a tax wasimposed on interest income from bank deposits, todiscourage households from saving in banks and toencourage private consumption.
Given the small fiscal deficits and modest pub-lic debt, continuing an expansionary fiscal policy topump-prime the economy in the face of deflationarytrends is appropriate. However, the official measureof fiscal deficit underestimates the actual resourceimbalance of the government because it does notinclude the deficit spending of the SOEs, theextrabudgetary government expenditures, and thevarious subsidies by the state-owned banks. Withthese items included, the fiscal deficit in 1998 reached6 percent of GDP. Continued fiscal pump priming tostimulate domestic demand could drain resourcesaway from other needs. Therefore, fiscal stimuluspackages to maintain high GDP growth should be usedwith caution.
Coupled with antipoverty programs, robustgrowth enabled significant progress in poverty reduc-tion. Much of the economic growth has been pro-poor.
The official estimate of the number of rural poor de-clined from 42 million (4.6 percent of the rural popu-lation) in 1998 to 35 million (4 percent of the ruralpopulation) the next year. Between 1978 and 1999,227 million people were lifted from absolute poverty.The official estimate of poverty has two weaknesses,however. It is based on a very low income criterion ofabout Y635 annual per capita income ($0.66 per dayusing purchasing power parity), and does not coverurban areas. According to a World Bank estimate, ifthe dollar-a-day poverty norm is applied, then in 1997there were about 208 million rural poor (about 23 per-cent of the rural population), compared with the offi-cial estimate of 50 million (5.4 percent of the ruralpopulation). There is no official estimate of the urbanpoor. However, unofficial estimates indicatethat 12 million-15 million (5-6 percent of the urbanpopulation) are poor, with per capita income lessthan Y1,700 (about $1.77 per day using purchasingpower parity).
Because of the lack of reliable data, it is difficultto assess the extent of unemployment. Official datado not cover rural areas, which account for 70 per-cent of the labor force. Unofficial sources indicate thatabout 150 million, or 30 percent of the rural labor

63PEOPLE’S REPUBLIC OF CHINA AND MONGOLIA
force, are either unemployed or underemployed. Evenin urban areas, the official 1999 estimate of 3.1 per-cent urban unemployment covers only workers regis-tered with the Ministry of Labor and Social Security.It does not include workers who are laid off as xiagangworkers (those who keep a legal link to their enter-prises but receive little pay or benefits) as part of theSOE reforms. Adjusting for these limitations, the ur-ban unemployment rate was about 9.5 percent in 1999.
Largely because of the economic crisis in Asia,export growth was subdued in 1998 and the first halfof 1999. Exports increased in the second half of 1999as growth in the rest of Asia began to accelerate. How-ever, for 1999 as a whole, export growth was a modest6 percent, while imports grew a robust 18 percent.
Foreign direct investment (FDI) flows reacheda high plateau during 1995-1998, and FDI inflow de-clined in 1999 for the first time since 1990. While FDIcommitments declined 18.9 percent, actual FDI in-flows went down by 9.7 percent, reflecting concern offoreign investors about weak financial institutions.The impact of this slowdown on the economy wassomewhat mitigated in 1998 and 1999 by large fiscalstimulus packages.
Despite the worsening trade balance and thedeclining capital flows, the external payments situa-tion continued to be comfortable. Both the externaldebt and the debt-service ratios are low by develop-ing country standards. Foreign exchange reserves wereabout $155 billion in December 1999 (11 months ofimport equivalent), slightly more than the total ex-ternal debt and about nine times the short-term ex-ternal debt. At less than 10 percent, the externaldebt-service ratio was well within prudent limits.
In the aftermath of the Asian crisis, some fearedan economic downturn in the PRC. Similarities to thecrisis-affected countries include indicators of structuralvulnerabilities, such as the corporate debt-equity ra-tio, ratio of nonperforming loans in banks’ balancesheets, exposure of the banking sector to the propertysector, and growth of bank credit to enterprises. How-ever, macroeconomic indicators—such as inflation,current account balance, short-term capital inflows,share of short-term debt in total external debt, andsize of short-term external debt relative to foreign ex-change reserves—are much stronger than that of thecrisis-affected countries prior to the crisis. Further-
more, capital and exchange rate controls help insu-late the economy from external shocks.
Considering both internal and external factors,GDP growth is projected to decline from 7.1 percentin 1999 to about 6 percent by 2001. Most of the slow-down will occur in industry and construction, wheregrowth is expected to decline from 9 percent in 1999to about 6.5 percent by 2001. The slowing economyand the SOE reforms will cause urban unemploymentto increase by about 1 percent to 10.5 percent by 2001.The economic slowdown and increasing unemploy-ment should keep inflation moderate, about 2 per-cent during 2000-2001. The recovery in the newlyindustrialized economies should improve export pros-pects to these countries. Domestic price deflation, con-tinued export tax rebates, and growing import demandin the Asian region will enhance export competitive-ness. However, currency devaluation in SoutheastAsian economies will make their exports more com-petitive than the PRC’s exports. Import demand willbe more moderate, but sufficient to serve the growingneed for capital goods. Balancing these factors, thecurrent account is likely to shift from a surplus to asmall deficit in 2000 and 2001 (see figure 2.2). Capitalinflows are expected to cover this deficit and allow amodest increase in foreign exchange reserves, whichstood at $155 billion at the end of 1999. External debtoutstanding as a percent of GDP should remain atroughly the same level as in 1999.
ISISISISISSUES IN ECONOMIC MANAGEMENTSUES IN ECONOMIC MANAGEMENTSUES IN ECONOMIC MANAGEMENTSUES IN ECONOMIC MANAGEMENTSUES IN ECONOMIC MANAGEMENT
Because of the rapid growth of the economy, signifi-cant expansion of employment opportunities, and im-pressive achievements in poverty reduction in the lasttwo decades, the population has come to expect ever-improving economic conditions and living standards.However, if high rates of economic growth are notmaintained, employment creation may not be suffi-cient for the increasing redundancy from SOEs andgrowth of the labor force. The crucial challenge forthe government is to ensure that economic growthgenerates enough jobs to hold the unemployment ratein check.
Under the centrally planned economy, SOEsplayed a key role in growth and employment genera-tion. Often, these enterprises provided employment
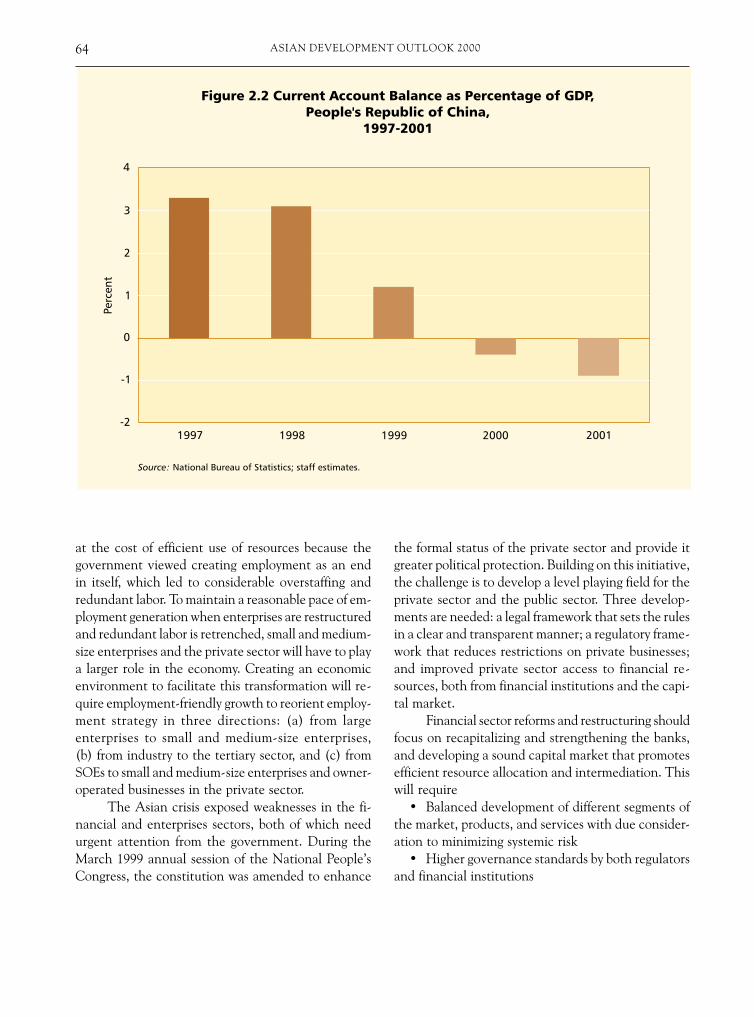
ASIAN DEVELOPMENT OUTLOOK 200064
at the cost of efficient use of resources because thegovernment viewed creating employment as an endin itself, which led to considerable overstaffing andredundant labor. To maintain a reasonable pace of em-ployment generation when enterprises are restructuredand redundant labor is retrenched, small and medium-size enterprises and the private sector will have to playa larger role in the economy. Creating an economicenvironment to facilitate this transformation will re-quire employment-friendly growth to reorient employ-ment strategy in three directions: (a) from largeenterprises to small and medium-size enterprises,(b) from industry to the tertiary sector, and (c) fromSOEs to small and medium-size enterprises and owner-operated businesses in the private sector.
The Asian crisis exposed weaknesses in the fi-nancial and enterprises sectors, both of which needurgent attention from the government. During theMarch 1999 annual session of the National People’sCongress, the constitution was amended to enhance
the formal status of the private sector and provide itgreater political protection. Building on this initiative,the challenge is to develop a level playing field for theprivate sector and the public sector. Three develop-ments are needed: a legal framework that sets the rulesin a clear and transparent manner; a regulatory frame-work that reduces restrictions on private businesses;and improved private sector access to financial re-sources, both from financial institutions and the capi-tal market.
Financial sector reforms and restructuring shouldfocus on recapitalizing and strengthening the banks,and developing a sound capital market that promotesefficient resource allocation and intermediation. Thiswill require
• Balanced development of different segments ofthe market, products, and services with due consider-ation to minimizing systemic risk
• Higher governance standards by both regulatorsand financial institutions
65PEOPLE’S REPUBLIC OF CHINA AND MONGOLIA
• Stronger legal and regulatory framework to con-form to international standards
• Institutional capacities that enforce the legaland regulatory framework.
The government has taken steps in these areasin the last two years. It now needs to make moreprogress and to effectively implement many of the re-cent financial sector reforms.
POLICY AND DEVELPOLICY AND DEVELPOLICY AND DEVELPOLICY AND DEVELPOLICY AND DEVELOPMENT ISOPMENT ISOPMENT ISOPMENT ISOPMENT ISSUESSUESSUESSUESSUES
Many of the problems in the financial sector are relatedto ailing SOEs that account for a large portion of banks’nonperforming loans. Two of the most difficult SOEreform issues are developing alternative methodsto provide the social security services traditionallyprovided by SOEs, and to redeploy redundant workers.
The unemployment situation worsened as aresult of the SOE reforms and the consequentbreakdown of the social security system that was builtaround the cradle-to-death employment practices ofSOEs. To cope with this, the government establishedan unemployment insurance scheme in the mid-1980s. This was strengthened in June 1998, with cen-tral government raising contributions to theunemployment fund from 1 to 3 percent of the enter-
prises’ total payroll, and requiring the employees tocontribute 1 percent. Until 1999, 15.8 million work-ers were covered by this scheme. The governmentintends to use the unemployment insurance systemnot only for expediting SOE reforms, but also for pen-sion fund contributions, medical insurance, and en-terprise industrial insurance. The reforms, when fullyimplemented, should provide a sound basis for enter-prise restructuring.
Another important institutional issue is to es-tablish a sound legal framework, essential for efficientfunctioning of a market economy. During the last twodecades, the transition to a market economy has out-paced the development of the legal and regulatoryframework. Many of the elements of the legal andregulatory system needed for a market economy tofunction efficiently are lacking or underdeveloped.The government has set a target to establish a frame-work for a market economy, and beginning in 1999, afive-year legislative work program will develop andrevise important economic laws and the correspond-ing implementing regulations. The laws covered in-clude company, bankruptcy, trust, antimonopoly andunfair competition, telecommunications, trademarkand patents, income and inheritance tax, governmentprocurement, and state assets laws.
ASIAN DEVELOPMENT OUTLOOK 200066
MongoliaMongoliaMongoliaMongoliaMongolia
Mongolia’s transition to a market economy, which began in 1990, has proceeded satisfactorily, andthe private sector is now the main producer of goods and services. The immediate challenges arereducing poverty and resolving the public sector imbalances that are the main barriers to growth andpromotion of private sector activity.
RECENT TRENDS AND PROSPECTSRECENT TRENDS AND PROSPECTSRECENT TRENDS AND PROSPECTSRECENT TRENDS AND PROSPECTSRECENT TRENDS AND PROSPECTS
In 1999, the economy remained adversely affectedby external factors, most notably continued low
international prices for Mongolia’s main exports ofcopper, cashmere, and gold and the ongoing economicinstability in Russia. The extensive dependence of thecountry on exports of primary commodities means thateven small changes in their international market pricescan measurably affect GDP. Real GDP growth reached3.5 percent in 1999, the same as the previous year,and slightly less than in 1997.
Inflation, which had declined to 6 percent by1998, increased to 10 percent by end-December 1999.The disruption in Russia—as well as increased worldprices for petroleum products and food items, parti-cularly meat products—contributed to the high rateof inflation at the year-end.
The trade balance improved somewhat in 1999.Consequently, the trade deficit declined from 14.5 per-cent of GDP in 1998 to 9 percent in 1999. The tugrikfell 18.9 percent against the dollar during 1999,compared with 10.9 percent in 1998, which helped
the trade balance. The current account balance alsoimproved in 1999, as the deficit narrowed to 4.7 per-cent of GDP compared with 11.9 percent in 1998.Gross international reserves increased to 14.3 weeksof import equivalent at the end of 1999, comparedwith 8.8 weeks of imports the previous year.
Fiscal performance improved slightly during1999, as the full impact of the mid-1998 revenuemeasures became effective and additional measureswere introduced in mid-1999. In May 1998, the gov-ernment announced a package of tax and revenue ex-penditure measures, which included increasing thevalue-added tax rate from 10 to 13 percent effectiveSeptember 1998, and increasing petroleum excise tax.These should yield budgetary savings of about 2 per-cent of GDP per year. Additional revenue-raising mea-sures, adopted by Parliament in May 1999, included auniform import duty of 5 percent and an excise tax onbeer, which were expected to yield revenue equiva-lent to 1 percent of GDP in 1999.
Partly because of these measures, tax revenuesincreased to 19 percent of GDP in 1999, comparedwith 17.5 percent in 1998. However, privatization

67PEOPLE’S REPUBLIC OF CHINA AND MONGOLIA
stalled because of Parliament’s resistance, so receiptsfrom the sale of government assets were substantiallybelow expectations. Total revenues and grantstherefore declined slightly to 26 percent of GDP in1999, from 27 percent in 1998. By cutting currentexpenditures, the government reduced total expen-diture to 36 percent of GDP in 1999, compared with39 percent the previous year. The overall fiscal defi-cit improved from 11.5 percent of GDP in 1998 to10 percent. Reducing dependence on externalconcessional finance can only be achieved throughmore focused public expenditure and improved rev-enue performance. The Asian Development Bank’sGovernance Reform Program Loan, which emphasizesreform in public expenditure management, will helpthis process.
Annual GDP growth is projected to climb0.5 percent in 2000 and another 0.5 percent in 2001,emanating from mining, manufacturing, and services.This growth rate could further accelerate if thegovernment’s privatization program gathers steam andbegins to contribute to economic efficiency.
Fiscal stability is expected to strengthen over themedium term because of the governance reformssupported by multilateral donors. The International
Monetary Fund’s Enhanced Structural AdjustmentFacility program, which was begun in mid-1997 andredefined as a Poverty Reduction and Growth Facilityin November 1999, also calls for fiscal reforms. Themain fiscal target for the government is to bring downthe overall budget deficit so it does not require excep-tional financing from concessional foreign sources.This implies reducing the overall deficit from the un-sustainable levels of about 11 percent of GDP to lessthan 4 percent. This would require improved tax ad-ministration, decreased current expenditures, andimproved public sector efficiency. It would also requirefocusing on operations in the private sector and oncurrent expenditures to avoid compromising devel-opment outlays.
The government is actively trying to increaserevenues. Total revenues and grants are forecast toincrease and stabilize at about 28 percent of the GDPin 2000-2001. Between 2000 and 2002, receipts fromprivatization are targeted to contribute 5-6 percent ofGDP to government revenues. This represents an am-bitious but achievable target. Current expenditures areprojected to increase but will be offset by reduced capi-tal expenditure. The ratio of total expenditure to GDPwill remain at 36 percent in 2000.
TTTTTable 2.6able 2.6able 2.6able 2.6able 2.6 Major Economic Indicators, Mongolia, 1997-2001 Major Economic Indicators, Mongolia, 1997-2001 Major Economic Indicators, Mongolia, 1997-2001 Major Economic Indicators, Mongolia, 1997-2001 Major Economic Indicators, Mongolia, 1997-2001(percent)
Item 1997 1998 1999 2000 2001
GDP growth 4.0 3.5 3.5 4.0 4.5
Gross domestic investment/GDP 25.3 27.3 — — —
Gross domestic savings/GDP 30.0 28.3 — — —
Inflation rate (consumer price index) 36.6 9.8 7.6 5.5 4.3
Money supply (M2) growth 32.5 -1.7 32.1 15.0 15.0
Fiscal balance/GDP -8.6 -11.5 -10.0 -9.4 -7.7
Merchandise exports growth 16.6 -12.1 2.8 12.8 14.3
Merchandise imports growth -1.5 9.5 -15.4 8.6 11.8
Current account balance/GDP 1.3 -11.9 -4.7 -9.5 -8.4
Debt service/exports 6.3 6.9 5.0 4.8 5.0
— Not available.
Sources: Bank of Mongolia; National Statistics Office; IMF; staff estimates.

ASIAN DEVELOPMENT OUTLOOK 200068
A relatively tight monetary policy is expectedto keep inflation in check for the medium term.Growth of broad money (M2) will average 15 percentannually in 2000-2001, which will provide sufficientliquidity while maintaining single-digit inflation.Government borrowing and credit to the public sec-tor from the Bank of Mongolia must be reducedsubstantially to allow credit to the private sector, andto keep interest rates from increasing because of toomuch credit demand. Interest rates on deposits willfall in line with inflation rates, but will be kept posi-tive in real terms to provide incentives for domesticsavings. With the expected restructuring of thebanking sector and improvement in banking practices,the efficiency and financial health of the major banksare expected to improve in the next three years. Thiscould help reduce lending rates to a level more suit-able for longer-term investment financing.
Prices of the main export commodities may notrecover substantially in the near future, although goldprices have strengthened. The balance of paymentsremains a challenge, and a depreciating tugrik couldcontribute to reduced consumer imports. The exter-nal current account will maintain a deficit of about10 percent of GDP in 2000, and decline to 7.5 percentover the medium term. Foreign capital inflows willhave to sustain these high external liabilities.
ISISISISISSUES IN ECONOMIC MANAGEMENTSUES IN ECONOMIC MANAGEMENTSUES IN ECONOMIC MANAGEMENTSUES IN ECONOMIC MANAGEMENTSUES IN ECONOMIC MANAGEMENT
Mongolia’s heavy dependence on exports of primarycommodities that are subject to wide price fluctuationshas made the task of macroeconomic stabilizationdifficult in the 1990s. Copper accounts for 26 percentof Mongolia’s exports, and cashmere another 10 per-cent. Revenues from the copper monopoly Edernetconstituted 11.3 percent of government revenues in1996, the year before international prices fell. Thisslowed to 10 percent in 1997 and 1.8 percent in 1998,as a sharp decrease in international prices of copperreduced the sector’s tax and dividend payments to thegovernment budget. The slump in export earnings alsoexposed the inherent weaknesses in the bankingsystem, worsening an already difficult situation in thefinancial sector. As large enterprises faced cash short-ages, drawdowns on bank deposits and increasednonperforming loans have severely affected corporate
liquidity and profitability. This situation was exacer-bated by persistent managerial and governance prob-lems in several big banks, political uncertainty, andinadequate supervision.
The immediate challenge facing the governmentis to put the financial sector and the fiscal balanceback on track. Otherwise, any efforts at reviving sus-tainable economic activity and employment genera-tion within the private sector could prove difficult.Recognizing this, the government has persevered inits efforts to reform the financial sector and promotefiscal discipline within the public sector.
POLICY AND DEVELPOLICY AND DEVELPOLICY AND DEVELPOLICY AND DEVELPOLICY AND DEVELOPMENT ISOPMENT ISOPMENT ISOPMENT ISOPMENT ISSUESSUESSUESSUESSUES
Since the start of its transition to a market economy,Mongolia has achieved commendable rates in eco-nomic growth along with reduction in inflation lev-els, privatization, and structural reforms in many areas.In the initial years of transition, with high export earn-ings and inflows of development aid replacing theformer subsidies from Moscow, the government con-tinued to help finance the social sector, housing, andheating (about 30 percent of some ministries’ budgetgoes to heating buildings). Public expenditures onhealth and education still are substantial. Conse-quently, standards of health and education achieve-ments are high.
However, Mongolia has been facing persistentlyelevated rates of poverty. The incidence of povertygrew from 15 percent of the population in 1991 to36 percent in 1996, and since then has remained stable.Simultaneously, the severity of poverty has increased.The increasing depth of poverty indicates that thecurrent development process does not generate suffi-cient opportunities for viable employment and income.The poor become poorer by depleting their last re-maining assets and because of a breakdown of familyand social support structures. This pattern reduces thechances for the poor to improve their situation with-out public assistance. This persistence of poverty, de-spite continued positive economic growth, is a seriouscause for concern.
Various developments since the transition to amarket economy may have contributed to this prob-lem. These include (a) lack of sufficient resources toaddress poverty reduction directly; (b) failure to

69PEOPLE’S REPUBLIC OF CHINA AND MONGOLIA
diversify the economy to generate more sustainableand inclusive growth; (c) externally financed infra-structure projects that tended to use capital-intensivetechnology with few employment effects; and (d) struc-tural changes in the real economy that evolved moreslowly than anticipated.
To combat poverty, the government is workingwith the Asian Development Bank to
• Generate more employment in the short tomedium term, mainly in urban areas, particularly theaimag (provincial government) centers where theincidence of poverty is high
• Encourage the private sector to create new em-ployment opportunities
• Improve the social safety net for the very poorwho may be beyond the reach of self-help oppor-tunities
• Help deliver needed social services to avoid fac-ing new forms of poverty at a later stage.
The recent growth performance has beencreditable, given the structural problems of theeconomy and the adverse external economic environ-ment. Growth will remain limited until the reformprocess is further strengthened.

71CENTRAL ASIAN REPUBLICS
KazakhstanKazakhstanKazakhstanKazakhstanKazakhstan
In 1999, the economy began to recover from a deep recession caused by the fall in world commodityprices and the Russian crisis. Nevertheless, to restore sustained economic growth along with macro-economic stabilization, the government needs to make greater efforts to accelerate enterprise restruc-turing and alleviate pervasive poverty.
RECENT TRENDS AND PROSPECTSRECENT TRENDS AND PROSPECTSRECENT TRENDS AND PROSPECTSRECENT TRENDS AND PROSPECTSRECENT TRENDS AND PROSPECTS
During 1999, the economy showed signs of recov-ery from the recession that had been caused by
the weak world commodity markets and the Russiancrisis that erupted in mid-August 1998. GDP grew by1.7 percent in 1999, a moderate turnaround comparedwith a 1.9 percent contraction in 1998. After a con-tinued decline in output during the first half of 1999,the recovery began in the second half. This resultedfrom a bumper harvest; a rebound in industrial pro-duction; an increase in capital investment; and risingworld prices for major commodity exports such as oil,gas, and metals.
The agriculture sector grew substantially in 1999,as favorable weather resulted in a good grain harvest.The output of grain totaled 14.3 million tons, morethan double the 1998 output. Kazakhstan planned toexport at least 3 million tons of grain to neighboringcountries such as Turkmenistan and Ukraine. Theoutput of cotton also grew sharply by 54 percent, whileproduction of livestock increased modestly.
Industrial output grew by 2.2 percent in 1999mainly because of the rebound in production of natu-ral gas and crude oil. In response to rising world prices,the output of gas and oil expanded by 51 percent and12 percent, respectively. Processing industries, whichaccount for more than half of the overall industrialoutput, also experienced growth, notably chemicals,metals, and textiles.
Capital investment expanded in 1999 toT277 billion as the government increased develop-ment expenditures to stimulate economic recovery.Because of the expansion, construction activitiesremained strong, while foreign investment continuedto flow into the oil and gas subsectors.
Officially, the registered unemployment rate atthe end of 1999 was 3.9 percent. However, actualunemployment was much higher because some stillofficially employed were on forced unpaid leave andmany other unemployed persons were not officiallyregistered. Due to mounting unemployment and thereduction in government social expenditures, povertyhas risen rapidly.

ASIAN DEVELOPMENT OUTLOOK 200072
In 1999, total government revenues accountedfor 21.2 percent of GDP while total governmentexpenditures were 24.7 percent, resulting in a budgetdeficit of 3.5 percent. This deficit was financed by re-ceipts from privatization and by foreign sources. Toimprove the fiscal situation, the government tookmeasures to strengthen tax collection and adminis-tration and rationalize public expenditures. However,the reduction in government expenditures resulted inarrears on payments of public sector wages, pensions,and benefits.
In 1999 monetary policy was designed and imple-mented to stimulate economic recovery while keepinginflation under control. The refinancing rate was re-duced three times during the year, from 25 to 18 per-cent, and the requirement that exporters must sell50 percent of their export earnings to the central bankwas abolished in November. The rate of inflation was17.8 percent, compared with 1.9 percent in 1998,largely because of currency devaluation. However,
while inflation increased in 1999, there has been sub-stantial progress in reducing inflation since 1995, eventhough it has been difficult to sustain a pattern ofgrowth in GDP (see figure 2.3). The national currency,the tenge, depreciated sharply against the dollar afterthe government floated the currency in April 1999, be-fore stabilizing somewhat in the second half of the year.
The balance-of-payments situation improved,with a sharp reduction in the current account deficitfrom 5.5 percent of GDP in 1998 to 1.7 percent in1999. This resulted mainly from the trade surplusof $776 million in 1999—compared with a deficit of$801 million the previous year—because imports de-clined more sharply than exports. Exports climbed inthe second half of 1999 because of the rising world oilprice and the effect of the currency devaluation. Forthe whole year, however, exports decreased by 4.8percent while imports fell by 28.2 percent.
Foreign direct investment declined in 1999, asinvestors remained cautious after the Russian crisis.

73CENTRAL ASIAN REPUBLICS
However, as the first Commonwealth of IndependentStates country to return to the global capital marketsafter the Russian crisis, Kazakhstan issued new inter-national bonds totaling $300 million during the pe-riod from September to November 1999, the thirdoffering since independence. By the end of 1999, grossinternational reserves totaled $2 billion (four monthsof import equivalent). External debt increased in 1999while the debt-service ratio declined slightly from 26percent in 1998 to 25 percent in 1999.
The economic outlook for 2000 appears posi-tive. GDP is projected to grow by about 3 percent,driven by a continuing upward trend in revenue fromthe major export commodities and by economic re-covery in Russia. The budget deficit will likely shrinkto about 3 percent of GDP, as the government is com-mitted to achieve medium-term sustainability of pub-lic finance. The annual rate of inflation is projectedto decline to about 13 percent, provided the centralbank keeps tight control on credit growth and moneysupply. The balance-of-payments situation shouldcontinue to improve. Exports are expected to growsteadily and inflows of foreign capital should increase.
ISISISISISSUES IN ECONOMIC MANAGEMENTSUES IN ECONOMIC MANAGEMENTSUES IN ECONOMIC MANAGEMENTSUES IN ECONOMIC MANAGEMENTSUES IN ECONOMIC MANAGEMENT
The government has developed an economic programfor 2000-2002 aimed at promoting economic growthand achieving macroeconomic stabilization. The pro-gram, supported by the International Monetary Fundunder a three-year Extended Fund Facility approvedin December 1999, focuses on adopting prudent fis-cal policies that consolidate public finances, pursu-ing a tight monetary policy to reduce inflation whilemaintaining a free-floating exchange rate, and accel-erating structural reforms. In the fiscal area,Parliament approved a more prudent governmentbudget for 2000, which requires raising tax revenue,reforming the tax code, strengthening tax and cus-toms administration, and improving public expendi-ture management.
The central bank will strengthen its supervisoryactivities to ensure that all banks comply with en-hanced prudential requirements. Meanwhile, the cen-tral bank will continue to intervene on the currencymarket to prevent excessive short-term exchange ratefluctuations. The government will maintain efforts to
liberalize the trade system, removing the tariffs im-posed on its major trading partners in early 1999 andfurther reducing trade barriers. As part of the struc-tural reform programs, the government will restruc-ture the financial and corporate sectors, accelerateprivatization of medium-size and large state-ownedenterprises, improve governance, strengthen transpar-ency, develop legal and regulatory frameworks neces-sary for a market-based economy, and fight corruption.These steps will help improve the quality of publicservices and promote private sector development.
POLICY AND DEVELPOLICY AND DEVELPOLICY AND DEVELPOLICY AND DEVELPOLICY AND DEVELOPMENT ISOPMENT ISOPMENT ISOPMENT ISOPMENT ISSUESSUESSUESSUESSUES
Despite the positive short-term economic prospects,Kazakhstan needs to take concerted action on manyfronts to accelerate economic recovery and realizeequitable long-term development. The most impor-tant tasks are accelerating enterprise restructuring andstrengthening poverty alleviation efforts.
Enterprise restructuring revives the corporatesector and enables private sector development, whichare critical for economic growth. An effective andgrowing corporate sector would increase employmentopportunities and thus benefit the poor. While thegovernment has taken initial steps on enterpriserestructuring, especially in privatizing state farms,agribusiness, and small and medium-size industrialenterprises, the corporate sector remains weak. Manyenterprises have limited operational experience in amarket-based economy. Old management remains incontrol of some privatized enterprises, while the gov-ernment continues to intervene in operations of priva-tized or corporatized enterprises. In addition, manystate-owned enterprises are experiencing difficultiescaused by poor management, inefficient organizationalstructures, shortcomings in the incentive system, andinternationally unacceptable accounting standards.This has resulted in extensive corporate losses andinterenterprise arrears. About half of all enterpriseswere estimated to be unprofitable in 1999. By October1999, total domestic corporate debts payable amountedto T1.8 trillion, a 25 percent increase over the sameperiod of 1998.
Enterprise restructuring is imperative to developan efficient corporate sector, and three major actionsneed to be taken. First, bankruptcy and merger pro-

ASIAN DEVELOPMENT OUTLOOK 200074
ceedings should be enforced. Strong efforts should bemade to formulate the necessary legal and regulatoryframeworks for implementing bankruptcy and mergerprocedures. All nonviable enterprises should be liqui-dated through bankruptcy to reallocate resources tomore efficient producers. Money-losing enterprisesthat can be salvaged should be merged with efficientones, to render them profitable by changing their in-centives and governance structures. Second,privatization should be accelerated. Whenever pos-sible, the government should sell the remaining state-owned enterprises, especially large ones, in all thenonstrategic sectors. In particular, foreign participa-tion in large companies—both capital and manage-ment— should be allowed during privatization. Third,corporate governance should be improved througheffective management structures and internationallyaccepted accounting and auditing standards and man-ager training programs.
Poverty has climbed because of persistent eco-nomic difficulties after attaining independence in 1991,and is now a serious problem. The government indi-cates that 43 percent of the population lived belowthe poverty line in 1999. Poverty is also more perva-sive in rural areas than in urban ones.
Fighting poverty in the medium term is essen-tial to maintain social stability and public support forthe government’s macroeconomic stabilization effortsand structural reforms. From a long-term perspective,it is the key objective of development. Strong actionneeds to be taken to reduce and eventually eliminatepoverty. The government planned to develop a na-tional program on poverty reduction by April 2000.Greater efforts are needed in three areas.
First, the government needs to promote pro-poor, sustainable economic growth. Such growth willgenerate more income and government revenuesneeded to finance the social safety net. The govern-ment should pursue policies that encourage labor-intensive sectors, promote private sector development,and help small enterprises expand. Measures couldinclude orienting public investment toward poor ar-eas, promoting self-employment, providing incentivesfor job training and retraining, and supporting the poorthrough microfinance programs.
Second, the government needs to formulate andimplement a comprehensive national poverty reduc-tion strategy. An appropriate poverty line should bedefined; a reliable database set up; and a comprehen-sive study undertaken to examine causes, constraints,and opportunities for poverty reduction. The gov-ernment should also stipulate policies and programsdesigned for raising the incomes of the poor. Adequatebudgetary resources for basic social services and so-cial assistance to the poor should be allocated and themost vulnerable groups targeted. Particular attentionshould be paid to women, who usually suffer morefrom poverty, and have limited access to essentialsocial services and assistance.
To formulate and implement the poverty reduc-tion strategy, nongovernment organizations should beencouraged to identify and assist the targeted groups,and the private sector should be permitted to providebasic social services and social assistance to the poor.These efforts should be complemented by continuedreforms in the education and health sectors to deliverthese services more efficiently, and to strengthen thesocial security system that provides incentives for self-employment and job training.
Last, efforts should be made to improve gover-nance. Aside from increasing the efficiency of thepublic sector, good governance also facilitates formu-lating and implementing pro-poor policies and thepoverty reduction strategy. Public administration andexpenditure management at both national and locallevels must be strengthened to promote pro-poorgrowth and social development. In particular, stronginstitutional capacity is needed at the local level, be-cause local governments and communities are prima-rily responsible for delivering basic public services andproviding social assistance to the poor. Meanwhile,the central government must develop the mechanismto closely monitor budgeted social assistance programs.It should also establish effective regulations to ensurethe accountability of public funds used for povertyreduction. Strong measures must be undertaken tofight corruption and waste of public resources. Theseefforts will contribute to effective and efficient deliv-ery of basic public services and successful implemen-tation of targeted antipoverty programs.

75CENTRAL ASIAN REPUBLICS
KKKKKyrgyz Republicyrgyz Republicyrgyz Republicyrgyz Republicyrgyz Republic
For the second consecutive year, economic performance in the Kyrgyz Republic was modest.The government must persevere in reforms to push the economy toward more rapid and sustainablegrowth and higher living standards.
RECENT TRENDS AND PROSPECTSRECENT TRENDS AND PROSPECTSRECENT TRENDS AND PROSPECTSRECENT TRENDS AND PROSPECTSRECENT TRENDS AND PROSPECTS
RRRRReal GDP grew by 3.6 percent during 1999, higherthan the 2.1 percent in 1998 when the Russian
crisis broke out. As in 1998, the agriculture sector pro-duced the best performance, and grew by 8.7 percent.Production of all major crops increased, except forgrain and wheat, which decreased slightly. The ser-vice sector edged up 1.8 percent. Industrial produc-tion declined by 2.4 percent, and gold production atthe Kumtor mine also decreased.
The weak fiscal situation continued during 1999.Total government revenue as a percent of GDPincreased slightly to 18.1 percent. However, taxes fellshort of the planned level, due mostly to the slow-down in imports caused by the steep depreciation ofthe som. The tax revenue collection relies heavily onindustry, and the poor industrial performance also con-tributed to the shortfall in tax revenue. Nontax rev-enue and grants remained weak. Total expenditurefell about 1 percent of GDP to 28.3 percent, higherthan planned because of unanticipated spending re-lated to a foreign terrorist incursion in the southern
province of Osh. The total fiscal deficit remained high,at more than 10 percent of GDP. Because of the weak-ened fiscal situation, both budget and pension arrearsrose steeply.
The money supply (M2) rose at a slightly higherrate in 1999 than in 1998, and inflation more thandoubled from 16.8 percent to nearly 40 percent. Infla-tion had been rising since the fourth quarter of 1998,primarily because of the weakness of the som, causedby a continued lack of public confidence triggered bythe Russian crisis of August 1998. During 1999, thesom lost another 35 percent of its value to the dollar,after a 32 percent loss between end-August and end-December 1998. Public confidence was further shakenby a major financial fraud involving most of the larg-est commercial banks. A swift and satisfactory resolu-tion would help restore public confidence in thefinancial sector and the currency.
Total external trade in 1999 declined by about25 percent compared with the previous year. Importsdeclined by nearly 30 percent and exports around19 percent. Consequently, both trade and current ac-count balances improved, with the latter at 12 percent

ASIAN DEVELOPMENT OUTLOOK 200076
of GDP, nearly half the deficit of 1998. The savingsrate was negative for the second year in a row, whilethe investment rate was around 12 percent. The re-source gap of more than 12 percent of GDP mirrorsthe current account deficit and reflects a lack of do-mestic savings in a weak economy. International re-serves rose to a level equivalent to more than fourmonths of imports as inflows of concessional assistanceexceeded the current account deficit. External debt(public and publicly guaranteed) stood at about $1.3billion at the end of 1999, an increase of about $150million from December 1998.
While the economy is capable of growing4-5 percent per year, the unfavorable domestic andexternal conditions will likely slow growth to within2-3 percent in 2000 and 2001. Tighter monetary policywill cut inflation in 2000 by half to about 20 percent,and reduce currency depreciation. If measures de-signed to enhance revenue and reduce expendituresare followed consistently, the overall fiscal deficit coulddecrease to about 7.4 percent of GDP. Both imports
and exports are expected to grow moderately, withthe current account deficit projected to decrease to10.5 percent of GDP for 2000. With weak foreign in-vestments, both direct and portfolio, the country willcontinue to rely on foreign official assistance, mostlyon concessional terms, and public and publicly guar-anteed debts will accumulate to about $1.5 billion bythe end of 2000.
ISISISISISSUES IN ECONOMIC MANAGEMENTSUES IN ECONOMIC MANAGEMENTSUES IN ECONOMIC MANAGEMENTSUES IN ECONOMIC MANAGEMENTSUES IN ECONOMIC MANAGEMENT
While the country made major efforts in reachingagreement with the International Monetary Fund tostart the enhanced structural adjustment facility pro-gram in 2000, it faces serious challenges in implement-ing macrostabilization and structural reforms. Besidesa continued tight monetary policy, the governmentmust make extra efforts to cut spending while increas-ing revenue collection. On the revenue side, the fo-cus should continue to be on broadening the tax baseand increasing tax compliance for better tax collec-

77CENTRAL ASIAN REPUBLICS
tion. Frequent changes to the tax code and ambigu-ous interpretation of the tax law discourage businessactivity and encourage tax evasion. It is essential,therefore, to maintain a stable tax environment. Thecurrent system of interpreting the tax code and grant-ing arbitrary exemptions creates more uncertainty,especially among small and medium-size enterprises.It also discourages risk taking by both domestic andforeign entrepreneurs and reduces the incentive toinvest. Indirect tax collections have improved, butrevenues from direct taxes remain low and below tar-get. Because about one fourth of the working popu-lation pays little or no tax, the potential payoff fromincreased tax efforts is high, particularly regardingdirect taxes.
On the expenditure side, efforts should be con-centrated on cutting subsidies, especially indirect ones,and shifting expenditures to sectors that are likely tocontribute to strong long-term growth. Direct subsi-dies to state-owned enterprises (SOEs) should bephased out as well as indirect subsidies for gas andelectricity consumers. Existing utility tariffs do notreflect full costs and are not designed to absorb shockssuch as exchange rate depreciation. Losses by utilitycompanies also contribute to the government’s weakfiscal position.
Fiscal management also needs to be improved.In particular, better coordination between theTreasury and the Ministry of Finance is required.Efforts to reorganize the fiscal management systemare under way. These include strengthening linkagesbetween the Treasury, the Ministry of Finance, andthe National Bank of the Kyrgyz Republic, and theyshould be monitored for effectiveness.
On the structural side, progress in promotingprivate sector development has been slow, and priva-tization of large SOEs continues to lag. Major govern-ment efforts, including privatization and restructuringof the SOEs, will be needed to develop the privatesector. Changes may be difficult to implement, con-sidering that both the parliamentary and presidentialelections occur in 2000.
POLICY AND DEVELPOLICY AND DEVELPOLICY AND DEVELPOLICY AND DEVELPOLICY AND DEVELOPMENT ISOPMENT ISOPMENT ISOPMENT ISOPMENT ISSUESSUESSUESSUESSUES
Historically, the Kyrgyz Republic was one of the poor-est regions in the former Soviet Union, and in the
five years following independence in 1991 cumulativeoutput fell by about 50 percent. As a result, in 1997an estimated one half of the population lived belowthe official poverty line, the equivalent of less than$0.75 per day.
The economic recovery that began in 1996 wasrobust. However, it has lagged since the Russian cur-rency crisis of August 1998, and real wages are likelystill lower than they were in 1992. Due to the depthand severity of poverty, a significant improvement inliving standards will require a sustained and broad-based effort by the government and long-term sus-tained economic growth. The fundamental picture ofpoverty is unlikely to have changed substantively inthe last two years.
Although on national average one in twopersons is poor, 80 percent of the poor live in ruralareas. The degree of poverty in rural areas has alsodeteriorated relative to urban areas. While extremepoverty decreased from 19.1 percent of the popula-tion in 1996 to 14.8 percent in 1997, most of this re-sulted from a targeted poverty reduction program inurban areas only. Poverty also appears to affect morewomen than men.
Realizing that widespread poverty is the mainobstacle to improving the welfare of the people, thegovernment has an ongoing national initiative, theArakat program. The government is waging major ef-forts to revamp its poverty-fighting strategy and re-lated policies in coordination with major donors,including the Asian Development Bank and the WorldBank. It must consider carefully three issues.
First, because poverty is most severe in the ruralareas, lifting rural and agriculture development abovethe current level of subsistence farming must be thecore in formulating an effective poverty reduction strategy(see figure 2.4). Some farm households apparentlyengage in both agricultural and nonagricultural wagelabor, which suggests a range of income-generatingactivities. Policy may need to pay more attention topromoting off-farm employment and secondary(nongrain) food crops, livestock, and horticulture.
Second, policies should aim to increase the qual-ity of life as well as income. Social infrastructure spend-ing needs to be increased, especially in rural areas.About 45 percent of the rural population has no ac-cess to potable water versus only 15 percent in urban

ASIAN DEVELOPMENT OUTLOOK 200078
areas. About 95 percent of those in rural areas stilluse latrines, compared with 47 percent in urban ar-eas. Centralized systems for heating, water supply, andgas distribution are lacking in rural areas, and the qual-ity and reliability of electric power supply and distri-bution is much lower than in urban areas.
Third, private sector development efforts shouldbe strengthened. Substantial progress has been madein adopting markets and stimulating the private sectorsince independence, including price and trade regimeliberalization and substantial privatization. By the endof 1997, the private sector accounted for about 65 per-cent of GDP, the highest private sector share amongformer Soviet republics. Nevertheless, the governmentshould strengthen its role in creating an environment
that encourages private sector growth, and in estab-lishing and enforcing transparent rules and simple pro-cedures. For example, despite decrees and resolutions,small and medium-size enterprises still require 27 clear-ances to register a business.
The role of the government is still evolving andfacing many questions. What are the functions of thegovernment in this era of transition? How can the gov-ernment optimally participate in building and main-taining a legal and regulatory framework for economicdevelopment and poverty reduction? Answers to thesequestions will guide the government in reorganizingits structure and staffing and making it more suited tomeet the long-term challenges of reducing poverty andpromoting economic growth.
79CENTRAL ASIAN REPUBLICS
TTTTTajikistanajikistanajikistanajikistanajikistan
The Russian financial crisis, the deterioration in terms of trade, and adverse weather haveslowed Tajikistan’s economic recovery. Redoubled efforts in privatization and structural re-forms, as well as continued commitment to the peace process, are necessary to promote eco-nomic growth and prosperity.
ment and underemployment in inactive state-ownedenterprises and rural areas. Moreover, many of theunemployed have not registered because of the lowunemployment benefits.
Budget overruns and weak tax administrationwidened the budget deficit during the first three quar-ters of 1999. However, the authorities intensified rev-enue collection and rationalized expenditures in thefourth quarter. As a result, the deficit fell to 3.1 per-cent of GDP in 1999 after a 3.8 percent deficit the previ-ous year. The deficit is being financed by concessionalborrowing from multilateral lending institutions,privatization proceeds, and an issue of Treasury bills.
The Russian f inancial cris is damagedTajikistan’s economy. After enjoying more than ayear of hard-won stability, the official exchange rateof the Tajik ruble against the dollar depreciated 47.5percent from August 1998 to August 1999. Sincethen, however, the exchange rate has remainedstable, and will likely depreciate more gradually asthe Russian economy improves.
Since June 1997, the authorities have pursued atight monetary policy to reduce inflation, which fell
RECENT TRENDS AND PROSPECTSRECENT TRENDS AND PROSPECTSRECENT TRENDS AND PROSPECTSRECENT TRENDS AND PROSPECTSRECENT TRENDS AND PROSPECTS
SSSSSince its civil war ended in 1997, Tajikistan hasmade significant progress in creating a stable
macroeconomic environment and implementingmarket-oriented reforms. However, economic growthslowed in 1999 with real GDP growing 3.7 percent (seefigure 2.5). This decrease reflects the adverse effectsof the Russian financial crisis, the deterioration inTajikistan’s terms of trade, and adverse weather.
Agriculture is a key sector of the economy,contributing 20 percent to GDP and accounting for60 percent of employment. Agricultural productionincreased by 3.8 percent in 1999, but production ofcotton (the country’s most important cash crop) andgrain fell by 17.6 and 20 percent, respectively, becauseof bad weather and limited financing. Industrial pro-duction grew 5 percent in 1999, led by aluminum, elec-tricity, and wood and timber. Production of aluminum,the major export, increased 20 percent.
The official unemployment rate was 3.1 percentin 1999, but actual unemployment was close to 30 per-cent. The official data do not account for unemploy-

ASIAN DEVELOPMENT OUTLOOK 200080
from 159.8 percent in 1997 to 2.7 percent in 1998.However, the currency devaluation between August1998 and August 1999 renewed inflationary pressures.Tajikistan faced more shocks in 1999 when prices ofkey commodities increased. In August, fuel prices rose50 percent and bread prices 20 percent as the effectsof the low grain harvest began to manifest themselves.Administrative price increases in electricity and gaso-line also contributed to inflation, which increased to24 percent in 1999.
Tajikistan continued its liberal trade regime in1999. In 1998, a uniform tariff of 5 percent was leviedon most major imports. In February 1999, Tajikistanjoined the customs union of the Commonwealth ofIndependent States, and raised its average tariff rateto 8 percent. However, the government remains com-mitted to a liberal trade regime and announced that itwill apply for World Trade Organization membership,emphasizing that it will not introduce trade policiesthat violate the organization’s policies.
The trade balance faces substantial instabilitybecause of the lack of diversity in exports and the vola-tility in their prices. More than three fourths ofexport earnings come from cotton and aluminum. In1998, the trade balance deteriorated sharply whenworld market prices for both of these products de-creased, but recovered in 1999 when the price of alu-minum rebounded. Export earnings from aluminumincreased 36 percent, although earnings from cottondeclined 18 percent as cotton’s price continued to fall.The appreciation of the Tajik ruble against the Rus-sian ruble after the Russian crisis caused decreasedexports to former Soviet countries in 1999. However,diversifying trading partners since independence cush-ioned the effects of the crisis. For example, Tajikistansells cotton and aluminum mostly to countries thatwere not in the former Soviet Union.
The debt-service burden continues to be heavy.In April 1999, however, Russia agreed to reduceTajikistan’s debt more than 50 percent. Agreements

81CENTRAL ASIAN REPUBLICS
were also signed with Kazakhstan, Kyrgyz Republic,Turkey, and Uzbekistan. The European Union, India,and Pakistan also indicated a willingness to rescheduleTajikistan’s debt. Consequently, the foreign debtservice fell from $181 million (34.4 percent of exports)in 1996 to $29 million (7.6 percent of exports) in 1999.However, because of the currency depreciation, thedebt-to-GDP ratio increased from 91.4 percent in 1998to 97.2 percent in 1999.
POLICY AND DEVELPOLICY AND DEVELPOLICY AND DEVELPOLICY AND DEVELPOLICY AND DEVELOPMENT ISOPMENT ISOPMENT ISOPMENT ISOPMENT ISSUESSUESSUESSUESSUES
Continued progress in the peace process is the mostcrucial factor in maintaining a stable macroeconomicenvironment that will foster economic developmentand promote investor confidence.
The peace process made significant progress in1999. The United Tajik Opposition announced inAugust 1999 that it had completed disarming opposi-tion fighters and integrating them into the Tajik armedforces. The United Tajik Opposition emphasized thatit is no longer an armed opposition, but only a politi-cal opposition. The Supreme Court subsequently liftedthe 1993 ban on opposition parties. Security condi-tions also improved in much of the country. However,the presidential election in November was criticizedby domestic and international observers for irregulari-ties and strained relations between the governmentand the opposition.
Only 35 percent of recorded GDP is generatedin the private sector. However, privatization of smallenterprises accelerated in 1999, and in December, thegovernment announced that its privatization programfor small enterprises was complete. Moreover, bySeptember 1999, half of state and collective farms hadbeen dismantled, 45 percent of arable land was in pri-vate hands, and 63,000 marketable land share certifi-cates were distributed to individual farmers.Privatization of medium and large state-owned enter-prises lagged, however, and only seven of 23 cottongin mills had been sold by October 1999. Problemsincluded unrealistic pricing by the government anddelayed payments by buyers. The government has alsobeen slow in restructuring the two largest firms—theelectricity monopoly Barki Tajik and the aluminumsmelter TADAZ.
The banking sector has performed poorly since1991 because of weak management skills, directedcredits, an inadequate legal and regulatory framework,and a background of political and macroeconomicinstability. Consequently, a large proportion of bankloans is nonperforming. Confidence in the bank-ing sector is diminished, which keeps deposits lowand severely limits commercial credit expansion.Given the importance of this sector, the authoritiesare restructuring it.
The first round of restructuring was completedin November 1998, and progress was made in reducingbank staff, improving management practices, and ex-panding the capital base. In 1999, new prudential regu-lations reduced the number of banks from 26 to 16, asseveral weak banks were liquidated or merged withother banks. In April 1999, the National Bank ofTajikistan, the central bank, took over one of the bigfive banks to liquidate it because of noncompliancewith prudential regulations, an action that should setan important example for other banks.
Agricultural finance has been especially con-strained in recent years. Financing for the newly pri-vatized “peasant farms” is virtually nonexistent, as thecurrent rural finance system is not designed to accom-modate them. Consequently, farmers have been forcedeither to borrow from moneylenders, enter into for-ward contracts with suppliers and traders at unfavor-able terms, or limit production. The need to developsustainable rural financial institutions is crucial.
Because of the sharp economic contraction sinceindependence, the government’s ability to providebasic social services has been severely strained, andthe estimated poverty rate is 83 percent. Althoughthe political and economic situation has stabilizedsomewhat since 1997, the Russian financial crisis andthe deterioration in Tajikistan’s terms of trade in 1998and 1999 have exacerbated fragile living conditions.In the past two years, the country was also hit by ma-jor floods that destroyed or damaged infrastructure,homes, and crops. However, the existing social safetynet remains inadequate and poorly targeted. With ahigh incidence of poverty and the government’slimited resources, the need to reform and strengthenthe social safety net is urgent.

ASIAN DEVELOPMENT OUTLOOK 200082
UzbekistanUzbekistanUzbekistanUzbekistanUzbekistan
GDP growth of 4.4 percent in 1999 was maintained, although international prices for Uzbekistan’sprimary exports continued to be weak. Major structural reforms to sustain macroeconomic stabilityand growth are necessary, as well as policy measures to ameliorate the short-term social effects ofthese reforms.
RECENT TRENDS AND PROSPECTSRECENT TRENDS AND PROSPECTSRECENT TRENDS AND PROSPECTSRECENT TRENDS AND PROSPECTSRECENT TRENDS AND PROSPECTS
DDDDDespite the difficult macroeconomic environmentand the repercussions from the Russian and
Asian economic crises, real GDP grew by 4.4 percentin 1999, the same as the previous year (see figure 2.6).Growth was spurred mainly by agriculture and indus-try. The agriculture sector did not experience inclem-ent weather as it did during 1996-1998, and hencewitnessed an across-the-board increase in output thatincluded cotton, the most important export crop. Ag-ricultural output increased by 5.9 percent in 1999 com-pared with a 4 percent increase in 1998. However,the soft prices in international commodity markets forcotton and for gold, the other important export com-modity, reduced total export earnings.
Industrial production increased by 6.1 percent,and construction services by 3.9 percent, boostingoverall economic growth. Growth of the service sec-tor also contributed significantly to real GDP growth,despite the government’s policy of restricting importsof consumer goods that in turn constrained privatetrading. Nevertheless, by opening the service sector
to private initiatives, this sector and nongovernmentemployment grew rapidly. The fiscal situation contin-ued to improve in 1999 as the government maintainedits efforts to reduce the budget deficit. The consoli-dated budget deficit contracted to 2.2 percent of GDPfrom 3.4 percent in 1998, reflecting progress in fiscalmanagement.
Despite the tight monetary and fiscal policiesmaintained by the government, average monthlyinflation was 1.9 percent, about 26 percent annually,as in the previous year. The principal cause of infla-tion was the rapid depreciation of the sum by about27.3 percent during the year.
The balance of payments remained under pres-sure in 1999. The Russian crisis, a bad cotton harvestin 1998, and falling world commodity prices contrib-uted to the substantial deterioration in external bal-ances. The government responded by furtherrestricting imports, tightening access to foreign ex-change, and increasing foreign borrowing to financepublic investments. Although the government con-tinued to restrict the import of consumer goods, thecurrent account deficit widened to 1.3 percent of GDP
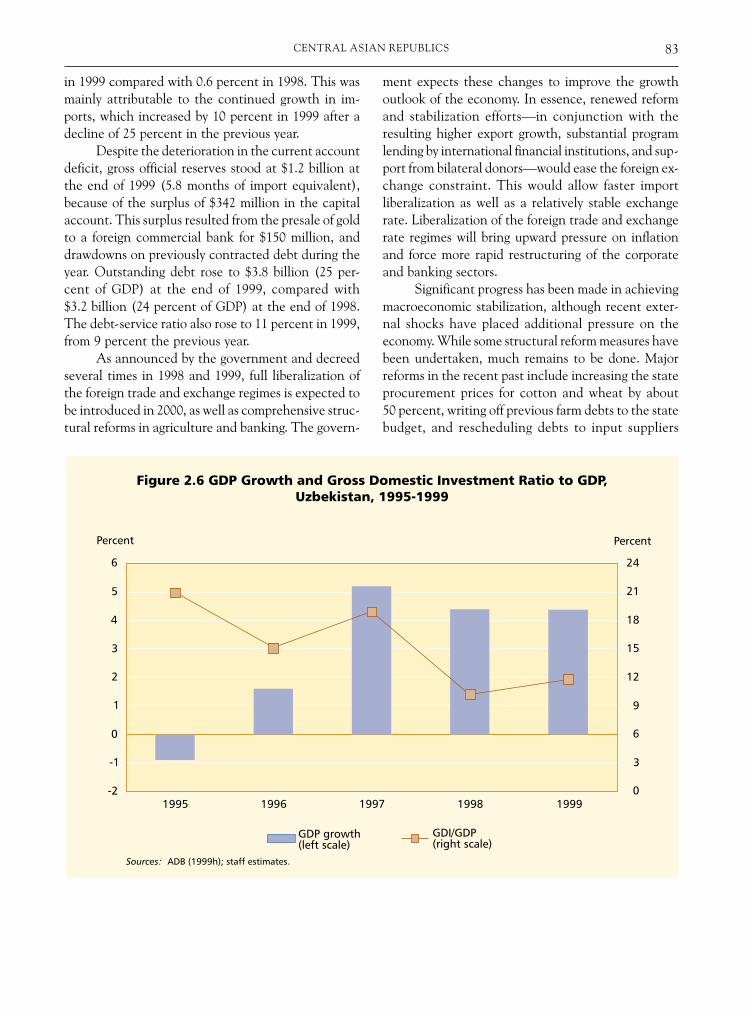
83CENTRAL ASIAN REPUBLICS
in 1999 compared with 0.6 percent in 1998. This wasmainly attributable to the continued growth in im-ports, which increased by 10 percent in 1999 after adecline of 25 percent in the previous year.
Despite the deterioration in the current accountdeficit, gross official reserves stood at $1.2 billion atthe end of 1999 (5.8 months of import equivalent),because of the surplus of $342 million in the capitalaccount. This surplus resulted from the presale of goldto a foreign commercial bank for $150 million, anddrawdowns on previously contracted debt during theyear. Outstanding debt rose to $3.8 billion (25 per-cent of GDP) at the end of 1999, compared with$3.2 billion (24 percent of GDP) at the end of 1998.The debt-service ratio also rose to 11 percent in 1999,from 9 percent the previous year.
As announced by the government and decreedseveral times in 1998 and 1999, full liberalization ofthe foreign trade and exchange regimes is expected tobe introduced in 2000, as well as comprehensive struc-tural reforms in agriculture and banking. The govern-
ment expects these changes to improve the growthoutlook of the economy. In essence, renewed reformand stabilization efforts—in conjunction with theresulting higher export growth, substantial programlending by international financial institutions, and sup-port from bilateral donors—would ease the foreign ex-change constraint. This would allow faster importliberalization as well as a relatively stable exchangerate. Liberalization of the foreign trade and exchangerate regimes will bring upward pressure on inflationand force more rapid restructuring of the corporateand banking sectors.
Significant progress has been made in achievingmacroeconomic stabilization, although recent exter-nal shocks have placed additional pressure on theeconomy. While some structural reform measures havebeen undertaken, much remains to be done. Majorreforms in the recent past include increasing the stateprocurement prices for cotton and wheat by about50 percent, writing off previous farm debts to the statebudget, and rescheduling debts to input suppliers

ASIAN DEVELOPMENT OUTLOOK 200084
until 2002. Farmers received a substantial reductionin tax burden, partly because various agricultural taxeswere consolidated into a single unified land tax. Othertax relief measures included granting a three-year taxbreak to newly established private farms and estab-lishing Rural Business Advisory Centers in all the ray-ons (counties) to provide business advisory andextension services to private farmers.
Prospects for 2000 are mixed. If the planned re-forms occur in the foreign exchange and trade regimes,the temporary adverse macroeconomic consequenceswill likely slow GDP growth in the short run. How-ever, once the relative price and structural adjustmentsare completed, real GDP is likely to grow steadily un-til the economy attains its full growth potential. GDPgrowth is therefore projected to contract to about3 percent in 2000. The unification of the exchangerate will also lead to a one-time jump in the inflationrate. The fiscal situation is likely to be strained as theslowing of economic growth reduces tax revenues. Thegovernment’s attempts to develop an effective socialsafety net—to protect the most vulnerable in societyand provide financial assistance to critical industriesnegatively affected by the reform program—will alsostrain the fiscal situation. Nevertheless, the govern-ment’s target budget deficit in the 2000 budgetapproved by Parliament is 3 percent of GDP. TheInternational Monetary Fund deems this level ofbudget deficit temporary and sustainable.
Despite the strain on the internal balance, ob-servers expect the external balance to improve some-what in 2000, and to continue to improve graduallyover the medium term. The deficit in the current ac-count is expected to narrow to 1 percent of GDP in2000 mainly because of the recovery in export growth.Once the reform program is implemented, a steadyrecovery in exports and an increase in imports shouldresult. These will support much-needed technicalrenovations in the state-owned enterprise sector. In-creases in energy and manufactured exports in themedium term, resulting from growing demand inneighboring countries, are projected to boost exportgrowth. Because grain production has improved to lev-els of near self-sufficiency, grain imports will likely bemodest. A surplus on the capital account would suf-fice to finance the current account deficit. Inflows offoreign direct investment (FDI) and long-term debt
from multilateral and bilateral sources also are ex-pected to increase, given the improved investmentclimate expected from the reform program.
With the completion of the foreign exchangeand trade reforms in 2000 and the relative priceadjustments, GDP growth is forecast to increase to4 percent in 2001, with inflation contained at 20 per-cent per annum. The deficit in the budget is forecastto widen slightly to 3 percent of GDP in 2001; expen-ditures will be increased to support the social safetynet necessitated by the economic reform program. Thecurrent account deficit is also anticipated to increaseto 2 percent of GDP in 2001, mainly because ofincreased imports.
ISISISISISSUES IN ECONOMIC MANAGEMENTSUES IN ECONOMIC MANAGEMENTSUES IN ECONOMIC MANAGEMENTSUES IN ECONOMIC MANAGEMENTSUES IN ECONOMIC MANAGEMENT
The presidential decree of 1 July 1998 stated thatUzbekistan would introduce current account convert-ibility by the end of 2000. Significant efforts are underway to make this objective a reality. Introduction ofcurrent account convertibility would help increaseexports and attract greater FDI. It would also stemthe capital outflows that have troubled the economysince late 1996. The Partnership and CooperationAgreement with the European Union of July 1999 wasa significant step toward integrating Uzbekistan withthe world economy. In an attempt to boost exports,the government cut the profit tax from 35 percent to30 percent in June 1999. Simultaneously, it allowedpayment of value-added tax to be delayed for up to90 days on imported goods used in the production ofexports. However, the multiple exchange rate systemcontinued to restrain export growth and FDI.
The government’s privatization program, espe-cially for large-scale enterprises, appears to have en-countered difficulties because of limited foreigninvestor interest. The main problem remains thegovernment’s reluctance to offer majority stakes tostrategic investors. Other problems are unrealistic priceexpectations, a difficult investment environment, andfalling commodity prices in world markets. The mainconcern is that, although the management of thecorporatized and privatized enterprises is supposed tobe autonomous, the ownership patterns and the cur-rent regulatory regime are not sufficiently developedto prevent state interference.

85CENTRAL ASIAN REPUBLICS
Financial sector reforms are being expeditedunder a $25 million World Bank loan approved inJune 1999. The project aims to strengthen corporategovernance in commercial banks, improve thesupervisory functions of the central bank, and increasethe openness of the sector to foreign entry. The keyshort-term issues for the government include continu-ing reforms in the financial and corporate sectors,adopting policies to stimulate noninflationaryeconomy growth, and providing a social safety netprogram to offset the anticipated social costs of liber-alizing the foreign exchange and trade regimes.
POLICY AND DEVELPOLICY AND DEVELPOLICY AND DEVELPOLICY AND DEVELPOLICY AND DEVELOPMENT ISOPMENT ISOPMENT ISOPMENT ISOPMENT ISSUESSUESSUESSUESSUES
Long-term growth prospects are promising. Rich natu-ral endowments, the large stock of human capital, andcenturies of tradition in commerce and trade bode wellfor a successful transition to a fast-growing marketeconomy. The realization of this potential is the centraldevelopment challenge. Creating enough opportuni-ties to reduce unemployment and underemploymentand absorb the growth in the labor force is critical.Unless a more robust and sustainable GDP growth rateis attained, it will not be possible to address this issueeffectively, and the number of families living belowthe poverty line will increase. Authorities estimatedthat in 1998, 23 percent of the population were livingbelow the official poverty line of Sum910 per capitaper month which at market-exchange rates amountsto less than $5 per month.
The main objectives of the government shouldbe the revival of economic growth and the diversifica-tion of the economy. The realization of both objec-tives hinges on accelerating reforms. An appreciationof this critical aspect is essential. First, while prospectsfor recovery in international prices of gold and cottonare more optimistic than they have been for several
years, the cushion that was provided by attractive com-modity export prices in the first few years after inde-pendence is no longer available. Higher foreignexchange earnings will depend on larger quantities ofcommodity exports and new export items. The fall-out of the Russian crisis has made it clear thatdiversification of the export basket has becomeessential.
Second, cotton and grain yields remain abysmallylow by international standards. Increases in productionmust come from augmented yields, which will requireoverhauling the incentive structure and, therefore,far-reaching agriculture sector policy reform.
Third, the gradual reform approach has not re-sulted in large-scale economic disruption, but neitherhas it yielded high growth or many new employmentopportunities. Further, the diversification of theeconomy remains partial; new fast-growing exportsectors have yet to emerge, and the potential of thetraditional productive sectors has yet to be fully tapped.To revive growth and diversify the economy, it isimperative to speed up the reform process.
There appear to be some downside risks to theeconomy over the medium term. First, the Russianeconomy’s recovery has been constrained by continu-ing political uncertainty, which has further eroded theconfidence of private and official creditors. Recentallegations of widespread corruption and misappro-priation of public funds could further intensify capitalflight and accelerate the decline in FDI. This wouldin turn reduce the demand for Uzbekistan’s exports,because about 45 percent of these exports still go tothe former Soviet Union, mainly to Russia. Second,there is always the danger that a continuation of un-favorable world commodity prices for the two majorexport items, gold and cotton, would lead to a furtherpostponement of the planned foreign exchange andtrade reforms.

87SOUTHEAST ASIA
CambodiaCambodiaCambodiaCambodiaCambodia
Benefiting from favorable weather conditions and an improved political climate, Cambodia experi-enced higher economic growth in 1999 than in the previous year. Lower inflation, a lower fiscaldeficit, and a slightly increased capital account deficit accompanied the improved growth. If thegovernment can maintain the political stability and reform progress achieved in 1999, economic growthof 6-7 percent per year can be expected over the medium term.
RECENT TRENDS AND PROSPECTSRECENT TRENDS AND PROSPECTSRECENT TRENDS AND PROSPECTSRECENT TRENDS AND PROSPECTSRECENT TRENDS AND PROSPECTS
In 1999, real GDP grew by 5 percent. This resultedfrom a good wet-season crop harvest, continued gar-
ment export growth, and recovery in tourism. Aftertwo years of contraction, agriculture grew in 1999because of expansion of value added in crops, live-stock, and fisheries. Strong growth in manufacturing,particularly textiles, and a rebound in constructionactivity contributed to double-digit growth in indus-trial production. A 33 percent increase in tourist ar-rivals led to moderate growth in services. Both publicinvestment and foreign direct investment declined in1999 because of the lagged effects of the 1997 politi-cal and regional economic crises.
Domestic revenues jumped from 9.2 percent ofGDP in 1998 to 11.6 percent in 1999 because a value-added tax was introduced. Current expenditures in-creased modestly from 9.1 percent of GDP in 1998 to9.6 percent in 1999. As a result, government savings—current revenues less current expenses—improvedfrom -0.4 percent of GDP in 1998 to 1.7 percent, whilecapital spending fell from 6.1 percent of GDP in 1998
to 5.5 percent in 1999. This narrowed the overall fiscaldeficit from 6.1 percent of GDP in 1998 to 3.7 per-cent. The National Bank of Cambodia’s net claims onthe government decreased in 1999, in contrast to theprevious year when credit was extended to financepart of the budget deficit.
Average annual inflation fell to 4 percent in 1999from 14.8 percent in 1998. Broad money (M2) in-creased by 17.3 percent in 1999. Foreign currency de-posits, the main component of quasi-money, rose 31.8percent in 1999, up from a 0.3 percent hike the previ-ous year. Enhanced political stability also contributedto the growth of deposits. Independent audits of ninecommercial banks in 1999, however, indicated that aweak banking sector, characterized by limited creditactivity and high cash liquidity, continued to hampereconomic development.
Improved 1999 exports of garments, as well astimber, fish products, and rubber, led to strong domesticexport growth of about 22 percent. However, becauseof rapid import growth, the trade deficit widened from6.8 percent in 1998 to 7.3 percent in 1999, while thecurrent account deficit grew from 8 percent of GDP

ASIAN DEVELOPMENT OUTLOOK 200088
in 1998 to 8.4 percent. The riel, which had depreci-ated against the dollar in 1997 and 1998, appreciatedby 0.1 percent in 1999.
A return to real GDP growth rates of 6-7 per-cent is possible in the medium term if political stabil-ity and progress in structural reforms are maintained.A critical determinant of long-run agricultural growthwill be greater public investment, particularly in ruralinfrastructure and water resource management. Iflabor conditions improve, annual increases in USquotas on textile imports from Cambodia will allowmoderate growth in garment assembly. However,diversification to other markets and perhaps to othertypes of basic manufacturing will be necessary tosustain rapid manufacturing growth. Finally, long-term tourism potential, if successfully developed,would stimulate activities in agriculture, industry,and services.
ISISISISISSUES IN ECONOMIC MANAGEMENTSUES IN ECONOMIC MANAGEMENTSUES IN ECONOMIC MANAGEMENTSUES IN ECONOMIC MANAGEMENTSUES IN ECONOMIC MANAGEMENT
On 22 October 1999, the International MonetaryFund approved a three-year, $81.6 million Enhanced
Structural Adjustment Facility. The agreement par-ticularly emphasized fiscal reform, because Cambodia’s1998 revenues as a percent of GDP were the lowest ofall reporting developing member countries, and spend-ing on social sectors as a percent of GDP was less thanboth the Lao People’s Democratic Republic andViet Nam. With a goal of raising government revenuesto 13 percent of GDP by 2002, the government imple-mented several revenue-generating measures in 1999,including a value-added tax. Continuing efforts areunder way to reduce ad hoc tax exemptions, expandonsite tax audits of large taxpayers, and increase ef-forts to collect tax arrears. The government is work-ing to increase the capacity and efficiency of the taxand customs departments.
Public expenditure on defense regularly exceedsthat on the social sectors. For example, in the 1999budget, 22 percent was allocated to defense and lessthan 20 percent for the social sectors. The latter in-cluded 8 percent budgeted for education and 5 per-cent for health. Actual outlays for education—andeven more so for health—generally fall short ofbudgeted levels. This trend to spend less than the
TTTTTable 2.7able 2.7able 2.7able 2.7able 2.7 Major Economic Indicators, Cambodia, 1997-2001Major Economic Indicators, Cambodia, 1997-2001Major Economic Indicators, Cambodia, 1997-2001Major Economic Indicators, Cambodia, 1997-2001Major Economic Indicators, Cambodia, 1997-2001(percent)
Item 1997 1998 1999 2000 2001
GDP growth 2.6 1.3 5.0 6.0 7.0
Gross domestic investment/GDP 14.7 13.4 13.1 13.0 14.0
Gross savings/GDP 5.9 5.4 4.7 4.0 4.0
Inflation rate (consumer price index) 8.0 14.8 4.0 6.0 5.0
Money supply (M2) growth 16.6 15.7 17.3 12.0 12.0
Fiscal balance/GDPa -4.2 -6.1 -3.7 -4.5 -4.0
Merchandise exports growthb 81.0 8.3 21.8 11.0 10.0
Merchandise imports growthc 5.8 -0.1 20.4 12.0 10.0
Current account balance/GDPd -8.8 -8.0 -8.4 -9.0 -10.0
Debt service/exports 2.5 2.9 2.5 3.0 3.0
a. Cash basis.b. Domestic exports.c. Retained imports.d. Excludes official transfers.
Sources: Ministry of Economy and Finance; National Institute of Statistics; National Bank of Cambodia; staff estimates.

89SOUTHEAST ASIA
allocated budget seems to have reversed only in thelast quarter of 1999.
Defense spending has remained a priority in thepast several years. Its share in total expenditure in-creased while spending on the social sectors declined(figure 2.7). However, defense spending as a percentof GDP fell from 5.7 percent in 1995 to about 4 per-cent in 1999. The government is further reducing de-fense spending by demobilizing about 30,000 soldiersduring 2000-2003. In addition, various efforts are un-der way to improve spending on the social sectors,such as decentralizing budget responsibility. Thesesteps should improve the capability to develop hu-man resources.
POLICY AND DEVELPOLICY AND DEVELPOLICY AND DEVELPOLICY AND DEVELPOLICY AND DEVELOPMENT ISOPMENT ISOPMENT ISOPMENT ISOPMENT ISSUESSUESSUESSUESSUES
Insufficient public spending on education and healthexacerbates the underdevelopment of human re-sources. This inhibits economic development and con-tributes to poverty. The government share of totaleducational expenditures is about 25 percent. As a
result, about 40 percent of the population have neverattended school, 32 percent are illiterate, and less than1 percent has had any training beyond high school.The skills needed to improve administrative, legal,educational, and medical institutions are therefore inshort supply, often forcing Cambodia to rely on inter-national experts. The labor force—which has high de-pendency ratios because of high fertility and anunusually large population with disabilities—also ischaracterized by low productivity.
Improving the level of education will not besimple, however. Access to basic education varies bygeographical region, socioeconomic status, and gender.Distance and an inadequate transportation system aremajor constraints to school attendance for the ruralpoor. The high opportunity costs of sending childrento school is another major obstacle, because about80 percent of the population reside in farm householdsthat depend largely on their own child labor. This isparticularly true of female labor, resulting in lowerenrollments for females than males. The proportionof girls enrolled is about 45 percent in primary school,40 percent in lower secondary school, and 25 percentin upper secondary school. Basic education suffers fromextremely low quality, in part because most instruc-tional materials and many qualified teachers were lostduring the Khmer Rouge years. All too often, unquali-fied, low-paid, and demoralized teachers are con-fronted with overcrowded and ill-equipped classrooms.
In addition to low levels of education, a poorlyfunctioning health care system results in one of thelowest rates of health service utilization in the world.This, combined with poor water and sanitation cov-erage, leaves the population debilitated, contributingto low productivity. Stunting is common among chil-dren, permanently robbing them of their physicalpotential. Adults frequently lose days of work becauseof illnesses for which treatment by a health provideris usually expensive and often unreliable. Self-medication is common. Leading causes of death in-clude malaria, acute respiratory infections, tubercu-losis, road accidents, and accidential mine detonations.An HIV/AIDS epidemic looms on the horizon as athreat to future development. Ultimately, to ensuresustainable long-run growth, Cambodia must devotemore financial resources to educating its people, andsafeguarding their health.

ASIAN DEVELOPMENT OUTLOOK 200090
IndonesiaIndonesiaIndonesiaIndonesiaIndonesia
Economic recovery, after nearly two years of recession, is essentially driven by the fiscal stimulus andremains fragile. Progress in structural reforms and an expected increase in export and investmentdemand will help consolidate this recovery in 2000. The new government is strongly committed toempowering local governments to promote broad-based growth.
RECENT TRENDS AND PROSPECTSRECENT TRENDS AND PROSPECTSRECENT TRENDS AND PROSPECTSRECENT TRENDS AND PROSPECTSRECENT TRENDS AND PROSPECTS
TTTTThe crisis in Indonesia has bottomed out, and signsof recovery have appeared after nearly two years
of financial and economic turmoil. GDP recorded a0.2 percent increase in 1999, compared with a13.2 percent contraction the previous year, and thecrisis-induced surge in poverty appears to have peakedin early 1999. The recovery, initially underpinned bya rebound in agriculture, gradually spread to othersectors. However, strong growth of agricultural out-put in the first half of the year faded in the third quar-ter, and reached only 0.7 percent for the year.
The manufacturing sector expanded by 2.2 per-cent because of a rebound in the export-oriented oiland gas sector, while the construction sector grew bya modest 1.1 percent. The service sector, however, de-clined a further 1.5 percent in 1999 because of a con-traction in banking and financial services. On theaggregate demand side, the recovery was initially aidedby a rise in public spending, reflecting the government’sfiscal stimulus to jump-start the economy. Growth ofprivate consumption then led the recovery. Private
investment activity, however, continued to contract dueto inadequate progress in corporate debt restructuring.
The fragile recovery has not prevented furtheremployment problems. Unemployment increased from5.5 percent in 1998 to 6.3 percent by August 1999,and underemployment increased from 60 percent in1998 to 63 percent in 1999. More significantly, al-though real wages went up in 1999, they remained20-25 percent below the precrisis levels.
After averaging 58.5 percent in 1998, consumerprice inflation came down to 20.5 percent in 1999.On a year-on-year basis, it plummeted to 2 percent atthe end of December 1999, compared with 78 per-cent a year ago. While falling food prices, especiallyof rice, were the primary cause of declining inflation,the restoration of food distribution channels, the ap-preciation of the rupiah, and a tight monetary stancealso helped. Despite volatility associated with politi-cal uncertainties, share prices in Indonesia reboundedbecause of considerably lower domestic inflation,greater exchange rate stability, and sharply reducedinterest rates. Overall equity prices, as measured bythe Jakarta Stock Market index, rose by 60 percent
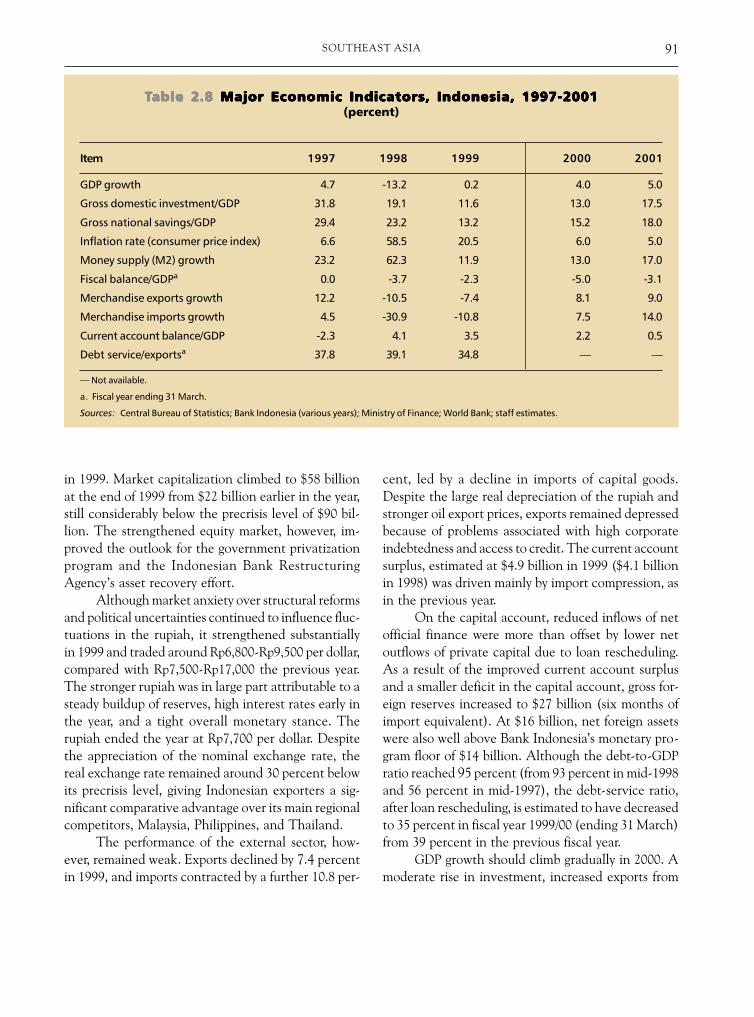
91SOUTHEAST ASIA
TTTTTable 2.8able 2.8able 2.8able 2.8able 2.8 Major Economic Indicators, Indonesia, 1997-2001Major Economic Indicators, Indonesia, 1997-2001Major Economic Indicators, Indonesia, 1997-2001Major Economic Indicators, Indonesia, 1997-2001Major Economic Indicators, Indonesia, 1997-2001(percent)
Item 1997 1998 1999 2000 2001
GDP growth 4.7 -13.2 0.2 4.0 5.0
Gross domestic investment/GDP 31.8 19.1 11.6 13.0 17.5
Gross national savings/GDP 29.4 23.2 13.2 15.2 18.0
Inflation rate (consumer price index) 6.6 58.5 20.5 6.0 5.0
Money supply (M2) growth 23.2 62.3 11.9 13.0 17.0
Fiscal balance/GDPa 0.0 -3.7 -2.3 -5.0 -3.1
Merchandise exports growth 12.2 -10.5 -7.4 8.1 9.0
Merchandise imports growth 4.5 -30.9 -10.8 7.5 14.0
Current account balance/GDP -2.3 4.1 3.5 2.2 0.5
Debt service/exportsa 37.8 39.1 34.8 — —
— Not available.
a. Fiscal year ending 31 March.
Sources: Central Bureau of Statistics; Bank Indonesia (various years); Ministry of Finance; World Bank; staff estimates.
in 1999. Market capitalization climbed to $58 billionat the end of 1999 from $22 billion earlier in the year,still considerably below the precrisis level of $90 bil-lion. The strengthened equity market, however, im-proved the outlook for the government privatizationprogram and the Indonesian Bank RestructuringAgency’s asset recovery effort.
Although market anxiety over structural reformsand political uncertainties continued to influence fluc-tuations in the rupiah, it strengthened substantiallyin 1999 and traded around Rp6,800-Rp9,500 per dollar,compared with Rp7,500-Rp17,000 the previous year.The stronger rupiah was in large part attributable to asteady buildup of reserves, high interest rates early inthe year, and a tight overall monetary stance. Therupiah ended the year at Rp7,700 per dollar. Despitethe appreciation of the nominal exchange rate, thereal exchange rate remained around 30 percent belowits precrisis level, giving Indonesian exporters a sig-nificant comparative advantage over its main regionalcompetitors, Malaysia, Philippines, and Thailand.
The performance of the external sector, how-ever, remained weak. Exports declined by 7.4 percentin 1999, and imports contracted by a further 10.8 per-
cent, led by a decline in imports of capital goods.Despite the large real depreciation of the rupiah andstronger oil export prices, exports remained depressedbecause of problems associated with high corporateindebtedness and access to credit. The current accountsurplus, estimated at $4.9 billion in 1999 ($4.1 billionin 1998) was driven mainly by import compression, asin the previous year.
On the capital account, reduced inflows of netofficial finance were more than offset by lower netoutflows of private capital due to loan rescheduling.As a result of the improved current account surplusand a smaller deficit in the capital account, gross for-eign reserves increased to $27 billion (six months ofimport equivalent). At $16 billion, net foreign assetswere also well above Bank Indonesia’s monetary pro-gram floor of $14 billion. Although the debt-to-GDPratio reached 95 percent (from 93 percent in mid-1998and 56 percent in mid-1997), the debt-service ratio,after loan rescheduling, is estimated to have decreasedto 35 percent in fiscal year 1999/00 (ending 31 March)from 39 percent in the previous fiscal year.
GDP growth should climb gradually in 2000. Amoderate rise in investment, increased exports from

ASIAN DEVELOPMENT OUTLOOK 200092
the nonprimary sectors, and strong agricultural pro-duction will lead to a GDP growth rate of around4 percent in 2000 and 5 percent in 2001. The pace ofrecovery will, however, be constrained by continuedliquidity problems and a massive overhang of corpo-rate debt.
The budget will remain in deficit over the me-dium term, but will likely decline steadily from a pro-jected 5 percent of GDP in 2000 to 3.1 percent thefollowing year, as private sector activity picks up andoutlays on subsidies decline. Imports will increase in2000 as domestic demand rises, lowering the currentaccount surplus to 2.2 percent, and then to 0.5 per-cent in 2001. This should, however, be offset by offi-cial financial flows and private capital inflows, and theimport coverage of reserves will remain at about sixmonths. The debt-to-GDP ratio is expected to gradu-ally fall in 2000 because of declining interest rates,real exchange rate appreciation, and increased IBRAasset recovery. Inflation is likely to exceed the gov-ernment forecast of 5 percent in 2000 by about 1 per-cent because of increases in wages and salaries,adjustments in fuel and electricity prices, and tariffson rice and sugar. Inflation will decline to around5 percent in 2001 as the domestic supply responseimproves further and import tariffs decrease.
With greater macroeconomic stability andadequate reserve cover, the exchange rate shouldremain stable at around Rp7,000-Rp7,500 per dollarin 2000, but will still be vulnerable to swings in marketsentiment. However, with a strong increase in reservegrowth and exports in 2001, it may drop below Rp7,000per dollar. The Bank Indonesia Certificates interestrate is likely to fall—from an average of 23 percent in1999 to 11 percent in 2000 and 10 percent in 2001.These forecasts assume that domestic political condi-tions in Indonesia will not deteriorate further and thatthe Asian economies will continue to rebound strongly.
ISISISISISSUES IN ECONOMIC MANAGEMENTSUES IN ECONOMIC MANAGEMENTSUES IN ECONOMIC MANAGEMENTSUES IN ECONOMIC MANAGEMENTSUES IN ECONOMIC MANAGEMENT
The government continued to maintain an expansion-ary fiscal stance to counteract the economic contrac-tion; the budget for the fiscal year ending 31 March2000 projected a deficit of 6.8 percent of GDP. How-ever, the realized deficit is provisionally estimated at
only 4 percent of GDP, because delays in project imple-mentation will likely cause development expendituresto fall short of their target by nearly 30 percent. Thebudget deficit was unable to play its envisaged role instimulating the economy.
The fiscal year 2000 budget covering the nine-month period April-December 2000 projects a deficitof 5 percent of GDP. Although this is smaller than theprojected deficit of 6.8 percent the previous year, itreflects negative public savings (current expenditureexceeding domestic revenue) for the second time sincethe crisis began. Therefore, some development resourceswill be diverted to support current expenditures.
A major consequence of the crisis has been asharp rise in public debt. At the end of March 2000,public debt is expected to increase to 95 percent ofGDP from only 23 percent at the end of March 1998,a quadrupling in only two years. About 75 percent ofthe rise in public debt resulted from domestic bondissues to recapitalize banks and repay Bank Indonesia’sliquidity support to the banking system after the crisis.Domestic public debt now totals $89 billion comparedwith $63 billion in external public debt. Outlays ondomestic debt payments are projected to increasesharply to Rp42 trillion, more than twice the amountrequired to service public external debt, representingthe interest on government recapitalization bonds.
Together, domestic and external debt-serviceexpenditures make up 41 percent of total current ex-penditures and 61 percent of total tax revenues, andwill drain public resources for the foreseeable future.As the recovery becomes sustainable, the emphasis ofpublic policy must shift from fiscal stimulus to fiscalconsolidation, and then to fiscal sustainability. Giventhe high level of debt and a weak revenue base, achiev-ing this will require more effective and transparentuse of resources and reduced borrowing.
Given this public debt scenario, the governmentfaces several urgent imperatives. First, vigorous effortsare needed to speed up domestic resource mobiliza-tion through revenue-raising measures, includingaccelerating asset sales through privatization. Second,although outlay on the petroleum subsidy is projectedto decline as the government increases electricity andfuel prices, other timely price adjustments are neededto reduce subsidies while the targeting of social subsi-

93SOUTHEAST ASIA
dies to the poor needs to be improved. Third, fulltransparency and accountability in the use of publicresources are needed to ensure the greatest possibledevelopment effect and to eliminate leakage of funds.Fourth, careful programming of external assistance isrequired to prevent negative resource transfer.
In 1999, the deceleration of inflation and appre-ciation of the exchange rate permitted interest ratesto drop. The key one-month Bank Indonesia Certifi-cates interest rate declined from around 35 percent inearly 1999 to 12.5 percent by the end of 1999, belowthe precrisis level. Bank lending rates also declinedalthough not nearly as much, but bank lendingremained extremely subdued. Due to the massiveoverhang of corporate sector debt and high levelsof nonperforming loans, banks have adopted anextremely cautious approach to new lending, andare strengthening their capital adequacy ratios.Although further declines in inflation allow roomfor more reduction in interest rates, it is unlikely tobe substantial, given risk perceptions and bankingsector weakness.
The targets for monetary aggregates, especiallynet domestic assets and base money, need to be re-laxed gradually to support economic recovery. How-ever, this needs to be done cautiously as increases ingovernment salaries and fuel and electricity prices in2000 could exert inflationary pressures. The govern-ment’s inflation target of 5 percent could prove diffi-cult to achieve because of these factors.
Of all the crisis countries, Indonesia’s financialand corporate problems have been the most acute.Nonperforming loans are estimated at 60-85 percentof all loans and bank recapitalization costs are esti-mated at a staggering Rp643 trillion (about $89 bil-lion), or 60 percent of GDP. Restructuring efforts gotoff to a slow start because of political constraints, andit will likely take several years to restore the financial sec-tor to health. The first major step toward recapitali-zation of private banks was in 1999, when independentaudits—of all state banks, nationalized banks, regionalbanks, and private banks—ranked banks into threecategories according to their capital adequacy ratio.
The banks in category C (those with a capitaladequacy ratio of less than negative 25 percent) faceliquidation, while some banks in category B (those
with a ratio of negative 25 percent to less than 4 per-cent) will be eligible for recapitalization. All categoryA banks, those with a capital adequacy ratio of 4 per-cent or higher, are to continue in business. Sevenprivate banks were recapitalized in 1999, and fourstate-owned banks comprising half of the assets ofthe banking sector were merged into one and recapi-talized. Recapitalization and restructuring of the re-maining state-owned banks will complete the firststage of banking sector reforms, and the next stagewill involve modernizing regulatory systems andprocedures.
Bank recapitalization is being financed by do-mestic bond issues, with the government and the re-capitalized banks exchanging bonds for outstandingshares. The government plans to cover the interestcosts of these bonds from the proceeds of privatizationand asset sales of IBRA, which include an estimatedRp250 trillion in nonperforming loans transferred bythe banking system in the restructuring process. TheIBRA, in turn, faces a complex task of selling its assets.Such sales are critical in reducing the public debt. Thedevastating impact of the crisis on the banking systempoints to a strong need for developing the capitalmarket to mobilize domestic savings and reduce the cor-porate sector’s excessive reliance on bank borrowing.
To facilitate corporate restructuring, the govern-ment set up the Jakarta Initiative Task Force and theIndonesian Debt Restructuring Agency (INDRA). TheJakarta Initiative Task Force provided a platform forcorporate debtors to seek voluntary resolution of theirdebt outside the judicial system, and the INDRA pro-vided forward foreign exchange cover to restructureddeals. Despite these initiatives, corporate debt restruc-turing has been slow. It is essential to improve imple-mentation of the bankruptcy law, which was revisedin 1998. Voluntary mechanisms for restructuring cor-porate debt will have greater appeal if creditors havereasonable expectations of being able to speedily en-force their claims against debtors through legal means,should voluntary methods fail. The government alsoneeds to make greater efforts to address negative per-ceptions about governance in judicial processes, andto enhance the capacity of the judiciary to implementthe bankruptcy law. The slow pace of corporate debtrestructuring has impeded economic recovery.
ASIAN DEVELOPMENT OUTLOOK 200094
POLICY AND DEVELPOLICY AND DEVELPOLICY AND DEVELPOLICY AND DEVELPOLICY AND DEVELOPMENT ISOPMENT ISOPMENT ISOPMENT ISOPMENT ISSUESSUESSUESSUESSUES
In Indonesia, decades of unaccountable and central-ized administration have tended to degrade the qual-ity and efficiency of several public institutions. Stronggrowth and rising prosperity for years before the crisisgave rise to a false sense of complacency, delayingnecessary action on governance reforms. Poor gover-nance was also responsible, in large part, for the mag-nitude of financial collapse and fiscal distress. Unlessgovernance reform is accelerated and fundamentalchanges realized, future growth and development willbe impeded. Major priorities in improving governanceinclude combating corruption, improving decision-making and administrative structures, and strength-ening public institutions.
The government took important steps in 1999to combat corruption when it passed several new laws.The Clean Government Law requires public officialsto declare their assets before assuming their posts andto agree to open their assets to official audit duringand after their terms. The Eradication of Criminal Actsof Corruption Law defines corrupt practices that areharmful to the finances or the economy of the state,and establishes the basis for legal prosecution andcriminal charges. It also provides for public partici-pation in legal surveillance and the establishmentof an independent anticorruption commission forlegal enforcement.
New regulations to reform public procurementand project implementation practices are being final-ized. While these are important steps, much more re-mains to be done to promote competition and efficient,transparent, and accountable public administration;encourage citizen participation; and strengthen legal re-forms and the role of official oversight agencies. However,progressive institutional change across many sectors couldmeet significant resistance from vested interests.
Parliament’s approval of the Law on RegionalAutonomy and the Law on Fiscal Balances earlier in1999 gave districts and provinces impetus to decen-tralize. This is intended to improve accountability of
the government’s decisionmaking process, strengthenparticipation of beneficiaries, and increase transpar-ency. Implementing the government’s wide-rangingdecentralization agenda—which includes introducingnew systems, structures, and procedures to transferdevelopmental and administrative functions and fis-cal responsibilities to local levels—will pose difficultchallenges. Among other things, this implies that manycentral government agencies will need to make theirrespective mandates consistent with a decentralizedframework. It also implies substantial strengtheningof capacity of the public institutions, especially at lowertiers of public administration.
Even before the crisis, poverty was a major con-cern in Indonesia. The crisis further exacerbated thepoverty problem, reversing in a short period gains insocial development that were achieved over decades.Even if the surge in poverty proves to be transient, itsconsequences are not. Moreover, many millions moresubsist near the poverty line, and the country has longexperienced regional economic disparities that could leadto serious sociopolitical discontent and instability.
Combating poverty remains the foremost devel-opment priority, and the new government has giventhis issue its greatest attention. Decentralizationhas potential for responding to poverty issues directlyand sensitively. It could empower the poor and taptheir creative energies, and help build a genuinepartnership between government, civil society, andthe poor to eradicate poverty. The anticorruptionmeasures of the government will also support pov-erty reduction, by addressing corruption and ineffi-ciency in public services, including delivery of servicesto the poor.
Indonesia doubtlessly faces daunting challengesin its path to recovery and sustained growth, andresolution of its problems is likely to take time.However, the arrival of democracy and a govern-ment committed to reform have provided new andhistoric opportunities for the country to confrontits problems. It is crucial to seize this window ofopportunity now.

95SOUTHEAST ASIA
Lao People’s Democratic RepublicLao People’s Democratic RepublicLao People’s Democratic RepublicLao People’s Democratic RepublicLao People’s Democratic Republic
In 1999, the economy experienced moderate expansion accompanied by high monetary growth, rapidinflation, and volatile exchange rates. The outlook is for relatively stable economic growth over themedium term.
RECENT TRENDS AND PROSPECTSRECENT TRENDS AND PROSPECTSRECENT TRENDS AND PROSPECTSRECENT TRENDS AND PROSPECTSRECENT TRENDS AND PROSPECTS
SSSSSeveral factors contributed to sustain economicgrowth in 1999 at the same rate as 1998. While
industry and services grew slowly, agriculture per-formed well, benefitting from a major government ir-rigation program. Production of garments, one of thelargest export earners, rebounded because of increasedpenetration in European markets.
The gross investment rate fell as both public andprivate investment rates weakened. Constructionslumped as work wound down on the nearly completed60-megawatt Nam Leuk and 150-megawatt Huoy Hohydropower projects. However, an increase in touristarrivals boosted the service sector, although this waspartially offset by weakness in the banking sector.
Fiscal performance improved in 1999 as the dropin public investment reduced the overall fiscal defi-cit, excluding grants, to 9.3 percent of GDP from nearly14 percent in the previous year. In contrast to 1998when bank financing of the budget deficit was re-quired, net bank credit to the government declinedin 1999. Revenues recovered from 9.8 percent of GDP
in 1998 to about 11.3 percent because of improvementsin both tax and nontax revenue collections. At thesame time, the government further compressed cur-rent expenditures to 5.5 percent of GDP in 1999, downfrom 7.1 percent in 1998.
In 1999, rapid money supply growth of approxi-mately 86 percent resulted in an estimated inflationrate of about 87 percent and significant exchange ratedepreciation of 40 percent. Although still high, theserates were all lower than the previous year, as the gov-ernment gradually moved to reduce credit expansion.The government alternated between tightening andeasing credit conditions throughout 1999 before set-tling into a tight monetary stance in the final quarter,which stabilized prices and the exchange rate at theend of the year.
However, because of monetary policy inconsis-tency, the year was characterized by volatility in theforeign exchange market. Furthermore, because of thegovernment’s reluctance to adjust the official exchangerate rapidly in response to changing market conditions,the unofficial exchange rate ranged from more than40 percent in February and March 1999 to less than

ASIAN DEVELOPMENT OUTLOOK 200096
TTTTTable 2.9able 2.9able 2.9able 2.9able 2.9 Major Economic Indicators, Lao People’s Democratic Republic, 1997-2001Major Economic Indicators, Lao People’s Democratic Republic, 1997-2001Major Economic Indicators, Lao People’s Democratic Republic, 1997-2001Major Economic Indicators, Lao People’s Democratic Republic, 1997-2001Major Economic Indicators, Lao People’s Democratic Republic, 1997-2001(percent)
Item 1997 1998 1999 2000 2001
GDP growth 6.9 4.0 4.0 4.5 5.0
Gross domestic investment/GDP 26.2 26.1 23.7 24.0 25.0
Gross savings/GDP 9.4 15.5 13.4 13.0 13.0
Inflation rate (consumer price index)a 26.6 142.0 86.7 30.0 10.0
Money supply (M2) growth 65.8 113.3 86.3 50.0 30.0
Fiscal balance/GDPb -8.8 -13.9 -9.3 -8.5 -8.0
Merchandise exports growth -1.2 7.7 2.9 5.0 6.0
Merchandise imports growth -6.0 -14.7 -2.9 7.0 6.5
Current account balance/GDPc -16.8 -10.6 -10.3 -11.0 -12.0
Debt service/exports 9.0 11.1 12.0 12.5 12.0
Note: Figures for 1999 are preliminary estimates.a. End of period.b. On a fiscal year basis ending 30 September; excludes official transfers.c. Excludes official transfers.
Sources: Bank of Lao PDR; IMF; Ministry of Finance; National Statistical Centre; staff estimates.
3 percent above the official rate in June 1999. Over-all, confidence in the kip weakened, so banking andother transactions were increasingly carried out in for-eign currencies, which put more pressure on theexchange rate.
The current account balance as a percent of GDPimproved modestly in 1999. The trade balance signifi-cantly improved, more than offsetting deteriorationin net factor income and private transfers. Foreigndirect investment and official development assistancedisbursements increased slightly in 1999 relative to1998. Gross official reserves increased from $112.8million to $115.9 million.
Prospects are for modest improvement in eco-nomic growth in 2000 and 2001. Agriculture shouldcontinue to enjoy moderate growth, helped bycontinued investment in irrigation. If normal tradingrelations with the United States are established, thiswould translate into improved growth in manu-facturing in the near to medium term. Hydropowerexport earnings are projected to grow by more than30 percent in 2000 with the start of operations at the
Nam Leuk and Huoy Ho sites. However, foreign di-rect investment likely will stagnate and constructioncontinue to slump in the medium term, partly becauseof the delay in new hydropower projects resulting froma slowdown in Thai electricity demand.
ISISISISISSUES IN ECONOMIC MANAGEMENTSUES IN ECONOMIC MANAGEMENTSUES IN ECONOMIC MANAGEMENTSUES IN ECONOMIC MANAGEMENTSUES IN ECONOMIC MANAGEMENT
Macroeconomic conditions are intertwined intimatelywith fiscal management. Figure 2.8 shows the evolu-tion of fiscal revenues and expenditures since 1995.In late 1997, total revenues dropped as the regionalcrisis lowered trade tax revenues. Furthermore,external financing of the budget decreased becauseaid flows diminished when donor countries saw thereform effort faltering, particularly in the financial sec-tor. Nevertheless, the government expanded publicinvestment with central bank financing, especially forits irrigation projects.
Using outdated and overvalued exchange ratesto calculate import tariffs—thus reducing the taxliability in kip terms—resulted in revenue shortfalls.

97SOUTHEAST ASIA
The government has since adjusted the exchange rateused for import valuation. Another problem arisingfrom high inflation was erosion in the real value ofnominal lump sum commercial income tax paymentsduring the year, although their levels had been fixedat the beginning of the year. As a result of the highinflation and exchange rate depreciation, weaknessesin tax administration were exposed. On the expendi-ture side, imperfect management often resulted inpublic investments that were higher than intended.Facing shortfalls in revenues and foreign funding, thegovernment economized on current expenditures,which in 1995 were as high as 10.8 percent of GDP.These have been squeezed over the past several yearsand continue to be compressed despite recent successin curtailing capital expenditures.
In particular, wages and salaries of governmentworkers have fallen significantly, both as a percentageof GDP (from 5.2 in 1995 to 2.2 in 1999) and in realterms, because nominal wage increases have not kept
pace with high inflation during the last two years. Inaddition, even as public investment accelerated tonearly 17 percent of GDP in 1998, spending on mate-rials and supplies fell from more than 3 percent of GDPin 1995 to less than 2 percent in 1999. These trendscan cause problems such as increased absenteeismamong government workers, incentives for corruption,and inadequate spending on maintenance, all of whichcan impair public sector efficiency.
POLICY AND DEVELPOLICY AND DEVELPOLICY AND DEVELPOLICY AND DEVELPOLICY AND DEVELOPMENT ISOPMENT ISOPMENT ISOPMENT ISOPMENT ISSUESSUESSUESSUESSUES
About 40 percent of the population lives below thenational poverty line, less than the estimated 45 per-cent in 1992-1993. The highest incidence of povertyoccurs in the north region, although poverty levels inthe south and central regions are also significant. Mostof the rural poor are subsistence farmers with low pro-ductivity and poor market access. Pervasive poverty isalso indicated by a low per capita income of $330 in

ASIAN DEVELOPMENT OUTLOOK 200098
1998. However, among income groups there is rela-tive equality, as evidenced by a low Gini coefficient (ameasure of income inequality) of 0.38.
Wide disparities exist between the richest andpoorest quantiles with respect to access to and thequality of public services used. For education, net pri-mary enrollments for the richest quintile are 78 per-cent compared with 44 percent for the poorest quintile.At secondary levels, the inequities are even greater:net enrollments are 28 percent for the richest and4 percent for the poorest. Availability of textbooksand access to better-qualified teachers mirror thesedifferences. Student performance rates are lower inthe poorest provinces, accompanied by higherdropout rates and lower enrollment rates. Con-sequently, children from poorer families have littleaccess to skills training and other income-generatingopportunities.
Patterns for health care access and quality aresimilar. Only 8 percent of the poorest quintile usemodern health care services, compared with 22 per-cent of the richest quintile. Similarly, only 8 percentof the poorest quantile as compared with 33 percentof the richest quantile have access to safe water andsanitation, causing more waterborne diseases amongthe poorest. The cumulative impact of poor access tohealth care and inadequate sanitation and water ser-vices implies a large quality gap in health care betweenthe richest and poorest quintiles.
To address poverty, greater efforts must be madeto enhance opportunities for the poor through policiesto promote rural economic activities, especially inagriculture. In addition, greater spending on socialservices by the government is needed to achievebroader coverage and reduce the gap in the utiliza-tion of the social services.

99SOUTHEAST ASIA
MalaysiaMalaysiaMalaysiaMalaysiaMalaysia
Malaysia has made an impressive recovery from economic recession in 1998. Although capital con-trols enabled the authorities to pursue expansionary fiscal and monetary policies without precipitatingcapital flight, greater market orientation in several areas will support a more sustainable recovery.Enhancing the skill level of the Malaysian labor force remains a key challenge for improving economiccompetitiveness and long-term development prospects.
RECENT TRENDS AND PROSPECTSRECENT TRENDS AND PROSPECTSRECENT TRENDS AND PROSPECTSRECENT TRENDS AND PROSPECTSRECENT TRENDS AND PROSPECTS
TTTTT he economy achieved a robust recovery in1999, with real GDP expanding by 5.4 percent af-
ter having contracted by 7.5 percent in 1998. Stron-ger economic growth also led to a decline in the rateof unemployment to 3 percent of the labor force in1999 from 3.2 percent in 1998. Most of the positivesigns of economic growth came from greater externaldemand for manufactured goods and a rise inconsumer confidence, as reflected in increased pas-senger car sales, sales tax receipts, and imports of con-sumer goods.
All major production sectors, with the excep-tion of construction and mining, recorded highergrowth in 1999. The manufacturing sector expandedby 13.6 percent, spearheaded by strong external de-mand for electronic equipment and components. Asignificant increase in crude palm oil productionpushed agriculture sector growth to 3.8 percent, whileincreased manufacturing activity and stronger exportgrowth led to a recovery in service subsectors suchas transportation, storage, and communications.
Although a large surplus of high-rise commercial build-ings and higher-end condominium units continued todepress construction activity, output contraction less-ened in 1999. Despite the strong rebound in overalleconomic activity in 1999, the recovery was uneven,and private investment activity continued to contractbecause of inadequate credit expansion and excess in-dustrial capacity.
After averaging 5.3 percent in 1998, consumerprice inflation decreased steadily during 1999,averaging 2.8 percent. The slowdown reflected con-tinued excess capacity, greater exchange rate stability,and a slower increase in food prices. The strong eco-nomic rebound, the relaxation of restrictions on therepatriation of portfolio investment, and the conse-quent decision of several credit rating agencies to re-admit Malaysia to their global benchmark equityindices led to a recovery in share prices. Share priceswere, however, somewhat volatile, owing in part touncertainty over US interest rates and a strengthen-ing yen. Overall equity prices, as measured by theKuala Lumpur Composite Index, rose by 39 percentin 1999.
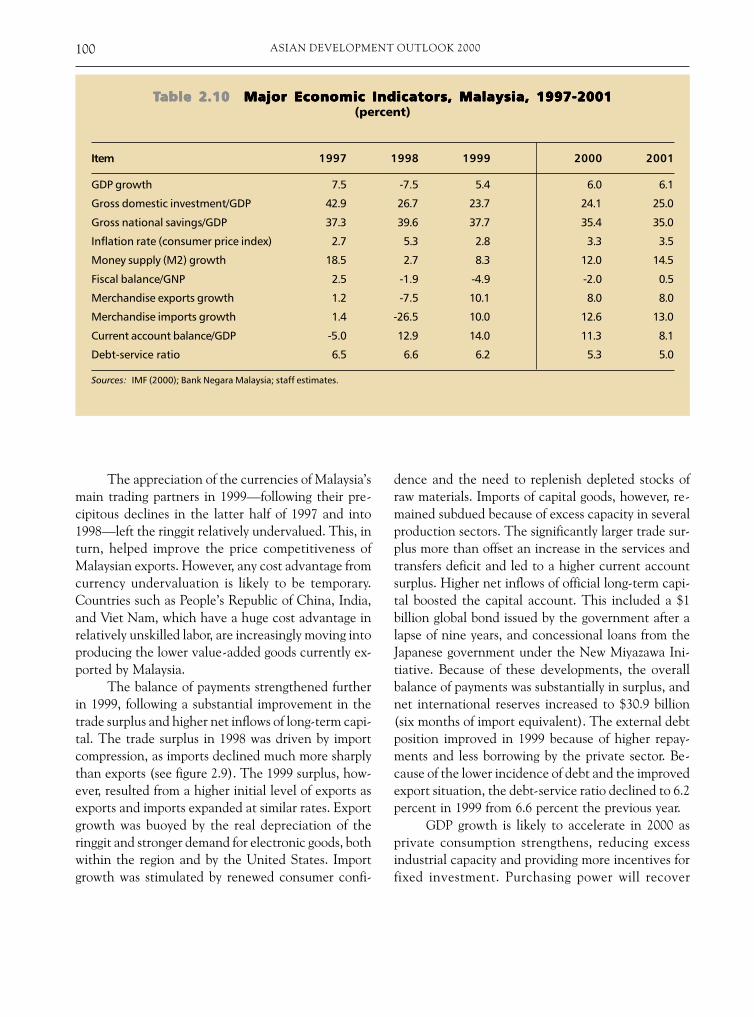
ASIAN DEVELOPMENT OUTLOOK 2000100
TTTTTable 2.10able 2.10able 2.10able 2.10able 2.10 Major Economic Indicators, Malaysia, 1997-2001Major Economic Indicators, Malaysia, 1997-2001Major Economic Indicators, Malaysia, 1997-2001Major Economic Indicators, Malaysia, 1997-2001Major Economic Indicators, Malaysia, 1997-2001(percent)
Item 1997 1998 1999 2000 2001
GDP growth 7.5 -7.5 5.4 6.0 6.1
Gross domestic investment/GDP 42.9 26.7 23.7 24.1 25.0
Gross national savings/GDP 37.3 39.6 37.7 35.4 35.0
Inflation rate (consumer price index) 2.7 5.3 2.8 3.3 3.5
Money supply (M2) growth 18.5 2.7 8.3 12.0 14.5
Fiscal balance/GNP 2.5 -1.9 -4.9 -2.0 0.5
Merchandise exports growth 1.2 -7.5 10.1 8.0 8.0
Merchandise imports growth 1.4 -26.5 10.0 12.6 13.0
Current account balance/GDP -5.0 12.9 14.0 11.3 8.1
Debt-service ratio 6.5 6.6 6.2 5.3 5.0
Sources: IMF (2000); Bank Negara Malaysia; staff estimates.
The appreciation of the currencies of Malaysia’smain trading partners in 1999—following their pre-cipitous declines in the latter half of 1997 and into1998—left the ringgit relatively undervalued. This, inturn, helped improve the price competitiveness ofMalaysian exports. However, any cost advantage fromcurrency undervaluation is likely to be temporary.Countries such as People’s Republic of China, India,and Viet Nam, which have a huge cost advantage inrelatively unskilled labor, are increasingly moving intoproducing the lower value-added goods currently ex-ported by Malaysia.
The balance of payments strengthened furtherin 1999, following a substantial improvement in thetrade surplus and higher net inflows of long-term capi-tal. The trade surplus in 1998 was driven by importcompression, as imports declined much more sharplythan exports (see figure 2.9). The 1999 surplus, how-ever, resulted from a higher initial level of exports asexports and imports expanded at similar rates. Exportgrowth was buoyed by the real depreciation of theringgit and stronger demand for electronic goods, bothwithin the region and by the United States. Importgrowth was stimulated by renewed consumer confi-
dence and the need to replenish depleted stocks ofraw materials. Imports of capital goods, however, re-mained subdued because of excess capacity in severalproduction sectors. The significantly larger trade sur-plus more than offset an increase in the services andtransfers deficit and led to a higher current accountsurplus. Higher net inflows of official long-term capi-tal boosted the capital account. This included a $1billion global bond issued by the government after alapse of nine years, and concessional loans from theJapanese government under the New Miyazawa Ini-tiative. Because of these developments, the overallbalance of payments was substantially in surplus, andnet international reserves increased to $30.9 billion(six months of import equivalent). The external debtposition improved in 1999 because of higher repay-ments and less borrowing by the private sector. Be-cause of the lower incidence of debt and the improvedexport situation, the debt-service ratio declined to 6.2percent in 1999 from 6.6 percent the previous year.
GDP growth is likely to accelerate in 2000 asprivate consumption strengthens, reducing excessindustrial capacity and providing more incentives forfixed investment. Purchasing power will recover

101SOUTHEAST ASIA
further as asset values increase and unemploymenteases, while fixed investment will pick up because ofincreased bank lending. These positive trends will,however, be partially offset as public consumptionexpands more slowly to bring down the level of fiscaldeficit. The rate of increase in real GDP growth is likelyto moderate in 2001 as the recovery from recessionends. Inflation is likely to pick up slightly because ofstronger domestic demand, rising real wages, and arecovery in non-oil commodity prices, but it willremain substantially below its 1998 level. The tradesurplus is likely to narrow, as an expected improve-ment in export performance on the back of strongerworld trade growth is offset by faster import growth,because of the import-dependent nature of exportsand a higher demand for capital goods. Malaysia’s de-pendence on trade-related service imports and in-creased outflows of profits and dividend payments willlikely widen services and income deficits, in turn caus-ing the current account surplus to narrow. The exter-
nal debt position is expected to remain manageable,and Malaysia should not experience any problems inmeeting its debt obligations.
Although stronger economic growth is likely toincrease the demand for workers, various factors maylimit how much unemployment decreases. These in-clude ongoing restructuring activities in the construc-tion, manufacturing, and financial sectors; thetendency for private companies to employ migrantworkers as wage pressures begin to mount; and a lossof competitiveness in labor-intensive, low-value-addedgoods because of increased competition from coun-tries with cheaper unskilled labor.
ISISISISISSUES IN ECONOMIC MANAGEMENTSUES IN ECONOMIC MANAGEMENTSUES IN ECONOMIC MANAGEMENTSUES IN ECONOMIC MANAGEMENTSUES IN ECONOMIC MANAGEMENT
With capital controls in place, the government pur-sued expansionary fiscal and monetary policies tostimulate the economy in 1999. While expansionaryfiscal policies have undoubtedly helped to revive the
ASIAN DEVELOPMENT OUTLOOK 2000102
economy, lower interest rates have been less effectivein stimulating loan growth. The central bank’s three-month intervention rate—the rate used by banks tofix the base lending rate—reached a low of 5.5 per-cent in 1999, falling from a high of 11 percent in 1998.Correspondingly, base lending rates declined to lessthan 7 percent from more than12 percent in July 1998,although total loans extended by the banking systemcontracted 4 percent during the year.
The ratio of nonperforming loans (NPLs) on athree-month arrears basis decreased only gradually—from 18.9 percent at the end of 1998 to 16.7 percentat the end of December 1999—and corporate debtrestructuring proceeded slowly. Hence banks werereluctant to lend for fear of increasing their risk expo-sure. With domestic demand still subdued, fiscal andmonetary policies probably will remain expansionaryin the short term to boost private consumption andinvestment. To encourage investment and loangrowth, the government is likely to capitalize on thecurrent low inflation to further reduce interest rates.Loan growth is also likely to increase and NPLs de-crease as the economy continues to recover.
The government has, however, made con-siderable progress in cleaning up the banking sectorby NPL purchases and capital injections. Danaharta,the agency set up to purchase and rehabilitate thebanking sector’s bad debt, acquired around 35 per-cent of NPLs and began disposing of these assets.Danamodal, the special-purpose organization forrecapitalizing and strengthening banks, initially in-jected RM6.4 billion into ten banks. The amount in-volved decreased to RM4.6 billion following repaymentsby five banking institutions. The government also at-tempted to consolidate the banking sector to createdomestic financial institutions that can withstand in-ternational competition. This competition is expectedto intensify in 2003 when the government liberalizesthe sector to conform to its World Trade Organiza-tion commitments. The plan initially called for theconsolidation of the country’s 58 financial institutionsby the end of March 2000 into six anchor banks to beselected by the authorities. However, following strongobjections to some parts of the plan, the central bankallowed commercial banks to choose their own mergerpartners—which they have now done—and extendedthe deadline to December 2000.
Some observers are concerned over the need forgreater transparency and a proper balancing of credi-tor and borrower interests in the voluntary corporatedebt workout program. However, notable progress hasbeen achieved in restructuring corporate debt. By theend of September 1999, Malaysia’s Corporate DebtRestructuring Committee, which oversees the volun-tary program, had received 63 applications for debtrestructuring that totalled RM35 billion. Of these, 15restructuring schemes involving debts of RM12.7 bil-lion were completed or were in various stages of imple-mentation, while a further 15 cases involving debtsworth RM3.5 billion were rejected. A program for re-forming corporate governance, created in 1998, wasenacted. It requires publicly listed companies to filequarterly financial statements, restricts the numberof directorships an individual may hold, enhances dis-closure requirements for publicly listed companies re-lating to takeovers and mergers, and requires morestringent listing requirements and capital adequacyratios for publicly listed financial companies.
During 1999, some of the capital controlmeasures that had been introduced in September 1998to support economic recovery were significantly re-laxed. In February 1999, an exit levy replaced the pre-vious moratorium on the repatriation of portfoliocapital. This allowed foreign investors to repatriatethe principal and profits upon payment of a gradu-ated levy that varied from 10-30 percent, dependingon the duration of investment in Malaysia. In Sep-tember 1999, a uniform levy of 10 percent on capitalgains replaced the graduated levy.
Malaysia has survived the dire predictions madeby many analysts when it imposed selective capitalcontrols in September 1998. At a time when interna-tional investors had yet to regain confidence in theregion, capital controls gave the authorities sufficientflexibility to pursue expansionary fiscal and monetarypolicies that would stimulate domestic demand with-out precipitating capital flight. Using capital controlsto accelerate corporate and financial sector reformsand replacing the quantitative restrictions on repatri-ating portfolio investment with an exit levy also helpedrestore international confidence and reestablish port-folio capital inflows.
In the short term, however, greater market ori-entation in several areas will help bring about a more

103SOUTHEAST ASIA
robust and sustainable recovery. For instance, settinga minimum loan growth target for banks (as was thepolicy in 1998 and 1999) is likely to lessen the qualityof credit appraisal and jeopardize the asset quality ofbanks. Loan growth more likely will be stimulated ifbanks are allowed to set lending rates consistent withunderlying risks, rather than the current practice ofsetting a cap on lending rate using an administrativelydetermined, fixed markup on the base rate.
Reverting to a three-month NPL classificationstandard and reducing the current six-month disclo-sure requirement for banks to three months also willstrengthen prudential norms and provide a stricterassessment of the banking system’s health. This willalso reinforce market discipline and be consistent withthe direction of current financial sector and corpo-rate sector reforms. Bank exposure limits to certainrisky sectors (such as real estate and share transac-tions) that were relaxed in 1998 must be reviewed tostrengthen overall risk management by individualbanks. Coping with these issues will reduce thevulnerabilities that characterized the financial sectorwhen the crisis struck in 1997.
POLICY AND DEVELPOLICY AND DEVELPOLICY AND DEVELPOLICY AND DEVELPOLICY AND DEVELOPMENT ISOPMENT ISOPMENT ISOPMENT ISOPMENT ISSUESSUESSUESSUESSUES
In the longer term, the retention of capital controlsand the fixed exchange rate probably will increaseinefficiency in resource allocation. This, in turn, islikely to have negative implications for economicgrowth. The number of foreign investment applica-tions has fallen steadily since the imposition of capitalcontrols in September 1998. This suggests continuedinvestor unease over these measures, which has seri-ous implications for a country that wants to shift fromproducing low-cost, labor-intensive manufacturedgoods to high-technology, knowledge-based highvalue-added products.
Malaysia has made impressive gains in increas-ing the educational levels of its population, especiallyat the primary and secondary levels. Concern is, how-ever, growing about educational quality consideringthe shortage of skilled labor for the high-technologyand knowledge-based industries that the country
hopes to build, and the perceived lack of labor com-petitiveness compared with most Association of South-east Asian Nations countries. While the effects of theeconomic crisis on existing levels of primary and sec-ondary education are believed to be mild, the effecton tertiary education is more severe. The steep rise inthe cost of tertiary education abroad has led to in-creased demand for public tertiary education withinMalaysia, both from new school leavers and return-ing overseas students who cannot afford to completetheir studies abroad. Estimates indicate that in 1998there were 112,000 applications for the 40,222 placesavailable at the country’s ten public universities. Underthese circumstances, local tertiary education costshave reportedly increased about 30 percent, beyondthe reach of many lower middle-income families.
In the initial stages of the crisis, the governmentdecreased its education budget as part of an across-the-board cut of 18 percent in all categories of expen-diture to restore international confidence and stabilizethe economy. Expenditure cuts in the school construc-tion program in rural areas, teacher training programs,and educational management information systemsundoubtedly adversely affected educational access,quality, and efficiency. Following the abandonment ofthe government’s restrictive demand managementprogram in mid-1998, these budget reductions wererestored in 1999 and allocations for education wereincreased in real terms.
However, given the shortage of skilled labor andthe bottlenecks in tertiary education, efforts must beredoubled to encourage greater private sector partici-pation in providing higher education and appropriateskills development programs. Private sector employ-ers also need to be involved in providing vocationaltraining. This will not only increase the likelihood thatthe skills gained by trainees are relevant to employerneeds, but would shift the financial burden of provid-ing such courses to employers, away from the publicsector. The opportunity cost of not doing so is high,because private provision of education not only in-creases access to education at little or no cost to thegovernment, but also introduces competition thatcould improve standards.
ASIAN DEVELOPMENT OUTLOOK 2000104
MyanmarMyanmarMyanmarMyanmarMyanmar
Following several years of strong economic performance in the early 1990s, Myanmar’s growth rateslowed for the third consecutive year since 1996. Unless necessary structural reforms are under-taken, the economy will continue to depend heavily on ad hoc policies formulated in reaction torandom factors such as weather and the changing regional economic environment.
RECENT TRENDS AND DEVELRECENT TRENDS AND DEVELRECENT TRENDS AND DEVELRECENT TRENDS AND DEVELRECENT TRENDS AND DEVELOPMENTSOPMENTSOPMENTSOPMENTSOPMENTS
IIIIIn the early 1990s GDP increased at the rapid rate ofaround 8 percent. According to official estimates,
GDP growth slowed to 5 percent in 1998. Agricultureoutput growth declined from 5 percent in 1996 to2.8 percent in 1998 largely because of droughts, floods,and a shortage of fertilizer and pesticides. The structureof the economy has not changed substantially sincethe introduction of market-oriented reforms in 1988.It remains largely agrarian, with agriculture account-ing for 42 percent of GDP in 1999 and more than60 percent of the labor force in 1998 (see figure 2.10).
Real growth was about 4.5 percent in 1999.While industry and services maintained approximatelythe same growth rate as the previous year, growth inagriculture decreased because of bad weather, includ-ing drought in the upper part of the country and anuntimely monsoon in lower Myanmar. External sec-tor performance remained weak, with trade and cur-rent account deficits putting more pressure on the kyatexchange rate.
The consolidated budget deficit for 1998amounted to 4.5 percent of GDP. Both revenues andexpenditures declined, from 11.5 and 8.9 percent ofGDP in 1997 to 8.9 and 7.3 percent in 1998, respec-tively. The deficit of state-owned enterprises (SOEs)increased in recent years, mainly because exports werevalued at the official exchange rate and state sectoremployees received subsidized rice.
Money supply and domestic credit have bothbeen increasing 30-40 percent annually in recent years.Credit to the private sector has been increasing since1995. However, it has become difficult for businessesto borrow from commercial banks, which arereluctant to lend in the poor business environment.In April 1999 the central bank lowered its discountrate from 15 to 12 percent, a surprising move givenhigh inflation and negative real interest rates.
Meanwhile, the share of foreign currency de-posits in total deposits increased to a little more than20 percent, twice the level of two years ago, weaken-ing the central bank’s control of domestic moneysupply. Inflation has been high in recent years, largely
1999 refers to fiscal year 1999/00, ending 31 March.

105SOUTHEAST ASIA
because of increasing food prices and excess liquidityresulting from the central bank financing of around70 percent of the budget deficit. Inflation in Yangon,the capital city, increased to 49 percent in 1998. Nodata are available for 1999, but inflation likely re-mained high for three reasons: a tenfold increase inelectricity prices effective March 1999, an increase intransportation costs because of higher taxes, and adecline in commodity production.
The foreign exchange market remained highlydistorted, with the parallel market rate at aroundMK350 per dollar, compared with the official rate ofabout MK6 per dollar. Because of quantitative restric-tions and controls on foreign exchange transactions,private traders normally cannot export items such asrice, sugar, rubber, minerals, and gems. Consequently,SOEs are the major players in trading activities. Foreignexchange transactions among nonfinancial firms in theprivate sector appear to have no restrictions, however.
According to official figures, imports amounted toaround $2.6 billion in 1998, while exports were around$1.2 billion, mostly primary products. Border trade withneighboring countries accounted for 30 percent ofexports, and the current account, exclud-ing officialtransfers, registered a deficit of $546 million.
Nevertheless, Myanmar posted a net balance-of-payments surplus of about $64 million in 1998.Foreign exchange reserves were reported to be about$400 million (1.8 months of import equivalent). Atthe end of March 1998, the total outstanding exter-nal debt was $5.6 billion, of which about 90 percentwas medium- and long-term debt. At that timeMyanmar had arrears totaling about $1.6 billion, ofwhich 70 percent were owed to bilateral sources,28 percent to private creditors (including suppliers’credit), and the rest to multilateral sources. By theend of March 1999, arrears to multilateral sources werebelieved to have more than tripled.
ASIAN DEVELOPMENT OUTLOOK 2000106
ISISISISISSUES IN ECONOMIC MANAGEMENTSUES IN ECONOMIC MANAGEMENTSUES IN ECONOMIC MANAGEMENTSUES IN ECONOMIC MANAGEMENTSUES IN ECONOMIC MANAGEMENT
Given its rich resource base, Myanmar has the econo-mic potential to grow at a high rate. However, theeconomy remains highly controlled and has yet toadopt sound economic policies to exploit its potentialand sustain economic growth. After the initial liber-alization of the economy in 1988, which led to a rela-tively successful period of economic growth, progressstagnated, and persistent structural problems under-mined its progress. Unless badly needed reforms areundertaken, the economy will continue to dependheavily on ad hoc policies rather than more carefullyconsidered and far-reaching ones.
Some of the most pressing issues the govern-ment needs to address to revive growth are the distor-tions in the foreign exchange market, the continuinghigh level of inflation, and the low levels of revenuecollection and public expenditure. The central bankneeds greater authority and autonomy to controlmoney supply and to determine interest rate policy,so it can help reduce inflation to manageable levels.The current official exchange rate is heavily biasedtoward import-using SOEs that import at the overval-ued exchange rate and sell domestically at marketprices. Exchange rate distortions favor a small num-ber of industries at the expense of consumers and mostother industries. Unifying the exchange rate wouldhave to go hand in hand with removing price controlsand easing restrictions on exports, imports, and for-eign exchange transactions. In recent years theeconomy has begun to integrate with neighboringcountries; more open external policies would help im-prove export performance, given the ongoing eco-nomic recovery in the region.
The government continues to strongly supportthe state sector despite its small contribution to theeconomy. The private sector transfers many resourcesto the state sector through taxation and levies, subsi-dies to SOEs, controlled prices for staples and agri-cultural and industrial inputs, and the highlyovervalued currency. In particular, the large and grow-ing rice subsidy for state employees seems unsustain-able. Improving SOEs’ performance—and reducingthe fiscal deficit—will require restructuring and re-
forming SOEs. Economic liberalization would signifi-cantly enhance efficiency, and help the developmentof the nascent private sector. This could shiftMyanmar to a higher growth path, and help alleviatepoverty.
The fiscal deficit has been reduced, but mainlyby reducing public spending to unacceptable levels.Tax collection—along with broadening the tax baseand reducing the current level of exemptions—mustbe improved significantly to resume necessary govern-ment spending. Simultaneously, about 70 percent ofthe fiscal deficit is reportedly financed through centralbank credit, an underlying factor contributing to per-sistently high inflation.
POLICY AND DEVELPOLICY AND DEVELPOLICY AND DEVELPOLICY AND DEVELPOLICY AND DEVELOPMENT ISOPMENT ISOPMENT ISOPMENT ISOPMENT ISSUESSUESSUESSUESSUES
Myanmar does not rank particularly high in its socio-economic achievements compared with its SoutheastAsian neighbors. Although to the extent that socialindicators exist, they have improved over the lastdecades and usually reveal better social conditionsthan expected, given the low level of per capitaincome. In 1997, life expectancy stood at 60 years andadult literacy at 84 percent. However, the benefits ofeconomic growth do not seem well distributed. Esti-mates on poverty are rarely available, and Myanmardoes not have an official poverty line. Nevertheless,estimates suggest that at least one in four householdscould be considered poor, with wide regional and eth-nic differences. Infant mortality at 79 per 1,000 birthsis also slightly higher than the average of 68 per 1,000births in four other Southeast Asian countries withsimilar levels of GDP per capita. Child mortality issignificantly higher, 113 per 1,000 compared with anaverage of 77. High levels of malnutrition have beenreported among children, reflecting the poverty ofmany households.
Under these circumstances, it is particularlyworrisome that from 1997 to 1998, public expenditurefor education fell from 0.93 to 0.64 percent of GDP,and expenditure for health fell from 0.28 to 0.18 per-cent of GDP. This trend should be reversed to raisethe standards of living and to upgrade Myanmar’shuman resources.
107SOUTHEAST ASIA
PhilippinesPhilippinesPhilippinesPhilippinesPhilippines
Compounded by delays in implementing structural reforms, economic recovery in the Philippines hasbeen slow compared to other crisis-affected countries. Measures to accelerate the implementation ofreforms are critical to improve medium-term growth prospects, address the serious poverty problem,and arrest further environmental degradation.
RECENT TRENDS AND PROSPECTSRECENT TRENDS AND PROSPECTSRECENT TRENDS AND PROSPECTSRECENT TRENDS AND PROSPECTSRECENT TRENDS AND PROSPECTS
IIIIIn 1999, the economy experienced a GDP growthrate of 3.2 percent. Slow growth was primarily due
to the anemic performance of the industry sector,which grew only 0.5 percent. Agriculture experienceda strong recovery from the El Niño drought of 1998,and grew by 6.6 percent, the highest rate in decades.Services, which had remained resilient throughout thecrisis, grew by 3.9 percent in 1999, based mainly onretail trade growth.
Poor industrial performance resulted from weakconsumer demand for nonfood manufactured items, amild contraction in the construction sector caused byovercapacity, and nonperforming loans (NPLs) thatimpeded growth in bank financing for new projects.Slow growth in industry has been symptomatic of eco-nomic performance in recent years. The industrialshare in GDP has shrunk from more than 40 percenttwo decades ago to around 35 percent in 1998, in con-trast to strong industrial growth in neighboring coun-tries such as Malaysia and Thailand.
Despite the slow overall economic recovery,employment in the agriculture sector increased sig-nificantly. However, this was almost completely offsetby declining employment in industry and rapid growthin the labor force. Consequently, the unemploymentrate decreased only slightly and underemploymentremained substantial. The investment rate furtherdeclined in 1999, following a severe contraction in 1998.Efforts to improve the investment climate by lower-ing interest rates were countered by a lack of investorconfidence in the progress of economic reforms andin the policy framework itself.
Inflation gradually receded, averaging 6.6 per-cent for the year. The reduction in inflation reflectsa strong supply of agriculture products as wellas modest domestic demand and a relatively stableexchange rate.
The economic crisis and subsequent efforts tostimulate domestic demand resulted in a larger thanplanned fiscal imbalance. The fiscal deficit increasedto about 3.6 percent of GDP in 1999, nearly double the1998 level and substantially higher than targeted.

ASIAN DEVELOPMENT OUTLOOK 2000108
TTTTTable 2.11able 2.11able 2.11able 2.11able 2.11 Major Economic Indicators, Philippines, 1997-2001Major Economic Indicators, Philippines, 1997-2001Major Economic Indicators, Philippines, 1997-2001Major Economic Indicators, Philippines, 1997-2001Major Economic Indicators, Philippines, 1997-2001(percent)
Item 1997 1998 1999 2000 2001
GDP growth 5.2 -0.5 3.2 3.8 4.3
Gross domestic investment/GDP 24.9 20.4 18.8 19.5 20.0
Gross domestic savings/GDP 19.6 22.3 19.8 20.0 21.0
Inflation rate (consumer price index) 5.9 9.8 6.6 6.5 6.0
Money supply (M3) growth 20.9 7.4 19.3 17.0 18.0
Fiscal balance/GDP 0.1 -1.8 -3.6a -1.8 -2.0
Merchandise exports growth 22.8 16.9 18.8 14.0 14.0
Merchandise imports growth 14.0 -18.8 4.1 14.0 16.0
Current account balance/GDP -5.3 1.7 9.1b 6.3 5.6
Debt-service ratio 11.6 12.7 13.1c 14.3 14.5
a. January to September 1999.b. Projection from Bangko Sentral ng Pilipinas.c. January to November 1999.
Sources: ADB (1999f); IMF (2000); National Economic and Development Authority; National Statistical Coordination Board; staff estimates.
Lower-than-expected tax collections and higherspending were responsible for the increased deficit.The increase in the public debt did not seem to haveany crowding-out effect on private borrowing, whichremained weak. Despite easing monetary policy andlowering interest rates—the benchmark 91-day Trea-sury bill rate remained below 9 percent for the lastthree months of the year—there was no significantincrease in bank lending activity. Money supply andcredit growth were weak. Domestic credit shrank inthe first half of 1999 before recovering slightly in thelast six months as the private sector began to recover.Low credit growth in the early months of the yearreflected slow economic recovery, low lending spreads,and borrowers’ unwillingness to make commitmentsin a climate of general overcapacity and insufficientdemand.
On the external front, the trade and the currentaccount balances turned around sharply in 1999. Thetrade balance soared from a deficit of $19 million in1998 to a surplus of more than $4 billion, while thecurrent account surplus widened from $1.3 billion tonearly $6 billion. These surpluses primarily resultedfrom growth of nearly 20 percent in exports, particu-
larly in electronics and components, which accountedfor nearly 60 percent of export revenue. Imports grewslowly, reflecting sluggish domestic demand for bothconsumer and investment goods. On the capitalaccount, the outflow of short-term private capital con-tinued, although at a lower level than in 1998. How-ever, this was more than offset by a variety of officialinflows, including a two-year standby facility from theInternational Monetary Fund—supported by the AsianDevelopment Bank, Japan, and the World Bank—aswell as bond financing on international capital mar-kets. The surplus in the balance of payments resultedin a substantial increase in international reserves tonearly $15 billion, exceeding the precrisis level by morethan $2 billion. While the external debt-to-GDP ra-tio increased to around 65 percent mainly because ofthe peso’s depreciation, the debt-service ratio was acomfortable 13 percent.
The overall macroeconomic situation continuedto reflect the adverse effects of the economic crisis.Although the beginnings of a recovery were evident,it has yet to gather full momentum. Unemploymentand the number of NPLs continued to be high, andindustrial activity, demand for credit, investment

109SOUTHEAST ASIA
demand, and foreign private capital inflows were alllow. However, inflation has been controlled, interestrates have been lowered, and export demand is strong.The pace of economic reforms, however, has been slow.Concerns include reduced revenue, quality of publicexpenditures, delayed reforms in the banking and fi-nancial sectors, and slow progress in legislationrequired for capital market reforms and in the priva-tization program. Many of the pending reforms areclose to implementation, and will send positive sig-nals to investors when implemented. The governmentexpects the Securities Act and the Omnibus PowerSector Reform Bill to be passed by the legislature bymid-2000.
In 2000, GDP growth may reach 3.8 percent asthe economy continues its moderate recovery,although return of investor confidence is pivotal. For2001, growth will depend to some extent on weatherconditions and their effect on the agriculture sector.Improved growth prospects are contingent on severalfactors. First, continuing prudent macroeconomicmanagement is required, along with progress in re-forms. The government expects that budgetary defi-cits will continue at least until 2001. These deficitsmay be necessary to impart the needed boost to theeconomy in an environment of flagging aggregate de-mand, and to maintain vital social sector expendi-tures. However, care must be taken to ensure thatfinancing these deficits does not push up interest ratesand crowd out much-needed private investment. Sec-ond, strong export growth momentum must continue.However, because the export basket is composed of anarrow range of products—electronics, transportequipment, machinery, garments, and textiles—it issensitive to shifts in market sentiment and price vola-tility. Diversification of the export basket and encour-aging small and medium-size enterprises in areaswhere the Philippines has a comparative advantagewill help maintain export dynamism, and would en-sure future export growth. Finally, a continued favorableregional environment is necessary for recovery.
ISSUESISSUESISSUESISSUESISSUES INININININ ECONOMICECONOMICECONOMICECONOMICECONOMIC MANAGEMENTMANAGEMENTMANAGEMENTMANAGEMENTMANAGEMENT
So that recovery can be sustained and growth furtheraccelerated, action on several fronts is necessary.Restoration of investor confidence clearly requires the
government’s commitment to reform, as well as socialconsensus for its policies and programs. At the begin-ning of 1999, changes in various important departmentswere announced, and the Economic CoordinationCouncil was formed to begin implementing stalledreforms. The business community and the public wel-comed a renewed commitment to improving govern-ment efficiency, and these changes raised hopes thatthe stalled reform process will gather speed.
One issue is the size of the budget deficit re-quired to stimulate the economy without causing in-flation or a rise in interest rates. In 1999, the deficitexceeded the P100 billion target, but did not affectprices and interest rates. In 2000, the deficit target ismuch lower, which is appropriate considering the ex-pectations of recovery. Nevertheless, care must betaken to ensure that private sector investment is notdiscouraged. Should the recovery be delayed, a largerrole for public investments may be warranted, particu-larly to impart further stimulus to the economy and toaugment badly needed social expenditures.
Better fiscal management can provide govern-ment resources in the short term to fund priorityinvestments without resorting to higher deficits. In-vestment projects, especially those assisted by donors,have lagged, and this is a critical issue. Better projectimplementation can improve the productivity of in-vestments and allow efficient use of scarce investableresources. The government has taken initiatives toimprove implementation, such as setting up thePresidential Committee on Flagship Programs andProjects. Speedy action is needed to improve projectimplementation and expenditure monitoring andmanagement, and to increase vitally needed social andinfrastructure expenditures.
On the revenue side, measures are being takento revamp tax administration to improve collections.The government has upgraded the bureaus of internaltax and customs and is considering other administra-tive measures, such as focusing first on large delin-quent taxpayers to improve revenue collections.However, the process has been slow and needs morevigorous efforts.
On the monetary front, the main concern is thenumber of NPLs in the banking system, currentlyaround 15 percent of total loans. This is much smallerthan in other crisis-affected countries, but the con-

ASIAN DEVELOPMENT OUTLOOK 2000110
tinued increase and persistence is a cause for concern.Faced with stagnant sales volumes, firms are cuttingcosts, reducing indebtedness, and selling assets. Ap-plications to the Securities and Exchange Commis-sion to suspend debt payments slowed considerablyin 1999 from 1998. Nevertheless, the level of NPLs hasacted as a drag on the financial system and restrained
credit growth. The authorities must continue effortsto stimulate corporate activity and at the same timeensure that loan-loss provisions remain adequate.
The financial crisis and slow economic recoveryhas exacerbated the problems local government unitsface in delivering social services. Resources are ofteninadequate and financial management of these re-
Box 2.1 Dimensions of Poverty
Sources: ADB (1999f); NSCB(1998).
More than a third of the population ofthe Philippines—36.7 percent in1997—is poor. An AsianDevelopment Bank study based on the1998 Annual Poverty IndicatorsSurvey offers insights into the natureof poverty (see figure 2.11).• Poverty in the Philippines ispredominantly rural. A main cause ofrural poverty is low productivity ofagricultural employment. The highestincidence of poverty exists amonghouseholds whose head is employed inthe agriculture sector, and is far higherthan among those engaged in servicesor industry.• Low labor productivity andreturns from labor—rather thanunemployment—are the maindeterminants of poverty. More poorare employed than nonpoor, but thewages are not ample to lift them out ofpoverty. The labor market has a largeinformal segment capable of keepingwages low.• Little difference exists in primaryschool enrollment rates betweenchildren of poor and nonpoorhouseholds. The net enrollment ratesfor secondary school, however, show asignificant gap between the poor andnonpoor at this level.• The self-reported rate of sicknessis similar for the poor and nonpoor.The poor, however, are more likely toseek treatment at a local public health
facility, usually a public rural healthclinic, than the nonpoor. The nonpoormore frequently access private medicalfacilities, private hospitals, and clinics,particularly private clinics. The nearbybarangay or village health centersstaffed by a midwife or health workerremain underused.• Compared to the other EastAsian countries, population growth inthe Philippines is high, which isreflected in higher family size. Averagehousehold size among the poor is evenhigher. While reported awareness offamily planning methods is high,contraceptive use is still relatively low,and even lower among poor women.Access to maternal care is low, asevidenced by the low percentage ofpregnant women receiving iron andother supplements. These rates arelowest among poor women and thoseliving in certain regions.• The poor have less access to cleanwater supply, piped water, and tubewells than the nonpoor, and hence aremore likely to use contaminatedsources of water such as dug wells.Despite less access to clean water,however, the gap is modest betweenpoor and nonpoor in access to toilets,whether personal or communal.• The poor have even less access toelectricity than to clean water.Nationally, less than half of the poorlive in premises connected to a
national or cooperative system, whilealmost 90 percent of the nonpoor havesuch a connection.
These results have significantpolicy implications. They confirm thatgreater rural development is critical topoverty reduction and that raisinglabor productivity in all sectors,including the informal sector, can be animportant step.
In terms of human resourcedevelopment, while educationalpolicies have been relatively successfulat promoting primary education,reforms are needed to increasesecondary education among the poor.
In health, as the poor generallyaccess basic public health facilitiesmore often, further improvement inthese services would greatly benefit thepoor. Additional efforts and reforms areneeded to promote the use of thebarangay or village health centers. Thelow contraceptive prevalence rateneeds to be increased, and maternalhealth improved by more pervasivedistribution of needed prenatalsupplements.
Other services such as providingclean water remain a high priority,particularly for the poor, and in view ofthe implications for sanitation andhygiene. The large inequity in access toelectricity suggests that expandingelectricity distribution in rural areascan result in considerable benefits.
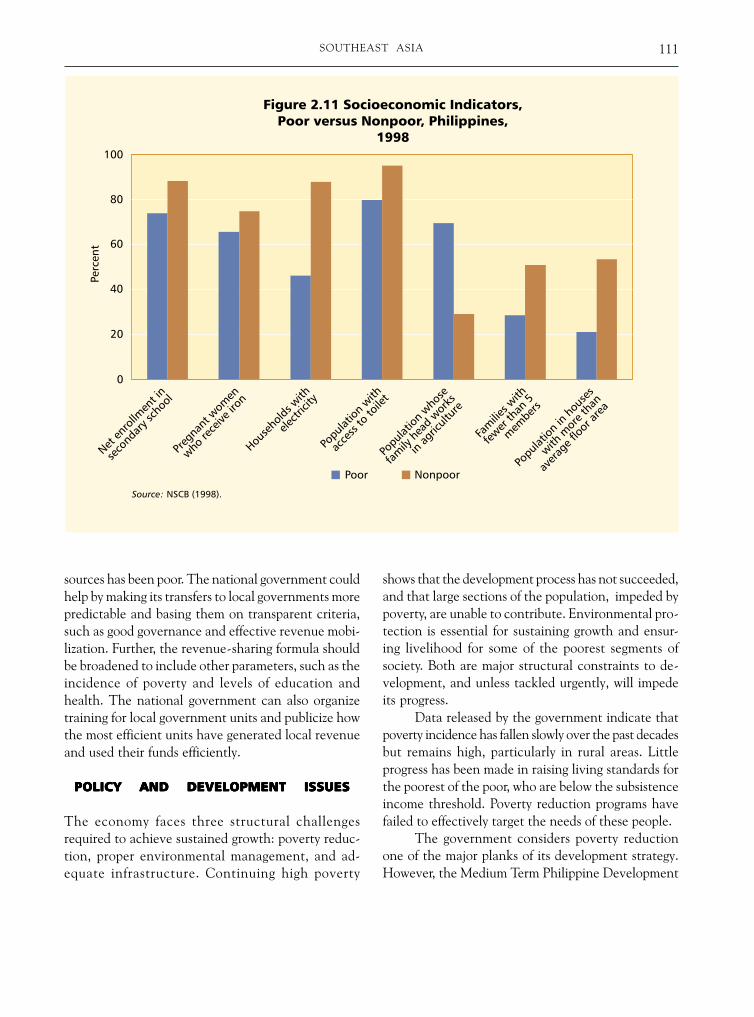
111SOUTHEAST ASIA
sources has been poor. The national government couldhelp by making its transfers to local governments morepredictable and basing them on transparent criteria,such as good governance and effective revenue mobi-lization. Further, the revenue-sharing formula shouldbe broadened to include other parameters, such as theincidence of poverty and levels of education andhealth. The national government can also organizetraining for local government units and publicize howthe most efficient units have generated local revenueand used their funds efficiently.
POLICY AND DEVELOPMENT ISSUESPOLICY AND DEVELOPMENT ISSUESPOLICY AND DEVELOPMENT ISSUESPOLICY AND DEVELOPMENT ISSUESPOLICY AND DEVELOPMENT ISSUES
The economy faces three structural challengesrequired to achieve sustained growth: poverty reduc-tion, proper environmental management, and ad-equate infrastructure. Continuing high poverty
shows that the development process has not succeeded,and that large sections of the population, impeded bypoverty, are unable to contribute. Environmental pro-tection is essential for sustaining growth and ensur-ing livelihood for some of the poorest segments ofsociety. Both are major structural constraints to de-velopment, and unless tackled urgently, will impedeits progress.
Data released by the government indicate thatpoverty incidence has fallen slowly over the past decadesbut remains high, particularly in rural areas. Littleprogress has been made in raising living standards forthe poorest of the poor, who are below the subsistenceincome threshold. Poverty reduction programs havefailed to effectively target the needs of these people.
The government considers poverty reductionone of the major planks of its development strategy.However, the Medium Term Philippine Development

ASIAN DEVELOPMENT OUTLOOK 2000112
Plan has a modest target for reducing the overall inci-dence of poverty by at most 7 percent in 1997-2004.This is no different from earlier targets, and reflectsno major additional emphasis on poverty reduction.As poverty alleviation efforts progress, bringing theremaining poor above the poverty line becomes in-creasingly difficult. Special measures are necessary toaddress the needs of the very poor, and far more effortis needed to address this seemingly intractable prob-lem. The government has begun annual poverty sur-veys, which will help better monitor and delineatethe dimensions of poverty and guide efforts to addressthe needs of the poor (see box 2.1).
Indications are clear that rapid environmentaldegradation is under way. The annual rate of defores-tation, for example, is among the highest in SoutheastAsia, and the protected forest area as a percentage oftotal land area is among the lowest in Southeast Asia.Conservation International, a reputed nongovern-ment organization, has ranked the Philippines firstamong 25 countries classified as Priority BiodiversityHotspots needing urgent attention.
The cost of environmental degradation to theeconomy is high. Health and productivity losses fromair and water pollution in Metro Manila alone havebeen estimated at about 1 percent of gross nationalproduct annually. However, because of difficulties in
measuring the full cost of pollution and environmen-tal damage, it is difficult for policymakers to makeinformed decisions and take appropriate action. Moreanalysis is needed. The government also needs to de-vote more attention to capacity building of nationalgovernment agencies that handle environment mat-ters, and to improving their capability for enactingand enforcing environmental regulations. This in-volves obtaining the cooperation of all stakeholders,including local governments and communities as wellas nongovernment organizations.
The Philippines has lagged behind many of itsneighbors in physical infrastructure to support the in-dustrialization and general development effort. Poorroads, inadequate port facilities, and unreliable andexpensive power have increased costs and reduced eco-nomic efficiency. Many of these deficiencies in infra-structure have been addressed in the past few years,but much remains to be done. The Medium Term Phil-ippine Development Plan calls for the private sectorto be more involved in accelerating project implemen-tation and restructuring the electricity sector throughprivatization, which is projected to improve efficiency,and lower costs. Costs of electricity are higher than inneighboring countries, which puts exporters at a dis-advantage. A program of specific targets for achievingthis objective would be welcome.

113SOUTHEAST ASIA
ThailandThailandThailandThailandThailand
The Thai economy began to recover in 1999 from the severe recession of 1998. Manufacturingproduction and the external sector performance improved significantly. In the short term, the imme-diate challenge continues to be financial sector restructuring. In the medium and long term, industrialrestructuring, technological upgrading, and improved education and training will be necessary toconsolidate economic recovery and growth.
tracted sharply the previous year, picked up, particu-larly in the second and third quarters of 1999, androse to 8.5 percent for the year. Private consumptiongrew moderately, resulting in part from rising consumerconfidence and modestly expanding farm income.Government stimulus measures, which included re-ducing the value-added tax rate from 10 to 7 percentand cutting taxes on petroleum products, also helpedboost private consumption. Tourism continued togrow, with the number of tourists reaching 8.5 millionin 1999, a 10.1 percent increase from the previous year.The private investment index declined moderately in1999, compared with a steep decline in 1998.
The economic crisis resulted in historically highunemployment since mid-1997. Before the crisis,unemployment, including the seasonally inactivelabor force, was around 3.6 percent. By 1998, this fig-ure had almost doubled to 6.1 percent of the total la-bor force, and underemployment had increasedsignificantly. The situation eased somewhat in 1999,as the unemployment rate declined slightly to 5.9 per-cent. Public programs boosted temporary employment,and the agriculture sector absorbed a significant
RECENT TRENDS AND PROSPECTSRECENT TRENDS AND PROSPECTSRECENT TRENDS AND PROSPECTSRECENT TRENDS AND PROSPECTSRECENT TRENDS AND PROSPECTS
AAAAAfter an unprecedented real GDP contraction of10.4 percent in 1998, the economy began show-
ing positive signs of recovery in the beginning of 1999.Real GDP growth in 1999 was 4.1 percent, led by themanufacturing sector and increased domestic demandboosted through several government stimulus pack-ages. The capacity utilization rate in the manufactur-ing sector increased to 63 percent from slightly morethan 50 percent in 1998. While this was still belownormal levels of 70-80 percent, manufacturing wasnevertheless the engine of economic recovery, with agrowth rate of around 11.3 percent in 1999.
Vehicles and transportation equipment produc-tion showed the highest growth rate. New vehiclemodels boosted domestic demand, and exports ex-panded as foreign vehicle producers used Thailand asa production center for regional manufacturing. Ag-riculture showed modest growth of 0.5 percent, withincreased production of major crops such as rice, rub-ber, maize, and cassava partly offset by a sharp declinein farm prices. Domestic demand, which had con-

ASIAN DEVELOPMENT OUTLOOK 2000114
TTTTTable 2.12able 2.12able 2.12able 2.12able 2.12 Major Economic Indicators, Thailand, 1997-2001Major Economic Indicators, Thailand, 1997-2001Major Economic Indicators, Thailand, 1997-2001Major Economic Indicators, Thailand, 1997-2001Major Economic Indicators, Thailand, 1997-2001(percent)
Item 1997 1998 1999 2000 2001
GDP growth -1.8 -10.4 4.1 4.5 4.6
Gross domestic investment/GDP 33.2 26.1 26.8 30.4 33.0
Gross savings/GDP 32.4 39.3 36.4 36.3 36.0
Inflation rate (consumer price index) 5.6 8.1 0.3 2.5 3.5
Money supply (M2) growth 16.4 9.5 2.1 8.0 12.0
Fiscal balance/GDPa -0.9 -3.4 -3.0 -3.0 —
Merchandise exports growth 3.8 -6.8 7.4 7.0 8.0
Merchandise imports growth -13.4 -33.8 17.7 16.5 17.0
Current account balance/GDPb -2.1 12.7 9.1 5.5 1.9
Debt service/exports 15.6 20.8 20.4 16.0 —
— Not available.
a. On a fiscal year basis. Covers central government budgetary and nonbudgetary accounts and social security funds, and excludes interest costs offinancial sector restructuring.b. Excludes official transfers.
Sources: Bank of Thailand; Ministry of Finance; National Economic and Social Development Board; National Statistics Office; Bureau of theBudget; Ministry of Commerce; IMF reports; staff estimates.
number of laid-off urban workers who had returnedto their provinces. Furthermore, both output and em-ployment growth remain below precrisis growth rates,after falling sharply in 1998 (see figure 2.12).
In 1999, the government maintained the expan-sionary fiscal stance it adopted in 1998, after the fiscaland monetary targets of the adjustment program of1997 and early 1998 plunged the country into a deeprecession. The government continued to relax itspublic sector deficit target. Under the Eighth Letterof Intent to the International Monetary Fund inSeptember 1999, the consolidated deficit—includingthe cost of financial restructuring, estimated at 1.7 per-cent of GDP—was projected at 7.2 percent of GDPfor 1999, compared with 5.5 percent the previous year.During 1999, the government launched two economicstimulus packages, with expenditures of B53 billionand B100 billion, respectively, along with tax and tariffreductions. While the March 1999 package aimed atincreasing employment and stimulating privateconsumption, the August 1999 package focused ontax and tariff measures, equity investment funds,
recovery of the real estate sector, and financing forsmall and medium-size enterprises.
Despite an easing of monetary policy, the growthrate of money supply continued to slow in 1999, inline with the decrease in commercial bank credits anddeposits. At the end of 1999, the increase in moneysupply (M2) and M2A (including finance and securi-ties companies) was 2.1 percent and 1.3 percent, re-spectively, compared with 9.5 percent and 6.1 percentat the end of the previous year. With high liquidity inthe money market, interest rates dropped to very lowlevels, with the interbank rate at 1.23 percent, primerate at 8.25-8.50 percent, and deposit rates at 4.00-4.25 percent in December 1999. However, the creditcrunch continued because of the banks’ concern withexisting levels of nonperforming loans (NPLs), andtightened loan-loss provisioning and capital adequacyrequirements. Credit extension by commercial banksposted negative growth throughout the year. Despiteprogress in debt restructuring, the total amount ofNPLs in this financial sector was B2,074 billion, or 38.5percent of total loans outstanding in December 1999.
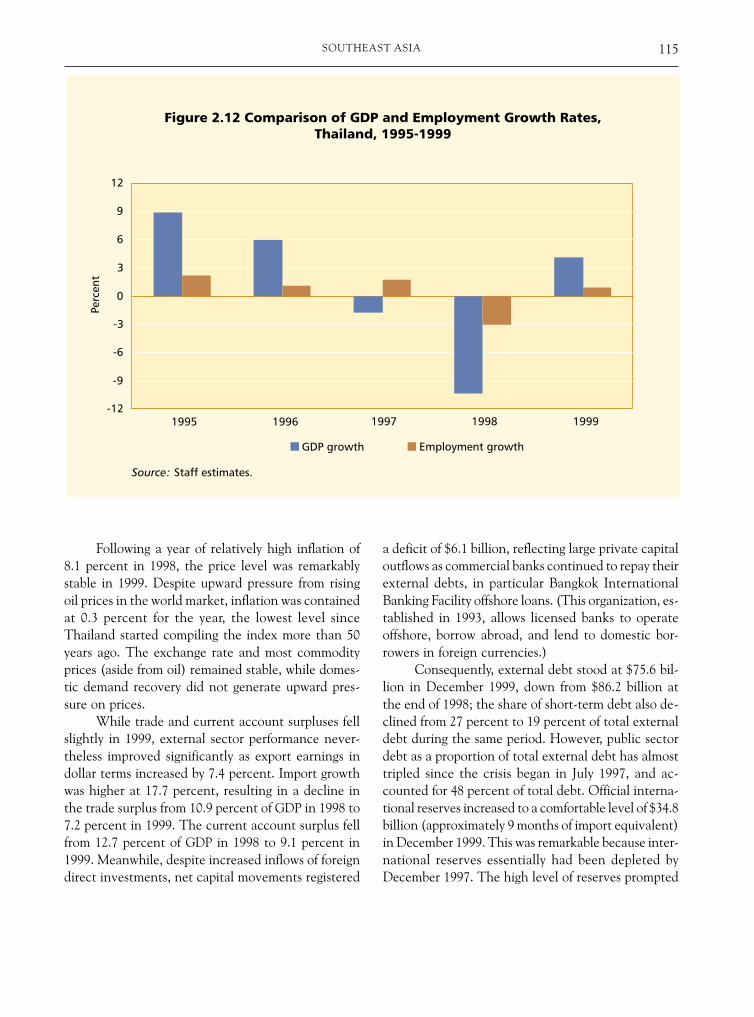
115SOUTHEAST ASIA
Following a year of relatively high inflation of8.1 percent in 1998, the price level was remarkablystable in 1999. Despite upward pressure from risingoil prices in the world market, inflation was containedat 0.3 percent for the year, the lowest level sinceThailand started compiling the index more than 50years ago. The exchange rate and most commodityprices (aside from oil) remained stable, while domes-tic demand recovery did not generate upward pres-sure on prices.
While trade and current account surpluses fellslightly in 1999, external sector performance never-theless improved significantly as export earnings indollar terms increased by 7.4 percent. Import growthwas higher at 17.7 percent, resulting in a decline inthe trade surplus from 10.9 percent of GDP in 1998 to7.2 percent in 1999. The current account surplus fellfrom 12.7 percent of GDP in 1998 to 9.1 percent in1999. Meanwhile, despite increased inflows of foreigndirect investments, net capital movements registered
a deficit of $6.1 billion, reflecting large private capitaloutflows as commercial banks continued to repay theirexternal debts, in particular Bangkok InternationalBanking Facility offshore loans. (This organization, es-tablished in 1993, allows licensed banks to operateoffshore, borrow abroad, and lend to domestic bor-rowers in foreign currencies.)
Consequently, external debt stood at $75.6 bil-lion in December 1999, down from $86.2 billion atthe end of 1998; the share of short-term debt also de-clined from 27 percent to 19 percent of total externaldebt during the same period. However, public sectordebt as a proportion of total external debt has almosttripled since the crisis began in July 1997, and ac-counted for 48 percent of total debt. Official interna-tional reserves increased to a comfortable level of $34.8billion (approximately 9 months of import equivalent)in December 1999. This was remarkable because inter-national reserves essentially had been depleted byDecember 1997. The high level of reserves prompted

ASIAN DEVELOPMENT OUTLOOK 2000116
the government to suspend disbursement of the in-stallment of $3.5 billion due under the $17.2 billionInternational Monetary Fund standby agreement ofAugust 1997. The exchange rate remained stable ataround B37-B39 per dollar in 1999.
To sum up, with the exception of private invest-ment and commercial bank credits, indications ofrecovery are growing. Private consumption and manu-facturing production picked up in particular in the sec-ond and third quarter of 1999, and the performanceof the external sector steadily improved.
The economy is expected to build on its 1999performance, growing at a slightly higher rate in 2000and 2001, but not to return to precrisis growth levels.Capacity utilization in the manufacturing sector shouldreach normal levels of around 70 percent in the firsthalf of 2000, which should be reflected by a return topositive private investment levels. While the recoveryin 1999 was primarily export-driven with additionalsupport from public stimulus measures and tourism,domestic consumption must rise if GDP growth is tocontinue in 2000-2001. In the financial sector, transferof bad bank loans to newly established asset manage-ment companies (AMCs) is expected to reduce thelevel of NPLs held by commercial banks by 2001 toaround 30 percent of total loans outstanding. How-ever, if these plans are derailed, banks are unlikely toundertake the required volume of new lending to funda sustained recovery in production and economicgrowth. As demand catches up and capacity utilizationrises, inflation in 2000 is forecast at about 2.5-3 percent.Implementation of the August 1999 fiscal package,along with continued financial restructuring, will keepthe consolidated deficit at 6-7 percent of GDP in 2000.If the growth rate of trade continues, the trade surpluswill continue to shrink to about 4 percent of GDP in2000. This will also translate into a decline in the cur-rent account surplus to about 5-6 percent of GDP.Gross official reserves are expected to be maintainedat the same level in 1999, and external debt and thedebt-service ratio are expected to decline further.
ISISISISISSUES IN ECONOMIC MANAGEMENTSUES IN ECONOMIC MANAGEMENTSUES IN ECONOMIC MANAGEMENTSUES IN ECONOMIC MANAGEMENTSUES IN ECONOMIC MANAGEMENT
The biggest immediate challenge is financial restruc-turing, in particular solving the problem of NPLs, whichcontinue to cripple the financial sector and cause weak
credit expansion. If lending does not resume quickly,viable companies that survived the crisis may eventu-ally succumb to sustained liquidity problems. Thiscould cause another wave of business closures andhigher unemployment. Many commercial banks haveso far been reluctant to restructure problem loans andaccept actual losses (“haircuts”). Instead, most haveopted for less painful rescheduling such as stretchingout the amortization schedule. However, this merelypostpones solving the problem. Problem loans willresurface once the extended repayment period isreached, unless additional liquidity is introducedrapidly into the system through foreign capital inflows.
In contrast to other countries in the region,Thailand has not opted for commercial bank recapi-talization financed by government. Such a programwould encourage moral hazard and put an excessivelyhigh burden on taxpayers. Nevertheless, the govern-ment has adopted measures since the start of the cri-sis to help banks cope with the crisis. In addition tothe ongoing financial restructuring package launchedin August 1998, the government encouraged banks toset up AMCs to deal with NPLs. By separating themanagement of problem loans from ongoing bank ac-tivities, the banks should be able to refocus on newlending, thus helping revive the economy. However,progress has been slow and setting up some AMCshas been put on hold.
During the crisis, private consumption reachedits lowest level in the third quarter of 1998. Aided bya series of stimulus measures and tax reductions, ithas improved but the trend is volatile. GDP per capitawas on the rise after two years of decline, but con-sumers remained hesitant to resume significant spend-ing. Worries about job security and financial sectorstability, a sharp rise in oil prices, and a weaker bahtconstrained private consumption. Confidence in gov-ernment policy and the government’s commitment tocarrying out needed reforms will play a critical role inreestablishing consumer confidence and boosting con-sumption in the future.
POLICY AND DEVELPOLICY AND DEVELPOLICY AND DEVELPOLICY AND DEVELPOLICY AND DEVELOPMENT ISOPMENT ISOPMENT ISOPMENT ISOPMENT ISSUESSUESSUESSUESSUES
In the medium and long term, industrial upgradingand improvement of productivity will be the mainchallenges. Increasing local wages have undermined

117SOUTHEAST ASIA
competitiveness in labor-intensive sectors, as have lowwages in neighboring countries. In the end,international competitiveness can only be achievedby industrial upgrading. This requires substantial in-vestment in specialized education, research and de-velopment, and other knowledge-enhancingmeasures. This should help the industry sector fur-ther develop a high-technology base in computers,electronics, and other technology- and knowledge-intensive products and services.
While the country has done exceptionally wellin achieving nearly universal primary education andexpanding its secondary school system, qualityimprovements have not accompanied quantitativeachievements. Eighty percent of Thailand’s labor forcehas only a primary education or less. Some 5.5 millionpersons in the 6- to 19-year-old age group are not inschool or another form of training. Educational at-tainment also varies substantially between urban andrural areas, where participation in education and skillsdevelopment is strikingly low. Enrollment in highereducation focuses on the social sciences and humani-ties, with science and technology students making uponly about 22 percent of total enrollment. Low num-bers of qualified faculty and an inadequate budget foruniversity-level research and development have im-paired the capacity to conduct science and technol-ogy research and provide quality graduate education.In addition, vocational and skills training programshave been implemented largely without the activeparticipation of the private sector in planning, design,and execution.
Consequently, concern is growing regarding themismatch between skills generated by the educationand training systems and those required to keep thecorporate sector internationally competitive. In par-ticular, the economy needs to move away from labor-intensive production. In recent years, the governmenthas increasingly recognized the importance of human
resource development in restoring its long-term com-petitiveness and ensuring sustainable growth and de-velopment. Several policy initiatives address theunderlying weaknesses of the educational and train-ing system. The new constitution, approved in 1997,made education free for children up to 12 years old.In addition, the Eighth Plan (1997-2001) outlinedpriority areas in education and training, including im-proving quality, relevance, administration, manage-ment, and private sector participation.
The National Education Act of 1999 will let thegovernment pursue sweeping education reforms.Essentially, these will cover basic education for all, earlychildhood education, teachers and teaching methods,educational standards and quality assurance,education management (decentralization), financialmanagement, training and vocational education, andinformation technology for continued learning.
If Thailand wants to move to higher value-added production, it must also strengthen its domes-tic capacity for research and development, so it canmaster new and complex technology that will sup-port growth and development. This would requiremoving away from a predominantly supply-driven,government-dominated educational system toward amore market-responsive educational system. This sys-tem should incorporate private sector participation,education and research programs in science and tech-nology, and market-oriented, specialized training ofthe active labor force. Specialized and up-to-date edu-cation and training will upgrade manufacturing pro-duction, but also will improve agricultural productionby allowing the use of agricultural biotechnology andenvironmental technology. Moreover, it is essentialto promote private sector collaboration by strength-ening links between university and industry. Thesepolicy initiatives were incorporated in the HigherEducation Development Project approved by theAsian Development Bank in 1999.

ASIAN DEVELOPMENT OUTLOOK 2000118
VVVVViet Namiet Namiet Namiet Namiet Nam
With the loss of reform momentum and the economic slowdown over the last two years, the sustainabilityof past gains on poverty reduction is at stake. Carrying the process of poverty reduction for-ward in the coming years will require embarking on a second set of reform measures, onefocused on diversifying rural livelihoods.
RECENT TRENDS AND PROSPECTSRECENT TRENDS AND PROSPECTSRECENT TRENDS AND PROSPECTSRECENT TRENDS AND PROSPECTSRECENT TRENDS AND PROSPECTS
IIIIIn 1999, real GDP growth was estimated at 4.4 per-cent. This was half the average growth rate during
the six-year period from 1992 to the onset of the re-gional crisis in 1997, an era of high growth driven byfirst-generation reforms (doi moi), booming privateconsumption, and foreign direct investment (FDI)inflows. The slowdown in growth during 1998-1999resulted from the impact of the regional crisis, stag-nating domestic demand, and loss of reformmomentum.
Performance of various sectors in 1999 wasmixed. Agriculture sector growth increased to 5 per-cent from 3 percent the previous year, with a bumperrice crop and growth in fisheries and livestock. Theindustry and service sectors continued to lag in 1999,with inventory buildup in key manufacturing indus-tries, including cement, steel, coal, and fertilizers.Decreasing domestic demand and eroding com-petitiveness in vital subsectors slowed industrialgrowth. The deceleration in the service sector resultedfrom a slowdown in tourism, real estate services,
and transportation, areas that were hit particularlyhard by the economic slowdown. Two years of slowgrowth led to rising unemployment, particularly inthe urban areas, and reached an estimated 7.4 per-cent in 1999.
Investment as a share of GDP has fallen duringthe last two years, from an estimated 29 percent ofGDP in 1998 to 27.2 percent in 1999. This stemmedfrom lower private investment, less investment bystate-owned enterprises (SOEs), and slower FDI in-flows. The budgeted increase in public invesment in1999 to stimulate demand did not materialize. To re-vive private investment, the government set up aDevelopment Assistance Fund to provide medium-and long-term loans and credit guarantees for investingin productive ventures. FDI declined for the secondyear in a row, and estimates of the 1999 inflows rangefrom $600 million to $1.4 billion. Before the crisis,two thirds of FDI inflows originated in Asia and hencewere vulnerable to weaker regional GDP growth. Thedecline in FDI continued as investor sentiment re-mained lukewarm because of uncertainties about thedirection and pace of reforms.

119SOUTHEAST ASIA
TTTTTable 2.13able 2.13able 2.13able 2.13able 2.13 Major Economic Indicators, VMajor Economic Indicators, VMajor Economic Indicators, VMajor Economic Indicators, VMajor Economic Indicators, Viet Nam, 1997-2001iet Nam, 1997-2001iet Nam, 1997-2001iet Nam, 1997-2001iet Nam, 1997-2001(percent)
Item 1997 1998 1999 2000 2001
GDP growth 8.2 4.4 4.4 5.0 6.0
Gross domestic investment/GDP 28.3 25.5 19.7 20.8 21.9
Gross savings/GDP 21.8 21.1 22.0 21.6 20.5
Inflation rate (consumer price index)a 3.6 9.2 0.1 6.0 7.0
Money supply (M2) growthb 25.4 24.6 40.0 25.0 24.0
Fiscal balance/GDPc -1.7 -1.6 -2.0 -1.7 -1.5
Merchandise exports growth 26.5 1.0 22.3 10.0 10.0
Merchandise imports growth 0.8 -2.1 1.2 16.0 17.0
Current account balance/GDPd -6.5 -4.4 2.3 0.8 -1.4
Debt service/exportse 11.4 13.2 11.1 12.0 10.9
a. End of period; 1997 data based on retail price index, but since 1998 the CPI has replaced the RPI for estimating inflation.b. Since 1996 the monetary survey has included 36 nongovernment banks.c. On cash basis; excludes interest arrears, grants, and onlending.d. Excludes official transfers.e. Debt service on debt due/exports of goods and nonfactor services.
Sources: General Statistical Office; Ministry of Finance; State Bank of Viet Nam; staff estimates.
The fiscal deficit was about 2 percent of GDP in1999. The budget deficit was maintained at moderatelevels, despite falling revenues, because currentexpenditures were reduced. The banking systemabsorbed the bulk of the Treasury bill issuance thataccounted for 51 percent of total financing in 1999.
The end-of-year growth rate of retail prices for1999 was estimated at 0.1 percent compared with9.2 percent in 1998. A fall in the food price index,weak domestic demand, and a relatively stable ex-change rate contributed to price stability. Interest rateceilings were reduced gradually from around 1.2 per-cent per month to 0.85 percent. Credit to the govern-ment and SOE sector was more restricted than inprevious years, while credit to the smaller nonstatesector grew faster. The State Bank of Viet Nam esti-mated that money supply (M2) grew by 39.1 percentin 1999 compared with 26 percent in 1998, due largelyto increased foreign currency deposits from inwardremittances. These funds were re-deposited inoverseas banks and did not translate into accelerateddomestic credit growth. This partly explains why
the money supply grew so rapidly in a year of recordlow inflation.
Exports grew slowly in early 1999 but perkedup toward the end of the year, largely because ofcrude oil and rice exports. Textiles, garments, footwear,and marine products also registered stronger growththan in previous years. Crude oil was exported mainlyto the People’s Republic of China and Australia,marine products to Japan and other countries in theregion, and most of the footwear exports to Europe.A higher volume of exports accounted for most ofthe increase in export earnings, rather than increasedexport price.
Overall export growth was 22.3 percent, up fromonly 1 percent in 1998. Imports showed only a smallincrease from the previous year, with fewer machin-ery and consumer goods and more petroleum prod-ucts, fertilizers, steel, and synthetic fibers. With lowerimport levels and a resurgence of exports, the currentaccount registered a substantial surplus, in contrastto a large deficit in 1998. Debt remained withinmanageable limits.
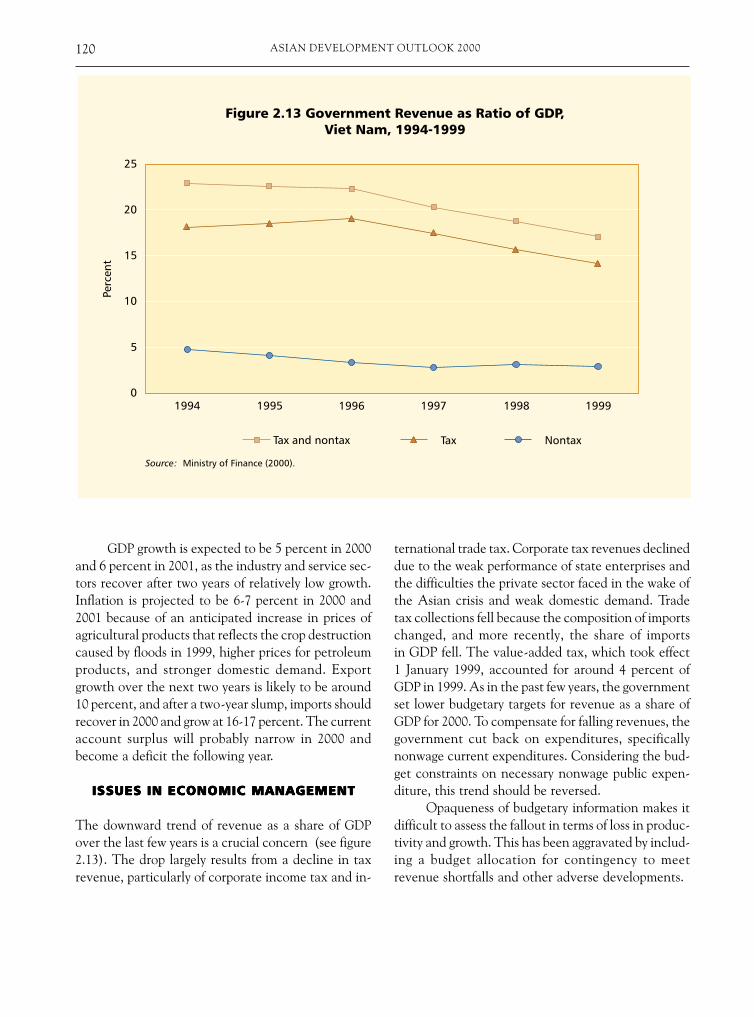
ASIAN DEVELOPMENT OUTLOOK 2000120
GDP growth is expected to be 5 percent in 2000and 6 percent in 2001, as the industry and service sec-tors recover after two years of relatively low growth.Inflation is projected to be 6-7 percent in 2000 and2001 because of an anticipated increase in prices ofagricultural products that reflects the crop destructioncaused by floods in 1999, higher prices for petroleumproducts, and stronger domestic demand. Exportgrowth over the next two years is likely to be around10 percent, and after a two-year slump, imports shouldrecover in 2000 and grow at 16-17 percent. The currentaccount surplus will probably narrow in 2000 andbecome a deficit the following year.
ISISISISISSUES IN ECONOMIC MANAGEMENTSUES IN ECONOMIC MANAGEMENTSUES IN ECONOMIC MANAGEMENTSUES IN ECONOMIC MANAGEMENTSUES IN ECONOMIC MANAGEMENT
The downward trend of revenue as a share of GDPover the last few years is a crucial concern (see figure2.13). The drop largely results from a decline in taxrevenue, particularly of corporate income tax and in-
ternational trade tax. Corporate tax revenues declineddue to the weak performance of state enterprises andthe difficulties the private sector faced in the wake ofthe Asian crisis and weak domestic demand. Tradetax collections fell because the composition of importschanged, and more recently, the share of importsin GDP fell. The value-added tax, which took effect1 January 1999, accounted for around 4 percent ofGDP in 1999. As in the past few years, the governmentset lower budgetary targets for revenue as a share ofGDP for 2000. To compensate for falling revenues, thegovernment cut back on expenditures, specificallynonwage current expenditures. Considering the bud-get constraints on necessary nonwage public expen-diture, this trend should be reversed.
Opaqueness of budgetary information makes itdifficult to assess the fallout in terms of loss in produc-tivity and growth. This has been aggravated by includ-ing a budget allocation for contingency to meetrevenue shortfalls and other adverse developments.

121SOUTHEAST ASIA
To improve revenue performance and ensurethat priority spending can be maintained without jeop-ardizing macroeconomic stability, the governmentmust set and achieve revenue targets aligned to itsmacroeconomic projections. Problems in the designand administration of taxes will have to be addressedwith a view to terminating discretionary rates and ex-emptions. Budgetary information also needs to bemade more transparent so that revenue shortfalls canbe monitored in terms of productive and nonproduc-tive expenditures. Further, the practice of including asignificant allocation for contingency must be re-viewed, as it weakens the link between the budgetand actual spending.
POLICY AND DEVELPOLICY AND DEVELPOLICY AND DEVELPOLICY AND DEVELPOLICY AND DEVELOPMENT ISOPMENT ISOPMENT ISOPMENT ISOPMENT ISSUESSUESSUESSUESSUES
Rapid economic growth from the early 1990s until theonset of the crisis had a significant impact in reducingpoverty. It has also been associated with an increasein inequality, particularly a widening of rural-urbangaps, though Viet Nam has been and remains a rela-tively egalitarian society. The incidence of poverty, asmeasured by the headcount ratio, dropped from 58 to37 percent between 1993 and 1998. During the sameperiod, the depth of poverty measured by the povertygap declined from 18.5 to 9.5 percent. The incidenceof poverty in rural areas is 45 percent compared with10-15 percent for urban areas, and 90 percent of thepoor live in rural areas. In 1993, many people belowthe poverty line were able to improve their situationsenough to cross the line and are now clustered justabove it. Therefore, while gains in poverty reductionhave been made, they remain quite fragile.
Indicators of inequality for 1993-1998 increasedmarginally, with the Gini coefficient (a measure ofinequality) rising from 0.33 to 0.35. An estimated96 percent of the increase resulted from widening
rural-urban gaps, with differences in growth rates be-tween regions also contributing to the disparity.
Poverty incidence during 1984-1994 declined asa result of high GDP growth rates. In the future, how-ever, GDP growth alone may not suffice to reduce pov-erty levels. Measures will be needed to improve incomedistribution, particularly the differentials in the rural-urban income levels. Because most of the poor live inrural areas, it is critical to identify the factors associ-ated with rural poverty, which include geographicalfactors and household characteristics. The NorthernUplands, Central Highlands, and North Central Coastare the most impoverished regions, with limited natu-ral resources and low agricultural productivity. Thesethree regions have 51 percent of the country’s poor,although they contain only 26.8 percent of the popu-lation. Poverty among ethnic minorities living in theupland areas is also high.
Rural poverty bears most heavily on those farmhouseholds that
• Have small landholdings, often of low quality• Rely on informal credit with high interest rates• Have limited access to markets for farm goods• Lack off-farm employment.
Providing off-farm employment is particularlyrelevant. This will involve moving away from thecapital-intensive pattern of development with limitedlinkages to the rest of the economy that offers limitedemployment opportunities. This pattern of develop-ment has been perpetuated by a policy of resuscitat-ing SOEs through preferential treatment. Thegovernment needs to move decisively to remove bothexplicit and implicit biases that favor SOEs and dis-criminate against nonstate enterprises. To makeprogress in reducing poverty, these distortions mustbe corrected and policymakers must articulate a time-bound strategy—doi moi phase two—for promotinglabor-intensive growth.

123SOUTH ASIA
1999 refers to fiscal year 1998/99, ending 30 June.
BangladeshBangladeshBangladeshBangladeshBangladesh
Macroeconomic stability has been put under severe pressure by the disruptions from flooding in thethird quarter of 1998. Signs of vulnerability have emerged both in the domestic and external sectors.Further structural reforms are needed if Bangladesh is to achieve greater economic efficiency, growth,and international competitiveness while reducing poverty.
RECENT TRENDS AND PROSPECTSRECENT TRENDS AND PROSPECTSRECENT TRENDS AND PROSPECTSRECENT TRENDS AND PROSPECTSRECENT TRENDS AND PROSPECTS
IIIIIn the early 1990s, the government launched a com-prehensive set of structural reforms aimed at
strengthening fiscal and monetary management, fos-tering private sector development, and liberalizing theexternal trade and foreign exchange rate regimes. Suchreforms resulted in a relatively stable macroeconomicenvironment, with improvements in economic growth,savings, and investment. Decreased poverty andimproved social indicators accompanied the accelera-tion in economic growth. Between 1995 and 1999, theGDP growth rate averaged 5 percent compared with4.7 percent in the preceding five years. The agriculturesector maintained an average growth rate of 3 per-cent, and the country achieved near self-sufficiencyin rice production in those years without flooding.During the same period, growth in the industry sectoraveraged 6 percent, mainly because of robust manu-facturing performance, while the service sector grewat an average of 6 percent. The export sector showed
an average annual growth rate of about 16 percent indollar terms because of strong trade in garments andknitwear products. Bangladesh succeeded in attract-ing significant foreign direct investment (FDI), whichincreased from about $80 million in 1995 to about$400 million per year for 1996 through 1999.
This strong growth trend in GDP was slowedwhen severe floods hit in the third quarter of 1998,disrupting industrial growth in particular. Neverthe-less, with the help of a bumper winter harvest, GDPgrew 4.4 percent in 1999. This was better than theimmediate postflood estimates of 3.3 percent, thoughlower than the 5.2 percent growth of 1998. Agricul-ture and services performed well, overcoming theadverse impact of the flooding. Agriculture grew3.9 percent, up from 3.2 percent in 1998, because ofnew higher-yielding varieties, particularly of rice.Moreover, the government helped in postflood reha-bilitation by providing seeds, fertilizer, and credits. Theservice sector maintained steady growth of 5 percent,while growth in the industry sector slipped to 4 per-

ASIAN DEVELOPMENT OUTLOOK 2000124
cent from 8.3 percent in 1998. The floods seriouslydisrupted production of major medium- and large-scale manufacturing enterprises, including ready-madegarments for export.
Gross domestic investment increased to22.5 percent of GDP in 1999, from 21.6 percent theprevious year, because of an investment surge in flood-induced reconstruction and rehabilitation. Grossnational savings increased to 21.1 percent of GDPcompared with 20.4 percent in 1998, mainly becauseof a surge in remittances from overseas workers.
After double-digit growth for several years,export growth dwindled to 2.8 percent in 1999 from17.1 percent in 1998. The major setback was in thewoven ready-made garments sector, which registeredonly 4.8 percent growth. While floods adverselyaffected export shipments and production, the devalu-ation of Southeast Asian currencies also weakenedexport competitiveness. This demonstrates how vul-nerable the export sector is because of excessive de-pendence on a single subsector.
Imports grew 6.6 percent in 1999, higher thanthe preceding two years, because of imports of foodgrains triggered by the fear of flood losses. As a result,the current account deficit increased to 1.4 percent of
GDP from 1.2 percent the preceding year. Increasingpressure on the balance of payments was reflected bythe low level of foreign exchange reserves of $1.5 bil-lion (2.2 months of import equivalent) at the end of1999. Lower export growth resulted in a slight increasein the debt-service ratio to 12 percent from 11.7 per-cent the previous year. Currency depreciated slightly,as the annual average exchange rate increased toTk48.5 per dollar compared with Tk46.3 in 1998. Be-cause of additional spending brought on by the flood—including imports of extra food grains and postfloodrehabilitation costs—and a shortfall in current rev-enue collection resulting from production disruption,a higher budget deficit resulted. Current revenue de-clined to 9 percent of GDP from 9.7 percent in 1998,while the fiscal deficit increased to 5.3 percent of GDPfrom 4.2 percent. However, the fiscal losses ofTk15 billion associated with operating state-ownedenterprises exposed a serious fiscal managementproblem. If the fiscal liabilities arising from these losseswere considered, the government’s fiscal positionwould be even weaker.
The government pursued an expansionary mon-etary policy to finance the flood recovery program.Money supply (M2) increased 12.8 percent in 1999
TTTTTable 2.14able 2.14able 2.14able 2.14able 2.14 Major Economic Indicators, Bangladesh, 1997-2001 Major Economic Indicators, Bangladesh, 1997-2001 Major Economic Indicators, Bangladesh, 1997-2001 Major Economic Indicators, Bangladesh, 1997-2001 Major Economic Indicators, Bangladesh, 1997-2001(percent)
Item 1997 1998 1999 2000 2001
GDP growth 5.4 5.2 4.4 5.0 5.5
Gross domestic investment/GDP 20.8 21.6 22.5 22.8 23.5
Gross national savings/GDP 18.6 20.4 21.1 21.8 22.3
Inflation rate (consumer price index) 2.6 7.0 9.0 6.0 8.0
Money supply (M2) growth 10.8 10.4 12.8 14.0 12.0
Fiscal balance/GDP -4.5 -4.2 -5.3 -4.2 -5.0
Merchandise exports growth 13.3 17.1 2.8 7.0 12.0
Merchandise imports growth 3.2 5.1 6.6 7.0 7.0
Current account balance/GDP -2.2 -1.2 -1.4 -1.0 -1.2
Debt service/exports 11.4 11.7 12.0 12.1 12.1
Note: National accounts data are based on 1995/96 base year, are under government review, and not yet officially released.
Sources: Bangladesh Bank; Bangladesh Bureau of Statistics; World Bank; staff estimates.
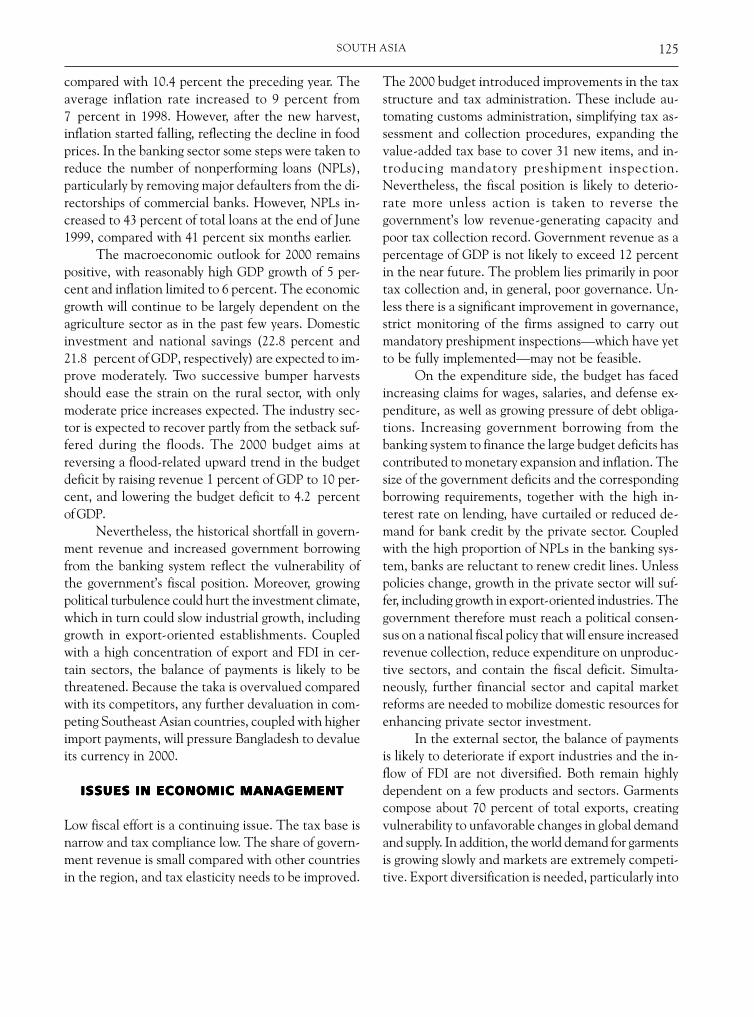
125SOUTH ASIA
compared with 10.4 percent the preceding year. Theaverage inflation rate increased to 9 percent from7 percent in 1998. However, after the new harvest,inflation started falling, reflecting the decline in foodprices. In the banking sector some steps were taken toreduce the number of nonperforming loans (NPLs),particularly by removing major defaulters from the di-rectorships of commercial banks. However, NPLs in-creased to 43 percent of total loans at the end of June1999, compared with 41 percent six months earlier.
The macroeconomic outlook for 2000 remainspositive, with reasonably high GDP growth of 5 per-cent and inflation limited to 6 percent. The economicgrowth will continue to be largely dependent on theagriculture sector as in the past few years. Domesticinvestment and national savings (22.8 percent and21.8 percent of GDP, respectively) are expected to im-prove moderately. Two successive bumper harvestsshould ease the strain on the rural sector, with onlymoderate price increases expected. The industry sec-tor is expected to recover partly from the setback suf-fered during the floods. The 2000 budget aims atreversing a flood-related upward trend in the budgetdeficit by raising revenue 1 percent of GDP to 10 per-cent, and lowering the budget deficit to 4.2 percentof GDP.
Nevertheless, the historical shortfall in govern-ment revenue and increased government borrowingfrom the banking system reflect the vulnerability ofthe government’s fiscal position. Moreover, growingpolitical turbulence could hurt the investment climate,which in turn could slow industrial growth, includinggrowth in export-oriented establishments. Coupledwith a high concentration of export and FDI in cer-tain sectors, the balance of payments is likely to bethreatened. Because the taka is overvalued comparedwith its competitors, any further devaluation in com-peting Southeast Asian countries, coupled with higherimport payments, will pressure Bangladesh to devalueits currency in 2000.
ISISISISISSUES IN ECONOMIC MANAGEMENTSUES IN ECONOMIC MANAGEMENTSUES IN ECONOMIC MANAGEMENTSUES IN ECONOMIC MANAGEMENTSUES IN ECONOMIC MANAGEMENT
Low fiscal effort is a continuing issue. The tax base isnarrow and tax compliance low. The share of govern-ment revenue is small compared with other countriesin the region, and tax elasticity needs to be improved.
The 2000 budget introduced improvements in the taxstructure and tax administration. These include au-tomating customs administration, simplifying tax as-sessment and collection procedures, expanding thevalue-added tax base to cover 31 new items, and in-troducing mandatory preshipment inspection.Nevertheless, the fiscal position is likely to deterio-rate more unless action is taken to reverse thegovernment’s low revenue-generating capacity andpoor tax collection record. Government revenue as apercentage of GDP is not likely to exceed 12 percentin the near future. The problem lies primarily in poortax collection and, in general, poor governance. Un-less there is a significant improvement in governance,strict monitoring of the firms assigned to carry outmandatory preshipment inspections—which have yetto be fully implemented—may not be feasible.
On the expenditure side, the budget has facedincreasing claims for wages, salaries, and defense ex-penditure, as well as growing pressure of debt obliga-tions. Increasing government borrowing from thebanking system to finance the large budget deficits hascontributed to monetary expansion and inflation. Thesize of the government deficits and the correspondingborrowing requirements, together with the high in-terest rate on lending, have curtailed or reduced de-mand for bank credit by the private sector. Coupledwith the high proportion of NPLs in the banking sys-tem, banks are reluctant to renew credit lines. Unlesspolicies change, growth in the private sector will suf-fer, including growth in export-oriented industries. Thegovernment therefore must reach a political consen-sus on a national fiscal policy that will ensure increasedrevenue collection, reduce expenditure on unproduc-tive sectors, and contain the fiscal deficit. Simulta-neously, further financial sector and capital marketreforms are needed to mobilize domestic resources forenhancing private sector investment.
In the external sector, the balance of paymentsis likely to deteriorate if export industries and the in-flow of FDI are not diversified. Both remain highlydependent on a few products and sectors. Garmentscompose about 70 percent of total exports, creatingvulnerability to unfavorable changes in global demandand supply. In addition, the world demand for garmentsis growing slowly and markets are extremely competi-tive. Export diversification is needed, particularly into
ASIAN DEVELOPMENT OUTLOOK 2000126
higher value-added products such as electronics,computers, and higher-quality clothing, where worlddemand is growing faster. Similarly, the high concen-tration of FDI in the natural gas and power sectors,about 60 percent, not only has failed to increase for-eign exchange reserves, but has also jeopardized thebalance of payments. The government is obliged topay foreign investors under the production-sharingcontracts of natural gas and power purchase agree-ments. The situation will be further aggravated whensignificant profit repatriation begins. Unless the gov-ernment considers exporting natural gas to neighbor-ing countries such as India, or diversifying FDI toexport-oriented industries, the balance of paymentsmay deteriorate further.
POLICY AND DEVELPOLICY AND DEVELPOLICY AND DEVELPOLICY AND DEVELPOLICY AND DEVELOPMENT ISOPMENT ISOPMENT ISOPMENT ISOPMENT ISSUESSUESSUESSUESSUES
Poverty alleviation will continue to be the centralagenda for both the government and external donors.Reducing poverty through accelerated economic andagricultural productivity is the main thrust of thegovernment’s Fifth Five-Year Plan (1997-2002).Poverty incidence is targeted to decline from 47.5 per-cent to 30 percent by 2002, while the annual averageGDP growth rate is set at 7 percent, a level necessaryto significantly decrease poverty. Halfway through theplan, growth had averaged only 5 percent.
The plan emphasizes the role of the private sec-tor, especially in export-oriented industries, as themain engine for sustainable economic growth andemployment opportunities. This will be facilitated byreforms in the financial and capital markets. Because80 percent of the population still lives in rural areas,self-sufficiency in food grains is emphasized as a routeto sustainable poverty reduction. Other measures totackle poverty are human resource development;promotion of small- scale enterprises throughmicrofinance; participation of local-level institutionsin rural development; and good governance.
Prospects for poverty reduction in Bangladeshwere set back in 1998 by heavy floods. Progress hasbeen slow despite substantial government effort and
resources that included allocating about a fourthof the annual development budget to social infra-structure. Thus, the use of the development bud-get allocated to the social sectors and socialinfrastructure needs to be extensively analyzed, anda strategy developed for increasing budget efficiencyto reduce poverty in a cost-effective manner.
Microfinance has been extended to a largesegment of the rural population. It is time to estab-lish stronger ties between these small-scale enter-prises and the formal sector by developing moreeffective marketing and distribution links withmedium- and large-scale industries. Nongovern-ment institutions organized to assist small-scaleindustry can play a key role. These links will alsoenhance the role of the private sector in povertyreduction through generating employment andincome for rural small-scale industries, many ofwhich are run by women.
While the government has been actively pro-moting the private sector’s role in the country’sdevelopment effort, progress in privatizing state-owned enterprises has been slow. The currentprivatization board, which was established in 1993,lacks full legislative power. The bureaucracy, laborunions, and politicians with vested interest stillexert strong resistance to privatization. However,substantial state-owned enterprise losses continueto drain the budget, consuming funds that couldotherwise be used for poverty reduction.
The country’s annual economic growth tar-get of 7 percent envisaged in the Fifth Five-YearPlan remains unattainable, not because the countrylacks economic potential, but because the growthprospects of the economy have been seriouslyclouded by internecine political conflicts, continu-ous general strikes (hartals) disrupting work,endemic corruption, and the general lack of goodgovernance. Unless the country’s political leader-ship becomes more enlightened and seriously setsitself to the task of addressing these issues, theeconomy may remain mired in poverty and under-development for years to come.
127SOUTH ASIA
BhutanBhutanBhutanBhutanBhutan
Economic growth in Bhutan has been strong the past two years. If the government remains committedto the objective of the Eighth Five-Year Plan, including social sector improvements and privatization,continued rapid growth can be continued in 2000 and beyond.
1999 refers to fiscal year 1998/99, ending 30 June.
RECENT TRENDS AND PROSPECTSRECENT TRENDS AND PROSPECTSRECENT TRENDS AND PROSPECTSRECENT TRENDS AND PROSPECTSRECENT TRENDS AND PROSPECTS
Economic growth in Bhutan registered 5.8 percentin 1998 and 6 percent in 1999, respectively. Con-
struction activities expanded because of major hydro-power and industrial projects. Per capita income grewmore slowly as a result of a rapidly expanding popula-tion. With a per capita income of $480 in 1997, Bhutanis still one of the poorest countries in the world. Whilelife in much of the country’s rugged terrain can beharsh, many of the characteristics of poverty such ashunger, malnutrition, and degraded physical environ-ment found in some parts of South Asia and amongpeople of similar income are not evident.
The government continued to conduct aprudent fiscal policy, with current revenues exceed-ing current expenditures as they have since 1996. Thegovernment receives most of its current revenues asprofits from public enterprises and service fees fromthe ministries, and tax revenues are primarily fromenterprise and goods taxes. However, inflows of foreign
grants have not been sufficient to cover developmentexpenditures. This led to an overall budget deficit of2.5 percent of GDP in 1999, in contrast to a 1 percentsurplus the previous year. This was due mainly to amajor increase in capital expenditures for hydropowerprojects. Inflation in 1999 was slightly more than the9 percent recorded the previous year, mainly becausefood imports from India cost more. Money supplygrowth slowed from 41.7 percent in 1998 to 21.4 per-cent because foreign aid slowed and domestic creditdeclined, particularly to the government. Credit to theprivate sector increased slightly compared to the pre-vious year.
The dollar value of exports declined 5.9 per-cent in 1999, compared with a strong growth of 12percent in 1998, because regional external demanddeclined. Imports grew 20.5 percent because of im-port requirements for the large hydropower and in-dustrial projects under construction. The combinationof declining exports and rapidly increasing importsresulted in a substantial widening of the trade deficit,

ASIAN DEVELOPMENT OUTLOOK 2000128
from 6.4 percent of GDP in 1998 to 15 percent in1999. The current account deficit also widened from12 percent of GDP to 25.8 percent. The trade bal-ance with India, Bhutan’s main trading partner, alsoturned from a slight surplus to a deficit of 4.8 percentof GDP. The current account deficit with India dete-riorated to almost 19 percent of GDP in 1999 com-pared with 6.6 percent in 1998.
Capital flows, mostly grants for infrastructureinvestments, were more than sufficient to cover thecurrent account deficit. This resulted in an overallbalance-of-payments surplus of more than 26 percentof GDP in 1999. Consequently, international reservesat the end of the year increased to about $259 mil-lion, equivalent to almost 19 months of imports. Ex-ternal debt, all in the form of concessional financingfrom donor agencies, continued to be small. Total pub-lic external debt was less than 30 percent of GDP in1999 and debt service was about 9 percent of mer-chandise export earnings. The composition of this debthas been changing, with less nonconvertible currencydebt and more convertible currency debt. As the graceperiods expire on the concessional debt acquired byBhutan in the 1980s, the country’s external balancewill come under increasing pressure because of higherdebt-service payments.
Bhutan has concluded two years of its ambitiousEighth Five-Year Plan, and the government has madesatisfactory progress in reaching plan targets. It hasexpanded the physical infrastructure network, includ-ing constructing roads and adding to the power supplygrid, and has built more schools and added healthcenters. To fund these projects, the government hasrelied on international donor support. In the future,there will be greater reliance on domestic resources.In this regard, the preparation for introducing a per-sonal income tax should help broaden the tax base.
Projected GDP growth rate for 2000 is 6 percent,and if the government continues its commitment tothe Eighth Plan, Bhutan should continue to experi-ence annual output growth of more than 5.5 percentduring 2001 and 2002, the end of the plan period.
ISISISISISSUES IN ECONOMIC MANAGEMENTSUES IN ECONOMIC MANAGEMENTSUES IN ECONOMIC MANAGEMENTSUES IN ECONOMIC MANAGEMENTSUES IN ECONOMIC MANAGEMENT
The government supports the Asian DevelopmentBank’s poverty reduction goal, which is consistent
with its own objectives. A large housing scheme hasbeen developed for urban dwellers. However,policymakers need to ensure that the program is fi-nancially sustainable. To this end, long-term finan-cial mechanisms need to be put in place. Housingsubsidies, if provided at all, should be given only tothe lowest income groups. Private sector participa-tion should also be encouraged.
Physical and social infrastructure need to beupgraded in various areas. Despite recent improve-ments in infrastructure development, road transportand power transmission urgently need improvement.In addition, vocational training needs to be strength-ened, particularly in technical and semi-skilled occu-pations in which workers are in short supply.
POLICY AND DEVELPOLICY AND DEVELPOLICY AND DEVELPOLICY AND DEVELPOLICY AND DEVELOPMENT ISOPMENT ISOPMENT ISOPMENT ISOPMENT ISSUESSUESSUESSUESSUES
A major developmental challenge in the years aheadwill be the absorption of the excess liquidity that hasbuilt up in the financial system, and the use of thesefunds to underpin private sector growth. The govern-ment is strongly committed to the growth of privatesector activity. While several institutional, policy, andlabor constraints remain, the government has beenactive in privatizing state-owned firms, promoting in-stitutional and legislative reform, and upgrading do-mestic skills.
However, industrial policies, particularly withregard to foreign investment, remain ambiguous.While sectoral diversification and privatization haveundoubtedly occurred, the industry sector is heavilyconcentrated on a narrow range of products. It is highlydependent on expatriate labor and is restricted by thesmall, fragmented domestic market and a narrow rangeof readily accessible export markets. It is also limitedby inadequate and expensive transportation and con-strained by national sensitivities concerning resourceexploitation—especially in tourism and logging—andby caution regarding foreign investment and foreignlabor. The main challenge facing the government ishow to realize its commitment to private sector activ-ity in the face of such constraints.
A series of legal and administrative changes areintended to improve government efficiency and in-crease administrative capacity. Several important billswere passed during the 77th session of the National

129SOUTH ASIA
Assembly, including the Telecommunications Act,Road Safety and Transport Act, Bankruptcy Act,Immovable and Movable Property Act, and Munici-pal Act. These bills will strengthen the legal frame-work for a market-oriented economy and increase thecapacity of the central and local government units tomanage development on a sustainable basis. Under anew system, the King remains the head of State, butis no longer the head of government. This positionnow is rotated annually among the six members ofthe Cabinet of Ministers.
On 11 November 1999, the government releaseda report aimed at enhancing good governance bypromoting efficiency, transparency, and accountabil-ity of government administration. Specific recommen-dations included measures to prevent corruption andabuse of authority. Reorganization of the government
administration will be fully implemented by 2002. Tofurther enhance efforts to strengthen governmentadministration through decentralization, a two-yearrolling budget will be introduced in 2000, and im-proved systems for budget planning and monitoringwill be introduced. Although the overall external debtposition is manageable, the new Department of Aidand Debt Management in the Ministry of Finance willconsider all new loans cautiously, in the context ofdebt-servicing capabilities as well as manpower andskill constraints.
After consolidating and evaluating these mea-sures, the government might consider additionalactions to strengthen its planning and developmentframework to prepare for future development chal-lenges, including reducing poverty and developing theprivate sector.

ASIAN DEVELOPMENT OUTLOOK 2000130
IndiaIndiaIndiaIndiaIndia
The recovery is being sustained, and the new government passed several important reform bills at thebeginning of its term. However, the unfinished agenda of economic reform remains substantial. Inparticular, while reforms undertaken so far clearly have helped promote economic growth, progresshas been less impressive in developing better social opportunities for the poor.
RECENT TRENDS AND PROSPECTSRECENT TRENDS AND PROSPECTSRECENT TRENDS AND PROSPECTSRECENT TRENDS AND PROSPECTSRECENT TRENDS AND PROSPECTS
TTTTThe economic recovery that started at the end of1998 continued in 1999, but at a slightly slower
pace because of less growth in agriculture. GDP growthwas slightly lower, at around 6 percent, than the 6.8percent in 1998.
With below-normal monsoon in some areas andserious damage from a cyclone that hit the Orissa coastin October 1999, agricultural growth slowed from1998’s strong performance of 7.2 percent to less than1 percent. However, lower growth in the agriculturesector was partially offset by increased activity in in-dustry and services. Industrial output increased 6.5percent in contrast to a 4 percent rise the previousyear. Double-digit growth in consumer durables, ma-chinery, and cement boosted the sector. Automobilesand steel production also continued to record healthygrowth rates. The growth rate of the service sector,which had declined modestly in 1998, bounced backto the previous level of about 8 percent.
The primary concern of the Reserve Bank ofIndia (RBI) in 1999 was to ensure adequate liquidityfor the corporate sector while keeping inflation un-der control. Under the generally favorable policy en-vironment, characterized by low inflation and a stableIndian rupee, the easing of monetary conditions con-tinued in 1999, with the broad money supply (M3)growing at a comfortable 16 percent. The RBI man-aged the adverse effect of large government borrow-ing on interest rates with a blend of auctions, privateplacement, and open market operations. Sales ofbonds to the private sector accounted for 40 percentof total government borrowing.
As the economy recovered in 1999, bank creditand other flows to the commercial sector increased.The RBI cut the cash reserve ratio three times, from10.5 to 9 percent, and reduced the repurchase andbank rates by 2 percent and 1 percent, respectively.Consequently, bank credit to the commercial sectorexpanded 11 percent during the first nine months of1999, compared with 7 percent the previous year.
1999 refers to fiscal year 1999/00, ending 31 March.
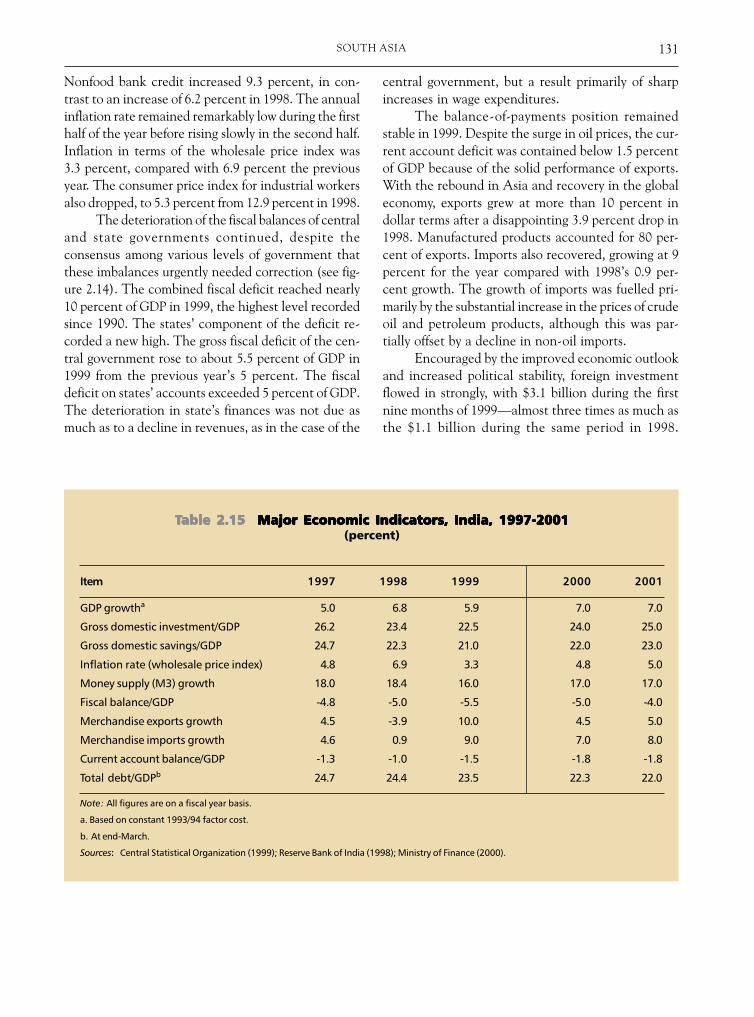
131SOUTH ASIA
TTTTTable 2.15able 2.15able 2.15able 2.15able 2.15 Major Economic Indicators, India, 1997-2001Major Economic Indicators, India, 1997-2001Major Economic Indicators, India, 1997-2001Major Economic Indicators, India, 1997-2001Major Economic Indicators, India, 1997-2001(percent)
Item 1997 1998 1999 2000 2001
GDP growtha 5.0 6.8 5.9 7.0 7.0
Gross domestic investment/GDP 26.2 23.4 22.5 24.0 25.0
Gross domestic savings/GDP 24.7 22.3 21.0 22.0 23.0
Inflation rate (wholesale price index) 4.8 6.9 3.3 4.8 5.0
Money supply (M3) growth 18.0 18.4 16.0 17.0 17.0
Fiscal balance/GDP -4.8 -5.0 -5.5 -5.0 -4.0
Merchandise exports growth 4.5 -3.9 10.0 4.5 5.0
Merchandise imports growth 4.6 0.9 9.0 7.0 8.0
Current account balance/GDP -1.3 -1.0 -1.5 -1.8 -1.8
Total debt/GDPb 24.7 24.4 23.5 22.3 22.0
Note: All figures are on a fiscal year basis.
a. Based on constant 1993/94 factor cost.
b. At end-March.
Sources: Central Statistical Organization (1999); Reserve Bank of India (1998); Ministry of Finance (2000).
Nonfood bank credit increased 9.3 percent, in con-trast to an increase of 6.2 percent in 1998. The annualinflation rate remained remarkably low during the firsthalf of the year before rising slowly in the second half.Inflation in terms of the wholesale price index was3.3 percent, compared with 6.9 percent the previousyear. The consumer price index for industrial workersalso dropped, to 5.3 percent from 12.9 percent in 1998.
The deterioration of the fiscal balances of centraland state governments continued, despite theconsensus among various levels of government thatthese imbalances urgently needed correction (see fig-ure 2.14). The combined fiscal deficit reached nearly10 percent of GDP in 1999, the highest level recordedsince 1990. The states’ component of the deficit re-corded a new high. The gross fiscal deficit of the cen-tral government rose to about 5.5 percent of GDP in1999 from the previous year’s 5 percent. The fiscaldeficit on states’ accounts exceeded 5 percent of GDP.The deterioration in state’s finances was not due asmuch as to a decline in revenues, as in the case of the
central government, but a result primarily of sharpincreases in wage expenditures.
The balance-of-payments position remainedstable in 1999. Despite the surge in oil prices, the cur-rent account deficit was contained below 1.5 percentof GDP because of the solid performance of exports.With the rebound in Asia and recovery in the globaleconomy, exports grew at more than 10 percent indollar terms after a disappointing 3.9 percent drop in1998. Manufactured products accounted for 80 per-cent of exports. Imports also recovered, growing at 9percent for the year compared with 1998’s 0.9 per-cent growth. The growth of imports was fuelled pri-marily by the substantial increase in the prices of crudeoil and petroleum products, although this was par-tially offset by a decline in non-oil imports.
Encouraged by the improved economic outlookand increased political stability, foreign investmentflowed in strongly, with $3.1 billion during the firstnine months of 1999—almost three times as much asthe $1.1 billion during the same period in 1998.
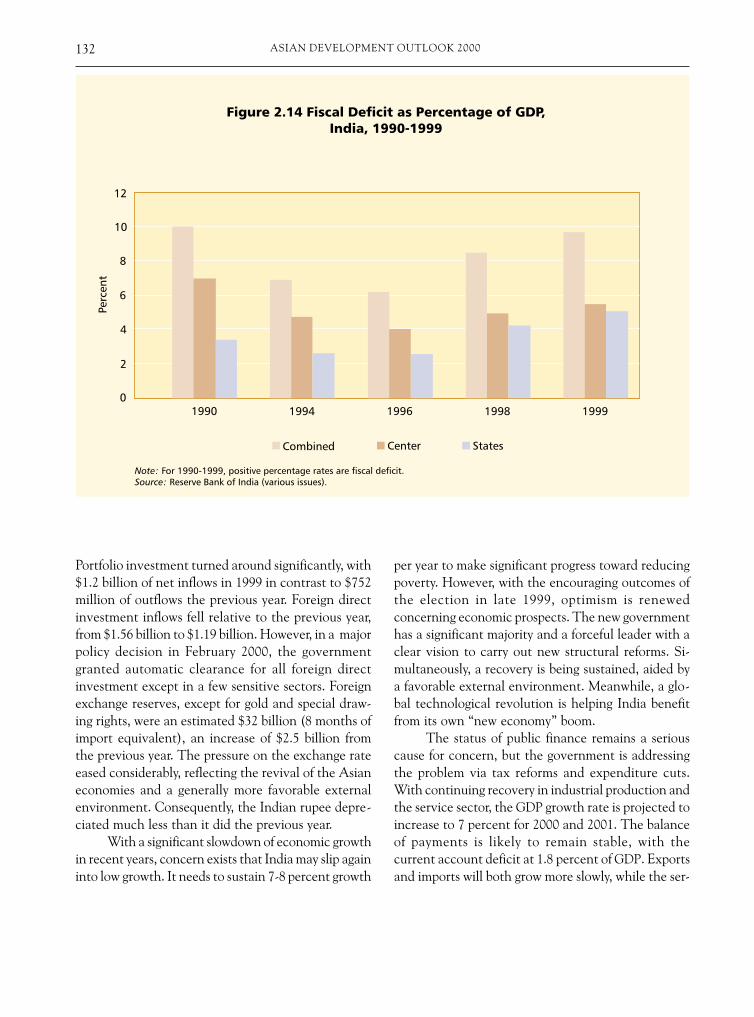
ASIAN DEVELOPMENT OUTLOOK 2000132
Portfolio investment turned around significantly, with$1.2 billion of net inflows in 1999 in contrast to $752million of outflows the previous year. Foreign directinvestment inflows fell relative to the previous year,from $1.56 billion to $1.19 billion. However, in a majorpolicy decision in February 2000, the governmentgranted automatic clearance for all foreign directinvestment except in a few sensitive sectors. Foreignexchange reserves, except for gold and special draw-ing rights, were an estimated $32 billion (8 months ofimport equivalent), an increase of $2.5 billion fromthe previous year. The pressure on the exchange rateeased considerably, reflecting the revival of the Asianeconomies and a generally more favorable externalenvironment. Consequently, the Indian rupee depre-ciated much less than it did the previous year.
With a significant slowdown of economic growthin recent years, concern exists that India may slip againinto low growth. It needs to sustain 7-8 percent growth
per year to make significant progress toward reducingpoverty. However, with the encouraging outcomes ofthe election in late 1999, optimism is renewedconcerning economic prospects. The new governmenthas a significant majority and a forceful leader with aclear vision to carry out new structural reforms. Si-multaneously, a recovery is being sustained, aided bya favorable external environment. Meanwhile, a glo-bal technological revolution is helping India benefitfrom its own “new economy” boom.
The status of public finance remains a seriouscause for concern, but the government is addressingthe problem via tax reforms and expenditure cuts.With continuing recovery in industrial production andthe service sector, the GDP growth rate is projected toincrease to 7 percent for 2000 and 2001. The balanceof payments is likely to remain stable, with thecurrent account deficit at 1.8 percent of GDP. Exportsand imports will both grow more slowly, while the ser-
133SOUTH ASIA
vices balance should remain relatively stable. Changesin regulation governing the inflow of foreign directinvestment combined with a strong foreign interestin portfolio investment (particularly in technologystocks) is expected to further accelerate the inflow offoreign investment. The RBI will continue its effortto contain inflation at less than 5 percent per year,while providing sufficient credit to the productive sec-tors of the economy.
ISISISISISSUES IN ECONOMIC MANAGEMENTSUES IN ECONOMIC MANAGEMENTSUES IN ECONOMIC MANAGEMENTSUES IN ECONOMIC MANAGEMENTSUES IN ECONOMIC MANAGEMENT
During its first two months in office, the new govern-ment passed the first hurdle in implementing the nextphase of reforms. The new insurance bill, which willopen the insurance market to the private sector, is asignificant first step. Nevertheless, the unfinishedagenda of economic reform remains substantial. Re-forms that have already begun—reducing protectionlevels, developing efficient financial and capital mar-kets, and expediting public enterprise reforms—should be completed swiftly, preferably within adefined timeframe. In those areas where reforms havenot yet gained momentum, such as fiscal consolida-tion, labor market, and power sector, it is urgent thatthese reforms be addressed.
Of particular importance is the need to expandthe reform process to state and local governments.Indications are clear that the top levels of the gov-ernment, as well as the corporate sector, are convincedof the urgency of carrying out economic reforms.However, most state governments and the lower lev-els of line ministries, which are directly responsiblefor implementing reforms, are neither fully awareof the urgency of the effort nor equipped to imple-ment them.
Similarly, the capability of the system to put theproposed reform measures into action is also in seri-ous doubt because of institutional weaknesses inher-ited from the past. The inefficient and oversizedbureaucracy and the outdated and nonresponsive le-gal system are examples. Without efficient adminis-trative and legal systems, the high transaction costsinvolved in processing the reform agenda will out-weigh the potential benefits of reforms. Capacitybuilding and institutional reforms are urgently neededto improve the processing of reforms.
POLICY AND DEVELPOLICY AND DEVELPOLICY AND DEVELPOLICY AND DEVELPOLICY AND DEVELOPMENT ISOPMENT ISOPMENT ISOPMENT ISOPMENT ISSUESSUESSUESSUESSUES
Both the political situation and the external eco-nomic environment have been volatile in 1995-1999.However, neither the frequent changes of govern-ment nor the financial crisis in East Asia had a last-ing impact on the general direction of economicreforms. The consensus on economic reforms notonly survived the four changes of government since1996, but was strengthened through these changes.In terms of external economic environment, theadverse impact of the East Asian economic crisis onIndia’s economy was limited. Sanctions imposed byG7 countries following nuclear tests by India andPakistan in May 1998 added new uncertainties, buttheir effect has been marginal.
Although the broad direction of economicreforms has been maintained in recent years, therehave been signs of reform fatigue. The initial urgeand excitement generated by the reform processabated as the economy recovered from the 1991 cri-sis. Consequently, the ability of policymakers to makeradical changes greatly diminished and special in-terest groups blocked the progress of reforms on sev-eral occasions.
With the slowing of reforms, it became evidentthat the growth impulses generated by the first gen-eration of reforms had ebbed by the mid-1990s. In-dustrial growth significantly decelerated and exportgrowth fell. Infrastructure bottlenecks began tohamper the expansion of private sector economicactivities. Poverty, illiteracy, and lack of basic healthcare were aggravated by the worsening environment.The slowdown in GDP growth in 1997-1998 raises aserious question: does the economic slowdown re-flect underlying structural impediments that couldlead to lower growth if not tackled urgently?
At the core of the reform process lies the re-orientation of the government’s role to improve ef-ficiency and raise the long-term economic growthpotential. Traditionally, the government has con-trolled private sector activity through various licens-ing schemes and has produced important goods andservices though public sector enterprises. Excessiveintervention of government in economic activitieswas inefficient, however. Therefore, remaining re-forms should withdraw unnecessary government in-

ASIAN DEVELOPMENT OUTLOOK 2000134
terference and refine the role of the state in eco-nomic management. Reforms must ensure that theprivate sector, not the government, is in charge ofraising production, creating jobs, and increasing in-come levels.
Dependence on the private sector and mar-kets does not mean that the government has no role.Reorienting its contribution to the economy is cru-cial, and government can help create conditions foraccelerated growth. For instance, a sound macro-economic environment—characterized by prudentfiscal policy, an efficient monetary and financial re-gime, and market-determined exchange rate poli-cies—is essential to attract private investors.International rating agencies issued a warning in1999 that the fiscal deficit had grown again to un-sustainable levels during the past several years.Although there is yet no sign of imminent macroeco-nomic crisis, lack of fiscal prudence pushed up inter-est rates. This deters private investment and increasesinterest costs for government and private firms.
Second, infrastructure bottlenecks are likelyto constrain the achievement of a higher growthrate of 7 percent and above. The infrastructure sys-tem is overstrained and suffered from underinvestmentin the post-reform period. Massive investments willbe needed in both public and private sectors toovercome these bottlenecks. A two-pronged ap-proach is required: mobilizing private investmentto supplement the public sector effort, and garner-ing public investment in the many sectors whereprivate investment is difficult to mobilize.
Third, the poor state of human resource de-velopment is an even more serious constraint tosustainable development. Clearly, people will notbe able to use the new opportunities offered by eco-nomic growth if they remain illiterate and lack thebasic skills required by modern industries. Creat-ing conditions for accelerated growth is not suffi-cient unless people are ready to participate in thegrowth process and use opportunities to integratewith the world market. Large investment in socialsectors is therefore essential not only for social de-velopment, but also as a precondition for acceler-ating growth. One important aspect is the role ofthe states in undertaking remedial actions to rec-tify the poor social development record. Because
state governments are responsible for social sectorinvestments, fiscal reforms and restructuring at thestate level are critical for increasing expenditureson the social sectors, particularly in primary andsecondary education and health and sanitation.
Fourth, restructuring public sector enterprisesthrough disinvestment or privatization must be ac-celerated. One positive development after the 1999election was the acceptance of the notion ofprivatization. The ruling coalition advocatedprivatization in its electoral platform, becoming thefirst political party to use the word officially. Withthe dissolution of the Disinvestment Commissionat the end of November 1999, the government setup its own committee to provide recommendationsand modalities for privatization. This committeewill be crucial if the coalition government takesadvantage of improving economic conditions andits majority in Parliament to initiate a major drivetoward privatizing some state assets.
The economic reforms undertaken haveyielded good results, but progress has been less im-pressive in terms of better social opportunities forthe poor. From the beginning of the reform pro-cess, the government tried to keep its commitmentto traditional poverty alleviation programs thatexisted before the reforms. These included directsupport to the poor by subsidized sale of food grainsand kerosene, job-creating public works programs,and a variety of self-employment programs thatprovided small loans. However, the real issue hasbeen the effectiveness of these programs. Recog-nizing high costs and minimal impact, the govern-ment considered phasing out some antipovertyprograms and reallocating part of the savings to im-prove social services, especially health, education,and family welfare. This shift was motivated by therecognition that a fresh perspective is probablymore effective than marginal expansions in tradi-tional schemes.
The government needs to spend more in edu-cation and health, but not only because investmentsin human capital are instrumental for economicgrowth. While education and better health clearlyhave value in making people more productive andgenerating more outputs and incomes, the elimi-nation of illiteracy, ill health, and other depriva-

135SOUTH ASIA
tions are valuable for their own sake. The adverseeffect of persistent illiteracy, for example, goes be-yond limited economic opportunities. It constrainsa person’s freedom and well-being, and has a di-rect role in the relative deprivation of women in
particular. It sustains high mortality and fertilityrates. It also contributes to the comparative lackof pressure for social change, and to the weaknessof political demand and pressure for effective pub-lic attention in fields such as health care.

ASIAN DEVELOPMENT OUTLOOK 2000136
MaldivesMaldivesMaldivesMaldivesMaldives
The Maldives continued its strong economic growth in 1999, mainly because of favorable develop-ments in the tourism and fisheries sectors. To continue sustainable economic growth, the country willneed to expedite structural reforms, including fiscal consolidation and human resource development.
RECENT TRENDS AND PROSPECTSRECENT TRENDS AND PROSPECTSRECENT TRENDS AND PROSPECTSRECENT TRENDS AND PROSPECTSRECENT TRENDS AND PROSPECTS
DDDDDuring 1996-1998, the Maldives’ economy grewby 8-9 percent. This strong performance resulted
from favorable developments in transportation,communications, utilities, tourism, fisheries, andmanufacturing, particularly garments. For 1999, growthwas an estimated 8.5 percent, with tourist arrivals in-creasing about 10 percent to more than 400,000.Increased growth in tourism continued to facilitatethe expansion of construction, the growth of trans-portation subsectors, and the development of basicinfrastructure facilities. Although the fisheries sectorremained buoyant, fish export earnings declinedbecause of a fall in fish prices in the internationalmarket. Because fish is the principal food item in theMaldives, the increase in fish production favorablyaffected inflation, with the annual average inflation rateestimated at about 3 percent in 1999.
The fiscal deficit worsened slightly in 1999 to6 percent of GDP, in contrast to 5.3 percent of GDPthe previous year. The deteriorating fiscal positionpartly resulted from higher expenditures on wages
of public sector employees, which increased about30 percent on average.
The unemployment rate is low in the Maldives.Estimates suggest that more than 20 percent of thelabor force are expatriates and this share is growing.Rapid economic development and the reluctance ofMaldivians to work in unskilled occupations haveresulted in increased recruiting of expatriate workersto fill these vacancies. Simultaneously, there is ashortage of high-skilled and professional labor. Thesepositions are also being filled by overseas recruitment.
In the external sector, the current account deficitdeteriorated further to 10 percent of GDP, comparedwith about 7 percent in 1998. This was primarily dueto increased imports associated with tourism sectorinvestments. The current account deficit, however,was more than offset by private capital inflows, whichincreased the official reserves to the equivalent of morethan four months of imports. External debt as a per-cent of GDP reached 51.5 percent in 1998 and in-creased slightly to 52 percent in 1999. The debt-serviceratio remained below 4 percent for the past five yearsexcept in 1997, when it increased to 7.2 percent

137SOUTH ASIA
because a $15 million loan from the Kuwait Fund forbalance-of-payment support was repaid fully. This lowlevel of debt service was possible because most of thedebt consisted of concessional foreign assistance.
While the country remains potentially vulne-rable to economic shocks because of its dependenceon tourism and fishing, the economic outlook for themedium term remains promising. Growth should bearound 7 percent in 2000, mainly strengthened by acontinued increase in tourist arrivals. Inflation isexpected to average about 3 percent in 2000 and beyond,because of a prudent macroeconomic policy stance andfavorable external conditions. The current accountdeficit is expected to fall slightly to 6 percent of GDPin 2000 and 2001 because of strong growth in the tour-ism and fisheries sectors.
ISISISISISSUES IN ECONOMIC MANAGEMENTSUES IN ECONOMIC MANAGEMENTSUES IN ECONOMIC MANAGEMENTSUES IN ECONOMIC MANAGEMENTSUES IN ECONOMIC MANAGEMENT
Deterioration of the fiscal balance in 1999, coupledwith the declining trend in concessional external assis-tance such as grants, highlights the need to strengthenthe government’s narrow revenue base. On average,nontax revenue consists of more than half of totalrevenue, and combined tax receipts from tourism andimport duties amounted to 60 percent of tax revenueduring 1995-1998. In this regard, tax reform is neededto broaden the tax base and enhance public sectorefficiency. The government is preparing to introducea business profit tax and a property rental value tax tobroaden the current tax base, and intends to upgradethe institutional capacity and valuation system of thecustoms service to improve import duty collections.
The administrative capacity of the governmentin key agencies also needs improvement. This includesenhancing public sector management, introducinglegal and judicial reforms, and restructuring state-owned enterprises. Furthermore, financial sector de-velopment is needed to enhance economic efficiency,including promoting competition in the banking
sector, increasing the availability of long-term finance,developing capital markets, and strengthening theMaldives Monetary Authority.
POLICY AND DEVELPOLICY AND DEVELPOLICY AND DEVELPOLICY AND DEVELPOLICY AND DEVELOPMENT ISOPMENT ISOPMENT ISOPMENT ISOPMENT ISSUESSUESSUESSUESSUES
Human resource development (HRD) is a high prior-ity, with two distinct goals: to sustain higher economicgrowth and to address regional disparities between theouter islands and the main urban centers. The dearthof sufficiently skilled workers is a serious obstacle toachieving national development objectives, and con-tinued efforts in HRD will be required to reduce thedependence on expatriate labor and save foreign ex-change. Institutional development of the educationsector is important to further enhance HRD. An im-portant government strategy is to pool resources; unifythe management function; and improve the range,quality, and comprehensiveness of the courses offeredat training institutes. This initiative also provides forstaff training and institutional development. The HRDstrategy should further target quality improvementthrough curriculum development, expansion of sec-ondary education and distance learning, and skill de-velopment through vocational training.
With regard to regional disparities, governmentestimates indicate that 22 percent of the country’spopulation has a daily income of less than Rf10 ($0.84),and most of them reside in the outer islands. Regionaldevelopment, including basic social and physical in-frastructure and institution-building in the outer is-lands, is essential for medium- to long-term HRD.
Greater emphasis on HRD, particularly educa-tion, is necessary to improve skills in the labor forcethat are required to help the private sector to becomean engine of economic development. To sustain ahigher rate of economic growth, these efforts must becomplemented by capacity building of governmentagencies, financial sector reform, and legal and judi-cial reform.

ASIAN DEVELOPMENT OUTLOOK 2000138
NepalNepalNepalNepalNepal
Because of a recovery in agricultural production, the short-term prospects for Nepal’s macroeconomyare promising. The new government needs to advance a broad-based reform agenda to sustain thisgrowth. The need to reduce poverty and promote gender equity also raises challenges.
RECENT TRENDS AND PROSPECTSRECENT TRENDS AND PROSPECTSRECENT TRENDS AND PROSPECTSRECENT TRENDS AND PROSPECTSRECENT TRENDS AND PROSPECTS
TTTTThe macroeconomy was stable in 1999, despite theuncertainty caused by a change in government.
Real GDP growth rose to 3.3 percent from 2.3 percentthe previous year, led by better performance in theagriculture and industry sectors. However, this growthin production barely exceeded the population growthof 2.4 percent. Consequently, with a per capita GDPof $210, Nepal ranks as among the poorest countriesin the region, lower than most of its South Asianneighbors. While the 3.0 percent growth in agricul-ture fell short of projections in the Agriculture PerspectivePlan, which details the agricultural development strat-egy for two decades, the increase from the previousyear’s 1 percent growth was promising, considering thatpoor weather conditions continued to hamper farmers.
Consistent with an economy dominated bysubsistence agriculture, the labor force participationrate was high and the unemployment rate low. About86 percent of the working-age population (aged 15
and above) is economically active, with 73 percentemployed in agriculture. The unemployment rate forthe country was less than 2 percent, but the rate inurban areas was higher than 7 percent.
Driven by rising food prices, inflation rose tonearly 13 percent in 1999, from 4 percent the previousyear. Poor monsoon conditions led to dramatic in-creases in the prices of food grains and vegetables.Exports of rice also prevented the usual downturn inprice after the main harvest, and the food andbeverages index rose by 17.3 percent. Inflation fromnonfood items, however, was only 4.3 percent, downnearly 1 percent from the previous year. This was dueto the stability of key administered prices, notably kero-sene, electricity, and diesel. High money growth con-tinued despite slower inflows of foreign assets. Broadmoney (M2) increased by about 21 percent in 1999,slightly less than the 22 percent the previous year be-cause of the slow inflow of foreign assets.
The budget deficit remained at 6.1 percent ofGDP in 1999, despite additional expenses from the
1999 refers to fiscal year 1998/99, ending 15 July.

139SOUTH ASIA
TTTTTable 2.16able 2.16able 2.16able 2.16able 2.16 Major Economic Indicators, Nepal, 1997-2001Major Economic Indicators, Nepal, 1997-2001Major Economic Indicators, Nepal, 1997-2001Major Economic Indicators, Nepal, 1997-2001Major Economic Indicators, Nepal, 1997-2001(percent)
Item 1997 1998 1999 2000 2001
GDP growth 5.0 2.3 3.3 5.5 5.5
Gross domestic investment/GDP 25.3 20.7 17.3 20.0 22.0
Gross domestic savings/GDP 12.1 9.5 10.6 11.7 11.7
Inflation rate (consumer price index) 7.8 4.0 12.7 5.0 5.0
Money supply (M2) growth 11.9 21.9 20.9 14.0 12.0
Fiscal balance/GDPa -5.1 -6.0 -6.1 -7.1 -7.5
Merchandise exports growth 10.2 11.9 20.3 10.0 12.0
Merchandise imports growth 21.7 -12.4 -10.5 15.0 15.0
Current account balance/GDP -6.0 -5.5 -3.5 -8.0 -9.5
Debt-service/exports 4.5 6.1 6.5 6.5 6.5
Notes: Data are on a fiscal year basis. Data on savings were derived as a residual.
a. Includes grants.
Sources: Central Bureau of Statistics; Nepal Rastra Bank; staff estimates.
elections. Preliminary data for 1999 show thatdomestic revenue collection was substantially lowerthan the budgeted amount, with actual revenue about10 percent of GDP, roughly the same as in 1998. Theshortfall in revenues was balanced by slower-than-budgeted growth in development expenditures, whichrose 9 percent rather than the 26 percent envisagedin the 1999 budget. Even with slower growth, foreigngrants and loans financed about 65 percent of devel-opment expenditures, compared with 50 percent inthe early 1990s, a situation that is unlikely to changein the coming years.
Nepal’s current account deficit declined dramati-cally in 1999 because of strong export growth and acontraction in imports, mainly in aid-related itemsbecause of weak investment activity before the elec-tions. Non-aid imports were roughly the same asprevious years. While loan disbursements from aidagencies also slowed before the elections, foreign ex-change reserves continued to rise. By the end of theyear, Nepal had $797 million in foreign exchangereserves (almost seven months of import equivalent).External debt as a percent of GDP rose in 1998, with
the inflow of foreign aid reaching 54 percent of GDP.However, because of the concessional nature of thislending, the debt-service ratio for external debt wasa manageable 6.1 percent of exports in 1998 (seefigure 2.15).
A favorable monsoon season and wider use offertilizer led to a strong recovery in agriculture duringthe first quarter of 2000. Production of food grains,particularly rice, and vegetables was expected to beabove average, leading to GDP growth of 5-6 percentfor the year. Early indicators for the tourism, carpet,and garment industries also suggested strong perfor-mance. However, with no large projects upcominguntil the end of the year, electricity growth should re-main slow. Price performance in 2000 will also benefitfrom bumper harvests throughout the region. Theprice of rice, which makes up most of the expendi-tures in the price index, will probably decline afterthe harvest. Therefore, Nepal can achieve an infla-tion target of 5 percent in 2000 (rather than the cur-rent 7 percent target) with the support of appropriatemonetary policy, despite the high-profile increases inprices of kerosene, diesel, and electricity.

ASIAN DEVELOPMENT OUTLOOK 2000140
The peg with the Indian rupee provides a usefulnominal anchor for the economy, but to sustain it thecentral bank must reduce the inflation and interestrate differentials with India. A target of 14 percentexpansion in broad money (M2) for 2000—with someslowing in 2001—would be consistent with the goalof parity with India, given growth and inflation pro-jections. The central bank needs to liquidate its hold-ings of Treasury bills, which were acquired throughconverting the government’s overdraft in its budget-ary operations. This can help eliminate the negativereal interest rates on these instruments and bring theoverall interest rate structure in line with India’s.
Development expenditures in the 2000 budgetare projected to grow by 33 percent. These will befinanced mainly by foreign grants, which are projectedto increase by 47 percent. Domestic revenue estimatesin the current budget are similarly optimistic, with aprojected growth rate of 14 percent. Actual revenueperformance will hinge on the effective implementa-
tion of the value-added tax. The minimum revenuelevel for firms covered by the value-added tax waslowered from NRs4.5 million to NRs2 million, and theregistration of firms was accelerated to widen the taxbase. As in past years, development expenditures prob-ably will bear any shortfalls in domestic revenues andforeign grants. However, preliminary first-quarter 2000figures suggest that the government’s ambitious rev-enue and development expenditure targets are achiev-able, even with the increase in allowances for civilservants. The fiscal deficit for 2000 is projected to reach7 percent of GDP and to continue to rise in 2001.
The current account deficit should widen in2000 as aid-related imports return to their previouslevels, particularly if the government succeeds in itsambitious development agenda. Merchandise importsare projected to grow 15 percent, with investmentgoods expanding faster than consumer goods imports.Export growth should continue to be strong in 2000,but will slow without the grain exports of the previous
141SOUTH ASIA
year. The current account deficit is thus expected toreach about 8 percent of GDP in 2000 and more than9 percent of GDP in 2001. The debt-service ratioshould remain around 6 percent of GDP, as much ofthis debt is concessional.
ISISISISISSUES IN ECONOMIC MANAGEMENTSUES IN ECONOMIC MANAGEMENTSUES IN ECONOMIC MANAGEMENTSUES IN ECONOMIC MANAGEMENTSUES IN ECONOMIC MANAGEMENT
The government’s long-term Agriculture PerspectivePlan aims to break this sector’s dependence on weatherby expanding irrigation facilities, improving the dis-tribution of inputs such as fertilizer, diversifying crops,and expanding rural infrastructure. Under this plan,the monopoly of the state-owned Agricultural InputsCorporation on the import and distribution of fertil-izer has been eliminated, price subsidies on all fertiliz-ers have been removed, and private sector trading infertilizer is on the rise. In the distribution of food grains,the role of the state-owned Nepal Food Corporationis being altered to promote more private sector activ-ity. The government must continue the momentumfor reform in this sector and maintain the progressmade by avoiding the political temptation to reintro-duce subsidies or state-owned monopolies.
While the newly elected majority governmentraised expectations of reform, progress has beenlimited. The increase in value-added tax registrationsis promising, but filling key vacancies in this depart-ment is needed to improve administration, clear thefiling backlog, initiate collection visits, and intensifyaudit activity. The government also raised prices ofkerosene, diesel, and electricity. Despite vocal publicprotests against these measures and a special par-liamentary session called by the opposition to reviewthe price increases, the government has stood firm.However, if the country is to achieve the levels ofsustained growth necessary to lift it out of poverty,the government needs to take advantage of its major-ity position to pursue a broad-based reform agenda,with financial sector reform and civil service reformas the core.
POLICY AND DEVELPOLICY AND DEVELPOLICY AND DEVELPOLICY AND DEVELPOLICY AND DEVELOPMENT ISOPMENT ISOPMENT ISOPMENT ISOPMENT ISSUESSUESSUESSUESSUES
Looking beyond the medium-term macroeconomicissues, the government must consider strategies forreducing poverty and raising women’s status. In addi-
tion to the equity considerations, the barriers facedby women and the poor limit their ability to providethe basic needs of their families. The system perpe-tuates itself, as most disadvantaged groups lack theresources to invest in their children’s education andhealth. The people in the poorest regions of thecountry have the least access to basic health servicesand the highest rates of infant mortality and childmalnutrition.
In Nepal, roughly 42 percent of the total popu-lation live in poverty, but the incidence of poverty isonly 23 percent in urban areas, compared with 44 per-cent in rural areas. Geographically, the incidence ofpoverty in the mid-western and far-western regionsgreatly exceeds the national average, as does the ratein the mountain districts. Castes with lower social sta-tus had higher rates of poverty, as did those withoutthe benefit of education.
One of the chief concerns of the Ninth Five-Year Plan (1998-2002) is poverty reduction, with theobjective of reducing poverty incidence by 10 per-cent by the end of the plan period. However, thebreadth of the plan in terms of its targets—coveringeverything from agricultural production to sportsfacilities—means the impact on poverty often is lostwhen the programs are implemented. A more focusedplan is needed to provide a comprehensive frame-work directed toward the primary goal. Thegovernment’s ongoing review of the Ninth Plan shouldemphasize the impact on poverty when prioritizingdevelopment projects, particularly in view of theemphasis on poverty alleviation by the major donors.In addition, improved information for monitoring theimpact of specific projects on poverty is necessary forplanning purposes.
Nepal is one of the poorest countries in theworld, and its women are among the most disadvan-taged. Although there is wide variation across thenumerous ethnic groups, the status of women is al-ways lower than that of their male counterparts.Women also lag behind men in access to education,and in ownership and access to assets.
Despite this, women in Nepal have madeprogress. Women’s life expectancy has increased bymore than 15 years within the last two decades, al-though men still live longer on average. The numberof women who die in childbirth has decreased, to 539

ASIAN DEVELOPMENT OUTLOOK 2000142
per 100,000 live births, a vast improvement from the1980s when the rate was about 50 percent higher.Women are now slightly older when they marry, whichhas led to a decline in the fertility rate. In education,the gains made by women have been dramatic. Twentyyears ago, only 4 percent of the women were literate,and now the rate is 27 percent. For girls, the net en-rollment rate has risen to 72 percent for primary schooland to 31 percent for lower secondary school. How-ever, men are still more likely to be literate thanwomen, and boys have reached full enrollment inprimary school.
Women’s economic participation is limitedmainly to agricultural production within the house-hold. While the male labor force has been shiftingtoward manufacturing and services, more than 85 per-cent of economically active women are in agriculture.Men, however, control the chief inputs to this pro-duction: land and real property. These are passed downpaternally and a woman’s claim to these assets is de-termined by marriage. It is difficult for women to raisefinancial capital because they cannot own land, andhence are unlikely to have the necessary collateral.Lower levels of schooling and skills training can pre-vent women moving from agriculture to other sec-tors. The preference within households for educatingsons and arranging early marriages of daughters rein-forces the status quo. Social customs present morehurdles for the women to participate in the economy.In some communities of the southern plains, womenare not allowed to mix freely with men.
Nepal’s constitution guarantees fundamentalrights to all citizens, equal treatment before the law,and equal pay for similar work regardless of gender.
However, these ideals have not been codified in anyspecific legislation, and the body of family law con-tains elements that contradict the principle of genderequity. For example, inheritance laws condition awoman’s right to parental assets on her age and mari-tal status, and a widow forfeits her claim to her formerhusband’s property if she remarries. The inheritancerights of men, however, are not subject to such condi-tions. Women have no claims to community propertyin divorce and spousal support is limited to five years.While the cultural view of women’s place in Nepalesesociety will change slowly over time, the governmentshould work through appropriate legislative reformstoward the principles of gender equity that areespoused in the constitution.
However, legal reforms alone are not enough.For example, prohibitions on violence against womenand trafficking in children already exist, but enforce-ment is often lax. The Ninth Plan proposes to includegender issues in government activities and directactivities to eliminate gender inequalities. Specificaction is needed, such as developing women’s healthprograms and ensuring that women do not dis-proportionately suffer from negative developmentssuch as involuntary resettlement. Improving income-earning capacity is important if women are to becomeaware of their rights, take advantage of programsoffered, and provide feedback for better meeting theirneeds. Improving conditions for women also will yieldimportant social benefits such as lower populationgrowth and infant mortality, and better health andeducation for children. Improving women’s opportu-nities helps the families of these women break out ofthe poverty cycle.

143SOUTH ASIA
PPPPPakistanakistanakistanakistanakistan
The economy has been slowly recovering since the second half of 1999 because of improved agricul-tural performance. However, the balance of payments remains fragile and the long economic stagna-tion hampers the government’s efforts to reduce rampant poverty. Medium-term economic prospectsdepend on political stability, structural reforms, and capital inflows.
RECENT TRENDS AND PROSPECTSRECENT TRENDS AND PROSPECTSRECENT TRENDS AND PROSPECTSRECENT TRENDS AND PROSPECTSRECENT TRENDS AND PROSPECTS
PPPPPakistan faced a challenging year in 1999, with GDPgrowth declining to 3.1 percent from 4.3 percent
in 1998. Following nuclear tests in late May 1998, eco-nomic sanctions imposed by G7 countries seriously af-fected the economy. Economic growth declined steeplyas investors lost confidence, private capital flows vir-tually ceased, and the new official development assis-tance was suspended. Consequently, Pakistan faced asevere foreign exchange crisis with foreign exchangereserves declining to $415 million in November 1998(two weeks of import equivalent). To prevent sover-eign default, the government adopted short-termemergency policies that included freezing foreign cur-rency deposits held by both residents and nonresidentsin domestic banks, adopting a dual exchange rate sys-tem, and delaying servicing of foreign debt.
In January 1999, the economic sanctions werepartially waived, and international financial institu-tions subsequently revived their assistance. At a meet-
ing of the Paris Club later that month, the govern-ment and bilateral creditors agreed to reschedule offi-cial debt worth $3.3 billion. In early July 1999, Pakistanconcluded an agreement with the London Club forrescheduling $877.3 million in commercial loans. Allthese activities helped build up foreign exchange re-serves and revive economic growth. By the end of June1999, foreign reserves reached $1.7 billion (two monthsof imports).
Both savings and investment rates declined be-cause of slow economic growth and collapse ofinvestors’ confidence. Gross domestic investmentdropped from 17.1 percent of GDP in 1998 to 14.8 per-cent in 1999. The decline in investment in manufac-turing, construction, and energy sectors offset the risingfixed investment in agriculture, transportation, andtelecommunications by the private sector. Poor stockmarket performance also contributed to the slowergrowth in investment, although public sector invest-ment increased by 12.6 percent in nominal terms. Grossnational saving as percentage of gross national product
1999 refers to fiscal year 1998/99, ending 30 June.

ASIAN DEVELOPMENT OUTLOOK 2000144
also slowed from 14.2 percent in 1998 to 11.1 percentin 1999.
The fiscal and monetary areas, however, showedencouraging signs. Structural reform measures to re-duce the fiscal deficit included: (a) increasing the gen-eral sales tax rate from 12.5 to 15 percent, (b)increasing petroleum product tax rates, (c) reducingbudgeted current consumption expenditures, and (d)reducing the federal subsidy on wheat. Consequently,the fiscal deficit declined from 6.3 percent of GDP in1997 to 5.6 percent in 1998, and further to 3.7 per-cent in 1999. While the customs duty collection de-clined sharply because of a reduction in tariff ratesand negative import growth, an increase in generalsales tax revenues helped boost tax collection. Nontaxrevenue collection also increased. Meanwhile, publicexpenditures were held in check, and total expendi-ture as a percent of GDP increased only marginally.Actual development expenditure was 17 percent lowerthan the budget target for 1999.
Because of tight monetary policy, the growth ofbroad money (M2) remained at 6.3 percent in 1999,slower than most years in the past decade. The gov-
ernment retired PRs68.4 billion of domestic debt be-cause of a lower fiscal deficit and debt rescheduling.However, because of weakened investors’ confidenceand the recovery campaign for defaulted loans, creditexpansion to the private sector was much slower thanthe previous year. Tight monetary policy, coupled withprudent fiscal management and slower growth inaggregate demand, helped weaken inflationary pres-sures. The inflation rate declined to 5.7 percent from7.8 percent in 1998.
Imports and exports in 1999 contracted by10.7 percent and 6.7 percent, respectively. The Asianfinancial crisis adversely affected exports, while gov-ernment policy measures pursued after the economicsanctions and slow growth in the industry sector con-tributed to a sharp decrease in imports. In the servicesector, workers’ remittances and foreign currencyaccount deposits dropped sharply. Overall, the currentaccount deficit was $1.8 billion or 2.7 percent of GDP,the same level as in 1998.
Economic performance in the first half of 2000exhibited a slow but fragile recovery. While industrialgrowth remained sluggish because of low investment,
TTTTTable 2.17able 2.17able 2.17able 2.17able 2.17 Major Economic Indicators, PMajor Economic Indicators, PMajor Economic Indicators, PMajor Economic Indicators, PMajor Economic Indicators, Pakistan, 1997-2001akistan, 1997-2001akistan, 1997-2001akistan, 1997-2001akistan, 1997-2001(percent)
Item 1997 1998 1999 2000 2001
GDP growtha 1.9 4.3 3.1 4.5 5.0
Gross domestic investment/GDP 17.7 17.1 14.8 15.1 15.9
Gross national savings/GNP 11.3 14.2 11.1 12.5 13.0
Inflation rate (consumer price index) 11.8 7.8 5.7 5.0 6.0
Money supply (M2) growth 12.2 14.5 6.3 10.0 9.0
Fiscal balance/GDP -6.3 -5.6 -3.7 -3.7 -3.5
Merchandise exports growth -2.6 4.2 -10.7 8.0 9.0
Merchandise imports growth -6.4 -8.4 -6.7 9.5 9.0
Current account balance/GDP -5.6 -2.7 -2.7 -2.5 -2.0
Debt-service ratio 24.7 — — — —
— Not available.
a. Based on constant factor cost.
Sources: IMF (2000); State Bank of Pakistan (1999); Government of Pakistan (1999); staff estimates.
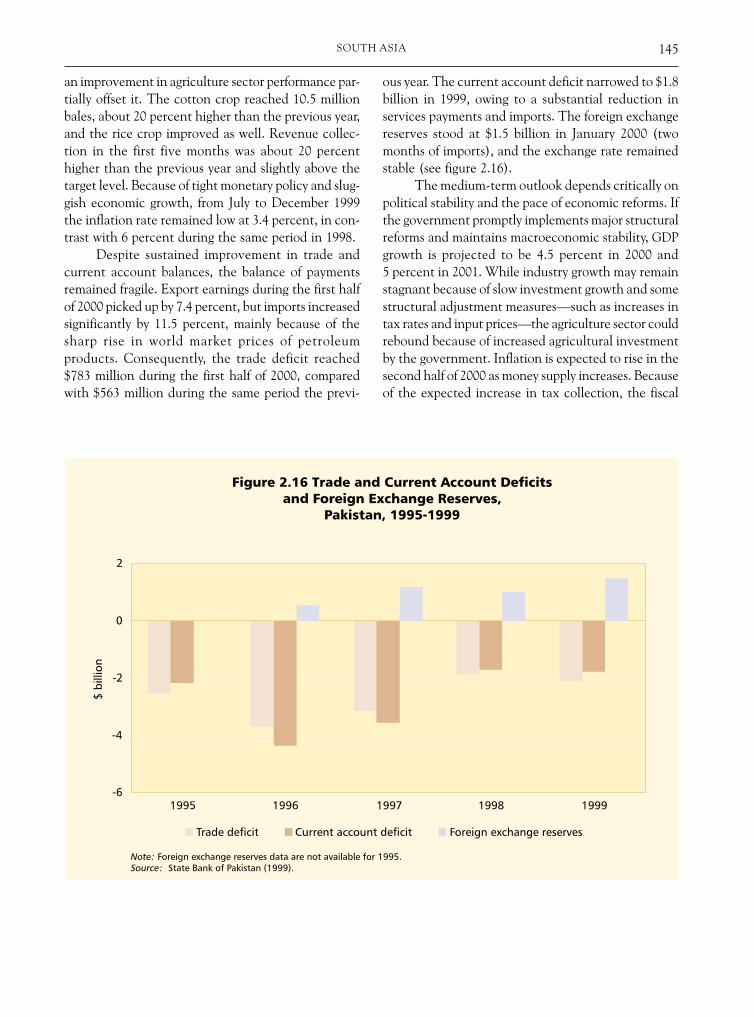
145SOUTH ASIA
an improvement in agriculture sector performance par-tially offset it. The cotton crop reached 10.5 millionbales, about 20 percent higher than the previous year,and the rice crop improved as well. Revenue collec-tion in the first five months was about 20 percenthigher than the previous year and slightly above thetarget level. Because of tight monetary policy and slug-gish economic growth, from July to December 1999the inflation rate remained low at 3.4 percent, in con-trast with 6 percent during the same period in 1998.
Despite sustained improvement in trade andcurrent account balances, the balance of paymentsremained fragile. Export earnings during the first halfof 2000 picked up by 7.4 percent, but imports increasedsignificantly by 11.5 percent, mainly because of thesharp rise in world market prices of petroleumproducts. Consequently, the trade deficit reached$783 million during the first half of 2000, comparedwith $563 million during the same period the previ-
ous year. The current account deficit narrowed to $1.8billion in 1999, owing to a substantial reduction inservices payments and imports. The foreign exchangereserves stood at $1.5 billion in January 2000 (twomonths of imports), and the exchange rate remainedstable (see figure 2.16).
The medium-term outlook depends critically onpolitical stability and the pace of economic reforms. Ifthe government promptly implements major structuralreforms and maintains macroeconomic stability, GDPgrowth is projected to be 4.5 percent in 2000 and5 percent in 2001. While industry growth may remainstagnant because of slow investment growth and somestructural adjustment measures—such as increases intax rates and input prices—the agriculture sector couldrebound because of increased agricultural investmentby the government. Inflation is expected to rise in thesecond half of 2000 as money supply increases. Becauseof the expected increase in tax collection, the fiscal
ASIAN DEVELOPMENT OUTLOOK 2000146
deficit is forecast to decline to 3.7 percent of GDP in2000 and 3.5 percent the next year. Resolving severalexport issues, such as financing for letters of credit,would maintain robust growth of exports, which areprojected to grow by 8 percent in 2000 and 9 percentin 2001. Imports may grow at a slightly higher rate.The current account deficit is projected at 2.5 percentand 2 percent of GDP in 2000 and 2001, respectively.
ISISISISISSUES IN ECONOMIC MANAGEMENTSUES IN ECONOMIC MANAGEMENTSUES IN ECONOMIC MANAGEMENTSUES IN ECONOMIC MANAGEMENTSUES IN ECONOMIC MANAGEMENT
Although Pakistan emerged gradually from the worstphase of the crisis, the economic situation remainsfragile. Some of the emergency measures taken overthe last two years have long-term adverse implicationsfor economic development. Credibility with officialand private creditors was seriously damaged becauseof freezing foreign currency accounts and delayingservicing of foreign debt. A significant decline in pub-lic spending on development programs could also harmthe long-term growth potential.
The primary area of concern remains thebalance-of-payments position. The traditional sourcesof capital inflows—foreign aid, short-term commer-cial lending, and portfolio investments—are expectedto weaken in coming years. The deterioration in theterms of trade threatens the ability to achieve thetrade deficit target of $1.2 billion in 2000. While thedebt rescheduling provides a two-year relief periodfor debt service, in January 2001 the government willhave to resume a substantial repayment of foreigndebt. Because foreign aid is the only reliable sourceof capital inflows, increasing disbursement of foreignaid projects and fulfilling policy reforms promptly arecrucial for improving the balance of payments. In par-ticular, export sector issues need to be vigorously ad-dressed, including providing export finance forindirect exporters and small and medium-size enter-prises, improving product quality and marketing, andallowing better access to technical information to in-crease industrial competitiveness. Resolving the on-going dispute with independent power producers isvital for restructuring the power sector and regainingforeign investors’ confidence.
The high interest rates of about 10 percent inreal terms discourage private investment. To encour-age demand for bank credit from a private sector that
is facing a high input cost structure, the nominal aver-age interest rate needs to be reduced at least 3-4 per-centage points. This may require a correspondingreduction in deposit rates on the National SavingsScheme. The sustained large budget deficit, financedby government borrowing from financial markets, isthe major cause of these high real interest rates. Itcrowds out financial resources available for lendingto the private sector and increases the cost of bor-rowing. Therefore, reducing the budget deficit isessential.
POLICY AND DEVELPOLICY AND DEVELPOLICY AND DEVELPOLICY AND DEVELPOLICY AND DEVELOPMENT ISOPMENT ISOPMENT ISOPMENT ISOPMENT ISSUESSUESSUESSUESSUES
Pakistan has once again approached a crossroad. Thenew government faces difficult challenges that includeslow economic growth; extremely low private sectorconfidence; unsustainable domestic and foreign debtobligations; and a rapid rise in the number of the poor,both in rural and urban areas.
The new government urgently needs to under-take fundamental reforms. Aside from speeding upeconomic growth and structural reforms, Pakistanmust address social issues and improve governance,with special attention to social development and pro-tecting poor and vulnerable groups.
Weak governance, both structural and systemic,has contributed to poor economic performance andweak social development. Laws and regulations areinadequately enforced and public control over majorinstitutions is ineffective. Another major cause ispoliticization and corruption, which weaken the civilservice and cause mismanagement of public resources.Furthermore, the government policy has not been ef-fective in vital functions, such as raising fiscal rev-enues, targeting and implementing programs to assistselected groups or regions, ensuring that public as-sets are efficiently used and well-maintained, and pro-tecting the citizens’ lives and livelihood. Finally,improvised and inconsistent policies contribute toeconomic instability and unpredictability, discouragelong-term investment, and create problems relatedto lack of transparency.
To address these issues, the following areas needurgent policy attention:
• Implementing transparent public managementprocedures and regulations to ensure accountability

147SOUTH ASIA
• Enforcing laws and regulations, particularly thoseregarding taxation, debt recovery, and human rights
• Undertaking judicial and legal reform to pro-mote social justice, economic development, andinvestors’ confidence
• Enacting public administration reforms, in-cluding downsizing the civil service and estab-lishing incentive and control systems basedon performance
• Improving corporate governance and speedingup privatization of state-owned enterprises
• Improving public resource management, par-ticularly public expenditure control and debtmanagement
• Decentralizing the government structure andencouraging local governments to adopt policyinnovations that improve efficiency.During the past eight years, the Social Action
Program (SAP) has improved social services. SAP wasintroduced in the early 1990s to expand basic socialservices, including primary education, basic health,family planning, and rural water supply and sanita-tion. SAP has increased the primary school participa-tion from 69 to 73 percent, contraceptive use from14 to 22 percent, access to safe water from 47 to 55percent of the population, and average life expect-ancy from 58 to 62.5 years. In its second phase, SAP IIcontinues to emphasize better provision of these ba-sic services as well as population control. These can
be accelerated through decentralizing decisionmakingand project implementation, and rigorously supervis-ing the use of SAP resources.
In the current difficult economic situation, pub-lic investment for strengthening and expanding so-cial service delivery under SAP II runs the risk of beingreduced. Protection for its funding is necessary, andgreater efforts are needed to involve nongovernmentorganizations in designing and providing socialservices. An improved policy environment and newmechanisms for government–nongovernment orga-nization cooperation are needed. While nongovern-ment organizations can contribute much to the socialand economic development, they need external as-sistance to improve institutional capacity, cost effec-tiveness, accountability, and transparency. Becausethe poor are adversely affected by drastic structuralreforms, strong measures are needed in the short termto protect them.
In the longer term, structural issues affecting thedelivery of basic social services and other poverty in-terventions should be addressed. Given the strong linkbetween poverty and human development, especiallyin the rural areas, basic social services in education,nutrition, health, and population control need im-provement. Participatory integrated rural developmentprograms are needed, including rural infrastructuredevelopment, microfinance improvement, and em-ployment generation.
ASIAN DEVELOPMENT OUTLOOK 2000148
Sri LankSri LankSri LankSri LankSri Lankaaaaa
Civil conflict in the northeast region of the country contributed to a slowdown of economic growth.Policy reforms are necessary to revive the economy, including fiscal consolidation, public administra-tion and financial sector reform, and private sector development. To sustain growth in the mediumterm, government policy should also focus on human resource development.
RECENT TRENDS AND PROSPECTSRECENT TRENDS AND PROSPECTSRECENT TRENDS AND PROSPECTSRECENT TRENDS AND PROSPECTSRECENT TRENDS AND PROSPECTS
AAAAAfter achieving real GDP growth of 4.7 percent in1998, Sri Lanka recorded a lower rate of 4.2 per-
cent in 1999, mainly because of declining industrialoutput growth. The industry sector’s performanceimproved in the second half of the year, reflecting agradual improvement in exports. The agriculture sec-tor also performed well, resulting from a higher outputof plantation crops.
The national savings-investment gap increasedin 1999 compared with the previous year. Domesticinvestment increased to 27.5 percent of GDPcompared with 25.4 percent in 1998, mainly due toaircraft purchases and telecommunications servicesexpansion. Infrastructure development projects,together with housing and small-scale constructionprojects in rural areas, dominated investmentexpenditure in 1999. Preliminary data indicate thatthe ratio of national savings to GDP edged up from24 percent in 1998 to 25 percent in 1999 because ofhigher private savings and lower fiscal deficit.
The unemployment rate declined in 1999 dueto the increased employment in the tourism sector,strong small business growth, and increased publicsector recruitment. The population grew at 1.2 per-cent annually and reached approximately 19 millionat the end of 1999, with about 21 percent below thepoverty threshold.
Government revenue increased 12 percent dur-ing 1999. A sharp increase in the national securitylevy and excise tax collections, plus moderate increasesin revenues from income taxes and import duty, con-tributed to the improvement in tax revenue. Totalrevenue was an estimated 17.6 percent of GDP com-pared with 17.3 percent in 1998, but it was lower thanoriginally targeted in the 1999 budget. Because of therelatively lower goods and services tax rate and thehigher level of exemptions, collections of this tax werelower than the previous year.
Government expenditure increased by 6.3 per-cent in 1999. Current expenditure is expected to behigher than originally budgeted, largely because ofincreased salaries and wages and interest payments

149SOUTH ASIA
on domestic debt. However, overall expenditure was25.6 percent of GDP in 1999, compared with 26.4 per-cent in 1998. Nonpriority expenditures in the publicsector were curtailed and specific borrowing limits im-posed on government spending units. Accordingly, the1999 budget deficit was estimated at 8 percent of GDP,an improvement over 9.2 percent the previous year.Monetary policy in 1999 aimed at maintaining finan-cial market stability, while helping strengthen the de-clining trend in inflation. The consolidated broadmoney supply (M2), which includes the operations ofthe foreign currency banking units, increased by13.3 percent in 1999. Inflation declined, averagingabout 4.7 percent compared with 9.4 percent in 1998,because of improved domestic supply of food itemsand lower prices of imports.
External sector developments in 1999 reflectedthe effects of depressed global demand and the de-cline in commodity prices (see figure 2.17). Exportsfell 4.1 percent in 1999 because of weak prices of tea,rubber, textiles, and garments. Imports increased 0.1percent as import prices—with the exception of oil—went down across the board. Consequently, the tradedeficit was $1.3 billion in 1999 compared with $1.1billion in 1998. Owing to rapid recovery in the tour-
TTTTTable 2.18able 2.18able 2.18able 2.18able 2.18 Major Economic Indicators, Sri Lank Major Economic Indicators, Sri Lank Major Economic Indicators, Sri Lank Major Economic Indicators, Sri Lank Major Economic Indicators, Sri Lanka, 1997-2001a, 1997-2001a, 1997-2001a, 1997-2001a, 1997-2001(percent)
Item 1997 1998 1999 2000 2001
GDP growth 6.3 4.7 4.2 5.0 6.0
Gross domestic investment/GDP 24.4 25.4 27.5 29.0 29.5
Gross national savings/GDP 21.5 24.0 25.0 25.0 26.0
Inflation rate (consumer price index) 9.6 9.4 4.7 6.5 6.5
Money supply (M2) growth 13.8 9.7 13.3 12.5 12.0
Fiscal balance/GDPa -7.9 -9.2 -8.0 -7.6 -5.7
Merchandise exports growth 13.3 3.4 -4.1 10.0 15.0
Merchandise imports growth 7.8 0.4 0.1 14.0 16.0
Current account balance/GDP -2.6 -1.8 -2.6 -6.8 -3.8
Debt service/exports 13.3 11.0 12.7 12.0 12.0
a. Excludes grants and privatization proceeds.
Sources: Central Bank of Sri Lanka (2000); Ministry of Finance and Planning; IMF; staff estimates.
ism sector, the services account significantly improved,registering a surplus of $203 million in 1999 comparedwith $143 million in 1998. During 1999, tourist arriv-als reached 436,400, a 14.5 percent increase from theprevious year.
The current account deficit widened to about2.6 percent of GDP in 1999 and the overall balanceof payments registered a deficit of $263 million, downfrom a surplus of $37 million the previous year. As aresult, gross official reserves declined to $1.7 billionat the end of 1999 (3.5 months of import equivalent)from $2 billion at the end of 1998 (4.1 months of im-ports). External debt was 57 percent of GDP in 1998and remained at the same level in 1999, but the debt-service ratio increased from 11 percent to 12.7 per-cent. The Sri Lanka rupee depreciated by 5 percentagainst the dollar in 1999, trading at SLRe71.5 perdollar at the end of the year.
Real GDP growth is projected at 5 percent and6 percent in 2000 and 2001, respectively. This highergrowth should result from a modest recovery inindustrial production, supported by an overallrecovery of world trade. Annual average inflation isexpected to be around 6.5 percent. However, importedinflation could occur in 2000 following higher oil

ASIAN DEVELOPMENT OUTLOOK 2000150
prices. The ratio of current account deficit to GDP isexpected to be 6.8 percent in 2000 and 3.8 percent in2001. Because of continuing fiscal consolidation ef-forts, the budget deficit for 2000 should be lower thanin 1999. The money supply is expected to grow at12-13 percent in 2000, providing adequate liquidityto the economy while avoiding inflationary pressure.
ISISISISISSUES IN ECONOMIC MANAGEMENTSUES IN ECONOMIC MANAGEMENTSUES IN ECONOMIC MANAGEMENTSUES IN ECONOMIC MANAGEMENTSUES IN ECONOMIC MANAGEMENT
The government has achieved considerable progressin structural reforms, which include tax reforms andprivate sector participation in key areas such as gas,telecommunications, and plantations. To sustainhigher economic growth, the government should con-tinue structural reform efforts, including fiscal con-solidation and reform in public administration and inthe financial sector.
The medium-term strategy for fiscal consolida-tion should include eliminating distortionary taxes,
improving tax administration, restructuring publicdebt, expanding public enterprise reforms, and reduc-ing defense and security-related expenditures. Publicadministration reform is also critical to better economicmanagement. The reform agenda should includestreamlining government organizations, progressivelyretrenching or redeploying employees in public insti-tutions and agencies, and ensuring that provincialcouncils and local governments benefit from a cleardelegation of authority. Public administration reformis expected not only to promote private sector devel-opment, but also reduce the fiscal deficit.
Although the government has been activelypursuing financial sector reforms to mobilize capital,the role of the domestic capital market remains mod-est and the development finance institutions are stillthe major sources of long-term finance. To foster pri-vate sector growth in the economy, the governmentmust develop market-based financial institutions andinstruments through financial sector reforms.

151SOUTH ASIA
POLICY AND DEVELPOLICY AND DEVELPOLICY AND DEVELPOLICY AND DEVELPOLICY AND DEVELOPMENT ISOPMENT ISOPMENT ISOPMENT ISOPMENT ISSUESSUESSUESSUESSUES
Traditional agricultural products such as tea and rub-ber, along with labor-intensive manufacturers, con-tinue to dominate Sri Lankan exports. In the face ofmodest prospects for these exports and increased com-petition from regional producers, the government mustreorient the existing production structure towardhigher-value-added activities. To achieve this objec-tive, human resource development is critical.
Sri Lanka has attained remarkable social progressduring the past decades. It ranks highest among SouthAsian countries in human development indicators,and in the middle in socioeconomic indicators. How-ever, human resource development requires strength-ening to provide the necessary skills for the currentneeds of the economy. Major policy initiatives needto focus on building closer links between educationand training and the labor markets, improving healthcare to meet the requirements of a growing aging popu-lation, and developing a social security system to helpvulnerable and poor groups.
Speedy reforms in the education sector areneeded to improve the quality of higher education,especially in technical skills. Policy initiatives shouldbe taken to further involve the private sector in tech-nical education and for raising standards to interna-tional levels. Health sector policy needs to addressissues relating to the efficiency and effectiveness of
the current health service system, especially its finan-cial sustainability and allocation of resources. Thequality of private sector services in health care needsappropriate regulatory legislation to equalize standardsfor the government and private sector health institutions.
Despite sustained commitment to social welfarethrough various poverty reduction programs such asdirect income transfers and subsidies, approximately21 percent of the country’s population are poor. Inthe short term, the government must ensure that thepoor gain access to social services and continue to re-ceive income support through a transfer scheme. Inthe medium term, the aim is to improve the earningsof the poor through productivity enhancement. In thelong term, economic growth will likely be sufficient toabsorb an expanded labor force and provide gainfulemployment for all segments of the society.
Estimates on the country’s poverty level do notinclude the conflict-centered Northeast Province,which has about 2.8 million people, 15 percent of thetotal population. A considerable portion of them arepoor. The government’s policy on relief, rehabilita-tion, and reconstruction in the region aims at provid-ing basic amenities—including education, health,water, and sanitation—to help those affected by theconflict create a physically, economically, and sociallysustainable environment for reintegration into pro-ductive life. Concerted efforts of the government anddonor agencies will be needed to achieve this objective.

159THE PACIFIC
Cook Islands, Kiribati, Marshall Islands,Cook Islands, Kiribati, Marshall Islands,Cook Islands, Kiribati, Marshall Islands,Cook Islands, Kiribati, Marshall Islands,Cook Islands, Kiribati, Marshall Islands,FFFFFederated States of Micronesia,ederated States of Micronesia,ederated States of Micronesia,ederated States of Micronesia,ederated States of Micronesia,Nauru, Samoa, Solomon Islands,Nauru, Samoa, Solomon Islands,Nauru, Samoa, Solomon Islands,Nauru, Samoa, Solomon Islands,Nauru, Samoa, Solomon Islands,
TTTTTonga, Tuvalu, and Vonga, Tuvalu, and Vonga, Tuvalu, and Vonga, Tuvalu, and Vonga, Tuvalu, and Vanuatuanuatuanuatuanuatuanuatu
In 1999, real GDP for the ten smallest Pacific countries increased by a weighted average of almost1 percent, with the growth rate decelerating in Kiribati, Tuvalu, and Vanuatu and accelerating in theother countries. Inflation rates remained low, and the economic outlook indicates that growth willcontinue at modest rates.
EEEEEconomic performance in 1999 improved in theten smallest Pacific countries as GDP increased
by a modest 1 percent. This was an improvementover the previous year when four countries (CookIslands, Marshall Islands, Federated States ofMicronesia, and Samoa) experienced negative growth.Growth outcomes were better in Cook Islands,Marshall Islands, Federated States of Micronesia,Nauru, Samoa, Solomon Islands, and Tonga. In Kiribatiand Tuvalu growth slowed, and the Vanuatu economywent into recession. The inflation rates for CookIslands, Nauru, Tuvalu, and Tonga increased, but de-creased in all the other countries for which data wereavailable. The overall balance-of-payments position
in 1999 improved for Solomon Islands, Tonga, andVanuatu, and deteriorated slightly for Samoa. In thesix countries using American, Australian, or NewZealand dollars—Marshall Islands, Kiribati, Nauru,Tuvalu, and Cook Islands—merchandise trade defi-cits continuted to be covered largely by varied combi-nations of official transfers, overseas investmentincome, and workers’ remittances. Fiscal and mon-etary policy parameters generally were consistent withmacroeconomic stability.
Evidence suggests that human developmentindicators improved significantly during the 1980s and1990s. Pacific island economies generally registereddeclines in infant mortality and increases in life
For Cook Islands, Nauru, Samoa, and Tonga, 1999 refers to fiscal year 1998/99, ending 30 June.For the Marshall Islands and the Federated States of Micronesia, 1999 refers to fiscal year 1998/99, ending 30 September.For Kiribati, Solomon Islands, Tuvalu, and Vanuatu, 1999 refers to the calendar year.
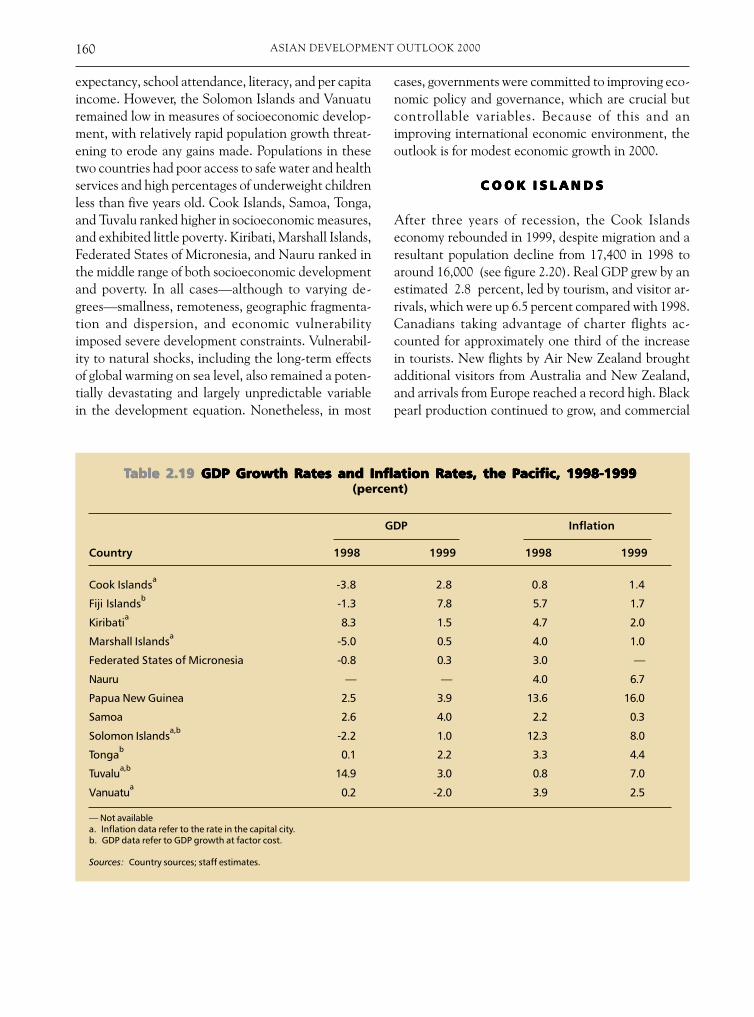
ASIAN DEVELOPMENT OUTLOOK 2000160
expectancy, school attendance, literacy, and per capitaincome. However, the Solomon Islands and Vanuaturemained low in measures of socioeconomic develop-ment, with relatively rapid population growth threat-ening to erode any gains made. Populations in thesetwo countries had poor access to safe water and healthservices and high percentages of underweight childrenless than five years old. Cook Islands, Samoa, Tonga,and Tuvalu ranked higher in socioeconomic measures,and exhibited little poverty. Kiribati, Marshall Islands,Federated States of Micronesia, and Nauru ranked inthe middle range of both socioeconomic developmentand poverty. In all cases—although to varying de-grees—smallness, remoteness, geographic fragmenta-tion and dispersion, and economic vulnerabilityimposed severe development constraints. Vulnerabil-ity to natural shocks, including the long-term effectsof global warming on sea level, also remained a poten-tially devastating and largely unpredictable variablein the development equation. Nonetheless, in most
TTTTTable 2.19able 2.19able 2.19able 2.19able 2.19 GDP Growth Rates and Inflation Rates, the PGDP Growth Rates and Inflation Rates, the PGDP Growth Rates and Inflation Rates, the PGDP Growth Rates and Inflation Rates, the PGDP Growth Rates and Inflation Rates, the Pacific, 1998-1999acific, 1998-1999acific, 1998-1999acific, 1998-1999acific, 1998-1999(percent)
GDP Inflation
Country 1998 1999 1998 1999
Cook Islandsa -3.8 2.8 0.8 1.4
Fiji Islandsb -1.3 7.8 5.7 1.7
Kiribatia
8.3 1.5 4.7 2.0
Marshall Islandsa -5.0 0.5 4.0 1.0
Federated States of Micronesia -0.8 0.3 3.0 —
Nauru — — 4.0 6.7
Papua New Guinea 2.5 3.9 13.6 16.0
Samoa 2.6 4.0 2.2 0.3
Solomon Islandsa,b
-2.2 1.0 12.3 8.0
Tongab 0.1 2.2 3.3 4.4
Tuvalua,b 14.9 3.0 0.8 7.0
Vanuatua
0.2 -2.0 3.9 2.5
— Not availablea. Inflation data refer to the rate in the capital city.b. GDP data refer to GDP growth at factor cost.
Sources: Country sources; staff estimates.
cases, governments were committed to improving eco-nomic policy and governance, which are crucial butcontrollable variables. Because of this and animproving international economic environment, theoutlook is for modest economic growth in 2000.
C O OC O OC O OC O OC O O KKKKK I S L A N D SI S L A N D SI S L A N D SI S L A N D SI S L A N D S
After three years of recession, the Cook Islandseconomy rebounded in 1999, despite migration and aresultant population decline from 17,400 in 1998 toaround 16,000 (see figure 2.20). Real GDP grew by anestimated 2.8 percent, led by tourism, and visitor ar-rivals, which were up 6.5 percent compared with 1998.Canadians taking advantage of charter flights ac-counted for approximately one third of the increasein tourists. New flights by Air New Zealand broughtadditional visitors from Australia and New Zealand,and arrivals from Europe reached a record high. Blackpearl production continued to grow, and commercial

161THE PACIFIC
agricultural production—stimulated by tourismgrowth—recovered from the drought. Constructionactivity also increased from the relatively low levels ofrecent years. Business surveys revealed a substantialrise in business confidence, which was reflected incredit growth in the private sector and increased for-eign investment. The inflation rate remained low, ris-ing slightly from 0.8 percent in 1998 to 1.4 percent.
The merchandise trade deficit fell to 46.3 per-cent of GDP in 1998 as imports declined and pearlexports grew by 66 percent. In 1999, increased pearlexports offset import growth that resulted from theeconomic recovery, and the trade deficit remainedaround 46 percent of GDP. Tourism receipts, officialtransfers, and private remittances substantially cov-ered the trade account imbalance, leaving a currentaccount deficit of approximately 7 percent of GDP.The New Zealand dollar, the currency in circulation,depreciated slightly against the US dollar, almost8 percent against the Australian dollar, and 10 per-cent against the yen. It appreciated 5 percent againstthe euro.
Government finances strengthened in 1999.Operating and overall surpluses were recorded; oper-ating expenditure was kept to the budgeted level andrevenues were above expectations. Developmentexpenditure continued to hover around the NZ$10million level of recent years. The debt-servicing bur-den eased because of the September 1998 restructur-ing of the external debt. Interest payments were amodest 12 percent of tax revenue, and the debt stockwas equivalent to 78 percent of GDP. The 2000 bud-get aimed at a balance-on-operating account, withrevenue rising 9 percent and operating expenditure15 percent. Development expenditure was projectedto rise to NZ$16 million as the government increasedspending on infrastructure assets to support tourism.
Implementation of the budget was disrupted bya period of political instability in the latter half of 1999,caused by poor governance and corrupt governmentpractices. However, a new coalition government tookoffice in November and quickly made a public com-mitment to continuing the economic and public sec-tor reform process begun in 1996. Six key strategiesfor improving fiscal governance included minimizingred tape, reducing government involvement in com-mercial activities, improving the corporate governance
of statutory authorities, restructuring some govern-ment corporations to increase efficiency, refocusingthe public administration on service delivery, and in-creasing reliance on local expertise.
Real GDP is forecast to grow by 4.2 percent in2000. The decline in the resident population attrib-utable to migration to New Zealand is expected tocease. Tourism is again predicted to be a driving force,with tourist arrivals forecast to increase by 6 percent,and production in agriculture and fisheries to rise6.6 percent.
KIRIBAKIRIBAKIRIBAKIRIBAKIRIBATITITITITI
According to revised estimates, real GDP grew by 8.3percent in 1998 because of recovery in copra produc-tion, aid-funded construction projects, and public ad-ministration expansion. Gross national product (GNP)was approximately twice the size of GDP because offishing license fees, net investment income, and

ASIAN DEVELOPMENT OUTLOOK 2000162
seamen’s remittances; GNP grew by 16 percent in 1998in real terms because fishing license fees were doubled.The next year growth slowed, with GDP increasingan estimated 1-2 percent, primarily because of theJapanese-funded construction of a new wharf at Betio.The real GNP growth rate decelerated as fishing li-cense fees fell because of declining fish stocks associ-ated with changing climatic conditions. The inflationrate fell to around 2 percent, in line with the rate inAustralia, the major source of imports. Growth in themoney supply was less than 1 percent.
The temporary increase in fishing license feesin 1998 strengthened the external accounts. Thecurrent account deficit, exclusive of official grants, fellfrom 17.9 percent of GDP in 1997 to 3.3 percent in1998. The strong growth in fishing license fees wasreinforced by increases in seamen’s remittances, to11 percent of GDP, and in investment income, to30 percent. When official grants equivalent to 43
percent of GDP were included, the current accountposition in 1998 was a surplus of 25.9 percent. The capitalaccount in 1998 moved into surplus—10 percent ofGDP—because of a rise in capital grants, and the over-all balance of A$36 million was 89 percent more thanthe historically large surplus of 1997. Because of thesesurpluses and the valuation effects of a depreciatedcurrency denominated by the Australian dollar, offi-cial external assets in the Revenue Equalization Re-serve Fund (RERF), the Consolidated Fund, and theDevelopment Fund reached A$606 million. Externaldebt was modest at 13.2 percent of GDP, with externaldebt service equal to 1.4 percent of exports of goodsand services. In 1999, however, the merchandise tradeand current account balances worsened because of de-clining exports and fishing license fees, respectively.
The 1999 budget was presented three months intothe year, and an overall deficit of 32 percent of GDPwas estimated, unlike budget surpluses in the previousyears (see figure 2.21). Fishing license fees were pro-jected to fall from A$42.5 million in 1998 to A$12.8million, while current and development expenditureswere estimated to rise 2.7 percent and 39.5 percent,respectively. External concessional loans would fi-nance almost one fourth of the deficit, and the re-mainder was to be covered by the Consolidated Fund(44 percent) and the RERF (31 percent). The accumu-lation of reserves during the past two years permitssuch a budget strategy, but care is needed over themedium to long term if the real per capita value of theRERF is to be maintained.
In the small finance sector, the sole commercialbank, the Bank of Kiribati—jointly owned by the gov-ernment and the Australian-based Westpac—remainsprofitable. Like the Kiribati Provident Fund, it holdsmore than 90 percent of its assets offshore. In August1999, credit of A$3.1 million to the private sector con-stituted barely 7 percent of assets, and no credit wasextended to the government or public enterprises.Growth of private sector credit is constrained by lim-ited domestic investment opportunities and the in-ability of the Bank of Kiribati to use land as collateral(the bank is partly foreign-owned, and foreigners arenot permitted to own land). The interest rate spreadincreased slightly to 6 percent. Loans from the Devel-opment Bank of Kiribati totaled A$3.8 million at theend of 1998, but further lending was constrained by a
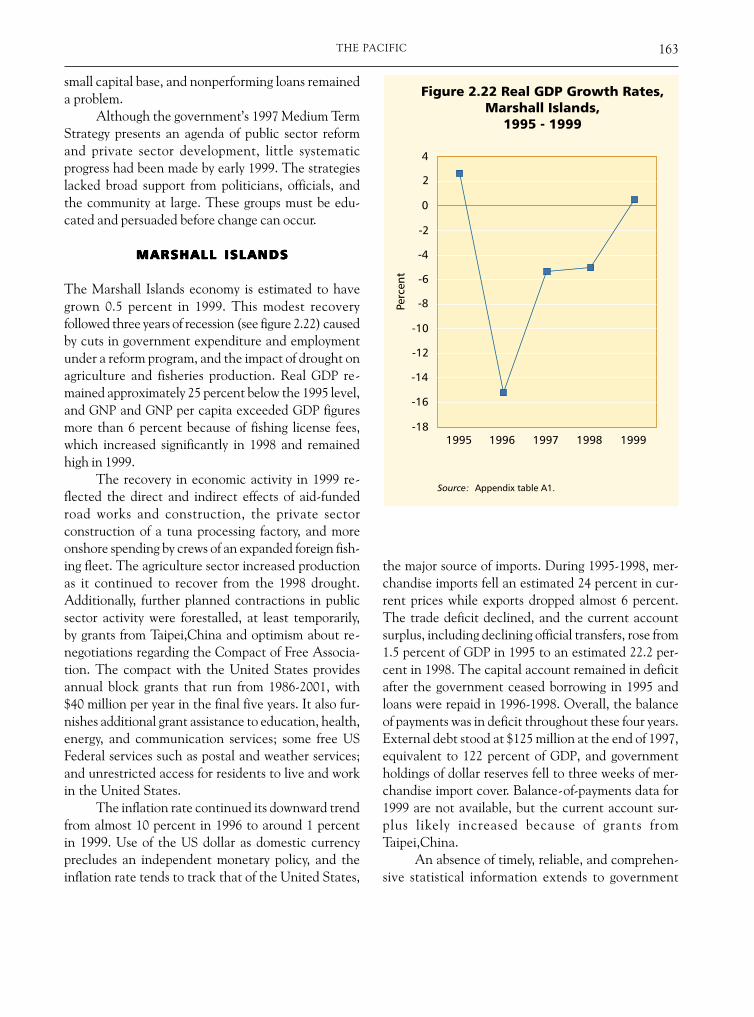
163THE PACIFIC
small capital base, and nonperforming loans remaineda problem.
Although the government’s 1997 Medium TermStrategy presents an agenda of public sector reformand private sector development, little systematicprogress had been made by early 1999. The strategieslacked broad support from politicians, officials, andthe community at large. These groups must be edu-cated and persuaded before change can occur.
MARSHALMARSHALMARSHALMARSHALMARSHALLLLLL ISLANDSISLANDSISLANDSISLANDSISLANDS
The Marshall Islands economy is estimated to havegrown 0.5 percent in 1999. This modest recoveryfollowed three years of recession (see figure 2.22) causedby cuts in government expenditure and employmentunder a reform program, and the impact of drought onagriculture and fisheries production. Real GDP re-mained approximately 25 percent below the 1995 level,and GNP and GNP per capita exceeded GDP figuresmore than 6 percent because of fishing license fees,which increased significantly in 1998 and remainedhigh in 1999.
The recovery in economic activity in 1999 re-flected the direct and indirect effects of aid-fundedroad works and construction, the private sectorconstruction of a tuna processing factory, and moreonshore spending by crews of an expanded foreign fish-ing fleet. The agriculture sector increased productionas it continued to recover from the 1998 drought.Additionally, further planned contractions in publicsector activity were forestalled, at least temporarily,by grants from Taipei,China and optimism about re-negotiations regarding the Compact of Free Associa-tion. The compact with the United States providesannual block grants that run from 1986-2001, with$40 million per year in the final five years. It also fur-nishes additional grant assistance to education, health,energy, and communication services; some free USFederal services such as postal and weather services;and unrestricted access for residents to live and workin the United States.
The inflation rate continued its downward trendfrom almost 10 percent in 1996 to around 1 percentin 1999. Use of the US dollar as domestic currencyprecludes an independent monetary policy, and theinflation rate tends to track that of the United States,
the major source of imports. During 1995-1998, mer-chandise imports fell an estimated 24 percent in cur-rent prices while exports dropped almost 6 percent.The trade deficit declined, and the current accountsurplus, including declining official transfers, rose from1.5 percent of GDP in 1995 to an estimated 22.2 per-cent in 1998. The capital account remained in deficitafter the government ceased borrowing in 1995 andloans were repaid in 1996-1998. Overall, the balanceof payments was in deficit throughout these four years.External debt stood at $125 million at the end of 1997,equivalent to 122 percent of GDP, and governmentholdings of dollar reserves fell to three weeks of mer-chandise import cover. Balance-of-payments data for1999 are not available, but the current account sur-plus likely increased because of grants fromTaipei,China.
An absence of timely, reliable, and comprehen-sive statistical information extends to government
ASIAN DEVELOPMENT OUTLOOK 2000164
finances. However, public finances have been strength-ened under the Policy Reform Program. Several min-istries have been rationalized, and the number ofgovernment employees was reduced 33 percent betweenlate 1995 and March 1999. A 1995 wage freeze remainedin place, following a 5 percent pay reduction for sala-ries higher than $10,400 per year. Subsidies to somestate-owned enterprises have been reduced or elimi-nated, the tariff system has been rationalized, and ef-forts to strengthen tax and customs administrationcontinued. These measures, combined with a large dropin capital expenditure, moved the overall budget bal-ance into surplus in 1996, 1997, and 1998.
The 1999 budget was passed one month into thefiscal year, before revised estimates for the budget out-comes of the previous year were available. A smalldeficit of $1 million was budgeted for General Fundaccounts, with increased total appropriations to sub-sidize government agencies. After nine months, it ap-peared that the deficit would reach $9 million,approximately 9 percent of GDP. Expenditure ex-ceeded the budgeted level, and revenue fell short, inlarge part because of the March 1999 decision to lowerthe general import duty from 12 percent to 5 percent.The government, concerned with the November 1999elections, apparently did not consider the budget im-plications of this policy and the decision to increasethe copra subsidy. Both reversed earlier policy actionsunder the Policy Reform Program, but did not savethe incumbent government, and the new UnitedDemocratic Party won office.
Interest in early 2000 centered on whether a newadministration would consolidate the gains made un-der the Policy Reform Program and complete theagenda of reform actions. Public expenditure man-agement is essential. Fiscal discipline may have weak-ened before the elections, when grants fromTaipei,China became available and confidence grewin a successful outcome to Compact funding renego-tiations. Whether this optimism proves justified or not,the quality of economic management will be crucialin determining future development outcomes. Otherareas requiring attention are public service perfor-mance, public enterprise reform, and an improved en-vironment for private sector development. Legislationconcerning investment approval, business licensingprocedures, issuance of work permits, and improved
security of land leases was being considered. Oncepassed, and if effectively implemented, the legal frame-work for increased private sector activity will improvegrowth prospects.
F E D E R A T EF E D E R A T EF E D E R A T EF E D E R A T EF E D E R A T E DDDDD S T A T ES T A T ES T A T ES T A T ES T A T E SSSSS OOOOO FFFFFM I C R O N E S I AM I C R O N E S I AM I C R O N E S I AM I C R O N E S I AM I C R O N E S I A
The real GDP of the Federated States of Micronesia(FSM) rose an estimated 0.3 percent in 1999. Thisslight increase in the aggregate level of economic ac-tivity ended two years of recession (see figure 2.23),but it was not evenly spread across the four states. Therise in GDP was attributable entirely to an increase ineconomic activity in Chuuk, where the private sectorexpanded enough to more than offset a continued de-cline in government contribution. Real GDP was stag-nant in Kosrae and Pohnpei and declined in Yap,although in the latter two states private sector activ-ity increased.
No data are available on the inflation rate, butit tracked the US rate of 2.6 percent, as the US dollaris the currency in circulation and the United States isthe dominant source of imports. Commercial bank-ing deposits and loans changed little from the levelssince 1993. Deposits dropped and both consumer andcommercial loans increased marginally; consumerloans, primarily to public servants, dominated bankportfolios. The loan-to-deposit ratio fell to 43 percentat the end of 1999, as banks continued to invest off-shore because of the ongoing lack of domestic com-mercial lending opportunities. This reflected a specificlimitation on mortgage-secured lending caused by lawsagainst land ownership by foreign banks. It also re-flected a combination of constraints to private sectordevelopment in general, most notably high wage costs,inadequate economic infrastructure, and an incom-plete regulatory framework lacking transparency andpredictability.
Under the Public Sector Reform Program, eas-ing these and other constraints began through publicservice downsizing, public enterprise reform, foreigninvestment legislation, banking deregulation, businesssupport services, and attempts at improving land ti-tling and leasehold arrangements. However, as ob-served at the national economic summit in September1999, much policy formulation remains to be done,

165THE PACIFIC
and implementation must be effective. Regulations,particularly those about attracting foreign investment,must be applied quickly, and must be transparent andnondiscriminatory.
The aid-dependent, public-sector-dominatednature of the FSM economy is well documented. Thishas altered slightly as reductions in transfer grantsunder the Compact of Association with the UnitedStates forced cutbacks in government expenditure.Staff retrenchment and wage reductions caused na-tional and state government expenditures to fall from80 percent of GDP in 1993 to 70 percent in 1998, andsimultaneously caused a decline in private sector ac-tivity, excluding subsistence production.
Historically, this sector evolved largely as a sub-sidiary goods and services provider to public servants,centering on importing, wholesaling, and retailing,rather than export-oriented agriculture, fisheries, andtourism. The public expenditure reductions contrib-uted substantially to strengthening state governmentfinances, but expenditure remained high by Pacific andinternational standards, with wages and travel ac-counting for 85 percent of operating expenditure. Fis-cal discipline will be needed to prevent expendituresrising and to allow ongoing reduction in the externaldebt burden. External debt continued to decline in1999, reaching 38 percent of GDP, compared with ahigh of 66 percent in 1993. The debt-service ratio wasestimated at 25 percent of exports. Official projectionsindicated that the country was on track for a debt-to-GDP ratio of 21 percent and a debt-service ratio ofjust 3 percent by 2002.
The continued reliance of the government onCompact transfers reveals the extent of the long-termeconomic adjustment that would be required if largeaid flows were not continued. These transfers ac-counted for 47 percent of total government revenuewhile tax collections provided just 14 percent. Majorreform to improve efficiency and effectiveness is re-quired if taxation revenue is to rise without jeopar-dizing private sector development. This will involvepossible replacement of the current gross revenue taxwith a value-added tax, greater efficiency in collec-tion, and greater use of service charges and user fees.Revenue sharing between state and national govern-ments was addressed in a July 1999 referendum, whichproposed that the national constitution be amended
to divide fishing license revenue equally among thefive governments, instead of it all going to the na-tional government. It also suggested allowing 70 per-cent of tax collections rather than 50 percent to go tothe states, but the proposal did not receive the re-quired support of three fourths of voters in at leastthree states.
The obvious uncertainty confronting FSM gov-ernments is the outcome of renegotiations of the USCompact. From an FSM perspective, successful rene-gotiations will ensure a long-term source of financialsupport that will ease the pressure for economicrestructuring. Micronesians may experience less com-pulsion to emigrate to Guam, Hawaii, and US main-land in search of employment. If the renegotiationsare unsuccessful, provision still exists for grant trans-fers in 2002 and 2003 at the average level of the15-year-period from 1986 to 2001. In this event, thegovernment will need to accelerate efforts to designand implement policies that will allow developmentled by the private sector to flourish.

ASIAN DEVELOPMENT OUTLOOK 2000166
N A U R UN A U R UN A U R UN A U R UN A U R U
The factors that caused concern for the economic situ-ation in 1998 continued to be worrisome in 1999. Theexhaustion of the phosphate resource, which has pro-vided the main source of income and employment formany years, drew closer. Fiscal planning and disciplinecontinued to be poor, and the financial system wasstill in a state of collapse. The diminished asset baseof the Nauru Phosphate Royalties Trust (NPRT) hadnot yet been given a reliable value as a basis to assesssustainable consumption levels. Government commit-ment to an economic and financial reform programweakened noticeably, partly because of an uncondi-tional loan from Taipei,China. In addition, Nauru’sinternational image was tarnished by allegations of in-volvement in money laundering.
Although there are no national accounts, realGDP probably increased in 1999. Real government ex-penditure rose 15 percent compared with 1998, the
volume of phosphate exports rose 38 percent, theJapanese-funded construction of Ainabare boat har-bor began, and fisheries production for the domesticmarket increased. About 30 percent (450 people) ofthe public sector workforce was retrenched beginningin April 1999, but a lump-sum payout funded by theAsian Development Bank (ADB)significantly amelio-rated the impact on aggregate demand. In addition,the Nauru Phosphate Corporation reportedly hiredaround 200 casual laborers, and a significant numberof retrenched public servants went into coastal fish-ing and the retail trade. A rise in inflation to 6.7 per-cent in 1999 corresponded with a rise in economicactivity.
The reformist 1999 budget projected an overallsurplus, but the actual outcome was officially reportedas an A$12 million deficit (see figure 2.24). The realfigure was probably larger, because recorded revenueincluded A$4 million in dividend payments from thebankrupt Bank of Nauru, and expenditures did notcapture all payments made by government. The defi-cit was more than covered by external loans, with A$3.5million (US$2.3 million) from the ADB and A$29 mil-lion from Taipei,China. Of the A$29 million, A$14 mil-lion remained unspent at the end of the year.
Preliminary estimates indicated that at the endof March 1999, the republic’s stocks of consolidateddomestic and external debt totaled A$524 million andA$129 million, respectively. During 1999, NPRTobtained a US$99 million loan from General ElectricCapital to pay dividends to landowners and to refi-nance and restructure the investments of NPRT, theNauru Finance Corporation, and the Nauru Super-annuation Board. The 2000 budget was presented toParliament three months into the year. The budgetspeech clearly identified the country’s economic diffi-culties, gloomy outlook, and necessary courses of ac-tion. However, the budget estimates did not representan adequate attempt to move toward long-term fiscalsustainability. A deficit of A$3 million was projected,assuming 32 percent growth in nominal domestic rev-enue, A$5 million in external grants, and an 8 per-cent increase in nominal expenditure. The deficit wasto be financed with A$2.7 million in surplus loan fundsfrom 1999, plus A$7.8 million in proceeds from assetsales, with provision for a net repayment on the foreignloan account of A$7.6 million. The government

167THE PACIFIC
intended to sell and lease back Air Nauru’s onlyaircraft, using the proceeds to pay an outstanding loan.
Actual budget outcomes, however, probably willdepart significantly from these estimates. Fishing li-cense revenue may not be forthcoming, as legally theNational Fisheries and Marine Resources Authorityretain it. Dividend income of A$3 million from theNauru Phosphate Corporation is uncertain, and saleof the aircraft for the expected amount is far from guar-anteed. On the expenditure side, overruns can be an-ticipated because of poor governance and deficienciesin the budget execution system.
For a brief period in 1999, a long-term anddifficult reform program was begun. Substantial publicservice downsizing occurred in an economy wherealmost all paid jobs were in the public sector. Unfor-tunately, political instability, substantial and un-conditional external loan funds, unwillingness toconfront harsh economic realities, combined to stallreform. This process must be revitalized quickly tominimize the harshness of an unavoidable fiscal andeconomic adjustment.
S A M O AS A M O AS A M O AS A M O AS A M O A
The growth performance of the Samoan economy ex-ceeded expectations in 1999. After increasing 1.6 per-cent in 1997 and 2.6 percent in 1998, real GDP in 1999rose by 4 percent, led by the fisheries and commercesectors (see figure 2.25), compared with an original bud-get forecast of 2.5 percent. From 1998 to 1999, valueadded in fisheries rose 41.8 percent, increasing its shareof GDP to 7.4 percent. Value added in the commercesector rose 29 percent. The construction sector alsorecorded strong growth, increasing value added by 12.9percent. The hotels and restaurants sector expanded4.9 percent, stimulated by almost 9 percent more tour-ist arrivals. Public administration increased 4.1 per-cent, but food and beverage manufacturing grewsluggishly, and value added in agriculture and othermanufacturing declined.
Employment growth occurred at a modest 2 per-cent between 1998 and 1999, according to incompleteNational Provident Fund figures. Increased employ-ment in public administration, accommodation andrestaurants, personal services, and food manufactur-ing sectors accounted for most formal sector employ-
ment growth, with the rate of female employmentgrowth more than double that of males. Althoughthere was some growth in private sector employment,creating additional job opportunities in that sectorremains an ongoing challenge.
A reduction in inflation accompanied the ac-celeration in output growth in 1999. The average an-nual rate in June 1999 was 0.8 percent—compared with5.5 percent in June 1998—and reflected decreased lo-cal food prices; low inflation rates in Australia andNew Zealand, the major sources of imports; and tariffreductions. Money supply growth was modest: in 1999,the broad money supply increased 10 percent.Increased net foreign assets accounted for 28 percentof this increase, and net domestic assets for the re-maining 72 percent.
As the government continued to increase its netdeposits with the banking system, credit to the pri-vate sector in 1999 increased 16 percent, reaching 27

ASIAN DEVELOPMENT OUTLOOK 2000168
percent of GDP compared with 25 percent in 1998.Credit to nonfinancial public enterprises also in-creased almost fourfold, albeit from a small base. Creditextended to the private sector by nonmonetary finan-cial institutions increased 12 percent. During 1999, thecomposition of financial institution portfolios withthe private sector shifted away from personal andmanufacturing sector loans toward loans to the pri-mary sector, construction, trade, transportation andcommunication, and business and professional ser-vices. The weighted average lending rate of commer-cial banks dropped half a percentage point during early1999, reducing the interest rate spread to 7.5 percent.The central bank continued to use its own securitiesas the monetary policy instrument to meet the infla-tion target of about 2 percent per year.
The balance of payments remained in overallsurplus in 1998, equivalent to 3.7 percent of GDP. Netforeign assets rose to ST177.7 million (US$68 million)at the end of the year, or 5.7 months of goods andservices imports. The external debt was 74 percent ofGDP, of which 69 percent was official government debt.External debt-servicing costs were manageable re-garding their demand on revenue from exports ofgoods, nonfactor services, and private remittances. Inthe first half of 1999, the balance of payments recordedan overall deficit equivalent to 3.1 percent of GDP,resulting in a decrease in net foreign assets to ST167.2million (US$64 million), or 4.4 months of goods andservices. This reflected a widening in the trade deficitthat was primarily attributable to growth in privatesector imports, to be expected with the increase ineconomic activity. During the same period, the nomi-nal exchange rate depreciated 0.3 percent and the realeffective exchange rate depreciated 4.4 percent, re-flecting the drop in Samoa’s inflation rate to belowthat of its trading partners. This last developmentreversed the trend of real appreciation that hademerged over 1991-1997 and had threatened a loss ofinternational competitiveness.
Provisional government finance statisticsshowed that in 1999, for the fourth fiscal year in suc-cession, government ran an overall budget surplus. Itwas equivalent to 0.5 percent of GDP, a significant im-provement over the budgeted deficit of 1.3 percent.Revenue was slightly below the original budget esti-mate because of a shortfall in tax revenue. However,
current expenditure was also lower, as was externallyfunded development expenditure because of delays instarting some projects. Because of the surplus, govern-ment increased its net deposits in the banking system,further reducing the crowding-out pressure on theprivate sector.
In 2000, an overall deficit of 5.1 percent of GDP isbudgeted. Revenue is projected to rise 8.2 percent, andcurrent expenditure is budgeted to be 6.6 percenthigher than in 1999, primarily because of increasedspending on education and health and a higher wagebill. A current surplus of 3.4 percent of GDP is pro-jected, and external grants are expected to fall 32.7percent. Development expenditure will be down 2.1percent, so external borrowing will increasingly be re-lied on for funding capital investment projects. Thisbudgetary projection is consistent with Samoa’s eco-nomic strategy, and the increased official external debtis well within debt-servicing capacity. There will againbe a negative domestic borrowing requirement, whichwill consolidate government’s net credit position withthe banking system.
The government reaffirmed its commitment toeconomic reform in its Partnership for a ProsperousSociety: A Statement of Economic Strategy 2000-2001. Thisstatement emphasizes the importance of ensuring thatreform benefits the community as a whole, and in-cludes among its objectives invigorated agriculture andfisheries and a revitalized village economy. Providedthe economy is not subject to severe external shocks,the forecast 2000 growth rate of 3-4 percent can beachieved. The government has demonstrated its ca-pacity to deliver a stable macroeconomic environment,and is set to continue to do so through a firm fiscalstance and a sound monetary policy.
In addition, it continues to improve themicroeconomic policy environment within which theprivate sector operates. Several state-owned enter-prises were privatized in 1999 and further privatizationis planned for 2000. Agriculture, however, continuesto pull down the aggregate growth rate. The revival ofthis sector from the long-term damage caused by the1994 taro leaf blight is a central medium-term con-cern. Success in this sector would considerably im-prove the prospects of increasing the growth rate, andof ensuring that the benefits of growth are morebroadly spread.

169THE PACIFIC
S O L O M OS O L O M OS O L O M OS O L O M OS O L O M O NNNNN I S L A N D SI S L A N D SI S L A N D SI S L A N D SI S L A N D S
After two years of recession, the Solomon Islandseconomy began to recover in 1999 (see figure 2.26).Real GDP is estimated to have increased around 1 per-cent, largely because of increased gold and log produc-tion, and aid-funded road construction in the capitalcity. Unfortunately, an insurgency on the island ofGuadalcanal prevented a stronger recovery. The gov-ernment was forced to declare a state of emergencybetween June and October and 25,000 Malaitans whohad settled on the island were displaced. The country’smajor oil palm producer, Solomon Islands PlantationsLimited, closed indefinitely because of the insurgency.Several tourist resorts also closed, cocoa and copraproduction was disrupted, and market gardening wasseverely curtailed. Business confidence sank further,diminishing medium-term growth prospects.
The insurgency derailed the expectedprivatization of Solomon Islands Plantations Limitedand threatened the rehabilitation of public finance,which is central to the government’s economic andpublic sector reform program, and where substantialprogress had been made. The cost to the budget inlost revenue and increased expenditure on securityoperations and resettling displaced persons was esti-mated at SI$30 million ($6 million). However, addi-tional aid from Taipei,China was offered to cover thesecosts, and actual total recurrent expenditure was keptto just 3 percent above the original budget estimates.Domestic revenue exceeded the budget estimate by3 percent as revenue collection improved, resultingin a small recurrent surplus. Total domestic public debtat the end of December 1999 had fallen to SI$378million ($75.6 million), almost 6 percent below thelevel at the end of 1998. External public debt rose9 percent to SI$580 million ($116 million), but thiswas on concessional terms and provided the financialmeans for the reform program. The government bor-rowed in external markets to pay off domestic arrearsand most foreign arrears, and fund the increase in de-velopment expenditure.
The growth rate of the money supply acceler-ated slightly from 4.8 percent in 1998 to 7 percent in1999 because of a 16 percent expansion in net foreignassets. Domestic credit declined 2 percent as govern-ment continued to reduce its net indebtedness to the
banking system, and credit to the private sector ex-panded a modest 1.3 percent. The government securi-ties market was reactivated in May 1999 following arestructuring of government debt that involved con-verting frozen Treasury bills into medium-term bonds.Commercial banks invested some of their excess re-serves in bills offered at auction, but retained 10 per-cent of free liquid assets at the end of the year. Theinterest rate spread remained at 10 percent, with av-erage deposit rates negative in real terms. Monetarypolicy was tight throughout 1999. The rates on cen-tral bank short-term securities and Treasury bills re-mained unchanged as the emphasis shifted to bills asthe main monetary policy instrument.
In 1999 the inflation rate decelerated to 8 per-cent, from about 12 percent the previous year, becauseof tight macroeconomic policies and slowed growthin import prices. The impact of the 20 percent de-valuation of December 1997 dissipated without gen-erating the price-wage spiral of earlier years. The

ASIAN DEVELOPMENT OUTLOOK 2000170
exchange rate remained relatively stable in 1999, withthe Solomon Islands dollar depreciating 2.2 percentand 4.2 percent against the US and Australian dollars,respectively, and appreciating slightly against the NewZealand dollar. The balance-of-payments positionstrengthened in 1999 because of a 4 percent rise inmerchandise export receipts, a 13 percent decline inimports, and an increase in capital receipts attribut-able to official bilateral and multilateral inflows. Therise in export receipts reflected greater earnings fromgold, copra, and log exports, while imports in all cat-egories declined. External reserves amounted to about3.5 months of import equivalent. This represented asubstantial improvement on the two weeks of coverearly in the year, but was still less than the five or sixmonths needed.
The government was hopeful that economicgrowth would accelerate to 3-4 percent in 2000 andinflation would decline to 6-7 percent. This, however,is predicated on an improved international economicenvironment and, more importantly, on an effectiveresolution of the social unrest that disrupted primarysector production and depressed investor confidence.Such a resolution will be difficult, and to be durablewill require a long-term strategy that addresses thecauses of economic inequality between regions andethnic groups. In the meantime, although the gov-ernment progressed toward restoring macroeconomicstability and continues to implement its reform pro-gram, investor confidence apparently has not revived.
The tax administration and public expendituremanagement still need work, particularly to improveallocative efficiency. The 2000 budget aims at zerogrowth in the nominal wage bill, while providing foran overall increase in recurrent expenditure of 10.5percent, which largely reflects increased spending onhealth and education. Domestic revenue is projectedto rise nearly 8 percent, and a small recurrent surplusis again budgeted. Personal and company income taxrates will be lowered; export duties on palm oil, copra,cocoa, and reef fish removed; and the maximum im-port tariff rate reduced from 40 to 20 percent. Increasedrevenue is expected from improved compliance andincreased taxes on log exports, alcohol, and tobacco.Deductions allowed for calculating taxable personalincome will also be reduced. Development expendi-ture is projected to increase 58 percent, to be financed
largely by an expected 81 percent increase in externalgrants. A budget deficit of SI$71 million ($14.2 mil-lion) is to be financed by external borrowing. Thesefigures are exclusive of Stabex funds (a European Unionstabilization system of financial assistance) that total42 million euros, which could be used to finance gov-ernment expenditure and establish a trust fund.
T O N G AT O N G AT O N G AT O N G AT O N G A
Following three years of recession and stagnation, theeconomy rebounded in 1999 (see figure 2.27). Revisednational accounts estimates show that real GDP fell3.7 percent in 1996 and 1.4 percent in 1997, and in-creased only 0.1 percent in 1998. However, the provi-sional official estimate is that real GDP grew by 2.2percent in 1999. This modest growth largely reflectedseveral construction projects, expanded kava manu-facturing, and moderate growth in the service sectors:trade, transportation and communications, finance

171THE PACIFIC
and business services. Output in the major productivesector of agriculture, forestry, and fisheries declinedfor the fourth year in a row, as the effects of droughtwere compounded by crop damage from Cyclone Corain December 1998. GDP per capita of the approxi-mately 98,500 population was an estimated T$2,487($1,574) at the end of 1999. The inflation rate had edgedup to 4.4 percent because of the effects of drought ondomestic food prices and currency devaluation.
The balance of payments recorded an overallsurplus of 4.2 percent of GDP in 1999, compared with adeficit of 6.4 percent the previous year. Total officialforeign reserves rose from 2.5 months of import coverto 3.9 months. The improvement in the balance ofpayments reflected a reduction in the current accountdeficit from 10.4 percent of GDP to 1 percent, and aslight increase in the capital account surplus from 4percent of GDP to 5.3 percent. The change in the cur-rent account balance largely was attributable to fewermerchandise imports. Export performance was disap-pointing, with the principal exports of squash, fish,and root crops all declining, and growth only in va-nilla and other agricultural products. Private remit-tance flows remained buoyant. The nominal and realeffective exchange rates depreciated 8.2 percent and6.7 percent, respectively, during 1999. This was an over-due adjustment after three years of appreciation, andit continued in the beginning of 2000.
Despite an increase in the money supply of nearly20 percent in 1999 because of an increase of foreignreserve, net domestic credit expanded just 1.6 per-cent. Lending to public enterprises increased, whilecredit to the private sector remained stagnant andthe government reduced its borrowing. The ReserveBank maintained a tight monetary policy, but theweakness of its balance sheet continued to constrainthe effective use of monetary policy when balance-of-payments pressures developed.
The fiscal situation in 1999 improved over 1998.Official estimates suggested an overall budget surplusof T$2.6 million (US$1.625 million), or approximately1 percent of GDP, while International Monetary Fundestimates suggested a deficit of T$4.2 million (US$2.674million), or 1.8 percent of GDP. The overall outcomereflects lower levels of public expenditure than in theoriginal budget estimates, with an increase in thenominal wage bill. In addition, the government’s
underlying fiscal capacity as measured by the currentbalance remained weak. The current deficit in 1999was T$7.1 million, or 2.9 percent of GDP. Thegovernment’s total outstanding debt at the end of1999 was 37.4 percent of GDP, with more than 80 per-cent consisting of external loans at concessional in-terest rates.
The wage bill is estimated to rise 4.4 percent,and a smaller overall annual budget surplus of T$0.9million is projected. These budget estimates, however,are not fully consistent with the stated policy objec-tives of fiscal tightness, ongoing civil service reform,and improved allocative efficiency, nor are theygrounded in a convincing medium-term macroeco-nomic framework. The budget hopes that growth willaccelerate to double-digit figures by 2001, but thesource of more rapid growth is unclear. In the earlymonths of 2000, there were signs of a domestic creditexpansion. Lending to the private sector rose almost7 percent, and the government increased borrowing.The budget deficit in 2000 is projected to be T$12.4million (US$7.75 million), with current expenditureset to grow 9.4 percent and current revenue to riseonly 1.7 percent. Debt servicing for 2000 was estimatedas a manageable 2.7 percent of GDP.
The 2000 budget contains some significant ini-tiatives, including a new contributory retirementscheme for civil servants and a commitment for taxreform to shift the balance from trade to indirect taxes.Major reforms targeted at enhancing the efficiency ofthe large and diverse public enterprises sector are de-sirable. In addition, the economic policy environmentneeds improvement, as its lack of transparency andpredictability seriously discourages domestic and for-eign private sector investment. The Industrial De-velopment Incentives Act remains in effect, with allits discretionary provisions. A new Companies Actof 1995 finally became law in April 1999, but was poorlyreceived by the business community and requires im-mediate amendment. The cumbersome system ofgranting business, trade, and development licensesalso needs reform. This system, combined with ongo-ing difficulties in obtaining work permits for foreignskilled labor, constitutes a major obstacle to the di-rect foreign investment needed if Tonga’s undoubteddevelopment potential—especially in the agriculture,fisheries, and tourism sectors—is to be realized.

ASIAN DEVELOPMENT OUTLOOK 2000172
T U V A L UT U V A L UT U V A L UT U V A L UT U V A L U
A new set of national accounts reveals that the realGDP growth rate in 1998 was 14.9 percent. This rapidgrowth was led by the government sector, which ex-panded by almost a third and accounted for one fourthof GDP. In addition, public construction grew by28.5 percent. This growth reflected the impact of in-creased public service employment, wages, and physi-cal infrastructure projects on national income. Incontrast, agriculture, forestry, and fisheries grew by lessthan 1 percent. The real GDP growth rate was esti-mated at 3 percent in 1999, with public administra-tion and public construction again the leading sectors.Official estimates of GNP are not made, but real GNPgrew faster than real GDP in 1999 because of rapidgrowth in fisheries license fees and revenue from pass-port sales. In addition, the first revenue from leasingTuvalu’s Internet domain address to a foreign com-pany was received, although it was much less than origi-nally anticipated. Income from the Tuvalu Trust Fund
and private remittances remained at the levels of re-cent years. The inflation rate in 1999 rose to 7 percentfrom less than 1 percent in 1998 (see figure 2.28). Thisreflected higher prices in the transport and miscella-neous categories of the consumer price index.
A substantial trade deficit continued to befinanced by remittances, investment income, fishinglicense fees, and official transfers. Net foreign assets,including the Tuvalu Trust Fund, reached A$90 millionat the end of the year (approximately seven years ofimport cover). An automatic distribution from thetrust fund to the Consolidated Investment Fund pro-vided 11.5 percent of the government’s total recur-rent revenue in 1999. Fishing license fees provided 40percent and taxation 17 percent, while telecom licensefees fell to 4 percent. Because of an unexpected surgein fishing license fees, total recurrent revenue was 30percent more than the budget estimate. Total operat-ing expenditure was 24 percent below the budgetedlevel, primarily because of a shortfall in expenditureon goods and services.
Capital expenditure, which for the first time waslargely domestically financed, was 32 percent belowthe approved level. Consequently, instead of a pro-jected budget deficit of approximately 24 percent ofGDP, the budget surplus was 9 percent. Such conser-vative projections of revenue and overestimates ofexpenditure have been characteristic of Tuvalu gov-ernment budgets in the 1990s. A new administrationintroduced the 2000 budget and continued thepost-independence tradition of fiscal prudence. It pro-jected a 15 percent increase in revenue, largely attrib-utable to increased distribution of income from theTuvalu Trust Fund and external grants. Operating ex-penditure was projected to rise a substantial 72 per-cent because of increased expenditure on personnel,goods and services, and special items that includedcontributions to the Falekaupule Trust Fund to financeouter island development projects. This fund was es-tablished in late 1999 with ADB loan funds, commu-nity contributions, and matching government funds.Capital expenditure is projected to rise the same per-centage as operating expenditure, as new governmentoffices are built and outer islands are provided withelectricity supplies. The overall budget is officially pre-sented as balanced. In fact, in 2000 Tuvalu will receiveADB concessional loans of A$1.8 million, and A$3.2

173THE PACIFIC
million will come from government’s financial reservesin the Consolidated Investment Fund. The total A$5million matches a planned augmentation of the capi-tal in the Tuvalu Trust Fund.
In 1999, the government began to devolve ad-ministrative responsibilities including some expen-diture management to Falekaupule, the outer islandcouncils. This was in line with the medium-term de-velopment strategy’s focus on ensuring greater equal-ity of income distribution between the capital islandof Funafuti and the outer islands. The FalekaupuleTrust Fund is expected to reach a capital base ofA$14.6 million in 2000, and to generate annual de-velopment finance of A$590,000 for an outer islandpopulation of approximately 5,000, the same numberof residents as Funafuti.
The government also began negotiations withJapan for acquiring a multipurpose inter-island vesselto supplement the services of the old existing vessel,and to ease the transport constraint on outer islandcommercial activity. However, activity in the marketeconomy will continue to be concentrated in Funafutiand will be dominated by the public sector. In 2000,construction of government offices, road reconstruc-tion, slightly increased public service employment, anda 10 percent wage rise for public servants will stimu-late private sector activity and significantly acceleratethe aggregate economic growth rate. Plans have beenannounced for accelerating public sector reformthrough (a) corporatizing inter-island shipping and theTuvalu Maritime School, (b) commercializing serviceprovision by some ministries, and (c) introducing aperformance orientation in the public service and pub-lic enterprises. Implementing the reforms can be ex-pected to be a slow process. Meanwhile, private sectordevelopment that is not a direct function of publicsector expansion remains limited by location, difficul-ties of access to land, and poor international trans-port links.
VVVVVANUANUANUANUANUAAAAATUTUTUTUTU
National accounts show that real GDP increased by0.2 percent in 1998, a year characterized by politicalinstability and disarray in macroeconomic policy. Out-put of the agriculture, fisheries, and forestry sector grewby 6.9 percent, primarily because of greater copra and
kava production. Industry sector output fell 7 percent,while service sector output declined 0.7 percent, largelybecause of reduced wholesale and retail trade.
In 1999, real GDP fell an estimated 2 percent,despite a 7.6 percent growth in industry sector pro-duction from a substantial increase in aid-funded con-struction (see figure 2.29). Agriculture sector outputdeclined 9.3 percent, with production slowed by a cy-clone in February. The government sector reportedlycontracted 5 percent, while the overall decline in theservice sector was 1.2 percent. Visitor arrivals in thefirst half of 1999 were lower for various reasons. ASydney hailstorm grounded the Air Vanuatu aircraftfor more than six weeks; a domestic air crash damagedVanuatu’s image; and competition increased fromother tourist destinations such as Fiji Islands, NewCaledonia, and Tahiti. However, the frequency offlights from Australia increased in comparison with1998, and the number of visitors began to climb in thelatter half of the year.

ASIAN DEVELOPMENT OUTLOOK 2000174
Along with stagnation in tourism receipts in 1999,cocoa, copra, and kava exports fell from their 1998 lev-els. However, revenue from beef and timber exportsrose as export volumes increased. Import expendituredropped from the high level of 1998, as tourism andthe aggregate level of economic activity fell. The defi-cit on the current account remained around 8 percentof GDP, and was matched by a capital account surplusfrom long-term public borrowing, notably disburse-ment of an ADB program loan. Through 1999, the vatu,which is pegged against a group of currencies, appreci-ated 0.5 percent against the US dollar and depreci-ated almost 6 percent against the Australian dollar inboth nominal and real terms, as Vanuatu’s inflationrate was nearly the same as Australia’s. No balance-of-payments pressure was evident, with official for-eign reserves at the end of 1999 equivalent to 6.5 monthsof imports. No significant policy-induced changes inthe nominal effective exchange rate were anticipated.
Given the openness of the economy and thepegged exchange rate system, the scope for an inde-pendent monetary policy is limited. Up to September1999 the money supply grew by only 0.3 percent fromthe corresponding quarter in 1998, entirely becauseof growth in domestic credit. This growth reflectedincreased loans to the private sector, particularly forland and house purchases. Net foreign assets fell1.2 percent. Considerable scope existed for credit ex-pansion, with commercial banks’ actual reserve hold-ings 76 percent higher than the prescribed StatutoryDeposit Ratio, which was reintroduced in November1998. At the end of the third quarter of 1999, theweighted average lending and deposit rates had de-clined slightly to 12.5 percent and 3.3 percent, respec-tively, so that the interest spread had widened from 9to 9.2 percent.
Following an overall budget deficit of 10.3 per-cent of GDP in 1998, the target outcome in 1999 was adeficit of 5.4 percent of GDP. The actual outcome wasestimated to be an overall deficit of 1.2 percent of GDP.This was attributable largely to development expen-diture of 39 percent of the budgeted level, which re-flected delays in implementing major infrastructureprojects. Total expenditure and net lending fell 24 per-cent from 1998. Revenue and grants reached 95 per-cent of the budgeted level, despite an economic growthrate well below expectations. The restructuring of thetax system from trade tax to a value-added tax showedencouraging results, with 96 percent of budgeted value-added tax revenue collected.
External concessional loans financed 92 percentof the budget deficit. The total stock of debt stood atVt9,657.1 million, or 35 percent of GDP, and one fourthwas domestic debt. The 2000 budget provided for abalanced recurrent budget, an increase in develop-ment expenditure, and an overall deficit of 3 percentof GDP to be financed by external concessional loans.The revenue estimate was a realistic 0.3 percent be-low the 1999 budget level, while the recurrent expen-diture estimate was 2.2 percent below the 1999 level.The latter may prove difficult to achieve unless pub-lic service staffing is consistent with budget provisions.
Restoring investor confidence is crucial, and theForeign Investment Act was amended in April 1999to be less restrictive of foreign investment. However,a sudden change of government in November 1999introduced uncertainty into the policy environment.The new prime minister, who headed a coalition offive parties with a slender parliamentary majority,indicated an intention to review the roles of theprevious administration and the role of external fund-ing agencies.

177THE SOCIAL CHALLENGE IN ASIA
As the Century TurnsAs the Century TurnsAs the Century TurnsAs the Century TurnsAs the Century TurnsThe Social Challenge in AsiaThe Social Challenge in AsiaThe Social Challenge in AsiaThe Social Challenge in AsiaThe Social Challenge in Asia
As developing Asia enters the 21st century, it faces an enormous social challenge: to improve thequality of life for around 900 million Asians who still live below the dollar-a-day poverty line. Thesocial challenge, however, goes beyond economic deprivation reflected by an income measure of pov-erty. It also entails addressing other aspects of human deprivation, such as illiteracy, malnutrition,high incidence of morbidity, poor access to water and sanitation, vulnerability to short-term shocks,and poor governance. Promoting inclusive and sustainable economic growth remains the best path topoverty reduction. Such growth is crucial because it increases demand for the one asset on which thepoor depend most—their labor. It is also crucial because the resources for and the political feasibilityof anti-poverty programs are greater when incomes and economic opportunities are expanding for all.To achieve such inclusive growth, the Asian economies should promote an overall policy environmentthat emphasizes openness and market orientation, along with labor market flexibility and prudentmacroeconomic management. This policy framework for inclusive growth should be part of an over-all national anti-poverty program that includes appropriate investments in human and physicalinfrastructure, improved governance, and strengthened social safety nets. While Asia’s developingcountries must accept the burden of responsibility for addressing the region’s social challenge, moreneeds to be done internationally. These international efforts should be directed at improving the globaltrading environment; increasing the flow of foreign assistance; and providing public goods that have adirect bearing on the welfare of the poor in developing economies, such as research on tropical diseasesand agriculture.
DDDDDeveloping Asia enters the new century with anenormous challenge: to improve the quality of
life for the hundreds of millions of its citizens who stilllive in poverty. The magnitude of poverty in the regionis staggering. According to the most common inter-national definition of poverty—those who live on lessthan a dollar a day income measured in purchasing-power-parity dollars—about 900 million people were
poor in 1998. That is about twice as many poor peopleas in the rest of the developing world combined. Us-ing a more generous poverty threshold of two dollarsa day, almost two billion people—the majority of Asia’spopulation—are poor.
Asia’s social challenge cannot—and shouldnot—be defined by dollar income alone. A broaddefinition of the quality of human life must include

ASIAN DEVELOPMENT OUTLOOK 2000178
other aspects of human deprivation: illiteracy, mal-nutrition, bad health, poor access to water andsanitation, vulnerability to economic shocks, and lackof political freedom. In all these dimensions, there ismuch to be accomplished. In South Asia, for instance,50 percent or more of the population is illiterate. Incountries such as Cambodia or Viet Nam, fewer thanhalf of all households have access to safe drinkingwater. Throughout Asia, 2.7 million people die fromdiseases related to air pollution every year.
These depressing figures mask a more complexpicture. Parts of Asia have managed spectacularimprovements in quality of life over the past fourdecades. Since the 1960s, many countries in the regionhave undergone a dramatic economic and social trans-formation, lifting hundreds of millions of people outof poverty. Some economies, particularly the newlyindustrialized economies (NIEs)—Hong Kong, China;Republic of Korea (henceforth referred to as Korea);Singapore, and Taipei,China—telescoped into fourdecades the process of social and economic develop-ment that took the advanced economies of WesternEurope three centuries to achieve. Abject poverty wasvirtually eradicated. Some Southeast Asian economiesalso made impressive strides: in Malaysia andIndonesia, for instance, the incidence of dollar-a-daypoverty during 1975-1995 underwent dramaticreductions.
Unfortunately, not all parts of Asia shared thisprogress. South Asia, in particular, lagged behind. Forinstance, the infant mortality rate in South Asia is77—meaning that 77 babies of every 1,000 die beforetheir first birthday—and is much higher than thedeveloping country average of 58. There are also largedifferences in progress between ethnic groups andgenders and between rural and urban areas. In general,women have fared worse than men; minority ethnicgroups have fared worse than majority groups; ruralareas have fared worse than urban areas.
More worrying, there are signs that progress inreducing poverty has stalled in recent years, and insome cases has even reversed. In the Central Asianrepublics, the collapse of the communist system pre-saged a massive economic decline, a widespread im-plosion of the social protection system, and a rise inpoverty. The financial crises of 1997-1998 were a costlysetback for the worst-affected countries in East and
Southeast Asia. Although financial collapse did notcause poverty rates to soar, as many had feared, povertydid increase, while improvements in health, educa-tion, and nutrition stalled. Even in countries not hitby crisis—particularly the People’s Republic of China(PRC)—their spectacular progress in povertyreduction has apparently now faltered. Because of allthese factors combined, there are more people livingin poverty today in Asia than there were in themid-1990s.
Addressing this challenge is the main task facingAsia, but there are reasons for optimism. Policymakersnow have a better understanding of poverty and moreknowledge about which anti-poverty policies work.Democratic institutions are on the rise, giving the poora greater voice in the political process. Greaterparticipation by the poor, together with broad socialpressures for better governance, makes it more difficultfor governments to remain inattentive. Meanwhile,global markets continue to offer new opportunities,and as Asian countries continue the process of liber-alization—both internally and externally—theseopportunities become easier to grasp.
The financial crises have shown the region’svulnerabilities, however, as well as the inadequacy ofits domestic social protection policies. Meanwhile,ever-less official money is available for developmentassistance. Addressing the region’s social challenge willdemand creating the right policies and tools to graspthe new opportunities, while ensuring that no segmentof the society gets left behind. This chapter willdescribe Asia’s social challenge, explain the reasons itexists, and then examine policies that can be used toconfront that challenge.
DIMENSIONS OF THE SOCIAL CHALLENGEDIMENSIONS OF THE SOCIAL CHALLENGEDIMENSIONS OF THE SOCIAL CHALLENGEDIMENSIONS OF THE SOCIAL CHALLENGEDIMENSIONS OF THE SOCIAL CHALLENGE
The most obvious manifestation of Asia’s socialchallenge is the number of poor people in the region.The challenge goes far beyond poverty, however.Human deprivation can mean poor health, poornutrition, and poor education. It can mean living in adegraded environment, or having few civil libertiesand little opportunity for political participation.
These dimensions do not always move intandem. Consider, for instance, Indonesia and thePhilippines. These countries have similar income

179THE SOCIAL CHALLENGE IN ASIA
levels, but the incidence of poverty in the Philippinesis many times higher than it is in Indonesia.Nonetheless, several measures of social well-being,such as the prevalence of malnutrition in childrenunder 5, life expectancy, and adult literacy, suggestthat the poor in the Philippines are less deprived thanthe poor in Indonesia.
Often, however, deprivations reinforce eachother. Poor nutritional and health indicators, forinstance, make it much more difficult for the poor toearn income. Lack of political and social empower-ment renders it unlikely that the poor can influencegovernment allocations of resources for social services,and they allow the nonpoor to more easily capturethe benefits of government-directed anti-povertyprograms. Thus, the cumulative effect of deprivationadds up to a much worse quality of life than apparentwhen considering the various dimensions one by one.The social challenge is most acute in countries, orregions within countries, where such a confluence ofnegative factors occurs. In such cases, in South Asia,for example, making and sustaining progress ineliminating poverty is extremely difficult.
PovertyPovertyPovertyPovertyPoverty
The term poverty has many different uses (see box3.1). A narrow definition is the lack of access to thebasic goods and services that constitute a minimallyacceptable standard of living. What constitutes aminimally acceptable standard of living is, of course,not fixed, but varies across countries and even overtime. In extremely poor countries, poverty might bedefined as the lack of access to a subsistence quantityof a staple food product, such as rice. In richercountries, poverty typically is defined as access tohigher minimum quantities of a broader set of basicgoods and services.
According to the dollar-a-day criterion, theoverwhelming majority of Asia’s poor live in SouthAsia. It is striking that while the recent financial andeconomic crisis in East and Southeast Asia may haveadded around 10 million more people to the ranks ofthose living below a dollar-a-day income between 1996and 1998, the number of dollar-a-day poor in SouthAsia increased by 17 million over the same period(World Bank 1999b).
The reduction of poverty has been relatively slowin South Asia. India—which accounts for the majorityof poor in South Asia—made no visible progress inreducing poverty from 1950 to 1975. As table 3.1shows, more than half of all Indians lived below itsnational poverty line in the early 1970s. Since then,however, progress has been made. By the early 1990s,about one in three Indians lived below the nationalpoverty line, although on a dollar-a-day basis almosthalf of all Indians were still poor in 1994. Poverty isalso pervasive in Bangladesh and Nepal. In bothcountries, the incidence of poverty based on thenational poverty lines is even higher than in India.Unfortunately, while the share of people who live onless than a dollar a day has fallen in South Asia inrecent years (from 44 to 40 percent from 1990-1998),throughout the 1990s the number of poor has contin-ued to expand along with the growth of the popula-tion. In 1998, there were 522 million poor people inSouth Asia, almost 30 million more than in 1990(World Bank 1999b).
The PRC has a much lower incidence of povertythan South Asia. In 1998, 213 million people—17 percent of the population—lived on less than adollar a day (World Bank 1999b). While the latest stud-ies reveal that poverty reduction has slowed in thelast few years, the PRC’s record of reducing povertyover the last 20 years has been nothing short ofremarkable. Poverty rates fell sharply after liberalizingreforms began in 1978. While 28 percent of thepopulation in 1978 faced income poverty based on thenational poverty line, this had shrunk to only9 percent by 1998.
Other Asian economies making the transitionfrom central planning have not fared nearly as well.In Mongolia, recent estimates suggest that almost2 million people, 80 percent of the population, livebelow the dollar-a-day poverty line. In the CentralAsian republics and other Asian transition economies,poverty rates are lower—but still significant. Fortu-nately, the most recent estimates suggest that povertyrates are falling in some cases. Measured in terms ofthe national poverty line, the incidence of poverty inViet Nam has fallen from 58 percent in 1993 to37 percent in 1998 (World Bank 1999b).
Thailand’s performance has been more mixedbut still impressive. Poverty declined rapidly in the

ASIAN DEVELOPMENT OUTLOOK 2000180
1970s, but then rose sharply in the first half of the1980s. By the mid-1980s, the incidence of dollar-a-day poverty was higher than a decade earlier.Fortunately, the downward trend in poverty incidenceresumed after the mid-1980s and continued until the
recent financial crisis. Estimates suggest that beforethe crisis, less than 2 percent of the Thai populationlived below the dollar-a-day measure. By contrast,poverty has been more persistent in the Philippines.While dollar-a-day incidence rates came down about
The poverty line is the minimumconsumption level required toachieve the minimum acceptablestandard of living within a society.This standard may be defined inabsolute or relative terms. Theabsolute poverty line is oftendefined as the threshold that allowsminimum calorie requirements plusa small allowance for nonfood items.A relative poverty line is definedas a function of various incomedistribution parameters such as themean or median. For example, arelative poverty line could bedefined as 50 percent of the meanincome. When consumption fallsbelow this threshold, the person isconsidered poor.
Because minimum acceptableconsumption levels vary acrosscountries and over time, povertylines also tend to vary acrosscountries and over time. However,differences in the definitions andmethodologies used for computingpoverty lines tend to vary far morebetween countries than within thesame country over time, especiallywhen the time periods are not too farapart. Thus, it is much easier toassess the changes in poverty in acountry over time, than to usenational methodologies forinternational comparisons of poverty.
The dollar-a-day poverty line is theconsumption level of one dollar perday, based on 1985/1993 dollars andadjusted for purchasing power parity.This threshold stands as aninternationally accepted minimumlevel of private consumption and
seeks to provide a more meaningfulcomparison of poverty acrosscountries.
Poverty incidence is the proportion ofa country’s population with incomeor consumption expenditure belowthe poverty threshold. The measuremay be based on either the nationalpoverty line or the dollar-a-daypoverty line. Poverty incidence is alsoreferred to as the headcount index.
The depth of poverty or the incomegap ratio is the average amount bywhich per capita income or theexpenditure of poor people falls shortof the poverty line, expressed as aproportion of the poverty line.
The intensity of poverty or thepoverty gap ratio is the income gapratio multiplied by the headcountindex. This is equivalent to theaverage amount by which per capitaincome or the consumptionexpenditure of the entire populationfalls short of the poverty line,expressed as a proportion of thepoverty line.
The transient poor are those whoare poor for a short time, usuallybecause of economic distortions ormarket imperfections. Thosesuffering temporary incomeshortfalls could include farmerswhose crops suffered from droughtand who had no crop insurance,students in financial trouble becauseof an imperfectly functioning capitalmarket, and displaced workers whohave no unemployment insurance.
The permanent or chronically poorare those who are poor for a long timebecause they have few assets or skills.The chronically poor earn inadequateincomes even in the best ofcircumstances with no marketdistortions.
The Lorenz curve is a curve thatrepresents the cumulative proportionof income that accrues to eachcumulative proportion of thepopulation, beginning with the lowestincome group. If there were perfectincome equality, the Lorenz curvewould be a 45-degree line.
An income quintile is one fifth of thepopulation, ranked according tolevels of per capita income. Thequintile income ratio compares theincome earned by the top 20 percentof the population with that of thelowest 20 percent, and is a commonlyused measure of inequality. Quintilesare also used in poverty profiles toexamine how characteristics such aseducation may vary between therichest 20 percent and the poorest20 percent of the population.
The Gini coefficient is a commonlyused measure of inequality of income(or consumption expenditure). TheGini coefficient is the area betweenthe Lorenz curve and the 45-degreeline, expressed as a percentage of thearea under the 45-degree line. Withperfect equality, the Gini ratio wouldequal zero; with perfect inequality, itwould equal one. In most countries,Gini coefficients range from a low of0.3 to a high of 0.7.
Box 3.1 Lexicon of Poverty

181THE SOCIAL CHALLENGE IN ASIA
8 percentage points from 1985-1995, the number ofpoor remained roughly constant at around 18 millionbecause of high rates of population growth.
The lowest rates of poverty in developing Asiaare in the economically dynamic economies of Eastand Southeast Asia, especially the NIEs. In the last 40years, poverty—measured by the dollar-a-daycriterion—has been virtually eliminated in HongKong, China; Korea; Singapore; and Taipei,China.Southeast Asian economies have not totallyeliminated poverty, but—at least until the onset of
the region’s financial crisis—had made impressiveprogress. In Malaysia, the incidence of dollar-a-daypoverty fell from 17.4 percent in 1975 to around4 percent in 1995. Indonesia’s record was even moreimpressive, with the incidence of poverty based onthe national poverty line dropping from 40 to 11 per-cent between the mid-1970s and mid-1990s.
Unfortunately, these dramatic improvementshave been stymied by Asia’s recent financial crisis. Itis clear that the collapsing currencies and dramaticrecessions had substantial adverse effects on poverty
TTTTTable 3.1able 3.1able 3.1able 3.1able 3.1 Incidence of Poverty Measured by Surveys,Incidence of Poverty Measured by Surveys,Incidence of Poverty Measured by Surveys,Incidence of Poverty Measured by Surveys,Incidence of Poverty Measured by Surveys,Selected Asian Developing Economies, Selected YSelected Asian Developing Economies, Selected YSelected Asian Developing Economies, Selected YSelected Asian Developing Economies, Selected YSelected Asian Developing Economies, Selected Yearsearsearsearsears
(percent)
Headcount Headcountindex index Headcount
Survey (national Survey (national Survey indexSubregion and country year poverty line) year poverty line) year ($1-a-day)
Newly industrialized economiesKorea, Rep. of 1970 23 1984 5 1998 <1
PRC and MongoliaPRC 1978 28 1998 9 1998 17Mongolia 1991 15 1996 36 1997 80
Central Asian republicsKazakhstan — — 1996 35 1993 <2Kyrgyz Republic — — 1993 40 1993 19
Southeast AsiaIndonesia 1976 40 1996 11 1996 8Malaysia 1970 49 1992 16 1995 4Philippines 1971 52 1997 38 1994 27Thailand 1975 32 1992 13 1992 <2Viet Nam 1993 58 1998 37 — —
South AsiaBangladesh 1973 73 1996 36 — —India 1972 52 1994 35 1994 47Nepal 1979 61 1996 42 1995 50Pakistan 1975 43 1992 28 1991 12Sri Lanka 1983 22 1997 21 1994 4
— Not available.
Note: Some years in the earliest survey may refer to midpoint of period covered. Data for $1-a-day poverty are estimated based on most recentsurveys.
Sources: ADB data; World Bank (1999c).

ASIAN DEVELOPMENT OUTLOOK 2000182
in the crisis-affected countries. Economic crises hurtthe poor through various ways. Most obviously, thecontraction in economic activity means that peoplelose their jobs and household income falls. While theloss of earning opportunities may be uniform acrossdifferent income groups, given their precariousfinancial situation, the poor are more vulnerable.Rapid inflation, often the result of a large devaluation,squeezes the purchasing power of earnings. Relativeprice shifts can severely hurt the poor. Cuts ingovernment spending, because of fiscal austerityprograms, can adversely affect health and educationservices used by the poor.
Some facts are clear from Asia’s experience.When the crisis hit, the main adjustment in the labormarket was a reduction in earnings rather than a risein open unemployment. Nevertheless, joblessness didrise—from 2.6 percent in 1997 to 6.8 percent in 1998in Korea, for example. Workers in some sectors, suchas construction, were particularly affected. There wasalso a big shift from formal to informal employment,particularly as young adults were drafted into familyenterprises. In some countries, high inflation hit thepoor hard. In Indonesia, for instance, consumer pricesjumped nearly 60 percent in 1998, compared with6.6 percent in the previous year.
It is too soon to gauge exactly the overall impacton poverty. Standard poverty measures are a usefulguide to changes in poverty rates over the mediumand long term, but they are less useful in the shortterm, particularly during an economic crisis, for severalreasons. First, the surveys on which poverty estimatesare based are usually conducted at two- to three-yearintervals. Typically, there is a lag of six months to ayear or more between the end of data collection (whichitself often takes a year to complete) and the time newpoverty estimates become available. Second, povertyestimates are very sensitive to the accuracy of themeasured price increases. At a time of rapid inflation,as in Indonesia during the recent crisis, mis-estima-tion is a risk. This is particularly a problem in ruralareas, as consumer price data are collected mainly inurban areas. Third, when large changes in relativeprices also occur, such as after a big devaluation, peoplechange the composition of their consumption. Thebasket of goods assumed under the old poverty linemay no longer be an accurate reflection of people’s
minimal consumption, even if it is correctly updatedfor inflation (Frankenberg, Thomas, and Beegle 1999).
Despite all these caveats, the available numbersdo suggest that poverty increased in those countriesthat were the worst affected by the recent regionaleconomic crisis (see figure 3.1). However, the increaseshave not been as high as some initially expected. Forexample, in Indonesia, a forecast prepared by theInternational Labour Organization in 1998 predictedthat poverty incidence would rise to 48 percent by theend of 1998 from a precrisis level of 11 percent (ILO1998). A study published by the Indonesian CentralBureau of Statistics also forecast that poverty ratesbased on the national poverty line would reach about40 percent by mid-1998. Fortunately, the most reli-able information available suggests that these dire fore-casts have proved inaccurate. Poverty incidence basedon the national poverty line increased from11.3 percent in February 1996 to 16.7 percent inDecember 1998 (World Bank 1999b). The latestinformation suggests that in some parts of Indonesia,particularly where a large segment of the populationis involved in producing cash crops for exports, house-hold incomes increased rapidly in nominal terms in1998 (Booth 1999).
Social IndicatorsSocial IndicatorsSocial IndicatorsSocial IndicatorsSocial Indicators
Standard measures of poverty provide informationabout the material resources available to households,but these are only partial measures of well-being. Theydo not provide information on critical aspects such asliteracy and education, health and nutrition, and thequality of the environment in which people live. Asdiscussed earlier, for a given level of income, theperformance of countries on these broader indicatorscan vary substantially. Some countries are under-achievers and others are overachievers in terms ofsocial indicators. For a fuller picture of the quality oflife, it is therefore important that social indicators beconsidered in juxtaposition with the income measuresof poverty.
Literacy and Education. Literacy is usually defined asthe ability to read and write a simple message. Typically,this is achieved by completing four or five years ofprimary school. Adult literacy is universal (or nearly

183THE SOCIAL CHALLENGE IN ASIA
so) in all Central Asian countries and also in Korea,Philippines, Thailand, and Viet Nam. In contrast, theadult literacy rate is around 50 percent in India andlower for the other countries in South Asia (excep-tion for Sri Lanka). It is also low in Cambodia and theLao People’s Democratic Republic (Lao PDR).Mongolia, Sri Lanka, and Viet Nam have relativelyhigh literacy rates, however, and given their low percapita incomes, these are notable achievements.
Raising adult literacy (for ages 15 and up) is aslow process without broad adult literacy programs,which few Asian countries have. Even a sharp andsustained increase in primary school enrollment rateswill affect adult literacy rates only after a lag ofseveral years, when those newly enrolled childrenreach age 15.
Nevertheless, it is encouraging that primaryenrollment rates have increased dramatically evenamong those Asian countries with low rates of adult
literacy, such as Bangladesh, India, Lao PDR, andNepal. Because of the expansion of primary school-ing, the dispersion of enrollment rates among Asianeconomies is much less today than it was a few decadesago (see table 3.2). It is also less than the dispersion inadult literacy rates.
Unfortunately, raising enrollment rates is not apanacea for low literacy levels. Higher enrollment ratesreflect neither the ability of schools to retain studentslong enough to achieve literacy nor the quality ofinstruction received. In Bangladesh, Nepal, andPakistan, for example, only about half of all primaryschool entrants reach grade 5, while Nepal’s primaryschool enrollment ratio is above 100 percent becauselarge numbers of students repeat the early grades. Bycomparison, about 90 percent of primary schoolentrants in Indonesia and the PRC reach grade 5. Theavailable information also suggests that the resourcesinvested per student in primary schools are lower in

ASIAN DEVELOPMENT OUTLOOK 2000184
South Asian schools than elsewhere in Asia(Deolalikar and others 1997). The primary schoolpupil-teacher ratio was 59 in South Asia in 1992, forexample, compared to 23 in Southeast Asia (ADB1997). While the relationship between pupil-teacherratios and the quality of education is not a watertight
one, extremely high ratios such as in South Asia usuallyindicate a low quality of primary education.
The cross-country variation in enrollment ratesis greater at higher levels of education. WhileBangladesh had a gross secondary enrollment rate of19 percent in 1996, for example, Korea’s enrollment
TTTTTable 3.2able 3.2able 3.2able 3.2able 3.2 Literacy and Enrollment Rates,Literacy and Enrollment Rates,Literacy and Enrollment Rates,Literacy and Enrollment Rates,Literacy and Enrollment Rates,Selected Asian Developing Economies, Selected YSelected Asian Developing Economies, Selected YSelected Asian Developing Economies, Selected YSelected Asian Developing Economies, Selected YSelected Asian Developing Economies, Selected Yearsearsearsearsears
(percent)
Gross enrollment rateAdult literacy
rate Primary Secondary Tertiary
Subregion and country 1980 1995 1970 1996 1970 1996 1970 1996
Newly industrialized economiesKorea, Rep. of 94 98 103 94 42 102 7 60
PRC and MongoliaPRC 66 82 91 120 24 71 0 6Mongolia 72 83 110 89 83 56 6 17
Central Asian republicsKazakhstan — 100 85 98 93 87 34 32Kyrgyz Republic — 97 116 104 110 79 16 12Tajikistan 41 100 — 95 — 78 24 20Uzbekistan — 100 81 78 106 94 29 36
Southeast AsiaCambodia — 65 30 109 8 28 2 1Indonesia 67 84 80 115 16 52 3 11Lao PDR 42 57 57 111 4 29 0 3Malaysia 70 84 89 91 34 62 2 11Myanmar 77 83 88 100 21 35 2 6Philippines 90 95 108 118 46 79 17 35Thailand 88 94 81 88 17 57 3 21Viet Nam 83 94 — — — — — —
South AsiaBangladesh 30 38 54 84 20 19 2 6India 41 52 78 101 24 49 5 7Nepal 19 28 26 105 10 37 2 5Pakistan 27 38 36 81 13 30 2 4Sri Lanka 85 90 99 109 47 75 1 5
— Not available.
Notes: Adult literacy rate is the proportion of the population aged 15 years and above who can, with comprehension, read or write, or read andwrite a simple message. Gross enrollment rate is the ratio of total enrollment, regardless of age, to the population of the age group that officiallycorresponds to the level of education shown.
Sources: UNESCO (1999); World Bank (1999c).

185THE SOCIAL CHALLENGE IN ASIA
rate exceeded 100 percent. Surprisingly, many of therelatively high-income Southeast Asian economieswith high rates of adult literacy and enrollment inprimary education do not have particularly high ratesof secondary school enrollment.
So far, there is little evidence that the region’seconomic and financial crisis has dramaticallyworsened access to education, although it may haveaffected its quality. Primary school enrollments havenot fallen, but evidence indicates that secondaryschool attendance has suffered, particularly amonggirls from poor families. Interestingly, in several crisis-affected countries, the crisis has led to higher enroll-ment at tertiary levels of education. This reflectsseveral factors, particularly the reduction in employ-ment opportunities for young people.
Health and Nutrition. Standards of health and nutri-tion in Asia have improved substantially over the pastfour decades. A child born in East and Southeast Asiatoday can expect to live to about 70, almost 45 per-cent longer than a child born in 1960. In South Asia,life expectancy has risen from 44 in 1960 to 62 today.This is comparable with life expectancy in the MiddleEast and North Africa, and is substantially higher thanin Sub-Saharan Africa. In Asia, overall life expectancyhas risen to an average of 65 years in 1997.
One of the biggest influences on raising lifeexpectancy has been a sharp drop in infant mortalityrates. In industrialized countries of the Organisationfor Economic Co-operation and Development(OECD), the infant mortality rates are around 6, thatis, six infants of every 1,000 die before their first birth-day. In Hong Kong, China; Korea; and Singapore,infant mortality rates are similar to those in industrialcountries, while in South Asia the infant mortalityrate is 77.
These variations reflect differences in nutritionand access to health care, safe water, and sanitation.Standards in all these areas have improved significantlyover the past four decades, but in South Asia especially,they remain low compared with the rest of the devel-oping world. Overall calorie consumption per personin South Asia is marginally higher than in Sub-Saharan Africa, but child nutrition is much worse. In1990, approximately six of ten children in South Asiahad stunted growth from malnutrition, compared with
four in ten children in Sub-Saharan Africa. One inthree babies in South Asia is born underweight,compared with one in six in Sub-Saharan Africa.In contrast, the incidence of child malnutritionin East and Southeast Asia is almost the lowestin the developing world, and is lower only in LatinAmerica.
Throughout Asia, official measures of access tohealth care, safe water, and sanitation often are over-estimated, and must be interpreted with caution. Ingeneral, however, access to all these services is fargreater in East and Southeast Asia than in South Asia.On average, more than 90 percent of the populationin East and Southeast Asia have access to health care,while national data for South Asia suggest that itscorresponding figure is about 75 percent.
Lack of safe water and sanitation is one of thebiggest causes of disease in the developing world, andAsia is no exception. In South Asia and some of thetransition economies, access to safe water andsanitation is particularly lacking. In countries such asCambodia, Papua New Guinea, and Viet Nam, lessthan half of households have access to safe water.Official national estimates from South Asia suggestthat about 81 percent of people have access to safewater. Given the region’s enormous water pollutionproblems, however, these access rates are almostcertainly overestimated. Access to sanitation facilitiesis also low: in Cambodia, India, Nepal, Papua NewGuinea, and Uzbekistan, less than 30 percent ofhouseholds have access to sanitation facilities.
Little concrete evidence exists to prove that therecent financial crisis harmed the health and nutritionof people in the crisis-affected countries. Nonethe-less, it is highly likely that the poorest and mostvulnerable segments suffered some degree of mal-nutrition. Focus group studies conducted by the AsianDevelopment Bank (ADB) in some of the crisis-affected countries indicated that children from lowerincome groups were arriving at school without break-fast or lunch (ADB 1999n).
Similarly, there is little evidence to suggest thatthe crisis significantly worsened the general healthlevel in the affected countries. However, there isevidence that many people shifted from higher-cost,higher-quality private medical services to cheaper,lower-quality public services. This created a “double
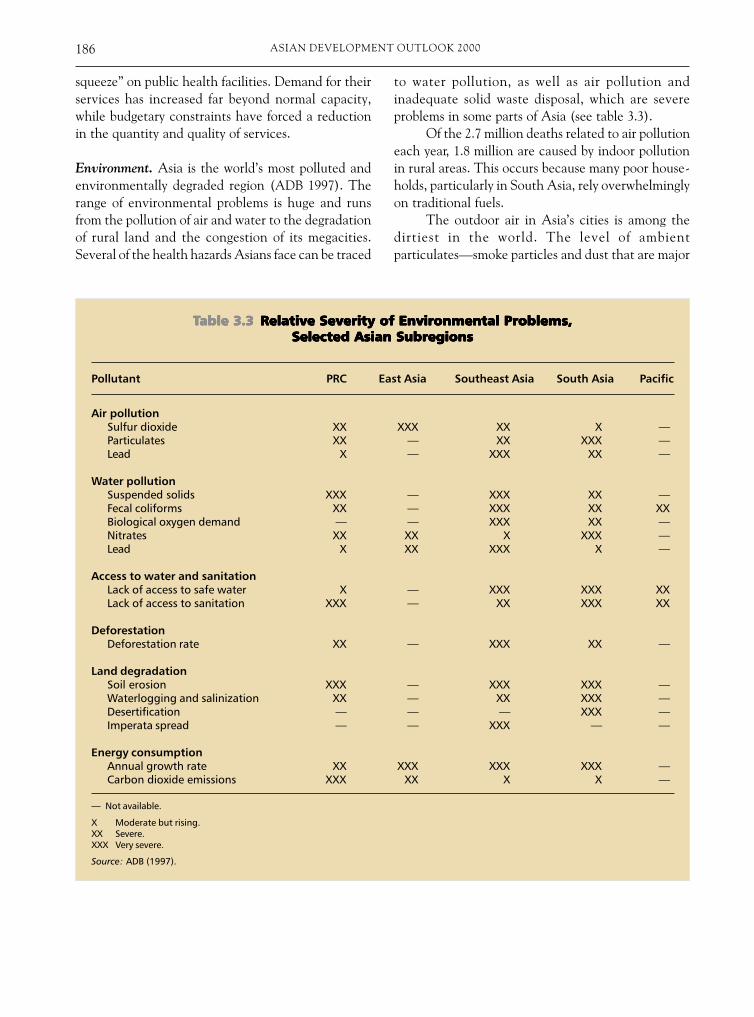
ASIAN DEVELOPMENT OUTLOOK 2000186
squeeze” on public health facilities. Demand for theirservices has increased far beyond normal capacity,while budgetary constraints have forced a reductionin the quantity and quality of services.
Environment. Asia is the world’s most polluted andenvironmentally degraded region (ADB 1997). Therange of environmental problems is huge and runsfrom the pollution of air and water to the degradationof rural land and the congestion of its megacities.Several of the health hazards Asians face can be traced
to water pollution, as well as air pollution andinadequate solid waste disposal, which are severeproblems in some parts of Asia (see table 3.3).
Of the 2.7 million deaths related to air pollutioneach year, 1.8 million are caused by indoor pollutionin rural areas. This occurs because many poor house-holds, particularly in South Asia, rely overwhelminglyon traditional fuels.
The outdoor air in Asia’s cities is among thedirtiest in the world. The level of ambientparticulates—smoke particles and dust that are major
TTTTTable 3.3able 3.3able 3.3able 3.3able 3.3 Relative Severity of Environmental Problems,Relative Severity of Environmental Problems,Relative Severity of Environmental Problems,Relative Severity of Environmental Problems,Relative Severity of Environmental Problems,Selected Asian SubregionsSelected Asian SubregionsSelected Asian SubregionsSelected Asian SubregionsSelected Asian Subregions
Pollutant PRC East Asia Southeast Asia South Asia Pacific
Air pollutionSulfur dioxide XX XXX XX X —Particulates XX — XX XXX —Lead X — XXX XX —
Water pollutionSuspended solids XXX — XXX XX —Fecal coliforms XX — XXX XX XXBiological oxygen demand — — XXX XX —Nitrates XX XX X XXX —Lead X XX XXX X —
Access to water and sanitationLack of access to safe water X — XXX XXX XXLack of access to sanitation XXX — XX XXX XX
DeforestationDeforestation rate XX — XXX XX —
Land degradationSoil erosion XXX — XXX XXX —Waterlogging and salinization XX — XX XXX —Desertification — — — XXX —Imperata spread — — XXX — —
Energy consumptionAnnual growth rate XX XXX XXX XXX —Carbon dioxide emissions XXX XX X X —
— Not available.
X Moderate but rising.XX Severe.XXX Very severe.
Source: ADB (1997).

187THE SOCIAL CHALLENGE IN ASIA
causes of respiratory diseases—is generally twicethe world average, and more than five times ashigh as in industrial countries and Latin America(ADB 1997).
By virtually every measure, Asia’s rivers are farmore polluted than those in the rest of the world. Morethan 90 percent of the wastewater in Asia is dischargeddirectly into streams, open drains, rivers, lakes, andcoastal waters without treatment. Asia’s rivers typicallyhave four times the world average of suspended solids(the amount of waste suspended in the water) and 20times the level prevalent in OECD countries (ADB1997). The levels of suspended solids in Asia’s rivershave quadrupled since the late 1970s, while they haveremained unchanged or improved in the rest of theworld (ADB 1997). Asia’s natural resources are alsodeclining rapidly. During the past four decades, Asiahas lost half of its forest cover and half its fish stock.Deforestation, which is particularly acute in South-east Asia but also a serious problem in South Asiaand the PRC, is partly responsible for increaseddesertification, soil erosion, flooding, and loss ofbiodiversity.
While it is difficult for anyone to fully escapepollution and environmental degradation, variousfactors suggest that the poor face the brunt of theseproblems. The poor tend to live in areas that are moreprone to environment-related natural disasters, suchas flooding and landslides. They are more likely tolive near heavily polluting factories, dumps, andhazardous waste sites. Malnutrition and poor healthmake them more susceptible to infectious diseases.Lower incomes, less education, and less access tohealth care mean that they are less able to recoveronce ill, and hence environmental degradationreinforces poverty.
Internal DisparitiesInternal DisparitiesInternal DisparitiesInternal DisparitiesInternal Disparities
National indicators of social and economic well-being mask large disparities among groups withinparticular countries. The most obvious disparities arethose between rich and poor, but disparities occuralong other lines, even between members of the samehousehold. Gender, ethnicity, religion, caste, andregional differences can all cause divergences in socialand economic well-being.
Income and Wealth Disparities. In general, incomeinequality is lower in Asia than in other parts of thedeveloping world. For example, Gini indexes—thestandard measure of overall income inequality (referback to box 3.1)—of 0.5 or more are common in LatinAmerica and a few African countries such as SouthAfrica and Kenya. In contrast, the Gini indexes fordeveloping countries in Asia generally fall in the rangeof 0.3-0.4 and have been fairly stable over time (seetable 3.4).
Some notable exceptions exist. In Thailand, forinstance, the Gini index reached 0.52 in the early1990s. While data from the transition economies aregenerally scanty, some studies suggest that incomeinequality has risen sharply in countries of the formerSoviet Union. In the Kyrgyz Republic, for instance,the Gini index rose from about 0.26 in the 1980s to0.55 in the 1990s (Kanbur and Lustig 1999).
Despite relatively low income inequality indeveloping Asia, the inequalities that do exist aretroubling because they tend to be closely associatedwith disparities in other social dimensions, includingthose related to accumulating human capital.Education differentials, for example, are quite closelyrelated to differentials in income, particularly in SouthAsia (see table 3.5).
In South Asia, more than 60 percent of thepoorest one third of children aged 15-19 do notcomplete grade 5, compared to about 20 percent inIndonesia and the Philippines (Filmer and Pritchett1999). In India, where 38 percent of all children donot complete grade 5, the poorest third of the childrenaccount for 61 percent of the shortfall, while the richestthird accounts for only 4 percent. In the Philippines,where only 13 percent of children fail to completegrade 5, the poorest third account for 72 percent ofthe children who drop out.
Equally pronounced disparities exist betweenrich and poor Asians regarding such social indicatorsas mortality rates, nutritional status, and access to safewater and sanitation. In Indonesia, for example, childmortality rates among the poorest 20 percent of thepopulation are 3.8 times higher than the childmortality rates among the richest 20 percent. Also,48 percent of Indonesian households from the poorestfifth of the population use river, canal, or surface waterfor drinking, compared to only 1 percent of the richest

ASIAN DEVELOPMENT OUTLOOK 2000188
fifth. More than seven of every ten people in thepoorest fifth of the population use a bush or field as alatrine, compared to only 2 percent among the richestfifth.
Gender Disparities. Gender disparities are among thesharpest internal social disparities in many Asiancountries (see table 3.6). In East and Southeast Asiancountries, females for the most part fared better thanmales in terms of social indicators. Women are alsobetter off in Central Asia, although recent develop-ments—including increased women’s unemploymentrates and reduced access to health care—suggest thatwomen’s status is worsening in Central Asia. Incontrast, with the exception of Sri Lanka, women aregenerally worse off than men in South Asian countries.
The level of gender disparity in health and educationis greater in South Asia than in any other region inthe world (Filmer, King, and Pritchett 1998).
The indicators in table 3.6 point clearly to genderdisparity in a number of countries. For example,mortality rates of children less than age 5 are normallylower among girls (for biological reasons). However,mortality of children less than age 5 is substantiallyhigher among girls in South Asian countries, as wellas in the PRC. Similarly, malnutrition is normally loweramong girls under 5, but in South Asia it is eitherhigher or the same as that of boys.
In South Asia (with the exception of Sri Lanka),school enrollment is substantially lower for girls thanboys, and the disparity becomes even more marked atthe secondary level. These disparities reflect gender
TTTTTable 3.4able 3.4able 3.4able 3.4able 3.4 Income or Consumption InequalityIncome or Consumption InequalityIncome or Consumption InequalityIncome or Consumption InequalityIncome or Consumption Inequality,,,,,Selected Asian Developing Economies,Selected Asian Developing Economies,Selected Asian Developing Economies,Selected Asian Developing Economies,Selected Asian Developing Economies,
Early 1970s, 1980s, and 1990sEarly 1970s, 1980s, and 1990sEarly 1970s, 1980s, and 1990sEarly 1970s, 1980s, and 1990sEarly 1970s, 1980s, and 1990s
Gini coefficient Ratio of H20/L20
Subregion and country 1970s 1980s 1990s 1970s 1980s 1990s
Newly industrialized economiesHong Kong, China 0.41 0.37 0.45 9.0 7.5 10.1Korea, Rep. of 0.33 0.39 0.34 5.7 8.9 5.7Singapore 0.41 0.41 0.39 — 7.1 —Taipei,China 0.28 0.28 0.31 4.2 4.2 5.4
PRC — 0.32 0.38 — 4.6 6.9
Southeast AsiaIndonesia 0.31 0.36 0.32 — 5.8 4.7Malaysia 0.50 0.51 0.48 14.1 15.1 11.7Philippines 0.49 0.46 0.45 15.0 10.0 —Thailand 0.43 0.43 0.52 9.8 11.9 15.8
South AsiaBangladesh 0.36 0.39 0.28 6.3 6.8 4.1India 0.30 0.31 0.30 4.5 4.7 4.3Pakistan 0.30 0.32 0.31 4.3 4.8 4.7Sri Lanka 0.38 0.42 0.30 6.5 4.7 4.4
— Not available.
Note: The Gini coefficient is based on either income or consumption expenditure, depending on the approach used in each country. The H20is the share of income of the top 20 percent of the population, and L20 is the share of income of the bottom 20 percent.
Source: Data derived from Deininger and Squire (1996).

189THE SOCIAL CHALLENGE IN ASIA
TTTTTable 3.5able 3.5able 3.5able 3.5able 3.5 Comparative Index of Completion of Grade FiveComparative Index of Completion of Grade FiveComparative Index of Completion of Grade FiveComparative Index of Completion of Grade FiveComparative Index of Completion of Grade Fivefor Ages 15-19, by Income Group,for Ages 15-19, by Income Group,for Ages 15-19, by Income Group,for Ages 15-19, by Income Group,for Ages 15-19, by Income Group,
Selected Asian Developing Economies, Selected YSelected Asian Developing Economies, Selected YSelected Asian Developing Economies, Selected YSelected Asian Developing Economies, Selected YSelected Asian Developing Economies, Selected Yearsearsearsearsears
Income groups
Country Year Poorest Middle Richest
Bangladesh 1996 45.2 69.8 100
India 1992 40.3 73.4 100
Indonesia 1994 82.0 95.4 100
Kazakhstan 1995 99.5 99.0 100
Nepal 1996 54.6 55.7 100
Pakistan 1990 29.3 61.3 100
Philippines 1993 81.9 97.5 100
Note: The percentage of 15- to 19-year-olds who completed Grade 5 in the richest income group was used as the base for each country, andassigned a value of 100. Rates of the other income groups are expressed as a proportion of the richest group.
Source: Based on Demographic and Health Surveys (DHS) data in Filmer and Pritchett (1999).
bias at the household level, such as a tendency for girlsto be withdrawn from or skip school to care for sib-lings. They also reflect household responses to genderdiscrimination in labor markets, which lowers privatereturns to investment in schooling of girls.
Gender disparities exist in other areas. Evidenceexists that, particularly in South Asia, girls and womenare discriminated against in the allocation of food andother resources within the household (Alderman andothers 1995; Deaton 1998). Women and girls are alsoexposed to greater environmental hazards within thehousehold, such as facing the brunt of indoor airpollution from the use of traditional fuels. In addition,females are exposed to greater risk from violence,including abortion and infanticide of female children,child marriage, child and adult prostitution, domesticviolence, and abuse of elderly women (especiallywidows). Although the quality of women’s lives hasimproved in some areas—increased education levelsand paid employment have enhanced intrahouseholdpower, while modern technologies have reduced
household burdens—the addition of market work totraditional household responsibilities has significantlyreduced leisure. In addition, longer life expectancy andfewer siblings have increased women’s burden of caringfor the elderly.
Women tend to be discriminated against in labormarkets in Asia, although the extent of such discrimi-nation and the underlying causes are still the subjectof considerable debate. Some formal sector jobs arenot open to women, and the wages women receiveare usually lower. Women also tend to be laid off beforemen in times of economic crisis. For example, duringthe 1997-1998 crisis in Korea, women were laid offmuch more frequently than men. There are alsoreports that heightened vulnerability among femaleemployees led to increased levels of sexual harassment(Moon, Lee, and Yoo 1999). Unfortunately, the effectof the gender disparity in layoffs is not visible ingender-specific unemployment rates because manywomen subsequently withdrew from the labor market(D. Kim 1999).

ASIAN DEVELOPMENT OUTLOOK 2000190
Ethnic, Religious, and Caste Disparities. In someAsian countries, sharp differences still exist in incomelevels and social indicators between ethnic andreligious groups and castes. In India in the mid-1980s,for example, the scheduled castes and tribes made upmore than one third of the rural poor while accounting
for less than one eighth of the rural population. Villagesurveys have found evidence of caste mobility, but thisis mainly among the middle and upper castes. Upwardmobility of low castes is rare. One study in UttarPradesh found, for example, that despite being targetedfor favorable treatment under government programs,
TTTTTable 3.6able 3.6able 3.6able 3.6able 3.6 Gender Disparity Indicators, Selected Asian Developing Gender Disparity Indicators, Selected Asian Developing Gender Disparity Indicators, Selected Asian Developing Gender Disparity Indicators, Selected Asian Developing Gender Disparity Indicators, Selected Asian DevelopingEconomies, Selected YEconomies, Selected YEconomies, Selected YEconomies, Selected YEconomies, Selected Yearsearsearsearsears
(percent)
Female minus male Ratio of female to male
Moderate ProbabilityProbability or severe of dying Secondary Member of
of dying stunting between school nonagriculturalbefore age 5 under age 5 ages 15 to 60 enrollment labor force
Subregion and country 1998 1995 1997 1990-1996 1997
Newly industrialized economiesKorea, Rep. of — — 46 100 67
PRC and MongoliaPRC 11 -1 83 90 62Mongolia 3 1 84 136 96
Central Asian republicsKazakhstan -10 -4 44 101 106Kyrgyz Republic -12 — 47 112 101Tajikistan -15 — 61 90 69Uzbekistan -13 -5 56 88 89
Southeast AsiaCambodia -14 — 87 59 78Indonesia -13 -2 78 85 69Lao PDR -8 -1 85 61 —Malaysia -3 — 61 109 62Myanmar -17 -5 83 103 59Philippines -11 -3 77 102 79Thailand -3 — 56 97 78Viet Nam 3 <1 73 93 81
South AsiaBangladesh 10 1 108 50 36India 15 <1 95 64 32Nepal 14 3 115 51 16Pakistan -4 — 90 52 25Sri Lanka -2 2 64 110 64
— Not available.
Sources: World Bank (1999c); WHO (1999); UNICEF (1999).

191THE SOCIAL CHALLENGE IN ASIA
the relative position of low-caste Jatabs did not change.They still experienced slower per capita incomegrowth, higher and stagnant levels of illiteracy (100percent of females and 88 percent of males in 1993),virtual exclusion from nonagricultural wage employ-ment, and unaltered land endowments (Lanjouw andStern 1998).
The situation for ethnic minorities acrossdeveloping Asia is not much better. In Viet Nam, forexample, 53 different ethnic minorities constituteabout 12 percent of the population. Social indicatorsfor these groups tend to be lower, and sometimesconsiderably lower, than those of the dominant groups.The H’mong, for example, experience an infantmortality rate of 106 and a life expectancy of 52.8 years,while the corresponding figures for the majority Kinhpopulation are 38.5 and 67.7, respectively. The dif-ferential between the H’mong and the Kinhpopulations in educational attainments is similarlysharp. In the PRC, the incidence of poverty is at leasttwice as high among the minorities as in the majorityethnic group.
Regional Disparities. Just as disparities exist betweendifferent groups of people, so they also exist betweendifferent areas within any single country. Thesedifferences are perhaps most stark between rural andurban areas. In most Asian countries, an overwhelmingproportion of the poor live in rural areas. In Indonesia,63 of 100 poor people live in rural areas, while theshare is around 80 per 100 in India and Thailand, andnearly 70 per 100 in the Philippines. Because themajority of the population in these countries live inrural areas, it is not surprising that the incidence ofrural poverty is higher than urban poverty, sometimessharply so (see table 3.7)
Access to education, health care, and water andsanitation is generally worse in rural areas. Indoor airpollution is a much more serious problem in rural areas,where there is less access to electricity and othermodern fuels. As in the case of poverty incidence,disparities in these other social dimensions can varygreatly across different rural settings. In the late 1980sin the PRC, for example, rural female literacy rateswere as low as 11 percent and as high as 75 percent,although annual income per person ranged only fromY400 to Y600 (ADB 1997).
TTTTTable 3.7able 3.7able 3.7able 3.7able 3.7 Rural and Urban Population Rural and Urban Population Rural and Urban Population Rural and Urban Population Rural and Urban Populationbelow Poverty Line, Selected Asianbelow Poverty Line, Selected Asianbelow Poverty Line, Selected Asianbelow Poverty Line, Selected Asianbelow Poverty Line, Selected Asian
Developing Economies, Developing Economies, Developing Economies, Developing Economies, Developing Economies,Selected YSelected YSelected YSelected YSelected Yearsearsearsearsears
SurveySubregion and country year Rural Urban
PRC and MongoliaPRC 1996 7.9 <2Mongolia 1995 33.1 38.5
Central Asian republicsKazakhstan 1996 39.0 30.0Kyrgyz Republic 1993 48.1 28.7
Southeast AsiaCambodia 1997 40.1 21.1Indonesia 1990 14.3 16.8Lao PDR 1993 53.0 24.0Philippines 1997 51.2 22.5Thailand 1992 15.5 10.2Viet Nam 1993 57.2 25.9
South AsiaBangladesh 1995, 1996 39.8 14.3India 1994 36.7 30.5Nepal 1995, 1996 44.0 23.0Pakistan 1991 36.9 28.0Sri Lanka 1990, 1991 38.1 28.4
Note: Multiple survey years refer to several surveys used to derivepoverty incidence.
Source: World Bank (1999c).
Although the rural-urban differentials ineconomic well-being are perhaps the most striking,they are not the only geographic disparities. WithinAsian countries, sharp differences in social outcomescan be seen across regions, provinces, and states. InIndia’s Bihar state, poverty incidence is 50 percenthigher than the national average and more than 12times higher than in the most prosperous state,Himachal Pradesh. In Pakistan, the incidence ofpoverty is higher in Pubjab and Baluchistan than inthe northwest Frontier Province and Sindh.
Access to social services also varies sharply, butthese disparities are often relatively independent ofregional income differentials. In India, one of the

ASIAN DEVELOPMENT OUTLOOK 2000192
poorest states, Kerala, has virtually universal primaryenrollment rates, while several other states, such asBihar, Orissa, Rajasthan, and Uttar Pradesh—not allof which are poorer than Kerala—lag 40-60 percentbehind national averages (ADB 1997).
Regional disparities may reflect differences insoil fertility, rainfall, or irrigation potential, ordevelopment policies biased in favor of industry andagainst agriculture. In other cases, regional dispari-ties reflect the differential impact of rapidly growingtrade opportunities in a global economy. Areas alongthe PRC’s coast, for example, have grown much morerapidly in recent years than interior areas of thecountry. In the five coastal provinces, average an-nual growth rates in real per capita income during1980-1996 were 6.4-9.2 percent in rural areas and 5.5-7.9 percent in urban areas. The corresponding rangein the 11 noncoastal provinces was 3.9-7.3 percent inrural areas and 3.6-6.5 percent in urban areas (Gang,Perkins, and Sabin 1997). Incomes in the richestprovinces are now two to three times higher thanthose in the poorest.
Some regional differences also stem fromprotracted civil disturbances that have hinderedinfrastructure investments and the delivery of socialservices. These include Kashmir in India and Pakistan,Tamil-inhabited areas of Sri Lanka, former KhmerRouge-controlled areas in Cambodia, and Mindanaoin the Philippines. In some cases, these conflict-tornareas benefit from special efforts from the nationalgovernment to improve services, but more often theyare simply excluded from the development effort inthe rest of the country.
EXPLAINING THE SOCIAL CHALLENGEEXPLAINING THE SOCIAL CHALLENGEEXPLAINING THE SOCIAL CHALLENGEEXPLAINING THE SOCIAL CHALLENGEEXPLAINING THE SOCIAL CHALLENGE
The plight of Asia’s poor results from a complicatedinterplay of economic, social, and demographic factors.The lack of economic growth has constricted thedevelopment of market opportunities for the poor. Alack of assets—physical assets, financial assets, humanand social capital—has meant that even when marketsdo exist, the poor are unable to take advantage ofthem. Moreover, the poor are particularly vulnerableto shocks, both economic and environmental. Politicaland social constraints, including poor governance,gender biases, ethnic and caste bias, all reinforce this
negative spiral, making it more difficult for the voiceof the poor to be heard.
Lack of Economic GrowthLack of Economic GrowthLack of Economic GrowthLack of Economic GrowthLack of Economic Growth
International experience indicates that wheneconomic growth rates rise, poverty falls. Conversely,where economic growth has been low or negative,poverty rates have typically been more persistent orhave increased. The major reason is that economicgrowth increases the demand for the one asset thatthe poor have in abundance: their labor. Economicgrowth also increases the availability of public andprivate resources that can be used to improve essentialservices, such as education and health care.
The relationship between economic growth andpoverty reduction can be seen both at the regionallevel and national level. The regions with the fastesteconomic growth in the 1990s—East and SoutheastAsia, including the Pacific, followed by South Asia—are where the largest reductions in the incidence ofpoverty have taken place (see table 3.8). Conversely,where economic growth has been low or declining inthe 1990s, such as Sub-Saharan Africa and thetransition countries of Eastern Europe and CentralAsia, poverty incidence has increased.
Poverty in South Asia remains unacceptablyhigh, largely because of poor prior economicperformance in that region. East and Southeast Asia,including the Pacific, experienced average annual percapita growth rates of 5.4 percent between 1965 and1995, but South Asia’s average annual growth rate wasaround half that.
The same relationship between growth andpoverty reduction is clear at the national level. Figure3.2 shows a linear relationship between povertyreduction and growth rate of GNP per capita, whichwas derived from 40 developing economies for whichdata existed in 1970-1992. The poverty incidence wasmeasured by the headcount index, based onthe national poverty line. The slope of the relation-ship was found to be negative and statistically signifi-cant, with an elasticity that was close to unity. Thismeant that income growth had a powerful impact onpoverty reduction. The scatter plot for Asiandeveloping economies illustrates this point morevividly (see figure 3.2). PRC, Indonesia, Korea, and

193THE SOCIAL CHALLENGE IN ASIA
Malaysia—all economies that experienced rapideconomic growth—were able to reduce the incidenceof poverty dramatically. Conversely, slower growth inNepal and the Philippines meant that povertyreduction was much more limited.
Lack of AssetsLack of AssetsLack of AssetsLack of AssetsLack of Assets
One fundamental distinction between the poor andnonpoor is that the poor own and have access to fewerresources, such as human, physical, financial, andsocial capital. Material well-being, however, dependson assets and the returns to those assets. Some assetssuch as human and physical capital are individuallyowned, while others, such as physical infrastructure,are owned by society. Still others, such as social capital,result from social interactions between people, andcan have significant influence on the returns toindividually owned capital.
Human Capital. Because of generally low literacylevels and poor health and nutritional conditions,the poor lack human capital. Not only does the lack
of human capital cause immediate deprivation, itseverely limits productive capacity, and hence earningspotential.
Raising human capital through investment ineducation can significantly raise earning capacity.Studies suggest that the returns to education canexceed 25 percent for primary education, 15-18 per-cent for secondary education, and 13-16 percent fortertiary education (Psacharopoulos 1985). Part of thesereturns may reflect factors other than productivityimprovements—such as the role of schooling as acredential-creating device or screening mechanism—but it is clear that most of the returns reflect enhancedproductivity. Some recent studies that carefullycontrolled for factors other than productivity foundthat education positively influences the wage levelprimarily through its impact on cognitive achieve-ments (Ashenfelter and Krueger 1994; Alderman andothers 1996).
The returns to education, however, depend onthe context in which they are used. The more dynamicthe environment, the greater the returns. A recentstudy of India found that farmers with a primary
TTTTTable 3.8 able 3.8 able 3.8 able 3.8 able 3.8 Changes in Per Capita GNP and DollarChanges in Per Capita GNP and DollarChanges in Per Capita GNP and DollarChanges in Per Capita GNP and DollarChanges in Per Capita GNP and Dollar-a-Day Poverty Line,-a-Day Poverty Line,-a-Day Poverty Line,-a-Day Poverty Line,-a-Day Poverty Line,Developing Regions, 1990-1996Developing Regions, 1990-1996Developing Regions, 1990-1996Developing Regions, 1990-1996Developing Regions, 1990-1996
(percent)
Average annual Population underchange in $1-a-day poverty line Change
per capita GNP in povertyDeveloping region 1990–1996 1990 1996 1990–1996
East and Southeast Asia (including the Pacific) 7.9 27.6 14.9 12.7
South Asia 3.5 44.0 40.1 3.9
Middle East and North Africa 0.5 9.3 7.8 1.5
Latin America and the Caribbean 2.0 16.8 15.6 1.2
Sub-Saharan Africa -0.6 47.7 48.5 -0.8
Europe and Central Asia -5.1 1.6 5.1 -3.5
Note: Per capita GNP is expressed in constant dollar terms. The reduction in poverty is calculated as the difference in the headcount indexbetween 1990 and 1996.
Sources: World Bank (1999b); staff estimates.

ASIAN DEVELOPMENT OUTLOOK 2000194
education were generally more productive than theiruneducated counterparts. However, the differenceswere greatest in more dynamic regions with new seed-fertilizer technology (Foster and Rosenzweig 1996).As education helps in being able to adopt a newtechnology, the returns to education also increase insuch a changing environment.
South Asian countries seem to devote a smallerfraction of total public expenditure to education thanthe more advanced economies of developing Asia,both historically and currently (see table 3.9).Moreover, the share of public education expendituredevoted to primary education in these South Asianeconomies is much lower than the extent of povertyin these countries would suggest. Because the largestnumber and proportion of students from poor house-holds are enrolled in the primary level, any givensubsidy is most likely to reach the poor most effectivelyif it is targeted to that level of education. ThePhilippines, for example, does not spend as much on
public education as a percentage of GNP as the SouthAsian countries. A far larger fraction of publicexpenditure on education is devoted to the primarysector, however. Such prioritizing of primary educa-tion helps explain the high rates of adult literacy inthe Philippines.
Land and Capital. In most Asian developing coun-tries, poverty is essentially a rural phenomenon.A principal characteristic of the rural poor is that theyhave little or no land. In India, for instance, house-holds with no land had a poverty incidence of morethan 40 percent, while those that cultivated more thaneight hectares had less than 1 0 percent (Dev, Parikh,and Suryanarayana 1994).
Although limited access to land is an importantfeature of the rural poor, the nature of access to landis not necessarily an indicator of poverty. In thePhilippines, for instance, tenancy (rather than owner-ship) is not significantly related to poverty, although
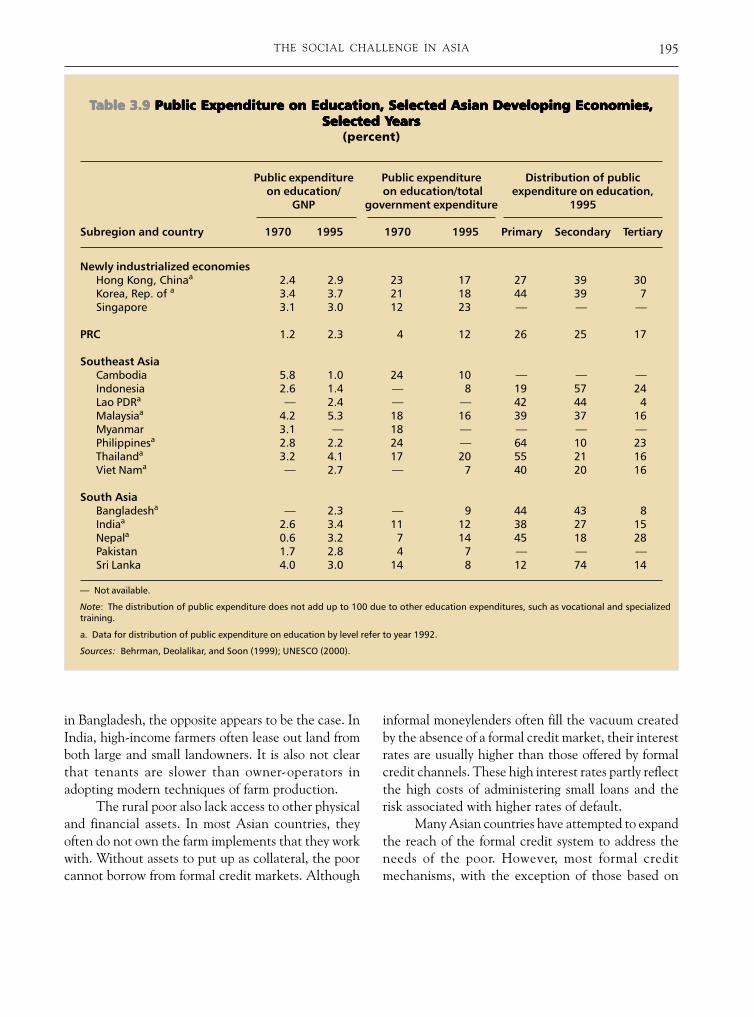
195THE SOCIAL CHALLENGE IN ASIA
TTTTTable 3.9able 3.9able 3.9able 3.9able 3.9 Public Expenditure on Education, Selected Asian Developing Economies, Public Expenditure on Education, Selected Asian Developing Economies, Public Expenditure on Education, Selected Asian Developing Economies, Public Expenditure on Education, Selected Asian Developing Economies, Public Expenditure on Education, Selected Asian Developing Economies,Selected YSelected YSelected YSelected YSelected Yearsearsearsearsears
(percent)
Public expenditure Public expenditure Distribution of publicon education/ on education/total expenditure on education,
GNP government expenditure 1995
Subregion and country 1970 1995 1970 1995 Primary Secondary Tertiary
Newly industrialized economiesHong Kong, Chinaa 2.4 2.9 23 17 27 39 30Korea, Rep. of a 3.4 3.7 21 18 44 39 7Singapore 3.1 3.0 12 23 — — —
PRC 1.2 2.3 4 12 26 25 17
Southeast AsiaCambodia 5.8 1.0 24 10 — — —Indonesia 2.6 1.4 — 8 19 57 24Lao PDRa — 2.4 — — 42 44 4Malaysiaa 4.2 5.3 18 16 39 37 16Myanmar 3.1 — 18 — — — —Philippinesa 2.8 2.2 24 — 64 10 23Thailanda 3.2 4.1 17 20 55 21 16Viet Nama — 2.7 — 7 40 20 16
South AsiaBangladesha — 2.3 — 9 44 43 8Indiaa 2.6 3.4 11 12 38 27 15Nepala 0.6 3.2 7 14 45 18 28Pakistan 1.7 2.8 4 7 — — —Sri Lanka 4.0 3.0 14 8 12 74 14
— Not available.
Note: The distribution of public expenditure does not add up to 100 due to other education expenditures, such as vocational and specializedtraining.
a. Data for distribution of public expenditure on education by level refer to year 1992.
Sources: Behrman, Deolalikar, and Soon (1999); UNESCO (2000).
in Bangladesh, the opposite appears to be the case. InIndia, high-income farmers often lease out land fromboth large and small landowners. It is also not clearthat tenants are slower than owner-operators inadopting modern techniques of farm production.
The rural poor also lack access to other physicaland financial assets. In most Asian countries, theyoften do not own the farm implements that they workwith. Without assets to put up as collateral, the poorcannot borrow from formal credit markets. Although
informal moneylenders often fill the vacuum createdby the absence of a formal credit market, their interestrates are usually higher than those offered by formalcredit channels. These high interest rates partly reflectthe high costs of administering small loans and therisk associated with higher rates of default.
Many Asian countries have attempted to expandthe reach of the formal credit system to address theneeds of the poor. However, most formal creditmechanisms, with the exception of those based on

ASIAN DEVELOPMENT OUTLOOK 2000196
cooperative, microcredit-style lending, have hadlimited success. The high fixed costs of lending,informational problems, and the costs of enforcementin defaults often limit the success of formal creditmechanism in reaching the poor.
Social Capital. While the term social capital is widelyused in development parlance, it is seldom preciselydefined. A narrow definition includes the socialnetworks or groups that benefit a member, while abroad definition includes all social institutions withinwhich individuals operate, including the legal frame-work and civil and political liberties. In this discussion,social capital is limited to social organizations, such asnetworks, norms, and social trusts that facilitatecoordination and cooperation among individuals ina society.
Social capital reduces the incentives for oppor-tunistic behavior by individuals and increases trust.Thus it enhances the productivity of individuals andfirms by reducing transaction costs, increases theprovision of public goods, and helps create an informalsafety net in times of economic crisis. In rural societies,for instance, social capital helps promote communityenterprises, such as irrigation and the management ofcommon properties. For the poor, social capital in theform of networks and connections is a critical asset indeveloping economic opportunity and securing accessto markets.
Social capital, like human and physical capital,is not uniformly distributed across Asian societies.Ethnic divisions are greater in some societies thanothers, and the degree of networking and social trustsvaries. In Gujarat in India, for instance, violentconfrontations between local people and the govern-ment over forests management led to economicstagnation. After communities were mobilized andjoint forest management programs began, the con-flicts declined and land productivity and village in-comes rose (Pathan, Arul, and Poffenberger 1993).Finally, while it is clear how social capital works andthe contributions it makes to economic developmentand poverty alleviation, quantitative estimation ofthese relations is fraught with conceptual and mea-surement difficulties. It is difficult to gauge preciselyhow much the poor lack the important resource ofsocial capital.
Infrastructure. Well-developed physical infrastructureis critical to economic development and povertyreduction. Infrastructure—including electric power,roads, irrigation, transportation, and telecommu-nications systems—is essential for the production,exchange, and distribution of goods and services.Physical infrastructure lowers the cost of productionand transactions, complements human capital, andenhances its productivity. Improved access to infra-structure can open up new employment and earningopportunities, for the poor in particular. Access to roadand transportation, for instance, allows poor peopleto explore employment options outside theirimmediate vicinity. Similarly, having modern infra-structure facilities in rural areas can lead to the growthof small and medium-size industries that can oftenensure higher and stable income for the poor.
Physical infrastructure also contributes directlyto the improvement of living standards, which in turnenables the poor to use other assets more effectively.The delivery of clean water and safe disposal of solidwaste, for instance, reduce the incidence of diseasesamong the poor, particularly waterborne ones. A fallin morbidity incidence allows a rise in productivity.
Like other assets, physical infrastructure isnot distributed evenly throughout the developingAsian region. South Asian countries have, on theaverage, the most inadequate physical infrastructurein the region (see table 3.10). East and Southeast Asiancountries fare better, and Central Asian countries havethe best physical infrastructure, a legacy of theirSoviet past.
Political and Social ConstraintsPolitical and Social ConstraintsPolitical and Social ConstraintsPolitical and Social ConstraintsPolitical and Social Constraints
Inadequate access to capital—physical, human, andfinancial—helps explain the economic origins ofpoverty in Asia, but it does not tell the whole story.These economic factors have been compounded byother political and social problems, including poorgovernance and social discrimination due to genderor ethnicity.
Poor Governance. Poor governance can take manydifferent forms: a lack of accountability for govern-ment actions, a lack of voice for the governed, inef-fective and partisan executives, political instability and

197THE SOCIAL CHALLENGE IN ASIA
violence, the absence of the rule of law, or corruption.All have important ramifications for the poor, prob-ably more than any other segment of society.
A government that is not accountable to all seg-ments of society—and does not allow “voice” to itscitizens—is likely to be less attentive to the needs ofthe poor than to other, more powerful, segments ofsociety. As Nobel Laureate Amartya Sen noted (1983),authoritarian regimes that allow little press freedomare the types of regimes in which widespread famines
are possible. Ineffective governments are unlikely tomake efficient investments in physical and social in-frastructure that would benefit the poor, and are alsoless efficient in delivering the needed social servicesto the poor.
Governments that are unable to maintain lawand order and to control eruptions of politicalinstability and violence are also unlikely to benefit thepoor. In recent years, Afghanistan and Cambodia havebeen subject to such political turmoil. Regional
TTTTTable 3.10able 3.10able 3.10able 3.10able 3.10 Physical Infrastructure, Selected Asian Developing Economies, Physical Infrastructure, Selected Asian Developing Economies, Physical Infrastructure, Selected Asian Developing Economies, Physical Infrastructure, Selected Asian Developing Economies, Physical Infrastructure, Selected Asian Developing Economies,Selected YSelected YSelected YSelected YSelected Yearsearsearsearsears
Paved Electricity Irrigatedroads consumption, land Telephones
(percentage (kWh per (percentage (main lines + mobile)of total) capita) of crop land) per 1,000 persons
Subregion and country 1997 1996 1994-1996 1997
Newly industrialized economiesKorea, Rep. of 74.0 4,453 60.7 594
PRC and MongoliaPRC — 19 37.0 66Mongolia 3.4 1,314 6.1 38
Central Asian republicsKazakhstan 82.8 2,865 6.9 110Kyrgyz Republic 91.1 1,479 76.8 76Tajikistan 82.7 2,292 80.6 38Uzbekistan 87.3 1,657 81.6 63
Southeast AsiaCambodia 7.5 — 4.5 5Indonesia 46.3 296 15.0 30Lao PDR 13.8 63 20.3 6Malaysia 75.1 2,078 4.5 308Myanmar 12.2 58 15.9 5Philippines 57.0 405 16.7 47Thailand 97.5 1,289 23.2 113Viet Nam 25.1 177 29.6 23
South AsiaBangladesh 12.3 97 39.1 3India 45.7 347 32.0 20Nepal 41.5 39 30.6 8Pakistan 58.0 333 80.2 20Sri Lanka 40.0 203 29.2 23
— Not available.
Sources: UN-ESCAP (various years); Statistical Yearbooks (various countries and years).

ASIAN DEVELOPMENT OUTLOOK 2000198
insurrections have also persisted in Sri Lanka and thePhilippines for a long time. These political instabilitieshave undoubtedly adversely affected economic growth,while simultaneously impeding governments’ abilitiesto provide public services to the poor.
Corruption can affect the poor in several ways.It affects them directly, as they are subject to varioustypes of financial extortion by corrupt officials, andbecause unscrupulous government functionaries oftendivert funds for social services intended for the poor.Corruption affects them indirectly, by reducing theeconomy’s growth potential. It reduces foreign anddomestic investment, decreases the efficiency withwhich these investments are made, and misallocatesresources to rent-seeking activities. All of these canhave a powerful negative impact on economic growth.
Gender Bias. There is no doubt that in many societieswomen often lack access to essential assets and basicsocial services. In particular, women tend to facegreater obstacles than men in attending school, usinghealth services, and participating in the labor market.These problems are particularly serious in South Asia.
Poverty is one reason for the bias, as womenoften suffer disproportionately from its burden.However, growing evidence suggests that poverty isnot the sole source—or even a strong cause—ofgender disparities. Tradition, as well as outrightdiscrimination, plays an important role in creating andsustaining these disparities.
In many Asian developing countries, gender biasin the labor market is directly linked to culturalstereotypes of gender roles. The high incidence ofunemployment among women is partly due to acultural perception that considers women’s economicrole secondary to their reproductive role. The socialtraditions and customs of the region reinforce thisimplicit discrimination. In many Asian countries suchas Bangladesh, India, and Viet Nam, women’s livesare shaped by the patriarchal and patrilineal natureof the social system, where women are subjected tothe dictates of their husbands’ families.
Another cause of lower female employment ratesin the formal sectors is that employing female workerscan mean shouldering the additional costs of maternityleave, sick leave, and childcare allowances. Discrimi-nation in labor markets can also be self-perpetuating.
If women face discrimination in employment, parentsmay invest less in the education of daughters thansons. If employers believe that women quit more often,they will deny them access to training programs, whichmay in fact cause them to quit.
Gender bias in education is also caused by acombination of economic and social factors. First, thedirect costs associated to sending girls to school arehigher than for boys, because parents are morereluctant to send daughters to school without properattire. Second, negative perceptions of girls’ academicability are widespread in many poor developing Asianeconomies. Third, in some cultures, education beyondthe acquisition of literacy can threaten a woman’schance of marriage. Fourth, in poor households, girlsgenerally perform more chores than boys, so theopportunity costs of sending girls to school are high.Finally, a strong perception exists that the economicreturns from boys’ schooling are greater.
Gender disparities go well beyond labor mar-kets and education. Women also have less access tocapital, particularly in the relatively low-interest for-mal sector. Discrimination in credit markets is onecause, but more important are a lack of collateral andthe fact that competing demands on women’s timemake it difficult for them to travel to large townswhere formal lending institutions are located. Fortu-nately, in many developing countries, microcreditprograms, such as the Grameen Bank in Bangladesh,are addressing this problem. Microcredit programsfocus on the credit needs of women and use socialcapital (pressure from a group of fellow borrowers) toensure loan repayment.
Ethnic, Religious, and Caste Bias. As with genderdisparities, ethnic and religious biases stem fromeconomic, social, cultural, and spatial factors.Discrimination may play a role, particularly in labormarkets, but it is difficult to find compelling evidenceon overt discriminatory practices. The negative spiralof poverty and social constraints are more plausibleexplanations for the lower levels of education, health,and productivity among ethnic minorities. Poverty andthe need for children to work dissuade many ethnicminority households from sending their children toschool, as they simply cannot afford the actual andopportunity costs of educating their children.
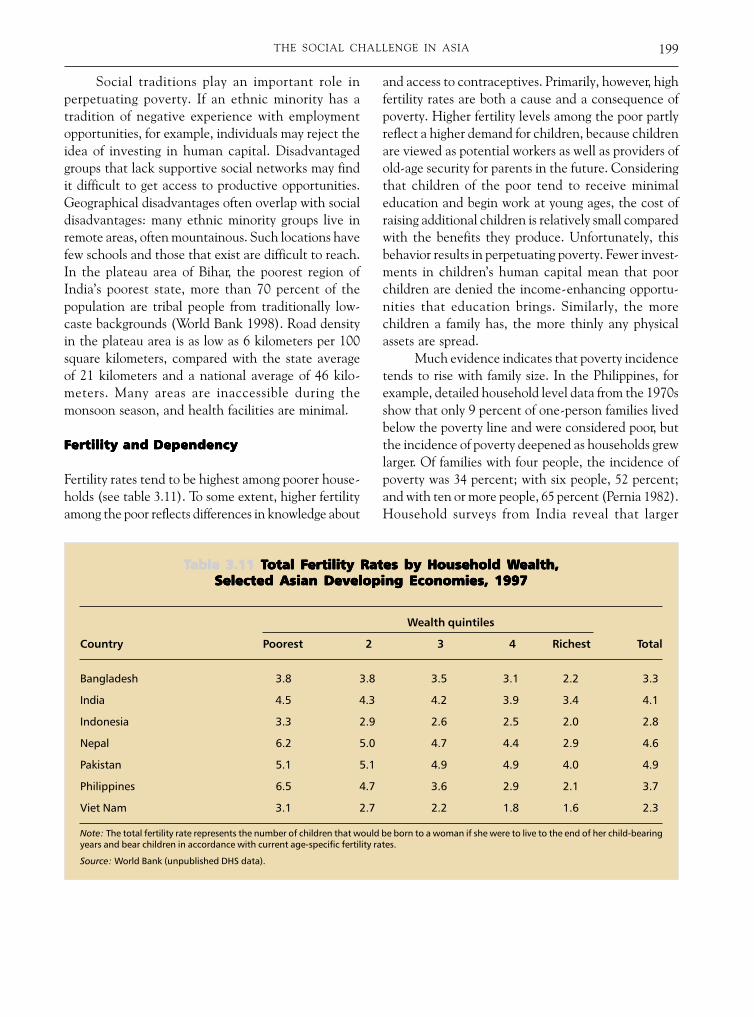
199THE SOCIAL CHALLENGE IN ASIA
Social traditions play an important role inperpetuating poverty. If an ethnic minority has atradition of negative experience with employmentopportunities, for example, individuals may reject theidea of investing in human capital. Disadvantagedgroups that lack supportive social networks may findit difficult to get access to productive opportunities.Geographical disadvantages often overlap with socialdisadvantages: many ethnic minority groups live inremote areas, often mountainous. Such locations havefew schools and those that exist are difficult to reach.In the plateau area of Bihar, the poorest region ofIndia’s poorest state, more than 70 percent of thepopulation are tribal people from traditionally low-caste backgrounds (World Bank 1998). Road densityin the plateau area is as low as 6 kilometers per 100square kilometers, compared with the state averageof 21 kilometers and a national average of 46 kilo-meters. Many areas are inaccessible during themonsoon season, and health facilities are minimal.
FFFFFertility and Dependencyertility and Dependencyertility and Dependencyertility and Dependencyertility and Dependency
Fertility rates tend to be highest among poorer house-holds (see table 3.11). To some extent, higher fertilityamong the poor reflects differences in knowledge about
and access to contraceptives. Primarily, however, highfertility rates are both a cause and a consequence ofpoverty. Higher fertility levels among the poor partlyreflect a higher demand for children, because childrenare viewed as potential workers as well as providers ofold-age security for parents in the future. Consideringthat children of the poor tend to receive minimaleducation and begin work at young ages, the cost ofraising additional children is relatively small comparedwith the benefits they produce. Unfortunately, thisbehavior results in perpetuating poverty. Fewer invest-ments in children’s human capital mean that poorchildren are denied the income-enhancing opportu-nities that education brings. Similarly, the morechildren a family has, the more thinly any physicalassets are spread.
Much evidence indicates that poverty incidencetends to rise with family size. In the Philippines, forexample, detailed household level data from the 1970sshow that only 9 percent of one-person families livedbelow the poverty line and were considered poor, butthe incidence of poverty deepened as households grewlarger. Of families with four people, the incidence ofpoverty was 34 percent; with six people, 52 percent;and with ten or more people, 65 percent (Pernia 1982).Household surveys from India reveal that larger
TTTTTable 3.11able 3.11able 3.11able 3.11able 3.11 T T T T Total Fotal Fotal Fotal Fotal Fertility Rates by Household Wertility Rates by Household Wertility Rates by Household Wertility Rates by Household Wertility Rates by Household Wealth,ealth,ealth,ealth,ealth,Selected Asian Developing Economies, 1997Selected Asian Developing Economies, 1997Selected Asian Developing Economies, 1997Selected Asian Developing Economies, 1997Selected Asian Developing Economies, 1997
Wealth quintiles
Country Poorest 2 3 4 Richest Total
Bangladesh 3.8 3.8 3.5 3.1 2.2 3.3
India 4.5 4.3 4.2 3.9 3.4 4.1
Indonesia 3.3 2.9 2.6 2.5 2.0 2.8
Nepal 6.2 5.0 4.7 4.4 2.9 4.6
Pakistan 5.1 5.1 4.9 4.9 4.0 4.9
Philippines 6.5 4.7 3.6 2.9 2.1 3.7
Viet Nam 3.1 2.7 2.2 1.8 1.6 2.3
Note: The total fertility rate represents the number of children that would be born to a woman if she were to live to the end of her child-bearingyears and bear children in accordance with current age-specific fertility rates.
Source: World Bank (unpublished DHS data).

ASIAN DEVELOPMENT OUTLOOK 2000200
families are not only more likely to be poor at anygiven time but are also more likely to be persistentlypoor (Gaiha and Deolalikar 1993).
Although fertility rates have fallen throughoutAsia in recent decades, fertility remains high in SouthAsia (particularly in Nepal and Pakistan), in somecountries of Southeast Asia (Cambodia, Lao PDR, andPhilippines) and Central Asia (Tajikistan andUzbekistan). These high fertility rates have contri-buted to a relatively young population, and hence alarger share of young dependents (see table 3.12).
The dynamic and relatively more developedNIEs that have virtually eliminated poverty are nowgoing through a rapid change in demographicstructure. Fertility rates have fallen dramatically; thepopulation is aging, and the share of the old people(those 65 years old and above) as a percentage of thetotal population is increasing.
The shift in the population bulge from young toold has important implications that must beconfronted. On one hand, relative pressures for socialwelfare expenditures on schooling and infant, child,and maternal health will decline as the young depen-dency ratios drop. On the other hand, relativepressures for an old-age pension and social assistancewill increase. There will be a rapid increase in olderindividuals whose economic vulnerability would beexacerbated by weakening intergenerational ties.Women, who are traditionally more vulnerable, willcomprise relatively large shares of the older popula-tions in most countries. Ensuring financial security forthe elderly will thus be a challenge to the dynamicEast and Southeast Asian economies in the futureyears (see box 3.2).
Finally, throughout the region, health emphasiswill shift from infectious childhood diseases toproblems of aging populations, such as heart disease,cancer, and other ailments. Dealing with this changeand finding ways to finance the shift may posesubstantial challenges for evolving health care systemsin developing Asia.
Environmental DeteriorationEnvironmental DeteriorationEnvironmental DeteriorationEnvironmental DeteriorationEnvironmental Deterioration
Several theories explain why Asia’s environment hasdeteriorated so dramatically. According to some, ris-ing populations inevitably put pressure on finite natu-
ral resources. Others argue that poverty itself has beenthe underlying cause of environmental deterioration.Still others regard economic growth as the root causeof a deteriorating environment. More recently, institu-tional and policy failures have been cited as the basicreason for environmental degradation.
TTTTTable 3.12able 3.12able 3.12able 3.12able 3.12 F F F F Fertility and Age Dependencyertility and Age Dependencyertility and Age Dependencyertility and Age Dependencyertility and Age Dependency,,,,,Selected Asian Developing Economies,Selected Asian Developing Economies,Selected Asian Developing Economies,Selected Asian Developing Economies,Selected Asian Developing Economies,
1960 and 19971960 and 19971960 and 19971960 and 19971960 and 1997
Total fertility Youngrate dependency
ratioSubregion and country 1960 1997 1997
NIEsKorea, Rep. of 6.0 1.7 0.3
PRC and MongoliaPRC 5.7 1.9 0.4Mongolia 6.0 2.6 0.6
Central Asian republicsKazakhstan 4.5 2.0 0.5Kyrgyz Republic 5.1 2.8 0.6Tajikistan 6.3 3.5 0.8Uzbekistan 6.3 3.3 0.7
Southeast AsiaCambodia 6.3 4.6 0.8Indonesia 5.5 2.8 0.5Lao PDR 6.2 5.6 0.8Malaysia 6.8 3.2 0.6Myanmar 6.0 2.4 0.5Philippines 6.9 3.6 0.6Thailand 6.4 1.7 0.4Viet Nam 6.1 2.4 0.6
South AsiaBangladesh 6.7 3.2 0.7India 5.9 3.3 0.6Nepal 5.8 4.4 0.8Pakistan 6.9 5.0 0.8Sri Lanka 5.3 2.2 0.4
NIEs - Newly industrialized economies.
Note: The young dependency ratio refers to the ratio of the youngpopulation (those younger than 15 years of age) to the working-agepopulation (aged 15-64).
Sources: World Bank (1999c); UNICEF (1999).
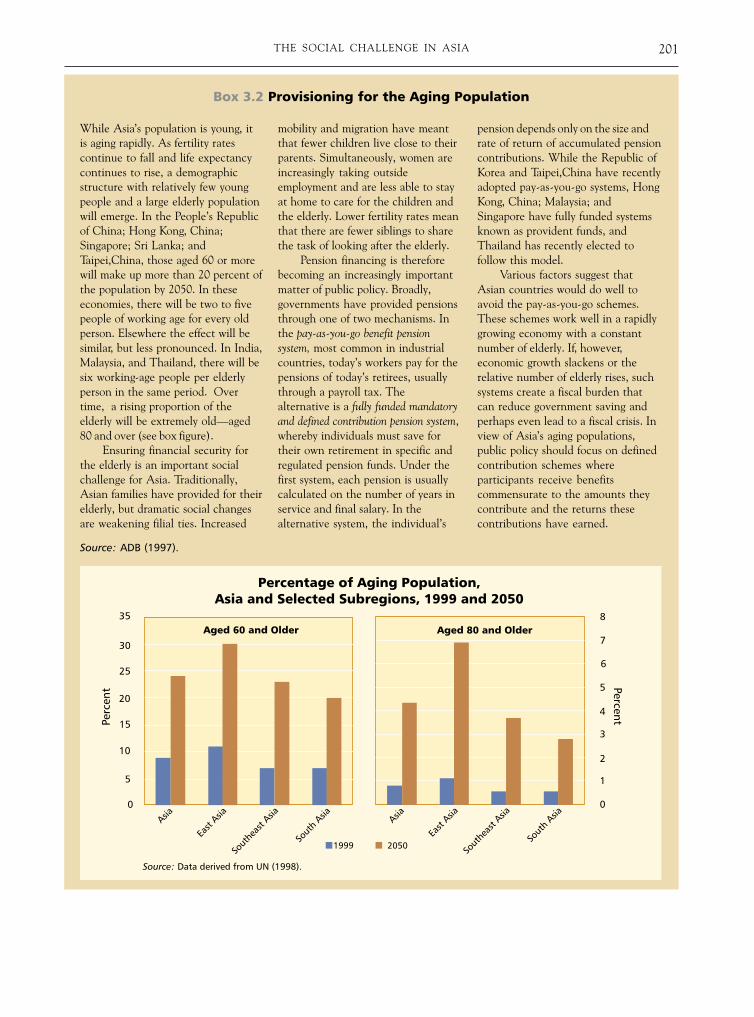
201THE SOCIAL CHALLENGE IN ASIA
While Asia’s population is young, itis aging rapidly. As fertility ratescontinue to fall and life expectancycontinues to rise, a demographicstructure with relatively few youngpeople and a large elderly populationwill emerge. In the People’s Republicof China; Hong Kong, China;Singapore; Sri Lanka; andTaipei,China, those aged 60 or morewill make up more than 20 percent ofthe population by 2050. In theseeconomies, there will be two to fivepeople of working age for every oldperson. Elsewhere the effect will besimilar, but less pronounced. In India,Malaysia, and Thailand, there will besix working-age people per elderlyperson in the same period. Overtime, a rising proportion of theelderly will be extremely old—aged80 and over (see box figure).
Ensuring financial security forthe elderly is an important socialchallenge for Asia. Traditionally,Asian families have provided for theirelderly, but dramatic social changesare weakening filial ties. Increased
Box 3.2 Provisioning for the Aging Population
mobility and migration have meantthat fewer children live close to theirparents. Simultaneously, women areincreasingly taking outsideemployment and are less able to stayat home to care for the children andthe elderly. Lower fertility rates meanthat there are fewer siblings to sharethe task of looking after the elderly.
Pension financing is thereforebecoming an increasingly importantmatter of public policy. Broadly,governments have provided pensionsthrough one of two mechanisms. Inthe pay-as-you-go benefit pensionsystem, most common in industrialcountries, today’s workers pay for thepensions of today’s retirees, usuallythrough a payroll tax. Thealternative is a fully funded mandatoryand defined contribution pension system,whereby individuals must save fortheir own retirement in specific andregulated pension funds. Under thefirst system, each pension is usuallycalculated on the number of years inservice and final salary. In thealternative system, the individual’s
pension depends only on the size andrate of return of accumulated pensioncontributions. While the Republic ofKorea and Taipei,China have recentlyadopted pay-as-you-go systems, HongKong, China; Malaysia; andSingapore have fully funded systemsknown as provident funds, andThailand has recently elected tofollow this model.
Various factors suggest thatAsian countries would do well toavoid the pay-as-you-go schemes.These schemes work well in a rapidlygrowing economy with a constantnumber of elderly. If, however,economic growth slackens or therelative number of elderly rises, suchsystems create a fiscal burden thatcan reduce government saving andperhaps even lead to a fiscal crisis. Inview of Asia’s aging populations,public policy should focus on definedcontribution schemes whereparticipants receive benefitscommensurate to the amounts theycontribute and the returns thesecontributions have earned.
Source: ADB (1997).

ASIAN DEVELOPMENT OUTLOOK 2000202
A rapidly growing population can stress theenvironment through deforestation, soil erosion, anddamage to local ecosystems. However, how a popula-tion behaves is likely to be a bigger factor than therate at which it is growing. In Sri Lanka and Thailand,population growth rates have fallen rapidly, butenvironmental degradation has been just as much aproblem in these countries than in ones with faster-growing populations. The important factor seems tobe whether individuals consider the costs of environ-mental degradation in decisionmaking. In particular,when property rights to resources are not definedclearly, people are more likely to be unconcerned aboutdegrading them.
Some suggest that the poor are more prone tocausing environmental damage through the overuseof resources. Openly accessible natural resources, suchas fish, game, water, and firewood, are likely to beexploited more intensely by the poor. While this over-use clearly contributes to environmental degradation,it is caused less by poverty than by market, institu-tional, and policy failures. Moreover, the poor sufferfrom environmental degradation that results from theactions of others. Poor people tend to live in areasthat are more prone to environmentally related naturaldisasters such as flooding and landslides, or nearheavily polluting factories, dumps, and hazardouswaste sites.
Another theory suggests that Asia’s rapideconomic growth over the past 40 years has been themain cause of its environmental degradation. Asagriculture becomes more intensive, resource extrac-tion increases, and as industrialization expands, ratesof natural resource depletion rise along with theamount and toxicity of waste. However, as economiesbecome richer, their economic structure eventuallymoves toward activities that use natural resources lessintensively. Greater prosperity also brings an increasedenvironmental awareness and the willingness andcapacity to pay for a cleaner environment. Again, therelationship between the environment and economicgrowth is likely to be heavily influenced by policiesand institutions. There is a growing consensus thatthe main factor in Asia’s rapid environmentaldeterioration has been policy failure (ADB 1997).Environmental policy and problems were neglectedfor a long time, and when strict pro-environment
policies were enacted, they were neither adequatelymonitored nor enforced. In some cases, policies wereapplied that hurt the environment rather than helpedit (see box 3.3).
VVVVVulnerability to Short-ulnerability to Short-ulnerability to Short-ulnerability to Short-ulnerability to Short-TTTTTerm Shockserm Shockserm Shockserm Shockserm Shocks
Standard poverty measures do not reflect the differentdegrees of risk and vulnerability that households withthe same level of expected income may face. Onefarmer may derive income from rain-fed crops, whichare subject to the vagaries of nature, while the othermay rely on irrigated crops, whose output is moredependable. Households also differ in their ability tocope with such shocks, as one family might have close,financially secure, relatives in urban areas who canassist in times of need, while another, equally poorhousehold, does not. These differences in vulnerabilityhave serious implications for the welfare of twootherwise identical individuals with the same levelof income.
Standard measures of poverty also provide noindication of whether the observed poverty is chronicor transient. In predominantly agricultural societies,variations in weather and other natural factors cancause substantial fluctuations in income from oneseason to another. Consequently, households canmove regularly into and out of poverty. One study ofSouth Indian villages found that only one fifth ofhouseholds were poor in all the nine years the studycovered. Twelve percent were never poor, and themajority moved in and out of poverty (Gaiha andDeolalikar 1993). The distinction between chronic andtransient poverty is important, as it has very differentpolicy implications.
Vulnerabilities to transient poverty have severalcauses and manifestations. Some shocks are natural,as a drought; others are political, such as a civil war;and others are economic, such as a currency crisis.Some shocks, such as a catastrophic illness, are specificto individuals. Others, such as a harvest failure, arecommon to everyone in the community or the entirevillage. Still others affect the entire economy, such asa sharp recession. The distinction between varioustypes of shocks is important because they have differ-ent policy implications. A shock that affects an entirecommunity obviously cannot be addressed by pooling

203THE SOCIAL CHALLENGE IN ASIA
Asia has paid heavily for itsenvironmental mismanagement andnegligence. Addressing the challengesof today’s environmental degradationrequires active policies in severalareas. First, government policies thatexacerbate environmental problems,such as subsidizing the extraction ofscarce resources, should be graduallyremoved. Second, property rightsshould be clarified. Insecure propertyrights over land and other naturalresources have led people to misusethem or underinvest in theirimprovement.
Governments also need topromote flexible types ofenvironmental regulation that rely oneconomic incentives to encouragecompliance. Traditionally,environmental protection in Asia wasbased on a command-and-controlsystem. Common policy tools werelicenses, fines, and specificgovernment orders to cease pollution.Governments often imposed auniform pollution standard across anindustry, but monitoring was usuallyinadequate. The result was aproliferation of unimplementedregulations and a rapidly deterioratingenvironment.
A more flexible approach wouldallow industry a much freer hand insetting its own means of compliancebased on the cost of the pollution tothe polluting entity. Controllingpollution is usually more expensivefor older factories with outdatedtechnology and smaller factories thatcannot reap the benefits of economiesof scale. In India’s pulp and paperindustry, for instance, the cost ofpollution abatement per ton of paperproduced decreases by more than 70percent as mill capacity rises from 10to 115 tons per day. A flexible systemof environmental regulation based onthese cost differentials—known astradable emission permits—would
allow older and smaller plants toreduce their compliance costs byselling to newer or larger factoriestheir permits for a permissible level ofpollution.
Under this system, the authoritiesset an overall level of permissible airor water pollution. The permits dividethis level between firms based onnorms agreed on by policymakers. Asthe permissible aggregate level ofpollution is lower than the currentlevel, this creates a market in air orwater pollution. The permits therebyacquire market value, and firms thatwish to expand must either reduce thepollution from their existing factoriesor buy permits from other factories.
Flexible instruments ofenvironmental regulation include notonly these sophisticated tradableemission permits, but also simplermethods, such as imposing charges onpolluting inputs rather than on thepollution itself, or providing depositrefund systems to induce producersand consumers of polluting productsto return waste for recycling ortreatment and safe disposal. Depositrefund systems have an additionaladvantage of promoting wastecollection, which is otherwise a labor-intensive activity.
Fortunately, a growing number ofpolicymakers are showing a willingnessto experiment with one of these moreflexible approaches. For this to workeffectively, however, Asiangovernments must improve theircapacity to implement changes. Toaccomplish this, first, governmentinvolvement in environmentalmanagement must shift from top-down management to focused andstrategic intervention. Instead of usinga huge regulatory bureaucracyemploying thousands of environmentalinspectors, streamlined environmentalministries must coordinate adecentralized approach and ensure
that environmental impact isconsidered in all areas ofpolicymaking. At the same time,better environmental management willinvolve removing issues from thepurview of certain governmentministries. For example, some Asiancountries have begun to move theresponsibility for managing protectedareas from their forestrydepartments—which have anacknowledged bias toward timber andextraction—into institutions thatfocus on preservation.
More generally, centralgovernments will need to devolveresponsibility for environmentalmanagement to appropriate local andregional levels, and enter partnershipswith the private sector,nongovernmental organizations(NGOs), and local communities. Thecapacities of local governments, theprivate sector, and NGOs will need tobe improved, however. Determiningthe appropriate level of governmentfor environmental management can bedone by considering at which level caneffective measures be undertaken. Forintegrated river basin or watershedmanagement, for instance,institutional arrangements may haveto straddle the jurisdictions of severalstates. For regulating automobileemissions, however, standard settingand enforcement should be at themunicipal level.
Civil society needs to be involvedmore broadly. Environmental impactassessments are an important way thatstakeholders can participate at theproject level. Greater decentralizationand broader participation areprerequisites for Asia’s newenvironment model to worksuccessfully, and the move towarddevolution and pluralism inenvironmental issues would onlymirror a broader trend already evidentin Asia.
Box 3.3 Improving Environmental Regulation
Source: ADB (1997).

ASIAN DEVELOPMENT OUTLOOK 2000204
resources within the community. Similarly, a largemacroeconomic shock requires pooling resourcesbeyond those available within the national borders.
Asian economies have been subject to variousmajor shocks in recent years. Bangladesh and the PRChave experienced serious floods, and Southeast Asiahas endured costly droughts. Others have experiencedserious epidemics of disease, as Thailand has sufferedhugely from HIV/AIDS. Still others have faced politicalviolence and civil disorder, such as Cambodia. Finally,the Asian financial crisis engulfed most of East andSoutheast Asia in 1997-1998.
Such economic shocks can be partly mitigatedby effective social safety net programs. Although theextent and effectiveness of social safety nets varybetween countries, they generally fail to meet theneeds of the poor. Many Asian countries experiencedyears of high economic growth before the onset of therecent financial crisis, and their governments believedthat economic growth would be the main form of socialsafety net, and hence had inadequate formalsocial safety nets (see box 3.4). In the absence ofwell-developed formal safety net programs, householdsin many Asian countries fall back to two strategiesduring periods of need: family support networks andmigration.
Family relationships have undoubtedly beenweakened by urbanization and modernization.Nonetheless, the evidence suggests that privatetransfers are still a significant source of support in timesof need. In the PRC, the immediate family is requiredby law to provide adequate consumption levels, evenif family members live in separate households. Ifnecessary, these laws are invoked to compel adultchildren to care for elderly parents.
According to a survey in Mongolia, families indistress were seven times more likely to receiveassistance from friends and relatives than from thegovernment. In the Kyrgyz Republic, about 20 per-cent of households either give or receive money orgoods to or from another household. Such transfersaccounted for almost 7 percent of household incomein 1996 (ADB 1999j). In India, intergenerational trans-fers (mostly informal support from children to elderlyparents) account for about 1.7 percent of GDP, andamount to more than the aggregate spending on allformal support programs for the elderly.
Migration is a widely used method of copingwith difficult times. Urban workers return to ruralareas to work in agriculture during periods of economicrecession. During the recent financial crisis, forinstance, employment shifted significantly fromthe nonfarm to the farm sector in Korea, Indonesia,and Thailand.
CONFRONTING THE SOCIAL CHALLENGECONFRONTING THE SOCIAL CHALLENGECONFRONTING THE SOCIAL CHALLENGECONFRONTING THE SOCIAL CHALLENGECONFRONTING THE SOCIAL CHALLENGE
As this chapter has shown, Asia’s social challengehas several dimensions and numerous causes.Consequently, to be effective, policy responses mustbe tailored to individual countries’ needs and circum-stances. These policy responses also should take intoaccount the overall policy environment—bothdomestic and international.
In the past decade, the domestic and inter-national policy environment has changed enormously.Most countries now have a greater focus on povertyreduction than they did in the past. Democraticinstitutions are on the rise, and more people recognizethe importance of better governance and increasedparticipation by civil society in the various facets ofsocial and economic life. Inspired by the benefits thatmany East Asian countries reaped from greatereconomic openness and reliance on market institu-tions, most countries in the region have taken stepsto liberalize their economies. The recent crisis has notset back this trend significantly.
In the international community, there is a greaterconcern about poverty issues than in the past. TheADB, for example, has declared poverty reduction itsover-arching development objective (see box 3.5).Although experience suggest which policies are themost effective policies for alleviating poverty, recentyears have seen a steady reduction in the level ofresources committed to development assistance (seefigure 3.3). The amount of private capital flowing todeveloping countries has risen dramatically, but thisflow has been limited to a dozen or so more advanceddeveloping economies.
Globalization offers new opportunities foreconomic development and poverty reduction in Asia.Regulatory barriers are falling, and after successiverounds of multilateral trade negotiations, the worldtrading system is more open than ever before. Average

205THE SOCIAL CHALLENGE IN ASIA
The Republic of Korea. Comparedwith other Asian countries, theRepublic of Korea (henceforthreferred to as Korea) has relativelysophisticated social safety nets,including public assistance programssuch as medical aid, veteran relief,and disaster relief. Compared withthose of developed countries,however, Korea’s social protectionlevels are rudimentary and limited,and essentially provide only partialprotection for formal sector workers.
Since 1995, Korea has had anunemployment benefit scheme.However, by April 1998, it coveredonly an estimated 22 percent ofpeople who have lost their jobs. Sincethe onset of the financial crisis,Korea has expanded itsunemployment benefit, raising thebenefit level gradually from 50 to 70percent of the minimum wage, andextending the minimum duration ofbenefits to two months. Also in1998, the government increased itsallocation for social welfareassistance and support by 13 percentto people with no income.
Indonesia. Through a ProvidentFund system, lump-sum paymentsare provided for old age, disability,and survivor benefits. These benefits,however, are limited to firms withmore than ten employees or a payrollabove Rs1 million ($140) per month.Coverage is gradually being extendedto smaller firms and seasonal workers.Indonesia also has a social insurancesystem that provides medical benefitsand work-related injury benefits.
In response to the economiccrisis, the government introduced anacross-the-board subsidy on fooditems such as rice, corn, sugar,soybean, wheat flour, soybean meal,and fishmeal at a cost of 0.5-0.7percent of GDP in 1998. Thegovernment also maintains subsidiesfor petroleum products (particularly,
kerosene and diesel) and electricity,which constitute more than 2percent of GDP. Other governmentprograms include providingscholarships for needy students,financing essential drugs for rural andurban health centers, providingsubsidies for low-cost housing, andexpanding rural credit schemes tocover small and medium-sizeenterprises and rural cooperatives.
Malaysia. Malaysia has two types ofsocial safety net programs: a dualprovident fund that provides bothlump-sum and periodic payments forold age, disability, death, and medicalbenefits; and a social insurancesystem that covers disability andwork-related injury benefits.
Recently, the Malaysiangovernment increased publicexpenditure on major anti-povertyprograms to protect the real spendingper beneficiary. The programs includethe Fund-for-Food program, whichprovides small-scale loans to thepoorest rural areas for income-generating activities, improvingwater supply, and strengtheningwelfare programs. The governmentalso expanded safety net programs forthose newly vulnerable because of therecent crisis, but who may not becovered by existing programs for thepoor. These include urbanmicrocredit programs for hawkers,traders, and entrepreneurs; a fund forsmall and medium-size industries toincrease their competitiveness andviability; skills training for retrenchedworkers; and preserving priority long-term development investments ineducation and health.
Philippines. The Philippines’ socialinsurance system covers benefits forold age, disability, death, and medicalcare. Contributions are compulsoryfor all private employees, whetherpermanent or provisional, who are
not more than 60 years old. Aseparate system covers governmentemployees.
To promote food security, thegovernment has begun to subsidizeessential staples—such as rice andoil—for the poorest households in thepoorest villages. Public employmentprograms are another major socialsafety net. The country hasintroduced two types of public worksschemes: the Food-for-Work scheme,set up in 1987; and the Cash-for-Work scheme, set up in 1990. For thelatter, the wage rate was set about 25percent higher than agriculturalmarket wages.
Thailand. In Thailand, old age,disability, death, and medical benefitsare provided through a limited socialinsurance system that covers firmswith ten or more employees.Currently, the pension system coversonly 10 percent of the labor force.
In response to the financialcrisis, the Thai government initiatedtemporary labor-intensive civil worksprograms in construction andinfrastructure. It also established twoinvestment funds. The SocialInvestment Fund will providesupport for community activities,including community developmentprograms and small credit schemes;and the Urban Development LoanFund will support labor-intensiveinvestments by municipalities. TheThai government is alsostrengthening its social spendingprograms by expanding its scholarshipand loan programs to minimizestudent dropouts, protectingoperational budgets for teachertraining and instructional materials,reallocating resources toward healthprograms for the poor, andredeploying health staff to rural areas.To protect urban low-incomeworkers, a subsidy for urban bus andrail fares will be maintained.
Box 3.4 The Social Safety Net Systems in Five Crisis-Affected Economies

ASIAN DEVELOPMENT OUTLOOK 2000206
The Asian Development Bank(ADB) has recently declared povertyreduction to be its overarching goal.Other strategic concerns, such ashuman development, soundenvironmental management,improvement of women’s status, andeconomic growth, will also beearnestly pursued, but in such a wayas to maximize their contribution topoverty reduction, where possible.
The three pillars of the newpoverty reduction strategy arefostering sustainable economicgrowth that benefits the poor,promoting social development, andencouraging good governance. TheADB’s next task is to translate thebroad thrust of its Poverty ReductionStrategy into comprehensivecountry-specific action plans. Thosewill prioritize the three strategicpillars according to countrycircumstances, the ADB’s cross-country experience in povertyreduction, and the changing globalenvironment facing developingmember countries.
In the past, the ADB hasfinanced the region’s urgent need forphysical infrastructure—such aselectricity, roads, irrigation systems,school buildings, and healthcenters—with an emphasis onboosting economic growth. It laterexpanded its focus to include humandevelopment, gender equity, andenvironmental protection.
Future ADB investments willaddress the region’s poor moredirectly. In transportation, the aimwill be to reduce transport costsbetween rural areas and growthcenters. In communications, theADB will harness informationtechnology to enhance the poor’smarket access. The ADB will alsoinvest more to provide the poor
access to essential services, includingelectricity, water supply andsanitation. Access to basic educationand primary health care will increasethe poor’s chance of earning income,and providing social safety nets willreduce the indebtedness that entrapsmany poor in a vicious circle.
A critical element of ADB’spoverty reduction strategy isgovernance. Good governance, aswell as sound macroeconomicmanagement, is essential forparticipatory, pro-poor policies. Itensures the transparent use of publicfunds, encourages growth of theprivate sector, promotes effectivedelivery of public services, and helpsestablish the rule of law. Actions ongovernance must proceed at twolevels. At the national level, publicadministration and expendituremanagement will be strengthened topromote growth and socialdevelopment that helps the poor. Atthe same time, responsibility forproviding public services will bemoved to the lowest appropriate levelof government. The ADB’s long-termobjective is to empower the poor anddevelop institutional arrangementsthat foster participation andaccountability at the local level.Henceforth, the emphasis will be onthe client, particularly community-based organizations, people’sorganizations, and cooperatives.
In implementing its povertyreduction strategy, the ADB willwork closely with membergovernments, nongovernmentalorganizations and other members ofcivil society, as well as the donorcommunity. The ADB will alsoundertake poverty analyses ofindividual countries to ascertain themost effective policies andinstitutions to fight poverty. These
analyses will be discussed at high-levelforums where governments,community-based organizations, theprivate sector, and the donorcommunity will be represented. Theseforums will produce countryoperational strategies that will form thebasis for programs. These programs, inturn, will be implemented throughpartnership agreements, which willinclude mechanisms for reviewingperformance and which will linkperformance to the allocation of funds.
To make antipoverty operationseffective, the ADB will introduce newinstruments or find new ways of usingexisting ones. For example, there willbe greater use of longer-term sectordevelopment programs, where front-end support for policy change andcapacity building will pave the way forfinancing for productive investment.Slow-disbursing policy-based lendingin support of national povertyreduction programs will also beconsidered, with a view to ensuringthat such programs are effective andcorrectly targeted. Moreover, the ADBwill take initiatives to lend directly tolocal governments, promote socialinvestment funds, and supportnongovernmental organizations withproven track records for helpingthe poor.
The ADB will help introduceeffective poverty monitoring system inthe developing member countries. TheADB will also help borrowing countriesimprove their capacity to generatetimely and reliable data, as well asdevelop indicators that can be easilyused. In monitoring progress towardthe agreed targets, the ADB will alsoassist borrowing governments inrefining their respective policies andprograms for poverty reduction. In theprocess, the ADB will become moreaccountable for its own actions.
Box 3.5 The Poverty Reduction Strategy of the Asian Development Bank
Source: ADB (1999i).
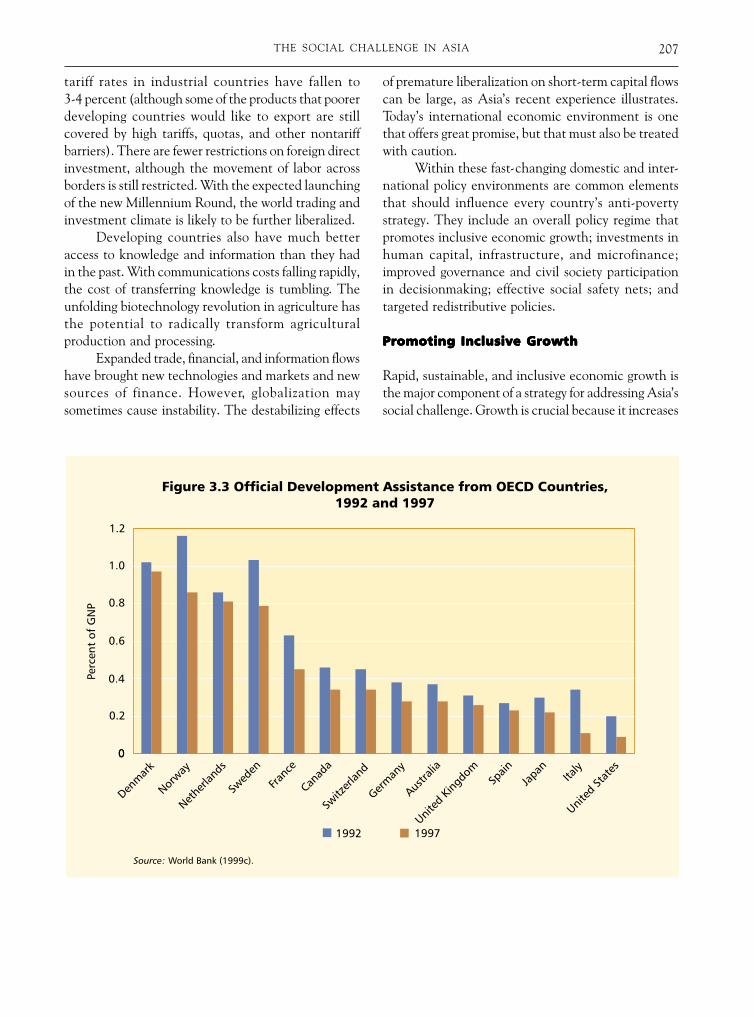
207THE SOCIAL CHALLENGE IN ASIA
tariff rates in industrial countries have fallen to3-4 percent (although some of the products that poorerdeveloping countries would like to export are stillcovered by high tariffs, quotas, and other nontariffbarriers). There are fewer restrictions on foreign directinvestment, although the movement of labor acrossborders is still restricted. With the expected launchingof the new Millennium Round, the world trading andinvestment climate is likely to be further liberalized.
Developing countries also have much betteraccess to knowledge and information than they hadin the past. With communications costs falling rapidly,the cost of transferring knowledge is tumbling. Theunfolding biotechnology revolution in agriculture hasthe potential to radically transform agriculturalproduction and processing.
Expanded trade, financial, and information flowshave brought new technologies and markets and newsources of finance. However, globalization maysometimes cause instability. The destabilizing effects
of premature liberalization on short-term capital flowscan be large, as Asia’s recent experience illustrates.Today’s international economic environment is onethat offers great promise, but that must also be treatedwith caution.
Within these fast-changing domestic and inter-national policy environments are common elementsthat should influence every country’s anti-povertystrategy. They include an overall policy regime thatpromotes inclusive economic growth; investments inhuman capital, infrastructure, and microfinance;improved governance and civil society participationin decisionmaking; effective social safety nets; andtargeted redistributive policies.
Promoting Inclusive GrowthPromoting Inclusive GrowthPromoting Inclusive GrowthPromoting Inclusive GrowthPromoting Inclusive Growth
Rapid, sustainable, and inclusive economic growth isthe major component of a strategy for addressing Asia’ssocial challenge. Growth is crucial because it increases

ASIAN DEVELOPMENT OUTLOOK 2000208
the demand for labor, the asset on which the poordepend. It is also crucial because the resources for anti-poverty programs and the political feasibility ofspending money on the poor are greater when incomesand economic opportunities are expanding for all.
Economic growth has benefited the poor evenwhen based on an initially unequal distribution ofincome. Brazil and Mexico have had unequal incomedistributions, but any income growth has been betterfor the poor than none (Fields 1995). If growth ratesare high enough, the poor can benefit even if in-equality rises. In Sri Lanka and Thailand in 1970,average income per head was roughly equal, althoughThailand had greater inequality (see table 3.13). Overthe next two decades, Thailand’s income inequalityincreased, while Sri Lanka’s fell, but Thailand’seconomic growth rate was far higher than Sri Lanka’s.Therefore, the poorest 20 percent of the Thai popula-tion had an income that was 45 percent higher thanthe corresponding group in Sri Lanka.
Had Thailand been able to generate the samegrowth rate while maintaining its initial level ofinequality, the poorest 20 percent would havebenefited far more, and their incomes would have beenaround 28 percent higher. Had Thailand somehowcombined its rapid growth with a decline in income
inequality similar to what Sri Lanka achieved by 1990,the poorest 20 percent of Thais would have had anincome 122 percent higher than it actually was.
This highlights two important questions. Whatcan Asia’s developing economies do to accelerateeconomic growth? And what mechanisms will ensurethat this growth benefits the poor, either in proportionor more than proportionally to the rest of the popula-tion? In other words, what types of policies willencourage inclusive growth? The answer involves anoverall policy regime that emphasizes economicopenness and market orientation, and is characterizedby prudent macroeconomic management, appropriateinvestments in human and physical infrastructure,improvements in governance, increased decentraliza-tion, and the active participation of the poor indecisions that affect their lives.
Openness and Market Orientation. It is difficult tooveremphasize the importance of using marketincentives and outward orientation to achieve inclu-sive economic growth. Following the Second WorldWar, many developing countries adopted a develop-ment strategy based on industrialization led by importsubstitution. High tariff rates and quantitativerestrictions on imports were used to conserve foreign
TTTTTable 3.13able 3.13able 3.13able 3.13able 3.13 Growth and Income Inequality Growth and Income Inequality Growth and Income Inequality Growth and Income Inequality Growth and Income Inequality,,,,,Sri LankSri LankSri LankSri LankSri Lanka and Thailand, 1970 and 1990a and Thailand, 1970 and 1990a and Thailand, 1970 and 1990a and Thailand, 1970 and 1990a and Thailand, 1970 and 1990
Country and indicator 1970 1990 Country and indicator 1970 1990
Sri Lanka ThailandGDP per capita ($) 180 470 GDP per capita ($) 200 1,520
Income inequality Income inequality(Gini coefficient) 0.38 0.30 (Gini coefficient) 0.43 0.49
Income share Income shareof poorest 20 percent 6.9 8.9 of poorest 20 percent 5.1 4.0(percent) (percent)
Income share Income share ofof poorest 20 percent poorest 20 percent($/capita) 12 42 ($/capita) 10 61
Source: Deininger and Squire (1996).

209THE SOCIAL CHALLENGE IN ASIA
exchange and shield new domestic industries fromwell-established foreign competition. The costs of“essential” imports were kept artificially low by over-valued exchange rates. Simultaneously, a complexcode of industrial licensing was used to allocateresources in the protected domestic market. Thisstrategy—followed most closely by India and otherSouth Asian economies—aimed at acceleratingindustrialization and poverty reduction. Unfortunately,it generally failed to achieve either objective.
Instead, it created an industrial structurecharacterized by large barriers to entry—both foreignand domestic—with narrow ownership. It also createdan economic structure that penalized agriculture,where most of Asia’s poor work. The protection ofdomestic industries raised the price of manufacturedinputs to agriculture, while overvalued exchange ratesreduced the domestic currency value of agriculturalexports. Other measures, such as export taxes, foodprice controls, and public investment programs biasedtoward industry, also hurt the agriculture sector. Notsurprisingly, the result was low growth and stagnantproductivity in agriculture, and an inefficient industrysector that was not conducive to creating growthor employment.
In contrast, the more dynamic developingeconomies of East and Southeast Asia did not penalizethe traded goods sectors, nor did they attempt tosupplant market forces so pervasively. Given therelative abundance of unskilled and semi-skilled labor,openness to trade and reliance on market forcesencouraged the production and exports of goods thatwere intensive in unskilled and semi-skilled labor (seebox 3.6). This in turn led to employment opportuni-ties for the poor and reductions in poverty.
A strong inverse relationship exists betweenopenness to trade and growth in poverty incidence indeveloping Asia (see figure 3.4). The relationship wasderived from 40 developing countries for whichrelevant data existed for the period 1970-1992. Thepoverty incidence was measured by the headcountindex based on the national poverty line, and opennessby trade share as a percentage of GDP. The slope ofthe relationship was found to be negative and statisti-cally significant, with a high (yet less than one) elas-ticity. This suggests that openness exerts a significantinfluence on poverty reduction.
Should market-oriented policies be limited toproduct markets only? Labor markets are often viewedas inherently different from product markets. Theyinfluence the terms of employment, such as wages andemployment conditions, which affect the quality oflife of workers and their families. Driven by suchconcerns, most governments regulate labor marketsby establishing the role of unions, setting minimumwages, providing unemployment insurance, and regu-lating employment contracts (ADB 1997). The extentand nature of these regulations differ across countries.In general, the more dynamic East and SoutheastAsian economies have had significantly fewer labormarket regulations than South Asian economies.
Are labor-market interventions always in thebest interest of workers? In South Asia, labor marketregulations have generally worked against workers bycreating an inflexible market—that is, a labor marketthat is unresponsive to economic circumstances andchanges. Over the years, India adopted a number oflaws that protect trade union rights, guarantee aminimum wage, and prevent layoffs, with the laudableintention of protecting the welfare of workers. Manyobservers believe, however, that the legislation hasmade the economy less flexible and has harmed theinterests of labor. Judging exactly how these regulationsaffect employment levels is difficult, but firm-levelstatistics suggest that the larger firms that are subjectto these regulations have responded by reducing theirlevels of employment, while employment has increasedin smaller firms.
It does not follow that any system that tries toprotect workers’ employment will be unsuccessful.Consider Japan, which has a system of lifetimeemployment for part of its workforce. Superficially,such a system may seem to generate the same type ofinefficiencies witnessed in India, but the Japanesesystem appears to have worked rather well for a longtime. The simple reason is that this system of lifetimeemployment maintains its flexibility through wage andbonus packages that allow firms to cut pay duringdownswings (ADB 1997). It is equally simplistic toblame powerful unions for labor market rigidities, whilethe nature of the collective bargaining process is muchmore important. In India, collective bargaining occursat the level of industry in the organized sector, but inmost of the dynamic East and Southeast Asian
ASIAN DEVELOPMENT OUTLOOK 2000210
economies, it occurs at the factory level. This meansthat factory-specific productivity growth and wages arenot linked in the Indian case, in contrast to East andSoutheast Asian economies.
The contrasting experiences of South Asia andthe more dynamic economies of East and SoutheastAsia suggest that developing economies will not beable to realize the potential benefits of the large poolsof employable labor unless their labor markets areflexible. Workers must have the opportunity andincentives to shift between jobs and sectors as theeconomy’s structure changes. If workers are un-employed or underemployed because they lack skills,because the minimum wage is too high, or becausewage increases significantly outstrip productivity gains,this will limit the potential for rapid economic growthand poverty reduction (ADB 1997).
Governments can do many important things inthe labor market, including protecting the vulnerable,
such as female and child workers (see box 3.7). In somecases, unfettered market activity may lead toundesirable health and safety conditions at work,which governments can act against. They can also helpcreate an industrial relations environment in whichworkers and enterprises are partners in shareddevelopment. Governments also have a role ineducating and training the disadvantaged to matchthe skills and knowledge of workers with the demandsof employers.
Macroeconomic Stability. While openness andmarket-oriented policies form the foundations onwhich inclusive growth is built, it is important thatthese policies operate in the context of a stablemacroeconomic environment. Manageable levels ofinternal and external debt, the absence of high andvolatile inflation, and the avoidance of seriousmisalignments in exchange rates are all important
To what extent does the structure ofa country’s exports depend on thecomposition of its resources?This may seem an arcane issueof international trade, but itis important in increasingmarket opportunities for thepoor in developing countries.
According to the Heckscher-Ohlin theory of trade, thecomposition of a country’s resourcesaffects the structure of its exports.Countries with relatively abundantunskilled labor tend to export goodsintensive in unskilled labor, whilethose with more abundant suppliesof skilled labor export skill-intensiveproducts. Poor countries, whichgenerally have large supplies ofunskilled labor, benefit from tradebecause market opportunitiesincrease for their abundantunskilled labor.
A recent study using data from111 countries examined the impactof countries’ relative supplies of landand labor resources on the structureof exports. The composition ofbetween one and two thirds ofexports can be explained bycountries’ relative supplies ofresources. In particular, countrieswith a larger proportion of unskilledlabor tend to have more primaryexports than manufactured goods,and within the manufacturing sector,more labor-intensive than skill-intensive manufactured goods. Thisfits the Heckscher-Ohlin theory, andhelps explain why developingcountries tend to export labor-intensive products to developedcountries in return for imports ofskill-intensive products.
Thus, economies in South Asia,which have relatively small supplies
Box 3.6 Openness and Poverty
Source: Wood and Mayer (1999).
of skilled labor and few naturalresources, export more labor-intensive goods than East andSoutheast Asia. The more dynamiceconomies of East and SoutheastAsia have more educated workforces, with an export structureheavily tilted toward skill-intensive goods.
South Asian economies havebeen among the most closed in theworld. Consequently, export levelsof countries in South Asia havebeen minuscule compared to Eastand Southeast Asia. In 1996, totalmerchandise exports of South Asianeconomies were less than theexports of Thailand alone. Hadthese economies been more open,they likely would have been ableto generate many more employmentopportunities for their large pool ofunskilled labor.

211THE SOCIAL CHALLENGE IN ASIA
factors in creating an environment conducive forefficient, growth-oriented investment and savingdecisions. They are also important for avoidingmacroeconomic crisis.
Large public deficits, in particular, must beavoided. If deficits are financed by the creation ofmoney, this will put upward pressure on prices. Highinflation reduces the real income of those whose wagesare slow to adjust, leads to distortions in relative prices,and interferes with the ability of markets to allocateresources efficiently. The poor are hurt, in particular,because they hold more of their assets in cash thanthe nonpoor. If large public deficits are financedthrough government borrowing, domestic privateinvestment can be crowded out as interest rates rise.If the borrowing is externally financed, a balance ofpayments crisis could occur if an economy’s exportearnings falter.
Traditionally, Asian countries have avoided theprofligate fiscal policies that led to the high rates ofinflation and unsustainable current account deficitsthat were common in other parts of the developingworld in previous decades (particularly in LatinAmerica and Africa). Nonetheless, Asia has not beenimmune to the macroeconomic instability resultingfrom weaknesses in banking systems and financialregulation—weaknesses that can be exposed by anunsustainable exchange rate regime and a lack ofprudential controls on short-term capital flows.
Economists have yet to reach a consensus onwhich type of exchange rate regime makes develop-ing countries less vulnerable to external shocks,although fixed but adjustable exchange rate pegs havebecome widely discredited in the wake of crises in Asia,Latin America, and Russia. The remaining divergenceof opinion rests on whether currency boards, or even

ASIAN DEVELOPMENT OUTLOOK 2000212
The question of child labor stirspowerful emotions, for obviousreasons. Child labor often impliesgross exploitation, where childrenare employed in harmfuloccupations, as field workers usingdangerous pesticides, as prostitutes,or perhaps as abused domesticservants. From an economicstandpoint, it almost alwaysrepresents a waste of humanpotential. Children who work areunable to get an education andacquire marketable skills.Unfortunately, child labor is alsohard to eradicate.
The fundamental cause of childlabor is abject poverty. Parentsusually know that more schoolingwould improve their child’s skills,bringing higher income later in life.But abject poverty means thatparents cannot afford to take theirchildren out of the labor market.There is a cruel conflict betweenthe short-term economic interestsof the parent and the long-terminterests of the child.
This conflict will not enduntil the problem of poverty isaddressed. A simple ban on childlabor will not help (thoughgovernments should obviously try toeliminate the worst forms of childlabor, such as those that involvesexual abuse). Enforcing an outrightban on child labor would beextremely difficult in many poorcountries. Laws that decreecompulsory schooling throughprimary school are alreadyunenforced among poorersegments of society in manydeveloping countries.
Nor will the imposition of tradesanctions against countries thatemploy child labor help. In fact, tradesanctions would worsen the situation,because by reducing exportopportunities for the poorestcountries, trade sanctions will simplyforce children into worse formsof employment.
The only long-term route toeliminating child labor is economicgrowth and poverty reduction.However, effectively designedeconomic incentives can affectparents’ and employers’ behavior inthe interim. One approach is toprovide financial incentives to poorparents to keep their children inschool. These stipends must berelatively close to the child’spotential earnings. In manycountries, the stipend paid to keepgirls, especially teenagers, in schoolmust be higher than for boys.
In Mexico, a pioneering programcalled Progresa that pays parents tokeep their children—particularlydaughters—in school has hadconsiderable success. Since itsinception on 8 August 1997, Progresahas raised school attendance ofchildren through educational grants,which are given out to children ofbeneficiary families who are betweenthe third and ninth grades. Duringthe school year beginning in 1998,Progresa gave educational grants to1.7 million boys and girls. In the nextschool year, which began in August1999, the number of childrenreceiving grants is expected toincrease to 2.2 million boys and girls(SEDESOL 1999). Progresa alsosuccessfully narrowed the gender gap
in education by giving girls at thesecondary level slightly higher grantsthan boys. This is to compensate forthe fact that girls tend to dropout of school at a younger agethan boys.
However, such schemes requiresubstantial public investment. Infiscally constrained poor countries, theresources are difficult to mobilize.One economically sensible—althoughpolitically challenging—option wouldbe to reduce the money spentsubsidizing tertiary education, whichtends to benefit the rich elite.
An alternative approach is privatecollaboration between employers andthe child who is employed. InBangladesh, for instance, garmentmanufacturers—in collaboration withnongovernmental organizations—have established school facilities forworking children.
Evidence suggests that workingchildren have considerably lowereducational attainments than non-working children. However, even aninferior education is better than noeducation at all. It is also betterthan the malnutrition that couldresult from a sizeable drop in thefamily’s income.
Moreover, it is worth notingthat in some poor countries the choicebetween school and work is irrelevant,because access to effective schoolingfacilities is not available. In many partsof rural India, for instance, there are nofunctioning schools. Parents, quiterationally, view a child’s early entryinto the labor market as morebeneficial than time wasted in a schoolwith permanently absent or chronicallyill-qualified teachers.
Box 3.7 What Can be Done About Child Labor?
213THE SOCIAL CHALLENGE IN ASIA
dollarization, are superior to flexible exchange ratesin terms of avoiding crises and in terms of facilitatingadjustment during a crisis. Opening up an economyto short-term capital flows is viewed as a bad idea whendomestic banking and financial systems are weak, andsupervisory and regulatory standards are lacking.
In summary, prudent macroeconomic manage-ment provides a strong underpinning to efforts aimedat promoting inclusive growth in an economy.Numerous studies confirm that economies that haveadopted open trade policies and practiced prudentmacroeconomic management have grown morerapidly than those that did not. Moreover, followingprudent macroeconomic policies enables economiesto better handle crises emanating from economicshocks. If previous budget surpluses exist, an economyaffected by a systemic financial and banking crisis isable to recapitalize its banking system.
Investing in Human and PhysicalInvesting in Human and PhysicalInvesting in Human and PhysicalInvesting in Human and PhysicalInvesting in Human and PhysicalInfrastructure, Rural Development,Infrastructure, Rural Development,Infrastructure, Rural Development,Infrastructure, Rural Development,Infrastructure, Rural Development,and Microcreditand Microcreditand Microcreditand Microcreditand Microcredit
Investment plays a central role in adding to theresource base for economic activity and in providingpeople better life opportunities. This section considersfour types of investment: in human capital, inphysical infrastructure, in rural development, andin microcredit.
Human Capital. Most governments are active as bothfinanciers and providers of social services. Thefinancing and provision of these services can be mademore effective, however. One way is to recognizesynergies that exist between various investments inhuman capital. Investments in education, particularlygirls’ schooling, for example, simultaneously promoteimprovements in health, nutrition, and familyplanning as girls enter reproductive ages (see box 3.8).Investments in family planning that enable widerspacing of births and reductions in fertility are associ-ated with improvements in maternal and child health,nutrition, and education. Reductions in fertility freeup both household and government resources, andfacilitate a shift in human capital investments awayfrom quantity and toward higher quality. Investmentsin health and nutrition improve the productivity of
children in school, and support fertility declines byreducing levels of child mortality. These synergiessuggest that an integrated approach to investments inhuman capital is required.
Because public resources are limited provisionof social services must be targeted to those areas wherethe divergence between private and social returns aregreatest, and to those people who cannot afford theseservices on their own. In the health sector, publicfinance should focus on public health interventionstargeted at combating communicable diseases andinfections carried by water and food through suchrelatively inexpensive health interventions as healtheducation, immunizations, and screening. HIV/AIDS,in particular, deserves special attention, especiallyin countries such as Cambodia, India, Lao PDR,Myanmar, and Thailand, which have among the mostserious HIV epidemics in the world. In the educationsector, there is scope for reallocating public financestoward primary education and away from highereducation.
Investing in human capital is not just an issue ofallocating more public resources to the appropriatetypes of health interventions or levels of education. Italso requires a fundamental change in the institutionalsetting, including the incentive structures under whichsocial services such as health and education operate.
A growing body of evidence from around thedeveloping world shows that nongovernmentproviders, including the private sector, deliver socialservices more effectively than the government (seebox 3.9). This suggests that governments would dowell to remove the explicit and implicit restrictions—such as regulatory barriers, stringent financial require-ments, and stricter standards—from private andnongovernment provision of health and educationservices. These constraints often mean that govern-ment and nongovernment providers of social servicesare not operating on a level playing field. The oppor-tunity cost of these restrictions is high, because thepresence of nongovernment providers in the healthand education sectors not only improves householdaccess to schooling and health opportunities at littleor no cost to the government, but also introducescompetition, thereby raising the quality of services.
The studies that show superior performance ofnongovernment providers of social services, especially

ASIAN DEVELOPMENT OUTLOOK 2000214
in education, also help explain why governmentprovision seems to be lacking. One reason for thedifferences between public and private schools, forinstance, is that headmasters in private schoolstypically have greater control over school-leveldecisions that influence student outcomes, such asselecting teachers, textbooks, and curriculum (Jimenezand Lockheed 1995). When coupled with the fact thatheadmasters in private schools are ultimatelyaccountable to students’ parents, they have every
incentive to control school-level decisions in a waycompatible with parents’ interests.
Reforming the incentive structures of govern-ment providers of social services so that they becomemore responsive to the needs of the people they aremeant to serve is likely to lead to large payoffs. Oneway to achieve this is decentralizing decisionmakingand finance to local levels. Decentralization is by nomeans a panacea, however. Simply decentralizingfinances to lower levels of government may exacerbate
Numerous studies for developingcountries have found a positiveassociation between maternaland child schooling. Thisrelationship is surprisingly robusteven when considering familycharacteristics, such as incomeand paternal schooling.
One explanation is thatmothers help their children athome, complementing theeducation received at school, andbetter-educated mothers are betterable to teach their children. Analternative explanation is thatwomen, perhaps because ofmaternal altruism, prefer to allocatemore resources to children thantheir husbands do. A better-educated woman is more likely tohave employment outside thehousehold, which in turn likelyincreases her control over theallocation of family resources, andshe chooses to devote more resourcesto her children’s education.
These two explanations haveimportant but different implicationsfor development policies. If the firstis correct, then maternal educationwill have a direct and immediateimpact on children’s education,regardless of outside employmentopportunities for women. However,
if the second explanation is correct,then women’s education will lead tobetter education of children only iflabor market opportunities exist forwomen. In many poor countries, suchoutside female employmentopportunities are limited, anddesigning specific programinterventions to create suchopportunities is not easy. Until suchopportunities can be created, if thesecond explanation is correct, inthose countries with little jobopportunity for women, femaleeducation will not help improvechildren’s education.
What is the situation in India? Arecent study drew a large householddata set from rural India covering 15years when the Green Revolutiontook place. The study found that theeducation of farmers played animportant role in the adoption andefficient use of this new seed-fertilizertechnology. However, the farmers aregenerally male, and as women did notusually participate in farmmanagement, the education of wivesdid not affect the use of the newtechnology. Similarly, rural Indiaoffered few employmentopportunities for educated wivesoutside the household. As femaleeducation neither expanded income
opportunities outside the householdnor contributed to increased farmincomes, it could be considered awaste of resources.
However, the demand for literatewives in rural India increased afterthe advent of the Green Revolution.The study concluded that thisincrease in demand was apparently a“derived demand.” Educated wiveshad an advantage over uneducatedwomen in educating children, andspent more time on such activities ashelping children with homework. Forfarmers coming from areas withtechnical change, where high-yielding variety seeds wereintroduced, education had apecuniary value, because onlyeducated people could successfullyuse the new technologies. Therefore,the demand increased for educatedwives who could improve educationaloutcomes for children.
The evidence from rural Indiasuggests that even if women do nothave any labor market opportunities,they can make a direct contributionto improving children’s education.However, if outside employmentopportunities exist for women,education may have even moreeffect on educational outcomesof the children.
Box 3.8 Mother’s Schooling Always Helps Children’s Education
Source: Behrman and others (1999).

215THE SOCIAL CHALLENGE IN ASIA
existing inequities, or may simply shift “the same oldproblems” to levels even less capable of resolving them.Nonetheless, if the capacity of local governments canbe improved, then decentralization is a promising routetoward more effective delivery of social services.
Infrastructure. Infrastructure investments have animportant role to play in confronting Asia’s socialchallenges. As described earlier, infrastructure invest-ments enhance quality of life directly, in addition tocontributing to inclusive economic growth.
While virtually all developingeconomies in Asia have madeimpressive strides in expanding thecoverage of education, particularly atthe primary level, many problemsremain even in areas whereschooling is available. High rates ofdropout; grade repetition; and lowlearning outcomes, even amongthose who complete schooling cycles,remain serious issues. One of thefactors responsible is the relative lackof attention policymakers devote toeducation quality. Schools withinadequately trained teachers andlimited supplies of textbooks andother teaching materials are,unfortunately, only too commonacross Asia’s developing economies.
Although channeling greaterpublic resources toward publicschools is part of the solution, agrowing number of experts believethat it is also important to makemajor changes in the institutionalsetting under which public schoolingis currently delivered. In particular,an increasing body of research findsthat private schools are moreefficient, and suggests that it is notonly better resources that accountfor this differential. Some expertsargue that because private schoolsenjoy relatively high degrees ofautonomy in management and areultimately accountable to parentswho pay the school fees, they aremore responsive to the needs of theirpupils. In contrast, public schools are
Box 3.9 Are Private Schools Better than Public Schools?
characterized by a lack of managerialautonomy: typically, they must makedecisions in accordance with strictguidelines set by ministries ofeducation. They also rely ongovernment funding, which is usuallynot linked to performance, and arelargely unaccountable to parents.
Because these argumentspotentially have dramaticimplications for the management ofpublic schools, it is important toevaluate them rigorously. Fewerdropouts or higher test scores inprivate schools do not necessarilyindicate a deficiency in themanagement of public schools, evenif the two operate with similar perstudent costs. If students with betterabilities or from families able toprovide a more conduciveatmosphere for studying chooseprivate schools, then those schoolscould seem more efficient even if theeducational services at the twoschools were identical. A carefulcomparison of public and privateschools, while taking into accountthe effects of innate student abilityand the possibility of nonrandomselection across school types, wasmade in a study for a district in UttarPradesh state in Northern India.
The results suggest that studentswith a higher likelihood ofperforming better systematicallychoose to attend private schools.Thus, a raw comparison of test scoresacross public and private schools
could be misleading. However, not allof the difference in scores wasattributable to student and familycharacteristics. Between 10 to 19percent of higher student scores at afully private school can be attributedto school influences. Moreover, thesuperior performance of privateschools cannot be attributed to largerexpenditure outlays. While capitalexpenditures across public andprivate schools are similar, privateschools have annual recurrentexpenditures that are less than halfthose of public schools. Privateschools achieve superior costeffectiveness partly by paying teachersless than the high government-prescribed salaries, and by havinghigher pupil-teacher ratios thanpublic schools.
The study concludes that greaterschool-level autonomy indecisionmaking, aimed at givingschool administrators more freedomin hiring, remuneration, andpedagogical decisions, may align theincentives of schools and teachers inways that make them more responsiveto their students. Similarly, removingconstraints on entry into privateschools—an important problem inmany countries—would lead to gainsin efficiency because private schoolsperform better. It would also be fairer,because if children from better-offhouseholds select into superiorprivate schools, more public moneycould be targeted toward the poor.
Source: Kingdon (1996).
ASIAN DEVELOPMENT OUTLOOK 2000216
Despite this, private markets do not provideenough infrastructure investments. This may bebecause they are “non-rival” goods, which means thatconsumption by one user does not reduce the supplyfor others. A road, for instance, can be used by ahundred people as easily as by one. These are also“non-excludable” goods, meaning it is difficult toprevent those who have not paid for the service fromreaping its benefits. Investments in flood control in alow area, for instance, benefit everybody who livesthere, regardless of who paid for the flood control.Infrastructure investments such as laying undergroundwater pipes or electric cables can also involvesubstantial fixed costs, which can make it cheaper forone provider to serve a market than for two or more.In such cases, a natural monopoly exists, and somegovernments have been wary of allowing the privatesector to provide the infrastructure in question.
Because of these specific characteristics, invest-ments in infrastructure in developing Asian economieshave been undertaken mostly by state-owned entities.However, for several reasons it is neither possible nordesirable for governments to continue to be involvedin the area of infrastructure services as deeply as theyhave been. The need for infrastructure services is sogreat in the region that governments do not have thenecessary resources for financing, and governmentoperation and management of infrastructure serviceshas often been highly inefficient. Services havetypically been provided at well below supply cost,making it virtually impossible to apply sound commer-cial principles to operations. Subsidized infrastructure,in turn, encourages wasteful usage and contributes toserious fiscal imbalances. It does not, however, benefitthe poor. Evidence from around the developing worldshows that infrastructure subsidies, especially thoseapplied through price subsidies, benefit the nonpoormuch more than the poor.
The economic and technological characteristicsof many types of infrastructure allow them to beprovided extremely efficiently by the private sector.Rural roadways, for example, are likely to beunderprovided by private markets, but that is notnecessarily the case for long-distance telecom-munication services.
Given their different infrastructure require-ments, Asia’s developing economies need an effective
public-private partnership in infrastructure provision.Such a partnership would emphasize applyingcommercial principles to the operation of infrastruc-ture services, and foster competition by appropriatelyregulating the private sector providers of infrastruc-ture. It would also ensure that user fees are not onlyrecoverable, but also set fairly.
Local governments and communities would bebrought into the decisionmaking process ofinfrastructure provision. Growing evidence shows thatparticipatory approaches to delivering infrastructurehave improved performance and quality of the infra-structure provided and the impact on the poor. Whenan ADB-financed high-speed toll road in the PRC wasdesigned to include roads connecting the expresswayto poor counties in Hebei, only after the intendedbeneficiaries—the poor—were involved in thedecisionmaking process did it become clear the projectwould only help them if village access roads were added(ADB 1998a). Another study of 121 rural water supplyprojects in 49 countries found that 68 percent of theprojects that enjoyed a high level of beneficiary par-ticipation were successful, compared to only 12 per-cent among those with low beneficiary involvement(Isham, Narayan, and Pritchett 1995).
Agriculture and Rural Development. Despite Asia’sprogress in alleviating poverty and overcoming othersocial challenges over the last four decades, depriva-tion remains overwhelmingly a rural problem. Morethan three fourths of the people below the povertyline in Asia live in rural areas, and are mostly employedin or dependent on agriculture. Clearly, in the battleagainst poverty and related social challenges, the trans-formation of the rural economy—and its integrationwith the modern sector—is crucial.
The transformation of the rural economy wouldrequire liberalization of markets to allow greaterinternal and external competition. In the past, manygovernments in developing Asia, in particular in SouthAsia, pursued an inward-oriented strategy ofdevelopment. This strategy adopted a structure oftrade protection and an exchange rate regime thatoffered negative protection to agriculture. However,in recent years, most Asian economies have adopteda more neutral policy stance that attempts to correctthe anti-agricultural bias in trade and exchange rates,

217THE SOCIAL CHALLENGE IN ASIA
and to dismantle the various state interventions suchas input and credit subsidies and price and marketingsupport. The impact of these market liberalizationpolicies has been positive, and often dramatic, as inthe PRC.
Liberalization of markets alone will not trans-form the rural economy. Governments must play amore active role in providing the critical public goods,such as agricultural research, extension services, andrural infrastructure. In rural areas, providing the righttype of infrastructure can go a long way towardexpanding the market opportunities available to therural poor by raising farm productivity and providingnew opportunities for nonfarm employment. Onestudy of rural districts in India found that the combinedimpact of services provided by rural roadways andmodern irrigation projects positively affected agricul-tural yields and the ability of farmers to access markets(World Bank 1994). One unanticipated benefit of ruralroads was to lower banks’ costs of operating in therural areas, which, in turn, facilitated the expansionof rural credit and enabled farmers to borrow topurchase productivity-improving fertilizer. Similarly,infrastructure services related to transportation,telecommunications, and power at the village levelhad been a key ingredient of the PRC’s success inpromoting rural enterprises, which now account formore than a third of national output and about a fifthof the labor force.
Microcredit. The poor, especially the rural poor, lackaccess to credit. Outside agencies (banks or govern-ments) lack the local information that allows them toeasily identify good credit risks. When information oncreditworthiness is lacking, the cost of monitoringnumerous small loans is high, and banks must demandcollateral from borrowers. This effectively excludesthe poor.
Governments can improve access to credit forthe poorest by subsidizing credit and by fosteringspecific market-oriented financial services targeted atthe poor.
The effectiveness of subsidized credit isquestionable. In the Integrated Rural DevelopmentProgram, a large credit program in India, for example,wealthier borrowers succeeded in capturing most ofthe credit subsidies intended for the poor, while
underpriced credit encouraged the inefficient use ofcapital (Bardhan 1996a). By 1986, repayment rateshad fallen to 41 percent, and the program had becomea costly and poorly targeted transfer program(Morduch 1999a).
The alternative is to improve credit markets.One way would be to provide the poor with collateral.This could be done by giving poor people a lump-sumtransfer (or even a ration card) to be used as collateral.The collateral will provide a strong incentive forrepayment that is absent with unsecured loans.Another option is to overcome the monitoringproblems cited above through peer-monitoring loans.Asian countries, particularly Bangladesh, havepioneered these efforts, and the first and most famousprogram of this type was the Grameen Bankin Bangladesh.
The Grameen Bank lends money to the land-less poor, and especially to impoverished women. Itstarted commercial operations in 1983, and by 1998,had amassed approximately $100 million in equity and$275 million in outstanding loan portfolio. It has lentmore than $2 billion to 2.3 million low-incomeborrowers in rural Bangladesh, of which 94 percentare women, spread across 37,000 villages. Loanrecovery rate has been a high 98 percent, especiallyimpressive when compared with a rate of approxi-mately 25 percent for the country’s commercial andagricultural development banks.
The Grameen Bank’s business strategy is basedon the voluntary formation of small groups of aboutfive individuals to provide mutual, morally bindinggroup guarantees in lieu of the collateral required byconventional banks. If any member of the groupdefaults, all are cut off from new lending until the out-standing debt is repaid. In this way, the social capitalin closely-knit communities is mobilized to monitorthe actions of borrowers, press them to repay loans,and impose sanctions against those who do not. Othermicrocredit institutions modeled after Grameen Bankserve an additional 2 million clients in Bangladesh.
Similar group-based lending programs have beenimplemented in more than 45 countries. Onecontroversial question about microcredit programs,however, is whether they can make a permanent denton poverty. Several studies have concluded that house-holds with Grameen Bank credit saw significant

ASIAN DEVELOPMENT OUTLOOK 2000218
improvements in welfare. Not only did the borrowershave higher income and consumption, but they alsomanaged to provide better schooling for their children,especially girls, and had a higher use of contracep-tives and lower rate of fertility. However, other authorshave found methodological faults with those studies,and found no impact on income and consumption.What is not controversial, however, is that theGrameen credit had indeed reduced consumptionvariability, which has an important bearing on thewelfare of the poor.
Questions have also been raised about thefinancial viability of the Grameen program, which isheavily dependent on subsidies from the governmentand donors. There appears to be a critical tradeoffbetween profitability and subsidies. Bolivia’s BancoSoland Indonesia’s Bank Rakyat Indonesia (Morduch1999a, b) both earn profit, but mainly by serving richerclients as well as the poor. If a microcredit programserves only the poor, then financial sustainability islikely to remain a problem. Microcredit is not a magicwand that will transform the poor into dynamicentrepreneurs, but it does play an important functionin smoothing poor people’s consumption andsafeguarding them from the worst consequencesof poverty.
Improving Governance and PImproving Governance and PImproving Governance and PImproving Governance and PImproving Governance and Participationarticipationarticipationarticipationarticipation
More than anything else, Asia’s success in overcomingits social challenge will depend on the quality of itsgovernance. Governance encompasses not only theinstitutional arrangements through which govern-ments are chosen and replaced, but also the ability ofthose in power to formulate appropriate policies andimplement them effectively. It also includes themanner and extent to which ordinary people are ableto voice their opinions and affect the decisions thatinfluence their lives.
Democracy and Civil Liberties. With rising incomes,education, and awareness of other more inclusivesystems of government, demand will increase in Asiafor more democratic forms of government and the civilliberties that go with it. What impact will this haveon Asia’s social challenge? Greater civil and politicalliberties—the freedom to express oneself; the freedom
to form and join organizations, political, or otherwise;and the freedom of the press—will directly improvethe well-being of Asians. The connections betweendemocracy and the various forms of deprivation,including poverty, are complex. Some of the mostspectacular achievements in poverty reduction havetaken place in East and Southeast Asian countriesunder regimes that are not necessarily democratic.Conversely, India—a democracy since it gainedindependence—has a less impressive record inpoverty reduction.
It appears that democracy, with its characteristicsof transparency, accountability, and consensusformation, can avoid some of the worst forms of rentseeking and predation associated with many authori-tarian regimes. At the same time, democracy can bestymied with political deadlock and the lengthy andcumbersome process of consensus building, and canbe hijacked by special interest groups. On balance,however, it is difficult to argue that less democracy isbetter for economic growth and poverty reduction.The fact that some authoritarian regimes have beenable to generate growth and translate it into large andtangible improvements in the lives of the poor mustbe balanced with the performance of other authori-tarian regimes, where rulers have used their power tosteal national wealth and carry out unproductiveinvestments. Authoritarian regimes are associated withboth the best and worst of performances in economicgrowth and poverty reduction.
Nonetheless, democracies clearly vary in theirperformance in poverty reduction. Part of thisvariation depends on the participation of the poor inthe political decisionmaking process. The level ofdecentralization and the quality of civil society and itslegal and judicial institutions all affect how muchdemocracy promotes poverty reduction. The legal andjudicial system safeguards citizens, the poor included,from an abuse of power by the state or other agents.The rule of law—in the form of enforced contractsand clear property rights—is associated with higherlevel of economic growth (Barro 1996).
Decentralization. The demand for greater democracyis mirrored by calls for greater decentralization inpolitical, fiscal, and administrative matters.Decentralization holds much promise. Greater

219THE SOCIAL CHALLENGE IN ASIA
local control over decisionmaking may improve thedelivery of various social and infrastructure services.Local involvement can provide incentives andinformation for improving the quality and cost-effectiveness of programs. However, there is noguarantee that decentralization will lead to superioroutcomes, especially for disadvantaged peoplesand regions.
In particular, there is a danger that decentralizedsettings may exacerbate existing inequities acrosshouseholds and regions. For example, poorer regionswith a low tax base may not be able to raise adequaterevenues if finance is decentralized. There is also adanger that landlords and other local elites may moreeffectively dominate local politics than nationalpolitics. Gender disparity may be a problem underdecentralization, because available evidence suggeststhat it has a strong local component (Filmer, King,and Pritchett 1998). In the absence of central controls,women and girls may have less than equal access tobasic services such as education and health care. Whilethe dangers are very real, the benefits from de-centralization designed and executed appropriately aretoo great to ignore, however.
Tendencies toward worsening inequities andpower capture by local elites need to be dealt withhead on. Decentralization requires an effectivemechanism for transferring resources from relativelywealthy localities to relatively poor ones. However,the transfer of resources should be based on hard-budget constraints. Local governments must retain areal resource stake in the activities and services theyare providing. It is difficult to involve communities inthe management of social services if they are not alsoproviding a substantial share of funding. At the sametime, public subsidies (whether from the national levelor local) should take the form of demand-side financerather than supply-side finance. For example, in thecase of schools, subsidies could follow students ratherthan schools through a system of vouchers.
In combating the capture of power by local elites,it is important to institute regular public meetings atthe local level, such as in the village or municipal town.In these meetings, major items of expenditure couldbe publicly discussed and accounted for. In parts ofIndia there is, for example, a growing movementcalling for a Freedom of Information Act.
With respect to the issue of gender and castedisparities, some experiments in India with therelatively new panchayati raj councils—elected villageand urban councils with control over a wide range ofsocial and developmental activities—suggest somepossible solutions. In particular, the law requires thata third of the elected council members be women. Inaddition, the scheduled castes and tribes must berepresented on councils in proportion to their sharein the population. While traditional patterns ofdiscrimination are difficult to break and womencouncil members may still be manipulated by men inregions where gender disparity is high, the evidencesuggests that women are increasingly becomingconscious of their rights and are beginning to actmore independently.
Enhanced Participation. A key aspect of decentrali-zation is the emphasis on introducing local knowledgeand local sensitivities into decisionmaking. For this totake place effectively, local people must participate inthe decisions that are intended to influence their lives.However, mobilizing such participation is not easy andrequires nurturing the institutions of civil society.
Civil society organizations have variousadvantages. They can often substitute for corrupt andineffective governments in delivering needed servicesto the poor. Given their knowledge of the locality, civilsociety organizations or nongovernmental organizations(NGOs) are able to distinguish between the “deserv-ing” and the “undeserving,” and may have less cor-ruption. NGOs can also serve an essential role in thepolitical process, promoting empowerment among thepoor and lobbying governments to change policies andto direct more resources to eradicate poverty. Becausepoor people have relatively little political power, theirneeds tend to be neglected when the location of roads,schools, and health facilities is decided.
Nonetheless, it is not clear that civil societyorganizations always live up to this promise. Most ofthese organizations offer high-quality services, butsome do not. Some suffer from inadequate communityparticipation and poor accountability. Some NGOsand governments have long histories of mutual mis-trust. Others act in isolation, setting up their ownfiefdoms. One evaluation of an anti-poverty programin the Philippines implemented by a large NGO found

ASIAN DEVELOPMENT OUTLOOK 2000220
that only about one third of the program’s beneficia-ries were poor. More surprisingly, about one third ofthe beneficiaries had incomes ranging from three tomore than 20 times the official poverty line (Balisacan1997). Even the evidence on corruption among NGOsis unclear.
It is difficult to generalize about how muchNGOs contribute to poverty reduction. In somecountries and in some sectors, they have done excel-lent jobs; while in other countries and other sectors,they have not. Overall, they offer a new institutionalarrangement for providing public goods, and have beena positive force in improving governance. Individually,each organization must be considered in terms of itsown merit and past performance.
Social Safety NetsSocial Safety NetsSocial Safety NetsSocial Safety NetsSocial Safety Nets
The recent financial crisis has emphasized that noteven the most dynamic Asian economies, let alonethe poor ones, had an adequate system of safety nets.As this chapter has shown, formal social assistancecoverage is relatively low; these countries instead relyheavily on informal family-based networks. Conse-quently, there is considerable debate within the regionabout whether to extend formal safety nets, and howto do so.
These formal programs include unemploymentinsurance, old-age pension and social assistance, publicworks and social funds, health insurance and cropinsurance, and other agriculture stabilization measures.
Unemployment Insurance. Unemployment insuranceprograms are intended to cushion against such labormarket risks as job loss, disability, and ill health. Inmost Asian developing economies, these programs,when they exist, cover only a small portion of the laborforce in the formal sector. The main argument againstintroducing broader unemployment insuranceprograms is that they add to labor costs and may leadto the erosion of international competitiveness andto sluggish employment growth. In addition, high laborcosts in the formal sector encourage growth of theinformal sector.
Although the richer developing economiesof Asia do have the financial and administrativecapacity to introduce a more comprehensive system
of unemployment insurance, it is not feasible forpoorer economies. More appropriate and feasible ac-tions for these countries include means-tested socialassistance and public works programs. Thailand, forinstance, has a system that aims to alleviate povertyamong the unemployed by providing limited trans-fers—in the form of flat benefits—to those close tothe poverty line.
Old-Age Pension and Assistance. In poorer Asiandeveloping economies, only a small portion of the laborforce receives formal pensions. In most countries, theextended family is the principal source of old-agesupport. Given that governments in most poorer Asiandeveloping economies are faced with worsening budgetproblems, it is highly unlikely that the state will beable to bear the full burden of the elderly. Primaryresponsibility lies with the family. However, the higher-income Asian developing economies need to paygreater attention to the needs of the elderly and mustintroduce more comprehensive old-age pension andother social assistance programs such as health care.The design and financing mechanisms for thesepension systems, however, need careful review.
Over the long run, issues such as pension fundgovernance (improving the transparency andefficiency of pension fund management), integrationof public and private retirement income provisions,establishment of financial and pension regulatoryregimes, and expansion of capital markets for privateand institutional investors should be integral elementsof a comprehensive pension reform agenda. Raisingpublic support and awareness of the implications ofdemographic scenarios are also crucial in facilitatingthe reform process.
Social Assistance and Welfare Programs. Socialassistance and welfare programs provide support tothose who do not earn an income sufficient to providefor minimum consumption needs. Pure cash transfersare rare in developing countries, except in times ofdire crisis. Most of these programs are in-kind transferstargeted at specific objectives: schooling, health, ornutrition. Some are common even in the poorer Asiandeveloping economies.
The design and administration of these programsare fraught with many difficulties. The government

221THE SOCIAL CHALLENGE IN ASIA
should finance these programs, but that does notnecessarily mean it should be involved in their actualprovision. Often excessive government involvementin the design, financing, and implementation of socialassistance programs is highly inefficient. For example,the food stamp program in Sri Lanka, where thegovernment is not involved in distribution, is moreefficient than in India, where the government isinvolved. The use of NGOs in the distribution processcan be useful.
To ensure that the provision of such subsidiesis fiscally sustainable, and to minimize distortionsin consumption and production, only those goodsthat are normally consumed by low-income house-holds (such as coarse rice, brown sugar, or genericmedicines) should be subsidized. Such subsidies havebeen successfully implemented in Indonesia and thePhilippines using regional targeting, where only thepoorest villages receive the subsidy; and commodity-specific targeting, where only low-quality foods aresubsidized.
Social Funds and Public Works Programs. Social fundsare agencies funded by national governments anddonors that provide temporary employment for thepoor. They have dual objectives: to transfer incometo the poor and to improve infrastructure. Social fundsoperate at local levels, sometimes through NGOs,usually to improve local infrastructure such as schools,hospitals, and roads. Public works programs are alsodesigned to provide short-term employment to thepoor during economic difficulties and to develop localinfrastructure. However, public works programsoperate on an ad-hoc basis without a permanentgoverning structure and regular funding.
The important attraction of public worksprogram has been their self-targeting nature. As thework is arduous and the wage level is below the marketwage level for unskilled laborers, the public worksusually attract only the poor. Experiences in India andBangladesh suggest that these programs play animportant part in risk management for the poor andthe vulnerable. However, the infrastructure theseprograms build is often unplanned, and inefficientlylocated or designed. These disadvantages can beavoided with more local participation and involve-ment by civil society. Nevertheless, even when the
infrastructures built are unplanned, the very existenceof these public works programs increases the bargainingpower of poor workers, especially those in the rurallabor markets.
Crop Insurance. Crop insurance pools the risks thatfarmers face from various natural disasters. Therationale for government-supported crop insurance isthat it encourages the farmer to pursue high-return,high-risk investments. However, crop insurance is rarein developing countries, and has been fraught withproblems. Farmers, however, can take other measuresthat can largely redress the need for crop insurance,such as diversifying crops and crop varieties andoffering a portion of household labor to off-farmemployment. Many governments have also adoptedfloor prices for agricultural products that act as a formof insurance.
These measures are the main forms of socialsafety net provision that developing economies in Asianeed to consider. Some of these measures already existin rudimentary form in some countries. At issue arewhat new measures should be introduced and howfast, and how far the existing ones should be expanded.No single answer applies to all Asian developingeconomies, however. In devising an appropriate safetynet program, each country must consider the natureof risks its poor face, as well as the financial andadministrative capacity of the government and thenature and extent of private safety nets.
Redistributing Assets, Affirmative Actions,Redistributing Assets, Affirmative Actions,Redistributing Assets, Affirmative Actions,Redistributing Assets, Affirmative Actions,Redistributing Assets, Affirmative Actions,and Tand Tand Tand Tand Targetingargetingargetingargetingargeting
This section considers additional methods of helpingthe poor directly: asset redistribution, particularly landreform; and affirmative action. Both offer radicalpotential methods to improve the situation of thepoorest, but considerable controversy surrounds boththe political feasibility as well as the economicefficiency of these approaches. Finally, the advantagesand difficulties of targeted transfers and socialprograms are explored.
Land Reform. Land reform includes both landredistribution and tenancy reforms. Land redistribu-tion can mean giving land from those who own more
ASIAN DEVELOPMENT OUTLOOK 2000222
than a legal limit to those with less or no land, orgranting ownership rights to those who are currentlycultivating the land. Tenancy reform can include bothchanges in the share of output received by the tenantand the provision of greater tenurial security. Policiesrelating to land consolidation, land titling, land recla-mation, and reforestation—which often have a strongeffect on growth and equity—are sometimes includedunder the rubric of land reform. However, this sectiondoes not address those issues.
There are two main arguments in favor of landreform: equity and efficiency. The equity argumentsuggests that a fairer distribution of land or improvedterms of contract in tenancy in favor of the tenantwould lead to better income distribution, and so reducepoverty. The efficiency argument suggests that landdistribution or improved tenancy contracts leads togreater economic productivity, which in turn will helpreduce poverty.
The argument that land reform increasesproductivity assumes that large farms are lessproductive than small farms. In traditional agriculture(as distinct from plantation agriculture), small farmshave lower labor costs than large farms, as much ofthe labor in a small farm is mobilized from within thefamily. Some empirical evidence supports thisargument: in Punjab, Pakistan, for example, theproductivity of the largest farms measured by valueadded per unit of land was less than 40 percentof that in the second smallest size group (Banerjee1999). In Malaysia, the corresponding ratio was67 percent.
In addition to purely economic arguments,redistributive land reform has often been advocatedon grounds of political economy. Land reform oftenhelps change the local political structure, replacingthe traditional dominance of the landlord with astructure that is more equitable and diffused. In atraditional rural economy, one of the motives for largelandholdings stems from the disproportionate politicalpower they confer. In such an environment, landreform gives the poor a voice, and creates anenvironment in which the rich are less able to capturethe benefits of government projects intended for thepoor. Local labor and products markets might alsofunction better when landlords are not in a positionto dominate them.
The main argument for tenancy reform is thatshare tenants are presumed to be less efficient thanthe owner-farmers because tenants have less incentiveto work hard on the rented land because part of theoutput is taken by the landlord. The larger the shareof the tenant’s output, the greater his incentive towork. However, there are other ways to overcome thedisincentive effect of sharecropping, including directmonitoring of the tenant’s effort (when the landlordsare present) or sharing costs of inputs. In addition,share tenancy provides some risk-sharing advantagesthat are not available to fixed rental contracts or ownercultivation. The empirical evidence on farmproductivity does not suggest that sharecropping isinefficient (Rashid and Quibria 1995). Many of theobserved differences in productivity across farms underdifferent types of tenurial arrangement may, forinstance, also be due to unobserved differences inland quality.
In most Asian countries, the experience withtenancy reform has not been good. One exceptionseems to be West Bengal, India, where a tenancyreform program called Operation Barga wasintroduced in 1977. It raised the share of outputreceived by the tenant from 50 to 70 percent(Banerjee, Gertler, and Ghatak 1998). By 1982, thereform covered about one half of the state’s share-croppers, who account for about half of the totalcropped area. Over the next decade, West Bengalachieved a breakthrough in agricultural production.One estimate suggests that more than a third of WestBengal’s production growth from 1981-1992 resultedfrom this tenancy reform. However, other analyses oftenancy reform in India have not found any positiveeffect on productivity.
Despite its putative economic benefits, there aremajor political constraints on land reform. Mostsignificantly, land redistribution has been associatedwith the termination of colonial rule or politicalupheavals. The much-discussed land reform in Koreaand Taipei,China was imposed by outside forces. Veryfew successful land reform efforts have been launchedin democracies and in peacetime. Given theselimitations, one option is to undertake market-basedland reform. Voluntary land reform with full com-pensation, as in Zimbabwe and the Philippines, is veryexpensive, however, and implies that little land will

223THE SOCIAL CHALLENGE IN ASIA
be redistributed. Additionally, the worst land is usuallysold to the state, and if the beneficiaries pay the costof compensation over time, their net asset situation isnot much improved.
Unless accompanied by other measures, landredistribution or tenancy reforms may not yield thefull productivity benefits of land reform. Land reformshould ideally be accompanied by programs thatattempt to deliver some of the services landlordsprovide to small farmers. Landlords are often the mainsource of credit and other inputs, including farmingadvice. Land reform may reduce or eliminate accessto these inputs, and unless governments make up forthis loss by providing support in such areas as research,credit and extension, crop insurance, and emergencyincome assistance (such as food-for-work programs),the impact on productive efficiency remains uncertain.
In sum, there are economies in Asia, notablyKorea and Taipei,China, where early land reformprograms may have had a positive impact on efficiencyand growth. However, it is not a prerequisite forreducing poverty. Countries such as Indonesia,Malaysia, and Thailand, with little or no land reform,grew briskly and saw rapid reductions in poverty. Noris land reform necessarily an efficient tool of povertyreduction, as it often imposes heavy financial, bureau-cratic, and political demands. A government that isstrong enough to implement a coercive land reformprogram should be able to impose and enforce thenecessary taxes to produce a more equitable distri-bution of income and wealth.
Affirmative Action. Many developing Asian countrieshave adopted various types of affirmative actionpolicies to address different types of social discrimina-tion arising from ethnic, gender, caste, and religiousdiversities. In India, for example, tribal people areeligible for special development assistance under theTribal Sub-Plan, jointly funded and administered bythe central and state governments (World Bank 1998).Malaysia has made extensive use of affirmative actionto address problems of economic disparity betweenMalays, Indians, and Chinese. The New EconomicPolicy, introduced under the Second Malaysia Plan in1973, sought to reduce poverty as well as differencesin economic conditions among racial groups byexpanding primary education and health care and
eliminating differences in employment and assetownership. It was extremely successful: between 1973and 1987, poverty among Malays fell from 55 to21 percent, among Chinese from 20 to 4 percent, andamong Indians from 28 to 9 percent (Ahuja andothers 1997).
Affirmative action programs have often beencriticized on grounds of inefficiency. However, suchcriticism has little or no empirical support, and theMalaysian experience suggests that affirmative actionpolicies do not harm economic growth. Until therecent financial crisis, Malaysia was one of the fastestgrowing economies in the region. Similarly, evidencefrom the advanced countries, such as the UnitedStates, suggests that affirmative actions had minimaladverse impact on efficiency (although otherundesirable consequences are possible, such asincreased social tensions between the favored groupand the others).
Affirmative action can also be used to closegender disparities. Bangladesh, for instance, hasintroduced various programs including special seatsfor women in Parliament, quotas in the civil service,and scholarships for girls in school. Microcreditprograms targeted at women can reduce genderdisparities in access to financial resources, andsubsidies to health services that benefit primarilywomen (such as family planning services) can beeffective. So, too, can legal changes.
In recent years, many Asian developingcountries adopted legislative measures that aim atredefining women’s roles and granting them equal sta-tus with men. These include equal employment andequal pay laws, as well as statutory provision ofmaternity leave and state-funded childcare.
The most critical element for the success ofaffirmative action measures is the commitment of thegovernment. The countries that have succeeded, suchas Malaysia, have been deeply committed to the goal.Finally, policy efforts in developing Asia in the pastwere focused mostly on preferential affirmative action:measures that give preference to the discriminatedgroup by setting a different threshold of expectationsor by lowering standards of evaluation. However, themore effective means of circumventing social discrimi-nation is developmental affirmative action: measures thatcontribute directly to enhance the performance of

ASIAN DEVELOPMENT OUTLOOK 2000224
the discriminated group so it can compete on equalfooting (Loury 1999).
Targeting. The idea of targeting social protectionprograms toward the most needy recipients isappealing, as social assistance is cheaper if it goes onlyto those who most need it. Taxpayers are more likelyto support programs they know are not diverted toundeserving beneficiaries. In practice, however,targeting can be expensive and ineffective. Theadministrative costs of ensuring that a social programis narrowly targeted can be high (Gelbach and Pritchett1997; van de Walle 1998). The introduction of targetedassistance can induce people to change their behav-ior to qualify—for instance, by altering their workpatterns so they can be considered poor. Under cer-tain conditions, it can also undermine the politicalsupport for transfers: sometimes voters support a socialprogram if and only if they personally benefit. Usefultargeting efforts must avoid these pitfalls.
The most accurate and expensive method oftargeting is formal means testing. This usually involvesadministering a questionnaire or conducting aninterview about the potential recipient’s job status,earnings, education, and assets. Cost considerationsensure that means testing is generally only applicableto those employed in the formal sector where employ-ment and earnings information can easily be validated.In Asia, formal means testing is confined to relativelydeveloped countries, such as Korea.
Informal means testing—usually the preparationof lists of the poor by village leaders—is common inIndonesia, Thailand, and Viet Nam. “Proxy” or“indicator” targeting bases eligibility on easily verifiablecharacteristics closely related to poverty, such as race,number of children, gender of household head, orlocation of residence. Malaysia, for instance, has reliedon racial targeting for decades, while PRC, Indonesia,and Viet Nam have extensively used geographicalindicators. Although systematic evaluations of thesesystems are rare, the available information suggeststhat they are not very accurate.
Self-targeting is another low-cost option that iswidely used in food-for-work and public worksprograms. Setting the wage well below the local marketwage for unskilled labor ensures that it is only the verypoor who are attracted to such programs. Similarly,
confining food subsidies to items such as coarse grains,which are consumed primarily by the poor, is anotherform of self-targeting.
CONCLCONCLCONCLCONCLCONCLUSIONSUSIONSUSIONSUSIONSUSIONS
Developing Asia ended the 20th century with muchto be proud of. In the early 1970s, more than half theregion was poor, only two out of five adults wereliterate, and the average Asian could expect to livejust 48 years. Today the share of poor people is downto almost one fourth, 70 percent of adults are literate,and life expectancy is up to 65 years. Yet, as thediscussion in this chapter has shown, developing Asiastill faces an enormous social challenge. There arehuge differentials in human well-being betweencountries, between regions, and between socialgroups. Two-thirds of the developing world’s poor stilllive in Asia.
As the region enters the 21st century, it faces afast-changing global and domestic environment. Threebroad trends—globalization, information technology,and democratization—are changing the environmentAsia faces.
This new globalizing world offers ever-greatermarkets for trade and foreign investment. As therecent crises so dramatically showed, however, greaterintegration also increases economic vulnerabilities.Similarly, the explosion of information technology canbe a potentially powerful tool in Asia’s efforts atpoverty reduction—although it could also generategreater social inequalities both across and withinnations. Democracy and pluralism bring huge potentialbenefits, but also carry risks. Asian countries areenjoying rapid growth in democratic participation, andthere has been a phenomenal rise in the prominenceof civil society organizations. This offers the potentialfor better, more accountable governance, but alsoincreases the difficulty of creating consensus infavor of difficult policies within the parameters ofelectoral politics.
In this new global and national context, whatneeds to be accomplished to meet the social challengein Asia? Promoting economic growth remains the bestpath to poverty reduction. If developing Asia cancontinue with its historical trend in economicgrowth—and if there is no substantial increase in

225THE SOCIAL CHALLENGE IN ASIA
inequality—it will be largely free of poverty by 2025(ADB 1997). According to a recent World Bankestimate, if Asia can maintain its historical growthtrend, it will be able to more than achieve theInternational Development Goal of the OECDcountries: to reduce by at least one half the numberof people living under the dollar-a-day poverty lineby 2015, relative to 1990. To have a large impact onpoverty reduction, it must be inclusive growth—growth that the poor and disadvantaged share in. Thestrategy to address the social challenge in Asia, ofwhich promoting inclusive economic growth mustremain a critical element, needs to concentrate onthe following policy priorities:
Openness and market orientation: East Asiancountries’ success in economic and social trans-formation is based on market orientation andeconomic openness. This strategy enabled them toexploit new economic possibilities in internationaleconomy, while imposing policy discipline. In today’sintegrated global economy, it is essential that thestrategy of openness and market orientation besupported by prudent macroeconomic policies. Main-taining stable and manageable levels of debt, inflation,and exchange rates is a crucial factor in creating anenvironment conducive to inclusive growth.Moreover, by practicing prudent macroeconomicmanagement, economies will be better equipped tohandle crisis emanating from economic shocks.
Investing in human resources: Investment in humanresource development, particularly education, healthcare, and nutrition, must be an essential componentof Asia’s anti-poverty strategy. Not only do suchinvestments directly improve Asians’ quality of life,but they also boost economic growth.
Investing in physical infrastructure: Asia needsmassive investment in physical infrastructure. Not onlydoes better infrastructure raise the productivity oflabor, but it also has a direct bearing on human well-being. Providing basic water sanitation services tourban slum communities and rural villages, electricity,or a better mass transportation system can allsignificantly improve the quality of life and produc-tivity of the poor.
Improving governance: Asia’s economies need bettergovernance. Democracy, political and civil liberties,and participation are desirable objectives inthemselves, but they are also crucial for effective 21stcentury economies. Good governance requiresadopting a policy framework that is responsive to theneeds of the people. It also means efficient andequitable public expenditure management that resultsin appropriate investments in human resources,physical infrastructure, and social protection. Goodgovernance also leads to efficient decentralization andincreased local management of public resources.
Strengthening social protection: The protection fromthe possibility of being suddenly rendered poor isequally important as measures to help the poor out ofpoverty. Asia needs a more effective social safety net.The recent financial crisis dramatically highlighted theinadequacies of today’s system. All Asian developingeconomies need to develop fiscally prudent programsthat effectively supplement private safety nets.
While Asia’s developing economies must acceptthe burden of responsibility for addressing the region’ssocial challenge, more can, and must, be doneinternationally to address the scourge of poverty andsocial deprivation. In particular, there must be aneffort toward:
Improving the global trading environment: While theglobal trading environment has improved over theyears, there are still too many areas important to poorcountries, particularly textiles and agriculture, whererich-country markets remain encumbered by manytrade restrictions. The use of anti-dumping measuresby advanced countries and the specter of protection-ism in the guise of labor and environment measuresdo not help inspire confidence in poor countries aboutthe fairness of the global trading system. Part of thisfrustration was manifested in the eventual breakdownof the Seattle Ministerial Meeting, which underscoreda lack of agreement between the developing and ad-vanced countries.
Increasing the flow of foreign assistance: The flow offoreign economic assistance from the advanced to thedeveloping world has steadily declined since the early1990s, despite the fact that most industrial economies
ASIAN DEVELOPMENT OUTLOOK 2000226
are now in much better fiscal shape than at any timein recent history. Certainly, not all aid has been usedeffectively. With improved governance in developingcountries, however, there is every likelihood that aidcan, and should, make a substantial difference.
Providing international public goods: Theinternational community can make major contri-butions toward global poverty reduction by providingimportant international public goods that are currentlynot being provided. Medical research in advancedcountries, for instance, neglects research on tropicaldiseases because it is mainly poor people who live inthese tropical areas. As a result, a sad paradox emerges,with only 10 percent of the $50 billion-$60 billion spentworldwide on medical research expended on diseases
that afflict 90 percent of the world’s population (WHO1999). Similarly, global agricultural research pays scantattention to tropical crops or how advances inbiotechnology can be used in transforming the farmingsystem of the rural poor in developing economies.More emphasis on, and greater funds for, these globalpublic goods would have a dramatic impact on reduc-ing poverty and improving well-being in developingcountries.
If national governments and the internationalcommunity work together to implement these policies,each will reinforce the other. Consequently, thescourge of poverty and abject human deprivation inAsia—and elsewhere—could be reduced dramatically,and quickly.

ASIAN DEVELOPMENT OUTLOOK 2000228
Selected BibliographySelected BibliographySelected BibliographySelected BibliographySelected Bibliography
Acemoglu, Daron and Robert Shimer. 1999. “EfficientUnemployment Insurance.” Journal of PoliticalEconomy 107(4): 893-928.
ADB (Asian Development Bank). 1997. EmergingAsia: Changes and Challenges. Manila.. 1998a. “Special Issue on Participation.” ADB
Review. 30(2): 1-31.. 1998b. Key Indicators of Developing Asian and
Pacific Countries 1998. Volume XXIX. Manila:Published by Oxford University Press for theAsian Development Bank.. 1998c. Asian Development Outlook 1998.
Manila.. 1999a. “ADB Basic Statistics: Developing
Member Countries.” Manila.. 1999b. Asian Development Outlook 1999
Update. Manila.. 1999c. Country Assistance Plan: Sri Lanka
(2000-2002). Manila.. 1999d. “Country Economic Review on
Kazakhstan.” Manila.. 1999e. “Country Economic Review on Kyrgyz
Republic.” Manila.. 1999f. “Country Economic Review on the
Philippines.” Manila.. 1999g. “Country Economic Review on Nepal.”
Manila.. 1999h. “Country Economic Review on
Uzbekistan.” Manila.
. 1999i. “Fighting Poverty in Asia and the Pa-cific: The Poverty Reduction Strategy of theAsian Development Bank.” Draft (15 October).Manila.. 1999j. “Framework for Operations on SocialProtection.” Manila.. 1999k. Key Indicators of Developing Asian andPacific Countries 1999. Volume XXIX. Manila.Published by Oxford University Press for theAsian Development Bank.. 1999l. “Policy for the Health Sector.” Manila.. 1999m. “Poverty Incidence in the Asian andPacific Region: Data Situation and MeasurementIssues.” EDRC Briefing Note No. 17. Manila:Published by Oxford University Press for theAsian Development Bank.. 1999n. “Social Consequences of the FinancialCrisis in Asia: The Deeper Crisis.” EDRC Brief-ing Note No. 16. Manila.. 1999o. “Strategies for Reducing Poverty:
A Report Based on Consultations in SelectedDeveloping Member Countries of the AsianDevelopment Bank.” Mimeo (24 May). Manila.. 1999p. “Urban Sector Strategy.” Manila.. 2000. “Country Economic Review on
Tajikistan.” Manila.Ahluwalia, Montek S. 1996. “Comment on ‘Inequal-
ity, Poverty, and Growth: Where Do We Stand?’by Albert Fishlow.” In Michael Bruno and Boris

229SELECTED BIBLIOGRAPHY
Pleskovic, eds., Annual World Bank Conferenceon Development Economics 1995, pp. 40-45.Washington, DC: World Bank.
Ahuja, Vinod, Benu Bidani, Francisco Ferreira, andMichael Walton. 1997. Everyone’s Miracle?Revisiting Poverty and Inequality in East Asia.Washington, DC: World Bank.
Alderman, H., P.A. Chiappori, L. Haddad, J.Hoddinott, and R. Kanbur. 1995. “Unitary versusCollective Models of the Household: Is it Timeto Shift the Burden of Proof?” The World BankResearch Observer 10(1): 1-20.
Alderman, H., J. Behrman, D. Ross, and R. Sabot.1996. “The Return to Endogenous Human Capi-tal: Pakistan’s Rural Labor Market.” Oxford Bul-letin of Economics and Statistics 58(1): 29-55.
Alesina, Alberto and Dani Rodrik. 1994. “Distribu-tive Politics and Economic Growth.” The Quar-terly Journal of Economics 109(2): 465-90.
Alesina, A., R. Baqir, and W. Easterly. 1997. “PublicGoods and Ethnic Divisions.” Unpublishedmimeo. World Bank, Washington, DC.
APEC (Asia-Pacific Economic Cooperation). 1999.“Compendium of Sound Practices: Guidelinesto Facilitate the Development of Domestic BondMarkets in APEC Member Economies.” Reportprepared by APEC Collaborative Initiative onDevelopment of Domestic Bond Markets(August). Hong Kong.
Ashenfelter, O. and A. Krueger. 1994. “Estimate ofthe Economic Return to Schooling from a NewSample of Twins.” The American Economic Re-view 84(5): 1157-73.
Balisacan, Arsenio M. 1994. “Urban Poverty in thePhilippines: Nature, Causes and Policy Mea-sures.” Asian Development Review 12(1): 117-52.. 1997. “Comment on ‘Political Economy of
Alleviating Poverty: Theory and Experience’ byTimothy Besley.” In Michael Bruno and BorisPleskovic, eds., Annual World Bank Conferenceon Development Economics 1996, pp. 135-38.Washington, DC: World Bank.
Baliño, T.J.T., Charles Enoch, Anne-Marie Gulde,Carl-Johan Lindgren, Marc Quintyn, and LeslieTeo. 1999. “Financial Sector Crisis and Restruc-turing: Lessons from Asia.” Advance copy (Sep-tember). Washington, DC: InternationalMonetary Fund.
Ballard, Charles L. and Don Fullerton. 1992.“Distortionary Taxes and the Provision of PublicGoods.” Journal of Economic Perspectives 6(3):117-31.
Banerjee, Abhijit V. 1999. “Land Reforms: Prospectsand Strategies.” Mimeo. Massachusetts Insti-tute of Technology, Department of Economics,Cambridge, MA.
Banerjee, Abhijit, Paul Gertler, and Maitreesh Ghatak.1998. “Empowerment and Efficiency: The Eco-nomics of Agrarian Reform.” Mimeo. Massachu-setts Institute of Technology, Department ofEconomics, Cambridge, MA.
Bank of America. 1999, “Banking Reform in Asia:Comparative Rankings of Progress Made,” AsianFinancial Outlook, Issue No. 25 (August).
Bank Indonesia. Various years. Indonesian FinancialStatistics. Jakarta.
Bank Negara Malaysia. (Online). Available.http://www.bnm.gov.my.
Barclays. 2000. Barclays Economic Review (First Quar-ter 2000). United Kingdom.
Bardhan, Pranab. 1996a. “Efficiency, Equity andPoverty Alleviation: Policy Issues in LessDeveloped Countries.” The Economic Journal106(3): 1344-55.. 1996b. “Research on Poverty and Develop-
ment Twenty Years after Redistribution withGrowth”. In Michael Bruno and Boris Pleskovic,eds., Annual World Bank Conference on Develop-ment Economics 1995, pp. 59-72. Washington,DC: World Bank.
Barro, Robert. 1996. “Democracy: A Recipe forGrowth?” In M.G. Quibria and J. MalcolmDowling, eds., Current Issues in Economic Devel-opment: An Asian Perspective, pp. 67-106. HongKong: Oxford University Press.
Basu, Kaushik. 1995. “Rural Credit and Interlinkage:Implications for Rural Poverty, Agrarian Effi-ciency, and Public Policy.” In M.G. Quibria, ed.,Critical Issues in Asian Development: Theories,Experiences and Policies, pp. 108-26. Hong Kong:Oxford University Press.. 1998. “Child Labor: Cause, Consequence andCure, with Remarks on International LaborStandards.” Mimeo (30 March). Cornell Uni-versity, Department of Economics, New York.

ASIAN DEVELOPMENT OUTLOOK 2000230
Basu, K., G. Fields, and S. Debgupta. 1998. “Retrench-ment, Labor Laws and Government Policy:An Analysis with Special Reference to India.”Mimeo. Cornell University, Department ofEconomics, New York.
Behrman, Jere R. 1993. “Investing in HumanResources.” Economic and Social Progress in LatinAmerica. Washington, DC: Inter-AmericanDevelopment Bank.. 1996. “The Impact of Health and Nutritionon Education.” The World Bank Research Ob-server 11(1): 23-38.
Behrman, Jere R. and James C. Knowles. 1998. “Popu-lation and Reproductive Health: An EconomicFramework for Policy Evaluation.” Population andDevelopment Review 24(4): 697-737.. 1999a. “Household Income and Child
Schooling in Vietnam.” The World Bank Eco-nomic Review 13(2): 211-56.. 1999b. “The Demand for Health Insurance inVietnam.” Unpublished mimeo. University ofPennsylvania, Department of Economics,Philadelphia, PA.
Behrman, Jere R., Anil B. Deolalikar, and Lee-YingSoon. 1999. “The Role of Education Decen-tralization in Promoting Effective Schooling inSelected DMCs.” Paper prepared for the AsianDevelopment Bank study on “Financing HumanResource Development in Asia.” Manila.
Behrman, Jere R., Andrew D. Foster, Mark R.Rosenzweig, and Prem Vashista. 1999. “Women’sSchooling, Home Teaching, and EconomicGrowth.” Journal of Political Economy 10(4):682-714.
Besley, Timothy. 1997. “Political Economy of Allevi-ating Poverty: Theory and Institutions.”In Michael Bruno and Boris Pleskovic, eds.,Annual World Bank Conference on DevelopmentEconomics 1996, pp.117-34. Washington, DC:World Bank.
Binswanger, Hans P. and Mark R. Rosenzweig. 1993.“Wealth, Weather Risk and the Composition andProfitability of Agricultural Investments.” TheEconomic Journal 103 (January): 56-78.
Booth, Anne. 1999. “The Social Impact of the AsianCrisis: What Do We Know Two Years On?” AsianPacific Economic Literature 13(2): 16-29.
Borio, Claudio E. V. and Robert N. McCauley. 1996.“The Economics of Recent Bond Yield Volatili-ties,” Basle: Bank for International Settlements.
Bourguignon, François. 1996. “Comment on ‘Inequal-ity, Poverty, and Growth: Where Do We Stand?’by Albert Fishlow.” In Michael Bruno and BorisPleskovic, eds., Annual World Bank Conferenceon Development Economics 1995, pp 46-49. Wash-ington, DC: World Bank.
Bourguignon, François and Christian Morrisson. 1990.“Income Distribution, Development and ForeignTrade: A Cross-Sectional Analysis.” EuropeanEconomic Review 34(6): 1113-32.
Bray, Mark. 1996. “Counting the Full Cost: Parentaland Community Financing of Education in EastAsia.” Washington, DC: World Bank.
Brooks, Douglas H. and Myo Thant. 1998. Social Sec-tor Issues in Transitional Economies of Asia. HongKong: Oxford University Press.
Bruno, Michael, Lyn Squire, and Martin Ravallion.1995. “Equity and Growth in DevelopingCountries: Old and New Perspectives.” PolicyResearch Working Paper No. 1563. World Bank,Development Research Group, Washing-ton, DC.
Burnside, Craig and David Dollar. 1997. “Aid, Poli-cies, and Growth.” Policy Research Working Pa-per No. 1777. World Bank, DevelopmentResearch Group, Washington, DC.. 1998. “Aid, the Incentive Regime, and PovertyReduction.” Policy Research Working PaperNo. 1937. World Bank, Development ResearchGroup, Washington, DC.
Central Bank of Sri Lanka. 1999. Annual Report 1998.Colombo.. 2000. Sri Lanka Economy in 1999 and Medium-Term Prospects (February). Colombo.
Central Statistical Organization. 2000. “NationalIncome, Consumption Expenditure, Saving, andCapital Formation, 1997-98.” New Delhi(February).
Chenery, Hollis, Montek S. Ahluwalia, Clive Bell, JohnH. Duloy, and Richard Jolly. 1974. Redistributionwith Growth. New York: Oxford University Press.
Claessens, Stijn, Simeon Djankov, and Larry Lang.1998. “East Asian Corporates: Growth, Financ-ing and Risks over the Last Decade.” WorldBank (October).

231SELECTED BIBLIOGRAPHY
Clarke, George. 1995. “More Evidence on Income Dis-tribution and Growth.” Journal of DevelopmentEconomics 47(2): 403-27.
Collier, Paul. 1999. “The Political Economy ofEthnicity.” In Boris Pleskovic and Joseph E.Stiglitz, eds., Annual World Bank Conference onDevelopment Economics 1998, pp. 387-99. Wash-ington, DC: World Bank.
Consensus Economics, Inc. 2000. “Foreign ExchangeConsensus Forecasts.” United Kingdom (14 Feb-ruary).
Cox, Donald and Emmanuel Jimenez. 1995. “PrivateTransfers and the Effectiveness of Public IncomeRedistribution in the Philippines.” In Domin-ique van de Walle and Kimberly Nead, eds., Pub-lic Spending and the Poor: Theory and Evidence.Baltimore, MD: The Johns Hopkins UniversityPress.
Cox, Donald, James Fetzer, and Emmanuel Jimenez.1995. “Private Safety Nets Through Inter-Household Transfers.” Mimeo. Boston College,Department of Economics, Boston, MA.
Datt, Gaurav and Martin Ravallion. 1992. “Growthand Poverty in Rural India.” World Bank, PolicyResearch Department, Washington, DC.
de Hann, Arjan and Michael Lipton. 1999. “Povertyin Emerging Asia: Progress, Setbacks and Log-jams.” Asian Development Review 16(2): 135-76.
Deaton, Angus. 1998. The Analysis of Household Sur-veys. Baltimore, MD: The Johns Hopkins Uni-versity Press.
Deininger, Klaus and Lyn Squire. 1996. “MeasuringIncome Inequality: A New Database.” The WorldBank Economic Review 10(3): 565-91.. 1998. “New Ways of Looking at Old Issues:Inequality and Growth.” Journal of DevelopmentEconomics 57(2): 259-87.
Deolalikar, Anil B. 1988. “Nutrition and Labor Pro-ductivity in Agriculture: Wage Equation andFarm Production Estimates for Rural India.” TheReview of Economics and Statistics 70(3): 406-14.
Deolalikar, Anil, Rana Hasan, Haider Khan, and M.G.Quibria. 1997. “Competitiveness and HumanResource Development in Asia.” Asian Devel-opment Review 15(2): 131-63.
Deutsche Bank. 1999. “Is Asia’s Recovery Sustain-able?” Global Emerging Markets 2(3), May.
Dev, S. M., K. Parikh, and M.H. Suryanarayana. 1994.“India.” In M.G. Quibria, ed., Rural Poverty inDeveloping Asia, pp. 191-354. Manila: Asian De-velopment Bank.
Easterly, W. and R. Levine. 1997. “Africa’s GrowthTragedy: Policies and Ethnic Divisions.” Quar-terly Journal of Economics 112(4): 1203-50.
Edwards, Michael and David Hulme. 1995. Non-Gov-ernmental Organizations—Performance and Ac-countability: Beyond the Magic Bullet. London:Earthscan Publications.
Feldstein, Martin. 1995. “Tax Avoidance and theDeadweight Loss of the Income Tax.” NBERWorking Paper No. 5055. Cambridge, MA:National Bureau of Economic Research.
Fields, Gary. 1995. “Income Distribution in Develop-ing Countries: Conceptual, Data and Policy Is-sues in Broad-Based Growth.” In M.G. Quibria,ed., Critical Issues in Asian Development: Theo-ries, Experiences and Policies, pp. 75-107. HongKong: Oxford University Press.
Filmer, Deon, Elizabeth King, and Lant Pritchett. 1998.“Gender Disparity in South Asia: Comparisonsbetween and within Countries.” Mimeo (Janu-ary). World Bank, Washington, DC.
Filmer, Deon and Lant Pritchett. 1999. “The Effect ofHousehold Wealth on Educational Attainment:Evidence from 35 Countries.” Population andDevelopment Review 25(1):85-120.
Finsterbusch, K. and W. van Wicklin. 1987. “The Con-tribution of Beneficiary Participation to Devel-opment Project Effectiveness.” Public Administrationand Development 7:1-23.
Fishlow, Albert. 1996. “Inequality, Poverty, andGrowth: Where Do We Stand?” In MichaelBruno and Boris Pleskovic, eds., Annual WorldBank Conference on Development Economics 1995,pp 25-39. Washington, DC: World Bank.
Foster, Andrew and Mark Rosenzweig. 1996. “Tech-nical Change and Human Capital Returns andInvestments: Evidence from the Green Revo-lution.” The American Economic Review86(4): 931-53.
Frankenberg, Elizabeth, Duncan Thomas, andKathleen Beegle. 1999. “The Real Costs ofIndonesia’s Economic Crisis: Preliminary Find-ings from the Indonesia Family Life Surveys.”Working Paper Series No. 99-04. Santa Monica,CA: RAND.

ASIAN DEVELOPMENT OUTLOOK 2000232
Gaiha, Raghav and Anil Deolalikar. 1993. “Persistent,Expected and Innate Poverty: Estimates forSemi-arid Rural South India, 1975-1984.”Cambridge Journal of Economics 17 (December):409-21.
Gang, Fan, Dwight Perkins, and Lora Sabin. 1997.“People’s Republic of China: EconomicPerformance and Prospects.” Asian DevelopmentReview 15(2): 43-85.
Gelbach, Jonah B. and Lant H. Pritchett. 1997. “Morefor the Poor is Less for the Poor: The Politics ofTargeting.” Draft (July). World Bank, Develop-ment Research Group, Washington, DC.
Government of Pakistan. 1999. Economic Survey1998-99. Islamabad.
Hoff, Karla. 1997. “Comment on ‘Political Economyof Alleviating Poverty: Theory and Institutions’by Timothy Besley.” In Michael Bruno and BorisPleskovic, eds., Annual World Bank Conferenceon Development Economics 1996, pp. 139-44.Washington, DC: World Bank.
Hoff, Karla and Andrew Lyon. 1995. “Non-LeakyBuckets: Optimal Redistributive Taxation andAgency Costs.” Journal of Public Economics 58(3):365-90.
Horowitz, Donald L. 1999. “Structure and Strategyin Ethnic Conflict.” In Boris Pleskovic and Jo-seph E. Stiglitz, eds., Annual World Bank Confer-ence on Development Economics 1998, pp.345-70 . Washington, DC: World Bank.
IDB (Inter-American Development Bank). 1999.“Social Protection for the Poor: A SpecialReport.” Draft (July). Inter-American Develop-ment Bank, Washington, DC.
IIE (Institute for International Economics). 1999.Economic Policy Briefs No. 99-6 (June). (AlsoOnline) Available. http://www.iie.com.
ILO (International Labour Organization). 1996. ChildLabor: Targeting the Intolerable. Geneva: Inter-national Labour Organization.. 1998. Employment Challenges of the IndonesianEconomic Crisis. Jakarta: International LabourOrganization and United Nations DevelopmentProgramme.
IMF (International Monetary Fund). 1990. WorldEconomic Outlook 1990 (May). Washington, DC.. 1998a. World Economic Outlook 1998 (May).Washington, DC.
. 1998b. World Economic Outlook 1998(October). Washington, DC.. 1999a. Direction of Trade Statistics Quarterly.Washington, DC.. 1999b. World Economic Outlook 1999 (May).Washington, DC.. 1999c. World Economic Outlook 1999
(October). Washington, DC.. 2000. International Financial Statistics (January).Washington, DC.
Isham, Jonathan, Deepa Narayan, and Lant Pritchett.1995. “Does Participation Improve Perfor-mance? Establishing Causality with SubjectiveData.” The World Bank Economic Review 9(2):175-200.
J.P. Morgan. 1990. “Reform Progress in Asian’s CrisisEconomies.” Asian Financial Markets (July).Singapore..1999. “The Budgetary Legacy of the Asian
Crisis.” Asian Financial Markets (Fourth Quar-ter), Singapore.
Jamison, Dean T. 1986. “Child Malnutrition andSchool Performance in China.” Journal of De-velopment Economics 20(2): 299-310.
Jayaraman, Rajshri and Peter Lanjouw. 1999. “TheEvolution of Poverty and Inequality in IndianVillages.” The World Bank Research Observer14(1): 1-30.
Jejeebhoy, Shireen J. 1996. “Adolescent Sexual andReproductive Behavior: A Review of theEvidence from India.” ICRW Working Paper No.3. Washington, DC: International Center for Re-search on Women.
Jimenez, Emmanuel and Marlaine Lockheed. 1995.Public and Private Secondary Education in Devel-oping Countries: A Comparative Study. Washing-ton, DC: World Bank.
Kanbur, Ravi and Nora Lustig. 1999. “Why is In-equality Back on the Agenda?” Paper preparedfor the Annual World Bank Conference on De-velopment Economics (28-30 April). Mimeo.Cornell University, Department of Economics,New York.
Khandker, Shahidur R. 1996. “Grameen Bank: Im-pact, Costs, and Program Sustainability.” AsianDevelopment Review 14(1): 97-130.
Kikeri, Sunita, John Nellis, and Mary Shirley. 1994.“Privatization: Lessons from Market Economies.”The World Bank Research Observer 9(2): 241-72.
233SELECTED BIBLIOGRAPHY
Kim, Dae Il. 1999. “The Impact of the Asian Finan-cial and Economic Crisis on the Labor Marketof the Republic of Korea.” Mimeo (March).Seoul National University, Department ofEconomies. Seoul.
Kim, Yun-Hwan. 1999. “Creating Long-termMortgage-Backed Bond Markets in Asian De-veloping Economies – A Postcrisis ReformAgenda.” EDRC Briefing Note No.18. Manila:Asian Development Bank.
Kingdon, Geeta. 1996. “The Quality and Efficiencyof Private and Public Education: A Case Studyof Urban India.” Oxford Bulletin of Economics andStatistics 58(1): 57-82.
Knowles, James C., Ernesto M. Pernia, and MaryRacelis. 1999. “Social Consequences of theFinancial Crisis in Asia.” Economic Staff PaperNo. 60 (November). Asian Development Bank,Economics and Development Resource Center,Manila.
Kremer, Michael R. 1995. ‘Research on Schooling:What We Know and What We Don’t:A Comment on Hanushek.” World Bank ResearchObserver 10(2): 247-54.
Kumar, Rajiv. 1999. “Economic Development andProspects for Developing Asian Economies,”Paper presented at the Twelfth Workshop onAsian Economic Outlook (23 November), AsianDevelopment Bank, Manila.
Lanjouw, Peter and Nicholas Stern. 1998. EconomicDevelopment in Palanpur over Five Decades.Oxford: Clarendon Press.
Lieberman, Sandy. 1999. “Indonesia’s Health Strat-egy Before and After the Crisis.” Mimeo(August). World Bank, Jakarta.
Lipton, Michael and Martin Ravallion. 1995. “Povertyand Policy.” In Jere Behrman and T.N.Srinivasan, eds., Handbook of Development Eco-nomics, vol. 3B, pp. 2551-657. Amsterdam:North Holland.
Lipton, Michael. 1996. “Comment on ‘Research onPoverty and Development Twenty Years afterRedistribution with Growth,’ by Pranab Bardhan.”In Michael Bruno and Boris Pleskovic, eds.,Annual World Bank Conference on DevelopmentEconomics 1995, pp. 73-80. Washington, DC:World Bank.
Loury, Glenn C. 1999. “Social Exclusion and EthnicGroups: The Challenge to Economics.” Paperprepared for the Annual World Bank Confer-ence on Development Economics (28-30 April),World Bank, Washington, DC.
Mauro, Paulo. 1995. “Corruption and Growth.” TheQuarterly Journal of Economics 110(3): 681-712.
Mijares, T.A. and L.C. Belarmino. 1973. “Some Noteson the Sources of Income Disparities amongPhilippine Families.” Journal of Philippine Statis-tics (September).
Ministry of Finance. 1999. Monthly Statistics of Exportsand Imports, Taiwan Area, the Republic of China(December). Department of Statistics.. 2000. Economic Survey 1999/00 (March). NewDelhi.
Monetary Authority of Singapore. 1999a. QuarterlyBulletin (December). Singapore.. 1999b. Monthly Statistical Bulletin
(September). Singapore.Moock, Peter and Joanne Leslie. 1986. “Childhood
Malnutrition and Schooling in the Terai Regionof Nepal.” Journal of Development Economics20(1): 33-52.
Moon, Hyungpyo, Hyehoon Lee, and GyeongjoonYoo. 1999. “Social Impact of the Financial Cri-sis in Korea.” Report prepared for the Finaliza-tion Conference, “Assessing the Social Impactof the Financial Crisis in Selected Asian Devel-oping Economies” (17-18 June), Asian Devel-opment Bank, Manila.
Morduch, Jonathan. 1999a. “The Grameen Bank: AFinancial Reckoning.” Mimeo (May). PrincetonUniversity, New Jersey.. 1999b. “The Microfinance Promise.” Journalof Economic Literature 4(37): 1569-614.
Narayan, D. 1995. “The Contribution of People’sParticipation: Evidence from 121 Rural WaterSupply Projects.” Environmentally SustainableDevelopment (ESD) Occasional Paper SeriesNo. 1. Washington, DC: World Bank.
National Economic and Development Authority ofthe Philippines. (Online). Available.http://www.neda.gov.ph.
National Statistical Committee of the Kyrgyz Repub-lic. 2000. Latest Economic and Financial Data(Online). Available. http://nsc.bishkek.su.

ASIAN DEVELOPMENT OUTLOOK 2000234
NSCB (National Statistical Coordination Board) ofthe Philippines. (Online). Available.http://www. nscb.gov.ph.. 1998. “Annual Poverty Indicators Survey
1998.” Manila.National Statistical Office. 1999. Korea Statistical
Yearbook 1999. Vol. 46. Seoul.OECD (Organisation for Economic Co-operation and
Development). 1999. OECD Economic Outlook.Paris: OECD.
Pathan, R., N. Arul, and M. Poffenberger. 1993. “ForestProtection Committees in Gujarat—JointManagement Initiatives.” Reference Paper No.8. Prepared for Sustainable Forest ManagementConference, sponsored by the Ford Foundation,Delhi, India.
Pernia, E.M. 1982. “Micro-level Implications ofPopulation Growth.” In A. Herrin, V.P. Paqueo,and E.M. Pernia, eds., Essays on the Economicsof Fertility, Population Growth and Public Interven-tion in a Developing Country: The Philippines.Quezon City: University of the PhilippinesSchool of Economics.
Pernia, E. and M.G. Quibria. 1999. “Poverty in De-veloping Countries.” In E.S. Mills and P.C.Cheshire, eds., Handbook of Regional and UrbanEconomics, Volume 3, Part III, Chap.45. Neth-erlands: Elsevier Science Publishers BV.
Perotti, Roberto. 1993. “Political Equilibrium, IncomeDistribution, and Growth.” The Review of Eco-nomic Studies 60 (4): 755-76.
Persson, Torsten and Guido Tabellini. 1994. “Is In-equality Harmful for Growth?” The AmericanEconomic Review 84(3): 600-21.
Pitt, Mark and S.R. Khandker. 1996. “Household andIntrahousehold Impacts of the Grameen Bankand Similar Targeted Credit Programs inBangladesh.” Discussion Paper No. 320. Wash-ington, DC: World Bank.. 1998. “The Impact of Group-Based Credit
Programs on Poor Households in Bangladesh:Does the Gender of Participants Matter?” Journalof Political Economy 106(5): 958-96.
Poppele, Jessica, Sudarno Sumarto, and Lant Pritchett.1999. “Social Impacts of the Indonesian Crisis:New Data and Policy Implications.” Mimeo(May). SMERU (Social Monitoring and EarlyResponse Unit), Jakarta.
Prescott, Nicholas. 1998. “Choices in FinancingHealth Care and Old Age Security.” Proceed-ings of a Conference (8 November), sponsoredby the Institute of Policy Studies, Singapore, andthe World Bank, Washington, DC.
Prud’homme, Remy. 1995. “The Dangers of Decen-tralization.” The World Bank Research Observer10(2): 201-20.
Psacharopoulos, George. 1985. “Returns to Education:A Further International Update and Implica-tions.” Journal of Human Resources 20: 583-97.. 1994. “Returns to Investment in Education:A Global Update.” World Development 22(9):1325-43.
Quibria, M.G. 1995. “Gender and Poverty: Issues andPolicies with Special Reference to Asian Devel-oping Countries.” Journal of Economic Surveys9(4): 373-411.. ed. 1996. Rural Poverty in Developing Asia.
Manila: Asian Development Bank.. 1999. “Comment on Leading Issues in
Microfinance.” Mimeo. Asian DevelopmentBank, Manila.
Ranis, Gustav. 1996. “Comment on ‘Inequality,Poverty, and Growth: Where Do We Stand?’ byAlbert Fishlow.” In Michael Bruno and BorisPleskovic, eds., Annual World Bank Conferenceon Development Economics 1995, pp. 50-55.Washington, DC: World Bank.
Rashid, Salim and M.G. Quibria. 1995. “Is LandReform Passe: With Special Reference to AsianAgriculture.” In M.G. Quibria, ed., Critical Is-sues in Asian Development: Theories, Experiencesand Policies, pp. 127-59. Hong Kong: OxfordUniversity Press.
Ravallion, Martin. 1996. “Issues in Measuring andModeling Poverty.” The Economic Journal 106(3):1328-43.. 1999a. “Is More Targeting Consistent with LessSpending?” Draft paper (February).World Bank,Development Research Group, Washington,DC.. 1999b. “Monitoring Targeting Performance
when Decentralized Allocations to the Poor areUnobserved.” Draft paper. World Bank, Devel-opment Research Group, Washington, DC.

235SELECTED BIBLIOGRAPHY
Reserve Bank of India. Report of Currency and Finance,1996-1997 and 1997-1998. Mumbai.. 1999. 1998-1999 Finances of State Governments.Mumbai.. Various years. Annual Report. Mumbai.
Reyes, Celia M., R.G. Manasan, A.C. Orbeta, andG.G. de Guzman. 1999. “Social Impact of theRegional Financial Crisis in the Philippines.”Mimeo. Final report of a study prepared for theAsian Development Bank, Manila.
Rosegrant, Mark W. and Peter B.R. Hazell. 1999. “TheTransformation of the Rural Economy in Asia.”Paper prepared for the Asian Development Bank“Study of Rural Asia,” Manila.
Rosenzweig, Mark and H. P. Binswanger. 1993.“Wealth, Weather Risk and the Composition andProfitability of Agricultural Investments.” TheEconomic Journal 103(416): 56-78.
Rosenzweig, Mark and Kenneth Wolpin. 1993. “CreditMarket Constraints, Consumption Smoothing,and the Accumulation of Durable Assets in Low-Income Countries: Investments in Bullocks inIndia.” Journal of Political Economy 101(2):223-44.
Saadah, Fadia and Meno Pradhan. 1999. “IndonesiaHealth Sector Analysis Based on the 1995, 1997and 1998 SUSENAS.” Mimeo. World Bank,Washington, DC.
Saadah, Fadia, Hugh Waters, and Peter Heywood.1999. “Indonesia, Undernutrition in Young Chil-dren.” Watching Brief Issue No. 1, World Bank,East Asia and Pacific Region, Washington, DC.
Sathar, Zeba A. and John B. Casterline. 1998. “TheOnset of Fertility Transition in Pakistan.” Popu-lation and Development Review 24(4): 773-96.
SEDESOL (Secretaria de Desarrollo Social). 1999.“Program for Education, Health and Nutrition(Progresa).” (Online). Available (19 November).http://www.sedesol.gob.mx.
Sen, Amartya. 1981. Poverty and Famines: An Essay onEntitlement and Deprivation. Oxford: ClarendonPress.. 1983. “Development: Which Way Now?” TheEconomic Journal 93 (December): 745-62.. 1985. Commodities and Capabilities.
Amsterdam: North Holland.
Singapore Department of Statistics. 1999. EconomicSurvey of Singapore, 3rd Quarter of 1999.Singapore.
Siregar, Reza Y. 1998. “Economic Development andProspects for Developing Asian Economies,”Paper presented at the Eleventh Workshop onAsian Economic Outlook (27 November),Asian Development Bank, Manila.
State Bank of Pakistan. 1999. Annual Report 1998-1999. Karachi.
Strauss, John. 1986. “Does Better Nutrition Raise FarmProductivity?” Journal of Political Economy94(2): 297-320.
Strauss, John and Duncan Thomas. 1998. “Health,Nutrition, and Economic Development.” Journalof Economic Literature 36(2): 766-817.
Streeten, Paul, S.J. Burki, M. Haq, N. Hicks, andF. Stewart. 1981. First Things First: MeetingBasic Needs in Developing Countries. New York:Oxford University Press.
Stiglitz, J. 1999. “Back to Basics: Policies and Strategiesfor Enhanced Growth and Equity in Post-CrisisEast Asia.” Washington, DC: World Bank.
Tan, H. and G. Batra. 1997. “Technology and FirmSize-Wage Differentials in Colombia, Mexico,and Taiwan (China).” The World Bank EconomicReview 11(1): 59-83.
Tanzi, Vito. 1996. “Fiscal Federalism and Decentrali-zation: A Review of Some Efficiency andMacroeconomic Aspects.”. In Michael Brunoand Boris Pleskovic, eds., Annual World BankConference on Development Economics 1995,pp.295-316. Washington, DC: World Bank.
The Brookings Institution. (Online). Available.http://www.brookings.org.
UN (United Nations). 1998. World Population Pros-pects (The 1998 Revision). Electronic database.New York.
UN-ESCAP (United Nations Economic and SocialCommission for Asia and the Pacific). Variousyears. Statistical Yearbook for Asia and the Pacific.Bangkok: UN ESCAP.
UNCTAD (United Nations Conference on Trade andDevelopment). 1999. World Investment Report1999: Foreign Direct Investment and the Challengeof Development. New York: UNCTAD.

ASIAN DEVELOPMENT OUTLOOK 2000236
. 2000. UNCTAD Press Release. (Online).Available. http://www.unctad.org.
UNDP (United Nations Development Programme).1998. Human Development Report 1998. NewYork: UNDP.
UNESCO (United Nations Educational, Scientific andCultural Organization). 1999. Statistical Yearbook1999. France: Imprimerie Jean Lamour,Maxeville.. 2000. “Public Expenditure on Education.”
(Online). Available (18 January).http://unescostat.unesco.org.
UNICEF (United Nations Children’s Fund). 1999. TheState of the World’s Children 1999. New York:United Nations Children’s Fund.
United States Bureau of Labor and Statistics Data.(Online). Available. http://stats.bls.gov.
van de Walle, Dominique. 1998. “Targeting Revisited.”The World Bank Research Observer 13(2): 147-70.
Wallich, Christine. 1999. “Role of the Private Sectorin Poverty Reduction.” Speech delivered at theseminar on “Poverty Reduction: What’s Newand What’s Different,” 32nd Annual Meetingof the Asian Development Bank (29 April),Manila.
WHO (World Health Organization). 1999. The WorldHealth Report 1999: Making a Difference. Geneva:World Health Organization.
Wood, Adrian and Jörg Mayer. 1999. “South Asia’sExport Structure in a Comparative Perspective.”IDS Working Paper No. 91. University of Sus-sex: Institute of Development Studies.
World Bank. 1992. World Development Report 1992:Development and the Environment. New York: Ox-ford University Press.. 1994. World Development Report 1994: Infra-structure for Development. New York: Oxford Uni-versity Press.. 1995. World Tables Diskette 1995. Washington,DC: World Bank.
. 1996a. Poverty Reduction and the World Bank:Progress and Challenges in the 1990s. Washing-ton, DC: World Bank.. 1996b. “China: Issues and Options in HealthFinancing.” Report No. 15278-CHA. WorldBank, China and Mongolia Department,Human Development Department, Washing-ton, DC.. 1997a. World Development Report 1997. NewYork: Oxford University Press.. 1997b. “Ensuring Old-Age Security in China.”In a Press Release (22 September) prepared forthe Annual Meeting Seminar Program on“Household Security in China: Health and Pen-sions,” World Bank, Hong Kong.. 1998. “Water and Work for India’s Poorest
Rural Region.” Project Brief (October). WorldBank, Washington, DC.. 1999a. “Global Economic Prospects and theDeveloping Countries 2000.” (Online). Avail-able. http://www.worldbank.org.. 1999b. “Poverty Trends and Voices of the Poor.”Mimeo (29 September). World Bank, PovertyReduction and Economic Management, HumanDevelopment Networks, Washington, DC.. 1999c. World Development Indicators 1999.
Washington, DC: World Bank.. 1999d. World Development Report 1998/99:
Knowledge for Development. Washington, DC:World Bank.
World Resources Institute. 1996. World Resources1996-1997: A Guide to Global Environment.Electronic database. New York: OxfordUniversity Press.
Yaron, Jacob, Benjamin McDonald, and StephanieCharitonenko. 1998. “Promoting Efficient RuralFinancial Intermediation.” The World BankResearch Observer 13 (2): 147-70.

ASIAN DEVELOPMENT OUTLOOK 2000238
Statistical NotesStatistical NotesStatistical NotesStatistical NotesStatistical Notes
TTTTThe Statistical Appendix presents selected eco-nomic indicators for the 37 developing member
countries of the Asian Development Bank (ADB) in atotal of 23 tables. These are presented by account: pro-duction and demand sectors of the national incomeaccounts, consumer price index, money supply, com-ponents of the balance of payments, external debt anddebt service, exchange rate, and the budget of the cen-tral government. These tables contain the time seriesinformation from 1994 to 1999. Except for policy vari-ables, such as the exchange rate and the financial ac-count of the central government, the tables giveprojections for 2000 and 2001. The table on foreigndirect investment shows data from 1993 to 1998 (thelatest year for which data are available). The followingsections describe the source, scope, and conceptualdefinition of the data in each table.
Historical data are derived mostly from officialsources; updated statistical publications; other sec-ondary publications; and working papers and otherinternal documents of the ADB, the World Bank, theInternational Monetary Fund (IMF), and the UnitedNations. Some of the preliminary data for 1999 areADB staff estimates calculated from quarterly ormonthly data available for the year. Projections for2000 and 2001 are staff estimates.
Despite limitations arising from differences instatistical methodology, definition, coverage, and prac-tice, efforts were made to standardize the data. Theaim is to allow comparability of data over time andacross the countries, and to ensure consistency across
accounts. Data-splicing and data-rebasing techniqueswere also used to fill in data gaps.
Data in these tables refer to either calendar yearor fiscal year. For Cook Islands, India, Marshall Islands,Federated States of Micronesia, Myanmar, Nauru,Nepal, Pakistan, Samoa, and Tonga, all data are on afiscal year basis. However, for Bangladesh, Bhutan andMaldives, some data refer to calendar year and some tofiscal year. For the rest of the countries, data on na-tional accounts, consumer price index, monetary ac-counts, and balance of payments are reported for thecalendar year. Government finances for all countriesare reported on a fiscal year basis.
Regional averages or totals for the countries andfor each of the six subregions are incorporated in tenof the 23 tables. These tables include growth rate ofgross domestic product (GDP), growth rate of percapita GDP, changes in consumer price index, growthrate of merchandise exports and imports, trade bal-ance, direction of exports current account balance,current account balance as a percentage of GDP, andforeign direct investment. Averages are computed assimple, weighted arithmetic means using the con-temporaneous GDP values in current US dollars asweights. Because of reliability concerns, data forMyanmar are excluded from the computation of aver-ages or totals.
Tables A1, A2, A3, A4, A5, and A6: Growth and Structureof Production. The definitions used in these tables re-lating to output growth and production are generally

239STATISTICAL NOTES
based on the United Nations System of NationalAccounts. Table A1 shows annual growth rates of GDPvalued either at constant market prices or at constantfactor costs. Most countries use the constant marketprices valuation. The exceptions are Bhutan, FijiIslands, India, Mongolia, Pakistan, Sri Lanka, SolomonIslands, Tonga, and Tuvalu, which use GDP at constantfactor cost. For Papua New Guinea the growth rate isbased on GDP at constant purchaser’s value.
Table A2 presents the growth rate figures for per capitareal GDP. Per capita real GDP is obtained by dividingGDP at constant market prices by population. Withthe exception of India, countries that used constantfactor costs in table A1 employ constant market pricesto compute per capita real GDP. The switch to marketprices creates a residual between GDP growth, percapita GDP growth, and population growth.
Tables A3, A4, and A5 present the annual growth ratesof real gross value added in agriculture, industry, andservices, respectively. The agriculture sector includesagricultural crops, livestock, poultry, fisheries, andforestry. Mining and quarrying, manufacturing,construction, and utilities fall under the industry sec-tor. The service sector comprises transportation andcommunications, trade, banking and finance, realestate, public administration, and other services. Thesectoral growth rates are consistently defined with thereported GDP values in table A1. Adding-up restric-tions are imposed where numerical discrepancies arenoted or where reclassifications of the sectors areimplemented.
Table A6 shows the sectoral shares of GDP based onconstant market prices. For Cook Islands, Fiji Islands,India, Lao People’s Democratic Republic (Lao PDR),Mongolia, Nepal, Pakistan, Sri Lanka, and Tonga, thesectoral shares of GDP are based on constant factorcosts. For Bhutan, the shares are based on gross valueadded at current factor cost.
Tables A7 and A8: Saving and Investment. Gross nationalsavings or gross domestic savings are computed as thedifference between gross national product (GNP) orGDP, and total consumption expenditure. For somecountries, gross savings data are obtained from official
sources. Gross savings may differ from either grossnational savings or gross domestic savings by beingderived from the consolidated income and outlay ac-count, and include private transfers recorded in thebalance of payments. Gross domestic investment iscalculated as the sum of gross fixed capital formationand changes in stocks. For the Pacific economies—except the Fiji Islands, where reliable estimates of con-sumption expenditures are not available—grossdomestic savings are computed as the sum of grossdomestic investment and current account balanceminus the sum of net factor income from abroad andnet transfers.
Table A7 gives the ratio of gross domestic savings toGDP as obtained from official sources. For India,Maldives, and Pakistan, the ratio of gross nationalsavings to GNP is used; for Cambodia, Thailand, andViet Nam, the ratio of gross savings to GDP is used;and for Malaysia and Sri Lanka, the ratio of grossnational savings to GDP is used. Table A8 presents theratio of gross domestic investment to GDP, except forthe Maldives, which uses the ratio of gross domesticinvestment to GNP. All figures used in computing theratios in tables A7 and A8 are in current market prices.
Table A9: Consumer Prices. This table presents theannual inflation rate based on the consumer priceindex, as obtained from official local sources. Forcountries for which data are not available locally, datawere obtained from the IMF. For most of the countries,the reported inflation rates are period averages. Forthe Central Asian republics and Viet Nam, the end-of-period consumer price index is used for calculatinginflation rates. For Hong Kong, China, the inflationrate is based on the composite consumer price index,while for India, it is based on the wholesale price index.
Table A10: Growth of Money Supply. This table tracksthe annual percentage change in money supply as rep-resented by M2. M2 is defined as the sum of M1 andquasi-money, where M1 denotes currency in circulationplus demand deposits, and quasi-money is time andsavings deposits plus foreign currency deposits. ForIndia and the Philippines, the M3 is used as the mea-sure of liquidity. All data for M2 are obtained fromcountry sources, except for Fiji Islands, Papua New

ASIAN DEVELOPMENT OUTLOOK 2000240
Guinea, Samoa, and Vanuatu, which are taken fromthe ADB’s Key Indicators of Developing Asian and PacificCountries and the IMF’s International Financial Statistics(IMF 2000).
Tables A11 and A13: Growth Rate of Merchandise Exportsand Imports. Historical data for 1994-1998 and somepreliminary estimates for 1999 on merchandise exportsand imports are taken from the balance-of-paymentsaccounts, except for Cook Islands data, which aretaken from the external trade account. These figuresare on a free-on-board basis, except for India and theLao PDR, for which import data are on a cost, insur-ance, and freight basis. Export and import statisticsare reported in calendar years except for India, MarshallIslands, Federated States of Micronesia, Myanmar,Nepal, Pakistan, and Tonga, which use fiscal year fig-ures. For Cambodia, export data refer to domestic ex-ports only, while import data refer to retained importsonly. Retained imports are total imports net of re-exports, but include project aid imports and an esti-mate of unrecorded imports. Data for People’s Republicof China (PRC), Republic of Korea, Malaysia, Mongolia,and Thailand are derived from IMF documents.
Table A12: Direction of Exports. For each country, thetable indicates the percentage share of that economy’sexports going to each of the major trading partners(other developing member countries, Australia andNew Zealand, Japan, United States, and EuropeanUnion). With the exception of Taipei,China, forwhich data are obtained directly from local sources,data are from the IMF’s Direction of Trade StatisticsQuarterly (IMF 1999a).
Tables A14, A15, and A16: Balance of Payments. The bal-ance of trade is the difference between merchandiseexports and merchandise imports. The current ac-count balance is the sum of the balance of trade, nettrade in services and factor income, and net unrequitedtransfers. In the case of Cambodia, India, Lao PDR,Thailand, and Viet Nam, official transfers are excludedfrom the current account balance. Data reported forPRC, Republic of Korea, and Malaysia are taken fromthe IMF’s International Financial Statistics (IMF 2000) orIMF staff country reports. The balance-of-paymentsdata for the rest of the countries are from local sources.
Table A17: Foreign Direct Investment. The UnitedNations Conference on Trade and Development’sWorld Investment Report 1999 (UNCTAD 1999) providesdata on gross foreign direct investment flows for 1993-1998. Direct investment capital refers to equity capi-tal, reinvested earnings, and other capital associatedwith the transactions of enterprises.
Tables A18 and A19: External Debt. For most countries,external debt outstanding includes long-term debt,short-term debt, and IMF credit. Principal repaymentsand interest payments on long-term debt and IMFcredit, and interest payments on short-term debt arelumped together in the debt-service payment. ForViet Nam, external debt data exclude debts innonconvertible currencies. For Mongolia, medium-and long-term debt include payment on Council forMutual Economic Assistance debts, but exclude un-resolved claims of former council members. The debt-service ratio is defined as debt-service paymentsexpressed as a percentage of total exports of goods andservices. For Cambodia, the debt-service ratio is cal-culated as a percentage of domestic exports and ser-vices only. For Viet Nam, debt-service ratio is debtservice or debt due as a ratio of exports of goods andnonfactor services. For most countries, data are col-lected from official country sources. World Bank dataare used for PRC, Malaysia, and Maldives.
Table A20: Foreign Exchange Rates. The exchange ratequoted is the annual average exchange rate of localcurrencies of the countries to the US dollar. The IMF’sInternational Financial Statistics (IMF 2000) is the sourcefor basic data for Bangladesh; India; Indonesia;Republic of Korea; Malaysia; Mongolia; Pakistan;Philippines; Singapore; and Taipei,China. For all othercountries, the sources are official country publications.
Tables A21, A22, and A23: Government Finance. Thesetables account for only central government financeon a fiscal year basis. Government expenditure in-cludes both current and capital expenditures. Like-wise, total revenue includes current revenue andcapital receipts. In most countries, the overall budgetsurplus or deficit is the balance between governmentrevenue and expenditure, excluding grants. In Bhutan,Republic of Korea, Kyrgyz Republic, Marshall Islands,

241STATISTICAL NOTES
Federated States of Micronesia, Nepal, Pakistan,Tajikistan, and Vanuatu, the overall fiscal balance in-cludes grants. For India, the overall balance excludesborrowing and other liabilities, while for Uzbekistanit includes net lending and budgetary funds. ForKazakhstan, the fiscal balance includes grants, but
excludes privatization receipts. Figures for Sri Lankaexclude not only grants, but also privatizationproceeds. For Pakistan, the fiscal balance includes con-solidated federal and provincial accounts. All ratiosare reported as a percentage of GDP in current marketprices. Data are from official country sources.

ASIAN DEVELOPMENT OUTLOOK 2000242
Table A1 Growth Rate of GDP(percent per year)
Economy 1994 1995 1996 1997 1998 1999 2000 2001
Newly industrialized economies 7.7 7.5 6.3 5.7 -1.9 7.0 6.5 6.0Hong Kong, China 5.4 3.9 4.5 5.0 -5.1 2.9 5.0 5.5Korea, Rep. of 8.3 8.9 6.8 5.0 -6.7 10.7 7.5 6.0Singapore 11.2 8.4 7.5 8.0 1.5 5.4 5.9 6.2Taipei,China 7.1 6.4 6.1 6.7 4.6 5.7 6.3 6.2
People’s Rep. of China and Mongolia 12.7 10.5 9.6 8.7 7.8 7.1 6.5 6.0China, People’s Rep. of 12.7 10.5 9.6 8.8 7.8 7.1 6.5 6.0Mongolia 2.3 6.3 2.4 4.0 3.5 3.5 4.0 4.5
Central Asian republics -10.4 -5.6 1.1 3.3 0.8 2.8 3.0 3.6Kazakhstan -12.6 -8.2 0.5 1.7 -1.9 1.7 3.0 3.3Kyrgyz Republic -20.1 -5.4 7.1 9.9 2.1 3.6 2.5 3.2Tajikistan -18.9 -12.5 -4.4 1.7 5.3 3.7 4.0 5.0Uzbekistan -4.2 -0.9 1.6 5.2 4.4 4.4 3.0 4.0
Southeast Asia 7.8 8.2 7.4 3.7 -7.5 3.2 4.6 5.0Cambodia 3.9 6.7 5.5 2.6 1.3 5.0 6.0 7.0Indonesia 7.5 8.2 7.8 4.7 -13.2 0.2 4.0 5.0Lao People’s Democratic Rep. 8.1 7.0 6.9 6.9 4.0 4.0 4.5 5.0Malaysia 9.2 9.8 10.0 7.5 -7.5 5.4 6.0 6.1Myanmar 7.5 6.9 6.4 5.7 5.0 4.5 — —Philippines 4.4 4.7 5.8 5.2 -0.5 3.2 3.8 4.3Thailand 9.0 8.9 5.9 -1.8 -10.4 4.1 4.5 4.6Viet Nam 8.8 9.5 9.3 8.2 4.4 4.4 5.0 6.0
South Asia 7.0 6.9 6.9 4.7 6.2 5.5 6.4 6.6Bangladesh 4.2 4.4 5.0 5.4 5.2 4.4 5.0 5.5Bhutan 6.4 7.5 6.0 7.3 5.8 6.0 6.0 5.5India 7.8 7.6 7.5 5.0 6.8 5.9 7.0 7.0Maldives 6.6 7.2 7.9 9.1 9.1 8.5 7.0 7.0Nepal 8.2 3.5 5.3 5.0 2.3 3.3 5.5 5.5Pakistan 3.9 5.1 5.0 1.2 3.3 3.9 3.8 5.2Sri Lanka 5.6 5.5 3.8 6.3 4.7 4.2 5.0 6.0
Pacific DMCs 3.0 0.3 3.0 -3.2 1.2 4.4 — —Cook Islands 3.9 -4.4 -0.2 -2.8 -3.8 2.8 4.2 —Fiji Islands 5.1 2.6 3.3 -1.8 -1.3 7.8 3.2 3.2Kiribati 7.7 3.4 6.3 2.3 8.3 1.5 — —Marshall Islands 2.8 2.7 -15.2 -5.3 -5.0 0.5 — —Micronesia, Federated States of -1.8 1.6 0.7 -4.2 -0.8 0.3 — —Nauru — — — — — — — —Papua New Guinea 2.2 -1.6 3.5 -4.6 2.5 3.9 4.6 —Samoa -7.8 6.8 6.1 1.6 2.6 4.0 4.0 —Solomon Islands 5.1 6.8 0.6 -0.5 -2.2 1.0 3.5 —Tonga 10.0 6.3 -3.7 -1.4 0.1 2.2 — —Tuvalu 10.3 -5.0 10.3 3.5 14.9 3.0 — —Vanuatu 2.6 3.2 3.5 0.6 0.2 -2.0 — —
Average 8.7 8.3 7.5 6.0 2.3 6.2 6.2 6.0
— Not available.

243STATISTICAL APPENDIX
Table A2 Growth Rate of Per Capita GDP(percent per year)
Per CapitaGNP (US$)
Economy 1994 1995 1996 1997 1998 1999 2000 2001 1998
Newly industrialized economies 6.4 6.2 5.0 4.3 -3.4 7.0 7.1 6.6Hong Kong, China 3.1 1.9 1.9 1.9 -7.8 0.6 2.7 3.4 23,670Korea, Rep. of 7.2 7.8 5.7 4.0 -7.6 9.6 6.4 5.0 7,970Singapore 9.0 6.4 5.5 5.9 -1.0 3.7 3.5 3.5 30,060Taipei,China 6.2 5.5 5.3 5.8 3.5 4.6 5.1 5.4 12,850
People’s Rep. of China and Mongolia 11.4 9.4 8.4 7.7 6.8 6.1 5.4 4.9China, People’s Rep. of 11.4 9.4 8.4 7.7 6.8 6.1 5.4 4.9 750Mongolia 1.0 4.5 0.8 1.2 2.5 2.2 2.7 3.2 400
Central Asian republics -10.8 -5.5 0.9 3.3 — — — —Kazakhstan -12.2 -6.5 1.5 2.8 -1.7 6.1 4.0 2.6 1,310Kyrgyz Republic -18.9 -7.8 6.8 9.5 0.7 — — — 350Tajikistan -19.8 -14.3 -5.9 0.1 — — — — 350Uzbekistan -6.0 -3.1 -0.2 3.4 2.2 2.4 — — 870
Southeast Asia 6.0 6.6 5.6 2.0 -9.0 1.5 2.9 2.5Cambodia 1.4 4.1 2.9 0.1 -1.2 2.4 — — 280Indonesia 5.8 6.5 6.0 3.1 -14.4 -1.3 2.5 — 680Lao People’s Democratic Rep. 5.4 6.9 4.3 4.3 1.4 1.5 — — 330Malaysia 6.7 7.4 7.6 5.2 -9.2 3.0 3.7 3.8 3,600Myanmar 5.5 5.0 4.5 3.7 3.1 — — — —Philippines 2.0 2.2 3.4 2.8 -2.7 1.0 1.6 2.1 1,050Thailand 7.6 8.2 4.8 -2.9 -11.2 3.1 3.5 3.8 2,200Viet Nam 6.6 7.4 7.3 6.2 2.7 2.5 3.1 4.0 330
South Asia 4.9 4.9 2.4 2.8 4.7 3.7 4.9 5.2Bangladesh 2.3 2.6 3.5 3.5 3.4 2.5 3.1 3.6 350Bhutan 3.2 4.3 3.0 4.2 2.7 2.9 — — —India 5.7 5.4 2.3 3.3 5.5 4.2 5.3 5.3 430Maldives 3.8 5.2 5.2 6.0 5.5 4.5 3.5 — 1,230Nepal 5.1 0.2 3.1 2.2 0.2 0.9 3.0 3.0 210Pakistan 1.4 3.8 2.5 -1.2 0.9 1.5 0.3 3.0 480Sri Lanka 4.2 4.0 2.6 4.9 3.5 3.0 3.8 4.8 810
Pacific DMCs 6.8 -1.6 1.3 -4.6 -1.0 4.4 — —Cook Islands 3.4 -5.8 -1.7 6.2 1.1 14.4 — — —Fiji Islands 4.1 1.4 2.5 -2.4 -4.7 1.9 6.6 — 2,110Kiribati 6.2 1.9 6.3 1.5 1.5 — — — 1,180Marshall Islands -0.4 -0.9 -18.0 -8.1 -8.1 — — — 1,540Micronesia, Federated States of -3.1 0.3 -0.6 -5.5 -4.8 — — — 1,800Nauru — — — — — — — — —Papua New Guinea 0.2 -3.6 1.5 -6.4 0.6 2.9 3.6 — 890Samoa — 4.9 5.5 1.0 — — — — 1,020Solomon Islands 2.4 2.8 -3.1 — — — — — 750Tonga 10.7 6.0 -4.0 -1.8 -0.2 1.8 — — 1,690Tuvalu 8.9 -6.2 8.9 2.2 13.6 1.8 — — —Vanuatu -0.2 0.6 0.8 — — — — — 1,270
Average 7.1 6.7 5.6 4.6 1.0 5.2 5.3 5.0

ASIAN DEVELOPMENT OUTLOOK 2000244
Table A3 Growth Rate of Value-Added in Agriculture(percent per year)
Economy 1994 1995 1996 1997 1998 1999 2000 2001
Newly industrialized economiesHong Kong, China — — — — — — — —Korea, Rep. of 0.2 6.6 3.3 4.6 -6.6 4.7 — —Singapore 5.7 8.0 6.0 -5.8 -5.7 4.9 1.6 1.5Taipei,China 3.3 5.5 -0.3 -1.5 -6.6 3.1 -1.3 -2.4
People’s Rep. of China and MongoliaChina, People’s Rep. of 4.0 5.0 5.1 3.5 3.5 2.8 3.0 3.0Mongolia 2.7 4.2 4.4 4.3 7.0 — — —
Central Asian republicsKazakhstan -21.0 -24.4 -5.0 1.9 -18.9 28.9 -6.5 2.0Kyrgyz Republic -8.6 -2.0 15.2 12.3 2.9 8.7 — —Tajikistan — — — 6.5 — 3.8 — —Uzbekistan -3.4 2.0 -7.3 5.8 4.0 5.9 — —
Southeast AsiaCambodia 2.3 7.5 2.2 -0.1 -1.2 2.4 4.2 —Indonesia 0.6 4.4 3.1 1.0 0.8 0.7 3.0 3.5Lao People’s Democratic Rep. 8.3 3.1 2.8 7.0 3.7 3.2 — —Malaysia -1.9 -2.5 4.5 0.4 -4.5 3.8 4.2 —Myanmar 5.9 4.8 5.0 3.7 2.8 2.5 — —Philippines 2.6 0.8 3.8 2.9 -6.6 6.6 3.0 —Thailand 4.7 3.5 3.8 -0.5 -0.3 0.5 1.5 2.0Viet Nam 3.3 4.8 4.4 4.3 2.8 5.0 3.5 3.5
South AsiaBangladesh 0.3 -1.0 3.4 6.1 3.2 3.9 3.2 4.0Bhutan 3.9 4.0 6.4 3.1 3.5 — — —India 5.4 0.2 9.6 -1.9 7.2 0.8 — —Maldives 2.6 1.6 1.9 2.3 6.2 6.5 6.5 6.5Nepal 7.6 -0.3 4.4 4.1 1.0 3.0 4.3 4.0Pakistan 5.2 6.6 11.7 0.1 3.8 0.4 4.8 4.1Sri Lanka 3.3 3.3 -4.6 3.0 2.5 4.8 2.9 3.0
Pacific DMCsCook Islands 5.4 -2.5 4.3 12.2 -4.6 — — —Fiji Islands 11.0 -3.2 1.9 -12.5 -10.4 — — —Kiribati 7.0 -11.9 4.7 — — — — —Marshall Islands 24.2 -3.9 -20.9 1.2 — — — —Micronesia, Federated States of — — — — — — — —Nauru — — — — — — — —Papua New Guinea 9.8 -7.7 2.2 -1.2 -8.8 — — —Samoa -22.6 15.8 -0.3 -5.9 7.0 — — —Solomon Islands 6.2 7.7 -4.3 — — — — —Tonga 13.3 12.1 -9.2 -3.0 -2.1 -0.9 — —Tuvalu 0.6 0.6 -16.2 5.8 0.7 — — —Vanuatu 2.2 6.4 — — 6.9 -9.3 — —

245STATISTICAL APPENDIX
Table A4 Growth Rate of Value-Added in Industry(percent per year)
Economy 1994 1995 1996 1997 1998 1999 2000 2001
Newly industrialized economiesHong Kong, China — — — — — — — —Korea, Rep. of 9.1 10.3 7.0 5.4 -7.5 13.0 — —Singapore 13.3 9.5 7.2 7.3 0.9 4.4 4.9 5.0Taipei,China 2.6 2.6 4.2 6.1 2.7 4.5 6.5 6.3
People’s Rep. of China and MongoliaChina, People’s Rep. of 18.4 13.9 12.1 10.8 9.2 8.5 7.5 6.5Mongolia 2.1 14.6 0.5 -7.0 7.2 — — —
Central Asian republicsKazakhstan -24.7 -14.9 -3.5 5.0 6.0 2.2 4.0 4.0Kyrgyz Republic -37.3 -12.3 2.6 19.8 -1.8 -2.4 — —Tajikistan — — — -2.8 — 5.0 — —Uzbekistan -6.6 -5.6 1.7 2.2 2.3 6.1 — —
Southeast AsiaCambodia 4.2 20.2 11.7 31.8 9.2 12.9 11.8 —Indonesia 11.2 10.4 10.7 5.2 -15.1 1.7 6.0 6.6Lao People’s Democratic Rep. 10.7 13.1 17.3 8.1 8.5 10.5 — —Malaysia 10.9 14.9 14.4 7.9 -11.0 8.5 1.5 —Myanmar 10.3 12.7 10.7 8.9 6.6 6.0 — —Philippines 5.8 6.7 6.4 6.1 -1.9 0.5 4.0 —Thailand 10.1 10.2 7.1 -2.7 -13.6 8.3 6.8 6.5Viet Nam 13.4 13.6 14.5 12.6 8.3 7.0 7.4 8.8
South AsiaBangladesh 7.8 8.4 5.3 5.8 8.3 4.0 7.5 7.0Bhutan 13.9 17.0 8.4 3.8 7.3 — — —India 9.3 12.2 5.2 5.9 3.7 6.2 — —Maldives 6.3 8.6 9.0 18.7 15.3 5.0 5.0 5.0Nepal 9.0 4.0 8.3 6.4 0.2 5.7 6.6 6.9Pakistan 4.5 4.9 5.4 0.6 6.8 3.8 4.8 4.8Sri Lanka 8.1 7.8 5.6 7.7 5.9 4.6 5.5 7.3
Pacific DMCsCook Islands 5.4 -15.9 -5.0 6.4 -6.2 — — —Fiji Islands 3.9 1.8 6.1 -0.9 -4.3 — — —Kiribati 14.3 0.6 -4.1 — — — — —Marshall Islands 14.7 18.7 -32.6 -6.1 — — — —Micronesia, Federated States of — — — — — — — —Nauru — — — — — — — —Papua New Guinea -3.6 4.1 4.1 -14.8 18.6 — — —Samoa -3.2 0.3 3.8 -1.0 -9.4 — — —Solomon Islands 10.2 34.1 32.0 — — — — —Tonga 12.6 3.6 4.3 -8.1 -5.7 9.3 — —Tuvalu 4.8 -13.1 85.6 4.0 21.5 — — —Vanuatu 7.3 6.4 — — -7.0 7.6 — —

ASIAN DEVELOPMENT OUTLOOK 2000246
Table A5 Growth Rate of Value-Added in Services(percent per year)
Economy 1994 1995 1996 1997 1998 1999 2000 2001
Newly industrialized economiesHong Kong, China — — — — — — — —Korea, Rep. of 9.7 9.9 7.5 6.5 -4.7 9.8 — —Singapore 10.4 8.1 7.9 8.7 1.8 5.4 5.8 5.8Taipei,China 10.4 8.9 7.8 7.4 6.2 6.3 6.5 6.5
People’s Rep. of China and MongoliaChina, People’s Rep. of 9.6 8.4 7.9 8.2 7.7 6.9 7.0 7.0Mongolia 2.0 0.2 -4.1 9.2 -2.6 — — —
Central Asian republicsKazakhstan 0.2 -1.3 3.2 0.9 0.4 -1.7 3.0 3.0Kyrgyz Republic -17.1 -4.4 -0.2 0.6 3.9 1.8 — —Tajikistan — — — — — — — —Uzbekistan -3.7 -0.5 5.0 5.9 — — — —
Southeast AsiaCambodia -0.2 4.2 4.8 -5.1 0.3 2.6 4.0 —Indonesia 7.1 7.6 6.8 5.6 -16.2 -1.5 2.3 3.9Lao People’s Democratic Rep. 5.5 10.2 8.5 7.5 4.8 7.9 — —Malaysia 9.8 9.6 8.9 11.1 -1.1 2.3 2.5 —Myanmar 8.3 7.3 6.5 6.6 6.7 6.0 — —Philippines 4.2 5.0 6.4 5.5 3.5 3.9 4.5 —Thailand 8.9 8.9 5.3 -1.1 -9.4 1.4 3.0 3.4Viet Nam 9.6 9.8 8.8 7.1 2.4 2.0 3.9 4.9
South AsiaBangladesh 5.8 6.9 6.5 4.8 4.5 5.0 7.0 5.5Bhutan 5.2 7.1 5.0 13.5 8.2 — — —India 8.5 9.8 1.1 9.0 8.3 8.0 — —Maldives 8.1 8.7 9.5 8.9 8.3 10.0 7.7 7.7Nepal 7.7 6.0 5.8 4.6 5.8 3.9 5.8 5.7Pakistan 4.3 4.7 5.0 3.6 3.2 4.1 4.2 5.9Sri Lanka 5.1 4.9 6.0 7.1 5.1 3.8 5.7 6.6
Pacific DMCsCook Islands 3.8 -3.6 -0.8 -7.4 -3.4 — — —Fiji Islands 3.5 5.2 2.4 1.8 -1.8 — — —Kiribati 11.3 0.7 8.7 — — — — —Marshall Islands -1.0 2.6 -10.7 -7.4 — — — —Micronesia, Federated States of — — — — — — — —Nauru — — — — — — — —Papua New Guinea 1.4 -3.7 2.7 5.5 -6.1 — — —Samoa 11.0 6.9 11.4 5.7 7.1 — — —Solomon Islands 2.9 -0.2 -2.2 — — — — —Tonga 6.9 2.5 -1.1 1.8 3.2 2.7 — —Tuvalu 14.7 -4.8 2.6 2.7 16.0 — — —Vanuatu 1.7 1.4 — — -0.7 -1.2 — —

247STATISTICAL APPENDIX
Table A6 Sectoral Share of GDP(percent)
Agriculture Industry Services
Economy 1970 1980 1999 1970 1980 1999 1970 1980 1999
Newly industrialized economiesHong Kong, China — — — — — — — — —Korea, Rep. of 29.8 14.2 6.1 23.8 37.8 47.4 46.4 48.1 46.5Singapore 2.2 1.1 0.1 36.4 38.8 32.2 61.4 60.0 67.7Taipei,China — 7.9 2.6 — 46.0 34.5 — 46.1 62.9
People’s Rep. of China and MongoliaChina, People’s Rep. of 42.2 25.6 15.8 44.6 51.7 56.3 13.2 22.7 27.9Mongolia 33.1 17.4 — 26.3 33.3 — 40.6 49.3 —
Central Asian republicsKazakhstan — — 13.9 — — 35.7 — — 50.4Kyrgyz Republic — — 53.8 — — 18.3 — — 27.8Tajikistan — — — — —Uzbekistan — — — — — — — — —
Southeast AsiaCambodia — — 37.4 — — 22.1 — — 35.5Indonesia 35.0 24.4 17.4 28.0 41.3 42.8 37.0 34.3 39.8Lao People’s Democratic Rep. — — 51.2 — — 22.9 — — 25.9Malaysia — 22.9 8.9 — 35.8 42.8 — 41.3 48.4Myanmar 49.5 47.9 41.9 12.0 12.3 17.2 38.5 39.8 41.0Philippines 28.2 23.5 20.0 33.7 40.5 34.5 38.1 36.0 45.5Thailand 30.2 20.2 10.2 25.7 30.1 42.9 44.1 49.7 46.9Viet Nam — 42.7 23.9 — 26.3 34.7 — 31.0 41.4
South AsiaBangladesh — 49.4 31.6 — 14.8 19.3 — 35.8 49.1Bhutan — 56.7 — — 12.2 — — 31.1 —India 44.5 38.1 25.5 23.9 25.9 27.3 31.6 36.0 47.2Maldives — — 17.3 — — 17.5 — — 65.3Nepal — 61.8 40.6 — 11.9 19.2 — 26.3 40.2Pakistan 40.1 30.6 24.5 19.6 25.6 26.7 40.3 43.8 48.7Sri Lanka 30.7 26.6 21.4 27.1 27.2 27.2 42.2 46.2 51.4
Pacific DMCsCook Islands — — — — — — — — —Fiji Islands 30.2 22.5 — 23.1 21.7 — 46.7 55.8 —Kiribati — — — — — — — — —Marshall Islands — — — — — — — — —Micronesia, Federated States of — — — — — — — — —Nauru — — — — — — — — —Papua New Guinea — — — — — — — — —Samoa — — — — — — — — —Solomon Islands — 52.5 — — 10.0 — — 37.4 —Tonga — 47.6 35.4 — 11.0 12.7 — 41.4 51.9Tuvalu — — — — — — — — —Vanuatu — — — — — — — — —

ASIAN DEVELOPMENT OUTLOOK 2000248
Table A7 Gross Domestic Savings(percentage of GDP)
Economy 1994 1995 1996 1997 1998 1999 2000 2001
Newly industrialized economiesHong Kong, China 33.1 30.5 30.7 31.1 30.2 29.8 30.7 32.0Korea, Rep. of 35.5 35.4 33.5 32.5 33.9 33.0 30.9 27.9Singapore 47.3 49.5 49.3 50.4 49.9 51.2 52.0 52.0Taipei,China 25.8 25.6 26.6 26.4 26.0 26.0 26.8 27.2
People’s Rep. of China and MongoliaChina, People’s Rep. of 42.6 41.1 40.5 41.5 40.9 39.0 37.4 36.4Mongolia 16.1 21.8 17.7 30.0 28.3 — — —
Central Asian republicsKazakhstan 14.0 17.4 8.2 8.9 8.1 — — —Kyrgyz Republic 2.7 5.5 — — — — — —Tajikistan — — — — — — — —Uzbekistan 7.8 20.4 7.9 14.9 9.9 10.5 11.0 11.5
Southeast AsiaCambodia — — — 5.9 5.4 4.7 4.0 4.0Indonesia 29.4 28.6 27.3 29.4 23.2 13.2 15.2 18.0Lao People’s Democratic Rep. — 11.5 12.4 9.4 15.5 13.4 13.0 13.0Malaysia 39.6 39.7 42.9 37.3 39.6 37.7 35.4 35.0Myanmar 11.7 13.4 11.5 11.9 10.6 — — —Philippines 19.0 17.5 18.5 19.6 22.3 19.8 20.0 21.0Thailand 34.6 33.4 33.6 32.4 39.3 36.4 36.3 36.0Viet Nam 17.5 16.1 17.8 21.8 21.1 22.0 21.6 20.5
South AsiaBangladesh 14.2 13.9 13.1 18.6 20.4 21.1 21.8 22.3Bhutan 45.0 48.7 38.3 38.8 37.9 — — —India 24.2 24.1 23.3 24.7 22.3 21.0 22.0 23.0Maldives 33.1 41.4 43.5 — — — — —Nepal 16.1 16.3 13.8 12.1 9.5 10.6 11.7 11.7Pakistan 16.7 15.7 14.4 13.1 16.1 15.1 14.7 15.6Sri Lanka 19.1 19.5 19.0 21.5 24.0 25.0 25.0 26.0
Pacific DMCsCook Islands — — — — — — — —Fiji Islands 12.4 12.9 14.7 13.2 7.5 — — —Kiribati — — — — — — — —Marshall Islands — — — — — — — —Micronesia, Federated States of — — — — — — — —Nauru — — — — — — — —Papua New Guinea 25.1 28.9 32.1 23.0 28.3 29.3 34.4 —Samoa — — — — — — — —Solomon Islands — — — — — — — —Tonga — — — — — — — —Tuvalu — — — — — — — —Vanuatu 23.1 26.1 — — — — — —
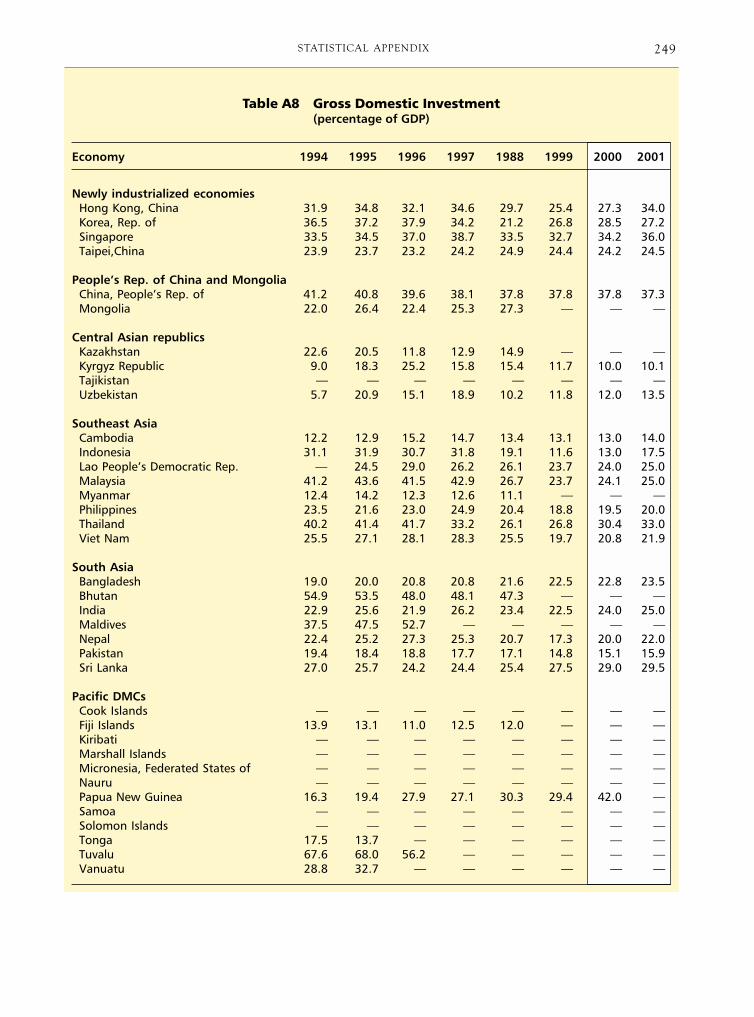
249STATISTICAL APPENDIX
Table A8 Gross Domestic Investment(percentage of GDP)
Economy 1994 1995 1996 1997 1988 1999 2000 2001
Newly industrialized economiesHong Kong, China 31.9 34.8 32.1 34.6 29.7 25.4 27.3 34.0Korea, Rep. of 36.5 37.2 37.9 34.2 21.2 26.8 28.5 27.2Singapore 33.5 34.5 37.0 38.7 33.5 32.7 34.2 36.0Taipei,China 23.9 23.7 23.2 24.2 24.9 24.4 24.2 24.5
People’s Rep. of China and MongoliaChina, People’s Rep. of 41.2 40.8 39.6 38.1 37.8 37.8 37.8 37.3Mongolia 22.0 26.4 22.4 25.3 27.3 — — —
Central Asian republicsKazakhstan 22.6 20.5 11.8 12.9 14.9 — — —Kyrgyz Republic 9.0 18.3 25.2 15.8 15.4 11.7 10.0 10.1Tajikistan — — — — — — — —Uzbekistan 5.7 20.9 15.1 18.9 10.2 11.8 12.0 13.5
Southeast AsiaCambodia 12.2 12.9 15.2 14.7 13.4 13.1 13.0 14.0Indonesia 31.1 31.9 30.7 31.8 19.1 11.6 13.0 17.5Lao People’s Democratic Rep. — 24.5 29.0 26.2 26.1 23.7 24.0 25.0Malaysia 41.2 43.6 41.5 42.9 26.7 23.7 24.1 25.0Myanmar 12.4 14.2 12.3 12.6 11.1 — — —Philippines 23.5 21.6 23.0 24.9 20.4 18.8 19.5 20.0Thailand 40.2 41.4 41.7 33.2 26.1 26.8 30.4 33.0Viet Nam 25.5 27.1 28.1 28.3 25.5 19.7 20.8 21.9
South AsiaBangladesh 19.0 20.0 20.8 20.8 21.6 22.5 22.8 23.5Bhutan 54.9 53.5 48.0 48.1 47.3 — — —India 22.9 25.6 21.9 26.2 23.4 22.5 24.0 25.0Maldives 37.5 47.5 52.7 — — — — —Nepal 22.4 25.2 27.3 25.3 20.7 17.3 20.0 22.0Pakistan 19.4 18.4 18.8 17.7 17.1 14.8 15.1 15.9Sri Lanka 27.0 25.7 24.2 24.4 25.4 27.5 29.0 29.5
Pacific DMCsCook Islands — — — — — — — —Fiji Islands 13.9 13.1 11.0 12.5 12.0 — — —Kiribati — — — — — — — —Marshall Islands — — — — — — — —Micronesia, Federated States of — — — — — — — —Nauru — — — — — — — —Papua New Guinea 16.3 19.4 27.9 27.1 30.3 29.4 42.0 —Samoa — — — — — — — —Solomon Islands — — — — — — — —Tonga 17.5 13.7 — — — — — —Tuvalu 67.6 68.0 56.2 — — — — —Vanuatu 28.8 32.7 — — — — — —
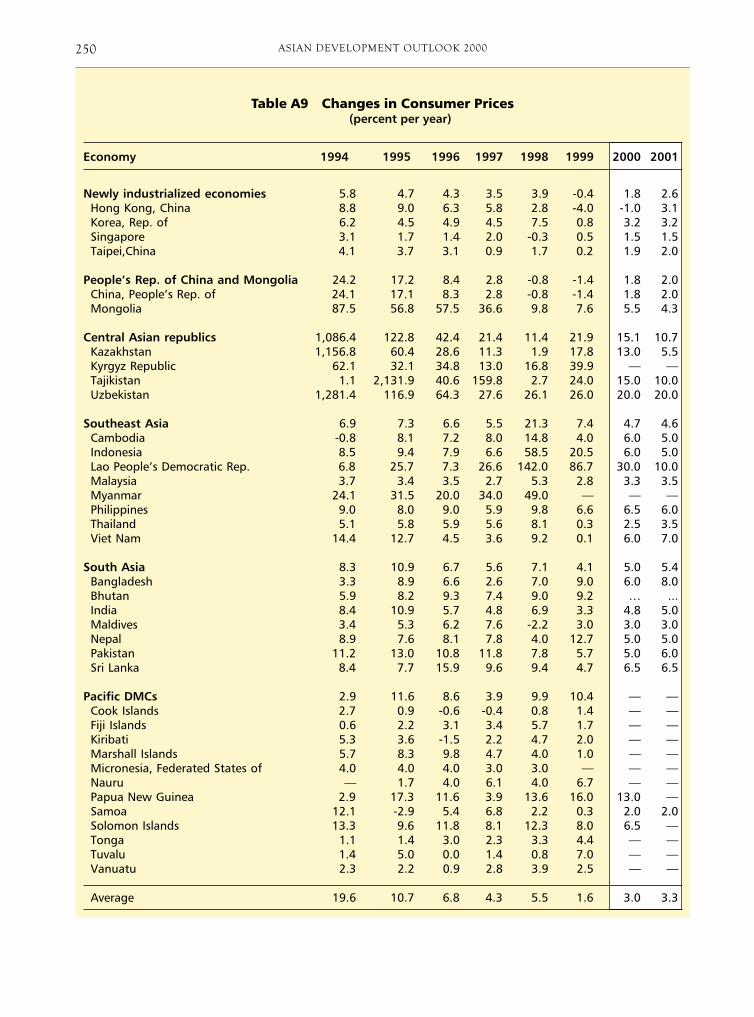
ASIAN DEVELOPMENT OUTLOOK 2000250
Table A9 Changes in Consumer Prices (percent per year)
Economy 1994 1995 1996 1997 1998 1999 2000 2001
Newly industrialized economies 5.8 4.7 4.3 3.5 3.9 -0.4 1.8 2.6Hong Kong, China 8.8 9.0 6.3 5.8 2.8 -4.0 -1.0 3.1Korea, Rep. of 6.2 4.5 4.9 4.5 7.5 0.8 3.2 3.2Singapore 3.1 1.7 1.4 2.0 -0.3 0.5 1.5 1.5Taipei,China 4.1 3.7 3.1 0.9 1.7 0.2 1.9 2.0
People’s Rep. of China and Mongolia 24.2 17.2 8.4 2.8 -0.8 -1.4 1.8 2.0China, People’s Rep. of 24.1 17.1 8.3 2.8 -0.8 -1.4 1.8 2.0Mongolia 87.5 56.8 57.5 36.6 9.8 7.6 5.5 4.3
Central Asian republics 1,086.4 122.8 42.4 21.4 11.4 21.9 15.1 10.7Kazakhstan 1,156.8 60.4 28.6 11.3 1.9 17.8 13.0 5.5Kyrgyz Republic 62.1 32.1 34.8 13.0 16.8 39.9 — —Tajikistan 1.1 2,131.9 40.6 159.8 2.7 24.0 15.0 10.0Uzbekistan 1,281.4 116.9 64.3 27.6 26.1 26.0 20.0 20.0
Southeast Asia 6.9 7.3 6.6 5.5 21.3 7.4 4.7 4.6Cambodia -0.8 8.1 7.2 8.0 14.8 4.0 6.0 5.0Indonesia 8.5 9.4 7.9 6.6 58.5 20.5 6.0 5.0Lao People’s Democratic Rep. 6.8 25.7 7.3 26.6 142.0 86.7 30.0 10.0Malaysia 3.7 3.4 3.5 2.7 5.3 2.8 3.3 3.5Myanmar 24.1 31.5 20.0 34.0 49.0 — — —Philippines 9.0 8.0 9.0 5.9 9.8 6.6 6.5 6.0Thailand 5.1 5.8 5.9 5.6 8.1 0.3 2.5 3.5Viet Nam 14.4 12.7 4.5 3.6 9.2 0.1 6.0 7.0
South Asia 8.3 10.9 6.7 5.6 7.1 4.1 5.0 5.4Bangladesh 3.3 8.9 6.6 2.6 7.0 9.0 6.0 8.0Bhutan 5.9 8.2 9.3 7.4 9.0 9.2 … ...India 8.4 10.9 5.7 4.8 6.9 3.3 4.8 5.0Maldives 3.4 5.3 6.2 7.6 -2.2 3.0 3.0 3.0Nepal 8.9 7.6 8.1 7.8 4.0 12.7 5.0 5.0Pakistan 11.2 13.0 10.8 11.8 7.8 5.7 5.0 6.0Sri Lanka 8.4 7.7 15.9 9.6 9.4 4.7 6.5 6.5
Pacific DMCs 2.9 11.6 8.6 3.9 9.9 10.4 — —Cook Islands 2.7 0.9 -0.6 -0.4 0.8 1.4 — —Fiji Islands 0.6 2.2 3.1 3.4 5.7 1.7 — —Kiribati 5.3 3.6 -1.5 2.2 4.7 2.0 — —Marshall Islands 5.7 8.3 9.8 4.7 4.0 1.0 — —Micronesia, Federated States of 4.0 4.0 4.0 3.0 3.0 — — —Nauru — 1.7 4.0 6.1 4.0 6.7 — —Papua New Guinea 2.9 17.3 11.6 3.9 13.6 16.0 13.0 —Samoa 12.1 -2.9 5.4 6.8 2.2 0.3 2.0 2.0Solomon Islands 13.3 9.6 11.8 8.1 12.3 8.0 6.5 —Tonga 1.1 1.4 3.0 2.3 3.3 4.4 — —Tuvalu 1.4 5.0 0.0 1.4 0.8 7.0 — —Vanuatu 2.3 2.2 0.9 2.8 3.9 2.5 — —
Average 19.6 10.7 6.8 4.3 5.5 1.6 3.0 3.3

251STATISTICAL APPENDIX
Table A10 Changes in Money Supply (M2)(percent per year)
Economy 1994 1995 1996 1997 1998 1999 2000 2001
Newly industrialized economiesHong Kong, China 12.9 14.6 10.9 8.3 11.8 8.1 12.0 15.0Korea, Rep. of 18.7 15.6 15.8 14.1 27.0 27.3 24.8 21.5Singapore 14.4 8.5 9.8 10.3 30.2 8.5 11.6 11.8Taipei,China 15.1 9.4 9.1 8.0 8.6 9.2 9.3 9.0
People’s Rep. of China and MongoliaChina, People’s Rep. of 34.5 29.5 25.3 17.3 15.3 14.7 16.0 16.0Mongolia 78.3 33.1 20.9 32.5 -1.7 32.1 15.0 15.0
Central Asian republicsKazakhstan 596.6 106.1 16.5 21.6 -18.7 76.6 — —Kyrgyz Republic 117.8 78.2 21.3 25.4 17.2 18.5 — —Tajikistan 159.4 — 93.2 110.7 30.7 — — —Uzbekistan 680.0 158.1 113.7 36.0 28.0 31.5 32.0 28.0
Southeast AsiaCambodia 34.9 44.3 40.4 16.6 15.7 17.3 12.0 12.0Indonesia 20.2 27.6 29.6 23.2 62.3 11.9 13.0 17.0Lao People’s Democratic Rep. 31.9 16.4 26.7 65.8 113.3 86.3 50.0 30.0Malaysia 14.7 24.0 20.9 18.5 2.7 8.3 12.0 14.5Myanmar 34.0 40.4 38.9 29.0 36.4 — — —Philippines 26.8 25.2 15.8 20.5 7.1 15.0 15.0 —Thailand 12.9 17.0 12.6 16.4 9.5 2.1 8.0 12.0Viet Nam 27.8 22.6 22.7 25.4 24.6 30.0 25.0 24.0
South AsiaBangladesh 18.6 13.0 8.3 10.8 10.4 12.8 14.0 12.0Bhutan 21.5 29.9 30.4 30.9 41.7 21.4 — —India 22.3 13.7 15.2 18.0 18.4 16.0 17.0 17.0Maldives 24.2 15.6 26.0 23.1 22.8 3.6 — —Nepal 19.6 16.1 14.4 11.9 21.9 20.9 14.0 12.0Pakistan 18.1 17.2 13.8 12.2 14.5 6.3 10.0 9.0Sri Lanka 19.7 19.2 10.8 13.8 9.7 13.3 12.5 12.0
Pacific DMCsCook Islands — — 6.9 15.6 18.5 9.5 — —Fiji Islands 2.7 4.3 0.9 -8.7 -0.3 3.1 — —Kiribati — — — — — — — —Marshall Islands — — — — — — — —Micronesia, Federated States of — — — — — — — —Nauru — — — — — — — —Papua New Guinea -1.3 13.7 30.7 7.7 2.5 5.1 — —Samoa 13.0 21.8 5.1 13.2 ... 9.1 — —Solomon Islands 24.1 9.9 15.7 6.3 4.8 7.0 — —Tonga 8.8 17.1 2.8 14.1 2.4 19.9 — —Tuvalu — — — — — — — —Vanuatu 2.9 13.3 10.1 -0.4 4.6 — — —
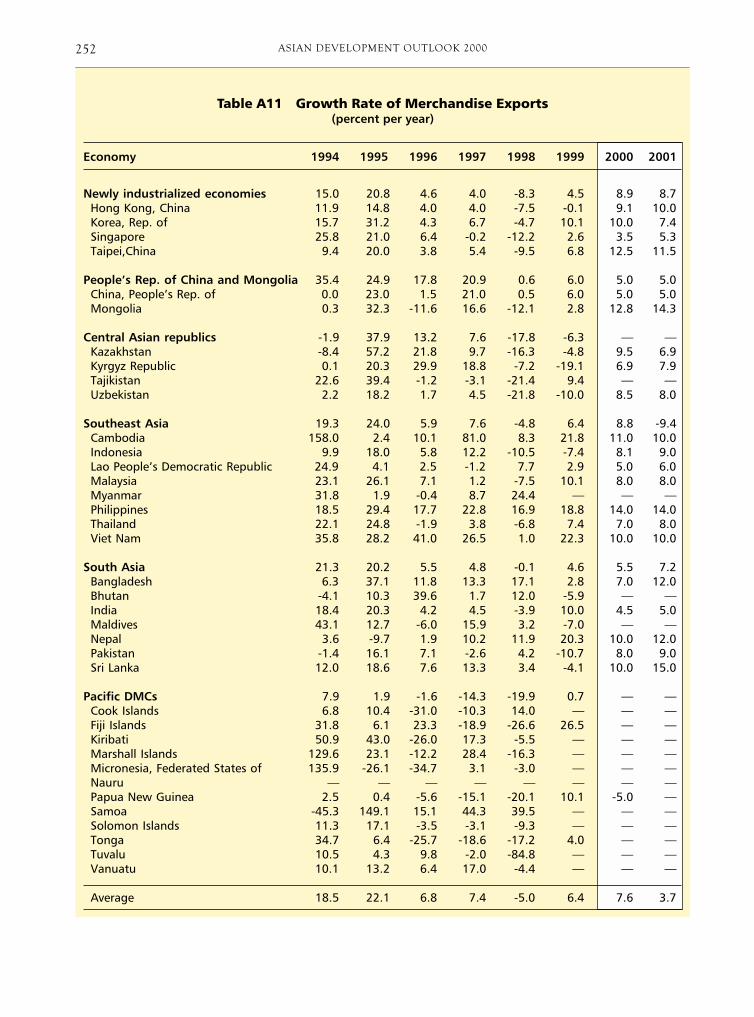
ASIAN DEVELOPMENT OUTLOOK 2000252
Table A11 Growth Rate of Merchandise Exports(percent per year)
Economy 1994 1995 1996 1997 1998 1999 2000 2001
Newly industrialized economies 15.0 20.8 4.6 4.0 -8.3 4.5 8.9 8.7Hong Kong, China 11.9 14.8 4.0 4.0 -7.5 -0.1 9.1 10.0Korea, Rep. of 15.7 31.2 4.3 6.7 -4.7 10.1 10.0 7.4Singapore 25.8 21.0 6.4 -0.2 -12.2 2.6 3.5 5.3Taipei,China 9.4 20.0 3.8 5.4 -9.5 6.8 12.5 11.5
People’s Rep. of China and Mongolia 35.4 24.9 17.8 20.9 0.6 6.0 5.0 5.0China, People’s Rep. of 0.0 23.0 1.5 21.0 0.5 6.0 5.0 5.0Mongolia 0.3 32.3 -11.6 16.6 -12.1 2.8 12.8 14.3
Central Asian republics -1.9 37.9 13.2 7.6 -17.8 -6.3 — —Kazakhstan -8.4 57.2 21.8 9.7 -16.3 -4.8 9.5 6.9Kyrgyz Republic 0.1 20.3 29.9 18.8 -7.2 -19.1 6.9 7.9Tajikistan 22.6 39.4 -1.2 -3.1 -21.4 9.4 — —Uzbekistan 2.2 18.2 1.7 4.5 -21.8 -10.0 8.5 8.0
Southeast Asia 19.3 24.0 5.9 7.6 -4.8 6.4 8.8 -9.4Cambodia 158.0 2.4 10.1 81.0 8.3 21.8 11.0 10.0Indonesia 9.9 18.0 5.8 12.2 -10.5 -7.4 8.1 9.0Lao People’s Democratic Republic 24.9 4.1 2.5 -1.2 7.7 2.9 5.0 6.0Malaysia 23.1 26.1 7.1 1.2 -7.5 10.1 8.0 8.0Myanmar 31.8 1.9 -0.4 8.7 24.4 — — —Philippines 18.5 29.4 17.7 22.8 16.9 18.8 14.0 14.0Thailand 22.1 24.8 -1.9 3.8 -6.8 7.4 7.0 8.0Viet Nam 35.8 28.2 41.0 26.5 1.0 22.3 10.0 10.0
South Asia 21.3 20.2 5.5 4.8 -0.1 4.6 5.5 7.2Bangladesh 6.3 37.1 11.8 13.3 17.1 2.8 7.0 12.0Bhutan -4.1 10.3 39.6 1.7 12.0 -5.9 — —India 18.4 20.3 4.2 4.5 -3.9 10.0 4.5 5.0Maldives 43.1 12.7 -6.0 15.9 3.2 -7.0 — —Nepal 3.6 -9.7 1.9 10.2 11.9 20.3 10.0 12.0Pakistan -1.4 16.1 7.1 -2.6 4.2 -10.7 8.0 9.0Sri Lanka 12.0 18.6 7.6 13.3 3.4 -4.1 10.0 15.0
Pacific DMCs 7.9 1.9 -1.6 -14.3 -19.9 0.7 — —Cook Islands 6.8 10.4 -31.0 -10.3 14.0 — — —Fiji Islands 31.8 6.1 23.3 -18.9 -26.6 26.5 — —Kiribati 50.9 43.0 -26.0 17.3 -5.5 — — —Marshall Islands 129.6 23.1 -12.2 28.4 -16.3 — — —Micronesia, Federated States of 135.9 -26.1 -34.7 3.1 -3.0 — — —Nauru — — — — — — — —Papua New Guinea 2.5 0.4 -5.6 -15.1 -20.1 10.1 -5.0 —Samoa -45.3 149.1 15.1 44.3 39.5 — — —Solomon Islands 11.3 17.1 -3.5 -3.1 -9.3 — — —Tonga 34.7 6.4 -25.7 -18.6 -17.2 4.0 — —Tuvalu 10.5 4.3 9.8 -2.0 -84.8 — — —Vanuatu 10.1 13.2 6.4 17.0 -4.4 — — —
Average 18.5 22.1 6.8 7.4 -5.0 6.4 7.6 3.7

253STATISTICAL APPENDIX
Table A12 Direction of Exports(percent share)
Australia/To DMCs Japan US EU New Zealand Others
From 1985 1998 1985 1998 1985 1998 1985 1998 1985 1998 1985 1998
Newly industrialized economiesHong Kong, China 35.6 41.6 4.2 5.3 30.8 23.4 11.8 — 2.3 1.5 15.3 28.2Korea, Rep. of 12.9 30.2 15.0 9.3 35.6 17.4 10.4 — 1.3 2.3 24.7 40.9Singapore 36.7 41.5 9.4 6.6 21.2 19.9 10.1 — 4.4 3.2 18.1 28.8Taipei,China 15.6 36.7 11.3 8.4 15.5 26.6 5.5 17.8 2.4 1.7 49.7 8.9
People’s Rep. of China and MongoliaChina, People’s Rep. of 38.2 31.5 22.3 16.2 8.5 20.7 7.8 — 0.8 1.4 22.5 30.2Mongolia 3.1 — 11.2 — 5.5 — 20.5 — 0.0 — 59.6 —
Central Asian republicsKazakhstan — 16.6 — 2.2 — 3.3 — — — 0.1 — 77.8Kyrgyz Republic — 29.0 — 0.1 — 1.5 — — — — — 69.4Tajikistan — 57.2 — — — 5.2 — — — — — 37.6Uzbekistan — 28.2 — 1.6 — 1.3 — — — — — 68.9
Southeast AsiaCambodia 67.9 — 7.0 — — — 13.2 — 0.0 — 11.9 —Indonesia 17.2 31.1 46.2 17.6 21.7 15.8 6.0 — 1.2 4.1 7.6 31.4Lao People’s Democratic Rep. 71.9 — 6.6 — 2.7 — 0.5 — 5.5 — 12.7 —Malaysia 38.1 37.4 24.6 10.5 12.8 21.6 13.6 — 1.9 2.6 9.1 27.9Myanmar 47.1 44.5 8.4 6.7 0.8 13.2 8.4 — 0.0 0.7 35.4 34.9Philippines 19.5 20.2 19.0 14.4 35.9 34.4 13.8 — 2.1 0.6 9.7 30.4Thailand 27.1 27.3 13.4 13.7 19.7 22.3 17.8 — 1.9 2.0 20.1 34.6Viet Nam 50.4 19.8 17.4 18.1 — 6.2 6.2 — 2.2 5.7 23.8 50.2
South AsiaBangladesh 14.5 6.8 7.2 1.7 18.1 35.8 13.0 — 1.8 0.5 45.5 55.2Bhutan — — — — — — — — — — — —India 8.9 19.5 11.1 5.1 18.9 20.9 16.7 — 1.4 1.3 43.0 53.1Maldives 50.8 — 10.1 — 24.3 — 4.0 — — — 10.9 —Nepal 41.4 — 0.7 — 35.3 — 20.3 — 0.1 — 2.3 —Pakistan 16.0 18.8 11.3 3.4 10.0 21.6 20.9 — 1.1 1.7 40.6 54.5Sri Lanka 11.2 7.6 5.1 4.7 22.3 38.4 17.9 — 1.7 1.3 41.9 48.0
Pacific DMCsCook Islands — — — — — — — — — — — —Fiji Islands 22.5 11.0 3.0 4.7 4.9 16.3 31.0 — 18.2 38.3 20.4 29.7Kiribati 7.2 — 4.3 — 0.0 — 44.497 — 0.5 — 43.5 —Nauru — — — — — — — — — — — —Marshall Islands — — — — — — — — — — — —Micronesia, Federated States of — — — — — — — — — — — —Papua New Guinea 9.9 13.1 22.1 13.1 4.0 5.6 46.5 — 12.0 20.6 5.6 47.7Samoa 0.3 2.0 0.9 0.1 59.4 29.0 5.8 — 29.7 56.5 3.9 12.5Solomon Islands 11.1 44.0 52.1 30.2 2.4 1.8 26.3 — 3.2 2.4 5.0 21.6Tonga 5.9 — 0.2 — 3.2 — 0.5 — 83.1 — 7.1 —Tuvalu — — — — — — — — — — — —Vanuatu 1.4 — 6.7 — 0.0 — 25.4 — 1.6 — 65.0 —
DMCs 25.6 33.7 16.5 10.2 26.3 21.4 10.7 2.0 2.1 2.1 18.8 30.7

ASIAN DEVELOPMENT OUTLOOK 2000254
Table A13 Growth Rate of Merchandise Imports(percent per year)
Economy 1994 1995 1996 1997 1998 1999 2000 2001
Newly industrialized economies 17.4 22.9 5.2 3.1 -19.3 6.5 14.1 11.9Hong Kong, China 16.7 19.1 3.0 5.1 -11.6 -2.7 10.7 11.0Korea, Rep. of 22.6 31.9 12.3 -2.2 -36.2 29.0 23.1 14.3Singapore 19.8 21.7 5.4 0.7 -23.2 6.8 7.9 8.8Taipei,China 10.4 21.2 -0.1 10.1 -7.4 2.8 15.8 13.4
People’s Rep. of China and Mongolia 10.3 15.6 19.4 8.3 -1.5 18.1 9.8 8.0China, People’s Rep. of 0.0 14.2 5.1 2.5 -1.5 18.2 10.0 8.0Mongolia -1.1 32.0 8.2 -1.5 9.5 -15.4 8.6 11.8
Central Asian republics -15.2 24.3 24.5 -0.3 -13.1 -20.7 — —Kazakhstan -18.3 28.1 23.0 8.3 -8.4 -28.2 9.3 7.9Kyrgyz Republic -4.6 24.6 47.5 -17.5 17.0 -29.4 7.5 4.6Tajikistan 7.4 22.2 -6.2 3.0 -9.7 -5.1 — —Uzbekistan -16.3 18.8 31.0 -11.2 -25.2 10.0 8.2 8.5
Southeast Asia 21.7 29.5 6.1 -0.7 -26.4 4.7 13.3 -5.8Cambodia 78.4 16.4 20.3 5.8 -0.1 20.4 12.0 10.0Indonesia 13.9 26.6 8.1 4.5 -30.9 -10.8 7.5 14.0Lao People’s Democratic Rep. 30.6 4.4 17.1 -6.0 -14.7 -2.9 7.0 6.5Malaysia 28.1 29.9 1.6 1.4 -26.5 10.0 12.6 13.0Myanmar 14.3 23.0 6.3 15.3 14.7 — — —Philippines 21.2 23.7 20.8 14.0 -18.8 4.1 14.0 16.0Thailand 18.4 31.9 0.6 -13.4 -33.8 17.7 16.5 17.0Viet Nam 48.5 43.8 38.9 0.8 -2.1 1.2 16.0 17.0
South Asia 38.7 21.6 10.5 3.3 -0.4 5.1 7.7 8.8Bangladesh 2.9 39.2 17.9 3.2 5.1 6.6 7.0 7.0Bhutan -25.7 4.6 14.1 18.4 3.7 20.5 — —India 34.3 21.6 9.1 4.6 0.9 9.0 7.0 8.0Maldives 9.7 20.9 12.6 15.6 1.5 13.5 — —Nepal 21.9 21.7 5.8 21.7 -12.4 -10.5 15.0 15.0Pakistan -13.6 18.5 16.7 -6.4 -8.4 -6.7 9.5 9.0Sri Lanka 18.9 11.4 2.4 7.8 0.4 0.1 14.0 16.0
Pacific DMCs 11.4 0.4 10.4 -1.5 -24.0 -16.1 — —Cook Islands -14.0 -0.4 -10.7 10.5 -20.8 — — —Fiji Islands 10.2 5.8 10.3 -2.5 -25.3 13.9 — —Kiribati -8.3 33.4 0.9 2.6 -14.4 — — —Marshall Islands 11.1 8.5 -0.9 -15.8 -9.3 — — —Micronesia, Federated States of 16.6 -22.2 -26.8 -6.7 -2.4 — — —Nauru — — — — — — — —Papua New Guinea 17.2 -4.5 19.3 -2.0 -30.2 10.4 15.2 —Samoa -22.0 15.2 7.3 0.6 3.1 — — —Solomon Islands 3.9 8.6 -1.9 22.6 -13.4 -13.0 — —Tonga 10.3 35.4 -9.9 -18.7 -8.3 -13.1 — —Tuvalu 11.9 6.4 9.8 28.8 18.6 — — —Vanuatu 13.4 6.4 2.5 -2.6 -3.5 — — —
Average 18.2 23.3 7.6 2.9 -16.2 9.1 12.4 7.5
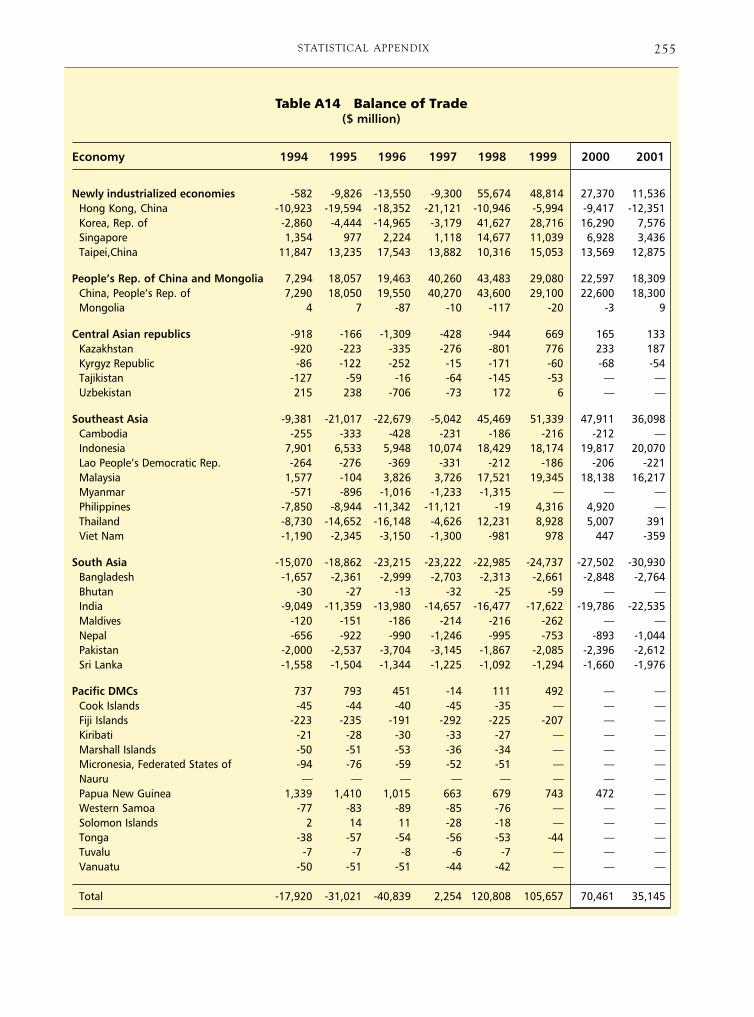
255STATISTICAL APPENDIX
Table A14 Balance of Trade($ million)
Economy 1994 1995 1996 1997 1998 1999 2000 2001
Newly industrialized economies -582 -9,826 -13,550 -9,300 55,674 48,814 27,370 11,536Hong Kong, China -10,923 -19,594 -18,352 -21,121 -10,946 -5,994 -9,417 -12,351Korea, Rep. of -2,860 -4,444 -14,965 -3,179 41,627 28,716 16,290 7,576Singapore 1,354 977 2,224 1,118 14,677 11,039 6,928 3,436Taipei,China 11,847 13,235 17,543 13,882 10,316 15,053 13,569 12,875
People’s Rep. of China and Mongolia 7,294 18,057 19,463 40,260 43,483 29,080 22,597 18,309China, People’s Rep. of 7,290 18,050 19,550 40,270 43,600 29,100 22,600 18,300Mongolia 4 7 -87 -10 -117 -20 -3 9
Central Asian republics -918 -166 -1,309 -428 -944 669 165 133Kazakhstan -920 -223 -335 -276 -801 776 233 187Kyrgyz Republic -86 -122 -252 -15 -171 -60 -68 -54Tajikistan -127 -59 -16 -64 -145 -53 — —Uzbekistan 215 238 -706 -73 172 6 — —
Southeast Asia -9,381 -21,017 -22,679 -5,042 45,469 51,339 47,911 36,098Cambodia -255 -333 -428 -231 -186 -216 -212 —Indonesia 7,901 6,533 5,948 10,074 18,429 18,174 19,817 20,070Lao People’s Democratic Rep. -264 -276 -369 -331 -212 -186 -206 -221Malaysia 1,577 -104 3,826 3,726 17,521 19,345 18,138 16,217Myanmar -571 -896 -1,016 -1,233 -1,315 — — —Philippines -7,850 -8,944 -11,342 -11,121 -19 4,316 4,920 —Thailand -8,730 -14,652 -16,148 -4,626 12,231 8,928 5,007 391Viet Nam -1,190 -2,345 -3,150 -1,300 -981 978 447 -359
South Asia -15,070 -18,862 -23,215 -23,222 -22,985 -24,737 -27,502 -30,930Bangladesh -1,657 -2,361 -2,999 -2,703 -2,313 -2,661 -2,848 -2,764Bhutan -30 -27 -13 -32 -25 -59 — —India -9,049 -11,359 -13,980 -14,657 -16,477 -17,622 -19,786 -22,535Maldives -120 -151 -186 -214 -216 -262 — —Nepal -656 -922 -990 -1,246 -995 -753 -893 -1,044Pakistan -2,000 -2,537 -3,704 -3,145 -1,867 -2,085 -2,396 -2,612Sri Lanka -1,558 -1,504 -1,344 -1,225 -1,092 -1,294 -1,660 -1,976
Pacific DMCs 737 793 451 -14 111 492 — —Cook Islands -45 -44 -40 -45 -35 — — —Fiji Islands -223 -235 -191 -292 -225 -207 — —Kiribati -21 -28 -30 -33 -27 — — —Marshall Islands -50 -51 -53 -36 -34 — — —Micronesia, Federated States of -94 -76 -59 -52 -51 — — —Nauru — — — — — — — —Papua New Guinea 1,339 1,410 1,015 663 679 743 472 —Western Samoa -77 -83 -89 -85 -76 — — —Solomon Islands 2 14 11 -28 -18 — — —Tonga -38 -57 -54 -56 -53 -44 — —Tuvalu -7 -7 -8 -6 -7 — — —Vanuatu -50 -51 -51 -44 -42 — — —
Total -17,920 -31,021 -40,839 2,254 120,808 105,657 70,461 35,145

ASIAN DEVELOPMENT OUTLOOK 2000256
Table A15 Balance of Payments on Current Account($ million)
Economy 1994 1995 1996 1997 1998 1999 2000 2001
Newly industrialized economies 14,031 11,402 2,427 13,917 61,873 49,827 33,594 24,762Hong Kong, China — — — — — — — —Korea, Rep. of -3,867 -8,507 -23,006 -8,167 40,823 25,500 11,800 4,500Singapore 11,400 14,435 14,510 15,033 17,613 16,133 16,058 14,933Taipei,China 6,498 5,474 10,923 7,051 3,437 8,694 5,736 5,329
People’s Rep. of China and Mongolia 7,625 1,575 7,166 29,682 29,199 11,962 -4,423 -10,700China, People’s Rep. of 7,657 1,617 7,280 29,717 29,324 12,000 -4,400 -10,700Mongolia -32 -42 -114 -35 -125 -38 -23 —
Central Asian republics -1,040 -860 -2,233 -1,586 -1,770 -668 -371 -365Kazakhstan -905 -517 -751 -804 -1,248 -269 -218 -218Kyrgyz Republic -84 -235 -425 -139 -323 -168 -154 -148Tajikistan -171 -89 -77 -60 -113 -29 — —Uzbekistan 120 -20 -980 -584 -86 -202 — —
Southeast Asia -20,232 -35,215 -34,737 -20,142 26,870 33,512 22,886 3,044Cambodia -367 -444 -546 -268 -219 -249 -301 —Indonesia -2,960 -6,760 -7,801 -5,001 4,097 4,904 3,819 936Lao People’s Democratic Rep. -221 -233 -307 -293 -137 -147 — —Malaysia -4,521 -8,700 -4,900 -5,000 9,200 11,050 11,801 —Myanmar -53 -244 -305 -350 -447 — — —Philippines -2,950 -3,304 -3,953 -4,345 1,290 6,000 — —Thailand -7,862 -13,248 -14,380 -3,130 14,261 11,300 7,307 2,591Viet Nam -1,298 -2,282 -2,545 -1,756 -1,175 654 260 -484
South Asia -6,559 -9,914 -12,045 -7,515 -10,216 -2,814 -3,254 -2,595Bangladesh -89 -664 -1,291 -534 -253 -394 — —Bhutan -40 -34 -37 -56 -47 -102 — —India -3,369 -5,910 -5,294 -2,648 -7,720 — — —Maldives -11 -18 -8 -37 -26 -57 -28 -31Nepal -225 -343 -390 -290 -245 -172 -415 -519Pakistan -1,965 -2,163 -4,348 -3,557 -1,701 -1,772 -1,531 -1,294Sri Lanka -860 -782 -677 -394 -224 -317 -1,280 -751
Pacific DMCs 517 687 441 -32 179 — — —Cook Islands — 0 5 1 2 — — —Fiji Islands -63 -19 61 6 27 10 — —Kiribati 1 -6 -7 — — — — —Marshall Islands 5 2 4 16 21 — — —Micronesia, Federated States of 13 46 62 64 67 — — —Nauru — — — — — — — —Papua New Guinea 573 673 312 -116 69 -23 -280 —Samoa 5 8 11 17 10 — — —Solomon Islands -2 9 5 -24 — — — —Tonga -8 -22 -11 -2 -19 -2 — —Tuvalu 1 1 — — — — — —Vanuatu -8 -5 -1 6 — — — —
Total -5,658 -32,326 -38,980 14,323 106,135 91,819 48,432 14,145
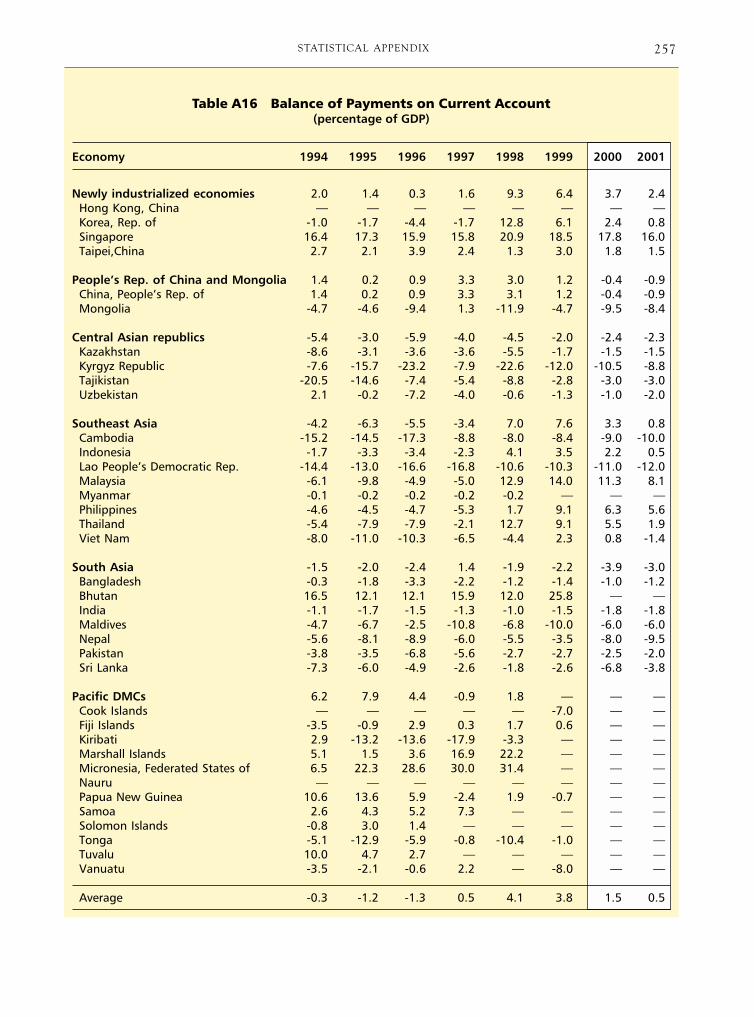
257STATISTICAL APPENDIX
Table A16 Balance of Payments on Current Account(percentage of GDP)
Economy 1994 1995 1996 1997 1998 1999 2000 2001
Newly industrialized economies 2.0 1.4 0.3 1.6 9.3 6.4 3.7 2.4Hong Kong, China — — — — — — — —Korea, Rep. of -1.0 -1.7 -4.4 -1.7 12.8 6.1 2.4 0.8Singapore 16.4 17.3 15.9 15.8 20.9 18.5 17.8 16.0Taipei,China 2.7 2.1 3.9 2.4 1.3 3.0 1.8 1.5
People’s Rep. of China and Mongolia 1.4 0.2 0.9 3.3 3.0 1.2 -0.4 -0.9China, People’s Rep. of 1.4 0.2 0.9 3.3 3.1 1.2 -0.4 -0.9Mongolia -4.7 -4.6 -9.4 1.3 -11.9 -4.7 -9.5 -8.4
Central Asian republics -5.4 -3.0 -5.9 -4.0 -4.5 -2.0 -2.4 -2.3Kazakhstan -8.6 -3.1 -3.6 -3.6 -5.5 -1.7 -1.5 -1.5Kyrgyz Republic -7.6 -15.7 -23.2 -7.9 -22.6 -12.0 -10.5 -8.8Tajikistan -20.5 -14.6 -7.4 -5.4 -8.8 -2.8 -3.0 -3.0Uzbekistan 2.1 -0.2 -7.2 -4.0 -0.6 -1.3 -1.0 -2.0
Southeast Asia -4.2 -6.3 -5.5 -3.4 7.0 7.6 3.3 0.8Cambodia -15.2 -14.5 -17.3 -8.8 -8.0 -8.4 -9.0 -10.0Indonesia -1.7 -3.3 -3.4 -2.3 4.1 3.5 2.2 0.5Lao People’s Democratic Rep. -14.4 -13.0 -16.6 -16.8 -10.6 -10.3 -11.0 -12.0Malaysia -6.1 -9.8 -4.9 -5.0 12.9 14.0 11.3 8.1Myanmar -0.1 -0.2 -0.2 -0.2 -0.2 — — —Philippines -4.6 -4.5 -4.7 -5.3 1.7 9.1 6.3 5.6Thailand -5.4 -7.9 -7.9 -2.1 12.7 9.1 5.5 1.9Viet Nam -8.0 -11.0 -10.3 -6.5 -4.4 2.3 0.8 -1.4
South Asia -1.5 -2.0 -2.4 1.4 -1.9 -2.2 -3.9 -3.0Bangladesh -0.3 -1.8 -3.3 -2.2 -1.2 -1.4 -1.0 -1.2Bhutan 16.5 12.1 12.1 15.9 12.0 25.8 — —India -1.1 -1.7 -1.5 -1.3 -1.0 -1.5 -1.8 -1.8Maldives -4.7 -6.7 -2.5 -10.8 -6.8 -10.0 -6.0 -6.0Nepal -5.6 -8.1 -8.9 -6.0 -5.5 -3.5 -8.0 -9.5Pakistan -3.8 -3.5 -6.8 -5.6 -2.7 -2.7 -2.5 -2.0Sri Lanka -7.3 -6.0 -4.9 -2.6 -1.8 -2.6 -6.8 -3.8
Pacific DMCs 6.2 7.9 4.4 -0.9 1.8 — — —Cook Islands — — — — — -7.0 — —Fiji Islands -3.5 -0.9 2.9 0.3 1.7 0.6 — —Kiribati 2.9 -13.2 -13.6 -17.9 -3.3 — — —Marshall Islands 5.1 1.5 3.6 16.9 22.2 — — —Micronesia, Federated States of 6.5 22.3 28.6 30.0 31.4 — — —Nauru — — — — — — — —Papua New Guinea 10.6 13.6 5.9 -2.4 1.9 -0.7 — —Samoa 2.6 4.3 5.2 7.3 — — — —Solomon Islands -0.8 3.0 1.4 — — — — —Tonga -5.1 -12.9 -5.9 -0.8 -10.4 -1.0 — —Tuvalu 10.0 4.7 2.7 — — — — —Vanuatu -3.5 -2.1 -0.6 2.2 — -8.0 — —
Average -0.3 -1.2 -1.3 0.5 4.1 3.8 1.5 0.5

ASIAN DEVELOPMENT OUTLOOK 2000258
Table A17 Foreign Direct Investment($ million)
Economy 1993 1994 1995 1996 1997 1998
Newly industrialized economies 9,848 14,865 13,820 17,594 20,802 14,183Hong Kong, China 3,657 4,131 3,279 5,521 6,000 1,600Korea, Rep. of 588 809 1,776 2,325 2,844 5,143Singapore 4,686 8,550 7,206 7,884 9,710 7,218Taipei,China 917 1,375 1,559 1,864 2,248 222
People’s Rep. of China and Mongolia 27,523 33,794 35,859 40,196 44,261 45,479China, People’s Rep. of 27,515 33,787 35,849 40,180 44,236 45,460Mongolia 8 7 10 16 25 19
Central Asian republics 1,326 758 1,195 1,255 1,694 1,375Kazakhstan 1,271 660 964 1,137 1,321 1,158Kyrgyz Republic 10 38 96 47 84 102Tajikistan — 10 15 16 4 30Uzbekistan 45 50 120 55 285 85
Southeast Asia 11,294 11,125 14,424 18,085 18,098 14,178Cambodia 54 69 151 294 204 140Indonesia 2,004 2,109 4,346 6,194 4,673 -356Lao People’s Democratic Rep. 36 59 88 128 86 45Malaysia 5,006 4,342 4,178 5,078 5,106 3,727Myanmar 149 91 115 38 124 40Philippines 1,238 1,591 1,478 1,517 1,222 1,713Thailand 1,805 1,364 2,068 2,336 3,733 6,969Viet Nam 1,002 1,500 2,000 2,500 2,950 1,900
South Asia 1,116 1,584 2,934 3,506 4,667 3,433Bangladesh 14 11 2 14 141 317Bhutan — — — — — —India 550 973 2,144 2,426 3,351 2,258Maldives 7 9 7 8 8 7Nepal 4 6 5 19 23 9Pakistan 347 419 720 919 714 497Sri Lanka 194 166 56 120 430 345
Pacific DMCs 206 160 561 180 136 170Cook Islands — — —Fiji Islands 91 68 70 27 34 91Kiribati – – — — 1 —Marshall Islands — — — — — —Micronesia, Federated States of — — — — — —Nauru — — — — — —Papua New Guinea 62 57 455 111 29 30Samoa 2 3 3 1 20 10Solomon Islands 23 2 2 6 21 10Tonga 2 — — 2 1 1Tuvalu — — — — — —Vanuatu 26 30 31 33 30 28
Average 51,313 62,286 68,793 80,816 89,658 78,818

259STATISTICAL APPENDIX
Table A18 External Debt Outstanding($ million)
Economy 1994 1995 1996 1997 1998 1999 2000 2001
Newly industrialized economiesHong Kong, China — — — — — — — —Korea, Rep. of — — — — — — — —Singapore — — — — — — — —Taipei,China — — — — — — — —
People’s Rep. of China and MongoliaChina, People’s Rep. of 100,457 118,090 128,015 130,787 138,000 157,749 175,425 195,777Mongolia 474 504 542 605 742 848 946 1,024
Central Asian republicsKazakhstan 3,265 3,480 4,205 5,952 7,543 — — —Kyrgyz Republic 414 585 733 957 1,177 1,333 1,496 1,654Tajilkistan 760 817 867 1,104 1,178 1,062 — —Uzbekistan 1,107 1,782 2,331 2,550 3,222 3,800 — —
Southeast AsiaCambodia 446 561 624 2,056 2,146 2,223 2,314 —Indonesia 101,278 106,455 113,143 138,018 149,849 — — —Lao People’s Democratic Rep. 1,971 2,057 2,178 2,322 2,442 2,489 — —Malaysia 22,518 33,400 38,700 45,600 42,000 43,200 43,700 —Myanmar 6,555 5,771 5,185 5,647 — — — —Philippines 38,700 39,400 41,900 45,400 47,800 48,100 — —Thailand 64,866 82,568 90,536 93,416 86,160 75,600 71,100 —Viet Nam 5,434 6,452 8,283 10,465 10,358 13,107 13,844 14,650
South AsiaBangladesh 15,700 16,500 17,600 18,700 19,800 20,800 22,004 —Bhutan 130 129 117 120 133 — — —India 99,008 92,982 93,470 94,320 98,231 109,590 116,265 128,465Maldives 126 152 164 156 172 172 — —Nepal 2,320 2,399 2,349 2,369 2,463 — — —Pakistan 24,482 27,072 28,852 29,617 31,000 32,000 33,000 —Sri Lanka 7,888 8,231 8,003 7,698 8,526 8,737 9,381 9,314
Pacific DMCsCook Islands — — — — — — — —Fiji Islands 284 250 218 219 193 — — —Kiribati — — — — — — — —Marshall Islands 158 149 133 125 117 — — —Micronesia, Federated States of 129 119 110 111 113 — — —Nauru — — — — — — — —Papua New Guinea 2,792 2,513 2,507 2,589 2,692 — — —Samoa 154 162 167 156 180 — — —Solomon Islands 155 157 145 135 152 — — —Tonga 64 70 70 61 65 — — —Tuvalu — — — — — — — —Vanuatu 47 48 47 48 63 — — —

ASIAN DEVELOPMENT OUTLOOK 2000260
Table A19 Debt-Service Ratio(percentage of exports of goods and services)
Economy 1994 1995 1996 1997 1998 1999 2000 2001
Newly industrialized economiesHong Kong, China — — — — — — — —Korea, Rep. of — — — — — — — —Singapore — — — — — — — —Taipei,China — — — — — — — —
People’s Rep. of China and MongoliaChina, People’s Rep. of 12.6 12.6 12.6 12.6 12.6 9.6 — —Mongolia 16.3 12.1 11.8 6.3 6.9 5.0 4.8 5.0
Central Asian RepublicsKazakhstan 4.7 9.1 17.6 27.5 26.3 25.0 — —Kyrgyz Republic 4.1 20.5 12.3 6.3 7.8 7.9 11.4 17.9Tajikistan 9.6 30.4 34.4 12.4 11.4 7.6 9.3 10.5Uzbekistan 10.5 7.0 8.3 9.0 9.0 11.0 26.2 27.3
Southeast AsiaCambodia 3.2 3.6 5.8 2.5 2.9 2.5 3.0 3.0Indonesia 32.6 32.6 34.2 37.8 39.1 34.8 — —Lao People’s Democratic Rep. 3.3 5.7 5.3 9.0 11.1 12.0 12.5 12.0Malaysia 4.9 7.3 8.5 6.5 6.6 6.2 5.3 5.0Myanmar 14.5 16.7 — — — — — —Philippines 17.4 15.8 12.7 11.6 12.7 13.1 14.3 14.5Thailand 11.7 11.4 12.2 15.6 20.8 20.4 16.0 —Viet Nam 13.4 12.2 11.0 11.4 13.2 11.1 12.0 10.9
South AsiaBangladesh 11.6 10.3 12.1 11.4 11.7 12.0 12.1 12.1Bhutan 26.8 18.3 25.9 10.4 9.0 14.7 — —India 27.5 27.9 23.6 19.8 19.4 — — —Maldives 4.0 3.9 3.3 7.2 3.9 3.9 — —Nepal 8.0 8.1 5.4 4.5 6.1 6.5 6.5 6.5Pakistan 33.4 34.9 33.9 38.0 40.0 20.0 22.0 —Sri Lanka 13.7 16.5 15.3 13.3 11.0 12.7 12.0 12.0
Pacific DMCsCook Islands — — — — — — — —Fiji Islands 8.6 6.0 3.6 2.8 3.6 — — —Kiribati — — — — — — — —Marshall Islands 38.6 37.9 40.1 36.9 41.1 — — —Micronesia, Federated States of 18.8 21.4 25.3 25.8 26.8 25.0 — —Nauru — — — — — — — —Papua New Guinea 30.8 20.8 16.4 20.5 8.6 — — —Samoa — — 3.0 2.9 3.0 — — —Solomon Islands 6.2 2.8 3.9 2.5 3.3 — — —Tonga 4.7 5.2 5.0 7.0 — — 2.7 —Tuvalu — — — — — — — —Vanuatu 1.6 1.5 1.4 1.0 0.9 — — —
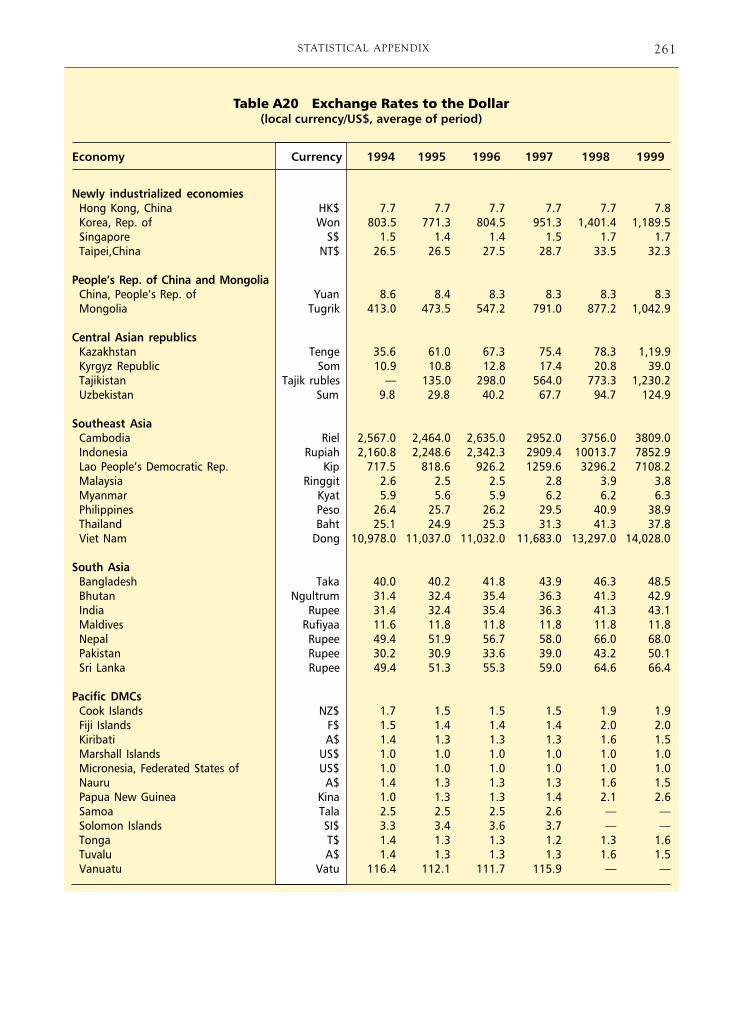
261STATISTICAL APPENDIX
Table A20 Exchange Rates to the Dollar(local currency/US$, average of period)
Economy Currency 1994 1995 1996 1997 1998 1999
Newly industrialized economiesHong Kong, China HK$ 7.7 7.7 7.7 7.7 7.7 7.8Korea, Rep. of Won 803.5 771.3 804.5 951.3 1,401.4 1,189.5Singapore S$ 1.5 1.4 1.4 1.5 1.7 1.7Taipei,China NT$ 26.5 26.5 27.5 28.7 33.5 32.3
People’s Rep. of China and MongoliaChina, People’s Rep. of Yuan 8.6 8.4 8.3 8.3 8.3 8.3Mongolia Tugrik 413.0 473.5 547.2 791.0 877.2 1,042.9
Central Asian republicsKazakhstan Tenge 35.6 61.0 67.3 75.4 78.3 1,19.9Kyrgyz Republic Som 10.9 10.8 12.8 17.4 20.8 39.0Tajikistan Tajik rubles — 135.0 298.0 564.0 773.3 1,230.2Uzbekistan Sum 9.8 29.8 40.2 67.7 94.7 124.9
Southeast AsiaCambodia Riel 2,567.0 2,464.0 2,635.0 2952.0 3756.0 3809.0Indonesia Rupiah 2,160.8 2,248.6 2,342.3 2909.4 10013.7 7852.9Lao People’s Democratic Rep. Kip 717.5 818.6 926.2 1259.6 3296.2 7108.2Malaysia Ringgit 2.6 2.5 2.5 2.8 3.9 3.8Myanmar Kyat 5.9 5.6 5.9 6.2 6.2 6.3Philippines Peso 26.4 25.7 26.2 29.5 40.9 38.9Thailand Baht 25.1 24.9 25.3 31.3 41.3 37.8Viet Nam Dong 10,978.0 11,037.0 11,032.0 11,683.0 13,297.0 14,028.0
South AsiaBangladesh Taka 40.0 40.2 41.8 43.9 46.3 48.5Bhutan Ngultrum 31.4 32.4 35.4 36.3 41.3 42.9India Rupee 31.4 32.4 35.4 36.3 41.3 43.1Maldives Rufiyaa 11.6 11.8 11.8 11.8 11.8 11.8Nepal Rupee 49.4 51.9 56.7 58.0 66.0 68.0Pakistan Rupee 30.2 30.9 33.6 39.0 43.2 50.1Sri Lanka Rupee 49.4 51.3 55.3 59.0 64.6 66.4
Pacific DMCsCook Islands NZ$ 1.7 1.5 1.5 1.5 1.9 1.9Fiji Islands F$ 1.5 1.4 1.4 1.4 2.0 2.0Kiribati A$ 1.4 1.3 1.3 1.3 1.6 1.5Marshall Islands US$ 1.0 1.0 1.0 1.0 1.0 1.0Micronesia, Federated States of US$ 1.0 1.0 1.0 1.0 1.0 1.0Nauru A$ 1.4 1.3 1.3 1.3 1.6 1.5Papua New Guinea Kina 1.0 1.3 1.3 1.4 2.1 2.6Samoa Tala 2.5 2.5 2.5 2.6 — —Solomon Islands SI$ 3.3 3.4 3.6 3.7 — —Tonga T$ 1.4 1.3 1.3 1.2 1.3 1.6Tuvalu A$ 1.4 1.3 1.3 1.3 1.6 1.5Vanuatu Vatu 116.4 112.1 111.7 115.9 — —
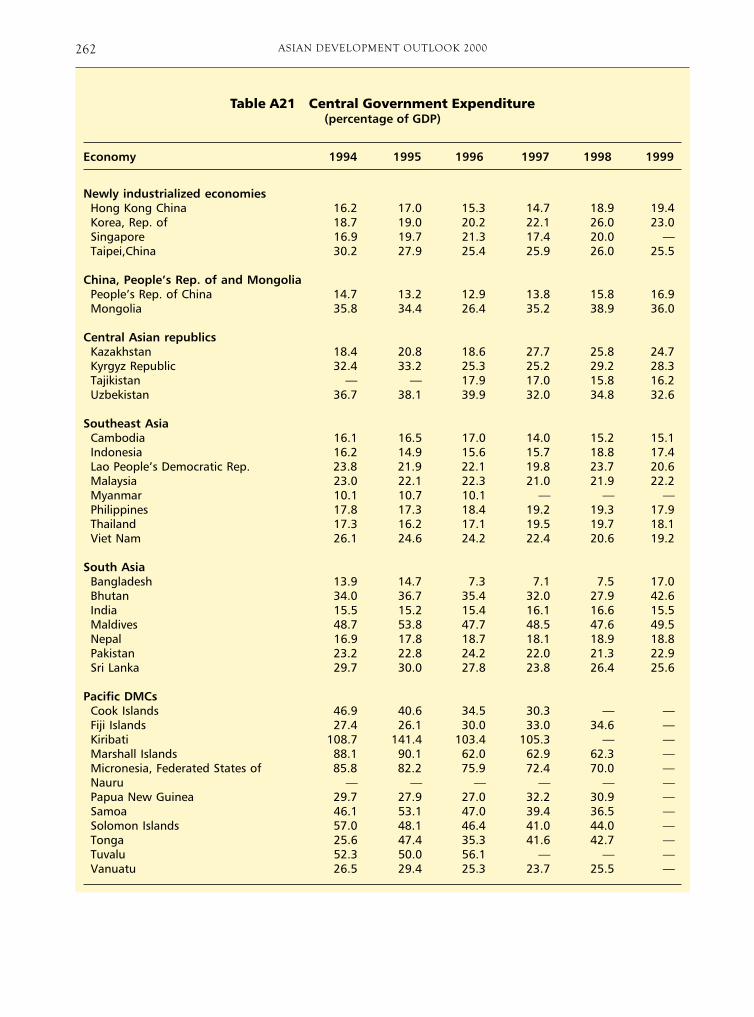
ASIAN DEVELOPMENT OUTLOOK 2000262
Table A21 Central Government Expenditure(percentage of GDP)
Economy 1994 1995 1996 1997 1998 1999
Newly industrialized economiesHong Kong China 16.2 17.0 15.3 14.7 18.9 19.4Korea, Rep. of 18.7 19.0 20.2 22.1 26.0 23.0Singapore 16.9 19.7 21.3 17.4 20.0 —Taipei,China 30.2 27.9 25.4 25.9 26.0 25.5
China, People’s Rep. of and MongoliaPeople’s Rep. of China 14.7 13.2 12.9 13.8 15.8 16.9Mongolia 35.8 34.4 26.4 35.2 38.9 36.0
Central Asian republicsKazakhstan 18.4 20.8 18.6 27.7 25.8 24.7Kyrgyz Republic 32.4 33.2 25.3 25.2 29.2 28.3Tajikistan — — 17.9 17.0 15.8 16.2Uzbekistan 36.7 38.1 39.9 32.0 34.8 32.6
Southeast AsiaCambodia 16.1 16.5 17.0 14.0 15.2 15.1Indonesia 16.2 14.9 15.6 15.7 18.8 17.4Lao People’s Democratic Rep. 23.8 21.9 22.1 19.8 23.7 20.6Malaysia 23.0 22.1 22.3 21.0 21.9 22.2Myanmar 10.1 10.7 10.1 — — —Philippines 17.8 17.3 18.4 19.2 19.3 17.9Thailand 17.3 16.2 17.1 19.5 19.7 18.1Viet Nam 26.1 24.6 24.2 22.4 20.6 19.2
South AsiaBangladesh 13.9 14.7 7.3 7.1 7.5 17.0Bhutan 34.0 36.7 35.4 32.0 27.9 42.6India 15.5 15.2 15.4 16.1 16.6 15.5Maldives 48.7 53.8 47.7 48.5 47.6 49.5Nepal 16.9 17.8 18.7 18.1 18.9 18.8Pakistan 23.2 22.8 24.2 22.0 21.3 22.9Sri Lanka 29.7 30.0 27.8 23.8 26.4 25.6
Pacific DMCsCook Islands 46.9 40.6 34.5 30.3 — —Fiji Islands 27.4 26.1 30.0 33.0 34.6 —Kiribati 108.7 141.4 103.4 105.3 — —Marshall Islands 88.1 90.1 62.0 62.9 62.3 —Micronesia, Federated States of 85.8 82.2 75.9 72.4 70.0 —Nauru — — — — — —Papua New Guinea 29.7 27.9 27.0 32.2 30.9 —Samoa 46.1 53.1 47.0 39.4 36.5 —Solomon Islands 57.0 48.1 46.4 41.0 44.0 —Tonga 25.6 47.4 35.3 41.6 42.7 —Tuvalu 52.3 50.0 56.1 — — —Vanuatu 26.5 29.4 25.3 23.7 25.5 —
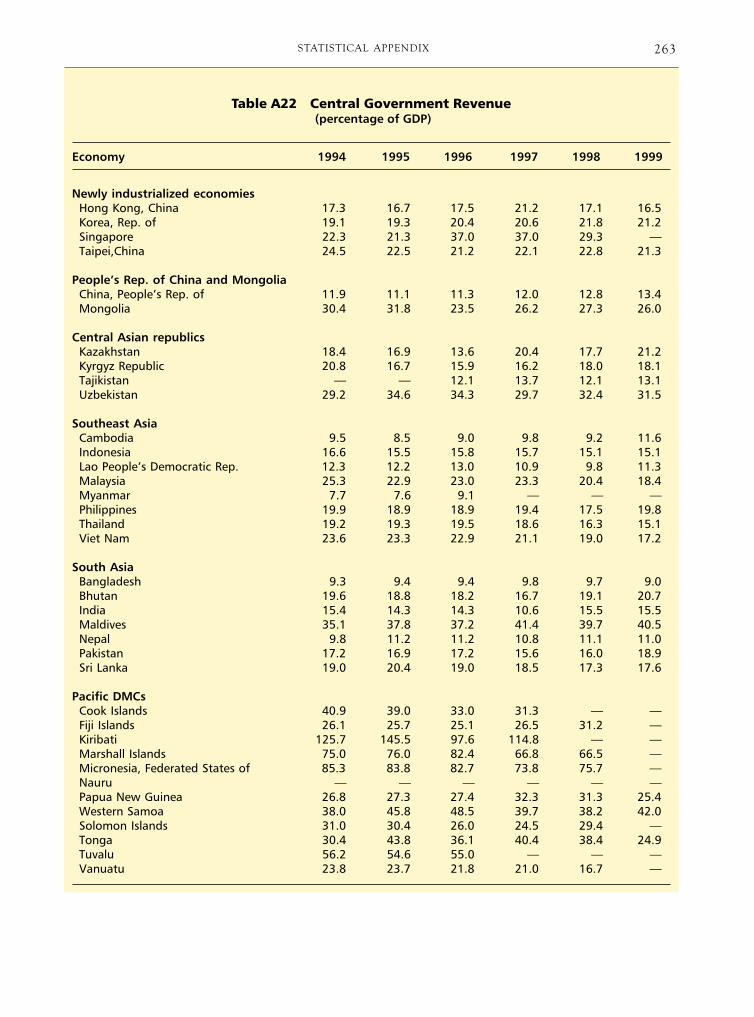
263STATISTICAL APPENDIX
Table A22 Central Government Revenue (percentage of GDP)
Economy 1994 1995 1996 1997 1998 1999
Newly industrialized economiesHong Kong, China 17.3 16.7 17.5 21.2 17.1 16.5Korea, Rep. of 19.1 19.3 20.4 20.6 21.8 21.2Singapore 22.3 21.3 37.0 37.0 29.3 —Taipei,China 24.5 22.5 21.2 22.1 22.8 21.3
People’s Rep. of China and MongoliaChina, People’s Rep. of 11.9 11.1 11.3 12.0 12.8 13.4Mongolia 30.4 31.8 23.5 26.2 27.3 26.0
Central Asian republicsKazakhstan 18.4 16.9 13.6 20.4 17.7 21.2Kyrgyz Republic 20.8 16.7 15.9 16.2 18.0 18.1Tajikistan — — 12.1 13.7 12.1 13.1Uzbekistan 29.2 34.6 34.3 29.7 32.4 31.5
Southeast AsiaCambodia 9.5 8.5 9.0 9.8 9.2 11.6Indonesia 16.6 15.5 15.8 15.7 15.1 15.1Lao People’s Democratic Rep. 12.3 12.2 13.0 10.9 9.8 11.3Malaysia 25.3 22.9 23.0 23.3 20.4 18.4Myanmar 7.7 7.6 9.1 — — —Philippines 19.9 18.9 18.9 19.4 17.5 19.8Thailand 19.2 19.3 19.5 18.6 16.3 15.1Viet Nam 23.6 23.3 22.9 21.1 19.0 17.2
South AsiaBangladesh 9.3 9.4 9.4 9.8 9.7 9.0Bhutan 19.6 18.8 18.2 16.7 19.1 20.7India 15.4 14.3 14.3 10.6 15.5 15.5Maldives 35.1 37.8 37.2 41.4 39.7 40.5Nepal 9.8 11.2 11.2 10.8 11.1 11.0Pakistan 17.2 16.9 17.2 15.6 16.0 18.9Sri Lanka 19.0 20.4 19.0 18.5 17.3 17.6
Pacific DMCsCook Islands 40.9 39.0 33.0 31.3 — —Fiji Islands 26.1 25.7 25.1 26.5 31.2 —Kiribati 125.7 145.5 97.6 114.8 — —Marshall Islands 75.0 76.0 82.4 66.8 66.5 —Micronesia, Federated States of 85.3 83.8 82.7 73.8 75.7 —Nauru — — — — — —Papua New Guinea 26.8 27.3 27.4 32.3 31.3 25.4Western Samoa 38.0 45.8 48.5 39.7 38.2 42.0Solomon Islands 31.0 30.4 26.0 24.5 29.4 —Tonga 30.4 43.8 36.1 40.4 38.4 24.9Tuvalu 56.2 54.6 55.0 — — —Vanuatu 23.8 23.7 21.8 21.0 16.7 —

ASIAN DEVELOPMENT OUTLOOK 2000264
Table A23 Overall Budget Surplus/Deficit of Central Government(percentage of GDP)
Economy 1994 1995 1996 1997 1998 1999
Newly industrialized economiesHong Kong, China 1.1 -0.3 2.2 6.6 -1.8 -0.1Korea, Rep. of 0.4 0.3 0.3 -1.5 -4.2 -2.9Singapore 9.1 6.6 8.6 9.6 1.6 2.5Taipei,China -5.7 -5.4 -4.2 -3.8 -3.3 -4.2
People’s Rep. of China and MongoliaChina, People’s Rep. of -2.7 -2.1 -1.6 -1.8 -3.0 -4.0Mongolia -5.4 -2.7 -2.9 -8.6 -11.5 -10.0
Central Asian republicsKazakhstan -7.3 -2.7 -4.7 -3.8 -4.2 -3.5Kyrgyz Republic -11.6 -17.3 -9.5 -9.0 -9.9 -11.2Tajikistan — — -5.8 -3.3 -3.8 -3.1Uzbekistan -7.7 -4.1 -7.4 -2.2 -3.4 -2.2
Southeast AsiaCambodia -6.8 -7.5 -8.3 -4.2 -6.1 -3.7Indonesia 0.4 0.6 0.2 0.0 -3.7 -2.2Lao People’s Democratic Rep. -11.5 -9.7 -9.1 -8.8 -13.9 -9.3Malaysia 2.3 0.8 0.7 2.6 -1.5 -3.8Myanmar -2.4 -3.1 -1.0 — — —Philippines 1.0 0.6 0.3 0.1 -1.8 -3.6Thailand 1.9 3.0 2.4 -0.9 -3.4 -3.0Viet Nam -2.3 -1.5 -1.3 -1.7 -1.6 -2.0
South AsiaBangladesh -4.5 -5.4 0.9 -4.5 -4.2 -5.3Bhutan -0.5 0.1 2.0 -2.4 1.0 -2.5India -0.1 -1.0 -1.2 -4.8 -5.0 -5.5Maldives -7.4 -9.4 -3.8 -2.0 -5.3 -6.0Nepal -5.8 -4.8 -5.6 -5.1 -6.0 -6.1Pakistan -5.9 -5.6 -7.0 -6.3 -5.6 -3.7Sri Lanka -10.5 -10.1 -9.4 -7.9 -9.2 -8.0
Pacific DMCsCook Islands -6.0 -1.6 -1.5 1.1 — —Fiji Islands -1.3 -0.5 -4.9 -6.5 -3.4 -1.2Kiribati 17.0 4.1 -5.9 6.3 24.0 -3.2Marshall Islands -13.1 -14.1 20.4 3.9 4.2 -9.0Micronesia, Federated States of -0.6 1.7 6.9 1.5 0.3 —Nauru — — — — — —Papua New Guinea -5.9 -4.3 -1.9 -4.4 -5.6 -6.5Samoa -8.1 -7.3 1.5 0.3 1.7 0.5Solomon Islands -6.0 -5.7 -4.7 -5.1 -0.1 -6.1Tonga 4.8 -3.6 0.8 -1.2 -4.3 1.1Tuvalu 3.9 4.7 -1.1 — — 9.0Vanuatu -2.7 -5.6 -3.5 -2.7 -10.3 -1.2
Related Documents


