ADBI Working Paper Series INTERNATIONAL REMITTANCES AND POVERTY REDUCTION: EVIDENCE FROM ASIAN DEVELOPING COUNTRIES Naoyuki Yoshino, Farhad Taghizadeh-Hesary, and Miyu Otsuka No.759 July 2017 Asian Development Bank Institute

Welcome message from author
This document is posted to help you gain knowledge. Please leave a comment to let me know what you think about it! Share it to your friends and learn new things together.
Transcript

ADBI Working Paper Series
INTERNATIONAL REMITTANCES AND POVERTY REDUCTION: EVIDENCE FROM ASIAN DEVELOPING COUNTRIES
Naoyuki Yoshino, Farhad Taghizadeh-Hesary, and Miyu Otsuka
No.759 July 2017
Asian Development Bank Institute

The Working Paper series is a continuation of the formerly named Discussion Paper series; the numbering of the papers continued without interruption or change. ADBI’s working papers reflect initial ideas on a topic and are posted online for discussion. Some working papers may develop into other forms of publication.
ADB recognizes “China” as the People’s Republic of China; “Hong Kong” as Hong Kong, China; and “Korea” as the Republic of Korea.
Suggested citation:
Yoshino, N., F. Taghizadeh-Hesary, and M. Otsuka. 2017. International Remittances and Poverty Reduction: Evidence from Asian Developing Countries. ADBI Working Paper 759. Tokyo: Asian Development Bank Institute. Available: https://www.adb.org/publications/international-remittances-and-poverty-reduction
Please contact the authors for information about this paper.
Email: [email protected], [email protected], [email protected]
Naoyuki Yoshino is dean of the ADB Institute and professor emeritus at Keio University, Tokyo, Japan. Farhad Taghizadeh-Hesary is assistant professor of economics, and Miyu Otsuka is a graduate student, both at Keio University, Tokyo, Japan. The views expressed in this paper are the views of the author and do not necessarily reflect the views or policies of ADBI, ADB, its Board of Directors, or the governments they represent. ADBI does not guarantee the accuracy of the data included in this paper and accepts no responsibility for any consequences of their use. Terminology used may not necessarily be consistent with ADB official terms. Working papers are subject to formal revision and correction before they are finalized and considered published.
Asian Development Bank Institute Kasumigaseki Building, 8th Floor 3-2-5 Kasumigaseki, Chiyoda-ku Tokyo 100-6008, Japan
Tel: +81-3-3593-5500 Fax: +81-3-3593-5571 URL: www.adbi.org E-mail: [email protected]
© 2017 Asian Development Bank Institute

ADBI Working Paper 759 Yoshino, Taghizadeh-Hesary, and Otsuka
Abstract
International remittances represent the second-most-important source of external funding for developing countries after foreign direct investment (FDI). This paper examines the impact of international remittances on poverty reduction using the panel data of 10 Asian developing countries. In terms of the dependent variables, this paper sets 3 poverty indicators: the poverty headcount ratio, poverty gap ratio, and poverty severity ratio. The results show that international remittances have a statistically significant impact on the reduction of the poverty gap ratio and poverty severity ratio using the random-effect model of ordinary least squares (OLS) estimates. A 1% increase in international remittances as a percentage of the GDP can lead to a 22.6% decline in the poverty gap ratio and a 16.0% decline in the poverty severity ratio in the sample of 10 Asian developing countries from 1981 to 2014. In addition, the results indicate that a per capita GDP increase and trade openness can decrease the poverty measures and that higher inflation rates may be one of the causes of poverty.
Keywords: remittances, poverty reduction, developing Asia
JEL Classification: I31, I32, I38

1
1. Introduction
International remittance flows into developing countries are attracting considerable interest because of their rising volume and impact on origin countries. The international remittances to developing countries are estimated to have reached $436 billion in 2014 according to the World Bank (2014). Remittances to the East Asia and Pacific (EAP) region1 and the South Asia region (SAR)2 account for the first- and second-largest portions in the world. Although a number of studies have investigated the effect of international remittances on poverty reduction in specific countries or villages, very little attention has been paid to the impact of international remittances on poverty reduction using the data set of Asian developing countries as a whole and on different indicators of poverty.
The aim of this paper is to investigate whether international remittances contribute to reducing different indicators of poverty in Asian developing countries using more recent data. This data set includes 10 Asian countries: Bangladesh, India, Nepal, Pakistan, and Sri Lanka from the SAR and the People’s Republic of China (PRC), Indonesia, Malaysia, the Philippines, and Thailand from the EAP region. The survey years are from 1981 to 2014. This research will contribute to a deeper understanding of the effects of international remittances on poverty reduction in Asian developing countries, especially migrant-sending countries.
The remaining parts of this paper are organized as follows. Section 2 briefly explains the recent trends of international remittances and poverty in Asian developing countries using official data. Section 3 reviews the previous research about the relationship between international remittances and poverty reduction at the country level and the cross-national level. Section 4 presents the model and data analysis. In Section 5, the empirical work regarding the relationship between international remittances and poverty reduction is discussed. Finally, Section 6 presents concluding remarks and policy implications, focusing on suggestions for increasing the effectiveness of international remittances in Asia.
2. International Remittances and Poverty Reduction in Developing Asia
2-1. Recent Trends in Remittances to Asia
Recently, there has been growing interest in international migration. According to data released by the United Nations, in 2013 there were 232 million international migrants, who accounted for 3.2% of the world population, representing an increase from 175 million in 2010 and 154 million in 1990 (United Nations 2013). The number of labor migrants is also increasing. According to the ADBI, OECD, and ILO (2017), the year 2015 was a peak year 1 The EAP region includes Japan, the People’s Republic of China, Cambodia, Indonesia, the Republic of Korea, Lao PDR, Malaysia, Mongolia, Myanmar, the Pacific Islands, Papua New Guinea, the Philippines, Singapore, Thailand, Timor-Leste, and Viet Nam (World Bank 2016a). 2 The SAR region includes Afghanistan, Bangladesh, Bhutan, India, the Maldives, Nepal, Pakistan, and Sri Lanka.

2
for labor migration from Asian countries both within the region and towards OECD countries outside of Asia.
When we consider the linkage between migration and development, international remittances are thought to be one of the most important elements that contribute to the development of labor-sending countries. International remittances refer to the money and goods that are transmitted to households by migrant workers working outside of their origin countries (Adams 2007).
Table 1: Remittance Flows to Developing Countries and the Growth Rate
2010 2011 2012 2013 2014 2015 2016
($ billions) All developing countries 333 373 392 404 436 473 516
East Asia and Pacific 95 107 107 112 123 135 148 Europe and Central Asia 32 38 39 43 45 49 54 Latin America and Caribbean 56 59 60 61 66 73 81 Middle East and North Africa 40 42 47 46 49 52 55 South Asia 82 96 108 111 118 127 136 Sub-Saharan Africa 29 31 31 32 35 38 41 World 453 507 521 542 581 628 681 Low-income countries 24 28 32 34 37 40 44 Middle-income countries 310 345 359 371 399 433 472 High-income countries 120 133 130 137 145 155 165
(Growth rate, %) All developing countries 10.3 12.1 4.9 3.3 7.8 8.6 8.9
East Asia and Pacific 20.2 13 0.1 4.8 9 9.9 10.1 Europe and Central Asia -0.8 17 2.7 10 6.7 8.4 9.4 Latin America and Caribbean 1.1 5.9 0.9 1.9 9.4 10.4 10.6 Middle East and North Africa 18 6.5 11.8 -2 5.6 6.2 6.3 South Asia 9.4 17.7 12.1 2.3 6.6 7.3 7.5 Sub-Saharan Africa 7 6.8 0.1 3.5 8.7 9.1 9.4 World 8.7 11.7 2.9 3.9 7.3 8.1 8.4 Low-income countries 10.9 19.3 15.2 4.1 8.6 9.5 9.9 Middle-income countries 10.3 11.5 4.1 3.2 7.7 8.5 8.9 High-income countries 4.5 10.7 -2.5 5.9 5.7 6.5 6.8
Source: World Bank calculations based on data from the IMF’s Balance of Payments Statistics Yearbooks (2014).
* The data from 2015 and 2016 are predicted.
Table 1 shows a comparison of estimates for remittance flows to developing countries. International remittances to developing countries are estimated to have reached $436 billion in 2014 according to the World Bank (2014). Remittances to the East Asia and Pacific (EAP) region account for the largest portion in the world and are estimated to have increased by 9.9% from 2014 to reach $135 billion in 2015 (Table 1). The Philippines, for instance,

3
received $29 billion in remittance flows in 2014, which was equivalent to about 10% of its GDP. As for the South Asia Region (SAR), the international remittance flows are estimated to have reached $127 billion in 2015 (Table 1). The economic effects caused by remittances in the SAR are quite robust. International remittances are the largest source of external resource flows in the SAR, and they have been increasing steadily compared with other factors, such as FDI and official development assistance (ODA) (Figure 1). Remittance flows account for a large portion of the external resources in the SAR, especially from the beginning of the twenty-first century. Looking at the respective data of the SAR, the international remittance flows in Nepal, for example, were equivalent to 25% of the GDP and to 98% of the international reserves in 2013 (World Bank 2014). As regards Pakistan, the international remittance flows in 2013 were equivalent to 284% of the international reserves (World Bank 2014).
The growth rate of remittance flows fell around 2012 and 2013 in almost all regions. However, in recent years, such as 2014 and 2015, their growth rate has increased again, especially in the EAP region, Latin America, and the Caribbean. In all developing countries as a whole, the growth rate of remittance flows peaked at 12.2% in 2011, decreased to around 5% and 3% in 2012 and 2013, and recovered to 8% and 9% in 2014 and 2015.
Figure 1: External Resource Flows in the SAR (% of GDP)
Source: Author’s compilation based on World Bank (2016a). Notes: FDI: foreign direct investment, ODA: official development assistance;
the data include Bangladesh, India, the Maldives, Nepal, Pakistan, and Sri Lanka.
SAR = South Asia Region.
0
2
4
6
8
10
12
1990
19
91
1992
19
93
1994
19
95
1996
19
97
1998
19
99
2000
20
01
2002
20
03
2004
20
05
2006
20
07
2008
20
09
2010
20
11
2012
20
13
2014
20
15
% o
f GD
P
Year
FDI Remittances ODA

4
Table 2: Remittances by Receiving Countries, 2005–2014 ($ billion)
Country 2005 2010 2011 2012 2013 2014 India 22.1 53.5 62.5 68.8 70 70.4 China, People’s Rep. of 23.6 52.5 61.6 58 59.5 62.3 Philippines 13.7 20.6 21.9 23.4 25.4 27.3 Pakistan 4.3 9.7 12.3 14 14.6 17.1 Bangladesh 4.6 10.9 12.1 10 11 12 Indonesia 5.4 6.9 6.9 7.2 7.6 8.6 Sri Lanka 2 4.1 5.2 6 6.4 7 Nepal 1.2 3.5 4.2 4.8 5.6 5.8 Thailand 1.2 3.6 4.6 4.7 5.7 5.7 Malaysia 1.1 1.1 1.2 1.3 1.4 1.6
Source: Author’s compilation based on the ADBI, OECD, and ILO (2017).
Table 2 shows the amount of remittance inflows into the Asian developing countries on which this paper will focus. All the countries experienced a drastic increase in the remittances received from 2005 to 2014. For Nepal and Thailand, the amount of remittance inflows in 2014 was about five times as large as that in 2005. India and the PRC are the two Asian countries with the largest emigrant populations in the world, and they received the largest amount of remittances (Table 2). India alone accounts for more than a quarter of all remittances to Asia, and the PRC follows it closely (Figure 2). The Philippines is currently the third-largest remittance-receiving country in Asia.
Figure 2: Share of Asian Remittances by Receiving Country, 2015
Source: Author’s compilation based on the ADBI, OECD, and ILO (2017).
India, 26%
PRC; 24%
Philippines; 11%
Pakistan; 7%
Bangladesh, 6%
Viet Nam; 5%
Indonesia, 3%
Sri Lanka; 3% Nepal; 3%
Republic of Korea; 2% Thailand; 2%
Others; 8%

5
2-2. Recent Trends of Poverty Reduction in Asia
According to the ADB (2015), there has been spectacular progress in reducing poverty in the Asian developing regions owing to the Millennium Development Goals (MDGs).3 The target of the MDGs was to halve the poverty headcount, which indicates the proportion of people whose income is below the poverty line. The poverty headcount ratio is the percentage of the population living on less than $1.90 a day at 2011 international prices (World Bank 2016b). According to the World Bank (2016c), 10.7% of the world’s population lived on less than $1.90 a day in 2013 compared with 12.4% in 2012, which is also a drop from 35% in 1990. This means that 767 million people lived on less than $1.90 a day in 2013, a fall from 881 million in 2012 and 1.85 billion in 1990. Figure 3 shows the proportion of the population below the poverty line in Asian developing countries. It can be said that almost all Asian developing countries – notably the PRC, Nepal, and Viet Nam – have succeeded in reducing extreme poverty, although there is a difference in the scale of progress depending on the country.
Although the poverty headcount is the most common tool for measuring poverty, there are two other factors to consider: poverty depth and poverty severity. Poverty depth is also described as the poverty gap and indicates how far, on average, the poor are from the poverty line. According to the World Bank (2016c), the poverty gap at $1.90 a day (2011 PPP) is the mean shortfall in income or consumption from the poverty line of $1.90 a day (counting the non-poor as having zero shortfall), expressed as a percentage of the poverty line. Poverty severity, which is shown as the squared poverty gap, represents the mean of the squared distance below the poverty line as a proportion of the poverty line (World Bank 2016c).
3 The United Nations Millennium Development Goals are 8 goals that all 191 UN Member States have agreed to try to achieve by the year 2015. The United Nations Millennium Declaration, signed in September 2000, commits world leaders to combating poverty, hunger, disease, illiteracy, environmental degradation, and discrimination against women. The MDGs are derived from this Declaration, and they all have specific targets and indicators. The Eight Millennium Development Goals are: to eradicate extreme poverty and hunger; to achieve universal primary education; to promote gender equality and empower women; to reduce child mortality; to improve maternal health; to combat HIV/AIDS, malaria, and other diseases; to ensure environmental sustainability; and to develop a global partnership for development. (Source: www.who.int/topics/millennium_development_goals/about/en/. Accessed December 25, 2017.)

6
Figure 3: Population Ratio below the Poverty Line ($1.90 a day) (Earliest Year and Latest Year)
Source: ADB (2015).
Note: The “earliest year and latest year” depend on each country: PRC (1990, 2011), Bangladesh (1991, 2010), Bhutan (2003,
2012), India (1993, 2011), the Maldives (1998, 2004), Nepal (1995, 2010), Sri Lanka (1990, 2009), Cambodia (1994, 2011),
Indonesia (1990, 2011), Lao PDR (1992, 2012), Malaysia (1992, 2009), the Philippines (1991, 2012), Thailand (1990, 2010),
and Viet Nam (1993, 2012).
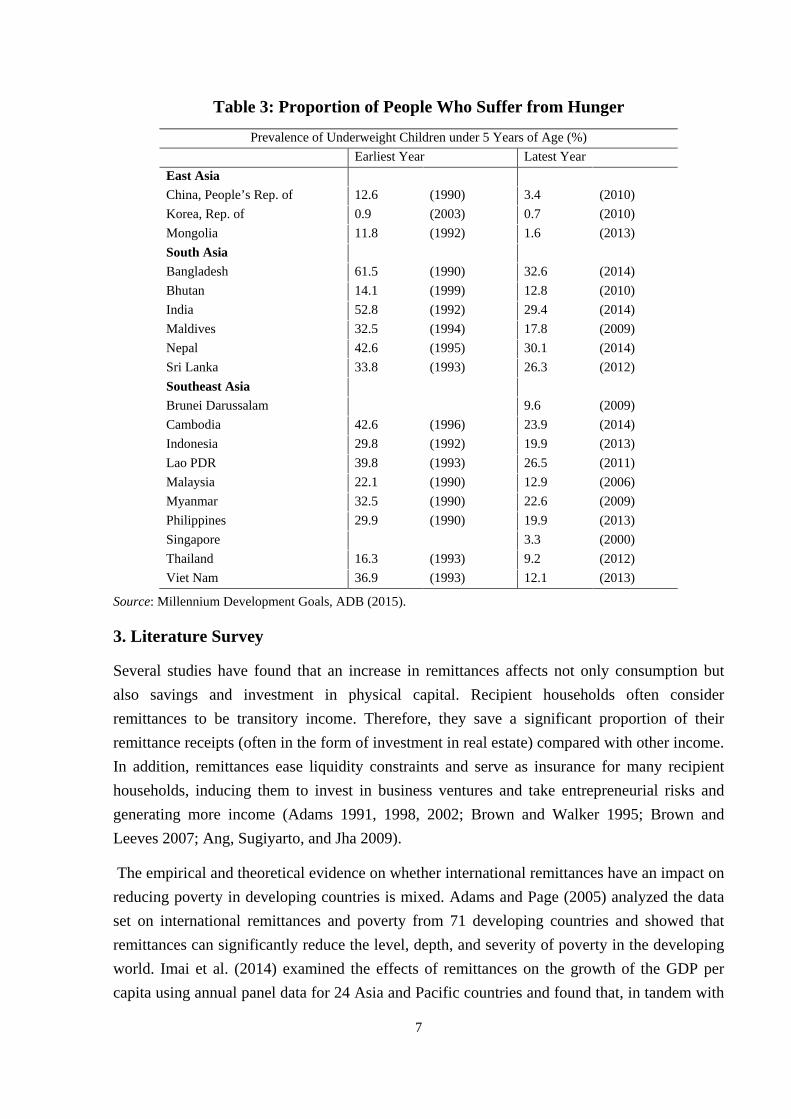
Another of the MDG targets was to halve the proportion of people who suffer from hunger between 1990 and 2015. One way to measure hunger and malnutrition is to calculate the percentage of children under 5 years of age who are underweight. As Table 3 shows, progress in reducing the hunger ratio was achieved in almost all of the developing Asian countries, particularly in the PRC, where the ratio of underweight children decreased from 12.6% in 1990 to 3.4% in 2010. Viet Nam also experienced a drastic decrease in this ratio: from 36.9% in 1993 to 12.1% in 2013. However, malnutrition remained high in some countries, such as India (29.4%), Nepal (30.1%), and Bangladesh (32.6%). Compared with the progress in reducing extreme poverty, the Asian developing region made much slower progress in reaching the hunger target.
The ADB (2015) mentioned that one of the recent characteristics of poverty in developing Asian countries is the higher poverty ratio in rural areas than in urban areas. The rural population is significantly more at risk of being poor than the urban population, and those who have managed to exit poverty can face various risks of returning to it, such as the loss of a job and harmful effects on their livelihood from price volatility, conflicts, and natural disasters.
0.0
10.0
20.0
30.0
40.0
50.0
60.0
70.0
80.0
%
Earliest year Latest year
7
Table 3: Proportion of People Who Suffer from Hunger
Prevalence of Underweight Children under 5 Years of Age (%)
Earliest Year Latest Year
East Asia China, People’s Rep. of 12.6 (1990) 3.4 (2010)
Korea, Rep. of 0.9 (2003) 0.7 (2010) Mongolia 11.8 (1992) 1.6 (2013) South Asia
Bangladesh 61.5 (1990) 32.6 (2014) Bhutan 14.1 (1999) 12.8 (2010) India 52.8 (1992) 29.4 (2014) Maldives 32.5 (1994) 17.8 (2009) Nepal 42.6 (1995) 30.1 (2014) Sri Lanka 33.8 (1993) 26.3 (2012) Southeast Asia
Brunei Darussalam
9.6 (2009)
Cambodia 42.6 (1996) 23.9 (2014) Indonesia 29.8 (1992) 19.9 (2013) Lao PDR 39.8 (1993) 26.5 (2011) Malaysia 22.1 (1990) 12.9 (2006) Myanmar 32.5 (1990) 22.6 (2009) Philippines 29.9 (1990) 19.9 (2013) Singapore
3.3 (2000)
Thailand 16.3 (1993) 9.2 (2012) Viet Nam 36.9 (1993) 12.1 (2013)
Source: Millennium Development Goals, ADB (2015).
3. Literature Survey
Several studies have found that an increase in remittances affects not only consumption but also savings and investment in physical capital. Recipient households often consider remittances to be transitory income. Therefore, they save a significant proportion of their remittance receipts (often in the form of investment in real estate) compared with other income. In addition, remittances ease liquidity constraints and serve as insurance for many recipient households, inducing them to invest in business ventures and take entrepreneurial risks and generating more income (Adams 1991, 1998, 2002; Brown and Walker 1995; Brown and Leeves 2007; Ang, Sugiyarto, and Jha 2009).
The empirical and theoretical evidence on whether international remittances have an impact on reducing poverty in developing countries is mixed. Adams and Page (2005) analyzed the data set on international remittances and poverty from 71 developing countries and showed that remittances can significantly reduce the level, depth, and severity of poverty in the developing world. Imai et al. (2014) examined the effects of remittances on the growth of the GDP per capita using annual panel data for 24 Asia and Pacific countries and found that, in tandem with

8
both the theoretical and the empirical literature, remittances could have a positive effect on growth and poverty reduction. Anyanwu and Erhijakpor (2010) examined the impact of international remittances on poverty reduction in African countries using panel data of 33 countries over the period from 1990 to 2005. They concluded that international remittances have a strong and statistically significant impact on reducing poverty in Africa. From a microeconomic perspective, Taylor et al. (2005) investigated the relationship between remittances and poverty and inequality in Mexico. They collected data from 1,782 households in 14 Mexican states in January and February 2003 to explore the impacts of remittances on rural inequality and poverty. The results show that remittances from international migrants come closer to being equal as well as more effective in reducing poverty as the prevalence of migration increases.
On the other hand, Hein’s (2005) qualitative investigation found that migrant remittances do not necessarily contribute to an improvement in the living conditions in receiving countries, because unattractive investment environments and restrictive immigration policies that interrupt circular migration patterns prevent the high development potential of migration from being fully realized. Chami, Fullenkamp, and Jahjah (2005) also examined a model of remittances based on the economy of 113 countries for which worker remittances were reported over the period 1970–1998. They found that remittances are not profit-driven but compensatory transfers and should have a negative correlation with GDP growth. Azam and Gubert (2006) investigated the microeconomic evidence concerning migration and remittances in Africa and reached two main conclusions. First, migration from Africa is regarded as a collective decision made by families or regions and remittance flows are thought to be a way of diversifying their income sources and supporting the families’ consumption. Second, on the other hand, remittance flows may cause some moral hazard problems within Africa. Those who remain behind in Africa tend to make less effort to work for a lower wage than overseas migrants, because they know that the migrants will compensate for their income shortfalls through international remittance flows. The World Bank’s (2006) International Migration and Development Research Program shows that international remittances reduce the level and depth of poverty. For example, a 10% increase in international remittances will lead to a 3.5% decline in the share of people living in poor conditions. However, at the same time, countries with higher levels of poverty do not necessarily receive more remittances. The countries with the highest level of poverty, such as the Sub-Saharan African countries, do not produce many international migrants and therefore receive fewer remittances. Moreover, this research program suggests that the largest effect of remittances on poverty is observed in countries that are located close to labor-receiving areas. This means that developing countries close to the United States or Europe receive more remittances, which are usually spread evenly among the population.

9
4. Theoretical Model
Before setting the empirical model, this section theoretically demonstrates the impact of remittances on poverty reduction. It shows that the flow of remittances has a greater impact on the low-income group than the high-income group; therefore, it has a poverty reduction impact. First, we start from the utility function of the country consisting of a low-income group and a high-income group.
𝑈 = 𝑈 (𝐶𝐿 ,𝐶𝐻,𝐿𝐿 ,𝐿𝐻) = 𝐶𝐿𝐶𝐻 − 𝐿𝐿𝐿𝐻 (1)
Eq. 1 shows the utility (𝑈) function of a country consisting of a low-income group and a high-income group. The utility function consists of the consumption of goods of the low-income group (𝐶𝐿) and high-income group (𝐶𝐻) subtracting the labor supply of the low-income group (𝐿𝐿) and high-income group (𝐿𝐻), which shows the level of satisfaction or happiness in the country. In this function, for simplicity, we assume that the absolute values of the impact of the consumption of both groups and the labor supply of both groups on the country utility are equal.
Next we write the budget constraints for both income groups.
𝑃𝐶𝐿 = 𝑊𝐿𝐿𝐿 + 𝛼(𝑟𝑒𝑚𝑖𝑡) (2)
𝑃𝐶𝐻 = 𝑊𝐻𝐿𝐻 + (1 − 𝛼)(𝑟𝑒𝑚𝑖𝑡) (3)
The income of both groups comes from two sources: the first source is the wage income, which depends on the wage rate and labor supply of each group, and the second source is the inflow of remittances of workers from their group who went abroad to work and send money to their families. Each group consumes the full income for the purchase and consumption of goods and services; hence, we assume that there is no saving in this model. 𝑃 denotes the general price level of goods and services, 𝑊𝐿 denotes the wage rate of the low-income group, 𝑊𝐻 denotes the wage rate of the high-income group, 𝛼 is share of the low-income group in the total inflow of remittances to the country, and 𝑟𝑒𝑚𝑖𝑡 denotes the total inflow of remittances to the country.
To find the optimal level of consumption and labor supply for each income group, we need to develop a Lagrange function, which is defined as:
Γ = (𝐶𝐿𝐶𝐻 − 𝐿𝐿𝐿𝐻) − 𝜆𝐿{ 𝑃𝐶𝐿 −𝑊𝐿𝐿𝐿 − 𝛼(𝑟𝑒𝑚𝑖𝑡)} (4) −𝜆𝐻{ 𝑃𝐶𝐻 −𝑊𝐻𝐿𝐻 − (1 − 𝛼)(𝑟𝑒𝑚𝑖𝑡)}
Obtaining the first-order conditions with respect to the consumption and labor supply of both groups and 𝜆𝐿 and 𝜆𝐻 results in:
∂ Γ∂ 𝐶𝐿
= 𝐶𝐻 − 𝜆𝐿 𝑃 = 0 (5)

10
∂ Γ∂ 𝐶𝐻
= 𝐶𝐿 − 𝜆𝐻 𝑃 = 0 (6)
∂ Γ∂ 𝐿𝐿
= − 𝐿𝐻 + 𝜆𝐿𝑊𝐿 = 0 → 𝜆𝐿 =𝐿𝐻𝑊𝐿
(7)
∂ Γ∂ 𝐿𝐻
= − 𝐿𝐿 + 𝜆𝐻𝑊𝐻 = 0 → 𝜆𝐻 =𝐿𝐿𝑊𝐻
(8)
∂ Γ∂ 𝜆𝐿
= 𝑃𝐶𝐿 − 𝑊𝐿𝐿𝐿 − 𝛼(𝑟𝑒𝑚𝑖𝑡) = 0 (9)
∂ Γ∂ 𝜆𝐻
= 𝑃𝐶𝐻 − 𝑊𝐻𝐿𝐻 − (1 − 𝛼)(𝑟𝑒𝑚𝑖𝑡) = 0 (10)
Substituting 𝜆𝐿 from Eq. 7 into Eq. 5 and writing it for 𝐶𝐻 results in:
𝐶𝐻 = 𝐿𝐻𝑊𝐿
𝑃 (11)
Substituting 𝜆𝐻 from Eq. 8 into Eq. 6 and writing it for 𝐶𝐿 results in:
𝐶𝐿 = 𝐿𝐿𝑊𝐻
𝑃 (12)
Substituting 𝐶𝐿 from Eq. 12 into Eq. 9 and writing it for 𝐿𝐿 results in the labor supply equation for the low-income group:
𝐿𝐿 =𝛼(𝑟𝑒𝑚𝑖𝑡)
�𝑃2
𝑊𝐻 � − 𝑊𝐿
(13)
Substituting 𝐶𝐻 from Eq. 11 into Eq. 10 and writing it for 𝐿𝐻 produces the labor supply equation for the high-income group:
𝐿𝐻 =(1 − 𝛼)(𝑟𝑒𝑚𝑖𝑡)
�𝑃2
𝑊𝐿 � − 𝑊𝐻
(14)
Substituting 𝐿𝐿 from Eq. 13 into Eq. 12 results in the consumption equation for the low-income group:
𝐶𝐿 = (𝛼)(𝑟𝑒𝑚𝑖𝑡)
�𝑃 −𝑊𝐿𝑊𝐻
𝑃 � (15)
𝑤ℎ𝑒𝑟𝑒: �𝑃 > 𝑊𝐻𝑃 > 𝑊𝐿
� → 𝑃 −𝑊𝐿𝑊𝐻
𝑃> 0

11
Substituting 𝐿𝐻 from Eq. 14 into Eq. 11 generates the consumption equation for the high-income group:
𝐶𝐻 = (1 − 𝛼)(𝑟𝑒𝑚𝑖𝑡)
�𝑃 −𝑊𝐻𝑊𝐿
𝑃 � (16)
𝑤ℎ𝑒𝑟𝑒: �𝑃 > 𝑊𝐿𝑃 > 𝑊𝐻
� → 𝑃 −𝑊𝐻𝑊𝐿
𝑃> 0
From Eq. 15 and Eq. 16 it is clear that, when the remittance inflow to the country is increasing, the consumption of both income groups (high-income and low-income) will increase. This means that remittances affect low-income people’s consumption positively and reduce poverty. However, this does not necessarily mean that remittances can reduce the income inequality, which is dependent on 𝛼; 𝑖𝑓 𝛼 ≥ 0.5, this means that the low-income group is receiving more remittances, hence the income disparity is decreasing. At the community level, several papers have found that remittances affect the distribution of income. Ravanilla and Robleza (2003) applied decomposition analysis to investigate the contribution of remittances to the total income inequality. Dakila and Dakila (2006) analyzed the effect of remittances through a computable general equilibrium model and showed that the main beneficiaries of remittances are the middle class. Tullao, Cortes, and See (2007) showed that the proportion of employed workers in families that received remittances in the Philippines is smaller than the proportion that did not. They opined that the benefits of migration will be reaped by the more educated and families with the ability to pay. This will contribute to the widening of income inequality. Real data support this; for example, migrant households in the Philippines accounted for 23% of the total and some of them for more than one migrant. Fewer than 10% of low-income households receive remittances. The proportion of those receiving remittances increases as one moves to higher-income quintiles. This implies that remittances worsen income inequality in the Philippines. Alternatively, about 6% of households in Viet Nam receive remittances, and most of them are non-poor. The share of poor households receiving remittances is only 3% compared with more than 10% of rich households (the top quintile in the distribution). This might be due to the high cost of migration for Vietnamese people given their main destination (the USA: 51%, France: 13%, Australia: 9%, Canada 7%, and other countries, including neighboring countries in Asia). Urban households tend to receive more remittances than their rural counterparts. Richer households receive more than poorer households (ADB, 2012).
5. Model and Data Analysis
5-1. Empirical Model

12
This paper uses a cross-country model to analyze international remittances’ effect on poverty in Asian developing countries. The model is an updated version of the model of Anyanwu and Erhijakpor (2010) and Banga and Sahu (2010); the empirical model of this paper can be written as:
𝐿𝑜𝑔𝑉𝑖𝑡 = 𝛽0 + 𝛽1𝐿𝑜𝑔 (𝑦𝑖𝑡) + 𝛽2𝐿𝑜𝑔 (𝑟𝑒𝑚𝑖𝑡𝑖𝑡) + 𝛽3𝐿𝑜𝑔 (𝑋𝑖𝑡) + 𝜀𝑖𝑡 (17) (𝑖 = 1, … ,𝑁; 𝑡 = 1, … ,𝑇)
In this model (Eq. 17), the dependent variable 𝑉𝑖𝑡 is the measure of poverty in country i at time t. 𝛽0 is the constant; 𝛽1 is the economic growth elasticity of poverty with respect to the real per capita GDP given by y. 𝛽2 is the elasticity of poverty with respect to international remittances (as a percentage of the GDP) given by remit. 𝑋𝑖𝑡 includes the control variables, which are inflation (as the annual percentage change in the consumer price index) and trade openness, represented by (imports + exports)/GDP. Finally, ε is an error term that includes the error terms in the poverty measure.
The dependent variable, which is poverty, can be measured using three poverty indices: i) the incidence of poverty, ii) the depth of poverty, and iii) the severity of poverty (Foster, Greer, and Thorbecke 2013). The PovcalNet database 4 of the World Bank offers data on the headcount ratio (the poverty incidence), the poverty gap ratio (the depth of poverty), and the squared poverty gap ratio (the severity of poverty), respectively.
First, the poverty headcount ratio is a measure of poverty that refers to the proportion of the population living beneath the poverty line. This paper uses $1.90 per day in 2011 PPP as the poverty line. The poverty headcount measure is thought to be the most commonly calculated poverty measure. The poverty headcount (𝑉0) is expressed as 𝑉0 = 𝑛𝑝 𝑛𝑡⁄ , where 𝑛𝑃 means the number of people who lived on under $1.90 per day in 2011 PPP and 𝑛𝑡 means the total population. Second, the poverty gap ratio indicates how far below the poverty line the average poor household’s income or expenditure falls. For example, a poverty gap of 10% means that the average poor person’s income or expenditure is 90% of the poverty line. This situation can be written as Eq. 18.
𝑦𝑝 = (1 − 𝑉1)𝑦�𝑝𝑜𝑣𝑒𝑟𝑡𝑦𝑙𝑖𝑛𝑒 (18)
𝑦𝑝 means the income of a poor person, 𝑉1 is the poverty gap, and 𝑦�𝑝𝑜𝑣𝑒𝑟𝑡𝑦𝑙𝑖𝑛𝑒 means the poverty line indicated as $1.90 per day in 2011 PPP. When we rearrange the equation, it can be written as Eq. 19:
4 PovcalNet is the source of the official globally, regionally, and internationally comparable country-level poverty estimates published in the World Development Indicators as well as the shared prosperity indices reported in the Global Monitoring Report (World Bank 2016b).

13
𝑉1 = 𝑦�𝑝𝑜𝑣𝑒𝑟𝑡𝑦𝑙𝑖𝑛𝑒−𝑦𝑝𝑦�𝑝𝑜𝑣𝑒𝑟𝑡𝑦𝑙𝑖𝑛𝑒
(19)
The poverty gap measures the extent to which individuals fall below the poverty line as a proportion of the poverty line. The sum of these poverty gaps gives the minimum cost of eliminating poverty if the transfers are perfectly targeted. The measure does not reflect changes in inequality among the poor.
In Eq. 20, 𝑉2 denotes the squared poverty gap index, which is also known as the poverty severity index. The poverty severity index averages the squares of the poverty gaps relative to the poverty line (Eq. 20):
𝑉2 = �𝑦�𝑝𝑜𝑣𝑒𝑟𝑡𝑦𝑙𝑖𝑛𝑒−𝑦𝑝𝑦�𝑝𝑜𝑣𝑒𝑟𝑡𝑦𝑙𝑖𝑛𝑒
�2 (20)
This is one of the Foster–Greer–Thorbecke (FGT) poverty measures that allow one to vary the amount of weight on the income (or expenditure) level of the poorest members of society. The FGT poverty measures are additively decomposable. It is also possible to separate changes in the FGT measures into a component resulting from rising average incomes and a component resulting from changes in the distribution of income.
The effect of squaring gives more weight to the poorest of the poor, drawing attention to the inequality between subpopulations of the poor. This can be illustrated by a simple example. Imagine two areas that both exhibit a poverty gap of 20%. In the first area, everyone is equally poor and must make up a 20% shortfall to reach the poverty line. In the second area, by contrast, half of the poor must only make up a 5% shortfall to reach the poverty line, while the other (poorer) half must contend with a much bigger 35% shortfall. In the first area, the severity index would be 0.2*0.2 = 0.04 or 4%, whereas in the second area it would be ((0.05*0.05) + (0.35*0.35)/2) = 0.0625 or 6.25%. Thus, in spite of exhibiting the same poverty gap, the two example areas differ significantly in their severity index, the index being higher in the area exhibiting greater inequality between the poor and a larger number of very poor people (Wiesmann, Kiteme, and Mwangi 2014).
The first explanatory variable, 𝑦𝑖𝑡, is the real per capita GDP. The relationship between the real per capita GDP and poverty is expected to be negative (β1). This is because an increase in the per capita GDP can make people’s life better through an increase in disposable income. The second variable, 𝑟𝑒𝑚𝑖𝑡𝑖𝑡, is the inflow of international remittances (ratio of the GDP). The sign of β2 as the coefficient of this variable could be either positive or negative, as found in the literature review, and the objective of this paper is to assess this impact. 𝑋𝑖𝑡 includes the control variables, inflation, and trade openness. Inflation brings a price increase or price instability, which can have a negative impact on welfare. Thus, a negative association between

14
inflation and poverty can be expected. Another variable, trade openness, can be correlated either positively or negatively with poverty, as we found in the literature. Trade liberalization could benefit the poor, because it could increase the relative wage of low-skilled workers and reduce monopoly rents or the connection to some bureaucratic and political powers (Anyanwu and Erhijakpor 2010). On the other hand, trade liberalization may worsen the income distribution by accelerating the skill-biased technical change in response to the increased competition with foreign countries. Therefore, trade liberalization may not necessarily be good for poverty reduction unless there are drastic per capita income growth and overall economic growth.
In this paper, the data set consists of 10 Asian countries: Bangladesh, the PRC, India, Indonesia, Malaysia, Nepal, Pakistan, the Philippines, Sri Lanka, and Thailand. All of these countries, except Malaysia and Thailand, are well-known migrant-sending countries of East and South Asia. Malaysia and Thailand have recently experienced a period of transition from being migrant-sending countries to being migrant-receiving countries. The survey years are from 1981 to 2014. Based on the survey years when the World Bank’s PovcalNet database collected the data on poverty measures and inequality, this paper also collected data on other variables. Therefore, in the years for which the PovcalNet database does not have data about the dependent variables, this paper sets zero for the other data. This paper uses panel data.
5-2. Unit Root Tests
To evaluate the stationarity of all the series, we performed two-unit root tests on all the variables at levels and at first differences with the intercept and trend. The unit root tests are the augmented Dickey–Fuller (ADF) test and the Phillips–Perron (PP) test. The results are summarized in Table 4.
Table 4: Unit Root Tests
Augmented Dickey–Fuller (ADF) Phillips–Perron (PP)
Levels First Differences Levels First Differences
Variable (t-statistics) (t-statistics) (t-statistics) (t-statistics) Poverty Headcount 63.59* 93.19* 69.65* 106.84* Poverty Gap 285.82* 304.25* 141.16* 155.71* Poverty Severity 40.25* 271.88* 188.21* 195.09* Per Capita GDP 9.45 71.29* 9.32 71.09* Remittance 14.11 42.10* 12.31 42.15* Inflation Rate 53.13* 96.88* 62.92* 334.09* Trade Openness 20.23 59.41* 17.59 66.09*
Notes: The per capita GDP is based on constant 2011 US$, and the remittances are inflows of international
remittances (ratio of GDP). * indicates rejection of the null hypothesis of the presence of a unit root at the 1%
level.

15
The results show that, according to both the augmented Dickey–Fuller (ADF) and the Phillips–Perron (PP) test, the per capita GDP, remittances, and trade openness contain a unit root. Hence, we need to test the series again in their first differences. For both tests, the results show that we can reject the null hypothesis of the presence of a unit root when applying the first difference, which means that the variables are integrated to the order one or I(1). Hence, the variables will appear in our empirical analysis in first-difference mode. When series are not integrated to the order one, we need to run the Johansen cointegration test to check for the presence of cointegration. The Johansson cointegration test results show that the series are not cointegrated.
6. Empirical Results
6-1. Pooled OLS Results
Table 5 shows the results of the empirical estimations for Eq. 17 using the ordinary least squares (OLS) of panel data analysis. In order to select the optimal lag length, we used The Akaike information criterion (AIC). Table 5 shows that the international remittance variable has a negative impact on all three of the poverty measures: the poverty headcount ratio (𝑉0), poverty gap ratio (𝑉1), and poverty severity ratio (𝑉2). The t-statistics of the poverty gap and poverty severity are statistically significant. However, the t-statistics of the poverty headcount ratio are statistically insignificant. The results of the OLS test show that a 1% increase in the international remittance flows as a percentage of the GDP can lead to a decrease in the poverty gap ratio of 22.6% and a decrease in the poverty severity ratio of 18.3%.
Table 5: Empirical Results of the Effects of International Remittances on Poverty Measures
Variable Poverty Headcount
Poverty Gap
Poverty Severity
Constant 0.019 0.016 0.012
(0.758) (0.670) (0.540)
Per Capita GDP (Constant 2011 US$) -0.007 -0.192** -0.25**
(-0.335) (-8.816) (-13.216)
Inflow of International Remittances (Ratio of GDP) -0.093 -0.226** -0.183**
(-1.451) (-3.486) (-3.167)
Inflation Rate 1.394** 1.362** 1.214**
(14.446) (13.918) (13.929)
Trade Openness -0.025** -0.032** -0.037**
(-3.496) (-4.467) (-5.783)
R-Squared 0.666 0.395 0.397 Adjusted R-Squared 0.651 0.387 0.386
Prob. (F-Statistics) 0.00 0.00 0.00 Observations 330 330 330
Notes: The numbers in parentheses are t-values. ** Significant at the 1% level.

16
The other explanatory variables, except for the inflation rate, all have a negative effect on the poverty measures. First, the per capita GDP has a negative association with the poverty measures, which means that an increase in the per capita GDP leads to a decline in poverty. As for the inflation rate and trade openness, they have a positive and a negative correlation with the poverty indicators, respectively. A continuing high inflation rate provokes a price hike and price instability, which can produce an adverse effect on people’s life and expand poverty. In the case of inflation, stock prices and land and real estate prices will rise; on the other hand, the living expenditures, including housing, clothing, and food costs, will rise. This means that poor people have to spend more to survive. Although inflation affects different income groups (rich and poor), rich people can gain more from their financial assets and real estate price increases and poor people do not have those kind of assets; hence, they suffer. As regards trade openness, the results show that all the poverty measures have a negative correlation with the spread of trade openness. This means that, if the observed countries open themselves up to foreign countries by increasing the volume of trade against their GDP, poverty can decrease. This is because the relative wage of low-skilled workers can increase, monopoly rents and the connection to some bureaucratic or political powers can be reduced, and trade liberalization and international competition can stimulate the country’s industry, especially with a comparative advantage.
6-2. Hausman Test
Table 6 shows the results of the Hausman test to verify whether we should choose a fixed-effect model or a random-effect model. 5 Following the Hausman test, this paper adopts a random-effect model that considers the independence between fixed effects and explanatory variables. The results of the random-effect model are similar to those of the pooled OLS. International remittances have a statistically significant impact on the poverty gap ratio and poverty severity ratio reduction.
The results show that a 1% increase in the international remittance flows as a percentage of the GDP can lead to a decrease in the poverty gap ratio of 22.6% and a decrease in the poverty severity ratio of 16.0%. However, only the t-statistics of international remittances are statistically insignificant for the poverty headcount ratio. This may be because the poverty headcount ratio does not reflect the poverty gap among the poor. There might be people who live on $1.90 per day, but, at the same time, there might be people who live on $0.50 per day. Although remittances are distributed to people in developing countries, those who receive
5 A test of fixed vs. random effects can also be seen as a test of overidentifying restrictions. The fixed-effect estimator uses the orthogonality condition that the regressors are uncorrelated with the idiosyncratic error. The random-effect estimator uses the additional orthogonality condition that the regressors are uncorrelated with the group-specific error (the “random effect”). These additional orthogonality conditions are overidentifying restrictions. See Arellano (1993) and Wooldridge (2002, 290–291).

17
remittances might be from high-income families, because it costs a considerable amount to leave home countries and work abroad. This can lead to an expansion of the gap among the poor. Compared with the poverty headcount ratio, the poverty gap ratio and poverty severity ratio take into account the average poor household’s income or expenditures against the poverty line. Therefore, these two variables can reflect a substantial reduction in poverty and a significant effect from international remittance inflows.
As regards the other variables, a per capita GDP increase of 1% can lead to a 19.2% decrease in the poverty gap ratio and a 24.3% decrease in the poverty severity ratio. However, a per capita GDP increase does not have a significant impact on the poverty headcount. This is because a per capita GDP increase for people who are far from the poverty line does not necessarily improve the poverty headcount ratio. High inflation can be a factor that accelerates poverty by expanding the gap between the rich and the poor. High-income people benefit from a wage hike due to increasing inflation, while poor people, who tend to experience difficulties in finding job opportunities, cannot enjoy such a benefit. Finally, trade openness can reduce all three poverty variables by increasing both the net exports and the country’s GDP.
Table 6: Hausman Test
Variable Poverty Headcount Poverty Gap Poverty Severity Fixed Random Fixed Random Fixed Random Constant 0.013 0.018 0.013 0.017 0.017 0.015
(0.758) (0.725) (0.560) (0.729) (0.794) (0.537)
Per Capita GDP -0.044* -0.001 -0.140** -0.192** -0.228** -0.243**
(-2.069) (-0.072) (-6.429) (-9.580) (-11.493) (-12.795)
Inflow of International Remittances -0.044 -0.085 -0.149* -0.226** -0.124* -0.160**
(-0.653) (-1.410) (-2.573) (-3.788) (-1.959) (-2.745)
Inflation Rate 1.143** 1.353** 1.090** 1.362** 1.027** 1.133** (11.912) (15.002) (11.206) (15.124) (11.484) (13.206) Trade Openness -0.025* -0.024** -0.025** -0.032** -0.031** -0.035**
(-2.587) (-3.586) (-3.642) (-4.854) (-4.983) (-5.586)
R-Squared 0.716 0.653 0.502 0.395 0.467 0.362 Adjusted R-Squared 0.704 0.648 0.481 0.387 0.449 0.354
Prob. (F-Statistics) 0.00 0.00 0.00 0.00 0.00 0.00 Observations 330 330 330 330 330 330
Notes: The numbers in parentheses are t-values. ** Significant at the 1% level; * significant at the 5% level.
Finally, it is also important to mention that remittances are not the only solution for reducing the poverty in developing countries. There are many other issues that need to be considered. i) Tax compliance: in many developing countries, rich people avoid paying proper tax by hiding their wealth, and the tax rates are not progressive, which means that everybody pays similar tax rates; hence, the income disparity remains. ii) Lack of high-quality education: education is very costly, which means that poor people cannot send their children to higher education or high-

18
quality institutes, so they cannot be recruited for high-income jobs and the poverty and income disparity remain in the society. iii) Regional disparity: in most developing countries, the main job in rural areas is agriculture. Agricultural farmers in developing countries receive a lower income than urban people, because in urban areas there are many opportunities to enjoy the economic growth; however, the agricultural sector has very low productivity and the workers’ income remains very low. iv) Fiscal subsidies: fiscal subsidies, such as unemployment compensation and a social welfare system, are not well developed in underdeveloped countries; therefore, poor people cannot receive fiscal transfers from the government. However, advanced countries, such as the Scandinavian countries, have higher tax rates but at the same time a very good social welfare system, making people much more equal. v) Lack of infrastructure: this makes the situation more difficult for micro, small, and medium-sized enterprises to sell their products to cities efficiently and to export overseas; therefore, their businesses cannot grow, which is another reason for the income disparity.
7. Concluding Remarks and Policy Implications
This paper examined the impact of international remittances on poverty in Asia using a data set of 10 developing Asian countries. Some key findings and policy implications emerged. First, international remittances have a significant impact on reducing poverty in Asia, especially on reducing the poverty gap ratio and poverty severity ratio. The empirical results show that a 1% increase in international remittances as a percentage of the GDP can lead to a 22.6% decline in the poverty gap ratio and a 16.0% decline in the poverty severity ratio. Moreover, the per capita GDP and trade openness also appear to decrease all the poverty measures, and the inflation rate could be a factor that fuels them. Looking at the analysis overall, some policy implications can be offered in terms of the relationship between international remittances and poverty measures. One of the policies for increasing the positive impact of remittances on lowering poverty in the target countries is to reduce the transaction costs. Lowering the transaction costs of sending remittances in Asia can encourage an increasing share of remittances that flow through formal channels rather than unofficial ones. Appendix 1 shows the total average cost of sending a remittance transfer when a migrant remits US$200. The data calculations are based on the World Bank’s Remittance Prices Worldwide. The total cost includes the fee charged to senders plus the exchange rate margin. Although the World Bank (2014) stated that South‒South migration is more extensive than South‒North migration – 82.3 million migrants from developing countries live in another developing country and 81.9 million from developing countries live in a developed country – according to the tables, it is clear that people from all 10 Asian countries migrate to countries with higher incomes than their own country.

19
As regards the cost of sending remittance transfers, it tends to increase according to the income level of the migrant-receiving countries. For example, remittance transfers from the US, Japan, Germany, and the UK, which account for a large part of the total GDP in high-income countries as a whole, impose quite a high cost on people. In contrast, remittance transfers from India, Saudi Arabia, and the UAE, where the GDP is usually lower than in the former countries, impose a lower cost on people. Moreover, although Appendix 1 estimates the situation of sending US$200, the average amount of remittances sent by most migrants in developing countries is in the range of US$300, and the money is sent on average every month (De Luna Martinez 2005). In the situation in which people send less than US$300 to their home countries, it is estimated that about 8 to 10% of remittance transfers can entail a fee. The fees increase when the amount of remittances decreases. To reduce the cost of sending remittances, one possible solution is to encourage a partnership between international banking services and remittance transfer operators. Although there are many channels, including unofficial ones, through which remittances can be made, creating a solid transfer system within the international banking services and encouraging migrants to use the official banking channels can lead to increased efficiency and equality for migrants in sending remittances.
Second, technological improvements are required in the remittance transfer systems through the use of financial technology (Fintech). While Appendix 1 shows the total average cost of remittance transfers using every payment instrument, Appendix 2 only focuses on Internet-based payments. Appendix 2 shows the total average cost of sending a remittance transfer when a migrant sends US$200 using Internet payment media. We can say from Appendix 2 that in some cases using Internet payment systems reduces the transaction costs but in most cases the costs are higher when migrants use Internet payment systems. In today’s world, where every economic activity is related to technology, it is essential to create a specific infrastructure to transfer remittances using Internet services with lower costs. By establishing solid banking technologies in the remittance transfer network, it may be possible to expedite check clearance and improve information disclosure. The two above policy implications to be taken into consideration are: 1) fostering official banking channels through cooperation between international banking services and remittance transfer operators and 2) creating a remittance transfer system (peer-to-peer or P2P) using Fintech to reduce the cost of sending remittances and to make good use of remittances in migrant-sending countries. Reducing the costs of sending remittances might increase the disposable income of migrants and their families, which may accelerate the reduction of poverty in migrant-sending countries.

20

21
References
ADB. 2012. Global Crisis, Remittances, and Poverty in Asia. Manila: Asian Development Bank.
ADB. 2015. Eradicate Extreme Poverty and Hunger. Manila: Asian Development Bank.
ADBI, OECD, and ILO. 2017. Safeguarding the Rights of Asian Migrant Workers from Home to the Workplace. Tokyo, Paris, and Bangkok: ADBI, OECD, and ILO.
Adams, R. 1991. “The Economic Uses and Impact of International Remittances in Rural Egypt.” Economic Development and Cultural Change 39 (4): 695–722.
Adams, R. 1998. “Remittances, Investment, and Rural Asset Accumulation in Pakistan.” Economic Development and Cultural Change 41 (1): 155–73.
Adams, R. 2002. Precautionary Saving from Different Sources of Income: Evidence from Rural Pakistan. Policy Research Working Paper 2761. Washington, DC: World Bank.
Adams, R. H. Jr. 2007. “The Determinants of International Remittances in Developing Countries.” World Development 37 (1): 93‒103.
Adams, R. H. Jr., and J. Page. 2005. “Do International Migration and Remittances Reduce Poverty in Developing Countries?” World Development 33 (10): 1645‒69.
Ang A. P., G. Sugiyarto, and S. Jha. 2009. Remittances and Household Behavior in the Philippines. ADB Economics Working Paper Series No. 188. Manila: Asian Development Bank.
Anyanwu, J. C., and A. E. O. Erhijakpor. 2010. “Do International Remittances Affect Poverty in Africa?” African Development Review 22 (1): 1‒38.
Arellano, M. 1993. “On the Testing of Correlated Effects with Panel Data.” Journal of Econometrics 59 (1‒2): 87‒97.
Azam, J. P., and F. Gubert. 2006. “Migrants’ Remittances and the Household in Africa: A Review of Evidence.” Journal of African Economics: 1‒36.
Banga, R., and P. K. Sahu. 2010. Impact of Remittances on Poverty in Developing Countries. Switzerland: UNCTAD, United Nations.
Brown, R. P., and G. Leeves. 2007. Impacts of International Migration and Remittances on Source Country Household Incomes in Small Island States; Fiji and Tonga. Working Papers 07–13. Rome: Agricultural and Development Economics Division, Food and Agriculture Organization.

22
Brown, R. P., and C. Walker. 1995. Migrants and Their Remittances: Results of a Household Survey of Tongans and Western Samoans in Sydney. Pacific Studies Monograph No. 17. Sydney: Centre for South Pacific Studies, University of New South Wales.
Chami, R., C. Fullenkamp, and S. Jahjah. 2005. “Are Immigrant Remittance Flows a Source of Capital for Development?” IMF Staff Papers 52 (1): 1‒25.
Dakila, C., and F. Dakila, Jr. 2006. Modeling the Impact of Overseas Filipino Workers Remittances on the Philippine Economy: An Inter-Regional and Economy-Wide Approach. BSP Working Paper Series No. 2006-02. Manila: Bangko Sentral ng Pilipinas.
Foster, J., J. Greer, and E. Thorbecke. 2013. “A Class of Decomposable Poverty Measures.” Econometrica 52 (3): 761‒6.
Hein, D. H. 2005. “International Migration, Remittances and Development: Myths and Facts.” Third World Quarterly 26 (8): 1269‒84.
Imai, K. S., R. Gaiha, A. Ali, and N. Kaicker. 2014. “Remittances, Growth, and Poverty: New Evidence from Asian Countries.” Journal of Policy Modeling 36: 524‒38.
IMF. 2014. Balance of Payments Statistics Yearbooks, 116‒8. International Monetary Fund: Washington D.C..
De Luna Martinez, J. 2005. Workers’ Remittances to Developing Countries: A Survey with Central Banks on Selected Public Policy Issues. WPS3638. 4-35. World Bank: Washington D.C.
Ravanilla N., and E. Robleza. 2003. The Contribution of Remittances to Income Inequality. School of Economics, University of the Philippines.
Taylor, J. E., J. Mora, R. Adams, and A. L. Feldman. 2005. “Remittances, Inequality and Poverty: Evidence from Rural Mexico.” Giannini Foundation for Agricultural Economics 5 (3): 1‒40.
Tullao Jr., T., M. A. Cortes, and E. See. 2007. “The Economic Impacts of International Migration: A Case Study on the Philippines.” Manila: Center for Business and Economics Research and Development, De La Salle University.
United Nations. 2013. Trends in International Migrant Stock. Migrants by Destination and Origin. Department of Economic and Social Affairs. http://www.un.org/en/development/desa/population/migration/data/estimates2/estimates15.shtml

23
Wiesmann, U., B. Kiteme, and Z. Mwangi. 2014. Socio-Economic Atlas of Kenya: Depicting the National Population Census by County and Sub-Location. Nairobi, Nanyuki, and Bern: KNBS, CETRAD, and CDE.
Wooldridge, J. M. 2002. Econometric Analysis of Cross Section and Panel Data. Massachusetts: MIT Press.
World Bank. 2006. “Global Economic Prospects.” Economic Implications of Remittances and Migration 34320 (1): 117‒34.
World Bank. 2014. “Migration and Development Brief 22.” Migration and Remittances Team, Development Prospects Group 22: 4‒27.
World Bank. 2015. Remittance Prices Worldwide. World Bank. http://remittanceprices.worldbank.org/en/countrycorridors
World Bank. 2016a. World Development Indicators. World Bank. http://data.worldbank.org/
World Bank. 2016b. PovcalNet: An Online Analysis Tool for Global Poverty Monitoring. World Bank. http://iresearch.worldbank.org/PovcalNet/home.aspx
World Bank. 2016c. Poverty and Shared Prosperity 2016: Taking on Inequality, 35‒52. World Bank.

24
Appendix 1: Total Average Cost of a Remittance Transfer of US$200
Destination Countries Top Origin Countries Total Average Cost (US$) Bangladesh India 8.4
Saudi Arabia 7.57
UAE 5.38
PRC Hong Kong, China No Data
US 17.11
Republic of Korea 11
India UAE 5.67
US 5.71
Saudi Arabia 9.03
Indonesia Malaysia 11.13
Saudi Arabia 8.41
UAE 12.25
Malaysia Singapore 10.25 Nepal India 6.3
Malaysia 5.98
Pakistan Saudi Arabia 6.87
India 8.4
UAE 6.42
Philippines US 10.67
Saudi Arabia 8.62
Canada 12.44
Sri Lanka India 8.4
Saudi Arabia 8.04
Thailand Germany 29.15
Japan 21.43
UK 19.72
Notes: The total average cost is calculated as the fee charged to senders plus the exchange rate margin.
Source: Author’s compilation using World Bank (2015).

25
Appendix 2. Total Average Cost of a Remittance Transfer of US$200 (in the Case of Using Internet Payment Systems)
Origin Countries Top Destination Countries Total Average Cost (US$) Bangladesh India 15.04
Saudi Arabia No Internet Payment Systems
UAE 9.12
PRC Hong Kong, China No Data
US 20
Republic of Korea 5.82 (Citibank), 6.18 (Korea Post Office)
India UAE No Internet Payment Systems
US 6.5
Saudi Arabia No Internet Payment Systems
Indonesia Malaysia 9.48
Saudi Arabia No Internet Payment Systems
UAE 9.62
Malaysia Singapore 14.92 Nepal India 15.04
Malaysia 5.58
Pakistan Saudi Arabia No Internet Payment Systems
India 15.56
UAE 12.22
Philippines US 10.08 (Money Gram)
20.1 (Philippines National Bank)
Saudi Arabia No Internet Payment Systems
Canada 10.02 (WorldRemit)
20.04 (Royal Bank of Canada)
Sri Lanka India 15.04
Saudi Arabia No Internet Payment Systems
Thailand Germany 6.01
Japan 22.02 (Seven Bank), 42.7 (Bangkok Bank)
UK 11.58 (WorldRemit), 31.17 (Bangkok Bank)
Source: Author’s compilation using World Bank (2015).
Related Documents


