DISCLOSURE APPENDIX CONTAINS ANALYST CERTIFICATIONS AND THE STATUS OF NON-US ANALYSTS. FOR OTHER IMPORTANT DISCLOSURES, visit www.credit-suisse.com/ researchdisclosures or call +1 (877) 291-2683. U.S. Disclosure: Credit Suisse does and seeks to do business with companies covered in its research reports. As a result, investors should be aware that the Firm may have a conflict of interest that could affect the objectivity of this report. Investors should consider this report as only a single factor in making their investment decision CREDIT SUISSE SECURITIES RESEARCH & ANALYTICS BEYOND INFORMATION TM Client-Driven Solutions, Insights, and Access Thursday, 06 February 2014 Asian Daily (Asia Edition) EPS, TP and Rating changes EPS TP (% change) T+1 T+2 Chg Up/Dn Rating Aristocrat Leisure 8 10 10 2 U (U) Downer EDI 0 (2) (2) 8 N (N) AIA Group (20) (10) 0 23 O (O) Bharat Heavy Electricals (6) (1) 0 (38) U (U) Cummins India (4) (5) (1) (15) N (N) Ranbaxy (61) (14) 6 7 N (N) Public Bank (9) (9) 13 4 N (N) Lotte Chemical (15) (1) 0 38 O (O) Kinsus Interconnect Tech 0 2 0 17 O (N) Connecting clients to corporates Singapore Seoul Semiconductor Co Ltd (046890.KQ) Date 17-18 February, Singapore Analyst Keon Han US China Mobile Games and Entertainment Group Limited (CMGE.O) Date 10-12 February, US Analyst Dick Wei Europe HDFC (HDBK.BO) Date 10-13 February, Europe Analyst Ashish Gupta Others PT Indoritel Makmur International Tbk (DNET.JK) Date 13 February, Kuala Lumpur Analyst Ella Nusantoro Contact [email protected] or Your usual sales representative. Top of the pack ... Global Equity Strategy Andrew Garthwaite (3) Equities: Hold your nerve! AIA Group (1299.HK) – Maintain O Arjan van Veen (4) New report: 4Q13 regional trends—Underlying momentum robust, valuation appeal returning Singapore Market Strategy Sanjay Mookim (5) Singapore underperforms the ASEAN markets YTD; the trend should reverse soon Malaysia Market Strategy Tan Ting Min (6) Malaysia: A hiding place? Indonesia Market Strategy Jahanzeb Naseer (7) Assessing the impact of a China slowdown CS pic of the day COSL forward P/E chart—recent market correction provides a good entry point for investors CS's China strategist Vincent Chan’s view is that the HK/China market will likely remain choppy in the near term as global growth concerns linger. That said, HK/China market valuation has been low for some time already, and many risk factors have been discounted, so the recent correction makes the valuation even cheaper. COSL is one of the names we highlight to buy and own after the correction. We believe COSL is one of the few names in HK/China that provide quality earnings growth and high earnings visibility. Source: Datastream, company data, Credit Suisse estimates. 5 7 9 11 13 15 17 2009 2010 2011 2012 2013 2014 +1 S.D. = 13.1x Avg. = 11.2x -1 S.D. = 9.3x (x) CS TP 12x ... and the whole pack Global Global Equity Strategy Andrew Garthwaite (3) Equities: Hold your nerve! Regional Asia Pacific Equity Strategy Sakthi Siva (8) New report: Foreign investor capitulation—any signs? Australia Aristocrat Leisure (ALL.AX) – Maintain U Larry Gandler (9) Looking for the break-out Downer EDI (DOW.AX) – Maintain N Emma Alcock (10) Delivering on cost-outs but markets still tough China China Market Strategy Vincent Chan (11) Bombed out stocks - dominated by Chinese banks and property

Welcome message from author
This document is posted to help you gain knowledge. Please leave a comment to let me know what you think about it! Share it to your friends and learn new things together.
Transcript
DISCLOSURE APPENDIX CONTAINS ANALYST CERTIFICATIONS AND THE STATUS OF NON-US ANALYSTS. FOR OTHER IMPORTANT DISCLOSURES, visit www.credit-suisse.com/ researchdisclosures or call +1 (877) 291-2683. U.S. Disclosure: Credit Suisse does and seeks to do business with companies covered in its research reports. As a result, investors should be aware that the Firm may have a conflict of interest that could affect the objectivity of this report. Investors should consider this report as only a single factor in making their investment decision
CREDIT SUISSE SECURITIES RESEARCH & ANALYTICS BEYOND INFORMATION TM
Client-Driven Solutions, Insights, and Access
Thursday, 06 February 2014
Asian Daily (Asia Edition)
EPS, TP and Rating changes EPS TP
(% change) T+1 T+2 Chg Up/Dn Rating
Aristocrat Leisure 8 10 10 2 U (U) Downer EDI 0 (2) (2) 8 N (N) AIA Group (20) (10) 0 23 O (O) Bharat Heavy Electricals
(6) (1) 0 (38) U (U)
Cummins India (4) (5) (1) (15) N (N) Ranbaxy (61) (14) 6 7 N (N) Public Bank (9) (9) 13 4 N (N) Lotte Chemical (15) (1) 0 38 O (O) Kinsus Interconnect Tech 0 2 0 17 O (N)
Connecting clients to corporates
Singapore
Seoul Semiconductor Co Ltd (046890.KQ) Date 17-18 February, Singapore
Analyst Keon Han
US
China Mobile Games and Entertainment Group Limited (CMGE.O)
Date 10-12 February, US
Analyst Dick Wei
Europe
HDFC (HDBK.BO) Date 10-13 February, Europe
Analyst Ashish Gupta
Others
PT Indoritel Makmur International Tbk (DNET.JK) Date 13 February, Kuala Lumpur
Analyst Ella Nusantoro
Contact [email protected] or Your usual sales representative.
Top of the pack ...
Global Equity Strategy Andrew Garthwaite (3) Equities: Hold your nerve!
AIA Group (1299.HK) – Maintain O Arjan van Veen (4) New report: 4Q13 regional trends—Underlying momentum robust, valuation appeal returning
Singapore Market Strategy Sanjay Mookim (5) Singapore underperforms the ASEAN markets YTD; the trend should reverse soon
Malaysia Market Strategy Tan Ting Min (6) Malaysia: A hiding place?
Indonesia Market Strategy Jahanzeb Naseer (7) Assessing the impact of a China slowdown
CS pic of the day
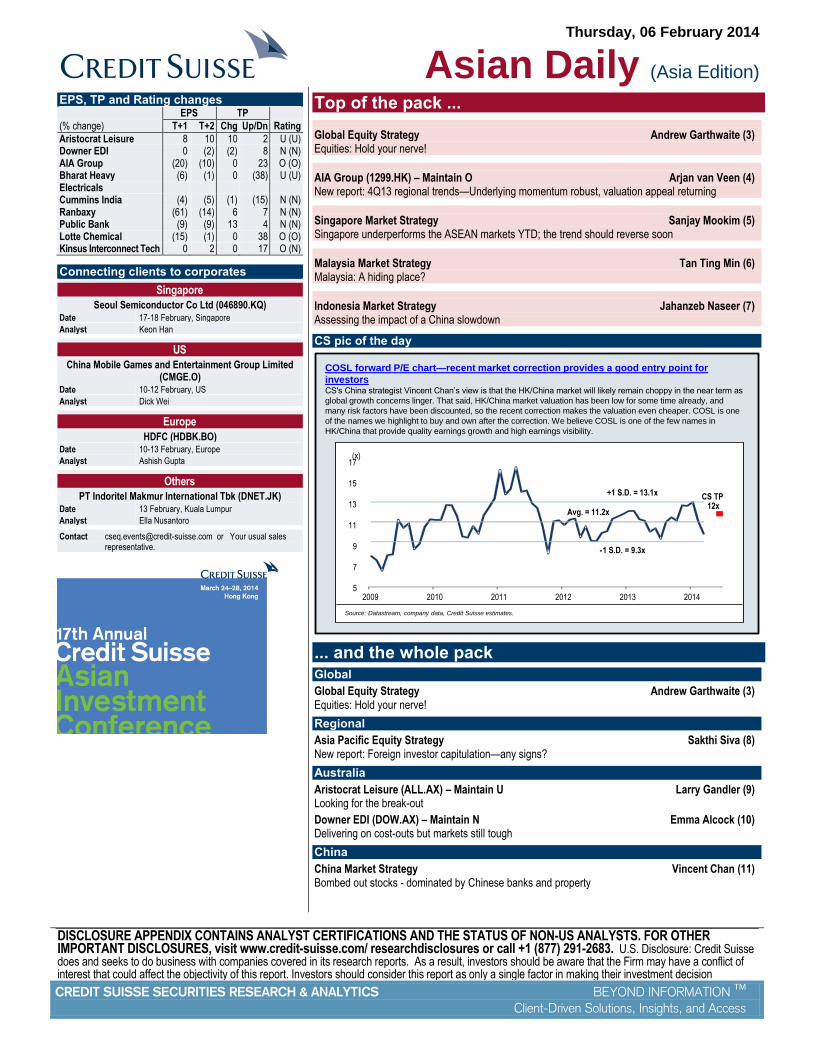
COSL forward P/E chart—recent market correction provides a good entry point for
investorsCS's China strategist Vincent Chan’s view is that the HK/China market will likely remain choppy in the near term as
global growth concerns linger. That said, HK/China market valuation has been low for some time already, and
many risk factors have been discounted, so the recent correction makes the valuation even cheaper. COSL is one
of the names we highlight to buy and own after the correction. We believe COSL is one of the few names in
HK/China that provide quality earnings growth and high earnings visibility.
Source: Datastream, company data, Credit Suisse estimates.
5
7
9
11
13
15
17
2009 2010 2011 2012 2013 2014
+1 S.D. = 13.1x
Avg. = 11.2x
-1 S.D. = 9.3x
(x)
CS TP12x
... and the whole pack Global
Global Equity Strategy Andrew Garthwaite (3) Equities: Hold your nerve!
Regional
Asia Pacific Equity Strategy Sakthi Siva (8) New report: Foreign investor capitulation—any signs?
Australia
Aristocrat Leisure (ALL.AX) – Maintain U Larry Gandler (9) Looking for the break-out
Downer EDI (DOW.AX) – Maintain N Emma Alcock (10) Delivering on cost-outs but markets still tough
China
China Market Strategy Vincent Chan (11) Bombed out stocks - dominated by Chinese banks and property

Thursday, 06 February 2014
Asian Daily
- 2 of 35 -
Asian indices – performance (% change) Latest 1D 1W 3M YTD
ASX300 5028 (0.5) (3.0) (6.6) (5.2) CSEALL 6176 (0.7) (0.7) 4.6 4.4 Hang Seng 21269 (0.6) (3.2) (7.7) (8.7) H-SHARE 9471 (0.4) (3.3) (10.3) (12.4) JCI 4384 0.7 1.0 (1.5) 2.6 KLSE 1786 0.4 0.3 (1.0) (4.3) KOSPI 1891 0.2 (1.0) (6.1) (6.0) KSE100 26751 (0.7) 0.4 17.4 5.9 NIFTY 6022 0.4 (1.6) (3.7) (4.5) NIKKEI 14180.4 1.2 (7.8) (1.1) (13.0) TOPIX 1162.6 2.1 (7.4) (2.5) (10.7) PCOMP 5908 0.4 (1.9) (8.8) 0.3 RED CHIP 4046 (0.1) (4.1) (10.3) (11.2) SET 1280 0.3 0.7 (10.8) (1.4) STI 2960 (0.2) (3.3) (7.6) (6.5) TWSE 8264 (2.3) (3.9) (0.2) (4.0) VNINDEX 557 (0.7) 0.5 12.1 10.3
Thomson Financial Datastream
Asian currencies (vs US$) (% change) Latest 1D 1W 3M YTD
A$ 1.1 (0.3) 1.5 (6.4) (0.2) Bt 32.8 0.0 0.7 (4.6) (0.1) D 21060.0 - - 0.2 0.2 JPY 101.4 0.2 1.3 (2.7) 3.8 NT$ 30.3 (0.1) 0.0 (2.9) (1.7) P 45.3 (0.2) (0.2) (4.7) (2.1) PRs 105.5 (0.2) (0.1) 1.8 (0.1) Rp 12194.0 (0.3) (0.2) (6.9) (0.2) Rs 62.6 (0.1) (0.3) (1.5) (1.2) S$ 1.3 (0.0) 0.6 (2.0) (0.4) SLRs 130.7 - 0.1 0.4 0.1 W 1077.9 (0.1) (0.7) (1.6) (2.6)
Thomson Financial Datastream
Global indices (% change) Latest 1D 1W 3M YTD
DJIA 15452.8 0.0 (1.8) (1.1) (6.8) S&P 500 1750.7 (0.3) (1.3) (0.7) (5.3) NASDAQ 4016.9 (0.4) (0.9) 2.0 (3.8) SOX 518.6 0.0 (1.2) 3.1 (3.1) EU-STOX 2801.8 0.1 (1.6) (2.6) (4.0) FTSE 6457.9 0.1 (1.3) (4.3) (4.3) DAX 9116.3 (0.1) (2.4) 1.2 (4.6) CAC-40 4117.8 0.0 (0.9) (3.2) (4.1) 10 YR LB 2.7 1.2 (0.5) (0.3) (12.1) 2 YR LB 0.3 (1.3) (12.4) 2.1 (19.0) US$:E 1.4 0.0 (0.1) 0.1 (1.8) US$:Y 101.4 (0.0) 1.3 (2.7) 3.8 BRENT 106.2 0.2 (2.1) 1.0 (4.2) GOLD 1257.4 0.2 (0.8) (4.1) 4.3 VIX 19.6 2.6 13.0 47.7 42.9
Thomson Financial Datastream
MSCI Asian indices – valuation & perf. EPS grth. P/E (x) Performance
MSCI Index 13E 14E 13E 14E 1D 1M YTD
Asia F X Japan 18 12 11.0 9.8 0.0 -5.1 (7.3)
Asia Pac F X J. 14 12 11.5 10.3 0.0 -5.2 (6.8)
Australia (2) 10 15.5 14.1 (0.3) -5.9 (5.6)
China 11 10 8.9 8.1 (0.2) -8.0 (10.2)
Hong Kong 11 11 14.9 13.5 (1.2) -7.0 (8.3)
India 15 16 14.1 12.3 0.6 -3.5 (5.0)
Indonesia 17 16 13.5 11.6 1.1 3.5 3.3
Japan 34 50 23.2 15.4 (4.6) (12.7) (12.7)
Korea 33 13 8.4 7.3 0.9 -5.5 (9.1)
Malaysia 1 10 16.0 14.6 0.7 -4.0 (5.9)
Pakistan 14 18 9.6 8.1 0.00 -1.6 1.2
Philippines 8 13 17.8 16.5 0.5 -2.4 (2.1)
Singapore 2 9 13.2 12.1 (0.1) -6.2 (7.8)
Sri Lanka 16 11 14.8 13.3 (2.1) 1.6 2.2
Taiwan 33 12 15.0 13.4 (3.2) -4.7 (6.4)
Thailand 19 13 10.8 9.6 0.4 5.5 (1.3) * IBES estimates
China Market Strategy Vincent Chan (12) HOLT analysis on our top picks in these times of uncertainty
Shenzhou International (2313.HK) – Maintain O Eva Wang (13) Time to accumulate after recent market correction
Hong Kong
Macau Gaming Sector Kenny Lau, CFA (14) Continuation of VIP business slowdown drags January GGR growth to 7%
AIA Group (1299.HK) – Maintain O Arjan van Veen (4) New report: 4Q13 regional trends—Underlying momentum robust, valuation appeal returning
India
India Market Strategy Neelkanth Mishra (15) Can the cost-push rise in milk prices offset the decline in vegetable inflation?
India Banks Sector Ashish Gupta (16) New report: Private banks 3Q14 review—Earnings slowed; impaired assets rise
Bharat Heavy Electricals (BHEL.BO) – Maintain U Amish Shah, CFA (17) 3Q14 ahead of estimates; structural concerns remain
Cummins India (CUMM.BO) – Maintain N Amish Shah, CFA (18) 3Q14 margins surprise positively, outlook on demand and margins muted
Ranbaxy (RANB.BO) – Maintain N Anubhav Aggarwal (19) Margin recovery stays muted; impact of Toansa import alert lower than expected
Indonesia
Indonesia Economics Robert Prior-Wandesforde (20) 4Q13 GDP: Stronger, not weaker
Indonesia Market Strategy Jahanzeb Naseer (7) Assessing the impact of a China slowdown
Indonesia Retail Sector – Maintain UW Priscilla Tjitra (21) New report: Retail regulations uncovered
Japan
Mitsubishi Gas Chemical (4182.T) – Maintain O Masami Sawato (22) Write-off at Shanghai polycarbonate plant could reduce ¥4 bn loss
Malaysia
Malaysia Market Strategy Tan Ting Min (6) Malaysia: A hiding place?
Public Bank (PUBMe.KL) – Maintain N Danny Goh (23) New report: 4Q13 results slightly below expectations; CET 1 close to target level
Pakistan
Pakistan Petroleum Limited (PPL.KA) – Maintain O Fahd Niaz (24) One drilling set-back should be compensated by a diverse exploration agenda
Philippines
Philippines Economics Michael Wan (25) CPI (January): Supply-driven rise; rates on hold
Singapore
Singapore Market Strategy Sanjay Mookim (5) Singapore underperforms the ASEAN markets YTD; the trend should reverse soon
M1 Limited (MONE.SI) – Maintain O Chate Benchavitvilai (26) Network outages: Limited near-term impact; medium-term damage recoverable if quality improves
South Korea
Lotte Chemical (011170.KS) – Maintain O Kenneth Whee (27) 4Q in line at EBIT, set to deliver better than its peers in 2014
Taiwan
Taiwan Financial Sector Chung Hsu, CFA (28) 2013 system loan growth of 3.0% YoY
Kinsus Interconnect Tech (3189.TW) – Upgrade to O Pauline Chen (29) 4Q13 miss on higher opex, but we expect 2014 ROE to reach to post-2009 high
O=Outperform N=Neutral U=Underperform R=Restricted OW= Overweight MW=Market Weight UW=Underweight
Research mailing options To make any changes to your existing research mailing details, please e-mail us directly at [email protected]
Sales Contact Hong Kong 852 2101 7211 Singapore 65 6212 3052 London 44 20 7888 4367 New York 1 212 325 5955 Boston 1 617 556 5634

Thursday, 06 February 2014
Asian Daily
- 3 of 35 -
Top of the pack ...
Global Equity Strategy ---------------------------------------------------------------------------------------- Equities: Hold your nerve! Andrew Garthwaite / Research Analyst / 44 20 7883 6477 / [email protected]
● Markets have been hit by three headwinds. We believe each is manageable for now. Consequently, we stick to our end-2014 S&P 500 target of 1,960 and overweight equities:
● GEM growth: US export growth to emerging markets has already slowed to 3%, as GEM consumption growth has halved over the past three years. We estimate that 3.5% off exports to EM would take 0.2% off nominal US GDP. Chinese GDP growth would have to be sub-5% or the RMB weaken by 10% for us to alter our positive stance on equities.
● January's US ISM survey was weak, but PMI new orders in Europe and Japan (the regions most exposed to GEM) hit new cycle highs. Consequently, global PMI new orders (on Markit data) were flat in January and continue to point to 3¾%- 4% global GDP growth, compared to the current run-rate of 3%.
● Concerns about the debt ceiling: but Congress appears more bi-partisan. Click here for full report.
Figure 1: Just 24% of NYSE stocks trade above ten-week moving average
Source: NYSE, Thomson Reuters, Credit Suisse research
Other reasons to stay bullish
Valuations: The equity risk premium is 5.5% on our EPS assumptions, still above our estimate of the warranted ERP of 4.7%, while many factors point to an even lower ERP of 4% (cf to a post 1900 average of 3.2%). Excess liquidity growth, at 5%, is consistent with a re-rating of equities.
Positioning: There have been US$100 bn of outflows from global equity funds since 2008, while combined corporate and private equity fire-power stands at US$3.4 tn. Earnings revisions are picking up modestly (and we revise our 2014E US EPS growth to 8.5% from 7.1%); we continue to believe profit margins don’t peak until 2016. Typically a big macro shock or very stretched valuation is required for the S&P to correct by 10%+, and we see no such trigger. Tactical indicators are broadly neutral.
The scope for further monetary easing: Our economists forecast inflation in Japan of 0.7% for 2014 and 0.8% 2015 (vs BoJ target of 2%) and Euro-area inflation of 0.4% in April. Hence, we expect more QE by the BoJ and the ECB to become more aggressive.
Global growth could still match 2013 on conservative assumptions
Even if we assume some pretty pessimistic GDP growth rates, global GDP growth would still end up at 2.8%—only slightly below the 2013 growth rate (Chinese GDP growth of 6% (down from 7.7% last year and compared to a consensus forecast of 7.4% and a CS forecast of 7.3%), Indian growth at 5.4% (i.e., same as 2013, CS is 6.6%) and Brazil at 2.4% (i.e., same as 2013, CS is 3.0%)—with US growth of only 2%, Euro-area growth of only 0.5% and the UK and Japan growing at 1%).
Figure 2: Even if China grows only at 6% and the US at 2%, global growth should still end up at 2.8% this year
Source: Thomson Reuters, Credit Suisse research
If TIPs yield were to fall because of more QE, then the GEM currencies could finance their current account deficits, again!
If we are wrong and emerging market weakness translates into a slowdown in developed market growth, we think the Fed would react to the renewed growth slowdown with a delay in its tapering program, while the ECB and the BoJ would likely introduce further easing measures. Inflation in Japan is, we believe, likely to stay around 0.7%, well below the BoJ target of 2%; European inflation will, according to our European economists, fall to 0.4%. If there were more QE, then real bond yields would fall, and thus, as below, it would be easier to finance current account deficits.
This is an extract from the Global Equity Strategy report published on 5 February 2014. Please see CS's R&A website for more details.

Thursday, 06 February 2014
Asian Daily
- 4 of 35 -
AIA Group ---------------------------------------------------------------------- Maintain OUTPERFORM New report: 4Q13 regional trends—Underlying momentum robust, valuation appeal returning EPS: ▼ TP: ◄► Arjan van Veen / Research Analyst / 852 2101 7508 / [email protected] Frances Feng / Research Analyst / 852 2101 6693 / [email protected]
● We have reviewed the latest industry data and peer results, which highlight the ongoing strength in key markets (Figure 1), in particular, growth acceleration in HK and Singapore. Weaker areas are Korea, Thailand (political) and Australia (group profitability).
● AIA continues to have some growth 'optionality' through M&A given its strong balance sheet, as highlighted by the recent Citibank regional distribution deal. Management continues to execute well on its key strategies of margin enhancement and agent productivity, with room for progress in the medium term.
● Catalyst: Full year 2013 results on 21 February 2014.
● However, we have downgraded our 2013-15 forecasts by 2-20% following marking to market its earnings due to movements in regional equity markets and currencies over the last few months. Our valuation is unchanged at HK$44.00, with currency movements offset by roll-forward. We maintain our OUTPERFORM investment rating and see current valuations as a good entry point for the stock, noting it rarely trades at these levels. Click here for full report.
4Q13 / 1Q14 mark to market: Currency mayhem
We have downgraded our 2013-15 forecasts by 2-20% following marking to market its earnings due to movements in currencies (-4%) over the last few months as well as weaker equity markets (-7%).
On the positive side, we highlight that the ~80 bp improvement in bond yields in 2013 to date has reversed most of the cumulative reduction in average bond yields since listing.
Growth in core markets strong
Following a review of peer results and industry data, we see near-term growth as robust in the region, with main markets (such as Hong Kong and Singapore) showing strong improvement.
On the less positive side, Korean growth has stalled more recently and is likely to remain so given the current (industry-wide) telemarketing ban. Thailand will likely be impacted by current political uncertainty, whilst Australian group risk profit is likely to be a medium-term issue.
Strong balance sheet provides flexibility
AIA’s solvency position looks very strong, with excess capital (above the minimum 150% solvency) totalling US$4.9 bn including the US$1 bn of debt, with further gearing capacity as at 31 May 2013.
AIA generated a free surplus of US$1.9 bn in 1H13, while the new business strain was US$0.7 bn, highlighting its capital generation capacity. As its ‘new generation’ investment-linked products are rolled out, this should reduce the new business strain further.
As such, coupled with plenty of debt capacity, we believe AIA is in a strong position to take advantage of any further M&A opportunities to drive growth, with the recent ING Malaysia acquisition and regional Citibank deal as key examples of this.
Valuation appeal returning in the recent pull-back
Given recent share price weakness, we see some valuation appeal returning to the stock at these levels. Specifically, AIA is now trading on the following multiples (12-month forward): (a) 11x implied value of new business multiple; (b) 16x price to earnings, relative to 17% growth in operating profit in 1H13; and (c) 2.0x price to book (relative to 12% return on equity—which would be 14-15% through use of its excess capital).
Figure 1: AIA mix (%) and NB APE growth (% p.a.) by market / market NB APE growth (% p.a.) AIA % of group 1H13 AIA ANP growth AIA VNB growth Market growth
1H13 1H13 1H13 2012 2H12 1H13 2012 2H12 1H13 10yr 2012 1Q13 2Q13 3Q13 4Q13
ANP VNB VNB ANP ANP ANP VNB VNB VNB CAGR
% US$mn % % p.a. % p.a. % p.a. % p.a. % p.a. % p.a. % p.a. % p.a. % p.a. % p.a. % p.a. % p.a.
Hong Kong 21% 168 24% 16% 21% 34% 20% 23% 20% 16% 5% 14% 21% 21%
Singapore 10% 110 15% 28% 30% -3% 9% 48% 11% 9% 11% 12% 37% 27%
Thailand 17% 146 21% 14% 19% 9% 12% 24% 11% 13% 23% 36% -23% 11%
Malaysia 10% 54 8% 6% 0% 100% 11% 3% 74% 10% 7% na na na na
China 8% 76 11% 0% 1% 11% 22% 10% 27% 20% -6% na 3% na
Korea 12% 45 6% -12% 10% 75% 4% 9% 36% 16% -4% 63% 18% 1% -8%
Other markets 22% 112 16% 4% -8% 29% 41% 41% 70%
AIA Group 711 9% 10% 29% 27% 27% 26% 9% 37% 21% 21%
- excl Group Risk one-off 14% 10% 29% 17% 34% 26% Source: Company data, Credit Suisse estimates
Please click here for the full 29pp report.
Bbg/RIC 1299 HK / 1299.HK Rating (prev. rating) O (O) Shares outstanding (mn) 12,044 Daily trad vol - 6m avg (mn) 22.7 Daily trad val - 6m avg (US$ mn) 109.1 Free float (%) 100.0 Major shareholders Capital 8.6%,
Blackrock 6%
Price (05 Feb 14, HK$) 35.65 TP (prev. TP HK$) 44.00 (44.00) Est. pot. % chg. to TP 23 52-wk range (HK$) 40.1 - 30.1 Mkt cap (HK$/US$ bn) 429.4/ 55.3
Performance 1M 3M 12M
Absolute (%) (6.4) (7.2) 18.6 Relative (%) (0.2) (0.1) 26.8
Year 11/11A 11/12A 11/13E 11/14E 11/15E
Life GWP (US$ bn) 12.4 13.2 14.7 15.7 17.5 P&C GWP (US$ bn) — — — — — Net profit (US$ bn) 1.6 3.0 2.9 3.1 3.8 EPS (US$) 0.13 0.25 0.24 0.26 0.32 - Change from prev. EPS (%) n.a. n.a. (20) (10) (2) - Consensus EPS (US$) n.a. n.a. 0.25 0.29 0.32 EPS growth (%) (40.8) 88.8 (4.2) 7.3 22.5 P/E (x) 34.6 18.3 19.1 17.8 14.5 NTA per share (US$) 1.75 2.19 2.00 2.28 2.53 EV per share (US$) 2.26 2.61 2.75 3.05 3.40 Dividend yield (%) 0.9 1.0 1.2 1.4 1.5 EV/EBITDA (x) 22.1 20.9 19.0 16.2 13.4 P/B (x) 2.6 2.1 2.2 1.9 1.7 ROE (%) 7.8 12.6 11.1 11.5 12.6 P&C combined ratio (%) — — — — —
Note 1: ORD/ADR=4.00. Note 2: AIA Group Limited is an investment holding company. The company and its subsidiaries are engaged in provision of products and services to individuals and businesses for their insurance, protection, savings, investment and retirement needs.
Thursday, 06 February 2014
Asian Daily
- 5 of 35 -
Singapore Market Strategy ---------------------------------------------------------------------------------- Singapore underperforms the ASEAN markets YTD; the trend should reverse soon Sanjay Mookim / Research Analyst / 65 6212 3017 / [email protected] Kwee Hong Ching / Research Analyst / 65 6212 3142 / [email protected]
● Contrary to expectations of it being a 'defensive' market, the STI has fallen the most among the large ASEAN markets, even on a currency-adjusted basis, and is at a 12-month low. The MSCI Singapore forward P/E (of 12.7x) is now 6.5% below average.
● There are two possible explanations: (1) a strong negative correlation between TIPs' relative performance (to SG+MY) and US 10Y bond yields—reduction in yields YTD may explain SG+MY relative weakness; (2) during previous 'crises', SG tended to lead the decline.
● Both the explanations imply a positive view on SG from hereon. We expect US 10Y bond yields to rise through the year as the Fed reduces purchases (and the economy improves); further downside to yields should be limited. If the EM crisis escalates, other ASEAN markets could face greater risk. If not, SG should bounce back.
● A near-term, mean-reverting rally in SG may help stocks such as CMA, Noble, SMM, OCBC, GENS, IHH, CIT, WIL, KEP, SIA and CAPL that have fallen more than the market YTD. Our large-cap picks for SG are DBS (despite its continued performance), KEP (valuations, order inflow) and CMA/CAPL (an improving RoE outlook).
Figure 1: Strong inverse correlation between TIPs' excess return (in USD) over Singapore+Malaysia and US ten-year bond yields since the GFC
-
0.50
1.00
1.50
2.00
2.50
3.00
3.50
4.00
4.50
5.00 90
110
130
150
170
190
210
Jan-
09
Apr
-09
Jul-0
9
Oct
-09
Jan-
10
Apr
-10
Jul-1
0
Oct
-10
Jan-
11
Apr
-11
Jul-1
1
Oct
-11
Jan-
12
Apr
-12
Jul-1
2
Oct
-12
Jan-
13
Apr
-13
Jul-1
3
Oct
-13
Jan-
14
TIPS cumulative excess return (in USD) over SG+MY US 10yr bond yield (RHS - inverted)
Source: Datastream, Credit Suisse estimates
Not the best start to the year
The STI is down 6.4% YTD, is at a 12-month low, and has underperformed the large ASEAN markets even when adjusted to currency. This seems to be at odds with its traditional positioning as 'defensive'. However, historical trends suggest the following:
(1) Strong correlation with bond yields
There is a strong negative correlation (of about -82%) between the excess returns generated by the TIPs (growth) over Singapore+Malaysia (defensives) and the US ten-year bond yields, i.e., TIPs have outperformed when US bond yields have fallen.
(2) Singapore generally leads a decline
During the previous EM crisis (May 2013), the STI had initially underperformed the region, but did better as other markets fell subsequently. This pattern was observed early in the GFC as well (late 2007) but the subsequent outperformance was eroded by the late 2008 crash.
One big macro trade?
Since the GFC (and the expansion of central banks' balance sheets), the excess returns made in Thailand, Indonesia and the Philippines over Singapore and Malaysian equities (in USD terms; calculated as a simple average of market returns) have a strong inverse correlation
(of -82%) with US ten-year bond yields (Figure 1). How does one rationalise this? A higher cost of capital (bond yield) reduces the premium for growth (which the TIPs likely represent). The recent fall in US bond yields may then explain the STI's underperformance YTD.
The STI has led the region in previous declines
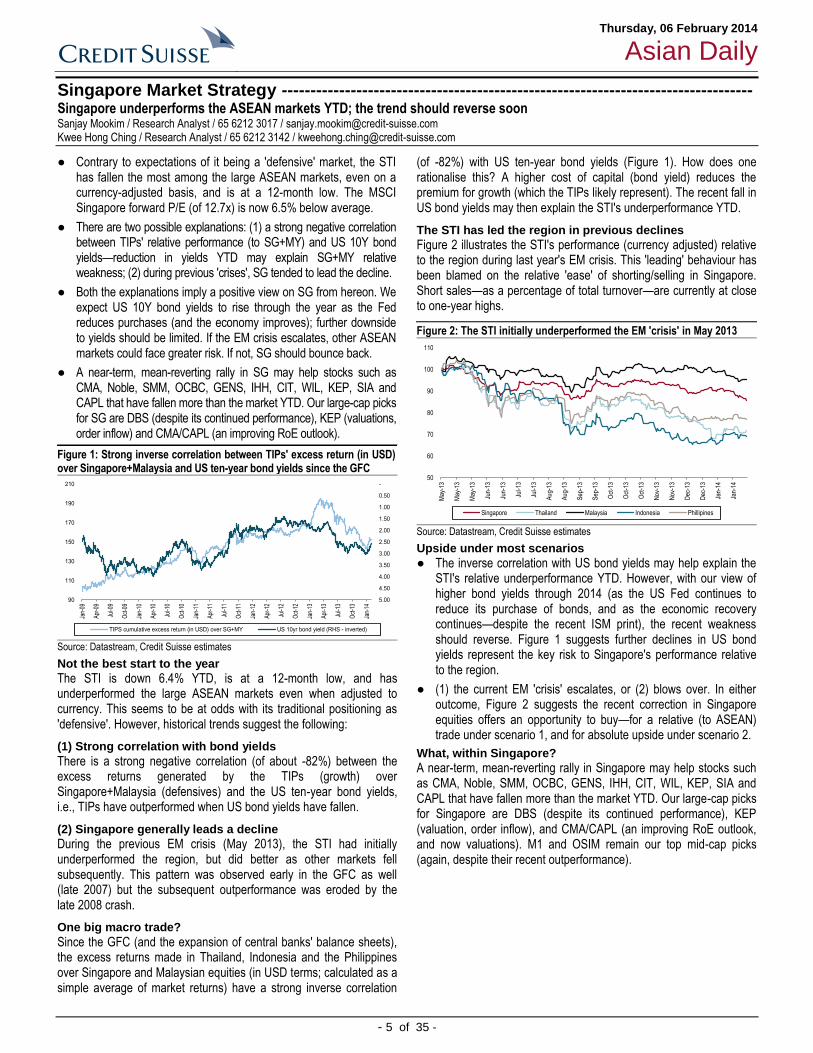
Figure 2 illustrates the STI's performance (currency adjusted) relative to the region during last year's EM crisis. This 'leading' behaviour has been blamed on the relative 'ease' of shorting/selling in Singapore. Short sales—as a percentage of total turnover—are currently at close to one-year highs.
Figure 2: The STI initially underperformed the EM 'crisis' in May 2013
50
60
70
80
90
100
110
May
-13
May
-13
May
-13
Jun-
13
Jun-
13
Jul-1
3
Jul-1
3
Aug
-13
Aug
-13
Sep
-13
Sep
-13
Oct
-13
Oct
-13
Oct
-13
Nov
-13
Nov
-13
Dec
-13
Dec
-13
Jan-
14
Jan-
14
Singapore Thailand Malaysia Indonesia Phillipines
Source: Datastream, Credit Suisse estimates
Upside under most scenarios
● The inverse correlation with US bond yields may help explain the STI's relative underperformance YTD. However, with our view of higher bond yields through 2014 (as the US Fed continues to reduce its purchase of bonds, and as the economic recovery continues—despite the recent ISM print), the recent weakness should reverse. Figure 1 suggests further declines in US bond yields represent the key risk to Singapore's performance relative to the region.
● (1) the current EM 'crisis' escalates, or (2) blows over. In either outcome, Figure 2 suggests the recent correction in Singapore equities offers an opportunity to buy—for a relative (to ASEAN) trade under scenario 1, and for absolute upside under scenario 2.
What, within Singapore?
A near-term, mean-reverting rally in Singapore may help stocks such as CMA, Noble, SMM, OCBC, GENS, IHH, CIT, WIL, KEP, SIA and CAPL that have fallen more than the market YTD. Our large-cap picks for Singapore are DBS (despite its continued performance), KEP (valuation, order inflow), and CMA/CAPL (an improving RoE outlook, and now valuations). M1 and OSIM remain our top mid-cap picks (again, despite their recent outperformance).
Thursday, 06 February 2014
Asian Daily
- 6 of 35 -
Malaysia Market Strategy ------------------------------------------------------------------------------------- Malaysia: A hiding place? Tan Ting Min / Research Analyst / 60 3 2723 2080 / [email protected] Nicholas Teh / Research Analyst / 603 2723 2085 / [email protected]
● During times of turmoil, Malaysia is always seen as a good place to hide, with its relatively low beta of 0.5, as the large domestic funds provide support to the stock market.
● The telco, REIT and consumer sectors have traditionally been seen as low beta defensive sectors with high dividend yields. We prefer the telco sector with OUTPERFORM ratings on Maxis, Digi and Axiata.
● Stocks with beta less than 1 and OUTPERFORM ratings include Astro, Maxis, Sime, Tenaga, IJM Corp and RHB Cap.
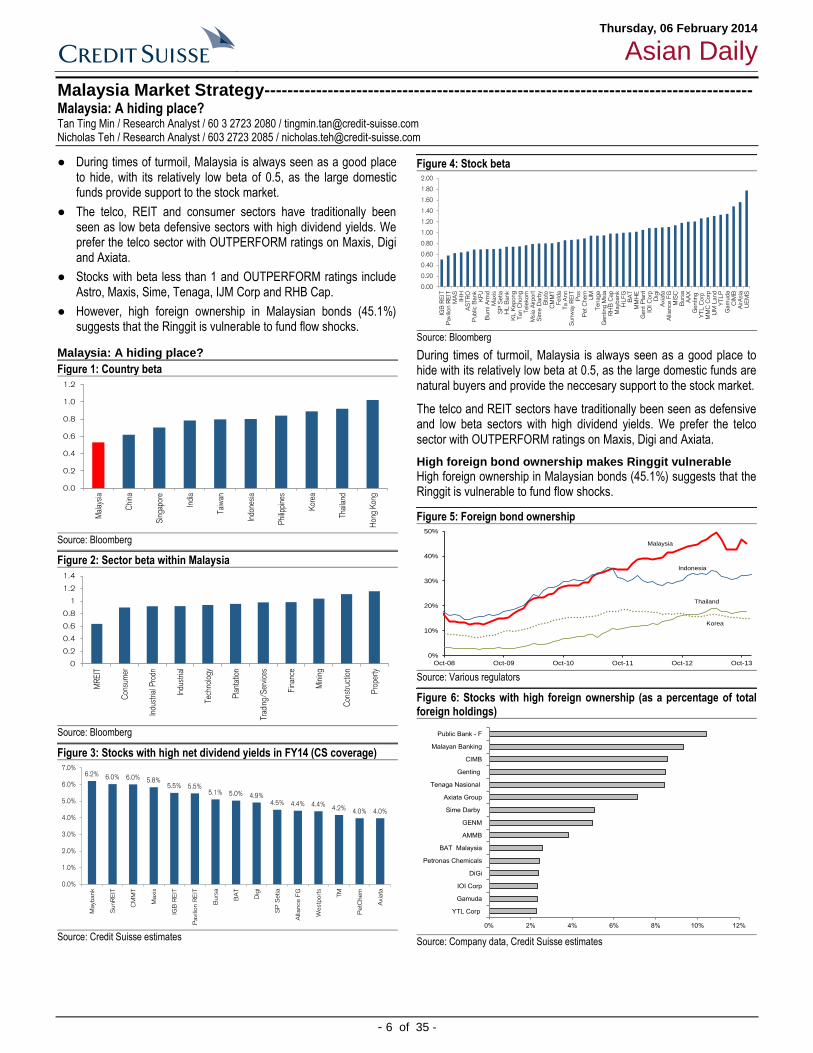
● However, high foreign ownership in Malaysian bonds (45.1%) suggests that the Ringgit is vulnerable to fund flow shocks.
Malaysia: A hiding place?
Figure 1: Country beta
0.0
0.2
0.4
0.6
0.8
1.0
1.2
Mal
aysi
a
Chi
na
Sin
gapo
re
Indi
a
Taiw
an
Indo
nesi
a
Phi
lippi
nes
Kor
ea
Thai
land
Hon
g K
ong
Source: Bloomberg
Figure 2: Sector beta within Malaysia
0
0.2
0.4
0.6
0.8
1
1.2
1.4
MR
EIT
Con
sum
er
Indu
stria
l Pro
dn
Indu
stria
l
Tech
nolo
gy
Pla
ntat
ion
Trad
ing/
Ser
vice
s
Fin
ance
Min
ing
Con
stru
ctio
n
Pro
pert
y
Source: Bloomberg
Figure 3: Stocks with high net dividend yields in FY14 (CS coverage)
6.2% 6.0% 6.0% 5.8%5.5% 5.5%
5.1% 5.0% 4.9%4.5% 4.4% 4.4%
4.2% 4.0% 4.0%
0.0%
1.0%
2.0%
3.0%
4.0%
5.0%
6.0%
7.0%
Mayb
ank
SunR
EIT
CM
MT
Maxi
s
IGB
RE
IT
Pavi
lion R
EIT
Burs
a
BA
T
Dig
i
SP
Setia
Alliance F
G
Westp
ort
s
TM
PetC
hem
Axi
ata
Source: Credit Suisse estimates
Figure 4: Stock beta
0.00
0.20
0.40
0.60
0.80
1.00
1.20
1.40
1.60
1.80
2.00
IGB
RE
ITP
avi
lion R
EIT
MA
SIH
HA
STR
OP
ublic
Bank
KP
JB
um
i A
rmd
Maxi
sS
P S
etia
HL
Bank
KL K
epong
Tan C
hong
Tele
kom
Msi
a A
irport
Sim
e D
arb
yB
toto
CM
MT
Feld
aTa A
nn
Sunw
ay
RE
ITP
os
Pet
Chem
IJM
Tenaga
Genting M
sia
RH
B C
ap
Mayb
ank
HL
FG
BA
TM
MH
EG
ent
Pla
nt
IOI C
orp
Dig
iA
xiata
Alliance F
GM
ISC
Burs
aA
AX
Genting
YTL C
orp
MM
C C
orp
IJM
Land
YTLP
Gam
uda
CIM
BA
irA
sia
UE
MS
Source: Bloomberg
During times of turmoil, Malaysia is always seen as a good place to hide with its relatively low beta at 0.5, as the large domestic funds are natural buyers and provide the neccesary support to the stock market.
The telco and REIT sectors have traditionally been seen as defensive and low beta sectors with high dividend yields. We prefer the telco sector with OUTPERFORM ratings on Maxis, Digi and Axiata.
High foreign bond ownership makes Ringgit vulnerable
High foreign ownership in Malaysian bonds (45.1%) suggests that the Ringgit is vulnerable to fund flow shocks.
Figure 5: Foreign bond ownership
0%
10%
20%
30%
40%
50%
Oct-08 Oct-09 Oct-10 Oct-11 Oct-12 Oct-13
Korea
Indonesia
Thailand
Malaysia
Source: Various regulators
Figure 6: Stocks with high foreign ownership (as a percentage of total foreign holdings)
0% 2% 4% 6% 8% 10% 12%
YTL Corp
Gamuda
IOI Corp
DiGi
Petronas Chemicals
BAT Malaysia
AMMB
GENM
Sime Darby
Axiata Group
Tenaga Nasional
Genting
CIMB
Malayan Banking
Public Bank - F
Source: Company data, Credit Suisse estimates
Thursday, 06 February 2014
Asian Daily
- 7 of 35 -
Indonesia Market Strategy ----------------------------------------------------------------------------------- Assessing the impact of a China slowdown Jahanzeb Naseer / Research Analyst / 852 2101 6554 / [email protected]
● The two external risks that are being talked about on Indonesia are the potential EM contagion and the linkages to slower growth in China. The former was addressed in CS's note (Re-testing
Asian vulnerability). The second we discuss here.
● At 11% of exports, China is Indonesia’s third-biggest partner after ASEAN (22%) and Japan (16%). The four areas of key linkages to China are coal (37% of exports), rubber/industrial inputs (22%), CPO (15%) and manufactured/finished goods (7%).
● Of these the first two are at risk from an industrial slowdown while the latter two geared to consumption are more resilient.
● The decline in coal exports so far is explained by falling coal prices while volumes have continued to rise. Stable-to-slightly higher coal prices (CS forecasts) indicate lower risk going forward. Even assuming the current trajectory of a decline in coal and rubber would result in a loss of US$1.5-2 bn. CPO and finished goods exports have been rising and with higher CPO prices this should more than offset the decline in industrial sector-related exports.
Figure 1: Coal and related materials are the major portion of exports
Coal & related materials
37%
Rubber, leather & related materials
22%
Palm oil & related
materials15%
Manufactured goods7%
Machinery and transport equipment
6%
Chemicals and related products, n.e.s.
6%
Food and live animals4%
Miscellaneous manufactured
articles3%
Commodities and transactions, n.e.s.
0% Beverages and tobacco
0%
Source: Based on 2012 data, UNCTADSTAT, Credit Suisse estimates.
Linkages from softer China growth
Credit Suisse cut its forecast for China's economic growth from 7.7% to 7.3% YoY for 2014. China accounts for about 11% of Indonesia's exports making it the third-biggest trading partner after ASEAN (22%) and Japan (16%), with coal accounting for 37% of exports to China, rubber and other industrial materials about 22% and palm oil 15%. It is prudent to question the impact on the coal and CPO sectors in particular and on Indonesia in general.
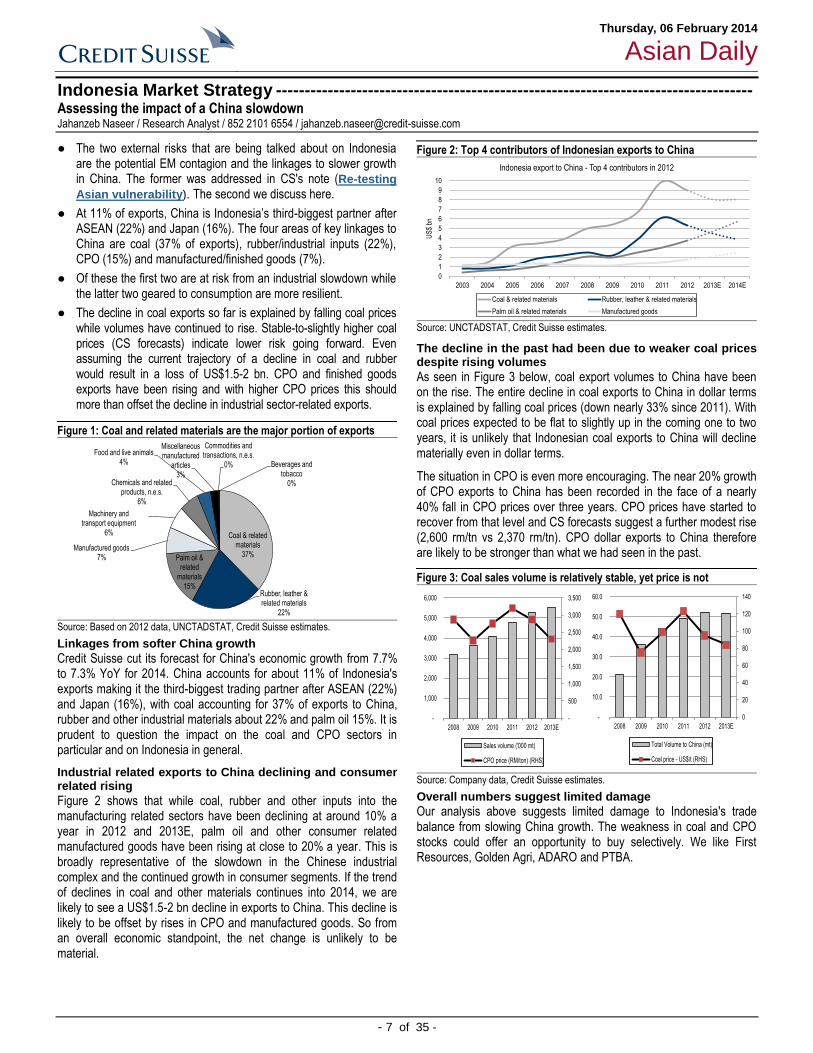
Industrial related exports to China declining and consumer related rising
Figure 2 shows that while coal, rubber and other inputs into the manufacturing related sectors have been declining at around 10% a year in 2012 and 2013E, palm oil and other consumer related manufactured goods have been rising at close to 20% a year. This is broadly representative of the slowdown in the Chinese industrial complex and the continued growth in consumer segments. If the trend of declines in coal and other materials continues into 2014, we are likely to see a US$1.5-2 bn decline in exports to China. This decline is likely to be offset by rises in CPO and manufactured goods. So from an overall economic standpoint, the net change is unlikely to be material.
Figure 2: Top 4 contributors of Indonesian exports to China
0
1
2
3
4
5
6
7
8
9
10
2003 2004 2005 2006 2007 2008 2009 2010 2011 2012 2013E 2014E
US
$ bn
Indonesia export to China - Top 4 contributors in 2012
Coal & related materials Rubber, leather & related materials
Palm oil & related materials Manufactured goods
Source: UNCTADSTAT, Credit Suisse estimates.
The decline in the past had been due to weaker coal prices despite rising volumes
As seen in Figure 3 below, coal export volumes to China have been on the rise. The entire decline in coal exports to China in dollar terms is explained by falling coal prices (down nearly 33% since 2011). With coal prices expected to be flat to slightly up in the coming one to two years, it is unlikely that Indonesian coal exports to China will decline materially even in dollar terms.
The situation in CPO is even more encouraging. The near 20% growth of CPO exports to China has been recorded in the face of a nearly 40% fall in CPO prices over three years. CPO prices have started to recover from that level and CS forecasts suggest a further modest rise (2,600 rm/tn vs 2,370 rm/tn). CPO dollar exports to China therefore are likely to be stronger than what we had seen in the past.
Figure 3: Coal sales volume is relatively stable, yet price is not
-
500
1,000
1,500
2,000
2,500
3,000
3,500
-
1,000
2,000
3,000
4,000
5,000
6,000
2008 2009 2010 2011 2012 2013E
Sales volume ('000 mt)
CPO price (RM/ton) (RHS)
0
20
40
60
80
100
120
140
-
10.0
20.0
30.0
40.0
50.0
60.0
2008 2009 2010 2011 2012 2013E
Total Volume to China (mt)
Coal price - US$/t (RHS)
Source: Company data, Credit Suisse estimates.
Overall numbers suggest limited damage
Our analysis above suggests limited damage to Indonesia's trade balance from slowing China growth. The weakness in coal and CPO stocks could offer an opportunity to buy selectively. We like First Resources, Golden Agri, ADARO and PTBA.
Thursday, 06 February 2014
Asian Daily
- 8 of 35 -
Regional
Asia Pacific Equity Strategy --------------------------------------------------------------------------------- New report: Foreign investor capitulation—any signs? Sakthi Siva / Research Analyst / 65 6212 3027 / [email protected] Kin Nang Chik / Research Analyst / 852 2101 7482 / [email protected]
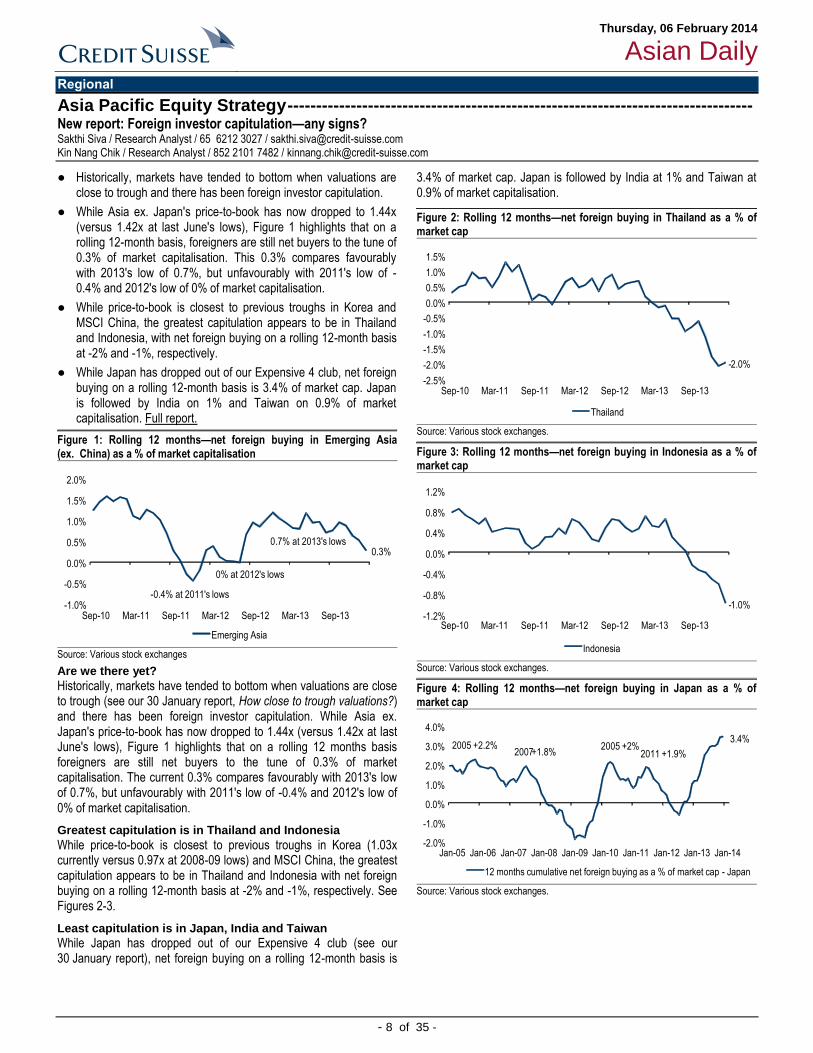
● Historically, markets have tended to bottom when valuations are close to trough and there has been foreign investor capitulation.
● While Asia ex. Japan's price-to-book has now dropped to 1.44x (versus 1.42x at last June's lows), Figure 1 highlights that on a rolling 12-month basis, foreigners are still net buyers to the tune of 0.3% of market capitalisation. This 0.3% compares favourably with 2013's low of 0.7%, but unfavourably with 2011's low of -0.4% and 2012's low of 0% of market capitalisation.
● While price-to-book is closest to previous troughs in Korea and MSCI China, the greatest capitulation appears to be in Thailand and Indonesia, with net foreign buying on a rolling 12-month basis at -2% and -1%, respectively.
● While Japan has dropped out of our Expensive 4 club, net foreign buying on a rolling 12-month basis is 3.4% of market cap. Japan is followed by India on 1% and Taiwan on 0.9% of market capitalisation. Full report.
Figure 1: Rolling 12 months—net foreign buying in Emerging Asia (ex. China) as a % of market capitalisation
0.3%
-1.0%
-0.5%
0.0%
0.5%
1.0%
1.5%
2.0%
Sep-10 Mar-11 Sep-11 Mar-12 Sep-12 Mar-13 Sep-13
Emerging Asia
0% at 2012's lows
-0.4% at 2011's lows
0.7% at 2013's lows
Source: Various stock exchanges
Are we there yet?
Historically, markets have tended to bottom when valuations are close to trough (see our 30 January report, How close to trough valuations?) and there has been foreign investor capitulation. While Asia ex. Japan's price-to-book has now dropped to 1.44x (versus 1.42x at last June's lows), Figure 1 highlights that on a rolling 12 months basis foreigners are still net buyers to the tune of 0.3% of market capitalisation. The current 0.3% compares favourably with 2013's low of 0.7%, but unfavourably with 2011's low of -0.4% and 2012's low of 0% of market capitalisation.
Greatest capitulation is in Thailand and Indonesia
While price-to-book is closest to previous troughs in Korea (1.03x currently versus 0.97x at 2008-09 lows) and MSCI China, the greatest capitulation appears to be in Thailand and Indonesia with net foreign buying on a rolling 12-month basis at -2% and -1%, respectively. See Figures 2-3.
Least capitulation is in Japan, India and Taiwan
While Japan has dropped out of our Expensive 4 club (see our 30 January report), net foreign buying on a rolling 12-month basis is
3.4% of market cap. Japan is followed by India at 1% and Taiwan at 0.9% of market capitalisation.
Figure 2: Rolling 12 months—net foreign buying in Thailand as a % of market cap
-2.0%
-2.5%
-2.0%
-1.5%
-1.0%
-0.5%
0.0%
0.5%
1.0%
1.5%
Sep-10 Mar-11 Sep-11 Mar-12 Sep-12 Mar-13 Sep-13
Thailand
Source: Various stock exchanges.
Figure 3: Rolling 12 months—net foreign buying in Indonesia as a % of market cap
-1.0%-1.2%
-0.8%
-0.4%
0.0%
0.4%
0.8%
1.2%
Sep-10 Mar-11 Sep-11 Mar-12 Sep-12 Mar-13 Sep-13
Indonesia
Source: Various stock exchanges.
Figure 4: Rolling 12 months—net foreign buying in Japan as a % of market cap
3.4%
-2.0%
-1.0%
0.0%
1.0%
2.0%
3.0%
4.0%
Jan-05 Jan-06 Jan-07 Jan-08 Jan-09 Jan-10 Jan-11 Jan-12 Jan-13 Jan-14
12 months cumulative net foreign buying as a % of market cap - Japan
2005 +2.2%2007+1.8%
2005 +2%2011 +1.9%
Source: Various stock exchanges.

Thursday, 06 February 2014
Asian Daily
- 9 of 35 -
Australia
Aristocrat Leisure -------------------------------------------------------- Maintain UNDERPERFORM Looking for the break-out EPS: ▲ TP: ▲ Larry Gandler / Research Analyst / 61 3 9280 1855 / [email protected] Benjamin Levin / Research Analyst / 61 3 9280 1766 / [email protected]
● We cautiously increase our target price to A$4.50 (from A$4.10) on more favourable fx assumptions and increased installations of North American 'revenue share' slot machines. We upgrade EPS by 8%. We appear in line with consensus.
● ALL gained share in the 'revenue share' segment of the North America slot machine industry in the December Qtr. We have reviewed the Dec Qtr 2013 Eiler-Fantini Quarterly Slot Survey. ALL has not gained share in the 'for sale' segment.
● Our valuation could rise to A$5.20 if Aristocrat demonstrates it is on a break-out market share path towards a 20% ship share with its 20% step-up investment in R&D. Although Eiler-Fantini survey indicates that Aristocrat's allocation of slot manager future purchases is not on a break-out trend yet, management is at least taking the engine into fifth gear.
● ALL is not quite good value but the gap to its peers has narrowed. Our DCF-based target price incorporates 50c for online gaming initiatives. Full report
Click here for detailed financials
The feeble slot player cannot resuscitate replacement demand
We argue that the wave that drove the North America casino expansion of 1988-2007 has plateaued and will not rise again for the foreseeable future.
We remain of the view that slot machine replacement demand is unlikely to 'cycle' upwards. Indeed, we anticipate that the US industry will come to speak more openly about what we call a 'dead market' here in Australia. That is a segment of the slot market where the potential uplift in revenue is insufficient to justify an investment in a machine replacement. Thus, that machine may never get replaced. Therefore, we do not consider replacement demand in the context of the entire US installed base. Replacement demand may hover between 50,000 and 65,000 units for many years to come.
With capacity now exceeding demand, new venues and expansions are also likely to be few in number. We anticipate 10,000 to 20,000 devices
installed by way of new venues or expansions. We therefore expect demand to hover around 70,000 units for the foreseeable future.
Figure 1: Median income fell in the late 2000s for baby boomers born 1946-65
0
5,000
10,000
15,000
20,000
25,000
30,000
35,000
40,000
45,000
1990 2000 2010
In 2
012
US
D
Source: US Census Bureau (Measured in 2012 USD)
Aristocrat is taking share in participation
The most recent Eilers-Fantini Slot Survey indicates to us that Aristocrat has gained share in the participation segment. The survey measures about 28% of the North America installed base.
Our A$4.50 valuation is predicated on Aristocrat adding 1,050 'revenue-sharing' installations to 8,600 in FY14 reaching 10,000 by 2015. Aristocrat seems to be aiming for at least 10,000 units spurred by a 20% lift in R&D based on comments from the company's US management. Since 2005, Aristocrat has not expanded its installed base by more than 900 units in a given year.
The valuation leverage in gaming operations is powerful. For every 1000 unit increase in average machine installed base our EPS forecast rises by 5% and our valuation by 42cps. The valuation increase assumes that Aristocrat sustains its share of floor to perpetuity.
Still early days in the 'for sale' segment
With its 20% increase in R&D, Aristocrat is aiming to strongly break out of its traditional 12-14% North America market share range. We model ALL's market share rising to 15% by 2015 and then hovering around there. In essence, our valuation is not incorporating full success.
If we were to value ALL as a 20% ship-share business in North America, we would add 70c to our valuation making it A$5.20.
But, Aristocrat has not yet taken share in the 'for sale' segment. According to the Eiler-Fantini slot survey in Dec Qtr, ALL's ship share was 9% – down from its traditional 12%. However, in the Dec Qtr-13, Aristocrat cycled the release of Wonder 4 from the Dec Qtr-2012 and that game was the major contributor lifting Aristocrat's market share from 12.5% to about 13.5% during FY13. ALL sold 1,700 Wonder 4 gaming machines in its first 12 months since release (FY13.)
This is an extract from the Aristocrat Leisure report published on 4 February 2014. Please see CS's R&A website for more details.
Bbg/RIC ALL AU / ALL.AX Rating (prev. rating) U (U) Shares outstanding (mn) 551.42 Daily trad vol - 6m avg (mn) 1.5 Daily trad val - 6m avg (US$ mn) 7.5 Free float (%) 76.7 Major shareholders
Price (04 Feb 14 , A$) 4.40 TP (prev. TP A$) 4.50 (4.10) Est. pot. % chg. to TP 2 52-wk range (A$) 5.05 - 3.58 Mkt cap (A$/US$ mn) 2,426.2/ 2,154.7
Performance 1M 3M 12M
Absolute (%) (5.4) (9.1) 19.6 Relative (%) (0.6) (2.9) 15.7
Year 09/12A 09/13A 09/14E 09/15E 09/16E
Revenue (A$ mn) 843 814 904 971 1,028 EBITDA (A$ mn) 177.9 188.1 231.0 258.2 277.2 Net profit (A$ mn) 91.7 107.2 130.5 144.5 153.7 EPS (A$) 0.17 0.19 0.24 0.26 0.28 - Change from prev. EPS (%) n.a. n.a. 7.6 9.9 7.2 - Consensus EPS (A$) n.a. n.a. 0.23 0.27 0.29 EPS growth (%) 35.9 15.8 21.5 10.8 8.3 P/E (x) 26.3 22.7 18.7 16.9 15.6 Dividend yield (%) 1.4 3.3 3.8 4.5 4.8 EV/EBITDA (x) 14.7 14.0 11.1 9.9 9.4 P/B (x) 8.7 6.4 5.7 5.2 5.7 ROE (%) 34.4 32.6 32.5 32.4 34.8 Net debt(cash)/equity (%) 69.4 55.5 32.7 26.4 44.0
Note 1: Aristocrat Leisure Limited is an Australia-based company engaged in providing gaming solutions. Aristocrat offers a diverse range of products and services, including electronic gaming machines, interactive video terminal systems and casino management.
Thursday, 06 February 2014
Asian Daily
- 10 of 35 -
Downer EDI -----------------------------------------------------------------------------Maintain NEUTRAL Delivering on cost-outs but markets still tough EPS: ▼ TP: ▼ Emma Alcock / Research Analyst / 61 2 8205 4403 / [email protected] Bradley Clibborn / Research Analyst / 61 2 8205 4465 / [email protected]
● DOW reported 1H14 underlying NPAT of A$99.1 mn, 3% above CS (A$95.9 mn) and reiterated FY14 guidance for flat NPAT YoY (~A$215 mn). We make minor earnings changes, reduce our target price to A$5.20 (from A$5.30) and maintain our NEUTRAL rating. Full report.
● DOW delivered 8.8% mining EBIT margins, ahead of the targeted 7-8% range, which suggests solid progress is being made in realising the targeted cost savings and productivity gains.
● However, the Australia and rail results were key negatives from the result with adjusted (i.e., ex restructuring costs) margins well below our forecasts. This appears to reflect increased competition amid reduced tendering activity.
● DOW's earnings should prove more defensive vs. the broader sector in the current environment based on its solid progress in realising cost savings/productivity gains and the recent improvement in DOW's contract win rate, as evidenced by 3% sequential order book growth in 1H14.
Click here for detailed financials
Downer appears to be managing the business well against challenging market conditions. DOW delivered a solid cash result in an environment where major resources companies are lengthening payment cycles. Additionally, DOW remains on track to report FY14 guidance for flat NPAT, suggesting solid progress is being made in realising productivity gains and cost savings to offset reduced corporate and government spend. We were impressed by DOW's mining margins (8.8%, above targeted 7-8% range) as this suggests management has made solid progress in realising the targeted A$250 mn of cost savings over FY14/15. We believe DOW also has the balance sheet flexibility to withstand any further deterioration in market conditions owing to management's conservative stance around the balance sheet which we view as prudent. The receipt of ~A$150 mn in cash proceeds upon completion of the Waratah PPP project
(anticipated FY15) should provide further balance sheet headroom to review potential capital management options.
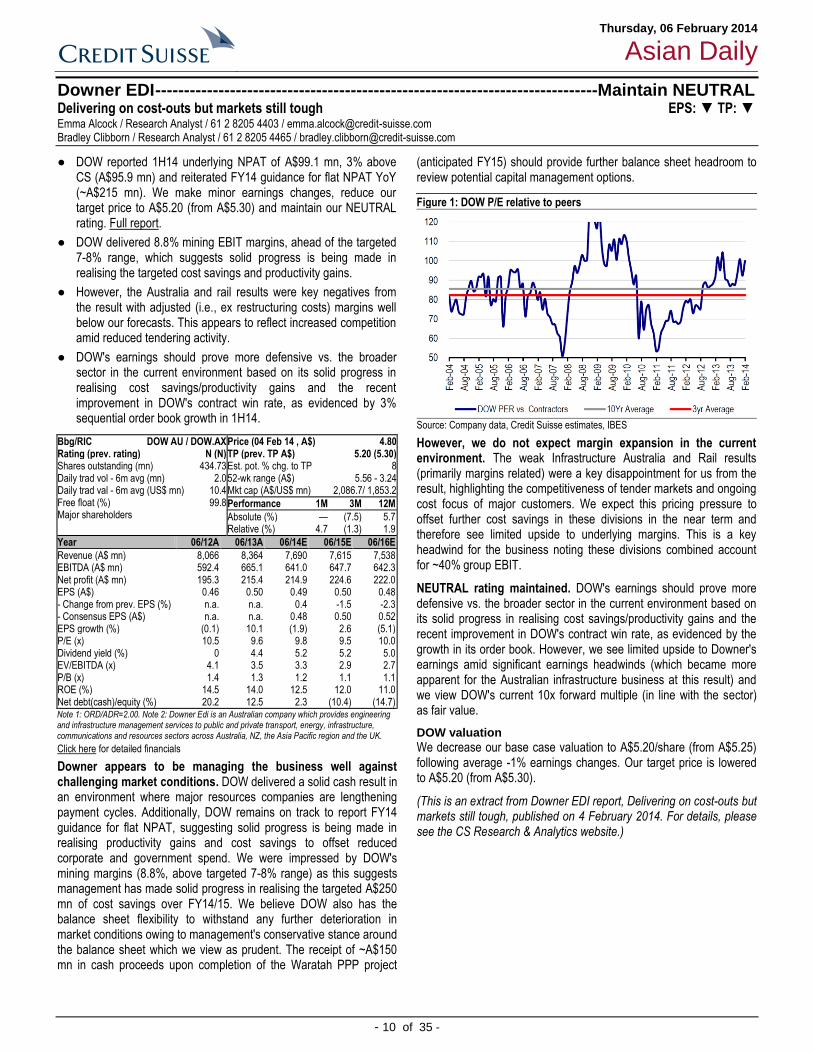
Figure 1: DOW P/E relative to peers
Source: Company data, Credit Suisse estimates, IBES
However, we do not expect margin expansion in the current environment. The weak Infrastructure Australia and Rail results (primarily margins related) were a key disappointment for us from the result, highlighting the competitiveness of tender markets and ongoing cost focus of major customers. We expect this pricing pressure to offset further cost savings in these divisions in the near term and therefore see limited upside to underlying margins. This is a key headwind for the business noting these divisions combined account for ~40% group EBIT.
NEUTRAL rating maintained. DOW's earnings should prove more defensive vs. the broader sector in the current environment based on its solid progress in realising cost savings/productivity gains and the recent improvement in DOW's contract win rate, as evidenced by the growth in its order book. However, we see limited upside to Downer's earnings amid significant earnings headwinds (which became more apparent for the Australian infrastructure business at this result) and we view DOW's current 10x forward multiple (in line with the sector) as fair value.
DOW valuation
We decrease our base case valuation to A$5.20/share (from A$5.25) following average -1% earnings changes. Our target price is lowered to A$5.20 (from A$5.30).
(This is an extract from Downer EDI report, Delivering on cost-outs but markets still tough, published on 4 February 2014. For details, please see the CS Research & Analytics website.)
Bbg/RIC DOW AU / DOW.AX Rating (prev. rating) N (N) Shares outstanding (mn) 434.73 Daily trad vol - 6m avg (mn) 2.0 Daily trad val - 6m avg (US$ mn) 10.4 Free float (%) 99.8 Major shareholders
Price (04 Feb 14 , A$) 4.80 TP (prev. TP A$) 5.20 (5.30) Est. pot. % chg. to TP 8 52-wk range (A$) 5.56 - 3.24 Mkt cap (A$/US$ mn) 2,086.7/ 1,853.2
Performance 1M 3M 12M
Absolute (%) — (7.5) 5.7 Relative (%) 4.7 (1.3) 1.9
Year 06/12A 06/13A 06/14E 06/15E 06/16E
Revenue (A$ mn) 8,066 8,364 7,690 7,615 7,538 EBITDA (A$ mn) 592.4 665.1 641.0 647.7 642.3 Net profit (A$ mn) 195.3 215.4 214.9 224.6 222.0 EPS (A$) 0.46 0.50 0.49 0.50 0.48 - Change from prev. EPS (%) n.a. n.a. 0.4 -1.5 -2.3 - Consensus EPS (A$) n.a. n.a. 0.48 0.50 0.52 EPS growth (%) (0.1) 10.1 (1.9) 2.6 (5.1) P/E (x) 10.5 9.6 9.8 9.5 10.0 Dividend yield (%) 0 4.4 5.2 5.2 5.0 EV/EBITDA (x) 4.1 3.5 3.3 2.9 2.7 P/B (x) 1.4 1.3 1.2 1.1 1.1 ROE (%) 14.5 14.0 12.5 12.0 11.0 Net debt(cash)/equity (%) 20.2 12.5 2.3 (10.4) (14.7)
Note 1: ORD/ADR=2.00. Note 2: Downer Edi is an Australian company which provides engineering and infrastructure management services to public and private transport, energy, infrastructure, communications and resources sectors across Australia, NZ, the Asia Pacific region and the UK.
Thursday, 06 February 2014
Asian Daily
- 11 of 35 -
China
China Market Strategy ----------------------------------------------------------------------------------------- Bombed out stocks - dominated by Chinese banks and property Vincent Chan / Research Analyst / 852 2101 6568 / [email protected] Peggy Chan, CFA / Research Analyst / 852 2101 6305 / [email protected]
● Following the recent market correction, we did a screening of bombed out China/HK stocks.
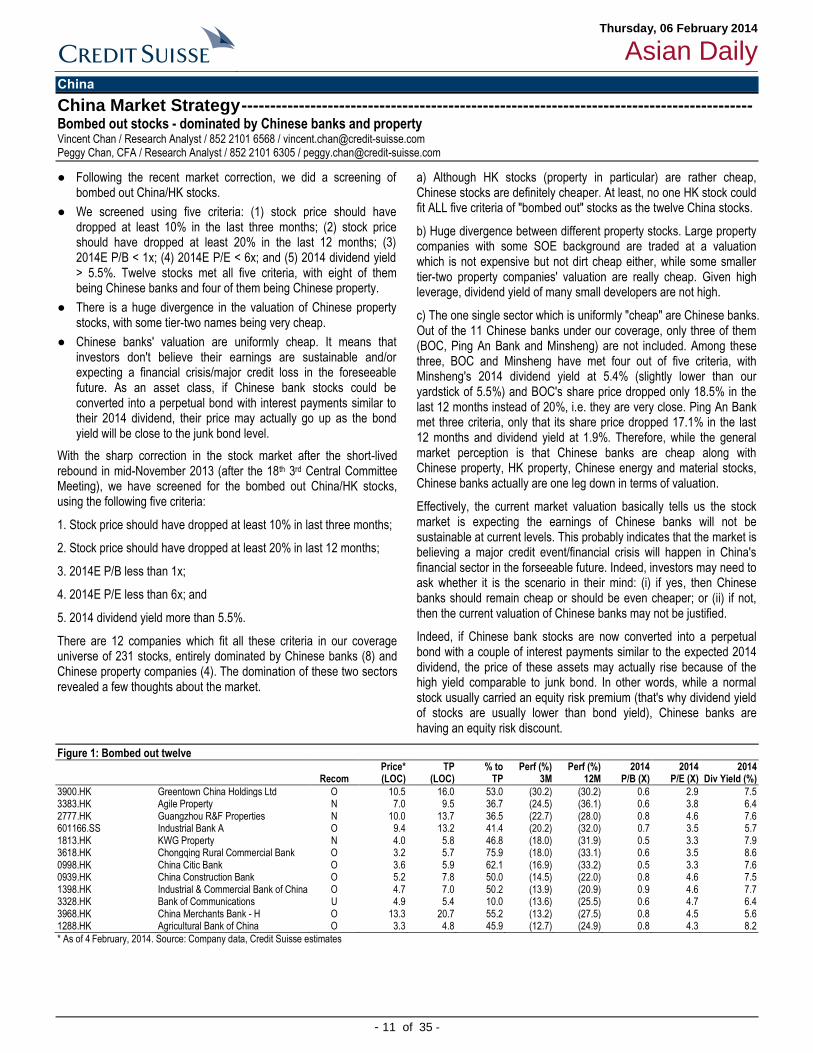
● We screened using five criteria: (1) stock price should have dropped at least 10% in the last three months; (2) stock price should have dropped at least 20% in the last 12 months; (3) 2014E P/B < 1x; (4) 2014E P/E < 6x; and (5) 2014 dividend yield > 5.5%. Twelve stocks met all five criteria, with eight of them being Chinese banks and four of them being Chinese property.
● There is a huge divergence in the valuation of Chinese property stocks, with some tier-two names being very cheap.
● Chinese banks' valuation are uniformly cheap. It means that investors don't believe their earnings are sustainable and/or expecting a financial crisis/major credit loss in the foreseeable future. As an asset class, if Chinese bank stocks could be converted into a perpetual bond with interest payments similar to their 2014 dividend, their price may actually go up as the bond yield will be close to the junk bond level.
With the sharp correction in the stock market after the short-lived rebound in mid-November 2013 (after the 18th 3rd Central Committee Meeting), we have screened for the bombed out China/HK stocks, using the following five criteria:
1. Stock price should have dropped at least 10% in last three months;
2. Stock price should have dropped at least 20% in last 12 months;
3. 2014E P/B less than 1x;
4. 2014E P/E less than 6x; and
5. 2014 dividend yield more than 5.5%.
There are 12 companies which fit all these criteria in our coverage universe of 231 stocks, entirely dominated by Chinese banks (8) and Chinese property companies (4). The domination of these two sectors revealed a few thoughts about the market.
a) Although HK stocks (property in particular) are rather cheap, Chinese stocks are definitely cheaper. At least, no one HK stock could fit ALL five criteria of "bombed out" stocks as the twelve China stocks.
b) Huge divergence between different property stocks. Large property companies with some SOE background are traded at a valuation which is not expensive but not dirt cheap either, while some smaller tier-two property companies' valuation are really cheap. Given high leverage, dividend yield of many small developers are not high.
c) The one single sector which is uniformly "cheap" are Chinese banks. Out of the 11 Chinese banks under our coverage, only three of them (BOC, Ping An Bank and Minsheng) are not included. Among these three, BOC and Minsheng have met four out of five criteria, with Minsheng's 2014 dividend yield at 5.4% (slightly lower than our yardstick of 5.5%) and BOC's share price dropped only 18.5% in the last 12 months instead of 20%, i.e. they are very close. Ping An Bank met three criteria, only that its share price dropped 17.1% in the last 12 months and dividend yield at 1.9%. Therefore, while the general market perception is that Chinese banks are cheap along with Chinese property, HK property, Chinese energy and material stocks, Chinese banks actually are one leg down in terms of valuation.
Effectively, the current market valuation basically tells us the stock market is expecting the earnings of Chinese banks will not be sustainable at current levels. This probably indicates that the market is believing a major credit event/financial crisis will happen in China's financial sector in the forseeable future. Indeed, investors may need to ask whether it is the scenario in their mind: (i) if yes, then Chinese banks should remain cheap or should be even cheaper; or (ii) if not, then the current valuation of Chinese banks may not be justified.
Indeed, if Chinese bank stocks are now converted into a perpetual bond with a couple of interest payments similar to the expected 2014 dividend, the price of these assets may actually rise because of the high yield comparable to junk bond. In other words, while a normal stock usually carried an equity risk premium (that's why dividend yield of stocks are usually lower than bond yield), Chinese banks are having an equity risk discount.
Figure 1: Bombed out twelve Price* TP % to Perf (%) Perf (%) 2014 2014 2014 Recom (LOC) (LOC) TP 3M 12M P/B (X) P/E (X) Div Yield (%)
3900.HK Greentown China Holdings Ltd O 10.5 16.0 53.0 (30.2) (30.2) 0.6 2.9 7.5 3383.HK Agile Property N 7.0 9.5 36.7 (24.5) (36.1) 0.6 3.8 6.4 2777.HK Guangzhou R&F Properties N 10.0 13.7 36.5 (22.7) (28.0) 0.8 4.6 7.6 601166.SS Industrial Bank A O 9.4 13.2 41.4 (20.2) (32.0) 0.7 3.5 5.7 1813.HK KWG Property N 4.0 5.8 46.8 (18.0) (31.9) 0.5 3.3 7.9 3618.HK Chongqing Rural Commercial Bank O 3.2 5.7 75.9 (18.0) (33.1) 0.6 3.5 8.6 0998.HK China Citic Bank O 3.6 5.9 62.1 (16.9) (33.2) 0.5 3.3 7.6 0939.HK China Construction Bank O 5.2 7.8 50.0 (14.5) (22.0) 0.8 4.6 7.5 1398.HK Industrial & Commercial Bank of China O 4.7 7.0 50.2 (13.9) (20.9) 0.9 4.6 7.7 3328.HK Bank of Communications U 4.9 5.4 10.0 (13.6) (25.5) 0.6 4.7 6.4 3968.HK China Merchants Bank - H O 13.3 20.7 55.2 (13.2) (27.5) 0.8 4.5 5.6 1288.HK Agricultural Bank of China O 3.3 4.8 45.9 (12.7) (24.9) 0.8 4.3 8.2
* As of 4 February, 2014. Source: Company data, Credit Suisse estimates

Thursday, 06 February 2014
Asian Daily
- 12 of 35 -
China Market Strategy ----------------------------------------------------------------------------------------- HOLT analysis on our top picks in these times of uncertainty Vincent Chan / Research Analyst / 852 2101 6568 / [email protected]
● In our recent report What stocks to buy after the recent correction, we picked 15 stocks that we like for their long-term fundamentals. In this daily, we attempt to look at these stocks using the HOLT valuation model.
● As a group, these companies exhibited strong value creation with a median CFROI of 11.6% over the past five years, compared to Asia ex-Japan’s 7% over the same period. Although CFROI fell to 9.4% last year, consensus estimates suggest an improvement to 10.6% this year.
● Current market-implied expectations are undemanding with investors pricing for CFROI to decline to 8.1% over the next five years, suggesting that the macro risk factors might have been priced in.
● These companies now have a median HOLT upside of +12% which compares favourably to their historical upside of -3% in the HOLT model.
Figure 1: MSCI China PB
0.5
1.5
2.5
3.5
4.5
5.5
Mar-01 Mar-03 Mar-05 Mar-07 Mar-09 Mar-11 Mar-13
MSCI China - P/B (x)Avg+1SD-1SD
Source: MSCI.
Sharp corrections will create market opportunities
Recent concerns over the US growth/monetary policy, emerging market currency (particularly in the LatAm area), Chinese economy/financial system risks and lack of additional reform measures have triggered a market correction. We believe such sharp corrections will create market opportunities. Our analysts have chosen 15 stocks for their long-term fundamentals.
In this note, we attempt to look at these stocks using the HOLT valuation model. As shown in Figure 2, these companies in aggregate exhibited strong value creation with a median CFROI of 11.6% over the past five years, compared to Asia ex-Japan’s 7% over the same period. Although CFROI fell to 9.4% last year, consensus estimates suggest an improvement to 10.6% this year.
Market-implied expectations undemanding
Current market-implied expectations are undemanding with investors pricing for CFROI to decline to 8.1% over the next five years, suggesting that macro risk factors might have been priced in.
These companies now have a median HOLT upside of +12% which compares favourably to their historical upside of -3% in the HOLT model.
Figure 2: Credit Suisse China top picks under uncertainty
Operation Momentum Valuation
Company Ticker SectorMarket Cap
(USD bn)
CFROI
5yr Median
CFROI
LFY (2012)
Forecast
CFROI
Market
Implied
CFROI (FY5)
CFROI
Momentum
13 Weeks
Relative
Price
Return 4
Weeks
HOLT
Upside
HOLT
Upside
5yr Median
Agricultural Bank of China Limited 1288.HK Financials 137.6 17.5 17.5 13.1 5.9 0.0 (4.2) 54.0 41.9
Anhui Conch Cement Company Limited 0914.HK Materials 19.6 9.1 8.8 10.8 6.8 0.6 12.1 33.0 0.7
BOC Hong Kong (Holdings) Ltd 2388.HK Financials 31.5 13.6 13.6 14.6 16.4 0.1 0.1 (16.0) 0.5
China Longyuan Power Group Limited 0916.HK Utilities 9.8 3.9 5.4 6.0 5.4 0.1 (1.8) 13.0 (30.1)
China Mengniu Dairy Company Limited 2319.HK Consumer Staples 8.1 8.9 7.3 9.5 12.3 (0.2) 2.9 (34.0) (38.6)
China Mobile Limited 0941.HK Telecommunication Services 186.4 11.6 9.4 7.6 (1.3) (0.6) (2.4) 117.0 96.4
China Oilfield Services Ltd 2883.HK Energy 11.6 4.9 4.9 6.8 7.2 0.2 (7.5) (4.0) (37.4)
China Resources Land Limited 1109.HK Financials 13.3 5.1 6.7 7.6 4.4 (0.1) (1.0) 52.0 (11.9)
Chow Tai Fook Jewellery Group Ltd 1929.HK Consumer Discretionary 14.9 18.6 11.6 9.8 8.3 0.1 4.5 (9.0) (2.9)
Henderson Land Development Company Limited0012.HK Financials 14.0 1.7 1.7 0.9 (6.1) (0.0) (1.7) 98.0 36.4
Sands China Limited 1928.HK Consumer Discretionary 61.3 10.0 14.0 28.5 24.7 2.5 (2.2) (20.0) (43.9)
Shenzhou International Group Holdings Ltd 2313.HK Consumer Discretionary 4.3 16.6 15.5 12.9 8.1 (0.5) (6.0) 24.0 100.4
Sihuan Pharmaceutical Holdings Group Ltd 0460.HK Health Care 5.5 18.3 18.3 21.0 18.1 0.7 13.5 (30.0) (23.9)
Tencent Holdings Limited 0700.HK Information Technology 121.9 30.8 30.8 24.6 17.2 0.3 13.4 12.0 40.1
Tsui Wah Holdings Limited 1314.HK Consumer Discretionary 0.8 12.8 6.8 10.6 16.0 (0.7) (8.9) (58.0) (61.3)
Median 11.6 9.4 10.6 8.1 0.1 (1.7) 12.0 (2.9)
Source: Credit Suisse HOLT.
Thursday, 06 February 2014
Asian Daily
- 13 of 35 -
Shenzhou International ---------------------------------------------------- Maintain OUTPERFORM Time to accumulate after recent market correction EPS: ◄► TP: ◄► Eva Wang / Research Analyst / 852 2101 7365 / [email protected] Kenny Lau, CFA / Research Analyst / 852 2101 7914 / [email protected]
● Following the CS China Strategy report, What stocks to buy after recent correction, we'd like to highlight Shenzhou (2313.HK) as one of our picks.
● Despite market concerns on Chinese economic growth and US monetary policy, we believe the impact on Shenzhou should be quite limited given the company's good operational track record, exposure to export markets, strong balance sheet (net cash position) and high visibility of revenue and growth potential.
● We believe the catalysts for the stock include: 1) the release of new garment capacity in 2H14 from Anhui Anqing and Cambodia factories; 2) the new fabric capacity in phase I of Vietnam expansion which will commence operation by the end of 2014.
● We believe a good entry price will be around HK$25.0 (close to current share price), at only 10x 2015E P/E or 12x 2014E P/E. We believe the recent sharp price correction is not justified given the company's solid fundamentals. Our target price of HK$35.00 is based on 14x CY2015E P/E, implying 0.86x PEG with 16% EPS CAGR for 13-15E.
Click here for detailed financials
Shenzhou as one of our picks after recent correction
Following CS China Strategy report, What stocks to buy after recent correction, we'd like to highlight Shenzhou (2313.HK) as one of our picks. Despite market concerns on Chinese economic growth and US monetary policy, we believe the impact on Shenzhou should be quite limited given the company's good operational track record, exposure to export markets, strong balance sheet (net cash position) and high visibility of revenue and growth potential.
We believe the recent sharp share price correction is not justified given the company's solid fundamentals. We recommend investors to buy on dips after the recent correction.
An export player mainly, not relying on domestic market
We believe Shenzhou is one of the companies that should be affected less by China's domestic economic growth, compared to many others.
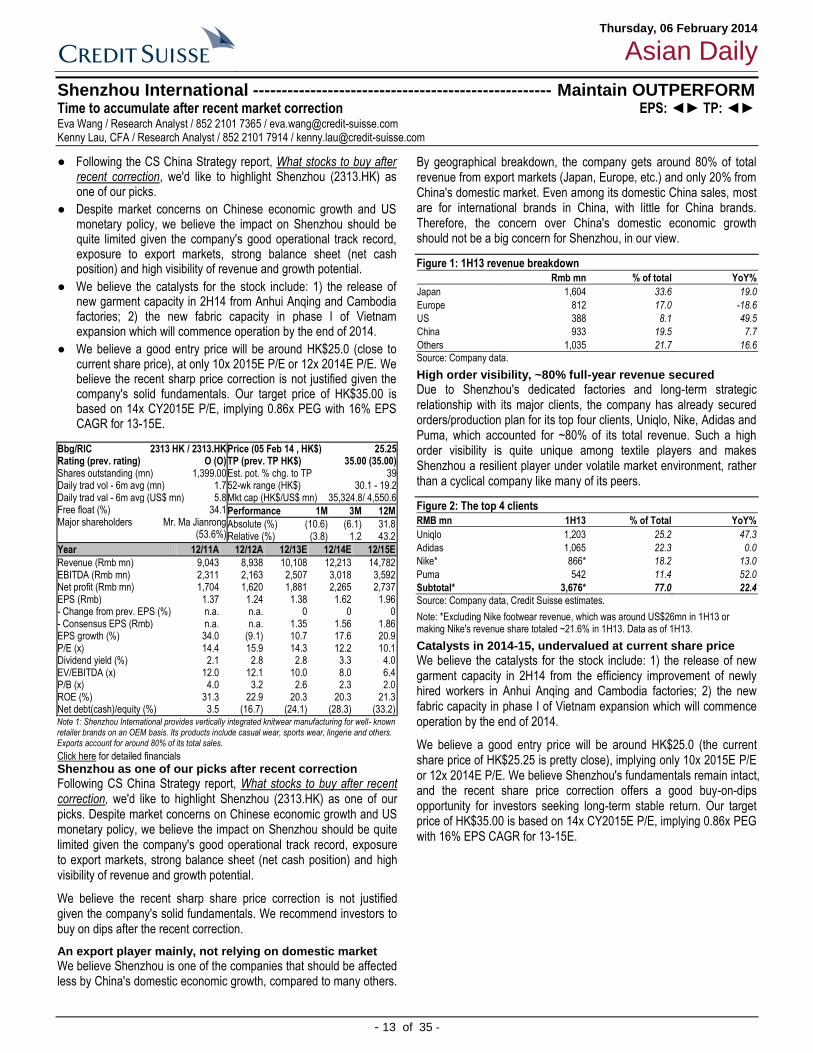
By geographical breakdown, the company gets around 80% of total revenue from export markets (Japan, Europe, etc.) and only 20% from China's domestic market. Even among its domestic China sales, most are for international brands in China, with little for China brands. Therefore, the concern over China's domestic economic growth should not be a big concern for Shenzhou, in our view.
Figure 1: 1H13 revenue breakdown
Rmb mn % of total YoY%
Japan 1,604 33.6 19.0
Europe 812 17.0 -18.6
US 388 8.1 49.5
China 933 19.5 7.7
Others 1,035 21.7 16.6
Source: Company data.
High order visibility, ~80% full-year revenue secured
Due to Shenzhou's dedicated factories and long-term strategic relationship with its major clients, the company has already secured orders/production plan for its top four clients, Uniqlo, Nike, Adidas and Puma, which accounted for ~80% of its total revenue. Such a high order visibility is quite unique among textile players and makes Shenzhou a resilient player under volatile market environment, rather than a cyclical company like many of its peers.
Figure 2: The top 4 clients
RMB mn 1H13 % of Total YoY%
Uniqlo 1,203 25.2 47.3
Adidas 1,065 22.3 0.0
Nike* 866* 18.2 13.0
Puma 542 11.4 52.0
Subtotal* 3,676* 77.0 22.4
Source: Company data, Credit Suisse estimates.
Note: *Excluding Nike footwear revenue, which was around US$26mn in 1H13 or making Nike's revenue share totaled ~21.6% in 1H13. Data as of 1H13.
Catalysts in 2014-15, undervalued at current share price
We believe the catalysts for the stock include: 1) the release of new garment capacity in 2H14 from the efficiency improvement of newly hired workers in Anhui Anqing and Cambodia factories; 2) the new fabric capacity in phase I of Vietnam expansion which will commence operation by the end of 2014.
We believe a good entry price will be around HK$25.0 (the current share price of HK$25.25 is pretty close), implying only 10x 2015E P/E or 12x 2014E P/E. We believe Shenzhou's fundamentals remain intact, and the recent share price correction offers a good buy-on-dips opportunity for investors seeking long-term stable return. Our target price of HK$35.00 is based on 14x CY2015E P/E, implying 0.86x PEG with 16% EPS CAGR for 13-15E.
Bbg/RIC 2313 HK / 2313.HK Rating (prev. rating) O (O) Shares outstanding (mn) 1,399.00 Daily trad vol - 6m avg (mn) 1.7 Daily trad val - 6m avg (US$ mn) 5.8 Free float (%) 34.1 Major shareholders Mr. Ma Jianrong
(53.6%)
Price (05 Feb 14 , HK$) 25.25 TP (prev. TP HK$) 35.00 (35.00) Est. pot. % chg. to TP 39 52-wk range (HK$) 30.1 - 19.2 Mkt cap (HK$/US$ mn) 35,324.8/ 4,550.6
Performance 1M 3M 12M
Absolute (%) (10.6) (6.1) 31.8 Relative (%) (3.8) 1.2 43.2
Year 12/11A 12/12A 12/13E 12/14E 12/15E
Revenue (Rmb mn) 9,043 8,938 10,108 12,213 14,782 EBITDA (Rmb mn) 2,311 2,163 2,507 3,018 3,592 Net profit (Rmb mn) 1,704 1,620 1,881 2,265 2,737 EPS (Rmb) 1.37 1.24 1.38 1.62 1.96 - Change from prev. EPS (%) n.a. n.a. 0 0 0 - Consensus EPS (Rmb) n.a. n.a. 1.35 1.56 1.86 EPS growth (%) 34.0 (9.1) 10.7 17.6 20.9 P/E (x) 14.4 15.9 14.3 12.2 10.1 Dividend yield (%) 2.1 2.8 2.8 3.3 4.0 EV/EBITDA (x) 12.0 12.1 10.0 8.0 6.4 P/B (x) 4.0 3.2 2.6 2.3 2.0 ROE (%) 31.3 22.9 20.3 20.3 21.3 Net debt(cash)/equity (%) 3.5 (16.7) (24.1) (28.3) (33.2)
Note 1: Shenzhou International provides vertically integrated knitwear manufacturing for well- known retailer brands on an OEM basis. Its products include casual wear, sports wear, lingerie and others. Exports account for around 80% of its total sales.
Thursday, 06 February 2014
Asian Daily
- 14 of 35 -
Hong Kong
Macau Gaming Sector ----------------------------------------------------------------------------------------- Continuation of VIP business slowdown drags January GGR growth to 7% Kenny Lau, CFA / Research Analyst / 852 2101 7914 / [email protected] Isis Wong / Research Analyst / 852 2101 7109 / [email protected]
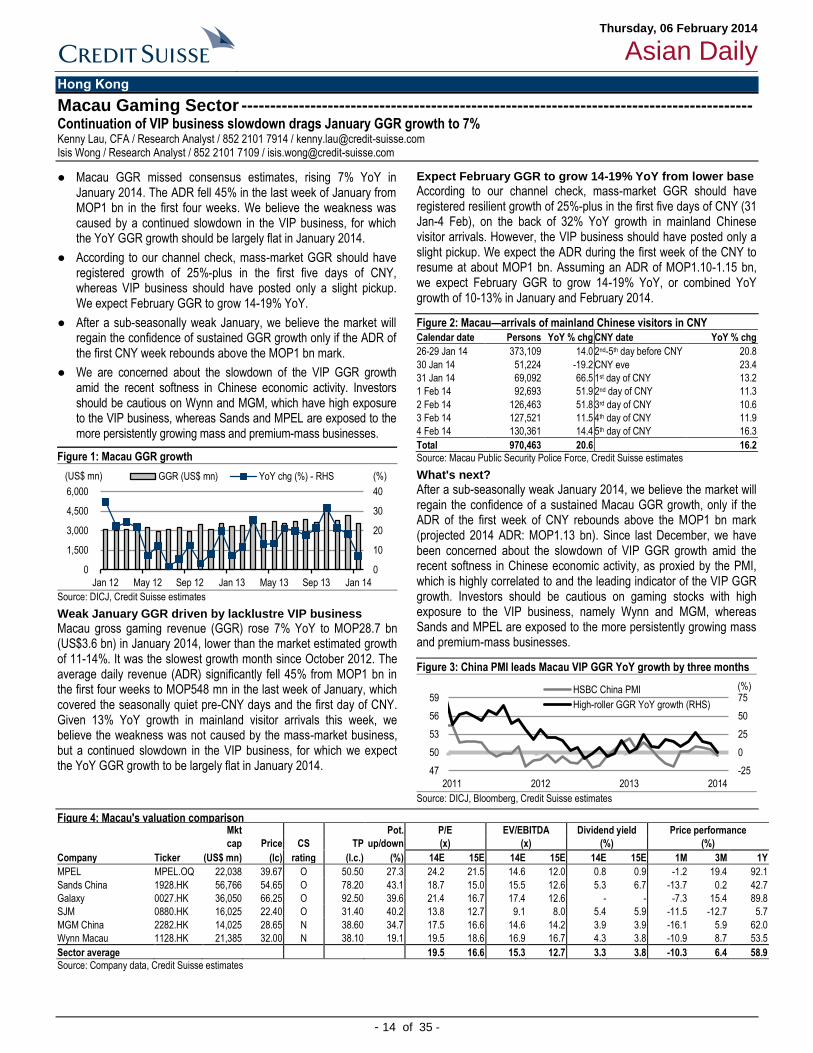
● Macau GGR missed consensus estimates, rising 7% YoY in January 2014. The ADR fell 45% in the last week of January from MOP1 bn in the first four weeks. We believe the weakness was caused by a continued slowdown in the VIP business, for which the YoY GGR growth should be largely flat in January 2014.
● According to our channel check, mass-market GGR should have registered growth of 25%-plus in the first five days of CNY, whereas VIP business should have posted only a slight pickup. We expect February GGR to grow 14-19% YoY.
● After a sub-seasonally weak January, we believe the market will regain the confidence of sustained GGR growth only if the ADR of the first CNY week rebounds above the MOP1 bn mark.
● We are concerned about the slowdown of the VIP GGR growth amid the recent softness in Chinese economic activity. Investors should be cautious on Wynn and MGM, which have high exposure to the VIP business, whereas Sands and MPEL are exposed to the more persistently growing mass and premium-mass businesses.
Figure 1: Macau GGR growth
0
10
20
30
40
0
1,500
3,000
4,500
6,000
Jan 12 May 12 Sep 12 Jan 13 May 13 Sep 13 Jan 14
GGR (US$ mn) YoY chg (%) - RHS(US$ mn) (%)
Source: DICJ, Credit Suisse estimates
Weak January GGR driven by lacklustre VIP business
Macau gross gaming revenue (GGR) rose 7% YoY to MOP28.7 bn (US$3.6 bn) in January 2014, lower than the market estimated growth of 11-14%. It was the slowest growth month since October 2012. The average daily revenue (ADR) significantly fell 45% from MOP1 bn in the first four weeks to MOP548 mn in the last week of January, which covered the seasonally quiet pre-CNY days and the first day of CNY. Given 13% YoY growth in mainland visitor arrivals this week, we believe the weakness was not caused by the mass-market business, but a continued slowdown in the VIP business, for which we expect the YoY GGR growth to be largely flat in January 2014.
Expect February GGR to grow 14-19% YoY from lower base
According to our channel check, mass-market GGR should have registered resilient growth of 25%-plus in the first five days of CNY (31 Jan-4 Feb), on the back of 32% YoY growth in mainland Chinese visitor arrivals. However, the VIP business should have posted only a slight pickup. We expect the ADR during the first week of the CNY to resume at about MOP1 bn. Assuming an ADR of MOP1.10-1.15 bn, we expect February GGR to grow 14-19% YoY, or combined YoY growth of 10-13% in January and February 2014.
Figure 2: Macau—arrivals of mainland Chinese visitors in CNY
Calendar date Persons YoY % chg CNY date YoY % chg
26-29 Jan 14 373,109 14.0 2nd-5th day before CNY 20.8
30 Jan 14 51,224 -19.2 CNY eve 23.4
31 Jan 14 69,092 66.5 1st day of CNY 13.2
1 Feb 14 92,693 51.9 2nd day of CNY 11.3
2 Feb 14 126,463 51.8 3rd day of CNY 10.6
3 Feb 14 127,521 11.5 4th day of CNY 11.9
4 Feb 14 130,361 14.4 5th day of CNY 16.3
Total 970,463 20.6 16.2
Source: Macau Public Security Police Force, Credit Suisse estimates
What's next?
After a sub-seasonally weak January 2014, we believe the market will regain the confidence of a sustained Macau GGR growth, only if the ADR of the first week of CNY rebounds above the MOP1 bn mark (projected 2014 ADR: MOP1.13 bn). Since last December, we have been concerned about the slowdown of VIP GGR growth amid the recent softness in Chinese economic activity, as proxied by the PMI, which is highly correlated to and the leading indicator of the VIP GGR growth. Investors should be cautious on gaming stocks with high exposure to the VIP business, namely Wynn and MGM, whereas Sands and MPEL are exposed to the more persistently growing mass and premium-mass businesses.
Figure 3: China PMI leads Macau VIP GGR YoY growth by three months
-25
0
25
50
75
47
50
53
56
59
2011 2012 2013 2014
(%)HSBC China PMI
High-roller GGR YoY growth (RHS)
Source: DICJ, Bloomberg, Credit Suisse estimates
Figure 4: Macau's valuation comparison Mkt Pot. P/E EV/EBITDA Dividend yield Price performance
cap Price CS TP up/down (x) (x) (%) (%)
Company Ticker (US$ mn) (lc) rating (l.c.) (%) 14E 15E 14E 15E 14E 15E 1M 3M 1Y
MPEL MPEL.OQ 22,038 39.67 O 50.50 27.3 24.2 21.5 14.6 12.0 0.8 0.9 -1.2 19.4 92.1
Sands China 1928.HK 56,766 54.65 O 78.20 43.1 18.7 15.0 15.5 12.6 5.3 6.7 -13.7 0.2 42.7
Galaxy 0027.HK 36,050 66.25 O 92.50 39.6 21.4 16.7 17.4 12.6 - - -7.3 15.4 89.8
SJM 0880.HK 16,025 22.40 O 31.40 40.2 13.8 12.7 9.1 8.0 5.4 5.9 -11.5 -12.7 5.7
MGM China 2282.HK 14,025 28.65 N 38.60 34.7 17.5 16.6 14.6 14.2 3.9 3.9 -16.1 5.9 62.0
Wynn Macau 1128.HK 21,385 32.00 N 38.10 19.1 19.5 18.6 16.9 16.7 4.3 3.8 -10.9 8.7 53.5
Sector average 19.5 16.6 15.3 12.7 3.3 3.8 -10.3 6.4 58.9
Source: Company data, Credit Suisse estimates

Thursday, 06 February 2014
Asian Daily
- 15 of 35 -
India
India Market Strategy ------------------------------------------------------------------------------------------ Can the cost-push rise in milk prices offset the decline in vegetable inflation? Neelkanth Mishra / Research Analyst / 91 22 6777 3716 / [email protected] Ravi Shankar / Research Analyst / 91 22 6777 3869 / [email protected]
● Last week milk prices were raised by Rs2/ltr for the second time since October, and retail prices are now tracking 18-23% higher YoY. Thus, milk prices are back at 15-20% growth after a 1.5-year lull (Figure 1).
● The strong correlation between milk costs and prices (Figure 4) suggests a strong cost push. Operating costs in milk production are primarily labour and fodder, and both have been rising. Fodder prices in particular have grown significantly since FY09, and have continued to rise in FY14 (Figure 2).
● The low prices over the last year thus likely hurt supply growth as costs were still rising. As demand grew and supply did not, prices are now rising. Milk has 3.2% weight in the CPI, versus 3.8% for fruits and vegetables: the expected decline in the latter inflation can likely be offset by the spike in milk prices.
● This wage-price spiral in more labour-intensive animal products and fruits/vegetables is the root cause of sticky food inflation (for details see link to our Oct 2013 report), and is unlikely to be broken soon—hence, our UNDERWEIGHT stance on rate-sensitive sectors. We recommend selling L&T, SBI and Tata Steel.
Milk price inflation at 20% YoY after an 18-month lull
Figure 1: After Feb hikes, milk price increases back to 20% YoY levels
0%
5%
10%
15%
20%
25%
30%
1995
1996
1997
1998
1999
2000
2001
2002
2003
2004
2005
2006
2007
2008
2009
2010
2011
2012
2013
2014
TD
Pos
t Feb
Annual change in milk price (annual)
Source: EA to GoI, BS, IE, Credit Suisse estimates
Last week, milk prices were raised by Rs2/ltr for the second time in four months, and retail prices are now tracking 18-23% higher YoY. Thus, milk prices are back at 15-20% growth after a 1.5-year lull (Figure 1).
Figure 2: Fodder prices have continued to grow at 15-20% for a while
-40%
-20%
0%
20%
40%
60%
80%
0
100
200
300
400
500
600
Apr-95 Apr-98 Apr-01 Apr-04 Apr-07 Apr-10 Apr-13
Fodder price (Indexed to 100) Inflation (%, y/y RHS)
Source: EA to GoI, Credit Suisse estimates
Cost-push inflation at play again
Operating costs in milk production are primarily labour and fodder, and both have been rising. Fodder prices in particular have grown significantly since FY09, and have continued to rise in FY14 (Figure 2).
Figure 3: Annual increases in costs not correlated with milk prices, but…
-10%
10%
30%
50%
1994-02 2004 2006 2008 2010 2012 2014TD
Milk Milk Cost
Assumptions: Fodder 65% of cost; Labour 33%
Source: Anagol, Etang, Karlan (2013), EA to GoI, Credit Suisse estimates
Given long gestation and lactation periods for cattle, supply response to milk prices is not immediate. Over a one-year period, there is not much correlation between costs and prices (Figure 3). However, over five years, the increase in milk costs and prices are in sync (Figure 4).
Figure 4: …over five years, milk costs and milk prices move together
0%
5%
10%
15%
1994-02 2003-08 2004-09 2005-10 2006-11 2007-12 2008-13
Milk Milk Cost
5 Year Increase (CAGR, %)
Source: EA to GoI, Labour Bureau, Credit Suisse estimates
The low prices over the last year thus likely hurt supply growth as costs were still rising. As demand grew and supply did not, prices are now rising. This wage-price spiral in more labour-intensive animal products and fruits/vegetables is the root cause of sticky food inflation (for details see Agri 101: Boosting the Silent Transformation).
Figure 5: Milk price hike limits combined inflation fall from 20% to 16%
-20%
-10%
0%
10%
20%
30%
40%
Apr-05 Apr-06 Apr-07 Apr-08 Apr-09 Apr-10 Apr-11 Apr-12 Apr-13
Fruits & veg Milk Combined
Without hike, combined inflation could have fallen to 10%
Source: EA to GoI, Credit Suisse estimates
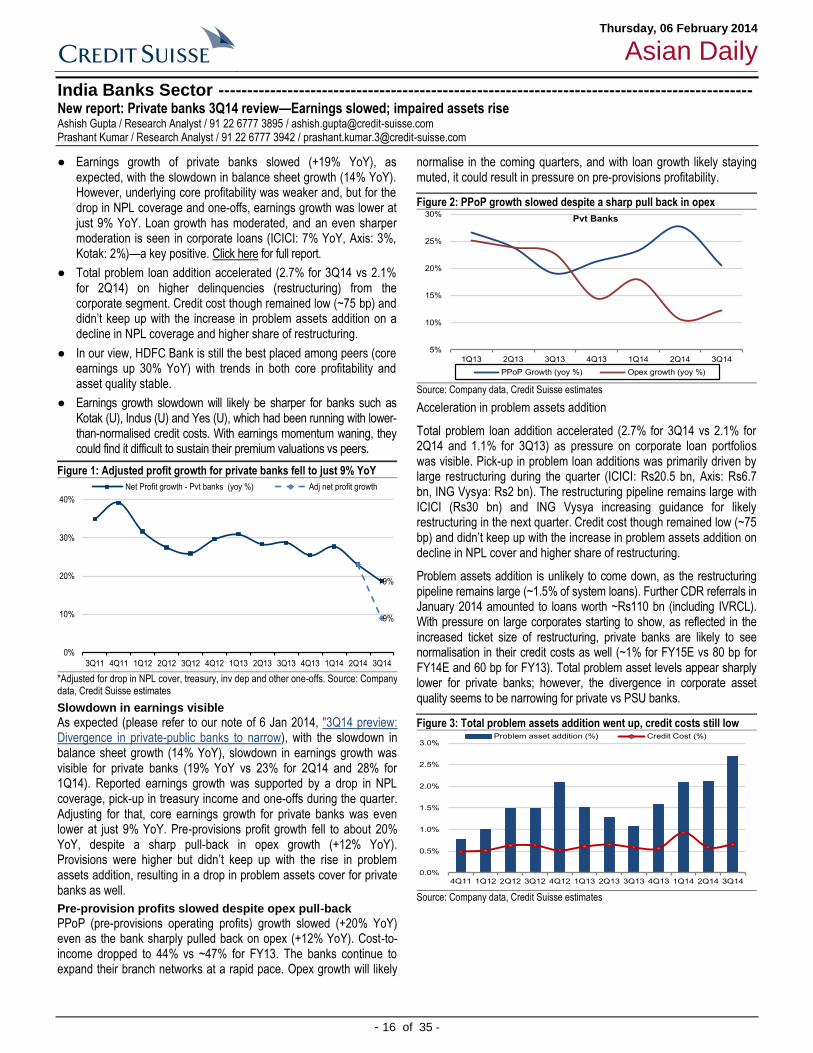
Thursday, 06 February 2014
Asian Daily
- 16 of 35 -
India Banks Sector --------------------------------------------------------------------------------------------- New report: Private banks 3Q14 review—Earnings slowed; impaired assets rise Ashish Gupta / Research Analyst / 91 22 6777 3895 / [email protected] Prashant Kumar / Research Analyst / 91 22 6777 3942 / [email protected]
● Earnings growth of private banks slowed (+19% YoY), as expected, with the slowdown in balance sheet growth (14% YoY). However, underlying core profitability was weaker and, but for the drop in NPL coverage and one-offs, earnings growth was lower at just 9% YoY. Loan growth has moderated, and an even sharper moderation is seen in corporate loans (ICICI: 7% YoY, Axis: 3%, Kotak: 2%)—a key positive. Click here for full report.
● Total problem loan addition accelerated (2.7% for 3Q14 vs 2.1% for 2Q14) on higher delinquencies (restructuring) from the corporate segment. Credit cost though remained low (~75 bp) and didn’t keep up with the increase in problem assets addition on a decline in NPL coverage and higher share of restructuring.
● In our view, HDFC Bank is still the best placed among peers (core earnings up 30% YoY) with trends in both core profitability and asset quality stable.
● Earnings growth slowdown will likely be sharper for banks such as Kotak (U), Indus (U) and Yes (U), which had been running with lower-than-normalised credit costs. With earnings momentum waning, they could find it difficult to sustain their premium valuations vs peers.
Figure 1: Adjusted profit growth for private banks fell to just 9% YoY
19%
9%
0%
10%
20%
30%
40%
3Q11 4Q11 1Q12 2Q12 3Q12 4Q12 1Q13 2Q13 3Q13 4Q13 1Q14 2Q14 3Q14
Net Profit growth - Pvt banks (yoy %) Adj net profit growth
*Adjusted for drop in NPL cover, treasury, inv dep and other one-offs. Source: Company data, Credit Suisse estimates
Slowdown in earnings visible
As expected (please refer to our note of 6 Jan 2014, "3Q14 preview: Divergence in private-public banks to narrow), with the slowdown in balance sheet growth (14% YoY), slowdown in earnings growth was visible for private banks (19% YoY vs 23% for 2Q14 and 28% for 1Q14). Reported earnings growth was supported by a drop in NPL coverage, pick-up in treasury income and one-offs during the quarter. Adjusting for that, core earnings growth for private banks was even lower at just 9% YoY. Pre-provisions profit growth fell to about 20% YoY, despite a sharp pull-back in opex growth (+12% YoY). Provisions were higher but didn’t keep up with the rise in problem assets addition, resulting in a drop in problem assets cover for private banks as well.
Pre-provision profits slowed despite opex pull-back
PPoP (pre-provisions operating profits) growth slowed (+20% YoY) even as the bank sharply pulled back on opex (+12% YoY). Cost-to-income dropped to 44% vs ~47% for FY13. The banks continue to expand their branch networks at a rapid pace. Opex growth will likely
normalise in the coming quarters, and with loan growth likely staying muted, it could result in pressure on pre-provisions profitability.
Figure 2: PPoP growth slowed despite a sharp pull back in opex
5%
10%
15%
20%
25%
30%
1Q13 2Q13 3Q13 4Q13 1Q14 2Q14 3Q14
PPoP Growth (yoy %) Opex growth (yoy %)
Pvt Banks
Source: Company data, Credit Suisse estimates
Acceleration in problem assets addition
Total problem loan addition accelerated (2.7% for 3Q14 vs 2.1% for 2Q14 and 1.1% for 3Q13) as pressure on corporate loan portfolios was visible. Pick-up in problem loan additions was primarily driven by large restructuring during the quarter (ICICI: Rs20.5 bn, Axis: Rs6.7 bn, ING Vysya: Rs2 bn). The restructuring pipeline remains large with ICICI (Rs30 bn) and ING Vysya increasing guidance for likely restructuring in the next quarter. Credit cost though remained low (~75 bp) and didn’t keep up with the increase in problem assets addition on decline in NPL cover and higher share of restructuring.
Problem assets addition is unlikely to come down, as the restructuring pipeline remains large (~1.5% of system loans). Further CDR referrals in January 2014 amounted to loans worth ~Rs110 bn (including IVRCL). With pressure on large corporates starting to show, as reflected in the increased ticket size of restructuring, private banks are likely to see normalisation in their credit costs as well (~1% for FY15E vs 80 bp for FY14E and 60 bp for FY13). Total problem asset levels appear sharply lower for private banks; however, the divergence in corporate asset quality seems to be narrowing for private vs PSU banks.
Figure 3: Total problem assets addition went up, credit costs still low
0.0%
0.5%
1.0%
1.5%
2.0%
2.5%
3.0%
4Q11 1Q12 2Q12 3Q12 4Q12 1Q13 2Q13 3Q13 4Q13 1Q14 2Q14 3Q14
Problem asset addition (%) Credit Cost (%)
Source: Company data, Credit Suisse estimates
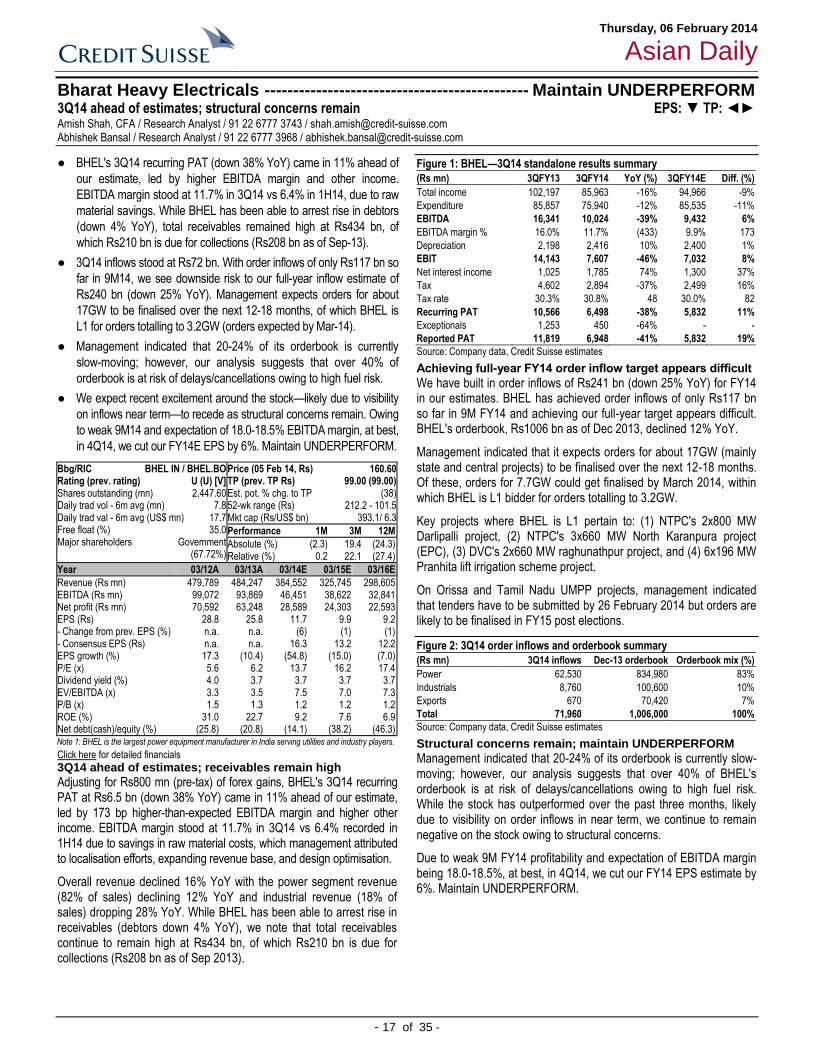
Thursday, 06 February 2014
Asian Daily
- 17 of 35 -
Bharat Heavy Electricals ---------------------------------------------- Maintain UNDERPERFORM 3Q14 ahead of estimates; structural concerns remain EPS: ▼ TP: ◄► Amish Shah, CFA / Research Analyst / 91 22 6777 3743 / [email protected] Abhishek Bansal / Research Analyst / 91 22 6777 3968 / [email protected]
● BHEL's 3Q14 recurring PAT (down 38% YoY) came in 11% ahead of
our estimate, led by higher EBITDA margin and other income.
EBITDA margin stood at 11.7% in 3Q14 vs 6.4% in 1H14, due to raw
material savings. While BHEL has been able to arrest rise in debtors
(down 4% YoY), total receivables remained high at Rs434 bn, of
which Rs210 bn is due for collections (Rs208 bn as of Sep-13).
● 3Q14 inflows stood at Rs72 bn. With order inflows of only Rs117 bn so
far in 9M14, we see downside risk to our full-year inflow estimate of
Rs240 bn (down 25% YoY). Management expects orders for about
17GW to be finalised over the next 12-18 months, of which BHEL is
L1 for orders totalling to 3.2GW (orders expected by Mar-14).
● Management indicated that 20-24% of its orderbook is currently
slow-moving; however, our analysis suggests that over 40% of
orderbook is at risk of delays/cancellations owing to high fuel risk.
● We expect recent excitement around the stock—likely due to visibility
on inflows near term—to recede as structural concerns remain. Owing
to weak 9M14 and expectation of 18.0-18.5% EBITDA margin, at best,
in 4Q14, we cut our FY14E EPS by 6%. Maintain UNDERPERFORM.
Click here for detailed financials
3Q14 ahead of estimates; receivables remain high
Adjusting for Rs800 mn (pre-tax) of forex gains, BHEL's 3Q14 recurring PAT at Rs6.5 bn (down 38% YoY) came in 11% ahead of our estimate, led by 173 bp higher-than-expected EBITDA margin and higher other income. EBITDA margin stood at 11.7% in 3Q14 vs 6.4% recorded in 1H14 due to savings in raw material costs, which management attributed to localisation efforts, expanding revenue base, and design optimisation.
Overall revenue declined 16% YoY with the power segment revenue (82% of sales) declining 12% YoY and industrial revenue (18% of sales) dropping 28% YoY. While BHEL has been able to arrest rise in receivables (debtors down 4% YoY), we note that total receivables continue to remain high at Rs434 bn, of which Rs210 bn is due for collections (Rs208 bn as of Sep 2013).
Figure 1: BHEL—3Q14 standalone results summary
(Rs mn) 3QFY13 3QFY14 YoY (%) 3QFY14E Diff. (%)
Total income 102,197 85,963 -16% 94,966 -9%
Expenditure 85,857 75,940 -12% 85,535 -11%
EBITDA 16,341 10,024 -39% 9,432 6%
EBITDA margin % 16.0% 11.7% (433) 9.9% 173
Depreciation 2,198 2,416 10% 2,400 1%
EBIT 14,143 7,607 -46% 7,032 8%
Net interest income 1,025 1,785 74% 1,300 37%
Tax 4,602 2,894 -37% 2,499 16%
Tax rate 30.3% 30.8% 48 30.0% 82
Recurring PAT 10,566 6,498 -38% 5,832 11%
Exceptionals 1,253 450 -64% - -
Reported PAT 11,819 6,948 -41% 5,832 19%
Source: Company data, Credit Suisse estimates
Achieving full-year FY14 order inflow target appears difficult
We have built in order inflows of Rs241 bn (down 25% YoY) for FY14 in our estimates. BHEL has achieved order inflows of only Rs117 bn so far in 9M FY14 and achieving our full-year target appears difficult. BHEL's orderbook, Rs1006 bn as of Dec 2013, declined 12% YoY.
Management indicated that it expects orders for about 17GW (mainly state and central projects) to be finalised over the next 12-18 months. Of these, orders for 7.7GW could get finalised by March 2014, within which BHEL is L1 bidder for orders totalling to 3.2GW.
Key projects where BHEL is L1 pertain to: (1) NTPC's 2x800 MW Darlipalli project, (2) NTPC's 3x660 MW North Karanpura project (EPC), (3) DVC's 2x660 MW raghunathpur project, and (4) 6x196 MW Pranhita lift irrigation scheme project.
On Orissa and Tamil Nadu UMPP projects, management indicated that tenders have to be submitted by 26 February 2014 but orders are likely to be finalised in FY15 post elections.
Figure 2: 3Q14 order inflows and orderbook summary
(Rs mn) 3Q14 inflows Dec-13 orderbook Orderbook mix (%)
Power 62,530 834,980 83%
Industrials 8,760 100,600 10%
Exports 670 70,420 7%
Total 71,960 1,006,000 100%
Source: Company data, Credit Suisse estimates
Structural concerns remain; maintain UNDERPERFORM
Management indicated that 20-24% of its orderbook is currently slow-moving; however, our analysis suggests that over 40% of BHEL's orderbook is at risk of delays/cancellations owing to high fuel risk. While the stock has outperformed over the past three months, likely due to visibility on order inflows in near term, we continue to remain negative on the stock owing to structural concerns.
Due to weak 9M FY14 profitability and expectation of EBITDA margin being 18.0-18.5%, at best, in 4Q14, we cut our FY14 EPS estimate by 6%. Maintain UNDERPERFORM.
Bbg/RIC BHEL IN / BHEL.BO Rating (prev. rating) U (U) [V] Shares outstanding (mn) 2,447.60 Daily trad vol - 6m avg (mn) 7.8 Daily trad val - 6m avg (US$ mn) 17.7 Free float (%) 35.0 Major shareholders Government
(67.72%)
Price (05 Feb 14, Rs) 160.60 TP (prev. TP Rs) 99.00 (99.00) Est. pot. % chg. to TP (38) 52-wk range (Rs) 212.2 - 101.5 Mkt cap (Rs/US$ bn) 393.1/ 6.3
Performance 1M 3M 12M
Absolute (%) (2.3) 19.4 (24.3) Relative (%) 0.2 22.1 (27.4)
Year 03/12A 03/13A 03/14E 03/15E 03/16E
Revenue (Rs mn) 479,789 484,247 384,552 325,745 298,605 EBITDA (Rs mn) 99,072 93,869 46,451 38,622 32,841 Net profit (Rs mn) 70,592 63,248 28,589 24,303 22,593 EPS (Rs) 28.8 25.8 11.7 9.9 9.2 - Change from prev. EPS (%) n.a. n.a. (6) (1) (1) - Consensus EPS (Rs) n.a. n.a. 16.3 13.2 12.2 EPS growth (%) 17.3 (10.4) (54.8) (15.0) (7.0) P/E (x) 5.6 6.2 13.7 16.2 17.4 Dividend yield (%) 4.0 3.7 3.7 3.7 3.7 EV/EBITDA (x) 3.3 3.5 7.5 7.0 7.3 P/B (x) 1.5 1.3 1.2 1.2 1.2 ROE (%) 31.0 22.7 9.2 7.6 6.9 Net debt(cash)/equity (%) (25.8) (20.8) (14.1) (38.2) (46.3)
Note 1: BHEL is the largest power equipment manufacturer in India serving utilities and industry players.
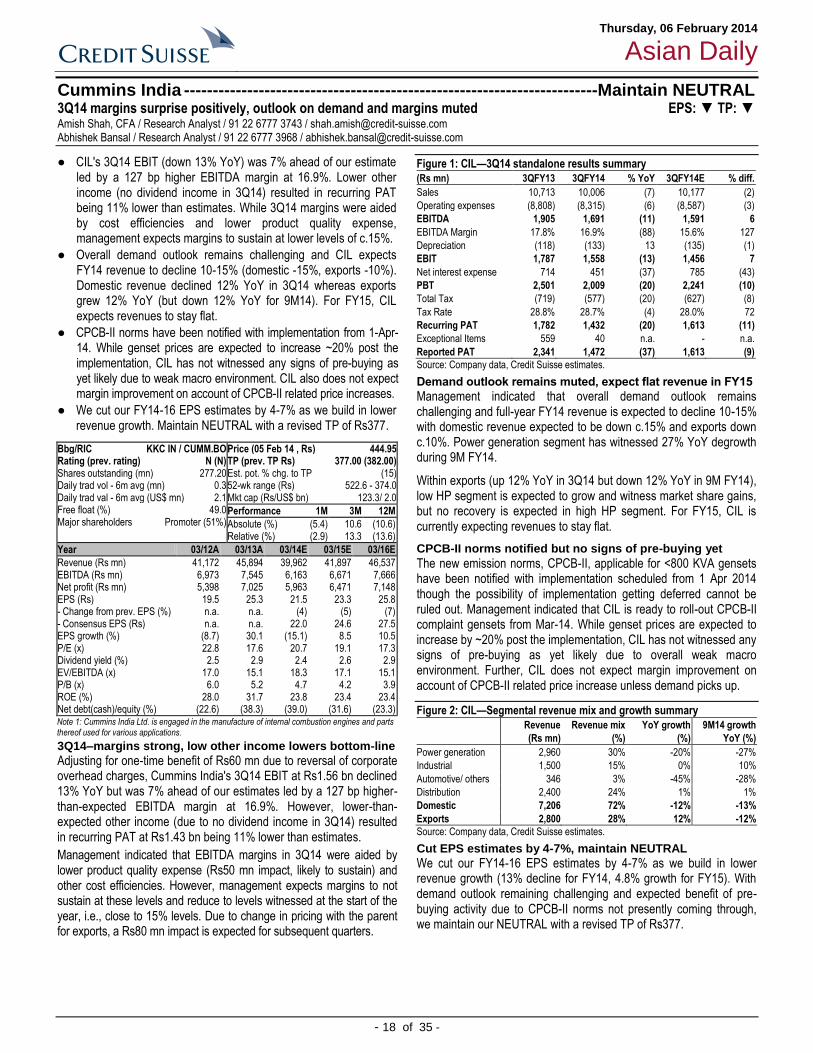
Thursday, 06 February 2014
Asian Daily
- 18 of 35 -
Cummins India ------------------------------------------------------------------------Maintain NEUTRAL 3Q14 margins surprise positively, outlook on demand and margins muted EPS: ▼ TP: ▼ Amish Shah, CFA / Research Analyst / 91 22 6777 3743 / [email protected] Abhishek Bansal / Research Analyst / 91 22 6777 3968 / [email protected]
● CIL's 3Q14 EBIT (down 13% YoY) was 7% ahead of our estimate led by a 127 bp higher EBITDA margin at 16.9%. Lower other income (no dividend income in 3Q14) resulted in recurring PAT being 11% lower than estimates. While 3Q14 margins were aided by cost efficiencies and lower product quality expense, management expects margins to sustain at lower levels of c.15%.
● Overall demand outlook remains challenging and CIL expects FY14 revenue to decline 10-15% (domestic -15%, exports -10%). Domestic revenue declined 12% YoY in 3Q14 whereas exports grew 12% YoY (but down 12% YoY for 9M14). For FY15, CIL expects revenues to stay flat.
● CPCB-II norms have been notified with implementation from 1-Apr-14. While genset prices are expected to increase ~20% post the implementation, CIL has not witnessed any signs of pre-buying as yet likely due to weak macro environment. CIL also does not expect margin improvement on account of CPCB-II related price increases.
● We cut our FY14-16 EPS estimates by 4-7% as we build in lower revenue growth. Maintain NEUTRAL with a revised TP of Rs377.
3Q14–margins strong, low other income lowers bottom-line
Adjusting for one-time benefit of Rs60 mn due to reversal of corporate overhead charges, Cummins India's 3Q14 EBIT at Rs1.56 bn declined 13% YoY but was 7% ahead of our estimates led by a 127 bp higher-than-expected EBITDA margin at 16.9%. However, lower-than-expected other income (due to no dividend income in 3Q14) resulted in recurring PAT at Rs1.43 bn being 11% lower than estimates.
Management indicated that EBITDA margins in 3Q14 were aided by lower product quality expense (Rs50 mn impact, likely to sustain) and other cost efficiencies. However, management expects margins to not sustain at these levels and reduce to levels witnessed at the start of the year, i.e., close to 15% levels. Due to change in pricing with the parent for exports, a Rs80 mn impact is expected for subsequent quarters.
Figure 1: CIL—3Q14 standalone results summary
(Rs mn) 3QFY13 3QFY14 % YoY 3QFY14E % diff.
Sales 10,713 10,006 (7) 10,177 (2)
Operating expenses (8,808) (8,315) (6) (8,587) (3)
EBITDA 1,905 1,691 (11) 1,591 6
EBITDA Margin 17.8% 16.9% (88) 15.6% 127
Depreciation (118) (133) 13 (135) (1)
EBIT 1,787 1,558 (13) 1,456 7
Net interest expense 714 451 (37) 785 (43)
PBT 2,501 2,009 (20) 2,241 (10)
Total Tax (719) (577) (20) (627) (8)
Tax Rate 28.8% 28.7% (4) 28.0% 72
Recurring PAT 1,782 1,432 (20) 1,613 (11)
Exceptional Items 559 40 n.a. - n.a.
Reported PAT 2,341 1,472 (37) 1,613 (9)
Source: Company data, Credit Suisse estimates.
Demand outlook remains muted, expect flat revenue in FY15
Management indicated that overall demand outlook remains challenging and full-year FY14 revenue is expected to decline 10-15% with domestic revenue expected to be down c.15% and exports down c.10%. Power generation segment has witnessed 27% YoY degrowth during 9M FY14.
Within exports (up 12% YoY in 3Q14 but down 12% YoY in 9M FY14), low HP segment is expected to grow and witness market share gains, but no recovery is expected in high HP segment. For FY15, CIL is currently expecting revenues to stay flat.
CPCB-II norms notified but no signs of pre-buying yet
The new emission norms, CPCB-II, applicable for <800 KVA gensets have been notified with implementation scheduled from 1 Apr 2014 though the possibility of implementation getting deferred cannot be ruled out. Management indicated that CIL is ready to roll-out CPCB-II complaint gensets from Mar-14. While genset prices are expected to increase by ~20% post the implementation, CIL has not witnessed any signs of pre-buying as yet likely due to overall weak macro environment. Further, CIL does not expect margin improvement on account of CPCB-II related price increase unless demand picks up.
Figure 2: CIL—Segmental revenue mix and growth summary
Revenue
(Rs mn)
Revenue mix
(%)
YoY growth
(%)
9M14 growth
YoY (%)
Power generation 2,960 30% -20% -27%
Industrial 1,500 15% 0% 10%
Automotive/ others 346 3% -45% -28%
Distribution 2,400 24% 1% 1%
Domestic 7,206 72% -12% -13%
Exports 2,800 28% 12% -12%
Source: Company data, Credit Suisse estimates.
Cut EPS estimates by 4-7%, maintain NEUTRAL
We cut our FY14-16 EPS estimates by 4-7% as we build in lower revenue growth (13% decline for FY14, 4.8% growth for FY15). With demand outlook remaining challenging and expected benefit of pre-buying activity due to CPCB-II norms not presently coming through, we maintain our NEUTRAL with a revised TP of Rs377.
Bbg/RIC KKC IN / CUMM.BO Rating (prev. rating) N (N) Shares outstanding (mn) 277.20 Daily trad vol - 6m avg (mn) 0.3 Daily trad val - 6m avg (US$ mn) 2.1 Free float (%) 49.0 Major shareholders Promoter (51%)
Price (05 Feb 14 , Rs) 444.95 TP (prev. TP Rs) 377.00 (382.00) Est. pot. % chg. to TP (15) 52-wk range (Rs) 522.6 - 374.0 Mkt cap (Rs/US$ bn) 123.3/ 2.0
Performance 1M 3M 12M
Absolute (%) (5.4) 10.6 (10.6) Relative (%) (2.9) 13.3 (13.6)
Year 03/12A 03/13A 03/14E 03/15E 03/16E
Revenue (Rs mn) 41,172 45,894 39,962 41,897 46,537 EBITDA (Rs mn) 6,973 7,545 6,163 6,671 7,666 Net profit (Rs mn) 5,398 7,025 5,963 6,471 7,148 EPS (Rs) 19.5 25.3 21.5 23.3 25.8 - Change from prev. EPS (%) n.a. n.a. (4) (5) (7) - Consensus EPS (Rs) n.a. n.a. 22.0 24.6 27.5 EPS growth (%) (8.7) 30.1 (15.1) 8.5 10.5 P/E (x) 22.8 17.6 20.7 19.1 17.3 Dividend yield (%) 2.5 2.9 2.4 2.6 2.9 EV/EBITDA (x) 17.0 15.1 18.3 17.1 15.1 P/B (x) 6.0 5.2 4.7 4.2 3.9 ROE (%) 28.0 31.7 23.8 23.4 23.4 Net debt(cash)/equity (%) (22.6) (38.3) (39.0) (31.6) (23.3)
Note 1: Cummins India Ltd. is engaged in the manufacture of internal combustion engines and parts thereof used for various applications.
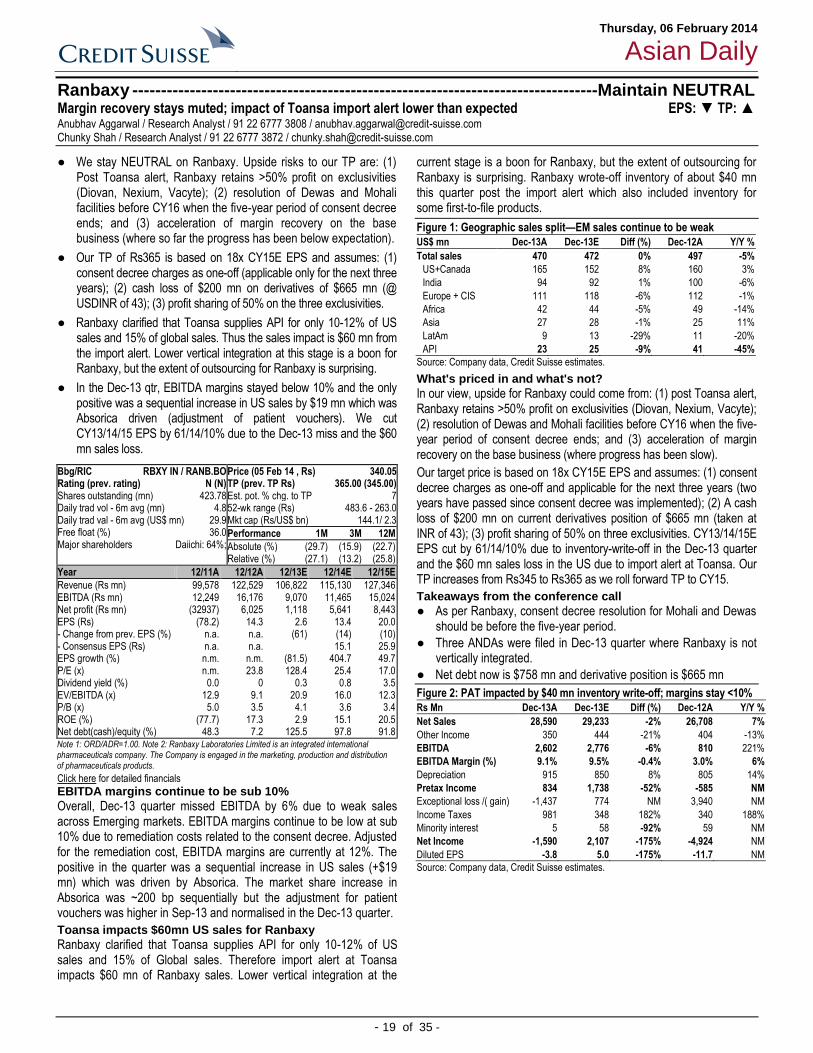
Thursday, 06 February 2014
Asian Daily
- 19 of 35 -
Ranbaxy ---------------------------------------------------------------------------------Maintain NEUTRAL Margin recovery stays muted; impact of Toansa import alert lower than expected EPS: ▼ TP: ▲ Anubhav Aggarwal / Research Analyst / 91 22 6777 3808 / [email protected] Chunky Shah / Research Analyst / 91 22 6777 3872 / [email protected]
● We stay NEUTRAL on Ranbaxy. Upside risks to our TP are: (1) Post Toansa alert, Ranbaxy retains >50% profit on exclusivities (Diovan, Nexium, Vacyte); (2) resolution of Dewas and Mohali facilities before CY16 when the five-year period of consent decree ends; and (3) acceleration of margin recovery on the base business (where so far the progress has been below expectation).
● Our TP of Rs365 is based on 18x CY15E EPS and assumes: (1) consent decree charges as one-off (applicable only for the next three years); (2) cash loss of $200 mn on derivatives of $665 mn (@ USDINR of 43); (3) profit sharing of 50% on the three exclusivities.
● Ranbaxy clarified that Toansa supplies API for only 10-12% of US sales and 15% of global sales. Thus the sales impact is $60 mn from the import alert. Lower vertical integration at this stage is a boon for Ranbaxy, but the extent of outsourcing for Ranbaxy is surprising.
● In the Dec-13 qtr, EBITDA margins stayed below 10% and the only positive was a sequential increase in US sales by $19 mn which was Absorica driven (adjustment of patient vouchers). We cut CY13/14/15 EPS by 61/14/10% due to the Dec-13 miss and the $60 mn sales loss.
Click here for detailed financials
EBITDA margins continue to be sub 10%
Overall, Dec-13 quarter missed EBITDA by 6% due to weak sales across Emerging markets. EBITDA margins continue to be low at sub 10% due to remediation costs related to the consent decree. Adjusted for the remediation cost, EBITDA margins are currently at 12%. The positive in the quarter was a sequential increase in US sales (+$19 mn) which was driven by Absorica. The market share increase in Absorica was ~200 bp sequentially but the adjustment for patient vouchers was higher in Sep-13 and normalised in the Dec-13 quarter.
Toansa impacts $60mn US sales for Ranbaxy
Ranbaxy clarified that Toansa supplies API for only 10-12% of US sales and 15% of Global sales. Therefore import alert at Toansa impacts $60 mn of Ranbaxy sales. Lower vertical integration at the
current stage is a boon for Ranbaxy, but the extent of outsourcing for Ranbaxy is surprising. Ranbaxy wrote-off inventory of about $40 mn this quarter post the import alert which also included inventory for some first-to-file products.
Figure 1: Geographic sales split—EM sales continue to be weak
US$ mn Dec-13A Dec-13E Diff (%) Dec-12A Y/Y %
Total sales 470 472 0% 497 -5%
US+Canada 165 152 8% 160 3%
India 94 92 1% 100 -6%
Europe + CIS 111 118 -6% 112 -1%
Africa 42 44 -5% 49 -14%
Asia 27 28 -1% 25 11%
LatAm 9 13 -29% 11 -20%
API 23 25 -9% 41 -45%
Source: Company data, Credit Suisse estimates.
What's priced in and what's not?
In our view, upside for Ranbaxy could come from: (1) post Toansa alert, Ranbaxy retains >50% profit on exclusivities (Diovan, Nexium, Vacyte); (2) resolution of Dewas and Mohali facilities before CY16 when the five-year period of consent decree ends; and (3) acceleration of margin recovery on the base business (where progress has been slow).
Our target price is based on 18x CY15E EPS and assumes: (1) consent decree charges as one-off and applicable for the next three years (two years have passed since consent decree was implemented); (2) A cash loss of $200 mn on current derivatives position of $665 mn (taken at INR of 43); (3) profit sharing of 50% on three exclusivities. CY13/14/15E EPS cut by 61/14/10% due to inventory-write-off in the Dec-13 quarter and the $60 mn sales loss in the US due to import alert at Toansa. Our TP increases from Rs345 to Rs365 as we roll forward TP to CY15.
Takeaways from the conference call
● As per Ranbaxy, consent decree resolution for Mohali and Dewas should be before the five-year period.
● Three ANDAs were filed in Dec-13 quarter where Ranbaxy is not vertically integrated.
● Net debt now is $758 mn and derivative position is $665 mn
Figure 2: PAT impacted by $40 mn inventory write-off; margins stay <10%
Rs Mn Dec-13A Dec-13E Diff (%) Dec-12A Y/Y %
Net Sales 28,590 29,233 -2% 26,708 7%
Other Income 350 444 -21% 404 -13%
EBITDA 2,602 2,776 -6% 810 221%
EBITDA Margin (%) 9.1% 9.5% -0.4% 3.0% 6%
Depreciation 915 850 8% 805 14%
Pretax Income 834 1,738 -52% -585 NM
Exceptional loss /( gain) -1,437 774 NM 3,940 NM
Income Taxes 981 348 182% 340 188%
Minority interest 5 58 -92% 59 NM
Net Income -1,590 2,107 -175% -4,924 NM
Diluted EPS -3.8 5.0 -175% -11.7 NM
Source: Company data, Credit Suisse estimates.
Bbg/RIC RBXY IN / RANB.BO Rating (prev. rating) N (N) Shares outstanding (mn) 423.78 Daily trad vol - 6m avg (mn) 4.8 Daily trad val - 6m avg (US$ mn) 29.9 Free float (%) 36.0 Major shareholders Daiichi: 64%;
Price (05 Feb 14 , Rs) 340.05 TP (prev. TP Rs) 365.00 (345.00) Est. pot. % chg. to TP 7 52-wk range (Rs) 483.6 - 263.0 Mkt cap (Rs/US$ bn) 144.1/ 2.3
Performance 1M 3M 12M
Absolute (%) (29.7) (15.9) (22.7) Relative (%) (27.1) (13.2) (25.8)
Year 12/11A 12/12A 12/13E 12/14E 12/15E
Revenue (Rs mn) 99,578 122,529 106,822 115,130 127,346 EBITDA (Rs mn) 12,249 16,176 9,070 11,465 15,024 Net profit (Rs mn) (32937) 6,025 1,118 5,641 8,443 EPS (Rs) (78.2) 14.3 2.6 13.4 20.0 - Change from prev. EPS (%) n.a. n.a. (61) (14) (10) - Consensus EPS (Rs) n.a. n.a. 15.1 25.9 EPS growth (%) n.m. n.m. (81.5) 404.7 49.7 P/E (x) n.m. 23.8 128.4 25.4 17.0 Dividend yield (%) 0.0 0 0.3 0.8 3.5 EV/EBITDA (x) 12.9 9.1 20.9 16.0 12.3 P/B (x) 5.0 3.5 4.1 3.6 3.4 ROE (%) (77.7) 17.3 2.9 15.1 20.5 Net debt(cash)/equity (%) 48.3 7.2 125.5 97.8 91.8
Note 1: ORD/ADR=1.00. Note 2: Ranbaxy Laboratories Limited is an integrated international pharmaceuticals company. The Company is engaged in the marketing, production and distribution of pharmaceuticals products.

Thursday, 06 February 2014
Asian Daily
- 20 of 35 -
Indonesia
Indonesia Economics ------------------------------------------------------------------------------------------ 4Q13 GDP: Stronger, not weaker Robert Prior-Wandesforde / Research Analyst / 65 6212 3707 / [email protected]
● GDP growth surprisingly strengthened in 4Q 2013, registering a 5.7% increase, up from 5.6% in the previous quarter and significantly above the consensus projection of 5.3%.
● While private consumption, government consumption and investment growth all softened year-on-year, this more than made up for a big increase in the contribution from net exports.
● We very much doubt the economy has bottomed and expect the downturn to resume form in the current quarter. Export growth will be hit by the government's recent ban on unprocessed mineral ore, while the lagged effects of the central bank's 175 bp of rate rises and ongoing weakness in key commodity prices/demand should mean that domestic demand growth slows further.
● We doubt the GDP release will have any major implications for the central bank which is focusing much more on trade position and inflation. The next big release will be the January external trade data which, unfortunately, is likely to bring much less cheer.
Figure 1: Consumption growth to follow investment growth lower… eventually
2.5
3.0
3.5
4.0
4.5
5.0
5.5
6.0
6.5
-2
0
2
4
6
8
10
12
14
16
18
03 04 05 06 07 08 09 10 11 12 13
Gross fixed capital formation (LHS)
Private consumption (RHS)
Source: Company data, Credit Suisse estimates
Bottoming?
Rather than slowing, as we and the consensus had anticipated, GDP growth in Indonesia actually strengthened modestly in the fourth quarter. By Indonesian standards, the consensus projection of 5.3% against the 5.7% outcome represents an unusually big miss, potentially casting doubt on the whole slowdown story. The key question is: is the headline number an aberration in a moderating trend or has the economy really bottomed?
Negative fundamentals
Our review of the fundamentals suggests the former is the more likely hypothesis. Demand for and prices of key commodities, not least coal, remain under pressure, while we very much doubt that the full effects of the 44% hike in subsidised fuel prices and the 175 bp of policy rate increases last year have been felt. Bank Indonesia only started to raise rates in mid-2013 and statistical analysis suggests that it normally takes at least 9-12 months for the impact to be felt. A big thanks to net exports
Looking at the breakdown of the 4Q release, the big surprise in it was the strength of exports (7.4% YoY) relative to imports (0.6%). As we argued in our note following the release of the December trade
numbers earlier this week, the risk is that mining companies have brought forward exports in anticipation of the ban on export of unprocessed minerals, which went into partial effect on 12 January. Although the government eventually watered down the ban, officials from the main mining companies have been quoted as saying that confusion surrounding the government's regulatory regime and tax policy led them to stop exporting altogether in January. Not only does this bode badly for the January external trade balance but likely means that export growth slows in the first quarter.
Consumption and investment growth slowed
The other main components of GDP, although stronger than we anticipated, were not hugely out of line—private consumption growth softening modestly to 5.3% from 5.5% in 3Q, investment to 4.4% versus 4.5%, and government consumption to 6.5% from 8.8%. For the record, it looks to us as though it was an unusually large (negative) statistical discrepancy as the components do not add up to the reported 5.7% YoY GDP growth rate.
Private consumption growth to soften from 2Q 2014
Our modelling work suggests that while investment growth is likely to bottom in 1Q 2014, private consumption growth will start to slow meaningfully from the second quarter, eventually falling close to 4% for the reasons mentioned earlier. In our 2014 average consumer spending growth forecast of 4.6%, we have built in a first quarter bounce, reflecting the "normal" pre-election pattern (see Assessing the potential election boost to consumer spending).
Sticking to our guns
The 4Q number obviously establishes a firmer base to GDP going into 2014 than we thought likely. While this means the risks to this year's growth forecast are on the upside, we are content to stick with the 5.0% projection. If we are going to be right, then the first sign will come with a poor January trade release.

Thursday, 06 February 2014
Asian Daily
- 21 of 35 -
Indonesia Retail Sector --------------------------------------------------- Maintain UNDERWEIGHT New report: Retail regulations uncovered Priscilla Tjitra / Research Analyst / 62 21 2553 7906 / [email protected] Ella Nusantoro / Research Analyst / 62 21 255 37917 / [email protected]
● In the past 18 months, the Indonesian government has issued four new regulations impacting modern retailers in general, with the latest one issued in Dec-2013. Click here for the full report
● Four points worth noting from the regulations: (1) minimum 80% use of local materials, (2) limitation on outlets and partnership obligation with SMEs, (3) requirement to operate based on appropriate licence, and (4) maximum 10% private label goods.
● We view that these policies are aimed at endorsing the development of micro, small and medium entrepreneurship as well as promoting domestic products. Although there would be some impact to the retailers, we view that: (1) it is not immediate (plenty of time adjustment given), and (2) in most cases, the government is open to negotiation (committee forum available).
● We see potential impact to MAPI, ACES, ERAA and ECII from the regulation for minimum 80% domestically produced goods as they sell mostly imported products. The companies plan to negotiate for an exception once the regulation committee forum is set up. We also see impact to AMRT, DNET and FAST from the limit on the number of outlets.
Figure 1: Correction in retail stocks after new regulation announcement
20.0
21.0
22.0
23.0
24.0
25.0
26.0
27.0
9/6/2013 10/6/2013 11/6/2013 12/6/2013 1/6/2014 2/6/2014
Agg
rega
te R
etai
l P/E
New retail regulationout in Dec-13
Source: Bloomberg, Credit Suisse estimates
New regulations in place
In the past 18 months, the Indonesian government has issued four
new regulations impacting modern retailers in general (the latest was
issued in Dec-2013). In this report, we attempt to discuss the key
points and the impact of these regulations on retailers.
Key points
Basically, there are four important points worth noting from the recent
regulations: (1) minimum 80% use of local materials, (2) limitation on
outlets and partnership obligation with SMEs, (3) requirement to
operate based on the appropriate licence, and (4) maximum 10%
private label goods.
What’s the purpose?
We view that these government policies are aimed at endorsing the
development of micro, small and medium entrepreneurship as well as
to promote domestic products. The government aims to support
healthy competition between the smaller players and modern retailers.
Although there would be some impact on retailers, we view that: (1) it
is not immediate (plenty of time adjustment given); and (2) in most
cases, the government is open to negotiation (committee forum
available).
Impact on retailers
Under our coverage, we see potential impact to MAPI, ACES, ERAA
and ECII from the regulation on minimum 80% domestically produced
goods as they sell mostly imported products. The companies plan to
negotiate for an exception once the regulation committee forum is set
up by the government. That apart, we see impact to AMRT, DNET
and FAST from the limit on the number of outlets.
Figure 2: Estimated percentage of imported products by retailers (max 20% according to the new regulation)
95%90%
80%
55%50% 50%
10% 10%
0%
10%
20%
30%
40%
50%
60%
70%
80%
90%
100%
% o
f im
porte
d pr
oduc
ts
Source: Company data, Credit Suisse estimates
Figure 3: Modern retailers and the number of stores Ticker Store name Total outlets (as of 2013)
AMRT.JK Alfamart 8,096 (5,730 owned) DNET.JK Indomaret 8,424 (65% owned) LPPF.JK Matahari 125 RALS.JK Ramayana 118 MPPA.JK Hypermart 91 Foodmart 29 Boston 89 MIDI.JK Alfamidi 452* Lawson 84 RANC.JK Ranch Market 11 Farmers' Market 11 MAPI.JK Sogo 13 Seibu 1 Debenhams 3 Galeries Lafayette 1 Food Hall 20 HERO.JK HERO and Giant Supermarket 142* Giant Hypermarket 46 Guardian 151
* As of 2012. Source: Company data

Thursday, 06 February 2014
Asian Daily
- 22 of 35 -
Japan
Mitsubishi Gas Chemical -------------------------------------------------- Maintain OUTPERFORM Write-off at Shanghai polycarbonate plant could reduce ¥4 bn loss EPS: ◄► TP: ◄► Masami Sawato / Research Analyst / 81 3 4550 9729 / [email protected] Maiko Saito / Research Analyst / 81 3 4550 9936 / [email protected]
● The 5 February Nikkei reports that Mitsubishi Gas Chemical (MGC) plans to write off a ¥10-20 bn loss related to a Shanghai factory that makes polycarbonate resin used in applications including electronics/OA, autos, and building materials. According to the article, this will be booked in FY3/14 as an extraordinary loss.
● We regard the write-off as positive for MGC’s profits and share price if it becomes a reality. The factory is operated by Mitsubishi Gas Chemical Engineering Plastics (Shanghai), a joint venture between MGC and Mitsubishi Engineering Plastics. We have been forecasting a FY3/14 operating loss of ¥4 bn for the JV, so the write-off should sharply reduce this. Click here for the full report.
● We expect MGC’s 3Q OP to come in at over 50% of 2H guidance.
● We see good visibility on growth in FY3/15 OP driven by improved performance at the Shanghai polycarbonate resin plant following the write-off and growing demand for BT materials and for smartphone cover glass alternatives. The shares’ recent correction has left them on a FY3/15E P/E of just 7x, the lowest valuation in our chemical sector coverage. MGC remains our top pick for 2014.
Click here for detailed financials
Write-off at Shanghai polycarbonate plant
The 5 February Nikkei reports that Mitsubishi Gas Chemical (MGC) plans to write off a ¥10-20 bn loss related to a Shanghai factory that makes polycarbonate resin used in applications including electronics/OA, autos, and building materials. According to the article, this will be booked in FY3/14 as an extraordinary loss. The supply–demand balance for polycarbonate resin has deteriorated amid a combination of ongoing capacity increases in Asia on the one hand and China’s slowing economy and weak PC shipments on the other. Margins are also under pressure from rising raw material prices.
Could reduce ¥4 bn operating loss
We regard the write-off as positive for MGC’s profits and share price if it becomes a reality. The factory is operated by Mitsubishi Gas Chemical Engineering Plastics (Shanghai), a joint venture between MGC (80%) and Mitsubishi Engineering Plastics (20%) that represents a total investment of ¥30 bn. We have been forecasting a FY3/14 operating loss of ¥4 bn for the JV, so the write-off should sharply reduce this.
Top pick for 2014
We expect MGC’s 3Q OP to come in at over 50% of 2H guidance (¥6 bn). Methanol prices rose to around US$500/t in 3Q from US$399/t in 2Q and are currently around US$540/t. JV Brunei Methanol meanwhile resumed production in early January following a shutdown, and we expect the increased volume and higher prices to support sharp growth in MGC’s equity-method profits from methanol in 2014. Demand for the company’s BT materials for semiconductor packages slowed in 3Q, but we expect sales for all of FY3/14 to be up more than 10% YoY on a contribution from high-end products and the weak JPY. MGC plans to begin shipping BT materials from its Thai plant in early 2014, and we expect growth for use in mid-range applications. All in all, we see good visibility on growth in FY3/15 OP driven by improved performance at the Shanghai polycarbonate resin plant following the write-off and growing demand for BT materials and for smartphone cover glass alternatives. The shares’ recent correction has left them on a FY3/15E P/E of just 7x, the lowest valuation in our chemical sector coverage. MGC remains our top pick for 2014.
(This is an extract from Mitsubishi Gas Chemical report published on 05 February 2014. For details, please see the CS Research & Analytics website.)
Figure 1: Mitsubishi Gas Chemical (4182)—forecasts summary
¥bn YoY (%) ¥bn YoY (%) ¥bn YoY (%) ¥bn YoY (%) ¥ YoY (%)
Consolidated
12/3 A 452.2 0.3 9.1 -61.1 26.1 -28.2 12.3 -35.0 27.3 -34.9
13/3 A 468.0 3.5 11.4 25.8 27.7 5.9 -7.8 NM -17.3 NM
14/3 1H 266.6 14.5 10.0 154.8 21.6 92.0 18.6 128.6 41.1 128.5
14/3 CS E 532.0 13.7 20.0 75.1 39.0 41.0 28.6 NM 63.3 NM
CoE 530.0 13.3 16.0 40.1 34.0 23.0 26.0 NM 57.6 NM
Shikiho 533.0 13.9 17.0 48.8 37.0 33.8 28.5 NM 63.1 NM
IBES E 535.1 14.3 18.0 57.2 - - 27.9 NM 61.8 NM
15/3 CS E 557.0 4.7 28.0 40.0 53.0 35.9 43.0 50.3 95.2 50.3
IBES E 558.2 4.3 23.8 32.6 - - 38.0 36.3 83.3 34.8
16/3 CS E 585.0 5.0 34.0 21.4 59.0 11.3 46.6 8.4 103.2 8.4
IBES E 582.9 4.4 28.4 19.4 - - 41.6 9.4 90.8 9.0
EPSSales Operating profit Recurring profit Net profit
Source: Company data, Credit Suisse estimates
Bbg/RIC 4182 JP / 4182.T Rating (prev. rating) O (O) Shares outstanding (mn) 451.72 Daily trad vol - 6m avg (mn) 2.2 Daily trad val - 6m avg (US$ mn) 17.3 Free float (%) 13.0 Major shareholders
Price (05 Feb 14 , ¥) 644.00 TP (prev. TP ¥) 1,050 (1,050) Est. pot. % chg. to TP 63 52-wk range (¥) 907.0 - 571.0 Mkt cap (¥/US$ bn) 290.9/ 2.9
Performance 1M 3M 12M
Absolute (%) (18.8) (17.5) 5.1 Relative (%) (8.8) (15.7) (18.7)
Year 03/12A 03/13A 03/14E 03/15E 03/16E
Revenue (¥ bn) 452.2 468.0 532.0 557.0 585.0 EBITDA (¥ bn) 36.8 34.4 43.0 56.0 63.0 Net profit (¥ bn) 12.3 (7.8) 28.6 43.0 46.6 EPS (¥) 27 (17) 63 95 103 - Change from prev. EPS (%) n.a. n.a. 0 0 0 - Consensus EPS (¥) n.a. n.a. 61.8 83.3 90.8 EPS growth (%) (34.9) n.m. n.m. 50.3 8.4 P/E (x) 23.6 n.m. 10.2 6.8 6.2 Dividend yield (%) 1.9 1.9 1.9 1.9 1.9 EV/EBITDA (x) 11.3 12.3 9.7 7.4 6.6 P/B (x) 1.0 1.0 0.9 0.8 0.8 ROE (%) 4.4 (2.8) 9.7 13.2 12.8 Net debt(cash)/equity (%) 42.5 44.7 40.2 35.5 31.4
Note 1: MITSUBISHI GAS CHEMICAL COMPANY, INC. is a Japan-based chemical co. operating in five business segments: Natural Gas-related Chemicals, Aromatic-related Chemical, Functional Chemicals, Specialty Chemicals & Others.
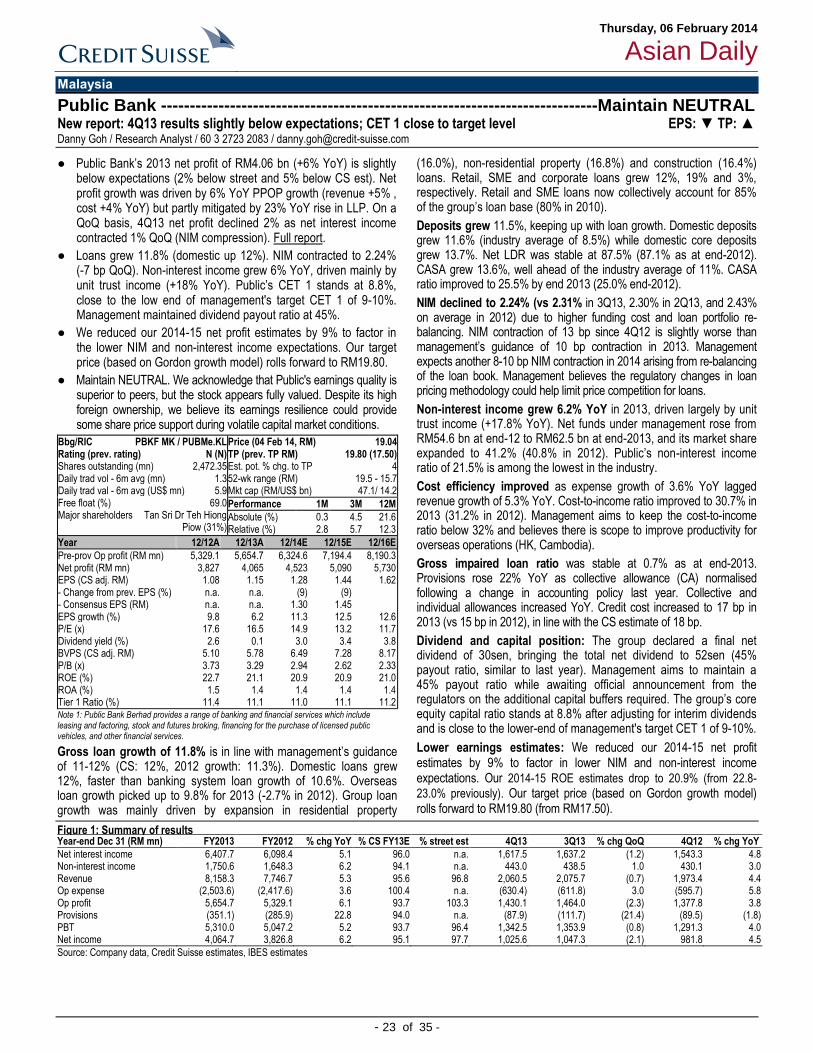
Thursday, 06 February 2014
Asian Daily
- 23 of 35 -
Malaysia
Public Bank ----------------------------------------------------------------------------Maintain NEUTRAL New report: 4Q13 results slightly below expectations; CET 1 close to target level EPS: ▼ TP: ▲ Danny Goh / Research Analyst / 60 3 2723 2083 / [email protected]
● Public Bank’s 2013 net profit of RM4.06 bn (+6% YoY) is slightly below expectations (2% below street and 5% below CS est). Net profit growth was driven by 6% YoY PPOP growth (revenue +5% , cost +4% YoY) but partly mitigated by 23% YoY rise in LLP. On a QoQ basis, 4Q13 net profit declined 2% as net interest income contracted 1% QoQ (NIM compression). Full report.
● Loans grew 11.8% (domestic up 12%). NIM contracted to 2.24% (-7 bp QoQ). Non-interest income grew 6% YoY, driven mainly by unit trust income (+18% YoY). Public’s CET 1 stands at 8.8%, close to the low end of management's target CET 1 of 9-10%. Management maintained dividend payout ratio at 45%.
● We reduced our 2014-15 net profit estimates by 9% to factor in the lower NIM and non-interest income expectations. Our target price (based on Gordon growth model) rolls forward to RM19.80.
● Maintain NEUTRAL. We acknowledge that Public's earnings quality is superior to peers, but the stock appears fully valued. Despite its high foreign ownership, we believe its earnings resilience could provide some share price support during volatile capital market conditions.
Gross loan growth of 11.8% is in line with management’s guidance of 11-12% (CS: 12%, 2012 growth: 11.3%). Domestic loans grew 12%, faster than banking system loan growth of 10.6%. Overseas loan growth picked up to 9.8% for 2013 (-2.7% in 2012). Group loan growth was mainly driven by expansion in residential property
(16.0%), non-residential property (16.8%) and construction (16.4%) loans. Retail, SME and corporate loans grew 12%, 19% and 3%, respectively. Retail and SME loans now collectively account for 85% of the group’s loan base (80% in 2010).
Deposits grew 11.5%, keeping up with loan growth. Domestic deposits grew 11.6% (industry average of 8.5%) while domestic core deposits grew 13.7%. Net LDR was stable at 87.5% (87.1% as at end-2012). CASA grew 13.6%, well ahead of the industry average of 11%. CASA ratio improved to 25.5% by end 2013 (25.0% end-2012).
NIM declined to 2.24% (vs 2.31% in 3Q13, 2.30% in 2Q13, and 2.43% on average in 2012) due to higher funding cost and loan portfolio re-balancing. NIM contraction of 13 bp since 4Q12 is slightly worse than management’s guidance of 10 bp contraction in 2013. Management expects another 8-10 bp NIM contraction in 2014 arising from re-balancing of the loan book. Management believes the regulatory changes in loan pricing methodology could help limit price competition for loans.
Non-interest income grew 6.2% YoY in 2013, driven largely by unit trust income (+17.8% YoY). Net funds under management rose from RM54.6 bn at end-12 to RM62.5 bn at end-2013, and its market share expanded to 41.2% (40.8% in 2012). Public’s non-interest income ratio of 21.5% is among the lowest in the industry.
Cost efficiency improved as expense growth of 3.6% YoY lagged revenue growth of 5.3% YoY. Cost-to-income ratio improved to 30.7% in 2013 (31.2% in 2012). Management aims to keep the cost-to-income ratio below 32% and believes there is scope to improve productivity for overseas operations (HK, Cambodia).
Gross impaired loan ratio was stable at 0.7% as at end-2013. Provisions rose 22% YoY as collective allowance (CA) normalised following a change in accounting policy last year. Collective and individual allowances increased YoY. Credit cost increased to 17 bp in 2013 (vs 15 bp in 2012), in line with the CS estimate of 18 bp.
Dividend and capital position: The group declared a final net dividend of 30sen, bringing the total net dividend to 52sen (45% payout ratio, similar to last year). Management aims to maintain a 45% payout ratio while awaiting official announcement from the regulators on the additional capital buffers required. The group’s core equity capital ratio stands at 8.8% after adjusting for interim dividends and is close to the lower-end of management's target CET 1 of 9-10%.
Lower earnings estimates: We reduced our 2014-15 net profit estimates by 9% to factor in lower NIM and non-interest income expectations. Our 2014-15 ROE estimates drop to 20.9% (from 22.8-
23.0% previously). Our target price (based on Gordon growth model) rolls forward to RM19.80 (from RM17.50).
Figure 1: Summary of results Year-end Dec 31 (RM mn) FY2013 FY2012 % chg YoY % CS FY13E % street est 4Q13 3Q13 % chg QoQ 4Q12 % chg YoY
Net interest income 6,407.7 6,098.4 5.1 96.0 n.a. 1,617.5 1,637.2 (1.2) 1,543.3 4.8 Non-interest income 1,750.6 1,648.3 6.2 94.1 n.a. 443.0 438.5 1.0 430.1 3.0 Revenue 8,158.3 7,746.7 5.3 95.6 96.8 2,060.5 2,075.7 (0.7) 1,973.4 4.4 Op expense (2,503.6) (2,417.6) 3.6 100.4 n.a. (630.4) (611.8) 3.0 (595.7) 5.8 Op profit 5,654.7 5,329.1 6.1 93.7 103.3 1,430.1 1,464.0 (2.3) 1,377.8 3.8 Provisions (351.1) (285.9) 22.8 94.0 n.a. (87.9) (111.7) (21.4) (89.5) (1.8) PBT 5,310.0 5,047.2 5.2 93.7 96.4 1,342.5 1,353.9 (0.8) 1,291.3 4.0 Net income 4,064.7 3,826.8 6.2 95.1 97.7 1,025.6 1,047.3 (2.1) 981.8 4.5
Source: Company data, Credit Suisse estimates, IBES estimates
Bbg/RIC PBKF MK / PUBMe.KL Rating (prev. rating) N (N) Shares outstanding (mn) 2,472.35 Daily trad vol - 6m avg (mn) 1.3 Daily trad val - 6m avg (US$ mn) 5.9 Free float (%) 69.0 Major shareholders Tan Sri Dr Teh Hiong
Piow (31%)
Price (04 Feb 14, RM) 19.04 TP (prev. TP RM) 19.80 (17.50) Est. pot. % chg. to TP 4 52-wk range (RM) 19.5 - 15.7 Mkt cap (RM/US$ bn) 47.1/ 14.2
Performance 1M 3M 12M
Absolute (%) 0.3 4.5 21.6 Relative (%) 2.8 5.7 12.3
Year 12/12A 12/13A 12/14E 12/15E 12/16E
Pre-prov Op profit (RM mn) 5,329.1 5,654.7 6,324.6 7,194.4 8,190.3 Net profit (RM mn) 3,827 4,065 4,523 5,090 5,730 EPS (CS adj. RM) 1.08 1.15 1.28 1.44 1.62 - Change from prev. EPS (%) n.a. n.a. (9) (9) - Consensus EPS (RM) n.a. n.a. 1.30 1.45 EPS growth (%) 9.8 6.2 11.3 12.5 12.6 P/E (x) 17.6 16.5 14.9 13.2 11.7 Dividend yield (%) 2.6 0.1 3.0 3.4 3.8 BVPS (CS adj. RM) 5.10 5.78 6.49 7.28 8.17 P/B (x) 3.73 3.29 2.94 2.62 2.33 ROE (%) 22.7 21.1 20.9 20.9 21.0 ROA (%) 1.5 1.4 1.4 1.4 1.4 Tier 1 Ratio (%) 11.4 11.1 11.0 11.1 11.2
Note 1: Public Bank Berhad provides a range of banking and financial services which include leasing and factoring, stock and futures broking, financing for the purchase of licensed public vehicles, and other financial services.
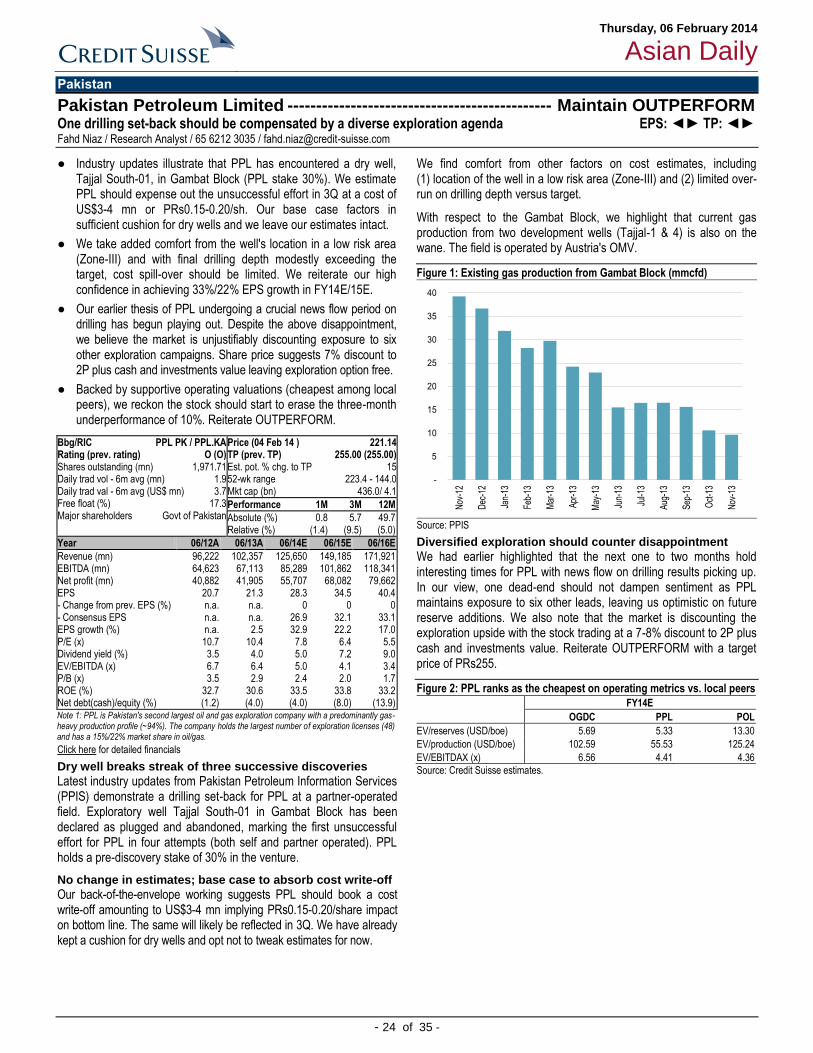
Thursday, 06 February 2014
Asian Daily
- 24 of 35 -
Pakistan
Pakistan Petroleum Limited ---------------------------------------------- Maintain OUTPERFORM One drilling set-back should be compensated by a diverse exploration agenda EPS: ◄► TP: ◄► Fahd Niaz / Research Analyst / 65 6212 3035 / [email protected]
● Industry updates illustrate that PPL has encountered a dry well, Tajjal South-01, in Gambat Block (PPL stake 30%). We estimate PPL should expense out the unsuccessful effort in 3Q at a cost of US$3-4 mn or PRs0.15-0.20/sh. Our base case factors in sufficient cushion for dry wells and we leave our estimates intact.
● We take added comfort from the well's location in a low risk area (Zone-III) and with final drilling depth modestly exceeding the target, cost spill-over should be limited. We reiterate our high confidence in achieving 33%/22% EPS growth in FY14E/15E.
● Our earlier thesis of PPL undergoing a crucial news flow period on drilling has begun playing out. Despite the above disappointment, we believe the market is unjustifiably discounting exposure to six other exploration campaigns. Share price suggests 7% discount to 2P plus cash and investments value leaving exploration option free.
● Backed by supportive operating valuations (cheapest among local peers), we reckon the stock should start to erase the three-month underperformance of 10%. Reiterate OUTPERFORM.
Click here for detailed financials
Dry well breaks streak of three successive discoveries
Latest industry updates from Pakistan Petroleum Information Services (PPIS) demonstrate a drilling set-back for PPL at a partner-operated field. Exploratory well Tajjal South-01 in Gambat Block has been declared as plugged and abandoned, marking the first unsuccessful effort for PPL in four attempts (both self and partner operated). PPL holds a pre-discovery stake of 30% in the venture.
No change in estimates; base case to absorb cost write-off
Our back-of-the-envelope working suggests PPL should book a cost write-off amounting to US$3-4 mn implying PRs0.15-0.20/share impact on bottom line. The same will likely be reflected in 3Q. We have already kept a cushion for dry wells and opt not to tweak estimates for now.
We find comfort from other factors on cost estimates, including (1) location of the well in a low risk area (Zone-III) and (2) limited over-run on drilling depth versus target.
With respect to the Gambat Block, we highlight that current gas production from two development wells (Tajjal-1 & 4) is also on the wane. The field is operated by Austria's OMV.
Figure 1: Existing gas production from Gambat Block (mmcfd)
-
5
10
15
20
25
30
35
40
Nov
-12
Dec
-12
Jan-
13
Feb-
13
Mar
-13
Apr
-13
May
-13
Jun-
13
Jul-1
3
Aug
-13
Sep
-13
Oct
-13
Nov
-13
Source: PPIS
Diversified exploration should counter disappointment
We had earlier highlighted that the next one to two months hold interesting times for PPL with news flow on drilling results picking up. In our view, one dead-end should not dampen sentiment as PPL maintains exposure to six other leads, leaving us optimistic on future reserve additions. We also note that the market is discounting the exploration upside with the stock trading at a 7-8% discount to 2P plus cash and investments value. Reiterate OUTPERFORM with a target price of PRs255.
Figure 2: PPL ranks as the cheapest on operating metrics vs. local peers
FY14E
OGDC PPL POL
EV/reserves (USD/boe) 5.69 5.33 13.30
EV/production (USD/boe) 102.59 55.53 125.24
EV/EBITDAX (x) 6.56 4.41 4.36
Source: Credit Suisse estimates.
Bbg/RIC PPL PK / PPL.KA Rating (prev. rating) O (O) Shares outstanding (mn) 1,971.71 Daily trad vol - 6m avg (mn) 1.9 Daily trad val - 6m avg (US$ mn) 3.7 Free float (%) 17.3 Major shareholders Govt of Pakistan
Price (04 Feb 14 ) 221.14 TP (prev. TP) 255.00 (255.00) Est. pot. % chg. to TP 15 52-wk range 223.4 - 144.0 Mkt cap (bn) 436.0/ 4.1
Performance 1M 3M 12M
Absolute (%) 0.8 5.7 49.7 Relative (%) (1.4) (9.5) (5.0)
Year 06/12A 06/13A 06/14E 06/15E 06/16E
Revenue (mn) 96,222 102,357 125,650 149,185 171,921 EBITDA (mn) 64,623 67,113 85,289 101,862 118,341 Net profit (mn) 40,882 41,905 55,707 68,082 79,662 EPS 20.7 21.3 28.3 34.5 40.4 - Change from prev. EPS (%) n.a. n.a. 0 0 0 - Consensus EPS n.a. n.a. 26.9 32.1 33.1 EPS growth (%) n.a. 2.5 32.9 22.2 17.0 P/E (x) 10.7 10.4 7.8 6.4 5.5 Dividend yield (%) 3.5 4.0 5.0 7.2 9.0 EV/EBITDA (x) 6.7 6.4 5.0 4.1 3.4 P/B (x) 3.5 2.9 2.4 2.0 1.7 ROE (%) 32.7 30.6 33.5 33.8 33.2 Net debt(cash)/equity (%) (1.2) (4.0) (4.0) (8.0) (13.9)
Note 1: PPL is Pakistan's second largest oil and gas exploration company with a predominantly gas-heavy production profile (~94%). The company holds the largest number of exploration licenses (48) and has a 15%/22% market share in oil/gas.
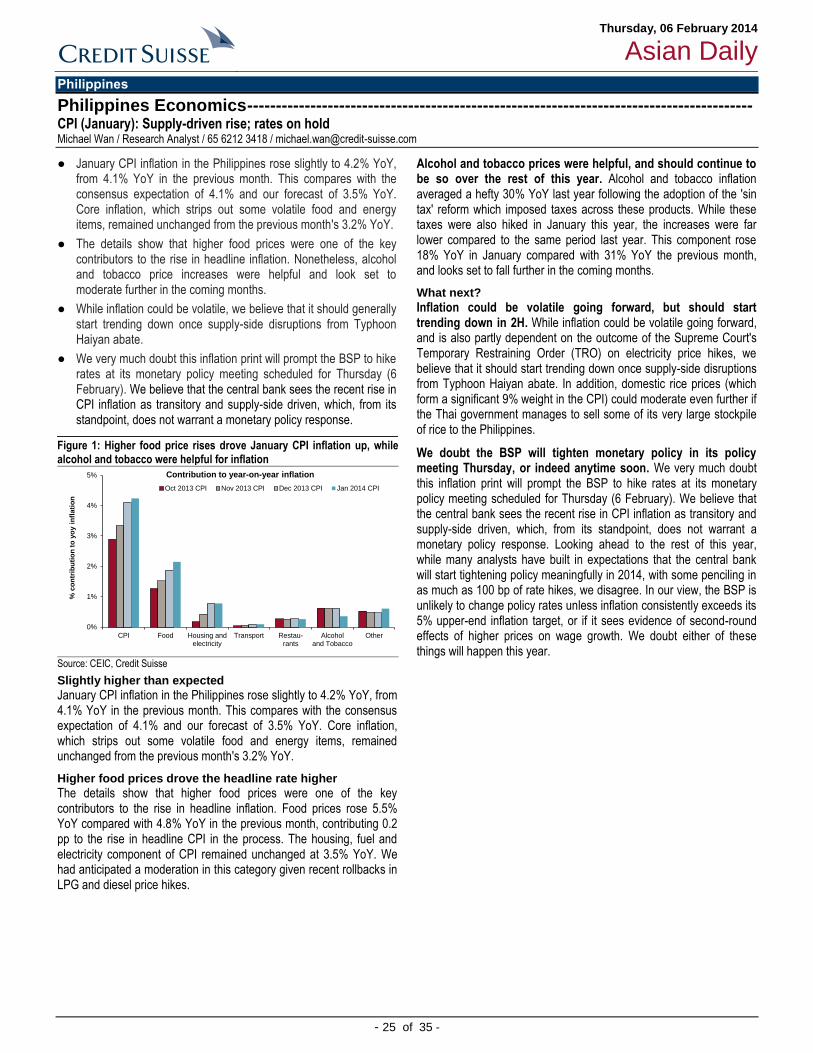
Thursday, 06 February 2014
Asian Daily
- 25 of 35 -
Philippines
Philippines Economics ---------------------------------------------------------------------------------------- CPI (January): Supply-driven rise; rates on hold Michael Wan / Research Analyst / 65 6212 3418 / [email protected]
● January CPI inflation in the Philippines rose slightly to 4.2% YoY, from 4.1% YoY in the previous month. This compares with the consensus expectation of 4.1% and our forecast of 3.5% YoY. Core inflation, which strips out some volatile food and energy items, remained unchanged from the previous month's 3.2% YoY.
● The details show that higher food prices were one of the key contributors to the rise in headline inflation. Nonetheless, alcohol and tobacco price increases were helpful and look set to moderate further in the coming months.
● While inflation could be volatile, we believe that it should generally start trending down once supply-side disruptions from Typhoon Haiyan abate.
● We very much doubt this inflation print will prompt the BSP to hike rates at its monetary policy meeting scheduled for Thursday (6 February). We believe that the central bank sees the recent rise in CPI inflation as transitory and supply-side driven, which, from its standpoint, does not warrant a monetary policy response.
Figure 1: Higher food price rises drove January CPI inflation up, while alcohol and tobacco were helpful for inflation
0%
1%
2%
3%
4%
5%
CPI Food Housing andelectricity
Transport Restau-rants
Alcoholand Tobacco
Other
% c
on
trib
uti
on
to
yo
y i
nfl
ati
on
Contribution to year-on-year inflation
Oct 2013 CPI Nov 2013 CPI Dec 2013 CPI Jan 2014 CPI
Source: CEIC, Credit Suisse
Slightly higher than expected
January CPI inflation in the Philippines rose slightly to 4.2% YoY, from 4.1% YoY in the previous month. This compares with the consensus expectation of 4.1% and our forecast of 3.5% YoY. Core inflation, which strips out some volatile food and energy items, remained unchanged from the previous month's 3.2% YoY.
Higher food prices drove the headline rate higher
The details show that higher food prices were one of the key contributors to the rise in headline inflation. Food prices rose 5.5% YoY compared with 4.8% YoY in the previous month, contributing 0.2 pp to the rise in headline CPI in the process. The housing, fuel and electricity component of CPI remained unchanged at 3.5% YoY. We had anticipated a moderation in this category given recent rollbacks in LPG and diesel price hikes.
Alcohol and tobacco prices were helpful, and should continue to be so over the rest of this year. Alcohol and tobacco inflation averaged a hefty 30% YoY last year following the adoption of the 'sin tax' reform which imposed taxes across these products. While these taxes were also hiked in January this year, the increases were far lower compared to the same period last year. This component rose 18% YoY in January compared with 31% YoY the previous month, and looks set to fall further in the coming months.
What next?
Inflation could be volatile going forward, but should start trending down in 2H. While inflation could be volatile going forward, and is also partly dependent on the outcome of the Supreme Court's Temporary Restraining Order (TRO) on electricity price hikes, we believe that it should start trending down once supply-side disruptions from Typhoon Haiyan abate. In addition, domestic rice prices (which form a significant 9% weight in the CPI) could moderate even further if the Thai government manages to sell some of its very large stockpile of rice to the Philippines.
We doubt the BSP will tighten monetary policy in its policy meeting Thursday, or indeed anytime soon. We very much doubt this inflation print will prompt the BSP to hike rates at its monetary policy meeting scheduled for Thursday (6 February). We believe that the central bank sees the recent rise in CPI inflation as transitory and supply-side driven, which, from its standpoint, does not warrant a monetary policy response. Looking ahead to the rest of this year, while many analysts have built in expectations that the central bank will start tightening policy meaningfully in 2014, with some penciling in as much as 100 bp of rate hikes, we disagree. In our view, the BSP is unlikely to change policy rates unless inflation consistently exceeds its 5% upper-end inflation target, or if it sees evidence of second-round effects of higher prices on wage growth. We doubt either of these things will happen this year.
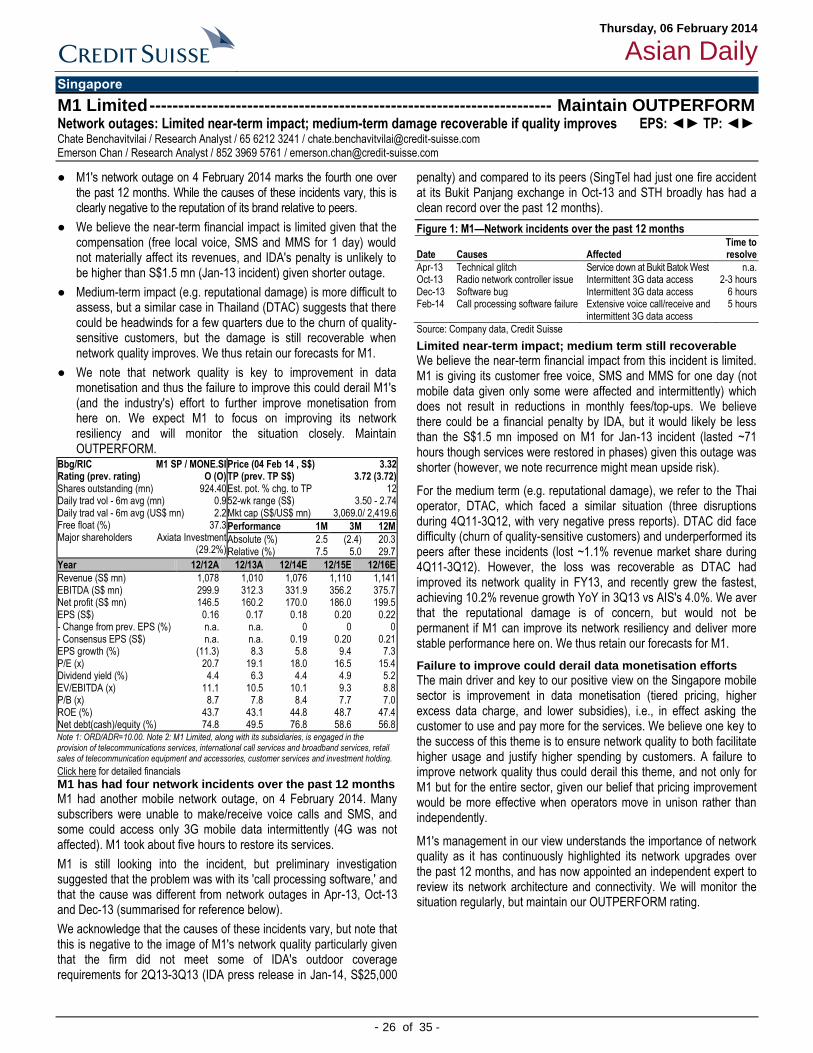
Thursday, 06 February 2014
Asian Daily
- 26 of 35 -
Singapore
M1 Limited ---------------------------------------------------------------------- Maintain OUTPERFORM Network outages: Limited near-term impact; medium-term damage recoverable if quality improves EPS: ◄► TP: ◄► Chate Benchavitvilai / Research Analyst / 65 6212 3241 / [email protected] Emerson Chan / Research Analyst / 852 3969 5761 / [email protected]
● M1's network outage on 4 February 2014 marks the fourth one over the past 12 months. While the causes of these incidents vary, this is clearly negative to the reputation of its brand relative to peers.
● We believe the near-term financial impact is limited given that the compensation (free local voice, SMS and MMS for 1 day) would not materially affect its revenues, and IDA's penalty is unlikely to be higher than S$1.5 mn (Jan-13 incident) given shorter outage.
● Medium-term impact (e.g. reputational damage) is more difficult to assess, but a similar case in Thailand (DTAC) suggests that there could be headwinds for a few quarters due to the churn of quality-sensitive customers, but the damage is still recoverable when network quality improves. We thus retain our forecasts for M1.
● We note that network quality is key to improvement in data monetisation and thus the failure to improve this could derail M1's (and the industry's) effort to further improve monetisation from here on. We expect M1 to focus on improving its network resiliency and will monitor the situation closely. Maintain OUTPERFORM.
Click here for detailed financials
M1 has had four network incidents over the past 12 months
M1 had another mobile network outage, on 4 February 2014. Many subscribers were unable to make/receive voice calls and SMS, and some could access only 3G mobile data intermittently (4G was not affected). M1 took about five hours to restore its services.
M1 is still looking into the incident, but preliminary investigation suggested that the problem was with its 'call processing software,' and that the cause was different from network outages in Apr-13, Oct-13 and Dec-13 (summarised for reference below).
We acknowledge that the causes of these incidents vary, but note that this is negative to the image of M1's network quality particularly given that the firm did not meet some of IDA's outdoor coverage requirements for 2Q13-3Q13 (IDA press release in Jan-14, S$25,000
penalty) and compared to its peers (SingTel had just one fire accident at its Bukit Panjang exchange in Oct-13 and STH broadly has had a clean record over the past 12 months).
Figure 1: M1—Network incidents over the past 12 months Time to Date Causes Affected resolve
Apr-13 Technical glitch Service down at Bukit Batok West n.a. Oct-13 Radio network controller issue Intermittent 3G data access 2-3 hours Dec-13 Software bug Intermittent 3G data access 6 hours Feb-14 Call processing software failure Extensive voice call/receive and
intermittent 3G data access 5 hours
Source: Company data, Credit Suisse
Limited near-term impact; medium term still recoverable
We believe the near-term financial impact from this incident is limited. M1 is giving its customer free voice, SMS and MMS for one day (not mobile data given only some were affected and intermittently) which does not result in reductions in monthly fees/top-ups. We believe there could be a financial penalty by IDA, but it would likely be less than the S$1.5 mn imposed on M1 for Jan-13 incident (lasted ~71 hours though services were restored in phases) given this outage was shorter (however, we note recurrence might mean upside risk).
For the medium term (e.g. reputational damage), we refer to the Thai operator, DTAC, which faced a similar situation (three disruptions during 4Q11-3Q12, with very negative press reports). DTAC did face difficulty (churn of quality-sensitive customers) and underperformed its peers after these incidents (lost ~1.1% revenue market share during 4Q11-3Q12). However, the loss was recoverable as DTAC had improved its network quality in FY13, and recently grew the fastest, achieving 10.2% revenue growth YoY in 3Q13 vs AIS's 4.0%. We aver that the reputational damage is of concern, but would not be permanent if M1 can improve its network resiliency and deliver more stable performance here on. We thus retain our forecasts for M1.
Failure to improve could derail data monetisation efforts
The main driver and key to our positive view on the Singapore mobile sector is improvement in data monetisation (tiered pricing, higher excess data charge, and lower subsidies), i.e., in effect asking the customer to use and pay more for the services. We believe one key to the success of this theme is to ensure network quality to both facilitate higher usage and justify higher spending by customers. A failure to improve network quality thus could derail this theme, and not only for M1 but for the entire sector, given our belief that pricing improvement would be more effective when operators move in unison rather than independently.
M1's management in our view understands the importance of network quality as it has continuously highlighted its network upgrades over the past 12 months, and has now appointed an independent expert to review its network architecture and connectivity. We will monitor the situation regularly, but maintain our OUTPERFORM rating.
Bbg/RIC M1 SP / MONE.SI Rating (prev. rating) O (O) Shares outstanding (mn) 924.40 Daily trad vol - 6m avg (mn) 0.9 Daily trad val - 6m avg (US$ mn) 2.2 Free float (%) 37.3 Major shareholders Axiata Investment
(29.2%)
Price (04 Feb 14 , S$) 3.32 TP (prev. TP S$) 3.72 (3.72) Est. pot. % chg. to TP 12 52-wk range (S$) 3.50 - 2.74 Mkt cap (S$/US$ mn) 3,069.0/ 2,419.6
Performance 1M 3M 12M
Absolute (%) 2.5 (2.4) 20.3 Relative (%) 7.5 5.0 29.7
Year 12/12A 12/13A 12/14E 12/15E 12/16E
Revenue (S$ mn) 1,078 1,010 1,076 1,110 1,141 EBITDA (S$ mn) 299.9 312.3 331.9 356.2 375.7 Net profit (S$ mn) 146.5 160.2 170.0 186.0 199.5 EPS (S$) 0.16 0.17 0.18 0.20 0.22 - Change from prev. EPS (%) n.a. n.a. 0 0 0 - Consensus EPS (S$) n.a. n.a. 0.19 0.20 0.21 EPS growth (%) (11.3) 8.3 5.8 9.4 7.3 P/E (x) 20.7 19.1 18.0 16.5 15.4 Dividend yield (%) 4.4 6.3 4.4 4.9 5.2 EV/EBITDA (x) 11.1 10.5 10.1 9.3 8.8 P/B (x) 8.7 7.8 8.4 7.7 7.0 ROE (%) 43.7 43.1 44.8 48.7 47.4 Net debt(cash)/equity (%) 74.8 49.5 76.8 58.6 56.8
Note 1: ORD/ADR=10.00. Note 2: M1 Limited, along with its subsidiaries, is engaged in the provision of telecommunications services, international call services and broadband services, retail sales of telecommunication equipment and accessories, customer services and investment holding.
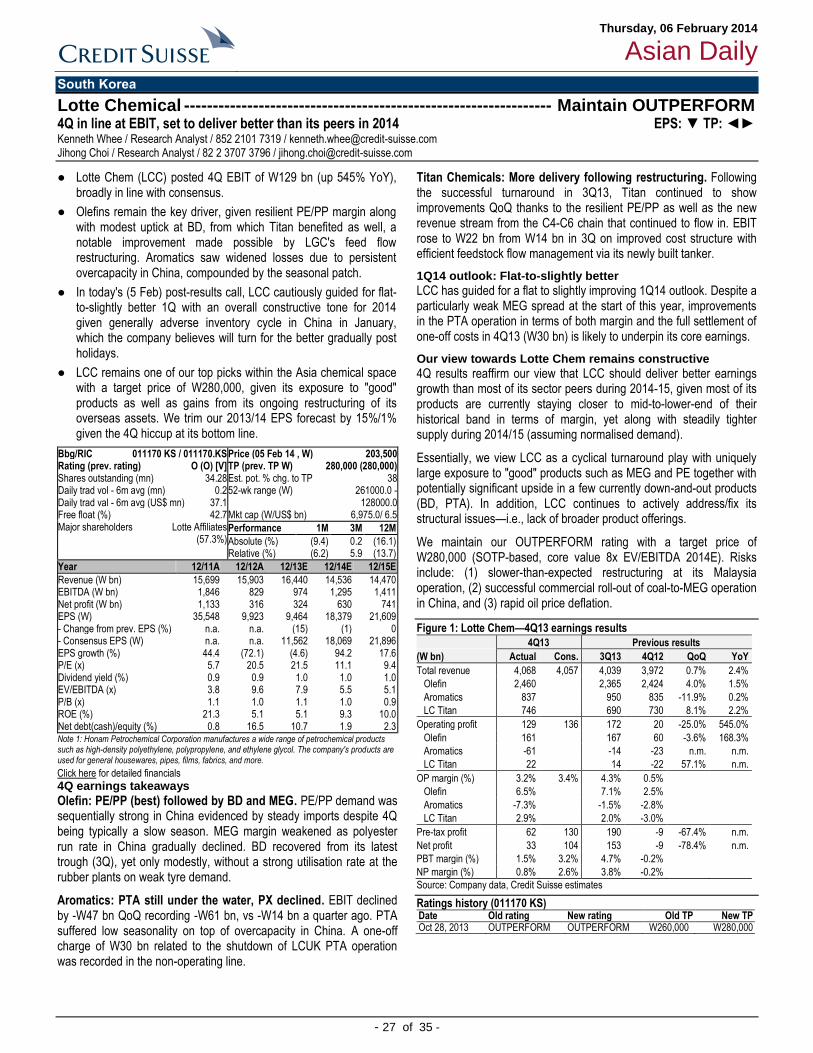
Thursday, 06 February 2014
Asian Daily
- 27 of 35 -
South Korea
Lotte Chemical ---------------------------------------------------------------- Maintain OUTPERFORM 4Q in line at EBIT, set to deliver better than its peers in 2014 EPS: ▼ TP: ◄► Kenneth Whee / Research Analyst / 852 2101 7319 / [email protected] Jihong Choi / Research Analyst / 82 2 3707 3796 / [email protected]
● Lotte Chem (LCC) posted 4Q EBIT of W129 bn (up 545% YoY), broadly in line with consensus.
● Olefins remain the key driver, given resilient PE/PP margin along with modest uptick at BD, from which Titan benefited as well, a notable improvement made possible by LGC's feed flow restructuring. Aromatics saw widened losses due to persistent overcapacity in China, compounded by the seasonal patch.
● In today's (5 Feb) post-results call, LCC cautiously guided for flat-to-slightly better 1Q with an overall constructive tone for 2014 given generally adverse inventory cycle in China in January, which the company believes will turn for the better gradually post holidays.
● LCC remains one of our top picks within the Asia chemical space with a target price of W280,000, given its exposure to "good" products as well as gains from its ongoing restructuring of its overseas assets. We trim our 2013/14 EPS forecast by 15%/1% given the 4Q hiccup at its bottom line.
Click here for detailed financials
4Q earnings takeaways
Olefin: PE/PP (best) followed by BD and MEG. PE/PP demand was sequentially strong in China evidenced by steady imports despite 4Q being typically a slow season. MEG margin weakened as polyester run rate in China gradually declined. BD recovered from its latest trough (3Q), yet only modestly, without a strong utilisation rate at the rubber plants on weak tyre demand.
Aromatics: PTA still under the water, PX declined. EBIT declined by -W47 bn QoQ recording -W61 bn, vs -W14 bn a quarter ago. PTA suffered low seasonality on top of overcapacity in China. A one-off charge of W30 bn related to the shutdown of LCUK PTA operation was recorded in the non-operating line.
Titan Chemicals: More delivery following restructuring. Following the successful turnaround in 3Q13, Titan continued to show improvements QoQ thanks to the resilient PE/PP as well as the new revenue stream from the C4-C6 chain that continued to flow in. EBIT rose to W22 bn from W14 bn in 3Q on improved cost structure with efficient feedstock flow management via its newly built tanker.
1Q14 outlook: Flat-to-slightly better
LCC has guided for a flat to slightly improving 1Q14 outlook. Despite a particularly weak MEG spread at the start of this year, improvements in the PTA operation in terms of both margin and the full settlement of one-off costs in 4Q13 (W30 bn) is likely to underpin its core earnings.
Our view towards Lotte Chem remains constructive
4Q results reaffirm our view that LCC should deliver better earnings growth than most of its sector peers during 2014-15, given most of its products are currently staying closer to mid-to-lower-end of their historical band in terms of margin, yet along with steadily tighter supply during 2014/15 (assuming normalised demand).
Essentially, we view LCC as a cyclical turnaround play with uniquely large exposure to "good" products such as MEG and PE together with potentially significant upside in a few currently down-and-out products (BD, PTA). In addition, LCC continues to actively address/fix its structural issues—i.e., lack of broader product offerings.
We maintain our OUTPERFORM rating with a target price of W280,000 (SOTP-based, core value 8x EV/EBITDA 2014E). Risks include: (1) slower-than-expected restructuring at its Malaysia operation, (2) successful commercial roll-out of coal-to-MEG operation in China, and (3) rapid oil price deflation.
Figure 1: Lotte Chem—4Q13 earnings results
4Q13 Previous results
(W bn) Actual Cons. 3Q13 4Q12 QoQ YoY
Total revenue 4,068 4,057 4,039 3,972 0.7% 2.4%
Olefin 2,460 2,365 2,424 4.0% 1.5%
Aromatics 837 950 835 -11.9% 0.2%
LC Titan 746 690 730 8.1% 2.2%
Operating profit 129 136 172 20 -25.0% 545.0%
Olefin 161 167 60 -3.6% 168.3%
Aromatics -61 -14 -23 n.m. n.m.
LC Titan 22 14 -22 57.1% n.m.
OP margin (%) 3.2% 3.4% 4.3% 0.5%
Olefin 6.5% 7.1% 2.5%
Aromatics -7.3% -1.5% -2.8%
LC Titan 2.9% 2.0% -3.0%
Pre-tax profit 62 130 190 -9 -67.4% n.m.
Net profit 33 104 153 -9 -78.4% n.m.
PBT margin (%) 1.5% 3.2% 4.7% -0.2%
NP margin (%) 0.8% 2.6% 3.8% -0.2%
Source: Company data, Credit Suisse estimates
Ratings history (011170 KS) Date Old rating New rating Old TP New TP Oct 28, 2013 OUTPERFORM OUTPERFORM W260,000 W280,000
Bbg/RIC 011170 KS / 011170.KS Rating (prev. rating) O (O) [V] Shares outstanding (mn) 34.28 Daily trad vol - 6m avg (mn) 0.2 Daily trad val - 6m avg (US$ mn) 37.1 Free float (%) 42.7 Major shareholders Lotte Affiliates
(57.3%)
Price (05 Feb 14 , W) 203,500 TP (prev. TP W) 280,000 (280,000) Est. pot. % chg. to TP 38 52-wk range (W) 261000.0 -
128000.0 Mkt cap (W/US$ bn) 6,975.0/ 6.5
Performance 1M 3M 12M
Absolute (%) (9.4) 0.2 (16.1) Relative (%) (6.2) 5.9 (13.7)
Year 12/11A 12/12A 12/13E 12/14E 12/15E
Revenue (W bn) 15,699 15,903 16,440 14,536 14,470 EBITDA (W bn) 1,846 829 974 1,295 1,411 Net profit (W bn) 1,133 316 324 630 741 EPS (W) 35,548 9,923 9,464 18,379 21,609 - Change from prev. EPS (%) n.a. n.a. (15) (1) 0 - Consensus EPS (W) n.a. n.a. 11,562 18,069 21,896 EPS growth (%) 44.4 (72.1) (4.6) 94.2 17.6 P/E (x) 5.7 20.5 21.5 11.1 9.4 Dividend yield (%) 0.9 0.9 1.0 1.0 1.0 EV/EBITDA (x) 3.8 9.6 7.9 5.5 5.1 P/B (x) 1.1 1.0 1.1 1.0 0.9 ROE (%) 21.3 5.1 5.1 9.3 10.0 Net debt(cash)/equity (%) 0.8 16.5 10.7 1.9 2.3
Note 1: Honam Petrochemical Corporation manufactures a wide range of petrochemical products such as high-density polyethylene, polypropylene, and ethylene glycol. The company's products are used for general housewares, pipes, films, fabrics, and more.
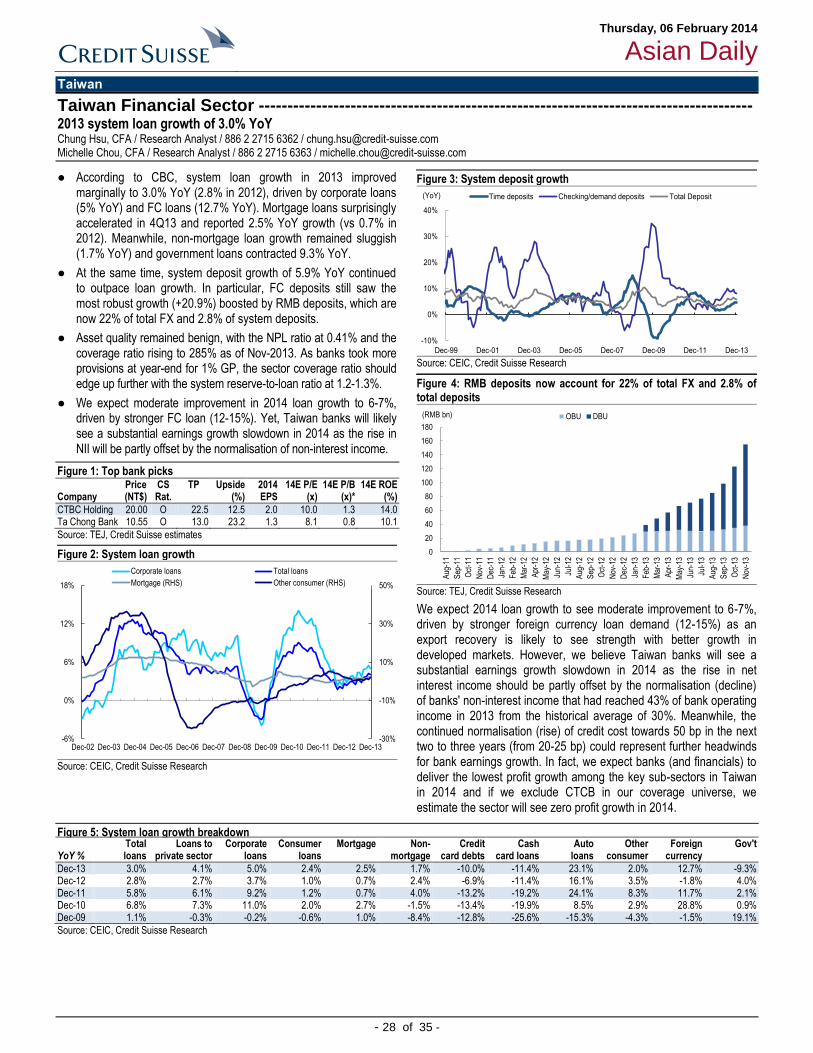
Thursday, 06 February 2014
Asian Daily
- 28 of 35 -
Taiwan
Taiwan Financial Sector -------------------------------------------------------------------------------------- 2013 system loan growth of 3.0% YoY Chung Hsu, CFA / Research Analyst / 886 2 2715 6362 / [email protected] Michelle Chou, CFA / Research Analyst / 886 2 2715 6363 / [email protected]
● According to CBC, system loan growth in 2013 improved marginally to 3.0% YoY (2.8% in 2012), driven by corporate loans (5% YoY) and FC loans (12.7% YoY). Mortgage loans surprisingly accelerated in 4Q13 and reported 2.5% YoY growth (vs 0.7% in 2012). Meanwhile, non-mortgage loan growth remained sluggish (1.7% YoY) and government loans contracted 9.3% YoY.
● At the same time, system deposit growth of 5.9% YoY continued to outpace loan growth. In particular, FC deposits still saw the most robust growth (+20.9%) boosted by RMB deposits, which are now 22% of total FX and 2.8% of system deposits.
● Asset quality remained benign, with the NPL ratio at 0.41% and the coverage ratio rising to 285% as of Nov-2013. As banks took more provisions at year-end for 1% GP, the sector coverage ratio should edge up further with the system reserve-to-loan ratio at 1.2-1.3%.
● We expect moderate improvement in 2014 loan growth to 6-7%, driven by stronger FC loan (12-15%). Yet, Taiwan banks will likely see a substantial earnings growth slowdown in 2014 as the rise in NII will be partly offset by the normalisation of non-interest income.
Figure 1: Top bank picks Price CS TP Upside 2014 14E P/E 14E P/B 14E ROE Company (NT$) Rat. (%) EPS (x) (x)* (%)
CTBC Holding 20.00 O 22.5 12.5 2.0 10.0 1.3 14.0 Ta Chong Bank 10.55 O 13.0 23.2 1.3 8.1 0.8 10.1
Source: TEJ, Credit Suisse estimates
Figure 2: System loan growth
-30%
-10%
10%
30%
50%
-6%
0%
6%
12%
18%
Dec-02 Dec-03 Dec-04 Dec-05 Dec-06 Dec-07 Dec-08 Dec-09 Dec-10 Dec-11 Dec-12 Dec-13
Corporate loans Total loans
Mortgage (RHS) Other consumer (RHS)
Source: CEIC, Credit Suisse Research
Figure 3: System deposit growth
-10%
0%
10%
20%
30%
40%
Dec-99 Dec-01 Dec-03 Dec-05 Dec-07 Dec-09 Dec-11 Dec-13
(YoY) Time deposits Checking/demand deposits Total Deposit
Source: CEIC, Credit Suisse Research
Figure 4: RMB deposits now account for 22% of total FX and 2.8% of total deposits
0
20
40
60
80
100
120
140
160
180
Aug
-11
Sep
-11
Oct
-11
Nov
-11
Dec
-11
Jan-
12
Feb
-12
Mar
-12
Apr
-12
May
-12
Jun-
12
Jul-1
2
Aug
-12
Sep
-12
Oct
-12
Nov
-12
Dec
-12
Jan-
13
Feb
-13
Mar
-13
Apr
-13
May
-13
Jun-
13
Jul-1
3
Aug
-13
Sep
-13
Oct
-13
Nov
-13
OBU DBU(RMB bn)
Source: TEJ, Credit Suisse Research
We expect 2014 loan growth to see moderate improvement to 6-7%, driven by stronger foreign currency loan demand (12-15%) as an export recovery is likely to see strength with better growth in developed markets. However, we believe Taiwan banks will see a substantial earnings growth slowdown in 2014 as the rise in net interest income should be partly offset by the normalisation (decline) of banks' non-interest income that had reached 43% of bank operating income in 2013 from the historical average of 30%. Meanwhile, the continued normalisation (rise) of credit cost towards 50 bp in the next two to three years (from 20-25 bp) could represent further headwinds for bank earnings growth. In fact, we expect banks (and financials) to deliver the lowest profit growth among the key sub-sectors in Taiwan in 2014 and if we exclude CTCB in our coverage universe, we estimate the sector will see zero profit growth in 2014.
Figure 5: System loan growth breakdown Total Loans to Corporate Consumer Mortgage Non- Credit Cash Auto Other Foreign Gov't YoY % loans private sector loans loans mortgage card debts card loans loans consumer currency
Dec-13 3.0% 4.1% 5.0% 2.4% 2.5% 1.7% -10.0% -11.4% 23.1% 2.0% 12.7% -9.3% Dec-12 2.8% 2.7% 3.7% 1.0% 0.7% 2.4% -6.9% -11.4% 16.1% 3.5% -1.8% 4.0% Dec-11 5.8% 6.1% 9.2% 1.2% 0.7% 4.0% -13.2% -19.2% 24.1% 8.3% 11.7% 2.1% Dec-10 6.8% 7.3% 11.0% 2.0% 2.7% -1.5% -13.4% -19.9% 8.5% 2.9% 28.8% 0.9% Dec-09 1.1% -0.3% -0.2% -0.6% 1.0% -8.4% -12.8% -25.6% -15.3% -4.3% -1.5% 19.1%
Source: CEIC, Credit Suisse Research
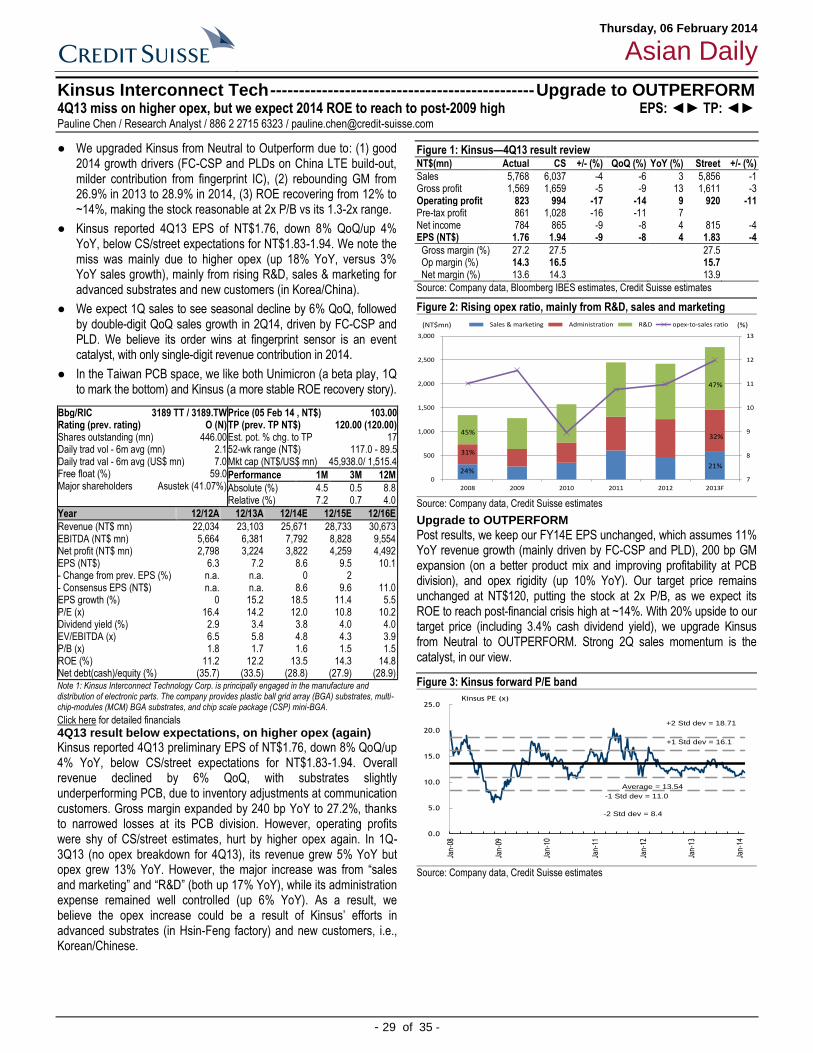
Thursday, 06 February 2014
Asian Daily
- 29 of 35 -
Kinsus Interconnect Tech ---------------------------------------------- Upgrade to OUTPERFORM 4Q13 miss on higher opex, but we expect 2014 ROE to reach to post-2009 high EPS: ◄► TP: ◄► Pauline Chen / Research Analyst / 886 2 2715 6323 / [email protected]
● We upgraded Kinsus from Neutral to Outperform due to: (1) good 2014 growth drivers (FC-CSP and PLDs on China LTE build-out, milder contribution from fingerprint IC), (2) rebounding GM from 26.9% in 2013 to 28.9% in 2014, (3) ROE recovering from 12% to ~14%, making the stock reasonable at 2x P/B vs its 1.3-2x range.
● Kinsus reported 4Q13 EPS of NT$1.76, down 8% QoQ/up 4% YoY, below CS/street expectations for NT$1.83-1.94. We note the miss was mainly due to higher opex (up 18% YoY, versus 3% YoY sales growth), mainly from rising R&D, sales & marketing for advanced substrates and new customers (in Korea/China).
● We expect 1Q sales to see seasonal decline by 6% QoQ, followed by double-digit QoQ sales growth in 2Q14, driven by FC-CSP and PLD. We believe its order wins at fingerprint sensor is an event catalyst, with only single-digit revenue contribution in 2014.
● In the Taiwan PCB space, we like both Unimicron (a beta play, 1Q to mark the bottom) and Kinsus (a more stable ROE recovery story).
Click here for detailed financials
4Q13 result below expectations, on higher opex (again)
Kinsus reported 4Q13 preliminary EPS of NT$1.76, down 8% QoQ/up 4% YoY, below CS/street expectations for NT$1.83-1.94. Overall revenue declined by 6% QoQ, with substrates slightly underperforming PCB, due to inventory adjustments at communication customers. Gross margin expanded by 240 bp YoY to 27.2%, thanks to narrowed losses at its PCB division. However, operating profits were shy of CS/street estimates, hurt by higher opex again. In 1Q-3Q13 (no opex breakdown for 4Q13), its revenue grew 5% YoY but opex grew 13% YoY. However, the major increase was from “sales and marketing” and “R&D” (both up 17% YoY), while its administration expense remained well controlled (up 6% YoY). As a result, we believe the opex increase could be a result of Kinsus’ efforts in advanced substrates (in Hsin-Feng factory) and new customers, i.e., Korean/Chinese.
Figure 1: Kinsus—4Q13 result review NT$(mn) Actual CS +/- (%) QoQ (%) YoY (%) Street +/- (%)
Sales 5,768 6,037 -4 -6 3 5,856 -1 Gross profit 1,569 1,659 -5 -9 13 1,611 -3 Operating profit 823 994 -17 -14 9 920 -11 Pre-tax profit 861 1,028 -16 -11 7 Net income 784 865 -9 -8 4 815 -4 EPS (NT$) 1.76 1.94 -9 -8 4 1.83 -4
Gross margin (%) 27.2 27.5 27.5 Op margin (%) 14.3 16.5 15.7 Net margin (%) 13.6 14.3 13.9
Source: Company data, Bloomberg IBES estimates, Credit Suisse estimates
Figure 2: Rising opex ratio, mainly from R&D, sales and marketing
7
8
9
10
11
12
13
0
500
1,000
1,500
2,000
2,500
3,000
2008 2009 2010 2011 2012 2013F
Sales & marketing Administration R&D opex-to-sales ratio
47%
32%
21%
45%
24%
31%
(%)(NT$mn)
Source: Company data, Credit Suisse estimates
Upgrade to OUTPERFORM
Post results, we keep our FY14E EPS unchanged, which assumes 11% YoY revenue growth (mainly driven by FC-CSP and PLD), 200 bp GM expansion (on a better product mix and improving profitability at PCB division), and opex rigidity (up 10% YoY). Our target price remains unchanged at NT$120, putting the stock at 2x P/B, as we expect its ROE to reach post-financial crisis high at ~14%. With 20% upside to our target price (including 3.4% cash dividend yield), we upgrade Kinsus from Neutral to OUTPERFORM. Strong 2Q sales momentum is the catalyst, in our view.
Figure 3: Kinsus forward P/E band
0.0
5.0
10.0
15.0
20.0
25.0
Jan-
08
Jan-
09
Jan-
10
Jan-
11
Jan-
12
Jan-
13
Jan-
14
Average = 13.54
+1 Std dev = 16.1
-1 Std dev = 11.0
+2 Std dev = 18.71
-2 Std dev = 8.4
Kinsus PE (x)
Source: Company data, Credit Suisse estimates
Bbg/RIC 3189 TT / 3189.TW Rating (prev. rating) O (N) Shares outstanding (mn) 446.00 Daily trad vol - 6m avg (mn) 2.1 Daily trad val - 6m avg (US$ mn) 7.0 Free float (%) 59.0 Major shareholders Asustek (41.07%)
Price (05 Feb 14 , NT$) 103.00 TP (prev. TP NT$) 120.00 (120.00) Est. pot. % chg. to TP 17 52-wk range (NT$) 117.0 - 89.5 Mkt cap (NT$/US$ mn) 45,938.0/ 1,515.4
Performance 1M 3M 12M
Absolute (%) 4.5 0.5 8.8 Relative (%) 7.2 0.7 4.0
Year 12/12A 12/13A 12/14E 12/15E 12/16E
Revenue (NT$ mn) 22,034 23,103 25,671 28,733 30,673 EBITDA (NT$ mn) 5,664 6,381 7,792 8,828 9,554 Net profit (NT$ mn) 2,798 3,224 3,822 4,259 4,492 EPS (NT$) 6.3 7.2 8.6 9.5 10.1 - Change from prev. EPS (%) n.a. n.a. 0 2 - Consensus EPS (NT$) n.a. n.a. 8.6 9.6 11.0 EPS growth (%) 0 15.2 18.5 11.4 5.5 P/E (x) 16.4 14.2 12.0 10.8 10.2 Dividend yield (%) 2.9 3.4 3.8 4.0 4.0 EV/EBITDA (x) 6.5 5.8 4.8 4.3 3.9 P/B (x) 1.8 1.7 1.6 1.5 1.5 ROE (%) 11.2 12.2 13.5 14.3 14.8 Net debt(cash)/equity (%) (35.7) (33.5) (28.8) (27.9) (28.9)
Note 1: Kinsus Interconnect Technology Corp. is principally engaged in the manufacture and distribution of electronic parts. The company provides plastic ball grid array (BGA) substrates, multi-chip-modules (MCM) BGA substrates, and chip scale package (CSP) mini-BGA.
Thursday, 06 February 2014
Asian Daily
- 30 of 35 -
Recently Published Research
Date Title Author(s) Tel. E-mail
Thu 6 Feb AIA Group - 4Q13 regional trends: Underlying momentum robust; valuation appeal returning
Arjan van Veen Frances Feng
852 2101 7508 852 2101 6693
[email protected] [email protected]
Thu 6 Feb India Banks Sector - Private banks 3Q14 review: Earnings slowed, impaired assets rise
Ashish Gupta Prashant Kumar Kush Shah
91 22 6777 3895 91 22 6777 3942 91 22 6777 3862
[email protected] [email protected]@credit-suisse.com
Wed 5 Feb Asia Pacific Equity Strategy - Foreign investor capitulation: Any signs?
Sakthi Siva Kin Nang Chik
65 6212 3027 852 2101 7482
[email protected] [email protected]
Wed 5 Feb Indonesia Retail Sector - Retail regulations uncovered Priscilla Tjitra Ella Nusantoro
62 21 2553 7906 62 21 255 37917
[email protected] [email protected]
Wed 5 Feb Public Bank - 4Q13 results slightly below expectations; CET 1 close to target level
Danny Goh 60 3 2723 2083 [email protected]
Tue 4 Feb China Market Strategy - What stocks to buy after the recent correction?
Vincent Chan Trina Chen
852 2101 6568 852 2101 7031
[email protected] [email protected]
Tue 4 Feb Singapore Land Transport Sector - Board the right bus Leonard Huo Timothy Ross
65 6212 3062 65 6212 3337
[email protected] [email protected]
Tue 4 Feb TRUEGIF - Necessary infrastructure for data traffic growth Colin McCallum Jennifer Gao
852 2101 6514 852 2101 6479
Thursday, 06 February 2014
Asian Daily
- 31 of 35 -
Companies mentioned
Ace Hardware Indonesia (ACES.JK, Rp715) Adaro Energy (ADRO.JK, Rp895, OUTPERFORM[V], TP Rp1,450) Adidas AG (ADSGn.F, €82.77) Agile Property (3383.HK, HK$6.95) Agricultural Bank of China (1288.HK, HK$3.29) AIA Group (1299.HK, HK$35.65, OUTPERFORM, TP HK$44.0) AirAsia (AIRA.KL, RM2.21) AirAsia X (AIRX.KL, RM0.98) Alliance Financial Group BHD (ALFG.KL, RM4.55) Anhui Conch Cement Co. Ltd. (0914.HK, HK$28.75) Aristocrat Leisure (ALL.AX, A$4.4, UNDERPERFORM, TP A$4.5) Astro Malaysia Holdings Bhd (ASTR.KL, RM2.98, OUTPERFORM, TP RM3.5) Axiata Group Berhad (AXIA.KL, RM6.55, OUTPERFORM, TP RM7.75) Axis Bank Limited (AXBK.BO, Rs1123.25) Bank of Baroda (BOB.BO, Rs542.35) Bank of China Ltd (3988.HK, HK$3.21) Bank of Communications (3328.HK, HK$4.91) Bank of India (BOI.BO, Rs184.5) BAT Malaysia (BATO.KL, RM60.08) Berjaya Sports Toto (BSTB.KL, RM4.0) Bharat Heavy Electricals (BHEL.BO, Rs160.6, UNDERPERFORM[V], TP Rs99.0) BOC Hong Kong (Holdings) (2388.HK, HK$23.1) Bumi Armada (BUAB.KL, RM4.0)
Bursa Malaysia (BMYS.KL, RM7.67) CapitaLand (CATL.SI, S$2.76) CapitaMalls Asia (CMAL.SI, S$1.69) CapitaMalls Malaysia Trust (CAMA.KL, RM1.39) China Citic Bank (0998.HK, HK$3.64) China Construction Bank (0939.HK, HK$5.2) China Mengniu Dairy (2319.HK, HK$35.45) China Merchants Bank - H (3968.HK, HK$13.34) China Minsheng Banking Corporation (1988.HK, HK$7.45) China Mobile Limited (0941.HK, HK$72.0) China Oilfield Services Ltd (2883.HK, HK$20.05) China Resources Land Ltd (1109.HK, HK$17.74) Chongqing Rural Commercial Bank (3618.HK, HK$3.24) Chow Tai Fook Jewellery Group Limited (1929.HK, HK$11.58) CIMB Group Holdings Bhd (CIMB.KL, RM6.85) City Developments (CTDM.SI, S$8.68) CTBC Holding (2891.TW, NT$20.0) Cummins India (CUMM.BO, Rs444.95, NEUTRAL, TP Rs377.0) DBS Group (DBSM.SI, S$16.3) DiGi.Com (DSOM.KL, RM4.68, OUTPERFORM, TP RM5.95) Downer EDI (DOW.AX, A$4.8, NEUTRAL, TP A$5.2) Electronic City (ECII.JK, Rp2,490) Erajaya Swasembada (ERAA.JK, Rp1,285) Fast Food ID (FAST.JK, Rp2,425) Fast Retailing (9983.T, ¥35,960) Felda Global Ventures (FGVH.KL, RM4.27) First Resources Ltd (FRLD.SI, S$1.96, OUTPERFORM, TP S$2.8) Galaxy Entertainment Group (0027.HK, HK$66.25) Gamuda (GAMU.KL, RM4.36) Genting Berhad (GENT.KL, RM10.0) Genting Malaysia Bhd (GENM.KL, RM4.21) Genting Plantations Bhd (GENP.KL, RM10.06) Genting Singapore (GENS.SI, S$1.34) Golden Agri-Resources (GAGR.SI, S$0.5, OUTPERFORM, TP S$0.66) Greentown China Holdings Ltd (3900.HK, HK$10.46) Guangzhou R&F Properties Co Ltd (2777.HK, HK$10.04) HDFC Bank (HDBK.BO, Rs630.55) Henderson Land Dev (0012.HK, HK$40.85) Hero Supermarket (HERO.JK, Rp2,700) Hong Leong Bank (HLBB.KL, RM14.08) Hong Leong Financial Group Berhad (HLCB.KL, RM15.2) Housing Development Finance Corp (HDFC.BO, Rs788.3) ICICI Bank (ICBK.BO, Rs970.1) IDFC Ltd (IDFC.BO, Rs91.5) IGB REIT (IGRE.KL, RM1.2) IHH Healthcare (IHHH.KL, RM3.52) IHH Healthcare (IHHH.SI, S$1.36) IJM Corporation Berhad (IJMS.KL, RM5.73, OUTPERFORM, TP RM7.28) IJM Land Berhad (IJML.KL, RM2.42) Indian Overseas Bank (IOBK.BO, Rs45.7) Indoritel Makmur (DNET.JK, Rp795) IndusInd Bank (INBK.BO, Rs387.75) Industrial & Commercial Bank of China (1398.HK, HK$4.66) Industrial Bank (601166.SS, Rmb9.35) ING Vysya Bank (VYSA.BO, Rs523.25) IOI Corporation (IOIB.KL, RM4.15) Jammu and Kashmir Bank (JKBK.BO, Rs1352.2) Keppel Corporation (KPLM.SI, S$10.19) Kinsus Interconnect Tech (3189.TW, NT$103.0, OUTPERFORM, TP NT$120.0) Kotak Mahindra Bank Ltd (KTKM.BO, Rs665.35) KPJ Healthcare Bhd (KPJH.KL, RM3.42) Kuala Lumpur Kepong (KLKK.KL, RM23.02)
Thursday, 06 February 2014
Asian Daily
- 32 of 35 -
KWG Property Holding Limited (1813.HK, HK$3.95) Larsen & Toubro (LART.BO, Rs984.2) Longyuan Power (0916.HK, HK$9.45) Lotte Chemical (011170.KS, W203,500, OUTPERFORM[V], TP W280,000) M1 Limited (MONE.SI, S$3.32, OUTPERFORM, TP S$3.72) Mahindra and Mahindra Financial Services Ltd (MMFS.BO, Rs242.85) Malayan Banking (MBBM.KL, RM9.56) Malaysia Airlines (MASM.KL, RM0.3) Malaysia Airports (MAHB.KL, RM8.15) Malaysia Marine and Heavy Engineering Holdings Bhd (MHEB.KL, RM3.74) Matahari Department Store (LPPF.JK, Rp11,850) Matahari Putra Prima (MPPA.JK, Rp2,035) Maxis Berhad (MXSC.KL, RM6.85, OUTPERFORM, TP RM9.0) Melco Crown Entertainment-ADR (MPEL.OQ, $39.67) MGM China (2282.HK, HK$28.65) Midi Utama ID (MIDI.JK, Rp575) MISC Bhd (MISC.KL, RM5.95) Mitra Adiperkasa (MAPI.JK, Rp5,650) Mitsubishi Gas Chemical (4182.T, ¥644, OUTPERFORM, TP ¥1,050) MMC Corporation Bhd (MMCB.KL, RM2.87) Nike Inc. (NKE.N, $70.51) Noble Group Ltd (NOBG.SI, S$0.94) NTPC Ltd (NTPC.BO, Rs132.55) Oil & Gas Development Company (OGDC.KA, PRs272.79, OUTPERFORM, TP PRs325.0) OMV (OMVV.VI, €31.34, UNDERPERFORM, TP €29.8) OSIM International (OSIL.SI, S$2.35) Oversea-Chinese Banking Corporation (OCBC.SI, S$9.09) Pakistan Oilfields Ltd (PKOL.KA, PRs530.54, NEUTRAL, TP PRs515.0) Pakistan Petroleum Limited (PPL.KA, PRs221.14, OUTPERFORM, TP PRs255.0) Pavilion REIT (PREI.KL, RM1.27) Petronas Chemicals Group BHD (PCGB.KL, RM6.65) Ping An Bank (000001.SZ, Rmb11.4) POS Malaysia Berhad (PSHL.KL, RM5.54) Public Bank (PUBMe.KL, RM19.04, NEUTRAL, TP RM19.8) Punjab National Bank Ltd (PNBK.BO, Rs565.15) Ramayana Lestari Sentosa (RALS.JK, Rp1,270) Ranbaxy Laboratories Limited (RANB.BO, Rs321.75, NEUTRAL, TP Rs365.0) RHB Capital Berhad (RHBC.KL, RM7.62, OUTPERFORM, TP RM8.8) Sands China (1928.HK, HK$59.05) Sembcorp Marine Ltd. (SCMN.SI, S$3.94) Shenzhou International (2313.HK, HK$25.25, OUTPERFORM, TP HK$35.0) Shriram Transport Finance Co Ltd (SRTR.BO, Rs613.0) Sihuan Pharmaceutical Holdings Group Ltd. (0460.HK, HK$8.27) Sime Darby (SIME.KL, RM8.87, OUTPERFORM, TP RM10.7) Singapore Airlines (SIAL.SI, S$9.48) Singapore Telecom (STEL.SI, S$3.46, NEUTRAL, TP S$3.9) SJM (0880.HK, HK$22.4) SP Setia (SETI.KL, RM2.8) StarHub Ltd (STAR.SI, S$4.18, NEUTRAL, TP S$4.4) State Bank Of India (SBI.BO, Rs1521.1) Sumber Alfaria (AMRT.JK, Rp443) Sunway REIT (SUNW.KL, RM1.28) Supra Boga (RANC.JK, Rp635) Ta Ann Holdings Bhd (TAAN.KL, RM4.08) Ta Chong Bank Ltd (2847.TW, NT$10.55) Tambang Batubara Bukit Asam (PTBA.JK, Rp9,125, OUTPERFORM, TP Rp13,600) Tan Chong Motor Holding (TNCS.KL, RM5.7) Tata Steel Ltd (TISC.BO, Rs359.25) Telekom Malaysia (TLMM.KL, RM5.49) Tenaga Nasional (TENA.KL, RM11.28, OUTPERFORM, TP RM12.4) Tencent Holdings (0700.HK, HK$510.5) Total Access Communication PCL (DTAC.BK, Bt94.75, OUTPERFORM, TP Bt140.0) Tsui Wah Holding (1314.HK, HK$4.59) UEM Sunrise Bhd (UMSB.KL, RM2.05) Unimicron Technology Corp (3037.TW, NT$22.3) Union Bank of India (UNBK.BO, Rs106.1) Westports Holdings Berhad (WPHB.KL, RM2.51) Wilmar International Ltd (WLIL.SI, S$3.1) Wynn Macau (1128.HK, HK$32.0) Yes Bank Ltd (YESB.BO, Rs303.45) YTL Corp (YTLS.KL, RM1.52) YTL Power (YTLP.KL, RM1.86)

Thursday, 06 February 2014
Asian Daily
- 33 of 35 -
Disclosure Appendix
Important Global Disclosures
The analysts identified in this report each certify, with respect to the companies or securities that the individual analyzes, that (1) the views expressed in this report accurately reflect his or her personal views about all of the subject companies and securities and (2) no part of his or her compensation was, is or will be directly or indirectly related to the specific recommendations or views expressed in this report.
The analyst(s) responsible for preparing this research report received Compensation that is based upon various factors including Credit Suisse's total revenues, a portion of which are generated by Credit Suisse's investment banking activities
As of December 10, 2012 Analysts’ stock rating are defined as follows:
Outperform (O) : The stock’s total return is expected to outperform the relevant benchmark*over the next 12 months.
Neutral (N) : The stock’s total return is expected to be in line with the relevant benchmark* over the next 12 months.
Underperform (U) : The stock’s total return is expected to underperform the relevant benchmark* over the next 12 months.
*Relevant benchmark by region: As of 10th December 2012, Japanese ratings are based on a stock’s total return relative to the analyst's coverage universe which consists of all companies covered by the analyst within the relevant sector, with Outperforms representing the most attractiv e, Neutrals the less attractive, and Underperforms the least attractive investment opportunities. As of 2nd October 2012, U.S. and Canadian as well as European ratings are base d on a stock’s total return relative to the analyst's coverage universe which consists of all companies covered by the analyst within the relevant sector, with Outperforms representing the most attractive, Neutrals the less attractive, and Underperforms the least attractive investment opportunities. For Latin American and non-Japan Asia stocks, ratings are based on a stock’s total return relative to the average total return of the relevant country or regional benchmark; Australia, New Zealand are, and prio r to 2nd October 2012 U.S. and Canadian ratings were based on (1) a stock’s absolute total return potential to its current share pr ice and (2) the relative attractiveness of a stock’s total return potential within an analyst’s coverage universe. For Australian and New Zealand stocks, 12 -month rolling yield is incorporated in the absolute total return calculation and a 15% and a 7.5% threshold replace the 10-15% level in the Outperform and Underperform stock rating definitions, respectively. The 15% and 7.5% thresholds replace the +10-15% and -10-15% levels in the Neutral stock rating definition, respectively. Prior to 10th December 2012, Japanese ratings were based on a stock’s total return relative to the average total return of the relevant country or regional benchmark.
Restricted (R) : In certain circumstances, Credit Suisse policy and/or applicable law and regulations preclude certain types of communications, including an investment recommendation, during the course of Credit Suisse's engagement in an investment banking transaction and in certain other circumstances.
Volatility Indicator [V] : A stock is defined as volatile if the stock price has moved up or down by 20% or more in a month in at least 8 of the past 24 months or the analyst expects significant volatility going forward.
Analysts’ sector weightings are distinct from analysts’ stock ratings and are based on the analyst’s expectations for the fundamentals and/or valuation of the sector* relative to the group’s historic fundamentals and/or valuation:
Overweight : The analyst’s expectation for the sector’s fundamentals and/or valuation is favorable over the next 12 months.
Market Weight : The analyst’s expectation for the sector’s fundamentals and/or valuation is neutral over the next 12 months.
Underweight : The analyst’s expectation for the sector’s fundamentals and/or valuation is cautious over the next 12 months.
*An analyst’s coverage sector consists of all companies covered by the analyst within the relevant sector. An analyst may cover multiple sectors.
Credit Suisse's distribution of stock ratings (and banking clients) is:
Global Ratings Distribution
Rating Versus universe (%) Of which banking clients (%)
Outperform/Buy* 43% (54% banking clients)
Neutral/Hold* 41% (48% banking clients)
Underperform/Sell* 14% (43% banking clients)
Restricted 2%
*For purposes of the NYSE and NASD ratings distribution disclosure requirements, our stock ratings of Outperform, Neutral, and Underperform most closely correspond to Buy, Hold, and Sell, respectively; however, the meanings are not the same, as our stock ratings are determined on a relati ve basis. (Please refer to definitions above.) An investor's decision to buy or sell a security should be based on investment objectives, current holdings, and other indivi dual factors.
Credit Suisse’s policy is to update research reports as it deems appropriate, based on developments with the subject company, the sector or the market that may have a material impact on the research views or opinions stated herein.
Credit Suisse's policy is only to publish investment research that is impartial, independent, clear, fair and not misleading. For more detail please refer to Credit Suisse's Policies for Managing Conflicts of Interest in connection with Investment Research: http://www.csfb.com/research and analytics/disclaimer/managing_conflicts_disclaimer.html
Credit Suisse does not provide any tax advice. Any statement herein regarding any US federal tax is not intended or written to be used, and cannot be used, by any taxpayer for the purposes of avoiding any penalties.
Thursday, 06 February 2014
Asian Daily
- 34 of 35 -
Please refer to the firm's disclosure website at https://rave.credit-suisse.com/disclosures for the definitions of abbreviations typically used in the target price method and risk sections.
Important Regional Disclosures
Singapore recipients should contact Credit Suisse AG, Singapore Branch for any matters arising from this research report.
Restrictions on certain Canadian securities are indicated by the following abbreviations: NVS--Non-Voting shares; RVS--Restricted Voting Shares; SVS--Subordinate Voting Shares.
Individuals receiving this report from a Canadian investment dealer that is not affiliated with Credit Suisse should be advised that this report may not contain regulatory disclosures the non-affiliated Canadian investment dealer would be required to make if this were its own report.
For Credit Suisse Securities (Canada), Inc.'s policies and procedures regarding the dissemination of equity research, please visit http://www.csfb.com/legal_terms/canada_research_policy.shtml.
As of the date of this report, Credit Suisse acts as a market maker or liquidity provider in the equities securities that are the subject of this report.
Principal is not guaranteed in the case of equities because equity prices are variable.
Commission is the commission rate or the amount agreed with a customer when setting up an account or at any time after that.
Taiwanese Disclosures: This research report is for reference only. Investors should carefully consider their own investment risk. Investment results are the responsibility of the individual investor. Reports may not be reprinted without permission of CS. Reports written by Taiwan based analysts on non-Taiwan listed companies are not considered recommendations to buy or sell securities under Taiwan Stock Exchange Operational Regulations Governing Securities Firms Recommending Trades in Securities to Customers.
Please find the full reports, including disclosure information, on Credit Suisse's Research and Analytics Website (http://www.researchandanalytics.com)
Important MSCI Disclosures
The MSCI sourced information is the exclusive property of Morgan Stanley Capital International Inc. (MSCI). Without prior written permission of MSCI, this information and any other MSCI intellectual property may not be reproduced, re-disseminated or used to create and financial products, including any indices. This information is provided on an "as is" basis. The user assumes the entire risk of any use made of this information. MSCI, its affiliates and any third party involved in, or related to, computing or compiling the information hereby expressly disclaim all warranties of originality, accuracy, completeness, merchantability or fitness for a particular purpose with respect to any of this information. Without limiting any of the foregoing, in no event shall MSCI, any of its affiliates or any third party involved in, or related to, computing or compiling the information have any liability for any damages of any kind. MSCI, Morgan Stanley Capital International and the MSCI indexes are services marks of MSCI and its affiliates.
The Global Industry Classification Standard (GICS) was developed by and is the exclusive property of Morgan Stanley Capital International Inc. and Standard & Poor’s. GICS is a service mark of MSCI and S&P and has been licensed for use by Credit Suisse.
Important Credit Suisse HOLT Disclosures
With respect to the analysis in this report based on the Credit Suisse HOLT methodology, Credit Suisse certifies that (1) the views expressed in this report accurately reflect the Credit Suisse HOLT methodology and (2) no part of the Firm’s compensation was, is, or will be directly related to the specific views disclosed in this report.
The Credit Suisse HOLT methodology does not assign ratings to a security. It is an analytical tool that involves use of a set of proprietary quantitative algorithms and warranted value calculations, collectively called the Credit Suisse HOLT valuation model, that are consistently applied to all the companies included in its database. Third-party data (including consensus earnings estimates) are systematically translated into a number of default algorithms available in the Credit Suisse HOLT valuation model. The source financial statement, pricing, and earnings data provided by outside data vendors are subject to quality control and may also be adjusted to more closely measure the underlying economics of firm performance. The adjustments provide consistency when analyzing a single company across time, or analyzing multiple companies across industries or national borders. The default scenario that is produced by the Credit Suisse HOLT valuation model establishes the baseline valuation for a security, and a user then may adjust the default variables to produce alternative scenarios, any of which could occur.
Additional information about the Credit Suisse HOLT methodology is available on request.
The Credit Suisse HOLT methodology does not assign a price target to a security. The default scenario that is produced by the Credit Suisse HOLT valuation model establishes a warranted price for a security, and as the third-party data are updated, the warranted price may also change. The default variable may also be adjusted to produce alternative warranted prices, any of which could occur.
CFROI®, HOLT, HOLTfolio, ValueSearch, AggreGator, Signal Flag and “Powered by HOLT” are trademarks or service marks or registered trademarks or registered service marks of Credit Suisse or its affiliates in the United States and other countries. HOLT is a corporate performance and valuation advisory service of Credit Suisse.
For Credit Suisse disclosure information on other companies mentioned in this report, please visit the website at https://rave.credit-suisse.com/disclosures or call +1 (877) 291-2683.
Thursday, 06 February 2014
Asian Daily
- 35 of 35 -
References in this report to Credit Suisse include all of the subsidiaries and affiliates of Credit Suisse operating under its investment banking division. For more information on our structure, please use the following link: https://www.credit-suisse.com/who_we_are/en/This report may contain material that is not directed to, or intended for distribution to or use by, any person or entity who is a citizen or resident of or located in any locality, state, country or other jurisdiction where such distribution, publication, availability or use would be contrary to law or regulation or which would subject Credit Suisse AG or its affiliates ("CS") to any registration or licensing requirement within such jurisdiction. All material presented in this report, unless specifically indicated otherwise, is under copyright to CS. None of the material, nor its content, nor any copy of it, may be altered in any way, transmitted to, copied or distributed to any other party, without the prior express written permission of CS. All trademarks, service marks and logos used in this report are trademarks or service marks or registered trademarks or service marks of CS or its affiliates. The information, tools and material presented in this report are provided to you for information purposes only and are not to be used or considered as an offer or the solicitation of an offer to sell or to buy or subscribe for securities or other financial instruments. CS may not have taken any steps to ensure that the securities referred to in this report are suitable for any particular investor. CS will not treat recipients of this report as its customers by virtue of their receiving this report. The investments and services contained or referred to in this report may not be suitable for you and it is recommended that you consult an independent investment advisor if you are in doubt about such investments or investment services. Nothing in this report constitutes investment, legal, accounting or tax advice, or a representation that any investment or strategy is suitable or appropriate to your individual circumstances, or otherwise constitutes a personal recommendation to you. CS does not advise on the tax consequences of investments and you are advised to contact an independent tax adviser. Please note in particular that the bases and levels of taxation may change. Information and opinions presented in this report have been obtained or derived from sources believed by CS to be reliable, but CS makes no representation as to their accuracy or completeness. CS accepts no liability for loss arising from the use of the material presented in this report, except that this exclusion of liability does not apply to the extent that such liability arises under specific statutes or regulations applicable to CS. This report is not to be relied upon in substitution for the exercise of independent judgment. CS may have issued, and may in the future issue, other communications that are inconsistent with, and reach different conclusions from, the information presented in this report. Those communications reflect the different assumptions, views and analytical methods of the analysts who prepared them and CS is under no obligation to ensure that such other communications are brought to the attention of any recipient of this report. CS may, to the extent permitted by law, participate or invest in financing transactions with the issuer(s) of the securities referred to in this report, perform services for or solicit business from such issuers, and/or have a position or holding, or other material interest, or effect transactions, in such securities or options thereon, or other investments related thereto. In addition, it may make markets in the securities mentioned in the material presented in this report. CS may have, within the last three years, served as manager or co-manager of a public offering of securities for, or currently may make a primary market in issues of, any or all of the entities mentioned in this report or may be providing, or have provided within the previous 12 months, significant advice or investment services in relation to the investment concerned or a related investment. Additional information is, subject to duties of confidentiality, available on request. Some investments referred to in this report will be offered solely by a single entity and in the case of some investments solely by CS, or an associate of CS or CS may be the only market maker in such investments. Past performance should not be taken as an indication or guarantee of future performance, and no representation or warranty, express or implied, is made regarding future performance. Information, opinions and estimates contained in this report reflect a judgment at its original date of publication by CS and are subject to change without notice. The price, value of and income from any of the securities or financial instruments mentioned in this report can fall as well as rise. The value of securities and financial instruments is subject to exchange rate fluctuation that may have a positive or adverse effect on the price or income of such securities or financial instruments. Investors in securities such as ADR's, the values of which are influenced by currency volatility, effectively assume this risk. Structured securities are complex instruments, typically involve a high degree of risk and are intended for sale only to sophisticated investors who are capable of understanding and assuming the risks involved. The market value of any structured security may be affected by changes in economic, financial and political factors (including, but not limited to, spot and forward interest and exchange rates), time to maturity, market conditions and volatility, and the credit quality of any issuer or reference issuer. Any investor interested in purchasing a structured product should conduct their own investigation and analysis of the product and consult with their own professional advisers as to the risks involved in making such a purchase. Some investments discussed in this report may have a high level of volatility. High volatility investments may experience sudden and large falls in their value causing losses when that investment is realised. Those losses may equal your original investment. Indeed, in the case of some investments the potential losses may exceed the amount of initial investment and, in such circumstances, you may be required to pay more money to support those losses. Income yields from investments may fluctuate and, in consequence, initial capital paid to make the investment may be used as part of that income yield. Some investments may not be readily realisable and it may be difficult to sell or realise those investments, similarly it may prove difficult for you to obtain reliable information about the value, or risks, to which such an investment is exposed. This report may provide the addresses of, or contain hyperlinks to, websites. Except to the extent to which the report refers to website material of CS, CS has not reviewed any such site and takes no responsibility for the content contained therein. Such address or hyperlink (including addresses or hyperlinks to CS's own website material) is provided solely for your convenience and information and the content of any such website does not in any way form part of this document. Accessing such website or following such link through this report or CS's website shall be at your own risk. This report is issued and distributed in Europe (except Switzerland) by Credit Suisse Securities (Europe) Limited, One Cabot Square, London E14 4QJ, England, which is authorised by the Prudential Regulation Authority and regulated by the Financial Conduct Authority and the Prudential Regulation Authority. This report is being distributed in Germany by Credit Suisse Securities (Europe) Limited Niederlassung Frankfurt am Main regulated by the Bundesanstalt fuer Finanzdienstleistungsaufsicht ("BaFin"). This report is being distributed in the United States and Canada by Credit Suisse Securities (USA) LLC; in Switzerland by Credit Suisse AG; in Brazil by Banco de Investimentos Credit Suisse (Brasil) S.A or its affiliates; in Mexico by Banco Credit Suisse (México), S.A. (transactions related to the securities mentioned in this report will only be effected in compliance with applicable regulation); in Japan by Credit Suisse Securities (Japan) Limited, Financial Instruments Firm, Director-General of Kanto Local Finance Bureau (Kinsho) No. 66, a member of Japan Securities Dealers Association, The Financial Futures Association of Japan, Japan Investment Advisers Association, Type II Financial Instruments Firms Association; elsewhere in Asia/ Pacific by whichever of the following is the appropriately authorised entity in the relevant jurisdiction: Credit Suisse (Hong Kong) Limited, Credit Suisse Equities (Australia) Limited, Credit Suisse Securities (Thailand) Limited, having registered address at 990 Abdulrahim Place, 27 Floor, Unit 2701, Rama IV Road, Silom, Bangrak, Bangkok 10500, Thailand, Tel. +66 2614 6000, Credit Suisse Securities (Malaysia) Sdn Bhd, Credit Suisse AG, Singapore Branch, Credit Suisse Securities (India) Private Limited regulated by the Securities and Exchange Board of India (registration Nos. INB230970637; INF230970637; INB010970631; INF010970631), having registered address at 9th Floor, Ceejay House, Dr.A.B. Road, Worli, Mumbai - 18, India, T- +91-22 6777 3777, Credit Suisse Securities (Europe) Limited, Seoul Branch, Credit Suisse AG, Taipei Securities Branch, PT Credit Suisse Securities Indonesia, Credit Suisse Securities (Philippines ) Inc., and elsewhere in the world by the relevant authorised affiliate of the above. Research on Taiwanese securities produced by Credit Suisse AG, Taipei Securities Branch has been prepared by a registered Senior Business Person. Research provided to residents of Malaysia is authorised by the Head of Research for Credit Suisse Securities (Malaysia) Sdn Bhd, to whom they should direct any queries on +603 2723 2020. This report has been prepared and issued for distribution in Singapore to institutional investors, accredited investors and expert investors (each as defined under the Financial Advisers Regulations) only, and is also distributed by Credit Suisse AG, Singapore branch to overseas investors (as defined under the Financial Advisers Regulations). By virtue of your status as an institutional investor, accredited investor, expert investor or overseas investor, Credit Suisse AG, Singapore branch is exempted from complying with certain compliance requirements under the Financial Advisers Act, Chapter 110 of Singapore (the "FAA"), the Financial Advisers Regulations and the relevant Notices and Guidelines issued thereunder, in respect of any financial advisory service which Credit Suisse AG, Singapore branch may provide to you. This research may not conform to Canadian disclosure requirements. In jurisdictions where CS is not already registered or licensed to trade in securities, transactions will only be effected in accordance with applicable securities legislation, which will vary from jurisdiction to jurisdiction and may require that the trade be made in accordance with applicable exemptions from registration or licensing requirements. Non-U.S. customers wishing to effect a transaction should contact a CS entity in their local jurisdiction unless governing law permits otherwise. U.S. customers wishing to effect a transaction should do so only by contacting a representative at Credit Suisse Securities (USA) LLC in the U.S. Please note that this research was originally prepared and issued by CS for distribution to their market professional and institutional investor customers. Recipients who are not market professional or institutional investor customers of CS should seek the advice of their independent financial advisor prior to taking any investment decision based on this report or for any necessary explanation of its contents. This research may relate to investments or services of a person outside of the UK or to other matters which are not authorised by the Prudential Regulation Authority and regulated by the Financial Conduct Authority and the Prudential Regulation Authority or in respect of which the protections of the Prudential Regulation Authority and Financial Conduct Authority for private customers and/or the UK compensation scheme may not be available, and further details as to where this may be the case are available upon request in respect of this report. CS may provide various services to US municipal entities or obligated persons ("municipalities"), including suggesting individual transactions or trades and entering into such transactions. Any services CS provides to municipalities are not viewed as "advice" within the meaning of Section 975 of the Dodd-Frank Wall Street Reform and Consumer Protection Act. CS is providing any such services and related information solely on an arm's length basis and not as an advisor or fiduciary to the municipality. In connection with the provision of the any such services, there is no agreement, direct or indirect, between any municipality (including the officials, management, employees or agents thereof) and CS for CS to provide advice to the municipality. Municipalities should consult with their financial, accounting and legal advisors regarding any such services provided by CS. In addition, CS is not acting for direct or indirect compensation to solicit the municipality on behalf of an unaffiliated broker, dealer, municipal securities dealer, municipal advisor, or investment adviser for the purpose of obtaining or retaining an engagement by the municipality for or in connection with Municipal Financial Products, the issuance of municipal securities, or of an investment adviser to provide investment advisory services to or on behalf of the municipality. If this report is being distributed by a financial institution other than Credit Suisse AG, or its affiliates, that financial institution is solely responsible for distribution. Clients of that institution should contact that institution to effect a transaction in the securities mentioned in this report or require further information. This report does not constitute investment advice by Credit Suisse to the clients of the distributing financial institution, and neither Credit Suisse AG, its affiliates, and their respective officers, directors and employees accept any liability whatsoever for any direct or consequential loss arising from their use of this report or its content. Principal is not guaranteed. Commission is the commission rate or the amount agreed with a customer when setting up an account or at any time after that.
Copyright © 2014 CREDIT SUISSE AG and/or its affiliates. All rights reserved.
Investment principal on bonds can be eroded depending on sale price or market price. In addition, there are bonds on which investment principal can be eroded due to changes in redemption amounts. Care is required when investing in such instruments. When you purchase non-listed Japanese fixed income securities (Japanese government bonds, Japanese municipal bonds, Japanese government guaranteed bonds, Japanese corporate bonds) from CS as a seller, you will be requested to pay the purchase price only.
Related Documents