MILLIMAN RESEARCH REPORT Asia retirement income report May 2017 Prepared by: Wade Matterson Richard Holloway Paul Sinnott Michael Daly Zhikang Chong

Welcome message from author
This document is posted to help you gain knowledge. Please leave a comment to let me know what you think about it! Share it to your friends and learn new things together.
Transcript
MILLIMAN RESEARCH REPORT
Asia retirement income reportMay 2017
Prepared by:
Wade MattersonRichard HollowayPaul SinnottMichael DalyZhikang Chong

MILLIMAN RESEARCH REPORT
Table of Contents
ACRONYMS AND ABBREVIATIONS . . . . . . . . . . . . . . . . . . . . . . . . . . . . . . . . . . . . . . . . . . . . . . . . . . . . . . . . . . 4
OPENING REMARKS . . . . . . . . . . . . . . . . . . . . . . . . . . . . . . . . . . . . . . . . . . . . . . . . . . . . . . . . . . . . . . . . . . . . . . 5
EXECUTIVE SUMMARY . . . . . . . . . . . . . . . . . . . . . . . . . . . . . . . . . . . . . . . . . . . . . . . . . . . . . . . . . . . . . . . . . . . . 6
INTRODUCTION . . . . . . . . . . . . . . . . . . . . . . . . . . . . . . . . . . . . . . . . . . . . . . . . . . . . . . . . . . . . . . . . . . . . . . . . . 10
RETIREMENT IN ASIA . . . . . . . . . . . . . . . . . . . . . . . . . . . . . . . . . . . . . . . . . . . . . . . . . . . . . . . . . . . . . . . . . . . . 12
PRODUCTS & PROPOSITIONS . . . . . . . . . . . . . . . . . . . . . . . . . . . . . . . . . . . . . . . . . . . . . . . . . . . . . . . . . . . . . 18Consumer Needs . . . . . . . . . . . . . . . . . . . . . . . . . . . . . . . . . . . . . . . . . . . . . . . . . . . . . . . . . . . . . . . . . . . . . . . . . . . . . . . 18Consumer Wants . . . . . . . . . . . . . . . . . . . . . . . . . . . . . . . . . . . . . . . . . . . . . . . . . . . . . . . . . . . . . . . . . . . . . . . . . . . . . . . 19Opportunities for Product Manufacturers . . . . . . . . . . . . . . . . . . . . . . . . . . . . . . . . . . . . . . . . . . . . . . . . . . . . . . . . . . 22Case Study: Annuities in the United Kingdom . . . . . . . . . . . . . . . . . . . . . . . . . . . . . . . . . . . . . . . . . . . . . . . . . . . . . . 26Case Study: Variable Annuities in Japan . . . . . . . . . . . . . . . . . . . . . . . . . . . . . . . . . . . . . . . . . . . . . . . . . . . . . . . . . . . 28Case Study: Universal Life in the United States . . . . . . . . . . . . . . . . . . . . . . . . . . . . . . . . . . . . . . . . . . . . . . . . . . . . . 32Case Study: With-Profits in the United Kingdom . . . . . . . . . . . . . . . . . . . . . . . . . . . . . . . . . . . . . . . . . . . . . . . . . . . . 39Case Study: Income Drawdown in Australia . . . . . . . . . . . . . . . . . . . . . . . . . . . . . . . . . . . . . . . . . . . . . . . . . . . . . . . . 42
THE ROLE OF FINANCIAL ADVICE . . . . . . . . . . . . . . . . . . . . . . . . . . . . . . . . . . . . . . . . . . . . . . . . . . . . . . . . . . 45Background . . . . . . . . . . . . . . . . . . . . . . . . . . . . . . . . . . . . . . . . . . . . . . . . . . . . . . . . . . . . . . . . . . . . . . . . . . . . . . . . . . . . 45Barriers to Financial Advice . . . . . . . . . . . . . . . . . . . . . . . . . . . . . . . . . . . . . . . . . . . . . . . . . . . . . . . . . . . . . . . . . . . . . . 46What Can Be Done? . . . . . . . . . . . . . . . . . . . . . . . . . . . . . . . . . . . . . . . . . . . . . . . . . . . . . . . . . . . . . . . . . . . . . . . . . . . . . 47Robo-advice . . . . . . . . . . . . . . . . . . . . . . . . . . . . . . . . . . . . . . . . . . . . . . . . . . . . . . . . . . . . . . . . . . . . . . . . . . . . . . . . . . . . 47Conclusion . . . . . . . . . . . . . . . . . . . . . . . . . . . . . . . . . . . . . . . . . . . . . . . . . . . . . . . . . . . . . . . . . . . . . . . . . . . . . . . . . . . . . 48
OVERVIEW OF NATIONAL RETIREMENT SYSTEMS BY COUNTRY . . . . . . . . . . . . . . . . . . . . . . . . . . . . . . . 49Australia . . . . . . . . . . . . . . . . . . . . . . . . . . . . . . . . . . . . . . . . . . . . . . . . . . . . . . . . . . . . . . . . . . . . . . . . . . . . . . . . . . . . . . . 49China . . . . . . . . . . . . . . . . . . . . . . . . . . . . . . . . . . . . . . . . . . . . . . . . . . . . . . . . . . . . . . . . . . . . . . . . . . . . . . . . . . . . . . . . . 52Hong Kong . . . . . . . . . . . . . . . . . . . . . . . . . . . . . . . . . . . . . . . . . . . . . . . . . . . . . . . . . . . . . . . . . . . . . . . . . . . . . . . . . . . . . 54India . . . . . . . . . . . . . . . . . . . . . . . . . . . . . . . . . . . . . . . . . . . . . . . . . . . . . . . . . . . . . . . . . . . . . . . . . . . . . . . . . . . . . . . . . 59Indonesia . . . . . . . . . . . . . . . . . . . . . . . . . . . . . . . . . . . . . . . . . . . . . . . . . . . . . . . . . . . . . . . . . . . . . . . . . . . . . . . . . . . . . . 62Japan . . . . . . . . . . . . . . . . . . . . . . . . . . . . . . . . . . . . . . . . . . . . . . . . . . . . . . . . . . . . . . . . . . . . . . . . . . . . . . . . . . . . . . . . . 64Malaysia . . . . . . . . . . . . . . . . . . . . . . . . . . . . . . . . . . . . . . . . . . . . . . . . . . . . . . . . . . . . . . . . . . . . . . . . . . . . . . . . . . . . . . . 67Singapore . . . . . . . . . . . . . . . . . . . . . . . . . . . . . . . . . . . . . . . . . . . . . . . . . . . . . . . . . . . . . . . . . . . . . . . . . . . . . . . . . . . . . . 70South Korea . . . . . . . . . . . . . . . . . . . . . . . . . . . . . . . . . . . . . . . . . . . . . . . . . . . . . . . . . . . . . . . . . . . . . . . . . . . . . . . . . . . . 75Taiwan . . . . . . . . . . . . . . . . . . . . . . . . . . . . . . . . . . . . . . . . . . . . . . . . . . . . . . . . . . . . . . . . . . . . . . . . . . . . . . . . . . . . . . . . . 79Thailand . . . . . . . . . . . . . . . . . . . . . . . . . . . . . . . . . . . . . . . . . . . . . . . . . . . . . . . . . . . . . . . . . . . . . . . . . . . . . . . . . . . . . . . 82
WORKS CITED . . . . . . . . . . . . . . . . . . . . . . . . . . . . . . . . . . . . . . . . . . . . . . . . . . . . . . . . . . . . . . . . . . . . . . . . . . 85
ACKNOWLEDGEMENTS . . . . . . . . . . . . . . . . . . . . . . . . . . . . . . . . . . . . . . . . . . . . . . . . . . . . . . . . . . . . . . . . . . 85
MILLIMAN RESEARCH REPORT
Table of FiguresFigure 1: Geographic spread of survey respondents . . . . . . . . . . . . . . . . . . . . . . . . . . . . . . . . . . . . . . . . . . . . . . . . . . . . .6
Figure 2: Life expectancy vs . average age at retirement . . . . . . . . . . . . . . . . . . . . . . . . . . . . . . . . . . . . . . . . . . . . . . . . . 10
Figure 3: Proportion of population in retirement in 2015 by country . . . . . . . . . . . . . . . . . . . . . . . . . . . . . . . . . . . . . . 11
Figure 4: “What are the goals of your country’s retirement system?” . . . . . . . . . . . . . . . . . . . . . . . . . . . . . . . . . . . . . 12
Figure 5: “Are these goals clearly articulated by the government?” . . . . . . . . . . . . . . . . . . . . . . . . . . . . . . . . . . . . . . . 13
Figure 6: “In your opinion, are these goals being met?” . . . . . . . . . . . . . . . . . . . . . . . . . . . . . . . . . . . . . . . . . . . . . . . . . . 14
Figure 7: “Are the retirement income provisions adequate?” . . . . . . . . . . . . . . . . . . . . . . . . . . . . . . . . . . . . . . . . . . . . . 14
Figure 8: Net replacement rates by country . . . . . . . . . . . . . . . . . . . . . . . . . . . . . . . . . . . . . . . . . . . . . . . . . . . . . . . . . . . 15
Figure 9: “Is the retirement system sustainable?” . . . . . . . . . . . . . . . . . . . . . . . . . . . . . . . . . . . . . . . . . . . . . . . . . . . . . . 16
Figure 10: “Why is the system unsustainable?” . . . . . . . . . . . . . . . . . . . . . . . . . . . . . . . . . . . . . . . . . . . . . . . . . . . . . . . . . . 16
Figure 11: “Are there opportunities for private providers?” . . . . . . . . . . . . . . . . . . . . . . . . . . . . . . . . . . . . . . . . . . . . . . . . 17
Figure 12: “Which spending category is likely to increase most during retirement?” . . . . . . . . . . . . . . . . . . . . . . . . . 19
Figure 13: “What are the most important features in a retirement income product for the consumer?” . . . . . . . 20
Figure 14: “Are guaranteed income products (e .g . annuities) successful?” . . . . . . . . . . . . . . . . . . . . . . . . . . . . . . . . . 21
Figure 15: “What needs to be done to increase the uptake of longevity products?” . . . . . . . . . . . . . . . . . . . . . . . . . .22
Figure 16 Risk mapping by product . . . . . . . . . . . . . . . . . . . . . . . . . . . . . . . . . . . . . . . . . . . . . . . . . . . . . . . . . . . . . . . . . . .22
Figure 17: “What products is your company developing for your country’s retirement market?” . . . . . . . . . . . . . .23
Figure 18: “What are the main impediments to your company developing retirement income products?” . . . . . .24
Figure 19: “What can the government do to support private providers to offer retirement income products?” . .25
Figure 20: Annuity sales in the UK by quarter . . . . . . . . . . . . . . . . . . . . . . . . . . . . . . . . . . . . . . . . . . . . . . . . . . . . . . . . . . .27
Figure 21: Variable Annuity - Assets under management . . . . . . . . . . . . . . . . . . . . . . . . . . . . . . . . . . . . . . . . . . . . . . . . .28
Figure 22: Variable Life and Variable Annuity new sales by Fiscal Year . . . . . . . . . . . . . . . . . . . . . . . . . . . . . . . . . . . . . .29
Figure 23: Market Share of UL Product Types . . . . . . . . . . . . . . . . . . . . . . . . . . . . . . . . . . . . . . . . . . . . . . . . . . . . . . . . . . . .32
Figure 24: Average UL Premium Size by Product Type . . . . . . . . . . . . . . . . . . . . . . . . . . . . . . . . . . . . . . . . . . . . . . . . . . . .33
Figure 25: Average UL Face Amount by Product Type . . . . . . . . . . . . . . . . . . . . . . . . . . . . . . . . . . . . . . . . . . . . . . . . . . . . .33
Figure 26: Average IUL Premium Size by Product Type . . . . . . . . . . . . . . . . . . . . . . . . . . . . . . . . . . . . . . . . . . . . . . . . . . . .34
Figure 27: Average IUL Face Amount by Product Type . . . . . . . . . . . . . . . . . . . . . . . . . . . . . . . . . . . . . . . . . . . . . . . . . . . .34
Figure 28: Sales with Living Benefit Riders as a % of Total UL Sales (by Premium) . . . . . . . . . . . . . . . . . . . . . . . . . . .36
Figure 29: Statutory ROI/IRR by UL Product Type . . . . . . . . . . . . . . . . . . . . . . . . . . . . . . . . . . . . . . . . . . . . . . . . . . . . . . . .36
Figure 30: US Individual Life Sales Forecast . . . . . . . . . . . . . . . . . . . . . . . . . . . . . . . . . . . . . . . . . . . . . . . . . . . . . . . . . . . . .37
Figure 31: Anticipated Mix of UL/IUL Business . . . . . . . . . . . . . . . . . . . . . . . . . . . . . . . . . . . . . . . . . . . . . . . . . . . . . . . . . .38
Figure 32: Use of Superannuation in Retirement . . . . . . . . . . . . . . . . . . . . . . . . . . . . . . . . . . . . . . . . . . . . . . . . . . . . . . . . .42
Figure 33: Use of Lump Sum . . . . . . . . . . . . . . . . . . . . . . . . . . . . . . . . . . . . . . . . . . . . . . . . . . . . . . . . . . . . . . . . . . . . . . . . . .43
Figure 34: “What role should financial advice have for delivering appropriate retirement outcomes for the general population?” . . . . . . . . . . . . . . . . . . . . . . . . . . . . . . . . . . . . . . . . . . . . . . . . . . . . . . . .45
Figure 35: “What proportion of consumers currently receives financial advice when developing their retirement plan?” . . . . . . . . . . . . . . . . . . . . . . . . . . . . . . . . . . . . . . . . . . . . . . . . . . . . . . . . . . . .45
Figure 36: “What are the main barriers to delivering financial advice more broadly?” . . . . . . . . . . . . . . . . . . . . . . . . 46
Figure 37: “What needs to be done to increase the quality of financial advice in your market?” . . . . . . . . . . . . . . . .47
Figure 38: “What role will robo-advice play in your market?” . . . . . . . . . . . . . . . . . . . . . . . . . . . . . . . . . . . . . . . . . . . . . .48
Australia . . . . . . . . . . . . . . . . . . . . . . . . . . . . . . . . . . . . . . . . . . . . . . . . . . . . . . . . . . . . . . . . . . . . . . . . . . . . . . . . . . . . . . . . . . . . 49
Figure 39: Projected total population . . . . . . . . . . . . . . . . . . . . . . . . . . . . . . . . . . . . . . . . . . . . . . . . . . . . . . . . . . . . . . . . . . . . . 49
Figure 40: Population distribution 2015 and 2025 . . . . . . . . . . . . . . . . . . . . . . . . . . . . . . . . . . . . . . . . . . . . . . . . . . . . . . . . . 49
Figure 41: Old-age support ratio (population aged 15-64 /population aged 65 and above) . . . . . . . . . . . . . . . . . . . . . 49
Figure 42: Average monthly household savings (USD) . . . . . . . . . . . . . . . . . . . . . . . . . . . . . . . . . . . . . . . . . . . . . . . . . . . . . 49
Figure 43: Gross savings rate (% of GDP) . . . . . . . . . . . . . . . . . . . . . . . . . . . . . . . . . . . . . . . . . . . . . . . . . . . . . . . . . . . . . . . . . 49
Figure 44: Superannuation distribution June 2015 (APRA) . . . . . . . . . . . . . . . . . . . . . . . . . . . . . . . . . . . . . . . . . . . . . . . . .50
China . . . . . . . . . . . . . . . . . . . . . . . . . . . . . . . . . . . . . . . . . . . . . . . . . . . . . . . . . . . . . . . . . . . . . . . . . . . . . . . . . . . . . . . . . . . . 52
Figure 45: Projected total population . . . . . . . . . . . . . . . . . . . . . . . . . . . . . . . . . . . . . . . . . . . . . . . . . . . . . . . . . . . . . . . . . . . . . 52
Figure 46: Population distribution 2015 and 2025 . . . . . . . . . . . . . . . . . . . . . . . . . . . . . . . . . . . . . . . . . . . . . . . . . . . . . . . . . 52
Figure 47: Old-age support ratio (population aged 15-64 /population aged 65 and above) . . . . . . . . . . . . . . . . . . . . . 52
Figure 48: Gross savings rate (% of GDP) . . . . . . . . . . . . . . . . . . . . . . . . . . . . . . . . . . . . . . . . . . . . . . . . . . . . . . . . . . . . . . . . . 52
MILLIMAN RESEARCH REPORT
Hong Kong . . . . . . . . . . . . . . . . . . . . . . . . . . . . . . . . . . . . . . . . . . . . . . . . . . . . . . . . . . . . . . . . . . . . . . . . . . . . . . . . . . . . . . . . . . .54
Figure 49: Projected total population . . . . . . . . . . . . . . . . . . . . . . . . . . . . . . . . . . . . . . . . . . . . . . . . . . . . . . . . . . . . . . . . . . .54
Figure 50: Population distribution 2015 and 2025 . . . . . . . . . . . . . . . . . . . . . . . . . . . . . . . . . . . . . . . . . . . . . . . . . . . . . . . .54
Figure 51: Old-age support ratio (population aged 15-64 /population aged 65 and above) . . . . . . . . . . . . . . . . . . . .54
Figure 52: Gross savings rate (% of GDP) . . . . . . . . . . . . . . . . . . . . . . . . . . . . . . . . . . . . . . . . . . . . . . . . . . . . . . . . . . . . . . .54
Figure 53: Employed population by type of retirement schemes enrolled (2016 Q2) . . . . . . . . . . . . . . . . . . . . . . . . .56
Figure 54: Market share of MPF assets (2016) . . . . . . . . . . . . . . . . . . . . . . . . . . . . . . . . . . . . . . . . . . . . . . . . . . . . . . . . . . .56
Figure 55: Net asset values of MPF funds (HKD billions) . . . . . . . . . . . . . . . . . . . . . . . . . . . . . . . . . . . . . . . . . . . . . . . . . .56
Figure 56: Annuity and other in-force business premiums (2015, HKD millions) . . . . . . . . . . . . . . . . . . . . . . . . . . . . .57
India . . . . . . . . . . . . . . . . . . . . . . . . . . . . . . . . . . . . . . . . . . . . . . . . . . . . . . . . . . . . . . . . . . . . . . . . . . . . . . . . . . . . . . . . . . .59
Figure 57: Projected total population . . . . . . . . . . . . . . . . . . . . . . . . . . . . . . . . . . . . . . . . . . . . . . . . . . . . . . . . . . . . . . . . . . .59
Figure 58: Population distribution 2015 and 2025 . . . . . . . . . . . . . . . . . . . . . . . . . . . . . . . . . . . . . . . . . . . . . . . . . . . . . . . .59
Figure 59: Old-age support ratio (population aged 15-64 /population aged 65 and above) . . . . . . . . . . . . . . . . . . . .59
Figure 60: Gross savings rate (% of GDP) . . . . . . . . . . . . . . . . . . . . . . . . . . . . . . . . . . . . . . . . . . . . . . . . . . . . . . . . . . . . . . .59
Indonesia . . . . . . . . . . . . . . . . . . . . . . . . . . . . . . . . . . . . . . . . . . . . . . . . . . . . . . . . . . . . . . . . . . . . . . . . . . . . . . . . . . . . . . . . . . .62
Figure 61: Projected total population . . . . . . . . . . . . . . . . . . . . . . . . . . . . . . . . . . . . . . . . . . . . . . . . . . . . . . . . . . . . . . . . . . .62
Figure 62: Population distribution 2015 and 2025 . . . . . . . . . . . . . . . . . . . . . . . . . . . . . . . . . . . . . . . . . . . . . . . . . . . . . . . .62
Figure 63: Old-age support ratio (population aged 15-64 /population aged 65 and above) . . . . . . . . . . . . . . . . . . . .62
Figure 64: Gross savings rate (% of GDP) . . . . . . . . . . . . . . . . . . . . . . . . . . . . . . . . . . . . . . . . . . . . . . . . . . . . . . . . . . . . . . .62
Japan . . . . . . . . . . . . . . . . . . . . . . . . . . . . . . . . . . . . . . . . . . . . . . . . . . . . . . . . . . . . . . . . . . . . . . . . . . . . . . . . . . . . . . . . . . 64
Figure 65: Projected total population . . . . . . . . . . . . . . . . . . . . . . . . . . . . . . . . . . . . . . . . . . . . . . . . . . . . . . . . . . . . . . . . . . 64
Figure 66: Population distribution 2015 and 2025 . . . . . . . . . . . . . . . . . . . . . . . . . . . . . . . . . . . . . . . . . . . . . . . . . . . . . . . 64
Figure 67: Old-age support ratio (population aged 15-64 /population aged 65 and above) . . . . . . . . . . . . . . . . . . . 64
Figure 68: Average monthly household savings (USD) . . . . . . . . . . . . . . . . . . . . . . . . . . . . . . . . . . . . . . . . . . . . . . . . . . . 64
Figure 69: Gross savings rate (% of GDP) . . . . . . . . . . . . . . . . . . . . . . . . . . . . . . . . . . . . . . . . . . . . . . . . . . . . . . . . . . . . . . 64
Malaysia . . . . . . . . . . . . . . . . . . . . . . . . . . . . . . . . . . . . . . . . . . . . . . . . . . . . . . . . . . . . . . . . . . . . . . . . . . . . . . . . . . . . . . . . . . .67
Figure 70: Projected total population . . . . . . . . . . . . . . . . . . . . . . . . . . . . . . . . . . . . . . . . . . . . . . . . . . . . . . . . . . . . . . . . . . .67
Figure 71: Population distribution 2015 and 2025 . . . . . . . . . . . . . . . . . . . . . . . . . . . . . . . . . . . . . . . . . . . . . . . . . . . . . . . .67
Figure 72: Old-age support ratio (population aged 15-64 /population aged 65 and above) . . . . . . . . . . . . . . . . . . . .67
Figure 73: Gross savings rate (% of GDP) . . . . . . . . . . . . . . . . . . . . . . . . . . . . . . . . . . . . . . . . . . . . . . . . . . . . . . . . . . . . . . .67
Singapore . . . . . . . . . . . . . . . . . . . . . . . . . . . . . . . . . . . . . . . . . . . . . . . . . . . . . . . . . . . . . . . . . . . . . . . . . . . . . . . . . . . . . . . . . . .70
Figure 74: Projected total population . . . . . . . . . . . . . . . . . . . . . . . . . . . . . . . . . . . . . . . . . . . . . . . . . . . . . . . . . . . . . . . . . . .70
Figure 75: Population distribution 2015 and 2025 . . . . . . . . . . . . . . . . . . . . . . . . . . . . . . . . . . . . . . . . . . . . . . . . . . . . . . . .70
Figure 76: Old-age support ratio (population aged 15-64 /population aged 65 and above) . . . . . . . . . . . . . . . . . . . .70
Figure 77: Gross savings rate (% of GDP) . . . . . . . . . . . . . . . . . . . . . . . . . . . . . . . . . . . . . . . . . . . . . . . . . . . . . . . . . . . . . . .70
Figure 78: CPF LIFE payouts vs expenditure for retirees . . . . . . . . . . . . . . . . . . . . . . . . . . . . . . . . . . . . . . . . . . . . . . . . . . 71
Figure 79: Total New Individual Annuities Business . . . . . . . . . . . . . . . . . . . . . . . . . . . . . . . . . . . . . . . . . . . . . . . . . . . . . . .73
Figure 80: Sales of Variable Annuities (SGD million) . . . . . . . . . . . . . . . . . . . . . . . . . . . . . . . . . . . . . . . . . . . . . . . . . . . . . .73
South Korea . . . . . . . . . . . . . . . . . . . . . . . . . . . . . . . . . . . . . . . . . . . . . . . . . . . . . . . . . . . . . . . . . . . . . . . . . . . . . . . . . . . . . . . . .75
Figure 81: Projected total population . . . . . . . . . . . . . . . . . . . . . . . . . . . . . . . . . . . . . . . . . . . . . . . . . . . . . . . . . . . . . . . . . . .75
Figure 82: Population distribution 2015 and 2025 . . . . . . . . . . . . . . . . . . . . . . . . . . . . . . . . . . . . . . . . . . . . . . . . . . . . . . . .75
Figure 83: Old-age support ratio (population aged 15-64 /population aged 65 and above) . . . . . . . . . . . . . . . . . . . .75
Figure 84: Average monthly household savings (USD) . . . . . . . . . . . . . . . . . . . . . . . . . . . . . . . . . . . . . . . . . . . . . . . . . . . .75
Figure 85: Gross savings rate (% of GDP) . . . . . . . . . . . . . . . . . . . . . . . . . . . . . . . . . . . . . . . . . . . . . . . . . . . . . . . . . . . . . . .75
Taiwan . . . . . . . . . . . . . . . . . . . . . . . . . . . . . . . . . . . . . . . . . . . . . . . . . . . . . . . . . . . . . . . . . . . . . . . . . . . . . . . . . . . . . . . . . . .79
Figure 86: Projected total population . . . . . . . . . . . . . . . . . . . . . . . . . . . . . . . . . . . . . . . . . . . . . . . . . . . . . . . . . . . . . . . . . . .79
Figure 87: Population distribution 2015 and 2025 . . . . . . . . . . . . . . . . . . . . . . . . . . . . . . . . . . . . . . . . . . . . . . . . . . . . . . . .79
Figure 88: Old-age support ratio (population aged 15-64 /population aged 65 and above) . . . . . . . . . . . . . . . . . . . .79
Figure 89: Average monthly household savings (USD) . . . . . . . . . . . . . . . . . . . . . . . . . . . . . . . . . . . . . . . . . . . . . . . . . . . .79
Figure 90: Gross savings rate (% of GDP) . . . . . . . . . . . . . . . . . . . . . . . . . . . . . . . . . . . . . . . . . . . . . . . . . . . . . . . . . . . . . . .79
Thailand . . . . . . . . . . . . . . . . . . . . . . . . . . . . . . . . . . . . . . . . . . . . . . . . . . . . . . . . . . . . . . . . . . . . . . . . . . . . . . . . . . . . . . . . . . .82
Figure 91: Projected total population . . . . . . . . . . . . . . . . . . . . . . . . . . . . . . . . . . . . . . . . . . . . . . . . . . . . . . . . . . . . . . . . . . .82
Figure 92: Population distribution 2015 and 2025 . . . . . . . . . . . . . . . . . . . . . . . . . . . . . . . . . . . . . . . . . . . . . . . . . . . . . . . .82
Figure 93: Old-age support ratio (population aged 15-64 /population aged 65 and above) . . . . . . . . . . . . . . . . . . . .82
Figure 94: Gross savings rate (% of GDP) . . . . . . . . . . . . . . . . . . . . . . . . . . . . . . . . . . . . . . . . . . . . . . . . . . . . . . . . . . . . . . .82
MILLIMAN RESEARCH REPORT
Asia retirement income report 4 MAY 2017
Acronyms and abbreviationsAFPK Associate Financial Planner Korea IUL Indexed universal life
APE Annual premium equivalent LIMRA Life Insurance Marketing and Research Association (US)
AUM Assets under management LTC Long-term care
BPJS Social Security Administrator (Indonesia) MPF Mandatory Provident Fund (Hong Kong)
BRS Basic Retirement Sum (Singapore) MPFA MPF Schemes Authority (Hong Kong)
CFP Certified Financial Planner MPFSO MPF Schemes Ordinance (Hong Kong)
CIPR Comprehensive income product for retirement (Australia)
NPS National Pension System (India)
CPF Central Provident Fund (Singapore) NSF National Savings Fund (Thailand)
CPF LIFE CPF Lifelong Income For The Elderly (Singapore)
OA Ordinary Account (Singapore)
CSSA Comprehensive Social Security Assistance (Hong Kong)
OECD Organisation for Economic Co-operation and Development
DB Defined benefit OJK Financial Services Authority (Indonesia)
DC Defined contribution OMO Open Market Option (UK)
DPPK Employer’s pension fund (Indonesia) ORSO Occupational Retirement Schemes Ordinance (Hong Kong)
DPLK Financial institution pension fund (Indonesia) PFRDA Pension Fund Regulatory and Development Authority (India)
EA Enterprise Annuity (China) PPF Public Provident Fund (India)
EPFI Employees’ Provident Fund (India) PRS Private Retirement Scheme (Malaysia)
EPFM Employees’ Provident Fund (Malaysia) RIA Registered investment advisor (India)
EPFO EPF Organisation of India ROI Return on Investment
EPF SP1M EPF 1Malaysia Retirement Savings Scheme SA Special Account (Singapore)
ETF Exchange-traded fund SEBI Securities and Exchange Board of India
FOFA Future of Financial Advice (Australia) SOCSO Social Security Organisation (Malaysia)
FSA Financial Services Authority (UK) SRS Supplementary Retirement Scheme (Singapore)
FSAJ Financial Services Agency (Japan) SSF Social Security Fund (Thailand)
FSC Financial Services Commission (South Korea)
Super Superannuation (Australia)
GEPS Government Employees Pension Scheme (South Korea)
UK United Kingdom
GMAB Guaranteed Minimum Accumulation Benefit UL Universal life
GMDB Guaranteed Minimum Death Benefit ULSG UL with secondary guarantees
GP Group Pension (China) US United States
GPF Government Pension Fund (Thailand) UWP Unitised with-profits
HDB Housing Development Board (Singapore) VA Variable annuity
HKMC Hong Kong Mortgage Corporation VL Variable life
IRDAI Insurance Regulatory and Development Authority of India
VM-20 Valuation Manual (US)
IRR Internal rate of return VUL Variable universal life

MILLIMAN RESEARCH REPORT
Asia retirement income report 5 MAY 2017
Opening remarksWelcome and thank you for taking the time to read our special report on the retirement income markets in Asia Pacific. We believe that now is the perfect time to expand the conversation on retirement income for two key reasons:
1. The Asian economies have seen strong growth over the last decade, with the emergence of a sizable middle class in most of the region’s developing markets. This comes with middle-class needs such as saving for retirement, driven by improving longevity and health. However, state retirement systems and employer-sponsored pensions are often unable to provide sufficient retirement income for a large part of the population, which opens opportunities for the private sector.
2. For the private market providers likely to fill this gap (e.g., life insurance and wealth management providers), there is now strong competition in Asia within their core business lines (e.g., protection and accumulation-type investment products). Offering retirement income products could be the next significant business line for these providers, following the example of markets such as Australia, the United Kingdom (UK) and the United States (US).
This report attempts to provide more colour on the topic of retirement, as well as our perspectives on the potential markets, product categories, challenges, and potential solutions. Case studies from other markets are explained in depth and related back to the Asian markets.
In putting together this report, we have relied heavily on our internal research, but also on an extensive survey of insurance and financial services industry professionals in the Asia Pacific region. We would like to thank the survey participants for taking the time to respond and provide us with their insights, and we hope that this report will assist them in their own strategy settings.
The editors
Wade MattersonRichard HollowayPaul SinnottMichael DalyZhikang Chong
MILLIMAN RESEARCH REPORT
Asia retirement income report 6 MAY 2017
Executive SummaryINTRODUCTIONAccording to the World Bank,1 the East Asia and Pacific region is ageing faster than any other region in the world. The rate of ageing is diverse across different countries, with some having a very young population. However, the more developed countries are seeing large numbers of residents now in retirement, and requiring income from family members, employers, personal savings, or the state. Similar trends have been seen elsewhere, namely in the European and North American markets, which has led to development of sophisticated public and private provision to support the need for retirement income. However, with the exception of a few markets, most Asia Pacific countries have yet to develop such comprehensive systems.
This report sets out our perspectives and analysis of the current and future state of the market for retirement income in Asia Pacific. As part of the research in producing the report, we conducted a comprehensive survey of over 100 insurance companies and financial institutions across Asia.
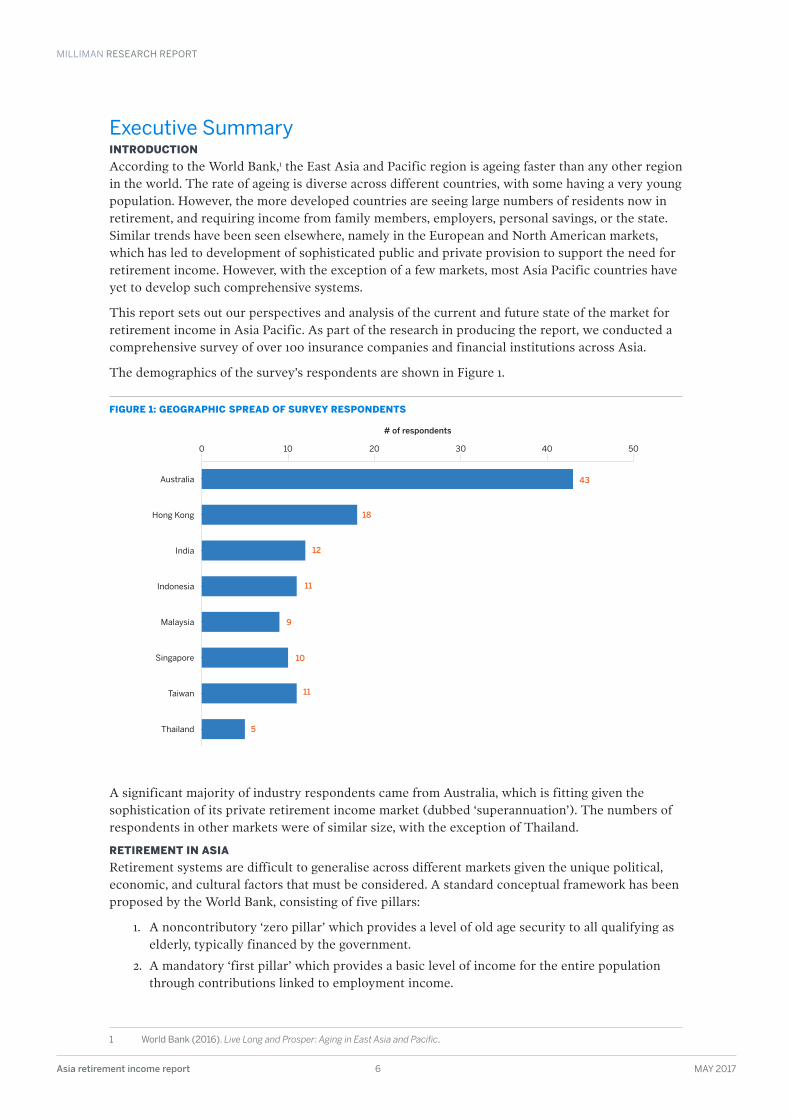
The demographics of the survey’s respondents are shown in Figure 1.
FIGURE 1: GEOGRAPHIC SPREAD OF SURVEY RESPONDENTS
A significant majority of industry respondents came from Australia, which is fitting given the sophistication of its private retirement income market (dubbed ‘superannuation’). The numbers of respondents in other markets were of similar size, with the exception of Thailand.
RETIREMENT IN ASIARetirement systems are difficult to generalise across different markets given the unique political, economic, and cultural factors that must be considered. A standard conceptual framework has been proposed by the World Bank, consisting of five pillars:
1. A noncontributory ‘zero pillar’ which provides a level of old age security to all qualifying as elderly, typically financed by the government.
2. A mandatory ‘first pillar’ which provides a basic level of income for the entire population through contributions linked to employment income.
1 World Bank (2016) . Live Long and Prosper: Aging in East Asia and Pacific .
# of respondents
Australia
Hong Kong
India
Indonesia
Malaysia
Singapore
Thailand
Taiwan
12
11
9
5
11
10
43
18
0 10 20 30 40 50
MILLIMAN RESEARCH REPORT
Asia retirement income report 7 MAY 2017
3. A funded mandatory ‘second pillar’ akin to a defined contribution plan, whereby outcomes are linked to contribution size and investment outcomes.
4. A funded voluntary ‘third pillar’, which can be employer-sponsored or individual private market products, bought above and beyond the requirements of the second pillar.
5. A nonfinancial ‘fourth pillar’ which includes informal support from family, friends, and community.
A significant proportion of respondents indicated that they feel the government’s goals in the markets they operate in are not clearly articulated. This could be a concern from both a supply (industry) and demand (consumer) viewpoint. In a range of markets, regular changes to the underlying basis of the retirement system have led to varying levels of confusion and a general lack of faith in the stability of the system and its ability to provide adequate retirement income.
The vast majority of respondents feel that their national retirement systems’ provisions are inadequate. Surprisingly, this feedback was consistent across all surveyed markets—even in countries that have traditionally been considered to have more advanced retirement systems, such as Singapore and Australia.
As expected, shifting demographics (e.g., an ageing population) was thought by the respondents to be the most important factor causing retirement systems to be unsustainable. Many retirement systems were designed decades ago, when life expectancy at the point of retirement was relatively short. As life expectancy has increased, retirement systems have been slow to keep up with the shifting demographics.
Given the general agreement across respondents that the current national retirement systems are inadequate, the same respondents also recognised that there are significant opportunities for the private sector to step in and fill part of the gap.
PRODUCTS AND PROPOSITIONSRegarding what consumers want in a retirement product, the overall survey results seem to indicate that respondents feel consumers would value some type of guarantee, either income or capital protection, with simplicity being a consistent third requirement. This message was consistent across all the markets covered in our survey.
Annuity-type products and their ilk are not readily available in most of the surveyed markets, the most notable exception being the government-provided CPF LIFE in Singapore, and the slowly reviving annuity market in Australia.
Given the seemingly clear consumer need, it seems strange that these products are not more widely available. There are several possible explanations for this, of which three stand out:
1. The lack of appreciation in some countries for an income stream in retirement as opposed to a lump sum.
2. The low interest rate environment, which makes it difficult to provide guaranteed products.
3. Structural obstacles, such as an underdeveloped long-term debt market or a lack of tax incentives, that are preventing the launch or popularity of guaranteed products.
A fourth explanation is also possible, that guaranteed products will only appeal to a certain segment of the market, and cannot be expected to be a ‘silver bullet’ for the entire population.
MILLIMAN RESEARCH REPORT
Asia retirement income report 8 MAY 2017
OPPORTUNITIES FOR PRODUCT MANUFACTURERSWe questioned our survey respondents on their retirement product pipelines, and several results stand out:
· A large proportion of respondents (51%) intend to further develop investment-linked offerings. However, investment-linked products are typically accumulation-type products and do not usually have strong decumulation features, which are desirable for retirement income products. The notable exceptions to this result were Australian respondents, who are more in favour of ‘vanilla’ investment products and annuities.
· 36% of respondents are intending to develop annuity products. These are the classic retirement income products, so respondents may find it important to include an annuity product in their list of offerings. This result is significant for almost every surveyed country except Indonesia and Malaysia.
· Universal life is in the product pipeline for Hong Kong (61%), Singapore (60%), and Taiwan (45%), but with virtually none planned in the other surveyed countries. While universal life may be desirable and sold as a legacy planning or retirement savings solution, it is not typically positioned as a retirement income solution.
· Equity release and its variants are only being considered by a small minority of respondents (2%).
The majority of products that appear to be in the product pipelines of our respondents are not, strictly speaking, decumulation or retirement income products. This was not unexpected, given the dearth of retirement income offerings in the market currently. With the potentially large market, we queried our respondents on why their companies are not offering more retirement income products. The key reasons are summarised below:
· Regulatory/tax (34%), pricing (34%), and solvency regulation issues (29%) were seen as the top impediments to the development of more retirement income products. The three issues are not unrelated. Typical regulatory and tax burdens could include restrictions on certain product features, or relatively onerous tax burdens on insurance products compared with other alternatives such as mutual funds or bank deposits.
· Distribution issues (26%) were also identified as a major impediment, but primarily by respondents in India, Indonesia, and Malaysia.
· Inadequate capital markets (21%) were also identified as a key impediment. The majority of Asian markets (excluding Japan) do not have large amounts of fixed income assets with tenure exceeding 20 years, and many of these markets have risk-based capital regimes that will penalise durational mismatching.
· Only a small number of respondents highlighted inadequate operational capabilities (10%) and technology issues (13%) as impediments.
The results of the survey in this area were consistent with our next question to our respondents, regarding the most useful actions that governments could take to expand their domestic retirement markets.
The key result of note was that large numbers of respondents (43%) selected increasing public financial literacy and awareness. This result, combined with the 70% of respondents opting for more government/tax incentives or even the 23% who are for outright compulsory purchase requirements, hints at demand-side problems for retirement income products.
MILLIMAN RESEARCH REPORT
Asia retirement income report 9 MAY 2017
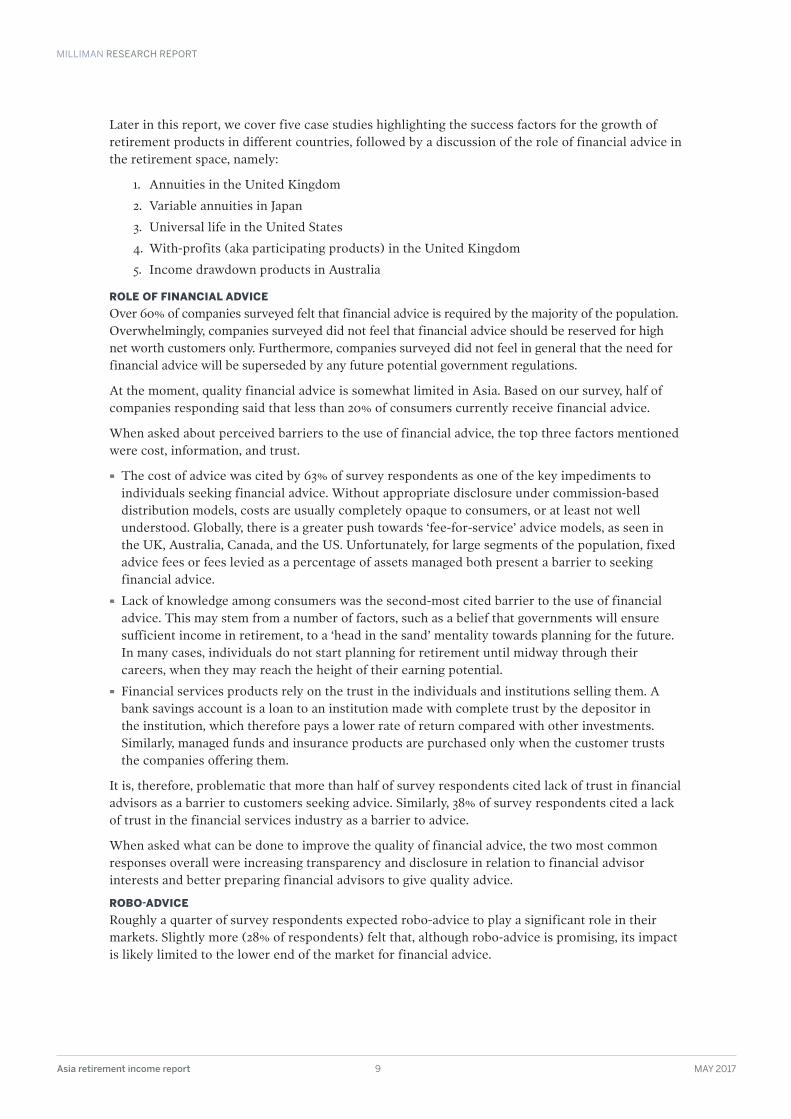
Later in this report, we cover five case studies highlighting the success factors for the growth of retirement products in different countries, followed by a discussion of the role of financial advice in the retirement space, namely:
1. Annuities in the United Kingdom
2. Variable annuities in Japan
3. Universal life in the United States
4. With-profits (aka participating products) in the United Kingdom
5. Income drawdown products in Australia
ROLE OF FINANCIAL ADVICEOver 60% of companies surveyed felt that financial advice is required by the majority of the population. Overwhelmingly, companies surveyed did not feel that financial advice should be reserved for high net worth customers only. Furthermore, companies surveyed did not feel in general that the need for financial advice will be superseded by any future potential government regulations.
At the moment, quality financial advice is somewhat limited in Asia. Based on our survey, half of companies responding said that less than 20% of consumers currently receive financial advice.
When asked about perceived barriers to the use of financial advice, the top three factors mentioned were cost, information, and trust.
· The cost of advice was cited by 63% of survey respondents as one of the key impediments to individuals seeking financial advice. Without appropriate disclosure under commission-based distribution models, costs are usually completely opaque to consumers, or at least not well understood. Globally, there is a greater push towards ‘fee-for-service’ advice models, as seen in the UK, Australia, Canada, and the US. Unfortunately, for large segments of the population, fixed advice fees or fees levied as a percentage of assets managed both present a barrier to seeking financial advice.
· Lack of knowledge among consumers was the second-most cited barrier to the use of financial advice. This may stem from a number of factors, such as a belief that governments will ensure sufficient income in retirement, to a ‘head in the sand’ mentality towards planning for the future. In many cases, individuals do not start planning for retirement until midway through their careers, when they may reach the height of their earning potential.
· Financial services products rely on the trust in the individuals and institutions selling them. A bank savings account is a loan to an institution made with complete trust by the depositor in the institution, which therefore pays a lower rate of return compared with other investments. Similarly, managed funds and insurance products are purchased only when the customer trusts the companies offering them.
It is, therefore, problematic that more than half of survey respondents cited lack of trust in financial advisors as a barrier to customers seeking advice. Similarly, 38% of survey respondents cited a lack of trust in the financial services industry as a barrier to advice.
When asked what can be done to improve the quality of financial advice, the two most common responses overall were increasing transparency and disclosure in relation to financial advisor interests and better preparing financial advisors to give quality advice.
ROBO-ADVICERoughly a quarter of survey respondents expected robo-advice to play a significant role in their markets. Slightly more (28% of respondents) felt that, although robo-advice is promising, its impact is likely limited to the lower end of the market for financial advice.
MILLIMAN RESEARCH REPORT
Asia retirement income report 10 MAY 2017
IntroductionRetirement, as a widespread and legalised concept in human society, did not exist until its introduction by Chancellor Otto Von Bismarck of Germany in 1883, in the form of a pension paid to nonworking citizens past the age of 65. Given that the average global life expectancy of a person in 1900 was in the low 30s,2 the provision of retirement income was not a significant commitment for the government’s financial resources or its citizens at that point in history.
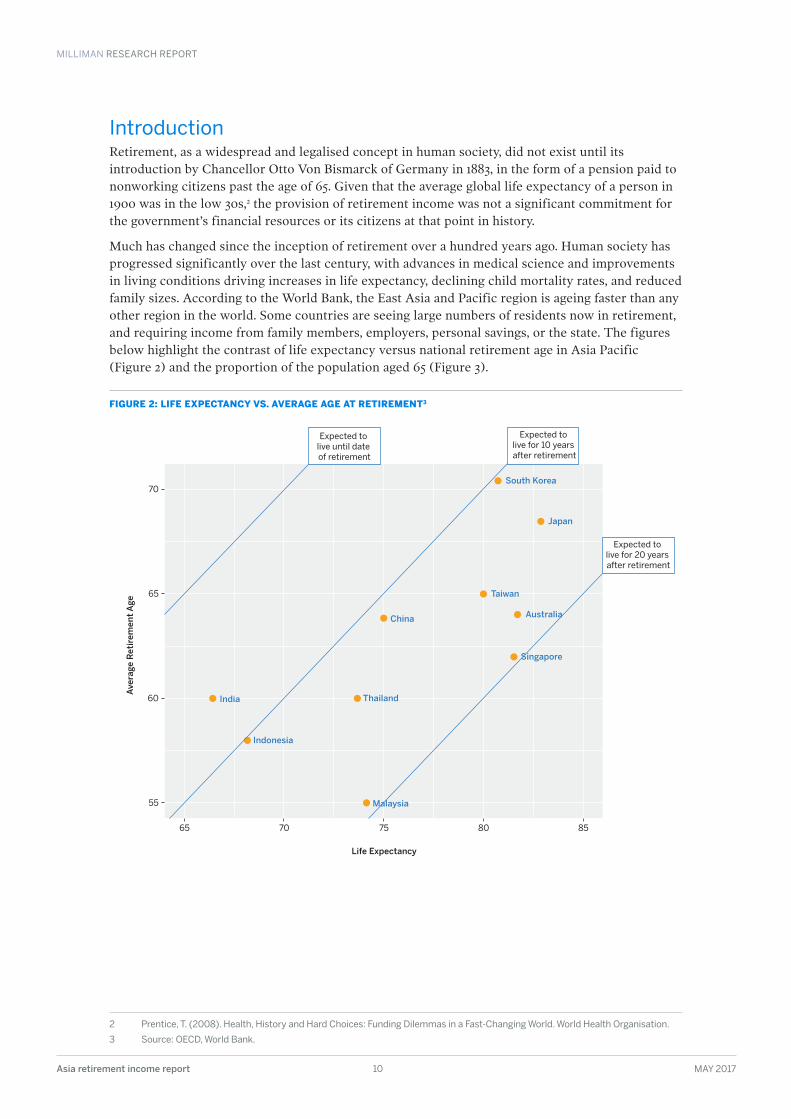
Much has changed since the inception of retirement over a hundred years ago. Human society has progressed significantly over the last century, with advances in medical science and improvements in living conditions driving increases in life expectancy, declining child mortality rates, and reduced family sizes. According to the World Bank, the East Asia and Pacific region is ageing faster than any other region in the world. Some countries are seeing large numbers of residents now in retirement, and requiring income from family members, employers, personal savings, or the state. The figures below highlight the contrast of life expectancy versus national retirement age in Asia Pacific (Figure 2) and the proportion of the population aged 65 (Figure 3).
FIGURE 2: LIFE EXPECTANCY VS . AVERAGE AGE AT RETIREMENT3
2 Prentice, T . (2008) . Health, History and Hard Choices: Funding Dilemmas in a Fast-Changing World . World Health Organisation .
3 Source: OECD, World Bank .
South Korea
Ave
rage
Ret
irem
ent A
ge
Life Expectancy
Expected to live until date of retirement
Expected to live for 10 years after retirement
Expected to live for 20 years after retirement
Japan
Taiwan
Australia
Singapore
ThailandIndia
Indonesia
China
70
65
60
55
65 70 75 80 85
Malaysia
MILLIMAN RESEARCH REPORT
Asia retirement income report 11 MAY 2017
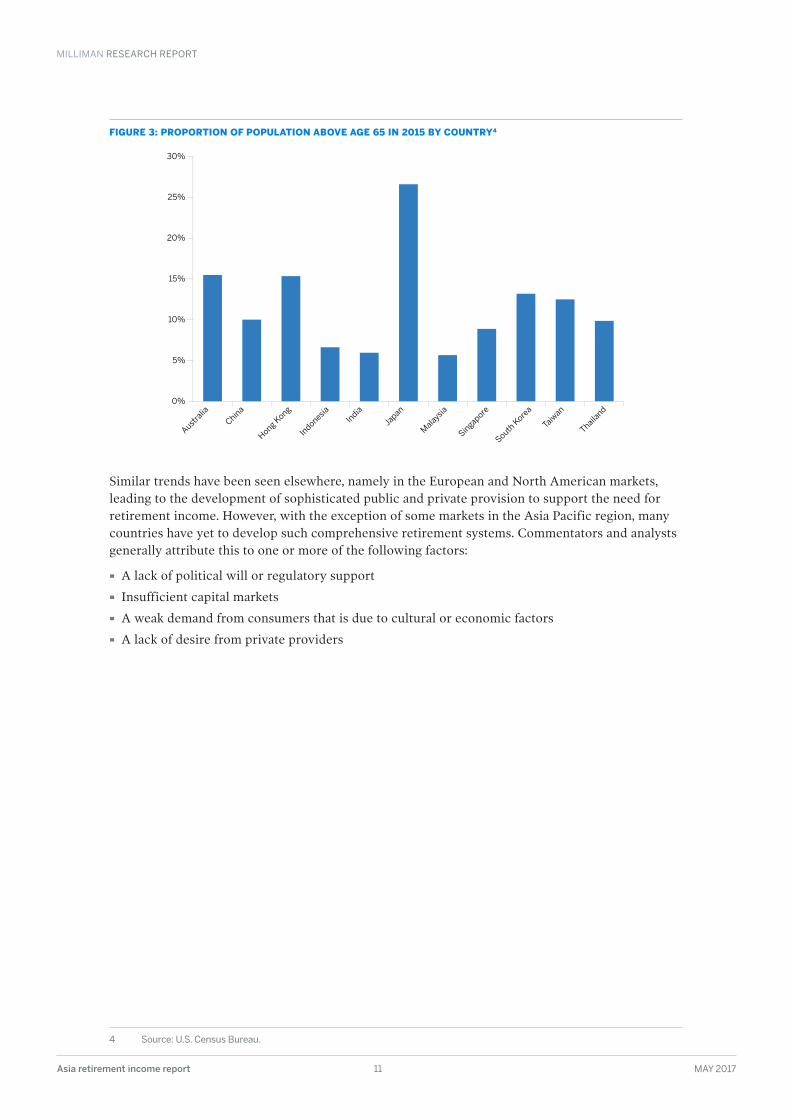
FIGURE 3: PROPORTION OF POPULATION ABOVE AGE 65 IN 2015 BY COUNTRY4
Similar trends have been seen elsewhere, namely in the European and North American markets, leading to the development of sophisticated public and private provision to support the need for retirement income. However, with the exception of some markets in the Asia Pacific region, many countries have yet to develop such comprehensive retirement systems. Commentators and analysts generally attribute this to one or more of the following factors:
· A lack of political will or regulatory support
· Insufficient capital markets
· A weak demand from consumers that is due to cultural or economic factors
· A lack of desire from private providers
4 Source: U .S . Census Bureau .
0%
5%
10%
15%
20%
25%
30%
Australia
China
Hong Kong
India
Japan
Indonesia
Malaysia
Singapore
South K
orea
Thailand
Taiw
an
MILLIMAN RESEARCH REPORT
Asia retirement income report 12 MAY 2017
Retirement in AsiaRetirement systems are difficult to generalise across different markets, given the unique political, economic, and cultural factors that must be considered. More recently, a standard conceptual framework has been proposed by the World Bank,5 which has been adopted by this report to discuss retirement systems. The framework, updated from its previous three-pillar model, now consists of five pillars:
1. A noncontributory ‘zero pillar’ which provides a level of old age security to all qualifying as elderly, typically financed by the government.
2. A mandatory ‘first pillar’ which provides a basic level of income for the entire population through contributions linked to employment income.
3. A funded mandatory ‘second pillar’ akin to a defined contribution plan, whereby outcomes are linked to contribution size (generally a fixed proportion of employment income) and investment outcomes.
4. A funded voluntary ‘third pillar,’ which can be employer-sponsored or individual private market products bought above and beyond the requirements of the second pillar.
5. A nonfinancial ‘fourth pillar’ which includes informal support from family, friends, and community.
An explanation of the retirement income systems for each of the major Asian countries is provided at the end of the report. While the overall objective of all national retirement systems is pretty much identical, the means by which individual markets aim to achieve this objective differs; usually by placing greater or less emphasis on the different pillars.
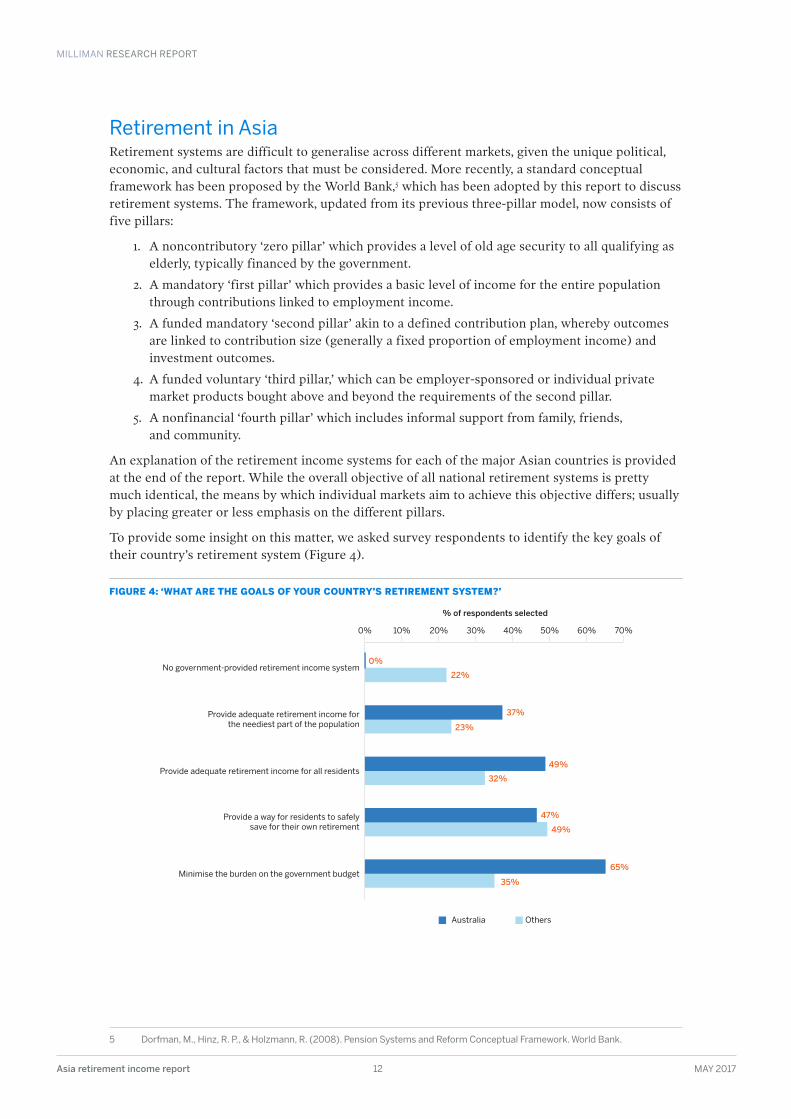
To provide some insight on this matter, we asked survey respondents to identify the key goals of their country’s retirement system (Figure 4).
FIGURE 4: ‘WHAT ARE THE GOALS OF YOUR COUNTRY’S RETIREMENT SYSTEM?’
5 Dorfman, M ., Hinz, R . P ., & Holzmann, R . (2008) . Pension Systems and Reform Conceptual Framework . World Bank .
0% 10% 20% 30% 40% 50% 60% 70%
37%
23%
0%
22%
49%
47%
49%
32%
65%
35%
No government-provided retirement income system
Provide adequate retirement income forthe neediest part of the population
Provide adequate retirement income for all residents
Provide a way for residents to safelysave for their own retirement
Minimise the burden on the government budget
% of respondents selected
Australia Others
MILLIMAN RESEARCH REPORT
Asia retirement income report 13 MAY 2017
The majority of respondents indicated that the purpose of the retirement system was to provide some degree of income for residents, to allow for some flexibility in self-funding, and to minimise the burden on the budget. By market, there were some interesting variations:
· Nearly 100% of Malaysia and Singapore respondents indicated that that the primary goal was to provide a way to safely save for retirement, with the secondary goal of providing adequate income for all residents.
· In contrast, respondents from Australia, Taiwan, and Thailand indicated that the primary goal of the system was to minimise the impact on the government budget.
These responses are broadly consistent with a trend seen globally away from defined benefit types of plans, with an increasing emphasis on individuals bearing more control (and hence uncertainty) over their retirement incomes. To a degree, some markets attempt to remove some of this uncertainty through the provision of a government-managed lifelong income program, such as CPF LIFE in Singapore.
Another aspect of retirement systems is the degree to which industry players and the general public are aware of the goals of the system and the extent to which these are communicated.
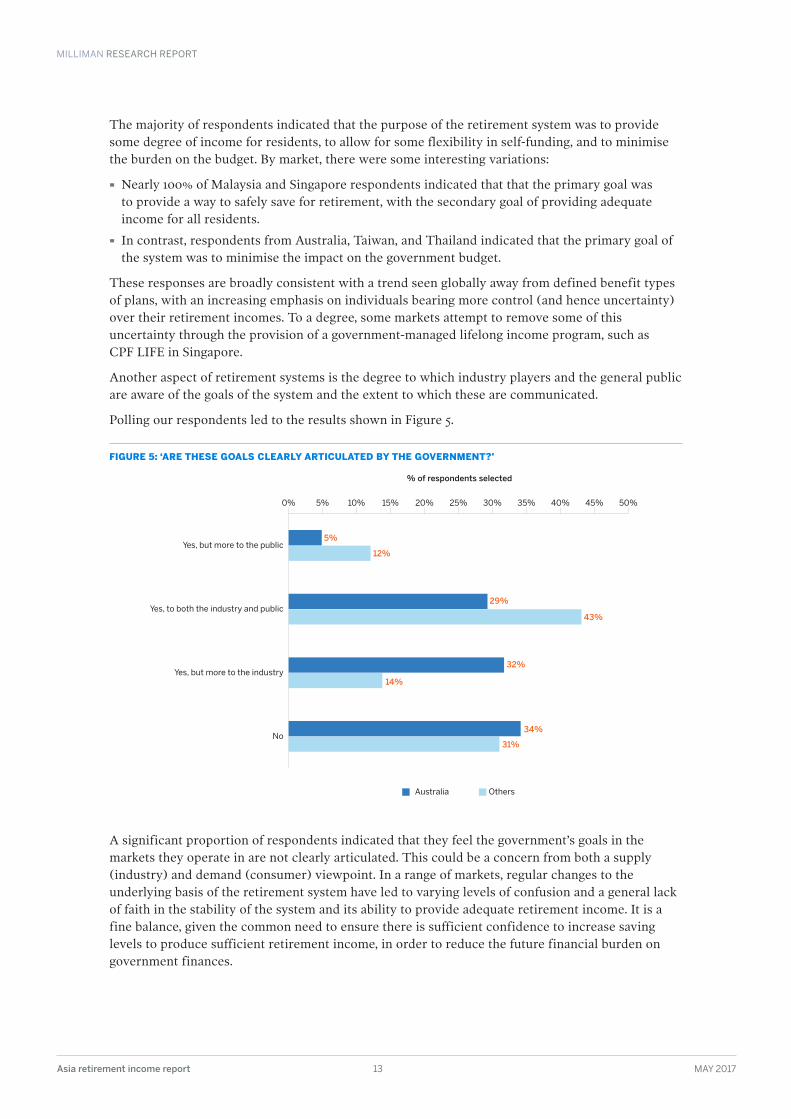
Polling our respondents led to the results shown in Figure 5.
FIGURE 5: ‘ARE THESE GOALS CLEARLY ARTICULATED BY THE GOVERNMENT?’
A significant proportion of respondents indicated that they feel the government’s goals in the markets they operate in are not clearly articulated. This could be a concern from both a supply (industry) and demand (consumer) viewpoint. In a range of markets, regular changes to the underlying basis of the retirement system have led to varying levels of confusion and a general lack of faith in the stability of the system and its ability to provide adequate retirement income. It is a fine balance, given the common need to ensure there is sufficient confidence to increase saving levels to produce sufficient retirement income, in order to reduce the future financial burden on government finances.
29%
43%
5%
12%
31%
34%
14%
32%
Yes, but more to the public
Yes, to both the industry and public
Yes, but more to the industry
No
% of respondents selected
Australia Others
0% 5% 10% 15% 20% 25% 30% 35% 40% 45% 50%
MILLIMAN RESEARCH REPORT
Asia retirement income report 14 MAY 2017
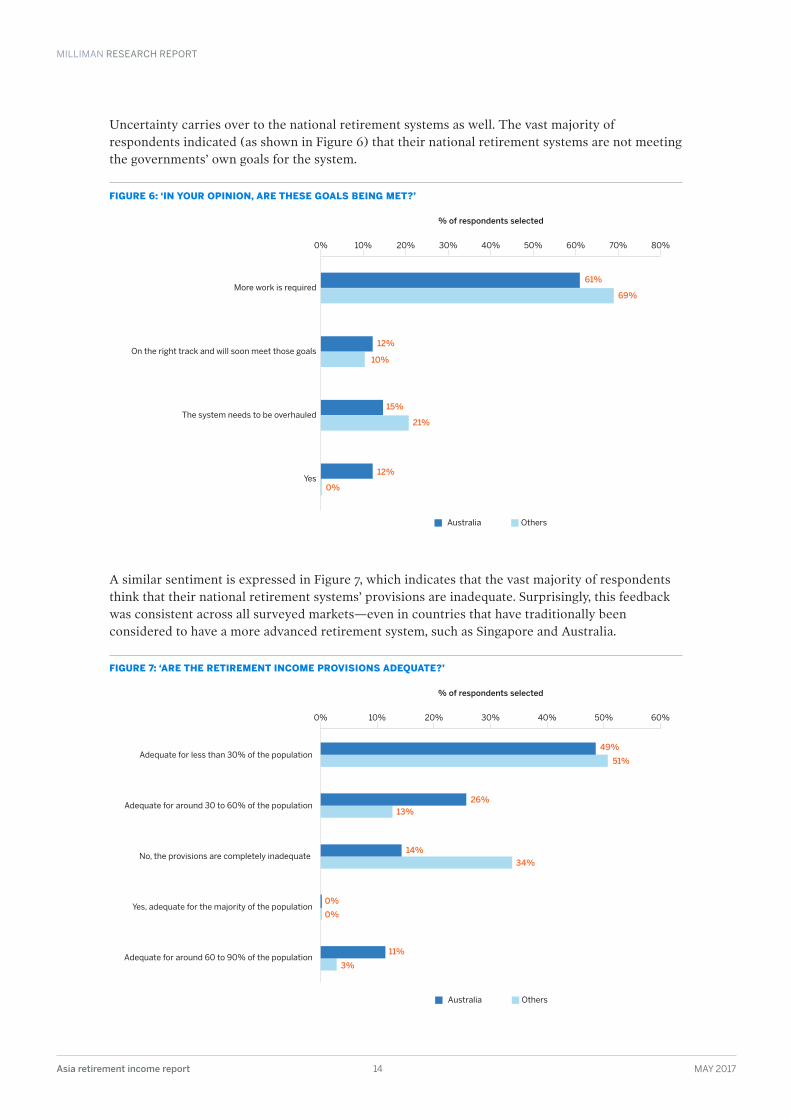
Uncertainty carries over to the national retirement systems as well. The vast majority of respondents indicated (as shown in Figure 6) that their national retirement systems are not meeting the governments’ own goals for the system.
FIGURE 6: ‘IN YOUR OPINION, ARE THESE GOALS BEING MET?’
A similar sentiment is expressed in Figure 7, which indicates that the vast majority of respondents think that their national retirement systems’ provisions are inadequate. Surprisingly, this feedback was consistent across all surveyed markets—even in countries that have traditionally been considered to have a more advanced retirement system, such as Singapore and Australia.
FIGURE 7: ‘ARE THE RETIREMENT INCOME PROVISIONS ADEQUATE?’
12%
10%
61%
69%
0%
12%
21%
15%
More work is required
On the right track and will soon meet those goals
The system needs to be overhauled
Yes
% of respondents selected
Australia Others
0% 10% 20% 30% 40% 50% 60% 70% 80%
51%
13%
49%
26%
0%
0%
11%
3%
34%
14%
Adequate for less than 30% of the population
Yes, adequate for the majority of the population
Adequate for around 30 to 60% of the population
Adequate for around 60 to 90% of the population
No, the provisions are completely inadequate
% of respondents selected
Australia Others
0% 10% 20% 30% 40% 50% 60%
MILLIMAN RESEARCH REPORT
Asia retirement income report 15 MAY 2017
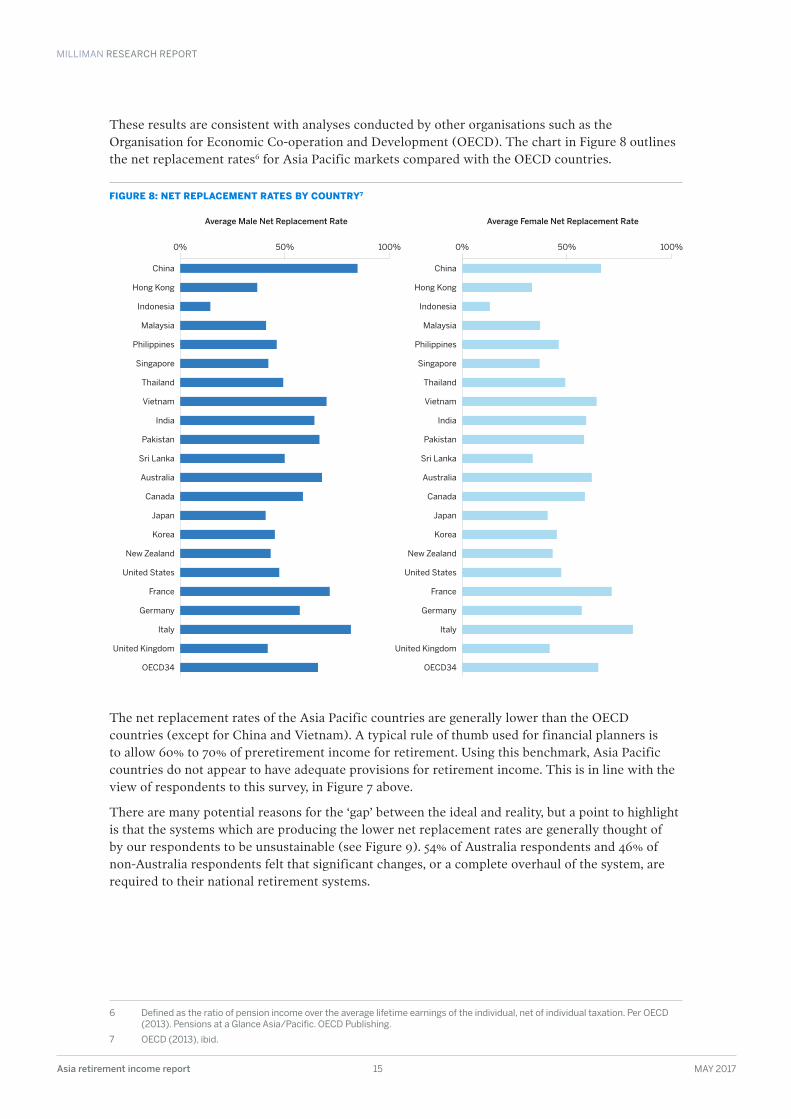
These results are consistent with analyses conducted by other organisations such as the Organisation for Economic Co-operation and Development (OECD). The chart in Figure 8 outlines the net replacement rates6 for Asia Pacific markets compared with the OECD countries.
FIGURE 8: NET REPLACEMENT RATES BY COUNTRY7
The net replacement rates of the Asia Pacific countries are generally lower than the OECD countries (except for China and Vietnam). A typical rule of thumb used for financial planners is to allow 60% to 70% of preretirement income for retirement. Using this benchmark, Asia Pacific countries do not appear to have adequate provisions for retirement income. This is in line with the view of respondents to this survey, in Figure 7 above.
There are many potential reasons for the ‘gap’ between the ideal and reality, but a point to highlight is that the systems which are producing the lower net replacement rates are generally thought of by our respondents to be unsustainable (see Figure 9). 54% of Australia respondents and 46% of non-Australia respondents felt that significant changes, or a complete overhaul of the system, are required to their national retirement systems.
6 Defined as the ratio of pension income over the average lifetime earnings of the individual, net of individual taxation . Per OECD (2013) . Pensions at a Glance Asia/Pacific . OECD Publishing .
7 OECD (2013), ibid .
Average Male Net Replacement Rate
Thailand
China
Hong Kong
Indonesia
Malaysia
Philippines
Singapore
Japan
Vietnam
India
Pakistan
Sri Lanka
Australia
Canada
Germany
Korea
New Zealand
United States
France
United Kingdom
OECD34
Italy
0% 50% 100%
Average Female Net Replacement Rate
Thailand
China
Hong Kong
Indonesia
Malaysia
Philippines
Singapore
Japan
Vietnam
India
Pakistan
Sri Lanka
Australia
Canada
Germany
Korea
New Zealand
United States
France
United Kingdom
OECD34
Italy
0% 50% 100%
MILLIMAN RESEARCH REPORT
Asia retirement income report 16 MAY 2017
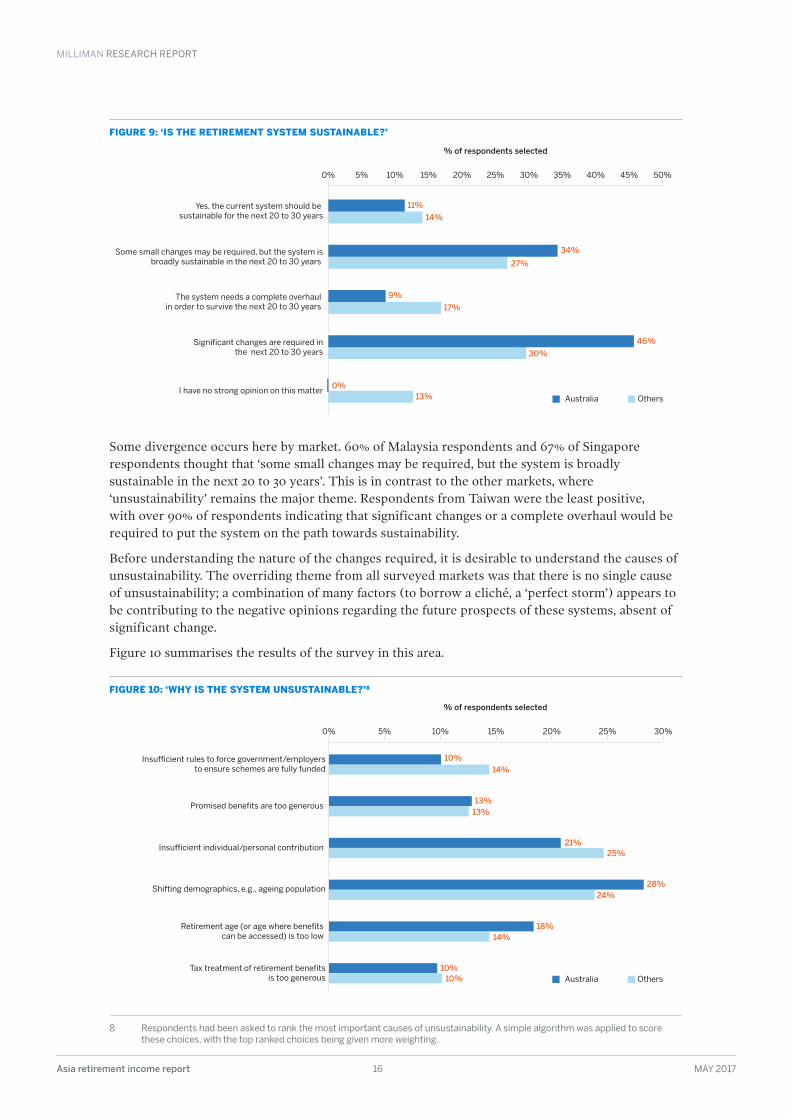
FIGURE 9: ‘IS THE RETIREMENT SYSTEM SUSTAINABLE?’
Some divergence occurs here by market. 60% of Malaysia respondents and 67% of Singapore respondents thought that ‘some small changes may be required, but the system is broadly sustainable in the next 20 to 30 years’. This is in contrast to the other markets, where ‘unsustainability’ remains the major theme. Respondents from Taiwan were the least positive, with over 90% of respondents indicating that significant changes or a complete overhaul would be required to put the system on the path towards sustainability.
Before understanding the nature of the changes required, it is desirable to understand the causes of unsustainability. The overriding theme from all surveyed markets was that there is no single cause of unsustainability; a combination of many factors (to borrow a cliché, a ‘perfect storm’) appears to be contributing to the negative opinions regarding the future prospects of these systems, absent of significant change.
Figure 10 summarises the results of the survey in this area.
FIGURE 10: ‘WHY IS THE SYSTEM UNSUSTAINABLE?’8
8 Respondents had been asked to rank the most important causes of unsustainability . A simple algorithm was applied to score these choices, with the top ranked choices being given more weighting .
34%
27%
11%
14%
30%
46%
9%
17%
0%13%
Yes, the current system should be sustainable for the next 20 to 30 years
Some small changes may be required, but the system isbroadly sustainable in the next 20 to 30 years
The system needs a complete overhaul in order to survive the next 20 to 30 years
Significant changes are required inthe next 20 to 30 years
I have no strong opinion on this matter
% of respondents selected
Australia Others
0% 5% 10% 15% 20% 25% 30% 35% 40% 45% 50%
13%13%
10%14%
24%28%
21%25%
18%14%
10%10%
Insufficient rules to force government/employersto ensure schemes are fully funded
Promised benefits are too generous
Insufficient individual/personal contribution
Shifting demographics, e.g., ageing population
Tax treatment of retirement benefitsis too generous
Retirement age (or age where benefits can be accessed) is too low
% of respondents selected
Australia Others
0% 5% 10% 15% 20% 25% 30%
MILLIMAN RESEARCH REPORT
Asia retirement income report 17 MAY 2017
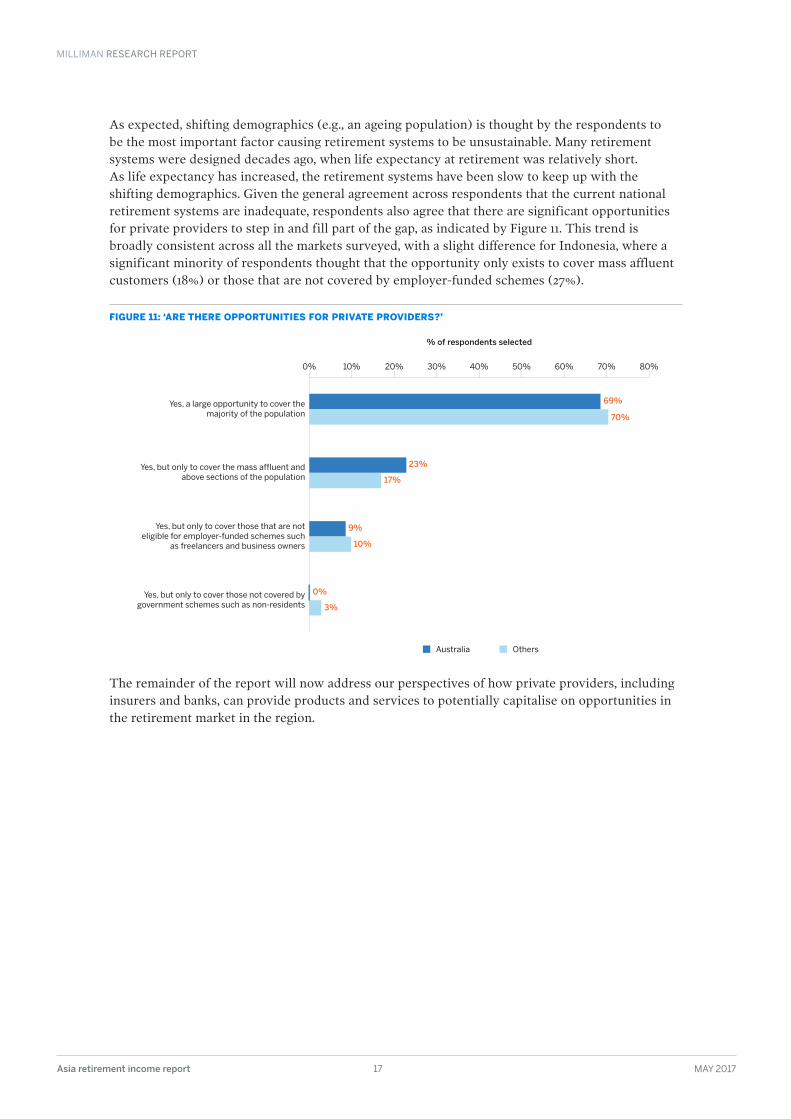
As expected, shifting demographics (e.g., an ageing population) is thought by the respondents to be the most important factor causing retirement systems to be unsustainable. Many retirement systems were designed decades ago, when life expectancy at retirement was relatively short. As life expectancy has increased, the retirement systems have been slow to keep up with the shifting demographics. Given the general agreement across respondents that the current national retirement systems are inadequate, respondents also agree that there are significant opportunities for private providers to step in and fill part of the gap, as indicated by Figure 11. This trend is broadly consistent across all the markets surveyed, with a slight difference for Indonesia, where a significant minority of respondents thought that the opportunity only exists to cover mass affluent customers (18%) or those that are not covered by employer-funded schemes (27%).
FIGURE 11: ‘ARE THERE OPPORTUNITIES FOR PRIVATE PROVIDERS?’
The remainder of the report will now address our perspectives of how private providers, including insurers and banks, can provide products and services to potentially capitalise on opportunities in the retirement market in the region.
70%
23%
61% 69%
0%
3%
10%
9%
17%
Yes, a large opportunity to cover themajority of the population
Yes, but only to cover the mass affluent andabove sections of the population
Yes, but only to cover those that are noteligible for employer-funded schemes such
as freelancers and business owners
Yes, but only to cover those not covered by government schemes such as non-residents
% of respondents selected
Australia Others
0% 10% 20% 30% 40% 50% 60% 70% 80%
MILLIMAN RESEARCH REPORT
Asia retirement income report 18 MAY 2017
Products and propositionsThe previous section established the potential for private sector involvement in the retirement income market in most, if not all, markets surveyed. This section will discuss the natural follow-on questions:
· In what way should the private market participate?
· What products and services should private sector providers offer?
To begin answering these questions, we first examine a more fundamental question—what do consumers need and want?
CONSUMER NEEDSTo determine the extent of income needed during retirement, it is important to understand the change in consumer spending patterns in the different phases of retirement, namely early retirement, middle retirement, and late retirement. These phases are typically characterised by:
· Early retirement: General good health and the ability to continue working on a full time or part time basis.
· Middle retirement: Slowly declining physical fitness, with more emphasis on health spending.
· Late retirement: Declining physical fitness, increased instances and severity of medical ailments, and the late stages of life.
· In addition, retirement income and expenditure within each of these phases can be further divided into:
− Essential: Income required to meet core day-to-day living needs, e.g., housing costs, food, travel.
− Discretionary: Less frequent income needs for various activities such as holidays, leisure activities, and lump-sum purchases.
− Philanthropic/bequest: Savings set aside for purposes other than retirement income, including potential bequests to relatives.
Importantly, the proportionate split between these expenditure categories varies over time and is dependent on the circumstances of the individual or household. According to HSBC’s 2016 global study on retirement,9 household bills and leisure/entertainment costs are always likely to be financial outgoings for people of all ages, while people in their 30s and 40s are more likely to be financially supporting others and in debt compared with people aged 60 or over.
The DBS-Manulife Retirement Wellness Study10 stated that pre-retirees in some of the more developed markets in Asia (e.g., Hong Kong, Singapore, and Taiwan) felt they were relatively less prepared for all aspects of retirement compared with the more developing markets (China, India, and Indonesia). For example, in that study 38% of Singaporeans are worried about their ability to afford medical costs when they retire, while less than one in three respondents for Hong Kong are confident they can afford to pay for their healthcare and medical costs. We would suggest, however, that pre-retirees in the developing markets have had less exposure to the need for retirement planning and are perhaps less aware of their potential retirement needs.
9 HSBC (2016) . The Future of Retirement - Generations and Journeys . Global Report .
10 DBS & Manulife (2016) . DBS-Manulife Retirement Wellness Study .
MILLIMAN RESEARCH REPORT
Asia retirement income report 19 MAY 2017
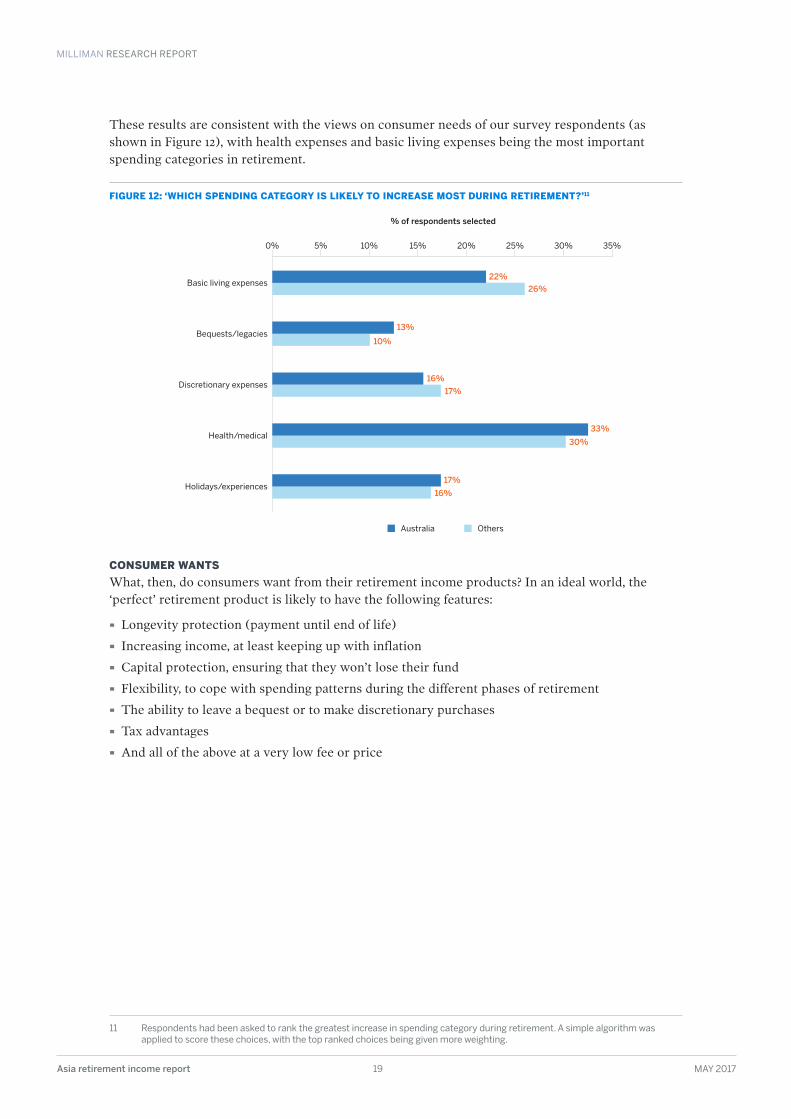
These results are consistent with the views on consumer needs of our survey respondents (as shown in Figure 12), with health expenses and basic living expenses being the most important spending categories in retirement.
FIGURE 12: ‘WHICH SPENDING CATEGORY IS LIKELY TO INCREASE MOST DURING RETIREMENT?’11
CONSUMER WANTSWhat, then, do consumers want from their retirement income products? In an ideal world, the ‘perfect’ retirement product is likely to have the following features:
· Longevity protection (payment until end of life)
· Increasing income, at least keeping up with inflation
· Capital protection, ensuring that they won’t lose their fund
· Flexibility, to cope with spending patterns during the different phases of retirement
· The ability to leave a bequest or to make discretionary purchases
· Tax advantages
· And all of the above at a very low fee or price
11 Respondents had been asked to rank the greatest increase in spending category during retirement . A simple algorithm was applied to score these choices, with the top ranked choices being given more weighting .
13%
10%
22%
26%
30%
33%
16%
17%
17%
16%
Basic living expenses
Bequests/legacies
Discretionary expenses
Health/medical
Holidays/experiences
% of respondents selected
Australia Others
0% 5% 10% 15% 20% 25% 30% 35%
MILLIMAN RESEARCH REPORT
Asia retirement income report 20 MAY 2017
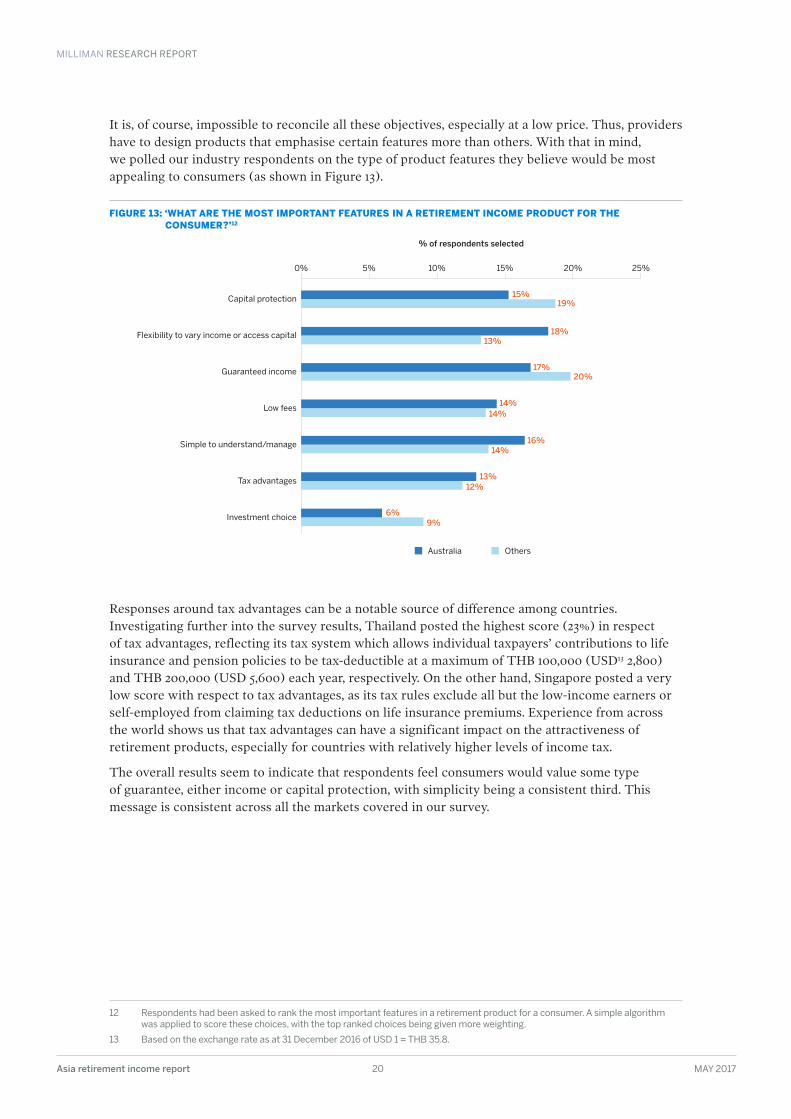
It is, of course, impossible to reconcile all these objectives, especially at a low price. Thus, providers have to design products that emphasise certain features more than others. With that in mind, we polled our industry respondents on the type of product features they believe would be most appealing to consumers (as shown in Figure 13).
FIGURE 13: ‘WHAT ARE THE MOST IMPORTANT FEATURES IN A RETIREMENT INCOME PRODUCT FOR THE CONSUMER?’12
Responses around tax advantages can be a notable source of difference among countries. Investigating further into the survey results, Thailand posted the highest score (23%) in respect of tax advantages, reflecting its tax system which allows individual taxpayers’ contributions to life insurance and pension policies to be tax-deductible at a maximum of THB 100,000 (USD13 2,800) and THB 200,000 (USD 5,600) each year, respectively. On the other hand, Singapore posted a very low score with respect to tax advantages, as its tax rules exclude all but the low-income earners or self-employed from claiming tax deductions on life insurance premiums. Experience from across the world shows us that tax advantages can have a significant impact on the attractiveness of retirement products, especially for countries with relatively higher levels of income tax.
The overall results seem to indicate that respondents feel consumers would value some type of guarantee, either income or capital protection, with simplicity being a consistent third. This message is consistent across all the markets covered in our survey.
12 Respondents had been asked to rank the most important features in a retirement product for a consumer . A simple algorithm was applied to score these choices, with the top ranked choices being given more weighting .
13 Based on the exchange rate as at 31 December 2016 of USD 1 = THB 35 .8 .
13%
17%
15%19%
18%
14%16%
12%13%
9%6%
14%14%
20%
Capital protection
Flexibility to vary income or access capital
Low fees
Guaranteed income
Simple to understand/manage
Tax advantages
Investment choice
% of respondents selected
Australia Others
0% 5% 10% 15% 20% 25%
MILLIMAN RESEARCH REPORT
Asia retirement income report 21 MAY 2017
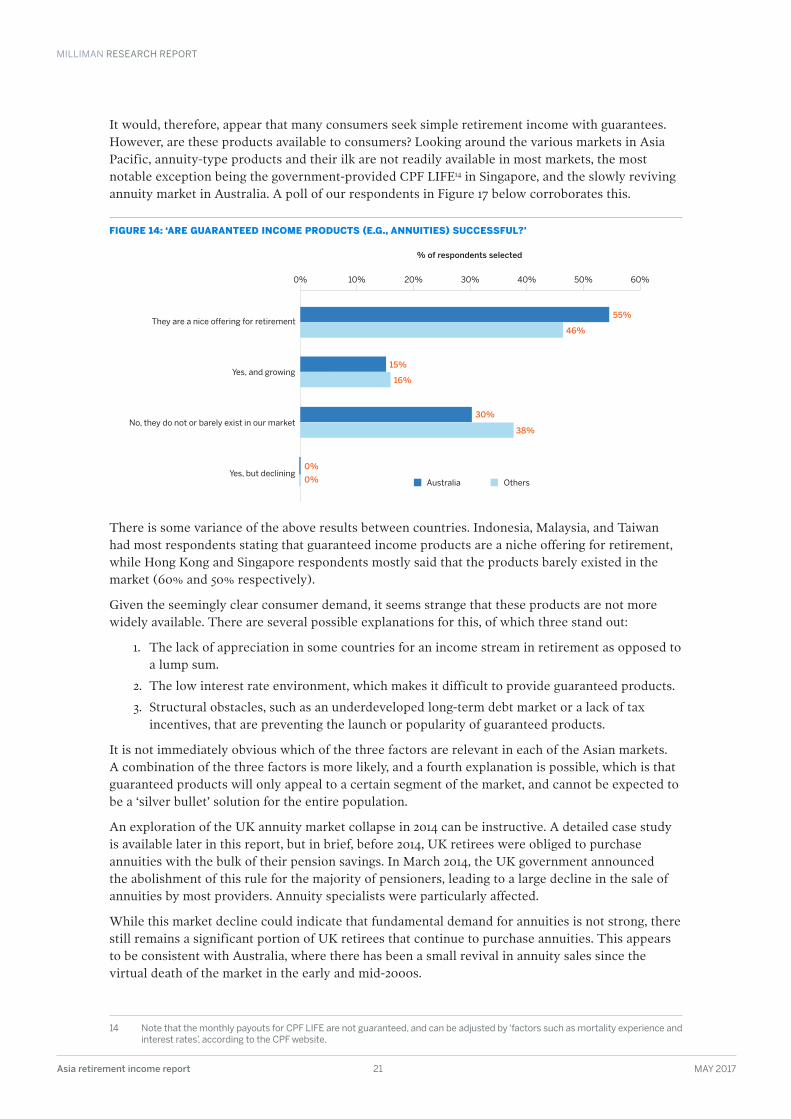
It would, therefore, appear that many consumers seek simple retirement income with guarantees. However, are these products available to consumers? Looking around the various markets in Asia Pacific, annuity-type products and their ilk are not readily available in most markets, the most notable exception being the government-provided CPF LIFE14 in Singapore, and the slowly reviving annuity market in Australia. A poll of our respondents in Figure 17 below corroborates this.
FIGURE 14: ‘ARE GUARANTEED INCOME PRODUCTS (E .G ., ANNUITIES) SUCCESSFUL?’
There is some variance of the above results between countries. Indonesia, Malaysia, and Taiwan had most respondents stating that guaranteed income products are a niche offering for retirement, while Hong Kong and Singapore respondents mostly said that the products barely existed in the market (60% and 50% respectively).
Given the seemingly clear consumer demand, it seems strange that these products are not more widely available. There are several possible explanations for this, of which three stand out:
1. The lack of appreciation in some countries for an income stream in retirement as opposed to a lump sum.
2. The low interest rate environment, which makes it difficult to provide guaranteed products.
3. Structural obstacles, such as an underdeveloped long-term debt market or a lack of tax incentives, that are preventing the launch or popularity of guaranteed products.
It is not immediately obvious which of the three factors are relevant in each of the Asian markets. A combination of the three factors is more likely, and a fourth explanation is possible, which is that guaranteed products will only appeal to a certain segment of the market, and cannot be expected to be a ‘silver bullet’ solution for the entire population.
An exploration of the UK annuity market collapse in 2014 can be instructive. A detailed case study is available later in this report, but in brief, before 2014, UK retirees were obliged to purchase annuities with the bulk of their pension savings. In March 2014, the UK government announced the abolishment of this rule for the majority of pensioners, leading to a large decline in the sale of annuities by most providers. Annuity specialists were particularly affected.
While this market decline could indicate that fundamental demand for annuities is not strong, there still remains a significant portion of UK retirees that continue to purchase annuities. This appears to be consistent with Australia, where there has been a small revival in annuity sales since the virtual death of the market in the early and mid-2000s.
14 Note that the monthly payouts for CPF LIFE are not guaranteed, and can be adjusted by ‘factors such as mortality experience and interest rates’, according to the CPF website .
16%
30%
55%
46%
15%
0%
0%
38%
They are a nice offering for retirement
Yes, and growing
No, they do not or barely exist in our market
Yes, but declining
% of respondents selected
Australia Others
0% 10% 20% 30% 40% 50% 60%
MILLIMAN RESEARCH REPORT
Asia retirement income report 22 MAY 2017
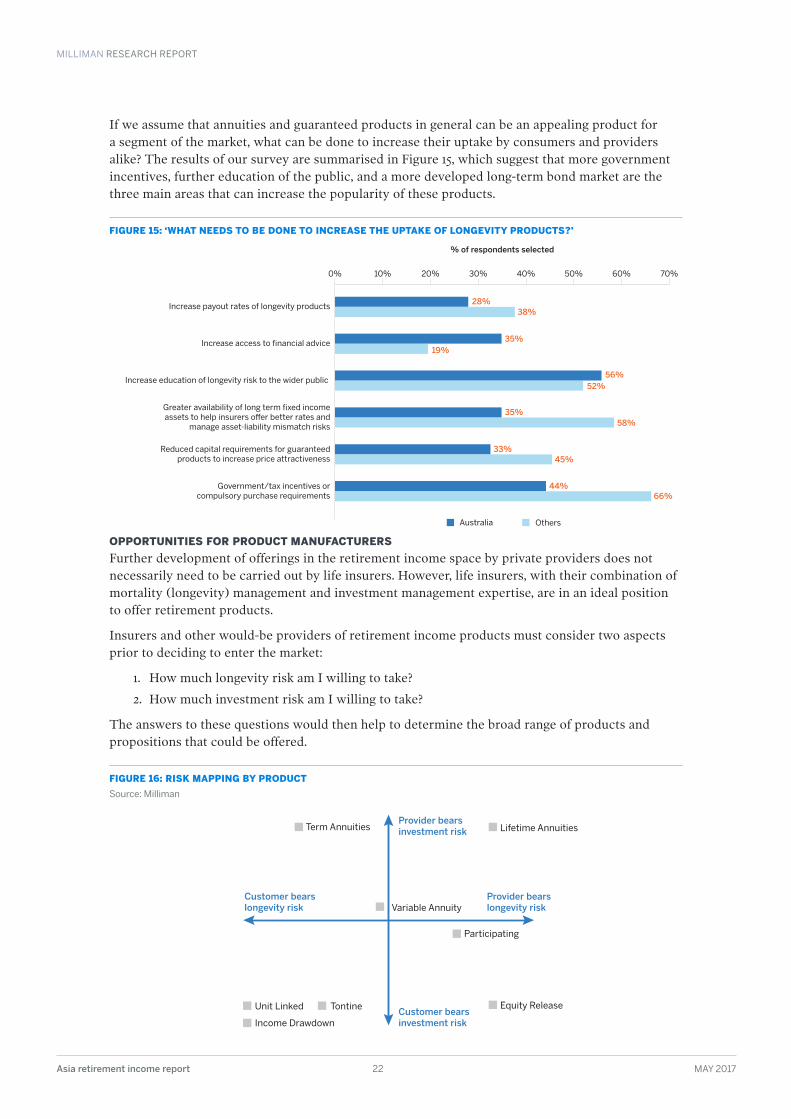
If we assume that annuities and guaranteed products in general can be an appealing product for a segment of the market, what can be done to increase their uptake by consumers and providers alike? The results of our survey are summarised in Figure 15, which suggest that more government incentives, further education of the public, and a more developed long-term bond market are the three main areas that can increase the popularity of these products.
FIGURE 15: ‘WHAT NEEDS TO BE DONE TO INCREASE THE UPTAKE OF LONGEVITY PRODUCTS?’
OPPORTUNITIES FOR PRODUCT MANUFACTURERSFurther development of offerings in the retirement income space by private providers does not necessarily need to be carried out by life insurers. However, life insurers, with their combination of mortality (longevity) management and investment management expertise, are in an ideal position to offer retirement products.
Insurers and other would-be providers of retirement income products must consider two aspects prior to deciding to enter the market:
1. How much longevity risk am I willing to take?
2. How much investment risk am I willing to take?
The answers to these questions would then help to determine the broad range of products and propositions that could be offered.
FIGURE 16: RISK MAPPING BY PRODUCTSource: Milliman
Term Annuities
Variable Annuity
Unit Linked Tontine Equity Release
Income Drawdown
Participating
Provider bearsinvestment risk
Customer bearsinvestment risk
Customer bearslongevity risk
Provider bearslongevity risk
Lifetime Annuities
35%19%
28%38%
58%35%
56%52%
33%45%
44%66%
Increase payout rates of longevity products
Increase access to �nancial advice
Increase education of longevity risk to the wider public
Greater availability of long term �xed income assets to help insurers o�er better rates and
manage asset-liability mismatch risks
Reduced capital requirements for guaranteedproducts to increase price attractiveness
Government/tax incentives orcompulsory purchase requirements
% of respondents selected
Australia Others
0% 10% 20% 30% 40% 50% 60% 70%
MILLIMAN RESEARCH REPORT
Asia retirement income report 23 MAY 2017
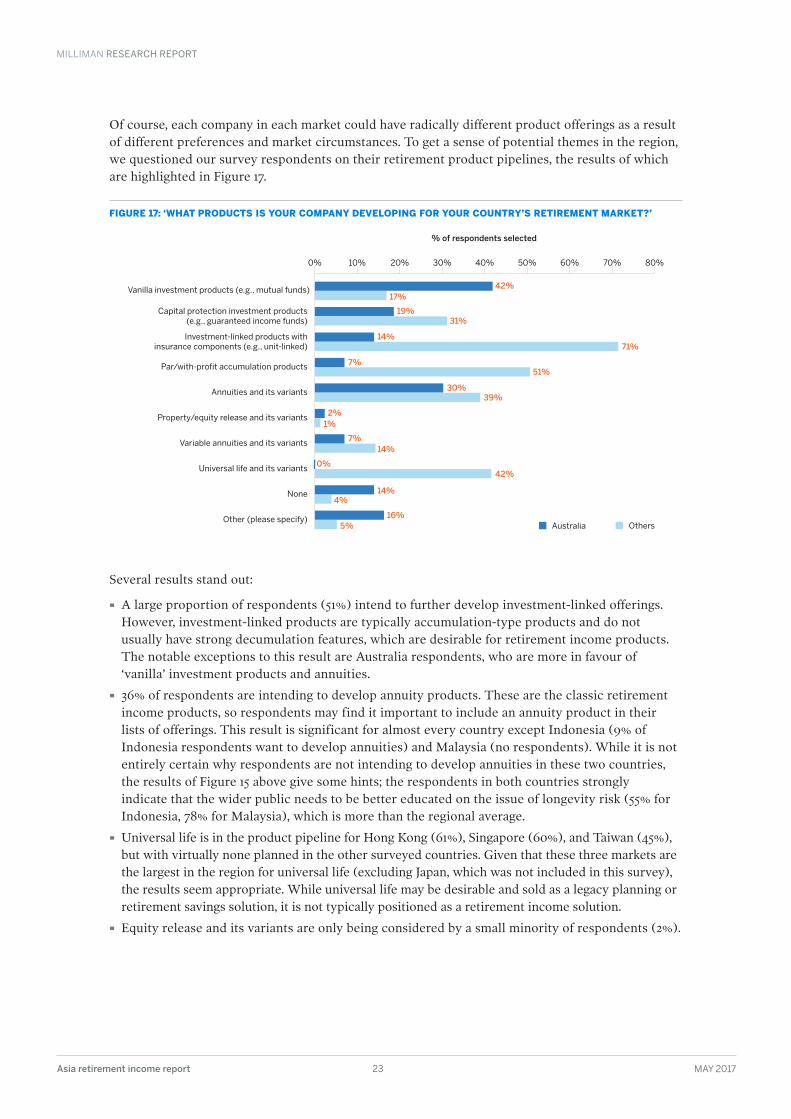
Of course, each company in each market could have radically different product offerings as a result of different preferences and market circumstances. To get a sense of potential themes in the region, we questioned our survey respondents on their retirement product pipelines, the results of which are highlighted in Figure 17.
FIGURE 17: ‘WHAT PRODUCTS IS YOUR COMPANY DEVELOPING FOR YOUR COUNTRY’S RETIREMENT MARKET?’
Several results stand out:
· A large proportion of respondents (51%) intend to further develop investment-linked offerings. However, investment-linked products are typically accumulation-type products and do not usually have strong decumulation features, which are desirable for retirement income products. The notable exceptions to this result are Australia respondents, who are more in favour of ‘vanilla’ investment products and annuities.
· 36% of respondents are intending to develop annuity products. These are the classic retirement income products, so respondents may find it important to include an annuity product in their lists of offerings. This result is significant for almost every country except Indonesia (9% of Indonesia respondents want to develop annuities) and Malaysia (no respondents). While it is not entirely certain why respondents are not intending to develop annuities in these two countries, the results of Figure 15 above give some hints; the respondents in both countries strongly indicate that the wider public needs to be better educated on the issue of longevity risk (55% for Indonesia, 78% for Malaysia), which is more than the regional average.
· Universal life is in the product pipeline for Hong Kong (61%), Singapore (60%), and Taiwan (45%), but with virtually none planned in the other surveyed countries. Given that these three markets are the largest in the region for universal life (excluding Japan, which was not included in this survey), the results seem appropriate. While universal life may be desirable and sold as a legacy planning or retirement savings solution, it is not typically positioned as a retirement income solution.
· Equity release and its variants are only being considered by a small minority of respondents (2%).
17%
31%
42%
19%
7%51%
30%39%
2%1%
7%14%
42%0%
14%4%
16%5%
14%71%
Vanilla investment products (e.g., mutual funds)
Property/equity release and its variants
Variable annuities and its variants
Universal life and its variants
None
Capital protection investment products (e.g., guaranteed income funds)
Investment-linked products with insurance components (e.g., unit-linked)
Other (please specify)
Par/with-profit accumulation products
Annuities and its variants
% of respondents selected
Australia Others
0% 10% 20% 30% 40% 50% 60% 70% 80%
MILLIMAN RESEARCH REPORT
Asia retirement income report 24 MAY 2017
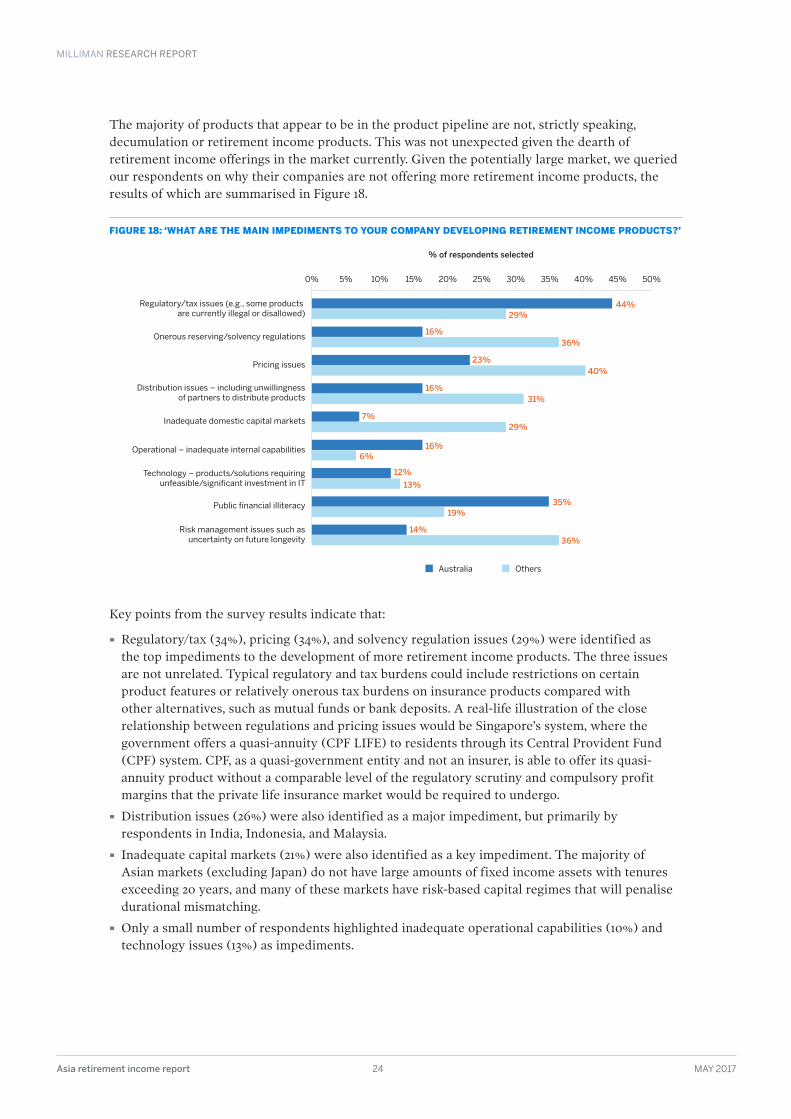
The majority of products that appear to be in the product pipeline are not, strictly speaking, decumulation or retirement income products. This was not unexpected given the dearth of retirement income offerings in the market currently. Given the potentially large market, we queried our respondents on why their companies are not offering more retirement income products, the results of which are summarised in Figure 18.
FIGURE 18: ‘WHAT ARE THE MAIN IMPEDIMENTS TO YOUR COMPANY DEVELOPING RETIREMENT INCOME PRODUCTS?’
Key points from the survey results indicate that:
· Regulatory/tax (34%), pricing (34%), and solvency regulation issues (29%) were identified as the top impediments to the development of more retirement income products. The three issues are not unrelated. Typical regulatory and tax burdens could include restrictions on certain product features or relatively onerous tax burdens on insurance products compared with other alternatives, such as mutual funds or bank deposits. A real-life illustration of the close relationship between regulations and pricing issues would be Singapore’s system, where the government offers a quasi-annuity (CPF LIFE) to residents through its Central Provident Fund (CPF) system. CPF, as a quasi-government entity and not an insurer, is able to offer its quasi-annuity product without a comparable level of the regulatory scrutiny and compulsory profit margins that the private life insurance market would be required to undergo.
· Distribution issues (26%) were also identified as a major impediment, but primarily by respondents in India, Indonesia, and Malaysia.
· Inadequate capital markets (21%) were also identified as a key impediment. The majority of Asian markets (excluding Japan) do not have large amounts of fixed income assets with tenures exceeding 20 years, and many of these markets have risk-based capital regimes that will penalise durational mismatching.
· Only a small number of respondents highlighted inadequate operational capabilities (10%) and technology issues (13%) as impediments.
29%
36%
44%
16%
7%
40%
29%
31%
6%
12%
13%
16%
35%19%
14%36%
16%
23%
Regulatory/tax issues (e.g., some products are currently illegal or disallowed)
Operational – inadequate internal capabilities
Technology – products/solutions requiring unfeasible/significant investment in IT
Public financial illiteracy
Onerous reserving/solvency regulations
Pricing issues
Risk management issues such as uncertainty on future longevity
Distribution issues – including unwillingnessof partners to distribute products
Inadequate domestic capital markets
% of respondents selected
Australia Others
0% 5% 10% 15% 20% 25% 30% 35% 40% 45% 50%
MILLIMAN RESEARCH REPORT
Asia retirement income report 25 MAY 2017
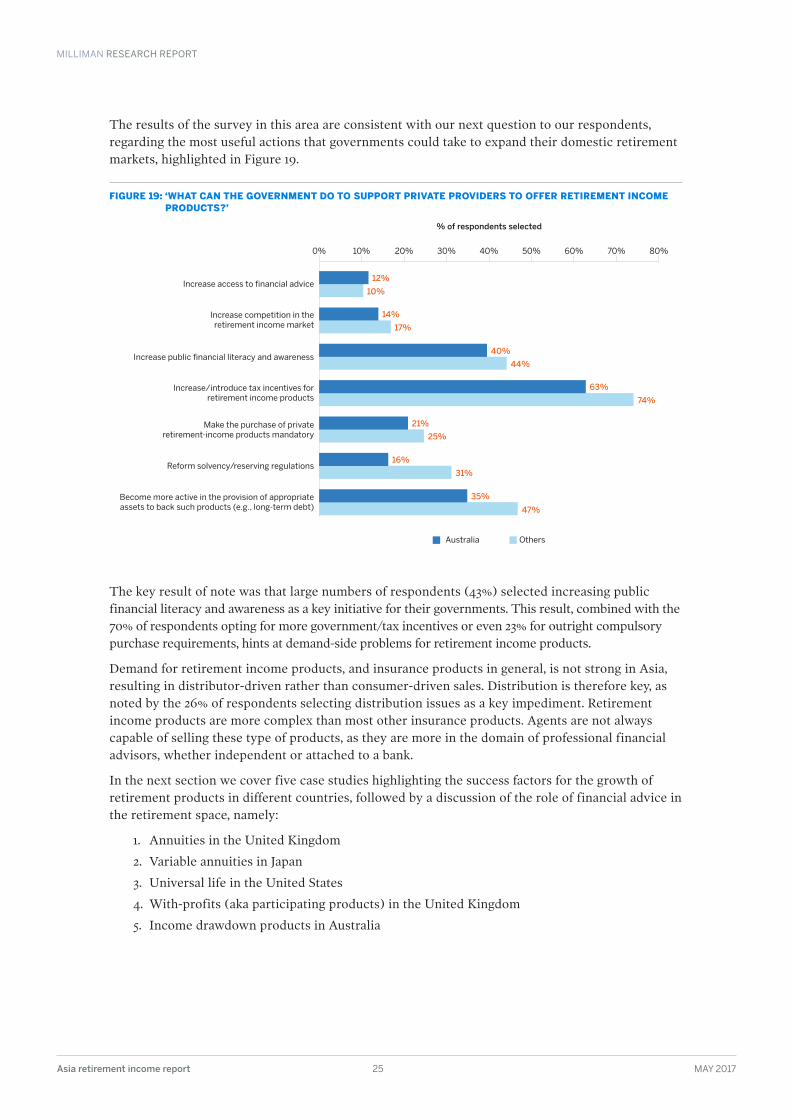
The results of the survey in this area are consistent with our next question to our respondents, regarding the most useful actions that governments could take to expand their domestic retirement markets, highlighted in Figure 19.
FIGURE 19: ‘WHAT CAN THE GOVERNMENT DO TO SUPPORT PRIVATE PROVIDERS TO OFFER RETIREMENT INCOME PRODUCTS?’
The key result of note was that large numbers of respondents (43%) selected increasing public financial literacy and awareness as a key initiative for their governments. This result, combined with the 70% of respondents opting for more government/tax incentives or even 23% for outright compulsory purchase requirements, hints at demand-side problems for retirement income products.
Demand for retirement income products, and insurance products in general, is not strong in Asia, resulting in distributor-driven rather than consumer-driven sales. Distribution is therefore key, as noted by the 26% of respondents selecting distribution issues as a key impediment. Retirement income products are more complex than most other insurance products. Agents are not always capable of selling these type of products, as they are more in the domain of professional financial advisors, whether independent or attached to a bank.
In the next section we cover five case studies highlighting the success factors for the growth of retirement products in different countries, followed by a discussion of the role of financial advice in the retirement space, namely:
1. Annuities in the United Kingdom
2. Variable annuities in Japan
3. Universal life in the United States
4. With-profits (aka participating products) in the United Kingdom
5. Income drawdown products in Australia
10%
17%
12%
14%
74%
63%
21%
25%
16%
31%
35%
47%
40%
44%
Increase access to financial advice
Reform solvency/reserving regulations
Become more active in the provision of appropriate assets to back such products (e.g., long-term debt)
Increase competition in the retirement income market
Increase public financial literacy and awareness
Increase/introduce tax incentives for retirement income products
Make the purchase of private retirement-income products mandatory
% of respondents selected
Australia Others
0% 10% 20% 30% 40% 50% 60% 70% 80%

MILLIMAN RESEARCH REPORT
Asia retirement income report 26 MAY 2017
CASE STUDY: ANNUITIES IN THE UNITED KINGDOMA brief history19 March 2014 was a historic day for the UK retirement market. In his budget, Chancellor George Osborne announced that the government would ‘introduce the most fundamental reform in almost a century to the way people access their pensions, by abolishing the effective requirement to buy an annuity’. After April 2015, the long-standing link between the pension pot and annuity purchase at retirement was effectively severed.
A ‘requirement to annuitise’ tax-relieved savings dates back to the Finance Act 1921. The Finance Act 1956 made it a requirement to annuitise between the ages of 60 and 70. The upper age limit was increased to 75 by the Finance Act 1976.
The Open Market Option (OMO), under which people did not have to purchase their annuities from providers with whom they saved, has been available since 1978 and firms have been obliged to inform their customers of this option since 2002.
The main alternatives to buying an annuity before the April 2015 changes were:
· People with small amounts of overall pension saving, or small individual pension pots, had the option to take them as a lump sum once they reached age 60.
· Income drawdown, which allowed individuals to draw an income from their funds while leaving the rest invested. There was a cap on the amount they could draw down each year. Even with income drawdown there was a requirement in practice to annuitise no later than age 75.
In advance of the more radical move in April 2015, the UK government introduced changes from 27 March 2014, increasing the size of pension pots that could be taken as a lump sum and introducing more flexibility into income drawdown arrangements.
How effective was this product in meeting consumer needs?The size of the UK annuity market before April 2015 did not have much to do with whether or not an annuity met consumer needs. Until April 2015, most people with a defined contribution (DC) pension bought an annuity because pension tax legislation strongly incentivised this market, with a 55% tax charge to lump-sum or flexible payments in most cases (excluding income payments under drawdown up to the limits set by the Government Actuary’s Department).
From the 1970s to the mid-1990s, annuities provided very attractive levels of income for a given purchase price. However, falling market interest rates and rapid improvements in longevity led to a steady decline in annuity rates, and a perception that new annuities were poor value for money.
In the 2014 budget, George Osborne said reforms were needed because annuities were ‘no longer the right product for everyone’ and the market was not working in the best interests of all consumers. He said:
As the nature of retirement changes, annuities are no longer the right product for everyone. People are living longer and their needs are becoming more varied. Our reforms to the State Pension and the triple lock guarantee give certainty to pensioners on what they will receive from the state. The introduction of Automatic Enrolment will dramatically increase the amount of pension savings. The landscape has completely changed. Moreover, the annuities market is currently not working in the best interests of all consumers. It is neither competitive nor innovative and some consumers are getting a poor deal. It is time for a bold, modern and progressive reform.
Annuities were, and continue to be, a product that is right for some people.
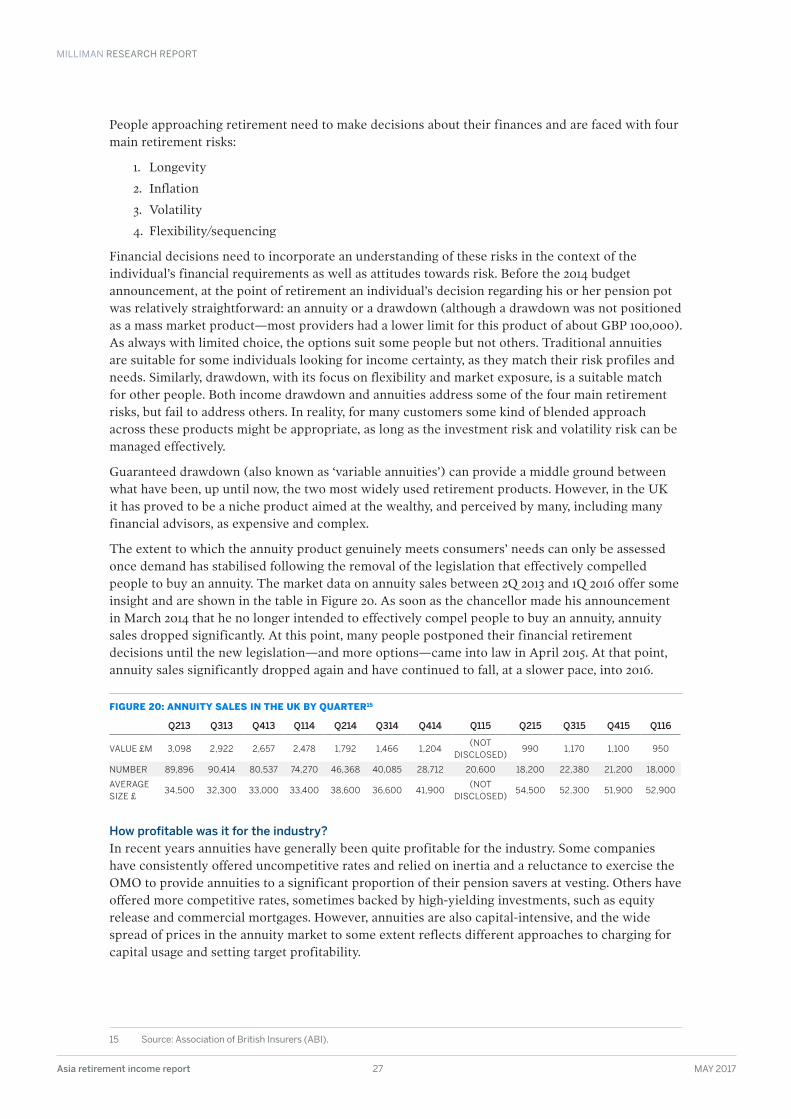
MILLIMAN RESEARCH REPORT
Asia retirement income report 27 MAY 2017
People approaching retirement need to make decisions about their finances and are faced with four main retirement risks:
1. Longevity
2. Inflation
3. Volatility
4. Flexibility/sequencing
Financial decisions need to incorporate an understanding of these risks in the context of the individual’s financial requirements as well as attitudes towards risk. Before the 2014 budget announcement, at the point of retirement an individual’s decision regarding his or her pension pot was relatively straightforward: an annuity or a drawdown (although a drawdown was not positioned as a mass market product—most providers had a lower limit for this product of about GBP 100,000). As always with limited choice, the options suit some people but not others. Traditional annuities are suitable for some individuals looking for income certainty, as they match their risk profiles and needs. Similarly, drawdown, with its focus on flexibility and market exposure, is a suitable match for other people. Both income drawdown and annuities address some of the four main retirement risks, but fail to address others. In reality, for many customers some kind of blended approach across these products might be appropriate, as long as the investment risk and volatility risk can be managed effectively.
Guaranteed drawdown (also known as ‘variable annuities’) can provide a middle ground between what have been, up until now, the two most widely used retirement products. However, in the UK it has proved to be a niche product aimed at the wealthy, and perceived by many, including many financial advisors, as expensive and complex.
The extent to which the annuity product genuinely meets consumers’ needs can only be assessed once demand has stabilised following the removal of the legislation that effectively compelled people to buy an annuity. The market data on annuity sales between 2Q 2013 and 1Q 2016 offer some insight and are shown in the table in Figure 20. As soon as the chancellor made his announcement in March 2014 that he no longer intended to effectively compel people to buy an annuity, annuity sales dropped significantly. At this point, many people postponed their financial retirement decisions until the new legislation—and more options—came into law in April 2015. At that point, annuity sales significantly dropped again and have continued to fall, at a slower pace, into 2016.
FIGURE 20: ANNUITY SALES IN THE UK BY QUARTER15
Q213 Q313 Q413 Q114 Q214 Q314 Q414 Q115 Q215 Q315 Q415 Q116
VALUE £M 3,098 2,922 2,657 2,478 1,792 1,466 1,204(NOT
DISCLOSED)990 1,170 1,100 950
NUMBER 89,896 90,414 80,537 74,270 46,368 40,085 28,712 20,600 18,200 22,380 21,200 18,000
AVERAGE SIZE £
34,500 32,300 33,000 33,400 38,600 36,600 41,900(NOT
DISCLOSED)54,500 52,300 51,900 52,900
How profitable was it for the industry?In recent years annuities have generally been quite profitable for the industry. Some companies have consistently offered uncompetitive rates and relied on inertia and a reluctance to exercise the OMO to provide annuities to a significant proportion of their pension savers at vesting. Others have offered more competitive rates, sometimes backed by high-yielding investments, such as equity release and commercial mortgages. However, annuities are also capital-intensive, and the wide spread of prices in the annuity market to some extent reflects different approaches to charging for capital usage and setting target profitability.
15 Source: Association of British Insurers (ABI) .
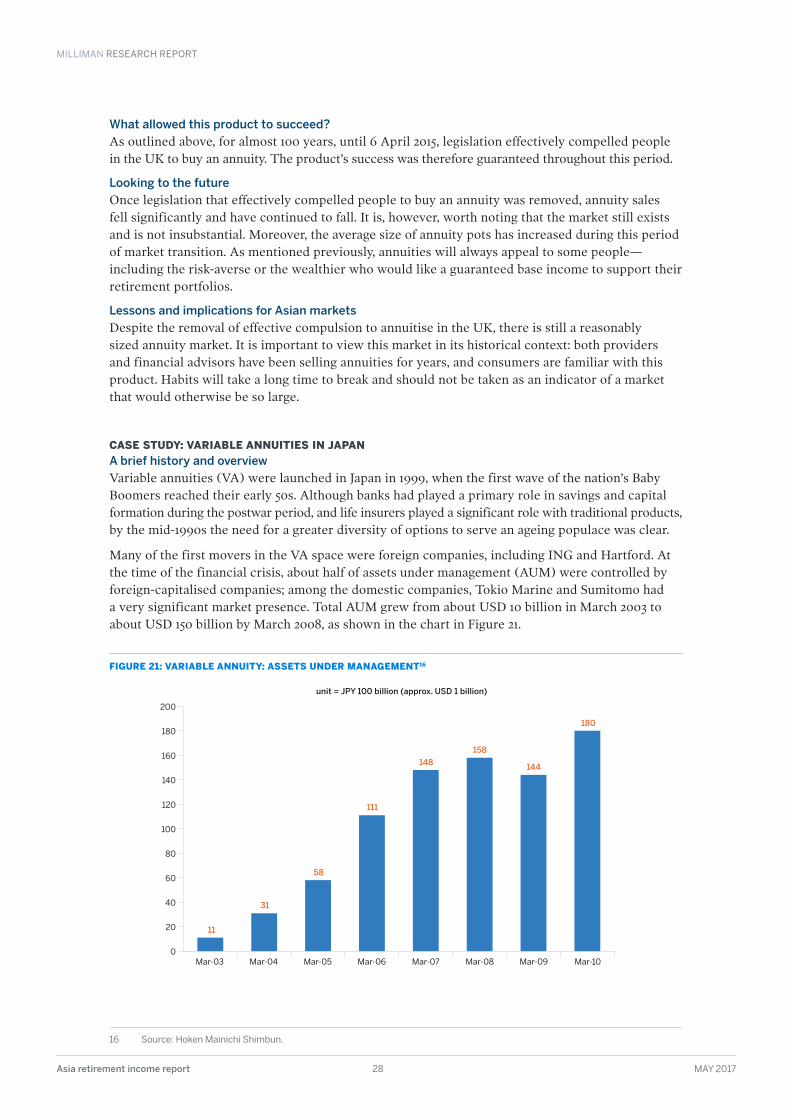
MILLIMAN RESEARCH REPORT
Asia retirement income report 28 MAY 2017
What allowed this product to succeed?As outlined above, for almost 100 years, until 6 April 2015, legislation effectively compelled people in the UK to buy an annuity. The product’s success was therefore guaranteed throughout this period.
Looking to the futureOnce legislation that effectively compelled people to buy an annuity was removed, annuity sales fell significantly and have continued to fall. It is, however, worth noting that the market still exists and is not insubstantial. Moreover, the average size of annuity pots has increased during this period of market transition. As mentioned previously, annuities will always appeal to some people—including the risk-averse or the wealthier who would like a guaranteed base income to support their retirement portfolios.
Lessons and implications for Asian marketsDespite the removal of effective compulsion to annuitise in the UK, there is still a reasonably sized annuity market. It is important to view this market in its historical context: both providers and financial advisors have been selling annuities for years, and consumers are familiar with this product. Habits will take a long time to break and should not be taken as an indicator of a market that would otherwise be so large.
CASE STUDY: VARIABLE ANNUITIES IN JAPANA brief history and overviewVariable annuities (VA) were launched in Japan in 1999, when the first wave of the nation’s Baby Boomers reached their early 50s. Although banks had played a primary role in savings and capital formation during the postwar period, and life insurers played a significant role with traditional products, by the mid-1990s the need for a greater diversity of options to serve an ageing populace was clear.
Many of the first movers in the VA space were foreign companies, including ING and Hartford. At the time of the financial crisis, about half of assets under management (AUM) were controlled by foreign-capitalised companies; among the domestic companies, Tokio Marine and Sumitomo had a very significant market presence. Total AUM grew from about USD 10 billion in March 2003 to about USD 150 billion by March 2008, as shown in the chart in Figure 21.
FIGURE 21: VARIABLE ANNUITY: ASSETS UNDER MANAGEMENT16
16 Source: Hoken Mainichi Shimbun .
0
20
40
60
80
100
120
140
160
180
200
11
31
58
111
148
158
180
144
unit = JPY 100 billion (approx. USD 1 billion)
Mar-03 Mar-04 Mar-05 Mar-06 Mar-07 Mar-08 Mar-09 Mar-10
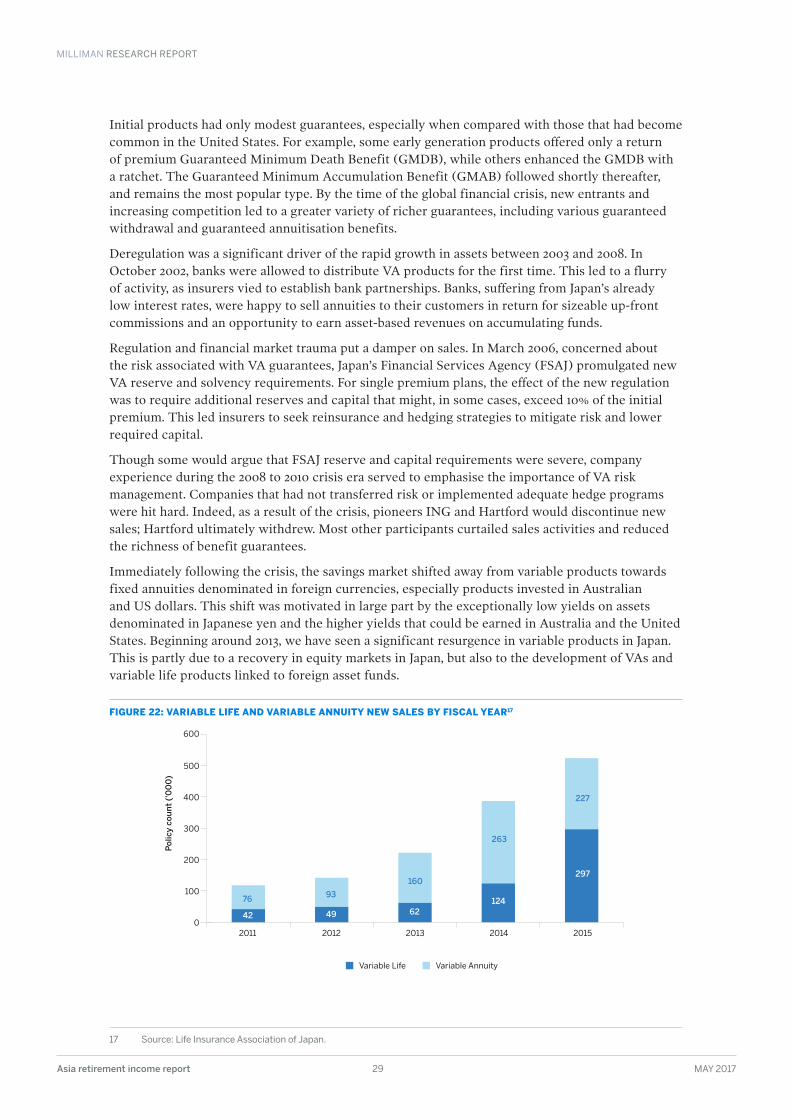
MILLIMAN RESEARCH REPORT
Asia retirement income report 29 MAY 2017
Initial products had only modest guarantees, especially when compared with those that had become common in the United States. For example, some early generation products offered only a return of premium Guaranteed Minimum Death Benefit (GMDB), while others enhanced the GMDB with a ratchet. The Guaranteed Minimum Accumulation Benefit (GMAB) followed shortly thereafter, and remains the most popular type. By the time of the global financial crisis, new entrants and increasing competition led to a greater variety of richer guarantees, including various guaranteed withdrawal and guaranteed annuitisation benefits.
Deregulation was a significant driver of the rapid growth in assets between 2003 and 2008. In October 2002, banks were allowed to distribute VA products for the first time. This led to a flurry of activity, as insurers vied to establish bank partnerships. Banks, suffering from Japan’s already low interest rates, were happy to sell annuities to their customers in return for sizeable up-front commissions and an opportunity to earn asset-based revenues on accumulating funds.
Regulation and financial market trauma put a damper on sales. In March 2006, concerned about the risk associated with VA guarantees, Japan’s Financial Services Agency (FSAJ) promulgated new VA reserve and solvency requirements. For single premium plans, the effect of the new regulation was to require additional reserves and capital that might, in some cases, exceed 10% of the initial premium. This led insurers to seek reinsurance and hedging strategies to mitigate risk and lower required capital.
Though some would argue that FSAJ reserve and capital requirements were severe, company experience during the 2008 to 2010 crisis era served to emphasise the importance of VA risk management. Companies that had not transferred risk or implemented adequate hedge programs were hit hard. Indeed, as a result of the crisis, pioneers ING and Hartford would discontinue new sales; Hartford ultimately withdrew. Most other participants curtailed sales activities and reduced the richness of benefit guarantees.
Immediately following the crisis, the savings market shifted away from variable products towards fixed annuities denominated in foreign currencies, especially products invested in Australian and US dollars. This shift was motivated in large part by the exceptionally low yields on assets denominated in Japanese yen and the higher yields that could be earned in Australia and the United States. Beginning around 2013, we have seen a significant resurgence in variable products in Japan. This is partly due to a recovery in equity markets in Japan, but also to the development of VAs and variable life products linked to foreign asset funds.
FIGURE 22: VARIABLE LIFE AND VARIABLE ANNUITY NEW SALES BY FISCAL YEAR17
17 Source: Life Insurance Association of Japan .
0
100
200
300
400
500
600
2011
76
42
93
49
160
62
263
124
227
297
2012 2013 2014 2015
Po
licy
cou
nt
('0
00
)
Variable Life Variable Annuity
MILLIMAN RESEARCH REPORT
Asia retirement income report 30 MAY 2017
The growth of variable life18 (VL) sales over the past several years has been particularly significant. In reality, the growth of the VL market can be viewed as part of a broader trend in de-risking of Japanese VA products. As low yields have become a global phenomenon, and Bank of Japan policy has pushed risk-free yen returns well into negative territory, the cost of providing rich guarantees on variable annuities has become prohibitive. As a result, the key players in this space have returned to VA products offering moderate guarantees and longer deferral periods. Though typical VA deferral periods had been 10 years, now periods such as 15 years have become the norm. The typical variable whole life is a single premium policy that pays a death benefit for the whole of life—essentially a GMDB VA with lifetime deferral period. This product offers advantages from an estate planning perspective.
How effective was this product in meeting consumer needs?Japanese banks and insurers have primarily targeted older customers for VA sales. They have offered these customers opportunities to diversify away from traditional savings accounts (which earn effectively zero in the current environment), with some degree of tax benefits, and with some degree of protection against downside risk.
However, there is still a large, unmet customer need for retirement savings vehicles, both pre- and post-retirement. A remarkable 55% of Japanese consumer savings still resides in cash and bank deposits. In an era of uncertainty, and very low inflation or moderate deflation, it is easy to understand this choice. Yet it is hard to believe that this is optimal.
Japan as a country faces a difficult dilemma. On the one hand, public health and longevity in Japan are better than ever. However, because of Japan’s low birth rate over the past several decades, there are fewer and fewer workers funding more and more retirees, putting pressure on retirement funding in both government and private sectors. At an individual level, it is more difficult for Japan’s elderly population to count on support from children if they face financial need and as they grow infirmed.
Facing the prospect of long but meagre retirements, it is natural for retirees to invest with great caution. Yet for many Japanese retiring in their 60s, the time horizon for retirement may be 20 or 30 or even 40 years. Long time horizons would typically call for greater diversification and risk taking in an investment strategy.
So while VAs have served a useful niche, we believe that progress to date should be viewed as only a start. The real task of offering investment and longevity risk management services has yet to be met.
How profitable is it for the industry?In the current environment, companies are earning adequate returns if the following criteria are met:
· Large volumes of business
· Control of distribution costs
· Exemplary risk management
· Capital management, typically through a combination of offshore reinsurance and hedging
As noted above, many companies made huge losses on VAs during the global financial crisis. Some have not achieved adequate scale to succeed; others have failed to control capital costs, and are likely selling unprofitable business on a risk-adjusted basis.
18 Variable life insurance, a product commonly found in the United States and Japan, refers to insurance policies that not only provide a death benefit, but also contain a cash value account which can be invested in various investment funds .
MILLIMAN RESEARCH REPORT
Asia retirement income report 31 MAY 2017
What allowed this product to succeed?Although we believe there continues to be significant potential for VAs in Japan, to date they have only been a partial success. Factors that have facilitated some degree of success to date include:
· High-quality bank distributors, albeit at a high cost
· High-quality training provided by insurers to bank staff
· A huge pool of retirement assets
· A dearth of alternative investments
· Unique product features, such as the ‘knock-out’ benefit
· A moderately favourable tax environment
· Ability to manage capital and risk
Looking to the futureTo date, Japanese VAs have been fundamentally accumulation products, even when sales are targeted at senior citizens.
The most significant enhancement that we envision for Japanese VAs is the development of products that are more specifically designed for the payout phase. These products may combine longevity protection with in-fund downside risk protection, so that funds are not severely depleted when withdrawn during market dips.
We also envision the possibility of integrating VAs with other retiree protection needs, notably long-term care and medical needs.
Finally, although the Japanese consumer has tended to prefer simple fund options (most VAs offer a single balanced fund rather than the choice of funds that is common in many markets), we envisage increasing fund choices coupled with VAs and hybrid VA/risk products that are targeted at a younger customer base.
Lessons and implications for Asian marketsUnlike in Japan, VAs do not exist or have insignificant penetration in most of the markets in Asia Pacific (with the exception of South Korea and Taiwan). Given the complexity of the product, there may be regulatory barriers to product approval. Even if approved it may be difficult for this new product type to gain traction in these markets. The Japanese experience has shown that banks are a good distribution channel for this product, particularly when targeting retirees which are customers of the bank.
The main reason for Japan’s large historical VA losses and the collapse of VA sales after the global financial crisis is that Japanese companies generally did not have sufficient risk management in place to manage the guarantees in VAs. As the capabilities of insurers in risk management and the modelling of guarantees have become more developed, we believe that Asian insurers now have the knowledge to avoid the same pitfalls faced by Japanese companies during the crisis (assuming insurers can easily gain access to a liquid derivatives and long-term debt market). Clearly care must be taken to avoid offering aggressive guarantees that can become onerous during a market downturn.
Asian insurers looking into VA can consider product features that are popular in Japan, to get a glimpse of what types of features can potentially be attractive to customers in their own markets in the future.
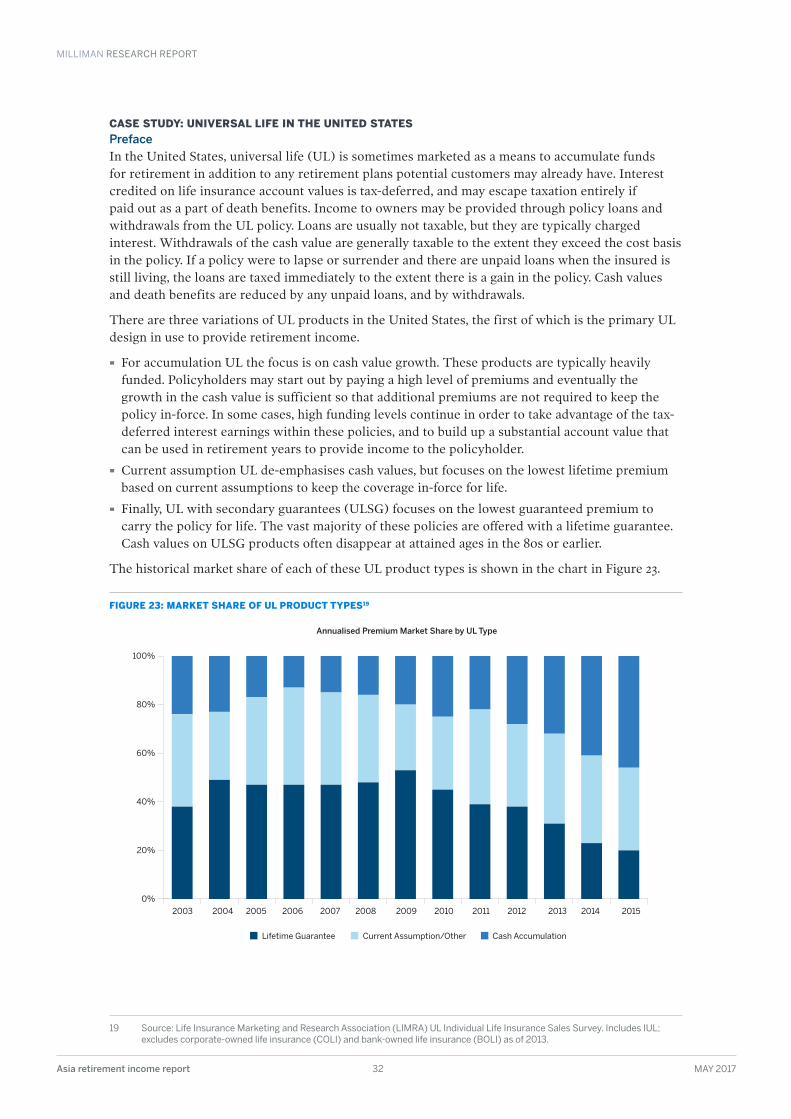
MILLIMAN RESEARCH REPORT
Asia retirement income report 32 MAY 2017
CASE STUDY: UNIVERSAL LIFE IN THE UNITED STATESPrefaceIn the United States, universal life (UL) is sometimes marketed as a means to accumulate funds for retirement in addition to any retirement plans potential customers may already have. Interest credited on life insurance account values is tax-deferred, and may escape taxation entirely if paid out as a part of death benefits. Income to owners may be provided through policy loans and withdrawals from the UL policy. Loans are usually not taxable, but they are typically charged interest. Withdrawals of the cash value are generally taxable to the extent they exceed the cost basis in the policy. If a policy were to lapse or surrender and there are unpaid loans when the insured is still living, the loans are taxed immediately to the extent there is a gain in the policy. Cash values and death benefits are reduced by any unpaid loans, and by withdrawals.
There are three variations of UL products in the United States, the first of which is the primary UL design in use to provide retirement income.
· For accumulation UL the focus is on cash value growth. These products are typically heavily funded. Policyholders may start out by paying a high level of premiums and eventually the growth in the cash value is sufficient so that additional premiums are not required to keep the policy in-force. In some cases, high funding levels continue in order to take advantage of the tax-deferred interest earnings within these policies, and to build up a substantial account value that can be used in retirement years to provide income to the policyholder.
· Current assumption UL de-emphasises cash values, but focuses on the lowest lifetime premium based on current assumptions to keep the coverage in-force for life.
· Finally, UL with secondary guarantees (ULSG) focuses on the lowest guaranteed premium to carry the policy for life. The vast majority of these policies are offered with a lifetime guarantee. Cash values on ULSG products often disappear at attained ages in the 80s or earlier.
The historical market share of each of these UL product types is shown in the chart in Figure 23.
FIGURE 23: MARKET SHARE OF UL PRODUCT TYPES19
19 Source: Life Insurance Marketing and Research Association (LIMRA) UL Individual Life Insurance Sales Survey . Includes IUL; excludes corporate-owned life insurance (COLI) and bank-owned life insurance (BOLI) as of 2013 .
0%
20%
40%
60%
80%
100%
Lifetime Guarantee
Annualised Premium Market Share by UL Type
Cash AccumulationCurrent Assumption/Other
2003 2004 2005 2006 2007 2008 2009 2010 2011 2012 2013 2014 2015
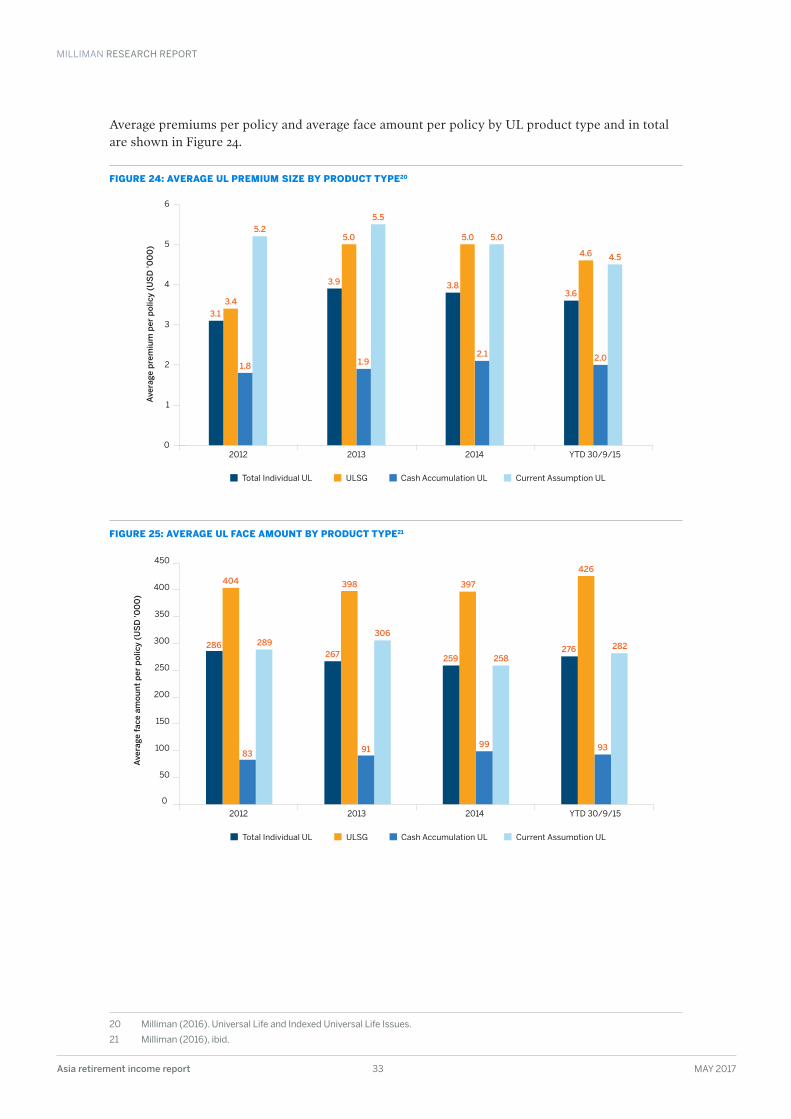
MILLIMAN RESEARCH REPORT
Asia retirement income report 33 MAY 2017
Average premiums per policy and average face amount per policy by UL product type and in total are shown in Figure 24.
FIGURE 24: AVERAGE UL PREMIUM SIZE BY PRODUCT TYPE20
FIGURE 25: AVERAGE UL FACE AMOUNT BY PRODUCT TYPE21
20 Milliman (2016) . Universal Life and Indexed Universal Life Issues .
21 Milliman (2016), ibid .
Total Individual UL
Ave
rage
pre
miu
m p
er p
olic
y (U
SD
'00
0)
Cash Accumulation ULULSG Current Assumption UL
2012 2013 2014 YTD 30/9/150
1
2
3
4
5
6
3.1
3.4
1.8
5.2
3.9
5.0
1.9
5.5
3.8
5.0
2.1
5.0
3.6
4.6
2.0
4.5
Total Individual UL
Ave
rage
face
am
ount
per
pol
icy
(US
D '0
00
)
Cash Accumulation ULULSG Current Assumption UL
2012 2013 2014 YTD 30/9/15
0
50
100
150
200
250
300
350
400
450
83
404 398
286306
267
91
289
99
259
93
397
426
258282276
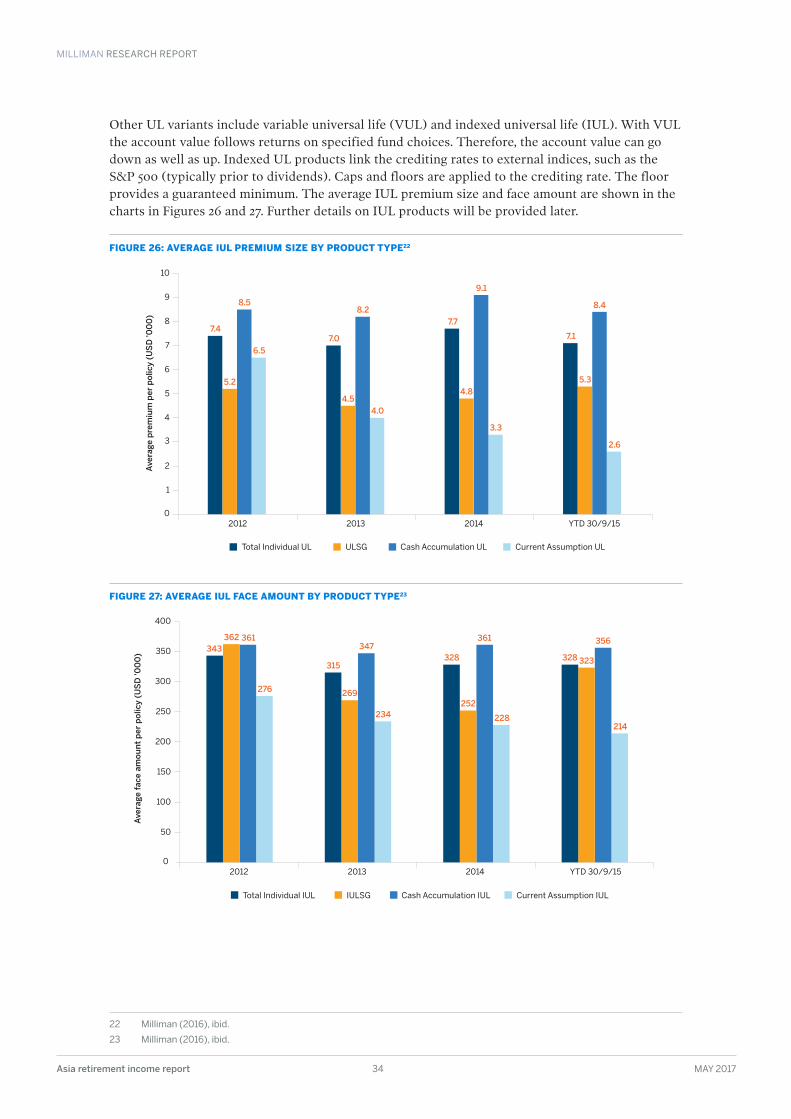
MILLIMAN RESEARCH REPORT
Asia retirement income report 34 MAY 2017
Other UL variants include variable universal life (VUL) and indexed universal life (IUL). With VUL the account value follows returns on specified fund choices. Therefore, the account value can go down as well as up. Indexed UL products link the crediting rates to external indices, such as the S&P 500 (typically prior to dividends). Caps and floors are applied to the crediting rate. The floor provides a guaranteed minimum. The average IUL premium size and face amount are shown in the charts in Figures 26 and 27. Further details on IUL products will be provided later.
FIGURE 26: AVERAGE IUL PREMIUM SIZE BY PRODUCT TYPE22
FIGURE 27: AVERAGE IUL FACE AMOUNT BY PRODUCT TYPE23
22 Milliman (2016), ibid .
23 Milliman (2016), ibid .
Total Individual UL
Ave
rage
pre
miu
m p
er p
olic
y (U
SD
'00
0)
Cash Accumulation ULULSG Current Assumption UL
2012 2013 2014 YTD 30/9/150
1
2
3
4
5
6
7
8
9
10
7.4
5.2
8.5
6.5
7.0
4.5
8.2
4.0
7.7
4.8
9.1
3.3
7.1
5.3
8.4
2.6
Total Individual IUL
Ave
rage
fac
e am
ou
nt
per
po
licy
(US
D '0
00
)
Cash Accumulation IULIULSG Current Assumption IUL
2012 2013 2014 YTD 30/9/150
50
100
150
200
250
300
350
400
315
343328
361 361
228
356362
234
347
214
276
252269
328 323
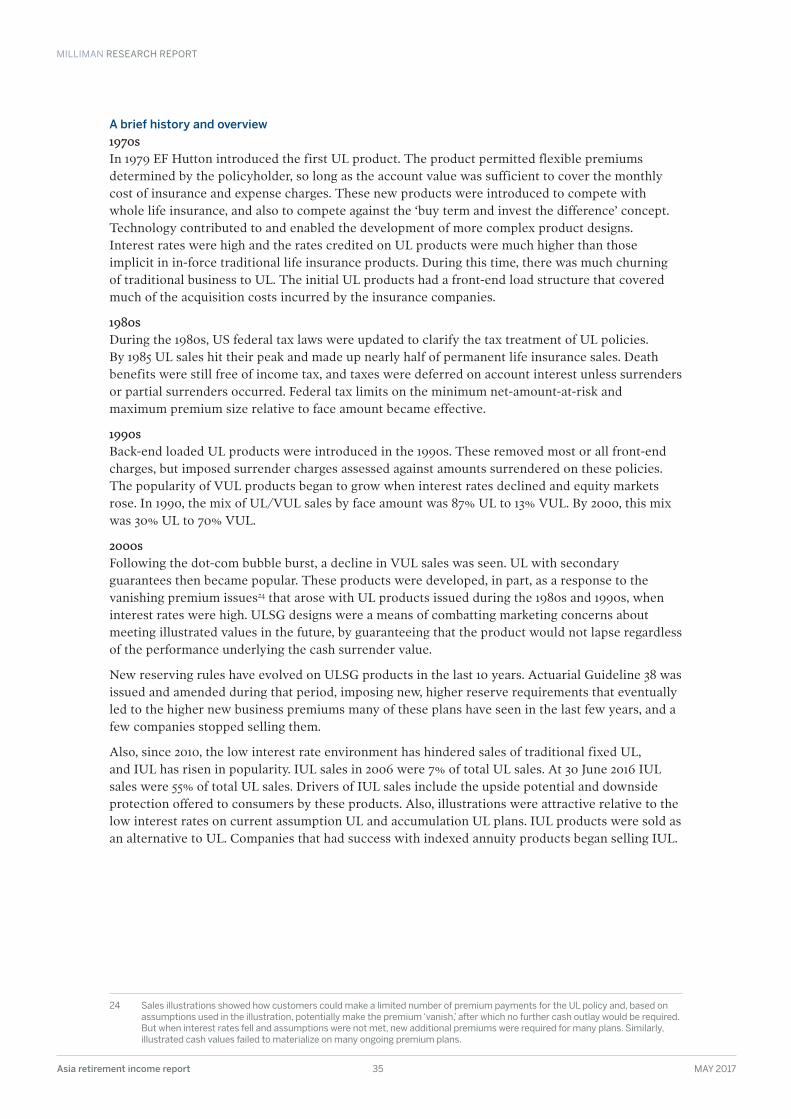
MILLIMAN RESEARCH REPORT
Asia retirement income report 35 MAY 2017
A brief history and overview1970sIn 1979 EF Hutton introduced the first UL product. The product permitted flexible premiums determined by the policyholder, so long as the account value was sufficient to cover the monthly cost of insurance and expense charges. These new products were introduced to compete with whole life insurance, and also to compete against the ‘buy term and invest the difference’ concept. Technology contributed to and enabled the development of more complex product designs. Interest rates were high and the rates credited on UL products were much higher than those implicit in in-force traditional life insurance products. During this time, there was much churning of traditional business to UL. The initial UL products had a front-end load structure that covered much of the acquisition costs incurred by the insurance companies.
1980sDuring the 1980s, US federal tax laws were updated to clarify the tax treatment of UL policies. By 1985 UL sales hit their peak and made up nearly half of permanent life insurance sales. Death benefits were still free of income tax, and taxes were deferred on account interest unless surrenders or partial surrenders occurred. Federal tax limits on the minimum net-amount-at-risk and maximum premium size relative to face amount became effective.
1990sBack-end loaded UL products were introduced in the 1990s. These removed most or all front-end charges, but imposed surrender charges assessed against amounts surrendered on these policies. The popularity of VUL products began to grow when interest rates declined and equity markets rose. In 1990, the mix of UL/VUL sales by face amount was 87% UL to 13% VUL. By 2000, this mix was 30% UL to 70% VUL.
2000sFollowing the dot-com bubble burst, a decline in VUL sales was seen. UL with secondary guarantees then became popular. These products were developed, in part, as a response to the vanishing premium issues24 that arose with UL products issued during the 1980s and 1990s, when interest rates were high. ULSG designs were a means of combatting marketing concerns about meeting illustrated values in the future, by guaranteeing that the product would not lapse regardless of the performance underlying the cash surrender value.
New reserving rules have evolved on ULSG products in the last 10 years. Actuarial Guideline 38 was issued and amended during that period, imposing new, higher reserve requirements that eventually led to the higher new business premiums many of these plans have seen in the last few years, and a few companies stopped selling them.
Also, since 2010, the low interest rate environment has hindered sales of traditional fixed UL, and IUL has risen in popularity. IUL sales in 2006 were 7% of total UL sales. At 30 June 2016 IUL sales were 55% of total UL sales. Drivers of IUL sales include the upside potential and downside protection offered to consumers by these products. Also, illustrations were attractive relative to the low interest rates on current assumption UL and accumulation UL plans. IUL products were sold as an alternative to UL. Companies that had success with indexed annuity products began selling IUL.
24 Sales illustrations showed how customers could make a limited number of premium payments for the UL policy and, based on assumptions used in the illustration, potentially make the premium ‘vanish,’ after which no further cash outlay would be required . But when interest rates fell and assumptions were not met, new additional premiums were required for many plans . Similarly, illustrated cash values failed to materialize on many ongoing premium plans .
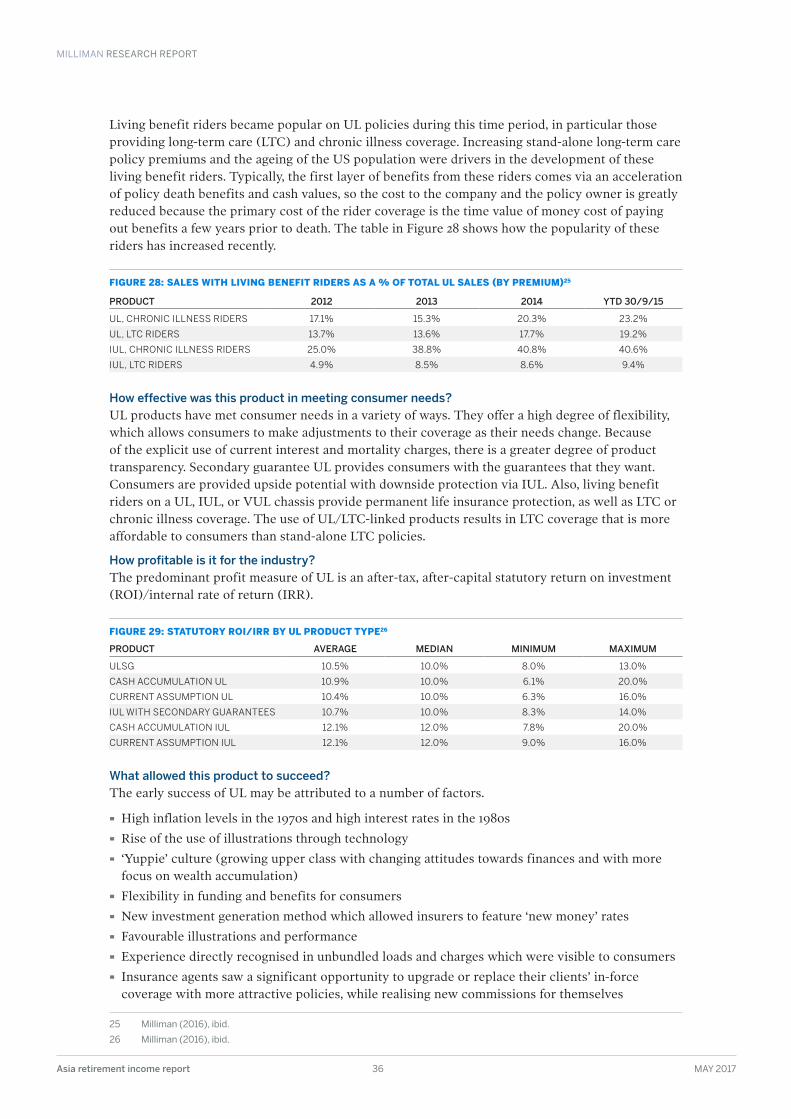
MILLIMAN RESEARCH REPORT
Asia retirement income report 36 MAY 2017
Living benefit riders became popular on UL policies during this time period, in particular those providing long-term care (LTC) and chronic illness coverage. Increasing stand-alone long-term care policy premiums and the ageing of the US population were drivers in the development of these living benefit riders. Typically, the first layer of benefits from these riders comes via an acceleration of policy death benefits and cash values, so the cost to the company and the policy owner is greatly reduced because the primary cost of the rider coverage is the time value of money cost of paying out benefits a few years prior to death. The table in Figure 28 shows how the popularity of these riders has increased recently.
FIGURE 28: SALES WITH LIVING BENEFIT RIDERS AS A % OF TOTAL UL SALES (BY PREMIUM)25
PRODUCT 2012 2013 2014 YTD 30/9/15
UL, CHRONIC ILLNESS RIDERS 17 .1% 15 .3% 20 .3% 23 .2%
UL, LTC RIDERS 13 .7% 13 .6% 17 .7% 19 .2%
IUL, CHRONIC ILLNESS RIDERS 25 .0% 38 .8% 40 .8% 40 .6%
IUL, LTC RIDERS 4 .9% 8 .5% 8 .6% 9 .4%
How effective was this product in meeting consumer needs?UL products have met consumer needs in a variety of ways. They offer a high degree of flexibility, which allows consumers to make adjustments to their coverage as their needs change. Because of the explicit use of current interest and mortality charges, there is a greater degree of product transparency. Secondary guarantee UL provides consumers with the guarantees that they want. Consumers are provided upside potential with downside protection via IUL. Also, living benefit riders on a UL, IUL, or VUL chassis provide permanent life insurance protection, as well as LTC or chronic illness coverage. The use of UL/LTC-linked products results in LTC coverage that is more affordable to consumers than stand-alone LTC policies.
How profitable is it for the industry?The predominant profit measure of UL is an after-tax, after-capital statutory return on investment (ROI)/internal rate of return (IRR).
FIGURE 29: STATUTORY ROI/IRR BY UL PRODUCT TYPE26
PRODUCT AVERAGE MEDIAN MINIMUM MAXIMUM
ULSG 10 .5% 10 .0% 8 .0% 13 .0%
CASH ACCUMULATION UL 10 .9% 10 .0% 6 .1% 20 .0%
CURRENT ASSUMPTION UL 10 .4% 10 .0% 6 .3% 16 .0%
IUL WITH SECONDARY GUARANTEES 10 .7% 10 .0% 8 .3% 14 .0%
CASH ACCUMULATION IUL 12 .1% 12 .0% 7 .8% 20 .0%
CURRENT ASSUMPTION IUL 12 .1% 12 .0% 9 .0% 16 .0%
What allowed this product to succeed?The early success of UL may be attributed to a number of factors.
· High inflation levels in the 1970s and high interest rates in the 1980s
· Rise of the use of illustrations through technology
· ‘Yuppie’ culture (growing upper class with changing attitudes towards finances and with more focus on wealth accumulation)
· Flexibility in funding and benefits for consumers
· New investment generation method which allowed insurers to feature ‘new money’ rates
· Favourable illustrations and performance
· Experience directly recognised in unbundled loads and charges which were visible to consumers
· Insurance agents saw a significant opportunity to upgrade or replace their clients’ in-force coverage with more attractive policies, while realising new commissions for themselves
25 Milliman (2016), ibid .
26 Milliman (2016), ibid .
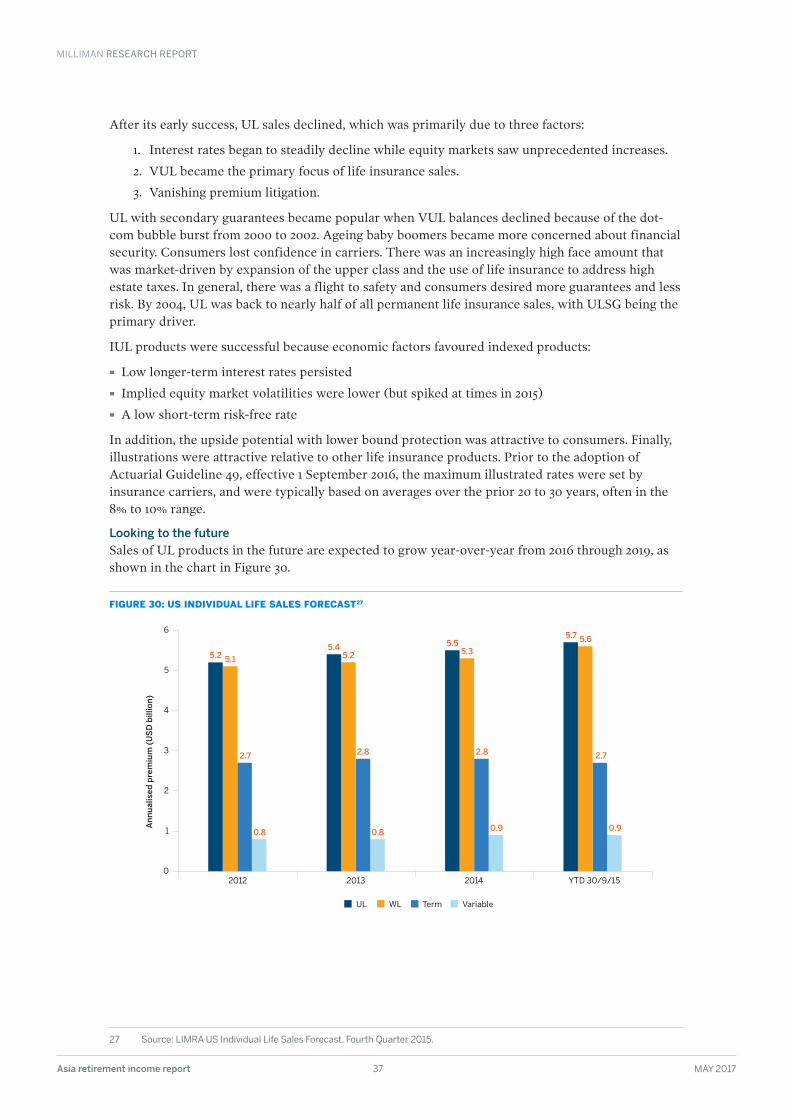
MILLIMAN RESEARCH REPORT
Asia retirement income report 37 MAY 2017
After its early success, UL sales declined, which was primarily due to three factors:
1. Interest rates began to steadily decline while equity markets saw unprecedented increases.
2. VUL became the primary focus of life insurance sales.
3. Vanishing premium litigation.
UL with secondary guarantees became popular when VUL balances declined because of the dot-com bubble burst from 2000 to 2002. Ageing baby boomers became more concerned about financial security. Consumers lost confidence in carriers. There was an increasingly high face amount that was market-driven by expansion of the upper class and the use of life insurance to address high estate taxes. In general, there was a flight to safety and consumers desired more guarantees and less risk. By 2004, UL was back to nearly half of all permanent life insurance sales, with ULSG being the primary driver.
IUL products were successful because economic factors favoured indexed products:
· Low longer-term interest rates persisted
· Implied equity market volatilities were lower (but spiked at times in 2015)
· A low short-term risk-free rate
In addition, the upside potential with lower bound protection was attractive to consumers. Finally, illustrations were attractive relative to other life insurance products. Prior to the adoption of Actuarial Guideline 49, effective 1 September 2016, the maximum illustrated rates were set by insurance carriers, and were typically based on averages over the prior 20 to 30 years, often in the 8% to 10% range.
Looking to the futureSales of UL products in the future are expected to grow year-over-year from 2016 through 2019, as shown in the chart in Figure 30.
FIGURE 30: US INDIVIDUAL LIFE SALES FORECAST27
27 Source: LIMRA US Individual Life Sales Forecast, Fourth Quarter 2015 .
UL
An
nu
alis
ed p
rem
ium
(U
SD
bill
ion
)
TermWL Variable
2012 2013 2014 YTD 30/9/150
1
2
3
4
5
6
5.2
2.7
0.8
5.1
5.45.2
0.8
2.8
5.5
2.8
5.3
0.9
2.7
5.7
0.9
5.6
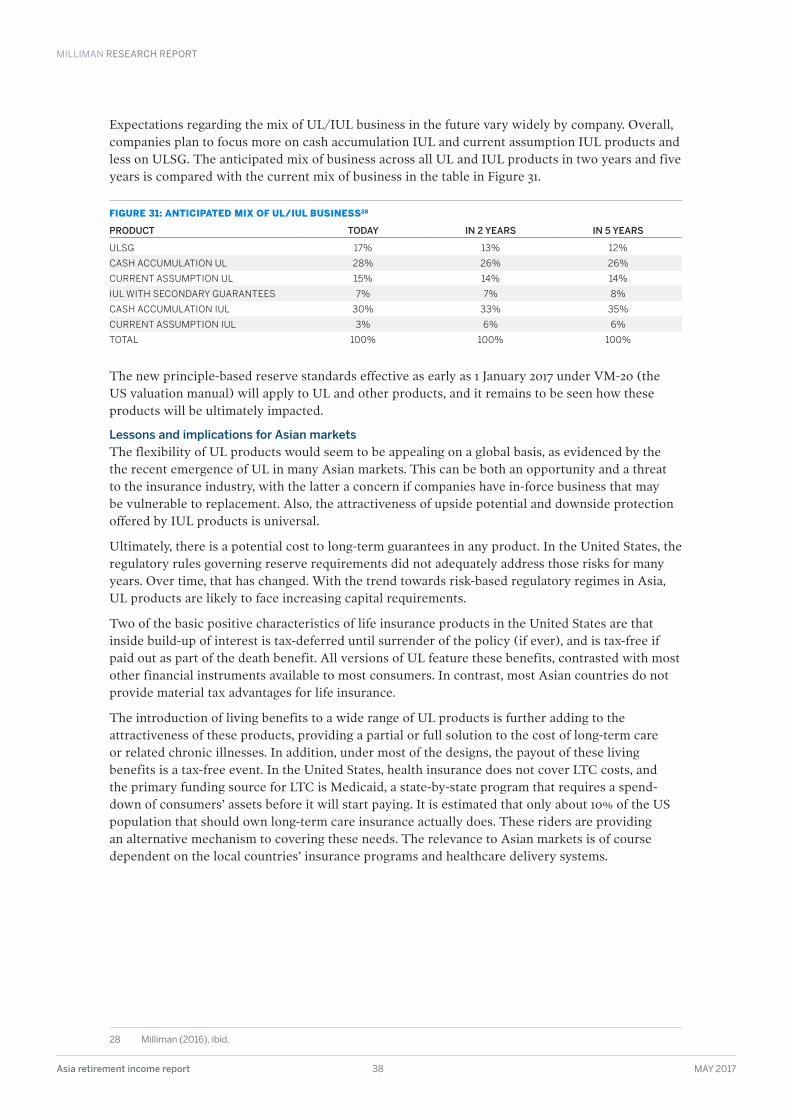
MILLIMAN RESEARCH REPORT
Asia retirement income report 38 MAY 2017
Expectations regarding the mix of UL/IUL business in the future vary widely by company. Overall, companies plan to focus more on cash accumulation IUL and current assumption IUL products and less on ULSG. The anticipated mix of business across all UL and IUL products in two years and five years is compared with the current mix of business in the table in Figure 31.
FIGURE 31: ANTICIPATED MIX OF UL/IUL BUSINESS28
PRODUCT TODAY IN 2 YEARS IN 5 YEARS
ULSG 17% 13% 12%
CASH ACCUMULATION UL 28% 26% 26%
CURRENT ASSUMPTION UL 15% 14% 14%
IUL WITH SECONDARY GUARANTEES 7% 7% 8%
CASH ACCUMULATION IUL 30% 33% 35%
CURRENT ASSUMPTION IUL 3% 6% 6%
TOTAL 100% 100% 100%
The new principle-based reserve standards effective as early as 1 January 2017 under VM-20 (the US valuation manual) will apply to UL and other products, and it remains to be seen how these products will be ultimately impacted.
Lessons and implications for Asian marketsThe flexibility of UL products would seem to be appealing on a global basis, as evidenced by the the recent emergence of UL in many Asian markets. This can be both an opportunity and a threat to the insurance industry, with the latter a concern if companies have in-force business that may be vulnerable to replacement. Also, the attractiveness of upside potential and downside protection offered by IUL products is universal.
Ultimately, there is a potential cost to long-term guarantees in any product. In the United States, the regulatory rules governing reserve requirements did not adequately address those risks for many years. Over time, that has changed. With the trend towards risk-based regulatory regimes in Asia, UL products are likely to face increasing capital requirements.
Two of the basic positive characteristics of life insurance products in the United States are that inside build-up of interest is tax-deferred until surrender of the policy (if ever), and is tax-free if paid out as part of the death benefit. All versions of UL feature these benefits, contrasted with most other financial instruments available to most consumers. In contrast, most Asian countries do not provide material tax advantages for life insurance.
The introduction of living benefits to a wide range of UL products is further adding to the attractiveness of these products, providing a partial or full solution to the cost of long-term care or related chronic illnesses. In addition, under most of the designs, the payout of these living benefits is a tax-free event. In the United States, health insurance does not cover LTC costs, and the primary funding source for LTC is Medicaid, a state-by-state program that requires a spend-down of consumers’ assets before it will start paying. It is estimated that only about 10% of the US population that should own long-term care insurance actually does. These riders are providing an alternative mechanism to covering these needs. The relevance to Asian markets is of course dependent on the local countries’ insurance programs and healthcare delivery systems.
28 Milliman (2016), ibid .
MILLIMAN RESEARCH REPORT
Asia retirement income report 39 MAY 2017
CASE STUDY: WITH-PROFITS IN THE UNITED KINGDOMPrefaceWith-profit products, or ‘participating products’ as they are better known in Asia, were created and popularised in the United Kingdom. The attraction of these products lay in the ‘smoothing’ of investment returns, and the variety of guarantees that could be bundled with them, including capital guarantees, minimum crediting rates, etc. In the context of retirement, these products were generally accumulation products rather than decumulation products, but there was a popular type of product known as with-profits annuities, which were accumulation funds that would either automatically convert to an annuity at maturity, or have the option to be converted to an annuity at a guaranteed rate. Some with-profits products also allowed a conversion of the accumulated funds into individual savings/investment accounts, from which policyholders could draw down any amount they desired.
In this sense, the with-profits annuity or products with guaranteed annuity rates could be considered one version of a ‘complete’ retirement product (i.e., combining accumulation and decumulation), after the first deferred annuities. We have included this case study to highlight the following potential lessons from these products for the next generation of retirement income offerings:
· The historical reasons why these products proved popular with consumers
· The historical reasons on why these products fell out of favour with providers and consumers, to possibly guide on what pitfalls could be avoided in the future
A brief history and overviewWith-profits life assurance can be traced back to the foundation of Equitable Life in 1762. At first the concept of declaring discretionary bonuses was used to deal with the uncertainty surrounding mortality experience at a time when there were no recognised life tables, but later excess investment returns became the main source of ‘profits’.
The popularity of with-profits life assurance grew steadily during the 19th century, and many policies that were originally issued as nonprofit were subsequently granted participation rights. With-profits continued to dominate life insurance in the UK for much of the last century. However, several new companies were formed during the 1960s to challenge the established players, with almost exclusively unit-linked business strategies. They were able to grow quickly, distributing mainly via commission-only sales forces. Meanwhile the established companies, many of which were mutual, continued to sell large volumes of with-profits business, including individual pension contracts and endowments designed to repay mortgage loans.
Competition among with-profits offices in the 1980s and 1990s led to very high payouts on some with-profits policies and very high levels of equity backing for those policies. This exposed with-profits funds to a high level of risk, and during the equity bear market from 2000 to 2003 a combination of low interest rates and negative returns on equities led to a number of UK with-profits funds experiencing financial difficulties and being forced to close to new business. This significantly reduced capacity in the UK with-profits market. At the same time, consumer confidence in with-profits products was badly shaken and the product sustained reputational damage. Many people who believed their policies would be adequate to repay their mortgages discovered that there were significant shortfalls to make up.
A number of companies continued to write with-profits business during the first decade of the 21st century, but volumes steadily declined. Between 1985 and 2007, new with-profits business measured by annual premium equivalent (APE)29 fell from GBP 1.1 billion to GBP 0.6 billion, while new unit-linked business grew more than tenfold, from GBP 1.2 billion to GBP 13.6 billion.
Only one company, Prudential Assurance, now transacts a significant volume of new with-profits business in the UK, although this is well below previous sales levels. These products use its PruFund brand, the literature for which has minimal mention of with-profits, due to poor customer perceptions.
29 Annual Premium Equivalent is defined as: new annual premiums + 10% of new single premiums .
MILLIMAN RESEARCH REPORT
Asia retirement income report 40 MAY 2017
How effective was this product in meeting consumer needs?With-profits life assurance generally provided good returns to policyholders, whose policies remained in-force throughout the original term; they received the benefit of stock market returns with smoothing and added guarantees, which were provided at little or no cost. However, until relatively recently returns were typically less favourable for policyholders who discontinued their policies before the end of the term, as there were often penalties for early surrender.
During the boom years for with-profits, past performance figures featured prominently in the sales process. This has led to disappointment in many cases because, as a result of falling interest rates and mediocre equity returns, typical payouts on 25-year endowments have fallen by around 70% since 2000.
As mentioned above, with-profits products sustained reputational damage during the early years of the present century.
In June 2010 the UK Financial Services Authority (FSA) published a report on with-profits partly as a result of concern by the Treasury Select Committee regarding the ‘lack of transparency in the operation of with-profits in general’. The FSA reported that many stakeholders, including consumers, thought that with-profits could be ‘an attractive option to consumers’ if the market operated effectively. However, there was a widespread view that the market did not operate effectively and consumers overwhelmingly thought that the market was delivering a bad deal. As quoted from the report:
There were concerns that the products were often not performing well for policyholders due to poor or unfair operation of funds and that policyholders were subject to considerable cost, through market value reductions, to extricate themselves from these funds.
The concerns that consumers held were compounded by the lack of transparency around with-profits business. The FSA report concluded that product literature did not enable consumers to understand how their funds were being operated or what was driving investment performance. This lack of understanding meant that consumers could not adequately assess the risks and rewards of with-profits.
How profitable is it for the industry?Until the 1970s, most with-profits life assurance was written on a conventional basis whereby, for proprietary insurers, the shareholders’ interest was expressed as a percentage of the cost of declared bonuses—typically 10%. This limited potential conflicts of interest between policyholders and shareholders, but meant that shareholder profits were heavily dependent on the level of investment returns. The subsequent growth of unit-linked business led to the development of unitised with-profits policies, under which investment in the with-profits fund was expressed as one of a range of investment options, the others being in unit-linked funds. These policies typically provided for explicit charges to be deducted from premiums and from the fund value, and so profitability was less dependent on investment returns and more on the product design than for conventional products.
What allowed this product to succeed?In the late 1950s, life insurers writing with-profits business started investing an increasing proportion of their with-profits funds in equities and property. Very often the returns from these investments were not fully passed on to policyholders, as asset share techniques were not widely used at that time. This led to the build-up of surplus assets or estates in some with-profits funds, and the availability of this internal capital allowed companies to expand their with-profits business relatively rapidly, contributing to the growth of with-profits business during the second half of the 20th century.
MILLIMAN RESEARCH REPORT
Asia retirement income report 41 MAY 2017
The success of with-profits business also depended on the willingness of policyholders to place their trust in a life insurer to manage the business fairly in the interests of policyholders. It was accepted that some policyholders would gain from the smoothing inherent in the with-profits concept, and others would lose. In recent years there has been a demand for more transparency in with-profits life assurance, and new regulations have been introduced which require much greater disclosure of how with-profits funds will be managed and more careful monitoring of their management. These changes have provided valuable added protection for consumers’ interests, but have come too late to reverse the decline of with-profits in the UK.
Guarantees are generally considered to be a fundamental feature of with-profits products, but providing guarantees is very expensive at times of low interest rates. It remains to be seen whether with-profits will experience a revival if and when interest rates rise again.
Looking to the futureThe decline in new business has changed the industry’s main focus to managing the run-off of with-profits funds in an orderly way. The volume of in-force with-profits business in the UK remains very large (over GBP 300 billion of liabilities at the end of 2015) and for many funds the projected run-off pattern is relatively gradual. Current challenges include mitigating diseconomies of scale as in-force volumes contract, managing the cost of guarantees that have become more onerous as a result of low interest rates, and distributing the estate fairly among remaining policies. Some with-profits funds include material volumes of annuities in payment, which have the potential to outlast much of the with-profits business, and there have been several transfers of annuity business out of with-profits funds in recent years.
There is a particular challenge for mutual insurers, whose with-profits policyholders are in many cases the members who elect the boards and vote on any constitutional changes. One large UK mutual has recently extended a form of profit sharing to most of its unit-linked pension policyholders to reduce the dependence of mutuality on more traditional with-profits business.
Lessons and implications for Asian marketsIn contrast to the UK, with-profits business is thriving in many parts of Asia. There is clearly still demand for a product which combines the benefits of stock market returns with guarantees and smoothing. There are lessons to be learned from the UK experience, which can help Asian markets avoid the pitfalls that contributed to the decline of with-profits in the market where it began over 250 years ago.
A key contributor to the downfall of with-profits in the UK was the hubris of the 1990s, when many with-profits funds were run without adequate regard to the level of investment risk. After the falls in interest rates and stock markets in early 2000, the near collapse of Equitable Life (which sold a lot of with-profits annuities) and numerous cases of mortgage endowment mis-selling led to a negative perception of with-profits. Subsequent changes in prudential regulation, which require proper recognition of the cost of out-of-the-money guarantees and accrued terminal bonus obligations, might well have led to a different outcome had they been introduced 10 years earlier.
Regulators tend to watch developments in other jurisdictions, and it is no surprise that some of the recent innovations in conduct regulation in the UK, such as Principles and Practices of Financial Management and With-Profits Committees, are beginning to find their way to Asia. They are helpful in promoting consumer confidence in with-profits, and should be welcomed—a well-regulated and transparent with-profits market is ultimately a more robust one.
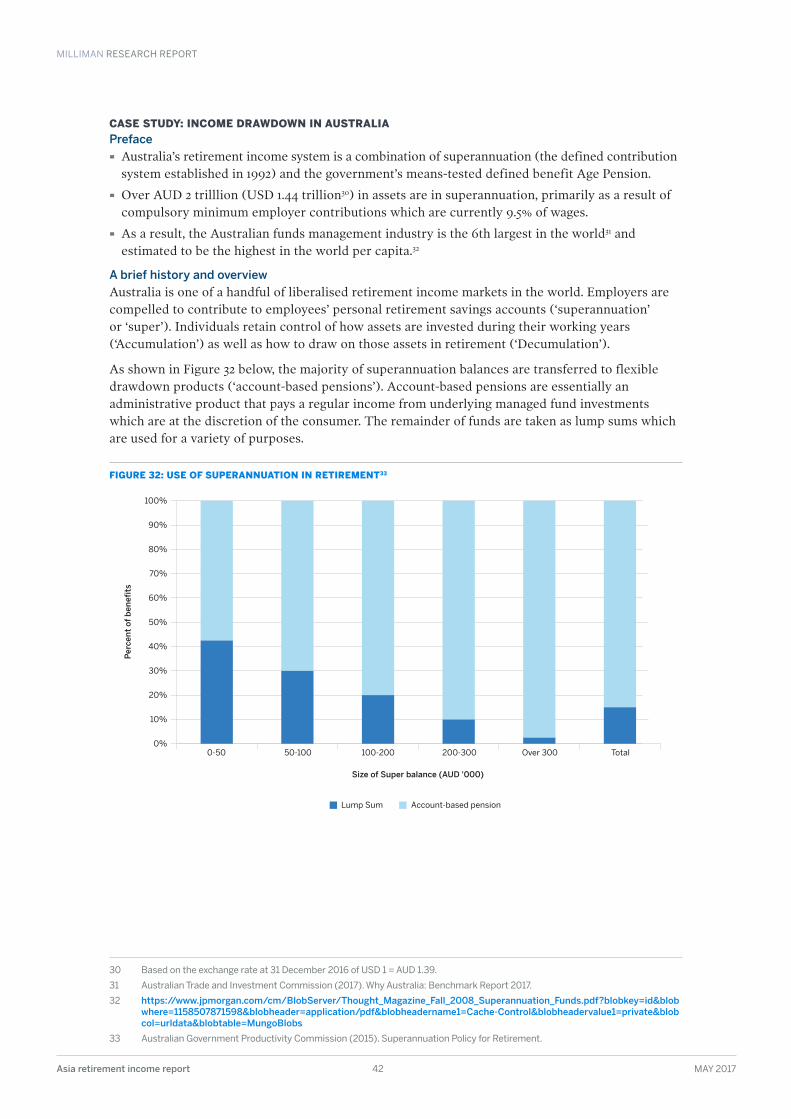
MILLIMAN RESEARCH REPORT
Asia retirement income report 42 MAY 2017
CASE STUDY: INCOME DRAWDOWN IN AUSTRALIAPreface
· Australia’s retirement income system is a combination of superannuation (the defined contribution system established in 1992) and the government’s means-tested defined benefit Age Pension.
· Over AUD 2 trilllion (USD 1.44 trillion30) in assets are in superannuation, primarily as a result of compulsory minimum employer contributions which are currently 9.5% of wages.
· As a result, the Australian funds management industry is the 6th largest in the world31 and estimated to be the highest in the world per capita.32
A brief history and overviewAustralia is one of a handful of liberalised retirement income markets in the world. Employers are compelled to contribute to employees’ personal retirement savings accounts (‘superannuation’ or ‘super’). Individuals retain control of how assets are invested during their working years (‘Accumulation’) as well as how to draw on those assets in retirement (‘Decumulation’).
As shown in Figure 32 below, the majority of superannuation balances are transferred to flexible drawdown products (‘account-based pensions’). Account-based pensions are essentially an administrative product that pays a regular income from underlying managed fund investments which are at the discretion of the consumer. The remainder of funds are taken as lump sums which are used for a variety of purposes.
FIGURE 32: USE OF SUPERANNUATION IN RETIREMENT33
30 Based on the exchange rate at 31 December 2016 of USD 1 = AUD 1 .39 .
31 Australian Trade and Investment Commission (2017) . Why Australia: Benchmark Report 2017 .
32 https://www.jpmorgan.com/cm/BlobServer/Thought_Magazine_Fall_2008_Superannuation_Funds.pdf?blobkey=id&blobwhere=1158507871598&blobheader=application/pdf&blobheadername1=Cache-Control&blobheadervalue1=private&blobcol=urldata&blobtable=MungoBlobs
33 Australian Government Productivity Commission (2015) . Superannuation Policy for Retirement .
0%
10%
20%
30%
40%
50%
60%
70%
80%
90%
100%
Per
cen
t o
f b
enef
its
Size of Super balance (AUD '000)
Lump Sum Account-based pension
0-50 50-100 100-200 200-300 Over 300 Total
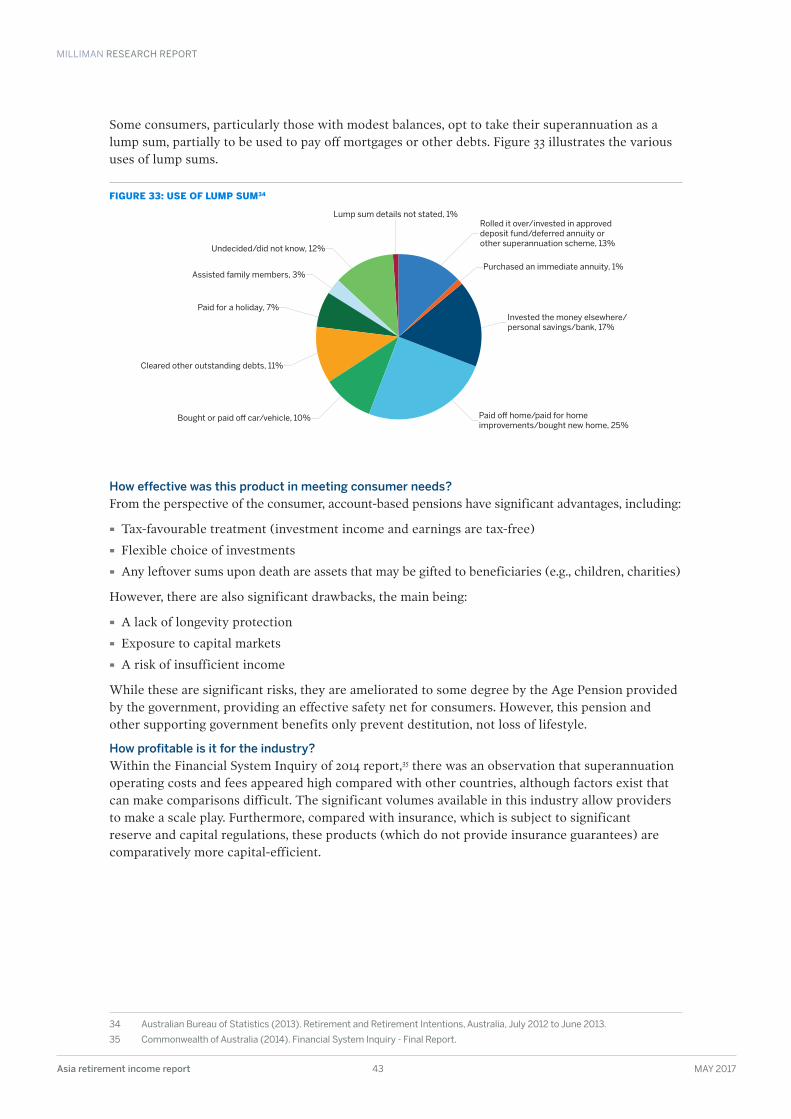
MILLIMAN RESEARCH REPORT
Asia retirement income report 43 MAY 2017
Some consumers, particularly those with modest balances, opt to take their superannuation as a lump sum, partially to be used to pay off mortgages or other debts. Figure 33 illustrates the various uses of lump sums.
FIGURE 33: USE OF LUMP SUM34
How effective was this product in meeting consumer needs?From the perspective of the consumer, account-based pensions have significant advantages, including:
· Tax-favourable treatment (investment income and earnings are tax-free)
· Flexible choice of investments
· Any leftover sums upon death are assets that may be gifted to beneficiaries (e.g., children, charities)
However, there are also significant drawbacks, the main being:
· A lack of longevity protection
· Exposure to capital markets
· A risk of insufficient income
While these are significant risks, they are ameliorated to some degree by the Age Pension provided by the government, providing an effective safety net for consumers. However, this pension and other supporting government benefits only prevent destitution, not loss of lifestyle.
How profitable is it for the industry?Within the Financial System Inquiry of 2014 report,35 there was an observation that superannuation operating costs and fees appeared high compared with other countries, although factors exist that can make comparisons difficult. The significant volumes available in this industry allow providers to make a scale play. Furthermore, compared with insurance, which is subject to significant reserve and capital regulations, these products (which do not provide insurance guarantees) are comparatively more capital-efficient.
34 Australian Bureau of Statistics (2013) . Retirement and Retirement Intentions, Australia, July 2012 to June 2013 .
35 Commonwealth of Australia (2014) . Financial System Inquiry - Final Report .
Rolled it over/invested in approved deposit fund/deferred annuity or other superannuation scheme, 13%
Invested the money elsewhere/personal savings/bank, 17%
Paid o� home/paid for homeimprovements/bought new home, 25%
Bought or paid o� car/vehicle, 10%
Cleared other outstanding debts, 11%
Paid for a holiday, 7%
Assisted family members, 3%
Undecided/did not know, 12%
Purchased an immediate annuity, 1%
Lump sum details not stated, 1%
MILLIMAN RESEARCH REPORT
Asia retirement income report 44 MAY 2017
What allowed this product to succeed?Three main factors allow for the success of this product in Australia:
1. Mandatory personal pensions in the form of superannuation, with amongst the highest compulsory employer contribution rates in the world.
2. Favourable tax treatment for account-based pensions relative to other products in Australia such as annuities.
3. Lack of strong competition among funds.
Looking to the futureWhile annuities are seeing slightly higher sales in recent years, income drawdown products are likely to remain the main form of retirement income product in the short to medium term for Australian consumers. There are changes in the industry to attempt to reduce the drawbacks of these products and increase consumer value. Two in particular stand out:
1. The development of ‘robo-advice’ to consumers, to provide more accessible financial advice. In theory, the prevalence of better quality and cheaper advice would allow consumers to stretch out their superannuation pots further. Unfortunately, take-up to date has been low.
2. Increasingly sophisticated risk management techniques for income drawdown products, to reduce the volatility of consumers’ account balances (and hence their retirement incomes). These techniques often involve using low-cost hedging techniques to smooth volatility and provide a more predictable outcome for consumers.
Product success in Australia is also highly dependent on government regulation. For example, deferred annuities are theoretically appealing but were previously not given the same tax concessions in retirement as account-based pensions (measures have been announced in the 2016 budget to extend tax exemptions to deferred annuities from July 2017). The recent Financial System Inquiry report36 recommended that retirement incomes become the key objective of the superannuation system and that superannuation trustees should preselect a ‘comprehensive income product for retirement (“CIPR”) for their members unless members opt out’. However, these recommendations are not yet legislated and the industry is largely taking a wait-and-see approach.
Lessons and implications for Asian marketsAccount-based pensions are easy to understand, and are the default option for a large segment of the population who are looking for flexibility, including self-management of their retirement outcomes. However, allowing flexible drawdown of pension accounts after retirement can lead to the risk of individuals outliving their savings. As many Asian countries also have a similar account-based pensions system, with many countries permitting a lump-sum payout on retirement, Australia’s experience can provide valuable insight on what could happen in the future.
36 Commonwealth of Australia (2014), ibid .
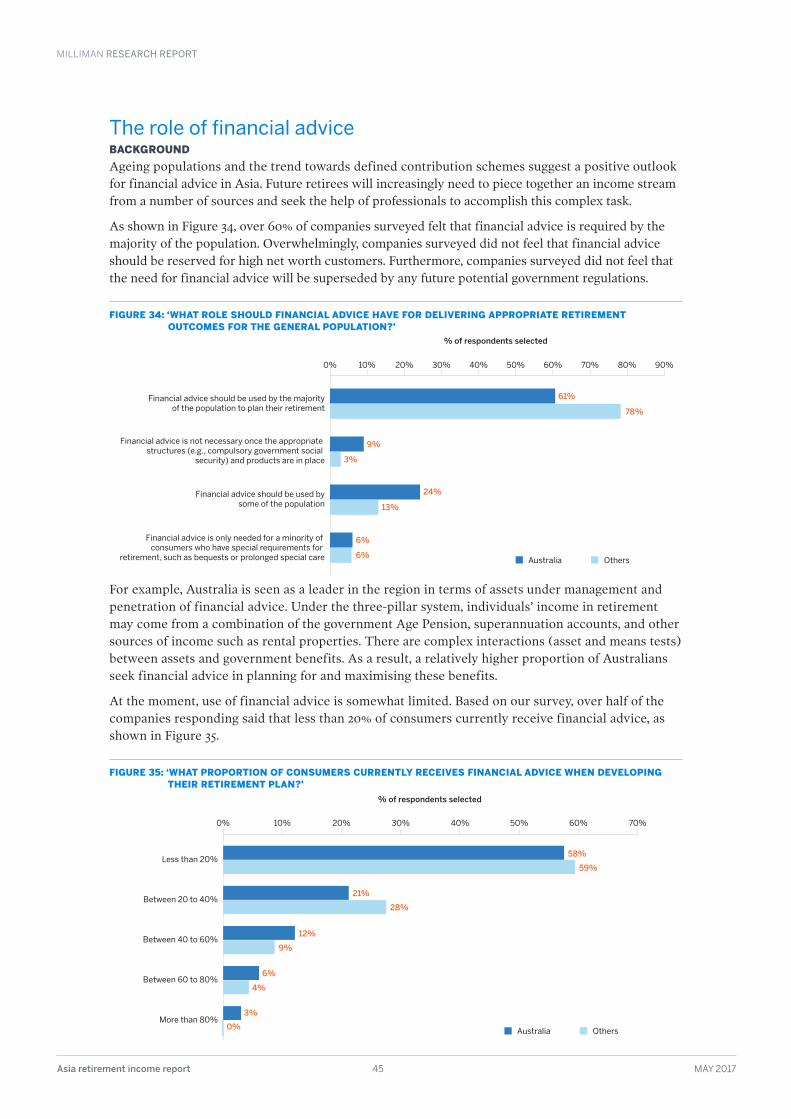
MILLIMAN RESEARCH REPORT
Asia retirement income report 45 MAY 2017
The role of financial adviceBACKGROUNDAgeing populations and the trend towards defined contribution schemes suggest a positive outlook for financial advice in Asia. Future retirees will increasingly need to piece together an income stream from a number of sources and seek the help of professionals to accomplish this complex task.
As shown in Figure 34, over 60% of companies surveyed felt that financial advice is required by the majority of the population. Overwhelmingly, companies surveyed did not feel that financial advice should be reserved for high net worth customers. Furthermore, companies surveyed did not feel that the need for financial advice will be superseded by any future potential government regulations.
FIGURE 34: ‘WHAT ROLE SHOULD FINANCIAL ADVICE HAVE FOR DELIVERING APPROPRIATE RETIREMENT OUTCOMES FOR THE GENERAL POPULATION?’
For example, Australia is seen as a leader in the region in terms of assets under management and penetration of financial advice. Under the three-pillar system, individuals’ income in retirement may come from a combination of the government Age Pension, superannuation accounts, and other sources of income such as rental properties. There are complex interactions (asset and means tests) between assets and government benefits. As a result, a relatively higher proportion of Australians seek financial advice in planning for and maximising these benefits.
At the moment, use of financial advice is somewhat limited. Based on our survey, over half of the companies responding said that less than 20% of consumers currently receive financial advice, as shown in Figure 35.
FIGURE 35: ‘WHAT PROPORTION OF CONSUMERS CURRENTLY RECEIVES FINANCIAL ADVICE WHEN DEVELOPING THEIR RETIREMENT PLAN?’
9%
3%
61%
78%
24%
13%
6%
6%
Financial advice should be used by the majority of the population to plan their retirement
Financial advice is not necessary once the appropriate structures (e.g., compulsory government social
security) and products are in place
Financial advice should be used by some of the population
Financial advice is only needed for a minority of consumers who have special requirements for
retirement, such as bequests or prolonged special care
% of respondents selected
Australia Others
0% 10% 20% 30% 40% 50% 60% 70% 80% 90%
28%
12%
58%
59%
6%
21%
9%
4%
3%
0%
Less than 20%
Between 20 to 40%
Between 40 to 60%
Between 60 to 80%
More than 80%
% of respondents selected
Australia Others
0% 10% 20% 30% 40% 50% 60% 70%
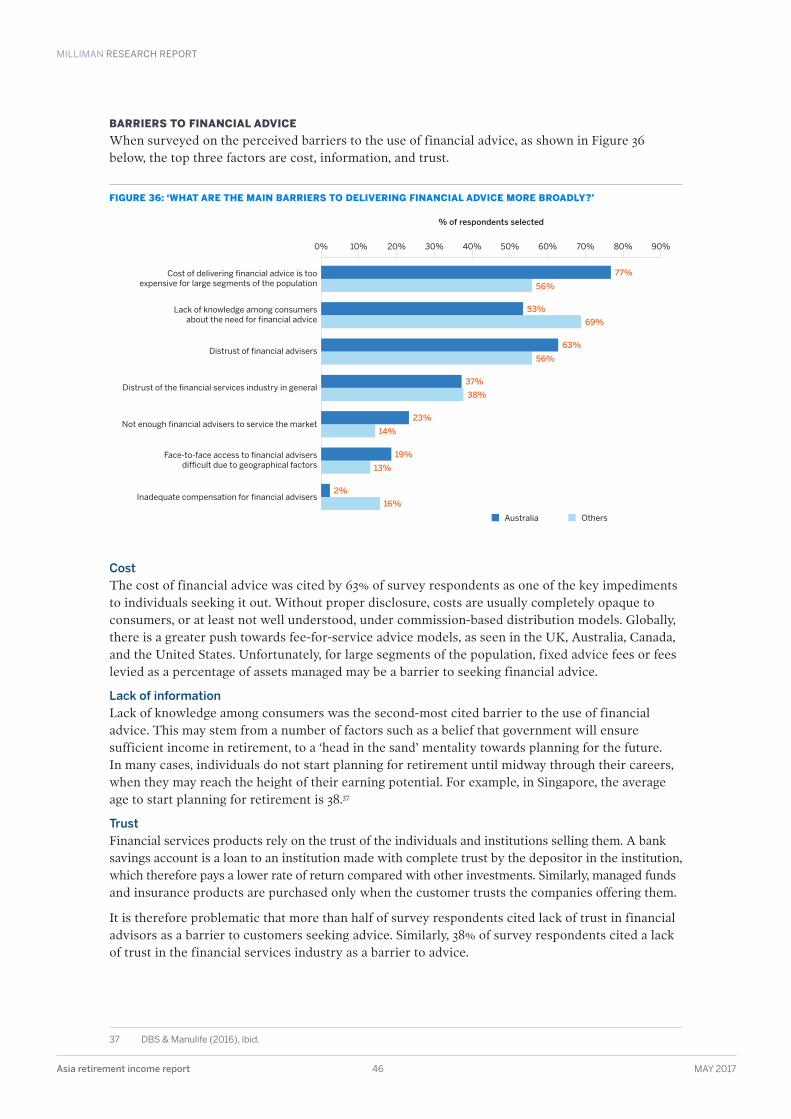
MILLIMAN RESEARCH REPORT
Asia retirement income report 46 MAY 2017
BARRIERS TO FINANCIAL ADVICEWhen surveyed on the perceived barriers to the use of financial advice, as shown in Figure 36 below, the top three factors are cost, information, and trust.
FIGURE 36: ‘WHAT ARE THE MAIN BARRIERS TO DELIVERING FINANCIAL ADVICE MORE BROADLY?’
CostThe cost of financial advice was cited by 63% of survey respondents as one of the key impediments to individuals seeking it out. Without proper disclosure, costs are usually completely opaque to consumers, or at least not well understood, under commission-based distribution models. Globally, there is a greater push towards fee-for-service advice models, as seen in the UK, Australia, Canada, and the United States. Unfortunately, for large segments of the population, fixed advice fees or fees levied as a percentage of assets managed may be a barrier to seeking financial advice.
Lack of informationLack of knowledge among consumers was the second-most cited barrier to the use of financial advice. This may stem from a number of factors such as a belief that government will ensure sufficient income in retirement, to a ‘head in the sand’ mentality towards planning for the future. In many cases, individuals do not start planning for retirement until midway through their careers, when they may reach the height of their earning potential. For example, in Singapore, the average age to start planning for retirement is 38.37
TrustFinancial services products rely on the trust of the individuals and institutions selling them. A bank savings account is a loan to an institution made with complete trust by the depositor in the institution, which therefore pays a lower rate of return compared with other investments. Similarly, managed funds and insurance products are purchased only when the customer trusts the companies offering them.
It is therefore problematic that more than half of survey respondents cited lack of trust in financial advisors as a barrier to customers seeking advice. Similarly, 38% of survey respondents cited a lack of trust in the financial services industry as a barrier to advice.
37 DBS & Manulife (2016), ibid .
56%
69%
77%
53%
37%
38%
23%
14%
19%
13%
2%
16%
56%
63%
Cost of delivering financial advice is too expensive for large segments of the population
Distrust of the financial services industry in general
Lack of knowledge among consumers about the need for financial advice
Inadequate compensation for financial advisers
Not enough financial advisers to service the market
Face-to-face access to financial advisers difficult due to geographical factors
Distrust of financial advisers
% of respondents selected
Australia Others
0% 10% 20% 30% 40% 50% 60% 70% 80% 90%
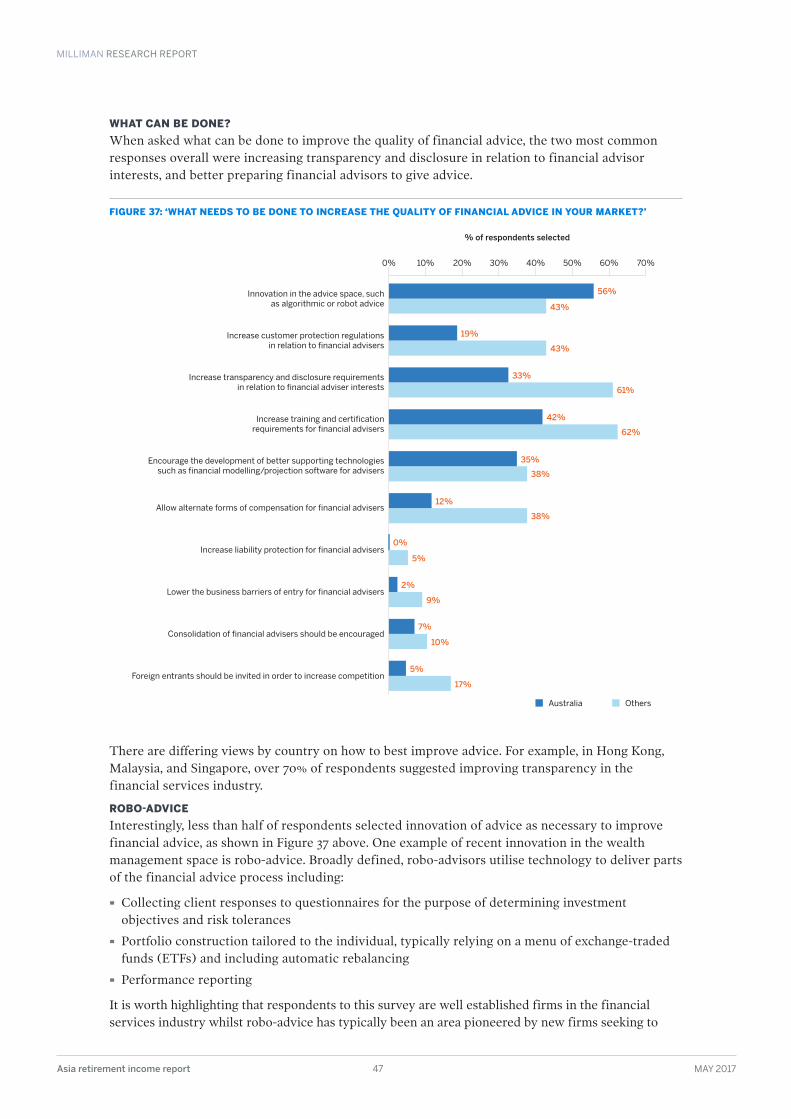
MILLIMAN RESEARCH REPORT
Asia retirement income report 47 MAY 2017
WHAT CAN BE DONE? When asked what can be done to improve the quality of financial advice, the two most common responses overall were increasing transparency and disclosure in relation to financial advisor interests, and better preparing financial advisors to give advice.
FIGURE 37: ‘WHAT NEEDS TO BE DONE TO INCREASE THE QUALITY OF FINANCIAL ADVICE IN YOUR MARKET?’
There are differing views by country on how to best improve advice. For example, in Hong Kong, Malaysia, and Singapore, over 70% of respondents suggested improving transparency in the financial services industry.
ROBO-ADVICEInterestingly, less than half of respondents selected innovation of advice as necessary to improve financial advice, as shown in Figure 37 above. One example of recent innovation in the wealth management space is robo-advice. Broadly defined, robo-advisors utilise technology to deliver parts of the financial advice process including:
· Collecting client responses to questionnaires for the purpose of determining investment objectives and risk tolerances
· Portfolio construction tailored to the individual, typically relying on a menu of exchange-traded funds (ETFs) and including automatic rebalancing
· Performance reporting
It is worth highlighting that respondents to this survey are well established firms in the financial services industry whilst robo-advice has typically been an area pioneered by new firms seeking to
19%
43%
56%
43%
62%
42%
33%
61%
35%
38%
12%
38%
0%
5%
2%
9%
7%
10%
5%
17%
Innovation in the advice space, such as algorithmic or robot advice
Increase customer protection regulations in relation to financial advisers
Increase transparency and disclosure requirements in relation to financial adviser interests
Increase training and certification requirements for financial advisers
Encourage the development of better supporting technologies such as financial modelling/projection software for advisers
Allow alternate forms of compensation for financial advisers
Increase liability protection for financial advisers
Lower the business barriers of entry for financial advisers
Consolidation of financial advisers should be encouraged
Foreign entrants should be invited in order to increase competition
% of respondents selected
Australia Others
0% 10% 20% 30% 40% 50% 60% 70%
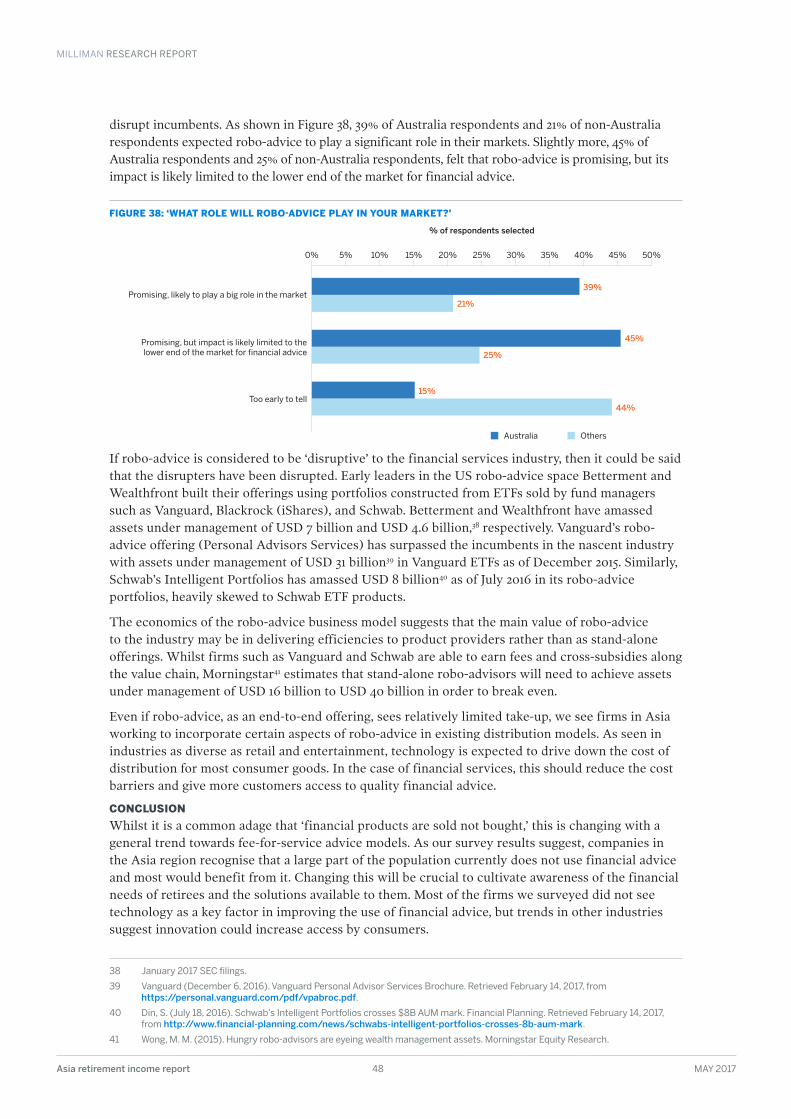
MILLIMAN RESEARCH REPORT
Asia retirement income report 48 MAY 2017
disrupt incumbents. As shown in Figure 38, 39% of Australia respondents and 21% of non-Australia respondents expected robo-advice to play a significant role in their markets. Slightly more, 45% of Australia respondents and 25% of non-Australia respondents, felt that robo-advice is promising, but its impact is likely limited to the lower end of the market for financial advice.
FIGURE 38: ‘WHAT ROLE WILL ROBO-ADVICE PLAY IN YOUR MARKET?’
If robo-advice is considered to be ‘disruptive’ to the financial services industry, then it could be said that the disrupters have been disrupted. Early leaders in the US robo-advice space Betterment and Wealthfront built their offerings using portfolios constructed from ETFs sold by fund managers such as Vanguard, Blackrock (iShares), and Schwab. Betterment and Wealthfront have amassed assets under management of USD 7 billion and USD 4.6 billion,38 respectively. Vanguard’s robo-advice offering (Personal Advisors Services) has surpassed the incumbents in the nascent industry with assets under management of USD 31 billion39 in Vanguard ETFs as of December 2015. Similarly, Schwab’s Intelligent Portfolios has amassed USD 8 billion40 as of July 2016 in its robo-advice portfolios, heavily skewed to Schwab ETF products.
The economics of the robo-advice business model suggests that the main value of robo-advice to the industry may be in delivering efficiencies to product providers rather than as stand-alone offerings. Whilst firms such as Vanguard and Schwab are able to earn fees and cross-subsidies along the value chain, Morningstar41 estimates that stand-alone robo-advisors will need to achieve assets under management of USD 16 billion to USD 40 billion in order to break even.
Even if robo-advice, as an end-to-end offering, sees relatively limited take-up, we see firms in Asia working to incorporate certain aspects of robo-advice in existing distribution models. As seen in industries as diverse as retail and entertainment, technology is expected to drive down the cost of distribution for most consumer goods. In the case of financial services, this should reduce the cost barriers and give more customers access to quality financial advice.
CONCLUSIONWhilst it is a common adage that ‘financial products are sold not bought,’ this is changing with a general trend towards fee-for-service advice models. As our survey results suggest, companies in the Asia region recognise that a large part of the population currently does not use financial advice and most would benefit from it. Changing this will be crucial to cultivate awareness of the financial needs of retirees and the solutions available to them. Most of the firms we surveyed did not see technology as a key factor in improving the use of financial advice, but trends in other industries suggest innovation could increase access by consumers.
38 January 2017 SEC filings .
39 Vanguard (December 6, 2016) . Vanguard Personal Advisor Services Brochure . Retrieved February 14, 2017, from https://personal.vanguard.com/pdf/vpabroc.pdf .
40 Din, S . (July 18, 2016) . Schwab’s Intelligent Portfolios crosses $8B AUM mark . Financial Planning . Retrieved February 14, 2017, from http://www.financial-planning.com/news/schwabs-intelligent-portfolios-crosses-8b-aum-mark .
41 Wong, M . M . (2015) . Hungry robo-advisors are eyeing wealth management assets . Morningstar Equity Research .
25%
45%
39%
21%
44%
15%
Promising, likely to play a big role in the market
Promising, but impact is likely limited to thelower end of the market for financial advice
Too early to tell
% of respondents selected
Australia Others
0% 5% 10% 15% 20% 25% 30% 35% 40% 45% 50%
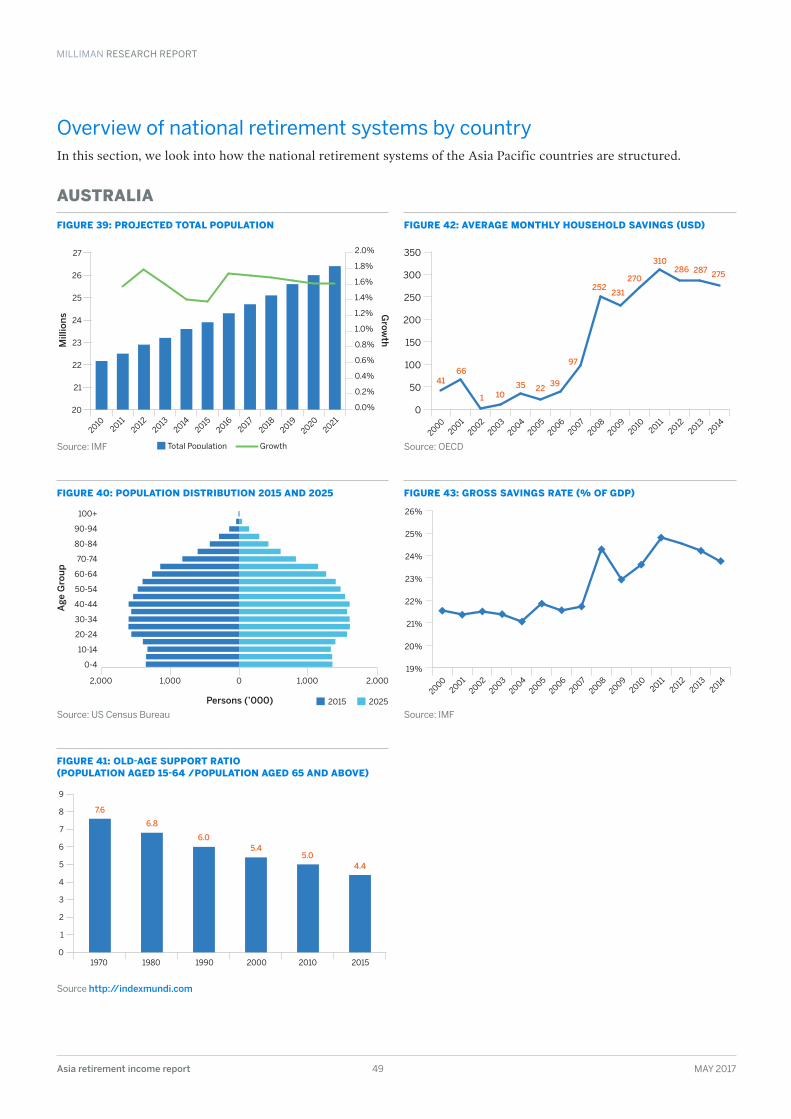
MILLIMAN RESEARCH REPORT
Asia retirement income report 49 MAY 2017
Overview of national retirement systems by countryIn this section, we look into how the national retirement systems of the Asia Pacific countries are structured.
AUSTRALIA
FIGURE 39: PROJECTED TOTAL POPULATION
Source: IMF
FIGURE 42: AVERAGE MONTHLY HOUSEHOLD SAVINGS (USD)
Source: OECD
FIGURE 40: POPULATION DISTRIBUTION 2015 AND 2025
Source: US Census Bureau
FIGURE 43: GROSS SAVINGS RATE (% OF GDP)
Source: IMF
FIGURE 41: OLD-AGE SUPPORT RATIO (POPULATION AGED 15-64 /POPULATION AGED 65 AND ABOVE)
Source http://indexmundi.com
Mill
ions
Grow
th
20142013
20122011
20102021
20202019
20182017
20162015
Total Population Growth
20
21
22
23
24
25
26
27
0.0%
0.2%
0.4%
0.6%
0.8%
1.0%
1.2%
1.4%
1.6%
1.8%
2.0%
20042003
20022001
20002011
20122013
20142010
20092008
20072006
2005
0
50
100
150
200
250
300
350
4166
1035 22
39
97
252231
270
310286 287 275
1
Age
Gro
up
2015 2025Persons (’000)
100+
90-94
80-84
70-74
60-64
50-54
40-44
30-34
20-24
10-14
0-4
1,000 2,00001,0002,000
1970
7.6
6.8
6.05.4
5.04.4
1980 1990 2000 2010 20150
1
2
3
4
5
6
7
8
9
20042003
20022001
20002011
20122013
20142010
20092008
20072006
2005
19%
20%
21%
22%
23%
24%
25%
26%
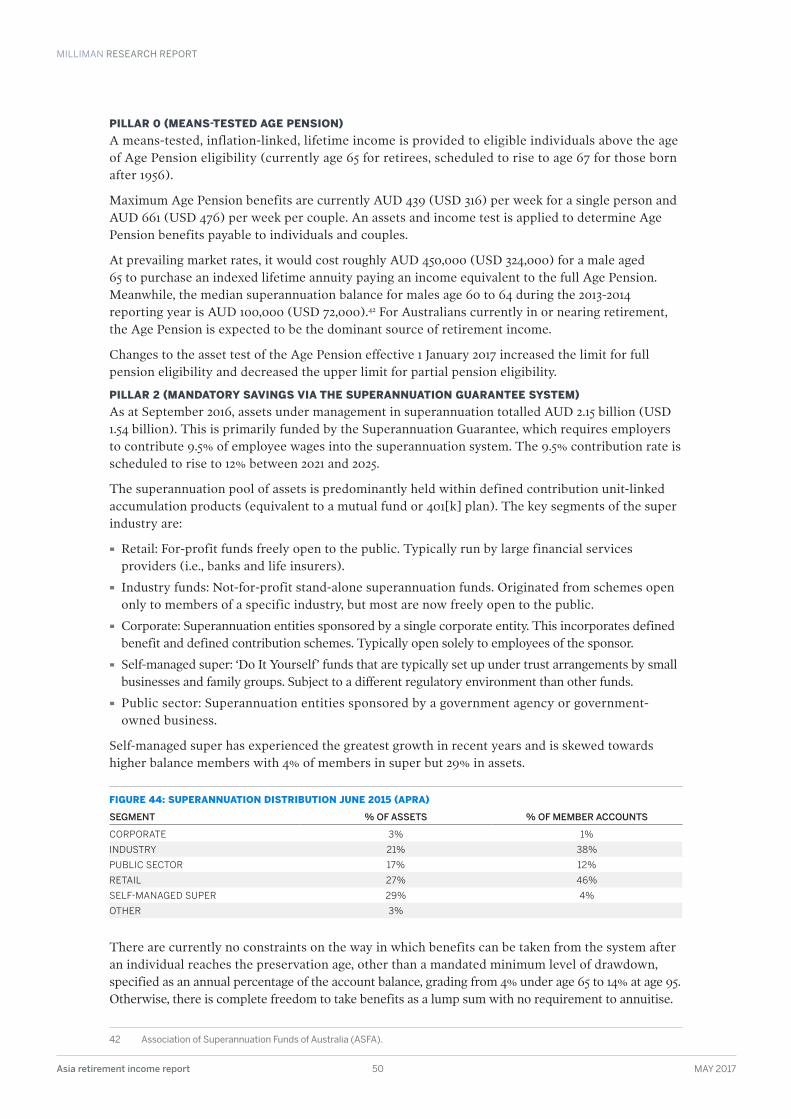
MILLIMAN RESEARCH REPORT
Asia retirement income report 50 MAY 2017
PILLAR 0 (MEANS-TESTED AGE PENSION)A means-tested, inflation-linked, lifetime income is provided to eligible individuals above the age of Age Pension eligibility (currently age 65 for retirees, scheduled to rise to age 67 for those born after 1956).
Maximum Age Pension benefits are currently AUD 439 (USD 316) per week for a single person and AUD 661 (USD 476) per week per couple. An assets and income test is applied to determine Age Pension benefits payable to individuals and couples.
At prevailing market rates, it would cost roughly AUD 450,000 (USD 324,000) for a male aged 65 to purchase an indexed lifetime annuity paying an income equivalent to the full Age Pension. Meanwhile, the median superannuation balance for males age 60 to 64 during the 2013-2014 reporting year is AUD 100,000 (USD 72,000).42 For Australians currently in or nearing retirement, the Age Pension is expected to be the dominant source of retirement income.
Changes to the asset test of the Age Pension effective 1 January 2017 increased the limit for full pension eligibility and decreased the upper limit for partial pension eligibility.
PILLAR 2 (MANDATORY SAVINGS VIA THE SUPERANNUATION GUARANTEE SYSTEM)As at September 2016, assets under management in superannuation totalled AUD 2.15 billion (USD 1.54 billion). This is primarily funded by the Superannuation Guarantee, which requires employers to contribute 9.5% of employee wages into the superannuation system. The 9.5% contribution rate is scheduled to rise to 12% between 2021 and 2025.
The superannuation pool of assets is predominantly held within defined contribution unit-linked accumulation products (equivalent to a mutual fund or 401[k] plan). The key segments of the super industry are:
· Retail: For-profit funds freely open to the public. Typically run by large financial services providers (i.e., banks and life insurers).
· Industry funds: Not-for-profit stand-alone superannuation funds. Originated from schemes open only to members of a specific industry, but most are now freely open to the public.
· Corporate: Superannuation entities sponsored by a single corporate entity. This incorporates defined benefit and defined contribution schemes. Typically open solely to employees of the sponsor.
· Self-managed super: ‘Do It Yourself’ funds that are typically set up under trust arrangements by small businesses and family groups. Subject to a different regulatory environment than other funds.
· Public sector: Superannuation entities sponsored by a government agency or government-owned business.
Self-managed super has experienced the greatest growth in recent years and is skewed towards higher balance members with 4% of members in super but 29% in assets.
FIGURE 44: SUPERANNUATION DISTRIBUTION JUNE 2015 (APRA)
SEGMENT % OF ASSETS % OF MEMBER ACCOUNTS
CORPORATE 3% 1%
INDUSTRY 21% 38%
PUBLIC SECTOR 17% 12%
RETAIL 27% 46%
SELF-MANAGED SUPER 29% 4%
OTHER 3%
There are currently no constraints on the way in which benefits can be taken from the system after an individual reaches the preservation age, other than a mandated minimum level of drawdown, specified as an annual percentage of the account balance, grading from 4% under age 65 to 14% at age 95. Otherwise, there is complete freedom to take benefits as a lump sum with no requirement to annuitise.
42 Association of Superannuation Funds of Australia (ASFA) .
MILLIMAN RESEARCH REPORT
Asia retirement income report 51 MAY 2017
PILLAR 3 (ADDITIONAL VOLUNTARY SAVINGS)Additional tax incentives are available on concessionary contributions to the superannuation system. Non-concessional contributions can also be made after-tax. Assets invested in superannuation receive further tax concessions on investment earnings, with no tax on investment earnings once assets are invested in the Pension phase. Pension phase withdrawals beyond preservation age also have zero tax.
Savings invested outside of superannuation are referred to as ‘ordinary money’.
STATE OF FINANCIAL ADVISORY SERVICES INDUSTRYIn general, large retail providers (e.g., the ‘big 4’ banks, AMP) have in recent years adopted a vertically integrated strategy. Growth in self-managed funds has arisen almost entirely from nonaligned models.
Industry funds and corporate funds have historically had a more direct distribution approach, relying on exclusive employer relationships, default arrangements often included in industrial awards, and direct marketing (typically promoted by industry funds as a low-cost ‘no commissions’ approach).
As industry funds have grown in size, they have increasingly offered aligned advice to customers (often with limited scope or outsourced to third-party providers). Similarly, the ownership of advice groups by large retail product providers has come under pressure, given the continued demand by those groups to offer a broader range of products (often led by internal research and compliance teams looking to comply with requirements to provide ‘best interests’ advice) and subsequent failure to fully establish a vertically integrated advice model.
Future of Financial Advice (FOFA) reforms implemented in 2013 laid out a revised regulatory framework for providing financial advice and in particular introduced a ban on conflicted remuneration (i.e., commissions) on wealth management products.
The Financial System Inquiry of 2014 (Murray Inquiry) put forth a number of recommendations which include improving standards of financial advice and better aligning the interests of firms and consumers.
Australia has seen a proliferation of robo-advice offerings. This includes several pure end-to-end robo-advice platforms by local start-ups offering portfolios based on exchange-traded funds (ETFs), as well as established financial services firms incorporating elements of robo-advice in existing distribution models.
MILLIMAN’S HIGH-LEVEL ASSESSMENT OF POTENTIAL OPPORTUNITY FOR PRIVATE PROVIDERS IN THIS MARKETAustralia has the largest pool of retirement assets in the Asia Pacific region, with similar demographics to other developed economies, making it attractive to financial services firms.
The present is a particularly opportune time for financial services firms in Australia. The industry typically adopts a ‘wait and see’ approach. We have seen in years past that innovation has been overshadowed by reacting to government policy such as Stronger Super reforms (MySuper) and the 2017 federal budget, which limited concessional contributions into superannuation.
However, in recent years, there is momentum from government in recognising the need for better solutions for retirement. This is seen in the Murray Inquiry’s recommendations to ‘set a clear objective for the superannuation system to provide income in retirement’ and ‘requiring superannuation trustees to pre-select a comprehensive income product (CIPR) in retirement for members to receive their benefit’.
At present, the Treasury has released a discussion paper soliciting input from industry on policy around CIPRs. From 1 July 2017 the government will extend tax exemptions on earnings in retirement for products such as deferred annuities.
The large pool of assets under management combined with the government’s increased focus on retirement incomes, therefore, makes the Australian market attractive for private providers.
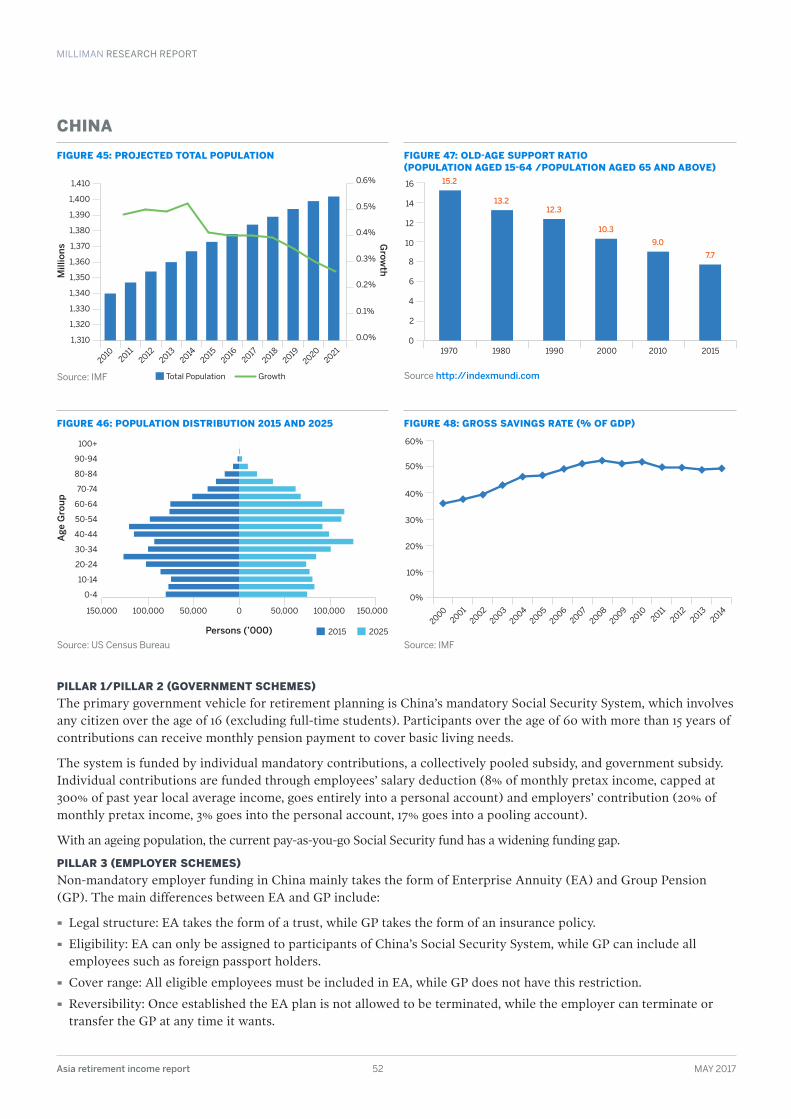
MILLIMAN RESEARCH REPORT
Asia retirement income report 52 MAY 2017
CHINA
FIGURE 45: PROJECTED TOTAL POPULATION
Source: IMF
FIGURE 47: OLD-AGE SUPPORT RATIO (POPULATION AGED 15-64 /POPULATION AGED 65 AND ABOVE)
Source http://indexmundi.com
FIGURE 46: POPULATION DISTRIBUTION 2015 AND 2025
Source: US Census Bureau
FIGURE 48: GROSS SAVINGS RATE (% OF GDP)
Source: IMF
PILLAR 1/PILLAR 2 (GOVERNMENT SCHEMES)The primary government vehicle for retirement planning is China’s mandatory Social Security System, which involves any citizen over the age of 16 (excluding full-time students). Participants over the age of 60 with more than 15 years of contributions can receive monthly pension payment to cover basic living needs.
The system is funded by individual mandatory contributions, a collectively pooled subsidy, and government subsidy. Individual contributions are funded through employees’ salary deduction (8% of monthly pretax income, capped at 300% of past year local average income, goes entirely into a personal account) and employers’ contribution (20% of monthly pretax income, 3% goes into the personal account, 17% goes into a pooling account).
With an ageing population, the current pay-as-you-go Social Security fund has a widening funding gap.
PILLAR 3 (EMPLOYER SCHEMES)Non-mandatory employer funding in China mainly takes the form of Enterprise Annuity (EA) and Group Pension (GP). The main differences between EA and GP include:
· Legal structure: EA takes the form of a trust, while GP takes the form of an insurance policy.
· Eligibility: EA can only be assigned to participants of China’s Social Security System, while GP can include all employees such as foreign passport holders.
· Cover range: All eligible employees must be included in EA, while GP does not have this restriction.
· Reversibility: Once established the EA plan is not allowed to be terminated, while the employer can terminate or transfer the GP at any time it wants.
Mill
ions
Grow
th
20142013
20122011
20102021
20202019
20182017
20162015
Total Population Growth
1,310
1,320
1,330
1,340
1,350
1,360
1,370
1,380
1,390
1,400
1,410
0.0%
0.1%
0.2%
0.3%
0.4%
0.5%
0.6%
1970 1980 1990 2000 2010 2015
15.2
13.212.3
10.3
9.0
7.7
0
2
4
6
8
10
12
14
16
Age
Gro
up
2015 2025Persons (’000)
100+
90-94
80-84
70-74
60-64
50-54
40-44
30-34
20-24
10-14
0-4
50,000 100,000 150,000050,000100,000150,0002004
20032002
2001
20002011
20122013
20142010
20092008
20072006
2005
0%
10%
20%
30%
40%
50%
60%
MILLIMAN RESEARCH REPORT
Asia retirement income report 53 MAY 2017
· Corporate income tax: Employer contributions to the EA plan within 5% of total payroll can be tax-exempted, while GP has no preferential tax treatment
· Individual income tax: Employer and employee contributions within 4% of income-tax basis (capped at 300% of past year local average income) are tax-deferred for the EA plan, while benefits payments from GP are tax-free.
· Portability: For the EA plan, upon resignation, the employee account can be transferred to another EA plan of the receiving company. Should the receiving company not have an EA plan, the ex-employer is responsible for managing the deferred account until the ex-employee has one of the following conditions: retirement immigration, or death. For the GP plan, the employee individual account will be terminated upon that employee’s termination of services. The vested portion of the employer account balance and 100% of the employee account balance can be cashed out to members. The unvested portion will be refunded to the employer.
PILLAR 3 (PRIVATE MARKET SCHEMES)China allows the sale of private market retirement income products. Historically, the market has seen solutions such as annuities, variable annuities, participating products, universal life, and unit-linked insurance. In 2014, annuity premium was CNY 282 billion (USD 40.6 billion), increasing by 77.2% on a year-on-year basis, while the total premium income of the life insurance market in China is CNY 1.3 trillion (USD 187 billion). Market participants include 70 life insurance companies (42 locals plus 28 joint ventures) and six pension companies. The majority of new business remains with the large insurers such as China Life, Ping An, New China Life, Taiping Life, and China Pacific Life Insurance.
The launch of variable annuities in 2011 now seems to have not been a success.
‘Retirement community’ is now a buzzword term in China’s life insurance market. High-end participating annuities may guarantee an entry ticket to the insurers’ self-built retirement communities, along with the affiliated medical centres, rehabilitation hospitals, private clinics, and other facilities.
Reverse mortgages are encouraged by the government, targeted at families bereft of their only child (because of the one-child policy) and low retirement income. However, the regulator received a lukewarm response from the market and from consumers. As of October 2016, Happy Life Insurance, one of only two insurers offering reverse mortgages, reported that only 89 people have participated in the plan.
Preferential tax policies for individual annuities have long been expected, with the State Council having issued ‘Opinions of the State Council on Accelerating the Development of Modern Insurance Industry’ in August 2015. But so far, no pilot program has been carried out.
STATE OF FINANCIAL ADVISORY SERVICES INDUSTRYCurrently, only high-net-worth private-bank customers use financial advisors. Robo-advice has been introduced in the fund industry, but is still in its embryonic stage.
MILLIMAN’S HIGH-LEVEL ASSESSMENT OF POTENTIAL OPPORTUNITY FOR PRIVATE PROVIDERS IN THIS MARKETThe lack of success of variable annuities in China is mainly due to a shortage of expertise and financial instruments, and uncompetitive yield rates compared with other financial products. Most, if not all, insurers manage investment in-house, but few of them have the experience and expertise to manage variable annuities.
The retirement market has great potential to grow in the next couple of years. Rapid growth of insurance premium income is widely expected in China, and the ageing population issue is likely to lead to greater demand for retirement income products.
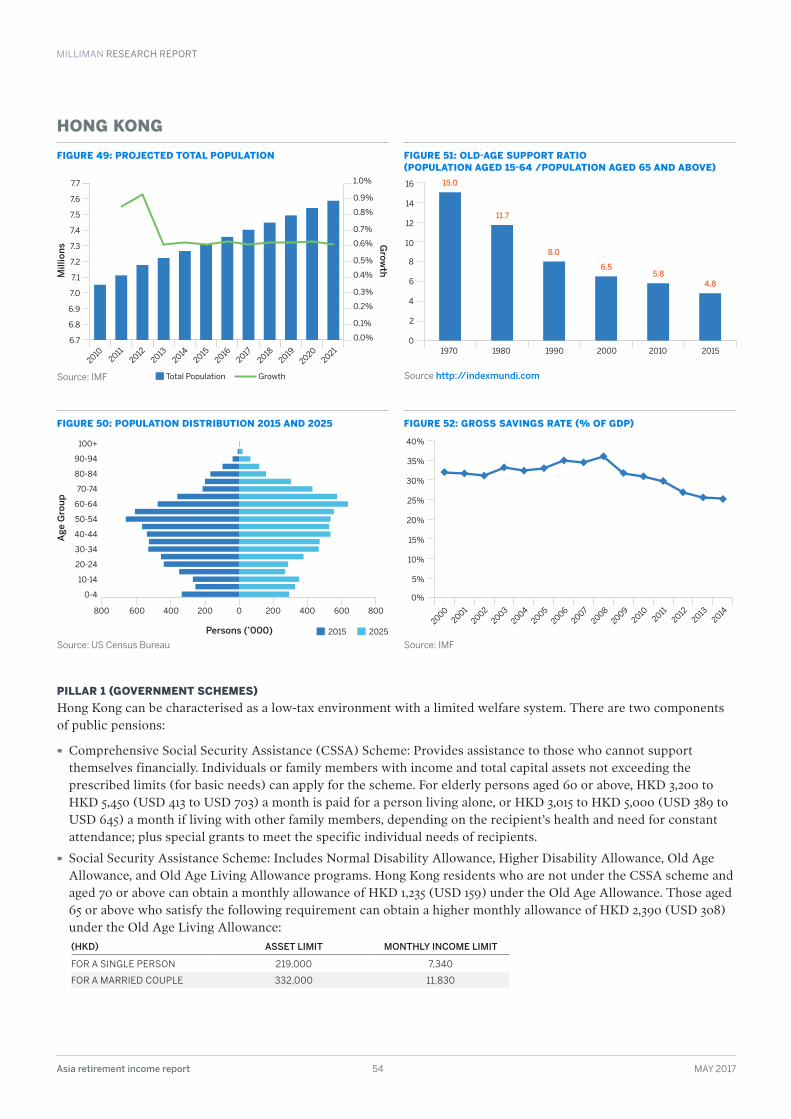
MILLIMAN RESEARCH REPORT
Asia retirement income report 54 MAY 2017
HONG KONG
FIGURE 49: PROJECTED TOTAL POPULATION
Source: IMF
FIGURE 51: OLD-AGE SUPPORT RATIO (POPULATION AGED 15-64 /POPULATION AGED 65 AND ABOVE)
Source http://indexmundi.com
FIGURE 50: POPULATION DISTRIBUTION 2015 AND 2025
Source: US Census Bureau
FIGURE 52: GROSS SAVINGS RATE (% OF GDP)
Source: IMF
PILLAR 1 (GOVERNMENT SCHEMES)Hong Kong can be characterised as a low-tax environment with a limited welfare system. There are two components of public pensions:
· Comprehensive Social Security Assistance (CSSA) Scheme: Provides assistance to those who cannot support themselves financially. Individuals or family members with income and total capital assets not exceeding the prescribed limits (for basic needs) can apply for the scheme. For elderly persons aged 60 or above, HKD 3,200 to HKD 5,450 (USD 413 to USD 703) a month is paid for a person living alone, or HKD 3,015 to HKD 5,000 (USD 389 to USD 645) a month if living with other family members, depending on the recipient’s health and need for constant attendance; plus special grants to meet the specific individual needs of recipients.
· Social Security Assistance Scheme: Includes Normal Disability Allowance, Higher Disability Allowance, Old Age Allowance, and Old Age Living Allowance programs. Hong Kong residents who are not under the CSSA scheme and aged 70 or above can obtain a monthly allowance of HKD 1,235 (USD 159) under the Old Age Allowance. Those aged 65 or above who satisfy the following requirement can obtain a higher monthly allowance of HKD 2,390 (USD 308) under the Old Age Living Allowance:(HKD) ASSET LIMIT MONTHLY INCOME LIMIT
FOR A SINGLE PERSON 219,000 7,340
FOR A MARRIED COUPLE 332,000 11,830
Mill
ions
Grow
th
20142013
20122011
20102021
20202019
20182017
20162015
Total Population Growth
6.7
6.8
6.9
7.0
7.1
7.2
7.3
7.4
7.5
7.6
7.7
0.0%
0.1%
0.2%
0.3%
0.4%
0.5%
0.6%
0.7%
0.8%
0.9%
1.0%
1970 1980 1990 2000 2010 2015
15.0
11.7
8.0
6.55.8
4.8
0
2
4
6
8
10
12
14
16
Age
Gro
up
2015 2025Persons (’000)
100+
90-94
80-84
70-74
60-64
50-54
40-44
30-34
20-24
10-14
0-4
200 400 600 8000400 200800 6002004
20032002
2001
20002011
20122013
20142010
20092008
20072006
2005
0%
5%
10%
15%
20%
25%
30%
35%
40%
MILLIMAN RESEARCH REPORT
Asia retirement income report 55 MAY 2017
PILLAR 2 (EMPLOYER SCHEMES)Permanent civil servants
· Civil Service Pension Scheme: For civil servants appointed before 1 June 2000. The pension amount depends on salary, length of service, etc. A lump-sum gratuity is paid upon retirement and the remaining is paid on a monthly basis.
· Civil Service Provident Fund Scheme: For civil servants appointed on or after 1 June 2000. It is set up under the Mandatory Provident Fund Schemes Ordinance (MPFSO) to replace the Civil Service Pension Scheme. The government contribution rate increases with completed years of civil service, from 5% to 25% of basic salary, according to the vesting schedule.
Employees in private companies/non-permanent civil servantsBefore MPFSO was introduced, many of the larger employers in Hong Kong offered defined benefit types of voluntary retirement schemes and a few defined contribution schemes. These schemes were regulated under the Occupational Retirement Schemes Ordinance (ORSO). ORSO schemes are voluntarily set up by employer, the contribution rates and investment choices are determined by the employer and the trust deeds involved. Employee contribution is not mandatory under ORSO schemes. There is a vesting scale determining the percentage of accrued benefits derived from the employer’s contributions; for example 30% after three years of service and 100% after 10 years of service.
The government passed legislation for a mandatory provident fund (MPF) scheme to provide compulsory retirement savings in 1995. The MPF system was launched in 2000. Employees can only choose the funds under the MPF scheme decided by the employer, and the contributions are fully vested independent of years of service. The minimum and maximum wages have been revised several times (slightly) since the implementation of MPF. The following details are updated as at 1 June 2014:
· The current minimum and maximum wage: HKD 7,100 to HKD 30,000 (USD 916 to USD 3,871) per month
· 5% of monthly salary will be deducted and contributed to the MPF fund
· The employer also contributes 5% of the monthly salary to the employee’s MPF account, subject to a maximum of HKD 1,500 (USD 194)
· Extra voluntary MPF contributions are allowed
In an amendment bill passed in May 2016, MPF schemes will be required to provide a default investment strategy that has service fees capped at 0.75% and recurring expenses capped at 0.2%. There is also an ongoing political debate for the offset mechanism in MPF to be scrapped. The offset mechanism is that employers can currently use their MPF contributions to offset long-service payments or severance to staff.
Tax deductions are allowed for the employee’s mandatory contributions made to an MPF scheme.
ORSO schemes which have been granted MPF exemption can continue to operate after 2000, but the employer must provide both schemes for new employees to choose from. Other ORSO schemes can only act as top-up schemes in addition to the MPF scheme.
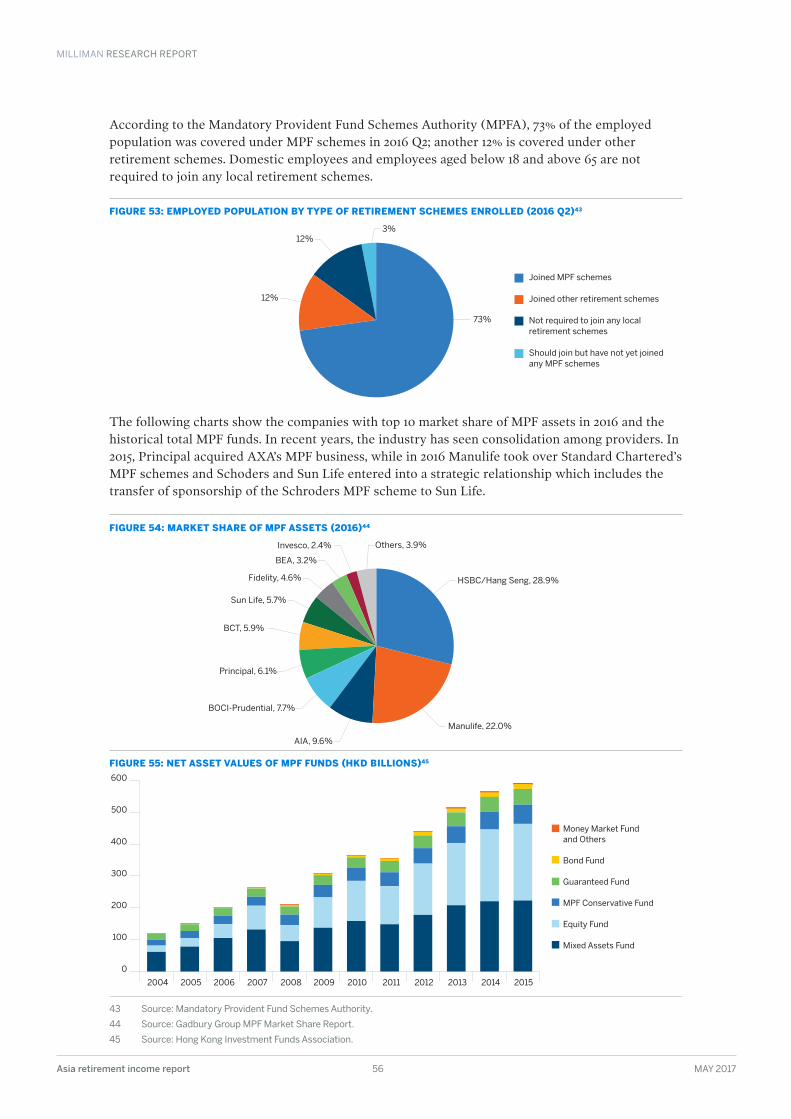
MILLIMAN RESEARCH REPORT
Asia retirement income report 56 MAY 2017
According to the Mandatory Provident Fund Schemes Authority (MPFA), 73% of the employed population was covered under MPF schemes in 2016 Q2; another 12% is covered under other retirement schemes. Domestic employees and employees aged below 18 and above 65 are not required to join any local retirement schemes.
FIGURE 53: EMPLOYED POPULATION BY TYPE OF RETIREMENT SCHEMES ENROLLED (2016 Q2)43
The following charts show the companies with top 10 market share of MPF assets in 2016 and the historical total MPF funds. In recent years, the industry has seen consolidation among providers. In 2015, Principal acquired AXA’s MPF business, while in 2016 Manulife took over Standard Chartered’s MPF schemes and Schoders and Sun Life entered into a strategic relationship which includes the transfer of sponsorship of the Schroders MPF scheme to Sun Life.
FIGURE 54: MARKET SHARE OF MPF ASSETS (2016)44
FIGURE 55: NET ASSET VALUES OF MPF FUNDS (HKD BILLIONS)45
43 Source: Mandatory Provident Fund Schemes Authority .
44 Source: Gadbury Group MPF Market Share Report .
45 Source: Hong Kong Investment Funds Association .
73%
12%
3%12%
Joined MPF schemes
Joined other retirement schemes
Not required to join any local retirement schemes
Should join but have not yet joined any MPF schemes
Manulife, 22.0%
AIA, 9.6%
Principal, 6.1%
BCT, 5.9%
Sun Life, 5.7%
Fidelity, 4.6% HSBC/Hang Seng, 28.9%
Others, 3.9%
BOCI-Prudential, 7.7%
BEA, 3.2%
Invesco, 2.4%
0
100
200
300
400
500
600
2004 2005 2006 2007 2008 2009 2010 2011 2012 2013 2014 2015
Money Market Fundand Others
Bond Fund
Guaranteed Fund
MPF Conservative Fund
Equity Fund
Mixed Assets Fund
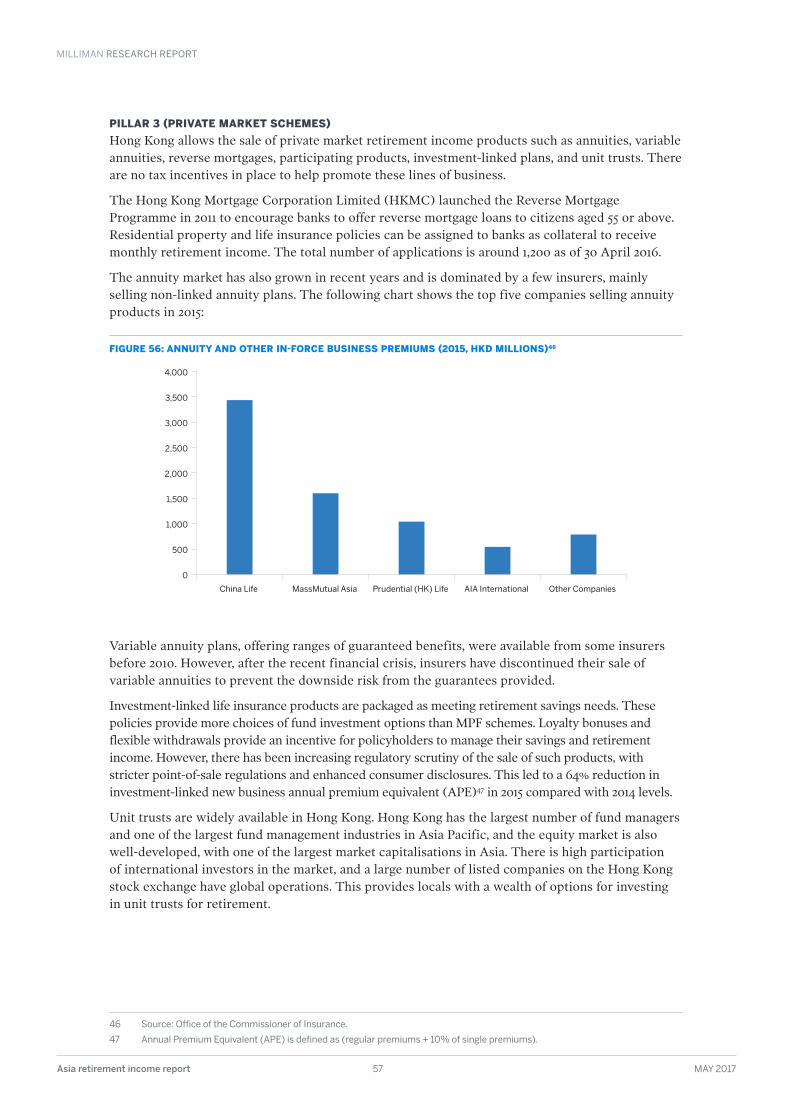
MILLIMAN RESEARCH REPORT
Asia retirement income report 57 MAY 2017
PILLAR 3 (PRIVATE MARKET SCHEMES)Hong Kong allows the sale of private market retirement income products such as annuities, variable annuities, reverse mortgages, participating products, investment-linked plans, and unit trusts. There are no tax incentives in place to help promote these lines of business.
The Hong Kong Mortgage Corporation Limited (HKMC) launched the Reverse Mortgage Programme in 2011 to encourage banks to offer reverse mortgage loans to citizens aged 55 or above. Residential property and life insurance policies can be assigned to banks as collateral to receive monthly retirement income. The total number of applications is around 1,200 as of 30 April 2016.
The annuity market has also grown in recent years and is dominated by a few insurers, mainly selling non-linked annuity plans. The following chart shows the top five companies selling annuity products in 2015:
FIGURE 56: ANNUITY AND OTHER IN-FORCE BUSINESS PREMIUMS (2015, HKD MILLIONS)46
Variable annuity plans, offering ranges of guaranteed benefits, were available from some insurers before 2010. However, after the recent financial crisis, insurers have discontinued their sale of variable annuities to prevent the downside risk from the guarantees provided.
Investment-linked life insurance products are packaged as meeting retirement savings needs. These policies provide more choices of fund investment options than MPF schemes. Loyalty bonuses and flexible withdrawals provide an incentive for policyholders to manage their savings and retirement income. However, there has been increasing regulatory scrutiny of the sale of such products, with stricter point-of-sale regulations and enhanced consumer disclosures. This led to a 64% reduction in investment-linked new business annual premium equivalent (APE)47 in 2015 compared with 2014 levels.
Unit trusts are widely available in Hong Kong. Hong Kong has the largest number of fund managers and one of the largest fund management industries in Asia Pacific, and the equity market is also well-developed, with one of the largest market capitalisations in Asia. There is high participation of international investors in the market, and a large number of listed companies on the Hong Kong stock exchange have global operations. This provides locals with a wealth of options for investing in unit trusts for retirement.
46 Source: Office of the Commissioner of Insurance .
47 Annual Premium Equivalent (APE) is defined as (regular premiums + 10% of single premiums) .
0
500
1,000
1,500
2,000
2,500
3,000
3,500
4,000
China Life MassMutual Asia Prudential (HK) Life AIA International Other Companies
MILLIMAN RESEARCH REPORT
Asia retirement income report 58 MAY 2017
STATE OF FINANCIAL ADVISORY SERVICES INDUSTRYMost life insurance sales are still made by tied agency and through banks. Independent financial advisors sell a range of savings and protection products to the local population and expatriates. There has been increasing regulatory scrutiny of the sale of insurance products, and the publication of Guidance Notes 15 and 16 (for investment-linked business and non-investment-linked business, respectively) has prohibited indemnified commissions and implemented stricter point-of-sale regulations and enhanced consumer disclosures.
MILLIMAN’S HIGH-LEVEL ASSESSMENT OF POTENTIAL OPPORTUNITY FOR PRIVATE PROVIDERS IN THIS MARKETThe main retirement product offerings are annuity products. Other traditional and investment-linked life insurance products are packaged as meeting retirement savings needs.
With an ageing population and an increasing strain on public finances from elderly assistance and healthcare subsidies, there is a clear need for more retirement provisions in Hong Kong. However, the Hong Kong government arguably has not yet implemented adequate safeguards to protect its rapidly ageing population. While the government is in the midst of considering a more comprehensive social security scheme to complement their existing programs, we also expect the government to look to private providers to provide part of the suite of retirement solutions.
Although long-term care (LTC) insurance is currently available in Hong Kong, sales have been historically very low, and it is usually offered as a rider on a base insurance policy. We expect LTC insurance to become an attractive product offering in the future.
We also believe that there is room for variable annuity types of products to become popular in Hong Kong. On the supply side, rising bond yields and equity markets make it easier for insurers to offer such products. The demand for the guarantees inherent in variable annuities is also expected to increase because of the ageing population. It will be critical for insurers to offer guarantees that are seen as valuable by customers, while also being able to effectively manage the downside risks of the guarantees. However, there are potentially significant challenges to be overcome, such as the likely level of regulatory scrutiny for approval and sales of such products, and overcoming some negative connotations of variable annuities within industry circles.
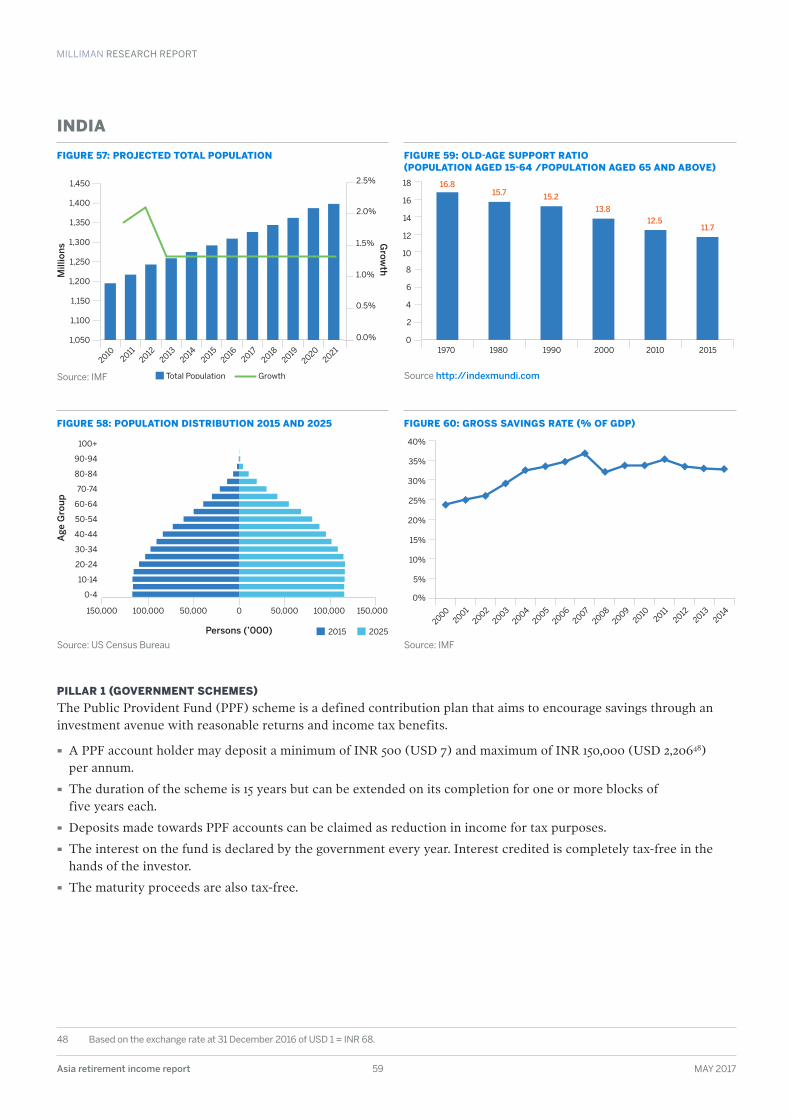
MILLIMAN RESEARCH REPORT
Asia retirement income report 59 MAY 2017
INDIA
FIGURE 57: PROJECTED TOTAL POPULATION
Source: IMF
FIGURE 59: OLD-AGE SUPPORT RATIO (POPULATION AGED 15-64 /POPULATION AGED 65 AND ABOVE)
Source http://indexmundi.com
FIGURE 58: POPULATION DISTRIBUTION 2015 AND 2025
Source: US Census Bureau
FIGURE 60: GROSS SAVINGS RATE (% OF GDP)
Source: IMF
PILLAR 1 (GOVERNMENT SCHEMES)The Public Provident Fund (PPF) scheme is a defined contribution plan that aims to encourage savings through an investment avenue with reasonable returns and income tax benefits.
· A PPF account holder may deposit a minimum of INR 500 (USD 7) and maximum of INR 150,000 (USD 2,20648) per annum.
· The duration of the scheme is 15 years but can be extended on its completion for one or more blocks of five years each.
· Deposits made towards PPF accounts can be claimed as reduction in income for tax purposes.
· The interest on the fund is declared by the government every year. Interest credited is completely tax-free in the hands of the investor.
· The maturity proceeds are also tax-free.
48 Based on the exchange rate at 31 December 2016 of USD 1 = INR 68 .
Mill
ions
Grow
th
20142013
20122011
20102021
20202019
20182017
20162015
Total Population Growth
1,050
1,100
1,150
1,200
1,250
1,300
1,350
1,400
1,450
0.0%
0.5%
1.0%
1.5%
2.0%
2.5%
1970 1980 1990 2000 2010 2015
16.815.7 15.2
13.8
12.511.7
0
2
4
6
8
10
12
14
16
18
Age
Gro
up
2015 2025Persons (’000)
100+
90-94
80-84
70-74
60-64
50-54
40-44
30-34
20-24
10-14
0-4
50,000 100,000 150,000050,000100,000150,0002004
20032002
2001
20002011
20122013
20142010
20092008
20072006
2005
0%
5%
10%
15%
20%
25%
30%
35%
40%
MILLIMAN RESEARCH REPORT
Asia retirement income report 60 MAY 2017
PILLAR 2 (EMPLOYER SCHEMES)The Employees’ Provident Fund (India, EPFI), promulgated by the Employees’ Provident Fund Organisation of India (EPFO), is one of the most popular defined contribution investment schemes for salaried persons in India.
· Employees with basic salary up to INR 15,000 (USD 221) a month and employers with minimum 20 employees are obligated to contribute to the provident fund. For others, it is voluntary.
· Employees contribute 12% of their basic salary in the fund, which is exempted from tax deductions.
· Employers also pay 12%, out of which 8.33% is used to fund the pension portion of the provident fund, called the Employee Pension Scheme. The remaining 3.67% is deposited into the employees’ provident fund account.
· The interest on the fund is pegged by EPFO in consultation with the Government of India.
Under National Pension System (NPS), a defined contribution plan launched under the purview of the Pension Fund Regulatory and Development Authority (PFRDA), the subscriber is allotted a unique Permanent Retirement Account Number which provides access to two personal accounts:
· Tier I account: This is a non-withdrawal account. Contribution to Tier I is mandatory for all Government employees but voluntary for nongovernment employees.
· Tier II account: This is a voluntary savings account from which subscribers are free to withdraw their savings whenever they wish.
· A minimum amount of INR 6,000 (USD 88) has to be deposited by the subscriber in a year.
· Tax is exempted on a maximum amount of INR 200,000 (USD 2,941).
In addition to this, workers in both public and private sectors are subject to a second tier of the lump-sum retirement benefit, known as gratuity, which is a defined benefit plan.
· It is paid to the workers who fulfil certain eligibility conditions such as a minimum qualifying service period of five years.
· It is equivalent to 15 days of final earnings for each year of service completed.
· The cost of gratuity is entirely borne by the employer.
PILLAR 3 (PRIVATE MARKET SCHEMES)The Indian market includes a variety of retirement plans such as with- and without-cover pension plans, annuities, and pension funds. These schemes are regulated by the Insurance Regulatory and Development Authority of India (IRDAI), a statutory body formed to regulate the insurance industry in India.
These schemes are taxable upon withdrawal, with the following tax implications:
· The annuity payment received is taxable in the hands of policyholders.
· The policyholder’s contribution paid as premium towards these plans is tax-exempted up to a certain limit.
· Insurance companies do not pay tax on profits arising from pension schemes.
MILLIMAN RESEARCH REPORT
Asia retirement income report 61 MAY 2017
STATE OF FINANCIAL ADVISORY SERVICES INDUSTRYThe IRDAI regulates the insurance sector, the Securities and Exchange Board of India (SEBI) regulates the mutual funds industry, and the Pension Fund Regulatory and Development Authority (PFRDA) regulates the NPS. Insurance products are sold through a combination of an insurer’s own agency sales force, the bancassurance channel and other third-party distribution channels, and brokers. Other minor channels of distribution include direct marketing and online.
In December 2016, the IRDAI issued new regulations effecting changes to the distributor commission structures for various insurance products and distribution channels. Under the new regulations, the commissions for individual protection business has been increased to boost the sale of such business in order to help close the huge protection gap in India. Indian life insurers have traditionally been much more focused on selling savings and investment-oriented plans rather than protection business.
In 2013, SEBI issued the Investment Advisors Regulations 2013, which requires investment advisors to register with SEBI. Registered investment advisors (RIAs) are required to meet certain minimum criteria, and have to meet various fiduciary responsibilities towards clients and disclosure of conflicts of interest. However, because of onerous requirements such as high compliance costs and being restricted to only fee-based advice instead of commission-based advice, the number of RIAs has been very small to date.
MILLIMAN’S HIGH-LEVEL ASSESSMENT OF POTENTIAL OPPORTUNITY FOR PRIVATE PROVIDERS IN THIS MARKETThe level of social security provided by the various schemes offered by the Government is considered to be grossly inadequate. Consequently, the private sector has a significant role to play in providing long-term retirement provisions for the citizens.
As the joint family system is disintegrating, Indians will increasingly have to provide for their retirement through their own savings.
Considering this, the three main systems for long-term retirement provisions—i.e., the pension policies provided through the life insurance industry; the long-term investment vehicles provided through the mutual fund industry, and the NPS, provided through the PFRDA—are expected to play an important role.
The potential for this segment is significant.
However, in order to provide a boost to the retirement provisions, a slew of other measures may be necessary:
· Providing attractive distributor compensation under NPS
· Rationalising some onerous product regulations applicable to the pensions products offered by the life insurance industry
· Rationalising the tax benefits applicable to immediate annuity products
· Making available long-dated zero coupon Government bonds for better asset-liability management by annuity providers
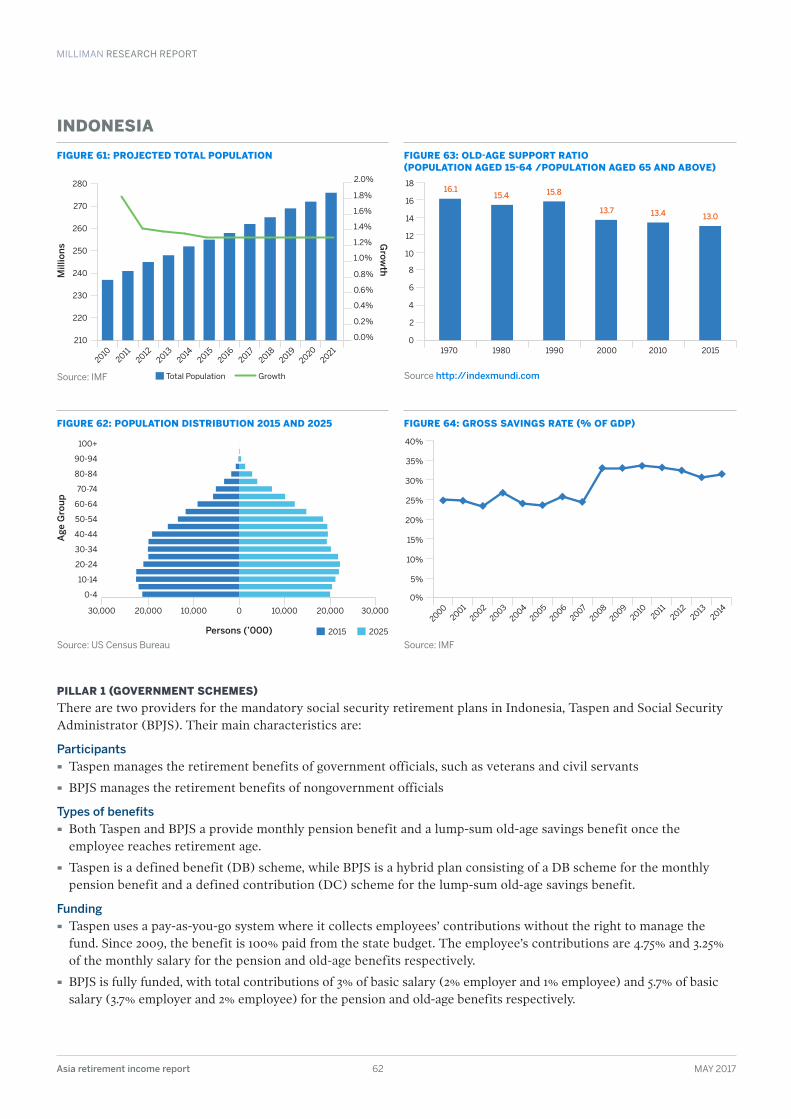
MILLIMAN RESEARCH REPORT
Asia retirement income report 62 MAY 2017
INDONESIA
FIGURE 61: PROJECTED TOTAL POPULATION
Source: IMF
FIGURE 63: OLD-AGE SUPPORT RATIO (POPULATION AGED 15-64 /POPULATION AGED 65 AND ABOVE)
Source http://indexmundi.com
FIGURE 62: POPULATION DISTRIBUTION 2015 AND 2025
Source: US Census Bureau
FIGURE 64: GROSS SAVINGS RATE (% OF GDP)
Source: IMF
PILLAR 1 (GOVERNMENT SCHEMES)There are two providers for the mandatory social security retirement plans in Indonesia, Taspen and Social Security Administrator (BPJS). Their main characteristics are:
Participants
· Taspen manages the retirement benefits of government officials, such as veterans and civil servants
· BPJS manages the retirement benefits of nongovernment officials
Types of benefits
· Both Taspen and BPJS a provide monthly pension benefit and a lump-sum old-age savings benefit once the employee reaches retirement age.
· Taspen is a defined benefit (DB) scheme, while BPJS is a hybrid plan consisting of a DB scheme for the monthly pension benefit and a defined contribution (DC) scheme for the lump-sum old-age savings benefit.
Funding
· Taspen uses a pay-as-you-go system where it collects employees’ contributions without the right to manage the fund. Since 2009, the benefit is 100% paid from the state budget. The employee’s contributions are 4.75% and 3.25% of the monthly salary for the pension and old-age benefits respectively.
· BPJS is fully funded, with total contributions of 3% of basic salary (2% employer and 1% employee) and 5.7% of basic salary (3.7% employer and 2% employee) for the pension and old-age benefits respectively.
Mill
ions
Grow
th
20142013
20122011
20102021
20202019
20182017
20162015
Total Population Growth
210
220
230
240
250
260
270
280
0.0%
0.2%
0.4%
0.6%
0.8%
1.0%
1.2%
1.4%
1.6%
1.8%
2.0%
1970 1980 1990 2000 2010 2015
16.115.4 15.8
13.7 13.4 13.0
0
2
4
6
8
10
12
14
16
18
Age
Gro
up
2015 2025Persons (’000)
100+
90-94
80-84
70-74
60-64
50-54
40-44
30-34
20-24
10-14
0-4
10,000 20,000 30,000010,00020,00030,0002004
20032002
2001
20002011
20122013
20142010
20092008
20072006
20050%
5%
10%
15%
20%
25%
30%
35%
40%
MILLIMAN RESEARCH REPORT
Asia retirement income report 63 MAY 2017
Normal retirement age
· Normal retirement age (NRA) for government officials in Taspen varies depending on the position and some classifications, ranging from age 53 to 65.
· For nongovernment officials under BPJS, the NRA is set as age 56 but will increase to age 57 in 2019, and then by an additional year every three years until NRA reaches age 65.
PILLAR 2 (EMPLOYER SCHEMES)The retirement plan by the employer aims to minimise employees’ income reduction after retirement. This pillar only applies to nongovernment officials as a supplementary retirement benefit.
The amount of retirement benefit paid is regulated under Labour Law no. 13/2003, which defines a floor benefit to which each employee is entitled, guaranteed by the employer.
The fund is privately managed, and the employer has discretion to determine the contribution rate as well as to choose the type of funding scheme. In general, the employer scheme takes the form of an employer’s pension fund (DPPK) or a financial institution pension fund (DPLK). A DPPK offers both DB and DC benefit types, while a DPLK only offers a DC benefit. In the DC case, if the accumulated benefit is lower than the minimum benefit, the employer has to top up the difference. On the other hand, if the accumulated benefit is higher, the upside amount will benefit the employees.
The benefit accumulates as a lump sum, however the government requires a large percentage of the lump sum to be used to purchase annuities. This applies to employees who enter the workforce after 1992.
PILLAR 3 (PRIVATE MARKET SCHEMES)The third pillar is voluntary saving via individual saving or DPLK. It acts as a secondary plan to reduce income and cover additional needs.
For individual savings, it can be in a form of conventional bank savings or insurance products, such as endowment, while in DPLK, the retirement scheme system is similar to the employer supplementary scheme but is bought by individuals. The providers of DPLK in Indonesia are mostly banks.
There is a tax-advantaged plan for additional retirement income.
STATE OF FINANCIAL ADVISORY SERVICES INDUSTRYThe retirement schemes in Indonesia are regulated by the Financial Services Authority (OJK). It covers all aspects that include financial and technical viewpoints. The supervision activities include:
· Licensing activity
· Reporting obligations
· Audits by OJK
· Imposition of sanctions
Insurance products are mainly sold through the insurer’s own tied agency sales force or through the bancassurance channel (45% and 33% of new business weighted premiums, respectively, in 2015). The financial advisory sector is still nascent.
MILLIMAN’S HIGH-LEVEL ASSESSMENT OF POTENTIAL OPPORTUNITY FOR PRIVATE PROVIDERS IN THIS MARKETIndonesia still only has a small proportion of workers who have set aside their incomes for future savings. If this continues, the government expects to spend a greater budget to fund these retired citizens, which may impose a burden on the younger workers, especially with the ageing population. Meanwhile, the growing middle class in Indonesia may be a suitable target for private providers to offer savings and retirement solutions and help people sustain their lifestyles after retirement.
According to current regulation on the second pillar, such as the fact that retirees are not allowed to receive lump sums, there is potential for insurance companies to innovate and offer new pension products. However, because pension products are a very long-term liability in nature, not all insurance companies are ready to bear the increased risk.
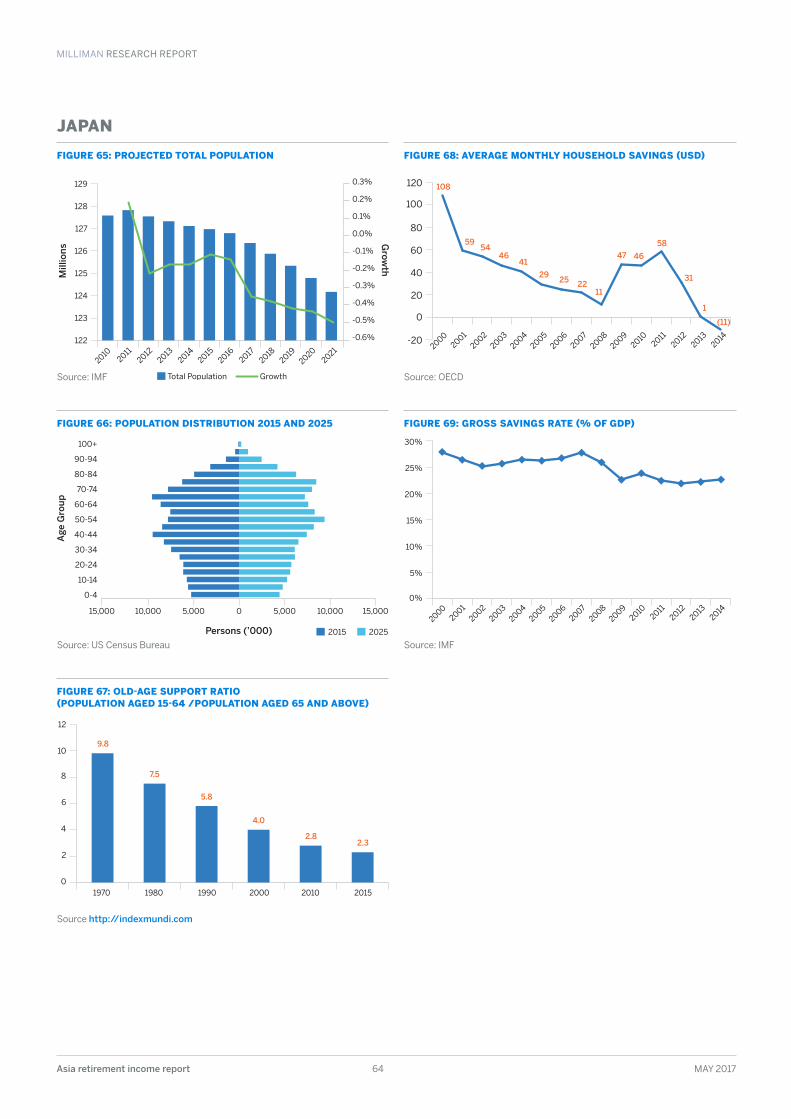
MILLIMAN RESEARCH REPORT
Asia retirement income report 64 MAY 2017
JAPAN
FIGURE 65: PROJECTED TOTAL POPULATION
Source: IMF
FIGURE 68: AVERAGE MONTHLY HOUSEHOLD SAVINGS (USD)
Source: OECD
FIGURE 66: POPULATION DISTRIBUTION 2015 AND 2025
Source: US Census Bureau
FIGURE 69: GROSS SAVINGS RATE (% OF GDP)
Source: IMF
FIGURE 67: OLD-AGE SUPPORT RATIO (POPULATION AGED 15-64 /POPULATION AGED 65 AND ABOVE)
Source http://indexmundi.com
1970 1980 1990 2000 2010 2015
9.8
7.5
5.8
4.0
2.82.3
0
2
4
6
8
10
12
Mill
ions
Grow
th
20142013
20122011
20102021
20202019
20182017
20162015
Total Population Growth
122
123
124
125
126
127
128
129
-0.6%
-0.5%
-0.4%
-0.3%
-0.2%
-0.1%
0.0%
0.1%
0.2%
0.3%
20042003
20022001
20002011
20122013
20142010
20092008
20072006
2005-20
0
20
40
60
80
100
120 108
59
4641
2925 22
11
47 46
58
31
1
(11)
54
Age
Gro
up
2015 2025Persons (’000)
100+
90-94
80-84
70-74
60-64
50-54
40-44
30-34
20-24
10-14
0-4
5,000 10,000 15,00005,00010,00015,0002004
20032002
2001
20002011
20122013
20142010
20092008
20072006
20050%
5%
10%
15%
20%
25%
30%
MILLIMAN RESEARCH REPORT
Asia retirement income report 65 MAY 2017
PILLAR 1 (GOVERNMENT SCHEMES)Japan is often characterised as the first rapidly ageing country, and also has the highest life expectancy in the world.
The national pension system, Kokumin Nenkin, is compulsory for all registered residents of Japan aged 20 to 59 years. The contribution amount is set at JPY16,260 (USD 13849) per month for the fiscal year 2016. The full benefit amount is currently JPY 780,100 (USD 6,667) per year, based on 40 years of contribution.
PILLAR 2 (EMPLOYER SCHEMES)The Employees’ Pension Insurance, or Kosei Nenkin, is mandatory for employees of private companies. Public service employees which were previously under Mutual Aid Pensions, or Kyosai Nenkin, have now also been moved into the Employees’ Pension Insurance system.
This employer scheme operates like a pay-as-you-go defined benefit program. Contributions are paid half by the employer and half by the employees, and come up to a total of 18.3% of the employee’s salary in 2017. The benefit payment consists of two components: a flat rate portion, and a remuneration-linked portion that depends on the average remuneration of the employee and the number of months worked.
Many large companies also provide corporate pension plans for employees. They are decided by the company, and can be defined benefit or defined contribution, or even a combination of both. Employers pay the required contributions, with no matching contribution from employees.
PILLAR 3 (PRIVATE MARKET SCHEMES)Japan allows individuals who do not have access to corporate pensions to contribute to a tax-advantaged voluntary personal defined contribution plan, which pays benefits based on investment returns. Contributions are subject to a ceiling.
Meanwhile, common insurance products that provide for retirement include fixed annuities and variable annuities (VA). However, based on a survey conducted by the Japanese Institute for Life Insurance in 2009:
· A majority of respondents do not rely on annuity products. The highest percentage was people who stated they relied on the national pension for their retirement income, while bank deposits and employer-sponsored plans were at second and third place, respectively.
· For fixed annuities (as they are categorised in Japan), the survey revealed that lifetime annuities were not common, making up only 16% of fixed annuities. The most common type of fixed annuities were 10-year certain annuities (36%), while certain annuities with other periods are also popular.
VA sales saw a period of growth since their introduction in 1999 by foreign insurers, while fixed annuity sales were stagnant. Fixed annuity products did not offer attractive rates, which was due to low interest rates in Japan. As at fiscal 2015, VAs made up 16.6% of individual annuity new business premiums.
VAs in Japan come with guarantees, with Guaranteed Minimum Death Benefit (GMDB) and Guaranteed Minimum Accumulation Benefit (GMAB) being the most common. These guarantees are a source of risk for the insurer, as was seen following the global financial crisis in 2008, when many foreign insurers exited the market because of losses suffered from variable annuities.
Some innovative products in the market include volatility-rebalancing VAs and fixed and variable annuities denominated in foreign currency.
PILLAR 4 (INFORMAL SUPPORT)Older people working part-time after retirement is becoming common in Japan. The Japanese population is exceptionally healthy in general, and we believe it will be the norm to see people working part-time into their mid-70s.
49 Based on the exchange rate at 31 December 2016 of USD 1 = JPY 117 .

MILLIMAN RESEARCH REPORT
Asia retirement income report 66 MAY 2017
STATE OF FINANCIAL ADVISORY SERVICES INDUSTRYInsurance products are mainly sold by an insurer’s tied sales agents, taking up 68% of total new policies in 2012. However, there is an increasing trend of insurance sales in other channels such as bancassurance, insurance outlets, and the Internet. Japan Post Insurance has seen strong insurance sales through its more than 24,000 post offices, and was one of the leading life insurance companies in Japan in 2015.
Banks are the predominant sales channel for fixed and variable annuities. Banks position the annuities as an investment vehicle for retirees who receive a lump-sum payment upon retirement from employers. A small number of annuity sales are done through security brokers.
MILLIMAN’S HIGH-LEVEL ASSESSMENT OF POTENTIAL OPPORTUNITY FOR PRIVATE PROVIDERS IN THIS MARKETWith both high life expectancy and a low interest rate environment, we expect that Pillar 1 and Pillar 2 will become increasingly inadequate for retirement. It is expected that a majority of people entering retirement in the near future will not have sufficient income after retirement. The large percentage of retirees still relying on bank deposits (which are basically not earning interest in the current environment) also presents an opportunity for more efficient use of their retirement savings.
However, there are also several challenges for insurers seeking to provide retirement products in Japan. Firstly, the market is already quite developed, and the banks, which are the predominant distribution channel for annuity products, already have distribution agreements in place. Secondly, the low interest rates are a big issue, and there is unwillingness at least in the middle market to assume equity and foreign exchange risk.
To the extent that insurers continue to develop new generations of equity and foreign currency products with some downside protection, we expect to see growing assets in the annuity segment.
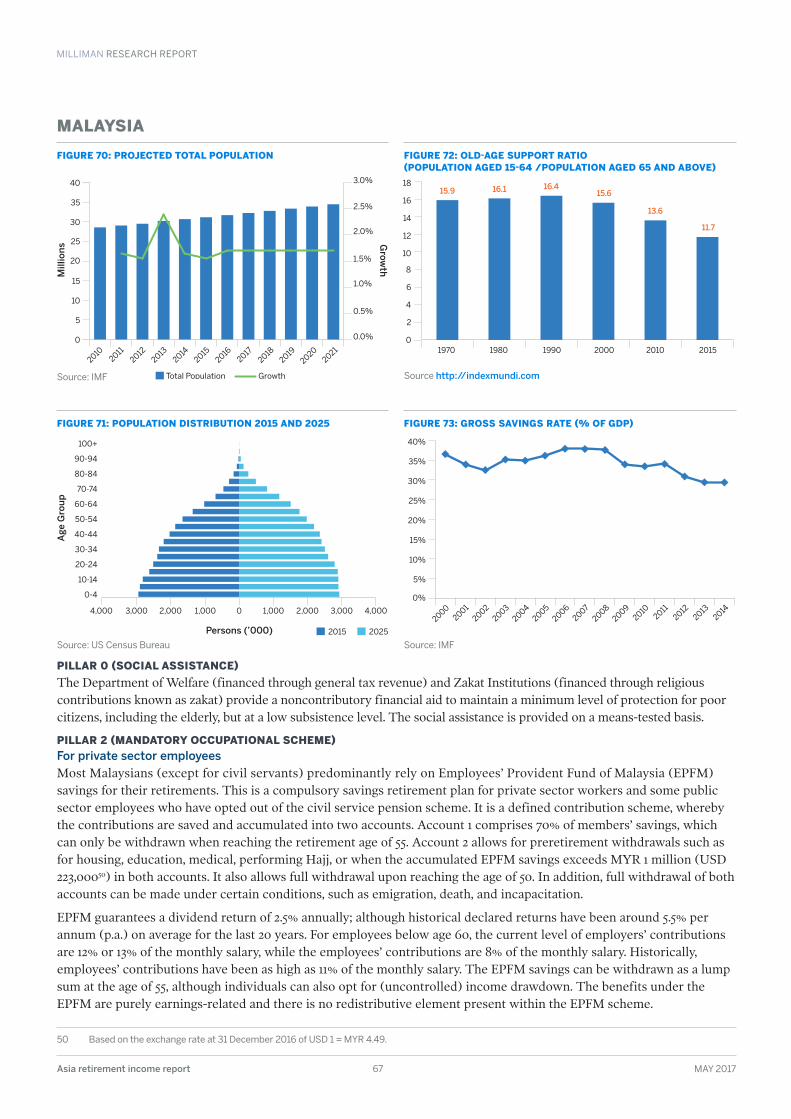
MILLIMAN RESEARCH REPORT
Asia retirement income report 67 MAY 2017
MALAYSIA
FIGURE 70: PROJECTED TOTAL POPULATION
Source: IMF
FIGURE 72: OLD-AGE SUPPORT RATIO (POPULATION AGED 15-64 /POPULATION AGED 65 AND ABOVE)
Source http://indexmundi.com
FIGURE 71: POPULATION DISTRIBUTION 2015 AND 2025
Source: US Census Bureau
FIGURE 73: GROSS SAVINGS RATE (% OF GDP)
Source: IMF
PILLAR 0 (SOCIAL ASSISTANCE)The Department of Welfare (financed through general tax revenue) and Zakat Institutions (financed through religious contributions known as zakat) provide a noncontributory financial aid to maintain a minimum level of protection for poor citizens, including the elderly, but at a low subsistence level. The social assistance is provided on a means-tested basis.
PILLAR 2 (MANDATORY OCCUPATIONAL SCHEME)For private sector employeesMost Malaysians (except for civil servants) predominantly rely on Employees’ Provident Fund of Malaysia (EPFM) savings for their retirements. This is a compulsory savings retirement plan for private sector workers and some public sector employees who have opted out of the civil service pension scheme. It is a defined contribution scheme, whereby the contributions are saved and accumulated into two accounts. Account 1 comprises 70% of members’ savings, which can only be withdrawn when reaching the retirement age of 55. Account 2 allows for preretirement withdrawals such as for housing, education, medical, performing Hajj, or when the accumulated EPFM savings exceeds MYR 1 million (USD 223,00050) in both accounts. It also allows full withdrawal upon reaching the age of 50. In addition, full withdrawal of both accounts can be made under certain conditions, such as emigration, death, and incapacitation.
EPFM guarantees a dividend return of 2.5% annually; although historical declared returns have been around 5.5% per annum (p.a.) on average for the last 20 years. For employees below age 60, the current level of employers’ contributions are 12% or 13% of the monthly salary, while the employees’ contributions are 8% of the monthly salary. Historically, employees’ contributions have been as high as 11% of the monthly salary. The EPFM savings can be withdrawn as a lump sum at the age of 55, although individuals can also opt for (uncontrolled) income drawdown. The benefits under the EPFM are purely earnings-related and there is no redistributive element present within the EPFM scheme.
50 Based on the exchange rate at 31 December 2016 of USD 1 = MYR 4 .49 .
Mill
ions
Grow
th
20142013
20122011
20102021
20202019
20182017
20162015
Total Population Growth
0
5
10
15
20
25
30
35
40
0.0%
0.5%
1.0%
1.5%
2.0%
2.5%
3.0%
1970 1980 1990 2000 2010 2015
15.9 16.1 16.415.6
13.6
11.7
0
2
4
6
8
10
12
14
16
18
Age
Gro
up
2015 2025Persons (’000)
100+
90-94
80-84
70-74
60-64
50-54
40-44
30-34
20-24
10-14
0-4
1,000 2,000 3,000 4,00002,000 1,0004,000 3,0002004
20032002
2001
20002011
20122013
20142010
20092008
20072006
20050%
5%
10%
15%
20%
25%
30%
35%
40%
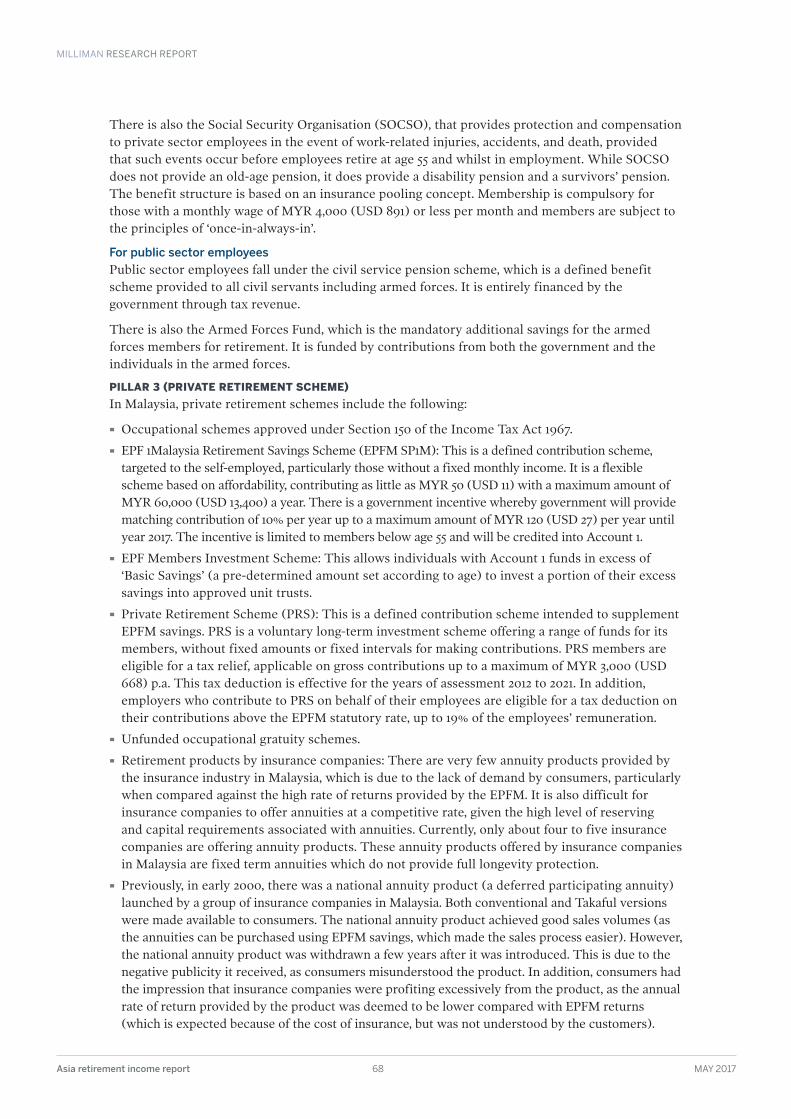
MILLIMAN RESEARCH REPORT
Asia retirement income report 68 MAY 2017
There is also the Social Security Organisation (SOCSO), that provides protection and compensation to private sector employees in the event of work-related injuries, accidents, and death, provided that such events occur before employees retire at age 55 and whilst in employment. While SOCSO does not provide an old-age pension, it does provide a disability pension and a survivors’ pension. The benefit structure is based on an insurance pooling concept. Membership is compulsory for those with a monthly wage of MYR 4,000 (USD 891) or less per month and members are subject to the principles of ‘once-in-always-in’.
For public sector employeesPublic sector employees fall under the civil service pension scheme, which is a defined benefit scheme provided to all civil servants including armed forces. It is entirely financed by the government through tax revenue.
There is also the Armed Forces Fund, which is the mandatory additional savings for the armed forces members for retirement. It is funded by contributions from both the government and the individuals in the armed forces.
PILLAR 3 (PRIVATE RETIREMENT SCHEME)In Malaysia, private retirement schemes include the following:
· Occupational schemes approved under Section 150 of the Income Tax Act 1967.
· EPF 1Malaysia Retirement Savings Scheme (EPFM SP1M): This is a defined contribution scheme, targeted to the self-employed, particularly those without a fixed monthly income. It is a flexible scheme based on affordability, contributing as little as MYR 50 (USD 11) with a maximum amount of MYR 60,000 (USD 13,400) a year. There is a government incentive whereby government will provide matching contribution of 10% per year up to a maximum amount of MYR 120 (USD 27) per year until year 2017. The incentive is limited to members below age 55 and will be credited into Account 1.
· EPF Members Investment Scheme: This allows individuals with Account 1 funds in excess of ‘Basic Savings’ (a pre-determined amount set according to age) to invest a portion of their excess savings into approved unit trusts.
· Private Retirement Scheme (PRS): This is a defined contribution scheme intended to supplement EPFM savings. PRS is a voluntary long-term investment scheme offering a range of funds for its members, without fixed amounts or fixed intervals for making contributions. PRS members are eligible for a tax relief, applicable on gross contributions up to a maximum of MYR 3,000 (USD 668) p.a. This tax deduction is effective for the years of assessment 2012 to 2021. In addition, employers who contribute to PRS on behalf of their employees are eligible for a tax deduction on their contributions above the EPFM statutory rate, up to 19% of the employees’ remuneration.
· Unfunded occupational gratuity schemes.
· Retirement products by insurance companies: There are very few annuity products provided by the insurance industry in Malaysia, which is due to the lack of demand by consumers, particularly when compared against the high rate of returns provided by the EPFM. It is also difficult for insurance companies to offer annuities at a competitive rate, given the high level of reserving and capital requirements associated with annuities. Currently, only about four to five insurance companies are offering annuity products. These annuity products offered by insurance companies in Malaysia are fixed term annuities which do not provide full longevity protection.
· Previously, in early 2000, there was a national annuity product (a deferred participating annuity) launched by a group of insurance companies in Malaysia. Both conventional and Takaful versions were made available to consumers. The national annuity product achieved good sales volumes (as the annuities can be purchased using EPFM savings, which made the sales process easier). However, the national annuity product was withdrawn a few years after it was introduced. This is due to the negative publicity it received, as consumers misunderstood the product. In addition, consumers had the impression that insurance companies were profiting excessively from the product, as the annual rate of return provided by the product was deemed to be lower compared with EPFM returns (which is expected because of the cost of insurance, but was not understood by the customers).
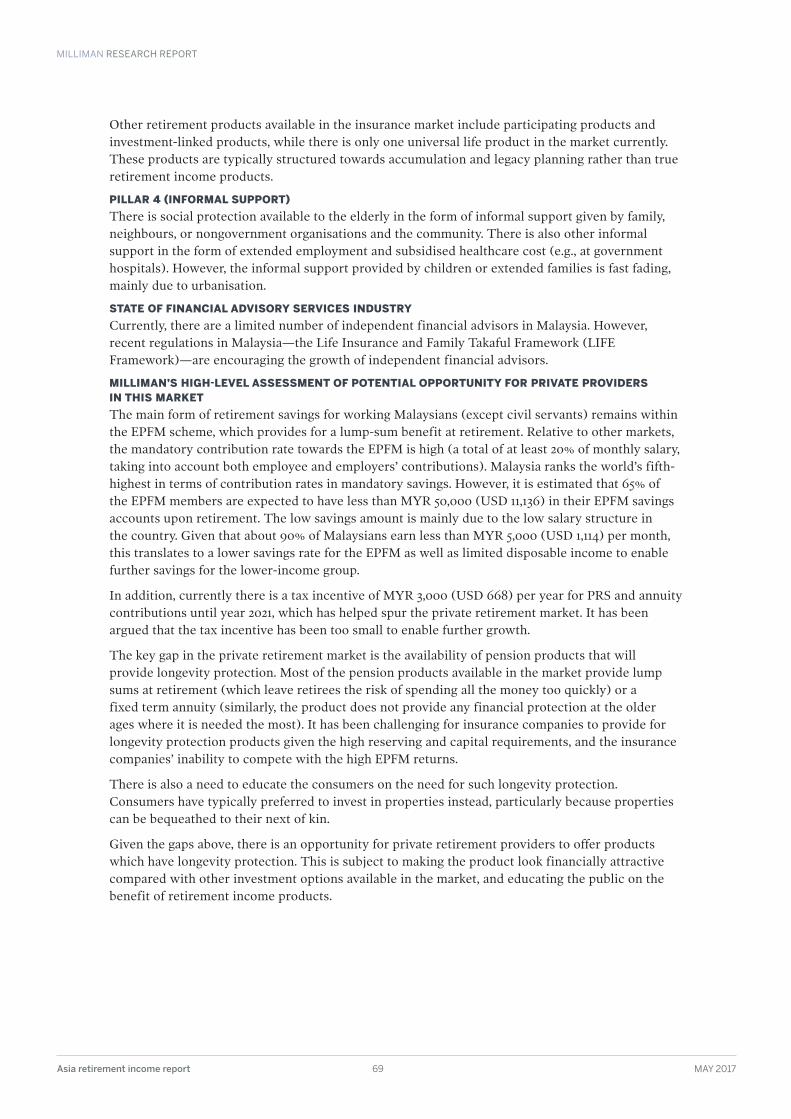
MILLIMAN RESEARCH REPORT
Asia retirement income report 69 MAY 2017
Other retirement products available in the insurance market include participating products and investment-linked products, while there is only one universal life product in the market currently. These products are typically structured towards accumulation and legacy planning rather than true retirement income products.
PILLAR 4 (INFORMAL SUPPORT)There is social protection available to the elderly in the form of informal support given by family, neighbours, or nongovernment organisations and the community. There is also other informal support in the form of extended employment and subsidised healthcare cost (e.g., at government hospitals). However, the informal support provided by children or extended families is fast fading, mainly due to urbanisation.
STATE OF FINANCIAL ADVISORY SERVICES INDUSTRYCurrently, there are a limited number of independent financial advisors in Malaysia. However, recent regulations in Malaysia—the Life Insurance and Family Takaful Framework (LIFE Framework)—are encouraging the growth of independent financial advisors.
MILLIMAN’S HIGH-LEVEL ASSESSMENT OF POTENTIAL OPPORTUNITY FOR PRIVATE PROVIDERS IN THIS MARKETThe main form of retirement savings for working Malaysians (except civil servants) remains within the EPFM scheme, which provides for a lump-sum benefit at retirement. Relative to other markets, the mandatory contribution rate towards the EPFM is high (a total of at least 20% of monthly salary, taking into account both employee and employers’ contributions). Malaysia ranks the world’s fifth-highest in terms of contribution rates in mandatory savings. However, it is estimated that 65% of the EPFM members are expected to have less than MYR 50,000 (USD 11,136) in their EPFM savings accounts upon retirement. The low savings amount is mainly due to the low salary structure in the country. Given that about 90% of Malaysians earn less than MYR 5,000 (USD 1,114) per month, this translates to a lower savings rate for the EPFM as well as limited disposable income to enable further savings for the lower-income group.
In addition, currently there is a tax incentive of MYR 3,000 (USD 668) per year for PRS and annuity contributions until year 2021, which has helped spur the private retirement market. It has been argued that the tax incentive has been too small to enable further growth.
The key gap in the private retirement market is the availability of pension products that will provide longevity protection. Most of the pension products available in the market provide lump sums at retirement (which leave retirees the risk of spending all the money too quickly) or a fixed term annuity (similarly, the product does not provide any financial protection at the older ages where it is needed the most). It has been challenging for insurance companies to provide for longevity protection products given the high reserving and capital requirements, and the insurance companies’ inability to compete with the high EPFM returns.
There is also a need to educate the consumers on the need for such longevity protection. Consumers have typically preferred to invest in properties instead, particularly because properties can be bequeathed to their next of kin.
Given the gaps above, there is an opportunity for private retirement providers to offer products which have longevity protection. This is subject to making the product look financially attractive compared with other investment options available in the market, and educating the public on the benefit of retirement income products.
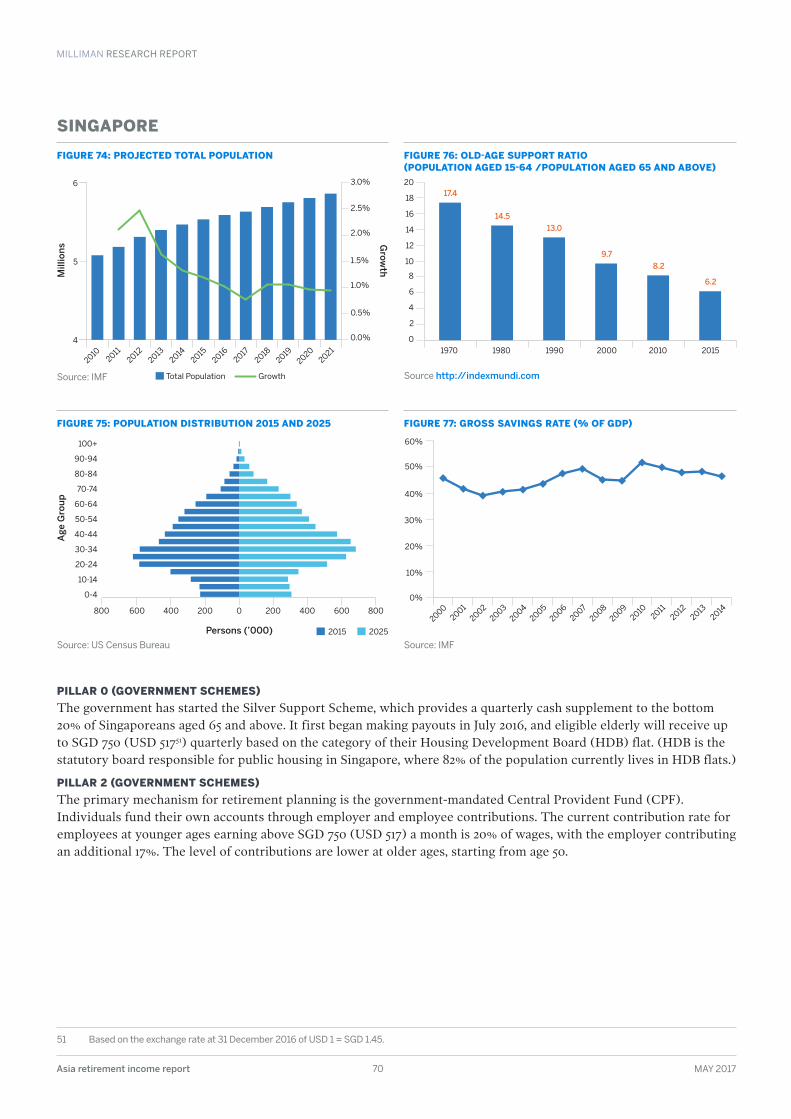
MILLIMAN RESEARCH REPORT
Asia retirement income report 70 MAY 2017
SINGAPORE
FIGURE 74: PROJECTED TOTAL POPULATION
Source: IMF
FIGURE 76: OLD-AGE SUPPORT RATIO (POPULATION AGED 15-64 /POPULATION AGED 65 AND ABOVE)
Source http://indexmundi.com
FIGURE 75: POPULATION DISTRIBUTION 2015 AND 2025
Source: US Census Bureau
FIGURE 77: GROSS SAVINGS RATE (% OF GDP)
Source: IMF
PILLAR 0 (GOVERNMENT SCHEMES)The government has started the Silver Support Scheme, which provides a quarterly cash supplement to the bottom 20% of Singaporeans aged 65 and above. It first began making payouts in July 2016, and eligible elderly will receive up to SGD 750 (USD 51751) quarterly based on the category of their Housing Development Board (HDB) flat. (HDB is the statutory board responsible for public housing in Singapore, where 82% of the population currently lives in HDB flats.)
PILLAR 2 (GOVERNMENT SCHEMES)The primary mechanism for retirement planning is the government-mandated Central Provident Fund (CPF). Individuals fund their own accounts through employer and employee contributions. The current contribution rate for employees at younger ages earning above SGD 750 (USD 517) a month is 20% of wages, with the employer contributing an additional 17%. The level of contributions are lower at older ages, starting from age 50.
51 Based on the exchange rate at 31 December 2016 of USD 1 = SGD 1 .45 .
Mill
ions
Grow
th
20142013
20122011
20102021
20202019
20182017
20162015
Total Population Growth
4
5
6
0.0%
0.5%
1.0%
1.5%
2.0%
2.5%
3.0%
1970 1980 1990 2000 2010 2015
17.4
14.5
13.0
9.7
8.2
6.2
0
2
4
6
8
10
12
14
16
18
20
Age
Gro
up
2015 2025Persons (’000)
100+
90-94
80-84
70-74
60-64
50-54
40-44
30-34
20-24
10-14
0-4
200 400 600 8000400 200800 6002004
20032002
2001
20002011
20122013
20142010
20092008
20072006
20050%
10%
20%
30%
40%
50%
60%
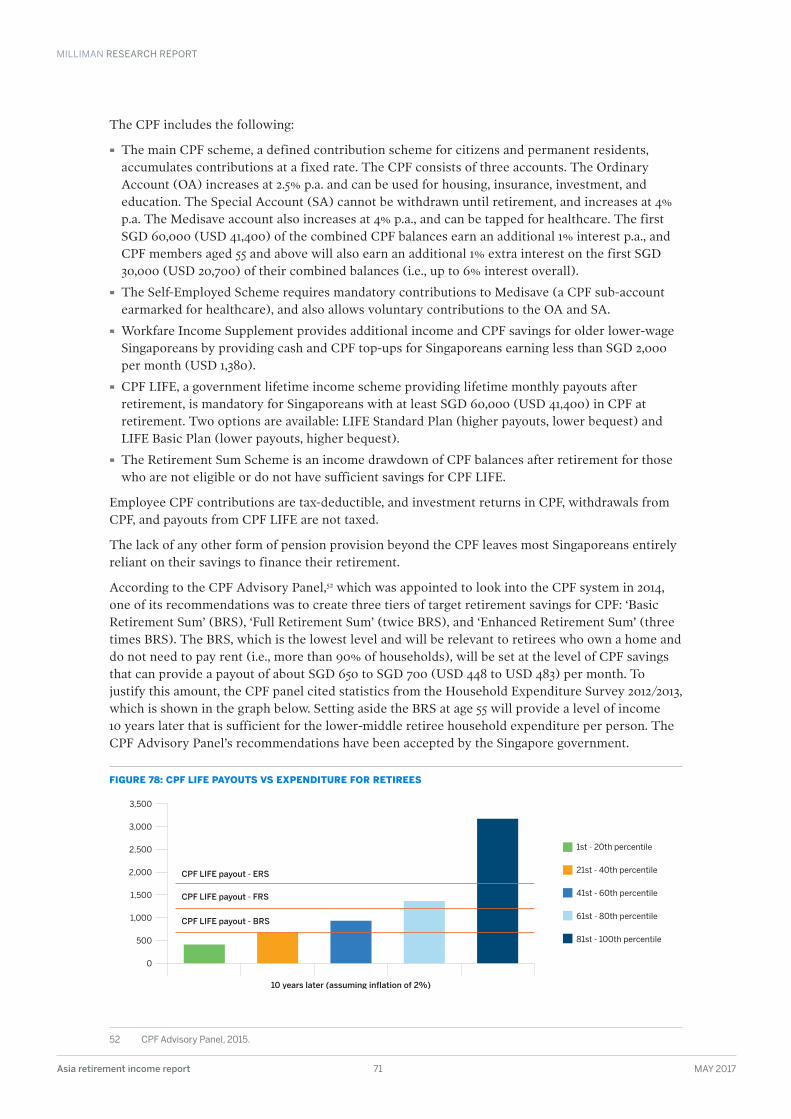
MILLIMAN RESEARCH REPORT
Asia retirement income report 71 MAY 2017
The CPF includes the following:
· The main CPF scheme, a defined contribution scheme for citizens and permanent residents, accumulates contributions at a fixed rate. The CPF consists of three accounts. The Ordinary Account (OA) increases at 2.5% p.a. and can be used for housing, insurance, investment, and education. The Special Account (SA) cannot be withdrawn until retirement, and increases at 4% p.a. The Medisave account also increases at 4% p.a., and can be tapped for healthcare. The first SGD 60,000 (USD 41,400) of the combined CPF balances earn an additional 1% interest p.a., and CPF members aged 55 and above will also earn an additional 1% extra interest on the first SGD 30,000 (USD 20,700) of their combined balances (i.e., up to 6% interest overall).
· The Self-Employed Scheme requires mandatory contributions to Medisave (a CPF sub-account earmarked for healthcare), and also allows voluntary contributions to the OA and SA.
· Workfare Income Supplement provides additional income and CPF savings for older lower-wage Singaporeans by providing cash and CPF top-ups for Singaporeans earning less than SGD 2,000 per month (USD 1,380).
· CPF LIFE, a government lifetime income scheme providing lifetime monthly payouts after retirement, is mandatory for Singaporeans with at least SGD 60,000 (USD 41,400) in CPF at retirement. Two options are available: LIFE Standard Plan (higher payouts, lower bequest) and LIFE Basic Plan (lower payouts, higher bequest).
· The Retirement Sum Scheme is an income drawdown of CPF balances after retirement for those who are not eligible or do not have sufficient savings for CPF LIFE.
Employee CPF contributions are tax-deductible, and investment returns in CPF, withdrawals from CPF, and payouts from CPF LIFE are not taxed.
The lack of any other form of pension provision beyond the CPF leaves most Singaporeans entirely reliant on their savings to finance their retirement.
According to the CPF Advisory Panel,52 which was appointed to look into the CPF system in 2014, one of its recommendations was to create three tiers of target retirement savings for CPF: ‘Basic Retirement Sum’ (BRS), ‘Full Retirement Sum’ (twice BRS), and ‘Enhanced Retirement Sum’ (three times BRS). The BRS, which is the lowest level and will be relevant to retirees who own a home and do not need to pay rent (i.e., more than 90% of households), will be set at the level of CPF savings that can provide a payout of about SGD 650 to SGD 700 (USD 448 to USD 483) per month. To justify this amount, the CPF panel cited statistics from the Household Expenditure Survey 2012/2013, which is shown in the graph below. Setting aside the BRS at age 55 will provide a level of income 10 years later that is sufficient for the lower-middle retiree household expenditure per person. The CPF Advisory Panel’s recommendations have been accepted by the Singapore government.
FIGURE 78: CPF LIFE PAYOUTS VS EXPENDITURE FOR RETIREES
52 CPF Advisory Panel, 2015 .
0
500
1,000
1,500
2,000
2,500
3,000
3,500
CPF LIFE payout - ERS
CPF LIFE payout - FRS
CPF LIFE payout - BRS
10 years later (assuming inflation of 2%)
1st - 20th percentile
21st - 40th percentile
41st - 60th percentile
61st - 80th percentile
81st - 100th percentile
MILLIMAN RESEARCH REPORT
Asia retirement income report 72 MAY 2017
PILLAR 2 (EMPLOYER SCHEMES)The market for employer-sponsored retirement savings schemes in Singapore is very small. In 2015, there were only 23 such schemes approved by the tax authority.
PILLAR 3 (PRIVATE MARKET SCHEMES)The Supplementary Retirement Scheme (SRS) is a voluntary savings scheme that works as a complement to CPF savings, where individuals can place their money in tax-deferred accounts which can then be directed into investments. SRS contributions are tax-deductible, investment returns are accumulated tax-free, and only 50% of the withdrawals from SRS (which can be spread over up to 10 years) are taxable after retirement. However, there is a penalty on withdrawals before retirement age. SRS funds can be invested in a wide range of financial assets, including shares, bonds, unit trusts, fixed deposits, and some types of insurance.
The Lease Buyback Scheme was launched by the government in March 2009 as an additional monetisation option for elderly households living in four-room or smaller HDB flats. Eligible elderly households can receive an additional bonus of up to SGD 20,000 (USD 13,800) if they sell the tail-end of the lease of their HDB flat back to HDB, while retaining up to 30 years of the current lease (new HDB flats generally come with 99-year leases). This allows the lower-income elderly to obtain an increased monthly stream of income through CPF LIFE (because proceeds from the sale are used to top up CPF) while continuing to live in their homes during retirement.
Historically, the market has seen solutions such as annuities, variable annuities, reverse mortgages, participating products, unit trusts, and universal life. Only participating products, unit trusts, and universal life are still being sold in the market in any significant volume, but they are not true retirement ‘income’ products, leaning more towards accumulation and legacy planning.
Participating products make up a significant proportion of life insurance sales in Singapore. Prior to 2008, unit-linked business was the dominant product, having steadily increased in its share of new business in the preceding years. However, the global financial crisis in 2008 has led to a gradual shift away from unit-linked to participating business as customers looked for more protection against market volatility.
Some participating products are sold and marketed with a longevity/retirement proposition, such as providing lifetime regular payouts. The majority of such products are mostly focused more on the accumulation rather than the decumulation phase. A few of these products allow the option of converting the accumulated fund into an annuity or fixed drawdown upon an agreed ‘retirement age’.
Unit trusts can be invested in directly, and also through the tax-advantaged SRS scheme. A third option is through the Central Provident Fund Investment Scheme (CPFIS), which provides individuals the option to invest part of their CPF funds in the OA into other instruments (including unit trusts) in lieu of keeping them in the OA earning the fixed 2.5% interest rate.
Universal life products are generally marketed to high net worth individuals. The product features tend to be rather similar across the various insurers. They are generally offered as a single premium policy and denominated in USD, while some insurers also offer a no-lapse guarantee. Universal life policies are generally marketed as legacy planning tools, although the guaranteed minimum crediting rate can also allow individuals to grow the policy value over time.
Despite the strong growth of universal life in Singapore, many players have not jumped into launching such products, with some players put off by factors such as high commissions, a need for more sophisticated systems or investment capabilities, or more volatile profitability under a market-consistent reporting framework. For example, Prudential UK, having sold universal life in Singapore for several years, discontinued sales of its universal life products in 2015.
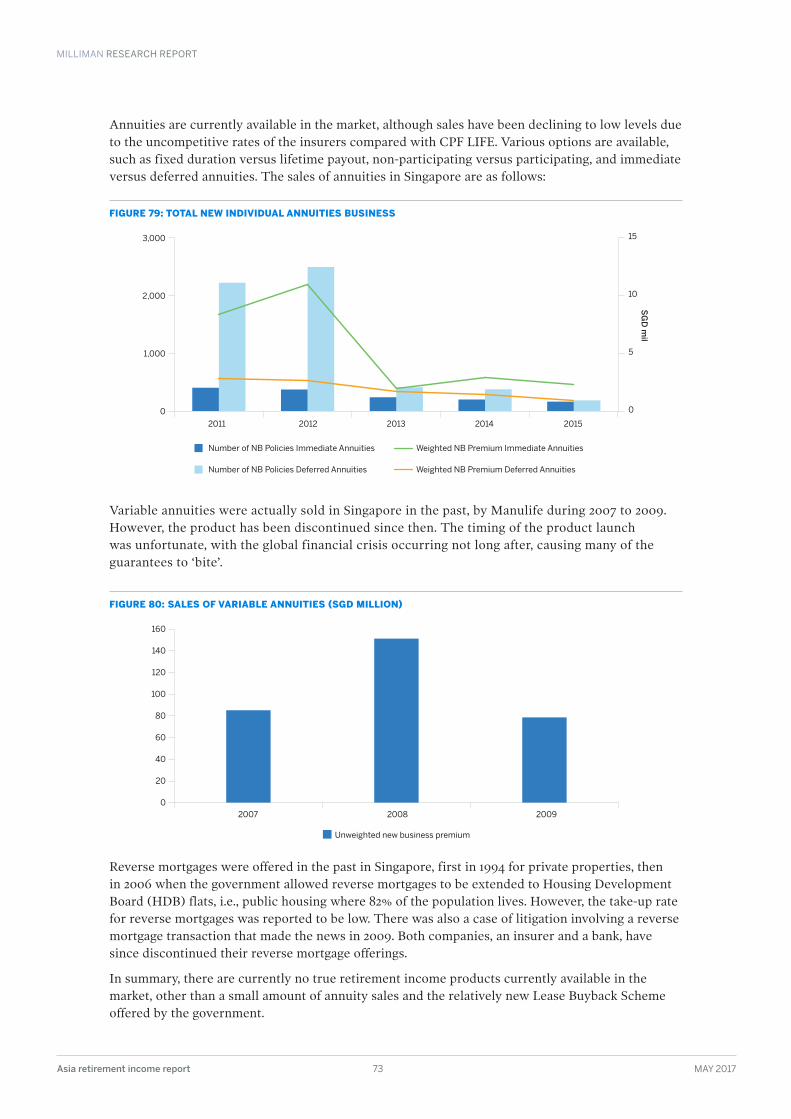
MILLIMAN RESEARCH REPORT
Asia retirement income report 73 MAY 2017
Annuities are currently available in the market, although sales have been declining to low levels due to the uncompetitive rates of the insurers compared with CPF LIFE. Various options are available, such as fixed duration versus lifetime payout, non-participating versus participating, and immediate versus deferred annuities. The sales of annuities in Singapore are as follows:
FIGURE 79: TOTAL NEW INDIVIDUAL ANNUITIES BUSINESS
Variable annuities were actually sold in Singapore in the past, by Manulife during 2007 to 2009. However, the product has been discontinued since then. The timing of the product launch was unfortunate, with the global financial crisis occurring not long after, causing many of the guarantees to ‘bite’.
FIGURE 80: SALES OF VARIABLE ANNUITIES (SGD MILLION)
Reverse mortgages were offered in the past in Singapore, first in 1994 for private properties, then in 2006 when the government allowed reverse mortgages to be extended to Housing Development Board (HDB) flats, i.e., public housing where 82% of the population lives. However, the take-up rate for reverse mortgages was reported to be low. There was also a case of litigation involving a reverse mortgage transaction that made the news in 2009. Both companies, an insurer and a bank, have since discontinued their reverse mortgage offerings.
In summary, there are currently no true retirement income products currently available in the market, other than a small amount of annuity sales and the relatively new Lease Buyback Scheme offered by the government.
Number of NB Policies Immediate Annuities
Number of NB Policies Deferred Annuities
Weighted NB Premium Immediate Annuities
Weighted NB Premium Deferred Annuities
2011 2012 2013 2014 2015
SG
D m
il
0
1,000
2,000
3,000
0
5
10
15
0
20
40
60
80
100
120
140
160
Unweighted new business premium
2007 2008 2009

MILLIMAN RESEARCH REPORT
Asia retirement income report 74 MAY 2017
PILLAR 4 (INFORMAL SUPPORT)There is generally informal support provided by children or extended families, e.g., children giving their parents a monthly allowance. There is also social protection available to the elderly through nongovernment organisations and the community.
The government has implemented a number of policies that cover a large proportion of healthcare costs for the elderly. HDB schemes and tax reliefs also include incentives for families to stay near each other or in the same home, to encourage informal support.
STATE OF FINANCIAL ADVISORY SERVICES INDUSTRYIn Singapore, the main distribution channels for life insurance are tied representatives (employed by the insurance company), bank representatives (employed by the bank to distribute insurance products), and financial advisor representatives (offering insurance products from a number of insurance companies), with 40%, 37%, and 19% of weighted premium, respectively, in 2015.
The regulator has given legislative effect in 2014 to a number of proposals that were set out in their Financial Advisory Industry Review consultation paper. Some of the main changes are:
· Life insurance products will be able to be purchased directly from insurers without commissions
· A web aggregator for consumers to compare the premiums and features of life insurance products
· A balanced scorecard framework for the remunerations of financial advisors and their supervisors
Direct purchase insurance has only seen lukewarm reception from the market so far. It remains to be seen whether there will be any further impact on the financial advisory services industry.
MILLIMAN’S HIGH-LEVEL ASSESSMENT OF POTENTIAL OPPORTUNITY FOR PRIVATE PROVIDERS IN THIS MARKETWith the existence of the CPF, it is not easy for private providers to sell to mass market consumers, given the difficulty of competing with CPF rates. Tax incentives are available through the SRS, but annual contributions are limited, and the type of products that can be purchased using SRS funds are restricted by the government.
Given the above points as well as the sizable population of high net worth individuals in Singapore, most retirement products by private providers tend to target this segment. The main example is universal life, which has been sold by a number of insurers in recent years, mostly through banks.
We expect more innovative products to be developed that also target the high net worth population and are distributed through banks. Examples of possible products are unitised with-profits (UWP)53 and variable universal life (VUL). There may also be a revival of variable annuities and reverse mortgages in the future.
53 For an in-depth analysis on UWP and an example of its application in Singapore, please refer to our research report “Participating business in Asia” at http://www.milliman.com/uploadedFiles/insight/2014/par-business-asia.pdf .
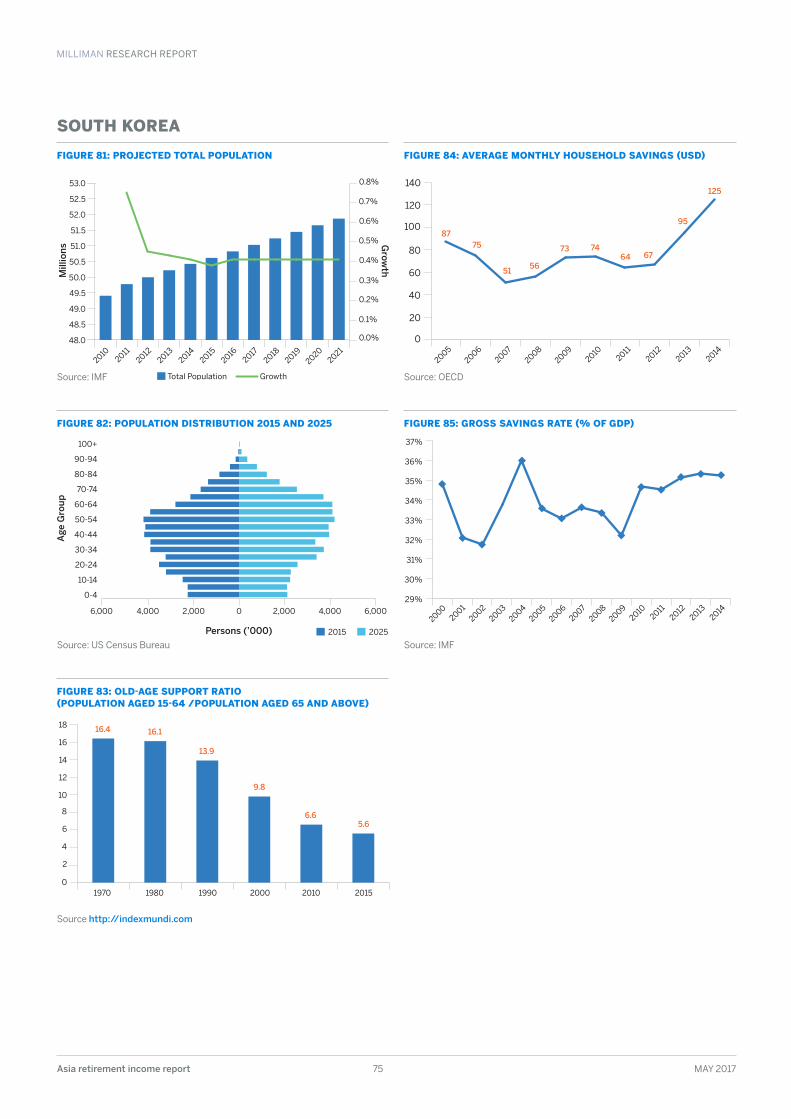
MILLIMAN RESEARCH REPORT
Asia retirement income report 75 MAY 2017
SOUTH KOREA
FIGURE 81: PROJECTED TOTAL POPULATION
Source: IMF
FIGURE 84: AVERAGE MONTHLY HOUSEHOLD SAVINGS (USD)
Source: OECD
FIGURE 82: POPULATION DISTRIBUTION 2015 AND 2025
Source: US Census Bureau
FIGURE 85: GROSS SAVINGS RATE (% OF GDP)
Source: IMF
FIGURE 83: OLD-AGE SUPPORT RATIO (POPULATION AGED 15-64 /POPULATION AGED 65 AND ABOVE)
Source http://indexmundi.com
Mill
ions
Grow
th
20142013
20122011
20102021
20202019
20182017
20162015
Total Population Growth
48.0
48.5
49.0
49.5
50.0
50.5
51.0
51.5
52.0
52.5
53.0
0.0%
0.1%
0.2%
0.3%
0.4%
0.5%
0.6%
0.7%
0.8%
20112012
20132014
20102009
20082007
20062005
0
20
40
60
80
100
120
140
8775
5156
73 7464 67
95
125
Age
Gro
up
2015 2025Persons (’000)
100+
90-94
80-84
70-74
60-64
50-54
40-44
30-34
20-24
10-14
0-4
2,000 4,000 6,00002,0004,0006,0002004
20032002
2001
20002011
20122013
20142010
20092008
20072006
200529%
30%
31%
32%
33%
34%
35%
36%
37%
1970 1980 1990 2000 2010 2015
16.4 16.1
13.9
9.8
6.65.6
0
2
4
6
8
10
12
14
16
18
MILLIMAN RESEARCH REPORT
Asia retirement income report 76 MAY 2017
PILLAR 1 (PUBLIC PENSION SCHEMES)The public pension programs in South Korea can be split into two categories: the National Pension Scheme for the general public and the Special Occupational Pension Scheme for specified occupations. Each of these categories is described further below:
National Pension Scheme
· Established in 1988 by the National Pension Act, the National Pension Scheme is managed by the National Pension Service of Korea and is currently the world’s third-largest pension fund.
· Originally, the scheme was limited to workplaces with 10 or more full-time employees. It has since extended to workplaces with fewer than 10 full-time employees, farmers and fishermen in rural areas, and workplace-based foreigners, as well as self-employed workers who reside in urban and rural areas.
· The general criteria for coverage under the scheme are age and residence. Regardless of their incomes, all South Korean residents in Korea aged between 18 and 59 are covered under the scheme and, similarly, all foreign nationals residing in South Korea whose ages are between 18 and 59 are also covered, apart from some exceptional cases. Those who are covered under the other public pension schemes outlined below are excluded from the National Pension Scheme.
· The contribution for a workplace-based insured person is shared equally by the employer and the employee (the insured person), at a contribution of 4.5% each, while the contribution for an individually insured person is all paid by the insured person at a contribution rate of 9%. Temporary financial support is also currently provided to farmers and fishermen.
· The scheme provides a number of the benefits to cover a wide range of social risks, including old age, disability, and death. The old-age pension, which is the major benefit of the scheme, is designed to provide the insured person with guaranteed old-age income when the person retires and the pension amount is derived by a combination of earnings-related and redistributive components (i.e., a defined benefit scheme). At present, insured persons who have been covered by the scheme for more than 10 years will receive the old-age pension upon attaining age 61. This minimum pensionable age is set to increase gradually to age 65 by 2033 and the pension benefit is adjusted annually based on the national consumer price inflation.
· Other benefits provided by the scheme include a disability pension to provide regular income to a person having a physical or mental illness during the insured period, a survivor pension for the dependents of a deceased insured person, lump-sum death benefits for deceased insured persons without eligible survivors to receive a survivor pension, and a lump-sum refund for a person who can no longer be covered under the scheme.
· The scheme’s generous old-age pension (which strongly favours early contributors coupled with low initial contribution rates) and the fast ageing population have forced the government to progressively increase the contribution rates and pensionable age at various stages in an attempt to restore the financial sustainability of the scheme.
Special Occupational Pension Scheme
· This comprises the Government Employees Pension Scheme (GEPS), the Military Personnel Pension Scheme, the Private School Personnel Pension Scheme, and the Special Post Office Pension Scheme. The GEPS is the oldest public pension scheme in Korea and was introduced in 1960, while the other pension schemes were introduced in 1963, 1975, and 1982, respectively.
· These schemes have generally been very generous in their benefits as they served as a means to compensate for the relatively lower earnings of public sector workers and for the lack of a retirement allowance scheme comparable with private sector workers. Given this and the drastic economic, social, and demographic changes that resulted in an ageing population and increasing life expectancy, these schemes have become unsustainable in recent years and various reforms, such as benefit reduction and increases in contribution rates and minimum pensionable age, had to be made in order to restore the financial health of the schemes.
· Nonetheless, it is expected that more drastic cost-cutting measures will be needed in the future for the long-term sustainability of the schemes.

MILLIMAN RESEARCH REPORT
Asia retirement income report 77 MAY 2017
PILLAR 2 (EMPLOYER SCHEMES)Retirement Allowance Scheme
· This scheme was introduced based on Article 28 of the Labour Standards Act enacted in 1953. It now applies to all employers and is used to supplement the National Pension Scheme.
· Under the scheme, all employees with more than one year of continuous service are entitled to receive a lump-sum payment of retirement allowance (also known as the mandatory severance pay) upon termination of their service with the employer, regardless of the reason for termination of employment. Therefore, both voluntary resignation as well as dismissal is entitled to the allowance.
· The lump-sum payment has been set to be the final monthly salary multiplied by the total years of service, and it was often used by laid-off workers to fund living expenses during their job search periods, at least until the introduction of the unemployment insurance scheme in 1995.
Corporate Pension Scheme
· Effective from 1 December 2005, the South Korean government has allowed employers, with agreement from employees, to convert their retirement allowance schemes into more typical corporate pension schemes, as the country’s demographic conditions began to change and a wave of retirement began to loom.
· Both defined benefit (DB) and defined contribution (DC) plans are allowed under the scheme, and employers and employees are free to choose their desirable plans. DB plans must provide a minimum benefit equivalent to one month of final salary for each year of service and they must be managed under a separate trust, while for DC plans, employers must make a minimum contribution of 1/12 of employees’ annual salaries.
· For smaller-sized workplaces, employers are also allowed to offer individual retirement accounts (IRAs) instead of occupational pension schemes. An IRA is contracted and regulated in a similar way to DC plans, with the main difference being that it is detached from any specific employer’s retirement plan.
PILLAR 3 (VOLUNTARY SCHEMES)Personal Pension Scheme
· Financial institutions have been selling various kinds of voluntary personal pension plans in the South Korean market since 1994. The personal pension market grew rapidly in the earlier years because of the large tax incentives provided to the contributors.
· The after-tax rates of return on these plans were often very high compared with any other investments with similar risk characteristics, even if investors terminate their plans after a few years of contributions.
· As a result, many investors chose to terminate their plans prematurely, as they regard these plans as a profitable investment instrument rather than as a means to secure an income during retirement. Furthermore, most personal pension plans pay out a lump-sum benefit upon retirement and hence they do not function as a postretirement regular income.
· Today, the subscription rate for personal pension plans remains very low despite the rapidly ageing population and increasing costs of living.
Other private retirement productsThere is strong demand for traditional annuity and savings insurance products that is due to tax incentives and a rapidly ageing population. Because variable annuities were introduced in 2002, there has been significant growth in their sales as a form of saving for retirement.
MILLIMAN RESEARCH REPORT
Asia retirement income report 78 MAY 2017
STATE OF FINANCIAL ADVISORY SERVICES INDUSTRYIn the South Korean market, financial products including insurance and investment-related products are mainly distributed through the Associate Financial Planner Korea (AFPK) and Certified Financial Planner (CFP), which are regulated by the Financial Planning Standards Board. The number of AFPKs and CFPs has grown steadily over the years to serve the increasing needs of the population in their pre- and post-retirement planning.
The Financial Services Commission (FSC) has also announced its plan to boost the independent financial advisory industry in the local market, by allowing financial professionals to start their own investment advisory firms completely independent from their former employers. This will not only help individual investors to secure more customised advice from advisors but also minimise potential conflicts of interest between advisors and their clients.
MILLIMAN’S HIGH-LEVEL ASSESSMENT OF POTENTIAL OPPORTUNITY FOR PRIVATE PROVIDERS IN THIS MARKETThe structural weakness and financial vulnerability of the public pension schemes have resulted in the implementation of various reform measures in the past and more reforms expected going forward. They potentially include further increment to the contribution rates and/or minimum pensionable age and reduction in pension benefits.
The level of retirement benefit provided by the government and employers is also often considered to be inadequate in the light of increasing costs of living and declining support within families during old age. Hence, promoting the private pension market is critical to ensure that the ageing population has sufficient provision in place for retirement and to avoid any economic and social burdens in the future.
Although personal pension plans are already currently being sold in the market, take-up rate remains very low and they have often been misused as short-term investment instruments instead of long-term retirement savings. Furthermore, most of the plans offer lump-sum benefits which expose the retirees to longevity and investment risks. Therefore, there are significant opportunities for insurance companies to innovate in the retirement space in order to develop products that better meet the retirement needs of the fast ageing South Korean population.
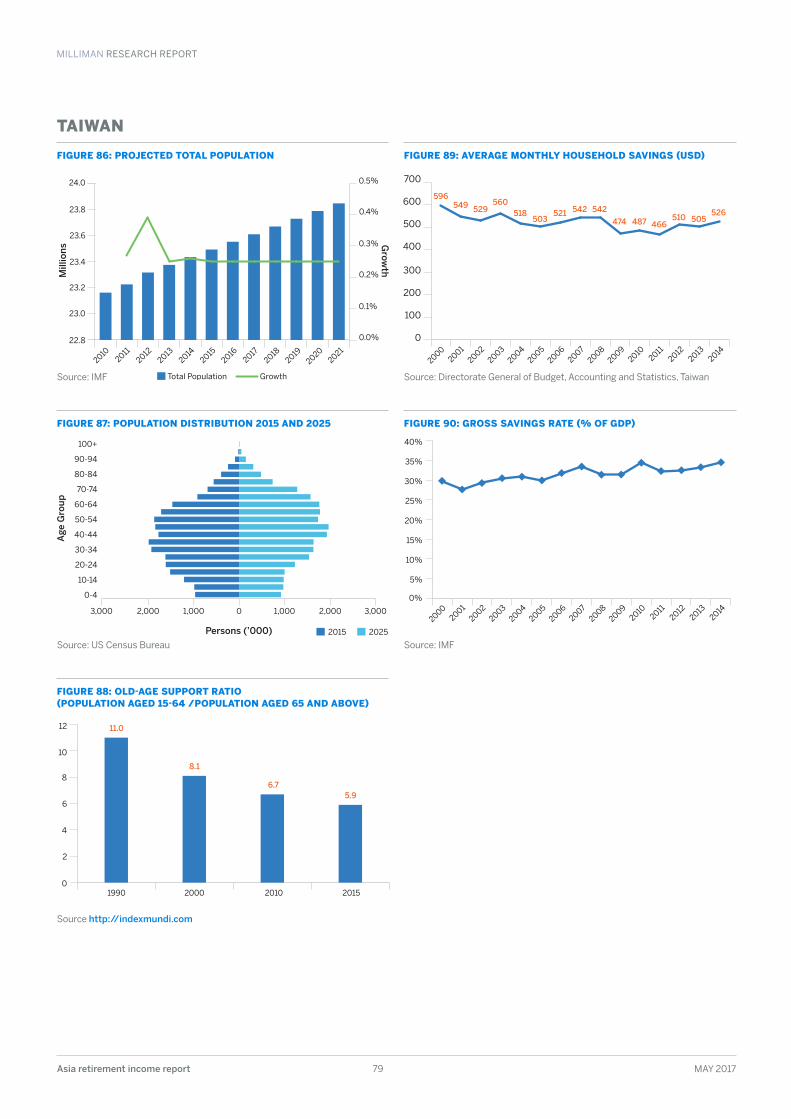
MILLIMAN RESEARCH REPORT
Asia retirement income report 79 MAY 2017
TAIWAN
FIGURE 86: PROJECTED TOTAL POPULATION
Source: IMF
FIGURE 89: AVERAGE MONTHLY HOUSEHOLD SAVINGS (USD)
Source: Directorate General of Budget, Accounting and Statistics, Taiwan
FIGURE 87: POPULATION DISTRIBUTION 2015 AND 2025
Source: US Census Bureau
FIGURE 90: GROSS SAVINGS RATE (% OF GDP)
Source: IMF
FIGURE 88: OLD-AGE SUPPORT RATIO (POPULATION AGED 15-64 /POPULATION AGED 65 AND ABOVE)
Source http://indexmundi.com
Mill
ions
Grow
th
20142013
20122011
20102021
20202019
20182017
20162015
Total Population Growth
22.8
23.0
23.2
23.4
23.6
23.8
24.0
0.0%
0.1%
0.2%
0.3%
0.4%
0.5%
20042003
20022001
20002011
20122013
20142010
20092008
20072006
2005
596549
526529560
518503
521 542 542474 487 466
510 505
0
100
200
300
400
500
600
700
Age
Gro
up
2015 2025Persons (’000)
100+
90-94
80-84
70-74
60-64
50-54
40-44
30-34
20-24
10-14
0-4
1,000 2,000 3,00001,0002,0003,0002004
20032002
2001
20002011
20122013
20142010
20092008
20072006
20050%
5%
10%
15%
20%
25%
30%
35%
40%
1990 2000 2010 2015
11.0
8.1
6.75.9
0
2
4
6
8
10
12
MILLIMAN RESEARCH REPORT
Asia retirement income report 80 MAY 2017
PILLAR 0 (SOCIAL ASSISTANCE)The feature of this pillar is to cover the poorest cohort under a noncontributory social welfare system.
The government provides a financial aid through general tax revenue to cover a minimum level of protection for poor elders with monthly amount of TWD 3,000 or TWD 6,000 (USD 96 or USD 18554), based on the income level.
PILLAR 1 (MANDATORY SOCIAL INSURANCE AND SOCIAL BENEFIT)This pillar covers basic expenditures under various occupational social insurance schemes or social subsidy schemes. The insurance premium is paid by the government, employers, and the insured proportionally.
There are ‘Labor Insurance,’ ‘Military Insurance,’ and ‘Government Employee and Teacher Insurance’ for various occupational types. For citizens not covered in previous types, there is a compulsory scheme, the ‘National Annuity’. This insurance covers disabled benefit, pension, death benefit, preganancy benefit, and accident benefit, etc.
PILLAR 2 (MANDATORY OCCUPATIONAL PENSION SCHEME)This pillar provides the supplementary economic support under various occupational pension schemes. The pension fund is contributed by the government, employers, and the employees proportionally.
The available schemes are the ‘Labor Pension Scheme’, ‘Military, Government Employee, and Teacher Pension Scheme’, and ‘Private School Teacher and Employee Pension Scheme’ for various occupational types. The fund can be withdrawn if the employee applies to retire, given a legal age under various schemes.
Recently in Taiwan, because of the severe financial deficits existing in the funds under the social insurance (Pillar 1) scheme and pension scheme (Pillar 2), there has been ongoing reform discussions. The reform plan will cut the annuity payment, raise the contribution amount, and delay the retirement age, based on the solvency level of these various schemes. Combining all occupational schemes into one scheme is also a possible method which is under discussion. The end goal of the reform is to standardise the income replacement ratio across different occupations. For example, the combined income replacement ratio for millitary, governmental, and educational employees is around 80% to 90% under Pillars 1 and 2, which is extremely high across all occupations in Taiwan, and also in the world. Meanwhile, the income replacement ratio for private sector workers is only around 60% under Pillars 1 and 2. The target timeline of finalising the reform plan is in 2017. If the reform plan is implemented, the income replacement ratio will probably drop for all occupations, with the resulting ratio possibly dropping to around 50% or even lower.
PILLAR 3 (PERSONAL SAVINGS)This pillar makes up for the gap between personal retirement needs and the coverage provided by Pillar 1 and Pillar 2. Personal savings are supported by the private sector, such as banks, insurance companies, investment funds, or other institutions.
Major investment asset classes in Taiwan include bonds, stocks, mutual funds, deposits, annuity insurance, life insurance with return of premium, unit-linked insurance, variable annuity, variable life, variable universal life, retirement security trust, and real estate. Reverse mortgages are also available.
PILLAR 4 (INFORMAL SUPPORT)There is social protection available to the elderly in the form of informal support given by family, neighbours, or nongovernment organisations and the community.
STATE OF FINANCIAL ADVISORY SERVICES INDUSTRYIn 2003, the Financial Planning Association of Taiwan introduced the Certified Financial Planner (CFP) designation in Taiwan, to advocate the idea of financial advisory services. As at 2015 year-end, there was a total of at least 1,300 CFPs in Taiwan, which is ranked the seventh-highest country in the world. Most of the CFPs in Taiwan are employed by banks, insurance companies, and security companies. The awareness of financial advisory services is growing, especially after the widespread mis-selling of structured notes that lost their value during the global financial crisis in 2008.
54 Based on the exchange rate at 31 December 2016 of USD 1 = TWD 32 .4 .

MILLIMAN RESEARCH REPORT
Asia retirement income report 81 MAY 2017
MILLIMAN’S HIGH-LEVEL ASSESSMENT OF POTENTIAL OPPORTUNITY FOR PRIVATE PROVIDERS IN THIS MARKETUnder the current mandatory pension schemes (Pillar 2), private fund providers are excluded from this market because employees do not have the option to select their investments, which all are invested by the government or select government-approved third parties.
With the expected drop in the income replacement ratio after the reform of the mandatory social insurance and pension schemes, there will be an increasing need for personal savings for retirement. This gap will be a potential opportunity for private providers.
Currently, banks, insurance companies, and investment companies all provide retirement solutions to the middle class and high net worth individuals. For the insurance sector in particular, there is a trend towards variable annuities with a living benefit guarantee, possibly fixed indexed annuities, and other types of investment-linked products. With the rapidly ageing population and the high popularity of insurance products in Taiwan, we expect the trend towards those products to continue for the near future.
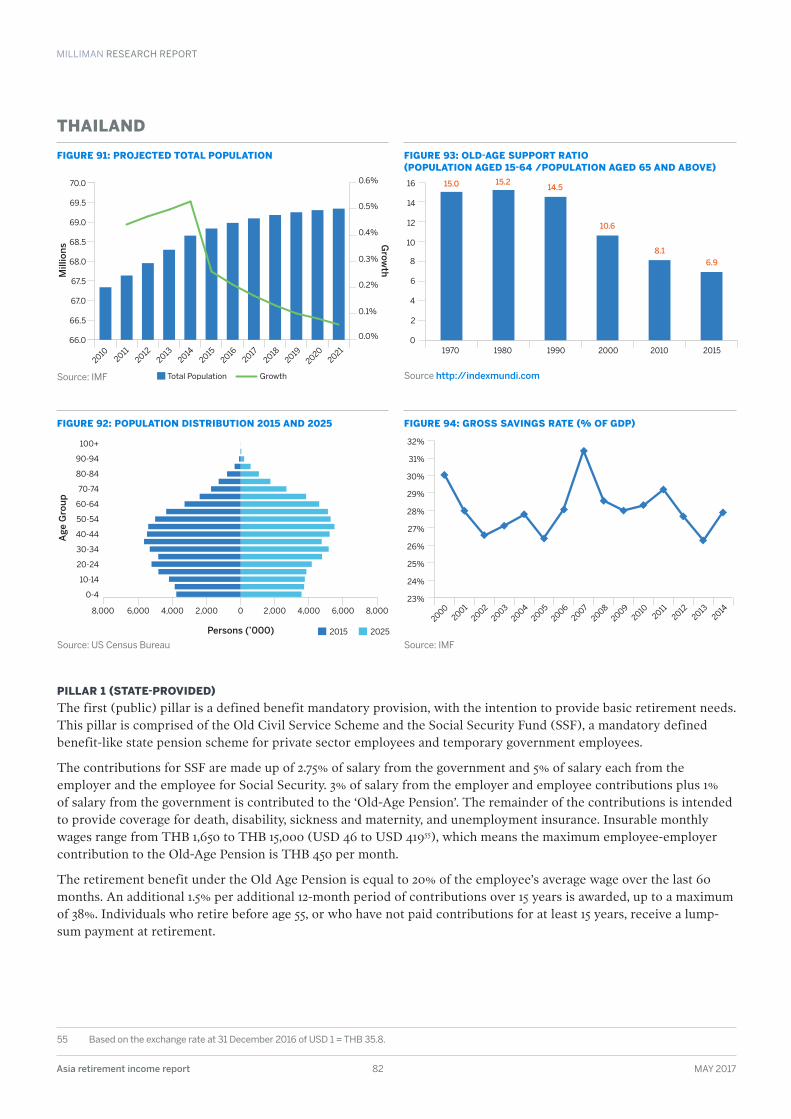
MILLIMAN RESEARCH REPORT
Asia retirement income report 82 MAY 2017
THAILAND
FIGURE 91: PROJECTED TOTAL POPULATION
Source: IMF
FIGURE 93: OLD-AGE SUPPORT RATIO (POPULATION AGED 15-64 /POPULATION AGED 65 AND ABOVE)
Source http://indexmundi.com
FIGURE 92: POPULATION DISTRIBUTION 2015 AND 2025
Source: US Census Bureau
FIGURE 94: GROSS SAVINGS RATE (% OF GDP)
Source: IMF
PILLAR 1 (STATE-PROVIDED)The first (public) pillar is a defined benefit mandatory provision, with the intention to provide basic retirement needs. This pillar is comprised of the Old Civil Service Scheme and the Social Security Fund (SSF), a mandatory defined benefit-like state pension scheme for private sector employees and temporary government employees.
The contributions for SSF are made up of 2.75% of salary from the government and 5% of salary each from the employer and the employee for Social Security. 3% of salary from the employer and employee contributions plus 1% of salary from the government is contributed to the ‘Old-Age Pension’. The remainder of the contributions is intended to provide coverage for death, disability, sickness and maternity, and unemployment insurance. Insurable monthly wages range from THB 1,650 to THB 15,000 (USD 46 to USD 41955), which means the maximum employee-employer contribution to the Old-Age Pension is THB 450 per month.
The retirement benefit under the Old Age Pension is equal to 20% of the employee’s average wage over the last 60 months. An additional 1.5% per additional 12-month period of contributions over 15 years is awarded, up to a maximum of 38%. Individuals who retire before age 55, or who have not paid contributions for at least 15 years, receive a lump-sum payment at retirement.
55 Based on the exchange rate at 31 December 2016 of USD 1 = THB 35 .8 .
Mill
ions
Grow
th
20142013
20122011
20102021
20202019
20182017
20162015
Total Population Growth
66.0
66.5
67.0
67.5
68.0
68.5
69.0
69.5
70.0
0.0%
0.1%
0.2%
0.3%
0.4%
0.5%
0.6%
1970 1980 1990 2000 2010 2015
15.0 15.214.5
10.6
8.1
6.9
0
2
4
6
8
10
12
14
16
Age
Gro
up
2015 2025Persons (’000)
100+
90-94
80-84
70-74
60-64
50-54
40-44
30-34
20-24
10-14
0-4
2,000 4,000 6,000 8,00004,000 2,0008,000 6,0002004
20032002
2001
20002011
20122013
20142010
20092008
20072006
200523%
24%
25%
26%
27%
28%
29%
30%
31%
32%
MILLIMAN RESEARCH REPORT
Asia retirement income report 83 MAY 2017
PILLAR 2 (MANDATORY SAVING)The second (occupational) pillar is a defined contribution plan and mandatory scheme. This pillar includes the Government Pension Fund (GPF). The GPF is a defined contribution pension system for civil servants. Contribution requirements for GPF are 3% of salary and a voluntary contribution (1% to 12% of salary) for employees and 3% of salary (with a 2% of pre-reform compensation that is due to the old Civil Service Scheme) for the government.
Another form of mandatory savings is the legal requirement for companies to pay severance payments to employees who retire or leave the company. The severance payment varies based on tenure, ranging from 1 month of salary for a tenure of 6 months, to 10 months of salary for a tenure of more than 10 years.
In November 2016, the Thai Cabinet approved, in principle, a National Pension Fund to support all pensioners after they retire, and it is expected to come into effect in 2018. This is a mandatory defined contribution pillar for private sector employees, with equal contributions required for employers and employees of (eventually) 10% of workers’ monthly wages.
PILLAR 3 (VOLUNTARY SAVING)The third pillar is a privately-financed, voluntary defined contribution provision. Unlike normal savings, it is incentivised with tax advantages and can be used as a means of closing pension gaps.
The Provident Fund is one such occupational pension scheme. Where the employer has chosen to provide a private provident fund to employees, membership is compulsory. Both employee and employer contributions have to be between 2% and 15% of the employee’s income. The relatively high threshold for income tax means in practice that this is of limited value for low- and middle-income earners in the formal sector.
In 2015, the government launched the National Savings Fund (NSF), a new voluntary retirement savings program. The fund acts as a state-run provident fund for some 30 million self-employed workers who are not members of the GPF or private provident funds. Upon joining the NSF, members are required to contribute a minimum of THB 50 per month, up to a maximum of THB 13,200 per year. The corresponding contribution from the government is dependent on the age of the members, with the percentage of contribution being not less than 50% of members’ contributions for ages 15 to 30, 80% of members’ contributions for ages 31 to 50, and 100% of members’ contributions for ages 51 to 60.
Pillar 3 also covers voluntary retirement saving made through personal saving plans such as the following products:
· Retirement mutual funds
· Long-term equity funds
· Annuity insurance products (introduced since 2009)
STATE OF FINANCIAL ADVISORY SERVICES INDUSTRYMost life insurance sales are made by tied agency and sales staff in banks and via other affinity partnerships and worksite marketing. Almost all direct marketing activity is outbound telemarketing, primarily to credit card and loan customers, with a small amount of inbound telemarketing driven by direct response TV and other promotions.
The financial advisory channel in Thailand is nascent.
Digital technology is increasingly used to support agents selling life insurance products, and some insurers are exploring using the Internet, mobile, and social media to sell products, leveraging the relatively high Internet and social media penetration in Thailand.
However, sales of insurance through these channels remain low and mainly consist of nonlife and commoditised life insurance products.
Some of the leading banks have been increasing focus more recently on retirement planning, including developing retirement calculators and other sales aids and targeted marketing campaigns.

MILLIMAN RESEARCH REPORT
Asia retirement income report 84 MAY 2017
MILLIMAN’S HIGH-LEVEL ASSESSMENT OF POTENTIAL OPPORTUNITY FOR PRIVATE PROVIDERS IN THIS MARKETThe retirement product offerings by insurers have, in general, been relatively simplistic and historically constrained by regulatory impediments in areas such as product design, a lack of meaningful tax relief, and the limited depth of long-term fixed income securities to support the liabilities with long durations typically associated with pensions. This exposes providers to potential reinvestment risk and asset/liability mismatch risk.
With a rapidly ageing population, a growing middle class, and increasing strain on public finances, there is considerable upside potential to expand retirement provisioning for those insurers with dedicated focus and distribution reach, especially in the mass affluent and high net worth segments. However, for the private sector to make significant inroads in developing this segment, a more conducive regulatory and tax environment is required.
MILLIMAN RESEARCH REPORT
Asia retirement income report 85 MAY 2017
Works CitedAustralian Bureau of Statistics, 2013. Retirement and Retirement Intentions, Australia, July 2012 to June 2013, Canberra: Australian Bureau of Statistics.
Commonwealth of Australia, 2014. Financial System Inquiry - Final Report, Canberra: Commonwealth of Australia.
CPF Advisory Panel, 2015. CPF Advisory Panel Full Report, s.l.: Government of Singapore.
DBS & Manulife, 2016. DBS-Manulife Retirement Wellness Study, s.l.: DBS & Manulife.
Dorfman, M., Hinz, R. P. & Holzmann, R., 2008. Pension Systems and Reform Conceptual Framework, s.l.: World Bank.
HSBC, 2016. The Future of Retirement - Generations and Journeys (Global Report), s.l.: HSBC.
Milliman, 2016. Universal Life and Indexed Universal Life Issues, s.l.: Milliman.
OECD, 2013. Pensions at a Glance Asia/Pacific 2013, s.l.: OECD Publishing.
Prentice, T., 2008. Health, history and hard choices: Funding dilemmas in a fast-changing world, Indiana: World Health Organisation.
Productivity Commission, 2015. Superannuation Policy for Retirement, Canberra: Australian Government Productivity Commission.
Thurley, D., 2015. Pensions: annuities, s.l.: House of Commons Library.
We Are Social, 2016. Digital, Social & Mobile Worldwide in 2016, s.l.: We Are Social.
Wong, M. M., 2015. Hungry Robo-Advisors Are Eyeing Wealth Management Assets, s.l.: Morningstar Equity Research.
World Bank, 2016. Live Long and Prosper: Aging in East Asia and Pacific, s.l.: World Bank.
AcknowledgementsWe would like to thank the following people for their contributions to this report:
Nick Dumbreck and Colette Dunn, Milliman - London office, for the case studies on the United Kingdom.
Stephen Conwill, Milliman - Tokyo office, for the case study on Japan and his input on the national retirement system in Japan.
Sue Siap, Milliman - Chicago office, for the case study on the United States.
Jeff Gebler, Milliman - Sydney office, for the case study on Australia.
Sanket Kawatkar, Milliman - Mumbai office, for his input on the national retirement system in India.
Farzana Ismail and Yi Yee Tan, Milliman - Kuala Lumpur office, for their input on the national retirement system in Malaysia.
Chihong An and Sojung Lee, Milliman - Seoul office, for their input on the national retirement system in South Korea.
Wing Wong and Richard Liao, Milliman - Taipei office, for their input on the national retirement systems in China and Taiwan.

Milliman is among the world’s largest providers of actuarial and
related products and services . The firm has consulting practices in
life insurance and financial services, property & casualty insurance,
healthcare, and employee benefits . Founded in 1947, Milliman is an
independent firm with offices in major cities around the globe .
milliman.com
©2017 Milliman, Inc. All Rights Reserved. The materials in this document represent the opinion of the authors and are not representative of the views of Milliman, Inc. Milliman does not certify the information, nor does it guarantee the accuracy and completeness of such information. Use of such information is voluntary and should not be relied upon unless an independent review of its accuracy and completeness has been performed. Materials may not be reproduced without the express consent of Milliman.
CONTACT
Wade [email protected]
Richard [email protected]
Paul [email protected]
Michael [email protected]
Zhikang [email protected]
Related Documents