Review Asia-Pacific mussel watch: monitoring contamination of persistent organochlorine compounds in coastal waters of Asian countries In Monirith a , Daisuke Ueno a , Shin Takahashi a , Haruhiko Nakata b , Agus Sudaryanto a , Annamalai Subramanian c , Subramanian Karuppiah c , Ahmad Ismail d , Muswerry Muchtar e , Jinshu Zheng f , Bruce J. Richardson f , Maricar Prudente g , Ngyen Duc Hue h , Touch Seang Tana i , Alexander V. Tkalin j , Shinsuke Tanabe a, * a Center for Marine Environmental Studies, Ehime University, Tarumi 3-5-7, Matsuyama 790-8556, Japan b Department of Environmental Science, Kumamoto University, Kurokami 2-39-1, Kumamoto 860-8555, Japan c Center of Advanced Study in Marine Biology, Annamalai University, Parangipettai 608 502, Tamil Nadu, India d Department of Biology, University Putra Malaysia 43400 UPM Serdang, Selangor, Malaysia e Research and Development Center for Oceanology––Indonesia Institute of Sciences, Jl. Pasir Putih 1, Ancol Timur, Jakarata 11048, Indonesia f Department of Biology and Chemistry, City University of Hong Kong, 83 Tat Chee Avenue, Kowloon, Hong Kong g Science Education Department, De La Sella University, 2401 Taft Avenue, 1004 Manila, Philippines h Faculty of Chemistry, Hanoi National University, 19 Le Thanh Tong Street, Hanoi, Viet Nam i Member of the Economics, Social and Cultural Observation Unit (OBSES) of the Council of Ministers, Cambodia j Far Eastern Regional Hydrometeorological Research Institute, Department of Oceanography and Marine Ecology, 24 Fontannaya Street, Vladivostock 690600, Russia Accepted 15 October 2002 Abstract Contamination of persistent organochlorines (OCs) such as PCBs (polychlorinated biphenyls), DDT and its metabolites (DDTs), HCH (hexachlorocyclohexane) isomers (HCHs), chlordane compounds (CHLs), and HCB (hexachlorobenzene) were examined in mussels collected from coastal waters of Asian countries such as Cambodia, China, Hong Kong, India, Indonesia, Japan, Korea, Malaysia, Philippines, Far East Russia, Singapore, and Vietnam in 1994, 1997, 1998, 1999, and 2001 to elucidate the contamination status, distribution and possible pollution sources and to assess the risks on aquatic organisms and human. OCs were detected in all mussels collected from all the sampling sites investigated. Considerable residue levels of p; p 0 -DDT and a-HCH were found in mussels and the concentrations of DDTs and HCHs found in mussels from Asian developing countries were higher than those in developed nations suggesting present usage of DDTs and HCHs along the coastal waters of Asian developing countries. On the other hand, lower concentrations of PCBs detected in mussels from Asian developing countries than those in developed countries indicate that PCBs contamination in mussels is strongly related to industrial and activities. To our knowledge, this is a first comprehensive report on monitoring OCs pollution in the Asia-Pacific region. Ó 2002 Elsevier Science Ltd. All rights reserved. Keywords: Organochlorine compounds (OCs); Mussels; Asia-Pacific region; Developing countries; Developed nations 1. Introduction Environmental pollution by toxic chemicals is a glo- bal problem, particularly organochlorine compounds (OCs) representing ‘‘persistent organic pollutants (POPs)’’ are of great concern due to their bioaccumulative nature and toxic biological effects on wildlife and humans (Tanabe et al., 2000). Elevated concentrations of OCs have been detected in a wide range of environmental media and aquatic biota (Iwata et al., 1993; Kannan et al., 1997; Tanabe, 2000; Tanabe et al., 2000). The undesirable effects of some of these chemicals are linked to the occurrence of immunologic and teratogenic * Corresponding author. Tel./fax: +81-89-946-9904. E-mail address: [email protected] (S. Tanabe). 0025-326X/03/$ - see front matter Ó 2002 Elsevier Science Ltd. All rights reserved. doi:10.1016/S0025-326X(02)00400-9 www.elsevier.com/locate/marpolbul Marine Pollution Bulletin 46 (2003) 281–300

Welcome message from author
This document is posted to help you gain knowledge. Please leave a comment to let me know what you think about it! Share it to your friends and learn new things together.
Transcript
Review
Asia-Pacific mussel watch: monitoring contamination of persistentorganochlorine compounds in coastal waters of Asian countries
In Monirith a, Daisuke Ueno a, Shin Takahashi a, Haruhiko Nakata b, Agus Sudaryanto a,Annamalai Subramanian c, Subramanian Karuppiah c, Ahmad Ismail d,
Muswerry Muchtar e, Jinshu Zheng f, Bruce J. Richardson f, Maricar Prudente g,Ngyen Duc Hue h, Touch Seang Tana i, Alexander V. Tkalin j, Shinsuke Tanabe a,*
a Center for Marine Environmental Studies, Ehime University, Tarumi 3-5-7, Matsuyama 790-8556, Japanb Department of Environmental Science, Kumamoto University, Kurokami 2-39-1, Kumamoto 860-8555, Japan
c Center of Advanced Study in Marine Biology, Annamalai University, Parangipettai 608 502, Tamil Nadu, Indiad Department of Biology, University Putra Malaysia 43400 UPM Serdang, Selangor, Malaysia
e Research and Development Center for Oceanology––Indonesia Institute of Sciences, Jl. Pasir Putih 1, Ancol Timur, Jakarata 11048, Indonesiaf Department of Biology and Chemistry, City University of Hong Kong, 83 Tat Chee Avenue, Kowloon, Hong Kong
g Science Education Department, De La Sella University, 2401 Taft Avenue, 1004 Manila, Philippinesh Faculty of Chemistry, Hanoi National University, 19 Le Thanh Tong Street, Hanoi, Viet Nam
i Member of the Economics, Social and Cultural Observation Unit (OBSES) of the Council of Ministers, Cambodiaj Far Eastern Regional Hydrometeorological Research Institute, Department of Oceanography and Marine Ecology,
24 Fontannaya Street, Vladivostock 690600, Russia
Accepted 15 October 2002
Abstract
Contamination of persistent organochlorines (OCs) such as PCBs (polychlorinated biphenyls), DDT and its metabolites (DDTs),
HCH (hexachlorocyclohexane) isomers (HCHs), chlordane compounds (CHLs), and HCB (hexachlorobenzene) were examined in
mussels collected from coastal waters of Asian countries such as Cambodia, China, Hong Kong, India, Indonesia, Japan, Korea,
Malaysia, Philippines, Far East Russia, Singapore, and Vietnam in 1994, 1997, 1998, 1999, and 2001 to elucidate the contamination
status, distribution and possible pollution sources and to assess the risks on aquatic organisms and human. OCs were detected in all
mussels collected from all the sampling sites investigated. Considerable residue levels of p; p0-DDT and a-HCH were found in
mussels and the concentrations of DDTs and HCHs found in mussels from Asian developing countries were higher than those in
developed nations suggesting present usage of DDTs and HCHs along the coastal waters of Asian developing countries. On the
other hand, lower concentrations of PCBs detected in mussels from Asian developing countries than those in developed countries
indicate that PCBs contamination in mussels is strongly related to industrial and activities. To our knowledge, this is a first
comprehensive report on monitoring OCs pollution in the Asia-Pacific region.
� 2002 Elsevier Science Ltd. All rights reserved.
Keywords: Organochlorine compounds (OCs); Mussels; Asia-Pacific region; Developing countries; Developed nations
1. Introduction
Environmental pollution by toxic chemicals is a glo-
bal problem, particularly organochlorine compounds
(OCs) representing ‘‘persistent organic pollutants (POPs)’’
are of great concern due to their bioaccumulative nature
and toxic biological effects on wildlife and humans
(Tanabe et al., 2000). Elevated concentrations of OCshave been detected in a wide range of environmental
media and aquatic biota (Iwata et al., 1993; Kannan
et al., 1997; Tanabe, 2000; Tanabe et al., 2000). The
undesirable effects of some of these chemicals are linked
to the occurrence of immunologic and teratogenic
*Corresponding author. Tel./fax: +81-89-946-9904.
E-mail address: [email protected] (S. Tanabe).
0025-326X/03/$ - see front matter � 2002 Elsevier Science Ltd. All rights reserved.
doi:10.1016/S0025-326X(02)00400-9
www.elsevier.com/locate/marpolbul
Marine Pollution Bulletin 46 (2003) 281–300
dysfunction, reproductive impairments and endocrine
disruption in lower and higher trophic levels (Colborn
and Smolen, 1996).
Several studies have reported the contamination ofOCs in the air (Iwata et al., 1993), foodstuff (Kannan
et al., 1997) and marine mammals (Tanabe et al., 1994;
Minh et al., 1999, 2000) from Asian coastal areas indi-
cating the presence of major emission sources of OCs in
Asian region. Even though most of the developed
countries have banned or restricted the production and
usage of many of these OCs during 1970s and 1980s,
these chemicals are still being used in some developingnations for agricultural and public health purposes
(Dave, 1996; Li, 1999; Tanabe et al., 1994). Some of
these chemicals are still being manufactured in Asian
developing region (FCI Editorial Board, 1996). Con-
sidering the above facts, the present study was con-
ducted to assess the levels of toxic contaminants such
as OCs in green mussels collected from Asian coastal
waters.Bivalves such as mussels have been suggested as a
suitable bioindicator for monitoring trace toxic con-
taminant levels in coastal waters due to their wide dis-
tribution, sessile lifestyle, easy sampling, tolerance to a
considerable range of salinity, resistance to stress and
high accumulation of a wide range of chemicals
(Goldberg et al., 1978). In particular, the green mussels
(Perna viridis) are widely distributed in the Asiancoastal waters, and recognized as a commercially valu-
able seafood in this zone. Mussels are highly suitable for
culture in the coastal areas. Being filter feeders, they
occupy a low position in the food chain, making their
exploitation a very economic utilization of the pri-
mary production available in coastal waters. Moreover,
mussels have a high protein content, averaging 67% of
the body weight (Cheong, 1982; Tanabe et al., 2000),which is comparable to the other food items of higher
trophic levels and this underscores its importance as a
source of inexpensive animal protein. It is for these
reasons that mussels are an important part of Asian
diet. Monitoring studies on the residues of toxic con-
taminants in this seafood is rather limited (Tanabe et al.,
2000).
The Asia-Pacific mussel watch program (APMW),started in 1994, is under the umbrella of the Interna-
tional Mussel Watch-Asia Pacific Phase, a project that
mainly involves coastal monitoring using sentinel or-
ganisms such as mussels and oysters as bioindicators in
ascertaining the quality of coastal waters in the Asia-
Pacific region (Tanabe, 2000; Tanabe et al., 2000). The
present study is a part of the APMW project to exhibit
the current status of contamination by OCs in coastalwaters of Asian countries.
This study aims to assess the levels of contamination
of OCs and their distribution in coastal waters of Asian
developing countries.
2. Materials and methods
2.1. Sample collection
Green mussel (Perna viridis), blue mussel (Mytilus
gallorovincialis), and Ezo mussel (Crenomytilus gray-
amus) were collected from various locations in the Asian
countries such as Cambodia, China, Hong Kong, India,
Indonesia, Japan, Korea, Malaysia, Philippines, Far
East Russia, Singapore and Vietnam in 1994, 1997,
1998, 1999 and 2001 respectively. Mussel samples were
kept in polyethylene bags, kept in ice box with ice or dryice, and kept in a deep freezer immediately after reach-
ing the laboratory. In the laboratory, the frozen mussel
samples were thawed and biometric measurement were
made. After shucking the whole soft tissues of mussels
from each location were pooled, homogenized, trans-
ferred into clean glass bottles and frozen at )20 �C until
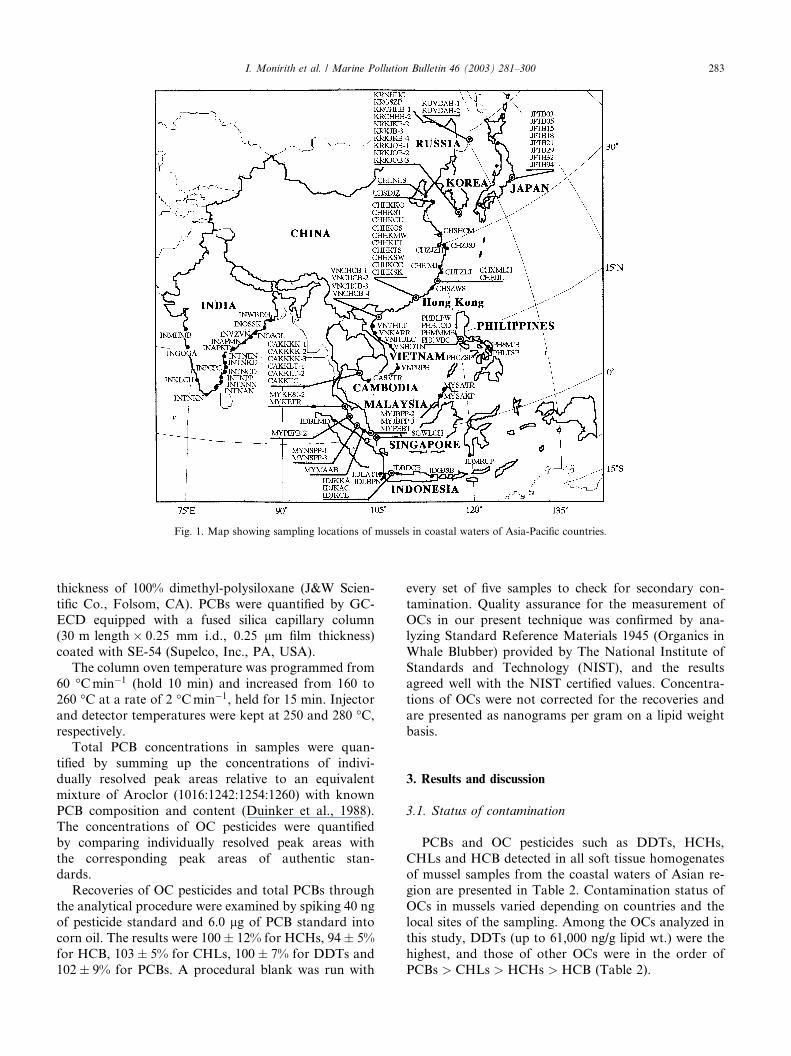
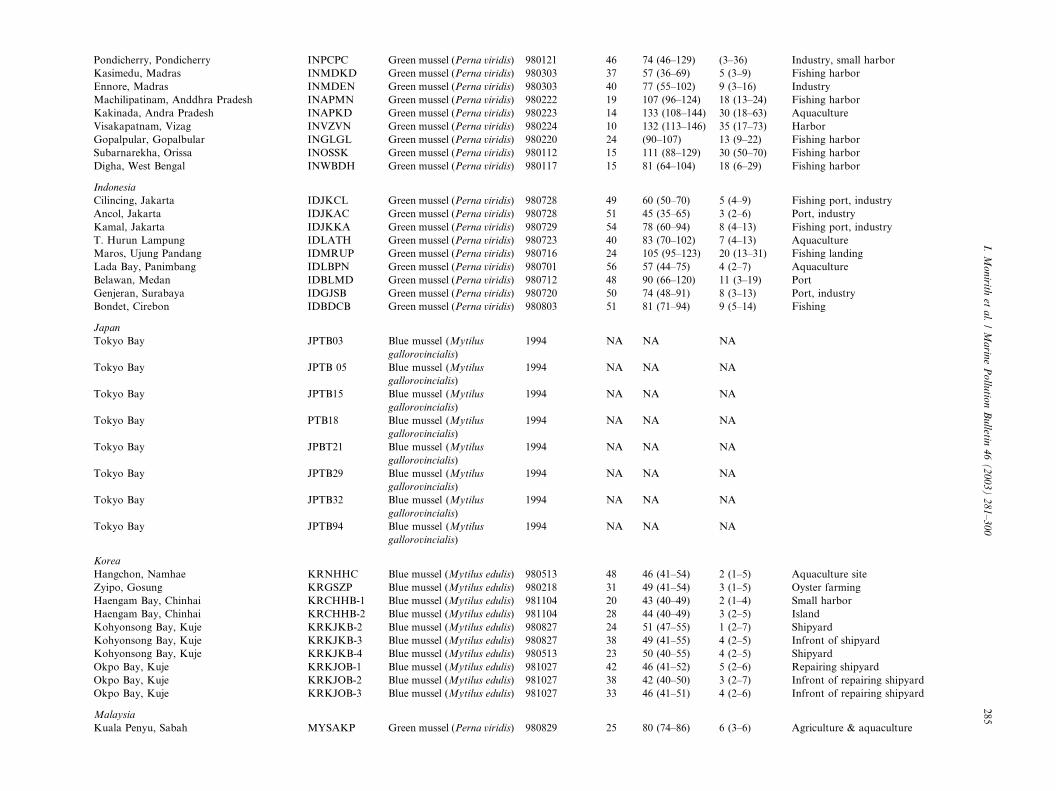
chemical analysis. The details of sampling locations and
biological data of mussels are presented in Fig. 1 andTable 1, respectively.
2.2. Chemical analysis
Polychlorinated biphenyls (PCBs) and organochlro-
rine (OC) insecticides such as DDT and its metabo-
lites (DDTs: p; p0-DDT, p; p0-DDD, and p; p0-DDE),chlordane compounds (CHLs: trans-chlordane, cis-chlordane, cis-nonachlor and oxychlordane), hexachlo-
rohexane isomers (HCHs: a-HCH, b-HCH, and c-HCH)and hexachlorobenzene (HCB) were analyzed following
the method described by Tanabe et al. (2000) and Kan-
atireklap et al. (1997). Briefly, samples were homoge-
nized with anhydrous Na2SO4 and extracted using a
Soxhlet apparatus with a mixture of diethyl ether and
hexane (3:1, 400 ml) for 7 h. After concentrating theextract, lipid content was determined gravimetrically
from an aliquot of the extract. A portion of the extract
was added to dry Florisil column to remove lipid and
then eluted with the mixture of 120 ml acetonitrile and
30 ml hexane-washed water. OCs in the eluate were then
transferred to hexane. After concentration, the hexane
extract was cleaned with sulfuric acid and separated into
two fractions using Florisil packed glass column. Thefirst fraction eluted with hexane contained PCBs, HCB
and p; p0-DDE. The second fraction eluted with 20%
dichloromethane in hexane contained HCH isomers (a-,b-, and c-HCH), o; p0-DDT, p; p0-DDD, p; p0-DDT and
chlordane compounds (trans-chlordane, cis-nonachlor,
and oxychlordane). Final extracts were concentrated,
cleaned up with sulfuric acid and subjected to quantifi-
cation by capillary gas chromatography with a 63Nielectron capture detector (GC-ECD). Chromatographic
separation was performed on a Hewlett-Packard 5890
Series II gas chromatograph with a 30 m� 0:25 mm
(i.d.) DB-1 capillary column coated with 0.25 lm film
282 I. Monirith et al. / Marine Pollution Bulletin 46 (2003) 281–300
thickness of 100% dimethyl-polysiloxane (J&W Scien-
tific Co., Folsom, CA). PCBs were quantified by GC-ECD equipped with a fused silica capillary column
(30 m length� 0:25 mm i.d., 0.25 lm film thickness)
coated with SE-54 (Supelco, Inc., PA, USA).
The column oven temperature was programmed from
60 �Cmin�1 (hold 10 min) and increased from 160 to
260 �C at a rate of 2 �Cmin�1, held for 15 min. Injector
and detector temperatures were kept at 250 and 280 �C,respectively.
Total PCB concentrations in samples were quan-
tified by summing up the concentrations of indivi-
dually resolved peak areas relative to an equivalent
mixture of Aroclor (1016:1242:1254:1260) with known
PCB composition and content (Duinker et al., 1988).
The concentrations of OC pesticides were quantified
by comparing individually resolved peak areas with
the corresponding peak areas of authentic stan-dards.
Recoveries of OC pesticides and total PCBs through
the analytical procedure were examined by spiking 40 ng
of pesticide standard and 6.0 lg of PCB standard into
corn oil. The results were 100� 12% for HCHs, 94� 5%
for HCB, 103� 5% for CHLs, 100� 7% for DDTs and
102� 9% for PCBs. A procedural blank was run with
every set of five samples to check for secondary con-
tamination. Quality assurance for the measurement ofOCs in our present technique was confirmed by ana-
lyzing Standard Reference Materials 1945 (Organics in
Whale Blubber) provided by The National Institute of
Standards and Technology (NIST), and the results
agreed well with the NIST certified values. Concentra-
tions of OCs were not corrected for the recoveries and
are presented as nanograms per gram on a lipid weight
basis.
3. Results and discussion
3.1. Status of contamination
PCBs and OC pesticides such as DDTs, HCHs,
CHLs and HCB detected in all soft tissue homogenatesof mussel samples from the coastal waters of Asian re-
gion are presented in Table 2. Contamination status of
OCs in mussels varied depending on countries and the
local sites of the sampling. Among the OCs analyzed in
this study, DDTs (up to 61,000 ng/g lipid wt.) were the
highest, and those of other OCs were in the order of
PCBs > CHLs > HCHs > HCB (Table 2).
Fig. 1. Map showing sampling locations of mussels in coastal waters of Asia-Pacific countries.
I. Monirith et al. / Marine Pollution Bulletin 46 (2003) 281–300 283
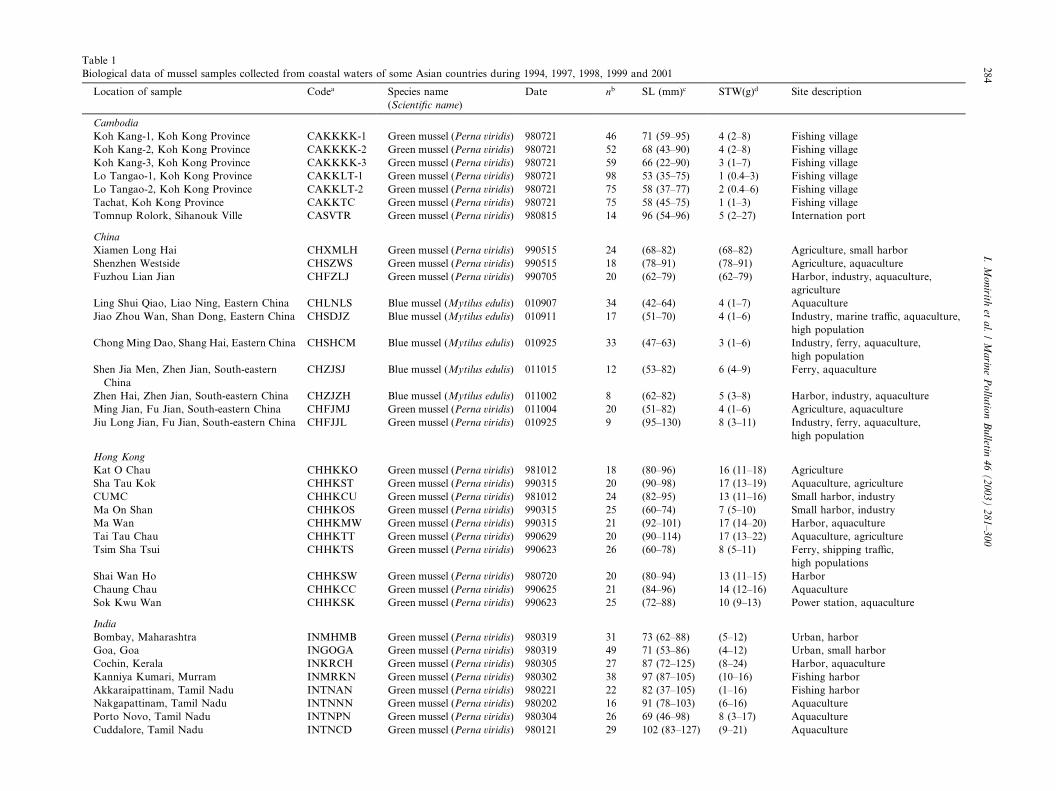
Table 1
Biological data of mussel samples collected from coastal waters of some Asian countries during 1994, 1997, 1998, 1999 and 2001
Location of sample Codea Species name
(Scientific name)
Date nb SL (mm)c STW(g)d Site description
Cambodia
Koh Kang-1, Koh Kong Province CAKKKK-1 Green mussel (Perna viridis) 980721 46 71 (59–95) 4 (2–8) Fishing village
Koh Kang-2, Koh Kong Province CAKKKK-2 Green mussel (Perna viridis) 980721 52 68 (43–90) 4 (2–8) Fishing village
Koh Kang-3, Koh Kong Province CAKKKK-3 Green mussel (Perna viridis) 980721 59 66 (22–90) 3 (1–7) Fishing village
Lo Tangao-1, Koh Kong Province CAKKLT-1 Green mussel (Perna viridis) 980721 98 53 (35–75) 1 (0.4–3) Fishing village
Lo Tangao-2, Koh Kong Province CAKKLT-2 Green mussel (Perna viridis) 980721 75 58 (37–77) 2 (0.4–6) Fishing village
Tachat, Koh Kong Province CAKKTC Green mussel (Perna viridis) 980721 75 58 (45–75) 1 (1–3) Fishing village
Tomnup Rolork, Sihanouk Ville CASVTR Green mussel (Perna viridis) 980815 14 96 (54–96) 5 (2–27) Internation port
China
Xiamen Long Hai CHXMLH Green mussel (Perna viridis) 990515 24 (68–82) (68–82) Agriculture, small harbor
Shenzhen Westside CHSZWS Green mussel (Perna viridis) 990515 18 (78–91) (78–91) Agriculture, aquaculture
Fuzhou Lian Jian CHFZLJ Green mussel (Perna viridis) 990705 20 (62–79) (62–79) Harbor, industry, aquaculture,
agriculture
Ling Shui Qiao, Liao Ning, Eastern China CHLNLS Blue mussel (Mytilus edulis) 010907 34 (42–64) 4 (1–7) Aquaculture
Jiao Zhou Wan, Shan Dong, Eastern China CHSDJZ Blue mussel (Mytilus edulis) 010911 17 (51–70) 4 (1–6) Industry, marine traffic, aquaculture,
high population
Chong Ming Dao, Shang Hai, Eastern China CHSHCM Blue mussel (Mytilus edulis) 010925 33 (47–63) 3 (1–6) Industry, ferry, aquaculture,
high population
Shen Jia Men, Zhen Jian, South-eastern
China
CHZJSJ Blue mussel (Mytilus edulis) 011015 12 (53–82) 6 (4–9) Ferry, aquaculture
Zhen Hai, Zhen Jian, South-eastern China CHZJZH Blue mussel (Mytilus edulis) 011002 8 (62–82) 5 (3–8) Harbor, industry, aquaculture
Ming Jian, Fu Jian, South-eastern China CHFJMJ Green mussel (Perna viridis) 011004 20 (51–82) 4 (1–6) Agriculture, aquaculture
Jiu Long Jian, Fu Jian, South-eastern China CHFJJL Green mussel (Perna viridis) 010925 9 (95–130) 8 (3–11) Industry, ferry, aquaculture,
high population
Hong Kong
Kat O Chau CHHKKO Green mussel (Perna viridis) 981012 18 (80–96) 16 (11–18) Agriculture
Sha Tau Kok CHHKST Green mussel (Perna viridis) 990315 20 (90–98) 17 (13–19) Aquaculture, agriculture
CUMC CHHKCU Green mussel (Perna viridis) 981012 24 (82–95) 13 (11–16) Small harbor, industry
Ma On Shan CHHKOS Green mussel (Perna viridis) 990315 25 (60–74) 7 (5–10) Small harbor, industry
Ma Wan CHHKMW Green mussel (Perna viridis) 990315 21 (92–101) 17 (14–20) Harbor, aquaculture
Tai Tau Chau CHHKTT Green mussel (Perna viridis) 990629 20 (90–114) 17 (13–22) Aquaculture, agriculture
Tsim Sha Tsui CHHKTS Green mussel (Perna viridis) 990623 26 (60–78) 8 (5–11) Ferry, shipping traffic,
high populations
Shai Wan Ho CHHKSW Green mussel (Perna viridis) 980720 20 (80–94) 13 (11–15) Harbor
Chaung Chau CHHKCC Green mussel (Perna viridis) 990625 21 (84–96) 14 (12–16) Aquaculture
Sok Kwu Wan CHHKSK Green mussel (Perna viridis) 990623 25 (72–88) 10 (9–13) Power station, aquaculture
India
Bombay, Maharashtra INMHMB Green mussel (Perna viridis) 980319 31 73 (62–88) (5–12) Urban, harbor
Goa, Goa INGOGA Green mussel (Perna viridis) 980319 49 71 (53–86) (4–12) Urban, small harbor
Cochin, Kerala INKRCH Green mussel (Perna viridis) 980305 27 87 (72–125) (8–24) Harbor, aquaculture
Kanniya Kumari, Murram INMRKN Green mussel (Perna viridis) 980302 38 97 (87–105) (10–16) Fishing harbor
Akkaraipattinam, Tamil Nadu INTNAN Green mussel (Perna viridis) 980221 22 82 (37–105) (1–16) Fishing harbor
Nakgapattinam, Tamil Nadu INTNNN Green mussel (Perna viridis) 980202 16 91 (78–103) (6–16) Aquaculture
Porto Novo, Tamil Nadu INTNPN Green mussel (Perna viridis) 980304 26 69 (46–98) 8 (3–17) Aquaculture
Cuddalore, Tamil Nadu INTNCD Green mussel (Perna viridis) 980121 29 102 (83–127) (9–21) Aquaculture
284
I.Monirith
etal./Marin
ePollu
tionBulletin
46(2003)281–300
Pondicherry, Pondicherry INPCPC Green mussel (Perna viridis) 980121 46 74 (46–129) (3–36) Industry, small harbor
Kasimedu, Madras INMDKD Green mussel (Perna viridis) 980303 37 57 (36–69) 5 (3–9) Fishing harbor
Ennore, Madras INMDEN Green mussel (Perna viridis) 980303 40 77 (55–102) 9 (3–16) Industry
Machilipatinam, Anddhra Pradesh INAPMN Green mussel (Perna viridis) 980222 19 107 (96–124) 18 (13–24) Fishing harbor
Kakinada, Andra Pradesh INAPKD Green mussel (Perna viridis) 980223 14 133 (108–144) 30 (18–63) Aquaculture
Visakapatnam, Vizag INVZVN Green mussel (Perna viridis) 980224 10 132 (113–146) 35 (17–73) Harbor
Gopalpular, Gopalbular INGLGL Green mussel (Perna viridis) 980220 24 (90–107) 13 (9–22) Fishing harbor
Subarnarekha, Orissa INOSSK Green mussel (Perna viridis) 980112 15 111 (88–129) 30 (50–70) Fishing harbor
Digha, West Bengal INWBDH Green mussel (Perna viridis) 980117 15 81 (64–104) 18 (6–29) Fishing harbor
Indonesia
Cilincing, Jakarta IDJKCL Green mussel (Perna viridis) 980728 49 60 (50–70) 5 (4–9) Fishing port, industry
Ancol, Jakarta IDJKAC Green mussel (Perna viridis) 980728 51 45 (35–65) 3 (2–6) Port, industry
Kamal, Jakarta IDJKKA Green mussel (Perna viridis) 980729 54 78 (60–94) 8 (4–13) Fishing port, industry
T. Hurun Lampung IDLATH Green mussel (Perna viridis) 980723 40 83 (70–102) 7 (4–13) Aquaculture
Maros, Ujung Pandang IDMRUP Green mussel (Perna viridis) 980716 24 105 (95–123) 20 (13–31) Fishing landing
Lada Bay, Panimbang IDLBPN Green mussel (Perna viridis) 980701 56 57 (44–75) 4 (2–7) Aquaculture
Belawan, Medan IDBLMD Green mussel (Perna viridis) 980712 48 90 (66–120) 11 (3–19) Port
Genjeran, Surabaya IDGJSB Green mussel (Perna viridis) 980720 50 74 (48–91) 8 (3–13) Port, industry
Bondet, Cirebon IDBDCB Green mussel (Perna viridis) 980803 51 81 (71–94) 9 (5–14) Fishing
Japan
Tokyo Bay JPTB03 Blue mussel (Mytilus
gallorovincialis)
1994 NA NA NA
Tokyo Bay JPTB 05 Blue mussel (Mytilus
gallorovincialis)
1994 NA NA NA
Tokyo Bay JPTB15 Blue mussel (Mytilus
gallorovincialis)
1994 NA NA NA
Tokyo Bay PTB18 Blue mussel (Mytilus
gallorovincialis)
1994 NA NA NA
Tokyo Bay JPBT21 Blue mussel (Mytilus
gallorovincialis)
1994 NA NA NA
Tokyo Bay JPTB29 Blue mussel (Mytilus
gallorovincialis)
1994 NA NA NA
Tokyo Bay JPTB32 Blue mussel (Mytilus
gallorovincialis)
1994 NA NA NA
Tokyo Bay JPTB94 Blue mussel (Mytilus
gallorovincialis)
1994 NA NA NA
Korea
Hangchon, Namhae KRNHHC Blue mussel (Mytilus edulis) 980513 48 46 (41–54) 2 (1–5) Aquaculture site
Zyipo, Gosung KRGSZP Blue mussel (Mytilus edulis) 980218 31 49 (41–54) 3 (1–5) Oyster farming
Haengam Bay, Chinhai KRCHHB-1 Blue mussel (Mytilus edulis) 981104 20 43 (40–49) 2 (1–4) Small harbor
Haengam Bay, Chinhai KRCHHB-2 Blue mussel (Mytilus edulis) 981104 28 44 (40–49) 3 (2–5) Island
Kohyonsong Bay, Kuje KRKJKB-2 Blue mussel (Mytilus edulis) 980827 24 51 (47–55) 1 (2–7) Shipyard
Kohyonsong Bay, Kuje KRKJKB-3 Blue mussel (Mytilus edulis) 980827 38 49 (41–55) 4 (2–5) Infront of shipyard
Kohyonsong Bay, Kuje KRKJKB-4 Blue mussel (Mytilus edulis) 980513 23 50 (40–55) 4 (2–5) Shipyard
Okpo Bay, Kuje KRKJOB-1 Blue mussel (Mytilus edulis) 981027 42 46 (41–52) 5 (2–6) Repairing shipyard
Okpo Bay, Kuje KRKJOB-2 Blue mussel (Mytilus edulis) 981027 38 42 (40–50) 3 (2–7) Infront of repairing shipyard
Okpo Bay, Kuje KRKJOB-3 Blue mussel (Mytilus edulis) 981027 33 46 (41–51) 4 (2–6) Infront of repairing shipyard
Malaysia
Kuala Penyu, Sabah MYSAKP Green mussel (Perna viridis) 980829 25 80 (74–86) 6 (3–6) Agriculture & aquaculture
I.Monirith
etal./Marin
ePollu
tionBulletin
46(2003)281–300
285
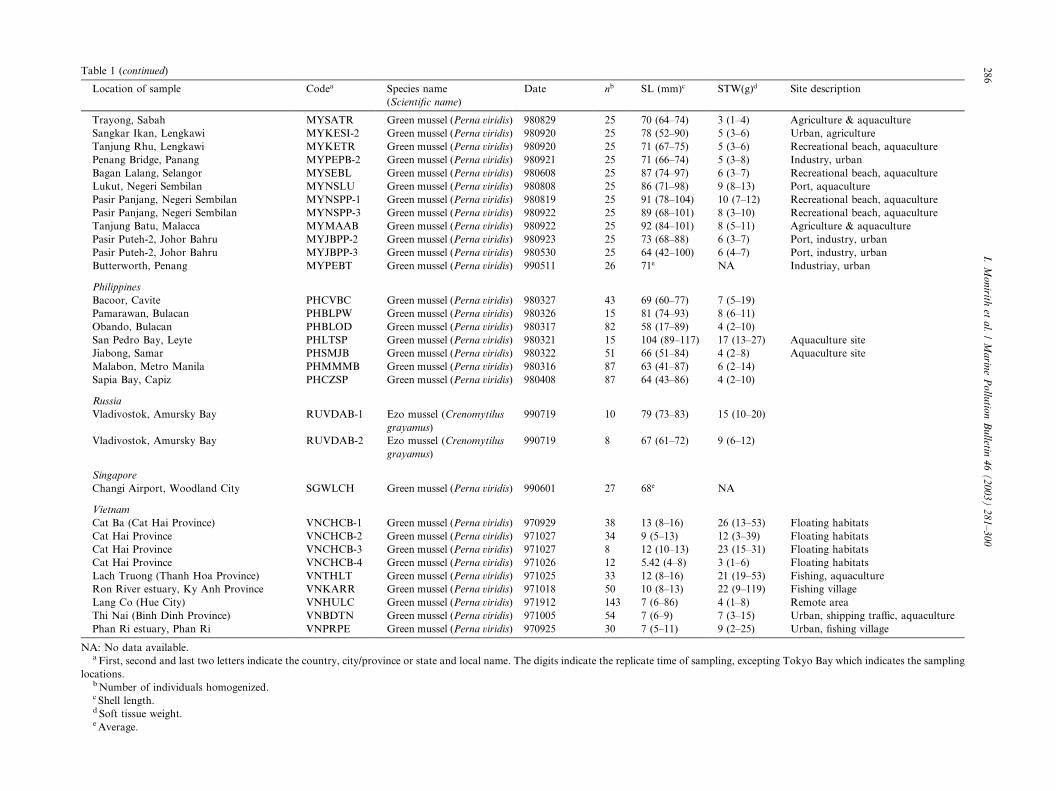
Table 1 (continued)
Location of sample Codea Species name
(Scientific name)
Date nb SL (mm)c STW(g)d Site description
Trayong, Sabah MYSATR Green mussel (Perna viridis) 980829 25 70 (64–74) 3 (1–4) Agriculture & aquaculture
Sangkar Ikan, Lengkawi MYKESI-2 Green mussel (Perna viridis) 980920 25 78 (52–90) 5 (3–6) Urban, agriculture
Tanjung Rhu, Lengkawi MYKETR Green mussel (Perna viridis) 980920 25 71 (67–75) 5 (3–6) Recreational beach, aquaculture
Penang Bridge, Panang MYPEPB-2 Green mussel (Perna viridis) 980921 25 71 (66–74) 5 (3–8) Industry, urban
Bagan Lalang, Selangor MYSEBL Green mussel (Perna viridis) 980608 25 87 (74–97) 6 (3–7) Recreational beach, aquaculture
Lukut, Negeri Sembilan MYNSLU Green mussel (Perna viridis) 980808 25 86 (71–98) 9 (8–13) Port, aquaculture
Pasir Panjang, Negeri Sembilan MYNSPP-1 Green mussel (Perna viridis) 980819 25 91 (78–104) 10 (7–12) Recreational beach, aquaculture
Pasir Panjang, Negeri Sembilan MYNSPP-3 Green mussel (Perna viridis) 980922 25 89 (68–101) 8 (3–10) Recreational beach, aquaculture
Tanjung Batu, Malacca MYMAAB Green mussel (Perna viridis) 980922 25 92 (84–101) 8 (5–11) Agriculture & aquaculture
Pasir Puteh-2, Johor Bahru MYJBPP-2 Green mussel (Perna viridis) 980923 25 73 (68–88) 6 (3–7) Port, industry, urban
Pasir Puteh-2, Johor Bahru MYJBPP-3 Green mussel (Perna viridis) 980530 25 64 (42–100) 6 (4–7) Port, industry, urban
Butterworth, Penang MYPEBT Green mussel (Perna viridis) 990511 26 71e NA Industriay, urban
Philippines
Bacoor, Cavite PHCVBC Green mussel (Perna viridis) 980327 43 69 (60–77) 7 (5–19)
Pamarawan, Bulacan PHBLPW Green mussel (Perna viridis) 980326 15 81 (74–93) 8 (6–11)
Obando, Bulacan PHBLOD Green mussel (Perna viridis) 980317 82 58 (17–89) 4 (2–10)
San Pedro Bay, Leyte PHLTSP Green mussel (Perna viridis) 980321 15 104 (89–117) 17 (13–27) Aquaculture site
Jiabong, Samar PHSMJB Green mussel (Perna viridis) 980322 51 66 (51–84) 4 (2–8) Aquaculture site
Malabon, Metro Manila PHMMMB Green mussel (Perna viridis) 980316 87 63 (41–87) 6 (2–14)
Sapia Bay, Capiz PHCZSP Green mussel (Perna viridis) 980408 87 64 (43–86) 4 (2–10)
Russia
Vladivostok, Amursky Bay RUVDAB-1 Ezo mussel (Crenomytilus
grayamus)
990719 10 79 (73–83) 15 (10–20)
Vladivostok, Amursky Bay RUVDAB-2 Ezo mussel (Crenomytilus
grayamus)
990719 8 67 (61–72) 9 (6–12)
Singapore
Changi Airport, Woodland City SGWLCH Green mussel (Perna viridis) 990601 27 68e NA
Vietnam
Cat Ba (Cat Hai Province) VNCHCB-1 Green mussel (Perna viridis) 970929 38 13 (8–16) 26 (13–53) Floating habitats
Cat Hai Province VNCHCB-2 Green mussel (Perna viridis) 971027 34 9 (5–13) 12 (3–39) Floating habitats
Cat Hai Province VNCHCB-3 Green mussel (Perna viridis) 971027 8 12 (10–13) 23 (15–31) Floating habitats
Cat Hai Province VNCHCB-4 Green mussel (Perna viridis) 971026 12 5.42 (4–8) 3 (1–6) Floating habitats
Lach Truong (Thanh Hoa Province) VNTHLT Green mussel (Perna viridis) 971025 33 12 (8–16) 21 (19–53) Fishing, aquaculture
Ron River estuary, Ky Anh Province VNKARR Green mussel (Perna viridis) 971018 50 10 (8–13) 22 (9–119) Fishing village
Lang Co (Hue City) VNHULC Green mussel (Perna viridis) 971912 143 7 (6–86) 4 (1–8) Remote area
Thi Nai (Binh Dinh Province) VNBDTN Green mussel (Perna viridis) 971005 54 7 (6–9) 7 (3–15) Urban, shipping traffic, aquaculture
Phan Ri estuary, Phan Ri VNPRPE Green mussel (Perna viridis) 970925 30 7 (5–11) 9 (2–25) Urban, fishing village
NA: No data available.a First, second and last two letters indicate the country, city/province or state and local name. The digits indicate the replicate time of sampling, excepting Tokyo Bay which indicates the sampling
locations.bNumber of individuals homogenized.c Shell length.d Soft tissue weight.eAverage.
286
I.Monirith
etal./Marin
ePollu
tionBulletin
46(2003)281–300
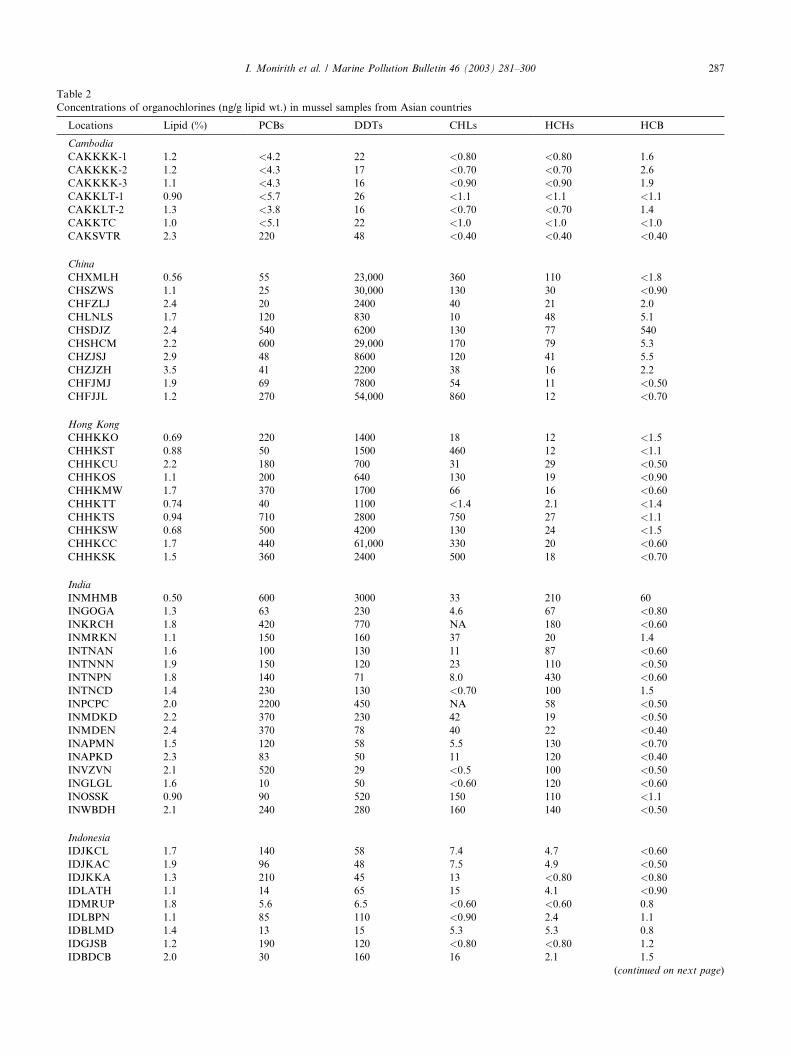
Table 2
Concentrations of organochlorines (ng/g lipid wt.) in mussel samples from Asian countries
Locations Lipid (%) PCBs DDTs CHLs HCHs HCB
Cambodia
CAKKKK-1 1.2 <4.2 22 <0.80 <0.80 1.6
CAKKKK-2 1.2 <4.3 17 <0.70 <0.70 2.6
CAKKKK-3 1.1 <4.3 16 <0.90 <0.90 1.9
CAKKLT-1 0.90 <5.7 26 <1.1 <1.1 <1.1
CAKKLT-2 1.3 <3.8 16 <0.70 <0.70 1.4
CAKKTC 1.0 <5.1 22 <1.0 <1.0 <1.0
CAKSVTR 2.3 220 48 <0.40 <0.40 <0.40
China
CHXMLH 0.56 55 23,000 360 110 <1.8
CHSZWS 1.1 25 30,000 130 30 <0.90
CHFZLJ 2.4 20 2400 40 21 2.0
CHLNLS 1.7 120 830 10 48 5.1
CHSDJZ 2.4 540 6200 130 77 540
CHSHCM 2.2 600 29,000 170 79 5.3
CHZJSJ 2.9 48 8600 120 41 5.5
CHZJZH 3.5 41 2200 38 16 2.2
CHFJMJ 1.9 69 7800 54 11 <0.50
CHFJJL 1.2 270 54,000 860 12 <0.70
Hong Kong
CHHKKO 0.69 220 1400 18 12 <1.5
CHHKST 0.88 50 1500 460 12 <1.1
CHHKCU 2.2 180 700 31 29 <0.50
CHHKOS 1.1 200 640 130 19 <0.90
CHHKMW 1.7 370 1700 66 16 <0.60
CHHKTT 0.74 40 1100 <1.4 2.1 <1.4
CHHKTS 0.94 710 2800 750 27 <1.1
CHHKSW 0.68 500 4200 130 24 <1.5
CHHKCC 1.7 440 61,000 330 20 <0.60
CHHKSK 1.5 360 2400 500 18 <0.70
India
INMHMB 0.50 600 3000 33 210 60
INGOGA 1.3 63 230 4.6 67 <0.80
INKRCH 1.8 420 770 NA 180 <0.60
INMRKN 1.1 150 160 37 20 1.4
INTNAN 1.6 100 130 11 87 <0.60
INTNNN 1.9 150 120 23 110 <0.50
INTNPN 1.8 140 71 8.0 430 <0.60
INTNCD 1.4 230 130 <0.70 100 1.5
INPCPC 2.0 2200 450 NA 58 <0.50
INMDKD 2.2 370 230 42 19 <0.50
INMDEN 2.4 370 78 40 22 <0.40
INAPMN 1.5 120 58 5.5 130 <0.70
INAPKD 2.3 83 50 11 120 <0.40
INVZVN 2.1 520 29 <0.5 100 <0.50
INGLGL 1.6 10 50 <0.60 120 <0.60
INOSSK 0.90 90 520 150 110 <1.1
INWBDH 2.1 240 280 160 140 <0.50
Indonesia
IDJKCL 1.7 140 58 7.4 4.7 <0.60
IDJKAC 1.9 96 48 7.5 4.9 <0.50
IDJKKA 1.3 210 45 13 <0.80 <0.80
IDLATH 1.1 14 65 15 4.1 <0.90
IDMRUP 1.8 5.6 6.5 <0.60 <0.60 0.8
IDLBPN 1.1 85 110 <0.90 2.4 1.1
IDBLMD 1.4 13 15 5.3 5.3 0.8
IDGJSB 1.2 190 120 <0.80 <0.80 1.2
IDBDCB 2.0 30 160 16 2.1 1.5
(continued on next page)
I. Monirith et al. / Marine Pollution Bulletin 46 (2003) 281–300 287
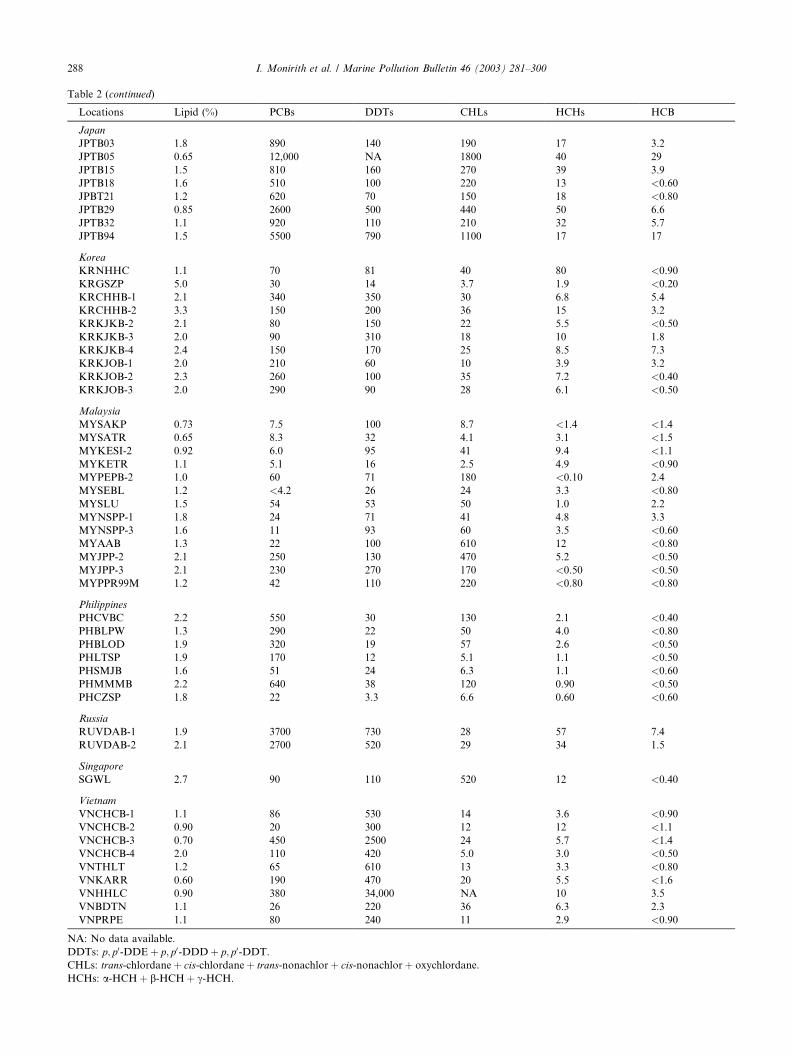
Table 2 (continued)
Locations Lipid (%) PCBs DDTs CHLs HCHs HCB
Japan
JPTB03 1.8 890 140 190 17 3.2
JPTB05 0.65 12,000 NA 1800 40 29
JPTB15 1.5 810 160 270 39 3.9
JPTB18 1.6 510 100 220 13 <0.60
JPBT21 1.2 620 70 150 18 <0.80
JPTB29 0.85 2600 500 440 50 6.6
JPTB32 1.1 920 110 210 32 5.7
JPTB94 1.5 5500 790 1100 17 17
Korea
KRNHHC 1.1 70 81 40 80 <0.90
KRGSZP 5.0 30 14 3.7 1.9 <0.20
KRCHHB-1 2.1 340 350 30 6.8 5.4
KRCHHB-2 3.3 150 200 36 15 3.2
KRKJKB-2 2.1 80 150 22 5.5 <0.50
KRKJKB-3 2.0 90 310 18 10 1.8
KRKJKB-4 2.4 150 170 25 8.5 7.3
KRKJOB-1 2.0 210 60 10 3.9 3.2
KRKJOB-2 2.3 260 100 35 7.2 <0.40
KRKJOB-3 2.0 290 90 28 6.1 <0.50
Malaysia
MYSAKP 0.73 7.5 100 8.7 <1.4 <1.4
MYSATR 0.65 8.3 32 4.1 3.1 <1.5
MYKESI-2 0.92 6.0 95 41 9.4 <1.1
MYKETR 1.1 5.1 16 2.5 4.9 <0.90
MYPEPB-2 1.0 60 71 180 <0.10 2.4
MYSEBL 1.2 <4.2 26 24 3.3 <0.80
MYSLU 1.5 54 53 50 1.0 2.2
MYNSPP-1 1.8 24 71 41 4.8 3.3
MYNSPP-3 1.6 11 93 60 3.5 <0.60
MYAAB 1.3 22 100 610 12 <0.80
MYJPP-2 2.1 250 130 470 5.2 <0.50
MYJPP-3 2.1 230 270 170 <0.50 <0.50
MYPPR99M 1.2 42 110 220 <0.80 <0.80
Philippines
PHCVBC 2.2 550 30 130 2.1 <0.40
PHBLPW 1.3 290 22 50 4.0 <0.80
PHBLOD 1.9 320 19 57 2.6 <0.50
PHLTSP 1.9 170 12 5.1 1.1 <0.50
PHSMJB 1.6 51 24 6.3 1.1 <0.60
PHMMMB 2.2 640 38 120 0.90 <0.50
PHCZSP 1.8 22 3.3 6.6 0.60 <0.60
Russia
RUVDAB-1 1.9 3700 730 28 57 7.4
RUVDAB-2 2.1 2700 520 29 34 1.5
Singapore
SGWL 2.7 90 110 520 12 <0.40
Vietnam
VNCHCB-1 1.1 86 530 14 3.6 <0.90
VNCHCB-2 0.90 20 300 12 12 <1.1
VNCHCB-3 0.70 450 2500 24 5.7 <1.4
VNCHCB-4 2.0 110 420 5.0 3.0 <0.50
VNTHLT 1.2 65 610 13 3.3 <0.80
VNKARR 0.60 190 470 20 5.5 <1.6
VNHHLC 0.90 380 34,000 NA 10 3.5
VNBDTN 1.1 26 220 36 6.3 2.3
VNPRPE 1.1 80 240 11 2.9 <0.90
NA: No data available.
DDTs: p; p0-DDEþ p; p0-DDDþ p; p0-DDT.CHLs: trans-chlordaneþ cis-chlordaneþ trans-nonachlorþ cis-nonachlorþ oxychlordane.
HCHs: a-HCHþ b-HCHþ c-HCH.
288 I. Monirith et al. / Marine Pollution Bulletin 46 (2003) 281–300
3.2. Global distribution
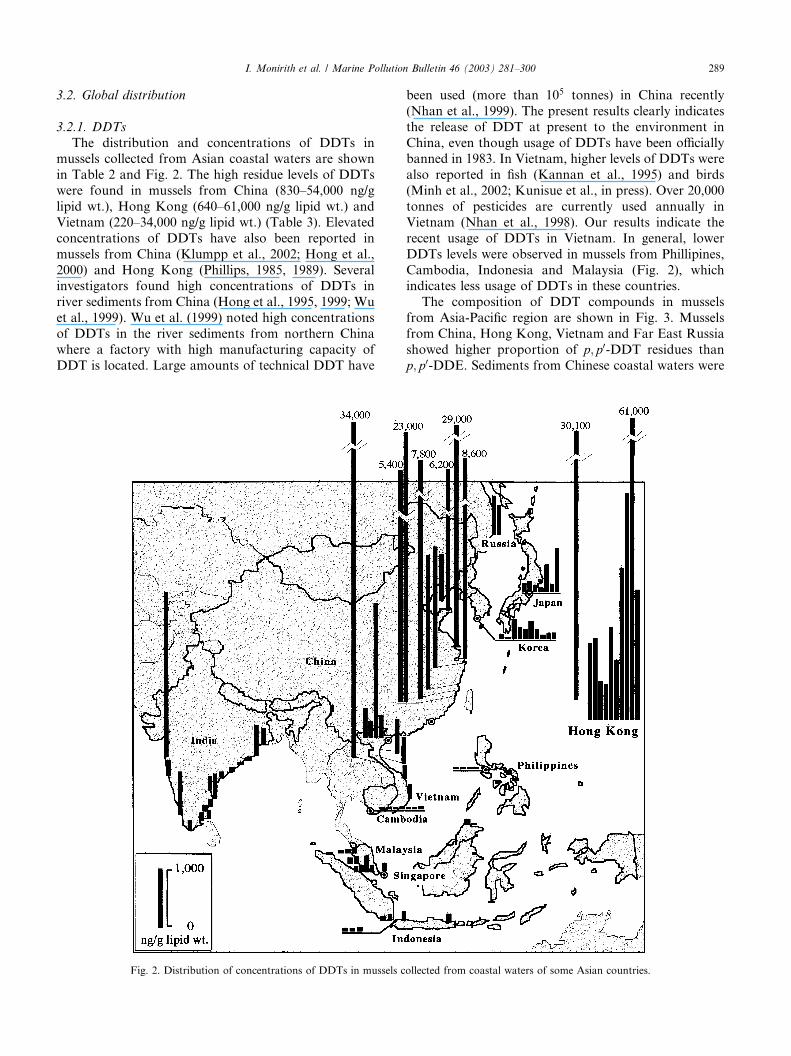
3.2.1. DDTs
The distribution and concentrations of DDTs inmussels collected from Asian coastal waters are shown
in Table 2 and Fig. 2. The high residue levels of DDTs
were found in mussels from China (830–54,000 ng/g
lipid wt.), Hong Kong (640–61,000 ng/g lipid wt.) and
Vietnam (220–34,000 ng/g lipid wt.) (Table 3). Elevated
concentrations of DDTs have also been reported in
mussels from China (Klumpp et al., 2002; Hong et al.,
2000) and Hong Kong (Phillips, 1985, 1989). Severalinvestigators found high concentrations of DDTs in
river sediments from China (Hong et al., 1995, 1999; Wu
et al., 1999). Wu et al. (1999) noted high concentrations
of DDTs in the river sediments from northern China
where a factory with high manufacturing capacity of
DDT is located. Large amounts of technical DDT have
been used (more than 105 tonnes) in China recently
(Nhan et al., 1999). The present results clearly indicates
the release of DDT at present to the environment in
China, even though usage of DDTs have been officiallybanned in 1983. In Vietnam, higher levels of DDTs were
also reported in fish (Kannan et al., 1995) and birds
(Minh et al., 2002; Kunisue et al., in press). Over 20,000
tonnes of pesticides are currently used annually in
Vietnam (Nhan et al., 1998). Our results indicate the
recent usage of DDTs in Vietnam. In general, lower
DDTs levels were observed in mussels from Phillipines,
Cambodia, Indonesia and Malaysia (Fig. 2), whichindicates less usage of DDTs in these countries.
The composition of DDT compounds in mussels
from Asia-Pacific region are shown in Fig. 3. Mussels
from China, Hong Kong, Vietnam and Far East Russia
showed higher proportion of p; p0-DDT residues than
p; p0-DDE. Sediments from Chinese coastal waters were
Fig. 2. Distribution of concentrations of DDTs in mussels collected from coastal waters of some Asian countries.
I. Monirith et al. / Marine Pollution Bulletin 46 (2003) 281–300 289
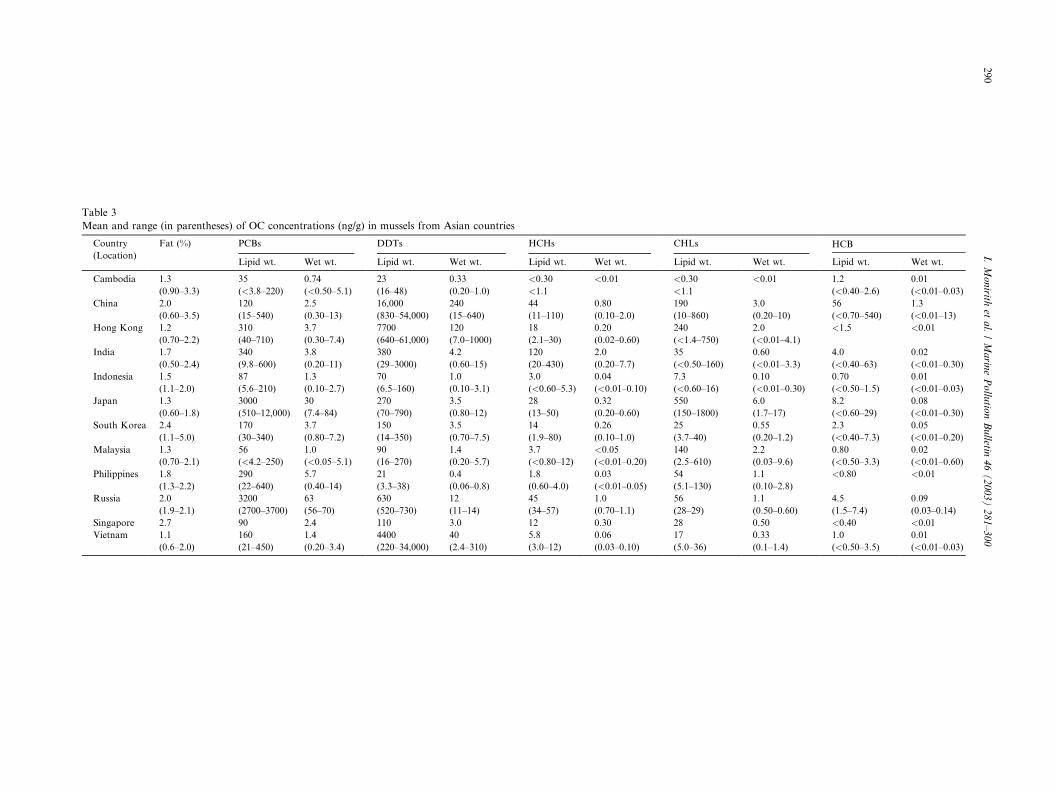
Table 3
Mean and range (in parentheses) of OC concentrations (ng/g) in mussels from Asian countries
Country
(Location)
Fat (%) PCBs DDTs HCHs CHLs HCB
Lipid wt. Wet wt. Lipid wt. Wet wt. Lipid wt. Wet wt. Lipid wt. Wet wt. Lipid wt. Wet wt.
Cambodia 1.3
(0.90–3.3)
35
(<3.8–220)
0.74
(<0.50–5.1)
23
(16–48)
0.33
(0.20–1.0)
<0.30
<1.1
<0.01 <0.30
<1.1
<0.01 1.2
(<0.40–2.6)
0.01
(<0.01–0.03)
China 2.0
(0.60–3.5)
120
(15–540)
2.5
(0.30–13)
16,000
(830–54,000)
240
(15–640)
44
(11–110)
0.80
(0.10–2.0)
190
(10–860)
3.0
(0.20–10)
56
(<0.70–540)
1.3
(<0.01–13)
Hong Kong 1.2
(0.70–2.2)
310
(40–710)
3.7
(0.30–7.4)
7700
(640–61,000)
120
(7.0–1000)
18
(2.1–30)
0.20
(0.02–0.60)
240
(<1.4–750)
2.0
(<0.01–4.1)
<1.5 <0.01
India 1.7
(0.50–2.4)
340
(9.8–600)
3.8
(0.20–11)
380
(29–3000)
4.2
(0.60–15)
120
(20–430)
2.0
(0.20–7.7)
35
(<0.50–160)
0.60
(<0.01–3.3)
4.0
(<0.40–63)
0.02
(<0.01–0.30)
Indonesia 1.5
(1.1–2.0)
87
(5.6–210)
1.3
(0.10–2.7)
70
(6.5–160)
1.0
(0.10–3.1)
3.0
(<0.60–5.3)
0.04
(<0.01–0.10)
7.3
(<0.60–16)
0.10
(<0.01–0.30)
0.70
(<0.50–1.5)
0.01
(<0.01–0.03)
Japan 1.3
(0.60–1.8)
3000
(510–12,000)
30
(7.4–84)
270
(70–790)
3.5
(0.80–12)
28
(13–50)
0.32
(0.20–0.60)
550
(150–1800)
6.0
(1.7–17)
8.2
(<0.60–29)
0.08
(<0.01–0.30)
South Korea 2.4
(1.1–5.0)
170
(30–340)
3.7
(0.80–7.2)
150
(14–350)
3.5
(0.70–7.5)
14
(1.9–80)
0.26
(0.10–1.0)
25
(3.7–40)
0.55
(0.20–1.2)
2.3
(<0.40–7.3)
0.05
(<0.01–0.20)
Malaysia 1.3
(0.70–2.1)
56
(<4.2–250)
1.0
(<0.05–5.1)
90
(16–270)
1.4
(0.20–5.7)
3.7
(<0.80–12)
<0.05
(<0.01–0.20)
140
(2.5–610)
2.2
(0.03–9.6)
0.80
(<0.50–3.3)
0.02
(<0.01–0.60)
Philippines 1.8
(1.3–2.2)
290
(22–640)
5.7
(0.40–14)
21
(3.3–38)
0.4
(0.06–0.8)
1.8
(0.60–4.0)
0.03
(<0.01–0.05)
54
(5.1–130)
1.1
(0.10–2.8)
<0.80 <0.01
Russia 2.0
(1.9–2.1)
3200
(2700–3700)
63
(56–70)
630
(520–730)
12
(11–14)
45
(34–57)
1.0
(0.70–1.1)
56
(28–29)
1.1
(0.50–0.60)
4.5
(1.5–7.4)
0.09
(0.03–0.14)
Singapore 2.7 90 2.4 110 3.0 12 0.30 28 0.50 <0.40 <0.01
Vietnam 1.1
(0.6–2.0)
160
(21–450)
1.4
(0.20–3.4)
4400
(220–34,000)
40
(2.4–310)
5.8
(3.0–12)
0.06
(0.03–0.10)
17
(5.0–36)
0.33
(0.1–1.4)
1.0
(<0.50–3.5)
0.01
(<0.01–0.03)
290
I.Monirith
etal./Marin
ePollu
tionBulletin
46(2003)281–300
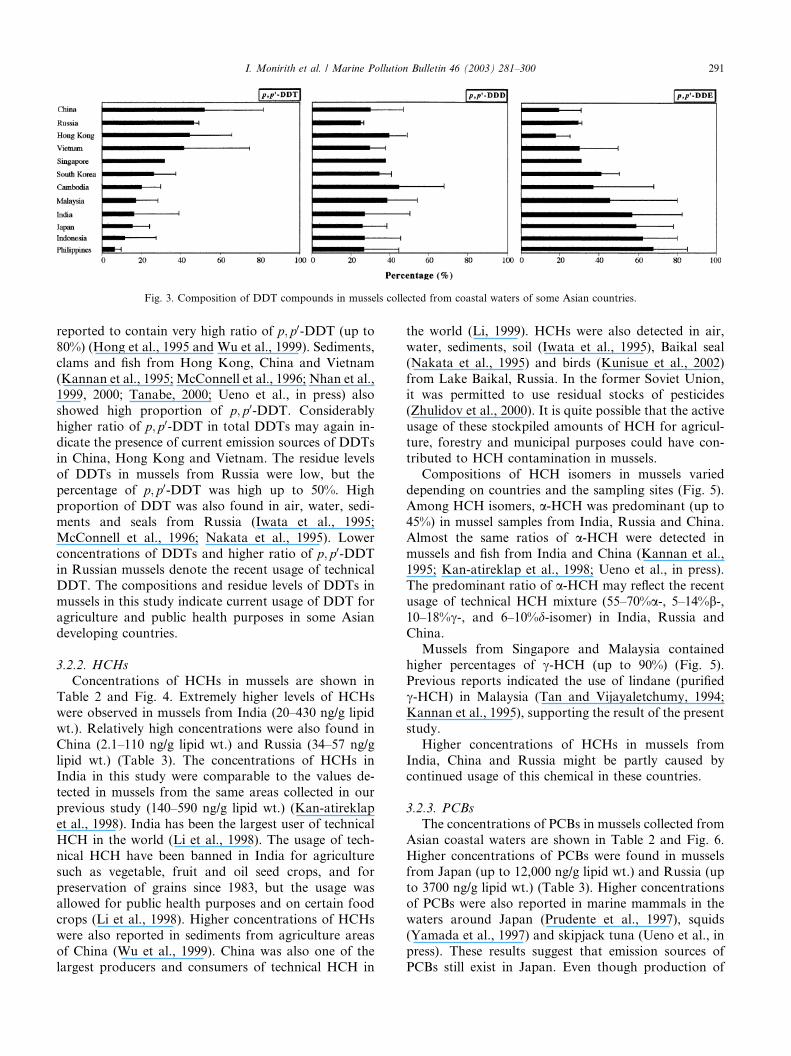
reported to contain very high ratio of p; p0-DDT (up to
80%) (Hong et al., 1995 and Wu et al., 1999). Sediments,
clams and fish from Hong Kong, China and Vietnam
(Kannan et al., 1995; McConnell et al., 1996; Nhan et al.,1999, 2000; Tanabe, 2000; Ueno et al., in press) also
showed high proportion of p; p0-DDT. Considerably
higher ratio of p; p0-DDT in total DDTs may again in-
dicate the presence of current emission sources of DDTs
in China, Hong Kong and Vietnam. The residue levels
of DDTs in mussels from Russia were low, but the
percentage of p; p0-DDT was high up to 50%. High
proportion of DDT was also found in air, water, sedi-ments and seals from Russia (Iwata et al., 1995;
McConnell et al., 1996; Nakata et al., 1995). Lower
concentrations of DDTs and higher ratio of p; p0-DDTin Russian mussels denote the recent usage of technical
DDT. The compositions and residue levels of DDTs in
mussels in this study indicate current usage of DDT for
agriculture and public health purposes in some Asian
developing countries.
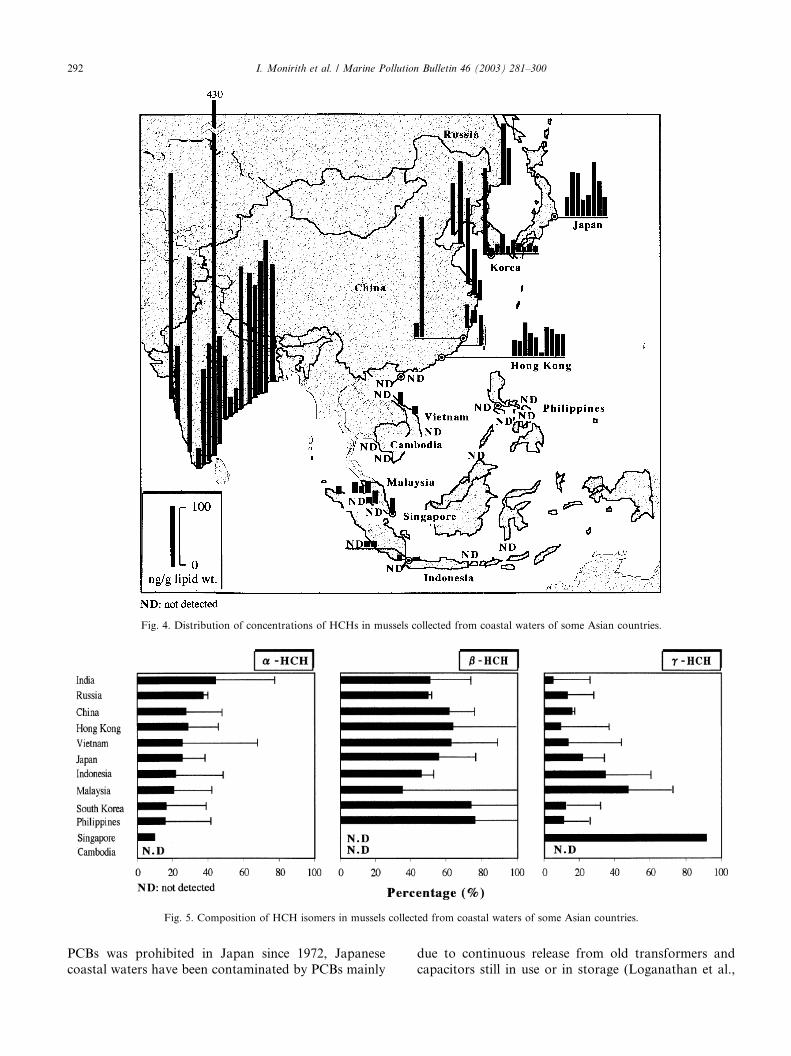
3.2.2. HCHs
Concentrations of HCHs in mussels are shown in
Table 2 and Fig. 4. Extremely higher levels of HCHs
were observed in mussels from India (20–430 ng/g lipid
wt.). Relatively high concentrations were also found in
China (2.1–110 ng/g lipid wt.) and Russia (34–57 ng/g
lipid wt.) (Table 3). The concentrations of HCHs inIndia in this study were comparable to the values de-
tected in mussels from the same areas collected in our
previous study (140–590 ng/g lipid wt.) (Kan-atireklap
et al., 1998). India has been the largest user of technical
HCH in the world (Li et al., 1998). The usage of tech-
nical HCH have been banned in India for agriculture
such as vegetable, fruit and oil seed crops, and for
preservation of grains since 1983, but the usage wasallowed for public health purposes and on certain food
crops (Li et al., 1998). Higher concentrations of HCHs
were also reported in sediments from agriculture areas
of China (Wu et al., 1999). China was also one of the
largest producers and consumers of technical HCH in
the world (Li, 1999). HCHs were also detected in air,
water, sediments, soil (Iwata et al., 1995), Baikal seal
(Nakata et al., 1995) and birds (Kunisue et al., 2002)
from Lake Baikal, Russia. In the former Soviet Union,it was permitted to use residual stocks of pesticides
(Zhulidov et al., 2000). It is quite possible that the active
usage of these stockpiled amounts of HCH for agricul-
ture, forestry and municipal purposes could have con-
tributed to HCH contamination in mussels.
Compositions of HCH isomers in mussels varied
depending on countries and the sampling sites (Fig. 5).
Among HCH isomers, a-HCH was predominant (up to45%) in mussel samples from India, Russia and China.
Almost the same ratios of a-HCH were detected in
mussels and fish from India and China (Kannan et al.,
1995; Kan-atireklap et al., 1998; Ueno et al., in press).
The predominant ratio of a-HCH may reflect the recent
usage of technical HCH mixture (55–70%a-, 5–14%b-,10–18%c-, and 6–10%d-isomer) in India, Russia and
China.Mussels from Singapore and Malaysia contained
higher percentages of c-HCH (up to 90%) (Fig. 5).
Previous reports indicated the use of lindane (purified
c-HCH) in Malaysia (Tan and Vijayaletchumy, 1994;
Kannan et al., 1995), supporting the result of the present
study.
Higher concentrations of HCHs in mussels from
India, China and Russia might be partly caused bycontinued usage of this chemical in these countries.
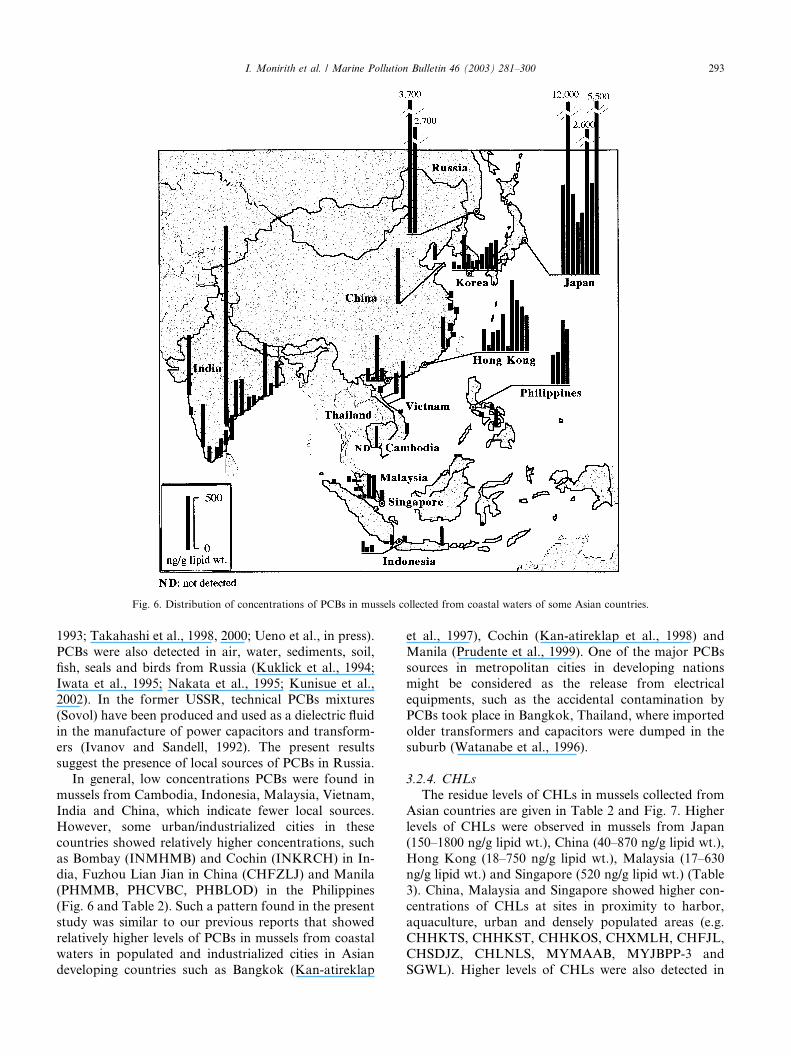
3.2.3. PCBs
The concentrations of PCBs in mussels collected from
Asian coastal waters are shown in Table 2 and Fig. 6.
Higher concentrations of PCBs were found in mussels
from Japan (up to 12,000 ng/g lipid wt.) and Russia (up
to 3700 ng/g lipid wt.) (Table 3). Higher concentrationsof PCBs were also reported in marine mammals in the
waters around Japan (Prudente et al., 1997), squids
(Yamada et al., 1997) and skipjack tuna (Ueno et al., in
press). These results suggest that emission sources of
PCBs still exist in Japan. Even though production of
Fig. 3. Composition of DDT compounds in mussels collected from coastal waters of some Asian countries.
I. Monirith et al. / Marine Pollution Bulletin 46 (2003) 281–300 291
PCBs was prohibited in Japan since 1972, Japanese
coastal waters have been contaminated by PCBs mainly
due to continuous release from old transformers and
capacitors still in use or in storage (Loganathan et al.,
Fig. 4. Distribution of concentrations of HCHs in mussels collected from coastal waters of some Asian countries.
Fig. 5. Composition of HCH isomers in mussels collected from coastal waters of some Asian countries.
292 I. Monirith et al. / Marine Pollution Bulletin 46 (2003) 281–300
1993; Takahashi et al., 1998, 2000; Ueno et al., in press).
PCBs were also detected in air, water, sediments, soil,
fish, seals and birds from Russia (Kuklick et al., 1994;
Iwata et al., 1995; Nakata et al., 1995; Kunisue et al.,
2002). In the former USSR, technical PCBs mixtures
(Sovol) have been produced and used as a dielectric fluid
in the manufacture of power capacitors and transform-ers (Ivanov and Sandell, 1992). The present results
suggest the presence of local sources of PCBs in Russia.
In general, low concentrations PCBs were found in
mussels from Cambodia, Indonesia, Malaysia, Vietnam,
India and China, which indicate fewer local sources.
However, some urban/industrialized cities in these
countries showed relatively higher concentrations, such
as Bombay (INMHMB) and Cochin (INKRCH) in In-dia, Fuzhou Lian Jian in China (CHFZLJ) and Manila
(PHMMB, PHCVBC, PHBLOD) in the Philippines
(Fig. 6 and Table 2). Such a pattern found in the present
study was similar to our previous reports that showed
relatively higher levels of PCBs in mussels from coastal
waters in populated and industrialized cities in Asian
developing countries such as Bangkok (Kan-atireklap
et al., 1997), Cochin (Kan-atireklap et al., 1998) and
Manila (Prudente et al., 1999). One of the major PCBs
sources in metropolitan cities in developing nations
might be considered as the release from electrical
equipments, such as the accidental contamination by
PCBs took place in Bangkok, Thailand, where imported
older transformers and capacitors were dumped in thesuburb (Watanabe et al., 1996).
3.2.4. CHLs
The residue levels of CHLs in mussels collected from
Asian countries are given in Table 2 and Fig. 7. Higher
levels of CHLs were observed in mussels from Japan
(150–1800 ng/g lipid wt.), China (40–870 ng/g lipid wt.),
Hong Kong (18–750 ng/g lipid wt.), Malaysia (17–630ng/g lipid wt.) and Singapore (520 ng/g lipid wt.) (Table
3). China, Malaysia and Singapore showed higher con-
centrations of CHLs at sites in proximity to harbor,
aquaculture, urban and densely populated areas (e.g.
CHHKTS, CHHKST, CHHKOS, CHXMLH, CHFJL,
CHSDJZ, CHLNLS, MYMAAB, MYJBPP-3 and
SGWL). Higher levels of CHLs were also detected in
Fig. 6. Distribution of concentrations of PCBs in mussels collected from coastal waters of some Asian countries.
I. Monirith et al. / Marine Pollution Bulletin 46 (2003) 281–300 293
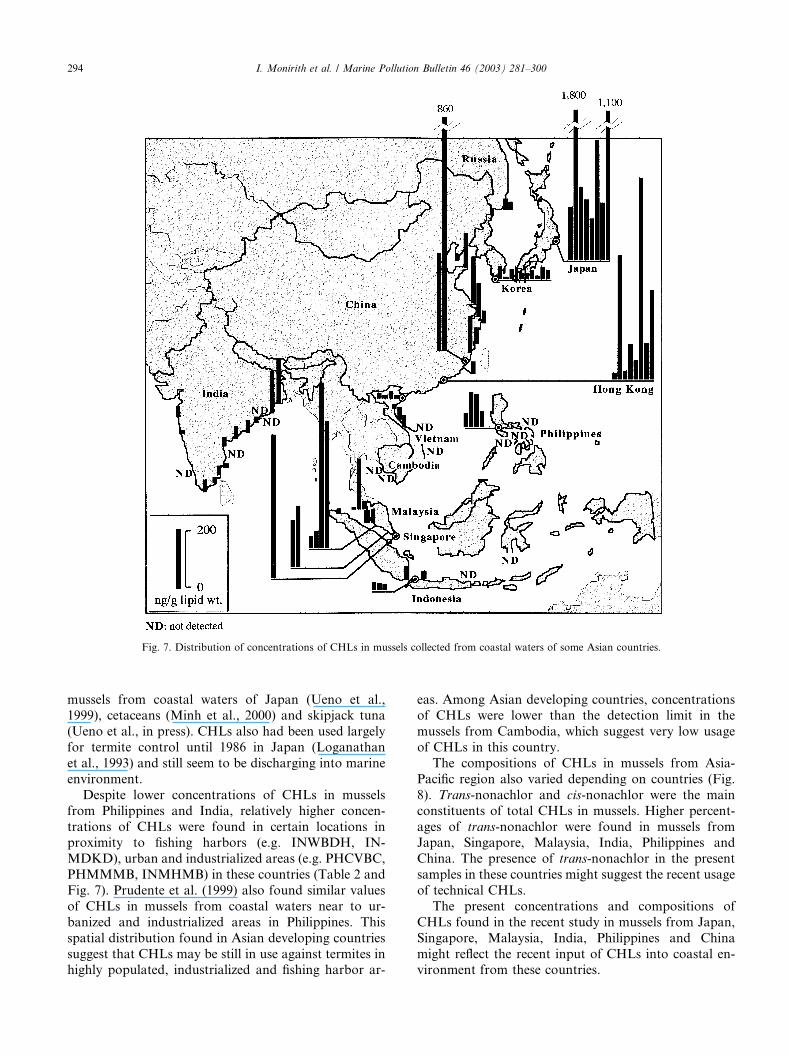
mussels from coastal waters of Japan (Ueno et al.,1999), cetaceans (Minh et al., 2000) and skipjack tuna
(Ueno et al., in press). CHLs also had been used largely
for termite control until 1986 in Japan (Loganathan
et al., 1993) and still seem to be discharging into marine
environment.
Despite lower concentrations of CHLs in mussels
from Philippines and India, relatively higher concen-
trations of CHLs were found in certain locations inproximity to fishing harbors (e.g. INWBDH, IN-
MDKD), urban and industrialized areas (e.g. PHCVBC,
PHMMMB, INMHMB) in these countries (Table 2 and
Fig. 7). Prudente et al. (1999) also found similar values
of CHLs in mussels from coastal waters near to ur-
banized and industrialized areas in Philippines. This
spatial distribution found in Asian developing countries
suggest that CHLs may be still in use against termites inhighly populated, industrialized and fishing harbor ar-
eas. Among Asian developing countries, concentrationsof CHLs were lower than the detection limit in the
mussels from Cambodia, which suggest very low usage
of CHLs in this country.
The compositions of CHLs in mussels from Asia-
Pacific region also varied depending on countries (Fig.
8). Trans-nonachlor and cis-nonachlor were the main
constituents of total CHLs in mussels. Higher percent-
ages of trans-nonachlor were found in mussels fromJapan, Singapore, Malaysia, India, Philippines and
China. The presence of trans-nonachlor in the present
samples in these countries might suggest the recent usage
of technical CHLs.
The present concentrations and compositions of
CHLs found in the recent study in mussels from Japan,
Singapore, Malaysia, India, Philippines and China
might reflect the recent input of CHLs into coastal en-vironment from these countries.
Fig. 7. Distribution of concentrations of CHLs in mussels collected from coastal waters of some Asian countries.
294 I. Monirith et al. / Marine Pollution Bulletin 46 (2003) 281–300
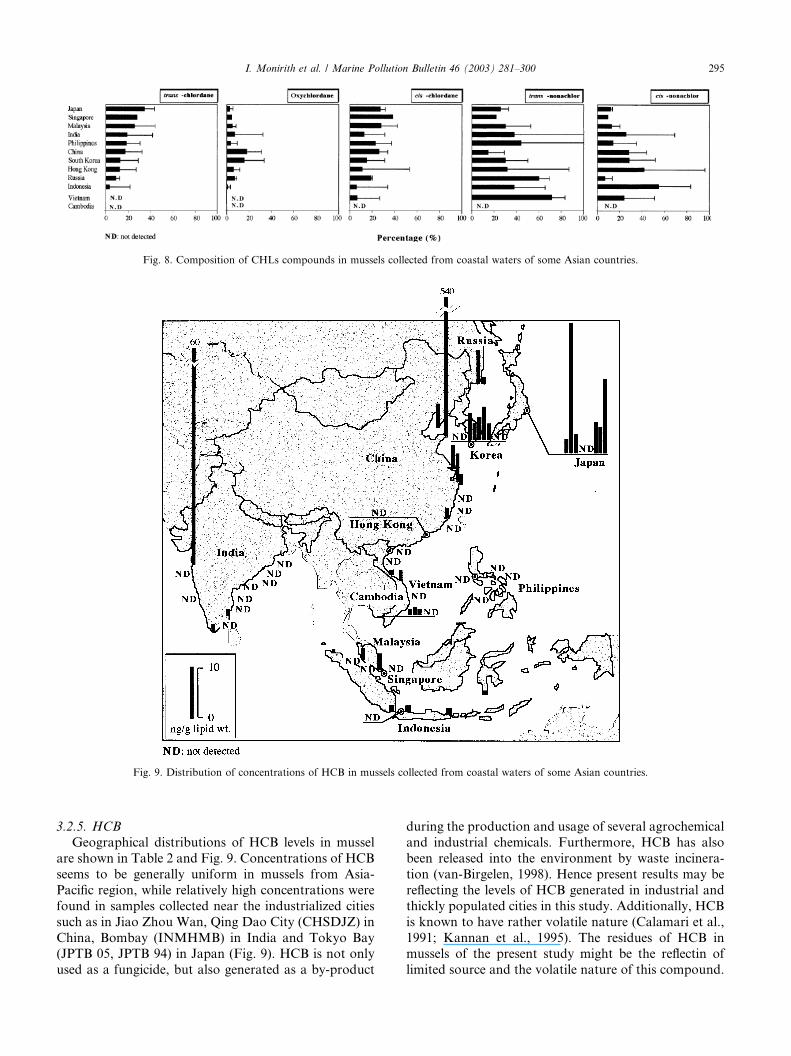
3.2.5. HCB
Geographical distributions of HCB levels in mussel
are shown in Table 2 and Fig. 9. Concentrations of HCB
seems to be generally uniform in mussels from Asia-
Pacific region, while relatively high concentrations were
found in samples collected near the industrialized cities
such as in Jiao Zhou Wan, Qing Dao City (CHSDJZ) in
China, Bombay (INMHMB) in India and Tokyo Bay(JPTB 05, JPTB 94) in Japan (Fig. 9). HCB is not only
used as a fungicide, but also generated as a by-product
during the production and usage of several agrochemical
and industrial chemicals. Furthermore, HCB has also
been released into the environment by waste incinera-
tion (van-Birgelen, 1998). Hence present results may be
reflecting the levels of HCB generated in industrial and
thickly populated cities in this study. Additionally, HCB
is known to have rather volatile nature (Calamari et al.,
1991; Kannan et al., 1995). The residues of HCB inmussels of the present study might be the reflectin of
limited source and the volatile nature of this compound.
Fig. 8. Composition of CHLs compounds in mussels collected from coastal waters of some Asian countries.
Fig. 9. Distribution of concentrations of HCB in mussels collected from coastal waters of some Asian countries.
I. Monirith et al. / Marine Pollution Bulletin 46 (2003) 281–300 295
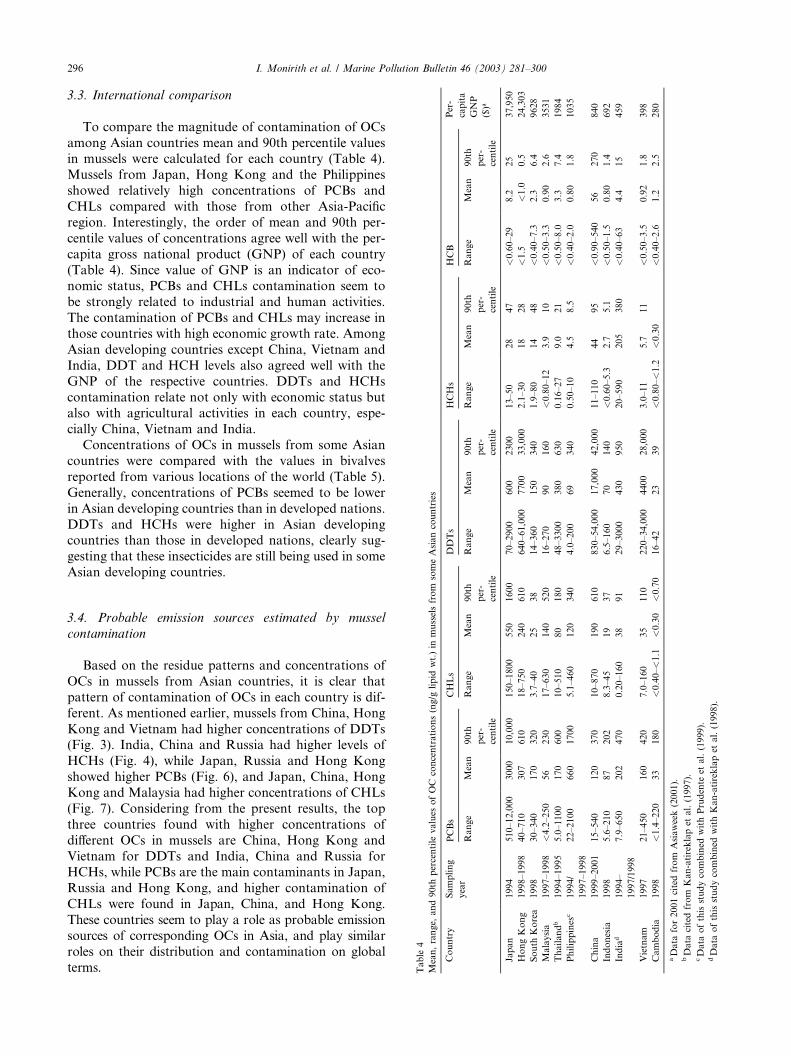
3.3. International comparison
To compare the magnitude of contamination of OCs
among Asian countries mean and 90th percentile valuesin mussels were calculated for each country (Table 4).
Mussels from Japan, Hong Kong and the Philippines
showed relatively high concentrations of PCBs and
CHLs compared with those from other Asia-Pacific
region. Interestingly, the order of mean and 90th per-
centile values of concentrations agree well with the per-
capita gross national product (GNP) of each country
(Table 4). Since value of GNP is an indicator of eco-nomic status, PCBs and CHLs contamination seem to
be strongly related to industrial and human activities.
The contamination of PCBs and CHLs may increase in
those countries with high economic growth rate. Among
Asian developing countries except China, Vietnam and
India, DDT and HCH levels also agreed well with the
GNP of the respective countries. DDTs and HCHs
contamination relate not only with economic status butalso with agricultural activities in each country, espe-
cially China, Vietnam and India.
Concentrations of OCs in mussels from some Asian
countries were compared with the values in bivalves
reported from various locations of the world (Table 5).
Generally, concentrations of PCBs seemed to be lower
in Asian developing countries than in developed nations.
DDTs and HCHs were higher in Asian developingcountries than those in developed nations, clearly sug-
gesting that these insecticides are still being used in some
Asian developing countries.
3.4. Probable emission sources estimated by mussel
contamination
Based on the residue patterns and concentrations of
OCs in mussels from Asian countries, it is clear that
pattern of contamination of OCs in each country is dif-
ferent. As mentioned earlier, mussels from China, Hong
Kong and Vietnam had higher concentrations of DDTs(Fig. 3). India, China and Russia had higher levels of
HCHs (Fig. 4), while Japan, Russia and Hong Kong
showed higher PCBs (Fig. 6), and Japan, China, Hong
Kong and Malaysia had higher concentrations of CHLs
(Fig. 7). Considering from the present results, the top
three countries found with higher concentrations of
different OCs in mussels are China, Hong Kong and
Vietnam for DDTs and India, China and Russia forHCHs, while PCBs are the main contaminants in Japan,
Russia and Hong Kong, and higher contamination of
CHLs were found in Japan, China, and Hong Kong.
These countries seem to play a role as probable emission
sources of corresponding OCs in Asia, and play similar
roles on their distribution and contamination on global
terms. Table4
Mean,range,and90th
percentilevalues
ofOCconcentrations(ng/g
lipid
wt.)in
musselsfrom
someAsiancountries
Country
Sampling
year
PCBs
CHLs
DDTs
HCHs
HCB
Per-
capita
GNP
($)a
Range
Mean
90th
per-
centile
Range
Mean
90th
per-
centile
Range
Mean
90th
per-
centile
Range
Mean
90th
per-
centile
Range
Mean
90th
per-
centile
Japan
1994
510–12,000
3000
10,000
150–1800
550
1600
70–2900
600
2300
13–50
28
47
<0.60–29
8.2
25
37,950
HongKong
1998–1998
40–710
307
610
18–750
240
610
640–61,000
7700
33,000
2.1–30
18
28
<1.5
<1.0
0.5
24,303
South
Korea
1998
30–340
170
320
3.7–40
25
38
14–360
150
340
1.9–80
14
48
<0.40–7.3
2.3
6.4
9628
Malaysia
1997–1998
<4.2–250
56
230
17–630
140
520
16–270
90
160
<0.80–12
3.9
10
<0.50–3.3
0.90
2.6
3531
Thailandb
1994–1995
5.0–1100
170
600
10–510
80
180
48–3300
380
630
0.16–27
9.0
21
<0.50–8.0
3.3
7.4
1984
Philippines
c1994/
1997–1998
22–2100
660
1700
5.1–460
120
340
4.0–200
69
340
0.50–10
4.5
8.5
<0.40–2.0
0.80
1.8
1035
China
1999–2001
15–540
120
370
10–870
190
610
830–54,000
17,000
42,000
11–110
44
95
<0.90–540
56
270
840
Indonesia
1998
5.6–210
87
202
8.3–45
19
37
6.5–160
70
140
<0.60–5.3
2.7
5.1
<0.50–1.5
0.80
1.4
692
India
d1994–
1997/1998
7.9–650
202
470
0.20–160
38
91
29–3000
430
950
20–590
205
380
<0.40–63
4.4
15
459
Vietnam
1997
21–450
160
420
7.0–160
35
110
220–34,000
4400
28,000
3.0–11
5.7
11
<0.50–3.5
0.92
1.8
398
Cambodia
1998
<1.4–220
33
180
<0.40–<1.1
<0.30
<0.70
16–42
23
39
<0.80–<1.2
<0.30
<0.40–2.6
1.2
2.5
280
aData
for2001citedfrom
Asiaweek(2001).
bData
citedfrom
Kan-atireklapetal.(1997).
cData
ofthisstudycombined
withPrudente
etal.(1999).
dData
ofthisstudycombined
withKan-atireklapet
al.(1998).
296 I. Monirith et al. / Marine Pollution Bulletin 46 (2003) 281–300
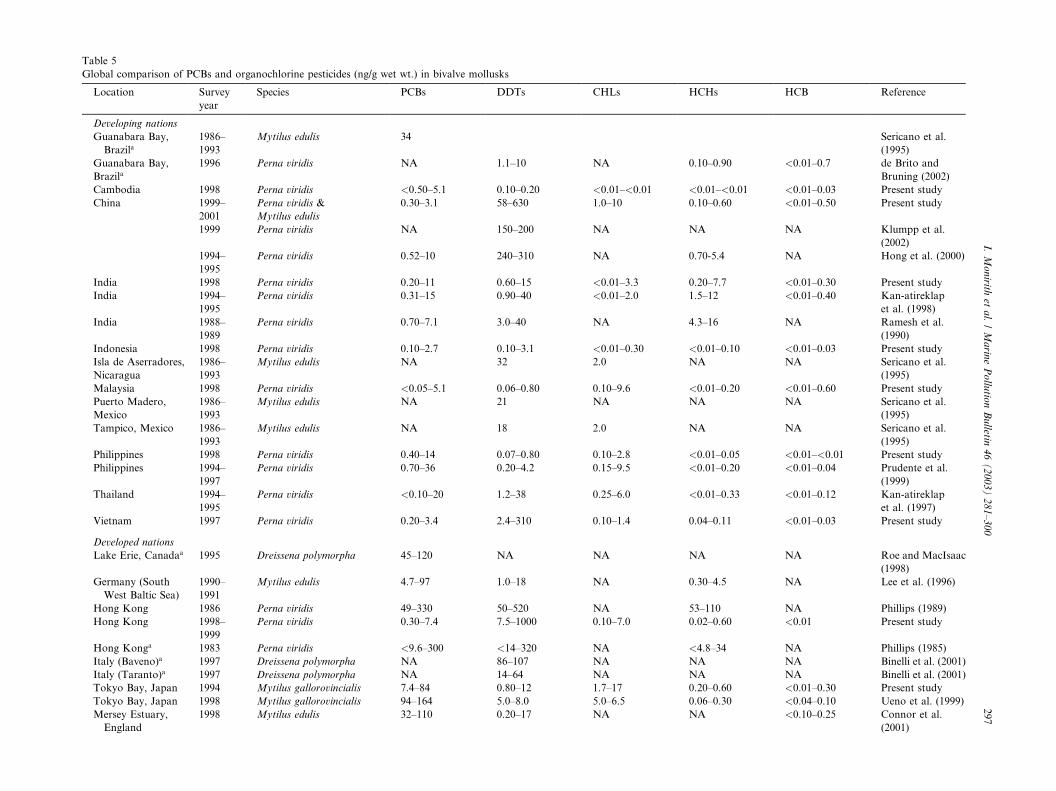
Table 5
Global comparison of PCBs and organochlorine pesticides (ng/g wet wt.) in bivalve mollusks
Location Survey
year
Species PCBs DDTs CHLs HCHs HCB Reference
Developing nations
Guanabara Bay,
Brazila1986–
1993
Mytilus edulis 34 Sericano et al.
(1995)
Guanabara Bay,
Brazila1996 Perna viridis NA 1.1–10 NA 0.10–0.90 <0.01–0.7 de Brito and
Bruning (2002)
Cambodia 1998 Perna viridis <0.50–5.1 0.10–0.20 <0.01–<0.01 <0.01–<0.01 <0.01–0.03 Present study
China 1999–
2001
Perna viridis &
Mytilus edulis
0.30–3.1 58–630 1.0–10 0.10–0.60 <0.01–0.50 Present study
1999 Perna viridis NA 150–200 NA NA NA Klumpp et al.
(2002)
1994–
1995
Perna viridis 0.52–10 240–310 NA 0.70-5.4 NA Hong et al. (2000)
India 1998 Perna viridis 0.20–11 0.60–15 <0.01–3.3 0.20–7.7 <0.01–0.30 Present study
India 1994–
1995
Perna viridis 0.31–15 0.90–40 <0.01–2.0 1.5–12 <0.01–0.40 Kan-atireklap
et al. (1998)
India 1988–
1989
Perna viridis 0.70–7.1 3.0–40 NA 4.3–16 NA Ramesh et al.
(1990)
Indonesia 1998 Perna viridis 0.10–2.7 0.10–3.1 <0.01–0.30 <0.01–0.10 <0.01–0.03 Present study
Isla de Aserradores,
Nicaragua
1986–
1993
Mytilus edulis NA 32 2.0 NA NA Sericano et al.
(1995)
Malaysia 1998 Perna viridis <0.05–5.1 0.06–0.80 0.10–9.6 <0.01–0.20 <0.01–0.60 Present study
Puerto Madero,
Mexico
1986–
1993
Mytilus edulis NA 21 NA NA NA Sericano et al.
(1995)
Tampico, Mexico 1986–
1993
Mytilus edulis NA 18 2.0 NA NA Sericano et al.
(1995)
Philippines 1998 Perna viridis 0.40–14 0.07–0.80 0.10–2.8 <0.01–0.05 <0.01–<0.01 Present study
Philippines 1994–
1997
Perna viridis 0.70–36 0.20–4.2 0.15–9.5 <0.01–0.20 <0.01–0.04 Prudente et al.
(1999)
Thailand 1994–
1995
Perna viridis <0.10–20 1.2–38 0.25–6.0 <0.01–0.33 <0.01–0.12 Kan-atireklap
et al. (1997)
Vietnam 1997 Perna viridis 0.20–3.4 2.4–310 0.10–1.4 0.04–0.11 <0.01–0.03 Present study
Developed nations
Lake Erie, Canadaa 1995 Dreissena polymorpha 45–120 NA NA NA NA Roe and MacIsaac
(1998)
Germany (South
West Baltic Sea)
1990–
1991
Mytilus edulis 4.7–97 1.0–18 NA 0.30–4.5 NA Lee et al. (1996)
Hong Kong 1986 Perna viridis 49–330 50–520 NA 53–110 NA Phillips (1989)
Hong Kong 1998–
1999
Perna viridis 0.30–7.4 7.5–1000 0.10–7.0 0.02–0.60 <0.01 Present study
Hong Konga 1983 Perna viridis <9.6–300 <14–320 NA <4.8–34 NA Phillips (1985)
Italy (Baveno)a 1997 Dreissena polymorpha NA 86–107 NA NA NA Binelli et al. (2001)
Italy (Taranto)a 1997 Dreissena polymorpha NA 14–64 NA NA NA Binelli et al. (2001)
Tokyo Bay, Japan 1994 Mytilus gallorovincialis 7.4–84 0.80–12 1.7–17 0.20–0.60 <0.01–0.30 Present study
Tokyo Bay, Japan 1998 Mytilus gallorovincialis 94–164 5.0–8.0 5.0–6.5 0.06–0.30 <0.04–0.10 Ueno et al. (1999)
Mersey Estuary,
England
1998 Mytilus edulis 32–110 0.20–17 NA NA <0.10–0.25 Connor et al.
(2001)
I.Monirith
etal./Marin
ePollu
tionBulletin
46(2003)281–300
297
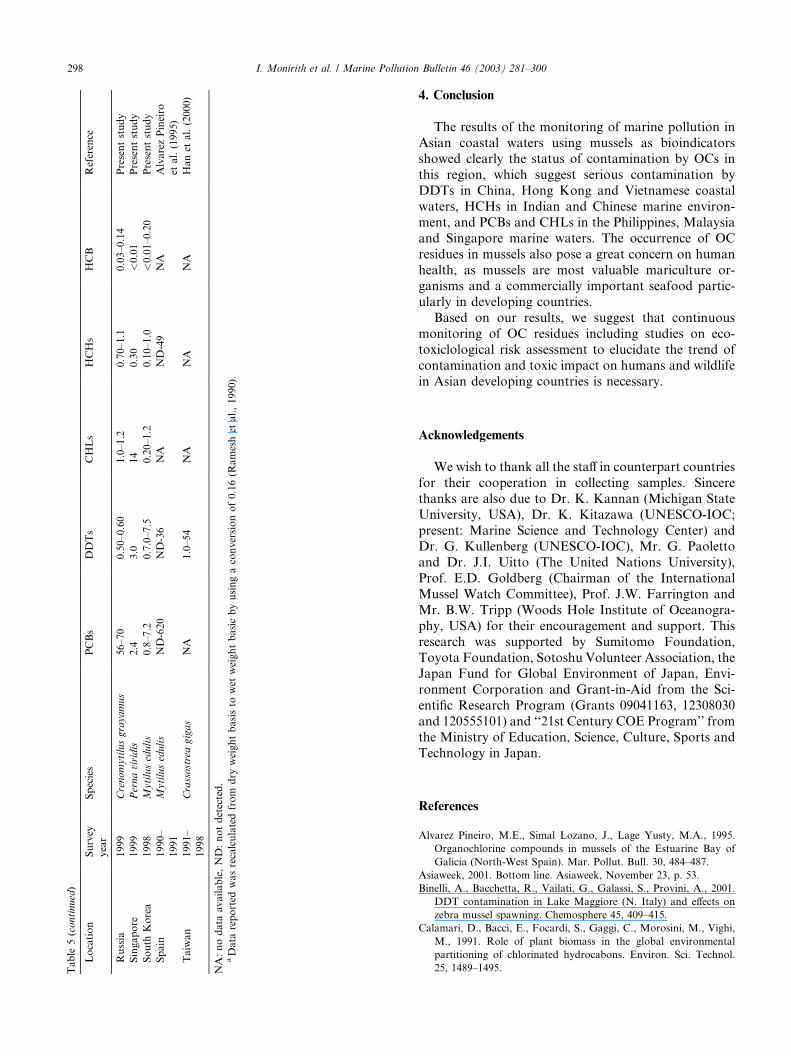
4. Conclusion
The results of the monitoring of marine pollution in
Asian coastal waters using mussels as bioindicatorsshowed clearly the status of contamination by OCs in
this region, which suggest serious contamination by
DDTs in China, Hong Kong and Vietnamese coastal
waters, HCHs in Indian and Chinese marine environ-
ment, and PCBs and CHLs in the Philippines, Malaysia
and Singapore marine waters. The occurrence of OC
residues in mussels also pose a great concern on human
health, as mussels are most valuable mariculture or-ganisms and a commercially important seafood partic-
ularly in developing countries.
Based on our results, we suggest that continuous
monitoring of OC residues including studies on eco-
toxiclological risk assessment to elucidate the trend of
contamination and toxic impact on humans and wildlife
in Asian developing countries is necessary.
Acknowledgements
We wish to thank all the staff in counterpart countries
for their cooperation in collecting samples. Sincere
thanks are also due to Dr. K. Kannan (Michigan State
University, USA), Dr. K. Kitazawa (UNESCO-IOC;
present: Marine Science and Technology Center) andDr. G. Kullenberg (UNESCO-IOC), Mr. G. Paoletto
and Dr. J.I. Uitto (The United Nations University),
Prof. E.D. Goldberg (Chairman of the International
Mussel Watch Committee), Prof. J.W. Farrington and
Mr. B.W. Tripp (Woods Hole Institute of Oceanogra-
phy, USA) for their encouragement and support. This
research was supported by Sumitomo Foundation,
Toyota Foundation, Sotoshu Volunteer Association, theJapan Fund for Global Environment of Japan, Envi-
ronment Corporation and Grant-in-Aid from the Sci-
entific Research Program (Grants 09041163, 12308030
and 120555101) and ‘‘21st Century COE Program’’ from
the Ministry of Education, Science, Culture, Sports and
Technology in Japan.
References
Alvarez Pineiro, M.E., Simal Lozano, J., Lage Yusty, M.A., 1995.
Organochlorine compounds in mussels of the Estuarine Bay of
Galicia (North-West Spain). Mar. Pollut. Bull. 30, 484–487.
Asiaweek, 2001. Bottom line. Asiaweek, November 23, p. 53.
Binelli, A., Bacchetta, R., Vailati, G., Galassi, S., Provini, A., 2001.
DDT contamination in Lake Maggiore (N. Italy) and effects on
zebra mussel spawning. Chemosphere 45, 409–415.
Calamari, D., Bacci, E., Focardi, S., Gaggi, C., Morosini, M., Vighi,
M., 1991. Role of plant biomass in the global environmental
partitioning of chlorinated hydrocabons. Environ. Sci. Technol.
25, 1489–1495.Table5(continued)
Location
Survey
year
Species
PCBs
DDTs
CHLs
HCHs
HCB
Reference
Russia
1999
Crenomytilusgrayamus
56–70
0.50–0.60
1.0–1.2
0.70–1.1
0.03–0.14
Presentstudy
Singapore
1999
Pernaviridis
2.4
3.0
14
0.30
<0.01
Presentstudy
South
Korea
1998
Mytilusedulis
0.8–7.2
0.7.0–7.5
0.20–1.2
0.10–1.0
<0.01–0.20
Presentstudy
Spain
1990–
1991
Mytilusedulis
ND-620
ND-36
NA
ND-49
NA
AlvarezPineiro
etal.(1995)
Taiwan
1991–
1998
Crassostreagigas
NA
1.0–54
NA
NA
NA
Hanetal.(2000)
NA:nodata
available,ND:notdetected.
aData
reported
wasrecalculatedfrom
dry
weightbasisto
wetweightbasicbyusingaconversionof0.16(Rameshetal.,1990).
298 I. Monirith et al. / Marine Pollution Bulletin 46 (2003) 281–300
Cheong, L. In: Davy, F.B., Graham, M., 1982. Country report:
Singapore: Bivalve culture in Asia and the Pacific: Proceedings
of a Workshop Held in Singapore, 16–19 February 1982.
Ottawa, Canada: International Development Research Centre,
pp. 69–71.
Colborn, T., Smolen, M.J., 1996. Epidemiological analysis of persis-
tent organochlorine contaminants in cetaceans. Rev. Environ.
Contam. Toxicol. 146, 91–172.
Connor, L., Johnson, M.S., Copplestone, D., Leah, R.T., 2001. Recent
trends in organochlorine residues in mussels (Mytilus edulis) from
the Mersey Estuary. Mar. Environ. Res. 52, 397–411.
Dave, P.P., 1996. India: a generics giant. Farm Chem. Int. 10, 36–
37.
de Brito, A.P.X., Bruning, I.M.R.D.A., 2002. Chlorinated pesticides in
mussels from Guanabara Bay, Rio de Janeiro, Brazil. Mar. Pollut.
Bull. 44, 71–81.
Duinker, J.C., Schulz, D.E., Petrict, G., 1988. Multidimensional gas
chromatography with electron capture detection for determination
of toxic congeners in polychlorinated biphenyl mixtures. Anal.
Chem. 6, 478–482.
FCI, 1996. Marketing in the Asia-Pacific. Farm Chem. Int., Septem-
ber, pp. 56–68.
Goldberg, E.D., Bowen, V.T., Farrington, J.W., Harvey, G., Martin,
J.H., Parker, P.L., Risebrough, R.W., Robertson, W., Schneider,
E., Gamble, E., 1978. The mussel watch. Environ. Conserv. 5, 101–
125.
Han, B.C., Jeng, W.L., Hung, T.C., Ling, Y.C., Shieh, M.J., Chien,
L.C., 2000. Estimation of metal and organochlorine pesticides
exposures and potential health threat by consumption of oysters in
Taiwan. Environ. Pollut. 109, 147–156.
Hong, H., Chen, W.X.L., Wang, X., Zhang, L., 1999. Distribution and
fate of organochlorine pollutants in the Pear River Estuary. Mar.
Pollut. Bull. 39, 376–382.
Hong, H., Wang, X., Xu, L., Chen, W., Zhang, L., Zhang, Z., 2000.
Trace organic pollutants in the Southeast estuarine environments
of China. J. Environ. Sci. Heal. A 35, 1833–1847.
Hong, H., Xu, L., Cheng, J.C., Wong, Y.S., Wan, T.S.M., 1995.
Environmental fate and chemistry of organic pollutants in the
sediment of Xiamen and Victoria Harbours. Mar. Pollut. Bull. 31,
229–236.
Ivanov, V., Sandell, E.N., 1992. Characterization of polychlorinated
biphenyl isomers in Sovol and trichlorobiphenyl formulations by
high-resolution gas chromatography with electron capture detec-
tion and high-resolution gas chromatography-mass spectrometry
technique. Environ. Sci. Technol. 26, 2012–2017.
Iwata, H., Tanabe, S., Sakai, N., Tatsukawa, R., 1993. Distribution of
persistent organochlorines in the oceanic air and surface seawater
and the role of ocean on their global transport and fate. Environ.
Sci. Technol. 27, 1071–1098.
Iwata, H., Tanabe, S., Ueda, K., Tatsukawa, R., 1995. Persistent
organochlorine residues in air, water, sediments, and soils from
the Lake Baikal region, Russia. Environ. Sci Technol. 29, 801–
972.
Kan-atireklap, S., Tanabe, S., Sanguansin, J., Tabucanon, M.S.,
Hungspreugs, M., 1997. Contamination by butyltin compounds
and organochlorine residues in green mussel (Perna viridis, L.)
from Thailand coastal waters. Environ. Pollut. 97, 79–89.
Kan-atireklap, S., Yen, N.T.H., Tanabe, S., Subramanian, A.N., 1998.
Butyltin compounds and organochlorin residues in green mussel
(Perina viridis L.) from India. Toxicol. Environ. Chem. 67, 409–
424.
Kannan, K., Tanabe, S., Tatsukawa, R., 1995. Geographical distri-
bution and accumulation features of organochlorine residues in fish
in Tropical Asia and Oceania. Environ. Sci. Technol. 29, 2673–
2683.
Kannan, K., Tanabe, S., Giesy, J.P., Tatsukawa, R., 1997. Orga-
nochlorine pesticides and polychlorianted biphenyls in foodstuffs
from Asian and Oceanic countries. Rev. Environ. Contam.
Toxicol. 15, 1–55.
Klumpp, D.W., Huansheng, H., Humphrey, C., Xinhong, W., Codi,
S., 2002. Toxic contaminants and their biological effects in coastal
waters of Xiamen, China I. Organic pollutants in mussel and fish
tissues. Mar. Pollut. Bull. 44, 752–760.
Kuklick, J.R., Bidleman, T.F., McConnell, L.L., Walia, D.M., Ivanov,
P.G., 1994. Organochlorines in the water and biota of Lake Baikal,
Siberia. Environ. Sci. Technol. 28, 31–37.
Kunisue, T., Minh, T.B., Fukuda, K., Watanabe, M., Tanabe, S.,
Titenko, A.M., 2002. Seasonal variation of persistent organochl-
orine accumulation in birds from Lake Baikal, Russia, and the role
of the south Asian region as source of pollution for wintering
migrants. Environ. Sci. Technol. 36, 1396–1404.
Kunisue, T., Watanabe, M., Subramanian, A., Sethuraman, A.,
Titenko, A.M., Qui, V., Prudente, M., Tanabe, S., in press.
Accumulation features of persistent organochlorines in resident
and migratory birds from Asia. Environ. Pollut.
Lee, K.M., Kruse, H., Wasserman, O., 1996. Seasonal fluctuation of
organochlorines in Mytilus edulis L. from the South West Baltic
Sea. Chemosphere 32, 1883–1895.
Li, Y.F., Bidelman, T.F., Barrie, L.A., McConnell, L.L., 1998.
Global hexachlorocyclohexane use trends and their impact on the
Arctic atmospheric environment. Geophys. Res. Lett. 25, 39–
41.
Li, Y.F., 1999. Global technical hexachlorocyclohexane usage and its
contamination consequences in the environment: from 1994 to
1997. Sci. Total Environ. 232, 121–158.
Loganathan, B.G., Tanabe, S., Hidaka, Y., Kawano, M., Hidaka, H.,
Tatsukawa, R., 1993. Temporal trends of persistent organochlorine
residues in human adipose tissue from Japan, 1928–1985. Environ.
Pollut. 81, 31–39.
McConnell, L.L., Kucklick, J.R., Bidleman, T.F., Ivanov, G.P.,
Chernyak, S.M., 1996. Air–water gas exchange of organochlorine
compounds in Lake Baikal, Russia. Environ. Sci. Technol. 30,
2975–2983.
Minh, T.B., Watanabe, M., Nakata, H., Tanabe, S., Jefferson, T.A.,
1999. Contamination by persistent organochlorines in small
cetaceans from Hong Kong coastal waters. Mar. Pollut. Bull. 39,
383–392.
Minh, T.B., Watanabe, M., Tanabe, S., Miyazaki, N., Jefferson, T.A.,
Prudente, M.S., Subramanian, A., Karuppiah, S., 2000. Wide-
spread contamination by tris(4-chlorophrnyl)methane and tris(4-
chlorophenyl)methanol in cetaceans from North Pacific and Asian
coastal waters. Environ. Pollut. 110, 459–468.
Minh, T.B., Kunisue, T., Yen, T.H., Watanabe, M., Tanabe, S., Hue,
N.D., Qui, V., 2002. Persistent organochlorine residues and their
bioaccumulation profile in resident and migatory birds from North
Vietnam. Environ. Toxicol. Chem. 21, 2108–2118.
Nakata, H., Tanabe, S., Tasukawa, R., Amano, M., Miyazaki, N.,
Petrov, E.A., 1995. Persistent organochlorine residues and their
accumulation kinetics in Baikal seal (Phoca sibirica) from Lake
Baikal, Russia. Environ. Sci. Technol. 29, 2877–2885.
Nhan, D.D., Am, N.M., Hoi, N.C., Dieu, L.V., Carvalho, F.P.,
Vieleneuve, J.P., Cattini, C., 1998. Organochlorine pesticides and
PCBs in the Red River Delta, North Vietnam. Mar. Pollut. Bull.
36, 742–749.
Nhan, D.D., Am, N.M., Carvalho, F.P., Vieleneuve, J.P., Cattini, C.,
1999. Organochlorine pesticides and PCBs along the coast of North
Vietnam. Sci. Total Environ. 237/238, 363–371.
Nhan, D.D., Carvalho, F.P., Am, N.M., Tuan, N.Q., Yen, N.T.H.,
Vieleneuve, J.P., Cattini, C., 2000. Chlorinated pesticides and PCBs
in sediments and molluscs from freshwater canals in the Hanoi
region. Environ. Pollut. 112, 311–320.
Phillips, D.J.H., 1985. Organochlorines and trace metals in green-
lipped mussels Perna viridis from Hong Kong water: a test of
indicator ability. Mar. Ecol. Prog. Ser. 21, 251–258.
I. Monirith et al. / Marine Pollution Bulletin 46 (2003) 281–300 299
Phillips, D.J.H., 1989. Trace metals and organochlorines in the
coastal waters of Hong Kong. Mar. Pollut. Bull. 20, 319–327.
Prudente, M., Tanabe, S., Watanabe, M., Subramanian, A., Miyazaki,
N., Suarez, P., Tatsukawa, R., 1997. Organochlorine contamina-
tion in some odontoceti species from the North Pacific and Indian
Ocean. Mar. Environ. Res. 44, 415–427.
Prudente, M., Ichihashi, H., Kan-atireklap, S., Watanabe, I., Tanabe,
S., 1999. Butyltins, organochlorines and metal levels in green
mussels, Pern viridis L. from coastal waters of the Philippines. Fish.
Sci. 65, 441–447.
Ramesh, A., Tanabe, S., Subramanian, A.N., Mohan, D., Venugopa-
lan, V.K., Tatsukawa, R., 1990. Persistent organochlorine residues
in green mussels from coastal waters of South India. Mar. Pollut.
Bull. 21, 587–590.
Roe, S.L., MacIsaac, H.J., 1998. Temporal variation of organochlo-
rine contaminants in the zebra mussel Dreissena polymorpha in
Lake Erie. Aquat. Toxicol. 41, 125–140.
Sericano, J.L., Wade, T.L., Jackson, T.J., Brooks, J.M., Tripp, B.W.,
Farrington, J.W., Mee, L.D., Readmann, J.W., Villeneuve, J.-P.,
Goldberg, E.D., 1995. Trace organic contamination in the Amer-
icas: an overview of the US national status and trends and
international �Mussel watch� Programmes. Mar. Pollut. Bull. 31,
214–225.
Takahashi, S., Lee, J.S., Tanabe, S., 1998. Contamination and specific
accumulation of organochlorine and butyltin compounds in deep-
sea organisms collected from Suruga Bay, Japan. Sci. Total
Environ. 214, 49–65.
Takahashi, S., Tanabe, S., Kawaguchi, K., 2000. Organochlorine and
butyltin residues in mesopelagic myctophid fishes from the western
North Pacific. Environ. Sci. Technol. 34, 5129–5136.
Tan, G.H., Vijayaletchumy, K., 1994. Organochlorine pesticide residue
levels in Peninsular Malaysian Rivers. Bull. Environ. Contam.
Toxicol. 53, 351–356.
Tanabe, S., 2000. Asian developing regions: persistent organic pollutants
in seas. In: Sheppard, C.R.C. (Ed.), Sea at the Millennium: an Envi-
ronmental Evaluation. Elsevier Science, Amsterdam, pp. 447–462.
Tanabe, S., Iwata, H., Tatsukawa, R., 1994. Global contamination by
persistent organochlorines and their ecotoxicological impact on
marine mammals. Sci. Total Environ. 154, 163–177.
Tanabe, S., Prudente, M.S., Kan-atireklap, S., Subramanian, A., 2000.
Mussel watch: marine pollution monitoring of butyltins and
organochlorines in coastal waters of Thailand, Philippines and
India. Ocean Coast. Manage. 43, 819–839.
Ueno, D., Takahashi, S., Tanabe, S., Ikeda, K., Koyama, J., 1999.
Uptake kinetics of persistent organochlorines in mussels through
the transplantion experiment. J. Environ. Chem. 9, 369–378 (in
Japanese).
Ueno, D., Takahashi, S., Tanaka, H., Subramanian, A.N., Fillmann,
G., Nakata, H., Lam, P.K.S., Zheng, J., Muchtar, M., Tanabe, S.,
in press. Global pollution monitoring of PCBs and organochlorine
pesticides using Skipjack Tuna as bioindicator. Arch. Environ.
Contam. Toxicol.
van-Birgelen, A.P.J.M., 1998. Hexachlorobenzene as a possible major
contributor to the dioxin activity of human milk. Environ. Health
Perspect. 106, 683–688.
Watanabe, S., Laovakul, W., Boonyathumanondh, R., Tabucanon,
M.S., Ohgaki, S., 1996. Concentrations and composition of PCB
congeners in the air around stored used capacitors containing PCB
insulator oil in a suburb of Bangkok, Thailand. Envrion. Pollut. 92,
289–297.
Wu, Y., Zhang, J., Zhou, Q., 1999. Persistent organochlorine residues
in sediments from Chinese river/estuary systems. Environ. Pollut.
96, 217–226.
Yamada, H., Takayanagi, K., Tateishi, M., Tagata, H., Ikeda, K.,
1997. Organotin compounds and polychlorinated biphenyls of
livers in squid collected from coastal waters and oceans. Environ.
Pollut. 96, 217–226.
Zhulidov, A.V., Headley, J.V., Pavlov, D.F., Robarts, R.D., Ko-
rotova, L.G., Vinnikov, Y.Y., Zhulidova, O.V., 2000. Riverine
fluxes of the persistent organochlorine pesticides hexachlorcyclo-
hexane and DDT in the Russian Federation. Chemosphere 41,
829–841.
300 I. Monirith et al. / Marine Pollution Bulletin 46 (2003) 281–300
Related Documents